UNITED STATES
SECURITIES AND EXCHANGE COMMISSION
Washington, D.C. 20549
FORM N-CSR
CERTIFIED SHAREHOLDER REPORT OF REGISTERED
MANAGEMENT INVESTMENT COMPANIES
Investment Company Act file number 811-04707
Fidelity Advisor Series II
(Exact name of registrant as specified in charter)
245 Summer St., Boston, Massachusetts 02210
(Address of principal executive offices) (Zip code)
Cynthia Lo Bessette, Secretary
245 Summer St.
Boston, Massachusetts 02210
(Name and address of agent for service)
Registrant's telephone number, including area code:
617-563-7000
|
Date of fiscal year end: |
December 31 |
|
|
|
|
Date of reporting period: |
December 31, 2022 |
Item 1.
Reports to Stockholders


Contents
| Board Approval of Investment Advisory Contracts and Management Fees |
|
Average Annual Total Returns
|
|||
|
Periods ended December 31, 2022
|
Past 1
year
|
Past 5
years
|
Past 10
years
|
|
Class A
(incl.4.00% sales charge)
|
-14.84%
|
0.32%
|
1.91%
|
|
Class M
(incl.4.00% sales charge)
|
-14.91%
|
0.33%
|
1.92%
|
|
Class C
(incl. contingent deferred sales charge)
|
-12.85%
|
0.40%
|
1.73%
|
|
Fidelity® Strategic Income Fund
|
-11.14%
|
1.42%
|
2.60%
|
|
Class I
|
-11.18%
|
1.39%
|
2.58%
|
|
Class Z
|
-11.00%
|
1.49%
|
2.63%
|
|
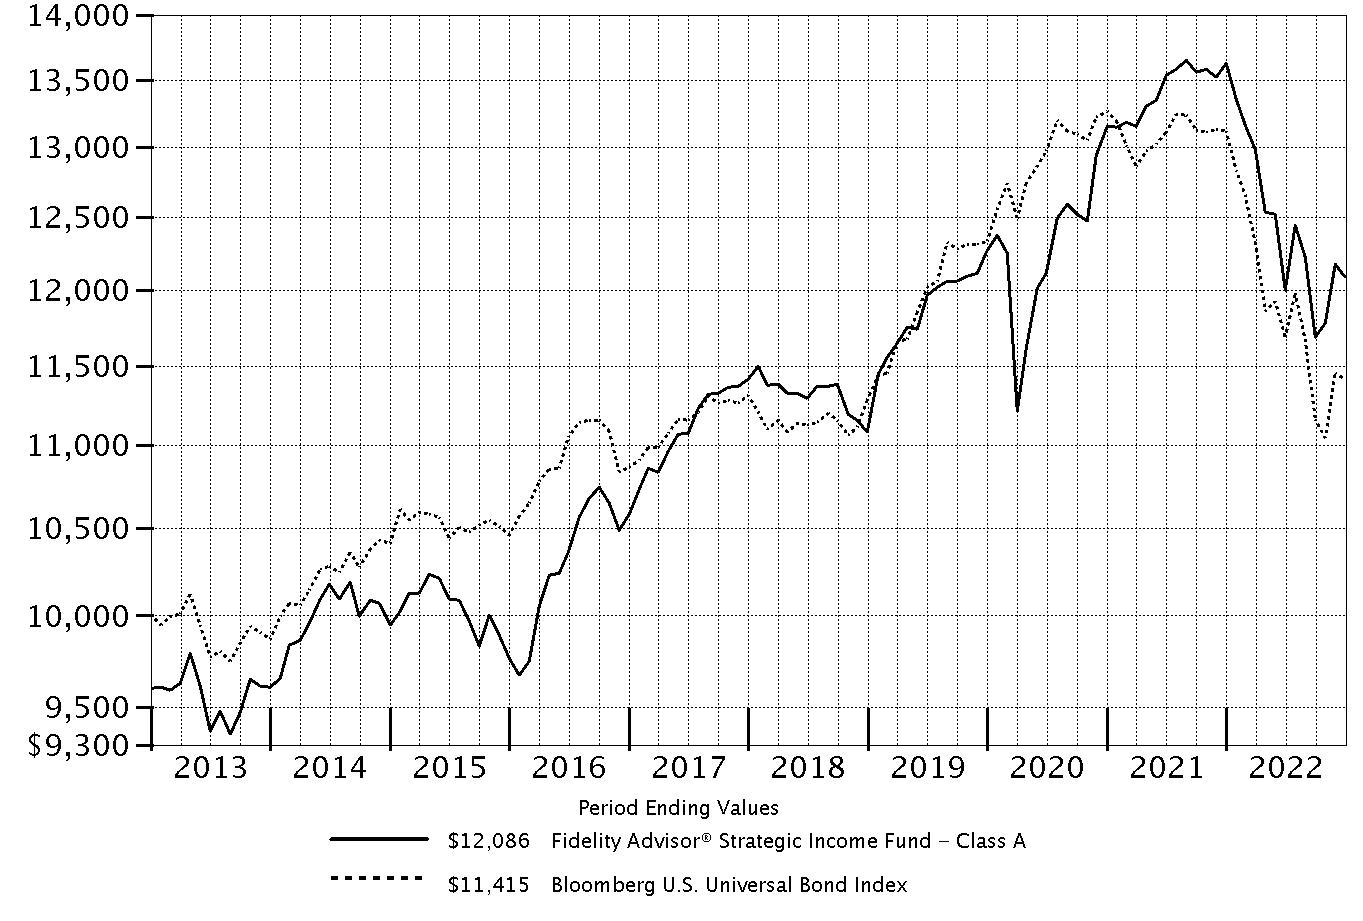
$10,000 Over 10 Years
|
|
Let's say hypothetically that $10,000 was invested in Fidelity Advisor® Strategic Income Fund - Class A, a class of the fund, on December 31, 2012, and the current 4.00% sales charge was paid.
The chart shows how the value of your investment would have changed, and also shows how the Bloomberg U.S. Universal Bond Index performed over the same period.
|
|
|
Top Bond Issuers (% of Fund's net assets)
|
||
|
(with maturities greater than one year)
|
||
|
U.S. Treasury Obligations
|
27.1
|
|
|
Freddie Mac
|
1.2
|
|
|
CCO Holdings LLC/CCO Holdings Capital Corp.
|
1.2
|
|
|
TransDigm, Inc.
|
1.2
|
|
|
JPMorgan Chase & Co.
|
0.9
|
|
|
Bank of America Corp.
|
0.9
|
|
|
Citigroup, Inc.
|
0.9
|
|
|
Fannie Mae
|
0.8
|
|
|
United Kingdom, Great Britain and Northern Ireland
|
0.8
|
|
|
German Federal Republic
|
0.7
|
|
|
35.7
|
||
|
Market Sectors (% of Fund's net assets)
|
||
|
Financials
|
9.5
|
|
|
Energy
|
9.3
|
|
|
Consumer Discretionary
|
8.1
|
|
|
Communication Services
|
7.7
|
|
|
Industrials
|
6.4
|
|
|
Materials
|
4.9
|
|
|
Information Technology
|
3.9
|
|
|
Health Care
|
3.2
|
|
|
Utilities
|
3.0
|
|
|
Consumer Staples
|
2.5
|
|
|
Real Estate
|
1.4
|
|
|
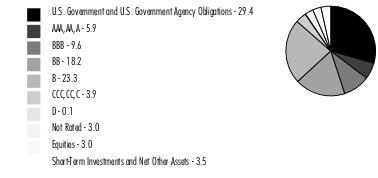
Quality Diversification (% of Fund's net assets)
|
|
|
We have used ratings from Moody's Investors Service, Inc. Where Moody's® ratings are not available, we have used S&P® ratings. All ratings are as of the date indicated and do not reflect subsequent changes.
|
|
Asset Allocation (% of Fund's net assets)
|
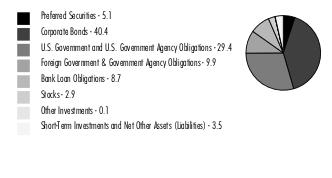
|
|
Foreign investments - 25.8%
|
|
Futures and Swaps - 8.6%
|
|
Forward Currency Contracts - (5.1)%
|
|
Percentages in the above tables are adjusted for the effect of TBA Sale Commitments.
|
|
Geographic Diversification (% of Fund's net assets)
|
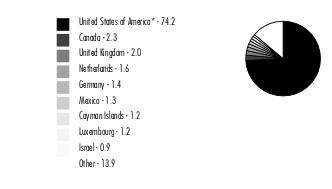
|
|
* Includes Short-Term investments and Net Other Assets (Liabilities).
Percentages are based on country or territory of incorporation and are adjusted for the effect of derivatives, if applicable.
|
|
Corporate Bonds - 32.7%
|
|||
|
Principal
Amount (a)
(000s)
|
Value ($)
(000s)
|
||
|
Convertible Bonds - 0.2%
|
|||
|
ENERGY - 0.2%
|
|||
|
Oil, Gas & Consumable Fuels - 0.2%
|
|||
|
Mesquite Energy, Inc. 15% 7/15/23 (b)(c)
|
1,457
|
9,285
|
|
|
Mesquite Energy, Inc. 15% 7/15/23 (b)(c)
|
2,515
|
16,026
|
|
|
25,311
|
|||
|
FINANCIALS - 0.0%
|
|||
|
Diversified Financial Services - 0.0%
|
|||
|
New Cotai LLC 5% 2/24/27 (c)
|
2,620
|
4,216
|
|
|
TOTAL CONVERTIBLE BONDS
|
29,527
|
||
|
Nonconvertible Bonds - 32.5%
|
|||
|
COMMUNICATION SERVICES - 4.9%
|
|||
|
Diversified Telecommunication Services - 2.0%
|
|||
|
Altice France SA:
|
|||
|
5.125% 7/15/29(d)
|
38,465
|
28,839
|
|
|
5.5% 1/15/28(d)
|
13,345
|
10,451
|
|
|
5.5% 10/15/29(d)
|
28,170
|
21,480
|
|
|
8.125% 2/1/27(d)
|
4,495
|
4,094
|
|
|
C&W Senior Financing Designated Activity Co. 6.875% 9/15/27 (d)
|
21,480
|
19,893
|
|
|
Cablevision Lightpath LLC:
|
|||
|
3.875% 9/15/27(d)
|
3,300
|
2,720
|
|
|
5.625% 9/15/28(d)
|
2,610
|
1,939
|
|
|
Cogent Communications Group, Inc. 7% 6/15/27 (d)
|
2,785
|
2,729
|
|
|
Frontier Communications Holdings LLC:
|
|||
|
5% 5/1/28(d)
|
11,730
|
10,229
|
|
|
5.875% 10/15/27(d)
|
6,300
|
5,850
|
|
|
8.75% 5/15/30(d)
|
2,785
|
2,832
|
|
|
Northwest Fiber LLC/Northwest Fiber Finance Sub, Inc.:
|
|||
|
4.75% 4/30/27(d)
|
2,800
|
2,464
|
|
|
6% 2/15/28(d)
|
2,355
|
1,823
|
|
|
Qwest Corp. 7.25% 9/15/25
|
955
|
961
|
|
|
Sable International Finance Ltd. 5.75% 9/7/27 (d)
|
11,004
|
10,165
|
|
|
Sprint Capital Corp.:
|
|||
|
6.875% 11/15/28
|
53,897
|
55,942
|
|
|
8.75% 3/15/32
|
15,023
|
17,879
|
|
|
Telenet Finance Luxembourg Notes SARL 5.5% 3/1/28 (d)
|
9,200
|
8,280
|
|
|
Verizon Communications, Inc. 4.75% 10/31/34
|
EUR
|
11,734
|
12,957
|
|
Virgin Media Finance PLC 5% 7/15/30 (d)
|
14,025
|
11,237
|
|
|
Windstream Escrow LLC 7.75% 8/15/28 (d)
|
24,965
|
20,342
|
|
|
Zayo Group Holdings, Inc. 4% 3/1/27 (d)
|
9,545
|
7,050
|
|
|
260,156
|
|||
|
Entertainment - 0.0%
|
|||
|
Roblox Corp. 3.875% 5/1/30 (d)
|
4,175
|
3,291
|
|
|
Media - 2.8%
|
|||
|
Altice Financing SA:
|
|||
|
5% 1/15/28(d)
|
8,025
|
6,460
|
|
|
5.75% 8/15/29(d)
|
11,895
|
9,356
|
|
|
Block Communications, Inc. 4.875% 3/1/28 (d)
|
4,405
|
3,843
|
|
|
CCO Holdings LLC/CCO Holdings Capital Corp.:
|
|||
|
4.25% 2/1/31(d)
|
10,205
|
8,186
|
|
|
4.5% 8/15/30(d)
|
16,805
|
13,884
|
|
|
4.5% 5/1/32
|
6,745
|
5,369
|
|
|
4.75% 3/1/30(d)
|
51,010
|
43,992
|
|
|
5% 2/1/28(d)
|
22,835
|
20,734
|
|
|
5.375% 6/1/29(d)
|
34,085
|
30,822
|
|
|
6.375% 9/1/29(d)
|
5,815
|
5,465
|
|
|
Clear Channel International BV 6.625% 8/1/25 (d)
|
9,800
|
9,351
|
|
|
Clear Channel Outdoor Holdings, Inc. 7.5% 6/1/29 (d)
|
5,745
|
4,218
|
|
|
CSC Holdings LLC:
|
|||
|
4.5% 11/15/31(d)
|
14,440
|
10,019
|
|
|
5.375% 2/1/28(d)
|
13,855
|
11,171
|
|
|
6.5% 2/1/29(d)
|
15,380
|
12,573
|
|
|
Diamond Sports Group LLC/Diamond Sports Finance Co. 5.375% 8/15/26 (d)
|
24,690
|
2,901
|
|
|
DISH DBS Corp.:
|
|||
|
5.25% 12/1/26(d)
|
6,925
|
5,833
|
|
|
5.75% 12/1/28(d)
|
6,925
|
5,527
|
|
|
DISH Network Corp. 11.75% 11/15/27 (d)
|
5,670
|
5,840
|
|
|
Gannett Holdings LLC 6% 11/1/26 (d)
|
4,000
|
3,260
|
|
|
Gray Escrow II, Inc. 5.375% 11/15/31 (d)
|
8,145
|
5,870
|
|
|
LCPR Senior Secured Financing DAC:
|
|||
|
5.125% 7/15/29(d)
|
7,310
|
6,056
|
|
|
6.75% 10/15/27(d)
|
6,107
|
5,710
|
|
|
Nexstar Broadcasting, Inc.:
|
|||
|
4.75% 11/1/28(d)
|
13,395
|
11,587
|
|
|
5.625% 7/15/27(d)
|
14,270
|
13,091
|
|
|
Quebecor Media, Inc. 5.75% 1/15/23
|
14,205
|
14,171
|
|
|
Radiate Holdco LLC/Radiate Financial Service Ltd. 4.5% 9/15/26 (d)
|
4,205
|
3,089
|
|
|
Scripps Escrow II, Inc. 3.875% 1/15/29 (d)
|
1,655
|
1,328
|
|
|
Sirius XM Radio, Inc.:
|
|||
|
3.125% 9/1/26(d)
|
4,235
|
3,760
|
|
|
3.875% 9/1/31(d)
|
5,645
|
4,404
|
|
|
4% 7/15/28(d)
|
11,260
|
9,800
|
|
|
5% 8/1/27(d)
|
8,740
|
8,079
|
|
|
Townsquare Media, Inc. 6.875% 2/1/26 (d)
|
3,305
|
2,933
|
|
|
Univision Communications, Inc.:
|
|||
|
4.5% 5/1/29(d)
|
5,760
|
4,817
|
|
|
7.375% 6/30/30(d)
|
8,200
|
7,837
|
|
|
Videotron Ltd. 5.125% 4/15/27 (d)
|
7,325
|
6,919
|
|
|
VZ Secured Financing BV 5% 1/15/32 (d)
|
11,130
|
9,044
|
|
|
Ziggo Bond Co. BV:
|
|||
|
5.125% 2/28/30(d)
|
3,375
|
2,725
|
|
|
6% 1/15/27(d)
|
7,930
|
7,378
|
|
|
Ziggo BV 4.875% 1/15/30 (d)
|
4,805
|
4,021
|
|
|
351,423
|
|||
|
Wireless Telecommunication Services - 0.1%
|
|||
|
Intelsat Jackson Holdings SA 6.5% 3/15/30 (d)
|
11,675
|
10,437
|
|
|
Millicom International Cellular SA 4.5% 4/27/31 (d)
|
1,040
|
873
|
|
|
Sprint Corp. 7.625% 3/1/26
|
3,615
|
3,804
|
|
|
T-Mobile U.S.A., Inc. 3.5% 4/15/31
|
2,215
|
1,913
|
|
|
17,027
|
|||
|
TOTAL COMMUNICATION SERVICES
|
631,897
|
||
|
CONSUMER DISCRETIONARY - 5.0%
|
|||
|
Auto Components - 0.1%
|
|||
|
Allison Transmission, Inc. 5.875% 6/1/29 (d)
|
4,830
|
4,536
|
|
|
Dana, Inc. 4.5% 2/15/32
|
4,150
|
3,319
|
|
|
Exide Technologies:
|
|||
|
11% 10/31/24 pay-in-kind(c)(d)(e)(f)
|
1,280
|
0
|
|
|
11% 10/31/24 pay-in-kind(c)(d)(e)(f)
|
632
|
285
|
|
|
Nesco Holdings II, Inc. 5.5% 4/15/29 (d)
|
7,155
|
6,261
|
|
|
PECF USS Intermediate Holding III Corp. 8% 11/15/29 (d)
|
2,515
|
1,634
|
|
|
16,035
|
|||
|
Automobiles - 0.2%
|
|||
|
Ford Motor Co.:
|
|||
|
3.25% 2/12/32
|
12,660
|
9,496
|
|
|
6.1% 8/19/32
|
5,815
|
5,380
|
|
|
McLaren Finance PLC 7.5% 8/1/26 (d)
|
3,860
|
2,837
|
|
|
Rivian Holdco & Rivian LLC & Rivian Automotive LLC 6 month U.S. LIBOR + 5.620% 10.1636% 10/15/26 (d)(f)(g)
|
14,000
|
13,510
|
|
|
31,223
|
|||
|
Diversified Consumer Services - 0.2%
|
|||
|
Adtalem Global Education, Inc. 5.5% 3/1/28 (d)
|
4,235
|
3,843
|
|
|
GEMS MENASA Cayman Ltd. 7.125% 7/31/26 (d)
|
5,300
|
5,066
|
|
|
Service Corp. International 4% 5/15/31
|
5,750
|
4,845
|
|
|
Sotheby's 7.375% 10/15/27 (d)
|
2,970
|
2,785
|
|
|
Sotheby's/Bidfair Holdings, Inc. 5.875% 6/1/29 (d)
|
4,315
|
3,623
|
|
|
TKC Holdings, Inc. 6.875% 5/15/28 (d)
|
6,393
|
4,995
|
|
|
WASH Multifamily Acquisition, Inc. 5.75% 4/15/26 (d)
|
4,750
|
4,477
|
|
|
29,634
|
|||
|
Hotels, Restaurants & Leisure - 2.7%
|
|||
|
1011778 BC Unlimited Liability Co./New Red Finance, Inc.:
|
|||
|
3.875% 1/15/28(d)
|
5,685
|
5,085
|
|
|
4% 10/15/30(d)
|
23,490
|
19,022
|
|
|
4.375% 1/15/28(d)
|
6,265
|
5,610
|
|
|
Affinity Gaming LLC 6.875% 12/15/27 (d)
|
2,520
|
2,137
|
|
|
Bloomin Brands, Inc. / OSI Restaurant Partners LLC 5.125% 4/15/29 (d)
|
2,720
|
2,288
|
|
|
Booking Holdings, Inc. 4.75% 11/15/34
|
EUR
|
9,706
|
10,561
|
|
Boyd Gaming Corp. 4.75% 6/15/31 (d)
|
7,140
|
6,212
|
|
|
Caesars Entertainment, Inc.:
|
|||
|
4.625% 10/15/29(d)
|
8,375
|
6,816
|
|
|
6.25% 7/1/25(d)
|
25,535
|
24,812
|
|
|
8.125% 7/1/27(d)
|
34,045
|
33,451
|
|
|
Caesars Resort Collection LLC 5.75% 7/1/25 (d)
|
8,510
|
8,330
|
|
|
Carnival Corp.:
|
|||
|
4% 8/1/28(d)
|
14,305
|
11,664
|
|
|
7.625% 3/1/26(d)
|
10,595
|
8,398
|
|
|
9.875% 8/1/27(d)
|
10,150
|
9,592
|
|
|
10.5% 2/1/26(d)
|
7,395
|
7,385
|
|
|
Carnival Holdings (Bermuda) Ltd. 10.375% 5/1/28 (d)
|
8,655
|
8,885
|
|
|
CDI Escrow Issuer, Inc. 5.75% 4/1/30 (d)
|
2,790
|
2,501
|
|
|
Fertitta Entertainment LLC / Fertitta Entertainment Finance Co., Inc.:
|
|||
|
4.625% 1/15/29(d)
|
11,750
|
9,943
|
|
|
6.75% 1/15/30(d)
|
15,885
|
12,813
|
|
|
Garden SpinCo Corp. 8.625% 7/20/30 (d)
|
2,545
|
2,698
|
|
|
Hilton Domestic Operating Co., Inc.:
|
|||
|
3.75% 5/1/29(d)
|
3,350
|
2,898
|
|
|
4% 5/1/31(d)
|
5,020
|
4,200
|
|
|
4.875% 1/15/30
|
11,025
|
9,991
|
|
|
Hilton Worldwide Finance LLC/Hilton Worldwide Finance Corp. 4.875% 4/1/27
|
5,210
|
4,959
|
|
|
Jacobs Entertainment, Inc. 6.75% 2/15/29 (d)
|
3,955
|
3,570
|
|
|
Melco Resorts Finance Ltd.:
|
|||
|
5.25% 4/26/26(d)
|
5,440
|
4,786
|
|
|
5.75% 7/21/28(d)
|
2,710
|
2,257
|
|
|
Merlin Entertainments PLC 5.75% 6/15/26 (d)
|
4,580
|
4,288
|
|
|
MGM Resorts International 4.75% 10/15/28
|
6,740
|
5,883
|
|
|
NCL Corp. Ltd. 5.875% 2/15/27 (d)
|
5,580
|
4,834
|
|
|
Papa John's International, Inc. 3.875% 9/15/29 (d)
|
2,555
|
2,133
|
|
|
Premier Entertainment Sub LLC:
|
|||
|
5.625% 9/1/29(d)
|
10,245
|
7,555
|
|
|
5.875% 9/1/31(d)
|
5,385
|
3,809
|
|
|
Royal Caribbean Cruises Ltd.:
|
|||
|
5.375% 7/15/27(d)
|
4,165
|
3,372
|
|
|
8.25% 1/15/29(d)
|
12,500
|
12,561
|
|
|
9.25% 1/15/29(d)
|
16,510
|
16,966
|
|
|
11.5% 6/1/25(d)
|
13,222
|
14,181
|
|
|
11.625% 8/15/27(d)
|
5,815
|
5,830
|
|
|
SeaWorld Parks & Entertainment, Inc. 5.25% 8/15/29 (d)
|
5,630
|
4,902
|
|
|
Station Casinos LLC 4.625% 12/1/31 (d)
|
4,155
|
3,333
|
|
|
Studio City Finance Ltd. 5% 1/15/29 (d)
|
3,255
|
2,405
|
|
|
Vail Resorts, Inc. 6.25% 5/15/25 (d)
|
3,855
|
3,855
|
|
|
Viking Cruises Ltd. 13% 5/15/25 (d)
|
5,740
|
6,056
|
|
|
Voc Escrow Ltd. 5% 2/15/28 (d)
|
6,285
|
5,406
|
|
|
Yum! Brands, Inc. 4.625% 1/31/32
|
5,905
|
5,220
|
|
|
343,453
|
|||
|
Household Durables - 0.4%
|
|||
|
Ashton Woods U.S.A. LLC/Ashton Woods Finance Co. 4.625% 4/1/30 (d)
|
4,105
|
3,295
|
|
|
Brookfield Residential Properties, Inc./Brookfield Residential U.S. Corp. 4.875% 2/15/30 (d)
|
4,370
|
3,407
|
|
|
Century Communities, Inc. 3.875% 8/15/29 (d)
|
4,225
|
3,322
|
|
|
Taylor Morrison Communities, Inc./Monarch Communities, Inc. 5.625% 3/1/24 (d)
|
775
|
769
|
|
|
Tempur Sealy International, Inc.:
|
|||
|
3.875% 10/15/31(d)
|
7,360
|
5,778
|
|
|
4% 4/15/29(d)
|
7,905
|
6,641
|
|
|
TopBuild Corp. 3.625% 3/15/29 (d)
|
3,030
|
2,484
|
|
|
TRI Pointe Group, Inc./TRI Pointe Holdings, Inc. 5.875% 6/15/24
|
11,770
|
11,712
|
|
|
TRI Pointe Homes, Inc. 5.7% 6/15/28
|
8,715
|
7,894
|
|
|
45,302
|
|||
|
Internet & Direct Marketing Retail - 0.8%
|
|||
|
Angi Group LLC 3.875% 8/15/28 (d)
|
3,385
|
2,512
|
|
|
Millennium Escrow Corp. 6.625% 8/1/26 (d)
|
5,650
|
3,616
|
|
|
Terrier Media Buyer, Inc. 8.875% 12/15/27 (d)
|
23,835
|
17,941
|
|
|
Uber Technologies, Inc.:
|
|||
|
4.5% 8/15/29(d)
|
12,675
|
11,043
|
|
|
6.25% 1/15/28(d)
|
5,520
|
5,299
|
|
|
7.5% 9/15/27(d)
|
31,625
|
31,647
|
|
|
8% 11/1/26(d)
|
29,170
|
29,270
|
|
|
101,328
|
|||
|
Multiline Retail - 0.1%
|
|||
|
Macy's Retail Holdings LLC:
|
|||
|
5.875% 3/15/30(d)
|
2,925
|
2,538
|
|
|
6.125% 3/15/32(d)
|
2,820
|
2,370
|
|
|
Nordstrom, Inc.:
|
|||
|
4.25% 8/1/31
|
11,600
|
8,295
|
|
|
4.375% 4/1/30
|
1,745
|
1,312
|
|
|
5% 1/15/44
|
825
|
501
|
|
|
6.95% 3/15/28
|
250
|
231
|
|
|
15,247
|
|||
|
Specialty Retail - 0.4%
|
|||
|
Arko Corp. 5.125% 11/15/29 (d)
|
4,190
|
3,290
|
|
|
Asbury Automotive Group, Inc.:
|
|||
|
4.5% 3/1/28
|
1,987
|
1,749
|
|
|
4.625% 11/15/29(d)
|
4,555
|
3,838
|
|
|
4.75% 3/1/30
|
1,980
|
1,656
|
|
|
5% 2/15/32(d)
|
4,915
|
4,044
|
|
|
Bath & Body Works, Inc.:
|
|||
|
6.625% 10/1/30(d)
|
3,355
|
3,148
|
|
|
6.75% 7/1/36
|
8,920
|
7,840
|
|
|
7.5% 6/15/29
|
5,030
|
4,966
|
|
|
Carvana Co.:
|
|||
|
4.875% 9/1/29(d)
|
10,830
|
4,172
|
|
|
5.875% 10/1/28(d)
|
680
|
265
|
|
|
Foot Locker, Inc. 4% 10/1/29 (d)
|
2,800
|
2,181
|
|
|
LCM Investments Holdings 4.875% 5/1/29 (d)
|
3,120
|
2,498
|
|
|
Michaels Companies, Inc. 5.25% 5/1/28 (d)
|
6,875
|
5,531
|
|
|
Victoria's Secret & Co. 4.625% 7/15/29 (d)
|
10,565
|
8,295
|
|
|
53,473
|
|||
|
Textiles, Apparel & Luxury Goods - 0.1%
|
|||
|
Crocs, Inc.:
|
|||
|
4.125% 8/15/31(d)
|
2,820
|
2,298
|
|
|
4.25% 3/15/29(d)
|
4,325
|
3,664
|
|
|
Kontoor Brands, Inc. 4.125% 11/15/29 (d)
|
2,420
|
1,975
|
|
|
7,937
|
|||
|
TOTAL CONSUMER DISCRETIONARY
|
643,632
|
||
|
CONSUMER STAPLES - 1.2%
|
|||
|
Beverages - 0.0%
|
|||
|
Triton Water Holdings, Inc. 6.25% 4/1/29 (d)
|
3,135
|
2,515
|
|
|
Food & Staples Retailing - 0.5%
|
|||
|
Albertsons Companies LLC/Safeway, Inc./New Albertson's, Inc./Albertson's LLC:
|
|||
|
3.5% 3/15/29(d)
|
5,285
|
4,434
|
|
|
4.625% 1/15/27(d)
|
13,797
|
12,816
|
|
|
4.875% 2/15/30(d)
|
23,423
|
20,904
|
|
|
C&S Group Enterprises LLC 5% 12/15/28 (d)
|
5,155
|
3,892
|
|
|
KeHE Distributors LLC / KeHE Finance Corp. 8.625% 10/15/26 (d)
|
4,698
|
4,592
|
|
|
Performance Food Group, Inc.:
|
|||
|
4.25% 8/1/29(d)
|
3,955
|
3,427
|
|
|
5.5% 10/15/27(d)
|
5,345
|
5,041
|
|
|
SEG Holding LLC/SEG Finance Corp. 5.625% 10/15/28 (d)
|
6,735
|
6,331
|
|
|
United Natural Foods, Inc. 6.75% 10/15/28 (d)
|
4,680
|
4,497
|
|
|
65,934
|
|||
|
Food Products - 0.6%
|
|||
|
Chobani LLC/Finance Corp., Inc. 4.625% 11/15/28 (d)
|
3,790
|
3,300
|
|
|
Darling Ingredients, Inc. 6% 6/15/30 (d)
|
6,615
|
6,466
|
|
|
JBS U.S.A. Lux SA / JBS Food Co. 5.5% 1/15/30 (d)
|
12,225
|
11,632
|
|
|
Lamb Weston Holdings, Inc.:
|
|||
|
4.125% 1/31/30(d)
|
5,575
|
4,924
|
|
|
4.375% 1/31/32(d)
|
2,790
|
2,438
|
|
|
Pilgrim's Pride Corp. 4.25% 4/15/31 (d)
|
10,220
|
8,693
|
|
|
Post Holdings, Inc.:
|
|||
|
4.5% 9/15/31(d)
|
12,110
|
10,180
|
|
|
4.625% 4/15/30(d)
|
6,415
|
5,534
|
|
|
5.5% 12/15/29(d)
|
11,940
|
10,805
|
|
|
5.75% 3/1/27(d)
|
1,713
|
1,657
|
|
|
Simmons Foods, Inc. 4.625% 3/1/29 (d)
|
4,295
|
3,496
|
|
|
TreeHouse Foods, Inc. 4% 9/1/28
|
2,250
|
1,913
|
|
|
71,038
|
|||
|
Household Products - 0.0%
|
|||
|
Diamond BC BV 4.625% 10/1/29 (d)
|
3,360
|
2,696
|
|
|
Spectrum Brands Holdings, Inc. 3.875% 3/15/31 (d)
|
4,310
|
3,352
|
|
|
6,048
|
|||
|
Personal Products - 0.1%
|
|||
|
BellRing Brands, Inc. 7% 3/15/30 (d)
|
6,925
|
6,664
|
|
|
TOTAL CONSUMER STAPLES
|
152,199
|
||
|
ENERGY - 4.1%
|
|||
|
Energy Equipment & Services - 0.3%
|
|||
|
CGG SA 8.75% 4/1/27 (d)
|
5,895
|
4,761
|
|
|
Nabors Industries Ltd.:
|
|||
|
7.25% 1/15/26(d)
|
6,565
|
6,187
|
|
|
7.5% 1/15/28(d)
|
5,660
|
5,178
|
|
|
Nine Energy Service, Inc. 8.75% 11/1/23 (d)
|
3,620
|
3,548
|
|
|
NuStar Logistics LP 6% 6/1/26
|
7,285
|
7,015
|
|
|
Summit Midstream Holdings LLC:
|
|||
|
5.75% 4/15/25
|
3,405
|
2,882
|
|
|
8.5%(d)(h)
|
4,185
|
3,986
|
|
|
Vier Gas Transport GmbH 4.625% 9/26/32 (Reg. S)
|
EUR
|
4,000
|
4,302
|
|
37,859
|
|||
|
Multi Industry Energy - 0.0%
|
|||
|
Enviva Partners LP / Enviva Partners Finance Corp. 6.5% 1/15/26 (d)
|
6,600
|
6,216
|
|
|
Oil, Gas & Consumable Fuels - 3.8%
|
|||
|
Antero Midstream Partners LP/Antero Midstream Finance Corp.:
|
|||
|
5.375% 6/15/29(d)
|
4,305
|
3,936
|
|
|
5.75% 1/15/28(d)
|
10,640
|
9,870
|
|
|
Cheniere Energy Partners LP:
|
|||
|
3.25% 1/31/32
|
4,200
|
3,338
|
|
|
4% 3/1/31
|
9,070
|
7,722
|
|
|
Cheniere Energy, Inc. 4.625% 10/15/28
|
9,375
|
8,474
|
|
|
Chesapeake Energy Corp.:
|
|||
|
5.875% 2/1/29(d)
|
3,115
|
2,951
|
|
|
6.75% 4/15/29(d)
|
4,415
|
4,298
|
|
|
7% 10/1/24(c)(e)
|
3,985
|
0
|
|
|
8% 1/15/25(c)(e)
|
1,955
|
0
|
|
|
8% 6/15/27(c)(e)
|
1,240
|
0
|
|
|
Citgo Holding, Inc. 9.25% 8/1/24 (d)
|
16,430
|
16,392
|
|
|
Citgo Petroleum Corp.:
|
|||
|
6.375% 6/15/26(d)
|
4,665
|
4,496
|
|
|
7% 6/15/25(d)
|
13,580
|
13,245
|
|
|
CNX Midstream Partners LP 4.75% 4/15/30 (d)
|
2,970
|
2,437
|
|
|
CNX Resources Corp.:
|
|||
|
6% 1/15/29(d)
|
3,200
|
2,944
|
|
|
7.375% 1/15/31(d)
|
2,885
|
2,765
|
|
|
Colgate Energy Partners III LLC 5.875% 7/1/29 (d)
|
4,055
|
3,477
|
|
|
Comstock Resources, Inc.:
|
|||
|
5.875% 1/15/30(d)
|
15,170
|
13,042
|
|
|
6.75% 3/1/29(d)
|
8,110
|
7,319
|
|
|
CQP Holdco LP / BIP-V Chinook Holdco LLC 5.5% 6/15/31 (d)
|
12,715
|
11,107
|
|
|
Crestwood Midstream Partners LP/Crestwood Midstream Finance Corp.:
|
|||
|
5.625% 5/1/27(d)
|
11,025
|
10,253
|
|
|
5.75% 4/1/25
|
2,960
|
2,879
|
|
|
6% 2/1/29(d)
|
23,985
|
22,006
|
|
|
CrownRock LP/CrownRock Finance, Inc. 5% 5/1/29 (d)
|
2,450
|
2,201
|
|
|
CVR Energy, Inc.:
|
|||
|
5.25% 2/15/25(d)
|
9,740
|
8,961
|
|
|
5.75% 2/15/28(d)
|
24,505
|
21,332
|
|
|
DCP Midstream Operating LP 5.85% 5/21/43 (d)(f)
|
10,780
|
10,516
|
|
|
DT Midstream, Inc.:
|
|||
|
4.125% 6/15/29(d)
|
4,285
|
3,681
|
|
|
4.375% 6/15/31(d)
|
4,285
|
3,595
|
|
|
EG Global Finance PLC 8.5% 10/30/25 (d)
|
9,545
|
8,892
|
|
|
Endeavor Energy Resources LP/EER Finance, Inc. 5.75% 1/30/28 (d)
|
10,149
|
9,718
|
|
|
Energy Transfer LP 5.5% 6/1/27
|
12,065
|
11,744
|
|
|
EnLink Midstream LLC 6.5% 9/1/30 (d)
|
5,815
|
5,755
|
|
|
Hess Midstream Partners LP:
|
|||
|
4.25% 2/15/30(d)
|
4,590
|
3,924
|
|
|
5.125% 6/15/28(d)
|
6,600
|
6,103
|
|
|
5.5% 10/15/30(d)
|
2,775
|
2,539
|
|
|
5.625% 2/15/26(d)
|
9,140
|
8,903
|
|
|
Hilcorp Energy I LP/Hilcorp Finance Co. 6.25% 11/1/28 (d)
|
7,130
|
6,453
|
|
|
Holly Energy Partners LP/Holly Energy Finance Corp.:
|
|||
|
5% 2/1/28(d)
|
4,350
|
3,961
|
|
|
6.375% 4/15/27(d)
|
2,780
|
2,731
|
|
|
MEG Energy Corp. 7.125% 2/1/27 (d)
|
6,490
|
6,619
|
|
|
Mesquite Energy, Inc. 7.25% 2/15/23 (c)(d)(e)
|
12,834
|
0
|
|
|
Murphy Oil U.S.A., Inc.:
|
|||
|
4.75% 9/15/29
|
4,155
|
3,802
|
|
|
5.625% 5/1/27
|
3,665
|
3,559
|
|
|
New Fortress Energy, Inc.:
|
|||
|
6.5% 9/30/26(d)
|
11,785
|
10,945
|
|
|
6.75% 9/15/25(d)
|
12,840
|
12,144
|
|
|
NGPL PipeCo LLC 4.875% 8/15/27 (d)
|
1,800
|
1,710
|
|
|
Occidental Petroleum Corp.:
|
|||
|
3.5% 8/15/29
|
3,820
|
3,420
|
|
|
5.875% 9/1/25
|
6,775
|
6,750
|
|
|
6.2% 3/15/40
|
3,565
|
3,489
|
|
|
6.375% 9/1/28
|
6,775
|
6,841
|
|
|
6.45% 9/15/36
|
11,875
|
12,113
|
|
|
6.6% 3/15/46
|
7,130
|
7,337
|
|
|
6.625% 9/1/30
|
13,550
|
14,002
|
|
|
7.2% 3/15/29
|
2,440
|
2,525
|
|
|
7.5% 5/1/31
|
680
|
727
|
|
|
Parkland Corp.:
|
|||
|
4.5% 10/1/29(d)
|
4,420
|
3,683
|
|
|
4.625% 5/1/30(d)
|
5,540
|
4,584
|
|
|
PBF Holding Co. LLC/PBF Finance Corp.:
|
|||
|
6% 2/15/28
|
15,760
|
14,066
|
|
|
7.25% 6/15/25
|
13,580
|
13,419
|
|
|
PBF Logistics LP/PBF Logistics Finance, Inc. 6.875% 5/15/23
|
6,110
|
6,102
|
|
|
PDC Energy, Inc. 6.125% 9/15/24
|
1,240
|
1,233
|
|
|
SM Energy Co.:
|
|||
|
5.625% 6/1/25
|
4,400
|
4,224
|
|
|
6.625% 1/15/27
|
12,830
|
12,358
|
|
|
6.75% 9/15/26
|
3,175
|
3,082
|
|
|
Southwestern Energy Co.:
|
|||
|
5.375% 3/15/30
|
5,630
|
5,135
|
|
|
5.7% 1/23/25(i)
|
149
|
146
|
|
|
7.75% 10/1/27
|
7,830
|
7,980
|
|
|
Sunoco LP/Sunoco Finance Corp.:
|
|||
|
4.5% 5/15/29
|
5,515
|
4,824
|
|
|
4.5% 4/30/30
|
5,550
|
4,818
|
|
|
Tallgrass Energy Partners LP / Tallgrass Energy Finance Corp.:
|
|||
|
6% 9/1/31(d)
|
4,225
|
3,633
|
|
|
7.5% 10/1/25(d)
|
5,035
|
5,080
|
|
|
Targa Resources Partners LP/Targa Resources Partners Finance Corp. 4.875% 2/1/31
|
6,345
|
5,729
|
|
|
Teine Energy Ltd. 6.875% 4/15/29 (d)
|
4,420
|
3,967
|
|
|
Tennessee Gas Pipeline Co. 7.625% 4/1/37
|
2,585
|
2,811
|
|
|
Unit Corp. 0% 12/1/29 (c)
|
1,660
|
0
|
|
|
Venture Global Calcasieu Pass LLC:
|
|||
|
3.875% 8/15/29(d)
|
3,525
|
3,084
|
|
|
4.125% 8/15/31(d)
|
3,525
|
3,003
|
|
|
482,904
|
|||
|
TOTAL ENERGY
|
526,979
|
||
|
FINANCIALS - 4.1%
|
|||
|
Banks - 0.5%
|
|||
|
ABN AMRO Bank NV 4.5% 11/21/34 (Reg. S)
|
EUR
|
7,200
|
7,614
|
|
AIB Group PLC 2.875% 5/30/31 (Reg. S) (f)
|
EUR
|
5,810
|
5,580
|
|
Barclays PLC 5.262% 1/29/34 (Reg. S) (f)
|
EUR
|
12,316
|
13,017
|
|
CaixaBank SA 6.25% 2/23/33 (Reg. S) (f)
|
EUR
|
9,500
|
10,178
|
|
HSBC Holdings PLC Eur Swap Annual 5Y Index + 3.300% 6.364% 11/16/32 (Reg. S) (f)(g)
|
EUR
|
9,791
|
10,632
|
|
Svenska Handelsbanken AB 3.25% 6/1/33 (Reg. S) (f)
|
EUR
|
9,304
|
9,180
|
|
UniCredit SpA 2.731% 1/15/32 (Reg. S) (f)
|
EUR
|
1,676
|
1,507
|
|
57,708
|
|||
|
Capital Markets - 0.4%
|
|||
|
AssuredPartners, Inc.:
|
|||
|
5.625% 1/15/29(d)
|
3,905
|
3,214
|
|
|
7% 8/15/25(d)
|
2,930
|
2,834
|
|
|
Broadstreet Partners, Inc. 5.875% 4/15/29 (d)
|
7,265
|
6,183
|
|
|
Coinbase Global, Inc.:
|
|||
|
3.375% 10/1/28(d)
|
4,060
|
2,146
|
|
|
3.625% 10/1/31(d)
|
4,200
|
2,023
|
|
|
Deutsche Bank AG 4% 6/24/32 (Reg. S) (f)
|
EUR
|
17,100
|
16,195
|
|
Hightower Holding LLC 6.75% 4/15/29 (d)
|
2,870
|
2,397
|
|
|
Jane Street Group LLC/JSG Finance, Inc. 4.5% 11/15/29 (d)
|
3,985
|
3,427
|
|
|
Lions Gate Capital Holdings LLC 5.5% 4/15/29 (d)
|
4,420
|
2,563
|
|
|
MSCI, Inc.:
|
|||
|
3.25% 8/15/33(d)
|
4,225
|
3,263
|
|
|
4% 11/15/29(d)
|
3,780
|
3,293
|
|
|
47,538
|
|||
|
Consumer Finance - 1.6%
|
|||
|
Ally Financial, Inc.:
|
|||
|
8% 11/1/31
|
53,672
|
55,408
|
|
|
8% 11/1/31
|
16,761
|
17,426
|
|
|
Ford Motor Credit Co. LLC:
|
|||
|
3.375% 11/13/25
|
11,600
|
10,487
|
|
|
3.625% 6/17/31
|
7,380
|
5,803
|
|
|
4% 11/13/30
|
25,360
|
20,817
|
|
|
5.113% 5/3/29
|
6,160
|
5,578
|
|
|
7.35% 11/4/27
|
5,690
|
5,831
|
|
|
OneMain Finance Corp.:
|
|||
|
4% 9/15/30
|
3,340
|
2,492
|
|
|
5.375% 11/15/29
|
5,560
|
4,548
|
|
|
6.625% 1/15/28
|
4,415
|
4,065
|
|
|
6.875% 3/15/25
|
30,605
|
29,401
|
|
|
7.125% 3/15/26
|
41,215
|
39,191
|
|
|
201,047
|
|||
|
Diversified Financial Services - 0.6%
|
|||
|
Altus Midstream LP 5.875% 6/15/30 (d)
|
4,180
|
3,920
|
|
|
Compass Group Diversified Holdings LLC 5% 1/15/32 (d)
|
2,765
|
2,185
|
|
|
Icahn Enterprises LP/Icahn Enterprises Finance Corp.:
|
|||
|
4.375% 2/1/29
|
6,375
|
5,391
|
|
|
5.25% 5/15/27
|
23,175
|
21,234
|
|
|
6.25% 5/15/26
|
14,625
|
14,053
|
|
|
6.375% 12/15/25
|
18,820
|
18,252
|
|
|
James Hardie International Finance Ltd. 5% 1/15/28 (d)
|
5,270
|
4,835
|
|
|
OEC Finance Ltd.:
|
|||
|
4.375% 10/25/29 pay-in-kind(d)
|
4,302
|
99
|
|
|
5.25% 12/27/33 pay-in-kind(d)
|
2,180
|
49
|
|
|
Shift4 Payments LLC / Shift4 Payments Finance Sub, Inc. 4.625% 11/1/26 (d)
|
2,265
|
2,140
|
|
|
VMED O2 UK Financing I PLC 4.75% 7/15/31 (d)
|
9,930
|
8,067
|
|
|
80,225
|
|||
|
Insurance - 1.0%
|
|||
|
Acrisure LLC / Acrisure Finance, Inc.:
|
|||
|
6% 8/1/29(d)
|
4,230
|
3,457
|
|
|
7% 11/15/25(d)
|
20,290
|
18,643
|
|
|
10.125% 8/1/26(d)
|
6,810
|
6,623
|
|
|
Alliant Holdings Intermediate LLC:
|
|||
|
4.25% 10/15/27(d)
|
6,740
|
6,037
|
|
|
5.875% 11/1/29(d)
|
4,180
|
3,438
|
|
|
6.75% 10/15/27(d)
|
10,080
|
9,061
|
|
|
Allianz SE 4.252% 7/5/52 (Reg. S) (f)
|
EUR
|
17,200
|
16,897
|
|
AmWINS Group, Inc. 4.875% 6/30/29 (d)
|
4,105
|
3,482
|
|
|
ASR Nederland NV 7% 12/7/43 (Reg. S) (f)
|
EUR
|
15,040
|
16,104
|
|
AXA SA 4.25% 3/10/43 (Reg. S) (f)
|
EUR
|
14,867
|
14,492
|
|
Berkshire Hathaway Finance Corp. 2% 3/18/34
|
EUR
|
12,912
|
11,101
|
|
Hannover Reuck SE 5.875% 8/26/43 (Reg. S) (f)
|
EUR
|
7,100
|
7,761
|
|
HUB International Ltd.:
|
|||
|
5.625% 12/1/29(d)
|
6,030
|
5,266
|
|
|
7% 5/1/26(d)
|
6,980
|
6,833
|
|
|
MAPFRE SA 2.875% 4/13/30 (Reg. S)
|
EUR
|
1,700
|
1,499
|
|
Sampo Oyj 2.5% 9/3/52 (Reg. S) (f)
|
EUR
|
2,579
|
2,065
|
|
132,759
|
|||
|
Thrifts & Mortgage Finance - 0.0%
|
|||
|
MGIC Investment Corp. 5.25% 8/15/28
|
4,725
|
4,357
|
|
|
TOTAL FINANCIALS
|
523,634
|
||
|
HEALTH CARE - 2.2%
|
|||
|
Biotechnology - 0.0%
|
|||
|
Grifols Escrow Issuer SA 4.75% 10/15/28 (d)
|
2,795
|
2,413
|
|
|
Health Care Equipment & Supplies - 0.0%
|
|||
|
Avantor Funding, Inc. 3.875% 11/1/29 (d)
|
2,790
|
2,343
|
|
|
Hologic, Inc. 4.625% 2/1/28 (d)
|
2,505
|
2,360
|
|
|
4,703
|
|||
|
Health Care Providers & Services - 1.7%
|
|||
|
180 Medical, Inc. 3.875% 10/15/29 (d)
|
2,995
|
2,575
|
|
|
Cano Health, Inc. 6.25% 10/1/28 (d)
|
1,865
|
1,128
|
|
|
Centene Corp.:
|
|||
|
4.25% 12/15/27
|
6,820
|
6,396
|
|
|
4.625% 12/15/29
|
23,795
|
21,745
|
|
|
Community Health Systems, Inc.:
|
|||
|
4.75% 2/15/31(d)
|
11,430
|
8,298
|
|
|
5.25% 5/15/30(d)
|
8,305
|
6,262
|
|
|
5.625% 3/15/27(d)
|
4,015
|
3,443
|
|
|
6% 1/15/29(d)
|
4,940
|
4,132
|
|
|
6.125% 4/1/30(d)
|
10,425
|
5,162
|
|
|
8% 3/15/26(d)
|
37,390
|
34,040
|
|
|
DaVita HealthCare Partners, Inc.:
|
|||
|
3.75% 2/15/31(d)
|
2,075
|
1,549
|
|
|
4.625% 6/1/30(d)
|
15,850
|
12,750
|
|
|
HealthEquity, Inc. 4.5% 10/1/29 (d)
|
2,950
|
2,578
|
|
|
Horizon Pharma U.S.A., Inc. 5.5% 8/1/27 (d)
|
7,300
|
7,493
|
|
|
ModivCare Escrow Issuer, Inc. 5% 10/1/29 (d)
|
3,250
|
2,741
|
|
|
Molina Healthcare, Inc.:
|
|||
|
3.875% 11/15/30(d)
|
6,345
|
5,377
|
|
|
3.875% 5/15/32(d)
|
5,560
|
4,617
|
|
|
4.375% 6/15/28(d)
|
4,690
|
4,280
|
|
|
Option Care Health, Inc. 4.375% 10/31/29 (d)
|
3,060
|
2,677
|
|
|
Radiology Partners, Inc. 9.25% 2/1/28 (d)
|
9,515
|
5,341
|
|
|
RP Escrow Issuer LLC 5.25% 12/15/25 (d)
|
6,200
|
4,735
|
|
|
Tenet Healthcare Corp.:
|
|||
|
4.625% 7/15/24
|
1,500
|
1,463
|
|
|
4.625% 9/1/24(d)
|
7,305
|
7,095
|
|
|
4.875% 1/1/26(d)
|
18,260
|
17,267
|
|
|
5.125% 11/1/27(d)
|
10,955
|
10,191
|
|
|
6.125% 10/1/28(d)
|
6,535
|
5,851
|
|
|
6.125% 6/15/30(d)
|
11,235
|
10,705
|
|
|
6.25% 2/1/27(d)
|
20,050
|
19,258
|
|
|
219,149
|
|||
|
Health Care Technology - 0.1%
|
|||
|
IQVIA, Inc. 5% 5/15/27 (d)
|
5,660
|
5,396
|
|
|
Life Sciences Tools & Services - 0.1%
|
|||
|
Charles River Laboratories International, Inc.:
|
|||
|
3.75% 3/15/29(d)
|
5,245
|
4,639
|
|
|
4% 3/15/31(d)
|
6,035
|
5,220
|
|
|
4.25% 5/1/28(d)
|
2,045
|
1,883
|
|
|
Syneos Health, Inc. 3.625% 1/15/29 (d)
|
5,025
|
4,002
|
|
|
15,744
|
|||
|
Pharmaceuticals - 0.3%
|
|||
|
Bayer AG 5.375% 3/25/82 (Reg. S) (f)
|
EUR
|
8,400
|
7,868
|
|
Catalent Pharma Solutions:
|
|||
|
3.5% 4/1/30(d)
|
2,800
|
2,211
|
|
|
5% 7/15/27(d)
|
2,295
|
2,136
|
|
|
Organon & Co. / Organon Foreign Debt Co-Issuer BV:
|
|||
|
4.125% 4/30/28(d)
|
10,200
|
9,031
|
|
|
5.125% 4/30/31(d)
|
8,890
|
7,698
|
|
|
Teva Pharmaceutical Finance Netherlands III BV:
|
|||
|
4.75% 5/9/27
|
2,775
|
2,508
|
|
|
5.125% 5/9/29
|
2,775
|
2,471
|
|
|
33,923
|
|||
|
TOTAL HEALTH CARE
|
281,328
|
||
|
INDUSTRIALS - 3.8%
|
|||
|
Aerospace & Defense - 1.4%
|
|||
|
Bombardier, Inc.:
|
|||
|
6% 2/15/28(d)
|
2,815
|
2,603
|
|
|
7.125% 6/15/26(d)
|
5,695
|
5,525
|
|
|
7.5% 3/15/25(d)
|
5,202
|
5,152
|
|
|
7.875% 4/15/27(d)
|
13,015
|
12,624
|
|
|
BWX Technologies, Inc. 4.125% 6/30/28 (d)
|
6,400
|
5,752
|
|
|
Moog, Inc. 4.25% 12/15/27 (d)
|
2,025
|
1,873
|
|
|
Rolls-Royce PLC 5.75% 10/15/27 (d)
|
6,560
|
6,248
|
|
|
Spirit Aerosystems, Inc. 7.5% 4/15/25 (d)
|
9,205
|
9,096
|
|
|
TransDigm UK Holdings PLC 6.875% 5/15/26
|
21,085
|
20,590
|
|
|
TransDigm, Inc.:
|
|||
|
4.625% 1/15/29
|
9,290
|
8,168
|
|
|
5.5% 11/15/27
|
68,140
|
63,370
|
|
|
6.25% 3/15/26(d)
|
11,120
|
10,966
|
|
|
6.375% 6/15/26
|
20,230
|
19,683
|
|
|
7.5% 3/15/27
|
11,028
|
10,911
|
|
|
182,561
|
|||
|
Air Freight & Logistics - 0.0%
|
|||
|
Cargo Aircraft Management, Inc. 4.75% 2/1/28 (d)
|
3,960
|
3,564
|
|
|
Airlines - 0.4%
|
|||
|
Air Canada 3.875% 8/15/26 (d)
|
4,230
|
3,747
|
|
|
Allegiant Travel Co. 7.25% 8/15/27 (d)
|
4,365
|
4,152
|
|
|
Delta Air Lines, Inc. 7% 5/1/25 (d)
|
1,671
|
1,708
|
|
|
Mileage Plus Holdings LLC 6.5% 6/20/27 (d)
|
18,595
|
18,487
|
|
|
Spirit Loyalty Cayman Ltd. / Spirit IP Cayman Ltd.:
|
|||
|
8% 9/20/25(d)
|
1,420
|
1,427
|
|
|
8% 9/20/25(d)
|
4,670
|
4,686
|
|
|
United Airlines, Inc.:
|
|||
|
4.375% 4/15/26(d)
|
14,560
|
13,496
|
|
|
4.625% 4/15/29(d)
|
8,725
|
7,597
|
|
|
55,300
|
|||
|
Building Products - 0.1%
|
|||
|
Advanced Drain Systems, Inc.:
|
|||
|
5% 9/30/27(d)
|
1,400
|
1,306
|
|
|
6.375% 6/15/30(d)
|
2,780
|
2,701
|
|
|
CP Atlas Buyer, Inc. 7% 12/1/28 (d)
|
3,280
|
2,436
|
|
|
MIWD Holdco II LLC / MIWD Finance Corp. 5.5% 2/1/30 (d)
|
1,865
|
1,485
|
|
|
Oscar Acquisition Co. LLC / Oscar Finance, Inc. 9.5% 4/15/30 (d)
|
4,185
|
3,756
|
|
|
Shea Homes Ltd. Partnership/Corp. 4.75% 4/1/29
|
4,830
|
4,057
|
|
|
15,741
|
|||
|
Commercial Services & Supplies - 0.9%
|
|||
|
Allied Universal Holdco LLC / Allied Universal Finance Corp. 6% 6/1/29 (d)
|
3,995
|
2,899
|
|
|
Atlas Luxco 4 SARL / Allied Universal Holdco LLC / Allied Universal Finance Corp.:
|
|||
|
4.625% 6/1/28(d)
|
10,374
|
8,568
|
|
|
4.625% 6/1/28(d)
|
6,871
|
5,571
|
|
|
CoreCivic, Inc. 8.25% 4/15/26
|
14,975
|
15,357
|
|
|
Covanta Holding Corp.:
|
|||
|
4.875% 12/1/29(d)
|
4,300
|
3,523
|
|
|
5% 9/1/30
|
6,775
|
5,471
|
|
|
GFL Environmental, Inc.:
|
|||
|
4% 8/1/28(d)
|
4,200
|
3,591
|
|
|
4.75% 6/15/29(d)
|
5,705
|
4,993
|
|
|
IAA, Inc. 5.5% 6/15/27 (d)
|
2,830
|
2,761
|
|
|
KAR Auction Services, Inc. 5.125% 6/1/25 (d)
|
6,210
|
6,067
|
|
|
Madison IAQ LLC:
|
|||
|
4.125% 6/30/28(d)
|
5,345
|
4,470
|
|
|
5.875% 6/30/29(d)
|
4,265
|
2,923
|
|
|
Neptune BidCo U.S., Inc. 9.29% 4/15/29 (d)
|
14,145
|
13,332
|
|
|
Pitney Bowes, Inc. 7.25% 3/15/29 (d)
|
890
|
696
|
|
|
The Brink's Co. 4.625% 10/15/27 (d)
|
7,200
|
6,588
|
|
|
The GEO Group, Inc.:
|
|||
|
9.5% 12/31/28(d)
|
5,755
|
5,478
|
|
|
10.5% 6/30/28
|
16,764
|
16,928
|
|
|
109,216
|
|||
|
Construction & Engineering - 0.4%
|
|||
|
AECOM 5.125% 3/15/27
|
7,490
|
7,209
|
|
|
Arcosa, Inc. 4.375% 4/15/29 (d)
|
4,130
|
3,581
|
|
|
Bouygues SA 5.375% 6/30/42 (Reg. S)
|
EUR
|
14,100
|
15,520
|
|
Pike Corp. 5.5% 9/1/28 (d)
|
14,255
|
12,462
|
|
|
SRS Distribution, Inc.:
|
|||
|
4.625% 7/1/28(d)
|
5,520
|
4,893
|
|
|
6.125% 7/1/29(d)
|
2,315
|
1,872
|
|
|
45,537
|
|||
|
Electrical Equipment - 0.1%
|
|||
|
Sensata Technologies BV 4% 4/15/29 (d)
|
5,910
|
5,097
|
|
|
Industrial Conglomerates - 0.1%
|
|||
|
Honeywell International, Inc. 4.125% 11/2/34
|
EUR
|
12,154
|
12,843
|
|
Machinery - 0.1%
|
|||
|
ATS Automation Tooling System, Inc. 4.125% 12/15/28 (d)
|
4,630
|
3,995
|
|
|
Chart Industries, Inc. 7.5% 1/1/30 (d)
|
7,420
|
7,459
|
|
|
Stevens Holding Co., Inc. 6.125% 10/1/26 (d)
|
1,880
|
1,885
|
|
|
13,339
|
|||
|
Marine - 0.0%
|
|||
|
Seaspan Corp. 5.5% 8/1/29 (d)
|
4,240
|
3,213
|
|
|
Professional Services - 0.1%
|
|||
|
ASGN, Inc. 4.625% 5/15/28 (d)
|
5,670
|
5,132
|
|
|
Booz Allen Hamilton, Inc.:
|
|||
|
3.875% 9/1/28(d)
|
6,270
|
5,555
|
|
|
4% 7/1/29(d)
|
2,820
|
2,482
|
|
|
TriNet Group, Inc. 3.5% 3/1/29 (d)
|
4,545
|
3,737
|
|
|
16,906
|
|||
|
Road & Rail - 0.1%
|
|||
|
Hertz Corp.:
|
|||
|
4.625% 12/1/26(d)
|
2,350
|
1,968
|
|
|
5% 12/1/29(d)
|
4,560
|
3,459
|
|
|
5.5% 10/15/24(c)(d)(e)
|
6,540
|
147
|
|
|
6% 1/15/28(c)(d)(e)
|
5,785
|
340
|
|
|
6.25% 12/31/49(c)(e)
|
6,775
|
8
|
|
|
7.125% 8/1/26(c)(d)(e)
|
6,315
|
505
|
|
|
XPO, Inc. 6.25% 5/1/25 (d)
|
5,220
|
5,269
|
|
|
11,696
|
|||
|
Trading Companies & Distributors - 0.1%
|
|||
|
Foundation Building Materials, Inc. 6% 3/1/29 (d)
|
3,110
|
2,328
|
|
|
H&E Equipment Services, Inc. 3.875% 12/15/28 (d)
|
10,040
|
8,552
|
|
|
10,880
|
|||
|
Transportation Infrastructure - 0.0%
|
|||
|
First Student Bidco, Inc./First Transit Parent, Inc. 4% 7/31/29 (d)
|
4,235
|
3,503
|
|
|
TOTAL INDUSTRIALS
|
489,396
|
||
|
INFORMATION TECHNOLOGY - 1.2%
|
|||
|
Electronic Equipment & Components - 0.0%
|
|||
|
Coherent Corp. 5% 12/15/29 (d)
|
4,370
|
3,769
|
|
|
TTM Technologies, Inc. 4% 3/1/29 (d)
|
4,540
|
3,893
|
|
|
7,662
|
|||
|
IT Services - 0.3%
|
|||
|
Acuris Finance U.S. 5% 5/1/28 (d)
|
4,315
|
3,441
|
|
|
Block, Inc. 3.5% 6/1/31
|
5,745
|
4,584
|
|
|
CA Magnum Holdings 5.375% (d)(h)
|
2,230
|
2,018
|
|
|
Camelot Finance SA 4.5% 11/1/26 (d)
|
6,365
|
5,966
|
|
|
Gartner, Inc.:
|
|||
|
3.625% 6/15/29(d)
|
4,040
|
3,550
|
|
|
3.75% 10/1/30(d)
|
6,920
|
5,965
|
|
|
Go Daddy Operating Co. LLC / GD Finance Co., Inc.:
|
|||
|
3.5% 3/1/29(d)
|
6,060
|
5,073
|
|
|
5.25% 12/1/27(d)
|
5,665
|
5,362
|
|
|
Rackspace Hosting, Inc. 5.375% 12/1/28 (d)
|
3,845
|
1,676
|
|
|
Unisys Corp. 6.875% 11/1/27 (d)
|
3,685
|
2,828
|
|
|
40,463
|
|||
|
Semiconductors & Semiconductor Equipment - 0.1%
|
|||
|
onsemi 3.875% 9/1/28 (d)
|
6,765
|
5,903
|
|
|
Synaptics, Inc. 4% 6/15/29 (d)
|
3,500
|
2,949
|
|
|
8,852
|
|||
|
Software - 0.8%
|
|||
|
Black Knight InfoServ LLC 3.625% 9/1/28 (d)
|
6,975
|
6,051
|
|
|
Central Parent, Inc./Central Merger Sub, Inc. 7.25% 6/15/29 (d)
|
4,225
|
4,133
|
|
|
Clarivate Science Holdings Corp.:
|
|||
|
3.875% 7/1/28(d)
|
5,025
|
4,354
|
|
|
4.875% 7/1/29(d)
|
4,755
|
4,043
|
|
|
Elastic NV 4.125% 7/15/29 (d)
|
8,005
|
6,466
|
|
|
Fair Isaac Corp. 4% 6/15/28 (d)
|
6,420
|
5,826
|
|
|
Gen Digital, Inc. 5% 4/15/25 (d)
|
6,360
|
6,186
|
|
|
ION Trading Technologies Ltd. 5.75% 5/15/28 (d)
|
5,780
|
4,819
|
|
|
MicroStrategy, Inc. 6.125% 6/15/28 (d)
|
9,960
|
7,122
|
|
|
NCR Corp.:
|
|||
|
5% 10/1/28(d)
|
3,385
|
2,886
|
|
|
5.25% 10/1/30(d)
|
13,370
|
11,030
|
|
|
5.75% 9/1/27(d)
|
5,480
|
5,244
|
|
|
6.125% 9/1/29(d)
|
5,480
|
5,124
|
|
|
Open Text Corp.:
|
|||
|
3.875% 2/15/28(d)
|
3,220
|
2,763
|
|
|
3.875% 12/1/29(d)
|
3,045
|
2,449
|
|
|
6.9% 12/1/27(d)
|
5,000
|
5,000
|
|
|
Open Text Holdings, Inc.:
|
|||
|
4.125% 2/15/30(d)
|
3,220
|
2,583
|
|
|
4.125% 12/1/31(d)
|
2,490
|
1,935
|
|
|
PTC, Inc.:
|
|||
|
3.625% 2/15/25(d)
|
3,755
|
3,576
|
|
|
4% 2/15/28(d)
|
3,715
|
3,344
|
|
|
Veritas U.S., Inc./Veritas Bermuda Ltd. 7.5% 9/1/25 (d)
|
7,100
|
4,900
|
|
|
99,834
|
|||
|
TOTAL INFORMATION TECHNOLOGY
|
156,811
|
||
|
MATERIALS - 2.6%
|
|||
|
Chemicals - 0.9%
|
|||
|
BASF AG 3.75% 6/29/32 (Reg. S)
|
EUR
|
6,100
|
6,431
|
|
Gpd Companies, Inc. 10.125% 4/1/26 (d)
|
8,860
|
7,553
|
|
|
Ingevity Corp. 3.875% 11/1/28 (d)
|
6,715
|
5,774
|
|
|
Kronos Acquisition Holdings, Inc. / KIK Custom Products, Inc. 5% 12/31/26 (d)
|
2,100
|
1,817
|
|
|
Lanxess AG 1.75% 3/22/28 (Reg. S)
|
EUR
|
13,300
|
12,499
|
|
Linde PLC 1.625% 3/31/35 (Reg. S)
|
EUR
|
12,600
|
10,864
|
|
LSB Industries, Inc. 6.25% 10/15/28 (d)
|
9,723
|
8,896
|
|
|
Olympus Water U.S. Holding Corp.:
|
|||
|
4.25% 10/1/28(d)
|
5,600
|
4,546
|
|
|
7.125% 10/1/27(d)
|
2,905
|
2,767
|
|
|
SCIH Salt Holdings, Inc. 4.875% 5/1/28 (d)
|
3,770
|
3,235
|
|
|
SCIL IV LLC / SCIL U.S.A. Holdings LLC 5.375% 11/1/26 (d)
|
6,435
|
5,454
|
|
|
The Chemours Co. LLC:
|
|||
|
5.375% 5/15/27
|
18,470
|
17,056
|
|
|
5.75% 11/15/28(d)
|
10,075
|
9,050
|
|
|
The Scotts Miracle-Gro Co. 4% 4/1/31
|
5,930
|
4,530
|
|
|
Valvoline, Inc. 4.25% 2/15/30 (d)
|
4,680
|
4,540
|
|
|
W.R. Grace Holding LLC 5.625% 8/15/29 (d)
|
13,095
|
10,571
|
|
|
115,583
|
|||
|
Construction Materials - 0.0%
|
|||
|
Summit Materials LLC/Summit Materials Finance Corp. 5.25% 1/15/29 (d)
|
6,525
|
6,075
|
|
|
Containers & Packaging - 0.6%
|
|||
|
Ardagh Metal Packaging Finance U.S.A. LLC/Ardagh Metal Packaging Finance PLC:
|
|||
|
3.25% 9/1/28(d)
|
3,025
|
2,571
|
|
|
4% 9/1/29(d)
|
6,050
|
4,795
|
|
|
6% 6/15/27(d)
|
2,785
|
2,727
|
|
|
Cascades, Inc.:
|
|||
|
5.125% 1/15/26(d)
|
3,310
|
3,011
|
|
|
5.375% 1/15/28(d)
|
3,310
|
2,898
|
|
|
Clydesdale Acquisition Holdings, Inc.:
|
|||
|
6.625% 4/15/29(d)
|
3,315
|
3,152
|
|
|
8.75% 4/15/30(d)
|
19,065
|
16,319
|
|
|
Crown Cork & Seal, Inc.:
|
|||
|
7.375% 12/15/26
|
16,535
|
17,023
|
|
|
7.5% 12/15/96
|
7,695
|
7,787
|
|
|
Graham Packaging Co., Inc. 7.125% 8/15/28 (d)
|
3,720
|
3,104
|
|
|
Graphic Packaging International, Inc. 3.75% 2/1/30 (d)
|
3,585
|
3,050
|
|
|
Intelligent Packaging Ltd. Finco, Inc. 6% 9/15/28 (d)
|
2,570
|
2,071
|
|
|
Trivium Packaging Finance BV 5.5% 8/15/26 (d)
|
4,195
|
3,845
|
|
|
72,353
|
|||
|
Metals & Mining - 1.0%
|
|||
|
Alcoa Nederland Holding BV:
|
|||
|
4.125% 3/31/29(d)
|
7,735
|
6,862
|
|
|
6.125% 5/15/28(d)
|
2,110
|
2,079
|
|
|
Algoma Steel SCA 0% 12/31/23 (c)
|
1,518
|
0
|
|
|
Arconic Corp.:
|
|||
|
6% 5/15/25(d)
|
4,090
|
4,021
|
|
|
6.125% 2/15/28(d)
|
9,123
|
8,560
|
|
|
ATI, Inc.:
|
|||
|
4.875% 10/1/29
|
2,795
|
2,470
|
|
|
5.125% 10/1/31
|
2,480
|
2,184
|
|
|
Cleveland-Cliffs, Inc.:
|
|||
|
4.625% 3/1/29(d)
|
4,615
|
4,096
|
|
|
4.875% 3/1/31(d)
|
4,615
|
4,075
|
|
|
5.875% 6/1/27
|
11,010
|
10,518
|
|
|
Compass Minerals International, Inc. 6.75% 12/1/27 (d)
|
9,315
|
8,942
|
|
|
Eldorado Gold Corp. 6.25% 9/1/29 (d)
|
4,225
|
3,709
|
|
|
ERO Copper Corp. 6.5% 2/15/30 (d)
|
4,180
|
3,368
|
|
|
First Quantum Minerals Ltd.:
|
|||
|
6.5% 3/1/24(d)
|
6,560
|
6,431
|
|
|
6.875% 3/1/26(d)
|
14,330
|
13,549
|
|
|
7.5% 4/1/25(d)
|
12,105
|
11,778
|
|
|
FMG Resources Pty Ltd.:
|
|||
|
4.375% 4/1/31(d)
|
4,420
|
3,676
|
|
|
4.5% 9/15/27(d)
|
5,450
|
5,028
|
|
|
HudBay Minerals, Inc. 4.5% 4/1/26 (d)
|
3,600
|
3,270
|
|
|
Infrabuild Australia Pty Ltd. 12% 10/1/24 (d)
|
6,320
|
6,130
|
|
|
Kaiser Aluminum Corp. 4.625% 3/1/28 (d)
|
6,615
|
5,772
|
|
|
Mineral Resources Ltd.:
|
|||
|
8% 11/1/27(d)
|
2,785
|
2,848
|
|
|
8.125% 5/1/27(d)
|
11,025
|
11,101
|
|
|
8.5% 5/1/30(d)
|
2,065
|
2,093
|
|
|
Murray Energy Corp.:
|
|||
|
11.25% 12/31/49(c)(d)(e)
|
5,925
|
0
|
|
|
12% 4/15/24 pay-in-kind(c)(d)(e)(f)
|
6,364
|
0
|
|
|
Roller Bearing Co. of America, Inc. 4.375% 10/15/29 (d)
|
2,015
|
1,742
|
|
|
134,302
|
|||
|
Paper & Forest Products - 0.1%
|
|||
|
Glatfelter Corp. 4.75% 11/15/29 (d)
|
4,190
|
2,519
|
|
|
LABL, Inc. 5.875% 11/1/28 (d)
|
6,750
|
5,881
|
|
|
8,400
|
|||
|
TOTAL MATERIALS
|
336,713
|
||
|
REAL ESTATE - 1.4%
|
|||
|
Equity Real Estate Investment Trusts (REITs) - 1.0%
|
|||
|
Iron Mountain Information Management Services, Inc. 5% 7/15/32 (d)
|
4,190
|
3,481
|
|
|
Iron Mountain, Inc.:
|
|||
|
4.875% 9/15/29(d)
|
14,590
|
12,725
|
|
|
5% 7/15/28(d)
|
6,370
|
5,721
|
|
|
5.25% 7/15/30(d)
|
5,915
|
5,140
|
|
|
5.625% 7/15/32(d)
|
5,915
|
5,126
|
|
|
MPT Operating Partnership LP/MPT Finance Corp.:
|
|||
|
3.5% 3/15/31
|
6,700
|
4,593
|
|
|
4.625% 8/1/29
|
10,950
|
8,350
|
|
|
5% 10/15/27
|
21,010
|
17,660
|
|
|
SBA Communications Corp. 3.875% 2/15/27
|
9,720
|
8,782
|
|
|
Uniti Group LP / Uniti Group Finance, Inc.:
|
|||
|
4.75% 4/15/28(d)
|
9,350
|
7,480
|
|
|
6.5% 2/15/29(d)
|
19,535
|
12,942
|
|
|
Uniti Group, Inc.:
|
|||
|
6% 1/15/30(d)
|
6,990
|
4,423
|
|
|
7.875% 2/15/25(d)
|
9,940
|
9,621
|
|
|
VICI Properties LP / VICI Note Co.:
|
|||
|
3.875% 2/15/29(d)
|
6,695
|
5,868
|
|
|
4.25% 12/1/26(d)
|
12,650
|
11,801
|
|
|
4.625% 12/1/29(d)
|
7,220
|
6,570
|
|
|
130,283
|
|||
|
Real Estate Management & Development - 0.4%
|
|||
|
DTZ U.S. Borrower LLC 6.75% 5/15/28 (d)
|
6,575
|
6,275
|
|
|
Realogy Group LLC/Realogy Co-Issuer Corp. 5.75% 1/15/29 (d)
|
8,505
|
6,421
|
|
|
Realogy Group LLC/Realogy Co.-Issuer Corp. 5.25% 4/15/30 (d)
|
5,555
|
4,052
|
|
|
Segro Capital SARL 1.875% 3/23/30 (Reg. S)
|
EUR
|
12,186
|
11,071
|
|
Taylor Morrison Communities, Inc./Monarch Communities, Inc.:
|
|||
|
5.125% 8/1/30(d)
|
6,480
|
5,613
|
|
|
5.875% 6/15/27(d)
|
5,610
|
5,386
|
|
|
Weekley Homes LLC/Weekley Finance Corp. 4.875% 9/15/28 (d)
|
3,045
|
2,559
|
|
|
41,377
|
|||
|
TOTAL REAL ESTATE
|
171,660
|
||
|
UTILITIES - 2.0%
|
|||
|
Electric Utilities - 1.5%
|
|||
|
Clearway Energy Operating LLC:
|
|||
|
3.75% 1/15/32(d)
|
2,795
|
2,247
|
|
|
4.75% 3/15/28(d)
|
4,055
|
3,743
|
|
|
EnBW International Finance BV 4.049% 11/22/29 (Reg. S)
|
EUR
|
5,657
|
6,027
|
|
NRG Energy, Inc.:
|
|||
|
3.375% 2/15/29(d)
|
3,080
|
2,484
|
|
|
3.625% 2/15/31(d)
|
6,110
|
4,645
|
|
|
3.875% 2/15/32(d)
|
6,475
|
4,863
|
|
|
5.75% 1/15/28
|
19,350
|
18,163
|
|
|
ORSTED A/S 2.875% 6/14/33 (Reg. S)
|
EUR
|
9,718
|
9,509
|
|
Pacific Gas & Electric Co.:
|
|||
|
3.75% 8/15/42
|
6,290
|
4,217
|
|
|
3.95% 12/1/47
|
13,510
|
9,160
|
|
|
4% 12/1/46
|
14,690
|
9,835
|
|
|
4.25% 3/15/46
|
1,475
|
1,026
|
|
|
4.3% 3/15/45
|
3,690
|
2,616
|
|
|
4.55% 7/1/30
|
36,325
|
32,925
|
|
|
PG&E Corp.:
|
|||
|
5% 7/1/28
|
13,615
|
12,428
|
|
|
5.25% 7/1/30
|
5,150
|
4,687
|
|
|
TenneT Holding BV:
|
|||
|
2.375% 5/17/33 (Reg. S)
|
EUR
|
6,136
|
5,665
|
|
2.75% 5/17/42 (Reg. S)
|
EUR
|
11,199
|
9,735
|
|
Vistra Operations Co. LLC:
|
|||
|
4.375% 5/1/29(d)
|
11,110
|
9,585
|
|
|
5% 7/31/27(d)
|
13,800
|
12,808
|
|
|
5.5% 9/1/26(d)
|
9,975
|
9,610
|
|
|
5.625% 2/15/27(d)
|
17,455
|
16,559
|
|
|
192,537
|
|||
|
Gas Utilities - 0.2%
|
|||
|
Southern Natural Gas Co. LLC:
|
|||
|
7.35% 2/15/31
|
14,890
|
15,607
|
|
|
8% 3/1/32
|
9,400
|
10,311
|
|
|
Suburban Propane Partners LP/Suburban Energy Finance Corp. 5% 6/1/31 (d)
|
5,750
|
4,887
|
|
|
30,805
|
|||
|
Independent Power and Renewable Electricity Producers - 0.1%
|
|||
|
Atlantica Sustainable Infrastructure PLC 4.125% 6/15/28 (d)
|
3,735
|
3,311
|
|
|
RWE AG:
|
|||
|
1% 11/26/33 (Reg. S)
|
EUR
|
6,400
|
4,898
|
|
2.75% 5/24/30 (Reg. S)
|
EUR
|
5,550
|
5,410
|
|
13,619
|
|||
|
Water Utilities - 0.2%
|
|||
|
Suez SACA 2.375% 5/24/30 (Reg. S)
|
EUR
|
7,400
|
6,937
|
|
Thames Water Utility Finance PLC 1.25% 1/31/32 (Reg. S)
|
EUR
|
14,395
|
11,989
|
|
18,926
|
|||
|
TOTAL UTILITIES
|
255,887
|
||
|
TOTAL NONCONVERTIBLE BONDS
|
4,170,136
|
||
|
TOTAL CORPORATE BONDS
(Cost $4,648,983)
|
4,199,663
|
||
|
U.S. Government and Government Agency Obligations - 27.1%
|
|||
|
Principal
Amount (a)
(000s)
|
Value ($)
(000s)
|
||
|
U.S. Government Agency Obligations - 0.2%
|
|||
|
Fannie Mae 0.625% 4/22/25
|
2,128
|
1,955
|
|
|
Freddie Mac 4% 11/25/24
|
21,100
|
20,788
|
|
|
Tennessee Valley Authority:
|
|||
|
5.25% 9/15/39
|
2,106
|
2,191
|
|
|
5.375% 4/1/56
|
3,503
|
3,708
|
|
|
TOTAL U.S. GOVERNMENT AGENCY OBLIGATIONS
|
28,642
|
||
|
U.S. Treasury Obligations - 26.8%
|
|||
|
U.S. Treasury Bills, yield at date of purchase 3.33% to 4.17% 1/5/23 to 2/16/23 (j)
|
20,270
|
20,233
|
|
|
U.S. Treasury Bonds:
|
|||
|
2% 11/15/41 (j)
|
55,859
|
39,885
|
|
|
2% 8/15/51
|
148,344
|
97,131
|
|
|
2.25% 2/15/52
|
115,400
|
80,248
|
|
|
2.5% 2/15/45 (j)
|
216,056
|
162,658
|
|
|
3% 5/15/45
|
20,100
|
16,559
|
|
|
3% 2/15/49
|
128,820
|
106,619
|
|
|
3.25% 5/15/42
|
20,500
|
17,973
|
|
|
3.375% 8/15/42
|
4,900
|
4,379
|
|
|
4% 11/15/42 (k)
|
62,650
|
61,338
|
|
|
4.75% 2/15/37 (j)
|
74,200
|
81,058
|
|
|
5.25% 2/15/29
|
5,406
|
5,739
|
|
|
6.125% 8/15/29
|
3,663
|
4,094
|
|
|
U.S. Treasury Notes:
|
|||
|
0.125% 3/31/23
|
30,000
|
29,693
|
|
|
0.125% 5/31/23
|
38,200
|
37,518
|
|
|
0.125% 6/30/23
|
34,600
|
33,832
|
|
|
0.125% 8/15/23
|
2,411
|
2,344
|
|
|
0.125% 10/15/23
|
2,852
|
2,751
|
|
|
0.25% 5/15/24
|
470
|
442
|
|
|
0.25% 7/31/25
|
35,866
|
32,365
|
|
|
0.25% 9/30/25
|
26,037
|
23,378
|
|
|
0.25% 10/31/25
|
17,600
|
15,738
|
|
|
0.375% 10/31/23
|
20,700
|
19,962
|
|
|
0.375% 4/30/25
|
82,771
|
75,541
|
|
|
0.375% 12/31/25
|
167,057
|
149,301
|
|
|
0.375% 1/31/26
|
13,900
|
12,367
|
|
|
0.5% 11/30/23
|
115,900
|
111,508
|
|
|
0.625% 7/31/26
|
24,000
|
21,207
|
|
|
0.75% 3/31/26
|
46,052
|
41,276
|
|
|
0.75% 8/31/26
|
29,200
|
25,855
|
|
|
0.875% 9/30/26
|
143,800
|
127,684
|
|
|
1% 7/31/28
|
49,141
|
41,772
|
|
|
1.125% 10/31/26
|
17,300
|
15,473
|
|
|
1.125% 8/31/28 (j)
|
465,629
|
397,562
|
|
|
1.25% 12/31/26
|
52,353
|
46,883
|
|
|
1.25% 9/30/28
|
38,280
|
32,876
|
|
|
1.375% 8/31/23
|
11,000
|
10,754
|
|
|
1.375% 10/31/28
|
8,911
|
7,692
|
|
|
1.5% 2/29/24
|
286,900
|
276,545
|
|
|
1.5% 10/31/24
|
480
|
455
|
|
|
1.5% 1/31/27
|
40,989
|
37,007
|
|
|
1.5% 11/30/28
|
6,930
|
6,018
|
|
|
1.625% 5/31/23
|
19,717
|
19,485
|
|
|
1.625% 9/30/26
|
3,093
|
2,830
|
|
|
1.75% 1/31/29
|
41,434
|
36,394
|
|
|
1.875% 2/28/27
|
280,000
|
256,441
|
|
|
2.125% 7/31/24
|
96,008
|
92,344
|
|
|
2.125% 5/15/25
|
12,033
|
11,435
|
|
|
2.25% 4/30/24
|
78,844
|
76,343
|
|
|
2.25% 3/31/26
|
34,717
|
32,717
|
|
|
2.375% 3/31/29
|
7,500
|
6,820
|
|
|
2.5% 2/28/26
|
38,997
|
37,040
|
|
|
2.5% 3/31/27
|
7,200
|
6,756
|
|
|
2.625% 5/31/27
|
90
|
85
|
|
|
2.625% 7/31/29
|
25,965
|
23,909
|
|
|
2.75% 2/15/24
|
203,714
|
199,306
|
|
|
2.75% 6/30/25
|
197
|
190
|
|
|
2.75% 7/31/27
|
18,600
|
17,598
|
|
|
2.75% 5/31/29
|
18,541
|
17,226
|
|
|
2.75% 8/15/32
|
117,622
|
107,110
|
|
|
2.875% 5/15/32
|
36,400
|
33,545
|
|
|
3.125% 11/15/28
|
31,330
|
29,882
|
|
|
3.875% 11/30/27 (k)
|
14,110
|
14,033
|
|
|
3.875% 12/31/27
|
15,500
|
15,407
|
|
|
3.875% 11/30/29
|
26,570
|
26,391
|
|
|
4% 10/31/29
|
26,100
|
26,108
|
|
|
4.125% 10/31/27
|
8,800
|
8,832
|
|
|
TOTAL U.S. TREASURY OBLIGATIONS
|
3,431,940
|
||
|
Other Government Related - 0.1%
|
|||
|
Private Export Funding Corp. Secured 1.75% 11/15/24
|
11,520
|
10,842
|
|
|
TOTAL U.S. GOVERNMENT AND GOVERNMENT AGENCY OBLIGATIONS
(Cost $3,896,300)
|
3,471,424
|
||
|
U.S. Government Agency - Mortgage Securities - 2.9%
|
|||
|
Principal
Amount (a)
(000s)
|
Value ($)
(000s)
|
||
|
Fannie Mae - 0.8%
|
|||
|
1.5% 11/1/40 to 11/1/41
|
41,464
|
33,773
|
|
|
2.5% 11/1/36 to 2/1/52
|
24,567
|
21,319
|
|
|
3% 11/1/34 to 2/1/52
|
12,413
|
11,496
|
|
|
3.5% 1/1/51 to 3/1/52
|
14,879
|
13,576
|
|
|
4% 9/1/52
|
2,178
|
2,055
|
|
|
4.5% 9/1/52
|
2,178
|
2,101
|
|
|
5% 5/1/52 to 12/1/52
|
16,431
|
16,452
|
|
|
TOTAL FANNIE MAE
|
100,772
|
||
|
Freddie Mac - 0.9%
|
|||
|
1.5% 12/1/40 to 4/1/41
|
11,501
|
9,405
|
|
|
2.5% 5/1/41 to 1/1/52
|
20,608
|
17,985
|
|
|
3% 9/1/34
|
3,888
|
3,677
|
|
|
3.5% 5/1/51 to 3/1/52
|
48,576
|
44,517
|
|
|
4.5% 1/1/53
|
19,372
|
18,679
|
|
|
5% 5/1/52 to 12/1/52
|
15,918
|
15,892
|
|
|
TOTAL FREDDIE MAC
|
110,155
|
||
|
Ginnie Mae - 0.7%
|
|||
|
2% 1/1/53 (l)
|
14,100
|
11,829
|
|
|
2% 1/1/53 (l)
|
4,700
|
3,943
|
|
|
2% 1/1/53 (l)
|
4,650
|
3,901
|
|
|
2% 1/1/53 (l)
|
950
|
797
|
|
|
2% 1/1/53 (l)
|
6,300
|
5,286
|
|
|
2% 1/1/53 (l)
|
4,600
|
3,859
|
|
|
2% 1/1/53 (l)
|
3,900
|
3,272
|
|
|
2% 1/1/53 (l)
|
1,850
|
1,552
|
|
|
2% 1/1/53 (l)
|
10,250
|
8,599
|
|
|
2% 1/1/53 (l)
|
16,300
|
13,675
|
|
|
2% 2/1/53 (l)
|
13,050
|
10,960
|
|
|
2% 2/1/53 (l)
|
16,300
|
13,690
|
|
|
2% 3/1/53 (l)
|
3,250
|
2,732
|
|
|
3.5% 1/1/53 (l)
|
2,000
|
1,838
|
|
|
3.5% 1/1/53 (l)
|
1,500
|
1,378
|
|
|
3.5% 2/1/53 (l)
|
1,850
|
1,701
|
|
|
TOTAL GINNIE MAE
|
89,012
|
||
|
Uniform Mortgage Backed Securities - 0.5%
|
|||
|
2.5% 1/1/53 (l)
|
5,200
|
4,409
|
|
|
2.5% 1/1/53 (l)
|
1,250
|
1,060
|
|
|
2.5% 1/1/53 (l)
|
1,750
|
1,484
|
|
|
2.5% 2/1/53 (l)
|
1,750
|
1,485
|
|
|
2.5% 2/1/53 (l)
|
1,250
|
1,061
|
|
|
2.5% 2/1/53 (l)
|
1,200
|
1,018
|
|
|
3.5% 1/1/53 (l)
|
1,750
|
1,592
|
|
|
3.5% 1/1/53 (l)
|
13,300
|
12,096
|
|
|
3.5% 1/1/53 (l)
|
13,300
|
12,096
|
|
|
3.5% 2/1/53 (l)
|
13,300
|
12,102
|
|
|
4% 1/1/53 (l)
|
2,800
|
2,628
|
|
|
4.5% 1/1/53 (l)
|
17,450
|
16,820
|
|
|
5% 1/1/53 (l)
|
2,300
|
2,268
|
|
|
TOTAL UNIFORM MORTGAGE BACKED SECURITIES
|
70,119
|
||
|
TOTAL U.S. GOVERNMENT AGENCY - MORTGAGE SECURITIES
(Cost $391,279)
|
370,058
|
||
|
Commercial Mortgage Securities - 0.1%
|
|||
|
Principal
Amount (a)
(000s)
|
Value ($)
(000s)
|
||
|
Freddie Mac:
|
|||
|
sequential payer:
|
|||
|
Series 2021-K136 Class A2, 2.127% 11/25/31
|
5,000
|
4,149
|
|
|
Series 2022-K142 Class A2, 2.4% 3/25/32
|
7,700
|
6,509
|
|
|
Series 2022-K150 Class A2, 3.71% 11/25/32
|
2,600
|
2,445
|
|
|
TOTAL COMMERCIAL MORTGAGE SECURITIES
(Cost $14,053)
|
13,103
|
||
|
Foreign Government and Government Agency Obligations - 3.1%
|
|||
|
Principal
Amount (a)
(000s)
|
Value ($)
(000s)
|
||
|
Australian Commonwealth:
|
|||
|
1.75% 11/21/32 (Reg. S)
|
AUD
|
15,000
|
8,313
|
|
1.75% 6/21/51 (Reg. S)
|
AUD
|
60,510
|
23,875
|
|
Canadian Government:
|
|||
|
0.25% 2/1/23
|
CAD
|
52,420
|
38,586
|
|
0.75% 2/1/24
|
CAD
|
26,500
|
18,827
|
|
1.25% 3/1/27
|
CAD
|
30,000
|
20,261
|
|
German Federal Republic:
|
|||
|
0% 3/10/23 (Reg. S)
|
EUR
|
24,555
|
26,210
|
|
0% 12/15/23 (Reg. S)
|
EUR
|
30,905
|
32,368
|
|
1.7% 8/15/32 (Reg. S)
|
EUR
|
37,094
|
37,015
|
|
Israeli State (guaranteed by U.S. Government through Agency for International Development):
|
|||
|
5.5% 9/18/23
|
54,954
|
55,195
|
|
|
5.5% 12/4/23
|
19,812
|
19,922
|
|
|
Japan Government 0.4% 3/20/56
|
JPY
|
2,254,000
|
11,828
|
|
United Kingdom, Great Britain and Northern Ireland:
|
|||
|
0.375% 10/22/26 (Reg. S)
|
GBP
|
86,985
|
93,040
|
|
3.75% 7/22/52
|
GBP
|
7,700
|
8,966
|
|
TOTAL FOREIGN GOVERNMENT AND GOVERNMENT AGENCY OBLIGATIONS
(Cost $435,300)
|
394,406
|
||
|
Common Stocks - 2.8%
|
|||
|
Shares
|
Value ($)
(000s)
|
||
|
COMMUNICATION SERVICES - 0.1%
|
|||
|
Entertainment - 0.0%
|
|||
|
New Cotai LLC/New Cotai Capital Corp. (b)(c)(m)
|
2,242,893
|
1,211
|
|
|
Interactive Media & Services - 0.1%
|
|||
|
Alphabet, Inc. Class A (m)
|
56,700
|
5,003
|
|
|
Meta Platforms, Inc. Class A (m)
|
29,000
|
3,490
|
|
|
8,493
|
|||
|
Media - 0.0%
|
|||
|
iHeartMedia, Inc. (m)
|
26
|
0
|
|
|
Nexstar Broadcasting Group, Inc. Class A
|
33,727
|
5,903
|
|
|
5,903
|
|||
|
TOTAL COMMUNICATION SERVICES
|
15,607
|
||
|
CONSUMER DISCRETIONARY - 0.4%
|
|||
|
Auto Components - 0.0%
|
|||
|
Exide Technologies (c)(m)
|
7,093
|
7
|
|
|
Exide Technologies (c)(m)
|
418,807
|
0
|
|
|
Exide Technologies (c)(m)
|
280
|
182
|
|
|
UC Holdings, Inc. (c)(m)
|
560,355
|
3,609
|
|
|
3,798
|
|||
|
Hotels, Restaurants & Leisure - 0.2%
|
|||
|
Boyd Gaming Corp.
|
123,800
|
6,751
|
|
|
Caesars Entertainment, Inc. (m)
|
290,400
|
12,081
|
|
|
Studio City International Holdings Ltd.:
|
|||
|
ADR (d)
|
121,177
|
722
|
|
|
(NYSE) ADR (m)
|
133,400
|
795
|
|
|
20,349
|
|||
|
Household Durables - 0.1%
|
|||
|
Tempur Sealy International, Inc.
|
296,848
|
10,191
|
|
|
Specialty Retail - 0.1%
|
|||
|
Dick's Sporting Goods, Inc.
|
52,100
|
6,267
|
|
|
Lowe's Companies, Inc.
|
40,300
|
8,029
|
|
|
Williams-Sonoma, Inc.
|
24,000
|
2,758
|
|
|
17,054
|
|||
|
Textiles, Apparel & Luxury Goods - 0.0%
|
|||
|
Tapestry, Inc.
|
91,100
|
3,469
|
|
|
TOTAL CONSUMER DISCRETIONARY
|
54,861
|
||
|
CONSUMER STAPLES - 0.2%
|
|||
|
Food & Staples Retailing - 0.1%
|
|||
|
Southeastern Grocers, Inc. (b)(c)(m)
|
584,047
|
13,567
|
|
|
Food Products - 0.1%
|
|||
|
Darling Ingredients, Inc. (m)
|
49,300
|
3,086
|
|
|
JBS SA
|
1,108,000
|
4,615
|
|
|
Reddy Ice Holdings, Inc. (c)(m)
|
133,255
|
7
|
|
|
7,708
|
|||
|
TOTAL CONSUMER STAPLES
|
21,275
|
||
|
ENERGY - 0.7%
|
|||
|
Energy Equipment & Services - 0.1%
|
|||
|
Diamond Offshore Drilling, Inc. (k)(m)
|
66,694
|
694
|
|
|
Forbes Energy Services Ltd. (c)(m)
|
135,187
|
0
|
|
|
Halliburton Co.
|
4,034
|
159
|
|
|
Jonah Energy Parent LLC (c)(m)
|
183,159
|
10,317
|
|
|
Superior Energy Services, Inc. Class A (c)(m)
|
66,115
|
4,871
|
|
|
16,041
|
|||
|
Oil, Gas & Consumable Fuels - 0.6%
|
|||
|
Antero Resources Corp. (m)
|
127,900
|
3,964
|
|
|
California Resources Corp.
|
625,506
|
27,216
|
|
|
California Resources Corp. warrants 10/27/24 (m)
|
34,633
|
436
|
|
|
Chaparral Energy, Inc.:
|
|||
|
Series A warrants 10/1/24 (c)(m)
|
289
|
0
|
|
|
Series B warrants 10/1/25 (c)(m)
|
289
|
0
|
|
|
Cheniere Energy, Inc.
|
58,100
|
8,713
|
|
|
Chesapeake Energy Corp.
|
110,303
|
10,409
|
|
|
Chesapeake Energy Corp. (b)(m)
|
15,902
|
1,501
|
|
|
Civitas Resources, Inc.
|
36,312
|
2,104
|
|
|
Diamondback Energy, Inc.
|
22,492
|
3,076
|
|
|
EP Energy Corp. (c)(m)
|
611,545
|
4,061
|
|
|
Mesquite Energy, Inc. (c)(m)
|
185,122
|
11,030
|
|
|
Unit Corp.
|
28,630
|
1,657
|
|
|
74,167
|
|||
|
TOTAL ENERGY
|
90,208
|
||
|
FINANCIALS - 0.1%
|
|||
|
Capital Markets - 0.0%
|
|||
|
Penson Worldwide, Inc. Class A (c)(m)
|
7,403,098
|
0
|
|
|
Consumer Finance - 0.1%
|
|||
|
OneMain Holdings, Inc.
|
302,400
|
10,073
|
|
|
TOTAL FINANCIALS
|
10,073
|
||
|
HEALTH CARE - 0.2%
|
|||
|
Health Care Providers & Services - 0.1%
|
|||
|
Humana, Inc.
|
6,100
|
3,124
|
|
|
Tenet Healthcare Corp. (m)
|
36,700
|
1,791
|
|
|
UnitedHealth Group, Inc.
|
10,400
|
5,514
|
|
|
10,429
|
|||
|
Life Sciences Tools & Services - 0.1%
|
|||
|
Charles River Laboratories International, Inc. (m)
|
22,300
|
4,859
|
|
|
IQVIA Holdings, Inc. (m)
|
47,000
|
9,630
|
|
|
14,489
|
|||
|
TOTAL HEALTH CARE
|
24,918
|
||
|
INDUSTRIALS - 0.1%
|
|||
|
Building Products - 0.0%
|
|||
|
Builders FirstSource, Inc. (m)
|
55,600
|
3,607
|
|
|
Electrical Equipment - 0.0%
|
|||
|
Regal Rexnord Corp.
|
22,600
|
2,712
|
|
|
Professional Services - 0.1%
|
|||
|
ASGN, Inc. (m)
|
88,300
|
7,195
|
|
|
Trading Companies & Distributors - 0.0%
|
|||
|
Penhall Acquisition Co.:
|
|||
|
Class A (c)(m)
|
11,553
|
1,381
|
|
|
Class B (c)(m)
|
3,850
|
460
|
|
|
1,841
|
|||
|
Transportation Infrastructure - 0.0%
|
|||
|
Tricer Holdco SCA:
|
|||
|
Class A1 (b)(c)(m)
|
403,760
|
0
|
|
|
Class A2 (b)(c)(m)
|
403,760
|
0
|
|
|
Class A3 (b)(c)(m)
|
403,760
|
0
|
|
|
Class A4 (b)(c)(m)
|
403,760
|
0
|
|
|
Class A5 (b)(c)(m)
|
403,760
|
0
|
|
|
Class A6 (b)(c)(m)
|
403,760
|
0
|
|
|
Class A7 (b)(c)(m)
|
403,760
|
0
|
|
|
Class A8 (b)(c)(m)
|
403,760
|
0
|
|
|
Class A9 (b)(c)(m)
|
403,760
|
0
|
|
|
0
|
|||
|
TOTAL INDUSTRIALS
|
15,355
|
||
|
INFORMATION TECHNOLOGY - 0.6%
|
|||
|
Electronic Equipment & Components - 0.0%
|
|||
|
CDW Corp.
|
40,300
|
7,197
|
|
|
IT Services - 0.2%
|
|||
|
Fiserv, Inc. (m)
|
66,600
|
6,731
|
|
|
Global Payments, Inc.
|
61,700
|
6,128
|
|
|
GTT Communications, Inc. rights (c)(m)
|
285,630
|
286
|
|
|
MasterCard, Inc. Class A
|
12,100
|
4,208
|
|
|
SS&C Technologies Holdings, Inc.
|
54,139
|
2,818
|
|
|
Visa, Inc. Class A
|
26,900
|
5,589
|
|
|
25,760
|
|||
|
Semiconductors & Semiconductor Equipment - 0.3%
|
|||
|
Advanced Micro Devices, Inc. (m)
|
35,900
|
2,325
|
|
|
ASML Holding NV
|
4,400
|
2,404
|
|
|
Lam Research Corp.
|
7,200
|
3,026
|
|
|
Marvell Technology, Inc.
|
155,200
|
5,749
|
|
|
Microchip Technology, Inc.
|
127,400
|
8,950
|
|
|
NVIDIA Corp.
|
19,000
|
2,777
|
|
|
NXP Semiconductors NV
|
18,600
|
2,939
|
|
|
onsemi (m)
|
169,691
|
10,584
|
|
|
38,754
|
|||
|
Software - 0.1%
|
|||
|
Adobe, Inc. (m)
|
14,064
|
4,733
|
|
|
Microsoft Corp.
|
15,200
|
3,645
|
|
|
Palo Alto Networks, Inc. (m)
|
18,800
|
2,623
|
|
|
11,001
|
|||
|
TOTAL INFORMATION TECHNOLOGY
|
82,712
|
||
|
MATERIALS - 0.3%
|
|||
|
Chemicals - 0.1%
|
|||
|
CF Industries Holdings, Inc.
|
64,100
|
5,461
|
|
|
The Chemours Co. LLC
|
214,479
|
6,567
|
|
|
12,028
|
|||
|
Containers & Packaging - 0.1%
|
|||
|
Berry Global Group, Inc.
|
87,939
|
5,314
|
|
|
Graphic Packaging Holding Co.
|
332,500
|
7,398
|
|
|
WestRock Co.
|
111,900
|
3,934
|
|
|
16,646
|
|||
|
Metals & Mining - 0.1%
|
|||
|
Algoma Steel Group, Inc.
|
489,241
|
3,102
|
|
|
Algoma Steel SCA (c)(m)
|
151,792
|
0
|
|
|
Elah Holdings, Inc. (m)
|
517
|
31
|
|
|
First Quantum Minerals Ltd.
|
217,300
|
4,540
|
|
|
Freeport-McMoRan, Inc.
|
47,500
|
1,805
|
|
|
9,478
|
|||
|
TOTAL MATERIALS
|
38,152
|
||
|
UTILITIES - 0.1%
|
|||
|
Electric Utilities - 0.1%
|
|||
|
NRG Energy, Inc.
|
58,409
|
1,859
|
|
|
PG&E Corp. (m)
|
606,468
|
9,861
|
|
|
Portland General Electric Co.
|
13,962
|
684
|
|
|
12,404
|
|||
|
Independent Power and Renewable Electricity Producers - 0.0%
|
|||
|
PureWest Energy (c)
|
10,774
|
0
|
|
|
PureWest Energy rights (c)(m)
|
6,493
|
0
|
|
|
0
|
|||
|
TOTAL UTILITIES
|
12,404
|
||
|
TOTAL COMMON STOCKS
(Cost $298,657)
|
365,565
|
||
|
Nonconvertible Preferred Stocks - 0.0%
|
|||
|
Shares
|
Value ($)
(000s)
|
||
|
CONSUMER DISCRETIONARY - 0.0%
|
|||
|
Auto Components - 0.0%
|
|||
|
Exide Technologies (c)(m)
|
624
|
581
|
|
|
INDUSTRIALS - 0.0%
|
|||
|
Transportation Infrastructure - 0.0%
|
|||
|
Tricer Holdco SCA (b)(c)(m)
|
193,792,711
|
2
|
|
|
TOTAL NONCONVERTIBLE PREFERRED STOCKS
(Cost $7,489)
|
583
|
||
|
Bank Loan Obligations - 1.7%
|
|||
|
Principal
Amount (a)
(000s)
|
Value ($)
(000s)
|
||
|
COMMUNICATION SERVICES - 0.2%
|
|||
|
Diversified Telecommunication Services - 0.1%
|
|||
|
Connect U.S. Finco LLC Tranche B 1LN, term loan 1 month U.S. LIBOR + 3.500% 7.89% 12/12/26 (f)(g)(n)
|
5,315
|
5,246
|
|
|
Frontier Communications Holdings LLC Tranche B 1LN, term loan 1 month U.S. LIBOR + 3.750% 8.5% 5/1/28 (f)(g)(n)
|
2,657
|
2,529
|
|
|
Securus Technologies Holdings Tranche B, term loan 3 month U.S. LIBOR + 4.500% 9.2299% 11/1/24 (f)(g)(n)
|
4,181
|
3,112
|
|
|
Zayo Group Holdings, Inc. 1LN, term loan 1 month U.S. LIBOR + 3.000% 7.3836% 3/9/27 (f)(g)(n)
|
4,347
|
3,509
|
|
|
14,396
|
|||
|
Media - 0.1%
|
|||
|
Diamond Sports Group LLC 1LN, term loan CME Term SOFR 1 Month Index + 8.000% 12.3171% 5/25/26 (f)(g)(n)
|
3,585
|
3,385
|
|
|
Nexstar Broadcasting, Inc. Tranche B, term loan 1 month U.S. LIBOR + 2.500% 6.8836% 9/19/26 (f)(g)(n)
|
1,380
|
1,368
|
|
|
Univision Communications, Inc.:
|
|||
|
1LN, term loan CME Term SOFR 1 Month Index + 4.250% 8.8302% 6/10/29 (f)(g)(n)
|
353
|
348
|
|
|
Tranche B 1LN, term loan 1 month U.S. LIBOR + 3.250% 7.6336% 1/31/29 (f)(g)(n)
|
3,553
|
3,439
|
|
|
8,540
|
|||
|
TOTAL COMMUNICATION SERVICES
|
22,936
|
||
|
CONSUMER DISCRETIONARY - 0.3%
|
|||
|
Auto Components - 0.0%
|
|||
|
PECF USS Intermediate Holding III Corp. Tranche B 1LN, term loan 1 month U.S. LIBOR + 4.250% 8.6336% 12/17/28 (f)(g)(n)
|
1,040
|
864
|
|
|
Diversified Consumer Services - 0.1%
|
|||
|
KUEHG Corp. Tranche B 2LN, term loan 3 month U.S. LIBOR + 8.250% 12.9799% 8/22/25 (f)(g)(n)
|
3,640
|
3,471
|
|
|
Sotheby's Tranche B 1LN, term loan 1 month U.S. LIBOR + 4.500% 8.5791% 1/15/27 (f)(g)(n)
|
6,593
|
6,417
|
|
|
Spin Holdco, Inc. Tranche B 1LN, term loan 1 month U.S. LIBOR + 4.000% 8.765% 3/4/28 (f)(g)(n)
|
8,307
|
6,975
|
|
|
16,863
|
|||
|
Hotels, Restaurants & Leisure - 0.1%
|
|||
|
Delta 2 SARL Tranche B 1LN, term loan CME Term SOFR 1 Month Index + 3.250% 7.573% 1/15/30 (f)(g)(n)
|
1,625
|
1,623
|
|
|
Fertitta Entertainment LLC NV Tranche B 1LN, term loan CME Term SOFR 1 Month Index + 4.000% 8.323% 1/27/29 (f)(g)(n)
|
1,734
|
1,646
|
|
|
Scientific Games Corp. 1LN, term loan CME Term SOFR 1 Month Index + 3.000% 7.4171% 4/7/29 (f)(g)(n)
|
1,090
|
1,072
|
|
|
4,341
|
|||
|
Specialty Retail - 0.1%
|
|||
|
Michaels Companies, Inc. 1LN, term loan 1 month U.S. LIBOR + 4.250% 8.9799% 4/15/28 (f)(g)(n)
|
2,669
|
2,297
|
|
|
New SK Holdco Sub LLC 1LN, term loan CME Term SOFR 1 Month Index + 8.350% 12.6746% 6/30/27 (f)(g)(n)
|
515
|
443
|
|
|
Wand NewCo 3, Inc. Tranche B 1LN, term loan 1 month U.S. LIBOR + 3.000% 7.3836% 2/5/26 (f)(g)(n)
|
11,038
|
10,443
|
|
|
13,183
|
|||
|
TOTAL CONSUMER DISCRETIONARY
|
35,251
|
||
|
CONSUMER STAPLES - 0.0%
|
|||
|
Beverages - 0.0%
|
|||
|
Bengal Debt Merger Sub LLC 1LN, term loan CME TERM SOFR 3 MONTH INDEX + 3.250% 7.9302% 1/24/29 (f)(g)(n)
|
1,035
|
923
|
|
|
ENERGY - 0.0%
|
|||
|
Energy Equipment & Services - 0.0%
|
|||
|
Forbes Energy Services LLC Tranche B, term loan 0% (c)(e)(f)(n)
|
1,267
|
0
|
|
|
Oil, Gas & Consumable Fuels - 0.0%
|
|||
|
Mesquite Energy, Inc.:
|
|||
|
1LN, term loan 3 month U.S. LIBOR + 8.000% 0% (c)(e)(g)(n)
|
3,423
|
0
|
|
|
term loan 3 month U.S. LIBOR + 0.000% 0% (c)(e)(g)(n)
|
1,476
|
0
|
|
|
0
|
|||
|
TOTAL ENERGY
|
0
|
||
|
FINANCIALS - 0.1%
|
|||
|
Capital Markets - 0.0%
|
|||
|
Citadel Securities LP Tranche B 1LN, term loan 1 month U.S. LIBOR + 2.500% 6.9375% 2/27/28 (f)(g)(n)
|
5,281
|
5,171
|
|
|
Insurance - 0.1%
|
|||
|
Acrisure LLC Tranche B 1LN, term loan 1 month U.S. LIBOR + 4.250% 8.6336% 2/15/27 (f)(g)(n)
|
648
|
626
|
|
|
Alliant Holdings Intermediate LLC Tranche B3 1LN, term loan 1 month U.S. LIBOR + 3.500% 7.8539% 11/12/27 (f)(g)(n)
|
6,399
|
6,246
|
|
|
HUB International Ltd. Tranche B 1LN, term loan CME Term SOFR 1 Month Index + 4.000% 8.2202% 11/10/29 (f)(g)(n)
|
450
|
445
|
|
|
7,317
|
|||
|
TOTAL FINANCIALS
|
12,488
|
||
|
HEALTH CARE - 0.2%
|
|||
|
Health Care Providers & Services - 0.1%
|
|||
|
Gainwell Acquisition Corp. Tranche B 1LN, term loan 1 month U.S. LIBOR + 4.000% 8.7299% 10/1/27 (f)(g)(n)
|
9,702
|
9,084
|
|
|
Phoenix Newco, Inc. Tranche B 1LN, term loan 1 month U.S. LIBOR + 3.250% 7.6336% 11/15/28 (f)(g)(n)
|
3,310
|
3,182
|
|
|
12,266
|
|||
|
Health Care Technology - 0.1%
|
|||
|
Athenahealth Group, Inc.:
|
|||
|
Tranche B 1LN, term loan CME Term SOFR 1 Month Index + 3.500% 7.8211% 2/15/29 (f)(g)(n)
|
13,072
|
11,769
|
|
|
Tranche DD 1LN, term loan CME Term SOFR 1 Month Index + 3.500% 3.5% 2/15/29 (f)(g)(n)(o)
|
2,227
|
2,005
|
|
|
13,774
|
|||
|
TOTAL HEALTH CARE
|
26,040
|
||
|
INDUSTRIALS - 0.3%
|
|||
|
Air Freight & Logistics - 0.0%
|
|||
|
Dynasty Acquisition Co., Inc.:
|
|||
|
Tranche B 1LN, term loan 1 month U.S. LIBOR + 3.500% 7.923% 4/8/26 (f)(g)(n)
|
1,506
|
1,433
|
|
|
Tranche B2 1LN, term loan 1 month U.S. LIBOR + 3.500% 7.923% 4/4/26 (f)(g)(n)
|
810
|
770
|
|
|
2,203
|
|||
|
Airlines - 0.1%
|
|||
|
Air Canada Tranche B 1LN, term loan 1 month U.S. LIBOR + 3.500% 8.13% 8/11/28 (f)(g)(n)
|
4,219
|
4,161
|
|
|
SkyMiles IP Ltd. Tranche B 1LN, term loan 3 month U.S. LIBOR + 3.750% 7.9926% 10/20/27 (f)(g)(n)
|
2,095
|
2,133
|
|
|
6,294
|
|||
|
Building Products - 0.1%
|
|||
|
Acproducts Holdings, Inc. Tranche B 1LN, term loan 1 month U.S. LIBOR + 4.250% 8.9799% 5/17/28 (f)(g)(n)
|
11,288
|
8,403
|
|
|
Hunter Douglas, Inc. Tranche B 1LN, term loan CME Term SOFR 1 Month Index + 3.500% 7.8588% 2/25/29 (f)(g)(n)
|
10,537
|
9,229
|
|
|
17,632
|
|||
|
Commercial Services & Supplies - 0.1%
|
|||
|
ABG Intermediate Holdings 2 LLC:
|
|||
|
Tranche B 2LN, term loan CME Term SOFR 1 Month Index + 6.000% 10.423% 12/20/29 (f)(g)(n)
|
525
|
478
|
|
|
Tranche B1 LN, term loan CME Term SOFR 1 Month Index + 3.500% 7.923% 12/21/28 (f)(g)(n)
|
2,487
|
2,404
|
|
|
Madison IAQ LLC Tranche B 1LN, term loan 1 month U.S. LIBOR + 3.250% 7.9883% 6/21/28 (f)(g)(n)
|
1,399
|
1,298
|
|
|
Neptune BidCo U.S., Inc. Tranche B 1LN, term loan CME Term SOFR 1 Month Index + 5.000% 8.8219% 4/11/29 (f)(g)(n)
|
7,380
|
6,573
|
|
|
Sabert Corp. Tranche B 1LN, term loan 1 month U.S. LIBOR + 4.500% 8.9375% 12/10/26 (c)(f)(g)(n)
|
3,903
|
3,864
|
|
|
14,617
|
|||
|
Construction & Engineering - 0.0%
|
|||
|
SRS Distribution, Inc. Tranche B 1LN, term loan 1 month U.S. LIBOR + 3.500% 7.8836% 6/4/28 (f)(g)(n)
|
3,056
|
2,916
|
|
|
Machinery - 0.0%
|
|||
|
Chart Industries, Inc. 1LN, term loan CME Term SOFR 1 Month Index + 3.750% 12/8/29 (g)(n)(p)
|
815
|
805
|
|
|
TOTAL INDUSTRIALS
|
44,467
|
||
|
INFORMATION TECHNOLOGY - 0.4%
|
|||
|
Electronic Equipment & Components - 0.0%
|
|||
|
DG Investment Intermediate Holdings, Inc. Tranche B 1LN, term loan 1 month U.S. LIBOR + 3.750% 8.1336% 3/31/28 (f)(g)(n)
|
985
|
941
|
|
|
IT Services - 0.1%
|
|||
|
Acuris Finance U.S., Inc. 1LN, term loan CME Term SOFR 1 Month Index + 4.000% 8.7302% 2/16/28 (f)(g)(n)
|
603
|
591
|
|
|
Camelot Finance SA Tranche B, term loan 1 month U.S. LIBOR + 3.000% 7.3836% 10/31/26 (f)(g)(n)
|
599
|
589
|
|
|
GTT Communications, Inc. Tranche B, term loan 3 month U.S. LIBOR + 4.750% 10.75% 5/31/25 (f)(g)(n)
|
7,817
|
3,518
|
|
|
Hunter U.S. Bidco, Inc. Tranche B 1LN, term loan 1 month U.S. LIBOR + 4.250% 8.9799% 8/19/28 (f)(g)(n)
|
5,339
|
5,226
|
|
|
9,924
|
|||
|
Software - 0.3%
|
|||
|
Boxer Parent Co., Inc. Tranche B 1LN, term loan 1 month U.S. LIBOR + 3.750% 8.1336% 10/2/25 (f)(g)(n)
|
18,876
|
18,042
|
|
|
Polaris Newco LLC Tranche B 1LN, term loan 1 month U.S. LIBOR + 4.000% 8.7299% 6/2/28 (f)(g)(n)
|
3,145
|
2,863
|
|
|
Proofpoint, Inc. Tranche B 1LN, term loan 1 month U.S. LIBOR + 3.250% 7.9849% 8/31/28 (f)(g)(n)
|
3,074
|
2,949
|
|
|
RealPage, Inc. Tranche B 1LN, term loan 1 month U.S. LIBOR + 3.000% 7.3836% 4/22/28 (f)(g)(n)
|
3,066
|
2,910
|
|
|
Ultimate Software Group, Inc. 1LN, term loan 1 month U.S. LIBOR + 3.250% 6.9983% 5/3/26 (f)(g)(n)
|
6,670
|
6,336
|
|
|
VS Buyer LLC Tranche B 1LN, term loan 1 month U.S. LIBOR + 3.000% 7.3836% 2/28/27 (f)(g)(n)
|
1,274
|
1,234
|
|
|
34,334
|
|||
|
TOTAL INFORMATION TECHNOLOGY
|
45,199
|
||
|
MATERIALS - 0.1%
|
|||
|
Chemicals - 0.1%
|
|||
|
Avient Corp. Tranche B 1LN, term loan CME Term SOFR 1 Month Index + 3.250% 7.3442% 8/29/29 (f)(g)(n)
|
271
|
270
|
|
|
Discovery Purchaser Corp. 1LN, term loan CME Term SOFR 1 Month Index + 4.370% 7.9683% 10/4/29 (f)(g)(n)
|
8,880
|
8,074
|
|
|
Olympus Water U.S. Holding Corp. Tranche B 1LN, term loan 1 month U.S. LIBOR + 3.750% 8.5% 11/9/28 (f)(g)(n)
|
1,693
|
1,621
|
|
|
W.R. Grace Holding LLC Tranche B 1LN, term loan 3 month U.S. LIBOR + 3.750% 8.5% 9/22/28 (f)(g)(n)
|
1,277
|
1,251
|
|
|
11,216
|
|||
|
Containers & Packaging - 0.0%
|
|||
|
Clydesdale Acquisition Holdings, Inc. 1LN, term loan CME Term SOFR 1 Month Index + 4.170% 8.598% 4/13/29 (f)(g)(n)
|
4,159
|
3,953
|
|
|
Kloeckner Pentaplast of America, Inc. Tranche B 1LN, term loan 1 month U.S. LIBOR + 4.750% 8.2592% 2/9/26 (f)(g)(n)
|
786
|
695
|
|
|
4,648
|
|||
|
TOTAL MATERIALS
|
15,864
|
||
|
UTILITIES - 0.1%
|
|||
|
Electric Utilities - 0.1%
|
|||
|
PG&E Corp. Tranche B 1LN, term loan 1 month U.S. LIBOR + 3.000% 7.4375% 6/23/25 (f)(g)(n)
|
16,590
|
16,439
|
|
|
TOTAL BANK LOAN OBLIGATIONS
(Cost $240,954)
|
219,607
|
||
|
Fixed-Income Funds - 23.7%
|
|||
|
Shares
|
Value ($)
(000s)
|
||
|
Fidelity Emerging Markets Debt Central Fund (q)
|
269,174,565
|
2,029,576
|
|
|
Fidelity Floating Rate Central Fund (q)
|
10,625,916
|
1,010,843
|
|
|
TOTAL FIXED-INCOME FUNDS
(Cost $3,604,102)
|
3,040,419
|
||
|
Preferred Securities - 4.4%
|
|||
|
Principal
Amount (a)
(000s)
|
Value ($)
(000s)
|
||
|
CONSUMER DISCRETIONARY - 0.1%
|
|||
|
Automobiles - 0.1%
|
|||
|
Volkswagen International Finance NV 4.375% (Reg. S) (f)(h)
|
EUR
|
18,100
|
16,414
|
|
ENERGY - 0.6%
|
|||
|
Oil, Gas & Consumable Fuels - 0.6%
|
|||
|
Energy Transfer LP:
|
|||
|
6.25% (f)(h)
|
45,897
|
40,096
|
|
|
6.625% (f)(h)
|
17,100
|
13,125
|
|
|
7.125% (f)(h)
|
4,160
|
3,512
|
|
|
MPLX LP 6.875% (f)(h)
|
18,000
|
18,197
|
|
|
Summit Midstream Partners LP 3 month U.S. LIBOR + 7.430% 12.1759% (e)(f)(g)(h)
|
1,711
|
1,264
|
|
|
76,194
|
|||
|
FINANCIALS - 3.7%
|
|||
|
Banks - 3.4%
|
|||
|
Bank of America Corp.:
|
|||
|
5.2% (f)(h)
|
48,090
|
46,812
|
|
|
5.875% (f)(h)
|
60,475
|
54,318
|
|
|
6.25% (f)(h)
|
18,480
|
18,121
|
|
|
Citigroup, Inc.:
|
|||
|
4.7% (f)(h)
|
8,755
|
7,449
|
|
|
5% (f)(h)
|
36,455
|
33,004
|
|
|
5.9% (f)(h)
|
15,875
|
16,063
|
|
|
5.95% (f)(h)
|
46,925
|
47,635
|
|
|
6.3% (f)(h)
|
4,120
|
3,920
|
|
|
Huntington Bancshares, Inc. 5.7% (f)(h)
|
7,660
|
7,181
|
|
|
JPMorgan Chase & Co.:
|
|||
|
4% (f)(h)
|
19,100
|
16,547
|
|
|
4.6% (f)(h)
|
13,385
|
12,052
|
|
|
5% (f)(h)
|
18,675
|
17,475
|
|
|
6% (f)(h)
|
54,840
|
55,007
|
|
|
6.125% (f)(h)
|
12,865
|
12,639
|
|
|
6.75% (f)(h)
|
6,270
|
6,422
|
|
|
Wells Fargo & Co.:
|
|||
|
5.875% (f)(h)
|
36,775
|
35,589
|
|
|
5.9% (f)(h)
|
46,445
|
41,725
|
|
|
431,959
|
|||
|
Capital Markets - 0.3%
|
|||
|
Goldman Sachs Group, Inc.:
|
|||
|
3 month U.S. LIBOR + 2.870% 7.466% (f)(g)(h)
|
29,914
|
29,413
|
|
|
4.4% (f)(h)
|
4,530
|
3,863
|
|
|
4.95% (f)(h)
|
7,885
|
7,328
|
|
|
40,604
|
|||
|
Diversified Financial Services - 0.0%
|
|||
|
OEC Finance Ltd. 7.5% pay-in-kind (d)(h)
|
22
|
1
|
|
|
TOTAL FINANCIALS
|
472,564
|
||
|
TOTAL PREFERRED SECURITIES
(Cost $607,397)
|
565,172
|
||
|
Money Market Funds - 2.6%
|
|||
|
Shares
|
Value ($)
(000s)
|
||
|
Fidelity Cash Central Fund 4.37% (r)
|
260,038,729
|
260,091
|
|
|
Fidelity Securities Lending Cash Central Fund 4.37% (r)(s)
|
74,117,736
|
74,125
|
|
|
TOTAL MONEY MARKET FUNDS
(Cost $334,178)
|
334,216
|
||
|
TOTAL INVESTMENT IN SECURITIES - 101.1%
(Cost $14,478,692)
|
12,974,216
|
|
NET OTHER ASSETS (LIABILITIES) - (1.1)%
|
(140,107)
|
|
NET ASSETS - 100.0%
|
12,834,109
|
|
TBA Sale Commitments
|
||
|
Principal
Amount (a)
(000s)
|
Value ($)
(000s)
|
|
|
Ginnie Mae
|
||
|
2% 1/1/53
|
(13,050)
|
(10,949)
|
|
2% 1/1/53
|
(16,300)
|
(13,675)
|
|
2% 1/1/53
|
(10,250)
|
(8,599)
|
|
2% 1/1/53
|
(16,300)
|
(13,675)
|
|
2% 2/1/53
|
(3,250)
|
(2,730)
|
|
3.5% 1/1/53
|
(1,850)
|
(1,700)
|
|
TOTAL GINNIE MAE
|
(51,328)
|
|
|
Uniform Mortgage Backed Securities
|
||
|
2.5% 1/1/53
|
(1,750)
|
(1,484)
|
|
2.5% 1/1/53
|
(1,250)
|
(1,060)
|
|
2.5% 1/1/53
|
(1,250)
|
(1,060)
|
|
2.5% 1/1/53
|
(1,750)
|
(1,484)
|
|
2.5% 1/1/53
|
(1,200)
|
(1,017)
|
|
3.5% 1/1/53
|
(1,750)
|
(1,592)
|
|
3.5% 1/1/53
|
(13,300)
|
(12,096)
|
|
3.5% 1/1/53
|
(13,300)
|
(12,096)
|
|
4% 1/1/53
|
(2,800)
|
(2,628)
|
|
4.5% 1/1/53
|
(17,450)
|
(16,820)
|
|
4.5% 1/1/53
|
(7,200)
|
(6,940)
|
|
5% 1/1/53
|
(2,300)
|
(2,267)
|
|
TOTAL UNIFORM MORTGAGE BACKED SECURITIES
|
(60,544)
|
|
|
TOTAL TBA SALE COMMITMENTS
(Proceeds $113,458)
|
(111,872)
|
|
|
Futures Contracts
|
|||||
|
Number
of contracts
|
Expiration
Date
|
Notional
Amount ($)
(000s)
|
Value ($)
(000s)
|
Unrealized
Appreciation/
(Depreciation) ($)
(000s)
|
|
|
Purchased
|
|||||
|
Treasury Contracts
|
|||||
|
CBOT 10-Year U.S. Treasury Note Contracts (United States)
|
4,478
|
Mar 2023
|
502,865
|
(1,451)
|
(1,451)
|
|
CBOT 2-Year U.S. Treasury Note Contracts (United States)
|
2,473
|
Mar 2023
|
507,158
|
481
|
481
|
|
CBOT 5-Year U.S. Treasury Note Contracts (United States)
|
247
|
Mar 2023
|
26,659
|
13
|
13
|
|
CBOT Long Term U.S. Treasury Bond Contracts (United States)
|
207
|
Mar 2023
|
25,946
|
0
|
0
|
|
CBOT Ultra Long Term U.S. Treasury Bond Contracts (United States)
|
279
|
Mar 2023
|
37,473
|
76
|
76
|
|
TOTAL FUTURES CONTRACTS
|
(881)
|
||||
|
The notional amount of futures purchased as a percentage of Net Assets is 8.6%
|
|||||
|
Forward Foreign Currency Contracts
|
||||||
|
Currency
Purchased
|
Currency
Sold
|
Counterparty
|
Settlement
Date
|
Unrealized
Appreciation/
(Depreciation) ($) (000s)
|
||
|
AUD
|
35,438
|
USD
|
23,735
|
Canadian Imperial Bk. of Comm.
|
1/13/23
|
402
|
|
EUR
|
3,738
|
USD
|
3,987
|
Bank of America, N.A.
|
1/13/23
|
17
|
|
EUR
|
13,370
|
USD
|
14,274
|
Bank of America, N.A.
|
1/13/23
|
47
|
|
EUR
|
2,282
|
USD
|
2,432
|
Barclays Bank PLC
|
1/13/23
|
12
|
|
EUR
|
4,366
|
USD
|
4,649
|
Brown Brothers Harriman & Co
|
1/13/23
|
28
|
|
EUR
|
1,837
|
USD
|
1,962
|
Brown Brothers Harriman & Co
|
1/13/23
|
6
|
|
EUR
|
2,304
|
USD
|
2,439
|
HSBC Bank
|
1/13/23
|
29
|
|
EUR
|
17,415
|
USD
|
18,603
|
Morgan Stanley Cap. Group, Inc
|
1/13/23
|
51
|
|
EUR
|
2,603
|
USD
|
2,780
|
State Street Bank and Trust Co
|
1/13/23
|
8
|
|
EUR
|
3,368
|
USD
|
3,583
|
State Street Bank and Trust Co
|
1/13/23
|
25
|
|
EUR
|
2,508
|
USD
|
2,671
|
State Street Bank and Trust Co
|
1/13/23
|
15
|
|
USD
|
44,050
|
AUD
|
65,044
|
Bank of America, N.A.
|
1/13/23
|
(253)
|
|
USD
|
11,023
|
AUD
|
16,301
|
Bank of America, N.A.
|
1/13/23
|
(80)
|
|
USD
|
1,835
|
AUD
|
2,701
|
State Street Bank and Trust Co
|
1/13/23
|
(5)
|
|
USD
|
76,857
|
CAD
|
104,742
|
Bank of America, N.A.
|
1/13/23
|
(504)
|
|
USD
|
3,613
|
EUR
|
3,415
|
Bank of America, N.A.
|
1/13/23
|
(45)
|
|
USD
|
22,516
|
EUR
|
21,191
|
Brown Brothers Harriman & Co
|
1/13/23
|
(182)
|
|
USD
|
451,707
|
EUR
|
426,786
|
State Street Bank and Trust Co
|
1/13/23
|
(5,445)
|
|
USD
|
9,183
|
GBP
|
7,503
|
Royal Bank of Canada
|
1/13/23
|
110
|
|
USD
|
95,798
|
GBP
|
78,150
|
State Street Bank and Trust Co
|
1/13/23
|
1,294
|
|
USD
|
11,981
|
JPY
|
1,623,563
|
State Street Bank and Trust Co
|
1/13/23
|
(405)
|
|
TOTAL FORWARD FOREIGN CURRENCY CONTRACTS
|
(4,875)
|
|||||
|
Unrealized Appreciation
|
2,044
|
|||||
|
Unrealized Depreciation
|
(6,919)
|
|||||
|
AUD
|
-
|
Australian dollar
|
|
CAD
|
-
|
Canadian dollar
|
|
EUR
|
-
|
European Monetary Unit
|
|
GBP
|
-
|
British pound sterling
|
|
JPY
|
-
|
Japanese yen
|
|
USD
|
-
|
U.S. dollar
|
|
(a)
|
Amount is stated in United States dollars unless otherwise noted.
|
|
(b)
|
Restricted securities (including private placements) - Investment in securities not registered under the Securities Act of 1933 (excluding 144A issues). At the end of the period, the value of restricted securities (excluding 144A issues) amounted to $41,592,000 or 0.3% of net assets.
|
|
(c)
|
Level 3 security
|
|
(d)
|
Security exempt from registration under Rule 144A of the Securities Act of 1933. These securities may be resold in transactions exempt from registration, normally to qualified institutional buyers. At the end of the period, the value of these securities amounted to $2,773,023,000 or 21.6% of net assets.
|
|
(e)
|
Non-income producing - Security is in default.
|
|
(f)
|
Coupon rates for floating and adjustable rate securities reflect the rates in effect at period end.
|
|
(g)
|
Coupon is indexed to a floating interest rate which may be multiplied by a specified factor and/or subject to caps or floors.
|
|
(h)
|
Security is perpetual in nature with no stated maturity date.
|
|
(i)
|
Security initially issued at one coupon which converts to a higher coupon at a specified date. The rate shown is the rate at period end.
|
|
(j)
|
Security or a portion of the security was pledged to cover margin requirements for futures contracts. At period end, the value of securities pledged amounted to $15,981,000.
|
|
(k)
|
Security or a portion of the security is on loan at period end.
|
|
(l)
|
Security or a portion of the security purchased on a delayed delivery or when-issued basis.
|
|
(m)
|
Non-income producing
|
|
(n)
|
Remaining maturities of bank loan obligations may be less than the stated maturities shown as a result of contractual or optional prepayments by the borrower. Such prepayments cannot be predicted with certainty.
|
|
(o)
|
Position or a portion of the position represents an unfunded loan commitment. At period end, the total principal amount and market value of unfunded commitments totaled $1,670,000 and $1,504,000, respectively.
|
|
(p)
|
The coupon rate will be determined upon settlement of the loan after period end.
|
|
(q)
|
Affiliated fund that is generally available only to investment companies and other accounts managed by Fidelity Investments. A complete unaudited schedule of portfolio holdings for each Fidelity Central Fund is filed with the SEC for the first and third quarters of each fiscal year on Form N-PORT and is available upon request or at the SEC's website at www.sec.gov. An unaudited holdings listing for the Fund, which presents direct holdings as well as the pro-rata share of securities and other investments held indirectly through its investment in underlying non-money market Fidelity Central Funds, is available at fidelity.com and/or institutional.fidelity.com, as applicable. In addition, each Fidelity Central Fund's financial statements,which are not covered by the Fund's Report of Independent Registered Public Accounting Firm, are available on the SEC's website or upon request.
|
|
(r)
|
Affiliated fund that is generally available only to investment companies and other accounts managed by Fidelity Investments. The rate quoted is the annualized seven-day yield of the fund at period end. A complete unaudited listing of the fund's holdings as of its most recent quarter end is available upon request. In addition, each Fidelity Central Fund's financial statements, which are not covered by the Fund's Report of Independent Registered Public Accounting Firm, are available on the SEC's website or upon request.
|
|
(s)
|
Investment made with cash collateral received from securities on loan.
|
|
Additional information on each restricted holding is as follows:
|
||
|
Security
|
Acquisition Date
|
Acquisition Cost ($)
(000s)
|
|
Chesapeake Energy Corp.
|
2/10/21
|
151
|
|
Mesquite Energy, Inc. 15% 7/15/23
|
7/10/20 - 1/18/22
|
1,457
|
|
Mesquite Energy, Inc. 15% 7/15/23
|
11/05/20 - 1/18/22
|
2,515
|
|
New Cotai LLC/New Cotai Capital Corp.
|
9/11/20
|
11,111
|
|
Southeastern Grocers, Inc.
|
6/01/18
|
4,108
|
|
Tricer Holdco SCA
|
10/16/09 - 12/30/17
|
6,909
|
|
Tricer Holdco SCA Class A1
|
10/16/09 - 10/29/09
|
1,100
|
|
Tricer Holdco SCA Class A2
|
10/16/09 - 10/29/09
|
1,100
|
|
Tricer Holdco SCA Class A3
|
10/16/09 - 10/29/09
|
1,100
|
|
Tricer Holdco SCA Class A4
|
10/16/09 - 10/29/09
|
1,100
|
|
Tricer Holdco SCA Class A5
|
10/16/09 - 10/29/09
|
1,100
|
|
Tricer Holdco SCA Class A6
|
10/16/09 - 10/29/09
|
1,100
|
|
Tricer Holdco SCA Class A7
|
10/16/09 - 10/29/09
|
1,100
|
|
Tricer Holdco SCA Class A8
|
10/16/09 - 10/29/09
|
1,100
|
|
Tricer Holdco SCA Class A9
|
10/16/09 - 10/29/09
|
1,100
|
|
Affiliate (Amounts in thousands)
|
Value,
beginning
of period ($)
|
Purchases ($)
|
Sales
Proceeds ($)
|
Dividend
Income ($)
|
Realized
Gain (loss) ($)
|
Change in
Unrealized
appreciation
(depreciation) ($)
|
Value,
end
of period ($)
|
% ownership,
end
of period
|
|
Fidelity Cash Central Fund 4.37%
|
672,089
|
4,110,696
|
4,522,694
|
7,198
|
6
|
(6)
|
260,091
|
0.6%
|
|
Fidelity Emerging Markets Debt Central Fund
|
2,568,423
|
175,093
|
295,806
|
115,508
|
(39,921)
|
(378,213)
|
2,029,576
|
93.4%
|
|
Fidelity Floating Rate Central Fund
|
1,489,622
|
79,760
|
484,235
|
71,756
|
(39,057)
|
(35,247)
|
1,010,843
|
43.1%
|
|
Fidelity Mortgage Backed Securities Central Fund
|
21
|
-
|
20
|
-
|
(1)
|
-
|
-
|
0.0%
|
|
Fidelity Securities Lending Cash Central Fund 4.37%
|
234,493
|
2,492,428
|
2,652,796
|
660
|
-
|
-
|
74,125
|
0.2%
|
|
Total
|
4,964,648
|
6,857,977
|
7,955,551
|
195,122
|
(78,973)
|
(413,466)
|
3,374,635
|
|
|
Valuation Inputs at Reporting Date:
|
||||
|
Description
(Amounts in thousands)
|
Total ($)
|
Level 1 ($)
|
Level 2 ($)
|
Level 3 ($)
|
|
Investments in Securities:
|
||||
|
Equities:
|
||||
|
Communication Services
|
15,607
|
14,396
|
-
|
1,211
|
|
Consumer Discretionary
|
55,442
|
51,063
|
-
|
4,379
|
|
Consumer Staples
|
21,275
|
7,701
|
-
|
13,574
|
|
Energy
|
90,208
|
59,929
|
-
|
30,279
|
|
Financials
|
10,073
|
10,073
|
-
|
-
|
|
Health Care
|
24,918
|
24,918
|
-
|
-
|
|
Industrials
|
15,357
|
13,514
|
-
|
1,843
|
|
Information Technology
|
82,712
|
82,426
|
-
|
286
|
|
Materials
|
38,152
|
38,152
|
-
|
-
|
|
Utilities
|
12,404
|
12,404
|
-
|
-
|
|
Corporate Bonds
|
4,199,663
|
-
|
4,168,851
|
30,812
|
|
U.S. Government and Government Agency Obligations
|
3,471,424
|
-
|
3,471,424
|
-
|
|
U.S. Government Agency - Mortgage Securities
|
370,058
|
-
|
370,058
|
-
|
|
Commercial Mortgage Securities
|
13,103
|
-
|
13,103
|
-
|
|
Foreign Government and Government Agency Obligations
|
394,406
|
-
|
394,406
|
-
|
|
Bank Loan Obligations
|
219,607
|
-
|
215,743
|
3,864
|
|
Fixed-Income Funds
|
3,040,419
|
3,040,419
|
-
|
-
|
|
Preferred Securities
|
565,172
|
-
|
565,172
|
-
|
|
Money Market Funds
|
334,216
|
334,216
|
-
|
-
|
|
Total Investments in Securities:
|
12,974,216
|
3,689,211
|
9,198,757
|
86,248
|
|
Derivative Instruments:
|
||||
|
Assets
|
||||
|
Forward Foreign Currency Contracts
|
2,044
|
-
|
2,044
|
-
|
|
Futures Contracts
|
570
|
570
|
-
|
-
|
|
Total Assets
|
2,614
|
570
|
2,044
|
-
|
|
Liabilities
|
||||
|
Forward Foreign Currency Contracts
|
(6,919)
|
-
|
(6,919)
|
-
|
|
Futures Contracts
|
(1,451)
|
(1,451)
|
-
|
-
|
|
Total Liabilities
|
(8,370)
|
(1,451)
|
(6,919)
|
-
|
|
Total Derivative Instruments:
|
(5,756)
|
(881)
|
(4,875)
|
-
|
|
Other Financial Instruments:
|
||||
|
TBA Sale Commitments
|
(111,872)
|
-
|
(111,872)
|
-
|
|
Total Other Financial Instruments:
|
(111,872)
|
-
|
(111,872)
|
-
|
|
Primary Risk Exposure / Derivative Type
|
Value
|
|
|
(Amounts in thousands)
|
Asset ($)
|
Liability ($)
|
|
Foreign Exchange Risk
|
||
|
Forward Foreign Currency Contracts
(a)
|
2,044
|
(6,919)
|
|
Total Foreign Exchange Risk
|
2,044
|
(6,919)
|
|
Interest Rate Risk
|
||
|
Futures Contracts
(b)
|
570
|
(1,451)
|
|
Total Interest Rate Risk
|
570
|
(1,451)
|
|
Total Value of Derivatives
|
2,614
|
(8,370)
|
|
Statement of Assets and Liabilities
|
||||
|
Amounts in thousands (except per-share amounts)
|
December 31, 2022
|
|||
|
Assets
|
||||
|
Investment in securities, at value (including securities loaned of $71,775) - See accompanying schedule:
|
$
|
|||
|
Unaffiliated issuers (cost $10,540,412)
|
9,599,581
|
|||
|
Fidelity Central Funds (cost $3,938,280)
|
3,374,635
|
|||
|
Total Investment in Securities (cost $14,478,692)
|
$
|
12,974,216
|
||
|
Cash
|
3,074
|
|||
|
Foreign currency held at value (cost $4)
|
4
|
|||
|
Receivable for investments sold
|
47,997
|
|||
|
Receivable for TBA sale commitments
|
113,458
|
|||
|
Unrealized appreciation on forward foreign currency contracts
|
2,044
|
|||
|
Receivable for fund shares sold
|
10,975
|
|||
|
Dividends receivable
|
1,100
|
|||
|
Interest receivable
|
99,373
|
|||
|
Distributions receivable from Fidelity Central Funds
|
977
|
|||
|
Prepaid expenses
|
14
|
|||
|
Other receivables
|
104
|
|||
|
Total assets
|
13,253,336
|
|||
|
Liabilities
|
||||
|
Payable for investments purchased
|
||||
|
Regular delivery
|
$22,824
|
|||
|
Delayed delivery
|
160,002
|
|||
|
TBA sale commitments, at value
|
111,872
|
|||
|
Unrealized depreciation on forward foreign currency contracts
|
6,919
|
|||
|
Payable for fund shares redeemed
|
30,309
|
|||
|
Distributions payable
|
3,589
|
|||
|
Accrued management fee
|
5,970
|
|||
|
Distribution and service plan fees payable
|
672
|
|||
|
Payable for daily variation margin on futures contracts
|
1,172
|
|||
|
Other affiliated payables
|
1,524
|
|||
|
Other payables and accrued expenses
|
249
|
|||
|
Collateral on securities loaned
|
74,125
|
|||
|
Total Liabilities
|
419,227
|
|||
|
Net Assets
|
$
|
12,834,109
|
||
|
Net Assets consist of:
|
||||
|
Paid in capital
|
$
|
14,583,011
|
||
|
Total accumulated earnings (loss)
|
(1,748,902)
|
|||
|
Net Assets
|
$
|
12,834,109
|
||
|
Net Asset Value and Maximum Offering Price
|
||||
|
Class A :
|
||||
|
Net Asset Value
and redemption price per share ($1,636,956 ÷ 152,609 shares)
(a)
|
$
|
10.73
|
||
|
Maximum offering price per share (100/96.00 of $10.73)
|
$
|
11.18
|
||
|
Class M :
|
||||
|
Net Asset Value
and redemption price per share ($629,724 ÷ 58,739 shares)
(a)
|
$
|
10.72
|
||
|
Maximum offering price per share (100/96.00 of $10.72)
|
$
|
11.17
|
||
|
Class C :
|
||||
|
Net Asset Value
and offering price per share ($222,216 ÷ 20,776 shares)
(a)
|
$
|
10.70
|
||
|
Fidelity Strategic Income Fund :
|
||||
|
Net Asset Value
, offering price and redemption price per share ($5,456,882 ÷ 501,433 shares)
|
$
|
10.88
|
||
|
Class I :
|
||||
|
Net Asset Value
, offering price and redemption price per share ($3,986,403 ÷ 366,277 shares)
|
$
|
10.88
|
||
|
Class Z :
|
||||
|
Net Asset Value
, offering price and redemption price per share ($901,928 ÷ 82,832 shares)
|
$
|
10.89
|
||
|
(a)Redemption price per
share
is equal to net asset value less any applicable contingent deferred sales charge.
|
||||
|
Statement of Operations
|
||||
|
Amounts in thousands
|
Year ended
December 31, 2022
|
|||
|
Investment Income
|
||||
|
Dividends
|
$
|
50,006
|
||
|
Interest
|
360,210
|
|||
|
Income from Fidelity Central Funds (including $660 from security lending)
|
195,122
|
|||
|
Total Income
|
605,338
|
|||
|
Expenses
|
||||
|
Management fee
|
$
|
79,820
|
||
|
Transfer agent fees
|
18,450
|
|||
|
Distribution and service plan fees
|
9,036
|
|||
|
Accounting fees
|
1,718
|
|||
|
Custodian fees and expenses
|
44
|
|||
|
Independent trustees' fees and expenses
|
48
|
|||
|
Registration fees
|
344
|
|||
|
Audit
|
124
|
|||
|
Legal
|
914
|
|||
|
Miscellaneous
|
66
|
|||
|
Total expenses before reductions
|
110,564
|
|||
|
Expense reductions
|
(297)
|
|||
|
Total expenses after reductions
|
110,267
|
|||
|
Net Investment income (loss)
|
495,071
|
|||
|
Realized and Unrealized Gain (Loss)
|
||||
|
Net realized gain (loss) on:
|
||||
|
Investment Securities:
|
||||
|
Unaffiliated issuers
|
(57,059)
|
|||
|
Fidelity Central Funds
|
(78,973)
|
|||
|
Forward foreign currency contracts
|
113,251
|
|||
|
Foreign currency transactions
|
(5,636)
|
|||
|
Futures contracts
|
(224,713)
|
|||
|
Total net realized gain (loss)
|
(253,130)
|
|||
|
Change in net unrealized appreciation (depreciation) on:
|
||||
|
Investment Securities:
|
||||
|
Unaffiliated issuers
|
(1,674,078)
|
|||
|
Fidelity Central Funds
|
(413,466)
|
|||
|
Forward foreign currency contracts
|
(25,357)
|
|||
|
Assets and liabilities in foreign currencies
|
215
|
|||
|
Futures contracts
|
(3,309)
|
|||
|
TBA Sale commitments
|
1,618
|
|||
|
Total change in net unrealized appreciation (depreciation)
|
(2,114,377)
|
|||
|
Net gain (loss)
|
(2,367,507)
|
|||
|
Net increase (decrease) in net assets resulting from operations
|
$
|
(1,872,436)
|
||
|
Statement of Changes in Net Assets
|
||||
|
Amount in thousands
|
Year ended
December 31, 2022
|
Year ended
December 31, 2021
|
||
|
Increase (Decrease) in Net Assets
|
||||
|
Operations
|
||||
|
Net investment income (loss)
|
$
|
495,071
|
$
|
424,672
|
|
Net realized gain (loss)
|
(253,130)
|
319,698
|
||
|
Change in net unrealized appreciation (depreciation)
|
(2,114,377)
|
(140,674)
|
||
|
Net increase (decrease) in net assets resulting from operations
|
(1,872,436)
|
603,696
|
||
|
Distributions to shareholders
|
(511,157)
|
(741,684)
|
||
|
Share transactions - net increase (decrease)
|
(1,768,785)
|
1,482,123
|
||
|
Total increase (decrease) in net assets
|
(4,152,378)
|
1,344,135
|
||
|
Net Assets
|
||||
|
Beginning of period
|
16,986,487
|
15,642,352
|
||
|
End of period
|
$
|
12,834,109
|
$
|
16,986,487
|
|
Fidelity Advisor® Strategic Income Fund Class A
|
|
Years ended December 31,
|
2022
|
2021
|
2020
|
2019
|
2018
|
|||||
|
Selected Per-Share Data
|
||||||||||
|
Net asset value, beginning of period
|
$
|
12.51
|
$
|
12.61
|
$
|
12.29
|
$
|
11.56
|
$
|
12.32
|
|
Income from Investment Operations
|
||||||||||
|
Net investment income (loss)
A,B
|
.359
|
.303
|
.367
|
.412
|
.424
|
|||||
|
Net realized and unrealized gain (loss)
|
(1.764)
|
.143
|
.497
|
.818
|
(.780)
|
|||||
|
Total from investment operations
|
(1.405)
|
.446
|
.864
|
1.230
|
(.356)
|
|||||
|
Distributions from net investment income
|
(.361)
|
(.305)
|
(.386)
|
(.390)
|
(.392)
|
|||||
|
Distributions from net realized gain
|
(.014)
|
(.241)
|
(.158)
|
(.110)
|
(.012)
|
|||||
|
Total distributions
|
(.375)
|
(.546)
|
(.544)
|
(.500)
|
(.404)
|
|||||
|
Net asset value, end of period
|
$
|
10.73
|
$
|
12.51
|
$
|
12.61
|
$
|
12.29
|
$
|
11.56
|
|
Total Return
C,D
|
(11.29)%
|
3.58%
|
7.19%
|
10.74%
|
(2.95)%
|
|||||
|
Ratios to Average Net Assets
B,E,F
|
||||||||||
|
Expenses before reductions
|
.98%
|
.97%
|
.97%
|
.98%
|
.98%
|
|||||
|
Expenses net of fee waivers, if any
|
.97%
|
.96%
|
.97%
|
.97%
|
.98%
|
|||||
|
Expenses net of all reductions
|
.97%
|
.96%
|
.97%
|
.97%
|
.98%
|
|||||
|
Net investment income (loss)
|
3.18%
|
2.39%
|
3.02%
|
3.38%
|
3.52%
|
|||||
|
Supplemental Data
|
||||||||||
|
Net assets, end of period (in millions)
|
$
|
1,637
|
$
|
2,072
|
$
|
1,904
|
$
|
1,918
|
$
|
1,631
|
|
Portfolio turnover rate
G
|
69%
|
94%
|
96%
|
138%
H
|
113%
I
|
|
Fidelity Advisor® Strategic Income Fund Class M
|
|
Years ended December 31,
|
2022
|
2021
|
2020
|
2019
|
2018
|
|||||
|
Selected Per-Share Data
|
||||||||||
|
Net asset value, beginning of period
|
$
|
12.51
|
$
|
12.61
|
$
|
12.28
|
$
|
11.55
|
$
|
12.31
|
|
Income from Investment Operations
|
||||||||||
|
Net investment income (loss)
A,B
|
.360
|
.304
|
.368
|
.412
|
.424
|
|||||
|
Net realized and unrealized gain (loss)
|
(1.774)
|
.142
|
.506
|
.818
|
(.779)
|
|||||
|
Total from investment operations
|
(1.414)
|
.446
|
.874
|
1.230
|
(.355)
|
|||||
|
Distributions from net investment income
|
(.362)
|
(.305)
|
(.386)
|
(.390)
|
(.393)
|
|||||
|
Distributions from net realized gain
|
(.014)
|
(.241)
|
(.158)
|
(.110)
|
(.012)
|
|||||
|
Total distributions
|
(.376)
|
(.546)
|
(.544)
|
(.500)
|
(.405)
|
|||||
|
Net asset value, end of period
|
$
|
10.72
|
$
|
12.51
|
$
|
12.61
|
$
|
12.28
|
$
|
11.55
|
|
Total Return
C,D
|
(11.37)%
|
3.59%
|
7.29%
|
10.75%
|
(2.95)%
|
|||||
|
Ratios to Average Net Assets
B,E,F
|
||||||||||
|
Expenses before reductions
|
.97%
|
.96%
|
.96%
|
.97%
|
.98%
|
|||||
|
Expenses net of fee waivers, if any
|
.97%
|
.96%
|
.96%
|
.97%
|
.97%
|
|||||
|
Expenses net of all reductions
|
.97%
|
.96%
|
.96%
|
.97%
|
.97%
|
|||||
|
Net investment income (loss)
|
3.19%
|
2.39%
|
3.03%
|
3.39%
|
3.52%
|
|||||
|
Supplemental Data
|
||||||||||
|
Net assets, end of period (in millions)
|
$
|
630
|
$
|
797
|
$
|
792
|
$
|
806
|
$
|
755
|
|
Portfolio turnover rate
G
|
69%
|
94%
|
96%
|
138%
H
|
113%
I
|
|
Fidelity Advisor® Strategic Income Fund Class C
|
|
Years ended December 31,
|
2022
|
2021
|
2020
|
2019
|
2018
|
|||||
|
Selected Per-Share Data
|
||||||||||
|
Net asset value, beginning of period
|
$
|
12.48
|
$
|
12.58
|
$
|
12.26
|
$
|
11.53
|
$
|
12.28
|
|
Income from Investment Operations
|
||||||||||
|
Net investment income (loss)
A,B
|
.275
|
.208
|
.276
|
.320
|
.334
|
|||||
|
Net realized and unrealized gain (loss)
|
(1.765)
|
.142
|
.496
|
.818
|
(.770)
|
|||||
|
Total from investment operations
|
(1.490)
|
.350
|
.772
|
1.138
|
(.436)
|
|||||
|
Distributions from net investment income
|
(.276)
|
(.209)
|
(.294)
|
(.298)
|
(.302)
|
|||||
|
Distributions from net realized gain
|
(.014)
|
(.241)
|
(.158)
|
(.110)
|
(.012)
|
|||||
|
Total distributions
|
(.290)
|
(.450)
|
(.452)
|
(.408)
|
(.314)
|
|||||
|
Net asset value, end of period
|
$
|
10.70
|
$
|
12.48
|
$
|
12.58
|
$
|
12.26
|
$
|
11.53
|
|
Total Return
C,D
|
(11.99)%
|
2.81%
|
6.41%
|
9.94%
|
(3.60)%
|
|||||
|
Ratios to Average Net Assets
B,E,F
|
||||||||||
|
Expenses before reductions
|
1.73%
|
1.72%
|
1.72%
|
1.72%
|
1.72%
|
|||||
|
Expenses net of fee waivers, if any
|
1.73%
|
1.72%
|
1.72%
|
1.72%
|
1.72%
|
|||||
|
Expenses net of all reductions
|
1.73%
|
1.72%
|
1.72%
|
1.72%
|
1.72%
|
|||||
|
Net investment income (loss)
|
2.43%
|
1.64%
|
2.27%
|
2.63%
|
2.78%
|
|||||
|
Supplemental Data
|
||||||||||
|
Net assets, end of period (in millions)
|
$
|
222
|
$
|
354
|
$
|
572
|
$
|
678
|
$
|
1,006
|
|
Portfolio turnover rate
G
|
69%
|
94%
|
96%
|
138%
H
|
113%
I
|
|
Fidelity® Strategic Income Fund
|
|
Years ended December 31,
|
2022
|
2021
|
2020
|
2019
|
2018
A
|
|||||
|
Selected Per-Share Data
|
||||||||||
|
Net asset value, beginning of period
|
$
|
12.70
|
$
|
12.79
|
$
|
12.46
|
$
|
11.72
|
$
|
12.38
|
|
Income from Investment Operations
|
||||||||||
|
Net investment income (loss)
B,C
|
.399
|
.346
|
.410
|
.454
|
.314
|
|||||
|
Net realized and unrealized gain (loss)
|
(1.805)
|
.153
|
.504
|
.827
|
(.657)
|
|||||
|
Total from investment operations
|
(1.406)
|
.499
|
.914
|
1.281
|
(.343)
|
|||||
|
Distributions from net investment income
|
(.400)
|
(.348)
|
(.426)
|
(.431)
|
(.317)
|
|||||
|
Distributions from net realized gain
|
(.014)
|
(.241)
|
(.158)
|
(.110)
|
-
|
|||||
|
Total distributions
|
(.414)
|
(.589)
|
(.584)
|
(.541)
|
(.317)
|
|||||
|
Net asset value, end of period
|
$
|
10.88
|
$
|
12.70
|
$
|
12.79
|
$
|
12.46
|
$
|
11.72
|
|
Total Return
D,E
|
(11.14)%
|
3.96%
|
7.53%
|
11.04%
|
(2.78)%
|
|||||
|
Ratios to Average Net Assets
C,F,G
|
||||||||||
|
Expenses before reductions
|
.68%
|
.66%
|
.67%
|
.68%
|
.69%
H
|
|||||
|
Expenses net of fee waivers, if any
|
.68%
|
.66%
|
.67%
|
.68%
|
.68%
H
|
|||||
|
Expenses net of all reductions
|
.68%
|
.66%
|
.67%
|
.68%
|
.68%
H
|
|||||
|
Net investment income (loss)
|
3.48%
|
2.69%
|
3.32%
|
3.68%
|
3.64%
H
|
|||||
|
Supplemental Data
|
||||||||||
|
Net assets, end of period (in millions)
|
$
|
5,457
|
$
|
7,245
|
$
|
6,823
|
$
|
8,139
|
$
|
7,817
|
|
Portfolio turnover rate
I
|
69%
|
94%
|
96%
|
138%
J
|
113%
K
|
|
Fidelity Advisor® Strategic Income Fund Class I
|
|
Years ended December 31,
|
2022
|
2021
|
2020
|
2019
|
2018
|
|||||
|
Selected Per-Share Data
|
||||||||||
|
Net asset value, beginning of period
|
$
|
12.70
|
$
|
12.79
|
$
|
12.46
|
$
|
11.72
|
$
|
12.49
|
|
Income from Investment Operations
|
||||||||||
|
Net investment income (loss)
A,B
|
.394
|
.340
|
.404
|
.449
|
.458
|
|||||
|
Net realized and unrealized gain (loss)
|
(1.805)
|
.153
|
.505
|
.827
|
(.789)
|
|||||
|
Total from investment operations
|
(1.411)
|
.493
|
.909
|
1.276
|
(.331)
|
|||||
|
Distributions from net investment income
|
(.395)
|
(.342)
|
(.421)
|
(.426)
|
(.427)
|
|||||
|
Distributions from net realized gain
|
(.014)
|
(.241)
|
(.158)
|
(.110)
|
(.012)
|
|||||
|
Total distributions
|
(.409)
|
(.583)
|
(.579)
|
(.536)
|
(.439)
|
|||||
|
Net asset value, end of period
|
$
|
10.88
|
$
|
12.70
|
$
|
12.79
|
$
|
12.46
|
$
|
11.72
|
|
Total Return
C
|
(11.18)%
|
3.91%
|
7.48%
|
11.00%
|
(2.71)%
|
|||||
|
Ratios to Average Net Assets
B,D,E
|
||||||||||
|
Expenses before reductions
|
.72%
|
.71%
|
.71%
|
.72%
|
.73%
|
|||||
|
Expenses net of fee waivers, if any
|
.72%
|
.71%
|
.71%
|
.72%
|
.73%
|
|||||
|
Expenses net of all reductions
|
.72%
|
.71%
|
.71%
|
.72%
|
.73%
|
|||||
|
Net investment income (loss)
|
3.44%
|
2.64%
|
3.28%
|
3.64%
|
3.76%
|
|||||
|
Supplemental Data
|
||||||||||
|
Net assets, end of period (in millions)
|
$
|
3,986
|
$
|
5,460
|
$
|
4,890
|
$
|
4,899
|
$
|
4,831
|
|
Portfolio turnover rate
F
|
69%
|
94%
|
96%
|
138%
G
|
113%
H
|
|
Fidelity Advisor® Strategic Income Fund Class Z
|
|
Years ended December 31,
|
2022
|
2021
|
2020
|
2019
|
2018
A
|
|||||
|
Selected Per-Share Data
|
||||||||||
|
Net asset value, beginning of period
|
$
|
12.70
|
$
|
12.80
|
$
|
12.47
|
$
|
11.72
|
$
|
12.17
|
|
Income from Investment Operations
|
||||||||||
|
Net investment income (loss)
B,C
|
.405
|
.352
|
.417
|
.461
|
.119
|
|||||
|
Net realized and unrealized gain (loss)
|
(1.794)
|
.143
|
.504
|
.837
|
(.437)
|
|||||
|
Total from investment operations
|
(1.389)
|
.495
|
.921
|
1.298
|
(.318)
|
|||||
|
Distributions from net investment income
|
(.407)
|
(.354)
|
(.433)
|
(.438)
|
(.132)
|
|||||
|
Distributions from net realized gain
|
(.014)
|
(.241)
|
(.158)
|
(.110)
|
-
|
|||||
|
Total distributions
|
(.421)
|
(.595)
|
(.591)
|
(.548)
|
(.132)
|
|||||
|
Net asset value, end of period
|
$
|
10.89
|
$
|
12.70
|
$
|
12.80
|
$
|
12.47
|
$
|
11.72
|
|
Total Return
D,E
|
(11.00)%
|
3.92%
|
7.59%
|
11.19%
|
(2.62)%
|
|||||
|
Ratios to Average Net Assets
C,F,G
|
||||||||||
|
Expenses before reductions
|
.62%
|
.61%
|
.61%
|
.62%
|
.62%
H
|
|||||
|
Expenses net of fee waivers, if any
|
.62%
|
.61%
|
.61%
|
.62%
|
.62%
H
|
|||||
|
Expenses net of all reductions
|
.62%
|
.61%
|
.61%
|
.62%
|
.62%
H
|
|||||
|
Net investment income (loss)
|
3.54%
|
2.74%
|
3.38%
|
3.74%
|
3.95%
H
|
|||||
|
Supplemental Data
|
||||||||||
|
Net assets, end of period (in millions)
|
$
|
902
|
$
|
1,058
|
$
|
662
|
$
|
587
|
$
|
166
|
|
Portfolio turnover rate
I
|
69%
|
94%
|
96%
|
138%
J
|
113%
K
|
|
Fidelity Central Fund
|
Investment Manager
|
Investment Objective
|
Investment Practices
|
Expense Ratio
A
|
|
Fidelity Emerging Markets Debt Central Fund
|
Fidelity Management & Research Company LLC (FMR)
|
Seeks high total return by normally investing in debt securities of issuers in emerging markets and other debt investments that are tied economically to emerging markets.
|
Foreign Securities
Restricted Securities
|
Less than .005%
|
|
Fidelity Floating Rate Central Fund
|
Fidelity Management & Research Company LLC (FMR)
|
Seeks a high level of income by normally investing in floating rate loans and other floating rate securities.
|
Foreign Securities
Loans & Direct Debt Instruments
Restricted Securities
|
Less than .005%
|
|
Fidelity Money Market Central Funds
|
Fidelity Management & Research Company LLC (FMR)
|
Each fund seeks to obtain a high level of current income consistent with the preservation of capital and liquidity.
|
Short-term Investments
|
Less than .005%
|
|
Fidelity Advisor Strategic Income Fund
|
$104
|
|
Gross unrealized appreciation
|
$253,135
|
|
Gross unrealized depreciation
|
(1,729,843)
|
|
Net unrealized appreciation (depreciation)
|
$(1,476,708)
|
|
Tax Cost
|
$14,462,311
|
|
Capital loss carryforward
|
$(248,582)
|
|
Net unrealized appreciation (depreciation) on securities and other investments
|
$(1,476,627)
|
|
Short-term
|
$(248,582)
|
|
|
December 31, 2022
|
December 31, 2021
|
|
Ordinary Income
|
$492,380
|
$543,787
|
|
Long-term Capital Gains
|
18,777
|
197,897
|
|
Total
|
$511,157
|
$741,684
|
|
Foreign Exchange Risk
|
Foreign exchange rate risk relates to fluctuations in the value of an asset or liability due to changes in currency exchange rates.
|
|
Interest Rate Risk
|
Interest rate risk relates to the fluctuations in the value of interest-bearing securities due to changes in the prevailing levels of market interest rates.
|
|
Primary Risk Exposure / Derivative Type
|
Net Realized Gain (Loss)
|
Change in Net Unrealized Appreciation (Depreciation)
|
|
Fidelity Advisor Strategic Income Fund
|
|
|
|
Foreign Exchange Risk
|
|
|
|
Forward Foreign Currency Contracts
|
$113,251
|
$(25,357)
|
|
Total Foreign Exchange Risk
|
113,251
|
(25,357)
|
|
Interest Rate Risk
|
|
|
|
Futures Contracts
|
(224,713)
|
(3,309)
|
|
Total Interest Rate Risk
|
$(224,713)
|
$(3,309)
|
|
Totals
|
$(111,462)
|
$(28,666)
|
|
|
Purchases ($)
|
Sales ($)
|
|
Fidelity Advisor Strategic Income Fund
|
5,463,554
|
7,299,520
|
|
|
Distribution Fee
|
Service Fee
|
Total Fees
|
Retained by FDC
|
|
Class A
|
- %
|
.25%
|
$4,519
|
$87
|
|
Class M
|
- %
|
.25%
|
1,729
|
15
|
|
Class C
|
.75%
|
.25%
|
2,788
|
303
|
|
|
|
|
$9,036
|
$405
|
|
|
Retained by FDC
|
|
Class A
|
$85
|
|
Class M
|
11
|
|
Class C
A
|
10
|
|
|
$106
|
|
|
Amount
|
% of Class-Level Average Net Assets
|
|
Class A
|
$2,820
|
.16
|
|
Class M
|
1,029
|
.15
|
|
Class C
|
448
|
.16
|
|
Fidelity Strategic Income Fund
|
6,636
|
.11
|
|
Class I
|
7,042
|
.15
|
|
Class Z
|
475
|
.05
|
|
|
$18,450
|
|
|
|
% of Average Net Assets
|
|
Fidelity Advisor Strategic Income Fund
|
.01
|
|
|
Amount
|
|
Fidelity Advisor Strategic Income Fund
|
$4
|
|
|
Purchases ($)
|
Sales ($)
|
Realized Gain (Loss) ($)
|
|
Fidelity Advisor Strategic Income Fund
|
12,193
|
17,812
|
4,204
|
|
|
Amount ($)
|
|
Fidelity Advisor Strategic Income Fund
|
6
|
|
|
Amount
|
|
Fidelity Advisor Strategic Income Fund
|
$26
|
|
|
Total Security Lending Fees Paid to NFS
|
Security Lending Income From Securities Loaned to NFS
|
Value of Securities Loaned to NFS at Period End
|
|
Fidelity Advisor Strategic Income Fund
|
$72
|
$-
|
$-
|
|
|
Year ended December 31, 2022
|
Year ended
December 31, 2021
|
|
Fidelity Advisor Strategic Income Fund
|
|
|
|
Distributions to shareholders
|
|
|
|
Class A
|
$59,799
|
$87,743
|
|
Class M
|
22,910
|
34,319
|
|
Class C
|
6,975
|
14,402
|
|
Fidelity Strategic Income Fund
|
223,432
|
326,888
|
|
Class I
|
163,110
|
236,348
|
|
Class Z
|
34,931
|
41,984
|
|
Total
|
$511,157
|
$741,684
|
|
|
Shares
|
Shares
|
Dollars
|
Dollars
|
|
|
Year ended December 31, 2022
|
Year ended December 31, 2021
|
Year ended December 31, 2022
|
Year ended December 31, 2021
|
|
Fidelity Advisor Strategic Income Fund
|
|
|
|
|
|
Class A
|
|
|
|
|
|
Shares sold
|
15,973
|
38,813
|
$181,883
|
$492,042
|
|
Reinvestment of distributions
|
5,118
|
6,639
|
57,068
|
83,673
|
|
Shares redeemed
|
(34,081)
|
(30,768)
|
(383,022)
|
(390,153)
|
|
Net increase (decrease)
|
(12,990)
|
14,684
|
$(144,071)
|
$185,562
|
|
Class M
|
|
|
|
|
|
Shares sold
|
4,863
|
8,510
|
$55,925
|
$107,780
|
|
Reinvestment of distributions
|
2,014
|
2,673
|
22,441
|
33,668
|
|
Shares redeemed
|
(11,838)
|
(10,318)
|
(133,831)
|
(130,794)
|
|
Net increase (decrease)
|
(4,961)
|
865
|
$(55,465)
|
$10,654
|
|
Class C
|
|
|
|
|
|
Shares sold
|
2,460
|
5,044
|
$28,121
|
$63,776
|
|
Reinvestment of distributions
|
608
|
1,114
|
6,768
|
13,990
|
|
Shares redeemed
|
(10,660)
|
(23,285)
|
(119,724)
|
(294,235)
|
|
Net increase (decrease)
|
(7,592)
|
(17,127)
|
$(84,835)
|
$(216,469)
|
|
Fidelity Strategic Income Fund
|
|
|
|
|
|
Shares sold
|
90,824
|
125,347
|
$1,045,620
|
$1,613,497
|
|
Reinvestment of distributions
|
17,550
|
22,959
|
198,721
|
293,601
|
|
Shares redeemed
|
(177,632)
|
(110,939)
|
(2,014,058)
|
(1,427,465)
|
|
Net increase (decrease)
|
(69,258)
|
37,367
|
$(769,717)
|
$479,633
|
|
Class I
|
|
|
|
|
|
Shares sold
|
116,342
|
143,221
|
$1,352,927
|
$1,842,147
|
|
Reinvestment of distributions
|
13,623
|
17,372
|
154,401
|
222,130
|
|
Shares redeemed
|
(193,764)
|
(112,697)
|
(2,218,101)
|
(1,448,940)
|
|
Net increase (decrease)
|
(63,799)
|
47,896
|
$(710,773)
|
$615,337
|
|
Class Z
|
|
|
|
|
|
Shares sold
|
34,259
|
41,820
|
$393,604
|
$539,424
|
|
Reinvestment of distributions
|
2,610
|
2,771
|
29,544
|
35,442
|
|
Shares redeemed
|
(37,338)
|
(13,034)
|
(427,072)
|
(167,460)
|
|
Net increase (decrease)
|
(469)
|
31,557
|
$(3,924)
|
$407,406
|
|
The Example is based on an investment of $1,000 invested at the beginning of the period and held for the entire period (July 1, 2022 to December 31, 2022).
|
|
Annualized Expense Ratio-
A
|
Beginning Account Value July 1, 2022
|
Ending Account Value December 31, 2022
|
Expenses Paid During Period-
C
July 1, 2022 to December 31, 2022
|
|||||||
|
Fidelity Advisor® Strategic Income Fund
|
||||||||||
|
Class A
|
.97%
|
|||||||||
|
Actual
|
$ 1,000
|
$ 1,007.00
|
$ 4.91
|
|||||||
|
Hypothetical-
B
|
$ 1,000
|
$ 1,020.32
|
$ 4.94
|
|||||||
|
Class M
|
.96%
|
|||||||||
|
Actual
|
$ 1,000
|
$ 1,007.00
|
$ 4.86
|
|||||||
|
Hypothetical-
B
|
$ 1,000
|
$ 1,020.37
|
$ 4.89
|
|||||||
|
Class C
|
1.72%
|
|||||||||
|
Actual
|
$ 1,000
|
$ 1,003.10
|
$ 8.68
|
|||||||
|
Hypothetical-
B
|
$ 1,000
|
$ 1,016.53
|
$ 8.74
|
|||||||
|
Fidelity® Strategic Income Fund
|
.67%
|
|||||||||
|
Actual
|
$ 1,000
|
$ 1,007.70
|
$ 3.39
|
|||||||
|
Hypothetical-
B
|
$ 1,000
|
$ 1,021.83
|
$ 3.41
|
|||||||
|
Class I
|
.72%
|
|||||||||
|
Actual
|
$ 1,000
|
$ 1,007.50
|
$ 3.64
|
|||||||
|
Hypothetical-
B
|
$ 1,000
|
$ 1,021.58
|
$ 3.67
|
|||||||
|
Class Z
|
.62%
|
|||||||||
|
Actual
|
$ 1,000
|
$ 1,008.90
|
$ 3.14
|
|||||||
|
Hypothetical-
B
|
$ 1,000
|
$ 1,022.08
|
$ 3.16
|
|||||||

|
|
Item 2.
Code of Ethics
As of the end of the period, December 31, 2022, Fidelity Advisor Series II (the trust) has adopted a code of ethics, as defined in Item 2 of Form N-CSR, that applies to its President and Treasurer and its Chief Financial Officer. A copy of the code of ethics is filed as an exhibit to this Form N-CSR.
Item 3.
Audit Committee Financial Expert
The Board of Trustees of the trust has determined that Elizabeth S. Acton is an audit committee financial expert, as defined in Item 3 of Form N-CSR. Ms. Acton is independent for purposes of Item 3 of Form N-CSR.
Item 4.
Principal Accountant Fees and Services
Fees and Services
The following table presents fees billed by Deloitte & Touche LLP, the member firms of Deloitte Touche Tohmatsu, and their respective affiliates (collectively, “Deloitte Entities”) in each of the last two fiscal years for services rendered to Fidelity Advisor Strategic Income Fund (the “Fund”):
Services Billed by Deloitte Entities
December 31, 2022 FeesA
| |
Audit Fees |
Audit-Related Fees |
Tax Fees |
All Other Fees |
| Fidelity Advisor Strategic Income Fund |
$100,900 |
$- |
$9,300 |
$2,200 |
December 31, 2021 FeesA
| |
Audit Fees |
Audit-Related Fees |
Tax Fees |
All Other Fees |
| Fidelity Advisor Strategic Income Fund |
$100,200 |
$- |
$9,300 |
$2,200 |
A Amounts may reflect rounding.
The following table(s) present(s) fees billed by Deloitte Entities that were required to be approved by the Audit Committee for services that relate directly to the operations and financial reporting of the Fund(s) and that are rendered on behalf of Fidelity Management & Research Company LLC ("FMR") and entities controlling, controlled by, or under
common control with FMR (not including any sub-adviser whose role is primarily portfolio management and is subcontracted with or overseen by another investment adviser) that provide ongoing services to the Fund(s) (“Fund Service Providers”):
Services Billed by Deloitte Entities
| |
December 31, 2022A |
December 31, 2021A |
| Audit-Related Fees |
$- |
$- |
| Tax Fees |
$- |
$- |
| All Other Fees |
$- |
$- |
A Amounts may reflect rounding.
“Audit-Related Fees” represent fees billed for assurance and related services that are reasonably related to the performance of the fund audit or the review of the fund's financial statements and that are not reported under Audit Fees.
“Tax Fees” represent fees billed for tax compliance, tax advice or tax planning that relate directly to the operations and financial reporting of the fund.
“All Other Fees” represent fees billed for services provided to the fund or Fund Service Provider, a significant portion of which are assurance related, that relate directly to the operations and financial reporting of the fund, excluding those services that are reported under Audit Fees, Audit-Related Fees or Tax Fees.
Assurance services must be performed by an independent public accountant.
* * *
The aggregate non-audit fees billed by Deloitte Entities for services rendered to the Fund(s), FMR (not including any sub-adviser whose role is primarily portfolio management and is subcontracted with or overseen by another investment adviser), and any Fund Service Provider for each of the last two fiscal years of the Fund(s) are as follows:
| Billed By |
December 31, 2022A |
December 31, 2021A |
| Deloitte Entities |
$469,100 |
$533,100 |
A Amounts may reflect rounding.
The trust's Audit Committee has considered non-audit services that were not pre-approved that were provided by Deloitte Entities to Fund Service Providers to be compatible with maintaining the independence of Deloitte Entities in its(their) audit of
the Fund(s), taking into account representations from Deloitte Entities, in accordance with Public Company Accounting Oversight Board rules, regarding its independence from the Fund(s) and its(their) related entities and FMR’s review of the appropriateness and permissibility under applicable law of such non-audit services prior to their provision to the Fund(s) Service Providers.
Audit Committee Pre-Approval Policies and Procedures
The trust’s Audit Committee must pre-approve all audit and non-audit services provided by a fund’s independent registered public accounting firm relating to the operations or financial reporting of the fund. Prior to the commencement of any audit or non-audit services to a fund, the Audit Committee reviews the services to determine whether they are appropriate and permissible under applicable law.
The Audit Committee has adopted policies and procedures to, among other purposes, provide a framework for the Committee’s consideration of non-audit services by the audit firms that audit the Fidelity funds. The policies and procedures require that any non-audit service provided by a fund audit firm to a Fidelity fund and any non-audit service provided by a fund auditor to a Fund Service Provider that relates directly to the operations and financial reporting of a Fidelity fund (“Covered Service”) are subject to approval by the Audit Committee before such service is provided.
All Covered Services must be approved in advance of provision of the service either: (i) by formal resolution of the Audit Committee, or (ii) by oral or written approval of the service by the Chair of the Audit Committee (or if the Chair is unavailable, such other member of the Audit Committee as may be designated by the Chair to act in the Chair’s absence). The approval contemplated by (ii) above is permitted where the Treasurer determines that action on such an engagement is necessary before the next meeting of the Audit Committee.
Non-audit services provided by a fund audit firm to a Fund Service Provider that do not relate directly to the operations and financial reporting of a Fidelity fund are reported to the Audit Committee periodically.
Non-Audit Services Approved Pursuant to Rule 2-01(c)(7)(i)(C) and (ii) of Regulation S-X (“De Minimis Exception”)
There were no non-audit services approved or required to be approved by the Audit Committee pursuant to the De Minimis Exception during the Fund’s(s’) last two fiscal years relating to services provided to (i) the Fund(s) or (ii) any Fund Service Provider that relate directly to the operations and financial reporting of the Fund(s).
Item 5.
Audit Committee of Listed Registrants
Not applicable.
Item 6.
Investments
(a)
Not applicable.
(b)
Not applicable.
Item 7.
Disclosure of Proxy Voting Policies and Procedures for Closed-End Management Investment Companies
Not applicable.
Item 8.
Portfolio Managers of Closed-End Management Investment Companies
Not applicable.
Item 9.
Purchase of Equity Securities by Closed-End Management Investment Company and Affiliated Purchasers
Not applicable.
Item 10.
Submission of Matters to a Vote of Security Holders
There were no material changes to the procedures by which shareholders may recommend nominees to the trust’s Board of Trustees.
Item 11.
Controls and Procedures
(a)(i) The President and Treasurer and the Chief Financial Officer have concluded that the trust’s disclosure controls and procedures (as defined in Rule 30a-3(c) under the Investment Company Act) provide reasonable assurances that material information relating to the trust is made known to them by the appropriate persons, based on their evaluation of these controls and procedures as of a date within 90 days of the filing date of this report.
(a)(ii) There was no change in the trust’s internal control over financial reporting (as defined in Rule 30a-3(d) under the Investment Company Act) that occurred during the period covered by this report that has materially affected, or is reasonably likely to materially affect, the trust’s internal control over financial reporting.
Item 12.
Disclosure of Securities Lending Activities for Closed-End Management
Investment Companies
Not applicable.
Item 13.
Exhibits
| (a) |
(1) |
Code of Ethics pursuant to Item 2 of Form N-CSR is filed and attached hereto as EX-99.CODE ETH. |
| (a) |
(2) |
|
| (a) |
(3) |
Not applicable. |
| (b) |
|
SIGNATURES
Pursuant to the requirements of the Securities Exchange Act of 1934 and the Investment Company Act of 1940, the registrant has duly caused this report to be signed on its behalf by the undersigned, thereunto duly authorized.
Fidelity Advisor Series II
| By: |
/s/Laura M. Del Prato |
| |
Laura M. Del Prato |
| |
President and Treasurer |
| |
|
| Date: |
February 21, 2023 |
Pursuant to the requirements of the Securities Exchange Act of 1934 and the Investment Company Act of 1940, this report has been signed below by the following persons on behalf of the registrant and in the capacities and on the dates indicated.
| By: |
/s/Laura M. Del Prato |
| |
Laura M. Del Prato |
| |
President and Treasurer |
| |
|
| Date: |
February 21, 2023 |
| By: |
/s/John J. Burke III |
| |
John J. Burke III |
| |
Chief Financial Officer |
| |
|
| Date: |
February 21, 2023 |