UNITED STATES
SECURITIES AND EXCHANGE COMMISSION
WASHINGTON, D.C. 20549
FORM 10-K
☒ ANNUAL REPORT PURSUANT TO SECTION 13 OR 15(d) OF THE SECURITIES EXCHANGE ACT OF 1934
FOR THE FISCAL YEAR ENDED FEBRUARY 1, 2020
OR
TRANSITION REPORT PURSUANT TO SECTION 13 OR 15(d) OF THE SECURITIES EXCHANGE ACT
FOR THE TRANSITION PERIOD FROM ………… TO …………
COMMISSION FILE NUMBER: 0-14818
TRANS WORLD ENTERTAINMENT CORPORATION
(Exact name of registrant as specified in its charter)
|
New York
|
14-1541629
|
|
|
State or Other Jurisdiction of Incorporation or Organization
|
I.R.S. Employer Identification No.
|
|
|
2818 N. Sullivan Rd. Ste 30
Spokane, WA 99216
|
12203
|
|
|
Address of Principal Executive Offices
|
Zip Code
|
(855) 300-2710
Registrant’s Telephone Number, Including Area Code
Former Name, Former Address and Former Fiscal Year, if Changed Since Last Report
38 Corporate Circle
Albany, NY 12203
Securities registered pursuant to Section 12(b) of the Act:
|
Title of each class
|
Trading Symbol(s)
|
Name of each exchange on which registered
|
|
Common Stock, $.01 par value per share
|
TWMC
|
NASDAQ Stock Market
|
Indicate by check mark if the registrant is a well-known seasoned issuer, as defined in Rule 405 of the Securities Act. Yes ☐ No ☒
Indicate by check mark if the registrant is not required to file reports pursuant to Section 13 or Section 15(d) of the Act. Yes ☐ No ☒
Indicate by check mark whether the registrant (1) has filed all reports required to be filed by Section 13 or 15(d) of the Securities Exchange Act of 1934 during the preceding 12
months (or for such shorter period that the registrant was required to file such reports), and (2) has been subject to such filing requirements for the past 90 days. Yes ☒ No ☐
Indicate by check mark whether the registrant has submitted electronically every Interactive Data File required to be submitted pursuant to Rule 405 of Regulation S-T (§ 232.405
of this chapter) during the preceding 12 months (or for such shorter period that the registrant was required to submit such files). Yes ☒ No ☐
Indicate by check mark whether the registrant is a large accelerated filer, an accelerated filer, a non-accelerated filer, smaller reporting company, or an emerging growth
company. See the definitions of “large accelerated filer,” “accelerated filer,” “smaller reporting company,” and “emerging growth company” in Rule 12b-2 of the Exchange Act.
|
Large accelerated filer ☐
|
Accelerated filer ☐
|
|
Non-accelerated filer ☒
|
Smaller reporting company ☒
|
|
Emerging growth company ☐
|
If an emerging growth company, indicate by check mark if the registrant has elected not to use the extended transition period for complying with any new or revised financial
accounting standards provided pursuant to Section 13(a) of the Exchange Act. ☐
Indicate by check mark whether the registrant is a shell company (as defined in Rule 12b-2 of the Act). Yes ☐ No ☒
As of August 2, 2019, the last business day of the Company’s most recently completed second fiscal quarter, 1,816,061 shares of the Registrant’s Common Stock were issued and outstanding. The aggregate market value of
the voting stock held by non-affiliates of the Registrant, based upon the closing sale price of the Registrant’s Common Stock on August 2, 2019, was $10,569,475. As of May 29, 2020, there
were 1,825,198 shares of Common Stock issued and outstanding.
APPLICABLE ONLY TO ISSUERS INVOLVED IN BANKRUPTCY PROCEEDINGS DURING THE PRECEDING FIVE YEARS:
Indicate by check mark whether the registrant has filed all documents and reports required to be filed by Section 12, 13 or 15(d) of the Securities Exchange Act of 1934
subsequent to the distribution of securities under a plan confirmed by a court. Yes ☐ No ☐
DOCUMENTS INCORPORATED BY REFERENCE:
None.
PART I
Cautionary Statement for Purposes of the “Safe Harbor” Provisions of the Private Securities Litigation Reform Act of 1995
This document includes forward-looking statements within the meaning of the Private Securities Litigation Reform Act of 1995. These statements relate to analyses and other information that are based on forecasts of future results and estimates of
amounts not yet determinable. These statements also relate to the Trans World Entertainment Corporation’s (“the Company’s”) future prospects, developments and business strategies. The statements contained in this document that are not statements of
historical fact may include forward-looking statements that involve a number of risks and uncertainties.
We have used the words “anticipate”, “believe”, “could”, “estimate”, “expect”, “intend”, “may”, “plan”, “predict”, “project”, and similar terms and phrases, including references to assumptions, in this document to identify forward-looking
statements. These forward-looking statements are made based on management’s expectations and beliefs concerning future events and are subject to uncertainties and factors relating to our operations and business environment, all of which are
difficult to predict and many of which are beyond the Company’s control, that could cause actual results to differ materially from those matters expressed in or implied by these forward-looking statements. The following factors are among those that
may cause actual results to differ materially from the Company’s forward-looking statements.
|
• continued operating losses;
• impact of the novel coronavirus identified as “COVID-19” on our business and operating results;
• the ability of the Company to satisfy its liabilities and to continue as a going concern;
• our ability to realize the benefits of recent divestitures;
• maintaining etailz’s segment relationship with Amazon;
• decline in the Company’s stock price;
• the limited public float and trading volume for our Common Stock;
• new product introductions;
• advancements in technology;
• dependence on key employees, the ability to hire new employees and pay competitive wages;
|
• the Company’s level of debt and related restrictions and limitations;
• future cash flows;
• vendor terms;
• interest rate fluctuations;
• access to third party digital marketplaces;
• adverse publicity;
• product liability claims;
• changes in laws and regulations;
• breach of data security;
• increase in Amazon Marketplace fulfillment and storage fees;
• the other matters set forth under Item 1A “Risk Factors,” Item 7 “Management’s Discussion and Analysis of Financial
Condition and Results of Operations”, and other sections of this Annual Report on Form 10-K
|
The reader should keep in mind that any forward-looking statement made by us in this document, or elsewhere, pertains only as of the date on which we make it. New risks and uncertainties come up from time-to-time and it is impossible for us to
predict these events or how they may affect us. In light of these risks and uncertainties, you should keep in mind that any forward-looking statements made in this report or elsewhere might not occur.
1
In addition, the preparation of financial statements in accordance with accounting principles generally accepted in the United States (“GAAP”) requires us to make estimates and assumptions. These estimates and assumptions affect:
| • |
the reported amounts and timing of revenue and expenses,
|
| • |
the reported amounts and classification of assets and liabilities, and
|
| • |
the disclosure of contingent assets and liabilities.
|
Actual results may vary from our estimates and assumptions. These estimates and assumptions are based on historical results, assumptions that we make, as well as assumptions by third parties.
Reverse Stock Split
On August 15, 2019, we completed a 1-for-20 reverse stock split of our outstanding Common Stock. As a result of this stock split, our issued and outstanding Common Stock decreased from 36,291,620 to 1,814,581 shares.
Accordingly, all share and per share information contained in this report has been restated to retroactively show the effect of this stock split.
| Item 1. |
BUSINESS
|
Company Background
Trans World Entertainment Corporation, which, together with its consolidated subsidiaries, is referred to herein as the “Company”, “we”, “us” and “our”, was incorporated in New York in 1972. We own 100% of the outstanding Common Stock of Trans
World NY Sub, Inc. (f/k/a Record Town, Inc.) and etailz, Inc. See below for additional information.
Our Reportable Segments
During 2019, the Company operated our business in two segments:
etailz Segment (“etailz”)
etailz provides a platform of software and services to empower brands to grow their online distribution channels on digital marketplaces such as Amazon, Walmart, eBay, among others. The Company helps brands achieve their online retail goals
through its innovative and proprietary technology, tailored strategies and mutually beneficial partnerships.
For Your Entertainment Segment (“fye”)
The fye segment operates retail stores and two e-commerce sites selling entertainment products, including trend, video, music, electronics and related products in the United States.
As of February 1, 2020, the fye segment operated 200 stores primarily in malls totaling approximately 1.1 million square feet in the United States, the District of Columbia and the U.S. Virgin Islands predominantly
under the For Your Entertainment brand.
The fye segment operates two retail web sites, www.fye.com and www.secondspin.com. fye.com carries entertainment products, including trend, video, music,
electronics and related products. SecondSpin.com is a leading seller of used CDs, DVDs, and Blu-Ray online and carries one of the largest catalogs of used media available online.
On February 20, 2020, the Company consummated the sale of substantially all of the assets and certain of the liabilities relating to fye to a subsidiary of 2428391 Ontario Inc. o/a Sunrise Records (“Sunrise Records”) pursuant to an Asset Purchase
Agreement (as amended, the “Asset Purchase Agreement”) dated January 23, 2020, by and among the Company, Record Town, Inc., Record Town USA LLC, Record Town Utah LLC, Trans World FL LLC, Trans World New York, LLC, 2428392 Inc., and Sunrise Records.
(the “FYE Transaction”).
2
All of our financial information for fiscal 2019 includes the fye segment. For pro forma information, see Note 13 of the Notes to the Consolidated Financial Statements.
Business Overview
etailz Segment
etailz provides a platform of software and services to empower brands to grow their online distribution channel on digital marketplaces such as Amazon, Walmart, and eBay, among others. etailz empowers brands to achieve their online retail goals
through its innovative, proprietary technology, tailored strategies and mutually beneficial partnerships.
etailz is positioning itself to be a brand’s ultimate online growth partner and are guided by six core principles:
| Partner Obsession |
Insights Driven
|
| Simplicity |
Innovation
|
| Results | Ownership |
A high-level overview of the etailz platform is shown in Figure 1.
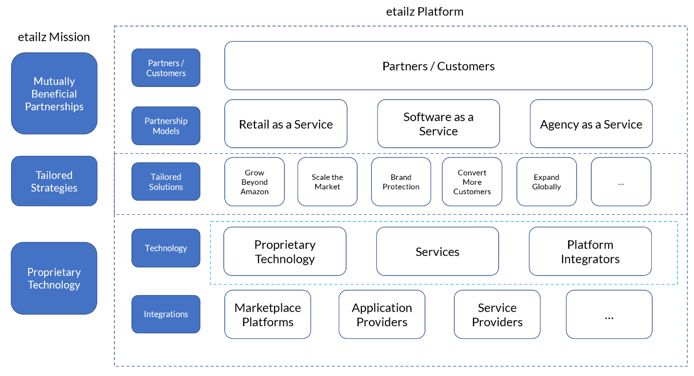
Figure 1: etailz platform of products and services
3
Partners
etailz’s partners include brands, suppliers, distributors, liquidators, and affiliates such as venture capital firms and marketing agencies. At the end of fiscal 2019 and following its vendor rationalization effort,
etailz had 1,039 partners.
Tailored Solutions
etailz’s customizable solutions for its partners include, but are not limited to, scaling the market, growing beyond Amazon, protecting a brand, expanding globally, converting more customers, and launching new products. etailz uses its platform to
customize solutions to cater to partner needs.
Partnership Models
etailz works with partners in three different partnership models:
Retail as a Service: In this model, etailz buys inventory and sells it on marketplaces such as Amazon, Walmart and eBay as a third-party seller. Additionally, etailz
supports dropship integrations with various suppliers and distributors and incubates its own brands. At the end of fiscal 2019, etailz had a total of 6 incubated brands – Jump Off Joe, Brilliant Bee, Big Betty, Domestic Corner, Coy Beauty and Keto.
In Retail as a Service, etailz’ business model is the same as that of a wholesale retailer.
Agency as a Service: In this model, etailz serves as an extension of a partner’s e-commerce team providing full service and managed services in the areas of inventory
management, marketing management, creative, brand control, tax, compliance and other marketplace growth services. etailz charges a subscription fee and receives a percentage of the revenue generated.
Software as a Service: In this model, etailz provides partners access to software through its platform of proprietary technology to empower partners to self-manage their
marketplace channel. etailz charges a subscription fee and receives a percentage of the transaction.
By offering a platform of software and services, etailz intends to diversify its risk and leverage its assets to capture more market share.
The “Agency as a Service” and “Software as a Service” models are collectively called “Subscriptions.”
Technology and Integrations
etailz’s marketplace growth platform of software and services is a one stop shop insights driven platform across the categories of brand protection, logistics, inventory management, pricing, digital marketing, creative, tax and compliance among
others, all accessible through a centralized portal. The platform has been developed over a period of 12 years and over $800 million in revenue has been processed through the platform.
The platform uses an insight driven approach to digital marketplace retailing using proprietary software. Using data collected from marketplaces, optimal inventory thresholds and purchasing trends are calculated within its advanced inventory
management software developed in-house. etailz also has proprietary software related to pricing, advertisement management, marketplace seller tracking and channel auditing.
Additionally, the platform can be extended to various software and service providers, thereby enabling a network of partner integrations. As of January 31, 2019, etailz had formed a strategic partnership with third party logistics provider,
Deliverr and tax provider – TaxCloud. In 2020, etailz intends to expand this to companies: MyFBAPrep and VantageBP among others.
The platform lends itself to network effects. The more partners etailz has on its platform, the more data and insights it can collect. The more insights it gets, more products and services it can serve its partners and more marketplace
integrations it can support. The more marketplace providers that can be integrated, the more partners etailz can acquire. This facilitates rapid scale.
4
Business Environment
Digital marketplaces allow consumers to shop from a variety of merchants in one place and have become an integral part of many brand manufacturers’ businesses.
In the US, total estimated e-commerce sales for 2020 are projected at $604 billion, an increase of 9% from 2019. e-commerce sales in 2019 accounted for 11% of total retail sales as compared to 10% of total retail sales for 2018. Top marketplaces
in the US include Amazon.com (2.3 billion visits per month), eBay.com (600 million visits per month) and Walmart.com (450 million visits per month). In 2019, Amazon represented 47% of U.S. retail e-commerce sales. Amazon’s third-party business is
growing faster than its first party business . As of 2019, the compound annual growth rate for Amazon’s third-party business was 52%, compared to 25% for its retail business.
There are several drivers of this growth including consumer preference for convenience, selection, personalization, opportunities, the ability to price compare, and delivery speed that are only found via e-commerce.
Globally, e-commerce sales are growing faster than physical store sales. According to global retail e-commerce statistics, e-commerce sales are projected to grow to $6.5 trillion, or 22% of total retail, by 2023 from $3.5 trillion in 2019, or 14.1
of total retail. At the end of 2019, China represented 54% of total global e-commerce sales, followed by the US at 16% and United Kingdom at 4%.
Globally, etailz sells on marketplaces in the United States (amazon.com, walmart.com, ebay.com, google.com, sears.com, jet.com, pricefalls.com, overstock.com, and wish.com ), the United Kingdom (amazon.uk), Germany (amazon.de) Canada (amazon.ca)
and India (amazon.in). In 2020, etailz intends to expand its selling to marketplaces in Japan and Mexico.
Competition and Strategic Positioning
etailz operates in a category within e-commerce called “Marketplace Growth Software and Services”. Businesses in this category provide services to brands and other sellers to facilitate growth on marketplaces. The market is very fragmented, and
most providers are focused on a few focus areas where sellers have support needs. Subcategories in this market include: Account and Marketing Services, Supply Chain and Logistics Providers, Manufacturers and Product Suppliers, Legal Services and
Accounting, Tax and Financial Services. In the Account and Marketing Services subcategory, services are further divided into retail services, agency services and software services. This is analogous to etailz’s business models – Retail as a Service,
Agency as a Service and Software as a Service.
etailz positions itself as a comprehensive and fully customizable platform of software and services tailored towards online marketplace growth. etailz’s core focus is on the Account and Marketing Services subcategory and competes in this
subcategory with Software Providers, Agencies and Retailers.
Revenue Distribution
etailz’s primary source of revenue is through its “Retail as a Service” business, specifically as a third-party seller on the Amazon US marketplace (96% of net revenue in fiscal 2019). The remaining revenue is generated from other marketplaces
including Amazon International, Walmart and eBay.
Approximately 66% of total etailz’s revenue in fiscal 2019 was generated by four major categories: health & personal care; home/kitchen/grocery; tools/office/outdoor; and pets & sporting goods.
5
In October 2019, etailz put increased focus on its subscription business (“Agency as a Service” and “Software as a Service”). As of January 31, 2020, the total number of subscription partners was 31 generating less
than 1% of net revenue in fiscal 2019. etailz expects continued growth in the subscription business in fiscal 2020.
Employees
As of February 1, 2020, etailz employed approximately 155 people, of whom approximately 148 were employed on a full-time basis. At the end of fiscal 2019, etailz had department heads in the areas of marketing, operations, sales, account
management, human resources, accounting, FP&A, warehouse operations, compliance, and engineering.
Customer Acquisition
etailz acquires its partners through a combination of brand building, inbound digital marketing, and outbound sales, as well as using its proprietary data platform to identify brands that would be good strategic fits for its services. etailz
utilizes content marketing to strengthen its visibility within the industry. etailz’s public relations efforts consist of press releases, articles in industry publications, and articles on its website to build its brand.
In addition, etailz regularly runs advertisements on popular ad platforms such as Google, Facebook, Twitter and LinkedIn to bring leads into its sales funnels.
Trademarks
The trademark etailz is registered with the U.S. Patent and Trademark Office and is owned by etailz. We believe that our rights to this trademark is adequately protected. We hold no material patents, licenses, franchises, or concessions; however,
our established trademark is essential to maintaining our competitive position.
Available Information
The Company’s headquarters are located at 2818 N. Sullivan Road, Suite 130, Spokane Valley, WA 99216, and its telephone number is (855)-300-2710. The Company’s corporate website address is www.twec.com. The Company
makes available, free of charge, its Exchange Act Reports (Forms 10-K, 10-Q, 8-K and any amendments thereto) on its web site as soon as practical after the reports are filed with the Securities and Exchange Commission (“SEC”). The public may read and
copy any materials the Company files with the SEC at the SEC’s Public Reference Room at 100 F Street, N.E., Washington, D.C. 20549. Information on the operation of the Public Reference Room can be obtained by calling the SEC at 1-800-SEC-0330. The
SEC maintains an Internet site that contains reports, proxy and information statements, and other information regarding issuers that file electronically with the SEC. This information can be obtained from the site http://www.sec.gov. The Company’s
Common Stock, $0.01 par value, is listed on the NASDAQ Capital Market under the trading symbol “TWMC”.
| Item 1A. |
RISK FACTORS
|
The following is a discussion of certain factors, which could affect the financial results of the Company.
Risks Related to Our Business and Industry
If we cannot successfully implement our business strategy our growth and profitability could be adversely impacted.
6
Our future results will depend, among other things, on our success in implementing our business strategy.
During the third quarter of 2019, based on recurring losses from operations, the expectation of continuing operating losses for the foreseeable future, and uncertainty with respect to any available future funding, the
Company concluded that there was substantial doubt about the Company’s ability to continue as a going concern. As a response, the Company pursued several strategic initiatives towards its strategy of shifting its focus solely to the operation of
etailz, improving profitability and meeting future liquidity needs and capital requirements. The following initiatives were completed during the first quarter of 2020:
| • |
The sale of the For Your Entertainment (fye) business;
|
| • |
The establishment of a new secured $25 million revolving credit facility (the “New Credit Facility”) with Encina Business Credit, LLC (“Encina”);
|
| • |
The execution of a separate subordinated loan agreement for etailz, Inc. (the “Subordinated Loan”); and
|
| • |
The receipt by etailz, Inc. of loan proceeds pursuant to the Paycheck Protection Plan (the “PPP Loan”) under the Coronavirus Aid, Relief, and Economic Security Act.
|
Notwithstanding the foregoing, the ability of the Company to meet its liabilities and to continue as a going concern is dependent on improved profitability, the continued implementation of the strategic initiative to
reposition etailz as a platform of software and services, the availability of future funding, implementation of one or more corporate initiatives to reduce costs at the parent company level (which could include a voluntary delisting from NASDAQ and
deregistering of our Common Stock in order to substantially eliminate the costs associated with being a public company), satisfying all unassumed liabilities of the fye segment and other strategic alternatives, including selling all or part of the
remaining business or assets of the Company, and overcoming the impact of the COVID-19 pandemic.
There can be no assurance that we will be successful in further implementing our business strategy or that the strategy, including the completed initiatives, will be successful in sustaining acceptable levels of
sales growth and profitability. As a result, the Company has concluded that there is substantial doubt about the Company’s ability to continue as a going concern for a period of one year after the date of filing of this Annual Report on
Form 10-K. In addition, the proceeds from the PPP Loan are subject to audit and there is a risk of repayment.
A pandemic, epidemic or outbreak of an infectious disease, such as COVID-19, may materially and adversely affect our business.
Our business, results of operations, and financial condition may be materially adversely impacted if a public health outbreak, including the recent COVID-19 pandemic, interferes with our ability,
or the ability of our employees, contractors, suppliers, and other business partners to perform our and their respective responsibilities and obligations relative to the conduct of our business.
7
The COVID-19 pandemic has adversely affected and may continue to adversely affect the economies and financial markets worldwide, resulting in an economic downturn that could impact
our business, financial condition and results of operations. As a result, our ability to fund through public or private equity offerings, debt financings, and through other means at acceptable terms, if at
all, may be disrupted, in the event our financing needs for the foreseeable future are not able to be met by our New Credit Facility, balances of cash, cash equivalents and cash generated from operations.
In addition, the continuation of the COVID-19 pandemic and various governmental responses in the United States has adversely affected and may continue to adversely affect our business operations,
including our ability to carry on business development activities, restrictions in business-related travel, delays or disruptions in our on-going projects, and unavailability of the employees of the Company or third-parties with whom we conduct
business, due to illness or quarantines, among others. Our business was negatively impacted by disruptions in our supply chain, which limited our ability to source merchandise, and limits on products fulfillment placed by Amazon. The extent to which
COVID-19 could impact our business will depend on future developments, which are highly uncertain and cannot be predicted with confidence, and will depend on many factors, including the duration of the outbreak, the effect of travel restrictions and
social distancing efforts in the United States and other countries, the scope and length of business closures or business disruptions, and the actions taken by governments to contain and treat the disease. As such, we cannot presently predict the
scope and extent of any potential business shutdowns or disruptions. Possible effects may include, but are not limited to, disruption to our customers and revenue, absenteeism in our labor workforce, unavailability of products and supplies used in
our operations, shutdowns that may be mandated or requested by governmental authorities, and a decline in the value of our assets, including various long-lived assets.
Continued increases in Amazon Marketplace fulfillment and storage fees could have an adverse impact on our profit margin and results of operations.
etailz utilizes Amazon’s Freight by Amazon (“FBA”) platform to store their products at the Amazon fulfillment center and to pack and distribute these products to customers. If Amazon continues to increase its FBA fees,
our profit margin for the etailz segment could be adversely affected.
The Company’s business is influenced by general economic conditions.
The Company’s performance is subject to general economic conditions and their impact on levels of discretionary consumer spending. General economic conditions impacting discretionary consumer spending include, among
others, wages and employment, consumer debt, reductions in net worth, residential real estate and mortgage markets, taxation, fuel and energy prices, interest rates, consumer confidence and other macroeconomic factors.
Consumer purchases of discretionary items generally decline during recessionary periods and other periods where disposable income is adversely affected. A downturn in the economy affects retailers disproportionately,
as consumers may prioritize reductions in discretionary spending, which could have a direct impact on purchases of our products and services and adversely impact our results of operations. In addition, reduced consumer spending may drive us and our
competitors to offer additional products at promotional prices, which would have a negative impact on gross profit.
8
Disruption of global capital and credit markets may have a material adverse effect on the Company’s liquidity and capital resources.
Distress in the financial markets has in the past and can in the future result in extreme volatility in security prices, diminished liquidity and credit availability. There can be no assurance that our liquidity will
not be affected by changes in the financial markets and the global economy or that our capital resources will at all times be sufficient to satisfy our liquidity needs.
Because of our floating rate credit facility, we may be adversely affected by interest rate changes.
Our financial position may be affected by fluctuations in interest rates, as the New Credit Facility is subject to floating interest rates. Interest rates are highly sensitive to many factors, including governmental
monetary policies, domestic and international economic and political conditions and other factors beyond our control. As we borrow against our credit facility, a significant increase in interest rates could have an adverse effect on our financial
position and results of operations.
The Company is dependent upon access to capital, including bank credit facilities and short-term vendor financing, for its liquidity needs.
The Company must have sufficient sources of liquidity to fund its working capital requirements and indebtedness. Based on its recurring losses from operations, expectation of
continuing operating losses, and uncertainty with respect to any available future funding, the Company has concluded that there is substantial doubt about the Company’s ability to continue as a going concern for a period of one year after the date of
filing of this Annual Report on Form 10-K.
The future availability of financing will depend on a variety of factors, such as economic and market conditions, the availability of credit and the Company’s credit rating, as well as the Company’s reputation with
potential lenders. These factors could materially adversely affect the Company’s ability to fund its working capital requirements, costs of borrowing, and the Company’s financial position and results of operations would be adversely impacted.
Historically, we have experienced declines and we may continue to experience fluctuation in our level of sales and results from operations.
A variety of factors has historically affected, and will continue to affect, our sales results and profit margins. These factors include general economic conditions; competition; actions taken by our competitors;
consumer trends and preferences; access to third party marketplaces; and new product introductions and changes in our product mix.
There is no assurance that we will achieve positive levels of sales and earnings growth, and any decline in our future growth or performance could have a material adverse effect on our business and results of
operations.
The ability of the Company to satisfy its liabilities and to continue as a going concern will continue to be dependent on the implementation of several items, the success of which is not certain.
The Company has suffered recurring losses from operations and the Company’s primary sources of liquidity are borrowing capacity under its revolving credit facility, available cash and cash equivalents, all of which are
limited. Therefore, the ability of the Company to meet its liabilities and to continue as a going concern is dependent on, among other things, improved profitability, the continued implementation of the strategic initiative to reposition etailz as a
platform of software and services, the availability of future funding, implementation of one or more corporate initiatives to reduce costs at the parent company level (which could include a voluntary delisting from NASDAQ and deregistering of our
Common Stock in order to substantially eliminate the costs associated with being a public company), satisfying all unassumed liabilities of the fye segment and other strategic alternatives, including selling all or part of the remaining business or
assets of the Company, and overcoming the impact of the COVID-19 pandemic.
There can be no assurance that we will be successful in further implementing our business strategy or that the strategy, including the completed initiatives, will be successful in sustaining acceptable levels of sales growth and profitability.
As a result, the Company has concluded that there is substantial doubt about the Company’s ability to continue as a going concern for a period of one year after the date of filing of this Annual Report on Form 10-K.
9
A change in one or more of the Company’s partners’ policies or the Company’s relationship with those partners could adversely affect the Company’s results of operations.
The Company is dependent on its partners to supply merchandise in a timely and efficient manner. If a partner fails to deliver on its commitments, whether due to financial difficulties or other reasons, the Company
could experience merchandise shortages that could lead to lost sales.
Historically, the etailz segment has not experienced difficulty in obtaining satisfactory sources of supply and management believes that it will continue to have access to adequate sources of supply. No individual
partner exceeded 10% of etailz purchases in fiscal 2019.
etailz revenue is dependent upon maintaining etailz’s relationship with Amazon and failure to do so, or any restrictions on our ability to offer products on the Amazon Marketplace, could have an
adverse impact on our business, financial condition and results of operations.
etailz generates substantially all of its revenue through the Amazon Marketplace. Therefore, we depend in large part on our relationship with Amazon for the growth of the etailz segment. In particular, we depend on our
ability to offer products on the Amazon Marketplace. We also depend on Amazon for the timely delivery of products to customers. Any adverse change in our relationship with Amazon, including restrictions on the ability to offer products or termination
of the relationship, could adversely affect the continued growth of our etailz segment and our financial condition and results of operations.
Parties with whom the Company does business may be subject to insolvency risks or may otherwise become unable or unwilling to perform their obligations to the Company.
The Company is a party to contracts, transactions and business relationships with various third parties, including partners, vendors, suppliers, service providers and lenders, pursuant to which such third parties have
performance, payment and other obligations to the Company. In some cases, the Company depends upon such third parties to provide essential products, services or other benefits, including with respect to merchandise, advertising, software development
and support, logistics, other agreements for goods and services in order to operate the Company’s business in the ordinary course, extensions of credit, credit card accounts and related receivables, and other vital matters. Economic, industry and
market conditions, including as a result of the COVID-19 pandemic, could result in increased risks to the Company associated with the potential financial distress or insolvency of such third parties. The Company is not currently able to accurately
determine the extent and scope of the impact of the COVID-19 pandemic on such third parties. If any of these third parties were to become subject to bankruptcy, receivership or similar proceedings, the rights and benefits of the Company in relation
to its contracts, transactions and business relationships with such third parties could be terminated, modified in a manner adverse to the Company, or otherwise impaired. The Company cannot make any assurances that it would be able to arrange for
alternate or replacement contracts, transactions or business relationships on terms as favorable as the Company’s existing contracts, transactions or business relationships, if at all. Any inability on the part of the Company to do so could
negatively affect the Company’s cash flows, financial condition and results of operations.
10
Breach of data security could harm our business and standing with our customers.
The protection of our partner, employee and business data is critical to us. Our business, like that of most companies, involves confidential information about our employees, our suppliers and our Company. We rely on
commercially available systems, software, tools and monitoring to provide security for processing, transmission and storage of all such data, including confidential information. Despite the security measures we have in place, our facilities and
systems, and those of our third-party service providers, may be vulnerable to security breaches, acts of vandalism, computer viruses, misplaced or lost data, programming or human errors, or other similar events. Unauthorized parties may attempt to
gain access to our systems or information through fraud or other means, including deceiving our employees or third-party service providers. The methods used to obtain unauthorized access, disable or degrade service, or sabotage systems are also
constantly changing and evolving, and may be difficult to anticipate or detect. We have implemented and regularly review and update our control systems, processes and procedures to protect against unauthorized access to or use of secured data and to
prevent data loss. However, the ever-evolving threats mean we must continually evaluate and adapt our systems and processes, and there is no guarantee that they will be adequate to safeguard against all data security breaches or misuses of data. Any
security breach involving the misappropriation, loss or other unauthorized disclosure of customer payment card or personal information or employee personal or confidential information, whether by us or our vendors, could damage our reputation, expose
us to risk of litigation and liability, disrupt our operations, harm our business and have an adverse impact upon our net sales and profitability. As the regulatory environment related to information security, data collection and use, and privacy
becomes increasingly rigorous, with new and changing requirements applicable to our business, compliance with those requirements could also result in additional costs. Further, if we are unable to comply with the security standards established by
banks and the credit card industry, we may be subject to fines, restrictions and expulsion from card acceptance programs, which could adversely affect our retail operations.
Our hardware and software systems are vulnerable to damage, theft or intrusion that could harm our business.
Any failure of our computer hardware or software systems that causes an interruption in our operations or a decrease in inventory tracking could result in reduced net sales and profitability. Additionally, if any data
intrusion, security breach, misappropriation or theft were to occur, we could incur significant costs in responding to such event, including responding to any resulting claims, litigation or investigations, which could harm our operating results.
Our inability or failure to protect our intellectual property rights, or any claimed infringement by us of third-party intellectual rights, could have a negative impact on our operating results.
Our trademark, trade secrets and other intellectual property, including proprietary software, are valuable assets that are critical to our success. The unauthorized reproduction or other misappropriation of our
intellectual property could cause a decline in our revenue. In addition, any infringement or other intellectual property claim made against us could be time-consuming to address, result in costly litigation, cause product delays, require us to enter
into royalty or licensing agreements or result in our loss of ownership or use of the intellectual property.
Loss of key personnel or the inability to attract, train and retain qualified employees could adversely affect the Company’s results of operations.
The Company believes that its future prospects depend, to a significant extent, on the services of its executive officers. Our future success will also depend on our ability to attract and retain qualified key
personnel. The loss of the services of certain of the Company’s executive officers and other key management personnel could adversely affect the Company’s results of operations.
11
In addition to our executive officers, the Company’s business is dependent on our ability to attract, train and retain qualified team members. Our ability to meet our labor needs while controlling our costs is subject
to external factors such as unemployment levels, health care costs and changing demographics. If we are unable to attract and retain adequate numbers of qualified team members, our operations and support functions could suffer. Those factors,
together with increased wage and benefit costs, could adversely affect our results of operations.
Failure to comply with legal and regulatory requirements could adversely affect the Company’s results of operations.
The Company’s business is subject to a wide array of laws and regulations. Significant legislative changes that impact our relationship with our workforce (none of which is represented by unions) could increase our
expenses and adversely affect our operations. Examples of possible legislative changes impacting our relationship with our workforce include changes to an employer’s obligation to recognize collective bargaining units, the process by which collective
bargaining units are negotiated or imposed, minimum wage requirements, health care mandates, and changes in overtime regulations.
Our policies, procedures and internal controls are designed to comply with all applicable laws and regulations, including those imposed by the Securities and Exchange Commission and the NASDAQ Capital Market, as well
as applicable employment laws. Additional legal and regulatory requirements increase the complexity of the regulatory environment in which we operate and the related cost of compliance. Failure to comply with such laws and regulations may result in
damage to our reputation, financial condition and market price of our stock.
We may face difficulties in meeting our labor needs to effectively operate our business.
We are heavily dependent upon our labor workforce. Our compensation packages are designed to provide benefits commensurate with our level of expected service. However, we face the challenge of filling many positions at
wage scales that are appropriate to the industry and competitive factors. We also face other risks in meeting our labor needs, including competition for qualified personnel, overall unemployment levels, and increased costs associated with complying
with regulations relating to COVID-19. Changes in any of these factors, including a shortage of available workforce, could interfere with our ability to adequately service our customers and could result in increasing labor costs.
Our business could be adversely affected by increased labor costs, including costs related to an increase in minimum wage and health care.
Labor is one of the primary components in the cost of operating our business. Increased labor costs, whether due to competition, unionization, increased minimum wage, state unemployment rates, health care, or other
employee benefits costs may adversely impact our operating expenses. Additionally, there is no assurance that future health care legislation will not adversely impact our results or operations.
Litigation may adversely affect our business, financial condition and results of operations.
Our business is subject to the risk of litigation by employees, consumers, partners, suppliers, competitors, stockholders, government agencies or others through private actions, class actions, administrative
proceedings, regulatory actions or other litigation. The outcome of litigation, particularly class action lawsuits and regulatory actions, is difficult to assess or quantify. We may incur losses relating to these claims, and in addition, these
proceedings could cause us to incur costs and may require us to devote resources to defend against these claims that could adversely affect our results of operations. For a description of current legal proceedings, see “Part I, Item 3, Legal
Proceedings.”
12
An impairment of the carrying value of fixed assets, intangible assets and goodwill has negatively affected and may in the future negatively affect our financial results.
Because we have grown in part through acquisitions, goodwill and other acquired intangible assets have represented a substantial portion of our total assets.
Under generally accepted accounting principles, we assess our long-lived assets for impairment whenever economic events or changes in circumstances indicate that the carrying value of an asset may not be recoverable.
During fiscal 2019, as a result of triggering events, the Company performed impairment tests on the fixed assets and operating lease right-of-use assets of the fye segment and concluded that both were fully impaired.
The Company recorded impairment losses of approximately $23.2 million for fixed assets and operating lease right-of-use assets of the fye segment.
During fiscal 2019, the Company fully impaired its vendor relationships and the Company recognized an impairment loss of $0.8 million.
In the future, significant negative industry or general economic trends, disruptions to our business and unexpected significant changes or planned changes in our use of our long-lived assets may result in additional
impairments to our fixed assets and intangible assets. Any reduction in or impairment of the value of fixed assets or intangible assets will result in a charge against earnings, which could have an adverse impact on our reported results of operations
and financial condition.
The effects of natural disasters, terrorism, acts of war, and public health issues may adversely affect our business.
Natural disasters, including earthquakes, hurricanes, floods, and tornadoes may affect store and distribution center operations. In addition, acts of terrorism, acts of war, and military action both in the United
States and abroad can have a significant effect on economic conditions and may negatively affect our ability to purchase merchandise from suppliers for sale to our customers. Public health issues, such as flu or other pandemics, whether occurring in
the United States or abroad, could disrupt our operations and result in a significant part of our workforce being unable to operate or maintain our infrastructure or perform other tasks necessary to conduct our business. Additionally, public health
issues may disrupt, or have an adverse effect on, our suppliers’ operations, our operations, our customers, or customer demand. Our ability to mitigate the adverse effect of these events depends, in part, upon the effectiveness of our disaster
preparedness and response planning as well as business continuity planning. However, we cannot be certain that our plans will be adequate or implemented properly in the event of an actual disaster. We may be required to suspend operations in some or
all our locations, which could have a material adverse effect on our business, financial condition, and results of operations. Any significant declines in public safety or uncertainties regarding future economic prospects that affect customer
spending habits could have a material adverse effect on customer purchases of our products.
The terms of our asset-based revolving credit agreement impose certain restrictions on us that may impair our ability to respond to changing business and economic conditions, which could have a
significant adverse impact on our business. Additionally, our business could suffer if our ability to acquire financing is reduced or eliminated.
On February 20, 2020, etailz entered into a Loan and Security Agreement (the “Loan Agreement”) with Encina, as administrative agent, under which the lenders committed to provide up to $25 million in loans under a
three-year, secured revolving credit facility (the “New Credit Facility”).
13
Among other things, the Loan Agreement limits etailz’s ability to incur additional indebtedness, create liens, make investments, make restricted payments or specified payments and merge or acquire assets. The Loan
Agreement also requires etailz to comply with a financial maintenance covenant.
The Loan Agreement contains customary events (including our Subordinated Debt) of default, including, but not limited to, payment defaults, breaches of representations and warranties, covenant defaults,
cross-defaults to other obligations, customary ERISA defaults, certain events of bankruptcy and insolvency, judgment defaults, the invalidity of liens on collateral, change in control, cessation of business or the liquidation of material assets of
the borrowers and guarantors under the New Credit Facility taken as a whole, the occurrence of an uninsured loss to a material portion of collateral and failure of the obligations under the New Credit
Facility to constitute senior indebtedness under any applicable subordination or intercreditor agreements, including our Subordinated Debt.
As of February 1, 2020, the Company had borrowings of $13.1 million under its previous credit facility with Wells Fargo. On February 20, 2020, in conjunction with the FYE Transaction, the Company fully satisfied its obligations under the Credit
Facility.
Risks Related to Ownership of Our Common Stock.
The ownership of our Common Stock is extremely concentrated, and entities affiliated with members of our Board of Directors have significant influence and control over the outcome of any vote of the
Company’s Shareholders and may have competing interests.
The Robert J. Higgins TWMC Trust (the “Trust”) owns approximately 39.1 % of the outstanding Common Stock and
Neil Subin owns approximately 16.5% of the outstanding Common Stock, and as a result can control the outcome of most actions requiring shareholder approval. In addition, entities affiliated with each of the Trust and Mr. Subin, as well as one of
our directors, Mr. Simpson, and certain of his affiliated entities, entered into a voting agreement (as described in “Related Party Transactions”) and agreed to how their respective shares of the Company’s Common Stock held by the parties (which
total approximately 60% ) will be voted with respect to (i) amending the Articles of Incorporation of the Company to set the size of the Board of Directors of the Company at three directors, (ii) the designation, election, removal, and replacement
of members of the Board and (iii) how shares of the Company’s capital stock held by the parties to the voting agreement will be voted on a Sale of the Company (as defined in the voting agreement) with respect to which there is a shareholder vote or
some other action to take place during the ninety (90) days immediately following the date of the voting agreement. Pursuant to the voting agreement, Messrs. Marcus and Simpson were appointed as directors of the Company, and Mr. Reickert, a
trustee of the Trust, remained as a director of the Company. Mr. Subin was also granted board observer rights. Entities affiliated with the Trust and Messrs. Marcus and Simpson are also lenders under our subordinated loan and security agreement,
have received warrants to purchase shares of the Company’s Common Stock and received contingent value rights (“CVRs”) representing the contractual right to receive cash payments from the Company in an amount equal, in the aggregate, to
19.9% of the proceeds received by the Company in respect of certain intercompany indebtedness owing to it by etailz and/or its equity interest in etailz, each as described in “Related Party Transactions”. As a
result, there may be instances in which the interest of Mr. Reickert, the Trust and its affiliated entities, Messrs. Marcus and Subin and their respective affiliated entities, and Mr. Simpson and his affiliated entities may conflict or be perceived
as being in conflict with the interest of a holder of our securities or the interest of the Company.
14
The Company’s stock price has experienced and could continue to experience volatility and could decline, resulting in a substantial loss on your investment.
Our stock price has experienced, and could continue to experience in the future, substantial volatility as a result of many factors, including global economic conditions, broad market fluctuations and public perception
of the prospects for the industries in which we operate and the value of our assets. As a result of the FYE Transaction, we are reliant on the performance of etailz, and a failure to meet market expectations, particularly with respect to net
revenues, operating margins and earnings per share, would likely result in a further decline in the market price of our stock.
If we do not meet the continued listing standards of the NASDAQ, our Common Stock could be delisted from trading, which could limit investors’ ability to make transactions in our Common Stock and
subject us to additional trading restrictions.
Our common stock is listed on NASDAQ, which imposes continued listing requirements with respect to listed shares. On August 15, 2019, the Company effected a reverse stock split of its outstanding shares of Common Stock
at a ratio of one-for-twenty pursuant to a Certificate of Amendment to the Company’s Certificate of Incorporation filed with the Secretary of State of the State of New York. The reverse stock split was reflected on NASDAQ beginning with the opening
of trading on August 15, 2019. The primary purpose of the reverse stock split, which was approved by the Company’s shareholders at the Company’s Annual Stockholders Meeting on June 27, 2019, was to enable the Company to comply with the $1.00 minimum
bid price requirement for continued listing on NASDAQ. There can be no assurance that we will be able to maintain compliance with the minimum bid price requirement or that we will otherwise be in compliance with other NASDAQ listing criteria. If we
fail to maintain compliance with the minimum bid requirement or to meet the other applicable continued listing requirements in the future and NASDAQ determines to delist our Common Stock, the delisting could adversely affect the market price and
liquidity of our Common Stock and reduce our ability to raise additional capital.
The limited public float and trading volume for our Common Stock may have an adverse impact and cause significant fluctuation of market price.
Historically, ownership of a significant portion of our outstanding shares of Common Stock has been concentrated in a small number of stockholders. Consequently, our Common Stock has a relatively small float and low
average daily trading volume, which could affect a shareholder’s ability to sell our stock or the price at which it can be sold. In addition, future sales of substantial amounts of our Common Stock in the public market by those larger stockholders,
or the perception that these sales could occur, may adversely impact the market price of the stock and our stock could be difficult for a shareholder to liquidate.
The Company intends to continue to undertake one or more corporate initiatives to reduce costs which may include deregistering the Company’s Common Stock under the Exchange Act.
Given the Company’s liquidity position, the Company intends to continue to undertake one or more corporate initiatives to reduce costs going forward. We currently incur significant expenses in connection with complying
with public company reporting requirements and, as a listed company, we have an obligation to continue to comply with the applicable reporting requirements. As part of its consideration of all available strategic alternatives for the Company, the
Board will consider whether, and may conclude that, deregistering our Common Stock, and therefore eliminating the significant expenses associated with complying with public company reporting requirements, is in the best interests of our shareholders.
If the Company determines to deregister its Common Stock, following such deregistration, we would no longer be a reporting company and we would cease to file annual, quarterly, current, and other reports and documents with the Securities and Exchange
Commission as soon as we are permitted to do so under applicable laws, rules and regulations. In such event, our shareholders would have significantly less information about the Company and our business, operations, and financial performance than
they have currently. Additionally, termination of our obligation to publicly disclose financial and other information about the Company following the deregistration of our Common Stock under the Exchange Act would make it more difficult (or even
impossible) for shareholders to sell shares of Common Stock held by them. Trading in our Common Stock would only occur, if at all, in privately negotiated sales and potentially on an OTC market, if one or more brokers chooses to make a market for our
Common Stock on any such market and complies with applicable regulatory requirements. There could be no assurances regarding any such private trading or OTC market trading.
15
| Item 1B. |
UNRESOLVED SEC COMMENTS
|
None.
| Item 2. |
PROPERTIES
|
Retail Stores
As of February 1, 2020, the fye segment leased and operated 200 stores. The majority of the leases provide for the payment of fixed monthly rent and expenses for maintenance, property taxes and insurance, while others provide for the payment of
monthly rent based on a percentage of sales. Certain leases provide for additional rent based on store sales in excess of specified levels. The following table lists the leases due to expire in each of the fiscal years shown as of the fiscal
year-end, assuming any renewal options are not exercised:
|
Year
|
No. of
Leases
|
Year
|
No. of
Leases
|
|||
|
2020
|
164
|
2023
|
3
|
|||
|
2021
|
27
|
2024
|
2
|
|||
|
2022
|
3
|
2025 and beyond
|
1
|
On February 20, 2020, as part of the FYE Transaction, Sunrise Records assumed the obligation under the leases for all stores, Albany, NY offices and distribution center.
16
Corporate Offices and Distribution Center Facilities
As of February 1, 2020, we leased the following office and distribution facilities:
|
Location
|
Square
Footage |
Owned or
Leased |
Use
|
|||
|
fye
|
||||||
|
Albany, NY
|
39,800
|
Leased
|
Office administration
|
|||
|
Albany, NY
|
141,500
|
Leased
|
Distribution center
|
|||
|
etailz
|
||||||
|
Spokane, WA
|
30,700
|
Leased
|
Office administration
|
|||
|
Spokane, WA
|
32,000
|
Leased
|
Distribution center
|
On February 20, 2020, as part of the FYE Transaction, Sunrise Records assumed the obligation under the leases for all stores, Albany, NY offices and distribution center.
The Spokane, WA distribution center supports the distribution to outside distribution facilities for sale on third-party marketplaces for etailz.
| Item 3. |
LEGAL PROCEEDINGS
|
The Company is subject to legal proceedings and claims that have arisen in the ordinary course of its business and have not been finally adjudicated. Although there can be no assurance as to the ultimate disposition of these matters, it is
management’s opinion, based upon the information available at this time, that the expected outcome of these matters, individually and in the aggregate, will not have a material adverse effect on the results of operations and financial condition of
the Company.
Store Manager Class Actions
There are two pending class actions. The first, Spack v. Trans World Entertainment Corp. was originally filed in the District of New Jersey, April 2017 (the “Spack Action”). The Spack Action alleges that the
Company misclassified Store Managers (“SMs”) as exempt nationwide. It also alleges that Trans World improperly calculated overtime for Senior Assistant Managers (“SAMs”) nationwide, and that both SMs and SAMs worked “off-the-clock.” It also alleges
violations of New Jersey and Pennsylvania State Law with respect to calculating overtime for SAMs. The second, Roper v. Trans World Entertainment Corp., was filed in the Northern District of New York, May 2017 (the “Roper Action”). The Roper Action
also asserts a nationwide misclassification claim on behalf of SMs. Both actions were consolidated into the Northern District of New York, with the Spack Action being the lead case.
The Company has reached a preliminary settlement with the plaintiffs for both store manager class actions. The Company reserved $425,000 for the settlement as of February 2, 2020.
| Item 4. |
MINE SAFETY DISCLOSURES
|
Not applicable.
17
PART II
| Item 5. |
MARKET FOR THE REGISTRANT’S COMMON EQUITY, RELATED STOCKHOLDER MATTERS AND ISSUER PURCHASES OF EQUITY SECURITIES
|
Market Information: The Company’s Common Stock trades on the NASDAQ Capital Market under the symbol “TWMC.” As of May 29, 2020, there were 225 shareholders of record. The following table sets forth high
and low last reported sale prices for each fiscal quarter during the period from February 4, 2018 through May 29, 2020.
|
Closing Sales Prices |
||||||||
|
High |
Low |
|||||||
|
2018 |
||||||||
|
1st Quarter |
$ |
36.00 |
$ |
20.00 |
||||
|
2nd Quarter |
$ |
27.00 |
$ |
17.00 |
||||
|
3rd Quarter |
$ |
22.80 |
$ |
13.00 |
||||
|
4th Quarter |
$ |
25.80 |
$ |
11.40 |
||||
|
2019 |
||||||||
|
1st Quarter |
$ |
12.48 |
$ |
5.77 |
||||
|
2nd Quarter |
$ |
8.01 |
$ |
5.00 |
||||
|
3d Quarter |
$ |
6.08 |
$ |
2.74 |
||||
|
4th Quarter |
$ |
6.98 |
$ |
1.92 |
||||
|
2020 |
||||||||
|
1st Quarter |
$ |
5.35 |
$ |
2.39 |
||||
|
2nd Quarter (through May 29, 2020) |
$ |
5.14 |
$ |
3.62 |
||||
On May 29, 2020, the last trading date in May the reported sale price on the Common Stock on the NASDAQ Capital Market was $4.80. On August 15, 2019, the Company completed a 1-for-20 reverse stock split of outstanding Common Stock. All closing
prices have been adjusted to reflect the reverse stock split.
Dividend Policy: The Company did not pay cash dividends in fiscal 2019 and fiscal 2018. The declaration and payment of any dividends is at the sole discretion of
the board of directors and is not guaranteed.
Issuer Purchases of Equity Securities during the Quarter Ended February 1, 2020
During the three-month period ended February 1, 2020, the Company did not repurchase any shares under the share repurchase program.
| Item 6. |
SELECTED CONSOLIDATED FINANCIAL DATA
|
Not required under the requirements of a Smaller Reporting Company.
18
| Item 7. |
MANAGEMENT’S DISCUSSION AND ANALYSIS OF FINANCIAL CONDITION AND RESULTS OF OPERATIONS
|
Overview
Management’s Discussion and Analysis of Financial Condition and Results of Operations provide information that the Company’s management believes necessary to achieve an understanding of its financial condition and results of operations. To the
extent that such analysis contains statements which are not of a historical nature, such statements are forward-looking statements, which involve risks and uncertainties. These risks include, but are not limited to, changes in the competitive
environment for the Company’s products and services; general economic factors in markets where the Company’s products and services are sold; and other factors including, but not limited to: cost of goods, consumer disposable income, consumer debt
levels and buying patterns, consumer credit availability, interest rates, customer preferences, unemployment, labor costs, inflation, fuel and energy prices, weather patterns, climate change, catastrophic events, competitive pressures and insurance
costs discussed in the Company’s filings with the Securities and Exchange Commission.
FYE Transaction
On February 20, 2020, the Company consummated the sale of substantially all of the assets and certain of the liabilities relating to fye to a subsidiary of Sunrise Records pursuant to an Asset Purchase Agreement dated
January 23, 2020, by and among the Company, Record Town, Inc., Record Town USA LLC, Record Town Utah LLC, Trans World FL LLC, Trans World New York, LLC, 2428392 Inc., and Sunrise Records.
Following the FYE Transaction, etailz is the Company’s only operating segment. However, all of our financial information for fiscal 2019 includes the fye segment. For pro forma information, see Note 13 of the Notes to the Consolidated Financial
Statements.
Impact of COVID-19
To date, as a direct result of COVID-19, most of our employees are working remotely. The full extent to which the COVID-19 pandemic will directly or indirectly impact our business, results of operations and financial
condition, including expenses, reserves and allowances, and employee-related amounts, will depend on future developments that are highly uncertain, including as a result of new information that may emerge concerning COVID-19 and the actions taken to
contain or treat it, as well as the economic impact on local, regional, national and international customers and markets, which are highly uncertain and cannot be predicted at this time. Management is actively monitoring this situation and the
possible effects on its financial condition, liquidity, operations, industry, and workforce. Given the daily evolution of the COVID-19 outbreak and the response to curb its spread, currently we are not able to estimate the effects of the COVID-19
outbreak to our results of operations, financial condition, or liquidity.
In response to the rapidly evolving COVID-19 pandemic, we activated our business continuity program, led by our Executive Team in conjunction with Human Resources, to help us manage the situation. In mid-March, we transitioned our corporate office
staff to work 100% remotely. This process was aided through the implementation of a flexible work from home policy rolled out to the organization in fiscal 2019, having a companywide communication platform for instant messaging and video
conferencing, and cloud-based critical business applications. However, while our business is not dependent on physical office locations nor travel, having a 100% remote workforce does present increased operational risk. Our leadership team believes
we have the necessary controls in place to mitigate these impacts and allow the team to continue to operate effectively remotely as long as required by State guidelines.
19
While e-commerce has largely benefited from the closure of brick-and-mortar locations as consumer spending has been pushed online to marketplaces such as Amazon and Walmart, the industry nor our organization has been immune to the impact to our
supply chains. For instance, in March, Amazon reduced replenishment in their fulfillment centers to essential items which limited a significant percentage of SKUs carried by etailz and a number of etailz’ partners shut their warehouses or suffered
limited processing capacity due to COVID-19. While Amazon has since lifted restrictions and the leadership team executed contingency plans to mitigate the adverse impact from these restrictions, this highlights the fluid nature of COVID-19 across
supply chains.
Additionally, since the beginning of the pandemic, tens of millions of Americans have lost their jobs, significantly increasing the risk of near-term economic contraction in the United States that may affect e-commerce sales. The risk of a second
wave or increased numbers of positive COVID-19 cases also presents further risk to supply chains. Leadership is actively monitoring the situation and potential impacts on its financial condition, liquidity, operations and workforce but the full
extent of the impact is still highly uncertain.
Key Performance Indicators
Management monitors a number of key performance indicators to evaluate its performance, including:
Net Sales and Comparable Store Net Sales: The etailz segment measures total year over year sales growth. etailz measures its sales performance through several key performance indicators including: number of
partners and active product listings and sales per listing.
The fye segment measures the rate of comparable store net sales change. A store is included in comparable store net sales calculations at the beginning of its thirteenth full month of operation. Stores relocated, expanded or downsized are
excluded from comparable store sales if the change in square footage is greater than 20% until the thirteenth full month following relocation, expansion or downsizing. Closed stores that were open for at
least thirteen months are included in comparable store sales through the month immediately preceding the month of closing. The fye segment further analyzes net sales by product category
Cost of Sales and Gross Profit: Gross profit is calculated based on the cost of product in relation to its retail selling value. Changes in gross profit are impacted primarily by net sales levels, mix of
products sold, vendor discounts and allowances, shrinkage, obsolescence and distribution costs. Distribution expenses include those costs associated with receiving, inspecting & warehousing merchandise, Amazon fulfillment fees, and costs
associated with product returns to vendors.
Selling, General and Administrative (“SG&A”) Expenses: Included in SG&A expenses are payroll and related costs, occupancy charges, general operating and overhead expenses and depreciation charges.
SG&A expenses also include fixed assets write-offs associated with store closures, if any, and miscellaneous income and expense items, other than interest.
Balance Sheet and Ratios: The Company views cash, merchandise inventory, accounts payable leverage, and working capital as key indicators of its financial position. See “Liquidity and Capital Resources”
for further discussion of these items.
20
Fiscal Year Ended February 1, 2020 (“fiscal 2019”)
Compared to Fiscal Year Ended February 2, 2019 (“fiscal 2018”)
The Company’s fiscal year is a 52 or 53-week period ending the Saturday nearest to January 31. Fiscal 2019 and fiscal 2018 ended February 1, 2020 and February 2, 2019, respectively. Both fiscal 2019 and fiscal 2018
had 52 weeks.
Segment Highlights:
|
(amounts in thousands)
|
Fiscal Year
Ended
February 1,
2020
|
Fiscal Year
Ended
February 2,
2019
|
||||||
|
Total Revenue
|
||||||||
|
etailz
|
$
|
133,216
|
$
|
186,900
|
||||
|
fye
|
192,719
|
231,290
|
||||||
|
Total Company
|
$
|
325,935
|
$
|
418,190
|
||||
|
Gross Profit
|
||||||||
|
etailz
|
$
|
30,393
|
$
|
38,815
|
||||
|
fye
|
65,706
|
89,259
|
||||||
|
Total Company
|
$
|
96,099
|
$
|
128,074
|
||||
|
Loss From Operations
|
||||||||
|
etailz
|
$
|
(6,405
|
)
|
$
|
(72,351
|
)
|
||
|
fye
|
(50,770
|
)
|
(24,455
|
)
|
||||
|
Total Company
|
$
|
(57,175
|
)
|
$
|
(96,806
|
)
|
||
|
Reconciliation of etailz Loss From Operations to etailz Adjusted Loss From Operations
|
||||||||
|
etailz Loss From Operations
|
$
|
(6,405
|
)
|
$
|
(72,351
|
)
|
||
|
Acquisition related intangible amortization expenses
|
1,143
|
3,890
|
||||||
|
Acquisition related compensation expenses
|
66
|
3,821
|
||||||
|
Asset impairment charges
|
765
|
57,712
|
||||||
|
etailz Adjusted Loss From Operations (1)
|
$
|
(4,431
|
)
|
$
|
(6,928
|
)
|
||
|
(1)
|
In addition to the results of operations determined in accordance with generally accepted accounting principles in the United States (“GAAP”), we reported non-GAAP etailz
adjusted operating loss as shown above. The Company believes that adjusted loss from operations as per the segment disclosure, when considered together with its GAAP financial results, provides management and investors with a more
complete understanding of its business operating results, including underlying trends, by excluding the effects of certain charges. This measure is not a recognized measure of financial performance under GAAP, and should not be considered
as a substitute for operating earnings (losses), net earnings (loss) from continuing operations or cash flows from operating activities, as determined in accordance with GAAP.
|
Total Revenue. The following table sets forth a year-over-year comparison of the Company’s total revenue:
|
2019 vs. 2018
|
|||||||||||||||||
|
2019
|
2018
|
$ |
|
%
|
|||||||||||||
|
(amounts in thousands)
|
|||||||||||||||||
|
etailz net sales
|
$
|
133,216
|
$
|
186,900
|
$
|
(53,684
|
)
|
(28.7
|
%)
|
||||||||
|
fye net sales
|
188,777
|
226,097
|
(37,320
|
)
|
(16.5
|
%)
|
|||||||||||
|
Other revenue (1)
|
3,942
|
5,193
|
(1,251
|
)
|
(24.1
|
%)
|
|||||||||||
|
Total revenue
|
$
|
325,935
|
$
|
418,190
|
$
|
(92,255
|
)
|
(22.1
|
%)
|
||||||||
|
1.
|
Other revenue is comprised of third-party commission income and management fees related to the fye segment.
|
21
Total revenue decreased 22.1% to $325.9 million compared to $418.2 million in fiscal 2018.
etailz Segment
etailz recorded sales of $133.2 million for fiscal 2019 compared to $186.9 million for fiscal 2018, a decline of 28.7%. etailz net sales were impacted by the partner rationalization and remediation strategic initiative. Rationalization and
remediation activities included terminating unprofitable partners and improving partner relationships through negotiations focused on improvements to gross margins and supply chain efficiencies. As a result of the initiative, etailz deactivated 1,060
partners. The average number of partners during fiscal 2019 was 1,177. The average number of active listings during 2019 were 12,838 as compared to 20,655 during 2018. Sales per listing increased 21% to $191 during 2019 as compared to $158 during
2018.
etailz generates revenue across a broad array of product lines primarily through the Amazon Marketplace. Categories include apparel, baby, beauty, electronics, health & personal care, home/kitchen/grocery, pets,
sporting goods, toys & art.
fye Segment
The 16.5% net sales decline from the prior year is primarily due to a 13.8% decline in average stores in operation and a 4.7% decline in comparable store net sales.
Net fye sales by merchandise category for fiscal 2019 and fiscal 2018 were as follows:
|
( dollar amounts in thousands)
|
2019
Net Sales
|
%
Total
|
2018
Net Sales
|
%
Total
|
Total $
Net Sales
Change
|
Total %
Net Sales
Change
|
Comparable
Store % Net
Sales Change
|
|||||||||||||||||||||
|
Trend/Lifestyle
|
$
|
85,901
|
45.5
|
%
|
$
|
93,830
|
41.5
|
%
|
$
|
(7,929
|
)
|
(8.5
|
%)
|
6.6
|
%
|
|||||||||||||
|
Video
|
45,957
|
24.3
|
%
|
62,403
|
27.6
|
%
|
(16,446
|
)
|
(26.4
|
%)
|
(17.8
|
%)
|
||||||||||||||||
|
Music
|
31,630
|
16.8
|
%
|
39,793
|
17.6
|
%
|
(8,163
|
)
|
(20.5
|
%)
|
(9.2
|
%)
|
||||||||||||||||
|
Electronics
|
25,289
|
13.4
|
%
|
30,071
|
13.3
|
%
|
(4,782
|
)
|
(15.9
|
%)
|
(12.6
|
%)
|
||||||||||||||||
|
Total
|
$
|
188,777
|
100.0
|
%
|
$
|
226,097
|
100.0
|
%
|
$
|
(37,320
|
)
|
(16.5
|
%)
|
(4.7
|
%)
|
|||||||||||||
Trend/lifestyle
fye stores offer a selection of trend/lifestyle products that primarily relate to theatrical releases, music, and gaming. The trend/lifestyle category increased 6.6% on a comparable store sales basis in fiscal 2019 and represented 45.5% of the
Company’s total net sales in fiscal 2019 versus 41.5% in fiscal 2018. The Company grew sales in this category by strengthening its assortment of consumables and collectables, as well as by improving the product presentation and value proposition.
Video
fye stores offer a wide range of new and used DVDs, Blu-rays, and 4Ks in all of its stores. Total net sales for the video category declined 17.8% on a comparable store sales basis in fiscal 2018. Video sales were negatively impacted by industry
wide declines in physical video due to digital options.
Music
fye stores offer a wide range of new and used CDs, music DVDs and vinyl across most music genres, including new releases from current artists as well as an extensive catalog of music from past periods and artists. Total net sales in the music
category declined 9.2% on a comparable store sale basis in fiscal 2019.
22
Electronics
fye stores offer a selection of complementary portable electronics and accessories to support our entertainment products. The electronics category decreased 12.6% on a comparable store sales basis.
Gross Profit. The following table sets forth a year-over-year comparison of the Company’s gross profit:
|
(amounts in thousands)
|
2019
|
2018
|
$ |
|
%
|
|||||||||||
|
etailz gross profit
|
$
|
30,393
|
$
|
38,815
|
$
|
(8,422
|
)
|
(21.7
|
%)
|
|||||||
|
fye gross profit
|
65,706
|
89,259
|
(23,553
|
)
|
(26.4
|
%)
|
||||||||||
|
Total gross profit
|
$
|
96,099
|
$
|
128,074
|
$
|
(31,975
|
)
|
(25.0
|
%)
|
|||||||
|
etailz gross profit as a % of etailz revenue
|
22.8
|
%
|
20.8
|
%
|
||||
|
fye gross profit as a % of fye revenue
|
34.1
|
%
|
38.6
|
%
|
||||
|
Total gross profit as a % of total revenue
|
29.5
|
%
|
30.6
|
%
|
Gross profit decreased 25.0% to $96.1 million compared to $128.1 million in fiscal 2018 due lower gross profit as a percentage of sales for fye.
etailz Segment
etailz gross profit as a percentage of revenue was 22.8% in fiscal 2019 as compared to 20.8% in fiscal 2018. The increase in the gross profit rate was primarily due the rationalization and remediation activities including terminating unprofitable
vendors and improving vendor relationships through negotiations focused on improvements to gross margins and supply chain efficiencies.
fye Segment
Gross profit as a percentage of sales was 34.1% in fiscal 2019 as compared to 38.6% in fiscal 2018. The decline in the gross profit rate was primarily due to the write-down of inventory to the fair value based on the FYE Transaction.
23
Selling, General and Administrative Expenses.
The following table sets forth a year-over-year comparison of the Company’s SG&A expenses:
|
2019
|
2018
|
$
|
%
|
|||||||||||||
|
etailz SG&A before depreciation and amortization
|
33,734
|
48,965
|
(15,231
|
)
|
-31.1
|
%
|
||||||||||
|
As a % of total etailz revenue
|
18.0
|
%
|
28.1
|
%
|
-10.0
|
%
|
||||||||||
|
fye SG&A before depreciation and amortization
|
$
|
84,094
|
$
|
107,141
|
$
|
(23,047
|
)
|
-21.5
|
%
|
|||||||
|
As a % of total fye revenue
|
58.9
|
%
|
46.3
|
%
|
12.6
|
%
|
||||||||||
|
Depreciation and amortization(1)
|
11,463
|
9,116
|
2,347
|
25.7
|
%
|
|||||||||||
|
Total SG&A
|
$
|
129,291
|
$
|
165,222
|
$
|
(35,931
|
)
|
-21.7
|
%
|
|||||||
|
As a % of total revenue
|
39.7
|
%
|
37.3
|
%
|
||||||||||||
(1) During fiscal 2019, the Company recorded $7.0 million of amortization of right-of-use-assets upon the adoption of ASC 842.
etailz Segment
etailz SG&A, excluding depreciation and amortization, expenses decreased $15.2 million, or 31.1%, primarily due to a 30% reduction in force implemented during the fourth quarter of fiscal 2018 and lower commissions due to lower sales.
Additional reductions implemented included expenses related to technology, hardware, and employee benefits.
fye Segment
SG&A, excluding depreciation and amortization, decreased $23.0 million, or 21.5%, primarily due to lower expenses from fewer stores in operation. The increase in the rate as a percentage of fye revenue was primarily due to the comparable
sales decline and increased corporate home office expenses to support strategic growth initiatives.
Depreciation and amortization expense. Consolidated depreciation and amortization expense increased $2.3 million primarily due to amortization of right to use assets partially
offset by the impairment charges recorded during the fourth quarter of fiscal 2018, as well as further impairment recorded during the third quarter of 2019, which reduced the net carrying value of the long-lived assets.
Asset Impairment Charges
etailz Segment
During fiscal 2019, the Company fully impaired its vendor relationships and the Company recognized an impairment loss of $0.8 million.
During fiscal 2018, the Company concluded, based on continued operating losses for the etailz segment driven by lower than expected operating results culminating in the fourth quarter of fiscal 2018 that a triggering event had occurred, and
pursuant to Financial Accounting Standards Board (FASB) Accounting Standards Codification (ASC) , Property, Plant, and Equipment, an evaluation of the etailz fixed assets and intangible assets for impairment
was required. Fixed assets related to internally developed technology at etailz were written down to their estimated fair values at the end of fiscal 2018, resulting in the recognition of asset impairment charges of $2.1 million. Intangible assets
related to technology and vendor relationships were written down to their estimated fair values at the end of fiscal 2018 resulting in the recognition of asset impairment charges of $16.4 million.
24
During fiscal 2018, as a result of the annual impairment review pursuant to FASB ASC 350, Intangibles—Goodwill and Other, the Company performed its impairment
test over goodwill. Based on the Company’s annual impairment test, it was determined that the goodwill balance was fully impaired, and the Company recognized an impairment loss of $39.2 million.
fye Segment
During fiscal 2019 and fiscal 2018, the Company concluded, based on continued operating losses within the fye segment driven by lower than expected sales, that triggering events had occurred in each respective fiscal year, and pursuant to FASB
ASC 360, Property, Plant, and Equipment, an evaluation of the fye fixed assets for impairment was required. Fixed assets and operating lease right-of-use assets, primarily at the Company’s retail store
locations, as well as certain fixed assets at the corporate location, consisting of the home office and the Albany distribution center, where impairment was determined to exist, were written down to their estimated fair values as of the end of
fiscal 2019 and fiscal 2018, resulting in the recording of asset impairment charges of $23.2 million and $1.9 million, respectively. Based on the fair value as determined attributable to the fixed assets and operating lease right-of-use assets in
contemplation of the sale of the fye segment, it was determined that the fixed assets and operating right-of-use assets were fully impaired.
Interest Expense. Interest expense in fiscal 2019 was $0.9 million, compared to $0.7 million in fiscal 2018.
Other Loss (Income). Other loss was $0.4 million in fiscal 2019 compared to income of $0.2 million in fiscal 2018.
Income Tax Expense. The following table sets forth a year-over-year comparison of the Company’s income tax expense:
|
(amounts in thousands)
|
2019 vs. 2018
|
|||||||||||
|
2019
|
2018
|
|
$ |
|||||||||
|
Income tax expense
|
$
|
321
|
$
|
80
|
$
|
241
|
||||||
|
Effective tax rate
|
(0.5
|
%)
|
(0.1
|
%)
|
||||||||
The fiscal 2019 and fiscal 2018 income tax expense includes state taxes and the accrual of interest on the reserve for uncertain tax positions.
Net Loss. The following table sets forth a year-over-year comparison of the Company’s net loss:
|
(amounts in thousands)
|
2019 vs. 2018
|
|||||||||||
|
2019
|
2018
|
|
$ | |||||||||
|
Net loss
|
$
|
(58,744
|
)
|
$
|
(97,382
|
)
|
$
|
38,638
|
||||
|
Net loss as a percentage of total revenue
|
(18.0
|
%)
|
(23.3
|
%)
|
||||||||
Net loss was $58.7 million for fiscal 2019, compared to $97.4 million for fiscal 2018. Included in the results for fiscal 2019 and fiscal 2018 are non-cash impairment charges of $24.0 million and $59.7 million,
respectively, as a result of recording impairment against certain fixed assets and right to use assets in the fye segment and impairment against fixed assets, intangible assets, and goodwill in the etailz segment. The decrease in net loss was
primarily due to a decrease in asset impairment charges.
25
LIQUIDITY AND CAPITAL RESOURCES
Liquidity and Cash Flows:
The consolidated financial statements for the year ended February 1, 2020 were prepared on the basis of a going concern which contemplates that the Company will be able to realize assets and satisfy liabilities and commitments in the normal
course of business. The ability of the Company to meet its liabilities and to continue as a going concern is dependent on improved profitability, the continued implementation of the strategic initiative to reposition etailz as a platform of
software and services, the availability of future funding, implementation of one or more corporate initiatives to reduce costs at the parent company level (which could include a voluntary delisting from NASDAQ and deregistering of our Common Stock
in order to substantially eliminate the costs associated with being a public company), satisfying all unassumed liabilities of the fye segment and other strategic alternatives, including selling all or part of the remaining business or assets of
the Company, and overcoming the impact of the COVID-19 pandemic.
The audited consolidated financial statements do not include any adjustments that might result from the outcome of these uncertainties.
The Company incurred net losses of $58.7 million and $97.4 million for the fiscal 2019 and fiscal 2018, respectively, and has an accumulated deficit of $109.0 million at February 1, 2020. In addition, net cash used in operating activities during
fiscal 2019 was $15.8 million. Net cash used in operating activities during fiscal 2018 was $25.5 million.
During the third quarter of fiscal 2019, based on recurring losses from operations, the expectation of continuing operating losses, and uncertainty with respect to any available future funding, the Company concluded that there was substantial
doubt about the Company’s ability to continue as a going concern. As a response, the Company pursued several strategic initiatives towards its strategy of shifting its focus solely to the operation of etailz, improving profitability and meeting
future liquidity needs and capital requirements. These following initiatives were completed during the first quarter of fiscal 2020 include:
| • |
The sale of the For Your Entertainment (fye) business;
|
| • |
The establishment of a new secured $25 million revolving credit facility with Encina:
|
| • |
The execution of a separate subordinated loan agreement for etailz, Inc. (the “Subordinated Loan”); and
|
| • |
The receipt by etailz, Inc. of loan proceeds pursuant to the Paycheck Protection Plan under the Coronavirus Aid, Relief, and Economic Security Act. For additional details, see Note 1 of the Notes to the Consolidated Financial Statements.
|
Notwithstanding the foregoing, the ability of the Company to meet its liabilities and to continue as a going concern is dependent on improved profitability, the continued implementation of the strategic initiative to
reposition etailz as a platform of software and services, the availability of future funding, implementation of one or more corporate initiatives to reduce costs at the parent company level (which could include a voluntary delisting from NASDAQ and
deregistering of our Common Stock in order to substantially eliminate the costs associated with being a public company), satisfying all unassumed liabilities of the fye segment and other strategic alternatives, including selling all or part of the
remaining business or assets of the Company, and overcoming the impact of the COVID-19 pandemic.
26
There can be no assurance that we will be successful in further implementing our business strategy or that the strategy, including the completed initiatives, will be successful in sustaining acceptable levels of
sales growth and profitability. As a result, the Company has concluded that there is substantial doubt about the Company’s ability to continue as a going concern for a period of one year after the date of filing of this Annual Report on
Form 10-K. In addition, the proceeds from the PPP Loan are subject to audit and there is a risk of repayment.
The Company’s primary sources of liquidity are its borrowing capacity under its New Credit Facility, available cash and cash equivalents, and to a lesser extent, cash generated from operations. Our cash requirements relate primarily to working
capital needed to operate etailz, including funding operating expenses, the purchase of inventory and capital expenditures. Our ability to achieve profitability and meet future liquidity needs and capital requirements will depend upon numerous
factors, including the timing and amount of our revenue; the timing and amount of our operating expenses; the timing and costs of working capital needs; successful implementation of our strategy and planned activities; and our ability to overcome the
impact of the COVID-19 pandemic.
In addition to the aforementioned current sources of existing working capital, the Company is continuing its efforts to generate additional sales and increase margins. There can be no assurance that any of the initiatives or strategic alternatives
will be implemented, successful or consummated.
The following table sets forth a two-year summary of key components of cash flow and working capital:
|
(amounts in thousands)
|
2019
|
2018
|
2019 vs.
2018
|
||||||||||
|
Operating Cash Flows
|
$
|
(15,827
|
)
|
$
|
(25,518
|
)
|
$
|
9,691
|
|||||
|
Investing Cash Flows
|
(2,696
|
)
|
(2,342
|
)
|
(354
|
)
|
|||||||
|
Financing Cash Flows
|
13,149
|
(1,420
|
)
|
14,569
|
|||||||||
|
Capital Expenditures
|
(2,823
|
)
|
(3,689
|
)
|
866
|
||||||||
|
End of Period Balances:
|
|||||||||||||
|
Cash, Cash Equivalents, and Restricted Cash
|
(1)
|
8,852
|
14,226
|
(5,374
|
)
|
||||||||
|
Merchandise Inventory
|
67,958
|
94,842
|
(26,884
|
)
|
|||||||||
|
Working Capital
|
22,126
|
65,947
|
(43,821
|
)
|
|||||||||
|
(1)
|
Cash and cash equivalents per Consolidated Balance Sheets
|
$
|
2,977
|
$
|
4,355
|
||||
|
Add: Restricted cash
|
5,875
|
9,871
|
|||||||
|
Cash, cash equivalents, and restricted cash
|
$
|
8,852
|
$
|
14,226
|
During fiscal 2019, cash used in operations was $15.8 million compared to $25.5 million in fiscal 2018. During 2019, cash used in operations consisted primarily of a net loss of $58.7 million offset by non-cash charges, including the $24.0
million impairment of long lived-assets, the $12.7 inventory net realizable adjustment and $11.5 million in depreciation and amortization and changes in operating assets and liabilities of $6.5 million. During fiscal 2018, cashed used in operations
consisted primarily of a net loss of $97.4 million offset by the non-cash charges, including $59.7 million impairment of long-lived assets and $9.1 million in depreciation and amortization and changes in operating assets and liabilities of $0.2
million. See the Consolidated Statement of Cash Flows for further detail.
27
The Company monitors various statistics to measure its management of inventory, including inventory turnover (annual cost of sales divided by average merchandise inventory balances), and accounts payable leverage (accounts payable divided by
merchandise inventory). Inventory turnover measures the Company’s ability to sell merchandise and how many times it is replaced in a year. This ratio is important in determining the need for markdowns and planning future inventory levels and
assessing customer response to our merchandise. For the etailz segment, inventory turnover in fiscal 2019 and in fiscal 2018 was 5.0 and 5.2, respectively. Accounts payable leverage measures the percentage of inventory being funded by the Company’s
product vendors. The percentage is important in determining the Company’s ability to fund its business. Accounts payable leverage on inventory for the etailz segment was 32.7% as of February 1, 2020 compared with 22.7% as of February 2, 2019.
Cash used in investing activities was $2.7 million in fiscal 2019, compared to cash flows used in investing activities of $2.3 million in fiscal 2018. During fiscal 2019, cash used in operating investing activities primarily consisted of capital
expenditures. During fiscal 2018, cash used in investing activities consisted of $1.4 million in capital distributions received from the joint venture, more than offset by $3.7 million in capital expenditures.
The Company has historically financed its capital expenditures through borrowings under its revolving credit facility and cash flow from operations. The Company anticipates capital spending of approximately $1.5 million in fiscal 2020.
Cash provided by financing activities was $13.1 million in fiscal 2019, compared to cash used in financing activities of $1.4 million in fiscal 2018. In fiscal 2019, cash provided by financing activities consisted of net proceeds from short term
borrowings. In fiscal 2018, cash used in financing activities was primarily comprised of a $1.5 million payment paid to the etailz shareholders in connection with the share purchase agreement signed during the acquisition of etailz during fiscal
2016.
Off-Balance Sheet Arrangements. The Company has no off-balance sheet arrangements as defined by Item 303 (a) (4) of Regulation S-K.
Related Party Transactions.
Prior to the consummation of the FYE Transaction, the Company leased its 181,300 square foot distribution center/office facility in Albany, New York from an entity controlled by the estate of Robert J. Higgins, its former Chairman and largest
shareholder. The distribution center/office lease commenced on January 1, 2016 and expires on December 31, 2020.
Under the lease accounted for as an operating lease, the Company paid $1.2 million in both fiscal 2019 and fiscal 2018, which were included in selling, general and administrative expenses in the Statement of Operations. As of February 1, 2020,
the Company owed $1.1 million on the operating lease liability, which is included in the current portion of operating lease liabilities on the Balance Sheet. Under the terms of the lease agreement, the Company is responsible for property taxes and
other operating costs with respect to the premises.
On February 20, 2020, as part of the FYE Transaction, the Company assigned the rights and obligations of the lease to Sunrise Records.
Directors Jonathan Marcus, Thomas Simpson, and Michael Reickert are the chief executive officer of Alimco Re Ltd. (“Alimco”), the managing member of Kick-Start III, LLC and Kick-Start IV, LLC (“Kick-Start”), and a trustee of the Robert J. Higgins
TWMC Trust (the “Trust”), an affiliate of RJHDC, LLC (“RJHDC” and together with Alimco and Kick-Start, “Related Party Entities”), respectively. The Related Party Entities are parties to the following agreements with the Company entered into on March
30, 2020:
28
| • |
Subordinated Loan and Security Agreement, pursuant to which the Related Party Entities made a $5.2 million secured term loan ($2.7 million from Alimco, $0.5 million from Kick-Start, and $2.0 million from RJHDC) to etailz with a scheduled
maturity date of May 22, 2023, interest accruing at the rate of twelve percent (12%) per annum and compounded on the last day of each calendar quarter by becoming a part of the principal amount, and secured by a second priority security
interest in substantially all of the assets of the Company and etailz;
|
| • |
Common Stock Purchase Warrants (“Warrants”), pursuant to which the Company issued warrants to purchase up to 244,532 shares of Common Stock to the Related Party Entities (127,208 shares for Alimco, 23,401 shares for Kick-Start, and 93,923
shares for RJHDC), subject to adjustment in accordance with the terms of the Warrants, at an exercise price of $0.01 per share;
|
| • |
Contingent Value Rights Agreement (the “CVR Agreement”), pursuant to which the Related Party Entities received contingent value rights (“CVRs”) representing the contractual right to receive cash payments from the Company in an amount
equal, in the aggregate, to 19.9% of the proceeds (10.35% for Alimco, 1.90% for Kick-Start, and 7.64% for RJHDC) received by the Company in respect of certain intercompany indebtedness owing to it by etailz and/or its equity interest in
etailz; and
|
| • |
Voting Agreement (the “Voting Agreement”), pursuant to which the Related Party Entities, the Trust, Mr. Simpson and their respective related entities agreed to how their respective shares of the Company’s capital stock held by the parties
will be voted with respect to (i) amending the Articles of Incorporation of the Company to set the size of the Board of Directors of the Company at three directors, (ii) the designation, election, removal, and replacement of members of the
Board and (iii) how shares of the Company’s capital stock held by the parties to the Voting Agreement will be voted on a Sale of the Company (as defined in the Voting Agreement) with respect to which there is a shareholder vote or some other
action to take place during the ninety (90) days immediately following the date of the Voting Agreement. Pursuant to the Voting Agreement, Messrs. Marcus and Simpson were appointed as directors of the Company, and Mr. Reickert, a trustee of
the Trust, remained as a director of the Company. Mr. Subin was also granted board observer rights.
|
CRITICAL ACCOUNTING POLICIES AND ESTIMATES
The preparation of financial statements and related disclosures in conformity with accounting principles generally accepted in the United States requires that management apply accounting policies and make estimates and assumptions that affect
results of operations and the reported amounts of assets and liabilities in the financial statements. Management bases its estimates and judgments on historical experience and other factors that are believed to be reasonable under the
circumstances. Actual results may differ from these estimates under different assumptions or conditions. Note 1 of the Notes to the Consolidated Financial Statements in this report includes a summary of the significant accounting policies and
methods used by the Company in the preparation of its consolidated financial statements. Management believes that of the Company’s significant accounting policies and estimates, the following involve a higher degree of judgment or complexity:
Merchandise Inventory and Return Costs. Merchandise inventory is stated at the lower of cost or net realizable value under the average cost method. In the current year, the
Company recorded a $12.7 million inventory adjustment to net realizable value based on the sale of its fye business after the balance street date. Inventory valuation requires significant judgment and estimates, including obsolescence, shrink and any
adjustments to net realizable value, if net realizable value is lower than cost. Inherent in the entertainment products industry is the risk of obsolete inventory. Typically, newer media releases generate a higher product demand. Some media
vendors offer credits to reduce the cost of products that are selling more slowly, thus allowing for a reduction in the selling price and reducing the possibility for items to become obsolete. For all merchandise categories, the Company records
obsolescence and any adjustments to net realizable value (if lower than cost) based on current and anticipated demand, customer preferences, and market conditions. The provision for inventory shrink is estimated as a percentage of sales for the
period from the last date a physical inventory was performed to the end of the fiscal year. Such estimates are based on historical results and trends and the shrink results from the last physical inventory. Physical inventories are taken at least
annually for all stores and the distribution center throughout the year and inventory records are adjusted accordingly.
29
The Company is generally entitled to return merchandise purchased from major music and video vendors for credit against other purchases from these vendors. Certain vendors reduce the credit with a per unit merchandise return charge which varies
depending on the type of merchandise being returned. Certain other vendors charge a handling fee based on units returned. The Company records merchandise return charges in cost of sales. The Company incurred merchandise return charges of $0.1
million and $0.4 million in fiscal 2019 and fiscal 2018, respectively.
Shrink expense, including obsolescence was $2.5 million and $3.4 million in fiscal 2019 and fiscal 2018, respectively. As a rate to net sales, this equaled 0.8% for fiscal 2019 and 2018.
Long-Lived Assets other than Goodwill: Long-lived assets are reviewed for impairment whenever events or changes in circumstances indicate that the carrying amount of an asset may not be recoverable.
Recoverability of assets to be held and used is measured by a comparison of the carrying amount of an asset to undiscounted future net cash flows expected to be generated by the asset over its remaining useful life. If the carrying amount of an
asset exceeds its estimated future cash flows, an impairment charge is recognized by the amount by which the carrying amount of the assets exceeds the fair value of the assets. Fair value is generally measured based on discounted estimated future
cash flows. Assets to be disposed of would be separately presented in the Consolidated Balance Sheets and reported at the lower of the carrying amount or fair value less disposition costs. For the purpose of the asset impairment test, the fye
segment has two asset groupings – corporate and store level assets. For the purposes of the asset impairment test, the etailz segment has one asset grouping, which is the same as the etailz segment.
During fiscal 2019 and fiscal 2018, the Company concluded, based on continued operating losses within the fye segment driven by lower than expected sales that triggering events had occurred in each respective fiscal year, and pursuant to FASB ASC
360, Property, Plant, and Equipment, an evaluation of the fye fixed assets for impairment was required. Fixed assets and operating lease right-of-use assets, primarily at the Company’s retail store
locations, as well as certain fixed assets at the corporate location, consisting of the home office and the Albany distribution center, where impairment was determined to exist were written down to their estimated fair values as of the end of fiscal
2019 and fiscal 2018, resulting in the recording of asset impairment charges of $23.2 million and $1.9 million, respectively. Based on the fair value as determined attributable to the fixed assets and operating lease right-of-use assets in
contemplation of the fye segment, it was determined that as of the end of fiscal 2019, the fixed assets and operating lease right-of-use assets were fully impaired.
During fiscal 2019 and fiscal 2018, the Company concluded, based on continued operating losses for the etailz segment that a triggering event had occurred, and pursuant to FASB ASC 360, Property, Plant, and
Equipment, an evaluation of the etailz fixed assets and intangible assets for impairment was required. For fiscal 2019, intangible assets related to vendor relationships were fully impaired resulting in the recognition of asset impairment
charges of $0.8 million. For fiscal 2018, fixed assets related to internally developed technology at etailz were written down to their estimated fair values resulting in the recognition of asset impairment charges of $2.1 million and intangible
assets related to technology and vendor relationships were written down to their estimated fair values resulting in the recognition of asset impairment charges of $16.4 million.
Recently Issued Accounting Pronouncements.
The information set forth above may be found under Notes to Consolidated Statements, Note 2.
| Item 7A. |
QUANTITATIVE AND QUALITATIVE DISCLOSURES ABOUT MARKET RISK
|
Not required under the requirements of a Smaller Reporting Company.
30
| Item 8. |
FINANCIAL STATEMENTS AND SUPPLEMENTARY DATA
|
The index to the Company’s Consolidated Financial Statements is included in Item 15, and the Consolidated Financial Statements follow the signature page to this report and are incorporated herein by reference.
The quarterly results of operations are included herein in Note 14 of Notes to the Consolidated Financial Statements in this report.
| Item 9. |
CHANGES IN AND DISAGREEMENTS WITH ACCOUNTANTS ON ACCOUNTING AND FINANCIAL DISCLOSURE
|
None.
| Item 9A. |
CONTROLS AND PROCEDURES
|
Conclusion Regarding the Effectiveness of Disclosure Controls and Procedures: Under the supervision and with the participation of our management, including our principal executive officer and principal
financial officer, we conducted an evaluation of the effectiveness of our disclosure controls and procedures, as such term is defined under Rule 13a-15(e) promulgated under the Securities Exchange Act of 1934, as amended (the “Exchange Act”). Based
on this evaluation, our principal executive officer and our principal financial officer concluded that the Company’s disclosure controls and procedures were designed to provide reasonable assurance of achieving their objectives and as of the end of
the period covered by this annual report, our disclosure controls and procedures were effective, in that they provide reasonable assurance that information required to be disclosed by us in the reports we file or submit, under the Exchange Act, is
recorded, processed, summarized, as appropriate, to allow timely decisions regarding required disclosure and reported within the time period specified in the Securities and Exchange Commission’s rules and forms and that such information is
accumulated and communicated to management including the principal executive officer and principal financial officer.
Management’s Report on Internal Control Over Financial Reporting: Management is responsible for establishing and maintaining adequate internal control over
financial reporting (as defined in Rule 13a-15(f) and 15d – 15(f) under the Exchange Act, as amended). Under the supervision and with the participation of the Company’s management, including our principal executive officer and principal financial
officer, we conducted an evaluation of the effectiveness of our internal control over financial reporting based on the framework set forth by the Committee of Sponsoring Organizations of the Treadway Commission (“COSO”) in Internal Control-Integrated Framework (2013). Based on our evaluation under the framework in Internal Control-Integrated Framework (2013), our management concluded that our internal
control over financial reporting was effective as of February 1, 2020.
Changes in Controls and Procedures: As of February 1, 2020, there have been no changes in the Company’s internal controls over financial reporting that occurred during fiscal 2019
that have materially affected, or are reasonably likely to materially affect, the Company’s internal controls over financial reporting. We have not experienced any material impact to our internal controls over financial reporting despite the fact
that most of our employees are working remotely due to the COVID-19 pandemic. We are continually monitoring and assessing the COVID-19 situation on our internal controls to minimize the impact on their design and operating effectiveness.
31
| Item 9B. |
OTHER INFORMATION
|
No events have occurred which would require disclosure under this Item 9B.
PART III
| Item 10. |
DIRECTORS, EXECUTIVE OFFICERS AND CORPORATE GOVERNANCE
|
The biographies of each of the member of our Board of Directors (the “Board”) contain applicable information regarding the person’s service as a director, business and other professional experience, director positions
held currently or at any time during the last five years, and the experiences, qualifications, attributes or skills that caused the Board to determine that the person should serve as a director for the Company. The Company believes that the
backgrounds and qualifications of its directors, considered as a group, should provide the Company and the Board with diverse business and professional capabilities, along with the experience, knowledge and other abilities that will allow the Board
to fulfill its responsibilities. See “Related Party Transactions” for additional information regarding certain relationships between our directors and the Company.
Jonathan Marcus, has been the Chief Executive Officer of Alimco Financial Corporation since March 2019. Prior to March 2019, Mr. Marcus was a managing member and co-founder of
Broadbill Partners, L.P., a fund focused on special situations and distressed securities. Prior to Broadbill’s inception in 2011, he was the chief investment officer of Cypress Management, L.P., the predecessor fund to Broadbill, which he founded in
1995 to specialize in investing in distressed securities. Jon’s career also includes extensive investment banking and financial advisory work at Prudential-Bache Securities and Credit Suisse First Boston, with a substantial focus advising
financially troubled companies or their creditors. Jon currently serves on the boards of directors of Alimco and Anacomp, Inc.
W. Michael Reickert, has been the managing member of Independent Family Office, LLC since 2005. Prior to founding Independent Family Office in 2005, Mr. Reickert was employed by
The Ayco Company, LP. From 1986 to 2004 in various positions, including Executive Vice President. Mr. Reickert provides the Board with financial and investment expertise. Mr. Reickert is a trustee of the Robert J. Higgins TWMC Trust, which is our
largest shareholder, and is also trustee of various other trusts.
Tom Simpson, has been the Chief Executive Officer of Ignite Northwest since July 2019. Prior to Ignite, Mr. Simpson was self-employed as Principal of Northwest Venture
Associates. Previously, he was Co-Founder and Executive Chairman of etailz prior to being acquired by the Company in 2016. Mr. Simpson provides the Board with over 35 years of experience as an investment banker, venture capitalist, angel investor
and entrepreneur, including his role as founder of etailz. In addition to his role with Ignite, he is President of the Spokane Angel Alliance, Managing Member of Kick-Start angel investment funds and currently serves on the boards of Medcurity,
Oddjobbers, Reenue, Spiceology, Sportscope and Vaagen Timbers.
Information About Our Executive Officers
The Company’s executive officers are identified below:
Kunal Chopra has been the Principal Executive Officer of the Company since March 2020 and Chief Executive Officer of etailz since September 2019. Prior to joining etailz, Mr.
Chopra was General Manager – Worldwide Learning for Microsoft from April 2018. From August 2016 through April 2018, Mr. Chopra served as General Manager – Amazon Fashion. Prior to joining Amazon, Mr. Chopra served as Chief Operating Officer of
Unikrn from March 2015 through August 2016.
32
Edwin Sapienza has been Chief Financial Officer of the Company since October 2018. Prior to being named Chief Financial Officer, Mr. Sapienza was the Company’s Vice President –
Strategy, Secretary and Treasurer since 2012, and has continued in those roles, in addition to serving as Chief Financial Officer. Mr. Sapienza joined the Company in 1993 as a staff accountant.
Compensation of Directors
The following table sets forth information regarding compensation of directors for the fiscal year ended February 1, 2020:
|
Name
|
Fees
Earned
or Paid in
Cash ($)(1)
|
Stock
Awards
($)
|
Option
Awards
($)(2)(4)
|
All Other
Compensation
($)
|
Total
Compensation
($)
|
|||||||||||||||
|
Martin Hanaka(3)
|
120,361
|
—
|
—
|
—
|
120,361
|
|||||||||||||||
|
Jeff Hastings
|
50,962
|
—
|
2,520
|
—
|
53,482
|
|||||||||||||||
|
Robert Marks
|
123,000
|
—
|
—
|
—
|
123,000
|
|||||||||||||||
|
Michael Nahl
|
187,500
|
—
|
—
|
—
|
187,500
|
|||||||||||||||
|
W. Michael Reickert
|
174,000
|
—
|
—
|
—
|
174,000
|
|||||||||||||||
|
Michael B. Solow
|
232,508
|
—
|
—
|
—
|
232,508
|
|||||||||||||||
| (1) |
Fees earned reflect the amount of cash received for the annual retainer, Board and committee meeting fees . Fees earned for Mr. Solow reflect an annual retainer of $50,000 for his role as Chairman of the Board.
|
| (2) |
Amount represents the grant date fair value as computed in accordance with Accounting Standards Codification Topic 718, relating to the grant of stock options to Mr. Hastings in 2019. See Note 9 to the Consolidated Financial Statements in
the Company’s 2019 Annual Report on Form 10-K for the assumptions made in determining the value. Effective August 8, 2019, 15,000 stock options were awarded to Mr. Hastings.
|
| (3) |
Mr. Hanaka did not stand for re-election at the 2019 Shareholders’ Annual Meeting. Upon his exit from the Board, Mr. Hanaka received payment of his deferred income in the form of cash and shares.
|
| (4) |
As of June 15, 2020, Mr. Hanaka, Mr. Nahl, Mr. Reickert, Mr. Hastings and Mr. Marks each held options to purchase 15,000 shares.
|
Cash Compensation. Each director who is not a salaried employee of the Company receives a $12,500 retainer per annum plus a $2,000 attendance fee for each Board meeting attended
and a $1,000 attendance fee for each committee meeting attended, except that the compensation for telephone conference meetings is $1,000 and $500 for Board and committee telephone conference meetings, respectively. A committee chairperson receives
an additional $5,000 retainer per year and the Audit Committee chairperson receives a $15,000 annual retainer. The Chairman of the Board receives an annual retainer of $50,000. The Company may, in its discretion, determine to pay all or a portion of
any annual retainer in shares of Common Stock in lieu of cash and to make discretionary grants of Common Stock to non-employee directors from time to time. The Company has not elected to pay the annual retainer in shares or make discretionary grants
during the past three years.
Additional Compensation. Currently, each director is eligible to participate in the Amended and Restated 2005 Long Term Incentive Plan. During the 2019 fiscal year, options to
purchase 15,000 Company shares were granted to Mr. Hastings.
Prior to fiscal 2019, on or about May 1 of each year, non-employee directors have been entitled to receive grants of vested shares of Common Stock representing $80,000 in market value of stock on the grant date for
service over the prior twelve months. They were entitled to elect to receive cash instead of shares of Common Stock to the extent they met a share ownership requirement (shares having a value at least equal to 4x the annual retainer).
33
Effective for amounts otherwise payable on or about May 1, 2019 and thereafter, in lieu of annual grants of shares having a fair market value of $80,000 on the date of grant, each non-employee director will be entitled
to receive annual payments of $80,000 in cash, provided they are serving as a director on the applicable payment date. Except to the extent a timely deferral election was made by the non-employee director, the amount payable in May of 2019 was made
in a single lump sum in May of 2019. Payments to non-employee directors for periods beginning after May 1, 2019 will generally be made in $20,000 increments paid quarterly in arrears on or about August 1, November 1, February 1 and May 1, provided
they are serving as a director on the payment date and they did not make a timely deferral election. To the extent a non-employee director made a timely election to defer payments until separation from service with the Company, such payments will be
made upon separation from service, together with interest on the deferred amounts computed at a rate equal to 120% of the applicable long-term federal rate (within the meaning of Section 1274(d) of the Internal Revenue Code of 1986, as amended) as in
effect from time to time.
Code of Ethics
We have adopted the Trans World Entertainment Corporation Code of Ethics that applies to all officers, directors, employees and consultants of the Company. The Code of Ethics is intended to comply with Item 406 of
Regulation S-K of the Securities Exchange Act of 1934 and with applicable rules of The NASDAQ Stock Market, Inc. Our Code of Ethics is posted on our Internet website under the “Corporate” page. Our Internet website address is www.twec.com. To the
extent required by the rules of the SEC and NASDAQ, we will disclose amendments and waivers relating to our Code of Ethics in the same place on our website.
Guidelines for Evaluating Independence of Directors
The Board has determined that all of the directors are independent directors in accordance with the standards of the NASDAQ Stock Market and as described below. The Nominating and Corporate Governance Committee as well
as the Board annually reviews relationships that directors may have with the Company to make a determination of whether there are any material relationships that would preclude a director from being independent.
The standards relied upon by the Board in affirmatively determining whether a director is “independent,” in compliance with the rules of the NASDAQ Stock Market, are comprised of those objective standards set forth in
the NASDAQ rules. The Board is responsible for ensuring that independent directors do not have a material relationship with the Company or its affiliates or any executive officer of the Company or his or her affiliates.
The Audit Committee
The Board has an Audit Committee whose current members are: Jonathan Marcus (Chairman), Mr. Reickert, and Mr. Simpson. The members of the Audit Committee, in the opinion of the Board, are “independent” (as defined under the standards of the
NASDAQ Stock Market) of management and free of any relationship that would interfere with their exercise of independent judgment as members of the Audit Committee. Mr. Marcus is the Chairman of the Audit Committee, and the Board has determined that
he is both independent and qualified as an Audit Committee financial expert as such term is defined under the rules and regulations promulgated by the Securities and Exchange Commission. The Audit Committee, which consisted of Jeff Hastings, Rob
Marks, Michael Nahl and Mike Solow through March 31,2020, held four meetings during the 2019 fiscal year. The Audit Committee’s responsibilities consist of the selection, appointment and authorization of independent accountants, reviewing the scope
of the audit conducted by such accountants, as well as the audit itself, and reviewing the Company’s audit activities and matters concerning financial reporting, accounting and audit procedures, related party transactions and policies generally. The
Audit Committee was established in accordance with Section 3(a)(58)(A) of the Securities Exchange Act of 1934. The Board of Directors has adopted a written charter for the Audit Committee, a copy of which is attached as Appendix A to the 2018 Proxy
Statement.
34
The Compensation Committee
The Board of Directors has a Compensation Committee, consisting solely of independent Directors, whose current members are: Mike Reickert (Chairman), Jonathan Marcus and Tom Simpson. The Compensation Committee which
consisted of Jeff Hastings, Rob Marks, Michael Nahl and Mike Solow through March 31,2020, held two meetings during the 2019 fiscal year. The Compensation Committee formulates and gives effect to policies concerning salary, compensation, stock options
and other matters concerning employment with the Company. The processes and procedures used for the consideration and determination of executive compensation are described in the section of this Proxy Statement captioned “Compensation Discussion and
Analysis.” The Board of Directors has adopted a written charter for the Compensation Committee, a copy of which is attached as Appendix B to the 2019 Proxy Statement.
The Nominating and Corporate Governance Committee
The Board of Directors has a Nominating and Corporate Governance Committee, consisting solely of independent Directors, whose current members are: Tom Simpson (Chairman), Jonathan Marcus and Mike Reickert. The
Nominating and Corporate Governance Committee, which consisted of Jeff Hastings, Rob Marks, Michael Nahl and Mike Solow through March 31,2020, held five meetings during the 2019 fiscal year. The Nominating Committee develops qualification criteria
for Board members; interviews and screens individuals qualified to become Board members in order to make recommendations to the Board; and oversees the evaluation of executive management. The Committee seeks to select a Board that is strong in its
collective knowledge of and diversity of skills and experience concerning retail operations, accounting and finance, management and leadership, vision and strategy, risk assessment and corporate governance. The Board of Directors has adopted a
written charter for the Nominating and Corporate Governance Committee, a copy of which is attached as Appendix C to the 2019 Proxy Statement.
The Nominating and Corporate Governance Committee will consider nominations submitted by shareholders. To recommend a nominee, a shareholder should write to the Company’s Secretary. See “Submission of Shareholder
Proposals” in this Proxy Statement. Any recommendation must include (i) the name and address of the candidate, (ii) a brief biographical description, including his or her occupation for at least the last five years, and a statement of the
qualifications of the candidate, taking into account the qualification requirements summarized above, and (iii) the candidate’s signed consent to be named in the Proxy Statement and to serve as a Director if elected. The Nominating and Corporate
Governance Committee may seek additional biographical and background information from any candidate which, to be considered, must be received on a timely basis.
The process followed by the Nominating and Corporate Governance Committee to identify and evaluate candidates includes requests to Board members and others for recommendations, including a search firm or
outside consultant, meetings from time to time to evaluate biographical information and background material relating to potential candidates and interviews of selected candidates by members of the Nominating and Corporate Governance Committee
and the Board. Assuming the appropriate biographical and background material is provided for candidates submitted by shareholders, the Nominating and Corporate Governance Committee will evaluate those candidates by following substantially the
same process, and applying substantially the same criteria, as for candidates submitted by Board members. While the Company does not have a formal diversity policy for Board of Director membership, the Nominating and Corporate Governance
Committee and the Board of Directors, as a whole, seeks nominees or candidates to serve as directors that represent a variety of backgrounds and experience that will enhance the quality of the Board of Director’s deliberations and decisions.
The Nominating and Corporate Governance Committee considers, among other factors, diversity with respect to viewpoint, skills and experience in its evaluation of candidates for Board of Director membership. Such diversity considerations are
discussed by the Nominating and Corporate Governance Committee in connection with the general qualifications of each potential nominee.
35
|
Item 11.
|
EXECUTIVE COMPENSATION
|
Introduction
This section describes the material elements of compensation for the Company’s executive officers identified in the Summary Compensation Table below (who are referred to below as the “named executive officers” or
“NEOs”), the process by which such elements are determined and established by the Compensation Committee for the respective individuals and the principles and considerations underlying such determinations.
Compensation Objectives and Approach
The objectives of our compensation programs are to attract, motivate, retain and reward executives and employees who will make substantial contributions toward the Company meeting the financial, operational and
strategic objectives that we believe will build value for the Company’s shareholders. In an effort to achieve these objectives, the key elements of such programs consist of base salary, annual performance-based cash bonuses and share-based
compensation.
The Compensation Committee’s compensation determinations regarding the named executive officers are reviewed by the full Board. Generally, these determinations are made annually and occur at the Compensation
Committee’s regular meeting of each fiscal year occurring in April, at which cash bonuses and share-based awards, if any, relating to the named executive officers’ performance during the preceding fiscal year are granted, and any base salary
adjustments for the current year are implemented. In preparation for these meetings, the Chief Executive Officer meets with the Compensation Committee Chairman to present his preliminary compensation proposals relating to the named executive
officers to be addressed in the April meeting, based on the planned full-year financial results for the Company and its subsidiaries.
The Compensation Committee reviews and approves each element of compensation for the named executive officers. In establishing the levels and components of compensation for the named executive officers, the
Compensation Committee, as a threshold matter, evaluates the overall performance of the Company for the year.
Key elements considered in the Compensation Committee’s performance evaluations include corporate performance, the officer’s contributions to such performance and the officer’s other accomplishments for the benefit
of the Company during such period. In these evaluations, the Compensation Committee does not apply rigid formulas with respect to amount of compensation paid or the allocation between cash and non-cash compensation, and reviews long-term financial
performance, as well as financial performance for the previous year. Such evaluations also take into account the nature, scope and level of the named executive officer’s responsibilities and the officer’s level of experience, past levels of
compensation and changes in such levels, tenure with the Company and other opportunities potentially available to such officer. In addition, the members of the Compensation Committee interact with each of the named executive officers in connection
with regular meetings of the Board, which provides the Compensation Committee with an additional basis for evaluating such officer and his performance. Based on all of these general evaluative factors and the additional factors described below, the
Compensation Committee makes its assessments and determines the components and levels of compensation for each such officer.
Management meets with members of the Compensation Committee to assist the Compensation Committee in making compensation decisions regarding our named executive officers and also to discuss with the Compensation
Committee its recommendations for other executives. We believe that since our management has extensive knowledge regarding our business, they are in a position to provide valuable input. Specifically, our Chief Executive Officer provides input
relevant to setting performance goals and certifies to the Compensation Committee the level of achievement of our performance targets under our Executive Officer Bonus Plan and The Trans World Entertainment 2005 Long Term Incentive and Share Award
Plan (As Amended and Restated on April 5, 2017) (the “2005 Plan”).
Compensation Committee-Assessment of Risk
Each year, the Compensation Committee reviews the Company’s compensation programs to assess risk in the Company’s compensation programs. As part of its consideration, the Compensation Committee considers any
potential risks that could arise from the Company’s compensation policies and practices and the extent to which any of those risks would be reasonably likely to have a material adverse effect on the Company. The Compensation Committee considers all
facets of the compensation programs, their underlying assumptions, and the objectives those programs were designed to achieve. Some of the factors the Compensation Committee considers to minimize potential risks are the balance between cash and
stock awards, the various time frames associated with earning of awards (seasonal, annual and multi-year vesting) and the different performance metrics associated with the incentive awards for each of the Company’s businesses and corporate
associates. After that review, the Compensation Committee has determined that the Company’s compensation programs for fiscal 2019 did not incentivize its associates, including senior executives, to take unnecessary and excessive risks that could
jeopardize the future of the Company and would be adverse to the best interests of its shareholders.
36
The Company has sought to structure its overall compensation program to contain an appropriate mix of long-term and short-term incentives that balance risk and potential reward in a manner that is appropriate to the
circumstances and in the best interest of the Company’s shareholders. In particular, equity-based awards are structured to vest generally over a number of years, which encourages employees to focus on long-term results. Moreover, both annual
incentive bonus and performance-based equity awards are subject to discretionary reduction if determined appropriate by the Compensation Committee. The Company believes that these factors reduce any incentive that employees may have to take
inappropriate risks. Accordingly, the Company believes that its compensation policies and practices encourage and incentivize the employees to improve results in a disciplined, focused manner, with a view toward long-term success.
Cash Compensation
The Company pays base salaries at levels it believes will attract and retain key employees and ensure that our compensation program is competitive. Base salaries for the named executive officers are established by
the Compensation Committee and reviewed by such Compensation Committee for potential adjustment on an annual basis, based on the considerations described in the preceding section. The base salary amounts paid to the named executive officers during
the 2019 fiscal year are shown in the “Summary Compensation Table”.
The annual incentive bonus plan, the results of which are shown in the Summary Compensation Table in the Non-Equity Incentive Plan Compensation column, provides for a cash bonus, dependent upon the level of
achievement of the stated corporate goals, calculated as a percentage of the officer’s base salary, with higher ranked executive officers being compensated at a higher percentage of base salary. The Compensation Committee approves the target annual
incentive award for the Chief Executive Officer and, for each officer below the Chief Executive Officer level, bases the target in part on the Chief Executive Officer’s recommendations. At the target level of bonus for fiscal year 2019, the Chief
Executive Officer would receive 100% of his base salary and the other NEOs would receive 60% of their salary. For the 2019 fiscal year, the performance goal adopted for annual bonuses was based on limiting losses before interest, taxes,
depreciation and amortization (“EBITDA”) to not more than $6.0 million or achieving sales of at least $375 million. Since the Company’s loss before interest, taxes, depreciation and amortization and its sales did not achieve the target thresholds,
incentives were not earned under the annual incentive bonus plan. During 2019, as required by their Severance, Retention and Restrictive Covenant Agreements with the Company, Mr. Sapienza received a guaranteed bonus of $100,000 and a retention
bonus of $133,000 and Mr. Eisenberg received a retention bonus of $100,000.
Share-Based Compensation
The Company believes that a component of its officers’ compensation should consist of share-based incentive compensation, which appreciates or depreciates in value in relation to the market price of our Common
Stock. Accordingly, the Compensation Committee has in recent years made, and intends in the future to continue to make, grants of share-based awards to the named executive officers and other key employees in such amounts as the Compensation
Committee believes will accomplish the objectives of our compensation programs. As discussed below, the holder’s ability to realize any financial benefit from these awards typically requires the fulfillment of substantial vesting requirements that
are performance contingency-related in some cases and time-related in others. Accordingly, the Company believes that these awards provide substantial benefit to the Company in creating appropriate performance incentives and in facilitating the
long-term retention of employees who add significant value.
Retirement and Other Benefits
The Company’s benefits program includes retirement plans and group insurance plans. The objective of the program is to provide named executive officers with reasonable and competitive levels of protection against
the four contingencies (retirement, death, disability and ill health) which could interrupt their employment and/or income received as an active employee. Retirement plans, including the supplemental executive retirement plan, are designed to
provide a competitive level of retirement income to named executive officers and to reward them for continued service with the Company. The retirement program consists of a supplemental executive retirement plan and the 401(k) plan.
37
The group insurance program consists of life, disability and health insurance benefit plans that cover all full-time management and administrative employees and the supplemental long-term disability plan, which
covers the named executive officers and other officers.
Other Compensation
The Company continues to maintain modest executive benefits and perquisites for officers; however, the Compensation Committee in its discretion may revise, amend or add to the officer’s executive benefits and
perquisites if it deems it advisable. See the Summary Compensation Table for a summary of such benefits.
Deductibility of Compensation Expenses
Section 162(m) of the Internal Revenue Code generally disallows a tax deduction to a public corporation for annual compensation over $1 million for each of its “covered employees” (i.e., the chief executive officer,
chief financial officer and certain other current or former executive officers). Prior to the amendment of Section 162(m) in December of 2017, the deductibility of some types of compensation for named executive officers (other than the chief
financial officer) depended upon whether the named executive officer’s receipt of compensation was deferred until after the executive terminated employment with the Company or on whether such compensation qualified as “performance-based
compensation” under Section 162(m). In general, the exceptions for deferred compensation and performance-based compensation were repealed effective for years beginning after December 31, 2017. The Compensation Committee has generally sought to
satisfy the requirements necessary to allow the compensation of its named executive officers to be deductible under Section 162(m) of the Internal Revenue Code, but it has retained the discretion to approve compensation that is not deductible under
Section 162(m). In making future compensation decisions, the Compensation Committee intends to take into account any available grandfather provisions under the amendments to Section 162(m). However, the Compensation Committee believes that its
primary responsibility is to provide a compensation program that will attract, retain and reward the executive talent necessary to the success of the Company. Consequently, the Compensation Committee recognizes that the loss of a tax deduction
could be necessary or advisable in some circumstances due to the restrictions of Section 162(m).
Summary Compensation Table
The following table sets forth information regarding compensation earned by our Chief Executive Officer and two other most highly compensated Executive Officers for the fiscal year ended February 1, 2020.
|
Name
|
Principal Position
|
Year
|
Salary
($)(1)
|
Bonus
($)(2)
|
Stock
Awards
($)(3)
|
Option
Awards
($)(4)
|
Non-Equity
Incentive Plan
Compensation
($)
|
All Other
Compensation
($)(6)
|
Total
Compensation
($)
|
|||||||||||||||||||||||
|
Michael Feurer (5)
|
Former Chief Executive Officer
|
2019
|
700,000
|
—
|
—
|
—
|
—
|
11,750
|
711,750
|
|||||||||||||||||||||||
| 2018 |
700,000
|
|
—
|
49,000
|
73,500
|
|
— |
|
15,361
|
|
837,861
|
|||||||||||||||||||||
|
Bruce J. Eisenberg(5)
|
Former Executive Vice
|
2019
|
425,000
|
100,000
|
—
|
—
|
—
|
—
|
525,000
|
|||||||||||||||||||||||
|
President—Real Estate
|
2018
|
425,000
|
—
|
—
|
17,115
|
—
|
—
|
442,115
|
||||||||||||||||||||||||
|
Edwin J. Sapienza
|
Chief Financial Officer
|
2019
|
280,000
|
233,334
|
—
|
—
|
—
|
—
|
513,334
|
|||||||||||||||||||||||
|
|
2018 |
224,615
|
|
— |
4,900
|
12,275
|
|
— |
2,403
|
|
244,193
|
|||||||||||||||||||||
| (1) |
Salary represents amounts earned during fiscal year ended February 1, 2020.
|
| (2) |
Bonus for 2019 for Mr. Eisenberg represents the payment of a retention bonus pursuant to his Severance, Retention and Restrictive Covenant Agreement with the Company. For Mr. Sapienza, the bonus amount consists of a $133,334 retention
bonus and a $100,000 guaranteed bonus paid pursuant to his Severance, Retention and Restrictive Covenant Agreement with the Company.
|
| (3) |
Amounts represent the grant date fair value, as computed in accordance with Accounting Standards Codification Topic 718, relating to restricted share units awarded to Mr. Feurer, and Mr. Sapienza in fiscal year 2018. See Note 9 to the
Consolidated Financial Statements for the assumptions made in determining the value.
|
| (4) |
Amount represents the grant date fair value as computed in accordance with Accounting Standards Codification Topic 718, relating to the grant of stock options to the named executive officer in fiscal year 2019 and fiscal 2018. See Note
9 to the Consolidated Financial Statements for the assumptions made in determining the value.
|
| (5) |
Mr. Feurer’s employment terminated as of March 30, 2020. Mr. Eisenberg’s employment terminated as of February 28, 2020.
|
| (6) |
Includes the following payments made by the Company to the named executive officers:
|
38
|
Name
|
Year
|
Perquisites
and Other
Personal
Benefits
($)
|
Insurance
Premiums
($)
|
Company
Contributions to
Retirement and
401(K) Plans
($)
|
Death
Benefits to
Survivor
($)
|
Total ($)
|
||||||||||||||||
|
Michael Feurer
|
2019
|
11,700
|
—
|
— |
11,700
|
|||||||||||||||||
|
|
2018 |
11,700
|
—
|
3,661
|
—
|
15,361
|
||||||||||||||||
|
Bruce J. Eisenberg
|
2019
|
—
|
—
|
—
|
—
|
—
|
||||||||||||||||
|
|
2018 |
—
|
—
|
—
|
—
|
—
|
||||||||||||||||
|
Edwin J. Sapienza
|
2019
|
—
|
—
|
—
|
—
|
—
|
||||||||||||||||
|
|
2018
|
—
|
—
|
2,403
|
—
|
2,403
|
||||||||||||||||
Outstanding Equity Awards at Fiscal Year-End
The table below summarizes the named executive officers’ equity awards that were unvested or unexercised, as applicable, as of February 1, 2020.
|
Option Awards
|
Number of
|
||||||||||||||||||
|
Name
|
Grant
Date (1)
|
Number of
Securities
Underlying
Unexercised
Options (#)
Exercisable
|
Number of
Securities
Underlying
Unexercised
Options (#)
Unexercisable
|
Option
Exercise Price
($)
|
Option
Expiration
Date
|
Shares or
Units
of Stock
That
Have Not
Vested (#)(2)
|
|||||||||||||
|
Michael Feurer (3)
|
10/13/2014
|
15,000
|
—
|
70.00
|
10/13/2024
|
—
|
|||||||||||||
|
4/14/2016
|
7,860
|
—
|
77.00
|
4/14/2026
|
—
|
||||||||||||||
|
5/6/2016
|
3,750
|
1,250
|
76.20
|
5/6/2026
|
—
|
||||||||||||||
|
5/1/2017
|
7,500
|
3,750
|
37.00
|
5/1/2027
|
1,250
|
||||||||||||||
|
6/27/2018
|
1,875
|
5,625
|
19.60
|
6/27/2028
|
1,875
|
||||||||||||||
|
Bruce J. Eisenberg
|
5/6/2010
|
10,000
|
—
|
42.20
|
5/6/2020
|
—
|
|||||||||||||
|
6/21/2013
|
2,500
|
—
|
97.40
|
6/21/2023
|
—
|
||||||||||||||
|
6/3/2014
|
1,750
|
—
|
67.20
|
6/3/2024
|
—
|
||||||||||||||
|
5/15/2015
|
1,750
|
—
|
77.60
|
5/15/2025
|
—
|
||||||||||||||
|
5/6/2016
|
1,313
|
437
|
76.20
|
5/6/2026
|
—
|
||||||||||||||
|
5/1/2017
|
875
|
875
|
37.00
|
5/1/2027
|
—
|
||||||||||||||
|
Edwin J. Sapienza
|
6/27/2018
|
438
|
1,313
|
19.60
|
6/27/2028
|
—
|
|||||||||||||
|
|
3/1/2011
|
|
400
|
|
—
|
|
34.60
|
|
3/1/2021
|
|
— | ||||||||
|
5/7/2012
|
500
|
—
|
50.60
|
5/7/2022
|
—
|
||||||||||||||
|
6/21/2013
|
500
|
—
|
97.40
|
6/21/2023
|
—
|
||||||||||||||
|
6/3/2014
|
375
|
—
|
67.20
|
6/21/2023
|
—
|
||||||||||||||
|
4/1/2015
|
375
|
—
|
77.60
|
4/1/2026
|
—
|
||||||||||||||
|
5/6/2016
|
282
|
93
|
76.20
|
5/6/2026
|
—
|
||||||||||||||
|
5/1/2017
|
625
|
625
|
37.00
|
5/1/2027
|
125
|
||||||||||||||
|
6/27/2018
|
313
|
937
|
19.60
|
6/27/2028
|
188
|
||||||||||||||
|
10/23/2018
|
625
|
1,875
|
20.80
|
10/23/2028
|
750
|
||||||||||||||
| (1) |
Mr. Feurer’s, Mr. Eisenberg’s and Mr. Sapienza’s, options vested on February 20, 2020 upon the closing of the FYE Transaction.
|
| (2) |
Mr. Feurer’s and Mr. Sapienza’s Restricted Stock Units vested on February 20, 2020 upon the closing of the FYE Transaction.
|
| (3) |
Mr. Feurer’s employment terminated as of March 30, 2020. Mr. Eisenberg’s employment terminated as of February 28, 2020.
|
39
Pension Benefits
The Company maintains a non-qualified Supplemental Executive Retirement Plan (the “SERP”) for certain current and former executive officers of the Company. Mr. Eisenberg is the only one of our NEOs who participated
in the SERP. The SERP, which is a nonqualified plan, provides eligible executives defined pension benefits that supplement benefits under other retirement arrangement. The annual benefit amount is equal to 50% of the average of the participant’s
base compensation for the five years prior to retirement plus the average of the three largest bonus payments for the last five years prior to retirement, to the extent vested. Participants vest 35% after 10 years, 75% after 20 years and 100% upon
retirement at age 65 after 20 years of service. The bonus portion of the benefit vests only if the participant is employed until age 65. In addition, the benefits become vested in full upon a change in control of the Company prior to the
participant’s termination of employment or a termination of employment due to the participant’s death or disability. A change in control as defined under the SERP has not occurred. Additionally, all benefits under the SERP will be forfeited in the
event of any of the following: competitive conduct or solicitation for employment or employment of company employees, in any case during the 5 years following termination or at any time while in receipt of benefits (these restrictions are waived in
the event of a change in control); disclosure or use of confidential information; or termination for cause. Payments are made in equal installments over 20 years. The Company has established a rabbi trust whose purpose is to be a source of funds to
pay benefits to participants in the SERP.
Potential Payments Upon Termination or Change of Control
Agreement with Mr. Sapienza
On February 26, 2019 we entered into a Severance, Retention and Restrictive Covenant Agreement with Mr. Sapienza. The Severance, Retention and Restrictive Covenant Agreements provide for a
retention bonus payable to Mr. Sapienza in the amount of $200,000. One third of his retention bonus was paid to him on each of June 1, 2019, October 1, 2019, and March 1, 2020.
The Severance, Retention and Restrictive Covenant Agreement also provides that if his employment is terminated by the Company without cause or by him for good reason (as those terms are defined in
the agreements), Mr. Sapienza will be entitled to the following: (i) the continuation of his base salary for a period of six (6) months from the date of termination, (ii) any unpaid portion of his retention bonus, (iii) any unpaid annual bonus that
was earned (as determined by the Board in accordance with the applicable annual bonus plan) for the year preceding the year in which termination occurs, and (iv) payment for health insurance coverage for up to six months following termination at
the same rate as the Company pays for health insurance coverage for its active employees (with the executive required to pay for any employee-paid portion of such coverage). Payment of these amounts is contingent on the executive signing (and not
revoking within any statutory revocation period) a release of claims reasonably acceptable to the Company.
Mr. Sapienza’s agreement provides that his annual bonus for our fiscal year ending in 2020 will not be less than $100,000. It also provides that he will receive the minimum bonus if his employment
is terminated by the Company without cause or by him for good reason prior to payment of the bonus.
The agreement also includes restrictive covenants under which Mr. Sapienza agrees to confidentiality provisions, non-competition and non-solicitation covenants that apply for six months after any
termination of employment, and certain non-disparagement and cooperation covenants.
Equity Award Provisions
Pursuant to the terms of our 2005 Long Term Incentive and Share Award Plan and applicable award agreements, unvested equity awards vest upon death, disability or a change of control of the Company. All outstanding
equity awards fully vested upon February 20, 2020, the date of the FYE Transaction.
40
Supplemental Executive Retirement Plan
Under the provisions of our SERP, Mr. Eisenberg would become fully vested in his pension benefit in the event of death, disability or a change of control of the Company. The FYE Transaction did not constitute a change
in control for purposes of the SERP.
Other Executives
Mr. Feurer’s employment was terminated, effective on March 30, 2020. Under our employment agreement with Mr. Feurer, he received a lump sum payment in the amount of $570,000 and medical benefits
for up to eighteen months following termination. Additional payments will begin six months after termination and will continue for 8 months for a total payment of $1,050,000. Mr. Feurer reaffirmed his covenants relating to non-competition,
non-solicitation, confidentiality, and intellectual property. He also executed a release and agreed to non-disparagement and cooperation covenants.
Mr. Eisenberg’s employment was terminated, effective on February 28, 2020. Under our employment agreement with Mr. Eisenberg, he received a payment of $212,500, payable in weekly installments over
six months, and medical benefits for up to six months following termination. Mr. Eisenberg reaffirmed his covenants relating to non-competition, non-solicitation, confidentiality and intellectual property. He also executed a release and agreed to
non-disparagement and cooperation covenants.
CEO Pay Ratio
The Dodd–Frank Wall Street Reform and Consumer Protection Act requires companies to disclose the pay ratio of their Chief Executive Officer to their median employee. We identified our median
employee taking into account all full-time, part-time, seasonal and temporary employees.
To identify the median employee from the Company’s employee population, we compared the amount of salary and wages paid to employees as reflected in payroll records for the 2019 calendar year as
reported to the Internal Revenue Service on Form W-2 who were employed on February 2, 2019, excluding Mr. Feurer. We annualized compensation for employees hired in 2019 and employees who took an unpaid leave of absence during the year, but we did
not annualize compensation for part-time, seasonal or temporary employees. No cost-of-living adjustments were made in identifying the median employee.
The 2019 annual total compensation of our Chief Executive Officer was $711,750 million, and the 2019 annual total compensation for the median employee was $17,346. The resulting ratio of our Chief
Executive Officer’s pay to the pay of our median employee for fiscal year 2019 is 41.0 to 1. We believe it is noteworthy that given the nature of our business, a significant number of our employees are part-time, seasonal, or temporary employees.
41
| Item 12. |
SECURITY OWNERSHIP OF CERTAIN BENEFICIAL OWNERS AND MANAGEMENT AND RELATED SHAREHOLDER MATTERS
|
PRINCIPAL SHAREHOLDERS
The only persons known to the Board to be the beneficial owners of more than five percent of the outstanding shares of Common Stock as of June 15, 2020, are indicated below;
|
Name and Address of Beneficial Owner
|
Amount and Nature
of
Beneficial Ownership
|
Percent of
Class
|
||||||
|
The Robert J. Higgins TWMC Trust
38 Corporate Circle
Albany, New York 12203
|
713,986
|
(1)
|
39.3
|
%
|
||||
|
Neil S. Subin
3300 South Dixie Highway, Suite 1-365
West Palm Beach, 33405
|
300,084
|
(2)
|
16.5
|
%
|
||||
|
Renaissance Technologies LLC
800 Third Avenue
New York, New York 10022
|
99,399
|
(3)
|
5.5
|
%
|
||||
| (1) |
Based on Form 5, filed February 21, 2017, by The Robert J Higgins TWMC Trust.
|
| (2) |
Based on Schedule 13D, filed April 9, 2020, on behalf of (i) Neil S. Subin (“Mr. Subin”); (ii) MILFAM LLC; (iii) Alimco Financial Corporation (“Alimco”); (iv) Alimco Re Ltd., a wholly-owned subsidiary of
Alimco (“Alimco Re”); (v) Jonathan Marcus (“Mr. Marcus”); (vi) AMIL Of Ohio, LLC; (vii) Catherine C. Miller Irrevocable Trust dtd 3/26/91; (viii) Catherine C Miller Trust A-2; (ix) Catherine C Miller Trust A-3; (x) Catherine Miller Trust C;
(xi) Kimberly S. Miller GST Trust dtd 12/17/1992; (xii) LIMFAM LLC; (xiii) Lloyd I. Miller Trust A-1; (xiv) Lloyd I. Miller, III Trust A-4; (xv) Lloyd I. Miller, III Irrevocable Trust dtd 12/31/91; (xvi) Lloyd I. Miller, III Revocable Trust
dtd 01/07/97; (xvii) MILFAM I L.P.; (xviii) MILFAM II L.P.; (xix) MILFAM III LLC; and (xx) Susan F. Miller (such persons, trusts and entities named in items (i) through (xx), collectively, the “Reporting Persons”).
|
The Schedule 13D reported beneficial ownerships of the Reporting Persons following a transaction between Alimco Re, the Company and certain other parties in which, inter alia, (i) Alimco Re made a
loan to a subsidiary of the Company, (ii) Alimco Re and certain other lenders received a warrant to purchase shares of Common Stock of the Company, and (iii) the Reporting Persons (other than Mr. Subin, MILFAM LLC, Alimco, and Mr. Marcus), and the
Other Group Members entered into the voting agreement. Each of the loan, the warrants and the voting agreement are described in “Related Party Transactions”.
As a result of the provisions of the voting agreement, the Reporting Persons are members of a group (the “Group”) that also includes the Robert J. Higgins TWMC Trust; RJHDC, LLC; Mr. Thomas C.
Simpson; Kick-Start I, LLC; Kick-Start III, LLC; and Kick-Start IV, LLC (such members of the group other than the Reporting Persons, the “Other Group Members”).
Some of the positions were previously reported on a Schedule 13G filed by Mr. Subin on December 31, 2018 with respect to securities held by certain entities owned by or trusts for the benefit of
the family of the late Mr. Lloyd I. Miller, III (the “Miller Family”) and other entities (such entities and trusts, the “Miller Entities”) and a Schedule 13G filed by Alimco on February 13, 2019. Certain of the Miller Entities hold approximately
85% of the outstanding shares of common stock of Alimco. The Reporting Persons respectively disclaim the existence of, and membership in, a “group” under Section 13(d)(3) that may arise as a result of the Miller Entities’ interests in Alimco. The
Reporting Persons disclaim beneficial ownership of any shares other than to the extent he, she or it may have a pecuniary interest therein.
The amount set forth represents the following shares of common stock with shared dispositive power: (i) 1,750 shares of common stock owned by AMIL of Ohio, LLC; (ii) 300 shares of common stock
owned by Catherine C. Miller Irrevocable Trust DTD 3/26/91; (iii) 200 shares of common stock owned by Catherine C. Miller Trust A-2; (iv) 5,639 shares of common stock owned by Catherine C. Miller Trust A-3; (v) 22,448 shares of common stock owned
by Catherine Miller Trust C; (vi) 300 shares of common stock owned by Kimberly S. Miller GST Trust DTD 12/17/1992; (vii) 26,105 shares of common stock owned by LIMFAM LLC; (viii) 1,359 shares of common stock owned by Lloyd I. Miller Trust A-1; (ix)
51,371 shares of common stock owned by Lloyd I. Miller, III Trust A-4; (x) 300 shares of common stock owned by Lloyd I. Miller, III Irrevocable Trust DTD 12/31/91; (xi) 59,490 shares of common stock owned by Lloyd I. Miller, III Revocable Trust DTD
01/07/97; (xii) 3,128 shares of common stock owned by MILFAM I L.P.; (xiii) 123,619 shares of common stock owned by MILFAM II L.P.; (xiv) 2,274 shares of common stock owned by MILFAM III LLC; and (xv) 1,801 shares of common stock owned by Susan F.
Miller. Mr. Subin is the President and Manager of MILFAM LLC, which serves as manager, general partner, or investment advisor of a number of the foregoing entities formerly managed or advised by the late Lloyd I. Miller, III, and he also serves as
trustee of a number of a number of the foregoing trusts for the benefit of the family of the late Mr. Lloyd I. Miller, III, consequently, he may be deemed the beneficial owner of the shares specified in clauses (i) through (xv) of the preceding
sentence.
The Schedule 13D also discloses 1,340,024 shares of common stock with shared voting power. This amount represents the aggregate number of shares beneficially owned by the parties to the voting
agreement, including 244,532 shares of common stock of the Company issuable upon exercise of warrants.
| (3) |
Based on Form 13G, filed on February 12, 2020, by Renaissance Technologies LLC, which is majority owned by Renaissance Technologies Holdings Corporation.
|
42
EQUITY OWNERSHIP BY DIRECTORS AND EXECUTIVE OFFICERS
The following table sets forth the beneficial ownership of Common Stock as of June 15, 2020, by each director and named executive officer of the Company and all directors and executive officers as a group. All shares
listed in the table are owned directly by the named individuals, unless otherwise indicated therein. The Company believes that the beneficial owners have sole voting and investment power over their shares, except as otherwise stated or as to shares
owned by spouses.
|
Name
|
Positions With the
Company
|
Age
|
Year
First
Elected
as
Director/
Officer
|
Direct
Ownership
|
Shares
that
may be
acquired
within
60 days
of
June 15,
2020
|
Total
Shares
Beneficially
Owned
|
Percent
of
Class
|
||||||||||||
|
Jonathan Marcus
|
Director
|
60
|
2020
|
—
|
—
|
—
|
*
|
||||||||||||
|
W. Michael Reickert
|
Director
|
56
|
2016
|
3,200
|
(1)
|
750
|
(2)
|
3,950
|
*
|
||||||||||
|
Tom Simpson
|
Director
|
59
|
2020
|
57,000
|
(3)
|
—
|
(4)
|
57,000
|
3.1%
|
||||||||||
|
Kunal Chopra(7)
|
Chief Executive Officer – etailz
|
38
|
2020
|
—
|
—
|
—
|
*
|
||||||||||||
|
Michael Feurer (5)
|
Former Chief Executive
Officer, Director
|
51
|
2014
|
11,441
|
42,858
|
54,299
|
3.0%
|
||||||||||||
|
Edwin J. Sapienza
|
Chief Financial
Officer
|
50
|
2018
|
1,500
|
7,525
|
9,025
|
*
|
||||||||||||
|
Bruce J. Eisenberg (6)
|
Former Executive Vice
President-Real Estate
|
60
|
1995
|
—
|
—
|
—
|
*
|
||||||||||||
|
All Directors and Executive Officers as a group (7 persons)
|
73,141
|
51,133
|
124,274
|
6.8%
|
|||||||||||||||
| * |
Less than 1% of issued and outstanding Common Stock
|
| (1) |
Excludes 713,986 shares held in the Robert J Higgins TWMC Trust of which Mr. Reickert is a Trustee.
|
| (2) |
Excludes 202,067 warrants held by the RJHDC LLC.
|
| (3) |
Excludes 25 shares held by the wife of Tom Simpson. Also excludes 23,879 and 9,737 shares held by Kick Start III, LLC and Kick Start IV, LLC. Mr. Simpson holds an interest, manages and has voting control of
Kick Start III and Kick Start IV, LLC.
|
| (4) |
Excludes 14,041 and 9,360 warrants held by Kick Start III, LLC and Kick Start IV, LLC. Mr. Simpson holds an interest, manages and has voting control of Kick Start III and Kick Start IV, LLC.
|
| (5) |
Mr. Feurer ceased to be a board member and his employment was terminated as of March 30, 2020.
|
| (6) |
Mr. Eisenberg’s employment was terminated as of February 28, 2020.
|
| (7) |
Mr. Chopra joined the Company as of September 3, 2019.
|
The following table contains information about the Company’s Common Stock that may be issued upon the exercise of options, warrants and rights under all of the Company’s equity compensation plans as of February 1, 2020:
|
Plan Category
|
Number of Shares to be
Issued upon Exercise of
Outstanding Options,
Warrants and Rights(1)
|
Weighted Average Exercise
Price of Outstanding
Options, Warrants and
Rights
|
Number of Shares
Remaining Available for
Future Issuance Under
Equity Compensation Plans
(Excluding Outstanding
Options, Warrants and
Rights)
|
|||||||||
|
Equity Compensation Plan Approved by Shareholders
|
140,708
|
$
|
52.11
|
213,125
|
||||||||
|
Equity Compensation Plans and Agreements not Approved by Shareholders
|
---
|
---
|
---
|
|||||||||
| (1) |
Includes 11,512 deferred shares which may be issued for no consideration.
|
43
| Item 13. |
CERTAIN RELATIONSHIPS AND RELATED TRANSACTIONS, AND DIRECTOR INDEPENDENCE
|
Related Party Transactions
Prior to the consummation of the FYE Transaction, the Company leased its 181,300 square foot distribution center/office facility in Albany, New York from an entity controlled by the estate of Robert J. Higgins, its former Chairman and largest
shareholder. The distribution center/office lease commenced on January 1, 2016 and expires on December 31, 2020.
Under the lease accounted for as an operating lease, the Company paid $1.2 million in both fiscal 2019 and fiscal 2018, which were included in selling, general and administrative expenses in the Statement of Operations. As of February 1, 2020,
the Company owed $1.1 million on the operating lease liability, which is included in the current portion of operating lease liabilities on the Balance Sheet. Under the terms of the lease agreement, the Company is responsible for property taxes and
other operating costs with respect to the premises.
The rights and obligations related to the lease were sold as part of the FYE Transaction. On February 20, 2020, as part of the FYE Transaction, the Company assigned the rights and obligations of the
lease to Sunrise Records.
Directors Jonathan Marcus, Thomas Simpson, and Michael Reickert are the chief executive officer of Alimco Re Ltd. (“Alimco”), the managing member of Kick-Start III, LLC and Kick-Start IV, LLC (“Kick-Start”), and a trustee of the Robert J.
Higgins TWMC Trust (the “Trust”), an affiliate of RJHDC, LLC (“RJHDC” and together with Alimco and Kick-Start, “Related Party Entities”), respectively. The Related Party Entities are parties to the following agreements with the Company entered
into on March 30, 2020:
| • |
Subordinated Loan and Security Agreement, pursuant to which the Related Party Entities made a $5.2 million secured term loan ($2.7 million from Alimco, $0.5 million from Kick-Start, and $2.0 million from RJHDC) to etailz with a scheduled
maturity date of May 22, 2023, interest accruing at the rate of twelve percent (12%) per annum and compounded on the last day of each calendar quarter by becoming a part of the principal amount, and secured by a second priority security
interest in substantially all of the assets of the Company and etailz;
|
| • |
Common Stock Purchase Warrants (“Warrants”), pursuant to which the Company issued warrants to purchase up to 244,532 shares of Common Stock to the Related Party Entities (127,208 shares for Alimco, 23,401 shares for Kick-Start, and
93,923 shares for RJHDC), subject to adjustment in accordance with the terms of the Warrants, at an exercise price of $0.01 per share;
|
| • |
Contingent Value Rights Agreement (the “CVR Agreement”), pursuant to which the Related Party Entities received contingent value rights (“CVRs”) representing the contractual right to receive cash payments from the Company in an amount
equal, in the aggregate, to 19.9% of the proceeds (10.35% for Alimco, 1.90% for Kick-Start, and 7.64% for RJHDC) received by the Company in respect of certain intercompany indebtedness owing to it by etailz and/or its equity interest in
etailz; and
|
| • |
Voting Agreement (the “Voting Agreement”), pursuant to which the Related Party Entities, the Trust, Mr. Simpson and their respective related entities agreed to how their respective shares of the Company’s capital stock held by the
parties will be voted with respect to (i) amending the Articles of Incorporation of the Company to set the size of the Board of Directors of the Company at three directors, (ii) the designation, election, removal, and replacement of members
of the Board and (iii) how shares of the Company’s capital stock held by the parties to the Voting Agreement will be voted on a Sale of the Company (as defined in the Voting Agreement) with respect to which there is a shareholder vote or
some other action to take place during the ninety (90) days immediately following the date of the Voting Agreement. Pursuant to the Voting Agreement, Messrs. Marcus and Simpson were appointed as directors of the Company, and Mr. Reickert, a
trustee of the Trust, remained as a director of the Company. Mr. Subin was also granted board observer rights.
|
44
Guidelines for Evaluating Independence of Directors
The Board has determined that all of the directors are independent directors in accordance with the standards of the NASDAQ Stock Market and as described below. The Nominating and Corporate Governance Committee as
well as the Board annually reviews relationships that directors may have with the Company to make a determination of whether there are any material relationships that would preclude a director from being independent.
The standards relied upon by the Board in affirmatively determining whether a director is “independent,” in compliance with the rules of the NASDAQ Stock Market, are comprised of those objective standards set forth
in the NASDAQ rules. The Board is responsible for ensuring that independent directors do not have a material relationship with the Company or its affiliates or any executive officer of the Company or his or her affiliates.
| Item 14. |
PRINCIPAL ACCOUNTANT FEES AND SERVICES
|
Fees Paid to Independent Public Accounting Firms
Audit Fees. Audit fees include fees paid by the Company to KPMG LLP (“KPMG”) in connection with the annual audit of the Company’s consolidated financial statements and KPMG’s review of the Company’s interim financial
statements. Audit fees also include fees for services performed by KPMG that are closely related to the audit and in many cases could only be provided by an independent public accounting firm. Such services include comfort letters related to SEC
registration statements and certain reports relating to the Company’s regulatory filings. The aggregate fees billed to the Company by KPMG for audit services rendered to the Company and its subsidiaries for fiscal years 2019 and 2018 totaled $1.0
million and $0.8 million respectively.
Audit-Related Fees. Audit related fees include fees paid by the Company to KPMG in connection with audit related services, including audit services related to employee benefit plan audits. The aggregate fees billed to
the Company by KPMG for audit related services rendered to the Company and its subsidiaries were $22,500 and $22,000 for fiscal years 2019 and 2018, respectively.
Other Fees. There were no other fees paid to KPMG in fiscal year 2018.
Tax Fees. Tax fees include corporate tax compliance and counsel and advisory services. SAXBST LLC was the Company’s primary tax advisor in fiscal year 2019. During fiscal year 2019 and 2018, tax fees paid to KPMG were
$5,000 and $89,000, respectively.
Each year, the Company reviews its existing practices regarding the use of its independent accountants to provide non-audit and consulting services to ensure compliance with recent SEC proposals. The Company has a
policy which provides that the Company’s independent public accounting firm may provide certain non-audit services which do not impair the firm’s independence. In that regard, the Audit Committee must pre-approve all audit services and non-audit
services provided to the Company. This policy is administered by the Company’s senior financial management, which reports throughout the year to the Audit Committee.
45
PART IV
| Item 15. |
EXHIBITS AND FINANCIAL STATEMENT SCHEDULES
|
15(a) (1) Financial Statements
The Consolidated Financial Statements and Notes are listed in the Index to Consolidated Financial Statements on page F-1 of this report.
15(a) (2) Financial Statement Schedules
Consolidated Financial Statement Schedules not filed herein have been omitted as they are not applicable or the required information or equivalent information has been included in the Consolidated Financial Statements or the notes thereto.
15(a) (3) Exhibits
Exhibits are as set forth in the “Index to Exhibits” which follows the Notes to the Consolidated Financial Statements and immediately precedes the exhibits filed.
| Item 16. |
Form 10-K Summary
|
None.
SIGNATURES
Pursuant to the requirements of Section 13 or 15(d) of the Securities Exchange Act of 1934, the registrant has duly caused this report to be signed on its behalf by the undersigned, thereunto duly authorized.
|
TRANS WORLD ENTERTAINMENT CORPORATION
|
||
|
Date: June 15, 2020
|
By: /s/ Kunal Chopra
|
|
|
Kunal Chopra
Principal Executive Officer
|
||
Pursuant to the requirements of the Securities Exchange Act of 1934, this report has been signed below by the following persons on behalf of the registrant and in the capacities and on the dates indicated.
|
Name
|
Title
|
Date
|
|
/s/ Kunal Chopra
|
|
June 15, 2020
|
|
(Kunal Chopra)
|
Principal Executive Officer
|
|
|
/s/ Edwin Sapienza
(Edwin Sapienza)
|
Chief Financial Officer
(Principal Financial and Chief Accounting Officer)
|
June 15, 2020
|
|
/s/ Jonathan Marcus
|
||
|
(Jonathan Marcus)
|
Director
|
June 15, 2020
|
|
/s/ Michael Reickert
|
||
|
(Michael Reickert)
|
Director
|
June 15, 2020
|
|
/s/ Tom Simpson
|
||
|
(Tom Simpson)
|
Director
|
June 15, 2020
|
46
TRANS WORLD ENTERTAINMENT CORPORATION
|
Form 10-K
Page No.
|
|
| 48 | |
|
Consolidated Financial Statements
|
|
| 49 | |
| 50 | |
| 51 | |
| 52 | |
| 53 | |
| 55 |
To the Shareholders and Board of Directors
Trans World Entertainment Corporation:
Opinion on the Consolidated Financial Statements
We have audited the accompanying consolidated balance sheets of Trans World Entertainment Corporation and subsidiaries (the Company) as of February 1, 2020 and February 2, 2019, the related consolidated statements of operations, comprehensive
loss, shareholders’ equity, and cash flows for each of the fiscal years in the two‑year period ended February 1, 2020, and the related notes (collectively, the consolidated financial statements). In our opinion, the consolidated financial
statements present fairly, in all material respects, the financial position of the Company as of February 1, 2020 and February 2, 2019, and the results of its operations and its cash flows for each of the fiscal years in the two‑year period ended
February 1, 2020, in conformity with U.S. generally accepted accounting principles.
Going Concern
The accompanying consolidated financial statements have been prepared assuming that the Company will continue as a going concern. As discussed in Note 1 to the consolidated financial statements, the Company continues to experience recurring
losses and negative cash flows from operations, that raise substantial doubt about its ability to continue as a going concern. Management’s plans in regard to these matters are also described in Note 1. The consolidated financial statements do not
include any adjustments that might result from the outcome of this uncertainty.
Change in Accounting Principle
As discussed in Note 2 to the consolidated financial statements, the Company has changed its method of accounting for leases as of February 3, 2019 due to the adoption of Accounting Standards Codification Topic 842, Leases.
Basis for Opinion
These consolidated financial statements are the responsibility of the Company’s management. Our responsibility is to express an opinion on these consolidated financial statements based on our audits. We are a public accounting firm registered
with the Public Company Accounting Oversight Board (United States) (PCAOB) and are required to be independent with respect to the Company in accordance with the U.S. federal securities laws and the
applicable rules and regulations of the Securities and Exchange Commission and the PCAOB.
We conducted our audits in accordance with the standards of the PCAOB. Those standards require that we plan and perform the audit to obtain reasonable assurance about whether the consolidated financial statements are free of material
misstatement, whether due to error or fraud. The Company is not required to have, nor were we engaged to perform, an audit of its internal control over financial reporting. As part of our audits, we are required to obtain an understanding of
internal control over financial reporting but not for the purpose of expressing an opinion on the effectiveness of the Company’s internal control over financial reporting. Accordingly, we express no such opinion.
Our audits included performing procedures to assess the risks of material misstatement of the consolidated financial statements, whether due to error or fraud, and performing procedures that respond to those risks. Such procedures included
examining, on a test basis, evidence regarding the amounts and disclosures in the consolidated financial statements. Our audits also included evaluating the accounting principles used and significant estimates made by management, as well as
evaluating the overall presentation of the consolidated financial statements. We believe that our audits provide a reasonable basis for our opinion.
/s/ KPMG LLP
We have served as the Company’s auditor since 1994.
Albany, New York
June 15, 2020
TRANS WORLD ENTERTAINMENT CORPORATION AND SUBSIDIARIES
(in thousands, except per share and share amounts)
|
February 1,
2020 |
February 2,
2019 |
|||||||
|
ASSETS
|
||||||||
|
CURRENT ASSETS
|
||||||||
|
Cash and cash equivalents
|
$
|
2,977
|
$
|
4,355
|
||||
|
Restricted cash
|
950
|
4,126
|
||||||
|
Accounts receivable
|
4,201
|
5,383
|
||||||
|
Merchandise inventory
|
67,958
|
94,842
|
||||||
|
Prepaid expenses and other current assets
|
3,979
|
6,657
|
||||||
|
Total current assets
|
80,065
|
115,363
|
||||||
|
Restricted cash
|
4,925
|
5,745
|
||||||
|
Fixed assets, net
|
2,190
|
7,529
|
||||||
|
Operating lease right-of-use assets
|
3,311
|
-
|
||||||
|
Intangible assets, net
|
1,760
|
3,668
|
||||||
|
Other assets
|
5,555
|
5,708
|
||||||
|
TOTAL ASSETS
|
$
|
97,806
|
$
|
138,013
|
||||
|
LIABILITIES
|
||||||||
|
CURRENT LIABILITIES
|
||||||||
|
Accounts payable
|
$
|
24,120
|
$
|
34,329
|
||||
|
Short-term borrowings
|
13,149
|
-
|
||||||
|
Accrued expenses and other current liabilities
|
4,479
|
8,132
|
||||||
|
Deferred revenue
|
6,681
|
6,955
|
||||||
|
Current portion of operating lease liabilities
|
9,510
|
-
|
||||||
|
Total current liabilities
|
57,939
|
49,416
|
||||||
|
Operating lease liabilities
|
13,263
|
-
|
||||||
|
Other long-term liabilities
|
22,089
|
24,867
|
||||||
|
TOTAL LIABILITIES
|
93,291
|
74,283
|
||||||
|
SHAREHOLDERS’ EQUITY
|
||||||||
|
Preferred stock ($0.01 par value; 5,000,000 shares authorized; none issued)
|
-
|
-
|
||||||
|
Common stock ($0.01 par value; 200,000,000 shares authorized; 3,225,627 shares and 3,221,834 shares issued, respectively)
|
32
|
32
|
||||||
|
Additional paid-in capital
|
345,102
|
344,826
|
||||||
|
Treasury stock at cost (1,409,316 and 1,408,892 shares, respectively)
|
(230,169
|
)
|
(230,166
|
)
|
||||
|
Accumulated other comprehensive loss
|
(1,479
|
)
|
(735
|
)
|
||||
|
Accumulated deficit
|
(108,971
|
)
|
(50,227
|
)
|
||||
|
TOTAL SHAREHOLDERS’ EQUITY
|
4,515
|
63,730
|
||||||
|
TOTAL LIABILITIES AND SHAREHOLDERS’ EQUITY
|
$
|
97,806
|
$
|
138,013
|
||||
See Accompanying Notes to Consolidated Financial Statements.
TRANS WORLD ENTERTAINMENT CORPORATION AND SUBSIDIARIES
(in thousands, except per share amounts)
|
Fiscal Year Ended
|
||||||||
|
February 1,
2020 |
February 2,
2019 |
|||||||
|
Net sales
|
$
|
321,993
|
412,997
|
|||||
|
Other revenue
|
3,942
|
5,193
|
||||||
|
Total revenue
|
325,935
|
418,190
|
||||||
|
Cost of sales
|
229,836
|
290,116
|
||||||
|
Gross profit
|
96,099
|
128,074
|
||||||
|
Selling, general and administrative expenses
|
129,291
|
165,222
|
||||||
|
Gain on sale of asset
|
---
|
---
|
||||||
|
Asset impairment charges
|
23,983
|
59,658
|
||||||
|
Loss from operations
|
(57,175
|
)
|
(96,806
|
)
|
||||
|
Interest expense
|
884
|
723
|
||||||
|
Other loss (income)
|
364
|
(227
|
)
|
|||||
|
Loss before income taxes
|
(58,423
|
)
|
(97,302
|
)
|
||||
|
Income tax expense
|
321
|
80
|
||||||
|
Net loss
|
$
|
(58,744
|
)
|
$
|
(97,382
|
)
|
||
|
Basic and diluted loss per share
|
$
|
(32.35
|
)
|
$
|
(53.67
|
)
|
||
|
Weighted average number of shares outstanding - basic and diluted
|
1,816
|
1,814
|
||||||
See Accompanying Notes to Consolidated Financial Statements.
TRANS WORLD ENTERTAINMENT CORPORATION AND SUBSIDIARIES
(in thousands)
|
Fiscal Year Ended
|
||||||||
|
February 1,
2020 |
February 2,
2019 |
|||||||
|
Net loss
|
$
|
(58,744
|
)
|
$
|
(97,382
|
)
|
||
|
Pension actuarial (loss) income adjustment
|
(744
|
)
|
263
|
|||||
|
Comprehensive loss
|
$
|
(59,488
|
)
|
$
|
(97,119
|
)
|
||
See Accompanying Notes to Consolidated Financial Statements.
TRANS WORLD ENTERTAINMENT CORPORATION AND SUBSIDIARIES
(dollars and shares in thousands)
|
Common
Shares
|
Treasury
Shares
|
Common
Stock
|
Additional
Paid-in
Capital
|
Treasury
Stock
At Cost
|
Accumulated
Other
Comprehensive
Loss
|
Retained
Earnings
(Accumulaed
Deficit)
|
Shareholders’
Equity
|
|||||||||||||||||||||||||
|
Balance as of February 3, 2018
|
3,215
|
(1,408
|
)
|
$
|
32
|
$
|
341,715
|
$
|
(230,145
|
)
|
$
|
(998
|
)
|
$
|
47,611
|
$
|
158,214
|
|||||||||||||||
|
Decrease to opening balance of Retained Earnings as a result of applying ASU 2014-09
|
-
|
-
|
-
|
-
|
-
|
-
|
(456
|
)
|
(456
|
)
|
||||||||||||||||||||||
|
Net Loss
|
-
|
-
|
-
|
-
|
-
|
-
|
(97,382
|
)
|
(97,382
|
)
|
||||||||||||||||||||||
|
Pension actuarial income adjustment
|
-
|
-
|
-
|
-
|
-
|
263
|
-
|
263
|
||||||||||||||||||||||||
|
Vested restricted shares
|
-
|
(1
|
)
|
-
|
-
|
(21
|
)
|
-
|
-
|
(21
|
)
|
|||||||||||||||||||||
|
Common stock issued-new grants
|
7
|
-
|
-
|
79
|
-
|
-
|
-
|
80
|
||||||||||||||||||||||||
|
Amortization of unearned compensation/restricted stock amortization
|
-
|
-
|
-
|
3,032
|
-
|
-
|
-
|
3,032
|
||||||||||||||||||||||||
|
Balance as of February 2, 2019
|
3,222
|
(1,409
|
)
|
$
|
32
|
$
|
344,826
|
$
|
(230,166
|
)
|
$
|
(735
|
)
|
$
|
(50,227
|
)
|
$
|
63,730
|
||||||||||||||
|
Net Loss
|
-
|
-
|
-
|
-
|
-
|
-
|
(58,744
|
)
|
(58,744
|
)
|
||||||||||||||||||||||
|
Pension actuarial loss adjustment
|
-
|
-
|
-
|
-
|
-
|
(744
|
)
|
-
|
(744
|
)
|
||||||||||||||||||||||
|
Vested restricted shares
|
4
|
-
|
-
|
3
|
(3
|
)
|
-
|
-
|
-
|
|||||||||||||||||||||||
|
Amortization of unearned compensation/restricted stock amortization
|
-
|
-
|
-
|
273
|
-
|
-
|
-
|
273
|
||||||||||||||||||||||||
|
Balance as of February 1, 2020
|
3,226
|
$
|
(1,409
|
)
|
$
|
32
|
$
|
345,102
|
$
|
(230,169
|
)
|
$
|
(1,479
|
)
|
$
|
(108,971
|
)
|
$
|
4,515
|
|||||||||||||
See Accompanying Notes to Consolidated Financial Statements.
TRANS WORLD ENTERTAINMENT CORPORATION AND SUBSIDIARIES
(in thousands)
|
Fiscal Year Ended
|
||||||||
|
February 1,
2020 |
February 2,
2019 |
|||||||
|
OPERATING ACTIVITIES:
|
||||||||
|
Net loss
|
$
|
(58,744
|
)
|
$
|
(97,382
|
)
|
||
|
Adjustments to reconcile net loss to net cash used in operating activities:
|
||||||||
|
Depreciation of fixed assets
|
3,330
|
5,226
|
||||||
|
Amortization of intangible assets
|
1,143
|
3,890
|
||||||
|
Amortization of right-of-use asset
|
6,990
|
-
|
||||||
|
Stock based compensation
|
276
|
3,032
|
||||||
|
Write down of investment
|
500
|
-
|
||||||
|
Treasury stock received for payment of withholding tax on exercises of RSUs
|
(3
|
)
|
(21
|
)
|
||||
|
Adjustment to contingent consideration
|
-
|
(272
|
)
|
|||||
|
Loss on disposal of fixed assets
|
125
|
422
|
||||||
|
Inventory net realizable value adjustment
|
12,701
|
-
|
||||||
|
Loss on impairment of long lived assets
|
23,983
|
59,658
|
||||||
|
Change in cash surrender value
|
(329
|
)
|
78
|
|||||
|
Changes in operating assets and liabilities that provide (use) cash:
|
||||||||
|
Accounts receivable
|
1,182
|
(914
|
)
|
|||||
|
Merchandise inventory
|
14,183
|
14,535
|
||||||
|
Prepaid expenses and other current assets
|
1,931
|
319
|
||||||
|
Other long-term assets
|
(913
|
)
|
6
|
|||||
|
Accounts payable
|
(10,209
|
)
|
(7,451
|
)
|
||||
|
Accrued expenses and other current liabilities
|
(1,888
|
)
|
(1,134
|
)
|
||||
|
Deferred revenue
|
(274
|
)
|
(1,509
|
)
|
||||
|
Other long-term liabilities
|
(9,811
|
)
|
(4,001
|
)
|
||||
|
Net cash used in operating activities
|
(15,827
|
)
|
(25,518
|
)
|
||||
|
INVESTING ACTIVITIES:
|
||||||||
|
Purchases of fixed assets
|
(2,823
|
)
|
(3,689
|
)
|
||||
|
Capital distributions from joint venture
|
127
|
1,347
|
||||||
|
Net cash used in investing activities
|
(2,696
|
)
|
(2,342
|
)
|
||||
|
FINANCING ACTIVITIES:
|
||||||||
|
Exercise of equity awards, net of treasury shares received
|
-
|
80
|
||||||
|
Proceeds from short term borrowings
|
35,851
|
35,734
|
||||||
|
Payments of short term borrowings
|
(22,702
|
)
|
(35,734
|
)
|
||||
|
Payments to etailz shareholders
|
-
|
(1,500
|
)
|
|||||
|
Net cash provided by (used in) financing activities
|
13,149
|
(1,420
|
)
|
|||||
|
Net decrease in cash, cash equivalents, and restricted cash
|
(5,374
|
)
|
(29,280
|
)
|
||||
|
Cash, cash equivalents, and restricted cash, beginning of year
|
14,226
|
43,506
|
||||||
|
Cash, cash equivalents, and restricted cash, end of year
|
$
|
8,852
|
$
|
14,226
|
||||
|
Supplemental disclosures and non-cash investing and financing activities:
|
||||||||
|
Interest paid
|
$
|
838
|
$
|
723
|
||||
See Accompanying Notes to Consolidated Financial Statements.
Index to Notes to Consolidated Financial Statements
Note Number and Description
|
Note No.
|
|
|
1.
|
Nature of Operations and Summary of Significant Accounting Policies
|
|
2.
|
Recently Adopted and Issued Accounting Pronouncements
|
|
3.
|
Goodwill and Other Intangible Assets
|
|
4.
|
Fixed Assets
|
|
5.
|
Restricted Cash
|
|
6.
|
Debt
|
|
7.
|
Leases
|
|
8.
|
Shareholders’ Equity
|
|
9.
|
Benefit Plans
|
|
10.
|
Income Taxes
|
|
11.
|
Related Party Transactions
|
|
12.
|
Commitments and Contingencies
|
|
13.
|
Quarterly Financial Information (Unaudited)
|
|
14.
|
Pro forma disposition of fye business
|
TRANS WORLD ENTERTAINMENT CORPORATION AND SUBSIDIARIES
Note 1. Nature of Operations and Summary of Significant Accounting Policies
Nature of Operations: Trans World Entertainment Corporation and subsidiaries (“the Company”) operates in two reportable segments: fye and etailz. The fye segment is a specialty retailer of entertainment
products, including trend, video, music, electronics and related products in the United States. The fye segment operates a chain of retail entertainment stores and e-commerce sites, www.fye.com and www.secondspin.com. As of February 1, 2020, the fye segment operated 200 stores totaling approximately 1.1 million square feet in the United States, the District of Columbia and the U.S. Virgin Islands. The
etailz segment is a digital marketplace retailer and generates substantially all of its revenue through Amazon Marketplace.
Recent Developments: On February 20, 2020, the Company consummated the sale of substantially all of the assets of and certain of the liabilities relating to fye to a subsidiary of 2428391 Ontario Inc. o/a
Sunrise Records (“Sunrise Records”) pursuant to an Asset Purchase Agreement (as amended by the Amendment, the “Asset Purchase Agreement”) dated January 23, 2020, by and among Trans World Entertainment Corporation, Record Town, Inc., Record Town USA
LLC, Record Town Utah LLC, Trans World FL LLC, Trans World New York, LLC, 2428392 Inc., and Sunrise Records. (the “FYE Transaction”).
All of our financial information for fiscal 2019 includes the fye segment. For pro forma information, see Note 13 of the Notes to the Consolidated Financial Statements.
In addition, as referenced herein, subsequent to year end, the Company restructured its debt, including the paydown of its existing credit facility with Wells Fargo, entered into a new credit facility with Encina, as well as a new subordinated
debt agreement.
Also, as a direct result of COVID-19, most of our employees are working remotely. The full extent to which the COVID-19 pandemic will directly or indirectly impact our business, results of operations and financial condition, including expenses,
reserves and allowances, and employee-related amounts, will depend on future developments that are highly uncertain, including as a result of new information that may emerge concerning COVID-19 and the actions taken to contain or treat it, as well as
the economic impact on local, regional, national and international customers and markets, which are highly uncertain and cannot be predicted at this time. Management is actively monitoring this situation and the possible effects on its financial
condition, liquidity, operations, industry, and workforce. Given the daily evolution of the COVID-19 outbreak and the response to curb its spread, currently we are not able to estimate the effects of the COVID-19 outbreak to our results of
operations, financial condition, or liquidity.
Liquidity: The Company’s primary sources of liquidity are borrowing capacity under its revolving credit facility, available cash and cash equivalents, and to a lesser extent,
cash generated from operations. Our cash requirements relate primarily to working capital needed to operate and grow our business, including funding operating expenses and the purchase of inventory and capital expenditures. Our ability to achieve
profitability and meet future liquidity needs and capital requirements will depend upon numerous factors, including the timing and amount of our revenue; the timing and amount of our operating expenses; the timing and costs of working capital needs;
successful implementation of our strategy and planned activities; and our ability to overcome the impact of the COVID-19 pandemic.
The Company incurred net losses of $58.7 million and $97.4 million for the years ended February 1, 2020 and February 2, 2019, respectively, and has an accumulated deficit of $109.0 million at February 1, 2020. In addition, net cash used in
operating activities for the year ended February 1, 2020 was $15.8 million.
The Company experienced negative cash flows from operations during fiscal 2019 and 2018 and we expect to incur net losses in 2020.
The ability of the Company to meet its liabilities and to continue as a going concern is dependent on improved profitability, the continued implementation of the strategic initiative to reposition etailz as a platform
of software and services, the availability of future funding, implementation of one or more corporate initiatives to reduce costs at the parent company level (which could include a voluntary delisting from NASDAQ and deregistering of our Common Stock
in order to substantially eliminate the costs associated with being a public company), satisfying all unassumed liabilities of the fye segment and other strategic alternatives, including selling all or part of the remaining business or assets of the
Company, and overcoming the impact of the COVID-19 pandemic.
There can be no assurance that we will be successful in further implementing our business strategy or that the strategy, including the completed initiatives, will be successful in sustaining acceptable levels of
sales growth and profitability. As a result, the Company has concluded that there is substantial doubt about the Company’s ability to continue as a going concern for a period of one year after the date of filing of this Annual Report on
Form 10-K. In addition, the proceeds from the PPP Loan are subject to audit and there is a risk of repayment.
At February 1, 2020, we had cash and cash equivalents of $3.0 million, net working capital of $22.1 million, and outstanding borrowings of $13.1 million on our revolving credit facility, as further discussed below. This compares to $4.4 million in
cash and cash equivalents and net working capital of $65.9 million and no outstanding borrowings on our revolving credit facility at February 2, 2019.
In January 2017, the Company amended and restated its revolving credit facility (“Credit Facility”). As of February 1, 2020, the Company had borrowings of $13.1 million under the Credit Facility and as of February 2, 2019 the Company did not have
any borrowings under the Credit Facility. Peak borrowings under the Credit Facility during fiscal 2019 and fiscal 2018 were $35.9 million and $35.7 million, respectively. As of February 1, 2020 and February 2, 2019, the Company had no outstanding
letters of credit. The Company had $12 million and $41 million available for borrowing under the Credit Facility as of February 1, 2020 and February 2, 2019, respectively.
On February 20, 2020, in conjunction with the FYE Transaction, the Company fully satisfied its obligations under the Credit Facility through proceeds received from the sale of the fye business and borrowings under the New Credit Facility, as
further discussed below, and the Credit Facility is no longer available to the Company.
New Credit Facility
On February 20, 2020, etailz Inc. entered into a Loan and Security Agreement (the “Loan Agreement”) with Encina Business Credit, LLC (“Encina”),, as administrative agent, under which the lenders party thereto committed to provide up to $25 million
in loans under a three-year, secured revolving credit facility (the “ New Credit Facility”). Concurrent with the FYE Transaction, the Company borrowed $3.3 million under the New Credit Facility in order to satisfy the remaining obligations of the
Company under the aforementioned Credit Facility.
The commitments by the lenders under the New Credit Facility are subject to borrowing base and availability restrictions. Up to $5.0 million of the New Credit Facility may be used for the making of swing line loans.
Subordinated Debt Agreement
On March 30, 2020, the Company and etailz (the “Loan Parties”) entered into Amendment No. 1 to the Loan Agreement (the “Amendment”). Pursuant to the Amendment, among other things, (i) the Company was added as “Parent” under the Amended Loan
Agreement, (ii) the Company granted a first priority security interest in substantially all of the assets of the Company, including inventory, accounts receivable, cash and cash equivalents and certain other collateral, and (iii) the Loan Agreement
was amended to (a) permit the incurrence of certain subordinated indebtedness under the Subordinated Loan Agreement (as defined below) and (b) limit the Company’s ability to incur additional indebtedness, create liens, make investments, make
restricted payments or specified payments and merge or acquire assets.
On March 30, 2020, the Loan Parties entered into a Subordinated Loan and Security Agreement (the “Subordinated Loan Agreement”) with the lenders party thereto from time to time (the “Lenders”) and TWEC Loan Collateral Agent, LLC (“Collateral
Agent”), as collateral agent for the Lenders, pursuant to which the Lenders made a $5.2 million secured term loan (the “Subordinated Loan”) to etailz with a scheduled maturity date of May 22, 2023.
Paycheck Protection Program
On April 17, 2020, etailz received loan proceeds of $2.0 million (the “PPP Loan”) pursuant to the Paycheck Protection Program (“PPP”) under the Coronavirus Aid, Relief, and Economic Security Act (“CARES Act”). The PPP Loan, which was in the form
of a promissory note (the “Note”), dated April 10, 2020, between etailz and First Interstate Bank, as the lender, matures on April 17, 2022, bears interest at a fixed rate of 1% per annum, and is payable in monthly installments of $112,975.55
commencing on November 10, 2020. While under the terms of the PPP, some or all of the PPP Loan amount may be forgiven if the PPP Loan proceeds are used for qualifying expenses as described in the CARES Act and the Note, such as payroll costs,
benefits, rent, and utilities, there is no assurance that the Company will be successful in qualifying for and receiving forgiveness on the PPP Loan amount.
In addition to the aforementioned current sources of existing working capital, the Company may explore certain other strategic alternatives that may become available to the Company, as well continuing our efforts to generate additional sales and
increase margins. However, at this time the Company has no commitments to obtain any additional funds, and there can be no assurance such funds will be available on acceptable terms or at all, should we require such additional funds. If the Company
is unable to improve its operations, it may be required to obtain additional funding, and the Company’s financial condition and results of operations may be materially adversely affected.
Furthermore, broad market and industry factors may seriously harm the market price of our common stock, regardless of our operating performance, and may adversely impact our ability to raise additional funds, should we require such additional
funds. Similarly, if our Common Stock is delisted from the NASDAQ Capital Market, it may also limit our ability to raise additional funds.
The consolidated financial statements for the fiscal year ended February 1, 2020 were prepared on the basis of a going concern which contemplates that the Company will be able to realize assets and discharge liabilities in the normal course of
business. The ability of the Company to meet its liabilities and to continue as a going concern is dependent on improved profitability, the performance improvement plan implemented for the etailz segment and the availability of future funding. The
consolidated financial statements do not include any adjustments that might result from the outcome of these uncertainties.
Basis of Presentation: The consolidated financial statements consist of Trans World Entertainment Corporation, its wholly owned subsidiaries, Trans World NY Sub, Inc. (f/k/a
Record Town, Inc.) and its subsidiaries, and etailz, Inc. All significant intercompany accounts and transactions have been eliminated. The preparation of financial statements in conformity with accounting principles generally accepted in the United
States of America requires management to make estimates and assumptions, including those related to merchandise inventory and return costs; valuation of goodwill and long-lived assets, income taxes, accounting for gift card liabilities, retirement
plan obligation, and other long-term liabilities that affect the reported amounts of assets and liabilities and disclosure of contingent assets and liabilities at the date of the consolidated financial statements, and the reported amounts of revenues
and expenses during the reporting period. Actual results could differ from those estimates.
Items Affecting Comparability: The Company’s fiscal year is a 52 or 53-week period ending the Saturday nearest to January 31. Fiscal 2019 and fiscal 2018 ended February 1,
2020 and February 2, 2019, respectively. Both fiscal years were 52 week periods.
Concentration of Business Risks: The fye segment purchases inventory from approximately 460 suppliers. In fiscal 2019, 38% of fye purchases were made from ten suppliers including Universal Studio Home
Entertainment, Paramount Video , Buena Vista Home Video, SONY Music, Twentieth Century Fox Home Entertainment, Warner/Elektra/Atlantic, Universal Music Group Distribution, Funko LLC, Warner Home Video, and Alliance Entertainment.
The etailz segment purchases various inventory from numerous suppliers and does not have material long-term purchase contracts; rather, it purchases products from its suppliers on an order-by-order basis. Historically, the etailz segment has not
experienced difficulty in obtaining satisfactory sources of supply and management believes that it will continue to have access to adequate sources of supply.
etailz generates substantially all its revenue through the Amazon Marketplace. Therefore, the segment depends in large part on its relationship with Amazon for its continued growth. In particular, the etailz segment depends on its ability to
offer products on the Amazon Marketplace and on its timely delivery of products to customers.
Cash and Cash Equivalents: The Company considers all highly liquid investments purchased with an original maturity of three months or less to be cash equivalents.
Restricted Cash: Cash and cash equivalents that are restricted as to withdrawal or use under the terms of certain contractual agreements are recorded in Restricted Cash on the
Company’s consolidated balance sheet.
Concentration of Credit Risks: The Company maintains centralized cash management and investment programs whereby excess cash balances are invested in short-term money market
funds. The Company limits the amount of credit exposure with any one financial institution and believes that no significant concentration of credit risk exists with respect to cash investments.
Accounts Receivable: Accounts receivable for the fye segment are primarily comprised of receivables from commissions due from third parties. For the etailz segment, accounts
receivable are comprised of receivables due from Amazon. There are no provisions for uncollectible amounts from retail sales of merchandise inventory since payment is received at the time of sale.
Merchandise Inventory and Return Costs: Merchandise inventory is stated at the lower of cost or net realizable value under the average cost method. In the current year, the
Company recorded an inventory adjustment to net realizable value based on the sale of its fye inventory after the balance street date, which was for $12.7 million. Inventory valuation requires significant judgment and estimates, including
obsolescence, shrink and any adjustments to net realizable value, if market value is lower than cost. The Company records obsolescence and any adjustments to net realizable value (if lower than cost) based on current and anticipated demand, customer
preferences and market conditions. The provision for inventory shrink is estimated as a percentage of store sales for the period from the last date a physical inventory was performed to the end of the fiscal year. Such estimates are based on
historical results and trends, and the shrink results from the last physical inventory. Physical inventories are taken at least annually for all stores and the distribution center throughout the year, and inventory records are adjusted accordingly.
The Company is generally entitled to return merchandise purchased from major music vendors for credit against other purchases from these vendors. Certain vendors reduce the credit with a merchandise return charge
which varies depending on the type of merchandise being returned. Certain other vendors charge a handling fee based on units returned. The Company records all merchandise return charges in cost of sales.
Fixed Assets and Depreciation: Fixed assets are recorded at cost and depreciated or amortized over the estimated useful life of the asset using the straight-line method. The estimated useful lives are as
follows:
|
Leasehold improvements
|
Lesser of estimated useful life of the asset or the lease term
|
|
Fixtures and equipment
|
3-7 years
|
Major improvements and betterments to existing facilities and equipment are capitalized. Expenditures for maintenance and repairs are expensed as incurred.
Goodwill: The Company’s goodwill resulted from the acquisition of etailz and represented the excess purchase price over the net identifiable assets acquired. All of the goodwill is associated with etailz, a
separate reporting unit, and there is no goodwill associated with the other reporting unit, fye. Goodwill is not amortized and the Company is required to evaluate goodwill for impairment at least annually or whenever indicators of impairment are
present.
As a result of the annual impairment review, the Company performed its impairment test over goodwill. During fiscal 2018, based on the Company’s annual impairment test, it was determined that the goodwill balance was fully impaired, and the
Company recognized an impairment loss of $39.2 million.
Long-Lived Assets other than Goodwill: Long-lived assets are reviewed for impairment whenever events or changes in circumstances indicate that the carrying amount of an asset may not be recoverable.
Recoverability of assets to be held and used is measured by a comparison of the carrying amount of an asset to undiscounted future net cash flows expected to be generated by the asset over its remaining useful life. If the carrying amount of an
asset exceeds its estimated future cash flows, an impairment charge is recognized by the amount by which the carrying amount of the assets exceeds the fair value of the assets. Fair value is generally measured based on discounted estimated future
cash flows. Assets to be disposed of would be separately presented in the Consolidated Balance Sheets and reported at the lower of the carrying amount or fair value less disposition costs. For the purpose of the asset impairment test, the fye
segment has two asset groupings – corporate and store level assets. For the purposes of the asset impairment test, the etailz segment has one asset grouping, which is the same as the etailz reporting unit level.
During fiscal 2019 and fiscal 2018, the Company concluded, based on continued operating losses within the fye segment driven by lower than expected sales that triggering events had occurred in each respective fiscal year, and pursuant to FASB ASC
360, Property, Plant, and Equipment, an evaluation of the fye long-lived assets for impairment was required. Long-lived assets, primarily at the Company’s retail store locations, as well as certain fixed
assets at the corporate location, consisting of the home office and the Albany distribution center, where impairment was determined to exist were written down to their estimated fair values as of the end of fiscal 2019 and fiscal 2018, resulting in
the recording of asset impairment charges of $23.2 million and $1.9 million, respectively. Based on the fair value as determined attributable to the fixed assets and operating lease right-of-use assets in contemplation of the sale of the fye segment,
it was determined that the fixed assets and operating lease right-of-use assets were fully impaired, as of February 1, 2020.
During fiscal 2019 and fiscal 2018, the Company concluded, based on continued operating losses for the etailz segment that a triggering event had occurred, and pursuant to FASB ASC 360, Property, Plant, and Equipment, an evaluation of the etailz fixed assets and intangible assets for impairment was required. For fiscal 2019, intangible assets related to vendor relationships were fully impaired resulting in the
recognition of asset impairment charges of $0.8 million. For fiscal 2018, fixed assets related to internally developed technology at etailz were written down to their estimated fair values resulting in the recognition of asset impairment charges of
$2.1 million and intangible assets related to technology and vendor relationships were written down to their estimated fair values resulting in the recognition of asset impairment charges of $16.4 million.
Conditional Asset Retirement Obligations: The Company records the fair value of an asset retirement obligation (“ARO”) as a liability in the period in which it incurs a legal
obligation associated with the retirement of tangible long-lived assets that result from the acquisition, construction, development, and/or normal use of the asset. The Company also records a corresponding asset that is depreciated over the life of
the asset. Subsequent to its initial measurement, the ARO is adjusted at the end of each period to reflect the passage of time and changes in the estimated future cash flows underlying the obligation.
Commitments and Contingencies: The Company is subject to legal proceedings and claims that have arisen in the ordinary course of its business. Although there can be no assurance as to the ultimate
disposition of these matters, it is management’s opinion, based upon the information available at this time, that the expected outcome of these matters, individually or in the aggregate, will not have a material adverse effect on the results of
operations and financial condition of the Company. During the fourth quarter of fiscal 2019, the Company recognized a charge of $0.4 million related to litigation (see Note 12).
Revenue Recognition:
Retail Sales
The Company recognizes sales revenue, net of sales taxes and estimated sales returns, at the time it sells merchandise to the customer (point of sale). Internet sales include shipping revenue and are recorded upon shipment to the customer. The
Company records shipping and handling costs in cost of sales. Additionally, estimated sales returns are calculated based on expected returns.
Membership Fee Revenue
The Company recognizes membership fee revenue over the term of the membership, which is typically 12 months for the Company’s Platinum Backstage Pass membership, and 24 months for the Company’s Backstage Pass VIP membership. For the Company’s
Platinum Backstage Pass program, the contractual term of the program is 12 months, in which revenue is recognized over that service period. For the Company’s Backstage Pass VIP program, the term of the program is indefinite until a customer cancels
the membership. The Company estimates 24 months as the service period based on historical cancellation patterns and recognizes revenue over that service period. Membership in each program provides customers with merchandise discounts and exclusive
member-only offers. Total membership fees related to the loyalty programs collected in advance, net of estimated refunds, were as follows: cash received from customers during fiscal 2019 and 2018 was $13.0 million and $13.7 million, respectively.
Membership fee revenue recognized was $13.3 million and $15.0 million during fiscal 2019 and 2018, respectively, and recognized on a straight-line basis over the service period. The remaining performance obligation associated with the membership
programs was $4.6 million and $4.8 million as of the end of fiscal 2019 and fiscal 2018, respectively. Membership fee revenue is included in Net Sales in the Company’s Consolidated Statements of Operations. Deferred membership revenue is included in
Deferred Revenue in the Company’s Consolidated Balance Sheets.
Other Revenue
The Company recognizes revenue related to commissions earned from third parties. The Company assesses the principal versus agent considerations depending on control of the good or service before it is transferred to the customer. As the Company is
the agent and does not have control of the specified good or service, the Company recognizes the fee or commission to which the Company expects to be entitled for the agency service. Commissions earned from third parties were $3.7 million and $5.0
million during fiscal 2019 and fiscal 2018, respectively, and are included in Other Revenue in the Company’s Consolidated Statements of Operations.
Gift Cards
The Company offers gift cards for sale, which is included in deferred revenue in the Consolidated Balance Sheets. When gift cards are redeemed at the store level, revenue is recorded, and the related liability is
reduced. Breakage is estimated based on proportion to the pattern of rights exercised by the customer. The Company has the ability to reasonably and reliably estimate the gift card liability based on historical experience with redemption rates
associated with a large volume of homogeneous transactions. The Company issued $1.5 million and $1.9 million in gift cards for fiscal 2019 and fiscal 2018, respectively. The Company recognized in revenue for redeemed gift cards of $1.4 million and
$1.9 million for fiscal 2019 and fiscal 2018, respectively. The Company recorded breakage on its gift cards for both fiscal 2019 and fiscal 2018 in the amount of $0.2 million. Gift card breakage is recorded as Other Revenue in the Company’s
Consolidated Statements of Operations. The remaining performance obligation associated with our gift cards was $1.9 million and $2.0 million as of the end of fiscal 2019 and fiscal 2018, respectively.
Cost of Sales: In addition to the cost of product, the Company includes in cost of sales those costs associated with purchasing, receiving, shipping, online marketplace
fulfillment fees, inspecting and warehousing product, and depreciation related to distribution operations. Also included are costs associated with the return of product to vendors. Cost of sales further includes the cost of inventory shrink losses
and obsolescence and the benefit of vendor allowances and discounts.
Selling, General and Administrative Expenses (SG&A): Included in SG&A expenses are payroll and related costs, store operating costs, occupancy charges, Amazon fees, professional and service fees,
general operating and overhead expenses and depreciation charges (excluding those related to distribution operations). Selling, general and administrative expenses also include fixed asset write offs associated with store closures, if any, and
miscellaneous income and expense items, other than interest.
Advertising Costs and Vendor Allowances: The fye segment often receives allowances from its vendors to fund in-store displays, print and radio advertising, and other promotional
events. Vendor advertising allowances which exceed specific, incremental and identifiable costs incurred in relation to the advertising and promotions offered by the Company to its vendors are classified as a reduction in the purchase price of
merchandise inventory. Accordingly, advertising and sales promotion costs are charged to operations, offset by direct vendor reimbursements, as incurred. Total advertising expense, excluding vendor allowances, was $1.7 million and $2.2 million in
fiscal 2019 and fiscal 2018, respectively. In the aggregate, vendor allowances supporting the fye segment’s advertising and promotion are included as a reduction of SG&A expenses, and reimbursements of such costs were $1.7 million and $2.1
million in fiscal 2019 and 2018, respectively. Advertising costs for the etailz segment primarily consist of Amazon marketing expenses which were $0.9 million and $1.7 million in fiscal 2019 and fiscal 2018, respectively.
Lease Accounting: Operating lease liabilities are recognized at the lease commencement date based on the present value of the fixed lease payments using the Company’s
incremental borrowing rates for its population of leases. Related operating ROU assets are recognized based on the initial present value of the fixed lease payments, reduced by contributions from landlords, plus any prepaid rent and direct costs
from executing the leases. ROU assets are tested for impairment in the same manner as long-lived assets. Lease terms include the non-cancellable portion of the underlying leases along with any reasonably certain lease periods associated with
available renewal periods, termination options and purchase options. Lease agreements with lease and non-lease components are combined as a single lease component for all classes of underlying assets.
Leases with an initial term of 12 months or less are not recorded on the balance sheet; the Company recognizes lease expense for these leases on a straight-line basis over the lease term. Variable lease payments are
recognized as lease expense as they are incurred.
Prior to February 3, 2019, leases were accounted for under Accounting Standards Codification (ASC) Subtopic 840, Leases. The Company’s calculation of straight-line rent expense
includes the impact of escalating rents for the lease period and includes any period during which the Company is not obligated to pay rent while the store is being constructed (“rent holiday”). The Company accounts for step rent provisions,
escalation clauses and other lease concessions by recognizing these amounts on a straight-line basis over the initial lease term. The Company capitalizes leasehold improvements funded by tenant improvement allowances, depreciating them over the
term of the related leases. The tenant improvement allowances are recorded as deferred rent within other long-term liabilities in the Consolidated Balance Sheets and are amortized as a reduction in rent expense over the life of the related leases.
Income Taxes: Income taxes are accounted for under the asset and liability method. Deferred tax assets and liabilities are recognized for the future tax consequences
attributable to differences between the financial statement carrying amounts of existing assets and liabilities and their respective tax bases and operating loss and tax credit carryforwards. Deferred tax assets and liabilities are measured using
enacted tax rates expected to apply to taxable income in the years in which those temporary differences are expected to be recovered or settled. The effect on deferred tax assets and liabilities of a change in tax rates is recognized in income in the
period that includes the enactment date. Deferred tax assets are subject to valuation allowances based upon management’s estimates of realizability.
The Company recognizes the effect of income tax positions only if those positions are more likely than not of being sustained. Recognized income tax positions are measured at the largest amount that is greater than 50%
likely of being realized. Changes in recognition or measurement are reflected in the period in which the change in judgment occurs. It is the Company’s practice to recognize interest and penalties related to income tax matters in income tax expense
(benefit) in the Consolidated Statements of Operations.
Comprehensive Loss: Comprehensive loss consists of net loss and a pension actuarial income (loss) adjustment that is recognized in other comprehensive income
(loss) (see Note 9).
Stock-Based Compensation: Stock-based compensation represents the cost related to stock-based awards granted to employees and directors. The Company measures stock-based
compensation cost at grant date, based on the estimated fair value of the award, and recognizes the cost as expense on a straight-line basis (net of estimated forfeitures) over the option’s requisite service period. The Company recognizes
compensation expense based on estimated grant date fair value using the Black‑Scholes option‑pricing model. Tax benefits, if any, resulting from tax deductions in excess of the compensation cost recognized for those options are to be classified and
reported as both an operating cash outflow and financing cash inflow.
Reverse Stock Split: On August 15, 2019, the Company effected a reverse stock split of its outstanding shares of common stock at a ratio of one-for-twenty pursuant to a Certificate of Amendment to the
Company’s Certificate of Incorporation filed with the Secretary of State of the State of New York. The reverse stock split was reflected on the Nasdaq Capital Market (“Nasdaq”) beginning with the opening of trading on August 15, 2019. The primary
purpose of the reverse stock split, which was approved by the Company’s stockholders at the Company’s Annual Stockholders Meeting on June 27, 2019, was to enable the Company to regain compliance with the $1.00 minimum bid price requirement for
continued listing on Nasdaq. Pursuant to the reverse stock split, every twenty shares of the Company’s issued and outstanding shares of common stock were automatically combined into one issued and outstanding share of common stock, without any
change in the par value per share of the common stock. Unless otherwise indicated, all share and per share amounts of the common stock included in the accompanying Consolidated Financial Statements have been retrospectively adjusted to give effect to
the reverse stock split for all periods presented, including reclassifying an amount equal to the reduction in par value to additional paid-in capital. Amounts of common stock resulting from the reverse stock split were rounded up to the nearest
whole share. The reverse stock split affected all issued and outstanding shares of the Company’s common stock, and the respective numbers of shares of common stock underlying outstanding stock options, and the Company’s equity incentive plans were
proportionately adjusted.
Loss Per Share: Basic and diluted loss per share is calculated by dividing net loss by the weighted average common shares outstanding for the period. During fiscal 2019 and
fiscal 2018, the impact of all outstanding stock awards was not considered because the Company reported a net loss and such impact would be anti-dilutive. Accordingly, basic and diluted loss per share for fiscal 2019 and fiscal 2018 was the same.
Total anti-dilutive stock awards for both fiscal 2019 and fiscal 2018 were approximately 100 thousand.
Fair Value of Financial Instruments: Fair value is defined as the exchange price that would be received for an asset or paid to transfer a liability (an exit price) in the principal or most advantageous
market for the asset or liability in an orderly transaction between market participants at the measurement date.
In determining fair value, the accounting standards establish a three-level hierarchy for inputs used in measuring fair value, as follows:
| • |
Level 1 — Quoted prices in active markets for identical assets or liabilities.
|
| • |
Level 2 — Significant observable inputs other than quoted prices in active markets for similar assets and liabilities, such as quoted prices for identical or similar assets or liabilities in markets that are not active; or other inputs
that are observable or can be corroborated by observable market data.
|
| • |
Level 3 — Significant unobservable inputs reflecting our own assumptions, consistent with reasonably available assumptions made by other market participants.
|
The carrying amounts reported in the Consolidated Balance Sheets for cash and cash equivalents, accounts receivable, accounts payable and other current liabilities approximate fair value because of the immediate or short-term maturity of these
financial instruments. The carrying value of life insurance policies included in other assets approximates fair value based on estimates received from insurance companies and are classified as Level 2 measurements within the hierarchy as defined by
applicable accounting standards. The Company had no Level 3 financial assets or liabilities at February 1, 2020 or at February 2, 2019.
Segment Information: The Company operates in two reportable segments: fye and etailz. Operating loss by operating segment, is defined as loss from operations, excluding interest expense, other (loss)
income, and income taxes. The following balances by reportable segment were as follows:
|
(amounts in thousands)
|
Fiscal Year
Ended February 2, 2019 |
Fiscal Year
Ended February 2, 2019 |
||||||
|
Total Revenue
|
||||||||
|
fye
|
$
|
192,719
|
$
|
231,290
|
||||
|
etailz
|
133,216
|
186,900
|
||||||
|
Total Company
|
$
|
325,935
|
$
|
418,190
|
||||
|
Gross Profit
|
||||||||
|
fye
|
$
|
65,706
|
$
|
89,259
|
||||
|
etailz
|
30,393
|
38,815
|
||||||
|
Total Company
|
$
|
96,099
|
$
|
128,074
|
||||
|
Depreciation and amortization
|
||||||||
|
fye
|
$
|
9,166
|
$
|
4,627
|
||||
|
etailz
|
2,297
|
4,489
|
||||||
|
Total Company
|
$
|
11,463
|
$
|
9,116
|
||||
|
Asset impairment charges
|
||||||||
|
fye
|
$
|
23,218
|
$
|
1,946
|
||||
|
etailz
|
765
|
57,712
|
||||||
|
Total Company
|
$
|
23,983
|
$
|
59,658
|
||||
|
Loss From Operations
|
||||||||
|
fye
|
$
|
(50,770
|
)
|
$
|
(24,455
|
)
|
||
|
etailz
|
(6,405
|
)
|
(72,351
|
)
|
||||
|
Total Company
|
$
|
(57,175
|
)
|
$
|
(96,806
|
)
|
||
|
Merchandise Inventory
|
||||||||
|
fye
|
$
|
50,122
|
$
|
69,785
|
||||
|
etailz
|
17,836
|
25,057
|
||||||
|
Total Company
|
$
|
67,958
|
$
|
94,842
|
||||
|
Total Assets
|
||||||||
|
fye
|
$
|
69,395
|
$
|
101,785
|
||||
|
etailz
|
28,411
|
36,228
|
||||||
|
Total Company
|
$
|
97,806
|
$
|
138,013
|
||||
|
Accounts Payable
|
||||||||
|
fye
|
$
|
18,292
|
$
|
28,545
|
||||
|
etailz
|
5,828
|
5,784
|
||||||
|
Total Company
|
$
|
24,120
|
$
|
34,329
|
||||
|
Other Long Term Liabilities
|
||||||||
|
fye
|
$
|
22,089
|
$
|
24,789
|
||||
|
etailz
|
-
|
78
|
||||||
|
Total Company
|
$
|
22,089
|
$
|
24,867
|
||||
|
Capital Expenditures
|
||||||||
|
fye
|
$
|
1,222
|
$
|
1,242
|
||||
|
etailz
|
1,601
|
2,447
|
||||||
|
Total Company
|
$
|
2,823
|
$
|
3,689
|
||||
Note 2. Recently Adopted and Issued Accounting Pronouncements
During the fiscal ended February 1, 2020, the Company adopted the following accounting pronouncements.
Leases
In February 2016, the Financial Accounting Standards Board (the “FASB”) issued Accounting Standards Update (“ASU”) 2016-02, Leases (Topic 842). Lessees are required to recognize a right-of-use asset and a lease liability for virtually all leases
(other than leases that meet the definition of a short-term lease). The liability is equal to the present value of lease payments. The asset is based on the liability, subject to certain adjustments, such as for initial direct costs. For income
statement purposes, a dual model was retained, requiring leases to be classified as either operating or finance leases. Operating leases result in straight-line expense (similar to operating leases under the prior accounting standard) while finance
leases result in a frontloaded expense pattern (similar to capital leases under the prior accounting standard).
The Company adopted this new accounting standard on February 3, 2019 on a modified retrospective basis and applied the new standard to all leases greater than one year. As a result, comparative financial information has not been restated and
continues to be reported under the accounting standards in effect for fiscal 2018. The Company elected the package of practical expedients permitted under the transition guidance within the new standard, which includes the ability to carry forward
the existing lease classification and to use hindsight when determining lease term. The Company does not engage in any Lessor transactions, and as a Lessee, the Company does not have any finance leases. As a result, the new standard had a material
impact on the consolidated balance sheet but did not materially impact the Company’s consolidated operating results and did not materially impact the Company’s cash flows.
The following is a discussion of the Company’s lease policy under the new lease accounting standard:
The Company determines if an arrangement contains a lease at the inception of a contract. Right-of-use assets represent the Company’s right to use an underlying asset for the lease term and lease liabilities represent the Company’s obligation to
make lease payments arising from the lease. Right-of-use assets and lease liabilities are recognized at the commencement date based on the present value of the remaining future minimum lease payments. As the interest rate implicit in the Company’s
leases is not readily determinable, the Company utilizes its incremental borrowing rate to discount the lease payments. The operating lease right-of-use assets also include lease payments made before commencement and reduced by lease incentives.
Leases with an initial term of 12 months or less are not recorded on the consolidated balance sheet and lease expense is recognized on a straight-line basis over the term of the short-term lease.
For real estate leases, the Company accounts for lease components and non-lease components as a single lease component. Certain real estate leases require additional payments based on reimbursement for real estate taxes, common area maintenance
and insurance, which are expensed as incurred as variable lease costs. Other real estate leases contain one fixed lease payment that includes real estate taxes, common area maintenance and insurance. These fixed payments are considered part of the
lease payment and included in the right-of-use assets and lease liabilities.
The Company elected the short-term lease exemption permitted under the lease standard. As such, the Company does not record leases with an initial term of 12 months or less on the balance sheet but continue to expense them on a straight-line basis
over the lease term. As of February 1, 2020, 153 leases were short-term in nature and were exempt from being recorded on the balance sheet.
During fiscal 2019, the Company concluded, based on continued operating losses within the fye segment driven by lower than expected third quarter sales that triggering events had occurred, and an
evaluation of the fye operating lease right-of-use asset for impairment was required. Operating lease right-of-use assets, primarily at the Company’s retail store locations, where impairment was determined to exist were written down to their
estimated fair values as of the end of fiscal 2019, resulting in the recording of asset impairment charges of $18.5 million. Estimated fair values at these locations were determined based on a measure of discounted future cash flows over the
remaining lease terms at the respective locations. Future cash flows were estimated based on individual store and corporate level plans and were discounted at a rate approximating the Company’s cost of capital. Management believes its assumptions
were reasonable and consistently applied.
As a result of applying the new lease standard using a modified retrospective method, the following adjustments were made to accounts on consolidated balance sheet as of February 3, 2019:
|
Impact of Change in Accounting Policy
|
||||||||||||
|
As Reported
February 2,
2019
|
Adjustments
|
Adjusted
February 3,
2019
|
||||||||||
|
ASSETS
|
||||||||||||
|
CURRENT ASSETS
|
||||||||||||
|
Cash and cash equivalents
|
$
|
4,355
|
$
|
-
|
$
|
4,355
|
||||||
|
Restricted cash
|
4,126
|
-
|
4,126
|
|||||||||
|
Accounts receivable
|
5,383
|
-
|
5,383
|
|||||||||
|
Merchandise inventory
|
94,842
|
-
|
94,842
|
|||||||||
|
Prepaid expenses and other current assets
|
6,657
|
(748
|
)
|
5,909
|
||||||||
|
Total current assets
|
115,363
|
(748
|
)
|
114,615
|
||||||||
|
Restricted cash
|
5,745
|
-
|
5,745
|
|||||||||
|
Fixed assets, net
|
7,529
|
-
|
7,529
|
|||||||||
|
Operating lease right-of-use assets
|
-
|
28,044
|
28,044
|
|||||||||
|
Intangible assets, net
|
3,668
|
-
|
3,668
|
|||||||||
|
Other assets
|
5,708
|
-
|
5,708
|
|||||||||
|
TOTAL ASSETS
|
$
|
138,013
|
$
|
27,296
|
$
|
165,309
|
||||||
|
LIABILITIES
|
||||||||||||
|
CURRENT LIABILITIES
|
||||||||||||
|
Accounts payable
|
$
|
34,329
|
$
|
-
|
$
|
34,329
|
||||||
|
Accrued expenses and other current liabilities
|
8,132
|
(1,319
|
)
|
6,813
|
||||||||
|
Deferred revenue
|
6,955
|
-
|
6,955
|
|||||||||
|
Current portion of operating lease liabilites
|
-
|
9,064
|
9,064
|
|||||||||
|
Total current liabilities
|
49,416
|
7,745
|
57,161
|
|||||||||
|
Operating lease liabilities
|
-
|
22,728
|
22,728
|
|||||||||
|
Other long-term liabilities
|
24,867
|
(3,177
|
)
|
21,690
|
||||||||
|
TOTAL LIABILITIES
|
74,283
|
27,296
|
101,579
|
|||||||||
|
SHAREHOLDERS’ EQUITY
|
||||||||||||
|
Preferred stock ($0.01 par value; 5,000,000 shares authorized; none issued)
|
-
|
-
|
-
|
|||||||||
|
Common stock ($0.01 par value; 200,000,000 shares authorized; 3,221,834 shares issued)
|
32
|
-
|
32
|
|||||||||
|
Additional paid-in capital
|
344,826
|
-
|
344,826
|
|||||||||
|
Treasury stock at cost (1,408,892, 1,408,892 and 1,407,831 shares, respectively)
|
(230,166
|
)
|
-
|
(230,166
|
)
|
|||||||
|
Accumulated other comprehensive loss
|
(735
|
)
|
-
|
(735
|
)
|
|||||||
|
Accumulated deficit
|
(50,227
|
)
|
-
|
(50,227
|
)
|
|||||||
|
TOTAL SHAREHOLDERS’ EQUITY
|
63,730
|
-
|
63,730
|
|||||||||
|
TOTAL LIABILITIES AND SHAREHOLDERS’ EQUITY
|
$
|
138,013
|
$
|
27,296
|
$
|
165,309
|
||||||
Compensation – Retirement Benefits
In March 2017, the FASB issued ASU 2017-07, “Compensation - Retirement Benefits (Topic 715): Improving the Presentation of Net Periodic Pension Cost and Net Periodic Postretirement Benefit Cost,” which is intended to improve the presentation of
net periodic pension cost and net periodic post-retirement benefit cost in an entity’s financial statements by requiring the service cost component be disaggregated from other components of net benefit costs and presented in the same line item or
items as other compensation costs for the employees. Additionally, only the service cost component of net benefit cost is eligible for capitalization when applicable. ASU 2017-07 was effective for the Company’s fiscal year beginning February 3,
2019. This standard did not have a material effect on the Company’s consolidated financial statements.
Compensation – Stock Compensation
In May 2017, the FASB issued ASU 2017-09, “Compensation - Stock Compensation (Topic 718): Scope of Modification Accounting,” which provided clarity as to what changes to the terms or conditions of share-based payment awards require an entity to
apply modification accounting in Topic 718. ASU 2017-09 was effective for the Company for interim and annual periods in fiscal year beginning February 3, 2019. This standard did not have a material effect on the Company’s consolidated financial
statements.
Revenue Recognition
In June 2014, the FASB issued ASU 2014-09, Revenue from Contracts with Customers (Topic 606), which requires an entity to recognize the amount of revenue to which it expects to be entitled for the transfer of promised goods or services to
customers. On February 4, 2018, the Company adopted Topic 606 using the modified retrospective approach. The new standard states that revenue is recognized when performance obligations are satisfied by transferring goods or services to the customer
in an amount that the entity expects to collect in exchange for those goods or services. The satisfaction of a performance obligation with a single customer may occur at a point in time or may occur over time. The significant majority of the
Company’s revenue is recognized at a point in time, generally when a customer purchases and takes possession of merchandise through the stores or when merchandise purchased through our e-commerce websites is shipped to a customer. Revenues do not
include sales taxes or other taxes collected from customers. The Company has arrangements with customers where the performance obligations are satisfied over time, which primarily relate to the loyalty programs and gift card liabilities. The adoption
of Topic 606 impacted the timing of revenue recognition for gift card breakage. Prior to adoption of Topic 606, gift card breakage was recognized at the point gift card redemption became remote. In accordance with the Topic 606, the Company
recognizes gift card breakage in proportion to the pattern of rights exercised by the customer. The adoption of Topic 606 also impacted presentation of the Consolidated Balance Sheets related to sales return reserves to be recorded on a gross basis,
consisting of a separate right of return asset and liability. The Company’s evaluation of Topic 606 included a review of certain third-party arrangements to determine whether the Company acts as principal or agent in such arrangements, and such
evaluation did not result in any material changes in gross versus net presentation as a result of the adoption of the new standard. The cumulative effect of initially applying Topic 606 was a $0.3 million increase to the opening balance of inventory,
a $0.3 million increase to the opening balance of accrued expenses and other liabilities, a $0.5 million increase to the opening balance of deferred revenue, and a $0.5 million decrease to the opening balance of retained earnings as of February 4,
2018
Recently Issued Accounting Pronouncements
In June 2016, the FASB issued ASU No. 2016-13, “Financial Instruments – Credit Losses (Topic 326): Measurement of Credit Losses on Financial Instruments,” which introduced an expected credit loss model for the impairment of financial assets
measured at amortized cost. The model replaces the probable, incurred loss model for those assets and instead, broadens the information an entity must consider in developing its expected credit loss estimate for assets measured at amortized cost. ASU
No. 2016-13 is effective beginning in the first quarter of fiscal 2020. Early adoption is permitted. We will adopt this standard in the first quarter of Fiscal 2020. We have evaluated the impact of this new standard on the consolidated financial
statements which is immaterial.
In August 2018, the FASB issued ASU 2018-14, “Compensation—Retirement Benefits—Defined Benefit Plans—General (Subtopic 715-20): Disclosure Framework— Changes to the Disclosure Requirements for Defined Benefit Plans”, which removes certain
disclosures that are no longer cost beneficial and also includes additional disclosures to improve the overall usefulness of the disclosure requirements to financial statement users. This standard will be effective for public entities for fiscal
years beginning after December 15, 2020, however early adoption is permitted. We are currently evaluating the impact of this new standard on the consolidated financial statements.
In December 2019, the FASB issued ASU 2019-12, “Simplifying the Accounting for Income Taxes” (Topic 740), which simplifies the accounting for income taxes by eliminating certain exceptions to the guidance in ASC 740 related to the approach for
intraperiod tax allocation, the methodology for calculating income taxes in an interim period and the recognition of deferred tax liabilities for outside basis differences. The standard also simplifies aspects of the enacted changes in tax laws or
rates. This standard will be effective for public entities for fiscal years, and interim periods within those fiscal years, beginning after December 15, 2020, however early adoption is permitted. We are currently evaluating the impact of this new
standard on the consolidated financial statements.
Recent accounting pronouncements pending adoption not discussed above are either not applicable or are not expected to have a material impact on our consolidated financial condition, results of operations, or cash flows.
Note 3. Goodwill and Other Intangible Assets
Determining the fair value of a reporting unit requires the use of significant estimates and assumptions, including revenue growth rates, operating margins, discount rates, and future market conditions, among others.
Goodwill and other long-lived assets are reviewed for impairment if circumstances indicate that the carrying amount may not be recoverable.
During fiscal 2019, the Company fully impaired its vendor relationships and the Company recognized an impairment loss of $0.8 million.
During fiscal 2018, the Company concluded, based on continued operating losses for the etailz segment driven by lower than expected operating results culminating in the fourth quarter of fiscal 2018 that a triggering event had occurred, and an
evaluation of intangible assets for impairment was required. Intangible assets related to technology and vendor relationships were written down to their estimated fair value at the end of fiscal 2018 resulting in the recognition of asset impairment
charges of $16.4 million. As a result of the annual goodwill impairment review, it was determined that the goodwill balance was fully impaired, and the Company recognized an impairment loss of $39.2 million.
The Company continues to amortize certain vendor relationships, technology, and trade names and trademarks that have finite lives.
Identifiable intangible assets as of February 1, 2020 consisted of the following:
|
(amounts in thousands)
|
February 1, 2020
|
|||||||||||||||||||
|
|
Weighted Average
Amortization
Period
(in months)
|
Gross Carrying
Amount
|
Accumulated
Amortization
|
Impairment
|
Net Carrying
Amount
|
|||||||||||||||
|
|
||||||||||||||||||||
|
Vendor Relationships
|
120
|
$
|
19,100
|
$
|
4,513
|
$
|
14,587
|
$
|
-
|
|||||||||||
|
Technology
|
60
|
6,700
|
3,466
|
2,587
|
647
|
|||||||||||||||
|
Trade names and trademarks
|
60
|
3,200
|
2,087
|
-
|
1,113
|
|||||||||||||||
|
|
$
|
29,000
|
$
|
10,066
|
$
|
17,174
|
$
|
1,760
|
||||||||||||
The changes in net intangibles and goodwill from February 2, 2019 to February 1, 2020 were as follows:
|
(amounts in thousands)
|
February 2,
2019 |
Amortization
|
Impairment
|
February 1,
2020 |
||||||||||||
|
Amortized intangible assets:
|
||||||||||||||||
|
Vendor relationships
|
$
|
880
|
$
|
115
|
$
|
765
|
$
|
-
|
||||||||
|
Technology
|
1,035
|
388
|
-
|
647
|
||||||||||||
|
Trade names and trademarks
|
1,753
|
640
|
-
|
1,113
|
||||||||||||
|
Net amortized intangible assets
|
$
|
3,668
|
$
|
1,143
|
$
|
765
|
$
|
1,760
|
||||||||
The changes in net intangibles and goodwill from February 3, 2018 to February 2, 2019 were as follows:
|
(amounts in thousands)
|
February 3,
2018 |
Amortization
|
Impairment
|
February 2,
2019 |
||||||||||||
|
Amortized intangible assets:
|
||||||||||||||||
|
Vendor relationships
|
$
|
16,612
|
$
|
1,910
|
$
|
13,822
|
$
|
880
|
||||||||
|
Technology
|
4,962
|
1,340
|
2,587
|
1,035
|
||||||||||||
|
Trade names and trademarks
|
2,393
|
640
|
-
|
1,753
|
||||||||||||
|
Net amortized intangible assets
|
$
|
23,967
|
$
|
3,890
|
$
|
16,409
|
$
|
3,668
|
||||||||
|
Unamortized intangible assets:
|
||||||||||||||||
|
Goodwill
|
$
|
39,191
|
$
|
-
|
$
|
39,191
|
$
|
-
|
||||||||
|
Total unamortized intangible assets
|
$
|
39,191
|
$
|
-
|
$
|
39,191
|
$
|
-
|
||||||||
Estimated amortization expense for the remaining useful lives of the intangible assets is as follows (amounts in thousands):
|
Fiscal Year
|
Amortization
|
|||
|
2020
|
$
|
1,028
|
||
|
2021
|
732
|
|||
|
2022
|
-
|
|||
|
2023
|
-
|
|||
|
2024
|
-
|
|||
|
Thereafter
|
-
|
|||
Note 4. Fixed Assets
Fixed assets consist of the following:
|
February 1,
2020 |
February 2,
2019 |
|||||||
|
(amounts in thousands)
|
||||||||
|
Capitalized software
|
$
|
2,388
|
$
|
845
|
||||
|
Fixtures and equipment
|
538
|
10,040
|
||||||
|
Leasehold improvements
|
45
|
6,836
|
||||||
|
Total fixed assets
|
2,971
|
17,721
|
||||||
|
Allowances for depreciation and amortization
|
(781
|
)
|
(10,192
|
)
|
||||
|
Fixed assets, net
|
$
|
2,190
|
$
|
7,529
|
||||
Depreciation expense included in fiscal 2019 and fiscal 2018 SG&A expenses within the Consolidated Statements of Operations were $3.3 million and $5.2 million, respectively. The Company recorded $4.7 million and
$4.1 million in fixed asset impairment during fiscal 2019 and fiscal 2018, respectively.
Note 5. Restricted Cash
As of February 1, 2020 and February 2, 2019, the Company had restricted cash of $5.9 million and $9.9 million, respectively.
Restricted cash balance at the end of fiscal 2019 consisted of $5.9 million rabbi trust, that resulted from the death of the Company’s former Chairman, of which $1.0 million was classified as restricted cash in current assets and $4.9 million was
classified as restricted cash as a long-term asset.
Restricted cash balance at the end of fiscal 2018 consisted of $3.2 million related to the earn-out amount that could be paid to the selling shareholders of etailz in accordance with the share purchase agreement created during the acquisition of
etailz in fiscal 2016; and a $6.7 million rabbi trust, that resulted from the death of the Company’s former Chairman, of which $1.0 million was classified as restricted cash in current assets and $5.7 million was classified as restricted cash as a
long-term asset.
During fiscal 2019, the $3.2 million earn-out escrow balance was returned to the Company as a result of etailz not achieving the prescribed earnings target, outlined in the amended etailz acquisition share purchase
agreement, as amended.
A summary of cash, cash equivalents and restricted cash is as follows (amounts in thousands):
|
February 1,
2020
|
February 2,
2019
|
|||||||
|
Cash and cash equivalents
|
$
|
2,977
|
$
|
4,355
|
||||
|
Restricted cash
|
5,875
|
9,871
|
||||||
|
Total cash, cash equivalents and restricted cash
|
$
|
8,852
|
$
|
14,226
|
||||
Note 6. Debt
Credit Facility
In January 2017, the Company amended and restated its revolving credit facility (“Credit Facility”). The Credit Facility provided for commitments of $50 million subject to increase up to $75 million during the months of October to December of
each year, as needed. The availability under the Credit Facility is subject to limitations based on receivables and inventory levels. The principal amount of all outstanding loans under the Credit Facility together with any accrued but unpaid
interest, are due and payable in January 2022, unless otherwise paid earlier pursuant to the terms of the Credit Facility. Payments of amounts due under the Credit Facility are secured by the assets of the Company.
As of February 1, 2020, the Company had outstanding borrowings of $13.1 million under the Credit Facility and as of February 2, 2019 the Company did not have any outstanding borrowings under the Credit Facility. Peak borrowings under the Credit
Facility during fiscal 2019 and fiscal 2018 were $35.9 million and $35.7 million, respectively. As of February 1, 2020 and February 2, 2019, the Company had no outstanding letters of credit. The Company had $12 million and $41 million available for
borrowing under the Credit Facility as of February 1, 2020 and February 2, 2019, respectively.
On February 20, 2020, in conjunction with the FYE Transaction, the Company fully satisfied its obligations under the Credit Facility through proceeds received from the sale of the fye business and borrowings under the new etailz credit facility,
as further discussed below, accordingly the Credit Facility is no longer available to the Company.
New Credit Facility
On February 20, 2020, etailz Inc. entered into a Loan and Security Agreement (the “Loan Agreement”) with Encina Business Credit, LLC (“Encina”), as administrative agent, under which the lenders party thereto committed to provide up to $25 million
in loans under a three-year, secured revolving credit facility (the “ New Credit Facility”). Concurrent with the sale of the fye business, the Company borrowed $3.3 million under the New Credit Facility to satisfy the remaining obligations of the
Company under the aforementioned Credit Facility.
The commitments by the lenders under the New Credit Facility are subject to borrowing base and availability restrictions. Up to $5.0 million of the New Credit Facility may be used for the making of swing line loans.
Interest under the New Credit Facility accrues, subject to certain terms and conditions under the Loan Agreement, at a LIBOR Rate or Base Rate, plus, in each case, an Applicable Margin, which is determined by reference to the level of Availability
as defined in the Loan Agreement, with the Applicable Margin for LIBOR Rate loans ranging from 4.00% to 4.50% and the Applicable Margin for Base Rate loans ranging from 3.00% to 3.50%.
The New Credit Facility is secured by a first priority security interest in substantially all of the assets of etailz, including inventory, accounts receivable, cash and cash equivalents and certain other collateral of the borrowers and guarantors
under the New Credit Facility (collectively, the “Credit Facility Parties”) and by a first priority pledge by the Company of its equity interests in etailz. The Company will provide a limited guarantee of etailz’s obligations under the New Credit
Facility.
Among other things, the Loan Agreement limits etailz’s ability to incur additional indebtedness, create liens, make investments, make restricted payments or specified payments and merge or acquire assets. The Loan Agreement also requires etailz
to comply with a financial maintenance covenant.
The Loan Agreement contains customary events of default, including, but not limited to, payment defaults, breaches of representations and warranties, covenant defaults, cross-defaults to other obligations, customary ERISA defaults, certain events
of bankruptcy and insolvency, judgment defaults, the invalidity of liens on collateral, change in control, cessation of business or the liquidation of material assets of the Credit Facility Parties taken as a whole, the occurrence of an uninsured
loss to a material portion of collateral and failure of the obligations under the New Credit Facility to constitute senior indebtedness under any applicable subordination or intercreditor agreements.
On March 30, 2020, the Company and etailz (the “Loan Parties”) entered into Amendment No. 1 to the Loan Agreement (the “Amendment”). Pursuant to the Amendment, among other things, (i) the Company was added as “Parent” under the Amended Loan
Agreement, (ii) the Company granted a first priority security interest in substantially all of the assets of the Company, including inventory, accounts receivable, cash and cash equivalents and certain other collateral, and (iii) the Loan Agreement
was amended to (a) permit the incurrence of certain subordinated indebtedness under the Subordinated Loan Agreement (as defined below) and (b) limit the Company’s ability to incur additional indebtedness, create liens, make investments, make
restricted payments or specified payments and merge or acquire assets.
Subordinated Loan Agreement
On March 30, 2020, the Loan Parties entered into a Subordinated Loan and Security Agreement (the “Subordinated Loan Agreement”) with the lenders party thereto from time to time (the “Lenders”) and TWEC Loan Collateral Agent, LLC (“Collateral
Agent”), as collateral agent for the Lenders, pursuant to which the Lenders made a $5.2 million secured term loan (the “Subordinated Loan”) to etailz with a scheduled maturity date of May 22, 2023.
Interest on the Subordinated Loan accrues, subject to certain terms and conditions under the Subordinated Loan Agreement, at the rate of twelve percent (12.0%) per annum, compounded on the last day of each calendar quarter by becoming a part of
the principal amount of the Subordinated Loan.
The Subordinated Loan is secured by a second priority security interest in substantially all of the assets of the Loan Parties, including inventory, accounts receivable, cash and cash equivalents and certain other collateral of the borrowers and
guarantors under the Subordinated Loan Agreement (collectively, the “Second Lien Credit Facility Parties”). The Company will provide a limited guarantee of etailz’s obligations under the Subordinated Loan.
Among other things, the Subordinated Loan Agreement limits the Loan Parties’ ability to incur additional indebtedness, create liens, make investments, make restricted payments or specified payments and merge or acquire assets.
The Subordinated Loan Agreement contains customary events of default, including, but not limited to, payment defaults, breaches of representations and warranties, covenant defaults, cross-defaults to other obligations, customary ERISA defaults,
certain events of bankruptcy and insolvency, judgment defaults, the invalidity of liens on collateral, change in control, cessation of business or the liquidation of material assets of the Second Lien Credit Facility Parties taken as a whole and the
occurrence of an uninsured loss to a material portion of collateral.
Note 7. Leases
During fiscal 2019, the Company conducted all of its operations from leased premises that include retail stores, distribution centers, and administrative offices. At February 1, 2020, the Company leased 200 stores
under operating leases. In addition, the Company currently leases 2 distribution centers and 2 administrative offices.
The following table is a summary of the Company’s components of net lease cost for the thirteen- and fifty-two-week period ended February 1, 2020:
|
Thirteen
Weeks Ended
|
Fifty-two
Weeks Ended
|
||||||||
|
(amounts in thousands)
|
Classification
|
February 1,
2020
|
February 1,
2020
|
||||||
|
Short-term operating lease cost
|
SG&A
|
$
|
4,974
|
$
|
15,017
|
||||
|
Operating lease cost
|
SG&A
|
1,187
|
6,099
|
||||||
|
Variable lease cost
|
SG&A
|
210
|
579
|
||||||
|
Net lease cost
|
$
|
6,371
|
$
|
21,695
|
|||||
During the thirteen and fifty-two weeks ended February 2, 2019, the Company recorded minimum rentals of $6.4 million and $21.7 million, respectively, and did not record any contingent rentals. During fiscal 2018, minimum
rent payments based on a store’s sales volume were $0.5 million.
As of February 1, 2020, the maturity of lease liabilities is as follows:
|
Operating Leases
|
||||
|
(amounts in thousands)
|
||||
|
2020
|
10,501 | |||
|
2021
|
7,312
|
|||
|
2022
|
3,181
|
|||
|
2023
|
2,278
|
|||
|
2024
|
1,509
|
|||
|
Thereafter
|
607
|
|||
|
Total lease payments
|
25,388 | |||
|
Less: amounts representing interest
|
(2,615
|
)
|
||
|
Present value of lease liabilities
|
$
|
22,773
|
||
Lease term and discount rate are as follows:
|
As of February 1, 2020
|
||||
|
Weighted-average remaining lease term (years)
|
||||
|
Operating leases
|
2.4
|
|||
|
Weighted-average discount rate Operating leases
|
5
|
%
|
||
Other information:
|
Fiscal 2019
|
||||
|
(amounts in thousands)
|
||||
|
Cash paid for amounts included in the measurement of operating lease liabilities
|
||||
|
Operating cash flows from operating leases
|
$
|
8,918
|
||
As determined prior to the adoption of the new lease standard, the future minimum lease payments under operating leases in effect as of February 2, 2019 were as follows:
|
(amounts in thousands)
|
||||
|
2019
|
$
|
24,426
|
||
|
2020
|
8,393
|
|||
|
2021
|
5,239
|
|||
|
2022
|
1,881
|
|||
|
2023
|
1,137
|
|||
|
Thereafter
|
1,060
|
|||
|
Total minimum lease payments
|
$
|
42,136
|
||
Effective with the sales of the fye segment all future obligations for store leases and the lease for the distribution center and administrative offices in Albany, NY were assumed by Sunrise Records, pursuant to the
Asset Purchase Agreement.
Future minimum rental payments required under the remaining leases for the administrative office and distribution center in Spokane, Washington at February 1, 2020, are as follows (amounts in thousands):
|
(amounts in thousands)
|
Operating Leases
|
|||
|
2020
|
$
|
692
|
||
|
2021
|
724
|
|||
|
2022
|
746
|
|||
|
2023
|
766
|
|||
|
2024
|
652
|
|||
|
Thereafter
|
296
|
|||
|
Total minimum lease payments
|
$
|
3,876
|
||
Note 8. Shareholders’ Equity
The Company classifies repurchased shares as treasury stock on the Company’s Consolidated Balance Sheet. There were no treasury stock repurchases during fiscal 2019 and fiscal 2018.
On August 15, 2019, we completed a 1-for-20 reverse stock split of our outstanding Common Stock. As a result of this stock split, our issued and outstanding Common Stock decreased from 36,291,620 to 1,814,581 shares.
Accordingly, all share and per share information contained in this report has been restated to retroactively show the effect of this stock split.
No cash dividends were paid in fiscal 2019 and fiscal 2018. The Company’s Credit Facility contained certain restrictions related to the payment of cash dividends, including limiting the amount of dividends to $5.0 million annually and not
allowing borrowings under the amended facility for the six months before or six months after the dividend payment.
Note 9. Benefit Plans
401(k) Savings Plan
Each segment of the Company offers a 401(k) Savings Plan to eligible employees meeting certain age and service requirements.
The fye segment offers a 401(k) plan which permits participants to contribute up to 80% of their salary, including bonuses, up to the maximum allowable by IRS regulations. The Company matches 50% of the first 6% of
employee contributions after completing one year of service. Participants are immediately vested in their voluntary contributions plus actual earnings thereon. Participant vesting of the Company’s matching contribution is based on the years of
service completed by the participant. Participants are fully vested upon the completion of four years of service. As of February 3, 2019, the fye segment suspended its matching contribution in response to one of the Company’s cost‑cutting
initiatives. The Trans World Entertainment Corporation 401(K) Plan for the fye segment was transferred to the acquiring company as part of the FYE Transaction pursuant to the terms of the Asset Purchase Agreement.
The etailz segment offers a 401(k) plan, the etailz 401(K) Plan, which permits participants to contribute up to the maximum allowable by IRS regulations. The Company matches 100% of the first 6% of employee
contributions after completing one year of service. Participants are immediately vested in their voluntary contributions plus actual earnings thereon. Participant vesting of the Company’s matching contribution is based on the years of service
completed by the participant. Participants are fully vested upon the completion of three years of service. All participant forfeitures of non-vested benefits are used to reduce the Company’s contributions or fees in future years.
Total expense related to the fye segment’s matching contributions was approximately $0 and $340,000 in fiscal 2019 and fiscal 2018, respectively. Total expense related to the etailz segment’s matching contributions
was approximately $303,000 and $297,000 in fiscal 2019 and fiscal 2018, respectively.
Stock Award Plans
As of February 1, 2020, there was approximately $0.3 million of unrecognized compensation cost related to stock option awards comprised of the following: $0.2 million was related to stock option awards listed in the table below and expected to be
recognized as expense over a weighted average period of 1.2 years and $0.1 million was related to restricted stock option awards expected to be recognized as expense over a weighted average period of 2.7 years. The FYE Transaction in February 2020
constituted a change of control and vesting on all unvested options was accelerated. As a result, all of the unrecognized compensation expense was recognized in the first quarter of fiscal 2020.
The Company has outstanding awards under three employee stock award plans, the 2005 Long Term Incentive and Share Award Plan, the Amended and Restated 2005 Long Term Incentive and Share Award Plan (the “Old Plans”);
and the 2005 Long Term Incentive and Share Award Plan (as amended and restated April 5, 2017 (the “New Plan”). Collectively, these plans are referred to herein as the Stock Award Plans. Additionally, the Company had a stock award plan for
non-employee directors (the “1990 Plan”). The Company no longer issues stock options under the Old Plans or the 1990 Plan.
Equity awards authorized for issuance under the New Plan total 250 thousand. As of February 1, 2020, of the awards authorized for issuance under the Stock Award Plans, approximately 129 thousand were granted and are outstanding, 99 thousand of
which were vested and exercisable. Shares available for future grants of options and other share-based awards under the New Plan at February 1, 2020 were 213 thousand.
The fair values of the options granted have been estimated at the date of grant using the Black - Scholes option pricing model with the following assumptions:
|
2019
|
2018
|
|||||||
|
Dividend yield
|
0
|
%
|
0
|
%
|
||||
|
Expected stock price volatility
|
63.7-70.1
|
%
|
50.5-54.0
|
%
|
||||
|
Risk-free interest rate
|
1.35%-1.62
|
%
|
2.71%-3.01
|
%
|
||||
|
Expected award life ( in years)
|
5.64-6.98
|
5.64-6.98
|
||||||
|
Weighted average fair value per share of awards granted during the year
|
$
|
4.46
|
$
|
10.00
|
||||
The following table summarizes stock option activity under the Stock Award Plans:
|
Employee and Director Stock Award Plans
|
||||||||||||||||||||
|
Number of
Shares
Subject To
Option
|
Stock Award
Exercise Price
Range Per Share
|
Weighted
Average
Exercise
Price
|
Other
Share
Awards (1)
|
Weighted
Average Grant
Fair Value/
Exercise Price
|
||||||||||||||||
|
Balance February 3, 2018
|
129,296
|
$
|
32.00-$97.40
|
$
|
61.20
|
8,921
|
$
|
65.20
|
||||||||||||
|
Granted
|
27,750
|
$
|
19.60-$20.80
|
19.80
|
11,224
|
22.40
|
||||||||||||||
|
Cancelled/Forfeited
|
(18,125
|
)
|
$
|
19.60-$77.60
|
57.68
|
-
|
38.80
|
|||||||||||||
|
Exercised
|
-
|
-
|
-
|
(6,575
|
)
|
-
|
||||||||||||||
|
Balance February 2, 2019
|
138,921
|
$
|
19.60-$97.40
|
$
|
55.00
|
13,571
|
$
|
33.60
|
||||||||||||
|
Granted
|
5,750
|
$
|
3.51-$5.40
|
3.76
|
-
|
-
|
||||||||||||||
|
Cancelled/Forfeited
|
(15,475
|
)
|
$
|
34.60-$95.40
|
57.68
|
-
|
-
|
|||||||||||||
|
Exercised
|
-
|
-
|
-
|
(3,626
|
)
|
5.66
|
||||||||||||||
|
Balance February 1, 2020
|
129,196
|
$
|
3.51-$97.40
|
$
|
52.11
|
9,945
|
$
|
36.75
|
||||||||||||
(1) Other Share Awards include deferred shares granted to executives and directors.
As of February 1, 2020, all stock awards outstanding and exercisable had a grant price higher than the market price of the stock and had no intrinsic value.
During fiscal 2019, the Company recognized approximately $40 thousand in expenses for deferred shares issued to non-employee directors. During fiscal 2018, the Company recognized approximately $79 thousand in expenses
for deferred shares issued to non-employee directors. There were no exercises of non-restricted stock options during fiscal 2019 and fiscal 2018.
In connection with the acquisition of etailz, the Company issued 78,628 restricted shares of Company common stock to a key etailz employee, with a grant date fair value of $71.20 per share, as adjusted for the reverse stock split. These shares
vested ratably through January 2019 and were fully amortized in fiscal 2018. Total expense related to these shares was $2.4 million in fiscal 2018. The Company recognized a total of $5.6 million of compensation cost related to these restricted
shares.
Defined Benefit Plans
The Company maintains a non-qualified Supplemental Executive Retirement Plan (“SERP”) for certain Executive Officers of the Company. The SERP, which is unfunded, provides eligible executives defined pension benefits
that supplement benefits under other retirement arrangements. The annual benefit amount is based on salary and bonus at the time of retirement and number of years of service.
Prior to June 1, 2003, the Company had provided the Board of Directors with a noncontributory, unfunded retirement plan (“Director Retirement Plan”) that paid retired directors an annual retirement benefit.
For fiscal 2019 and 2018, net periodic benefit cost recognized under both plans totaled approximately $0.6 million in each fiscal year. The accrued pension liability for both plans was approximately $17.5 million and $18.3 million at February 1,
2020 and February 2, 2019, respectively, and is recorded within other long-term liabilities on the Consolidated Balance Sheets. The accumulated benefit obligation for both plans was $17.7 million and $18.4 million as of the fiscal years ended
February 1, 2020 and February 2, 2019, respectively.
The following is a summary of the Company’s defined benefit pension plans as of each fiscal year-end:
Obligation and Funded Status:
|
(amounts in thousands)
|
February 1,
2020 |
February 2,
2019 |
||||||
|
Change in Projected Benefit Obligation:
|
||||||||
|
Benefit obligation at beginning of year
|
$
|
17,476
|
$
|
18,334
|
||||
|
Service cost
|
55
|
56
|
||||||
|
Interest cost
|
568
|
560
|
||||||
|
Actuarial loss (gain)
|
773
|
(275
|
)
|
|||||
|
Benefits paid
|
(1,199
|
)
|
(1,199
|
)
|
||||
|
Benefit obligation at end of year
|
$
|
17,673
|
$
|
17,476
|
||||
|
Fair value of plan assets at end of year
|
$
|
-
|
$
|
-
|
||||
|
Funded status
|
$
|
(17,673
|
)
|
$
|
(17,476
|
)
|
||
|
Unrecognized net actuarial loss (gain)
|
529
|
(263
|
)
|
|||||
|
Accrued benefit cost
|
$
|
(17,144
|
)
|
$
|
(17,739
|
)
|
||
Amounts recognized in the Consolidated Balance Sheets consist of:
|
February 1,
2020 |
February 2,
2019 |
|||||||
|
(amounts in thousands)
|
||||||||
|
Current liability
|
$
|
(1,199
|
)
|
$
|
(1,199
|
)
|
||
|
Long term liability
|
(17,247
|
)
|
(16,002
|
)
|
||||
|
Accumulated other comprehensive loss (income)
|
773
|
(275
|
)
|
|||||
|
Net amount recognized
|
$
|
(17,673
|
)
|
$
|
(17,476
|
)
|
||
Components of Net Periodic Benefit Cost and Other Amounts Recognized in Other Comprehensive Loss:
Net Periodic Benefit Cost:
|
Fiscal Year
|
||||||||
|
2019
|
2018
|
|||||||
|
Service cost
|
$
|
55
|
$
|
56
|
||||
|
Interest cost
|
568
|
560
|
||||||
|
Amortization of actuarial net gain
|
(20
|
)
|
(19
|
)
|
||||
|
Net periodic benefit cost
|
$
|
603
|
$
|
597
|
||||
Other Changes in Benefit Obligations Recognized in Other Comprehensive Loss:
|
2019
|
2018
|
|||||||
|
Net prior service cost recognized as a component of net periodic benefit cost
|
$
|
-
|
$
|
-
|
||||
|
Net actuarial loss (gain) arising during the period
|
744
|
(263
|
)
|
|||||
|
744
|
(263
|
)
|
||||||
|
Income tax effect
|
-
|
-
|
||||||
|
Total recognized in other comprehensive loss
|
$
|
744
|
$
|
(263
|
)
|
|||
|
Total recognized in net periodic benefit cost and other comprehensive loss
|
$
|
1,341
|
$
|
334
|
||||
The pre-tax components of accumulated other comprehensive loss, which have not yet been recognized as components of net periodic benefit cost as of February 1, 2020 and February 2, 2019 and the tax effect are summarized below.
|
(amounts in thousands)
|
February 1,
|
February 2,
|
||||||
|
2020
|
2019
|
|||||||
|
Net unrecognized actuarial loss (gain)
|
$
|
744
|
$
|
(263
|
)
|
|||
|
Other actuarial adjustments
|
(365
|
)
|
(102
|
)
|
||||
|
Accumulated other comprehensive loss (income)
|
$
|
379
|
$
|
(365
|
)
|
|||
|
Tax expense
|
1,100
|
1,100
|
||||||
|
Accumulated other comprehensive loss
|
$
|
1,479
|
$
|
735
|
||||
|
Fiscal Year
|
||||||||
|
2019
|
2018
|
|||||||
|
Weighted-average assumptions used to determine benefit obligation:
|
||||||||
|
Discount rate
|
2.31
|
%
|
3.37
|
%
|
||||
|
Salary increase rate
|
0.00
|
%
|
3.00
|
%
|
||||
|
Measurement date
|
Jan 31, 2020
|
Jan 31, 2019
|
||||||
|
Fiscal Year
|
||||||||
|
2019
|
2018
|
|||||||
|
Weighted-average assumptions used to determine net periodic benefit cost:
|
||||||||
|
Discount rate
|
2.31
|
%
|
3.61
|
%
|
||||
|
Salary increase rate
|
N/A
|
3.00
|
%
|
|||||
The discount rate is based on the rates implicit in high-quality fixed-income investments currently available as of the measurement date. The Citigroup Pension Discount Curve (CPDC) rates are intended to represent the
spot rates implied by the high-quality corporate bond market in the U.S. The projected benefit payments attributed to the projected benefit obligation have been discounted using the CPDC mid-year rates and the discount rate is the single constant
rate that produces the same total present value.
The following benefit payments over the next ten years are expected to be paid:
|
Year
|
Pension Benefits
|
|||
|
(amounts in thousands)
|
||||
|
2020
|
1,184
|
|||
|
2021
|
1,184
|
|||
|
2022
|
1,149
|
|||
|
2023
|
1,149
|
|||
|
2024
|
1,149
|
|||
|
2025 – 2029
|
6,504
|
|||
Note 10. Income Taxes
Income tax expense consists of the following:
|
Fiscal Year
|
||||||||
|
2019
|
2018
|
|||||||
|
(amounts in thousands)
|
||||||||
|
Federal - current
|
$
|
-
|
$
|
-
|
||||
|
State - current
|
316
|
80
|
||||||
|
Income tax expense
|
$
|
316
|
$
|
80
|
||||
A reconciliation of the Company’s effective income tax rate with the federal statutory rate is as follows:
|
Fiscal Year
|
||||||||
|
2019
|
2018
|
|||||||
|
Federal statutory rate
|
21.0
|
%
|
21.0
|
%
|
||||
|
State income taxes, net of federal tax effect
|
(0.5
|
%)
|
(0.3
|
%)
|
||||
|
Change in Valuation Allowance
|
(21.0
|
%)
|
(12.5
|
%)
|
||||
|
Cash surrender value - insurance / benefit program
|
0.1
|
%
|
---
|
%
|
||||
|
Goodwill Impairment
|
---
|
%
|
(8.5
|
%)
|
||||
|
Contingent consideration
|
---
|
%
|
0.1
|
%
|
||||
|
Other
|
(0.1
|
%)
|
0.1
|
%
|
||||
|
Effective tax rate
|
(0.5
|
%)
|
(0.1
|
%)
|
||||
The Other category is comprised of various items, including the impacts of non-deductible entertainment, penalties and parking benefits and the refundable portion of the federal alternative minimum tax carryover
credit.
Significant components of the Company’s deferred tax assets are as follows:
|
February 1,
2020 |
February 2,
2019 |
|||||||
|
(amounts in thousands)
|
||||||||
|
DEFERRED TAX ASSETS
|
||||||||
|
Accrued Expenses
|
$
|
1,783
|
$
|
559
|
||||
|
Inventory
|
$
|
32
|
$
|
-
|
||||
|
Retirement and compensation related accruals
|
5,888
|
6,001
|
||||||
|
Fixed assets
|
6,470
|
6,463
|
||||||
|
Federal and state net operating loss and credit carry forwards
|
83,562
|
75,117
|
||||||
|
Real estate leases, included deferred rent
|
5,712
|
1,973
|
||||||
|
Losses on investment
|
896
|
584
|
||||||
|
Others
|
549
|
556
|
||||||
|
Gross deferred tax assets before valuation allowance
|
104,892
|
91,253
|
||||||
|
Less: valuation allowance
|
(104,556
|
)
|
(90,161
|
)
|
||||
|
Total deferred tax assets
|
$
|
336
|
$
|
1,092
|
||||
|
DEFERRED TAX LIABILITIES
|
||||||||
|
Intangibles
|
$
|
(336
|
)
|
$
|
(922
|
)
|
||
|
Inventory
|
-
|
(170
|
)
|
|||||
|
Total deferred tax liabilities
|
$
|
(336
|
)
|
$
|
(1,092
|
)
|
||
|
NET DEFERRED TAX ASSET
|
$
|
-
|
$
|
-
|
||||
The Company, at the end of fiscal 2019, has a net operating loss carryforward of $288.1 million for federal income tax purposes which will expire at various times throughout 2039 with a portion being available
indefinitely. The Company has approximately $280.2 million of net operating loss carryforward for state income tax purposes as of the end of fiscal 2019 that expire at various times through 2039 and are subject to certain limitations and statutory
expiration periods. The state net operating loss carryforwards are subject to various business apportionment factors and multiple jurisdictional requirements when utilized. The Company has federal tax credit carryforwards of $0.5 million which
will expire in 2026. The Company has state tax credit carryforwards of $1.1 million, of which $0.2 million will expire in 2027.
In assessing the realizability of deferred tax assets, management considers whether it is more likely than not that some portion or all of the deferred tax assets will not be realized. The ultimate realization of
deferred tax assets is dependent upon the generation of future taxable income. Management considers the scheduled reversal of taxable temporary differences, projected future taxable income and tax planning strategies in making this assessment.
Based on the available objective evidence, management concluded that a full valuation allowance should be recorded against its deferred tax assets. As of February 1, 2020, the valuation allowance increased to $104.6 million from $90.2 million at
February 2, 2019. Management will continue to assess the valuation allowance against the gross deferred assets.
A reconciliation of the beginning and ending amounts of unrecognized tax benefits for the respective years is provided below. Amounts presented excluded interest and penalties, where applicable, on unrecognized tax benefits:
|
Fiscal Year
|
||||||||
|
2019
|
2018
|
|||||||
|
(amounts in thousands)
|
||||||||
|
Unrecognized tax benefits at beginning of year
|
$
|
1,930
|
$
|
1,930
|
||||
|
Increases in tax positions from prior years
|
-
|
-
|
||||||
|
Decreases in tax positions from prior years
|
-
|
-
|
||||||
|
Increases in tax positions for current years
|
-
|
-
|
||||||
|
Settlements
|
-
|
-
|
||||||
|
Lapse of applicable statute of limitations
|
-
|
-
|
||||||
|
Unrecognized tax benefits at end of year
|
$
|
1,930
|
$
|
1,930
|
||||
As of February 1, 2020, the Company had $1.9 million of gross unrecognized tax benefits, $1.5 million of which would affect the Company’s tax rate if recognized. While it is reasonably possible that the amount of unrecognized tax benefits will
increase or decrease within the next twelve months, the Company does not expect the change to have a significant impact on its results of operations or financial position. The Company is subject to U.S. federal income tax as well as income tax of
multiple state jurisdictions. The Company has substantially concluded all federal income tax matters and all material state and local income tax matters through fiscal 2013.
The Company’s practice is to recognize interest and penalties associated with its unrecognized tax benefits as a component of income tax expense in the Company’s Consolidated Statements of Operations. During fiscal
2019, the Company accrued a provision for interest expense of $0.2 million. As of February 1, 2020, the liability for uncertain tax positions reflected in the Company’s Consolidated Balance Sheets was $3.5 million, including accrued interest and
penalties of $2.7 million.
The Tax Cuts and Jobs Act also repeals the Corporation Alternative Minimum Tax (“AMT”) for tax years beginning after December 31, 2017. Any AMT carryover credits will be refundable starting in the 2018 tax year,
remaining credit will be fully refundable in 2021.
Note 11. Related Party Transactions
Prior to the consummation of the FYE Transaction, the Company leased its 181,300 square foot distribution center/office facility in Albany, New York from an entity controlled by the estate of Robert J. Higgins, its former Chairman and largest
shareholder. The distribution center/office lease commenced on January 1, 2016 and expires on December 31, 2020.
Under the lease accounted for as an operating lease, the Company paid $1.2 million in both fiscal 2019 and fiscal 2018, which were included in selling, general and administrative expenses in the Statement of Operations. As of February 1, 2020,
the Company owed $1.1 million on the operating lease liability, which is included in the current portion of operating lease liabilities in the Balance Sheet. Under the terms of the lease agreement, the Company is responsible for property taxes and
other operating costs with respect to the premises.
On February 20, 2020, as part of the FYE Transaction, the Company assigned the rights and obligations of the lease to the acquiror.
Directors Jonathan Marcus, Thomas Simpson, and Michael Reickert are the chief executive officer of Alimco Re Ltd. (“Alimco”), the managing member of Kick-Start III, LLC and Kick-Start IV, LLC (“Kick-Start”), and a trustee of the Robert J. Higgins
TWMC Trust (the “Trust”), an affiliate of RJHDC, LLC (“RJHDC” and together with Alimco and Kick-Start, “Related Party Entities”), respectively. The Related Party Entities are parties to the following agreements with the Company entered into on March
30, 2020:
| • |
Subordinated Loan and Security Agreement, pursuant to which the Related Party Entities made a $5.2 million secured term loan ($2.7 million from Alimco, $0.5 million from Kick-Start, and $2.0 million from RJHDC) to etailz with a scheduled
maturity date of May 22, 2023, interest accruing at the rate of twelve percent (12%) per annum and compounded on the last day of each calendar quarter by becoming a part of the principal amount, and secured by a second priority security
interest in substantially all of the assets of the Company and etailz;
|
| • |
Common Stock Purchase Warrants (“Warrants”), pursuant to which the Company issued warrants to purchase up to 244,532 shares of Common Stock to the Related Party Entities (127,208 shares for Alimco, 23,401 shares for Kick-Start, and 93,923
shares for RJHDC), subject to adjustment in accordance with the terms of the Warrants, at an exercise price of $0.01 per share;
|
| • |
Contingent Value Rights Agreement (the “CVR Agreement”), pursuant to which the Related Party Entities received contingent value rights (“CVRs”) representing the contractual right to receive cash payments from the Company in an amount
equal, in the aggregate, to 19.9% of the proceeds (10.35% for Alimco, 1.90% for Kick-Start, and 7.64% for RJHDC) received by the Company in respect of certain intercompany indebtedness owing to it by etailz and/or its equity interest in
etailz; and
|
| • |
Voting Agreement (the “Voting Agreement”), pursuant to which the Related Party Entities, the Trust, Mr. Simpson and their respective related entities agreed to how their respective shares of the Company’s capital stock held by the parties
will be voted with respect to (i) amending the Articles of Incorporation of the Company to set the size of the Board of Directors of the Company (the “Board”) at three directors and (ii) the designation, election, removal, and replacement of
members of the Board.
|
Note 12. Commitments and Contingencies
Legal Proceedings
The Company is subject to legal proceedings and claims that have arisen in the ordinary course of its business and have not been finally adjudicated. Although there can be no assurance as to the ultimate disposition
of these matters, it is management’s opinion, based upon the information available at this time, that the expected outcome of these matters, individually and in the aggregate, will not have a material adverse effect on the results of operations and
financial condition of the Company.
Loyalty Memberships and Magazine Subscriptions Class Action
On November 14, 2018, three consumers filed a punitive class action complaint against the Company and Synapse Group, Inc. in the United States District Court for the District of Massachusetts, Boston Division (Case No.1:18-cv-12377-DPW)
concerning enrollment in the Company’s Backstage Pass VIP loyalty program and associated magazine subscriptions. The complaint alleged, among other things, that the Company’s “negative option marketing” misled consumers into enrolling for
membership and subscriptions without obtaining the consumers’ consent. The complaint sought to represent a nationwide class of “all persons in the United States” who were enrolled in and/or charged for Backstage Pass VIP memberships and/or
magazine subscriptions, and to obtain statutory and actual damages on their behalf.
On April 11, 2019, the plaintiffs voluntarily dismissed their lawsuit. On May 8, 2019, two of the plaintiffs from the dismissed lawsuit filed a similar punitive class action in Massachusetts state court (Civ. Act. No. 197CV00331, Mass. Super.
Ct. Hampden Cty.), based on the same allegations, but this time seeking to represent only a class of “FYE customers in Massachusetts” who were charged for VIP Backstage Pass Memberships and/or magazine subscriptions. The Company believes it has
meritorious defenses to the plaintiffs’ claims and, if the new case is not dismissed in full, the Company intends to vigorously defend the action.
Store Manager Class Actions
There are two pending class actions. The first, Spack v. Trans World Entertainment Corp. was originally filed in the District of New Jersey, April 2017 (the “Spack Action”). The Spack Action alleges that the Company misclassified Store
Managers (“SMs”) as exempt nationwide. It also alleges that Trans World improperly calculated overtime for Senior Assistant Managers (“SAMs”) nationwide, and that both SMs and SAMs worked “off-the-clock.” It also alleges violations of New Jersey
and Pennsylvania State Law with respect to calculating overtime for SAMs. The second, Roper v. Trans World Entertainment Corp., was filed in the Northern District of New York, May 2017 (the “Roper Action”). The Roper Action also asserts a
nationwide misclassification claim on behalf of SMs. Both actions were consolidated into the Northern District of New York, with the Spack Action being the lead case.
The Company has reached a preliminary settlement with the plaintiffs for both store manager class actions. The Company reserved $0.4 million for the settlement as of February 2, 2020.
Note 13. Sale of fye Business (Unaudited)
The following unaudited pro forma condensed consolidated statements of operations for the years ended February 1, 2020 and February 2, 2019 present the Company’s results of operations as adjusted to give effect to
the FYE Transaction as if it had occurred at the beginning of the period. The accompanying unaudited pro forma condensed consolidated balance sheet as of February 1, 2020 presents the Company’s financial position as if the FYE Transaction had
occurred on February 1, 2020. The unaudited pro forma condensed consolidated balance sheet as of February 1, 2020 reflects the elimination of the certain assets and liabilities of the fye business, the elimination of all intercompany accounts, the
inclusion of the net proceeds from the FYE Transaction, the application of such net proceeds to repay certain outstanding debt, and the recognition of the estimated loss from the FYE Transaction.
The unaudited pro forma information below is provided for information purposes only and is not necessarily indicative of what the actual financial position or results of operations of the Company would have been had
the transaction actually occurred on the dates indicated, nor does it purport to indicate the future financial position or results of operations of the Company. The pro forma adjustments are based upon available information and assumptions believed
to be reasonable in the circumstances. There can be no assurance that such information and assumptions will not change from those reflected in the unaudited pro forma condensed financial statements and notes thereto.
TRANS WORLD ENTERTAINMENT CORPORATION AND SUBSIDIARIES
PRO FORMA CONDENSED CONSOLIDATED BALANCE SHEET
(Unaudited)
(Dollars in thousands)
|
Historical
|
|
||||||||||||||||
|
Trans World
Entertainment
Corp.
|
|
Pro forma
combined
|
|||||||||||||||
|
As of February 1,
2020
|
Disposition of
fye Business
(Note i)
|
Pro forma
adjustments
|
|
As of
February 1,
2020
|
|||||||||||||
|
ASSETS
|
|
||||||||||||||||
|
CURRENT ASSETS
|
|
||||||||||||||||
|
Cash and cash equivalents
|
$
|
2,977
|
$
|
-
|
$
|
-
|
|
$
|
2,977
|
||||||||
|
Restricted cash
|
950
|
-
|
-
|
|
950
|
||||||||||||
|
Accounts receivable
|
4,201
|
(62
|
)
|
-
|
|
4,139
|
|||||||||||
|
Merchandise inventory
|
67,958
|
(50,122
|
)
|
-
|
|
17,836
|
|||||||||||
|
Prepaid expenses and other assets
|
3,979
|
(1,005
|
)
|
-
|
|
2,974
|
|||||||||||
|
Total current assets
|
80,065
|
(51,189
|
)
|
-
|
|
28,876
|
|||||||||||
|
|
|||||||||||||||||
|
Restricted cash
|
4,925
|
-
|
-
|
|
4,925
|
||||||||||||
|
Fixed assets, net
|
2,190
|
-
|
|
2,190
|
|||||||||||||
|
Operating lease right-of-use assets
|
3,311
|
-
|
|
3,311
|
|||||||||||||
|
Goodwill
|
-
|
-
|
-
|
|
-
|
||||||||||||
|
Intangible assets, net
|
1,760
|
-
|
-
|
|
1,760
|
||||||||||||
|
Other assets
|
5,555
|
-
|
-
|
|
5,555
|
||||||||||||
|
TOTAL ASSETS
|
$
|
97,806
|
(51,189
|
)
|
-
|
|
46,617
|
||||||||||
|
|
|||||||||||||||||
|
LIABILITIES
|
|
||||||||||||||||
|
CURRENT LIABILITIES
|
|
||||||||||||||||
|
Accounts payable
|
$
|
24,120
|
(9,674
|
)
|
-
|
|
$
|
14,446
|
|||||||||
|
Short-term borrowings
|
13,149
|
-
|
(11,778
|
)
|
(ii)
|
1,371
|
|||||||||||
|
Accrued expenses and other current liabilities
|
4,479
|
(958
|
)
|
-
|
|
3,521
|
|||||||||||
|
Deferred revenue
|
6,681
|
(6,681
|
)
|
-
|
|
-
|
|||||||||||
|
Current portion of operating lease liabilities
|
9,510
|
(8,976
|
)
|
-
|
|
534
|
|||||||||||
|
Total current liabilities
|
57,939
|
(26,289
|
)
|
(11,778
|
)
|
|
19,872
|
||||||||||
|
|
|||||||||||||||||
|
Operating lease liabilites
|
13,263
|
(11,059
|
)
|
-
|
|
2,204
|
|||||||||||
|
Other long-term liabilites
|
22,089
|
(2,063
|
)
|
-
|
|
20,026
|
|||||||||||
|
TOTAL LIABILITIES
|
93,291
|
(39,411
|
)
|
(11,778
|
)
|
|
42,102
|
||||||||||
|
|
|||||||||||||||||
|
SHAREHOLDERS’ EQUITY
|
|
||||||||||||||||
|
Preferred stock ($0.01 par value; 5,000,000 shares authorized; none issued)
|
-
|
-
|
-
|
|
-
|
||||||||||||
|
Common stock ($0.01 par value; 200,000,000 shares authorized; 3,225,627 shares issued)
|
32
|
-
|
-
|
|
32
|
||||||||||||
|
Additional paid-in capital
|
345,102
|
-
|
-
|
|
345,102
|
||||||||||||
|
Treasury stock at cost (1,409,316 shares)
|
(230,169
|
)
|
-
|
-
|
|
(230,169
|
)
|
||||||||||
|
Accumulated other comprehensive loss
|
(1,479
|
)
|
-
|
-
|
|
(1,479
|
)
|
||||||||||
|
(Accumulated deficit) Retained earnings
|
(108,971
|
)
|
(11,778
|
)
|
11,778
|
(108,971
|
)
|
||||||||||
|
TOTAL SHAREHOLDERS’ EQUITY (DEFICIT)
|
4,515
|
(11,778
|
)
|
11,778
|
|
4,515
|
|||||||||||
|
TOTAL LIABILITIES AND SHAREHOLDERS’ EQUITY (DEFICIT)
|
$
|
97,806
|
$
|
(51,189
|
)
|
$
|
-
|
|
$
|
46,617
|
|||||||
Notes:
| (i) |
Represents the elimination of certain assets of the fye business sold to the Purchaser and certain liabilities of the fye business assumed by the Purchaser,
which is consistent with the terms of the Asset Purchase Agreement. Pursuant to the Asset Purchase Agreement, the Company will retain liabilities and obligations of the fye business not assumed by the Purchaser, including liabilities
relating to pending lawsuits (including pending store manager class actions) and liabilities with respect to severance obligations for employees not transferred to the Purchaser. Below represents a reconciliation of previously disclosed fye
segment assets and liabilities to the certain assets sold and liabilities assumed by the Purchaser.
|
|
fye segment assets as of February 1, 2020
|
$
|
69,395
|
|||
|
Less assets not sold:
|
|||||
|
Cash and cash equivalents
|
(2,661
|
)
|
|||
|
Restricted cash
|
(5,875
|
)
|
|||
|
Accounts receivable
|
(1,866
|
)
|
|||
|
Prepaid expenses and other current assets
|
(2,432
|
)
|
|||
|
Other assets
|
(5,372
|
)
|
|||
|
fye business assets sold
|
$
|
51,189
|
|||
|
fye segment liabilities as of February 1, 2020
|
$
|
82,767
|
|||
|
Less liabilities not assumed:
|
|||||
|
Accounts payable
|
(8,099
|
)
|
|||
|
Short-term borrowings
|
(13,149
|
)
|
|||
|
Accrued expenses and other current liabilities
|
(2,737
|
)
|
|||
|
Other long-term liabilities
|
(20,024
|
)
|
(a)
|
||
|
Operating lease liabilities
|
653
|
||||
|
fye business liabilities assumed
|
$
|
39,411
|
| (a) |
Other long-term liabilities consist of the Company’s Supplemental Executive Retirement Plan in the amount of $16.5 million and liabilities for uncertain tax positions in the amount of $3.5 million and certain other liabilities
|
| (ii) |
Represents the estimated net proceeds of the transaction used to pay down short-term borrowings, as required under the Company’s existing credit facility.
|
TRANS WORLD ENTERTAINMENT CORPORATION AND SUBSIDIARIES
PRO FORMA CONDENSED CONSOLIDATED STATEMENT OF OPERATIONS
(Unaudited)
(Dollars and shares in thousands, except per share amounts)
|
Historical
|
|
||||||||||||||||
|
Trans World
Entertainment
Corp.
|
|
Pro forma
combined
|
|||||||||||||||
|
As of February 1,
2020
|
Disposition
of fye
Business
(Note i) |
Pro forma
adjustments
|
|
As of
February 1,
2020
|
|||||||||||||
|
Net sales
|
$
|
321,993
|
$
|
(188,777
|
)
|
$
|
-
|
|
$
|
133,216
|
|||||||
|
Other revenue
|
3,942
|
(3,942
|
)
|
-
|
|
-
|
|||||||||||
|
Total revenue
|
325,935
|
(192,719
|
)
|
-
|
|
133,216
|
|||||||||||
|
|
|||||||||||||||||
|
Cost of sales
|
229,836
|
(127,013
|
)
|
-
|
|
102,823
|
|||||||||||
|
Gross profit
|
96,099
|
(65,706
|
)
|
|
30,393
|
||||||||||||
|
|
-
|
||||||||||||||||
|
Selling, general and administrative expenses
|
129,291
|
(93,258
|
)
|
8,591
|
(ii)
|
44,624
|
|||||||||||
|
Asset impairment charges
|
23,983
|
(23,218
|
)
|
-
|
|
765
|
|||||||||||
|
Loss from operations
|
(57,175
|
)
|
50,770
|
(8,591
|
)
|
|
(14,996
|
)
|
|||||||||
|
|
|||||||||||||||||
|
Interest expense
|
884
|
(884
|
)
|
(647
|
)
|
(iii)
|
(647
|
)
|
|||||||||
|
Other loss (income)
|
364
|
(364
|
)
|
-
|
|
-
|
|||||||||||
|
|
|||||||||||||||||
|
Loss before income taxes
|
(58,423
|
)
|
52,018
|
(7,944
|
)
|
|
(14,349
|
)
|
|||||||||
|
Income tax expense
|
321
|
(277
|
)
|
-
|
|
44
|
|||||||||||
|
Net loss
|
$
|
(58,744
|
)
|
$
|
52,295
|
$
|
(7,944
|
)
|
|
$
|
(14,393
|
)
|
|||||
|
|
|||||||||||||||||
|
BASIC AND DILUTED LOSS PER SHARE:
|
|
||||||||||||||||
|
Basic and dilluted income per common share
|
$
|
(32.35
|
)
|
|
$
|
(7.93
|
)
|
||||||||||
|
|
|||||||||||||||||
|
Weighted average number of common shares outstanding - basic and diluted
|
1,816
|
|
1,816
|
||||||||||||||
Notes:
| (i) |
The elimination of the operating results of the fye business for the period presented, which is consistent with the terms of the Asset Purchase Agreement.
|
| (ii) |
Represents the corporate level expenses of the parent company, which primarily consist of executive compensation and professional fees.
|
| (iii) |
Represents an adjustment of interest expense assuming that $11.8 million of net cash proceeds were received at the beginning of the period and applied to repay debt.
|
TRANS WORLD ENTERTAINMENT CORPORATION AND SUBSIDIARIES
PRO FORMA CONDENSED CONSOLIDATED STATEMENT OF OPERATIONS
(Unaudited)
(Dollars and shares in thousands, except per share amounts)
|
Historical
Trans World
Entertainment
Corporation
Year-ended
February 2,
2019
|
Disposition of
fye Business (i)
|
Pro Forma
Adjustments
|
Pro Forma
Trans World
Entertainment
Corporation
Year-ended
February 2,
2019
|
||||||||||||||
|
Net sales
|
$
|
412,997
|
$
|
(226,097
|
)
|
$
|
-
|
$
|
186,900
|
||||||||
|
Other revenue
|
5,193
|
(5,193
|
)
|
-
|
-
|
||||||||||||
|
Total revenue
|
418,190
|
(231,290
|
)
|
-
|
186,900
|
||||||||||||
|
Cost of sales
|
290,116
|
(142,031
|
)
|
-
|
148,085
|
||||||||||||
|
Gross profit
|
128,074
|
(89,259
|
)
|
-
|
38,815
|
||||||||||||
|
Selling, general and administrative expenses
|
165,222
|
(111,768
|
)
|
7,750
|
(ii)
|
61,204
|
|||||||||||
|
Asset impairment charges
|
59,658
|
(1,946
|
)
|
-
|
57,712
|
||||||||||||
|
Loss from operations
|
(96,806
|
)
|
24,455
|
(7,750
|
)
|
(80,101
|
)
|
||||||||||
|
Interest expense (income)
|
723
|
(723
|
)
|
(498
|
) |
(iii)
|
(498
|
) |
|||||||||
|
Other income
|
(227
|
)
|
227
|
-
|
-
|
||||||||||||
|
Loss before income taxes
|
(97,302
|
)
|
24,951
|
(7,252
|
)
|
(79,603
|
)
|
||||||||||
|
Income tax expense
|
80
|
(53
|
)
|
-
|
27
|
||||||||||||
|
Net loss
|
$
|
(97,382
|
)
|
$
|
25,004
|
$
|
(7,252
|
)
|
$
|
(79,630
|
)
|
||||||
|
Basic and diluted loss per share:
|
|||||||||||||||||
|
Basic and diluted loss per common share
|
$
|
(53.67
|
)
|
$
|
(43.90
|
)
|
|||||||||||
|
Weighted average number of common shares outstanding – basic and diluted
|
1,814
|
1,814
|
|||||||||||||||
Notes:
| (i) |
The elimination of the operating results of the fye business for the period presented, which is consistent with the terms of the Asset Purchase Agreement.
|
| (ii) |
Represents the corporate level expenses of the parent company. Does not reflect (i) income or expenses arising out of
the Transition Services Agreement or (ii) certain severance payments that will be payable by the Company in respect of employees not transferred to the Purchaser.
|
| (iii) |
Represents an adjustment of interest expense assuming that $11.8 million of net cash proceeds were received at the beginning of the period and applied to repay debt.
|
Note 14. Quarterly Financial Information (Unaudited)
|
Fiscal 2019 Quarter Ended
|
||||||||||||||||||||
|
Fiscal
2019
|
February 1,
2020(1)
|
November 2,
2019(2)
|
August 3,
2019
|
May 4,
2019
|
||||||||||||||||
|
Total Revenue
|
$
|
325,935
|
$
|
100,325
|
$
|
69,456
|
$
|
76,004
|
$
|
80,150
|
||||||||||
|
Gross profit
|
96,099
|
22,514
|
23,079
|
25,116
|
25,390
|
|||||||||||||||
|
Net loss
|
$
|
(58,744
|
)
|
$
|
(19,659
|
)
|
$
|
(23,155
|
)
|
$
|
(8,128
|
)
|
$
|
(7,802
|
)
|
|||||
|
Basic and diluted loss per share (4)
|
$
|
(32.35
|
)
|
$
|
(10.81
|
)
|
$
|
(12.73
|
)
|
$
|
(4.48
|
)
|
$
|
(4.20
|
)
|
|||||
|
Fiscal 2018 Quarter Ended
|
||||||||||||||||||||
|
Fiscal
2018
|
February 2,
2019 (3)
|
November 3,
2018
|
August 4,
2018
|
May 5,
2018
|
||||||||||||||||
|
Total Revenue
|
$
|
418,190
|
$
|
127,429
|
$
|
91,984
|
$
|
102,174
|
$
|
96,603
|
||||||||||
|
Gross profit
|
128,074
|
36,827
|
27,386
|
32,173
|
31,688
|
|||||||||||||||
|
Net loss
|
$
|
(97,382
|
)
|
$
|
(65,673
|
)
|
$
|
(14,052
|
)
|
$
|
(9,510
|
)
|
$
|
(8,147
|
)
|
|||||
|
Basic and diluted loss per share(4)
|
$
|
(53.67
|
)
|
$
|
(36.20
|
)
|
$
|
(7.80
|
)
|
$
|
(5.20
|
)
|
$
|
(4.40
|
)
|
|||||
| 1. |
Includes $8.0 million impairment of fixed assets and intangibles.
|
| 2. |
Includes $16.0 million impairment of fixed assets.
|
| 3. |
Includes $59.1 million impairment of fixed assets, intangibles and goodwill.
|
| 4. |
Per share amounts reflect the 1-for- 20 stock split during fiscal 2019.
|
Index to Exhibits
Document Number and Description
Exhibit No.
|
Asset Purchase Agreement by and among Record Town, Inc., Record Town USA LLC, Record Town Utah LLC, Trans World FL LLC, Trans World New York, LLC, Trans World Entertainment Corporation, 2428392 Inc., and 2428391 Ontario Inc, o/a Sunrise
Records, dated as of January 23, 2020 – incorporated herein by reference to Exhibit 2.1 to the Company’s Form 8-K filed on January 23, 2020. Commission File No. 0-14818.
|
|
|
Amendment No. 1 to Asset Purchase Agreement by and among Record Town, Inc., Record Town USA LLC, Record Town Utah LLC, Trans World FL LLC, Trans World New York, LLC, Trans World Entertainment Corporation, 2428392 Inc., and 2428391 Ontario
Inc, o/a Sunrise Records, dated as of February 20, 2020 – incorporated herein by reference to Exhibit 10.1 to the Company’s Form 8-K filed on February 20, 2020. Commission File No. 0-14818.
|
|
|
3.1
|
Restated Certificate of Incorporation – incorporated herein by reference to Exhibit 3.1 to the Company’s Annual Report on Form 10-K for the year ended January 29, 1994. Commission File No. 0-14818.
|
|
Certificate of Amendment to the Certificate of Incorporation — incorporated herein by reference to Exhibit 3.1 to the Company’s Quarterly Report on Form 10-Q for the fiscal quarter ended October 29, 1994.
Commission File No. 0-14818.
|
|
|
Certificate of Amendment to the Certificate of Incorporation – incorporated herein by reference to Exhibit 3.4 to the Company’s Annual Report on Form 10-K for the year ended January 31, 1998. Commission File
No. 0-14818.
|
|
|
Amended By-Laws – incorporated herein by reference to Exhibit 3.4 to the Company’s Annual Report on Form 10-K for the year ended January 29, 2000. Commission File No. 0-14818.
|
|
|
Form of Certificate of Amendment to the Certificate of Incorporation – incorporated herein by reference to Exhibit 3.5 to the Company’s Registration Statement on Form S-4, No. 333-75231.
|
|
|
Form of Certificate of Amendment to the Certificate of Incorporation – incorporated herein by reference to Exhibit 3.6 to the Company’s Registration Statement on Form S-4, No. 333-75231.
|
|
|
Certificate of Amendment to the Certificate of Incorporation – incorporated herein by reference to Exhibit 4.2 to the Company’s Current Report on Form 8-K filed August 15, 2000. Commission File No. 0-14818.
|
|
|
Certificate of Amendment to the Certificate of Incorporation – incorporated herein by reference to Exhibit 2 to the Company’s Current Report on Form 8-A filed August 15, 2000. Commission File No. 0-14818.
|
|
|
Certificate of Amendment to the Certificate of Incorporation – incorporated herein by reference to Exhibit 3.1 to the Company’s Form 8-K filed July 16, 2019. Commission File No. 0-14818.
|
|
Amendment No. 1 to By-Laws – incorporated herein by reference to Exhibit 3.1 to the Company’s Form 8-K filed March 31, 2020. Commission File No. 0-14818.
|
|
|
Specimen of Trans World Entertainment Corporation stock certificate – incorporated herein by reference to Exhibit 4.1 to the Company’s Annual Report on Form 10-K for the fiscal year ended February 2, 2019. Commission File No. 0-14818.
|
|
|
Description of Trans World Entertainment Corporation capital stock.
|
|
|
Loan and Security Agreement by and among Etailz, Inc. and Encina Business Credit, LLC, dated as of February 20, 2020 – incorporated herein by reference to Exhibit 10.1 to the Company’s Form 8-K filed February 20, 2020. Commission File No.
0-14818.
|
|
|
Amendment No. 1 to Loan and Security Agreement by and among Etailz, Inc. and Encina Business Credit, LLC, dated as of March 30, 2020 – incorporated herein by reference to Exhibit 10.1 to the Company’s Form 8-K filed March 31, 2020.
Commission File No. 0-14818.
|
|
|
Subordinated Loan and Security Agreement dated as of March 30, 2020 – incorporated herein by reference to Exhibit 10.2 to the Company’s Form 8-K filed March 31, 2020. Commission File No. 0-14818.
|
|
|
Contingent Value Rights Agreement, dated as of March 30, 2020 – incorporated herein by reference to Exhibit 10.3 to the Company’s Form 8-K filed March 31, 2020. Commission File No. 0-14818.
|
|
|
Common Stock Purchase Warrants, dated as of March 30, 2020 – incorporated herein by reference to Exhibit 4.1 to the Company’s Form 8-K filed March 31, 2020. Commission File No. 0-14818.
|
|
|
Voting Agreement, dated as of March 30, 2020 – incorporated herein by reference to Exhibit 4.2 to the Company’s Form 8-K filed March 31, 2020. Commission File No. 0-14818.
|
|
|
Promissory Note by and between etailz Inc. and First Interstate Bank, dated as of April 10, 2020 – incorporated herein by reference to Exhibit 10.1 to the Company’s Form 8-K filed April 23, 2020. Commission File No. 0-14818.
|
|
|
Form of Indemnification Agreement dated May 1, 1995 between the Company and its officers and directors – incorporated herein by reference to Exhibit 10.2 to the Company’s Quarterly Report on Form 10-Q for the
fiscal quarter ended April 29, 1995. Commission File No. 0-14818.
|
|
|
Trans World Entertainment Corporation Supplemental Executive Retirement Plan, as amended – incorporated herein by reference to Exhibit 10.1 to the Company’s Form 8-K filed on July 16, 2012. Commission File No.
0-14818.
|
|
|
Trans World Entertainment Corporation 2005 Long Term Incentive and Share Award Plan –incorporated herein by reference to Appendix A to Trans World Entertainment Corporation’s Definitive Proxy Statement on Form
14A filed as of May 11, 2005. Commission File No. 0-14818.
|
|
Trans World Entertainment Corporation Bonus Plan – incorporated herein by reference to Appendix A to Trans World Entertainment Corporation’s Definitive Proxy Statement on Form 14A filed as of May 30, 2014.
Commission File No. 0-14818.
|
|
|
Trans World Entertainment Corporation Amended and Restated 2005 Long Term Incentive and Share Award Plan – incorporated herein by reference to Appendix A to Trans World Entertainment Corporation’s Definitive
Proxy Statement on Form 14A filed as of May 30, 2014. Commission File No. 0-14818.
|
|
|
Amended and Restated Employment Agreement, dated February 26, 2019 between the Company and Michael Feurer – incorporated herein by reference to Exhibit 10.1 to the Company’s Form 8-K filed on March 4, 2019.
Commission File No. 0-14818.
|
|
|
Severance, Retention and Restrictive Covenant Agreement between the Company and Bruce J. Eisenberg, dated February 26, 2019 – incorporated herein by reference to Exhibit 10.3 to the Company’s Form 8-K filed on
March 4, 2019. Commission File No. 0-14818.
|
|
|
Severance, Retention and Restrictive Covenant Agreement between the Company and Edwin J. Sapienza, dated February 26, 2019 – incorporated herein by reference to Exhibit 10.2 to the Company’s Form 8-K filed on
March 4, 2019. Commission File No. 0-14818.
|
|
|
Separation Agreement between the Company and Josh Neblett, dated March 11, 2019 – incorporated herein by reference to Exhibit 10.15 to the Company’s Form 10-K filed on May 14, 2019. Commission File No. 0-14818.
|
|
|
Offer Letter by and between Trans World Entertainment Corporation and Kunal Chopra, dated July 5, 2019 – incorporated herein by reference to Exhibit 10.1 to the Company’s Form 10-Q filed on September 17, 2019. Commission File No. 0-14818
|
|
|
Amendment to Offer Letter by and between Trans World Entertainment Corporation and Kunal Chopra, dated July 17, 2019.
|
|
|
Significant Subsidiaries of the Registrant.
|
|
|
Consent of KPMG LLP.
|
|
|
Certification of Chief Executive Officer dated June 15, 2020, relating to the Registrant’s Annual Report on Form 10-K for the year ended February 1, 2020, pursuant to Rule 13a-14(a) or Rule 15a-14(a).
|
|
|
Certification of Chief Financial Officer dated June 15, 2020, relating to the Registrant’s Annual Report on Form 10-K for the year ended February 1, 2020, pursuant to Rule 13a-14(a) or Rule 15a-14(a).
|
|
|
Certification of Chief Executive Officer and Chief Financial Officer of Registrant, dated June 15, 2020, pursuant to 18 U.S.C. Section 1350, as adopted Pursuant to Section 906 of the Sarbanes-Oxley Act of
2002 relating to the Registrant’s Annual Report on Form 10-K for the year ended February 1, 2020.
|
|
*101.INS
|
XBRL Instance Document
|
|
*101.SCH
|
XBRL Taxonomy Extension Schema
|
|
*101.CAL
|
XBRL Taxonomy Extension Calculation Linkbase
|
|
*101.DEF
|
XBRL Taxonomy Extension Definition Linkbase
|
|
*101.LAB
|
XBRL Taxonomy Extension Label Linkbase
|
|
*101.PRE
|
XBRL Taxonomy Extension Presentation Linkbase
|
* Filed herewith
94