UNITED STATES
SECURITIES AND EXCHANGE COMMISSION
WASHINGTON, D.C. 20549
FORM N-CSR
CERTIFIED SHAREHOLDER REPORT OF REGISTERED MANAGEMENT
INVESTMENT COMPANIES
Investment Company Act file number 811-4626
Tax-Free Trust or Oregon
(Exact name of Registrant as specified in charter)
380 Madison Avenue
New York, New York 10017
(Address of principal executive offices) (Zip code)
Joseph P. DiMaggio
380 Madison Avenue
New York, New York 10017
(Name and address of agent for service)
Registrant's telephone number, including area code: (212) 697-6666
Date of fiscal year end: 9/30
Date of reporting period: 9/30/12
FORM N-CSR
|
ITEM 1.
|
REPORTS TO STOCKHOLDERS
|
|
|
|
Annual
Report
|
|
September 30, 2012
|
|
TAX-FREE TRUST OF OREGON
A tax-free income investment
|
  |
 |
Serving Oregon Investors For Over 25 Years
Tax-Free Trust of Oregon
“Research Matters”
|
 |
November, 2012
Dear Fellow Shareholder:
While we didn’t necessarily coin the phrases, “Invest in what you know” or “If you don’t understand it, don’t buy it,” these concepts are certainly not new to Tax-Free Trust of Oregon and the Aquila Group of Funds. In fact, they have been at the very core of our investment philosophy since day one.
Our country’s currently volatile economic environment makes these adages ring true louder than ever.
The value provided by a professional investment management team, such as that of Tax-Free Trust of Oregon, which conducts initial research and provides on-going surveillance of issuers and individual bonds as markets develop and credit conditions change, has become increasingly important.
Over the past year or so, you may have read or heard about problems being experienced by certain municipalities – including growing concerns over budget shortfalls, infrastructure demands, pension funding, and high unemployment.
Even when concerns such as these don’t make the mainstream newspapers, it is in your best interest that your Trust’s investment team makes every effort to know about each and every little hiccup. And, since each municipality has its own distinct nuances, we feel it is vital to have a local presence.
Local investment management and research enables us to monitor the local economy, issuers in the state, and policy decisions that will impact issuers, while we conduct research on issues held by the Trust. The research conducted prior to investing in a bond, and ongoing credit monitoring, make it possible to evaluate both the risk associated with an individual bond, and the adequacy of the compensation provided for that risk.
Tax-Free Trust of Oregon specifically benefits from its collective team of local Trustees, portfolio management staff and Trust Officers who seek to be intimately aware of any potential challenges facing the citizens of Oregon throughout the state.
They know the ups and downs that affect you, our shareholders, because they too are affected. Your local representatives are also your friends, neighbors and co-workers.
They hear the same discussions at little league games and pot luck dinners. They read the same small and big town newspapers that you do, shop in the same supermarkets and gas up at the same pumps.
They, like you, are Oregonians.
NOT A PART OF THE ANNUAL REPORT
As you know, by prospectus, Tax-Free Trust of Oregon may only invest in investment grade securities. These higher rated securities are intended to indicate those municipal issues which have not only sufficient, but significant, cash flow strength in order to pay interest when due and to redeem the bonds at maturity. Nonetheless, we firmly believe in the importance of looking beyond credit ratings.
We invest in an issue based on our initial research, and we conduct frequent credit monitoring in order to evaluate the financial condition of the issuer. We devote significant resources to understanding the financial condition of issuers in Oregon, the financing details of individual issues, and how payments of principal and interest on those issues are secured. We monitor the difficult, but necessary, steps being taken to balance budgets within the state. Based on the research we conduct, we select the bonds held in the Trust’s portfolio and decide whether or not to continue holding issues already in the portfolio.
The Aquila Group of Funds has been managing the assets of Oregon investors for over 25 years. Our long history in the Oregon market, the knowledge and experience of the Trust’s portfolio management team, and the research conducted on bonds held in Tax-Free Trust of Oregon continue to provide shareholders with the benefits of local, professional investment management.
Sincerely,
|
|
 |
|
 Diana P. Herrmann, Vice Chair and President
|
Consideration should be given to the risks of investing, including potential loss of value, market risk, interest rate risk, credit risk, and geographic concentration. Past performance does not guarantee future results. Investment return and principal value will fluctuate so that an investor’s shares, when redeemed, may be worth more or less than their original cost. For certain investors, some dividends may be subject to Federal and state taxes.
NOT A PART OF THE ANNUAL REPORT
|
|
Serving Oregon Investors For Over 25 Years
Tax-Free Trust of Oregon
ANNUAL REPORT
Management Discussion
|
|
2011-12 Review
The tone of the municipal bond market has improved over the past year as we have transitioned from a skeptical market with some investors selling bonds at any price to a market with improved demand due to a greater understanding of the inherent value and risk characteristics of municipal bonds. Nevertheless, headline risk continues to influence bond prices. Although, the theme has changed from Chicken Little, with a much-quoted analyst’s dire warnings of a falling sky through widespread bond defaults which was unrealized, to Goldilocks, or perhaps more fittingly “Gridlocks,” as sequestration, the fiscal cliff, an election year and a challenging interest rate environment are all obstacles preventing the bond market from finding comfort.
The much reported and dramatically named fiscal cliff is a culmination of the expiration of the Bush tax cuts, temporary payroll tax cut and extended unemployment benefits all expiring while higher Medicare taxes and cuts to discretionary spending, agreed to in the Budget Control Act of 2011 (the “BCA”), take effect. While we are optimistic of legislation to reduce the impact of the fiscal cliff, we remain cautious with respect to bonds that have a high degree of dependence on appropriations from the Federal government. In our last commentary we expressed similar sentiment regarding the Federal spending following the Treasury Department’s report that the debt limit of $14.29 trillion had been reached in May 2011.
The fiscal cliff also found its way into election year politics as market participants debated potential outcomes of Republican and Democratic platforms. Other election year issues impacting the market included potential tax reform and state and local credit issues. Speculation leading up to the election proved substantially more disruptive than the result. Ultimately, election results were largely priced into the market by Election Day, resulting in a muted response. The Democratic presidency proved to be a positive event for the bond market as it served to affirm the status quo and provided a degree of assurance that current policies would be carried forward. However, status quo also raises concerns of gridlock at the Federal level as we are again faced with Democratic control of the White House and Senate and Republican control of the House of Representatives. Gridlock is a concern from a credit perspective as the fiscal cliff approaches and decisive action is necessary to avoid disruption at the Federal level. Should a resolution not materialize, a downgrade of U.S. Treasury securities from Moody’s remains a possibility.
The aforementioned BCA requires the Director of the United States Office of Management and Budget to make certain spending cuts referred to as the “sequester.” The BCA cuts can be avoided if Congress enacts other cuts of an equal or larger amount or takes other action to postpone or change the provisions of the BCA prior to January 2, 2013. The municipal bond market is most concerned about the impact these cuts pose to Build America Bonds, none of which are held by the Tax-Free Trust of Oregon. The focus of the portfolio continues to be on high-grade credits supported by property taxes and essential service revenues. However, these concerns reinforce the value of deep credit research and a disciplined approach to portfolio management.
1 | Tax-Free Trust of Oregon
MANAGEMENT DISCUSSION (continued)
In its third attempt to stimulate the U.S. Economy, the Federal Reserve (the “Fed”) implemented its third round of quantitative easing in September, often referred to as QE3. The Fed’s primary objective is to lower mortgage rates and therefore increase spending and hiring as a result of increased activity in the housing market. QE3 is intended to lower mortgage interest rates through purchases of mortgage-backed securities by the Fed in monthly intervals of $40 billion. However, along with low mortgage rates, QE3 has lowered short-term rates in general as the Fed has indicated it plans to maintain short-term interest rates at “exceptionally low levels” until mid-2015. The result of this policy has kept Treasury rates close to historic lows with 2-year securities yielding 0.23% and 10-year bonds at 1.63%. Yields of highly rated municipal bonds have also remained very low with 2-year AAA maturities at 0.30% and 10-year yields at 1.70% as of September 30, 2012. The unusual relationship of tax-exempt yields remaining equal to or higher than taxable interest rates on Treasury and agency securities has persisted due to the Fed’s intervention and uncertainty of the impact from potential changes to the tax code. This environment has forced investors seeking higher yields to add more risk to their portfolios by investing further out on the yield curve or increasing exposure to low rated or nonrated sectors. Our focus will remain on maintaining high credit quality through proprietary research and local expertise. Through our internal credit process we will continue to review lower rated investment grade bonds to find credits with lower risk and a greater probability of outperforming the market.
Through the Fed’s effort to stimulate the economy and a renewed interest in the value presented by municipal bonds, interest rates have been pushed to challengingly low levels over the past year. As Sub-Adviser to Tax-Free Trust of Oregon we have continued our disciplined approach to portfolio management by seeking to (1) reduce interest rate risk with shorter portfolio duration and (2) manage credit risk through rigorous security analysis and surveillance.
Oregon’s economy continues to recover at a gradual pace. The housing market, particularly in the Portland metropolitan area, shows signs of improvement as the backlog of inventory diminishes and approaches levels last seen at the peak of the housing bubble. According to the Regional Multiple Listing Service (“RMLS”), median sales price increased 11.7% for October versus last year. Increases in housing prices have been largely attributed to diminishing inventories and the declining influence of foreclosures. According to Zillow, foreclosures comprise 11% of homes for sale in September versus 22%, or approximately double, last year.
Although employment gains have slowed over the past two quarters, employment in Oregon continues to increase at levels approximately in line with gains seen at the national level. According to the State economist’s December 2012 economic forecast, after adjustments, Oregon added approximately 25,000 jobs over the past year, or 1.5% through third quarter 2012. However, unadjusted employment data indicates employment growth is stagnating. As noted last year, public sector employment continues to fall, with losses declining in recent months. The largest statewide gains in employment have been in professional and business services, leisure and hospitality, and retail trade.
2 | Tax-Free Trust of Oregon
MANAGEMENT DISCUSSION (continued)
The State monitors revenues and provides projections on a quarterly basis and makes adjustments when necessary. As of its December 2012 report, the State Economist forecasts general fund revenues for 2011-13 at $13.96 billion, which is an increase of $40 million from the State’s September 2012 forecast. Tax-Free Trust of Oregon (the “Trust”) has 10% exposure to direct State obligations and an additional 24% exposure to school district obligations, most of which are backed by the State through the Oregon School Bond Guaranty Program. In the forecast, the 2011-13 biennium is now estimated to be $71 million below the close of session forecast and the State estimates that with strong April 2013 tax collections, the State could approach original close of session’s estimates.
Total municipal bond issuance in Oregon for the 12 months ended September 30 decreased by approximately 8% to $3.4 billion as voters were reluctant to approve new issues at the ballot box and issuers either reduced capital spending plans or chose not to put new issues on the ballot. In this low interest rate environment, refunding bonds continue to play an important role. Approximately 39% of the issues brought to market in Oregon over the past year have been refunding bonds issued to realize debt service savings. Many of these issuers were smaller or more rural issuers. A leading indicator of future issuance is the November 2012 ballot, at which 11 issues with a cumulative estimated par amount of $661 million passed statewide. Bonds that were previously rejected by voters are once again making an appearance on the ballot indicating stronger voter sentiment for local money measures. The most prominent example of this is Portland Public Schools which passed a $482 million issue for facilities. This issue was previously rejected at the May, 2011 election and represents the largest local government bond measure ever approved by Oregon voters. In addition, Oregon voters approved ballot measure 85 which amends the Oregon Constitution to allocate corporate “kicker” dollars toward state funding of K-12 public education rather than rebating the money to corporations. The measure does not impact personal income tax kicker rebates.
Over the course of the past year, our conservative approach has provided a relatively stable share price. We have taken profits from longer duration securities and reduced exposure to zero coupon bonds from 10% of the Trust at the beginning of 2011 to the current 3%. As of September 30, 2012, the portfolio had an average maturity of 12.25 years with approximately 30% of the portfolio invested in maturities of less than 10-years. With 71.49% of portfolio holdings rated AAA or AA and 41.78% insured or pre-refunded. Additionally, the portfolio was evenly distributed between revenue and general obligation bonds. The total return for class A investors based on Net Asset Value was 7.14% and the double-exempt dividend yield averaged approximately 3.14% for the year ended September 30, 2012.
3 | Tax-Free Trust of Oregon
MANAGEMENT DISCUSSION (continued)
2012-13 Strategy
Tax-Free Trust of Oregon has maintained a consistent investment strategy that emphasizes intermediate maturities, thorough credit analysis, and investment grade credit quality securities with the goal of providing an above average double tax-exempt dividend and a relatively stable share price. We shall seek to accomplish this goal in the upcoming year by maintaining a neutral to defensive interest rate posture. Despite the Fed’s announced intention to maintain low interest rates, we believe the risk to our shareholders is a meaningful rise in interest rates from the current historic low levels. Positive developments regarding the fiscal cliff or significant progress toward reducing the Federal deficit could be a catalyst for the market to believe the economy will improve and exert upward pressure on interest rates. If it appears that no improvement is on the immediate horizon, it is likely we will remain in the low interest rate environment for the foreseeable future. In that case, legacy portfolio holdings purchased when rates were higher than today’s levels should continue to add stability to the share price and the monthly dividend. We have also made a great effort to reduce our reinvestment risk by limiting the bonds subject to call in the next 2 years to approximately 8% of the portfolio. We intend to closely monitor the yield differentials between long and short maturities as well as the differences between the various credit rating categories. As has always been the case, we will seek to reduce our exposure to longer maturities and lower credit quality bonds when their yields narrow relative to shorter, higher quality securities. Finally, we will continue our diligent credit research and surveillance for our existing holdings and for any securities we consider adding to the portfolio. It is imperative that we stay fully informed on the financial condition of our holdings in this challenging economic environment. We believe this investment strategy will generate a reliable double tax-exempt income stream and a relatively stable share price experience.
Thank you for your investment in Tax-Free Trust of Oregon.
Performance data represents past performance, but does not guarantee future results. Investment return and principal value will fluctuate; shares, when redeemed, may be worth more or less than their original cost; current performance may be lower or higher than the data presented.
NOT FDIC INSURED – NO BANK GUARANTEE – MAY LOSE VALUE
4 | Tax-Free Trust of Oregon
PERFORMANCE REPORT
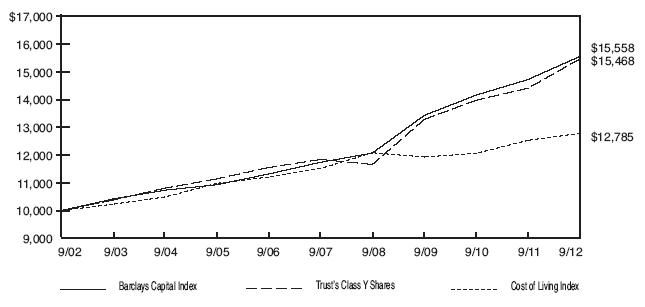
The following graph illustrates the value of $10,000 invested in the Class Y shares of Tax-Free Trust of Oregon for the 10-year period ended September 30, 2012 as compared with the Barclays Capital Quality Intermediate Municipal Bond Index (the “Barclays Capital Index”) and the Consumer Price Index (a cost of living index). The performance of each of the other classes is not shown in the graph but is included in the table below. It should be noted that the Barclays Capital Index does not include any operating expenses nor sales charges, and being nationally oriented, does not reflect state-specific bond market performance.
|
Average Annual Total Return
|
||||||||||||||||
|
for periods ended September 30, 2012
|
||||||||||||||||
|
Since
|
||||||||||||||||
|
Class and Inception Date
|
1 Year
|
5 Years
|
10 Years
|
inception
|
||||||||||||
|
Class A (commenced operations
|
||||||||||||||||
|
on 6/16/86)
|
||||||||||||||||
|
With Maximum Sales Charge
|
2.88 | % | 4.47 | % | 3.88 | % | 5.66 | % | ||||||||
|
Without Sales Charge
|
7.14 | 5.34 | 4.30 | 5.82 | ||||||||||||
|
Class C (commenced operations
|
||||||||||||||||
|
on 4/5/96)
|
||||||||||||||||
|
With CDSC**
|
5.21 | 4.43 | 3.42 | 4.15 | ||||||||||||
|
Without CDSC
|
6.24 | 4.43 | 3.42 | 4.15 | ||||||||||||
|
Class Y (commenced operations
|
||||||||||||||||
|
on 4/5/96)
|
||||||||||||||||
|
No Sales Charge
|
7.30 | 5.48 | 4.46 | 5.20 | ||||||||||||
|
Barclays Capital Index
|
5.66 | 5.79 | 4.52 |
5.87
|
* (Class A) | |||||||||||
|
5.22
|
(Class C & Y) | |||||||||||||||
Total return figures shown for the Trust reflect any change in price and assume all distributions within the period were invested in additional shares. The rates of return will vary and the principal value of an investment will fluctuate with market conditions. Shares, if redeemed, may be worth more or less than their original cost. A portion of each class’s income may be subject to Federal and state income taxes. Past performance is not predictive of future investment results.
* From commencement of the index on 1/1/87.
** CDSC = 1% contingent deferred sales charge imposed on redemptions made within the first 12 months after purchase.
5 | Tax-Free Trust of Oregon
REPORT OF INDEPENDENT REGISTERED PUBLIC ACCOUNTING FIRM
To the Board of Trustees and Shareholders of
Tax-Free Trust of Oregon:
We have audited the accompanying statement of assets and liabilities, including the schedule of investments, of Tax-Free Trust of Oregon as of September 30, 2012 and the related statement of operations for the year then ended, the statements of changes in net assets for each of the two years in the period then ended, and the financial highlights for each of the five years in the period then ended. These financial statements and financial highlights are the responsibility of the Trust’s management. Our responsibility is to express an opinion on these financial statements and financial highlights based on our audits.
We conducted our audits in accordance with the standards of the Public Company Accounting Oversight Board (United States). Those standards require that we plan and perform the audit to obtain reasonable assurance about whether the financial statements and financial highlights are free of material misstatement. The Trust is not required to have, nor were we engaged to perform, an audit of the Trust’s internal control over financial reporting. Our audits included consideration of internal control over financial reporting as a basis for designing audit procedures that are appropriate in the circumstances, but not for the purpose of expressing an opinion on the effectiveness of the Trust’s internal control over financial reporting. Accordingly, we express no such opinion. An audit also includes examining, on a test basis, evidence supporting the amounts and disclosures in the financial statements. Our procedures included confirmation of securities owned as of September 30, 2012, by correspondence with the custodian. An audit also includes assessing the accounting principles used and significant estimates made by management, as well as evaluating the overall financial statement presentation. We believe that our audits provide a reasonable basis for our opinion.
In our opinion, the financial statements and financial highlights referred to above present fairly, in all material respects, the financial position of Tax-Free Trust of Oregon as of September 30, 2012, the results of its operations for the year then ended, the changes in its net assets for each of the two years in the period then ended, and the financial highlights for each of the five years in the period then ended, in conformity with accounting principles generally accepted in the United States of America.
TAIT, WELLER & BAKER LLP
Philadelphia, Pennsylvania
November 27, 2012
6 | Tax-Free Trust of Oregon
|
TAX-FREE TRUST OF OREGON
|
|||
|
SCHEDULE OF INVESTMENTS
|
|||
|
SEPTEMBER 30, 2012
|
|
Rating
|
|||||||||
|
Moody’s/S&P
|
|||||||||
|
Principal
|
and Fitch
|
||||||||
|
Amount
|
General Obligation Bonds (49.2%)
|
(unaudited)
|
Value
|
||||||
|
City & County (6.4%)
|
|||||||||
|
Bend, Oregon
|
|||||||||
| $ | 2,435,000 |
4.000%, 06/01/24
|
Aa2/NR/NR
|
$ | 2,826,037 | ||||
|
Canby, Oregon
|
|||||||||
| 1,060,000 |
5.000%, 06/01/27
|
A2/NR/NR
|
1,228,487 | ||||||
|
Clackamas County, Oregon Refunding
|
|||||||||
| 1,135,000 |
4.000%, 06/01/24
|
Aa2/NR/NR
|
1,301,277 | ||||||
|
Clackamas County, Oregon Tax
|
|||||||||
|
Allocation
|
|||||||||
| 705,000 |
6.500%, 05/01/20
|
NR/NR/NR*
|
706,481 | ||||||
|
Deschutes County, Oregon
|
|||||||||
| 2,260,000 |
5.000%, 12/01/16 AGMC Insured
|
Aa2/NR/NR
|
2,276,747 | ||||||
|
Hillsboro, Oregon
|
|||||||||
| 380,000 |
3.500%, 06/01/15 Series B
|
Aa3/NR/NR
|
405,813 | ||||||
| 390,000 |
3.500%, 06/01/16 Series B
|
Aa3/NR/NR
|
426,582 | ||||||
| 345,000 |
3.500%, 06/01/17 Series B
|
Aa3/NR/NR
|
379,707 | ||||||
|
Hillsboro, Oregon Refunding
|
|||||||||
| 1,305,000 |
4.500%, 06/01/22
|
Aa3/NR/NR
|
1,583,905 | ||||||
|
Portland, Oregon
|
|||||||||
| 6,335,000 |
4.350%, 06/01/23
|
Aa1/NR/NR
|
6,439,718 | ||||||
|
Portland, Oregon Public Safety
|
|||||||||
| 2,130,000 |
4.125%, 06/01/26 Series A
|
Aaa/NR/NR
|
2,384,109 | ||||||
|
Portland, Oregon Revenue Limited Tax,
|
|||||||||
|
Improvement
|
|||||||||
| 1,165,000 |
4.000%, 06/01/22 Series A
|
Aa1/NR/NR
|
1,258,491 | ||||||
|
Portland, Oregon Revenue Refunding
|
|||||||||
|
Limited Tax, Oregon Convention
|
|||||||||
|
Center
|
|||||||||
| 4,765,000 |
5.000%, 06/01/27
|
Aa1/NR/NR
|
5,745,018 | ||||||
|
Redmond, Oregon Refunding
|
|||||||||
| 735,000 |
5.000%, 06/01/23 Series A
|
A1/NR/NR
|
893,231 | ||||||
|
City of Salem, Oregon
|
|||||||||
| 1,585,000 |
4.000%, 06/01/17
|
Aa2/AA-/NR
|
1,803,334 | ||||||
| 1,750,000 |
5.000%, 06/01/29
|
Aa2/AA-/NR
|
2,020,340 | ||||||
|
Washington County, Oregon
|
|||||||||
| 2,465,000 |
5.000%, 06/01/23
|
Aa1/NR/NR
|
2,811,185 | ||||||
|
Total City & County
|
34,490,462 | ||||||||
7 | Tax-Free Trust of Oregon
|
TAX-FREE TRUST OF OREGON
|
|||
|
SCHEDULE OF INVESTMENTS (continued)
|
|||
|
SEPTEMBER 30, 2012
|
|
Rating
|
|||||||||
|
Moody’s/S&P
|
|||||||||
|
Principal
|
and Fitch
|
||||||||
|
Amount
|
General Obligation Bonds (continued)
|
(unaudited)
|
Value
|
||||||
|
Community College (5.9%)
|
|||||||||
|
Central Oregon Community College
|
|||||||||
|
District School Bond Guaranty
|
|||||||||
|
Program
|
|||||||||
| $ | 1,850,000 |
4.750%, 06/15/22
|
NR/AA+/NR
|
$ | 2,246,658 | ||||
| 2,195,000 |
4.750%, 06/15/23
|
NR/AA+/NR
|
2,644,580 | ||||||
| 2,175,000 |
4.750%, 06/15/26
|
NR/AA+/NR
|
2,567,500 | ||||||
|
Chemeketa, Oregon Community
|
|||||||||
|
College District
|
|||||||||
| 1,385,000 |
5.500%, 06/01/14 ETM FGIC Insured
|
NR/NR/NR*
|
1,502,310 | ||||||
|
Chemeketa, Oregon Community College
|
|||||||||
|
District School Bond Guaranty Program
|
|||||||||
| 1,010,000 |
5.500%, 06/15/24
|
NR/AA+/NR
|
1,205,516 | ||||||
| 1,235,000 |
5.000%, 06/15/25
|
NR/AA+/NR
|
1,428,574 | ||||||
| 1,540,000 |
5.000%, 06/15/26
|
NR/AA+/NR
|
1,775,112 | ||||||
|
Clackamas, Oregon Community
|
|||||||||
|
College District
|
|||||||||
| 1,535,000 |
5.000%, 05/01/25 NPFG Insured
|
Aa3/AA/NR
|
1,686,520 | ||||||
|
Columbia Gorge, Oregon Community
|
|||||||||
|
College District, Refunding, School
|
|||||||||
|
Board Guaranty Program
|
|||||||||
| 1,000,000 |
4.000%, 06/15/24
|
Aa1/NR/NR
|
1,147,020 | ||||||
|
Lane, Oregon Community College
|
|||||||||
|
School Bond Guaranty Program
|
|||||||||
| 1,840,000 |
5.000%, 06/15/24
|
NR/AA+/NR
|
2,278,693 | ||||||
|
Oregon Coast Community College
|
|||||||||
|
District State School Bond Guaranty
|
|||||||||
|
Program
|
|||||||||
| 1,590,000 |
5.250%, 06/15/17 NPFG Insured
|
||||||||
|
(pre-refunded)
|
Aa1/NR/NR
|
1,722,495 | |||||||
| 1,770,000 |
5.000%, 06/15/25
|
Aa1/NR/NR
|
2,188,516 | ||||||
|
Portland, Oregon Community College
|
|||||||||
|
District
|
|||||||||
| 7,915,000 |
5.000%, 06/15/28
|
Aa1/AA/NR
|
9,528,868 | ||||||
|
Total Community College
|
31,922,362 | ||||||||
8 | Tax-Free Trust of Oregon
|
TAX-FREE TRUST OF OREGON
|
|||
|
SCHEDULE OF INVESTMENTS (continued)
|
|||
|
SEPTEMBER 30, 2012
|
|
Rating
|
|||||||||
|
Moody’s/S&P
|
|||||||||
|
Principal
|
and Fitch
|
||||||||
|
Amount
|
General Obligation Bonds (continued)
|
(unaudited)
|
Value
|
||||||
|
Higher Education (1.8%)
|
|||||||||
|
State of Oregon Board of Higher
|
|||||||||
|
Education
|
|||||||||
| $ | 820,000 |
zero coupon, 08/01/16
|
Aa1/AA+/AA+
|
$ | 781,509 | ||||
| 1,125,000 |
5.000%, 08/01/21 Series A
|
||||||||
|
(pre-refunded)
|
Aa1/NR/NR
|
1,268,662 | |||||||
| 875,000 |
5.000%, 08/01/21 Series A
|
Aa1/AA+/NR
|
972,335 | ||||||
| 500,000 |
5.750%, 08/01/29 Series A
|
Aa1/AA+/AA+
|
604,785 | ||||||
| 1,000,000 |
5.000%, 08/01/34
|
Aa1/AA+/AA+
|
1,155,890 | ||||||
| 1,000,000 |
5.000%, 08/01/38
|
Aa1/AA+/AA+
|
1,143,510 | ||||||
|
Oregon State, Oregon University System
|
|||||||||
| 1,170,000 |
4.000%, 08/01/25 Series B
|
Aa1/AA+/AA+
|
1,348,484 | ||||||
|
Oregon State, Oregon University
|
|||||||||
|
System Projects
|
|||||||||
| 2,365,000 |
4.000%, 08/01/26 Series H
|
Aa1/AA+/AA+
|
2,678,433 | ||||||
|
Total Higher Education
|
9,953,608 | ||||||||
|
Housing (0.2%)
|
|||||||||
|
State of Oregon Veterans’ Welfare
|
|||||||||
| 550,000 |
4.800%, 12/01/22
|
Aa1/AA+/AA+
|
592,499 | ||||||
| 400,000 |
4.900%, 12/01/26
|
Aa1/AA+/AA+
|
429,032 | ||||||
|
Total Housing
|
1,021,531 | ||||||||
|
Puerto Rico (0.3%)
|
|||||||||
|
Puerto Rico Commonwealth
|
|||||||||
| 1,270,000 |
6.000%, 07/01/28 NPFG Insured
|
Baa1/BBB/NR
|
1,384,833 | ||||||
|
Puerto Rico Municipal Finance Agency
|
|||||||||
| 500,000 |
5.250%, 08/01/16 AGMC Insured
|
Aa3/AA-/NR
|
501,355 | ||||||
|
Total Puerto Rico
|
1,886,188 | ||||||||
|
School District (22.8%)
|
|||||||||
|
Benton & Linn Counties, Oregon School
|
|||||||||
|
District #509J Corvallis
|
|||||||||
| 4,670,000 |
5.000%, 06/01/21 (pre-refunded)
|
||||||||
|
AGMC Insured
|
Aa1/NR/NR
|
4,815,471 | |||||||
|
Clackamas County, Oregon School
|
|||||||||
|
District #12 (North Clackamas)
|
|||||||||
| 8,000,000 |
5.000%, 06/15/27 Series B AGMC
|
||||||||
|
Insured
|
Aa1/AA+/NR
|
9,125,280 | |||||||
| 9,250,000 |
5.000%, 06/15/29 AGMC Insured
|
Aa1/AA+/NR
|
10,501,987 | ||||||
9 | Tax-Free Trust of Oregon
|
TAX-FREE TRUST OF OREGON
|
|||
|
SCHEDULE OF INVESTMENTS (continued)
|
|||
|
SEPTEMBER 30, 2012
|
|
Rating
|
|||||||||
|
Moody’s/S&P
|
|||||||||
|
Principal
|
and Fitch
|
||||||||
|
Amount
|
General Obligation Bonds (continued)
|
(unaudited)
|
Value
|
||||||
|
School District (continued)
|
|||||||||
|
Clackamas County, Oregon School
|
|||||||||
|
District #46 (Oregon Trail) School
|
|||||||||
|
Bond Guaranty Program
|
|||||||||
| $ | 1,000,000 |
5.000%, 06/15/22
|
NR/AA+/NR
|
$ | 1,186,520 | ||||
| 1,865,000 |
5.000%, 06/15/28 Series A
|
NR/AA+/NR
|
2,168,417 | ||||||
| 1,800,000 |
5.000%, 06/15/29 Series A
|
NR/AA+/NR
|
2,086,794 | ||||||
| 2,000,000 |
4.500%, 06/15/30 AGMC Insured
|
Aa1/AA+/NR
|
2,178,120 | ||||||
| 2,000,000 |
5.000%, 06/15/32 Series A
|
NR/AA+/NR
|
2,284,080 | ||||||
| 3,780,000 |
4.750%, 06/15/32 Series A
|
NR/AA+/NR
|
4,259,304 | ||||||
|
Clackamas County, Oregon School
|
|||||||||
|
District #86 (Canby)
|
|||||||||
| 2,240,000 |
5.000%, 06/15/19 AGMC Insured
|
||||||||
|
(pre-refunded)
|
Aa1/AA+/NR
|
2,516,416 | |||||||
| 1,800,000 |
5.000%, 06/15/24
|
Aa1/AA+/NR
|
2,255,886 | ||||||
| 1,110,000 |
5.000%, 06/15/25 Series A
|
Aa1/AA+/NR
|
1,383,404 | ||||||
|
Clackamas & Washington Counties,
|
|||||||||
|
Oregon School District No. 003
|
|||||||||
|
(West Linn-Wilsonville)
|
|||||||||
| 1,110,000 |
5.000%, 06/15/26
|
Aa1/AA+/NR
|
1,310,932 | ||||||
| 500,000 |
5.000%, 06/15/34
|
Aa1/AA+/NR
|
571,020 | ||||||
|
Clackamas & Washington Counties,
|
|||||||||
|
Oregon School District #3J (West
|
|||||||||
|
Linn - Wilsonville) School Bond
|
|||||||||
|
Guaranty Program
|
|||||||||
| 2,850,000 |
5.000%, 06/15/27
|
Aa1/AA+/NR
|
3,352,284 | ||||||
| 2,000,000 |
4.500%, 06/15/29
|
Aa1/AA+/NR
|
2,229,600 | ||||||
| 1,965,000 |
5.000%, 06/15/30
|
Aa1/AA+/NR
|
2,282,033 | ||||||
| 3,000,000 |
5.000%, 06/15/33
|
Aa1/AA+/NR
|
3,441,990 | ||||||
|
Columbia County, Oregon School
|
|||||||||
|
District #502
|
|||||||||
| 2,070,000 |
zero coupon, 06/01/15 NPFG FGIC
|
||||||||
|
Insured
|
Aa3/BBB/NR
|
1,982,998 | |||||||
|
Columbia & Washington Counties,
|
|||||||||
|
Oregon School District #47J (Vernonia)
|
|||||||||
|
State School Bond Guaranty Program
|
|||||||||
| 3,430,000 |
5.00%, 06/15/27
|
NR/AA+/NR
|
4,090,652 | ||||||
10 | Tax-Free Trust of Oregon
|
TAX-FREE TRUST OF OREGON
|
|||
|
SCHEDULE OF INVESTMENTS (continued)
|
|||
|
SEPTEMBER 30, 2012
|
|
Rating
|
|||||||||
|
Moody’s/S&P
|
|||||||||
|
Principal
|
and Fitch
|
||||||||
|
Amount
|
General Obligation Bonds (continued)
|
(unaudited)
|
Value
|
||||||
|
School District (continued)
|
|||||||||
|
Deschutes County, Oregon Administrative
|
|||||||||
|
School District #1 Refunding
|
|||||||||
| $ | 400,000 |
5.000%, 06/15/13 AGMC Insured
|
Aa1/NR/NR
|
$ | 413,392 | ||||
|
Deschutes County, Oregon School
|
|||||||||
|
District #6 (Sisters)
|
|||||||||
| 1,735,000 |
5.250%, 06/15/19 AGMC Insured
|
Aa3/AA+/NR
|
2,140,747 | ||||||
| 1,030,000 |
5.250%, 06/15/21 AGMC Insured
|
Aa3/AA+/NR
|
1,291,383 | ||||||
|
Deschutes and Jefferson Counties, Oregon
|
|||||||||
|
School District #02J (Redmond)
|
|||||||||
| 1,000,000 |
5.000%, 06/15/21 NPFG FGIC Insured
|
Aa1/NR/NR
|
1,070,760 | ||||||
| 1,025,000 |
zero coupon, 06/15/23
|
Aa1/NR/NR
|
779,113 | ||||||
| 5,000,000 |
6.000%, 06/15/31
|
Aa1/NR/NR
|
6,027,300 | ||||||
|
Hood River County, Oregon School
|
|||||||||
|
District Refunding School Bond
|
|||||||||
|
Guaranty Program
|
|||||||||
| 365,000 |
3.000%, 06/15/14
|
NR/AA+/NR
|
380,301 | ||||||
| 385,000 |
3.000%, 06/15/15
|
NR/AA+/NR
|
407,469 | ||||||
| 250,000 |
4.000%, 06/15/16
|
NR/AA+/NR
|
278,717 | ||||||
|
Jackson County, Oregon School District
|
|||||||||
|
#9 (Eagle Point)
|
|||||||||
| 2,080,000 |
5.500%, 06/15/15 NPFG Insured
|
Aa1/NR/NR
|
2,325,149 | ||||||
| 1,445,000 |
5.500%, 06/15/16 NPFG Insured
|
Aa1/NR/NR
|
1,672,602 | ||||||
|
Jackson County, Oregon School District
|
|||||||||
|
#549C (Medford) School Board
|
|||||||||
|
Guaranty Program
|
|||||||||
| 1,000,000 |
4.625%, 06/15/27
|
Aa1/AA+/NR
|
1,117,280 | ||||||
| 2,000,000 |
4.750%, 12/15/29 AGMC Insured
|
Aa1/AA+/NR
|
2,226,340 | ||||||
| 1,000,000 |
5.000%, 06/15/33
|
Aa1/AA+/NR
|
1,126,910 | ||||||
|
Jefferson County, Oregon School District
|
|||||||||
|
#509J School Board Guaranty Program
|
|||||||||
| 1,215,000 |
5.250%, 06/15/14 NPFG/ FGIC Insured
|
NR/AA+/NR
|
1,219,289 | ||||||
| 1,025,000 |
5.250%, 06/15/17 NPFG/ FGIC Insured
|
NR/AA+/NR
|
1,028,721 | ||||||
|
Lane County, Oregon School District
|
|||||||||
|
#4J (Eugene) Refunding School Board
|
|||||||||
|
Guaranty Program
|
|||||||||
| 1,000,000 |
5.000%, 07/01/15
|
Aa1/NR/NR
|
1,117,830 | ||||||
| 1,130,000 |
4.000%, 06/15/23
|
Aa1/NR/NR
|
1,288,302 | ||||||
11 | Tax-Free Trust of Oregon
|
TAX-FREE TRUST OF OREGON
|
|||
|
SCHEDULE OF INVESTMENTS (continued)
|
|||
|
SEPTEMBER 30, 2012
|
|
Rating
|
|||||||||
|
Moody’s/S&P
|
|||||||||
|
Principal
|
and Fitch
|
||||||||
|
Amount
|
General Obligation Bonds (continued)
|
(unaudited)
|
Value
|
||||||
|
School District (continued)
|
|||||||||
|
Lane County, Oregon School District
|
|||||||||
|
#19 (Springfield)
|
|||||||||
| $ | 3,425,000 |
zero coupon, 06/15/29 AGMC
|
|||||||
|
Insured
|
Aa1/NR/NR
|
$ | 1,672,804 | ||||||
|
Lincoln County, Oregon School District,
|
|||||||||
|
School Board Guaranty Program
|
|||||||||
| 2,370,000 |
4.000%, 06/15/24 Series A
|
Aa1/NR/NR
|
2,685,968 | ||||||
|
Linn County, Oregon School District #9
|
|||||||||
|
(Lebanon) School Board Guaranty
|
|||||||||
|
Program
|
|||||||||
| 3,000,000 |
5.600%, 06/15/30 FGIC Insured
|
||||||||
|
(pre-refunded)
|
NR/AA+/NR
|
3,111,510 | |||||||
|
Morrow County, Oregon School
|
|||||||||
|
District #1
|
|||||||||
| 1,710,000 |
5.250%, 06/15/19 AGMC Insured
|
Aa3/AA+/NR
|
2,109,901 | ||||||
|
Multnomah County, Oregon School
|
|||||||||
|
District #7 (Reynolds) Refunding
|
|||||||||
| 1,165,000 |
5.000%, 06/01/29
|
Aa3/NR/NR
|
1,387,457 | ||||||
|
Multnomah County, Oregon School
|
|||||||||
|
District #40 (David Douglas) School
|
|||||||||
|
Bond Guaranty Program
|
|||||||||
| 1,420,000 |
4.000%, 06/15/23 Series A
|
NR/AA+/NR
|
1,646,163 | ||||||
|
Multnomah and Clackamas Counties,
|
|||||||||
|
Oregon School District #10
|
|||||||||
|
(Gresham-Barlow)
|
|||||||||
| 4,275,000 |
5.250%, 06/15/19 AGMC Insured
|
Aa1/AA+/NR
|
5,320,921 | ||||||
|
Multnomah and Clackamas Counties,
|
|||||||||
|
Oregon School District #28JT
|
|||||||||
|
(Centennial)
|
|||||||||
| 2,680,000 |
5.250%, 12/15/18 AGMC Insured
|
Aa1/NR/NR
|
3,272,816 | ||||||
|
Polk, Marion & Benton Counties,
|
|||||||||
|
Oregon School District #13J (Central)
|
|||||||||
| 1,520,000 |
5.000%, 06/15/21 AGMC Insured
|
Aa3/AA+/NR
|
1,730,870 | ||||||
|
Salem-Keizer, Oregon School District #24J
|
|||||||||
| 1,000,000 |
5.000%, 06/15/19 AGMC Insured
|
Aa1/AA+/NR
|
1,075,010 | ||||||
12 | Tax-Free Trust of Oregon
|
TAX-FREE TRUST OF OREGON
|
|||
|
SCHEDULE OF INVESTMENTS (continued)
|
|||
|
SEPTEMBER 30, 2012
|
|
Rating
|
|||||||||
|
Moody’s/S&P
|
|||||||||
|
Principal
|
and Fitch
|
||||||||
|
Amount
|
General Obligation Bonds (continued)
|
(unaudited)
|
Value
|
||||||
|
School District (continued)
|
|||||||||
|
Wasco County, Oregon School District
|
|||||||||
|
#12 (The Dalles)
|
|||||||||
| $ | 1,400,000 |
5.500%, 06/15/17 AGMC Insured
|
Aa3/AA-/NR
|
$ | 1,676,416 | ||||
| 1,790,000 |
5.500%, 06/15/20 AGMC Insured
|
Aa3/AA-/NR
|
2,245,143 | ||||||
|
Washington County, Oregon School
|
|||||||||
|
District #48J (Beaverton)
|
|||||||||
| 1,280,000 |
5.000%, 06/01/31 AGC Insured
|
Aa2/AA-/NR
|
1,487,974 | ||||||
| 1,000,000 |
5.125%, 06/01/36 AGC Insured
|
Aa2/AA-/NR
|
1,152,160 | ||||||
|
Yamhill County, Oregon School District
|
|||||||||
|
#40 (McMinnville) School Bond
|
|||||||||
|
Guaranty Program
|
|||||||||
| 1,205,000 |
5.000%, 06/15/19 AGMC Insured
|
Aa1/NR/NR
|
1,416,044 | ||||||
| 1,375,000 |
5.000%, 06/15/22 AGMC Insured
|
Aa1/NR/NR
|
1,575,750 | ||||||
|
Total School Districts
|
123,501,700 | ||||||||
|
Special District (1.8%)
|
|||||||||
|
Metro, Oregon
|
|||||||||
| 1,100,000 |
5.000%, 06/01/18
|
Aaa/AAA/NR
|
1,308,175 | ||||||
| 4,000,000 |
4.000%, 06/01/26 Series A
|
Aaa/AAA/NR
|
4,552,520 | ||||||
|
Tualatin Hills, Oregon Park &
|
|||||||||
|
Recreational District
|
|||||||||
| 1,000,000 |
4.250%, 06/01/24
|
Aa1/AA/NR
|
1,126,350 | ||||||
|
Tualatin Valley, Oregon Fire & Rescue
|
|||||||||
|
Rural Fire Protection District
|
|||||||||
| 1,235,000 |
4.000%, 06/01/26
|
Aaa/NR/NR
|
1,394,846 | ||||||
| 1,170,000 |
4.000%, 06/01/27
|
Aaa/NR/NR
|
1,314,600 | ||||||
|
Total Special District
|
9,696,491 | ||||||||
|
State (9.0%)
|
|||||||||
|
Oregon State Alternative Energy Project
|
|||||||||
| 1,255,000 |
4.750%, 04/01/29 Series B
|
Aa1/AA+/AA+
|
1,423,308 | ||||||
| 500,000 |
6.000%, 10/01/29 Series B
|
Aa1/AA+/AA+
|
617,865 | ||||||
|
Oregon State Department of
|
|||||||||
|
Administrative Services
|
|||||||||
| 3,270,000 |
5.000%, 11/01/27 Series C
|
Aa2/AA/AA
|
3,772,010 | ||||||
| 2,155,000 |
5.000%, 11/01/28 Series C
|
Aa2/AA/AA
|
2,478,336 | ||||||
| 5,000,000 |
5.125%, 05/01/33
|
Aa2/AA/AA
|
5,664,950 | ||||||
13 | Tax-Free Trust of Oregon
|
TAX-FREE TRUST OF OREGON
|
|||
|
SCHEDULE OF INVESTMENTS (continued)
|
|||
|
SEPTEMBER 30, 2012
|
|
Rating
|
|||||||||
|
Moody’s/S&P
|
|||||||||
|
Principal
|
and Fitch
|
||||||||
|
Amount
|
General Obligation Bonds (continued)
|
(unaudited)
|
Value
|
||||||
|
State (continued)
|
|||||||||
|
Oregon State Department of
|
|||||||||
|
Administrative Services (continued)
|
|||||||||
| $ | 2,000,000 |
5.000%, 11/01/20 NPFG FGIC Insured
|
|||||||
|
(pre-refunded)
|
Aa2/AA/AA
|
$ | 2,281,140 | ||||||
| 2,660,000 |
5.000%, 11/01/23 NPFG FGIC Insured
|
Aa2/AA/AA
|
2,957,707 | ||||||
| 2,945,000 |
5.000%, 11/01/24 NPFG FGIC Insured
|
Aa2/AA/AA
|
3,264,886 | ||||||
| 1,475,000 |
5.000%, 11/01/26 NPFG FGIC Insured
|
Aa2/AA/AA
|
1,632,781 | ||||||
| 3,880,000 |
5.000%, 11/01/27 NPFG FGIC Insured
|
Aa2/AA/AA
|
4,283,869 | ||||||
|
Oregon State Department of
|
|||||||||
|
Administrative Services, Oregon
|
|||||||||
|
Opportunity Refunding
|
|||||||||
| 6,210,000 |
5.000%, 12/01/19
|
Aa1/AA+/AA+
|
7,873,286 | ||||||
|
Oregon State Refunding
|
|||||||||
| 3,000,000 |
5.000%, 05/01/23 Series L
|
Aa1/AA+/AA+
|
3,727,500 | ||||||
| 1,125,000 |
5.000%, 05/01/24 Series L
|
Aa1/AA+/AA+
|
1,393,796 | ||||||
| 2,630,000 |
5.000%, 05/01/26 Series L
|
Aa1/AA+/AA+
|
3,239,713 | ||||||
|
Oregon State Refunding Various Projects
|
|||||||||
| 2,125,000 |
4.000%, 05/01/25 Series O
|
Aa1/AA+/AA+
|
2,410,047 | ||||||
|
Oregon State Various Projects
|
|||||||||
| 1,470,000 |
4.000%, 11/01/26 Series M
|
Aa1/AA+/AA+
|
1,669,788 | ||||||
|
Total State
|
48,690,982 | ||||||||
|
Water & Sewer (0.8%)
|
|||||||||
|
Gearheart, Oregon
|
|||||||||
| 1,060,000 |
4.500%, 03/01/26 AGMC Insured
|
Aa3/NR/NR
|
1,221,639 | ||||||
|
Pacific City, Oregon Joint Water -
|
|||||||||
|
Sanitary Authority
|
|||||||||
| 1,830,000 |
4.800%, 07/01/27
|
NR/NR/NR*
|
1,948,730 | ||||||
|
Rockwood, Oregon Water Peoples
|
|||||||||
|
Utility District Water Revenue
|
|||||||||
|
Refunding
|
|||||||||
| 1,270,000 |
4.250%, 08/15/26
|
A1/NR/NR
|
1,398,994 | ||||||
|
Total Water & Sewer
|
4,569,363 | ||||||||
|
Total General Obligation Bonds
|
265,732,687 | ||||||||
14 | Tax-Free Trust of Oregon
|
TAX-FREE TRUST OF OREGON
|
|||
|
SCHEDULE OF INVESTMENTS (continued)
|
|||
|
SEPTEMBER 30, 2012
|
|
Rating
|
|||||||||
|
Moody’s/S&P
|
|||||||||
|
Principal
|
and Fitch
|
||||||||
|
Amount
|
Revenue Bonds (49.4%)
|
(unaudited)
|
Value
|
||||||
|
City & County (3.8%)
|
|||||||||
|
Newport, Oregon Urban Renewal
|
|||||||||
|
Obligations, Refunding
|
|||||||||
| $ | 565,000 |
4.500%, 06/15/22 Series B
|
NR/A+/NR
|
$ | 651,807 | ||||
|
Portland, Oregon
|
|||||||||
| 2,975,000 |
zero coupon, 06/01/15
|
Aa1/NR/NR
|
2,887,892 | ||||||
|
Portland, Oregon Revenue Refunding
|
|||||||||
|
Limited Tax, Oregon Convention
|
|||||||||
|
Center
|
|||||||||
| 2,825,000 |
5.000%, 06/01/24
|
Aa1/NR/NR
|
3,458,082 | ||||||
|
Portland, Oregon Revenue Refunding
|
|||||||||
|
Limited Tax
|
|||||||||
| 1,000,000 |
4.000%, 04/01/22 Series A
|
Aa1/NR/NR
|
1,118,010 | ||||||
|
Portland, Oregon River District Urban
|
|||||||||
|
Renewal and Redevelopment
|
|||||||||
| 1,915,000 |
5.000%, 06/15/20 AMBAC Insured
|
||||||||
|
(pre-refunded)
|
A1/NR/NR
|
1,978,846 | |||||||
| 1,600,000 |
5.000%, 06/15/22 Series B
|
A1/NR/NR
|
1,910,624 | ||||||
| 1,000,000 |
5.000%, 06/15/23 Series B
|
A1/NR/NR
|
1,182,910 | ||||||
|
Portland, Oregon Urban Renewal and
|
|||||||||
|
Redevelopment, Refunding, North
|
|||||||||
|
Macadam
|
|||||||||
| 1,000,000 |
4.000%, 06/15/25 Series B
|
A1/NR/NR
|
1,052,780 | ||||||
|
Portland, Oregon Urban Renewal Tax
|
|||||||||
|
Allocation (Interstate Corridor)
|
|||||||||
| 1,890,000 |
5.250%, 06/15/20 NPFG FGIC Insured
|
A1/NR/NR
|
2,018,180 | ||||||
| 1,810,000 |
5.250%, 06/15/21 NPFG FGIC Insured
|
A1/NR/NR
|
1,924,464 | ||||||
| 2,030,000 |
5.000%, 06/15/23 NPFG FGIC Insured
|
A1/NR/NR
|
2,127,460 | ||||||
|
Total City & County
|
20,311,055 | ||||||||
|
Electric (2.2%)
|
|||||||||
|
Emerald Peoples Utility District, Oregon
|
|||||||||
| 1,455,000 |
5.250%, 11/01/22 AGMC Insured
|
Aa3/NR/NR
|
1,516,139 | ||||||
|
Eugene, Oregon Electric Utility
|
|||||||||
| 5,635,000 |
5.000%, 08/01/30
|
Aa3/AA-/AA-
|
6,384,568 | ||||||
|
Eugene, Oregon Electric Utility
|
|||||||||
|
Refunding System
|
|||||||||
| 2,000,000 |
5.000%, 08/01/27 Series A
|
Aa3/AA-/AA-
|
2,409,640 | ||||||
15 | Tax-Free Trust of Oregon
|
TAX-FREE TRUST OF OREGON
|
|||
|
SCHEDULE OF INVESTMENTS (continued)
|
|||
|
SEPTEMBER 30, 2012
|
|
Rating
|
|||||||||
|
Moody’s/S&P
|
|||||||||
|
Principal
|
and Fitch
|
||||||||
|
Amount
|
Revenue Bonds (continued)
|
(unaudited)
|
Value
|
||||||
|
Electric (continued)
|
|||||||||
|
Northern Wasco County, Oregon
|
|||||||||
|
Peoples Utility District, McNary Dam
|
|||||||||
|
Fishway Hydroelectric Project,
|
|||||||||
|
Refunding
|
|||||||||
| $ | 1,585,000 |
5.000%, 12/01/21 Series A
|
NR/AA-/NR
|
$ | 1,951,357 | ||||
|
Total Electric
|
12,261,704 | ||||||||
|
Higher Education (7.4%)
|
|||||||||
|
Forest Grove, Oregon Campus
|
|||||||||
|
Improvement (Pacific University
|
|||||||||
|
Project)
|
|||||||||
| 1,500,000 |
6.000%, 05/01/30
|
NR/BBB/NR
|
1,541,670 | ||||||
|
Forest Grove, Oregon (Pacific University)
|
|||||||||
| 4,000,000 |
5.000%, 05/01/22 Radian Insured
|
NR/BBB/NR
|
4,151,560 | ||||||
|
Forest Grove, Oregon Student Housing
|
|||||||||
|
(Oak Tree Foundation)
|
|||||||||
| 5,750,000 |
5.500%, 03/01/37
|
NR/NR/NR*
|
5,891,967 | ||||||
|
Oregon Health Sciences University
|
|||||||||
| 2,890,000 |
5.250%, 07/01/22 NPFG Insured
|
||||||||
|
(pre-refunded)
|
A1/A+/A+
|
2,925,576 | |||||||
|
Oregon State Facilities Authority (Lewis
|
|||||||||
|
& Clark College Project)
|
|||||||||
| 1,000,000 |
5.250%, 10/01/24 Series A
|
A3/A-/NR
|
1,193,610 | ||||||
| 3,000,000 |
5.000%, 10/01/27 Series A
|
A3/A-/NR
|
3,441,900 | ||||||
|
Oregon State Facilities Authority (Linfield
|
|||||||||
|
College Project)
|
|||||||||
| 2,830,000 |
5.000%, 10/01/20 Series A 2005
|
Baa1/NR/NR
|
3,044,769 | ||||||
| 2,115,000 |
5.000%, 10/01/25 Series A 2005
|
Baa1/NR/NR
|
2,229,062 | ||||||
| 1,220,000 |
5.000%, 10/01/31 Series A 2010
|
Baa1/NR/NR
|
1,346,648 | ||||||
|
Oregon State Facilities Authority Revenue
|
|||||||||
|
Refunding (Reed College Project)
|
|||||||||
| 1,500,000 |
5.000%, 07/01/29 Series A
|
Aa2/AA-/NR
|
1,760,190 | ||||||
|
Oregon State Facilities Authority
|
|||||||||
|
(University of Portland)
|
|||||||||
| 3,000,000 |
5.000%, 04/01/32
|
NR/BBB+/NR
|
3,223,170 | ||||||
|
Oregon State Facilities Authority
|
|||||||||
|
(Willamette University)
|
|||||||||
| 1,000,000 |
4.000%, 10/01/24
|
NR/A/NR
|
1,108,420 | ||||||
| 2,500,000 |
5.000%, 10/01/32
|
NR/A/NR
|
2,697,800 | ||||||
16 | Tax-Free Trust of Oregon
|
TAX-FREE TRUST OF OREGON
|
|||
|
SCHEDULE OF INVESTMENTS (continued)
|
|||
|
SEPTEMBER 30, 2012
|
|
Rating
|
|||||||||
|
Moody’s/S&P
|
|||||||||
|
Principal
|
and Fitch
|
||||||||
|
Amount
|
Revenue Bonds (continued)
|
(unaudited)
|
Value
|
||||||
|
Higher Education (continued)
|
|||||||||
|
Portland, Oregon Economic
|
|||||||||
|
Development (Broadway Project)
|
|||||||||
| $ | 5,000,000 |
6.500%, 04/01/35
|
A1/A+/NR
|
$ | 5,616,350 | ||||
|
Total Higher Education
|
40,172,692 | ||||||||
|
Hospital (11.3%)
|
|||||||||
|
Deschutes County, Oregon Hospital
|
|||||||||
|
Facilities Authority (Cascade Health)
|
|||||||||
| 3,500,000 |
8.000%, 01/01/28
|
A3/NR/NR
|
4,468,905 | ||||||
| 3,250,000 |
5.375%, 01/01/35 AMBAC Insured
|
A3/NR/NR
|
3,511,982 | ||||||
|
Medford, Oregon Hospital Facilities
|
|||||||||
|
Authority Revenue Refunding, Asante
|
|||||||||
|
Health Systems
|
|||||||||
| 9,000,000 |
5.500%, 08/15/28 AGMC Insured
|
NR/AA-/NR
|
10,422,450 | ||||||
|
Multnomah County, Oregon Hospital
|
|||||||||
|
Facilities Authority (Adventist
|
|||||||||
|
Health/West)
|
|||||||||
| 500,000 |
5.000%, 09/01/21
|
NR/A/A
|
570,020 | ||||||
|
Multnomah County, Oregon Hospital
|
|||||||||
|
Facilities Authority (Providence
|
|||||||||
|
Health System)
|
|||||||||
| 1,390,000 |
5.250%, 10/01/22
|
Aa2/AA/AA
|
1,492,610 | ||||||
|
Oregon Health Sciences University
|
|||||||||
| 11,550,000 |
zero coupon, 07/01/21 NPFG Insured
|
A1/A+/A+
|
8,907,822 | ||||||
| 2,000,000 |
5.000%, 07/01/23 Series A
|
A1/A+/A+
|
2,405,040 | ||||||
| 4,500,000 |
5.750%, 07/01/39 Series A
|
A1/A+/A+
|
5,271,255 | ||||||
|
Oregon State Facilities Authority
|
|||||||||
|
Revenue Refunding, Legacy Health
|
|||||||||
|
Systems
|
|||||||||
| 2,000,000 |
4.250%, 03/15/17
|
A2/A+/NR
|
2,237,720 | ||||||
| 3,000,000 |
4.500%, 03/15/18
|
A2/A+/NR
|
3,443,880 | ||||||
| 1,000,000 |
4.750%, 03/15/24
|
A2/A+/NR
|
1,098,530 | ||||||
| 1,000,000 |
5.000%, 03/15/30
|
A2/A+/NR
|
1,090,750 | ||||||
|
Oregon State Facilities Authority
|
|||||||||
|
Revenue Refunding, Samaritan
|
|||||||||
|
Health Services
|
|||||||||
| 1,500,000 |
4.375%, 10/01/20
|
NR/A-/NR
|
1,638,945 | ||||||
| 2,000,000 |
4.500%, 10/01/21
|
NR/A-/NR
|
2,174,760 | ||||||
| 1,520,000 |
5.000%, 10/01/23
|
NR/A-/NR
|
1,703,677 | ||||||
17 | Tax-Free Trust of Oregon
|
TAX-FREE TRUST OF OREGON
|
|||
|
SCHEDULE OF INVESTMENTS (continued)
|
|||
|
SEPTEMBER 30, 2012
|
|
Rating
|
|||||||||
|
Moody’s/S&P
|
|||||||||
|
Principal
|
and Fitch
|
||||||||
|
Amount
|
Revenue Bonds (continued)
|
(unaudited)
|
Value
|
||||||
|
Hospital (continued)
|
|||||||||
|
Oregon State Facilities Authority
|
|||||||||
|
Revenue Refunding, Samaritan
|
|||||||||
|
Health Services (continued)
|
|||||||||
| $ | 1,795,000 |
4.875%, 10/01/25
|
NR/A-/NR
|
$ | 1,981,626 | ||||
| 2,000,000 |
5.000%, 10/01/30
|
NR/A-/NR
|
2,204,700 | ||||||
|
Salem, Oregon Hospital Facility
|
|||||||||
|
Authority (Salem Hospital)
|
|||||||||
| 2,000,000 |
5.750%, 08/15/23
|
NR/A/A+
|
2,303,060 | ||||||
| 1,075,000 |
5.000%, 08/15/27 Series A
|
NR/A/A+
|
1,159,431 | ||||||
|
State of Oregon Health Housing
|
|||||||||
|
Educational and Cultural Facilities
|
|||||||||
|
Authority (Peacehealth)
|
|||||||||
| 1,835,000 |
5.250%, 11/15/17 AMBAC Insured
|
NR/A+/AA-
|
1,844,267 | ||||||
| 1,430,000 |
5.000%, 11/15/32 AMBAC Insured
|
NR/A+/AA-
|
1,432,860 | ||||||
|
Total Hospital
|
61,364,290 | ||||||||
|
Housing (1.0%)
|
|||||||||
|
Portland, Oregon Urban Renewal and
|
|||||||||
|
Redevelopment, Interstate Corridor
|
|||||||||
| 1,390,000 |
5.000%, 06/15/27 Series B
|
A1/NR/NR
|
1,544,054 | ||||||
|
State of Oregon Housing and
|
|||||||||
|
Community Services
|
|||||||||
| 1,950,000 |
4.650%, 07/01/25
|
Aa2/NR/NR
|
2,077,569 | ||||||
| 1,580,000 |
5.350%, 07/01/30
|
Aa2/NR/NR
|
1,689,936 | ||||||
|
Total Housing
|
5,311,559 | ||||||||
|
Lottery (4.0%)
|
|||||||||
|
Oregon State Department of
|
|||||||||
|
Administration Services (Lottery
|
|||||||||
|
Revenue)
|
|||||||||
| 2,700,000 |
5.000%, 04/01/19 AGMC Insured
|
||||||||
|
(pre-refunded)
|
Aa2/AAA/AA-
|
2,890,755 | |||||||
| 1,195,000 |
5.000%, 04/01/24 Series A
|
Aa2/AAA/NR
|
1,486,078 | ||||||
| 1,500,000 |
5.000%, 04/01/25 Series B
|
Aa2/AAA/NR
|
1,847,985 | ||||||
| 7,300,000 |
5.250%, 04/01/26
|
Aa2/AAA/NR
|
8,991,045 | ||||||
| 3,000,000 |
5.000%, 04/01/27 AGMC Insured
|
Aa2/AAA/AA-
|
3,453,300 | ||||||
| 2,500,000 |
5.000%, 04/01/29
|
Aa2/AAA/NR
|
2,918,175 | ||||||
|
Total Lottery
|
21,587,338 | ||||||||
18 | Tax-Free Trust of Oregon
|
TAX-FREE TRUST OF OREGON
|
|||
|
SCHEDULE OF INVESTMENTS (continued)
|
|||
|
SEPTEMBER 30, 2012
|
|
Rating
|
|||||||||
|
Moody’s/S&P
|
|||||||||
|
Principal
|
and Fitch
|
||||||||
|
Amount
|
Revenue Bonds (continued)
|
(unaudited)
|
Value
|
||||||
|
Transportation (6.9%)
|
|||||||||
|
Jackson County, Oregon Airport Revenue
|
|||||||||
| $ | 750,000 |
5.250%, 12/01/32 Syncora Guarantee,
|
|||||||
|
Inc. Insured
|
Baa1/NR/NR
|
$ | 779,452 | ||||||
|
Oregon State Department Transportation
|
|||||||||
|
Highway Usertax
|
|||||||||
| 3,025,000 |
5.500%, 11/15/18 Series A
|
||||||||
|
(pre-refunded)
|
Aa1/AAA/AA+
|
3,043,785 | |||||||
| 1,200,000 |
5.000%, 11/15/22 Series A
|
||||||||
|
(pre-refunded)
|
Aa1/AAA/AA+
|
1,319,448 | |||||||
| 1,260,000 |
5.000%, 11/15/23 Series A
|
||||||||
|
(pre-refunded)
|
Aa1/AAA/AA+
|
1,385,420 | |||||||
| 4,545,000 |
5.125%, 11/15/26 Series A
|
||||||||
|
(pre-refunded)
|
Aa1/AAA/AA+
|
4,571,270 | |||||||
| 1,000,000 |
5.000%, 11/15/29 Series A
|
||||||||
|
(pre-refunded)
|
Aa1/AAA/AA+
|
1,099,540 | |||||||
|
Oregon State Department Transportation
|
|||||||||
|
Highway Usertax, Senior Lien
|
|||||||||
| 1,865,000 |
5.000%, 11/15/23 Series A
|
Aa1/AAA/AA+
|
2,213,904 | ||||||
| 2,000,000 |
4.625%, 11/15/25 Series A
|
Aa1/AAA/AA+
|
2,301,080 | ||||||
| 3,540,000 |
4.625%, 11/15/26 Series A
|
Aa1/AAA/AA+
|
3,899,487 | ||||||
| 2,155,000 |
5.000%, 11/15/28 Series A
|
Aa1/AAA/AA+
|
2,458,683 | ||||||
| 1,000,000 |
5.000%, 11/15/24 Series N
|
Aa1/AAA/AA+
|
1,273,510 | ||||||
|
Tri-County Metropolitan Transportation
|
|||||||||
|
District, Oregon
|
|||||||||
| 1,775,000 |
5.000%, 09/01/16
|
Aa1/AAA/NR
|
1,807,465 | ||||||
| 1,010,000 |
5.000%, 09/01/24
|
Aa1/AAA/NR
|
1,275,994 | ||||||
|
Tri-County Metropolitan Transportation
|
|||||||||
|
District, Oregon Capital Grant Receipt
|
|||||||||
| 1,685,000 |
5.000%, 10/01/24 Series A
|
A1/A/NR
|
2,022,438 | ||||||
| 3,480,000 |
5.000%, 10/01/26 Series A
|
A1/A/NR
|
4,133,718 | ||||||
| 3,000,000 |
5.000%, 10/01/27 Series A
|
A1/A/NR
|
3,545,100 | ||||||
|
Total Transportation
|
37,130,294 | ||||||||
|
Water and Sewer (12.8%)
|
|||||||||
|
Ashland, Oregon Refunding
|
|||||||||
| 1,025,000 |
4.000%, 05/01/17 AGMC Insured
|
NR/AA-/NR
|
1,176,126 | ||||||
|
Klamath Falls, Oregon Water
|
|||||||||
| 1,575,000 |
5.500%, 07/01/16 AGMC Insured
|
Aa3/AA-/NR
|
1,723,034 | ||||||
19 | Tax-Free Trust of Oregon
|
TAX-FREE TRUST OF OREGON
|
|||
|
SCHEDULE OF INVESTMENTS (continued)
|
|||
|
SEPTEMBER 30, 2012
|
|
Rating
|
|||||||||
|
Moody’s/S&P
|
|||||||||
|
Principal
|
and Fitch
|
||||||||
|
Amount
|
Revenue Bonds (continued)
|
(unaudited)
|
Value
|
||||||
|
Water and Sewer (continued
|
|||||||||
|
Lane County, Oregon Metropolitan
|
|||||||||
|
Wastewater
|
|||||||||
| $ | 2,500,000 |
5.250%, 11/01/28
|
Aa2/AA/NR
|
$ | 2,876,250 | ||||
|
Portland, Oregon Sewer System,
|
|||||||||
|
Second Lien
|
|||||||||
| 3,005,000 |
5.000%, 03/01/28 Series A
|
Aa3/AA/NR
|
3,632,234 | ||||||
|
Portland Oregon Sewer System Revenue
|
|||||||||
|
Refunding Second Lien
|
|||||||||
| 5,000,000 |
5.000%, 06/15/33 Series B
|
Aa3/AA/NR
|
5,634,550 | ||||||
|
Portland, Oregon Sewer System
|
|||||||||
| 2,760,000 |
5.250%, 06/01/17 AGMC Insured
|
Aa3/AA/NR
|
2,847,906 | ||||||
| 4,595,000 |
5.000%, 06/01/17 AGMC Insured
|
Aa2/AA/NR
|
5,131,788 | ||||||
| 3,470,000 |
5.000%, 06/01/21 AGMC Insured
|
Aa3/AA/NR
|
3,562,371 | ||||||
| 4,410,000 |
5.000%, 06/15/25 NPFG Insured
|
Aa3/AA/NR
|
4,901,098 | ||||||
| 4,630,000 |
5.000%, 06/15/26 NPFG Insured
|
Aa3/AA/NR
|
5,133,374 | ||||||
| 1,610,000 |
5.000%, 06/15/27 NPFG Insured
|
Aa3/AA/NR
|
1,780,773 | ||||||
|
Portland, Oregon Water System
|
|||||||||
|
Revenue Refunding
|
|||||||||
| 1,920,000 |
4.000%, 05/01/14 Series A
|
Aaa/NR/NR
|
2,030,784 | ||||||
| 1,275,000 |
4.000%, 05/01/25 Series A
|
Aaa/NR/NR
|
1,432,475 | ||||||
|
Prineville, Oregon Refunding
|
|||||||||
| 1,255,000 |
4.400%, 06/01/29 AGMC Insured
|
NR/AA-/NR
|
1,428,102 | ||||||
|
Salem, Oregon Water & Sewer
|
|||||||||
| 1,000,000 |
5.375%, 06/01/15 AGMC Insured
|
Aa3/AA-/NR
|
1,121,340 | ||||||
|
Seaside, Oregon Wastewater System
|
|||||||||
| 1,000,000 |
4.250%, 07/01/26
|
A3/NR/NR
|
1,100,330 | ||||||
|
Sunrise Water Authority, Oregon
|
|||||||||
| 2,630,000 |
5.000%, 03/01/19 AGMC Insured
|
Aa3/AA-/NR
|
2,761,421 | ||||||
| 1,350,000 |
5.250%, 03/01/24 AGMC Insured
|
Aa3/AA-/NR
|
1,408,793 | ||||||
| 1,000,000 |
5.000%, 09/01/25 Syncora Guarantee,
|
||||||||
|
Inc.
|
NR/NR/NR*
|
1,044,810 | |||||||
|
Tigard, Oregon Water System Revenue
|
|||||||||
|
Refunding
|
|||||||||
| 2,025,000 |
4.000%, 08/01/21
|
A1/AA-/NR
|
2,342,339 | ||||||
| 1,105,000 |
5.000%, 08/01/24
|
A1/AA-/NR
|
1,382,620 | ||||||
|
Washington County, Oregon Clean
|
|||||||||
|
Water Services
|
|||||||||
| 2,235,000 |
5.250%, 10/01/15 NPFG Insured
|
Aa2/AA/NR
|
2,549,420 | ||||||
| 4,000,000 |
5.000%, 10/01/28
|
Aa2/AA/NR
|
4,621,400 | ||||||
20 | Tax-Free Trust of Oregon
|
TAX-FREE TRUST OF OREGON
|
|||
|
SCHEDULE OF INVESTMENTS (continued)
|
|||
|
SEPTEMBER 30, 2012
|
|
Rating
|
|||||||||
|
Moody’s/S&P
|
|||||||||
|
Principal
|
and Fitch
|
||||||||
|
Amount
|
Revenue Bonds (continued)
|
(unaudited)
|
Value
|
||||||
|
Water and Sewer (continued
|
|||||||||
|
Washington County, Oregon Clean
|
|||||||||
|
Water Services Sewer Revenue
|
|||||||||
|
Senior Lien
|
|||||||||
| $ | 2,850,000 |
4.000%, 10/01/26 Series B
|
Aa2/AA/NR
|
$ | 3,194,879 | ||||
| 2,745,000 |
4.000%, 10/01/28 Series B
|
Aa2/AA/NR
|
3,037,507 | ||||||
|
Woodburn, Oregon Wastewater
|
|||||||||
|
Revenue Refunding
|
|||||||||
| 1,090,000 |
5.000%, 03/01/21 Series A
|
A2/NR/NR
|
1,300,087 | ||||||
|
Total Water and Sewer
|
69,155,811 | ||||||||
|
Total Revenue Bonds
|
267,294,743 | ||||||||
|
Total Investments (cost $487,051,513-
|
|||||||||
|
note 4)
|
98.6%
|
533,027,430 | |||||||
|
Other assets less liabilities
|
1.4
|
7,467,098 | |||||||
|
Net Assets
|
100.0%
|
$ | 540,494,528 | ||||||
| * |
Any security not rated (“NR”) by any of the Nationally Recognized Statistical Rating Organizations (“NRSRO” or “Credit Rating Agency”) has been determined by the Investment Sub-Adviser to have sufficient quality to be ranked in the top four credit ratings if a credit rating were to be assigned by a NRSRO.
|
||||||||
|
Percent of
|
||||
|
Portfolio Distribution by Quality Rating (unaudited)
|
Portfolio†
|
|||
|
Aaa of Moody’s or AAA of S&P
|
9.0 | % | ||
|
Pre-refunded bonds †† / Escrowed to Maturity bonds
|
6.9 | |||
|
Aa of Moody’s, AA of S&P or Fitch
|
62.4 | |||
|
A of Moody’s, S&P or Fitch
|
16.6 | |||
|
Baa of Moody’s or BBB of S&P
|
3.3 | |||
|
Not rated*
|
1.8 | |||
| 100.0 | % | |||
21 | Tax-Free Trust of Oregon
TAX-FREE TRUST OF OREGON
SCHEDULE OF INVESTMENTS (continued)
SEPTEMBER 30, 2012
| † | Where applicable, calculated using the highest rating of the three NRSROs. |
| †† | Pre-refunded bonds are bonds for which U.S. Government Obligations have been placed in escrow to retire the bonds at their earliest call date. |
|
PORTFOLIO ABBREVIATIONS:
|
|
|
AGC
|
Assured Guaranty Insurance
|
|
AGMC
|
Assured Guaranty Municipal Corp.
|
|
AMBAC
|
American Municipal Bond Assurance Corporation
|
|
ETM
|
Escrowed to Maturity
|
|
FGIC
|
Financial Guaranty Insurance Co.
|
|
NPFG
|
National Public Finance Guarantee
|
|
NR
|
Not Rated
|
See accompanying notes to financial statements.
22 | Tax-Free Trust of Oregon
|
TAX-FREE TRUST OF OREGON
|
|
STATEMENT OF ASSETS AND LIABILITIES
|
|
YEAR SEPTEMBER 30, 2012
|
|
ASSETS
|
||||
|
Investments at value (cost $487,051,513)
|
$ | 533,027,430 | ||
|
Cash
|
645,453 | |||
|
Interest receivable
|
7,347,747 | |||
|
Receivable for Trust shares sold
|
876,947 | |||
|
Other assets
|
25,325 | |||
|
Total assets
|
541,922,902 | |||
|
LiABiLiTiES
|
||||
|
Payable for Trust shares redeemed
|
760,138 | |||
|
Dividends payable
|
327,800 | |||
|
Management fees payable
|
173,704 | |||
|
Distribution and service fees payable
|
13,714 | |||
|
Accrued expenses
|
153,018 | |||
|
Total liabilities
|
1,428,374 | |||
|
NET ASSETS
|
$ | 540,494,528 | ||
|
Net Assets consist of:
|
||||
|
Capital Stock - Authorized an unlimited number of shares, par
|
||||
|
value $0.01 per share
|
$ | 468,752 | ||
|
Additional paid-in capital
|
491,626,980 | |||
|
Net unrealized appreciation on investments (note 4)
|
45,975,917 | |||
|
Undistributed net investment income
|
230,091 | |||
|
Accumulated net realized gain on investments
|
2,192,788 | |||
| $ | 540,494,528 | |||
|
CLASS A
|
||||
|
Net Assets
|
$ | 419,237,487 | ||
|
Capital shares outstanding
|
36,352,574 | |||
|
Net asset value and redemption price per share
|
$ | 11.53 | ||
|
Maximum offering price per share (100/96 of $11.53 adjusted
|
||||
|
to nearest cent)
|
$ | 12.01 | ||
|
CLASS C
|
||||
|
Net Assets
|
$ | 37,705,285 | ||
|
Capital shares outstanding
|
3,272,472 | |||
|
Net asset value and offering price per share
|
$ | 11.52 | ||
|
Redemption price per share (* a charge of 1% is imposed on the
|
||||
|
redemption proceeds of the shares, or on the original price,
|
||||
|
whichever is lower, if redeemed during the first 12 months
|
||||
|
after purchase)
|
$ | 11.52 | * | |
|
CLASS Y
|
||||
|
Net Assets
|
$ | 83,551,756 | ||
|
Capital shares outstanding
|
7,250,121 | |||
|
Net asset value, offering and redemption price per share
|
$ | 11.52 | ||
See accompanying notes to financial statements.
23 | Tax-Free Trust of Oregon
|
TAX-FREE TRUST OF OREGON
|
||
|
STATEMENT OF OPERATIONS
|
||
|
YEAR ENDED SEPTEMBER 30, 2012
|
|
Investment Income:
|
||||||||
|
Interest income
|
$ | 20,441,131 | ||||||
|
Expenses:
|
||||||||
|
Management fees (note 3)
|
$ | 2,030,450 | ||||||
|
Distribution and service fees (note 3)
|
918,321 | |||||||
|
Transfer and shareholder servicing agent fees
|
294,286 | |||||||
|
Trustees’ fees and expenses (note 7)
|
255,863 | |||||||
|
Legal fees
|
218,330 | |||||||
|
Shareholders’ reports and proxy statements
|
69,563 | |||||||
|
Custodian fees (note 6)
|
36,576 | |||||||
|
Registration fees and dues
|
28,882 | |||||||
|
Auditing and tax fees
|
25,903 | |||||||
|
Insurance
|
20,088 | |||||||
|
Chief compliance officer services (note 3)
|
5,194 | |||||||
|
Miscellaneous
|
37,469 | |||||||
|
Total expenses
|
3,940,925 | |||||||
|
Management fees waived (note 3)
|
(21,466 | ) | ||||||
|
Expenses paid indirectly (note 6)
|
(1,008 | ) | ||||||
|
Net expenses
|
3,918,451 | |||||||
|
Net investment income
|
16,522,680 | |||||||
|
Realized and Unrealized Gain (Loss) on Investments:
|
||||||||
|
Net realized gain (loss) from securities
|
||||||||
|
transactions
|
2,522,836 | |||||||
|
Change in unrealized appreciation on
|
||||||||
|
investments
|
16,001,761 | |||||||
|
Net realized and unrealized gain (loss) on
|
||||||||
|
investments
|
18,524,597 | |||||||
|
Net change in net assets resulting from
|
||||||||
|
operations
|
$ | 35,047,277 | ||||||
See accompanying notes to financial statements.
24 | Tax-Free Trust of Oregon
|
TAX-FREE TRUST OF OREGON
|
||
|
STATEMENTS OF CHANGES IN NET ASSETS
|
|
Year Ended
|
Year Ended
|
|||||||
|
September 30, 2012
|
September 30, 2011
|
|||||||
|
OPERATIONS:
|
||||||||
|
Net investment income
|
$ | 16,522,680 | $ | 16,847,144 | ||||
|
Net realized gain (loss) from securities
|
||||||||
|
transactions
|
2,522,836 | (213,603 | ) | |||||
|
Change in unrealized appreciation
|
||||||||
|
(depreciation) on investments
|
16,001,761 | (5,092,691 | ) | |||||
|
Change in net assets resulting from
|
||||||||
|
operations
|
35,047,277 | 11,540,850 | ||||||
|
DISTRIBUTIONS TO SHAREHOLDERS (note 10):
|
||||||||
|
Class A Shares:
|
||||||||
|
Net investment income
|
(13,021,908 | ) | (13,260,251 | ) | ||||
|
Class C Shares:
|
||||||||
|
Net investment income
|
(778,958 | ) | (713,975 | ) | ||||
|
Class Y Shares:
|
||||||||
|
Net investment income
|
(2,679,809 | ) | (2,852,438 | ) | ||||
|
Change in net assets from distributions
|
(16,480,675 | ) | (16,826,664 | ) | ||||
|
CAPITAL SHARE TRANSACTIONS (note 8):
|
||||||||
|
Proceeds from shares sold
|
84,694,490 | 51,950,817 | ||||||
|
Reinvested dividends and distributions
|
10,296,809 | 10,362,686 | ||||||
|
Cost of shares redeemed
|
(52,022,893 | ) | (103,034,039 | ) | ||||
|
Change in net assets from capital share
|
||||||||
|
transactions
|
42,968,406 | (40,720,536 | ) | |||||
|
Change in net assets
|
61,535,008 | (46,006,350 | ) | |||||
|
NET ASSETS:
|
||||||||
|
Beginning of period
|
478,959,520 | 524,965,870 | ||||||
|
End of period*
|
$ | 540,494,528 | $ | 478,959,520 | ||||
|
* Includes undistributed net investment
|
||||||||
|
income of:
|
$ | 230,091 | $ | 245,539 | ||||
See accompanying notes to financial statements.
25 | Tax-Free Trust of Oregon
TAX-FREE TRUST OF OREGON
NOTES TO FINANCIAL STATEMENTS
SEPTEMBER 30, 2012
1. Organization
Tax-Free Trust of Oregon (the “Trust”) is a separate portfolio of The Cascades Trust. The Cascades Trust (the “Business Trust”) is an open-end investment company, which was organized on October 17, 1985, as a Massachusetts business trust and is authorized to issue an unlimited number of shares. The Trust is a non-diversified portfolio which commenced operations on June 16, 1986 and until April 5, 1996, offered only one class of shares. On that date, the Trust began offering two additional classes of shares, Class C and Class Y Shares. All shares outstanding prior to that date were designated as Class A Shares and are sold at net asset value plus a sales charge of varying size (depending upon a variety of factors) paid at the time of purchase and bear a distribution fee. Class C Shares are sold at net asset value with no sales charge payable at the time of purchase but with a level charge for service and distribution fees for six years thereafter. Class C Shares automatically convert to Class A Shares after six years. Class Y Shares are sold only through authorized financial institutions acting for investors in a fiduciary, advisory, agency, custodial or similar capacity, and are not offered directly to retail customers. Class Y Shares are sold at net asset value with no sales charge, no redemption fee, no contingent deferred sales charge (“CDSC”) and no distribution fee. On January 31, 1998, the Trust established Class I Shares which are offered and sold only through financial intermediaries and are not offered directly to retail customers. Class I Shares are sold at net asset value with no sales charge and no redemption fee or CDSC, although a financial intermediary may charge a fee for effecting a purchase or other transaction on behalf of its customers. Class I Shares carry a distribution and a service fee. As of the report date, there were no Class I Shares outstanding. All classes of shares represent interests in the same portfolio of investments and are identical as to rights and privileges but differ with respect to the effect of sales charges, the distribution and/or service fees borne by each class, expenses specific to each class, voting rights on matters affecting a single class and the exchange privileges of each class.
2. Significant Accounting Policies
The following is a summary of significant accounting policies followed by the Trust in the preparation of its financial statements. The policies are in conformity with accounting principles generally accepted in the United States of America for investment companies.
|
a)
|
Portfolio valuation: Municipal securities which have remaining maturities of more than 60 days are valued each business day based upon information provided by a nationally prominent independent pricing service and periodically verified through other pricing services. In the case of securities for which market quotations are readily available, securities are valued by the pricing service at the mean of bid and asked quotations. If a market quotation or a valuation from the pricing service is not readily available, the security is valued at fair value determined in good faith under procedures established by and under the general supervision of the Board of Trustees. Securities which mature in 60 days or less are generally valued at amortized cost if their term to maturity at purchase is 60 days or less, or by amortizing their unrealized appreciation or depreciation on the 61st day prior to maturity, if their term to maturity at purchase exceeds 60 days.
|
26 | Tax-Free Trust of Oregon
TAX-FREE TRUST OF OREGON NOTES TO FiNANciAL STATEMENTS (continued) SEPTEMBER 30, 2012
|
b)
|
Fair value measurements: The Trust follows a fair value hierarchy that distinguishes between market data obtained from independent sources (observable inputs) and the Trust’s own market assumptions (unobservable inputs). These inputs are used in determining the value of the Trust’s investments and are summarized in the following fair value hierarchy:
|
Level 1 – Unadjusted quoted prices in active markets for identical assets or liabilities that the Trust has the ability to access.
Level 2 – Observable inputs other than quoted prices included in Level 1 that are observable for the asset or liability, either directly or indirectly. These inputs may include quoted prices for the identical instrument on an inactive market, prices for similar instruments, interest rates, prepayment speeds, credit risk, yield curves, default rates and similar data.
Level 3 – Unobservable inputs for the asset or liability, to the extent relevant observable inputs are not available, representing the Trust’s own assumptions about the assumptions a market participant would use in valuing the asset or liability, based on the best information available.
The inputs or methodology used for valuing securities are not an indication of the risk associated with investing in those securities.
The following is a summary of the valuation inputs, representing 100% of the Trust’s investments, used to value the Trust’s net assets as of September 30, 2012:
|
Valuation Inputs
|
|
Investments in Securities
|
|||
|
Level 1 – Quoted Prices
|
$ | – | |||
|
Level 2 – Other Significant Observable Inputs –Municipal Bonds*
|
533,027,430 | ||||
|
Level 3 – Significant Unobservable Inputs
|
– | ||||
|
Total
|
$ | 533,027,430 | |||
*See schedule of investments for a detailed listing of securities.
|
c)
|
Subsequent events: In preparing these financial statements, the Trust has evaluated events and transactions for potential recognition or disclosure through the date these financial statements were issued.
|
|
d)
|
Securities transactions and related investment income: Securities transactions are recorded on the trade date. Realized gains and losses from securities transactions are reported on the identified cost basis. Interest income is recorded daily on the accrual basis and is adjusted for amortization of premium and accretion of original issue and market discount.
|
|
e)
|
Federal income taxes: It is the policy of the Trust to continue to qualify as a regulated investment company by complying with the provisions of the Internal Revenue Code applicable to certain investment companies. The Trust intends to make distributions of income and securities profits sufficient to relieve it from all, or substantially all, Federal income and excise taxes.
|
27 | Tax-Free Trust of Oregon
TAX-FREE TRUST OF OREGON
NOTES TO FINANCIAL STATEMENTS (continued)
SEPTEMBER 30, 2012
Management has reviewed the tax positions for each of the open tax years (2009-2011) or expected to be taken in the Trust’s 2012 tax returns and has concluded that there are no significant uncertain tax positions that would require recognition in the financial statements.
|
f)
|
Multiple class allocations: All income, expenses (other than class-specific expenses), and realized and unrealized gains or losses are allocated daily to each class of shares based on the relative net assets of each class. Class-specific expenses, which include distribution and service fees and any other items that are specifically attributed to a particular class, are also charged directly to such class on a daily basis.
|
|
g)
|
Use of estimates: The preparation of financial statements in conformity with accounting principles generally accepted in the United States of America requires management to make estimates and assumptions that affect the reported amounts of assets and liabilities and disclosure of contingent assets and liabilities at the date of the financial statements and the reported amounts of increases and decreases in net assets from operations during the reporting period. Actual results could differ from those estimates.
|
|
h)
|
Reclassification of capital accounts: Accounting principles generally accepted in the United States of America require that certain components of net assets relating to permanent differences be reclassified between financial and tax reporting. On September 30, 2012, the Trust decreased undistributed net investment income by $57,453 and increased paid-in capital by $57,453 due primarily to differing book/tax treatment of distributions and bond amortization. These reclassifications had no effect on net assets or net asset value per share.
|
|
i)
|
Accounting pronouncements: In May 2011, the Financial Accounting Standards Board (“FASB”) issued Accounting Standards Update (“ASU”) No. 2011-04, “Fair Value Measurement (Topic 820): Amendments to Achieve Common Fair Value Measurement and Disclosure Requirements in U.S. GAAP and International Financial Reporting Standards (“IFRS”). ASU No. 2011-04 clarifies existing requirements for measuring fair value and for disclosure about fair value measurements in converged guidance of the FASB and the International Accounting Standards Board. The amendments are effective during interim and annual periods beginning after December 15, 2011.
|
In December 2011, FASB issued ASU No. 2011-11 related to disclosures about offsetting assets and liabilities. The amendments in this ASU require an entity to disclose information about offsetting and related arrangements to enable users of its financial statements to understand the effect of those arrangements on its financial position. The ASU is effective for annual reporting periods beginning on or after January 1, 2013, and interim periods within those annual periods. The guidance requires retrospective application for all comparative periods presented.
28 | Tax-Free Trust of Oregon
TAX-FREE TRUST OF OREGON
NOTES TO FINANCIAL STATEMENTS (continued)
SEPTEMBER 30, 2012
Management is currently evaluating the impact these updates and amendments may have on the Trust’s financial statements.
3. Fees and Related Party Transactions
a) Management Arrangements:
Aquila Investment Management LLC (the “Manager”), a wholly-owned subsidiary of Aquila Management Corporation, the Trust’s founder and sponsor, serves as the Manager for the Trust under an Advisory and Administration Agreement with the Trust. The portfolio management of the Trust has been delegated to a Sub-Adviser as described below. Under the Advisory and Administrative Agreement, the Manager provides all administrative services to the Trust, other than those relating to the day-today portfolio management. The Manager’s services include providing the office of the Trust and all related services as well as overseeing the activities of the Sub-Adviser and managing relationships with all the various support organizations to the Trust such as the shareholder servicing agent, custodian, legal counsel, auditors and distributor and additionally maintaining the Trust’s accounting books and records. For its services, the Manager is entitled to receive a fee which is payable monthly and computed as of the close of business each day at the annual rate of 0.40 of 1% of net assets of the Trust. The Manager determined to contractually waive its fees to the extent necessary in order to pass savings through to the shareholders recognized under the Sub-Advisory Agreement (as described below) such that its fees are as follows: the annual rate shall be equivalent to 0.40 of 1% of net assets of the Trust up to $400 million; 0.38 of 1% of the Trust’s net assets above that amount to $1 billion and 0.36 of 1% of the Trust’s net assets above $1 billion. For the year ended September 30, 2012, the Trust incurred management fees of $2,030,450, of which $21,466 was waived.
Kirkpatrick Pettis Capital Management (the “Sub-Adviser”) serves as the Investment Sub-Adviser for the Trust under a Sub-Advisory Agreement between the Manager and the Sub-Adviser. Under this agreement, the Sub-Adviser continuously provides, subject to oversight of the Manager and the Board of Trustees of the Trust, the investment program of the Trust and the composition of its portfolio, arranges for the purchases and sales of portfolio securities, and provides for daily pricing of the Trust’s portfolio. For its services, the Sub-Adviser is entitled to receive a fee from the Manager which is payable monthly and computed as of the close of business each day at the annual rate of 0.18 of 1% of net assets of the Trust up to $400 million; 0.16 of 1% of net assets above $400 million up to $1 billion; and 0.14 of 1% of net assets above $1 billlion.
Under a Compliance Agreement with the Manager, the Manager is compensated by the Trust for Chief Compliance Officer related services provided to enable the Trust to comply with Rule 38a-1 of the Investment Company Act of 1940.
Specific details as to the nature and extent of the services provided by the Manager and the Sub-Adviser are more fully defined in the Trust’s Prospectus and Statement of Additional Information.
29 | Tax-Free Trust of Oregon
TAX-FREE TRUST OF OREGON
NOTES TO FINANCIAL STATEMENTS (continued)
SEPTEMBER 30, 2012
b) Distribution and Service Fees:
The Trust has adopted a Distribution Plan (the “Plan”) pursuant to Rule 12b-1 (the “Rule”) under the Investment Company Act of 1940. Under one part of the Plan, with respect to Class A Shares, the Trust is authorized to make distribution fee payments to broker-dealers or others (“Qualified Recipients”) selected by Aquila Distributors, Inc. (the “Distributor”), including, but not limited to, any principal underwriter of the Trust, with which the Distributor has entered into written agreements contemplated by the Rule and which have rendered assistance in the distribution and/or retention of the Trust’s shares or servicing of shareholder accounts. The Trust makes payment of this distribution fee at the annual rate of 0.15% of the Trust’s average net assets represented by Class A Shares. For the year ended September 30, 2012, distribution fees on Class A Shares amounted to $595,726 of which the Distributor retained $30,292.
Under another part of the Plan, the Trust is authorized to make payments with respect to Class C Shares to Qualified Recipients which have rendered assistance in the distribution and/or retention of the Trust’s Class C shares or servicing of shareholder accounts. These payments are made at the annual rate of 0.75% of the Trust’s average net assets represented by Class C Shares and for the year ended September 30, 2012, amounted to $241,946. In addition, under a Shareholder Services Plan, the Trust is authorized to make service fee payments with respect to Class C Shares to Qualified Recipients for providing personal services and/or maintenance of shareholder accounts. These payments are made at the annual rate of 0.25% of the Trust’s average net assets represented by Class C Shares and for the year ended September 30, 2012, amounted to $80,649. The total of these payments made with respect to Class C Shares amounted to $322,595 of which the Distributor retained $57,461.
Specific details about the Plans are more fully defined in the Trust’s Prospectus and Statement of Additional Information.
Under a Distribution Agreement, the Distributor serves as the exclusive distributor of the Trust’s shares. Through agreements between the Distributor and various brokerage and advisory firms (“intermediaries”), the Trust’s shares are sold primarily through the facilities of these intermediaries having offices within Oregon, with the bulk of any sales commissions inuring to such intermediaries. For the year ended September 30, 2012, total commissions on sales of Class A Shares amounted to $1,250,842 of which the Distributor received $226,793.
4. Purchases and Sales of Securities
During the year ended September 30, 2012, purchases of securities and proceeds from the sales of securities aggregated $78,547,752 and $37,473,773, respectively.
At September 30, 2012, the aggregate tax cost for all securities was $486,821,422. At September 30, 2012, the aggregate gross unrealized appreciation for all securities in which there is an excess of value over tax cost amounted to $46,216,025 and aggregate gross unrealized depreciation for all securities in which there is an excess of tax cost over value amounted to $10,017 for a net unrealized appreciation of $46,206,008.
30 | Tax-Free Trust of Oregon
TAX-FREE TRUST OF OREGON
NOTES TO FINANCIAL STATEMENTS (continued)
SEPTEMBER 30, 2012
5. Portfolio Orientation
Since the Trust invests principally and may invest entirely in double tax-free municipal obligations of issuers within Oregon, it is subject to possible risks associated with economic, political, or legal developments or industrial or regional matters specifically affecting Oregon and whatever effects these may have upon Oregon issuers’ ability to meet their obligations. Two such developments, Measure 5, a 1990 amendment to the Oregon Constitution, as well as Measures 47 and 50, limit the taxing and spending authority of certain Oregon governmental entities. These amendments could have an adverse effect on the general financial condition of certain municipal entities that would impair the ability of certain Oregon issuers to pay interest and principal on their obligations.
6. Expenses
The Trust has negotiated an expense offset arrangement with its custodian, wherein it receives credit toward the reduction of custodian fees and other Trust expenses whenever there are uninvested cash balances. The Statement of Operations reflects the total expenses before any offset, the amount of offset and the net expenses.
7. Trustees’ Fees and Expenses
At September 30, 2012 there were 7 Trustees, one of whom is affiliated with the Manager and is not paid any fees. The total amount of Trustees’ service fees (for carrying out their responsibilities) and attendance fees paid during the year ended September 30, 2012 was $202,873. Attendance fees are paid to those in attendance at regularly scheduled quarterly Board Meetings and meetings of the Independent Trustees held prior to each quarterly Board Meeting, as well as additional meetings (such as Audit, Nominating, Shareholder and special meetings). Trustees are reimbursed for their expenses such as travel, accommodations, and meals incurred in connection with attendance at Board Meetings and at the Annual Meeting of Shareholders. For the year ended September 30, 2012, such meeting-related expenses amounted to $52,990.
31 | Tax-Free Trust of Oregon
|
TAX-FREE TRUST OF OREGON
|
||||
|
NOTES TO FINANCIAL STATEMENTS (continued)
|
||||
|
SEPTEMBER 30, 2012
|
|
8. Capital Share Transactions
|
|
Transactions in Capital Shares of the Trust were as follows:
|
|
Year Ended
|
Year Ended
|
|||||||||||||||
|
September 30, 2012
|
September 30, 2011
|
|||||||||||||||
|
Shares
|
Amount
|
Shares
|
Amount
|
|||||||||||||
|
Class A Shares:
|
||||||||||||||||
|
Proceeds from shares sold
|
4,298,384 | $ | 48,821,795 | 2,898,388 | $ | 31,437,611 | ||||||||||
|
Reinvested dividends and
|
||||||||||||||||
|
distributions
|
733,155 | 8,316,442 | 787,415 | 8,515,528 | ||||||||||||
|
Cost of shares redeemed
|
(2,893,087 | ) | (32,761,551 | ) | (5,278,453 | ) | (56,779,136 | ) | ||||||||
|
Net change
|
2,138,452 | 24,376,686 | (1,592,650 | ) | (16,825,997 | ) | ||||||||||
|
Class C Shares:
|
||||||||||||||||
|
Proceeds from shares sold
|
1,283,173 | 14,532,028 | 549,608 | 5,952,506 | ||||||||||||
|
Reinvested dividends
|
||||||||||||||||
|
and distributions
|
49,403 | 560,212 | 47,902 | 517,523 | ||||||||||||
|
Cost of shares redeemed
|
(517,711 | ) | (5,849,065 | ) | (758,285 | ) | (8,101,298 | ) | ||||||||
|
Net change
|
814,865 | 9,243,175 | (160,775 | ) | (1,631,269 | ) | ||||||||||
|
Class Y Shares:
|
||||||||||||||||
|
Proceeds from shares sold
|
1,888,049 | 21,340,667 | 1,352,255 | 14,560,700 | ||||||||||||
|
Reinvested dividends and
|
||||||||||||||||
|
distributions
|
125,029 | 1,420,155 | 123,185 | 1,329,635 | ||||||||||||
|
Cost of shares redeemed
|
(1,186,848 | ) | (13,412,277 | ) | (3,577,404 | ) | (38,153,605 | )) | ||||||||
|
Net change
|
826,230 | 9,348,545 | (2,101,964 | ) | (22,263,270 | ) | ||||||||||
|
Total transactions in Trust
|
||||||||||||||||
|
shares
|
3,779,547 | $ | 42,968,406 | (3,855,389 | ) | $ | (40,720,536 | ) | ||||||||
9. Securities Traded on a When-Issued Basis
The Trust may purchase or sell securities on a when-issued basis. When-issued transactions arise when securities are purchased or sold by the Trust with payment and delivery taking place in the future in order to secure what is considered to be an advantageous price and yield to the Trust at the time of entering into the transaction. Beginning on the date the Trust enters into a when-issued transaction, cash or other liquid securities are segregated in an amount equal to or greater than the value of the when-issued transaction. These transactions are subject to market fluctuations and their current value is determined in the same manner as for other securities.
10. Income Tax information and Distributions
The Trust declares dividends daily from net investment income and makes payments monthly. Net realized capital gains, if any, are distributed annually and are taxable. These distributions are paid in additional shares at the net asset value per share, in cash, or in a combination of both, at the shareholder’s option.
32 | Tax-Free Trust of Oregon
TAX-FREE TRUST OF OREGON
NOTES TO FINANCIAL STATEMENTS (continued)
SEPTEMBER 30, 2012
The Trust intends to maintain, to the maximum extent possible, the tax-exempt status of interest payments received from portfolio municipal securities in order to allow dividends paid to shareholders from net investment income to be exempt from regular Federal and State of Oregon income taxes. Due to differences between financial statement reporting and Federal income tax reporting requirements, distributions made by the Trust may not be the same as the Trust’s net investment income, and/ or net realized securities gains. Further, a portion of the dividends may, under some circumstances, be subject to taxes at ordinary income and/or capital gain rates. As a result of the passage of the Regulated Investment Company Act of 2010 (“the Act”), losses incurred in this fiscal year and beyond retain their character as short-term or long-term, have no expiration date and are utilized before capital losses incurred prior to the enactment of the Act. At September 30, 2012, the Trust utilized a capital loss carry forward of $116,445.
As of September 30, 2012, there were no post-October capital loss deferrals.
The tax character of distributions:
|
Year Ended September 30,
|
||||||||
|
2012
|
2011
|
|||||||
|
Net tax-exempt income
|
$ | 16,425,024 | $ | 16,826,664 | ||||
|
Ordinary income
|
55,651 | – | ||||||
|
Capital gain
|
– | – | ||||||
| $ | 16,480,675 | $ | 16,826,664 | |||||
As of September 30, 2012, the components of distributable earnings on a tax basis were as follows:
|
Unrealized appreciation
|
$ | 46,206,008 | ||
|
Undistributed tax-exempt income
|
327,800 | |||
|
Accumulated net gain on investments
|
2,192,788 | |||
|
Other temporary differences
|
(327,800 | ) | ||
| $ | 48,398,796 |
The difference between book basis and tax basis undistributed income is due to the timing difference in recognizing dividends paid.
11. Ongoing Development
Beginning in December 2007, the three major rating agencies (Standard & Poor’s, Moody’s and Fitch) downgraded or eliminated ratings of the municipal bond insurance companies due to loss of capital from investments in subprime mortgages. Only a few insurers are now deemed to be investment grade. Thus, while certain bonds have insurance, some are no longer rated based upon the ratings of their insurers. Furthermore, because the ability of many of the Trust’s insurers to pay claims has been downgraded, the protection of such insurance has been diminished, and there is no assurance that some of them may be relied upon for payment.
33 | Tax-Free Trust of Oregon
|
TAX-FREE TRUST OF OREGON
|
|
FINANCIAL HIGHLIGHTS
|
|
For a share outstanding throughout each period
|
| Class A | ||||||||||||||||||||
| Year Ended September 30, | ||||||||||||||||||||
|
2012
|
2011
|
2010
|
2009
|
2008
|
||||||||||||||||
|
Net asset value, beginning of period
|
$ | 11.12 | $ | 11.18 | $ | 11.05 | $ | 10.11 | $ | 10.68 | ||||||||||
|
Income (loss) from investment operations:
|
||||||||||||||||||||
|
Net investment income(1)
|
0.37 | 0.38 | 0.40 | 0.42 | 0.42 | |||||||||||||||
|
Net gain (loss) on securities (both
|
||||||||||||||||||||
|
realized and unrealized)
|
0.41 | (0.06 | ) | 0.13 | 0.94 | (0.58 | ) | |||||||||||||
|
Total from investment operations
|
0.78 | 0.32 | 0.53 | 1.36 | (0.16 | ) | ||||||||||||||
|
Less distributions (note 10):
|
||||||||||||||||||||
|
Dividends from net investment income
|
(0.37 | ) | (0.38 | ) | (0.40 | ) | (0.42 | ) | (0.41 | ) | ||||||||||
|
Distributions from capital gains
|
– | – | – | – | – | |||||||||||||||
|
Total distributions
|
(0.37 | ) | (0.38 | ) | (0.40 | ) | (0.42 | ) | (0.41 | ) | ||||||||||
|
Net asset value, end of period
|
$ | 11.53 | $ | 11.12 | $ | 11.18 | $ | 11.05 | $ | 10.11 | ||||||||||
|
Total return (not reflecting sales charge)
|
7.14 | % | 3.05 | % | 4.95 | % | 13.74 | % | (1.58 | )% | ||||||||||
|
Ratios/supplemental data
|
||||||||||||||||||||
|
Net assets, end of period (in millions)
|
$ | 419 | $ | 380 | $ | 400 | $ | 370 | $ | 324 | ||||||||||
|
Ratio of expenses to average net assets
|
0.74 | % | 0.76 | % | 0.72 | % | 0.73 | % | 0.76 | % | ||||||||||
|
Ratio of net investment income to average
|
||||||||||||||||||||
|
net assets
|
3.29 | % | 3.55 | % | 3.65 | % | 4.02 | % | 3.89 | % | ||||||||||
|
Portfolio turnover rate
|
8 | % | 15 | % | 9 | % | 15 | % | 15 | % | ||||||||||
|
The expense and net investment income ratios without the effect of the contractual waiver of
|
||||||||||||||||||||
|
management fees were (note 3):
|
||||||||||||||||||||
|
Ratio of expenses to average net assets
|
0.75 | % | 0.76 | % | – | – | – | |||||||||||||
|
Ratio of net investment income to average
|
||||||||||||||||||||
|
net assets
|
3.28 | % | 3.55 | % | – | – | – | |||||||||||||
|
The expense ratios after giving effect to the contractual waiver of management fees and expense
|
||||||||||||||||||||
|
offset for uninvested cash balances were:
|
||||||||||||||||||||
|
Ratio of expenses to average net assets
|
0.74 | % | 0.76 | % | 0.72 | % | 0.73 | % | 0.74 | % | ||||||||||
|
(1)
|
Per share amounts have been calculated using the daily average shares method.
|
|
Note:
|
On January 1, 2011, Kirkpatrick Pettis Capital Management became the Trust’s Investment Sub-Adviser, replacing FAF Advisors, Inc.
|
See accompanying notes to financial statements.
34 | Tax-Free Trust of Oregon
|
TAX-FREE TRUST OF OREGON
|
|
FINANCIAL HIGHLIGHTS (continued)
|
|
For a share outstanding throughout each period
|
| Class C | ||||||||||||||||||||
| Year Ended September 30, | ||||||||||||||||||||
|
2012
|
2011
|
2010
|
2009
|
2008
|
||||||||||||||||
|
Net asset value, beginning of period
|
$ | 11.11 | $ | 11.17 | $ | 11.04 | $ | 10.10 | $ | 10.68 | ||||||||||
|
Income (loss) from investment operations:
|
||||||||||||||||||||
|
Net investment income(1)
|
0.27 | 0.29 | 0.30 | 0.33 | 0.33 | |||||||||||||||
|
Net gain (loss) on securities (both
|
||||||||||||||||||||
|
realized and unrealized)
|
0.42 | (0.06 | ) | 0.14 | 0.94 | (0.59 | ) | |||||||||||||
|
Total from investment operations
|
0.69 | 0.23 | 0.44 | 1.27 | (0.26 | ) | ||||||||||||||
|
Less distributions (note 10):
|
||||||||||||||||||||
|
Dividends from net investment income
|
(0.28 | ) | (0.29 | ) | (0.31 | ) | (0.33 | ) | (0.32 | ) | ||||||||||
|
Distributions from capital gains
|
– | – | – | – | – | |||||||||||||||
|
Total distributions
|
(0.28 | ) | (0.29 | ) | (0.31 | ) | (0.33 | ) | (0.32 | ) | ||||||||||
|
Net asset value, end of period
|
$ | 11.52 | $ | 11.11 | $ | 11.17 | $ | 11.04 | $ | 10.10 | ||||||||||
|
Total return (not reflecting CDSC)
|
6.24 | % | 2.18 | % | 4.07 | % | 12.79 | % | (2.51 | )% | ||||||||||
|
Ratios/supplemental data
|
||||||||||||||||||||
|
Net assets, end of period (in millions)
|
$ | 38 | $ | 27 | $ | 29 | $ | 22 | $ | 18 | ||||||||||
|
Ratio of expenses to average net assets
|
1.59 | % | 1.61 | % | 1.57 | % | 1.58 | % | 1.61 | % | ||||||||||
|
Ratio of net investment income to average
|
||||||||||||||||||||
|
net assets
|
2.42 | % | 2.70 | % | 2.78 | % | 3.15 | % | 3.04 | % | ||||||||||
|
Portfolio turnover rate
|
8 | % | 15 | % | 9 | % | 15 | % | 15 | % | ||||||||||
|
The expense and net investment income ratios without the effect of the contractual waiver of
|
||||||||||||||||||||
|
management fees were (note 3):
|
||||||||||||||||||||
|
Ratio of expenses to average net assets
|
1.59 | % | 1.61 | % | – | – | – | |||||||||||||
|
Ratio of net investment income to average
|
||||||||||||||||||||
|
net assets
|
2.42 | % | 2.70 | % | – | – | – | |||||||||||||
|
The expense ratios after giving effect to the contractual waiver of management fees and expense
|
||||||||||||||||||||
|
offset for uninvested cash balances were:
|
||||||||||||||||||||
|
Ratio of expenses to average net assets
|
1.59 | % | 1.61 | % | 1.57 | % | 1.58 | % | 1.59 | % | ||||||||||
|
(1)
|
Per share amounts have been calculated using the daily average shares method.
|
|
Note:
|
On January 1, 2011, Kirkpatrick Pettis Capital Management became the Trust’s Investment Sub-Adviser, replacing FAF Advisors, Inc.
|
See accompanying notes to financial statements
35 | Tax-Free Trust of Oregon
|
TAX-FREE TRUST OF OREGON
|
|
FINANCIAL HIGHLIGHTS (continued)
|
|
For a share outstanding throughout each period
|
| Class Y | ||||||||||||||||||||
| Year Ended September 30, | ||||||||||||||||||||
|
2012
|
2011
|
2010
|
2009
|
2008
|
||||||||||||||||
|
Net asset value, beginning of period
|
$ | 11.11 | $ | 11.18 | $ | 11.04 | $ | 10.10 | $ | 10.68 | ||||||||||
|
Income (loss) from investment operations:
|
||||||||||||||||||||
|
Net investment income(1)
|
0.39 | 0.40 | 0.42 | 0.44 | 0.43 | |||||||||||||||
|
Net gain (loss) on securities (both
|
||||||||||||||||||||
|
realized and unrealized)
|
0.41 | (0.07 | ) | 0.14 | 0.93 | (0.58 | ) | |||||||||||||
|
Total from investment operations
|
0.80 | 0.33 | 0.56 | 1.37 | (0.15 | ) | ||||||||||||||
|
Less distributions (note 10):
|
||||||||||||||||||||
|
Dividends from net investment income
|
(0.39 | ) | (0.40 | ) | (0.42 | ) | (0.43 | ) | (0.43 | ) | ||||||||||
|
Distributions from capital gains
|
– | – | – | – | – | |||||||||||||||
|
Total distributions
|
(0.39 | ) | (0.40 | ) | (0.42 | ) | (0.43 | ) | (0.43 | ) | ||||||||||
|
Net asset value, end of period
|
$ | 11.52 | $ | 11.11 | $ | 11.18 | $ | 11.04 | $ | 10.10 | ||||||||||
|
Total return
|
7.30 | % | 3.11 | % | 5.21 | % | 13.92 | % | (1.52 | )% | ||||||||||
|
Ratios/supplemental data
|
||||||||||||||||||||
|
Net assets, end of period (in millions)
|
$ | 84 | $ | 71 | $ | 95 | $ | 85 | $ | 58 | ||||||||||
|
Ratio of expenses to average net assets
|
0.59 | % | 0.61 | % | 0.57 | % | 0.58 | % | 0.61 | % | ||||||||||
|
Ratio of net investment income to average
|
||||||||||||||||||||
|
net assets
|
3.44 | % | 3.70 | % | 3.80 | % | 4.16 | % | 4.04 | % | ||||||||||
|
Portfolio turnover rate
|
8 | % | 15 | % | 9 | % | 15 | % | 15 | % | ||||||||||
|
The expense and net investment income ratios without the effect of the contractual waiver of
|
||||||||||||||||||||
|
management fees were (note 3):
|
||||||||||||||||||||
|
Ratio of expenses to average net assets
|
0.60 | % | 0.61 | % | – | – | – | |||||||||||||
|
Ratio of net investment income to average
|
||||||||||||||||||||
|
net assets
|
3.43 | % | 3.70 | % | – | – | – | |||||||||||||
|
The expense ratios after giving effect to the contractual waiver of management fees and expense
|
||||||||||||||||||||
|
offset for uninvested cash balances were:
|
||||||||||||||||||||
|
Ratio of expenses to average net assets
|
0.59 | % | 0.61 | % | 0.57 | % | 0.58 | % | 0.59 | % | ||||||||||
|
(1)
|
Per share amounts have been calculated using the daily average shares method.
|
|
Note:
|
On January 1, 2011, Kirkpatrick Pettis Capital Management became the Trust’s Investment Sub-Adviser, replacing FAF Advisors, Inc.
|
See accompanying notes to financial statements.
36 | Tax-Free Trust of Oregon
|
Additional Information (unaudited)
|
|
Trustees(1)
|
|
and Officers
|
|
Number of
|
||||||||
|
Positions
|
Portfolios
|
|||||||
|
Held with
|
in Fund
|
|||||||
|
Name,
|
Trust and
|
Principal
|
Complex(4)
|
Other Directorships
|
||||
|
Address(2)
|
Length of
|
Occupation(s)
|
Overseen
|
Held by Trustee
|
||||
|
and Year of Birth
|
Service(3)
|
During Past 5 Years
|
by Trustee
|
During Past 5 Years
|
||||
|
Interested Trustee(5)
|
||||||||
|
Diana P. Herrmann
New York, NY
(1958)
|
Vice Chair of the Board of Trustees since 2003, President since 1998 and Trustee since 1994
|
Vice Chair and Chief Executive Officer of Aquila Management Corporation, Founder and Sponsor of the Aquila Group of Funds(6) and parent of Aquila Investment Management LLC, Manager, since 2004, President since 1997, Chief Operating Officer, 1997-2008, a Director since 1984, Secretary since 1986 and previously its Executive Vice President, Senior Vice President or Vice President, 1986-1997; Chief Executive Officer and Vice Chair since 2004, President and Manager since 2003, and Chief Operating Officer (2003-2008), of the Manager; Chair, Vice Chair, President, Executive Vice President and/or Senior Vice President of funds in the Aquila Group of Funds since 1986; Director of the Distributor since 1997; Governor, Investment Company Institute (the U .S . mutual fund industry trade organization dedicated to protecting shareholder interests and educating the public about investing) for various periods since 2004, and head of its Small Funds Committee, 2004-2009; active in charitable and volunteer organizations.
|
11 |
ICI Mutual Insurance Company, a Risk Retention Group (2006-2009 and since 2010); Vice Chair and Trustee of Pacific Capital Funds of Cash Assets Trust (three Aquila money-market funds) 2004-2012
|
||||
|
James A. Gardner
Terrebonne, OR
(1943)
|
Chair of the Board of Trustees since 2005 and Trustee since 1986
|
President, Gardner Associates, an investment and real estate firm, since 1989; Owner and Developer of Vandevert Ranch, Sunriver, Oregon since 1989; Founding Partner, Chairman Emeritus and previously Chairman (1991-2010), Ranch at the Canyons, Terrebonne, Oregon; President Emeritus and previously President (1981-1989), Lewis and Clark College and Law School; director, Oregon High Desert Museum, 1989-2003; active in civic, business and educational organizations in Oregon; writer on Native American and settlement history of Oregon.
|
1 | None |
37 | Tax-Free Trust of Oregon
|
Number of
|
||||||||
|
Positions
|
Portfolios
|
|||||||
|
Held with
|
in Fund
|
|||||||
|
Name,
|
Trust and
|
Principal
|
Complex(4)
|
Other Directorships
|
||||
|
Address(2)
|
Length of
|
Occupation(s)
|
Overseen
|
Held by Trustee
|
||||
|
and Year of Birth
|
Service(3)
|
During Past 5 Years
|
by Trustee
|
During Past 5 Years
|
||||
|
Gary C. Cornia
Orem, UT
(1948)
|
Trustee since 2002
|
Dean, Marriott School of Management, Brigham Young University, since 2008; Director, Romney Institute of Public Management, Marriott School of Management, 2004-2008; Professor, Marriott School of Management, 1980-present; Past President, National Tax Association; Fellow, Lincoln Institute of Land Policy, 2002-present; Associate Dean, Marriott School of Management, Brigham Young University, 1991-2000; member, Utah Governor’s Tax Review Committee, 1993-2009.
|
5 |
Utah Foundation, Salt Lake City, UT; formerly director, Lincoln Institute of Land Policy, Cambridge, MA
|
||||
|
Edmund P. Jensen
Portland, OR
(1937)
|
Trustee since 2003
|
President and CEO, VISA International, 1994-1999; Vice Chairman and Chief Operating Officer, US Bancorp, 1974-1994.
|
1 |
Five Cubits, Inc. (formerly BMG Seltec), a software company; Lewis and Clark College, Portland, OR
|
||||
|
John W. Mitchell
Lake Oswego, OR
(1944)
|
Trustee since 1999
|
Principal of M & H Economic Consultants; Economist, Western Region, for U .S . Bancorp 1998-2007; Chief Economist, U .S . Bancorp, Portland, Oregon, 1983-1998; member, Oregon Governor’s Council of Economic Advisors, 1984-1998; Chairman, Oregon Governor’s Technical Advisory Committee for Tax Review in 1998.
|
1 |
Oregon Mutual Insurance; Western Capital Corporation; Northwest Bank.
|
||||
|
Ralph R. Shaw
Portland, OR
(1938)
|
Trustee since 2000
|
President, Shaw Management Company, an investment counseling firm, 1980-present; General Partner, Shaw Venture Partners, 1983-2005; Shaw Venture Partners II, 1987-2005; and Shaw Venture Partners III, 1994-2005.
|
1 |
Schnitzer Steel Industries, Inc., Telestream, Inc., Five Cubits, Inc. (formerly BMG Seltec), a software company, Rentrak Corporation, One-to-One Interactive, Optimum Energy Co.
|
38 | Tax-Free Trust of Oregon
|
Number of
|
||||||||
|
Positions
|
Portfolios
|
|||||||
|
Held with
|
in Fund
|
|||||||
|
Name,
|
Trust and
|
Principal
|
Complex(4)
|
Other Directorships
|
||||
|
Address(2)
|
Length of
|
Occupation(s)
|
Overseen
|
Held by Trustee
|
||||
|
and Year of Birth
|
Service(3)
|
During Past 5 Years
|
by Trustee
|
During Past 5 Years
|
||||
|
Nancy Wilgenbusch
Marylhurst, OR
(1947)
|
Trustee since 2002
|
President Emerita since 2008 and President 1984-2008, Marylhurst University; member, former Chair, Portland Branch of the Federal Reserve Bank of San Francisco; active board member of a number of civic organizations.
|
1 | West Coast Bank; Cascade Corporation, a leading international manufacturer of lift truck attachments |
|
Positions
|
||||
|
Held with
|
||||
|
Name,
|
Trust and
|
|||
|
Address(1)
|
Length of
|
|||
|
and Year of Birth
|
Service(2)
|
Principal Occupation(s) During Past 5 Years
|
||
|
Trustees Emeritus(7)
|
||||
|
Vernon R. Alden
Boston, MA
(1923)
|
Trustee Emeritus since 2006
|
Retired; former director or trustee of various Fortune 500 companies, including Colgate-Palmolive and McGraw Hill; formerly President of Ohio University and Associate Dean of the Harvard University Graduate School of Business Administration; Trustee, Aquila Narragansett Tax-Free Income Fund, 1992-2006, Tax-Free Trust of Oregon, 1988-2001, Hawaiian Tax-Free Trust, 1989-2001, and Pacific Capital Funds of Cash Assets Trust (three Aquila money-market funds, consisting of Pacific Capital Cash Assets Trust, Pacific Capital Tax-Free Cash Assets Trust and Pacific Capital U .S . Government Securities Cash Assets Trust), 1989-2001; Trustee Emeritus, Aquila Narragansett Tax-Free Income Fund since 2006; member of several Japan-related advisory councils, including Chairman of the Japan Society of Boston; trustee of various cultural, educational and civic organizations.
|
||
|
David B. Frohnmayer
Eugene, OR
(1940)
|
Trustee Emeritus since 2003
|
President Emeritus and formerly President (1994-2009), University of Oregon; former Dean of the University of Oregon Law School and former Attorney General of the State of Oregon; Trustee, Tax-Free Trust of Oregon, 1997-2003.
|
||
|
Patricia L. Moss
Bend, OR
(1953)
|
Trustee Emerita since 2005
|
President and Chief Executive Officer, Cascade Bancorp and Bank of the Cascades since 1998; Director, Cascade Bancorp; Director, MDU Resources; Trustee, Tax-Free Trust of Oregon, 2002-2005; active in community and educational organizations.
|
39 | Tax-Free Trust of Oregon
|
Positions
|
||||
|
Held with
|
||||
|
Name,
|
Trust and
|
|||
|
Address(1)
|
Length of
|
|||
|
and Year of Birth
|
Service(2)
|
Principal Occupation(s) During Past 5 Years
|
||
|
Officers
|
||||
|
Charles E. Childs, III
New York, NY
(1957)
|
Executive Vice President since 2003 and Secretary since 2011
|
Executive Vice President of all funds in the Aquila Group of Funds and the Manager and the Manager’s parent since 2003; Chief Operating Officer of the Manager and the Manager’s parent since 2008; Secretary of all funds in the Aquila Group of Funds since 2011; formerly Senior Vice President, corporate development, Vice President, Assistant Vice President and Associate of the Manager’s parent since 1987; Executive Vice President, Senior Vice President, Vice President or Assistant Vice President of the Aquila money-market funds, 1988-2012.
|
||
|
Marie E. Aro
Denver, CO
(1955)
|
Senior Vice President since 2010
|
Co-President of the Distributor since 2010, Vice President, 1993-1997; Senior Vice President, Aquila Three Peaks Opportunity Growth Fund since 2004; Senior Vice President, Tax-Free Trust of Arizona since 2010 and Vice President, 2004-2010; Senior Vice President, Aquila Three Peaks High Income Fund since 2006; Senior Vice President, Churchill Tax-Free Fund of Kentucky, Hawaiian Tax-Free Trust, Aquila Narragansett Tax-Free Income Fund, Tax-Free Fund For Utah, Tax-Free Fund of Colorado and Tax-Free Trust of Oregon since 2010; Vice President, INVESCO Funds Group, 1998-2003.
|
||
|
Paul G. O’Brien
Charlotte, NC
(1959)
|
Senior Vice President since 2010
|
Co-President, Aquila Distributors, Inc. since 2010, Managing Director, 2009-2010; Senior Vice President of Aquila Three Peaks High Income Fund, Aquila Three Peaks Opportunity Growth Fund, and each of the Aquila Municipal Bond Funds since 2010; held various positions to Senior Vice President and Chief Administrative Officer of Evergreen Investments Services, Inc ., 1997-2008; Mergers and Acquisitions Coordinator for Wachovia Corporation, 1994-1997.
|
||
|
Christine L. Neimeth
Portland, OR
(1964)
|
Vice President since 1998
|
Vice President of Aquila Three Peaks Opportunity Growth Fund and Tax-Free Trust of Oregon.
|
||
|
Randall S. Fillmore
New York, NY
(1960)
|
Chief Compliance Officer since 2012
|
Chief Compliance Officer of each fund in the Aquila Group of Funds, the Manager and the Distributor since 2012; Managing Director, Fillmore & Associates, 2009-2012; Fund and Adviser Chief Compliance Officer (2002-2009), Senior Vice President - Broker Dealer Compliance (2004-2009), Schwab Funds Anti Money Laundering Officer and Identity Theft Prevention Officer (2004-2009), Vice President - Internal Audit (2000-2002), Charles Schwab Corporation; National Director, Information Systems Risk Management - Consulting Services (1999-2000), National Director, Investment Management Audit and Business Advisory Services (1992-1999), Senior Manager, Manager, Senior and Staff Roles (1983-1992), PricewaterhouseCoopers LLP.
|
40 | Tax-Free Trust of Oregon
|
Positions
|
||||
|
Held with
|
||||
|
Name,
|
Trust and
|
|||
|
Address(1)
|
Length of
|
|||
|
and Year of Birth
|
Service(2)
|
Principal Occupation(s) During Past 5 Years
|
||
|
Joseph P. DiMaggio
New York, NY
(1956)
|
Chief Financial Officer since 2003 and Treasurer since 2000
|
Chief Financial Officer of each fund in the Aquila Group of Funds since 2003 and Treasurer since 2000.
|
||
|
Yolonda S. Reynolds
New York, NY
(1960)
|
Assistant Treasurer since 2010
|
Assistant Treasurer of each fund in the Aquila Group of Funds since 2010; Director of Fund Accounting for the Aquila Group of Funds since 2007; Investment Accountant, TIAA-CREF, 2007; Senior Fund Accountant, JP Morgan Chase, 2003-2006.
|
||
|
Lori A. Vindigni
New York, NY
(1966)
|
Assistant Treasurer since 2000
|
Assistant Treasurer of each fund in the Aquila Group of Funds since 2000; Assistant Vice President of the Manager or its predecessor and current parent since 1998; Fund Accountant for the Aquila Group of Funds, 1995-1998.
|
________________
(1) The Trust’s Statement of Additional Information includes additional information about the Trustees and officers and is available, without charge, upon request by calling 800-437-1020 (toll-free) or by visiting www .aquilafunds .com or the EDGAR Database at the SEC’s internet site at www .sec .gov .
(2) The mailing address of each Trustee and officer is c/o Tax-Free Trust of Oregon, 380 Madison Avenue, Suite 2300, New York, NY 10017.
(3) Each Trustee holds office until the next annual meeting of shareholders or until his or her successor is elected and qualifies. The term of office of each officer is one year.
(4) Includes certain Aquila-sponsored funds that are dormant and have no public shareholders.
(5) Ms. Herrmann is an interested person of the Trust as an officer of the Trust, as a director, officer and shareholder of the Manager’s corporate parent, as an officer and Manager of the Manager, and as a shareholder and director of the Distributor. Ms. Herrmann is the daughter of Lacy B . Herrmann, the Founder and former Trustee, Chairman and Chairman Emeritus of the Trust.
(6) The “Aquila Group of Funds” includes: Tax-Free Trust of Arizona, Tax-Free Fund of Colorado, Hawaiian Tax-Free Trust, Churchill Tax-Free Fund of Kentucky, Tax-Free Trust of Oregon, Aquila Narragansett Tax-Free Income Fund (Rhode Island) and Tax-Free Fund For Utah, each of which is a tax-free municipal bond fund and are called the “Aquila Municipal Bond Funds”; Aquila Three Peaks Opportunity Growth Fund, which is an equity fund; and Aquila Three Peaks High Income Fund, which is a high-income corporate bond fund.
(7) A Trustee Emeritus may attend Board meetings but has no voting power.
41 | Tax-Free Trust of Oregon
Analysis of Expenses (unaudited)
As a shareholder of the Trust, you may incur two types of costs: (1) transaction costs, including front-end sales charges with respect to Class A shares or contingent deferred sales charges (“CDSC”) with respect to Class C shares; and (2) ongoing costs, including management fees; distribution and/or service (12b-1) fees; and other Trust expenses. The table below is intended to help you understand your ongoing costs (in dollars) of investing in the Trust and to compare these costs with the ongoing costs of investing in other mutual funds.
The table below is based on an investment of $1,000 invested on April 1, 2012 and held for the six months ended September 30, 2012.
Actual Expenses
This table provides information about actual account values and actual expenses. You may use the information provided in this table, together with the amount you invested, to estimate the expenses that you paid over the period. To estimate the expenses you paid on your account, divide your ending account value by $1,000 (for example, an $8,600 ending account value divided by $1,000 = 8.6), then multiply the result by the number under the heading “Expenses Paid During the Period”.
Six months ended September 30, 2012
|
Actual
|
||||
|
Total Return
|
Beginning
|
Ending
|
Expenses
|
|
|
Without
|
Account
|
Account
|
Paid During
|
|
|
Sales charges(1)
|
Value
|
Value
|
the Period(2)
|
|
|
Class A
|
3.95%
|
$1,000.00
|
$1,039.50
|
$3.72
|
|
Class C
|
3.52%
|
$1,000.00
|
$1,035.20
|
$8.04
|
|
Class Y
|
3.94%
|
$1,000.00
|
$1,039.40
|
$2.96
|
|
(1)
|
Assumes reinvestment of all dividends and capital gain distributions, if any, at net asset value and does not reflect the deduction of the applicable sales charges with respect to Class A shares or the applicable CDSC with respect to Class C shares. Total return is not annualized, as it may not be representative of the total return for the year.
|
|
(2)
|
Expenses are equal to the annualized expense ratio of 0.73%, 1.58% and 0.58% for the Trust’s Class A, C and Y shares, respectively, multiplied by the average account value over the period, multiplied by 183/366 (to reflect the one-half year period).
|
42 | Tax-Free Trust of Oregon
Analysis of Expenses (unaudited) (continued)
Hypothetical Example for Comparison Purposes
The table below provides information about hypothetical account values and hypothetical expenses based on the actual expense ratio and an assumed rate of return of 5.00% per year before expenses, which is not the Trust’s actual return. The hypothetical account values and expenses may not be used to estimate the actual ending account balance or expenses you paid for the period. You may use the information provided in this table to compare the ongoing costs of investing in the Trust and other mutual funds. To do so, compare this 5.00% hypothetical example relating to the Trust with the 5.00% hypothetical examples that appear in the shareholder reports of other mutual funds.
Please note that the expenses shown in the table below are meant to highlight your ongoing costs only and do not reflect any transactional costs, with respect to Class A shares. The example does not reflect the deduction of CDSC with respect to Class C shares. Therefore, the table is useful in comparing ongoing costs only, and will not help you determine the relative total costs of owning different mutual funds. In addition, if these transaction costs were included, your costs would have been higher.
Six months ended September 30, 2012
|
Hypothetical
|
||||
|
Annualized
|
Beginning
|
Ending
|
Expenses
|
|
|
Total
|
Account
|
Account
|
Paid During
|
|
|
Return
|
Value
|
Value
|
the Period(1)
|
|
|
Class A
|
5.00%
|
$1,000.00
|
$1,021.35
|
$3.69
|
|
Class C
|
5.00%
|
$1,000.00
|
$1,017.10
|
$7.97
|
|
Class Y
|
5.00%
|
$1,000.00
|
$1,022.10
|
$2.93
|
|
(1)
|
Expenses are equal to the annualized expense ratio of 0.73%, 1.58% and 0.58% for the Trust’s Class A, C and Y shares, respectively, multiplied by the average account value over the period, multiplied by 183/366 (to reflect the one-half year period).
|
43 | Tax-Free Trust of Oregon
Shareholder Meeting Results (unaudited)
The Annual Meeting of Shareholders of Tax-Free Trust of Oregon (the “Trust”) was held on April 11, 2012. The holders of shares representing 89% of the total net asset value of the shares entitled to vote were present in person or by proxy. At the meeting, the following matters were voted upon and approved by the shareholders (the resulting votes are presented below).
1. To elect Trustees.
| Dollar Amount of Votes: | |||
|
Trustee
|
For
|
Withheld
|
|
|
Gary C. Cornia
|
$448,086,491
|
$3,267,874
|
|
|
James A. Gardner
|
$446,528,626
|
$4,825,740
|
|
|
Diana P. Herrmann
|
$448,441,529
|
$2,912,837
|
|
|
Edmund P. Jensen
|
$447,688,663
|
$3,665,703
|
|
|
John W. Mitchell
|
$448,074,358
|
$3,280,008
|
|
|
Ralph R. Shaw
|
$446,416,758
|
$4,937,607
|
|
|
Nancy Wilgenbusch
|
$448,364,831
|
$2,989,535
|
|
2. To ratify the selection of Tait, Weller & Baker LLP as the Trust’s independent registered public accounting firm.
|
Dollar Amount of Votes:
|
|||
|
For
|
Against
|
Abstain
|
|
|
$445,094,000
|
$200,977
|
$6,059,390
|
|
44 | Tax-Free Trust of Oregon
Information Available (unaudited)
Much of the information that the funds in the Aquila Group of Funds produce is automatically sent to you and all other shareholders. Specifically, you are routinely sent your Trust’s entire list of portfolio securities twice a year in the semi-annual and annual reports you receive. Additionally, under Trust policies, the Manager publicly discloses the complete schedule of the Trust’s portfolio holdings, as of each calendar quarter, generally by the 15th day after the end of each calendar quarter. Such information remains accessible until the next schedule is made publicly available. You may obtain a copy of the Trust’s portfolio holdings schedule for the most recently completed period by visiting the Trust’s website at www.aquilafunds.com. The Trust may also disclose other portfolio holdings as of a specified date (currently the Trust discloses its five largest holdings and/or sector holdings by value as of the close of the last business day of each calendar month in a posting to its website on approximately the 5th business day following the month end). This information remains on the website until the next such posting. Whenever you wish to see a listing of your Trust’s portfolio other than in your shareholder reports, please check our website at www. aquilafunds.com or call us at 1-800-437-1020.
The Trust additionally files a complete list of its portfolio holdings with the SEC for the first and third quarter ends of each fiscal year on Form N-Q. Forms N-Q are available free of charge on the SEC website at www.sec.gov. You may also review or, for a fee, copy the forms at the SEC’s Public Reference Room in Washington, D.C. or by calling 1-800-SEC-0330.
Proxy Voting Record (unaudited)
The Trust does not invest in equity securities. Accordingly, there were no matters relating to a portfolio security considered at any shareholder meeting held during the 12 months ended June 30, 2012 with respect to which the Trust was entitled to vote. Applicable regulations require us to inform you that the foregoing proxy voting information is available on the SEC website at www.sec.gov.
Federal Tax Status of Distributions (unaudited)
This information is presented in order to comply with a requirement of the Internal Revenue Code. No action on the part of shareholders is required.
For the fiscal year ended September 30, 2012, $16,425,024 of dividends paid by Tax-Free Trust of Oregon, constituting 99.66% of total dividends paid during fiscal 2012, were exempt-interest dividends; and the balance was ordinary income.
Prior to February 15, 2013, shareholders will be mailed the appropriate tax form(s) which will contain information on the status of distributions paid for the 2012 calendar year.
45 | Tax-Free Trust of Oregon
PRIVACY NOTICE (unaudited)
Tax-Free Trust of Oregon
Our Privacy Policy. In providing services to you as an individual who owns or is considering investing in shares of the Trust, we collect certain non-public personal information about you. Our policy is to keep this information strictly safeguarded and confidential, and to use or disclose it only as necessary to provide services to you or as otherwise permitted by law. Our privacy policy applies equally to former shareholders and persons who inquire about the Trust. information We collect. ”Non-public personal information” is personally identifiable financial information about you as an individual or your family. The kinds of non-public personal information we have about you may include the information you provide us on your share purchase application or in telephone calls or correspondence with us, and information about your fund transactions and holdings, how you voted your shares and the account where your shares are held. information We Disclose. We disclose non-public personal information about you to companies that provide necessary services to us, such as the Trust’s transfer agent, distributor, investment adviser or sub-adviser, if any, as permitted or required by law, or as authorized by you. Any other use is strictly prohibited. We do not sell information about you or any of our fund shareholders to anyone.
Non-California Residents: We also may disclose some of this information to another fund in the Aquila Group of Funds (or its service providers) under joint marketing agreements that permit the funds to use the information only to provide you with information about other funds in the Aquila Group of Funds or new services we are offering that may be of interest to you. california Residents Only: In addition, unless you “opt-out” of the following disclosures using the form that was mailed to you under separate cover, we may disclose some of this information to another fund in the Aquila Group of Funds (or its service providers) under joint marketing agreements that permit the funds to use the information only to provide you with information about other funds in the Aquila Group of Funds or new services we are offering that may be of interest to you.
How We Safeguard Your Information. We restrict access to non-public personal information about you to only those persons who need it to provide services to you or who are permitted by law to receive it. We maintain physical, electronic and procedural safeguards to protect the confidentiality of all non-public personal information we have about you.
If you have any questions regarding our Privacy Policy, please contact us at 1-800-437-1020.
Aquila Distributors, Inc.
Aquila Investment Management LLC
This Privacy Policy also has been adopted by Aquila Distributors, Inc. and Aquila Investment Management LLC and applies to all non-public information about you that each of these companies may obtain in connection with services provided to the Trust or to you as a shareholder of the Trust.
46 | Tax-Free Trust of Oregon
(THIS PAGE INTENTIONALLY LEFT BLANK)
(THIS PAGE INTENTIONALLY LEFT BLANK)
Founders
Lacy B. Herrmann (1929-2012)
Aquila Management Corporation, Sponsor
Manager
AQUILA INVESTMENT MANAGEMENT LLC
380 Madison Avenue, Suite 2300
New York, New York 10017
Investment Sub-Adviser
KIRKPATRICK PETTIS CAPITAL MANAGEMENT
2 Centerpointe Drive, Suite 500
Lake Oswego, Oregon 97035
Board of Trustees
James A. Gardner, Chair
Diana P. Herrmann, Vice Chair
Gary C. Cornia
Edmund P. Jensen
John W. Mitchell
Ralph R. Shaw
Nancy Wilgenbusch
Officers
Diana P. Herrmann, President
Charles E. Childs, III, Executive Vice President and Secretary
Marie E. Aro, Senior Vice President
Paul G. O’Brien, Senior Vice President
Christine L. Neimeth, Vice President
Randall S. Fillmore, Chief Compliance Officer
Joseph P. DiMaggio, Chief Financial Officer and Treasurer
Distributor
AQUILA DISTRIBUTORS, INC.
380 Madison Avenue, Suite 2300
New York, New York 10017
Transfer and Shareholder Servicing Agent
BNY MELLON
4400 Computer Drive
Westborough, Massachusetts 01581
Custodian
JPMORGAN CHASE BANK, N.A.
1111 Polaris Parkway
Columbus, Ohio 43240
Independent Registered Public Accounting Firm
TAIT, WELLER & BAKER LLP
1818 Market Street, Suite 2400
Philadelphia, Pennsylvania 19103
Further information is contained in the Prospectus,
which must precede or accompany this report.
|
ITEM 2.
|
CODE OF ETHICS.
|
(a) As of September 30, 2012(the end of the reporting period) the Trust has adopted a code of ethics that applies to the Trust's principal executive officer(s)and principal financial officer(s) and persons performing similar functions ("Covered Officers") as defined in the Aquila Group of Funds Code of Ethics for Principal Executive and Senior Financial Officers under Section 406 of the Sarbanes-Oxley Act of 2002, as amended;
(f)(1) Pursuant to Item 10(a)(1), a copy of the Trust's Code of Ethics that applies to the Trust's principal executive officer(s) and principal financial officer(s) and persons performing similar functions is included as an exhibit to its annual report on this Form N-CSR;
(f)(2) The text of the Trust's Code of Ethics that applies to the Trust's principal executive officer(s) and principal financial officer(s) and persons performing similar functions has been posted on its Internet website which can be found at the Trust's Internet address at www.aquilafunds.com.
|
ITEM 3.
|
AUDIT COMMITTEE FINANCIAL EXPERT.
|
(a)(1)(i) The Registrant's Board of Trustees has determined that Mr. Edmund P, Jensen, a member of its Audit Committee, is an audit committee financial expert. Mr. Jensen is 'independent' as such term is defined in Form N-CSR.
|
ITEM 4.
|
PRINCIPAL ACCOUNTANT FEES AND SERVICES.
|
a) Audit Fees - The aggregate fees billed for professional services rendered by the principal accountant for the audit of the Registrant's annual financial statements were $21,000 in 2011 and $22,500 in 2012.
b) Audit Related Fees - There were no amounts billed for audit-related fees over the past two years.
c) Tax Fees - The Registrant was billed by the principal accountant $3,400 and $3,400 in 2011 and 2012, respectively, for return preparation and tax compliance.
d) All Other Fees - There were no additional fees paid for audit and non-audit services other than those disclosed in a) thorough c) above.
e)(1) Currently, the audit committee of the Registrant pre-approves audit services and fees on an engagement-by-engagement basis
e)(2) None of the services described in b) through d) above were approved by the audit committee pursuant to paragraph (c)(7)(i)(C) of Rule 2-01 of
Regulation S-X, all were pre-approved on an engagement-by-engagement basis.
f) No applicable.
g) There were no non-audit services fees billed by the Registrant's accountant to the Registrant's investment adviser or distributor over the past two years
h) Not applicable.
|
ITEM 5.
|
AUDIT COMMITTEE OF LISTED REGISTRANTS.
|
Not applicable.
|
ITEM 6.
|
SCHEDULE OF INVESTMENTS.
|
Included in Item 1 above
|
ITEM 7.
|
DISCLOSURE OF PROXY VOTING POLICIES AND PROCEDURES FOR CLOSED-END MANAGEMENT INVESTMENT COMPANIES.
|
Not applicable.
|
ITEM 8.
|
PORTFOLIO MANAGERS OF CLOSED-END MANAGEMENT INVESTMENT COMPANIES.
|
Not applicable.
|
ITEM 9.
|
PURCHASES OF EQUITY SECURITIES BY CLOSED-END MANAGEMENT INVESTMENTCOMPANY AND AFFILIATED PURCHASERS.
|
Not applicable.
|
ITEM 10.
|
SUBMISSION OF MATTERS TO A VOTE OF SECURITY HOLDERS.
|
The Board of Directors of the Registrant has adopted a Nominating Committee Charter which provides that the Nominating Committee (the 'Committee') may consider and evaluate nominee candidates properly submitted by shareholders if a vacancy among the Independent Trustees of the Registrant occurs and if, based on the Board's then current size, composition and structure, the Committee determines that the vacancy should be filled. The Committee will consider candidates submitted by shareholders on the same basis as it considers and evaluates candidates recommended by other sources. A copy of the qualifications and procedures that must be met or followed by shareholders to properly submit
a nominee candidate to the Committee may be obtained by submitting a request in writing to the Secretary of the Registrant.
|
ITEM 11.
|
CONTROLS AND PROCEDURES.
|
(a) Based on their evaluation of the registrant's disclosure controls and procedures (as defined in Rule 30a-2(c) under the Investment Company
Act of 1940) as of a date within 90 days of the fling of this report, the registrant's chief financial and executive officers have concluded that the
disclosure controls and procedures of the registrant are appropriately designed to ensure that information required to be disclosed in the registrant's reports that are filed under the Securities Exchange Act of 1934 are accumulated and communicated to registrant's management, including its principal executive officer(s) and principal financial officer(s), to allow timely decisions regarding required disclosure and is recorded,
processed, summarized and reported, within the time periods specified in the rules and forms adopted by the Securities and Exchange Commission.
(b) There have been no significant changes in registrant's internal controls or in other factors that could significantly affect registrant's internal
controls subsequent to the date of the most recent evaluation, including no significant deficiencies or material weaknesses that required corrective action.
|
ITEM 12.
|
EXHIBITS.
|
(a)(1) Aquila Group of Funds Code of Ethics for Principal Executive and Senior Financial Officers under Section 406 of the Sarbanes-Oxley Act
of 2002, as amended.
(a)(2) Certifications of principal executive officer and principal financial officer as required by Rule 30a-2(a) under the Investment Company Act of
1940.
(b) Certifications of principal executive officer and principal financial officer as required by Rule 30a-2(b) under the Investment Company Act of 1940.
SIGNATURES
Pursuant to the requirements of the Securities Exchange Act of 1934 and the Investment Company Act of 1940, the registrant has duly caused this report to be signed on its behalf by the undersigned thereunto duly authorized.
TAX-FREE TRUST OF OREGON
|
By:
|
/s/ Diana P. Herrmann | |
|
Vice Chair, President and Trustee
December 7, 2012
|
||
|
By:
|
/s/ Joseph P. DiMaggio | |
|
Chief Financial Officer
December 7, 2012
|
Pursuant to the requirements of the Securities Exchange Act of 1934 and the Investment Company Act of 1940, this report has been signed below by the following persons on behalf of the registrant and in the capacities and on the dates indicated.
|
By:
|
/s/ Diana P. Herrmann | |
|
Diana P. Herrmann
Vice Chair, President and Trustee
December 7, 2012 |
||
|
By:
|
/s/ Joseph P. DiMaggio | |
|
Joseph P. DiMaggio
Chief Financial Officer and Treasurer
December 7, 2012
|
TAX-FREE TRUST OF OREGON
EXHIBIT INDEX
(a)(1) Aquila Group of Funds Code of Ethics for Principal Executive and Senior Financial Officers under Section 406 of the Sarbanes-Oxley Act
of 2002, as amended.
(a)(2) Certifications of principal executive officer and principal financial officer as required by Rule 30a-2(a) under the Investment Company Act of 1940.
(b) Certification of chief executive officer and chief financial officer as required by Rule 30a-2(b) of the Investment Company Act of 1940.