UNITED STATES
SECURITIES AND EXCHANGE COMMISSION
WASHINGTON, DC 20549
FORM 10-K
(MARK ONE)
FOR THE FISCAL YEAR ENDED DECEMBER 31, 2020
OR
☐ TRANSITION REPORT PURSUANT TO SECTION 13 OR 15(d) OF THE SECURITIES EXCHANGE ACT OF 1934
FOR THE TRANSITION PERIOD FROM ________ TO ________.
COMMISSION FILE NUMBER: 0-14703
(Exact name of registrant as specified in its charter)
(State or other jurisdiction of incorporation or organization) |
(I.R.S. Employer Identification No.) |
(Address of principal executive office) (Zip Code)
(Registrant’s telephone number, including area code) (607 ) 337-2265
Securities registered pursuant to section 12(b) of the Act:
Title of each class |
Trading Symbol(s) |
Name of each exchange on which registered |
Securities registered pursuant to section 12(g) of the Act: None
Indicate by check mark if the registrant is a well-known seasoned issuer, as defined in Rule 405 of the Securities Act. Yes ☒ No ☐
Indicate by check mark if the registrant is not required to file reports pursuant to Section 13 or Section 15(d) of the Act. Yes ☐ No ☒
Indicate by check mark whether the registrant (1) has filed all reports required to be filed by Section 13 or 15(d) of the Securities Exchange Act of 1934 during the preceding 12 months (or for such shorter period that the registrant was required to file such reports) and (2) has been subject to such filing requirements for the past 90 days. Yes ☒ No ☐
Indicate by check mark whether the registrant has submitted electronically every Interactive Data File required to be submitted pursuant to Rule 405 of Regulation S-T (§232.405 of this chapter) during the preceding 12 months (or for such shorter period that the registrant was required to submit and post such files). Yes ☒ No ☐
Indicate by check mark whether the registrant is a large accelerated filer, an accelerated filer, a non-accelerated filer, a smaller reporting company or an emerging growth company. See the definitions of “large accelerated filer,” “accelerated filer,” “smaller reporting company” and “emerging growth company” in Rule 12b-2 of the Exchange Act.
Accelerated filer ☐ |
Non-accelerated filer ☐ |
Smaller reporting company |
Emerging growth company |
If an emerging growth company, indicate by check mark if the registrant has elected not to use the extended transition period for complying with any new or revised financial accounting standards provided pursuant to Section 13(a) of the Exchange Act. ☐
Indicate by check mark whether the registrant has filed a report on and attestation to its management’s assessment of the effectiveness of its internal control over financial reporting under Section 404(b) of the Sarbanes-Oxley Act (15 U.S.C. 7262(b)) by the registered public accounting firm that prepared or issued its audit report. Yes ⌧ No ☐
Indicate by check mark whether the registrant is a shell company (as defined in Rule 12b-2 of the Exchange Act). Yes ☐ No ☒
Based on the closing price of the registrant’s common stock as of June 30, 2020, the aggregate market value of the voting stock, common stock, par value, $0.01 per share, held by non-affiliates of the registrant is $1,302,040,742 .
The number of shares of common stock outstanding as of February 8, 2021, was 43,581,317 .
DOCUMENTS INCORPORATED BY REFERENCE
Portions of the registrant’s definitive Proxy Statement for its Annual Meeting of Stockholders to be held on May 25, 2021 are incorporated by reference into Part III, Items 10, 11, 12, 13 and 14 of this Form 10-K.
NBT BANCORP INC.
FORM 10-K – Year Ended December 31, 2020
PART I |
||
ITEM 1. |
3 |
|
ITEM 1A. |
16 |
|
ITEM 1B. |
25 |
|
ITEM 2. |
26 |
|
ITEM 3. |
27 |
|
ITEM 4. |
27 |
|
PART II |
||
ITEM 5. |
27 |
|
ITEM 6. |
29 |
|
ITEM 7. |
31 |
|
ITEM 7A. |
49 |
|
ITEM 8. |
50 |
|
50 |
||
53 |
||
54 |
||
55 |
||
56 |
||
57 |
||
59 |
||
ITEM 9. |
107 |
|
ITEM 9A. |
107 |
|
ITEM 9B. |
109 |
|
PART III |
||
ITEM 10. |
109 |
|
ITEM 11. |
109 |
|
ITEM 12. |
109 |
|
ITEM 13. |
109 |
|
ITEM 14. |
109 |
|
PART IV |
||
ITEM 15. |
110 |
|
ITEM 16. |
112 |
|
113 |
PART I
| ITEM 1. | BUSINESS |
NBT Bancorp Inc. (the “Company”) is a registered financial holding company incorporated in the state of Delaware in 1986, with its principal headquarters located in Norwich, New York. The Company, on a consolidated basis, at December 31, 2020 had assets of $10.9 billion and stockholders’ equity of $1.2 billion.
The principal assets of the Company consist of all of the outstanding shares of common stock of its subsidiaries, including NBT Bank, National Association (the “Bank”), NBT Financial Services, Inc. (“NBT Financial”), NBT Holdings, Inc. (“NBT Holdings”), CNBF Capital Trust I, NBT Statutory Trust I, NBT Statutory Trust II, Alliance Financial Capital Trust I and Alliance Financial Capital Trust II (collectively, the “Trusts”). The Company’s principal sources of revenue are the management fees and dividends it receives from the Bank, NBT Financial and NBT Holdings.
The Company’s business, primarily conducted through the Bank, consists of providing commercial banking, retail banking and wealth management services primarily to customers in its market area, which includes central and upstate New York, northeastern Pennsylvania, southern New Hampshire, western Massachusetts, Vermont, the southern coastal Maine area and now entering central Connecticut. The Company has been, and intends to continue to be, a community-oriented financial institution offering a variety of financial services. The Company’s business philosophy is to operate as a community bank with local decision-making, providing a broad array of banking and financial services to retail, commercial and municipal customers. The financial condition and operating results of the Company are dependent on its net interest income, which is the difference between the interest and dividend income earned on its earning assets, primarily loans and investments and the interest expense paid on its interest-bearing liabilities, primarily consisting of deposits and borrowings. Among other factors, net income is also affected by provisions for loan losses and noninterest income, such as service charges on deposit accounts, insurance and other financial services revenue, trust revenue and gains/losses on securities sales, bank owned life insurance income, ATM and debit card fees and retirement plan administration fees, as well as noninterest expenses, such as salaries and employee benefits, occupancy, equipment, data processing and communications, professional fees and outside services, office supplies and postage, amortization of intangible assets, loan collection and other real estate owned (“OREO”) expenses, advertising, Federal Deposit Insurance Corporation (“FDIC”) expenses and other expenses.
NBT Bank, N.A.
The Bank is a full service commercial bank formed in 1856, which provides a broad range of financial products to individuals, corporations and municipalities throughout the central and upstate New York, northeastern Pennsylvania, western Massachusetts, southern New Hampshire, Vermont, the southern coastal Maine area and now entering central Connecticut.
Through its network of branch locations, the Bank offers a wide range of products and services tailored to individuals, businesses and municipalities. Deposit products offered by the Bank include demand deposit accounts, savings accounts, negotiable order of withdrawal (“NOW”) accounts, money market deposit accounts (“MMDA”) and certificate of deposit (“CD”) accounts. The Bank offers various types of each deposit account to accommodate the needs of its customers with varying rates, terms and features. Loan products offered by the Bank include indirect and direct consumer loans, home equity loans, mortgages, business banking loans and commercial loans, with varying rates, terms and features to accommodate the needs of its customers. The Bank also offers various other products and services through its branch network such as trust and investment services and financial planning and life insurance services. In addition to its branch network, the Bank also offers access to certain products and services electronically through 24-hour online, mobile and telephone channels that enable customers to check balances, make deposits, transfer funds, pay bills, access statements, apply for loans and access various other products and services.
NBT Financial Services, Inc.
Through NBT Financial Services, the Company operates EPIC Advisors, Inc. (“EPIC”), a retirement plan administrator. Through EPIC, the Company offers services including retirement plan consulting and recordkeeping services. EPIC’s headquarters are located in Rochester, New York.
NBT Holdings, Inc.
Through NBT Holdings, the Company operates NBT Insurance Agency, LLC (“NBT Insurance”), a full-service insurance agency acquired by the Company on September 1, 2008. NBT Insurance’s headquarters are located in Norwich, New York. Through NBT Insurance, the Company offers a full array of insurance products, including personal property and casualty, business liability and commercial insurance, tailored to serve the specific insurance needs of individuals as well as businesses in a range of industries operating in the markets served by the Company.
The Trusts
The Trusts were organized to raise additional regulatory capital and to provide funding for certain acquisitions. CNBF Capital Trust I and NBT Statutory Trust I are Delaware statutory business trusts formed in 1999 and 2005, respectively, for the purpose of issuing trust preferred securities and lending the proceeds to the Company. In connection with the acquisition of CNB Bancorp, Inc., the Company formed NBT Statutory Trust II in February 2006 to fund the cash portion of the acquisition as well as to provide regulatory capital. In connection with the acquisition of Alliance Financial Corporation (“Alliance”), the Company acquired two statutory trusts, Alliance Financial Capital Trust I and Alliance Financial Capital Trust II, which were formed in 2003 and 2006, respectively. The Company guarantees, on a limited basis, payments of distributions on the trust preferred securities and payments on redemption of the trust preferred securities. The Trusts are variable interest entities for which the Company is not the primary beneficiary, as defined by Financial Accounting Standards Board (“FASB”) Accounting Standards Codification (“ASC”). In accordance with ASC, the accounts of the Trusts are not included in the Company’s consolidated financial statements.
Operating Subsidiaries of the Bank
The Bank has four operating subsidiaries, NBT Capital Corp., Broad Street Property Associates, Inc., CNB Realty Trust and NBT Capital Management, Inc. NBT Capital Corp., formed in 1998, is a venture capital corporation. Broad Street Property Associates, Inc., formed in 2004, is a property management company. CNB Realty Trust, formed in 1998, is a real estate investment trust. NBT Capital Management, Inc., formerly Columbia Ridge Capital Management, Inc., was acquired in 2016 and is a registered investment advisor that provides investment management and financial consulting services.
Competition
The financial services industry, including commercial banking, is highly competitive, and we encounter strong competition for deposits, loans and other financial products and services in our market area. The increasingly competitive environment is the result of the continued low rate environment, changes in regulation, changes in technology and product delivery systems, additional financial service providers and the accelerating pace of consolidation among financial services providers. The Company competes for loans, deposits and customers with other commercial banks, savings and loan associations, securities and brokerage companies, mortgage companies, insurance companies, finance companies, money market funds, credit unions and other nonbank financial service providers.
The financial services industry could become even more competitive as a result of legislative, regulatory and technological changes and continued consolidation. Banks, securities firms and insurance companies can merge under the umbrella of a financial holding company, which can offer virtually any type of financial service, including banking, securities underwriting, insurance (both agency and underwriting) and merchant banking. In addition, technology has lowered barriers to entry and made it possible for non-banks to offer products and services traditionally provided by banks, such as automatic transfer and automatic payment systems.
Some of the Company’s nonbanking competitors have fewer regulatory constraints and may have lower cost structures. In addition, some of the Company’s competitors have assets, capital and lending limits greater than that of the Company, have greater access to capital markets and offer a broader range of products and services than the Company. These institutions may have the ability to finance wide-ranging advertising campaigns and may be able to offer lower rates on loans and higher rates on deposits than the Company can offer. Some of these institutions offer services, such as credit cards and international banking, which the Company does not directly offer.
Various in-state market competitors and out-of-state banks continue to enter or have announced plans to enter or expand their presence in the market areas in which the Company currently operates. With the addition of new banking presences within our market, the Company expects increased competition for loans, deposits and other financial products and services.
In order to compete with other financial services providers, the Company stresses the community nature of its banking operations and principally relies upon local promotional activities, personal relationships established by officers, directors and employees with the Company’s customers and specialized services tailored to meet the needs of the communities served. We also offer certain customer services, such as agricultural lending, that many of our larger competitors do not offer. While the Company’s position varies by market, the Company’s management believes that it can compete effectively as a result of local market knowledge, local decision making and awareness of customer needs.
The table below summarizes the Bank’s deposits and market share as June 30, 2020 by the thirty-eight counties of New York, Pennsylvania, New Hampshire, Massachusetts, Vermont and Maine. Market share is based on deposits of all commercial banks, credit unions, savings and loans associations and savings banks.
County |
State |
Deposits in Thousands |
Market Share |
Market Rank |
Number of Branches* |
Number of ATMs* |
|||||||||
Chenango |
NY |
$ |
1,110,475 |
95.32% |
1 |
11 |
12 |
||||||||
Fulton |
NY |
540,377 |
60.76% |
1 |
5 |
6 |
|||||||||
Schoharie |
NY |
243,818 |
45.85% |
1 |
4 |
4 |
|||||||||
Hamilton |
NY |
47,514 |
43.92% |
2 |
1 |
1 |
|||||||||
Montgomery |
NY |
319,921 |
39.70% |
2 |
5 |
4 |
|||||||||
Cortland |
NY |
304,270 |
38.50% |
1 |
4 |
7 |
|||||||||
Otsego |
NY |
421,370 |
34.47% |
1 |
8 |
11 |
|||||||||
Essex |
NY |
254,229 |
29.62% |
2 |
3 |
4 |
|||||||||
Delaware |
NY |
295,906 |
28.97% |
2 |
5 |
5 |
|||||||||
Madison |
NY |
256,339 |
26.64% |
2 |
5 |
8 |
|||||||||
Susquehanna |
PA |
204,932 |
17.74% |
2 |
5 |
7 |
|||||||||
Broome |
NY |
563,548 |
17.11% |
2 |
7 |
9 |
|||||||||
Oneida |
NY |
641,648 |
15.54% |
2 |
6 |
9 |
|||||||||
St. Lawrence |
NY |
200,690 |
14.22% |
4 |
4 |
4 |
|||||||||
Pike |
PA |
91,834 |
11.85% |
4 |
2 |
2 |
|||||||||
Oswego |
NY |
171,621 |
10.94% |
4 |
4 |
6 |
|||||||||
Herkimer |
NY |
79,353 |
10.34% |
4 |
1 |
1 |
|||||||||
Wayne |
PA |
135,175 |
8.32% |
4 |
3 |
4 |
|||||||||
Clinton |
NY |
129,494 |
8.32% |
5 |
2 |
2 |
|||||||||
Tioga |
NY |
39,812 |
7.76% |
5 |
1 |
1 |
|||||||||
Lackawanna |
PA |
493,168 |
7.27% |
6 |
11 |
16 |
|||||||||
Schenectady |
NY |
240,373 |
7.26% |
5 |
2 |
2 |
|||||||||
Franklin |
NY |
36,992 |
6.35% |
4 |
1 |
1 |
|||||||||
Warren |
NY |
115,353 |
4.63% |
4 |
2 |
2 |
|||||||||
Onondaga |
NY |
587,599 |
4.59% |
6 |
10 |
12 |
|||||||||
Saratoga |
NY |
208,087 |
3.67% |
8 |
4 |
5 |
|||||||||
Cheshire |
NH |
63,401 |
3.28% |
7 |
1 |
1 |
|||||||||
Chittenden |
VT |
171,017 |
3.21% |
7 |
3 |
4 |
|||||||||
Monroe |
PA |
92,679 |
2.87% |
8 |
3 |
3 |
|||||||||
Berkshire |
MA |
132,282 |
2.52% |
7 |
5 |
5 |
|||||||||
Albany |
NY |
329,044 |
1.70% |
9 |
4 |
5 |
|||||||||
Greene |
NY |
35,235 |
1.65% |
6 |
1 |
1 |
|||||||||
Rensselaer |
NY |
32,043 |
1.30% |
11 |
1 |
1 |
|||||||||
Luzerne |
PA |
90,063 |
1.28% |
13 |
3 |
5 |
|||||||||
Hillsborough |
NH |
118,775 |
0.77% |
13 |
2 |
2 |
|||||||||
Rutland |
VT |
8,355 |
0.75% |
10 |
- |
1 |
|||||||||
Cumberland |
ME |
35,669 |
0.28% |
15 |
1 |
1 |
|||||||||
Rockingham |
NH |
16,305 |
0.17% |
24 |
- |
1 |
|||||||||
Merrimack |
NH |
- |
- |
- |
1 |
1 |
|||||||||
$ |
8,858,766 |
- |
- |
141 |
176 |
||||||||||
Source: S&P Global Market Intelligence
* Branch and ATM data is as of December 31, 2020.
Data Privacy and Security Practices
The Company’s enterprise security strategy revolves around people, processes and technology. The Company employs a defense in depth strategy, which combines physical control measures with logical control measures and uses a layered security model to provide end-to-end security of Company and client information. The high-level objective of the information security program is to protect the confidentiality, integrity and availability of all information assets in our environment. We accomplish this by building our program around six foundational control areas: program oversight and governance, safeguards and controls, security awareness training, service provider oversight, incident response and business continuity. The Company’s data security and privacy practices are in compliance with all applicable laws and regulations including the Gramm-Leach Bliley Act of 2001 (“GLBA”) and applicable privacy laws described under the heading Supervision and Regulation in this Item 1. Business section.
The controls identified in our enterprise security program are managed by various stakeholders throughout the Company and monitored by the information security team. All employees are required to complete information security and privacy training when they join the Company and then complete annual online training certification and ad hoc face to face trainings. The Company engages outside consultants to perform periodic audits of our information and data security controls and processes including penetration testing of the Company’s public facing websites and corporate networks. The Board of Directors requires the Company’s Information Security Officer to report to them the status of the overall information security and data privacy program on a recurring basis. More information can be located on the Company’s website https://www.nbtbank.com/Personal/Customer-Support/Fraud-Information-Center.
Human Capital Resources
Diversity, Equity and Inclusion
We have enhanced the visibility and structure of our long-standing commitment to diversity, equity and inclusion (“DEI”). Our Chief Diversity Officer has placed a high level of focus on relevant and impactful DEI initiatives by building upon our strong cultural foundation. The Company has implemented a variety of initiatives from being transparent by posting our diversity values on our website to providing forums to listen more closely to what our employees want to say. A company-wide DEI Round Table was formed to gain input from many voices. The Round Table’s accomplishments include broader internal communications on a variety of inclusion topics, the creation of an internal mentoring program, and a survey to capture employee opinions regarding DEI at NBT. The Company has a DEI steering committee comprised of members of the executive team, including the Chief Executive Officer. The plan is shared with our Board of Directors, management and employees, who are often included in implementing specific action items.
The Company developed a purpose statement to support the DEI initiative, which states that the Company strives to create an environment that is open and welcoming to all, leading to high employee engagement and job performance. We believe this will enable the Company to outperform its peers, ensure high levels of shareholder return and provide for financial independence. We strive to ensure our executives are demonstrating the highest ethical leadership, are approachable and inspire trust. More information can be located on the Company’s website at https://www.nbtbank.com/Personal/About-Us/Our-Bank/Diversity-and-Inclusion.
Investment in Our People
The Company’s focus on investing in our people includes key initiatives to attract, develop and retain our valued employees. Talent management is a top priority as specific competencies are predicted to be in short supply with the transition of retirement age skill sets.
The coronavirus (“COVID-19”) pandemic had a significant effect on the nature of our workplace. Implementing remote and hybrid work options has been attractive to many people and we expect it will continue. Many programs were implemented during the pandemic including self-care time off, pay for those in quarantine or with childcare needs, flexibility with paid time off policies and providing resources through care.com. Our employee retention rate remains at historically high levels which results in greater customer satisfaction and continuity of service. The Company offers total rewards that address employees at various stages of their personal lives and careers, including a student loan repayment program, paid parental leave, more flexibility in paid time off and a retirement transition option. The Company’s incentive programs recognize all full-time employees at all levels and are designed to motivate employees to support achievement of company success, with appropriate risk assessment and prevention measures designed to prevent fraud.
Learning and Career Development
The Company focuses on the future by encouraging and promoting internal development. During the pandemic, emphasis was placed on digital learning and connecting our employees with online resources. We invested in eLearning with a goal of providing resources to those working and leading in remote environments. We continue to have four distinct training and development programs that address and encourage development and foster retention. We have doubled the number of programs for both our high potential and emerging leaders programs, adapting the formats to remote learning utilizing our Microsoft Teams technology. Our management development program, modified for hybrid work, aims at attracting key external talent, particularly through benefit programs such as financial education, tuition repayment, graduate school tuition assistance and flexible work arrangements. The management development program has placed many graduates in key positions where they have made significant contributions. Our professional development programs provide an entry point for early career professionals. This programs provide an overview of banking functions over a 12-18 month period, ultimately placing employees with working knowledge in positions of responsibility around the Company. In addition, employees have access to career paths and career exploration programs throughout the Company’s business areas, supported by individual development plans and internal learning management system resources. To support this process, we employ an internal career counselor to work as a liaison with employees and managers to direct their personal career aspirations. The Company also has a robust talent review and succession process. Significant time is spent at the Board and Management level identifying and providing development for potential successors.
Engaging Employees
The Company seeks to further refine its workforce programs through its employee engagement survey. Numerous surveys were conducted during the last 12 months to understand employee well-being, attitudes about remote work, productivity and work-life balance and overall concerns. Based on the most recent survey, additional resources were deployed in the areas of technology, equipment and employee wellness. The extensive planning of the Company’s technology roadmap included the prepandemic implementation of Office 365 including Teams, allowing effective meetings and collaboration of work across our geography with little downtime. The Company believes our engaged employees will drive retention and effort, ultimately correlating to a better experience for our customers.
Conduct and Ethics
The board of directors and senior management have vigorously endorsed a no-tolerance stance for workplace harassment, biases and unethical behavior. The Company’s values-based Code of Business Conduct and Ethics is extensively communicated on our website and targeted internal communications platforms. Frequent training specific to managers and employees, regular publication of our whistleblower policy and reporting mechanisms provide framework to the Company’s motto of: “The right people. Doing the right things. In the right way.”
Community Engagement
The Company is engaged in the communities where we do business and where our employees and directors live and work. We live out our core value of community involvement through investments of both money and the time of our employees.
Through our active contribution program, administered by market-based committees with representation from all lines of business, the Company contributed over $1.4 million in 2020. Our teams’ efforts to distribute philanthropic resources across our footprint ensure alignment with local needs and support for hundreds of organizations that provide health and human services and promote education, affordable housing, economic development, the arts and agriculture.
A consistent way that the Company and our employees support our communities across our markets is through giving to United Way chapters in the form of corporate pledges and employee campaign contributions. In 2020, these commitments resulted in over $350,000 in funding for United Way chapters that provide resources to local organizations offering critical education, financial, food security and health services.
In addition to corporate financial support of community organizations and causes, employees are encouraged and empowered to volunteer and be a resource in their communities. They invest their financial and other expertise as board members and serve in roles where they offer direct support to those in need by engaging in all manner of volunteer activities. New employees participate in an onboarding experience that includes a community service activity.
Products
The Company offers a comprehensive array of financial products and services with options that are beneficial to low and moderate income individuals. Deposit accounts include low balance savings and checking options that features no monthly service fees, provide assistance rebuilding positive checking relationships, and assistance for those with development disabilities. An enhanced digital banking platform incorporates ready access to current credit score information and a personal financial management tool for budget and expense tracking.
The Company is focused on making home ownership accessible to everyone in the communities we serve. Our suite of home lending products features innovative and flexible options, including government guaranteed programs like Federal Housing Administration (“FHA”) and U.S. Department of Veterans Affairs (“VA”) loans as well as programs developed in-house like our First Home Loan, Habitat for Humanity, Home in the City and Portfolio 97 programs. Our home lending team includes affordable housing loan originators, and we maintain longstanding relationships with affordable housing agency partners across our banking footprint that offer first-time homebuyer education programs and assistance with down payments and closing costs.
Environmental
The Company offers a financing product to homeowners on a national basis which provides an opportunity to power their homes with sustainable solar energy. It allows households to reduce their carbon footprint at an affordable price. Services like mobile and online banking, remote deposit capture, eStatements and combined statements enable us to support all customers in their efforts to consume less fuel and paper. We continue to digitize loan origination processes, reducing trips to the bank and paper documents for our customers. Across our footprint, we host community shred days with multiple confidential document destruction companies to promote safe document disposal and recycling.
The Company is focused on the environment and committed to business practices and activities that encourage sustainability and minimize our environmental impact. In larger facilities, the Company conserves energy through the use of building energy management systems and motion sensor lighting controls. In new construction and renovations, the Company incorporates high-efficiency mechanical equipment, LED lighting, and modern building techniques to reduce our carbon footprint wherever possible. The Company has an ongoing initiative to replace existing lighting with LED lighting to reduce energy consumption.
Supervision and Regulation
The Company, the Bank and certain of its non-banking subsidiaries are subject to extensive regulation under federal and state laws. The regulatory framework applicable to bank holding companies and their subsidiary banks is intended to protect depositors, federal deposit insurance funds and the stability of the U.S. banking system. This system is not designed to protect equity investors in bank holding companies, such as the Company.
Set forth below is a summary of the significant laws and regulations applicable to the Company and its subsidiaries. The description that follows is qualified in its entirety by reference to the full text of the statutes, regulations and policies that are described. Such statutes, regulations and policies are subject to ongoing review by Congress and state legislatures and federal and state regulatory agencies. A change in any of the statutes, regulations or regulatory policies applicable to the Company and its subsidiaries could have a material effect on the results of the Company.
In addition to the summary below, as a result of the COVID-19 pandemic, the U.S. federal and state bank regulators issued several letters and other guidance to bank holding companies and banks regarding expectations for supporting the community and certain related temporary regulatory changes and accommodations. The Company continues to monitor guidance and developments related to COVID-19.
Overview
The Company is a registered bank holding company and financial holding company under the Bank Holding Company Act of 1956, as amended (the “BHC Act”), and is subject to the supervision of, and regular examination by, the Board of Governors of the Federal Reserve System (the “Federal Reserve Board” or “FRB”) as its primary federal regulator. The Company is also subject to the jurisdiction of the Securities and Exchange Commission (“SEC”) and is subject to the disclosure and other regulatory requirements of the Securities Act of 1933, as amended, and the Securities Exchange Act of 1934, as amended (the “Exchange Act”), as administered by the SEC. The Company’s common stock is listed on the NASDAQ Global Select market under the ticker symbol, “NBTB,” and the Company is subject to the NASDAQ stock market rules.
The Bank is chartered as a national banking association under the National Bank Act. The Bank is subject to the supervision of, and to regular examination by, the Office of the Comptroller of the Currency (“OCC”) as its chartering authority and primary federal regulator. The Bank is also subject to the supervision and regulation, to a limited extent, of the FDIC as its deposit insurer. Financial products and services offered by the Company and the Bank are subject to federal consumer protection laws and implementing regulations promulgated by the Consumer Financial Protection Bureau (“CFPB”). The Company and the Bank are also subject to oversight by state attorneys general for compliance with state consumer protection laws. The Bank’s deposits are insured by the FDIC up to the applicable deposit insurance limits in accordance with FDIC laws and regulations. The non-bank subsidiaries of the Company and the Bank are subject to federal and state laws and regulations, including regulations of the FRB and the OCC, respectively.
Since the enactment of the Dodd-Frank Wall Street Reform and Consumer Protection Act of 2010 (the “Dodd-Frank Act”), U.S. banks and financial services firms have been subject to enhanced regulation and oversight. The Trump administration and its appointees to the federal banking agencies enacted some legislation and took other steps to modify and scale back portions of the Dodd-Frank Act and certain of its implementing regulations. It is not clear at this time what the effect on the Company would be of any legislation or regulatory changes that may be enacted or implemented by the Biden administration, though major changes are not expected in the near term.
The CARES Act and Initiatives Related to COVID-19
In response to the COVID-19 pandemic, the Coronavirus Aid, Relief and Economic Security Act (“CARES Act”) was signed into law on March 27, 2020 to provide national emergency economic relief measures. Many of the CARES Act’s programs are dependent upon the direct involvement of U.S. financial institutions, such as the Company and the Bank, and have been implemented through rules and guidance adopted by federal departments and agencies, including the U.S. Department of Treasury, the Federal Reserve and other federal banking agencies, including those with direct supervisory jurisdiction over the Company and the Bank. Furthermore, as the ongoing COVID-19 pandemic evolves, federal regulatory authorities continue to issue additional guidance with respect to the implementation, lifecycle, and eligibility requirements for the various CARES Act programs as well as industry-specific recovery procedures for the COVID-19 pandemic. In addition, it is possible that Congress will enact supplementary COVID-19 response legislation, including amendments to the CARES Act or new bills comparable in scope to the CARES Act. The Company continues to assess the impact of the CARES Act and other statutes, regulations and supervisory guidance related to the COVID-19 pandemic.
Paycheck Protection Program
Section 1102 of the CARES Act created the Paycheck Protection Program (“PPP”), a program administered by the Small Business Administration (“SBA”) to provide loans to small businesses for payroll and other basic expenses during the COVID-19 pandemic. The Company has participated in the PPP as a lender. These loans are eligible to be forgiven if certain conditions are satisfied and are fully guaranteed by the SBA. Additionally, loan payments are deferred for the first six months of the loan term. The PPP commenced on April 3, 2020 and was available to qualified borrowers through August 8, 2020. No collateral or personal guarantees were required. Neither the government nor lenders are permitted to charge the recipients any fees. It is anticipated that additional revisions to the SBA’s interim final rules on forgiveness and loan review procedures will be forthcoming to address these and related changes. On December 27, 2020, the President signed into law omnibus federal spending and economic stimulus legislation titled the “Consolidated Appropriations Act” that included the Economic Aid to Hard-Hit Small Businesses, Nonprofits, and Venues Act (the “HHSB Act”). Among other things, the HHSB Act renewed the PPP, allocating $284.45 billion for both new first time PPP loans under the existing PPP and the expansion of existing PPP loans for certain qualified, existing PPP borrowers. In addition to extending and amending the PPP, the HHSB Act also creates a new grant program for “shuttered venue operators.” As a participating lender in the PPP, the Bank continues to monitor legislative, regulatory, and supervisory developments related thereto, including the most recent changes implemented by the HHSB Act.
Guidance on Non-TDR Loan Modifications due to COVID-19
On March 22, 2020, a statement was issued by our banking regulators and titled the “Interagency Statement on Loan Modifications and Reporting for Financial Institutions Working with Customers Affected by the Coronavirus” (the “Interagency Statement”) that encourages financial institutions to work prudently with borrowers who are or may be unable to meet their contractual payment obligations due to the effects of COVID-19. Additionally, Section 4013 of the CARES Act further provides that a qualified loan modification is exempt by law from classification as a troubled debt restructuring (“TDR”) as defined by generally accepted accounting principles in the United States of America (“GAAP”), from the period beginning March 1, 2020 until the earlier of December 31, 2020 or the date that is 60 days after the date on which the national emergency concerning the COVID-19 outbreak declared by the President of the United States under the National Emergencies Act terminates. Section 541 of the Consolidated Appropriation Act (“CAA”) extends this relief to the earlier of January 1, 2022 or 60 days after the national emergency termination date. The Interagency Statement was subsequently revised in April 2020 to clarify the interaction of the original guidance with Section 4013 of the CARES Act, as well as to set forth the banking regulators’ views on consumer protection considerations. In accordance with such guidance, the Bank is offering short-term modifications made in response to COVID-19 to borrowers who are current and otherwise not past due. These include short-term (180 days or less) modifications in the form of payment deferrals, fee waivers, extensions of repayment terms, or other delays in payment that are insignificant. See Notes 1 and 6 to the consolidated financial statements for further information on non-TDR loan modifications.
Temporary Regulatory Capital Relief Related to Impact of CECL
Concurrent with enactment of the CARES Act, in March 2020, the OCC, the Board of Governors of the Federal Reserve System, and the FDIC published an interim final rule to delay the estimated impact on regulatory capital stemming from the implementation of Accounting Standards Updates 2016-13, Financial Instruments - Credit Losses (Topic 326): Measurement of Credit Losses on Financial Instruments (“CECL”). The interim final rule maintains the three-year transition option in the previous rule and provides banks the option to delay for two years an estimate of CECL’s effect on regulatory capital, relative to the incurred loss methodology’s effect on regulatory capital, followed by a three-year transition period (five-year transition option). The Company is adopting the capital transition relief over the permissible five-year period.
Federal Bank Holding Company Regulation
The Company is a bank holding company as defined by the BHC Act. The BHC Act generally limits the business of the Company to banking, managing or controlling banks and other activities that the FRB has determined to be so closely related to banking “as to be a proper incident thereto.” The Company has also qualified for and elected to be a financial holding company. Financial holding companies may engage in any activity, or acquire and retain the shares of a company engaged in any activity, that is either (1) financial in nature or incidental to such financial activity (as determined by the FRB in consultation with the Secretary of the Treasury), or (2) complementary to a financial activity and that does not pose a substantial risk to the safety and soundness of depository institutions or the financial system (as solely determined by the FRB). If a bank holding company seeks to engage in the broader range of activities permitted under the BHC Act for financial holding companies, (1) the bank holding company and all of its depository institution subsidiaries must be “well-capitalized” and “well-managed,” as defined in the FRB’s Regulation Y and (2) it must file a declaration with the FRB that it elects to be a “financial holding company.” In order for a financial holding company to commence any activity that is financial in nature, incidental thereto, or complementary to a financial activity, or to acquire a company engaged in any such activity permitted by the BHC Act, each insured depository institution subsidiary of the financial holding company must have received a rating of at least “satisfactory” in its most recent examination under the Community Reinvestment Act of 1977 (the “CRA”). See the section titled “Community Reinvestment Act of 1977” for further information relating to the CRA.
Regulation of Mergers and Acquisitions
The BHC Act, the Bank Merger Act and other federal and state statutes regulate acquisitions of depository institutions and their holding companies. The BHC Act requires prior FRB approval for a bank holding company to acquire, directly or indirectly, 5% or more of any class of voting securities of a commercial bank or its parent holding company and for a company, other than a bank holding company, to acquire 25% or more of any class of voting securities of a bank or bank holding company (and sometimes a lower percentage if there are other indications of control). Under the Change in Bank Control Act, any person, including a company, may not acquire, directly or indirectly, control of a bank without providing 60 days’ prior notice and receiving a non-objection from the appropriate federal banking agency.
Under the Bank Merger Act, prior approval of the OCC is required for a national bank to merge with another bank where the national bank is the surviving bank or to purchase the assets or assume the deposits of another bank. In reviewing applications seeking approval of merger and acquisition transactions, the federal banking agencies will consider, among other criteria, the competitive effect and public benefits of the transactions, the capital position of the combined banking organization, the applicant’s performance record under the CRA and the effectiveness of the subject organizations in combating money laundering activities.
As a financial holding company, the Company is permitted to acquire control of non-depository institutions engaged in activities that are financial in nature and in activities that are incidental to financial activities without prior FRB approval. However, the BHC Act, as amended by the Dodd-Frank Act, requires prior written approval from the FRB or prior written notice to the FRB before a financial holding company may acquire control of a company with consolidated assets of $10 billion or more.
Capital Distributions
The principal source of the Company’s liquidity is dividends from the Bank. The OCC oversees the ability of the Bank to make capital distributions, including dividends. The OCC generally prohibits a depository institution from making any capital distributions (including payment of a dividend) or paying any management fee to its parent holding company if the bank would thereafter be undercapitalized. The OCC’s prior approval is required if the total of all dividends declared by a national bank in any calendar year would exceed the sum of the bank’s net income for that year and its undistributed net income for the preceding two calendar years, less any required transfers to surplus. The National Bank Act also prohibits national banks from paying dividends that would be greater than the bank’s undivided profits after deducting statutory bad debt in excess of the bank’s allowance for loan losses.
The federal banking agencies have indicated that paying dividends that deplete a bank’s capital base to an inadequate level would be an unsafe and unsound banking practice and that banking organizations should generally pay dividends only out of current operating earnings. The appropriate federal regulatory authority is authorized to determine, based on the financial condition of a bank holding company or a bank, that the payment of dividends would be an unsafe or unsound practice and to prohibit such payment.
Affiliate and Insider Transactions
Transactions between the Bank and its affiliates, including the Company, are governed by Sections 23A and 23B of the Federal Reserve Act (the “FRA”) and the FRB’s implementing Regulation W. An “affiliate” of a bank includes any company or entity that controls, is controlled by or is under common control with such bank. In a bank holding company context, at a minimum, the parent holding company of a bank and companies that are controlled by such parent holding company, are affiliates of the bank. Generally, Sections 23A and 23B of the FRA are intended to protect insured depository institutions from losses in transactions with affiliates. These sections place quantitative and qualitative limitations on covered transactions between the Bank and its affiliates and require that all transactions between a bank and its affiliates occur on market terms that are consistent with safe and sound banking practices.
Section 22(h) of the FRA and its implementing Regulation O restricts loans to the Bank’s and its affiliates’ directors, executive officers and principal stockholders (“Insiders”). Under Section 22(h), loans to Insiders and their related interests may not exceed, together with all other outstanding loans to such persons and affiliated entities, the Bank’s total capital and surplus. Loans to Insiders above specified amounts must receive the prior approval of the Bank’s board of directors. Further, under Section 22(h) of the FRA, loans to directors, executive officers and principal stockholders must be made on terms substantially the same as offered in comparable transactions to other persons, except that such Insiders may receive preferential loans made under a benefit or compensation program that is widely available to the Bank’s employees and does not give preference to the Insider over the employees. Section 22(g) of the FRA places additional limitations on loans to the Bank’s and its affiliates’ executive officers.
Federal Deposit Insurance and Brokered Deposits
The FDIC’s deposit insurance limit is $250,000 per depositor, per insured bank, for each account ownership category, in accordance with applicable FDIC regulations. The Bank’s deposit accounts are fully insured by the FDIC Deposit Insurance Fund (the “DIF”) up to the deposit insurance limits in accordance with applicable laws and regulations.
The FDIC uses a risk-based assessment system that imposes insurance premiums based upon a risk matrix that takes into account a bank’s capital level and supervisory rating (“CAMELS rating”). The risk matrix uses different risk categories distinguished by capital levels and supervisory ratings. As a result of the Dodd-Frank Act, the base for deposit insurance assessments is the consolidated average assets less average tangible equity. Assessment rates are calculated using formulas that take into account the risk of the institution being assessed.
Under FDIC laws and regulations, no FDIC-insured depository institution can accept brokered deposits unless it is well-capitalized or unless it is adequately capitalized and receives a waiver from the FDIC. Applicable laws and regulations also prohibit any depository institution that is not well-capitalized from paying an interest rate on brokered deposits in excess of three-quarters of one percentage point over certain prevailing market rates.
Under the Federal Deposit Insurance Act (“FDIA”), the FDIC may terminate deposit insurance upon a finding that the institution has engaged in unsafe and unsound practices, is in an unsafe or unsound condition to continue operations or has violated any applicable law, regulation, rule, order or condition imposed by the FDIC. The Bank’s management is not aware of any practice, condition or violation that might lead to the termination of its deposit insurance.
Federal Home Loan Bank System
The Bank is also a member of the Federal Home Loan Bank (“FHLB”) of New York, which provides a central credit facility primarily for member institutions for home mortgage and neighborhood lending. The Bank is subject to the rules and requirements of the FHLB, including the requirement to acquire and hold shares of capital stock in the FHLB in an amount at least equal to the sum of 0.125% of mortgage related assets at the beginning of each year. The Bank was in compliance with FHLB rules and requirements as of December 31, 2020.
Debit Card Interchange Fees
The Dodd-Frank Act requires that any interchange transaction fee charged for a debit transaction be reasonable and proportional to the cost incurred by the issuer for the transaction. FRB regulations mandated by the Dodd-Frank Act limit interchange fees on debit cards to a maximum of 21 cents per transaction plus 5 basis points of the transaction amount. The rule also permits a fraud-prevention adjustment of 1 cent per transaction conditioned upon an issuer developing, implementing and updating reasonably designed fraud-prevention policies and procedures. Issuers that, together with their affiliates, have less than $10 billion of assets, are exempt from the debit card interchange fee standards. In addition, FRB regulations prohibit all issuers, including the Company and the Bank, from restricting the number of networks over which electronic debit transactions may be processed to less than two unaffiliated networks.
In December 2020, the OCC together with the Board of Governors of the Federal Reserve System and the FDIC, issued an interim final rule to temporarily mitigate transition costs related to the COVID-19 pandemic on community banking organizations with less than $10 billion in total assets as of December 31, 2019. The rule allows organizations, including the Company, to use assets as of December 31, 2019, to determine the applicability of various regulatory asset thresholds. During 2020, the Company crossed the $10 billion threshold. However, the Company has elected to delay the regulatory implications of crossing the $10 billion threshold until 2022 for these debit card interchange fee standards.
Source of Strength Doctrine
FRB policy requires bank holding companies to act as a source of financial and managerial strength to their subsidiary banks. Section 616 of the Dodd-Frank Act codifies the requirement that bank holding companies serve as a source of financial strength to their subsidiary depository institutions. A bank holding company’s failure to meet its obligations to serve as a source of strength to its subsidiary banks will generally be considered by the FRB to be an unsafe and unsound banking practice or a violation of FRB regulations or both. As a result, the Company is expected to commit resources to support the Bank, including at times when the Company may not be in a financial position to provide such resources. Any capital loan by the Company to the Bank is subordinate in right of payment to deposits and to certain other indebtedness of such subsidiary banks. The U.S. Bankruptcy Code provides that, in the event of a bank holding company’s bankruptcy, any commitment by the bank holding company to a federal bank regulatory agency to maintain the capital of a subsidiary bank will be assumed by the bankruptcy trustee and entitled to priority of payment.
In addition, under the National Bank Act, if the Bank’s capital stock is impaired by losses or otherwise, the OCC is authorized to require payment of the deficiency by assessment upon the Company. If the assessment is not paid within three months, the OCC could order a sale of Bank stock held by the Company to cover any deficiency.
Capital Adequacy and Prompt Corrective Action
In July 2013, the FRB, the OCC and the FDIC approved final rules (the “Capital Rules”) that established a new capital framework for U.S. banking organizations. The Capital Rules generally implement the Basel Committee on Banking Supervision’s (the “Basel Committee”) December 2010 final capital framework referred to as “Basel III” for strengthening international capital standards. The Capital Rules revise the definitions and the components of regulatory capital, as well as address other issues affecting the numerator in banking institutions’ regulatory capital ratios. The Capital Rules also address asset risk weights and other matters affecting the denominator in banking institutions’ regulatory capital ratios and replace the existing general risk-weighting approach with a more risk-sensitive approach.
The Capital Rules: (1) require a capital measure called “Common Equity Tier 1” (“CET1”) and related regulatory capital ratio of CET1 to risk-weighted assets; (2) specify that Tier 1 capital consists of CET1 and “Additional Tier 1 capital” instruments meeting certain revised requirements; (3) mandate that most deductions/adjustments to regulatory capital measures be made to CET1 and not to the other components of capital; and (4) expand the scope of the deductions from and adjustments to capital as compared to existing regulations. Under the Capital Rules, for most banking organizations, including the Company, the most common form of Additional Tier 1 capital is non-cumulative perpetual preferred stock and the most common forms of Tier 2 capital are subordinated notes and a portion of the allocation for loan losses, in each case, subject to the Capital Rules’ specific requirements.
Pursuant to the Capital Rules, the minimum capital ratios as of January 1, 2015 are:
| ● | 4.5% CET1 to risk-weighted assets; |
| ● | 6.0% Tier 1 capital (CET1 plus Additional Tier 1 capital) to risk-weighted assets; |
| ● | 8.0% Total capital (Tier 1 capital plus Tier 2 capital) to risk-weighted assets; and |
| ● | 4.0% Tier 1 capital to average consolidated assets as reported on consolidated financial statements (known as the “leverage ratio”). |
The Capital Rules also require a “capital conservation buffer,” composed entirely of CET1, on top of these minimum risk-weighted asset ratios. The capital conservation buffer is designed to absorb losses during periods of economic stress. Banking institutions with a ratio of CET1 to risk-weighted assets above the minimum but below the capital conservation buffer will face constraints on dividends, equity and other capital instrument repurchases and compensation based on the amount of the shortfall. The capital conservation buffer was phased in incrementally until when, on January 1, 2019, the capital conservation buffer was fully phased in, resulting in the capital standards applicable to the Company and the Bank including an additional capital conservation buffer of 2.5% of CET1, and effectively resulting in minimum ratios inclusive of the capital conservation buffer of (1) CET1 to risk-weighted assets of at least 7%, (2) Tier 1 capital to risk-weighted assets of at least 8.5% and (3) Total capital to risk-weighted assets of at least 10.5%. The risk-weighting categories in the Capital Rules are standardized and include a risk-sensitive number of categories, depending on the nature of the assets, generally ranging from 0% for U.S. government and agency securities, to 600% for certain equity exposures and resulting in higher risk weights for a variety of asset classes.
The Capital Rules provide for a number of deductions from and adjustments to CET1. These include, for example, the requirement that mortgage servicing rights, deferred tax assets arising from temporary differences that could not be realized through net operating loss carrybacks and significant investments in non-consolidated financial entities be deducted from CET1 to the extent that any one such category exceeds 10% of CET1 or all such items, in the aggregate, exceed 15% of CET1. In November 2017, the FRB finalized a rule extending the then-applicable capital rules for mortgage servicing assets and certain other items for non-advanced approaches institutions and effectively pausing phase-in of related deductions and adjustments.
In addition, under the prior general risk-based capital rules, the effects of accumulated other comprehensive income or loss (“AOCI”) items included in stockholders’ equity (for example, marks-to-market of securities held in the available for sale (“AFS”) portfolio) under GAAP were excluded for the purposes of determining regulatory capital ratios. Under the Capital Rules, the effects of certain AOCI items are not excluded; however, banking organizations not using the advanced approaches, including the Company and the Bank, were permitted to make a one-time permanent election to continue to exclude these items in January 2015. The Capital Rules also preclude certain hybrid securities, such as trust preferred securities issued after May 19, 2010, from inclusion in bank holding companies’ Tier 1 capital.
Management believes that the Company is in compliance, with the targeted capital ratios.
Prompt Corrective Action and Safety and Soundness
Pursuant to Section 38 of the FDIA, federal banking agencies are required to take “prompt corrective action” (“PCA”) should an insured depository institution fail to meet certain capital adequacy standards. At each successive lower capital category, an insured depository institution is subject to more restrictions and prohibitions, including restrictions on growth, restrictions on interest rates paid on deposits, restrictions or prohibitions on payment of dividends and restrictions on the acceptance of brokered deposits. Furthermore, if an insured depository institution is classified in one of the undercapitalized categories, it is required to submit a capital restoration plan to the appropriate federal banking agency and the holding company must guarantee the performance of that plan. Based upon its capital levels, a bank that is classified as well-capitalized, adequately capitalized or undercapitalized, may be treated as though it were in the next lower capital category if the appropriate federal banking agency, after notice and opportunity for hearing, determines that an unsafe or unsound condition or an unsafe or unsound practice, warrants such treatment.
For purposes of PCA, to be: (1) well-capitalized, an insured depository institution must have a total risk based capital ratio of at least 10%, a Tier 1 risk based capital ratio of at least 8%, a CET1 risk based capital ratio of at least 6.5%, and a Tier 1 leverage ratio of at least 5%; (2) adequately capitalized, an insured depository institution must have a total risk based capital ratio of at least 8%, a Tier 1 risk based capital ratio of at least 6%, a CET1 risk based capital ratio of at least 4.5%, and a Tier 1 leverage ratio of at least 4%; (3) undercapitalized, an insured depository institution would have a total risk based capital ratio of less than 8%, a Tier 1 risk based capital ratio of less than 6%, a CET1 risk based capital ratio of less than 4.5%, and a Tier 1 leverage ratio of less than 4%; (4) significantly undercapitalized, an insured depository institution would have a total risk based capital ratio of less than 6%, a Tier 1 risk based capital ratio of less than 4%, a CET1 risk based capital ratio of less than 3%, and a Tier 1 leverage ratio of less than 3%.; (5) critically undercapitalized, an insured depository institution would have a ratio of tangible equity to total assets that is less than or equal to 2%. At December 31, 2020, the Bank qualified as “well-capitalized” under applicable regulatory capital standards.
Bank holding companies and insured depository institutions may also be subject to potential enforcement actions of varying levels of severity by the federal banking agencies for unsafe or unsound practices in conducting their business or for violation of any law, rule, regulation, condition imposed in writing by the agency or term of a written agreement with the agency. In more serious cases, enforcement actions may include the issuance of directives to increase capital; the issuance of formal and informal agreements; the imposition of civil monetary penalties; the issuance of a cease and desist order that can be judicially enforced; the issuance of removal and prohibition orders against officers, directors and other institution−affiliated parties; the termination of the insured depository institution’s deposit insurance; the appointment of a conservator or receiver for the insured depository institution; and the enforcement of such actions through injunctions or restraining orders based upon a judicial determination that the FDIC, as receiver, would be harmed if such equitable relief was not granted.
Volcker Rule
Section 619 of the Dodd-Frank Act, commonly known as the Volcker Rule, restricts the ability of banking entities from: (1) engaging in “proprietary trading” and (2) investing in or sponsoring certain covered funds, subject to certain limited exceptions. Under the Economic Growth, Regulatory Reform and Consumer Protection Act (“EGRRCPA”), depository institutions and their holding companies with less than $10 billion in assets, are excluded from the prohibitions of the Volcker Rule. During 2020, the Company crossed the $10 billion threshold, accordingly, we are subject to the Volcker Rule again. Given the Company’s size and the scope of its activities, the implementation of the Volcker Rule did not have a significant effect on its consolidated financial statements.
Depositor Preference
The FDIA provides that, in the event of the “liquidation or other resolution” of an insured depository institution, the claims of depositors of the institution, including the claims of the FDIC as subrogee of insured depositors and certain claims for administrative expenses of the FDIC as a receiver, will have priority over other general unsecured claims against the institution. If an insured depository institution fails, insured and uninsured depositors, along with the FDIC, will have priority in payment ahead of unsecured, non-deposit creditors, including the parent bank holding company, with respect to any extensions of credit they have made to such insured depository institution.
Consumer Protection and CFPB Supervision
The Dodd-Frank Act centralized responsibility for consumer financial protection by creating the CFPB, an independent agency charged with responsibility for implementing, enforcing and examining compliance with federal consumer financial laws. The Company grew its asset base in excess of $10 billion in 2020. The Company is now subject to the CFPB’s examination authority with regard to compliance with federal consumer financial laws and regulations, in addition to the OCC as the primary regulatory of the Bank. Under the Dodd-Frank Act, state attorneys general are empowered to enforce rules issued by the CFPB.
The Company is subject to federal consumer financial statutes and the regulations promulgated thereunder including, but not limited to:
| ● | the Truth-In-Lending Act, governing disclosures of credit terms to consumer borrowers; |
| ● | the Equal Credit Opportunity Act (“ECOA”), prohibiting discrimination in connection with the extension of credit; |
| ● | the Home Mortgage Disclosure Act (“HMDA”), requiring home mortgage lenders, including the Bank, to make available to the public expanded information regarding the pricing of home mortgage loans, including the “rate spread” between the annual percentage rate and the average prime offer rate for mortgage loans of a comparable type; |
| ● | the Fair Credit Reporting Act (“FCRA”), governing the provision of consumer information to credit reporting agencies and the use of consumer information; and |
| ● | the Fair Debt Collection Practices Act, governing the manner in which consumer debts may be collected by collection agencies. |
The Bank’s failure to comply with any of the consumer financial laws can result in civil actions, regulatory enforcement action by the federal banking agencies and the U.S. Department of Justice.
USA PATRIOT Act
The Bank Secrecy Act (“BSA”), as amended by the Uniting and Strengthening America by Providing Appropriate Tools Required to Intercept and Obstruct Terrorism Act of 2001 (“USA PATRIOT Act”), imposes obligations on U.S. financial institutions, including banks and broker-dealer subsidiaries, to implement policies, procedures and controls which are reasonably designed to detect and report instances of money laundering and the financing of terrorism. Financial institutions also are required to respond to requests for information from federal banking agencies and law enforcement agencies. Information sharing among financial institutions for the above purposes is encouraged by an exemption granted to complying financial institutions from the privacy provisions of the GLBA and other privacy laws. Financial institutions that hold correspondent accounts for foreign banks or provide private banking services to foreign individuals are required to take measures to avoid dealing with certain foreign individuals or entities, including foreign banks with profiles that raise money laundering concerns and are prohibited from dealing with foreign “shell banks” and persons from jurisdictions of particular concern. The primary federal banking agencies and the Secretary of the Treasury have adopted regulations to implement several of these provisions. Since May 11, 2018, the Bank has been required to comply with the Customer Due Diligence Rule, which clarified and strengthened the existing obligations for identifying new and existing customers and explicitly included risk-based procedures for conducting ongoing customer due diligence. All financial institutions also are required to establish internal anti-money laundering programs. The effectiveness of a financial institution in combating money laundering activities is a factor to be considered in any application submitted by the financial institution under the Bank Merger Act. The Company has a BSA and USA PATRIOT Act board-approved compliance program commensurate with its risk profile.
Identity Theft Prevention
The FCRA’s Red Flags Rule requires financial institutions with covered accounts (e.g., consumer bank accounts and loans) to develop, implement and administer an identity theft prevention program. This program must include reasonable policies and procedures to detect suspicious patterns or practices that indicate the possibility of identity theft, such as inconsistencies in personal information or changes in account activity.
Office of Foreign Assets Control Regulation
The United States government has imposed economic sanctions that affect transactions with designated foreign countries, nationals and others. These are typically known as the “OFAC” rules based on their administration by the U.S. Treasury Department Office of Foreign Assets Control (“OFAC”). The OFAC-administered sanctions targeting countries take many different forms. Generally, they contain one or more of the following elements: (1) restrictions on trade with or investment in a sanctioned country, including prohibitions against direct or indirect imports from and exports to a sanctioned country and prohibitions on “U.S. persons” engaging in financial transactions relating to making investments in or providing investment-related advice or assistance to a sanctioned country; and (2) a blocking of assets in which the government or specially designated nationals of the sanctioned country have an interest, by prohibiting transfers of property subject to U.S. jurisdiction (including property in the possession or control of U.S. persons). Blocked assets (property and bank deposits) cannot be paid out, withdrawn, set off or transferred in any manner without a license from OFAC. Failure to comply with these sanctions could have serious legal and reputational consequences.
Financial Privacy and Data Security
The Company and the Bank are subject to federal laws, including the GLBA and certain state laws containing consumer privacy protection provisions. These provisions limit the ability of banks and other financial institutions to disclose nonpublic information about consumers to affiliated and non-affiliated third parties and limit the reuse of certain consumer information received from nonaffiliated financial institutions. These provisions require notice of privacy policies to clients and, in some circumstances, allow consumers to prevent disclosure of certain nonpublic personal information to affiliates or non-affiliated third parties by means of “opt out” or “opt in” authorizations.
The GLBA requires that financial institutions implement comprehensive written information security programs that include administrative, technical and physical safeguards to protect consumer information. Further, pursuant to interpretive guidance issued under the GLBA and certain state laws, financial institutions are required to notify clients of security breaches resulting in unauthorized access to their personal information. The Bank believes it is in compliance with all GLBA obligations.
The Bank is also subject to data security standards, privacy and data breach notice requirements, primarily those issued by the OCC. The federal banking agencies, through the Federal Financial Institutions Examination Council, have adopted guidelines to encourage financial institutions to address cyber security risks and identify, assess and mitigate these risks, both internally and at critical third party services providers.
Community Reinvestment Act of 1977
The Bank has a responsibility under the CRA, as implemented by OCC regulations, to help meet the credit needs of the communities it serves, including low- and moderate-income neighborhoods. The CRA does not establish specific lending requirements or programs for financial institutions nor does it limit an institution’s discretion to develop the types of products and services that it believes are best suited to its particular community, consistent with the CRA. Regulators periodically assess the Bank’s record of compliance with the CRA. The Bank’s failure to comply with the CRA could, at a minimum, result in regulatory restrictions on its activities and the activities of the Company. The Bank’s latest CRA rating was “Satisfactory.”
Future Legislative Initiatives
Congress, state legislatures and financial regulatory agencies may introduce various legislative and regulatory initiatives that could affect the financial services industry, generally. Such initiatives may include proposals to expand or contract the powers of bank holding companies and/or depository institutions or proposals to substantially change the financial institution regulatory system. Such legislation could change banking statutes and the operating environment of the Company in substantial and unpredictable ways. If enacted, such legislation could increase or decrease the cost of doing business, limit or expand permissible activities or affect the competitive balance among banks, savings associations, credit unions and other financial institutions. The Company cannot predict whether any such legislation will be enacted, and, if enacted, the effect that it or any implementing regulations would have on the financial condition or results of operations of the Company. A change in statutes, regulations or regulatory policies applicable to the Company or any of its subsidiaries could have a material effect on the business of the Company.
Employees
At December 31, 2020, the Company had 1,812 full-time equivalent employees. The Company’s employees are not presently represented by any collective bargaining group.
Available Information
The Company’s website is http://www.nbtbancorp.com. The Company makes available free of charge through its website its Annual Reports on Form 10-K, Quarterly Reports on Form 10-Q, Current Reports on Form 8-K and any amendments to those reports as soon as reasonably practicable after such material is electronically filed with or furnished to the SEC pursuant to Section 13(a) or 15(d) of the Exchange Act. We also make available through our website other reports filed with or furnished to the SEC under the Exchange Act, including our proxy statements and reports filed by officers and directors under Section 16(a) of that Act, as well as our Code of Business Conduct and Ethics and other codes/committee charters. The references to our website do not constitute incorporation by reference of the information contained in the website and such information should not be considered part of this document.
This Annual Report on Form 10-K and other reports filed with the SEC are available on the SEC’s website, which contains reports, proxy and information statements and other information regarding issuers that file electronically with the SEC. The SEC’s website address is www.sec.gov.
| ITEM 1A. | RISK FACTORS |
There are risks inherent to the Company’s business. The material risks and uncertainties that management believes affect the Company are described below. Any of the following risks could affect the Company’s financial condition and results of operations and could be material and/or adverse in nature. You should consider all of the following risks together with all of the other information in this Annual Report on Form 10-K.
Risks Related to our Business and Industry
The ongoing coronavirus pandemic is adversely impacting the Company and our customers, counterparties, employees and third-party service providers. Further, the COVID-19 pandemic has led to an economic recession and disruptions in the U.S. economy and may disrupt banking and other financial activity in the areas in which the Company operates and the adverse impacts on our business, financial position, results of operations and prospects could be significant.
The Company’s business is dependent upon the willingness and ability of our employees and customers to conduct banking and other financial transactions. The COVID-19 global public health crisis and the corresponding governmental response have resulted in widespread volatility, severe disruptions in the U.S. economy at large, operational difficulty for many small businesses, and deterioration in household, business, economic and market conditions. The extent of the impact of the COVID-19 pandemic and related responses on our capital, liquidity and other financial positions and on our business, results of operations and prospects will depend on a number of evolving factors, including:
| ● | The duration, extent, and severity of the pandemic. The COVID-19 pandemic does not yet appear to be contained and could affect significantly more households and businesses. The duration and level of severity of the pandemic continue to be unpredictable. |
| ● | The impact on our employees. While we have not experienced a significant impact on the availability of our employees to date, our colleagues remain at risk of being exposed to COVID-19. We have taken meaningful steps and precautions to ensure their health and well-being; however, COVID-19 could still impact our colleagues’ availability to work due to illness, quarantines, government actions, financial center closures or other reasons. If our employees are not able to work as effectively or a substantial number of employees are unable to work due to COVID-19, our business would be adversely affected. |
| ● | The effects on our customers, counterparties, employees and third-party service providers. COVID-19 and its associated consequences and uncertainties may affect individuals, households, and businesses differently and unevenly. In the near-term if not longer, however, our credit, operational and other risks are generally expected to increase. |
| ● | The effects on economies and markets. Whether the actions of governmental and nongovernmental authorities will be successful in mitigating the adverse effects of COVID-19 is unclear. National, regional and local economies and markets could suffer disruptions that are lasting. In addition, governmental actions are meaningfully influencing the interest-rate environment, which could adversely affect our results of operations and financial condition. |
Additionally, if the COVID-19 pandemic has an adverse effect on (1) customer deposits, (2) the ability of our borrowers to satisfy their obligations to us, (3) the demand for our loans or our other products and services, (4) other aspects of our business operations, or (5) on financial markets, real estate markets, or economic growth, this could, depending on the extent of the decline in customer deposits or loan defaults, materially and adversely affect our liquidity and financial condition and our results of operations could be materially and adversely affected.
The Company is unable to fully estimate the impact of the COVID-19 pandemic on our business and operations at this time. The global pandemic may cause us to experience higher credit losses in our lending portfolio, impairment of our goodwill and other financial assets, further reduced demand for our products and services and other negative impacts on our financial position, results of operations and prospects. Sustained adverse effects may also prevent us from satisfying our minimum regulatory capital ratios and other supervisory requirements or result in downgrades in our credit ratings.
Any of the negative impacts of the COVID-19 pandemic, including those described above, alone or in combination with others, may have a material adverse effect on our results of operations, financial condition and cash flows. Any of these negative impacts, alone or in combination with others, could exacerbate many of the risk factors discussed in this Annual Report on Form 10-K. The full extent to which the COVID-19 pandemic will negatively affect our results of operations, financial condition and cash flows will depend on future developments that are highly uncertain and cannot be predicted, including the scope and duration of the pandemic and actions taken by governmental authorities and other third parties in response to the pandemic.
The Company’s active participation in PPP, or in other relief programs, may expose us to credit losses as well as litigation and compliance risk.
To support our customers, businesses, and communities, the Company’s participation in the PPP, and participation in any other relief programs now or in the future, including those under the CARES Act, exposes us to certain credit, compliance, and other risks.
Pursuant to regulatory requirements, PPP loans are subject to forbearance of loan repayment, and if PPP borrowers fail to qualify for loan forgiveness from the SBA, the Company bears the risk of holding these loans at unfavorable interest rates. In addition, because of the short time period between the passing of the CARES Act and the implementation of the PPP, there is ambiguity in the laws, rules, and guidance regarding the operation of the PPP, which exposes us to risks relating to noncompliance with the PPP. There is risk that the SBA or another governmental entity could conclude there is a deficiency in the manner in which the Company originated, funded, or serviced PPP loans, which may or may not be related to the ambiguity in the CARES Act or the rules and guidance promulgated by the SBA and the U.S. Department of the Treasury regarding the operation of the PPP. In the event of such deficiency, the SBA may deny its liability under the guaranty, reduce the amount of the guaranty, or, if it has already made payment under the guaranty, seek recovery of any loss related to the deficiency from us.
Since the commencement of the PPP, several other banks have been subject to litigation regarding the processes and procedures that such banks followed in accepting and processing applications for the PPP. We may be exposed to the risk of similar litigation, from both customers and non-customers, with respect to the processes and procedures we used in processing applications for the PPP. If any such litigation is filed against us and is not resolved in a manner favorable to us, it may result in significant financial liability to us or adversely affect our reputation business, financial condition, and results of operations.
In addition, we may be subject to regulatory scrutiny regarding the Company’s processing of PPP applications or its origination or servicing of PPP loans. While the SBA has stated that banks may rely on the certifications of borrowers regarding their eligibility for PPP loans, the Company also has obligations under the PPP. If the SBA found that the Company did not meet those obligations, the remedies the SBA may seek against the Company are unknown but may include not guarantying the PPP loans, resulting in credit exposure to borrowers who may be unable to repay their loans.
Deterioration in local economic conditions may negatively impact our financial performance.
The Company’s success depends primarily on the general economic conditions in central and upstate New York, northeastern Pennsylvania, southern New Hampshire, western Massachusetts, Vermont, southern coastal Maine, central Connecticut and the specific local markets in which the Company operates. Unlike larger national or other regional banks that are more geographically diversified, the Company provides banking and financial services to customers primarily in the upstate New York areas of Norwich, Syracuse, Oneonta, Amsterdam-Gloversville, Albany, Binghamton, Utica-Rome, Plattsburgh, Glens Falls and Ogdensburg-Massena, the northeastern Pennsylvania areas of Scranton and Wilkes-Barre, Berkshire County, Massachusetts, southern New Hampshire, Vermont, the southern coastal Maine area and central Connecticut. The local economic conditions in these areas have a significant impact on the demand for the Company’s products and services as well as the ability of the Company’s customers to repay loans, the value of the collateral securing loans and the stability of the Company’s deposit funding sources.
As a lender with the majority of our loans secured by real estate or made to businesses in New York, Pennsylvania, New Hampshire, Massachusetts, Vermont, Maine and Connecticut, a downturn in these local economies could cause significant increases in nonperforming loans, which could negatively impact our earnings. Declines in real estate values in our market areas could cause any of our loans to become inadequately collateralized, which would expose us to greater risk of loss. Additionally, a decline in real estate values could result in the decline of originations of such loans, as most of our loans and the collateral securing our loans, are located in those areas.
Variations in interest rates could adversely affect our results of operations and financial condition.
The Company’s earnings and financial condition, like that of most financial institutions, are largely dependent upon net interest income, which is the difference between interest earned from loans and investments and interest paid on deposits and borrowings. The narrowing of interest rate spreads could adversely affect the Company’s earnings and financial condition. The Company cannot predict with certainty, or control, changes in interest rates. Regional and local economic conditions and the policies of regulatory authorities, including monetary policies of the FRB, affect rates and, therefore, interest income and interest expense. High interest rates could also affect the amount of loans that the Company can originate because higher rates could cause customers to apply for fewer mortgages or cause depositors to shift funds from accounts that have a comparatively lower cost to accounts with a higher cost. The Company may also experience customer attrition due to competitor pricing. If the cost of interest-bearing deposits increases at a rate greater than the yields on interest-earning assets increase, net interest income will be negatively affected. Changes in the asset and liability mix may also affect net interest income. Similarly, lower interest rates cause higher yielding assets to prepay and floating or adjustable rate assets to reset to lower rates. If the Company is not able to reduce its funding costs sufficiently, due to either competitive factors or the maturity schedule of existing liabilities, then the Company’s net interest margin will decline.
Any substantial or unexpected change in, or prolonged change in market interest rates could have a material adverse effect on the Company’s financial condition and results of operations. See the section captioned “Net Interest Income” in Item 7. Management’s Discussion and Analysis of Financial Condition and Results of Operations and Item 7A. Quantitative and Qualitative Disclosure About Market Risk located elsewhere in this report for further discussion related to the Company’s management of interest rate risk.
Our lending, and particularly our emphasis on commercial lending, exposes us to the risk of losses upon borrower default.
As of December 31, 2020, approximately 54% of the Company’s loan portfolio consisted of commercial and industrial, agricultural, commercial construction and commercial real estate loans. These types of loans generally expose a lender to greater risk of non-payment and loss than residential real estate loans because repayment of the loans often depends on the successful operation of the property, the income stream of the borrowers and, for construction loans, the accuracy of the estimate of the property’s value at completion of construction and the estimated cost of construction. Such loans typically involve larger loan balances to single borrowers or groups of related borrowers compared to residential real estate loans. Because the Company’s loan portfolio contains a significant number of commercial and industrial, agricultural, construction and commercial real estate loans with relatively large balances, the deterioration of one or a few of these loans could cause a significant increase in nonperforming loans. An increase in nonperforming loans could result in a net loss of earnings from these loans, an increase in the provision for loan losses and/or an increase in loan charge-offs, all of which could have a material adverse effect on the Company’s financial condition and results of operations. See the section captioned “Loans” in Item 7. Management’s Discussion and Analysis of Financial Condition and Results of Operations located elsewhere in this report for further discussion related to our commercial and industrial, agricultural, construction and commercial real estate loans.
Our allowance for loan losses may not be sufficient to cover actual loan losses, which could have a material adverse effect on our business, financial condition and results of operations.
The Company maintains an allowance for loan losses, which is an allowance established through a provision for loan losses charged to expense, that represents management’s best estimate of expected credit losses within the existing portfolio of loans. The allowance, in the judgment of management, is necessary to reserve for estimated loan losses and risks inherent in the loan portfolio. The determination of the appropriate level of the allowance for loan losses inherently involves a high degree of subjectivity and requires the Company to make significant estimates of current credit risks, forecast economic conditions and future trends, all of which may undergo material changes. Changes in economic conditions affecting borrowers, new information regarding existing loans, identification of additional problem loans and other factors, both within and outside of the Company’s control, may require an increase in the allowance for loan losses. Bank regulatory agencies periodically review the Company’s allowance for loan losses and may require an increase in the provision for loan losses or the recognition of further loan charge-offs, based on judgments different from those of management. In addition, if charge-offs in future periods exceed the allowance for loan losses, the Company may need additional provisions to increase the allowance for loan losses. These potential increases in the allowance for loan losses would result in a decrease in net income and, possibly, capital and may have a material adverse effect on the Company’s financial condition and results of operations. See the section captioned “Risk Management – Credit Risk” in Item 7. Management’s Discussion and Analysis of Financial Condition and Results of Operations located elsewhere in this report for further discussion related to the Company’s process for determining the appropriate level of the allowance for loan losses. Management expects that the CECL model may create more volatility in the level of our allowance for loan losses from quarter to quarter as changes in the level of allowance for loan losses will be dependent upon, among other things, macroeconomic forecasts and conditions, loan portfolio volumes and credit quality.
Strong competition within our industry and market area could adversely affect our performance and slow our growth.
The Company faces substantial competition in all areas of its operations from a variety of different competitors, many of which are larger and may have more financial resources. Such competitors primarily include national, regional and community banks within the various markets in which the Company operates. Additionally, various banks continue to enter or have announced plans to enter the market areas in which the Company currently operates. The Company also faces competition from many other types of financial institutions, including, without limitation, savings and loans, credit unions, finance companies, brokerage firms, insurance companies and other financial intermediaries. The financial services industry could continue to become even more competitive as a result of legislative, regulatory and technological changes and continued consolidation. Technology has lowered barriers to entry and made it possible for non-banks to offer products and services traditionally provided by banks, such as automatic transfer and automatic payment systems. Many of the Company’s competitors have fewer regulatory constraints and may have lower cost structures. Additionally, due to their size, many competitors may be able to achieve economies of scale and, as a result, may offer a broader range of products and services as well as better pricing for those products and services than the Company can.
The Company’s ability to compete successfully depends on a number of factors, including, among other things:
| ● | the ability to develop, maintain and build upon long-term customer relationships based on top quality service, high ethical standards and safe, sound assets; |
| ● | the ability to expand the Company’s market position; |
| ● | the scope, relevance and pricing of products and services offered to meet customer needs and demands; |
| ● | the rate at which the Company introduces new products, services and technologies relative to its competitors; |
| ● | customer satisfaction with the Company’s level of service; |
| ● | industry and general economic trends; and |
| ● | the ability to attract and retain talented employees. |
Failure to perform in any of these areas could significantly weaken the Company’s competitive position, which could adversely affect the Company’s growth and profitability, which, in turn, could have a material adverse effect on the Company’s financial condition and results of operations.
The Company is subject to liquidity risk, which could adversely affect net interest income and earnings.
The purpose of the Company’s liquidity management is to meet the cash flow obligations of its customers for both deposits and loans. The primary liquidity measurement the Company utilizes is called basic surplus, which captures the adequacy of the Company’s access to reliable sources of cash relative to the stability of its funding mix of average liabilities. This approach recognizes the importance of balancing levels of cash flow liquidity from short and long-term securities with the availability of dependable borrowing sources, which can be accessed when necessary. However, competitive pressure on deposit pricing could result in a decrease in the Company’s deposit base or an increase in funding costs. In addition, liquidity will come under additional pressure if loan growth exceeds deposit growth. These scenarios could lead to a decrease in the Company’s basic surplus measure to an amount below the minimum policy level of 5%. To manage this risk, the Company has the ability to purchase brokered time deposits, borrow against established borrowing facilities with other banks (Federal funds) and enter into repurchase agreements with investment companies. Depending on the level of interest rates applicable to these alternatives, the Company’s net interest income, and therefore earnings, could be adversely affected. See the section captioned “Liquidity Risk” in Item 7.
Our ability to service our debt, pay dividends and otherwise pay our obligations as they come due is substantially dependent on capital distributions from our subsidiaries.
The Company is a separate and distinct legal entity from its subsidiaries. It receives substantially all of its revenue from dividends from its subsidiaries. These dividends are the principal source of funds to pay dividends on the Company’s common stock and interest and principal on the Company’s debt. Various federal and/or state laws and regulations limit the amount of dividends that the Bank may pay to the Company. In addition, the Company’s right to participate in a distribution of assets upon a subsidiary’s liquidation or reorganization is subject to the prior claims of the subsidiary’s creditors. In the event the Bank is unable to pay dividends to the Company, the Company may not be able to service debt, pay obligations or pay dividends on the Company’s common stock. The inability to receive dividends from the Bank could have a material adverse effect on the Company’s business, financial condition and results of operations.
A reduction in the Company’s credit rating could adversely affect our business and/or the holders of our securities.
The credit rating agency rating our indebtedness regularly evaluates the Company and the Bank. Credit ratings are based on a number of factors, including our financial strength and ability to generate earnings, as well as factors not entirely within our control, including conditions affecting the financial services industry generally and the economy and changes in rating methodologies. There can be no assurance that the Company will maintain our current credit ratings. A downgrade of the credit ratings of the Company or the Bank could adversely affect our access to liquidity and capital, significantly increase our cost of funds, and decrease the number of investors and counterparties willing to lend to the Company or purchase our securities. This could affect our growth, profitability, and financial condition, including liquidity.
The Company relies on third parties to provide key components of its business infrastructure.
The Company relies on third parties to provide key components for its business operations, such as data processing and storage, recording and monitoring transactions, online banking interfaces and services, internet connections and network access. While the Company selects these third-party vendors carefully, it does not control their actions. Any problems caused by these third parties, including those resulting from breakdowns or other disruptions in communication services provided by a vendor, failure of a vendor to handle current or higher volumes, cyber-attacks and security breaches at a vendor, failure of a vendor to provide services for any reason or poor performance of services by a vendor, could adversely affect the Company’s ability to deliver products and services to its customers and otherwise conduct its business. Financial or operational difficulties of a third-party vendor could also hurt the Company’s operations if those difficulties interfere with the vendor’s ability to serve the Company. Replacing these third party vendors also could create significant delays and expense that adversely affect the Company’s business and performance.
The possibility of the economy’s return to recessionary conditions and the possibility of further turmoil or volatility in the financial markets would likely have an adverse effect on our business, financial position and results of operations.
The economy in the United States and globally has experienced volatility in recent years and may continue to do so for the foreseeable future, particularly as a result of the COVID-19 pandemic. There can be no assurance that economic conditions will not worsen. Unfavorable or uncertain economic conditions can be caused by declines in economic growth, business activity or investor or business confidence, limitations on the availability or increases in the cost of credit and capital, increases in inflation or interest rates, the timing and impact of changing governmental policies, natural disasters (including pandemics), terrorist attacks, acts of war or a combination of these or other factors. A worsening of business and economic conditions recovery could have adverse effects on our business, including the following:
| ● | investors may have less confidence in the equity markets in general and in financial services industry stocks in particular, which could place downward pressure on the Company’s stock price and resulting market valuation; |
| ● | consumer and business confidence levels could be lowered and cause declines in credit usage and adverse changes in payment patterns, causing increases in delinquencies and default rates; |
| ● | the Company’s ability to assess the creditworthiness of its customers may be impaired if the models and approaches the Company uses to select, manage and underwrite its customers become less predictive of future behaviors; |
| ● | the Company could suffer decreases in demand for loans or other financial products and services or decreased deposits or other investments in accounts with the Company; |
| ● | demand for and income received from the Company’s fee-based services could decline; |
| ● | customers of the Company’s trust and benefit plan administration business may liquidate investments, which together with lower asset values, may reduce the level of assets under management and administration and thereby decrease the Company’s investment management and administration revenues; |
| ● | competition in the financial services industry could intensify as a result of the increasing consolidation of financial services companies in connection with current market conditions or otherwise; and; |
| ● | the value of loans and other assets or collateral securing loans may decrease. |
We are subject to other-than-temporary impairment risk, which could negatively impact our financial performance.
The process of evaluating the potential impairment of goodwill and other intangibles is highly subjective and requires significant judgment. The Company estimates the expected future cash flows of its various businesses and determines the carrying value of these businesses. The Company exercises judgment in assigning and allocating certain assets and liabilities to these businesses. The Company then compares the carrying value, including goodwill and other intangibles, to the discounted future cash flows. If the total of future cash flows is less than the carrying amount of the assets, an impairment loss is recognized based on the excess of the carrying amount over the fair value of the assets. Estimates of the future cash flows associated with the assets are critical to these assessments. Changes in these estimates based on changed economic conditions or business strategies could result in material impairment charges and therefore have a material adverse impact on the Company’s financial condition and performance.
There are substantial risks and uncertainties associated with the introduction or expansion of lines of business or new products and services within existing lines of business.
From time to time, the Company may implement new lines of business or offer new products and services within existing lines of business. There are substantial risks and uncertainties associated with these efforts, particularly in instances where the markets are not fully developed. In developing and marketing new lines of business and/or new products and services, the Company may invest significant time and resources. Initial timetables for the introduction and development of new lines of business and/or new products or services may not be achieved and price and profitability targets may not prove attainable. External factors, such as compliance with regulations, competitive alternatives and shifting market preferences, may also impact the successful implementation of a new line of business or a new product or service. Furthermore, any new line of business and/or new product or service could have a significant impact on the effectiveness of the Company’s system of internal controls. Failure to successfully manage these risks in the development and implementation of new lines of business or new products or services could have a material adverse effect on the Company’s business, results of operations and financial condition.
Risks Related to Legal, Governmental and Regulatory Changes
We are subject to extensive government regulation and supervision, which may interfere with our ability to conduct our business and may negatively impact our financial results.
We are subject to extensive federal and state regulation and supervision. Banking regulations are primarily intended to protect depositors’ funds, the DIF and the safety and soundness of the banking system as a whole, not stockholders. These regulations affect the Company’s lending practices, capital structure, investment practices, dividend policy and growth, among other things. Congress and federal regulatory agencies continually review banking laws, regulations and policies for possible changes. Changes to statutes, regulations or regulatory policies, including changes in interpretation or implementation of statutes, regulations or policies, could affect the Company in substantial and unpredictable ways. Such changes could subject the Company to additional costs, limit the types of financial services and products the Company may offer and/or limit the pricing the Company may charge on certain banking services, among other things. Compliance personnel and resources may increase our costs of operations and adversely impact our earnings.
Failure to comply with laws, regulations or policies could result in sanctions by regulatory agencies, civil money penalties and/or reputation damage, which could have a material adverse effect on our business, financial condition and results of operations. While the Company has policies and procedures designed to prevent any such violations, there can be no assurance that such violations will not occur. See the section captioned “Supervision and Regulation” in Item 1. Business of this report for further information.
We are subject to heightened regulatory requirements because we now exceed $10 billion in total consolidated assets.
As of December 31, 2020, we had total assets of approximately $10.9 billion. The Dodd-Frank Act and its implementing regulations impose enhanced supervisory requirements on bank holding companies with more than $10 billion in total consolidated assets. For bank holding companies with more than $10 billion in total consolidated assets, such requirements include, among other things:
| ● | applicability of Volcker Rule requirements and restrictions; |
| ● | increased capital, leverage, liquidity and risk management standards; |
| ● | examinations by the CFPB for compliance with federal consumer financial protection laws and regulations; and |
| ● | limits on interchange fees on debit cards. |
The EGRRCPA, which was enacted in 2018, amended Dodd-Frank Act to raise the $10 billion stress testing threshold to $250 billion, among other things. The federal financial regulators issued final rules in 2019 to increase the threshold for these stress testing requirements from $10 billion to $250 billion, consistent with the EGRRCPA.
In December 2020 the OCC together with the Board of Governors of the Federal Reserve System and the FDIC, issued an interim final rule to temporarily mitigate transition costs related to the COVID-19 pandemic on community banking organizations with less than $10 billion in total assets as of December 31, 2019. The rule allows organizations, including the Company, to use assets as of December 31, 2019 to determine the applicability of various regulatory asset thresholds. During 2020, the Company crossed the $10 billion threshold and has elected to delay the regulatory implications of crossing the $10 billion threshold until 2022 for the limits on interchange fees on debit cards.
We expect that our regulators will consider our compliance with these regulatory requirements that now apply to us (in addition to regulatory requirements that applied to us previously) when examining our operations or considering any request for regulatory approval. We may, therefore, incur associated compliance costs and may be required to maintain compliance procedures.
Failure to comply with these new requirements may negatively impact the results of our operations and financial condition. To ensure compliance, we will be required to investment significant resources, which may necessitate hiring additional personnel and implementing additional internal controls. These additional compliance costs may have a material adverse effect on our business, results of operations and financial condition.
Replacement of the LIBOR benchmark interest rate could adversely affect our business, financial condition, and results of operations.
In 2017, the United Kingdom’s Financial Conduct Authority (“FCA”), which regulates the London Interbank Offered Rate (“LIBOR”), announced that the FCA intends to stop persuading or compelling banks to submit the rates required to calculate LIBOR after 2021. This announcement indicates that the continuation of LIBOR on the current basis cannot and will not be guaranteed after 2021. Consequently, at this time, it is not possible to predict whether and to what extent banks will continue to provide submissions for the calculation of LIBOR. Similarly, it is not possible to predict whether LIBOR will continue to be viewed as an acceptable market benchmark, what rate or rates may become accepted alternatives to LIBOR or what the effect of any such changes in views or alternatives may be on the markets for LIBOR-indexed financial instruments. The Alternative Reference Rates Committee (“ARRC”) has proposed that the Secured Overnight Financing Rate (“SOFR”) is the rate that represents best practice as the alternative to LIBOR for use in derivatives and other financial contracts that are currently indexed to LIBOR. ARRC has proposed a paced market transition plan to SOFR from LIBOR and organizations are currently working on industry wide and company specific transition plans as it relates to derivatives and cash markets exposed to LIBOR.
We have a significant number of loans, derivative contracts, borrowings and other financial instruments with attributes that are either directly or indirectly dependent on LIBOR. The transition from LIBOR, or any changes or reforms to the determination or supervision of LIBOR, could have an adverse impact on the market for or value of any LIBOR-linked securities, loans, and other financial obligations or extensions of credit held by or due to us, could create considerable costs and additional risk and could have an adverse impact on our overall financial condition or results of operations. Since proposed alternative rates are calculated differently, payments under contracts referencing new rates will differ from those referencing LIBOR. The transition will change our market risk profiles, requiring changes to risk and pricing models, valuation tools, product design and hedging strategies. Furthermore, failure to adequately manage this transition process with our customers could adversely impact our reputation.
Changes in accounting policies, standards, and interpretations could materially affect how we report our financial condition and results of operations.
The preparation of the Company’s financial statements in accordance with U.S. generally accepted accounting principles requires management to make estimates and assumptions that affect the reported amounts of assets and liabilities as of the date of the financial statements, as well as revenues and expenses during the period.
A variety of factors could affect the ultimate values of assets, liabilities, income and expenses recognized and reported in the Company’s financial statements, and these ultimate values may differ materially from those determined based on management’s estimates and assumptions. In addition, the FASB, regulatory agencies, and other bodies that establish accounting standards from time to time change the financial accounting and reporting standards governing the preparation of the Company’s financial statements. Further, those bodies that establish and interpret the accounting standards (such as the FASB, the Securities and Exchange Commission, and banking regulators) may change prior interpretations or positions regarding how these standards should be applied. These changes can be difficult to predict and can materially affect how the Company records and reports its financial condition and results of operations.
Our controls and procedures may fail or be circumvented, which may result in a material adverse effect on our business.
Management regularly reviews and updates our internal controls, disclosure controls and procedures and corporate governance policies and procedures. Any system of controls, however well designed and operated, is based in part on certain assumptions and can provide only reasonable, not absolute, assurances that the objectives of the system are met. Any failure or circumvention of the controls and procedures or failure to comply with regulations related to controls and procedures could have a material adverse effect on our business, results of operations and financial condition.
We may be held responsible for environmental liabilities with respect to properties to which we obtain title, resulting in significant financial loss.
A significant portion of our loan portfolio at December 31, 2020 was secured by real estate. In the course of our business, we may foreclose and take title to real estate and could be subject to environmental liabilities with respect to these properties. We may be held liable to a government entity or to third parties for property damage, personal injury, investigation and clean-up costs incurred by these parties in connection with environmental contamination or may be required to clean up hazardous or toxic substances, or chemical releases at a property. The costs associated with investigation and remediation activities could be substantial. In addition, if we are the owner or former owner of a contaminated site, we may be subject to common law claims by third parties based on damages and costs resulting from environmental contamination emanating from the property. These costs and claims could adversely affect our business, results of operations, financial condition and liquidity.
We may be adversely affected by the soundness of other financial institutions including the FHLB of New York.
Our ability to engage in routine funding transactions could be adversely affected by the actions and commercial soundness of other financial institutions. Financial services companies are interrelated as a result of trading, clearing, counterparty or other relationships. We have exposure to many different industries and counterparties and we routinely execute transactions with counterparties in the financial services industry, including brokers and dealers, commercial banks, investment banks, mutual and hedge funds and other institutional clients. As a result, defaults by, or even rumors or questions about, one or more financial services companies, or the financial services industry generally, have led to market-wide liquidity problems and could lead to losses or defaults by us or by other institutions. Many of these transactions expose us to credit risk in the event of default of our counterparty or client. In addition, our credit risk may be exacerbated if the collateral held by us cannot be realized or is liquidated at prices not sufficient to recover the full amount of the loan or derivative exposure due us. There is no assurance that any such losses would not materially and adversely affect our business, financial condition or results of operations.
The Company owns common stock of FHLB of New York in order to qualify for membership in the FHLB system, which enables it to borrow funds under the FHLB of New York’s advance program. The carrying value and fair market value of our FHLB of New York common stock was $9.4 million as of December 31, 2020. There are 11 branches of the FHLB, including New York, which are jointly liable for the consolidated obligations of the FHLB system. To the extent that one FHLB branch cannot meet its obligations to pay its share of the system’s debt, other FHLB branches can be called upon to make the payment. Any adverse effects on the FHLB of New York could adversely affect the value of our investment in its common stock and negatively impact our results of operations.
Provisions of our certificate of incorporation and bylaws, as well as Delaware law and certain banking laws, could delay or prevent a takeover of us by a third party.
Provisions of the Company’s certificate of incorporation and bylaws, the corporate law of the State of Delaware and state and federal banking laws, including regulatory approval requirements, could delay, defer or prevent a third party from acquiring the Company, despite the possible benefit to the Company’s stockholders, or otherwise adversely affect the market price of the Company’s common stock. These provisions include supermajority voting requirements for certain business combinations and advance notice requirements for nominations for election to the Company’s board of directors and for proposing matters that stockholders may act on at stockholder meetings. In addition, the Company is subject to Delaware law, which among other things prohibits the Company from engaging in a business combination with any interested stockholder for a period of three years from the date the person became an interested stockholder unless certain conditions are met. These provisions may discourage potential takeover attempts, discourage bids for the Company’s common stock at a premium over market price or adversely affect the market price of and the voting and other rights of the holders of the Company’s common stock. These provisions could also discourage proxy contests and make it more difficult for you and other stockholders to elect directors other than candidates nominated by the Board.
Risks Related to Cybersecurity and Data Privacy
The Company faces operational risks and cybersecurity risks associated with incidents which have the potential to disrupt our operations, cause material harm to our financial condition, result in misappropriation of assets, compromise confidential information and/or damage our business relationships and cannot guarantee that the steps we and our service providers take in response to these risks will be effective.
We depend upon data processing, communication systems, and information exchange on a variety of platforms and networks and over the internet to conduct business operations. In addition, we rely on the services of a variety of vendors to meet our data processing and communication needs. Although we require third party providers to maintain certain levels of security, such providers remain vulnerable to breaches, security incidents, system unavailability or other malicious attacks that could compromise sensitive information. The risk of experiencing security incidents and disruptions, particularly through cyber-attacks or cyber intrusions has generally increased as the number, intensity and sophistication of attempted attacks and intrusions by organized crime, hackers, terrorists, nation-states, activists and other external parties has increased. These security incidents may result in disruption of our operations; material harm to our financial condition, cash flows and the market price of our common stock; misappropriation of assets; compromise or corruption of confidential information; liability for information or assets stolen during the incident; remediation costs; increased cybersecurity and insurance costs; regulatory enforcement; litigation; and damage to our stakeholder and customer relationships.
Moreover, in the normal course of business, we and our service providers collect and retain certain personal information provided by our customers, employees and vendors. If this information gets mishandled, misused, improperly accessed, lost or stolen, we could suffer significant financial, business, reputations, regulatory or other harm. These risks may increase as we continue to increase and expand our usage of web-based products and applications.
These risks require continuous and likely increasing attention and resources from us to, among other actions, identify and quantify potential cybersecurity risks, upgrade and expand our technologies, systems and processes to adequately address the risk. We provide on-going training for our employees to assist them in detecting phishing, malware and other malicious schemes. Such attention diverts time and resources from other activities and, while we have implemented policies and procedures designed to maintain the security and integrity of the information we and our service providers collect on our and their computer systems, there can be no assurance that our efforts will be effective. Likewise, while we have implemented security measures to prevent unauthorized access to personal information and prevent or limit the effect of possible incidents, we can provide no assurance that a security breach or disruption will not be successful or damaging, or, if any such breach or disruption does occur, that it can be sufficiently or timely remediated.
Even the most well protected information, networks, systems and facilities remain potentially vulnerable because the techniques used in such attempted security breaches evolve and generally are not recognized until launched against a target, and in some cases are designed not to be detected and, in fact, may not be detected. Accordingly, we may be unable to anticipate these techniques or to implement adequate security barriers or other preventative measures, and thus it is impossible for us to entirely mitigate this risk.
The Company may be adversely affected by fraud.
As a financial institution, the Company is inherently exposed to operational risk in the form of theft and other fraudulent activity by employees, customers and other third parties targeting the Company and/or the Company’s customers or data. Such activity may take many forms, including check fraud, electronic fraud, wire fraud, phishing, social engineering and other dishonest acts. Although the Company devotes substantial resources to maintaining effective policies and internal controls to identify and prevent such incidents, given the increasing sophistication of possible perpetrators, the Company may experience financial losses or reputational harm as a result of fraud.
We continually encounter technological change and the failure to understand and adapt to these changes could have a material adverse impact our business.
The financial services industry is continually undergoing rapid technological change with frequent introductions of new technology-driven products and services. The effective use of technology increases efficiency and enables financial institutions to serve customers better and to reduce costs. The Company’s future success depends, in part, upon its ability to address the needs of its customers by using technology to provide products and services that will satisfy customer demands, as well as to create additional efficiencies in the Company’s operations. Many of the Company’s competitors have substantially greater resources to invest in technological improvements. The Company may not be able to effectively implement new technology-driven products and services or be successful in marketing these products and services to its customers. Failure to successfully keep pace with technological changes affecting the financial services industry could have a material adverse impact on the Company’s business and, in turn, the Company’s financial condition and results of operations.
Risks Related to an Investment in the Company’s Securities
The Company’s common stock price may fluctuate significantly.
The Company’s common stock price constantly changes. The market price of the Company’s common stock may continue to fluctuate significantly in response to a number of factors including, but not limited to:
| ● | the political climate and whether the proposed policies of the current Presidential administration in the U.S. that have affected market prices for financial institution stocks are successfully implemented; |
| ● | changes in securities analysts’ recommendations or expectations of financial performance; |
| ● | volatility of stock market prices and volumes; |
| ● | incorrect information or speculation; |
| ● | changes in industry valuations; |
| ● | variations in operating results from general expectations; |
| ● | actions taken against the Company by various regulatory agencies; |
| ● | changes in authoritative accounting guidance; |
| ● | changes in general domestic economic conditions such as inflation rates, tax rates, unemployment rates, labor and healthcare cost trend rates, recessions and changing government policies, laws and regulations; and |
| ● | severe weather, natural disasters, acts of war or terrorism and other external events. |
There may be future sales or other dilution of the Company’s equity, which may adversely affect the market price of the Company’s stock.
The Company is not restricted from issuing additional common stock, including any securities that are convertible into or exchangeable for, or that represent the right to receive, common stock. The Company also grants shares of common stock to employees and directors under the Company’s incentive plan each year. The issuance of any additional shares of the Company’s common stock or preferred stock or securities convertible into, exchangeable for or that represent the right to receive common stock or the exercise of such securities could be substantially dilutive to stockholders of the Company’s common stock. Holders of the Company’s common stock have no preemptive rights that entitle such holders to purchase their pro rata share of any offering of shares or any class or series. Because the Company’s decision to issue securities in any future offering will depend on market conditions, its acquisition activity and other factors, the Company cannot predict or estimate the amount, timing or nature of its future offerings. Thus, the Company’s stockholders bear the risk of the Company’s future offerings reducing the market price of the Company’s common stock and diluting their stock holdings in the Company.
General Risks
The risks presented by acquisitions could adversely affect our financial condition and results of operations.
The business strategy of the Company has included and may continue to include growth through acquisition. Any future acquisitions will be accompanied by the risks commonly encountered in acquisitions. These risks may include, among other things:
| ● | exposure to potential asset quality issues of the acquired business; |
| ● | potential exposure to unknown or contingent liabilities of the acquired business; |
| ● | our ability to realize anticipated cost savings; |
| ● | the difficulty of integrating operations and personnel and the potential loss of key employees; |
| ● | the potential disruption of our or the acquired company’s ongoing business in such a way that could result in decreased revenues or the inability of our management to maximize our financial and strategic position; |
| ● | the inability to maintain uniform standards, controls, procedures and policies; and |
| ● | the impairment of relationships with the acquired company’s employees and customers as a result of changes in ownership and management. |
We cannot provide any assurance that we will be successful in overcoming these risks or any other problems encountered in connection with acquisitions. Our inability to overcome these risks could have an adverse effect on the achievement of our business strategy and results of operations.
We rely on our management and other key personnel, and the loss of any of them may adversely affect our operations.
We are and will continue to be dependent upon the services of our executive management team. In addition, we will continue to depend on our ability to retain and recruit key client relationship managers. The unexpected loss of services of any key management personnel, or the inability to recruit and retain qualified personnel in the future, could have an adverse effect on our business and financial condition.
| ITEM 1B. | UNRESOLVED STAFF COMMENTS |
None.
| ITEM 2. | PROPERTIES |
The Company owns its headquarters located at 52 South Broad Street, Norwich, New York 13815. The Company operated the following community banking branches and ATMs as of December 31, 2020:
County |
Branches |
ATMs |
County |
Branches |
ATMs |
|||||||
New York |
Pennsylvania |
|||||||||||
Albany |
4 |
5 |
Lackawanna |
11 |
16 |
|||||||
Broome |
7 |
9 |
Luzerne |
3 |
5 |
|||||||
Chenango |
11 |
12 |
Monroe |
3 |
3 |
|||||||
Clinton |
2 |
2 |
Pike |
2 |
2 |
|||||||
Cortland |
4 |
7 |
Susquehanna |
5 |
7 |
|||||||
Delaware |
5 |
5 |
Wayne |
3 |
4 |
|||||||
Essex |
3 |
4 |
||||||||||
Franklin |
1 |
1 |
New Hampshire |
|||||||||
Fulton |
5 |
6 |
Cheshire |
1 |
1 |
|||||||
Greene |
1 |
1 |
Hillsborough |
2 |
2 |
|||||||
Hamilton |
1 |
1 |
Merrimack |
1 |
1 |
|||||||
Herkimer |
1 |
1 |
Rockingham |
- |
1 |
|||||||
Madison |
5 |
8 |
||||||||||
Montgomery |
5 |
4 |
Vermont |
|||||||||
Oneida |
6 |
9 |
Chittenden |
3 |
4 |
|||||||
Onondaga |
10 |
12 |
Rutland |
- |
1 |
|||||||
Oswego |
4 |
6 |
||||||||||
Otsego |
8 |
11 |
Massachusetts |
|||||||||
Rensselaer |
1 |
1 |
Berkshire |
5 |
5 |
|||||||
St. Lawrence |
4 |
4 |
||||||||||
Saratoga |
4 |
5 |
Maine |
|||||||||
Schenectady |
2 |
2 |
Cumberland |
1 |
1 |
|||||||
Schoharie |
4 |
4 |
||||||||||
Tioga |
1 |
1 |
||||||||||
Warren |
2 |
2 |
||||||||||
Total |
141 |
176 |
||||||||||
The Company leases 58 of the above listed branches from third parties. The Company owns all other banking premises. The Company believes that its offices are sufficient for its present operations and that all properties are adequately covered by insurance. All of the above ATMs are owned by the Company.
| ITEM 3. | LEGAL PROCEEDINGS |
There are no material legal proceedings, other than ordinary routine litigation incidental to the business, to which the Company or any of its subsidiaries is a party or of which any of their property is subject.
| ITEM 4. | MINE SAFETY DISCLOSURES |
None.
PART II
| ITEM 5. | MARKET FOR REGISTRANT’S COMMON EQUITY, RELATED STOCKHOLDER MATTERS AND ISSUER PURCHASES OF EQUITY SECURITIES |
Market Information
The common stock of the Company, par value $0.01 per share (the “Common Stock”), is quoted on the NASDAQ Global Select Market under the symbol “NBTB.” The closing price of the Common Stock on February 8, 2021 was $35.26. As of February 8, 2021, there were 5,547 stockholders of record of Common Stock. No unregistered securities were sold by the Company during the year ended December 31, 2020.
Stock Performance Graph
The following stock performance graph compares the cumulative total stockholder return (i.e., price change, reinvestment of cash dividends and stock dividends received) on our Common Stock against the cumulative total return of the NASDAQ Stock Market (U.S. Companies) Index and the KBW Regional Bank Index (Peer Group). The stock performance graph assumes that $100 was invested on December 31, 2015. The graph further assumes the reinvestment of dividends into additional shares of the same class of equity securities at the frequency with which dividends are paid on such securities during the relevant fiscal year. The yearly points marked on the horizontal axis correspond to December 31 of that year. We calculate each of the referenced indices in the same manner. All are market-capitalization-weighted indices, so companies judged by the market to be more important (i.e., more valuable) count for more in all indices.
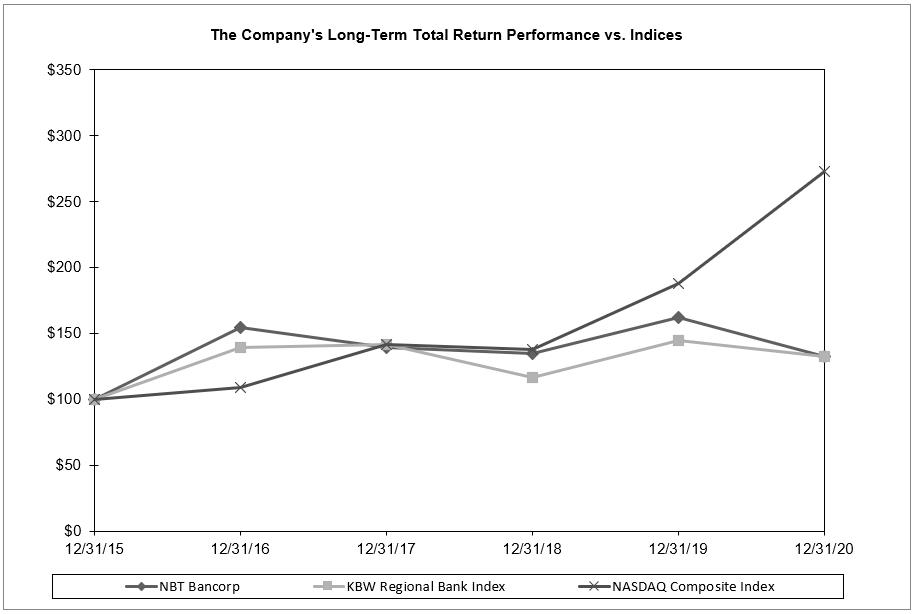
Period Ending |
||||||||||||||||||||||||
Index |
12/31/15 |
12/31/16 |
12/31/17 |
12/31/18 |
12/31/19 |
12/31/20 |
||||||||||||||||||
NBT Bancorp |
$ |
100.00 |
$ |
154.62 |
$ |
139.30 |
$ |
134.40 |
$ |
162.06 |
$ |
132.69 |
||||||||||||
KBW Regional Bank Index |
$ |
100.00 |
$ |
139.12 |
$ |
141.63 |
$ |
116.86 |
$ |
144.76 |
$ |
132.18 |
||||||||||||
NASDAQ Composite Index |
$ |
100.00 |
$ |
108.97 |
$ |
141.36 |
$ |
137.39 |
$ |
187.87 |
$ |
272.51 |
||||||||||||
Source: Bloomberg, L.P.
Dividends
The Company depends primarily upon dividends from subsidiaries for a substantial part of the Company’s revenue. Accordingly, the ability to pay dividends to stockholders depends primarily upon the receipt of dividends or other capital distributions from the subsidiaries. Payment of dividends to the Company from the Bank is subject to certain regulatory and other restrictions. Under Office of the Comptroller of the Currency (“OCC”) regulations, the Bank may pay dividends to the Company without prior regulatory approval so long as it meets its applicable regulatory capital requirements before and after payment of such dividends and its total dividends do not exceed its net income to date over the calendar year plus retained net income over the preceding two years. At December 31, 2020, the Bank was in compliance with all applicable minimum capital requirements and had the ability to pay dividends of $194.2 million to the Company without the prior approval of the OCC.
If the capital of the Company is diminished by depreciation in the value of its property or by losses, or otherwise, to an amount less than the aggregate amount of the capital represented by the issued and outstanding stock of all classes having a preference upon the distribution of assets, no dividends may be paid out of net profits until the deficiency in the amount of capital represented by the issued and outstanding stock of all classes having a preference upon the distribution of assets has been repaired. See the section captioned “Supervision and Regulation” in Item 1. Business and Note 15 to the consolidated financial statements is included in Item 8. Financial Statements and Supplementary Data, which are located elsewhere in this report.
Stock Repurchase
The Company purchased 263,507 shares of its common stock during year ended December 31, 2020 at an average price of $30.28 per share under its previously announced plan. As of December 31, 2020, there were 736,493 shares available for repurchase under this plan. On January 27, 2021, the NBT Board of Directors approved an increase to the total number of shares authorized under the stock repurchase program to 2 million shares from 1 million shares, previously. The plan expires on December 31, 2021. The Company did not purchase any shares of its common stock during the fourth quarter of 2020.
| ITEM 6. | SELECTED FINANCIAL DATA |
The following summary of financial and other information about the Company is derived from the Company’s audited consolidated financial statements for each of the last five fiscal years ended December 31 and should be read in conjunction with Item 7 and the Company’s consolidated financial statements and accompanying notes, included elsewhere in this report:
Years Ended December 31, |
||||||||||||||||||||
(In thousands, except per share data) |
2020 |
2019 |
2018 |
2017 |
2016 |
|||||||||||||||
Interest, fee and dividend income |
$ |
348,282 |
$ |
367,534 |
$ |
344,255 |
$ |
309,407 |
$ |
286,947 |
||||||||||
Interest expense |
32,604 |
55,979 |
38,626 |
25,914 |
22,506 |
|||||||||||||||
Net interest income |
315,678 |
311,555 |
305,629 |
283,493 |
264,441 |
|||||||||||||||
Provision for loan losses(1) |
51,134 |
25,412 |
28,828 |
30,988 |
25,431 |
|||||||||||||||
Noninterest income excluding net securities gains (losses) |
146,664 |
139,810 |
131,103 |
119,437 |
116,357 |
|||||||||||||||
Net securities (losses) gains |
(388 |
) |
4,213 |
(6,341 |
) |
1,867 |
(644 |
) |
||||||||||||
Noninterest expense |
277,733 |
274,734 |
264,561 |
245,648 |
235,922 |
|||||||||||||||
Income before income taxes |
133,087 |
155,432 |
137,002 |
128,161 |
118,801 |
|||||||||||||||
Net income |
104,388 |
121,021 |
112,566 |
82,151 |
78,409 |
|||||||||||||||
Per common share |
||||||||||||||||||||
Basic earnings |
$ |
2.39 |
$ |
2.76 |
$ |
2.58 |
$ |
1.89 |
$ |
1.81 |
||||||||||
Diluted earnings |
2.37 |
2.74 |
2.56 |
1.87 |
1.80 |
|||||||||||||||
Cash dividends paid |
1.08 |
1.05 |
0.99 |
0.92 |
0.90 |
|||||||||||||||
Book value at year-end |
27.22 |
25.58 |
23.31 |
22.01 |
21.11 |
|||||||||||||||
Tangible book value at year-end (2) |
20.52 |
19.03 |
16.66 |
15.54 |
14.61 |
|||||||||||||||
Average diluted common shares outstanding |
43,989 |
44,124 |
44,020 |
43,905 |
43,622 |
|||||||||||||||
Securities available for sale, at fair value |
$ |
1,348,698 |
$ |
975,340 |
$ |
998,496 |
$ |
1,255,925 |
$ |
1,338,290 |
||||||||||
Securities held to maturity, at amortized cost |
616,560 |
630,074 |
783,599 |
484,073 |
527,948 |
|||||||||||||||
Loans |
7,498,885 |
7,136,098 |
6,887,709 |
6,583,639 |
6,196,978 |
|||||||||||||||
Allowance for loan losses (1) |
110,000 |
72,965 |
72,505 |
69,500 |
65,200 |
|||||||||||||||
Assets |
10,932,906 |
9,715,925 |
9,556,363 |
9,136,812 |
8,867,268 |
|||||||||||||||
Deposits |
9,081,692 |
7,587,820 |
7,368,211 |
7,170,636 |
6,973,688 |
|||||||||||||||
Borrowings |
406,731 |
820,682 |
1,046,616 |
909,188 |
886,986 |
|||||||||||||||
Stockholders’ equity |
1,187,618 |
1,120,397 |
1,017,909 |
958,177 |
913,316 |
|||||||||||||||
Key ratios |
||||||||||||||||||||
Return on average assets |
0.99 |
% |
1.26 |
% |
1.20 |
% |
0.91 |
% |
0.92 |
% |
||||||||||
Return on average equity |
9.09 |
% |
11.32 |
% |
11.49 |
% |
8.71 |
% |
8.74 |
% |
||||||||||
Average equity to average assets |
10.92 |
% |
11.17 |
% |
10.47 |
% |
10.45 |
% |
10.49 |
% |
||||||||||
Net interest margin |
3.31 |
% |
3.58 |
% |
3.58 |
% |
3.47 |
% |
3.43 |
% |
||||||||||
Dividend payout ratio |
45.57 |
% |
38.32 |
% |
38.67 |
% |
49.20 |
% |
50.00 |
% |
||||||||||
Tier 1 leverage |
9.56 |
% |
10.33 |
% |
9.52 |
% |
9.14 |
% |
9.11 |
% |
||||||||||
Common equity tier 1 capital ratio |
11.84 |
% |
11.29 |
% |
10.49 |
% |
10.06 |
% |
9.98 |
% |
||||||||||
Tier 1 risk-based capital |
13.09 |
% |
12.56 |
% |
11.79 |
% |
11.42 |
% |
11.42 |
% |
||||||||||
Total risk-based capital |
15.62 |
% |
13.52 |
% |
12.78 |
% |
12.42 |
% |
12.39 |
% |
||||||||||
| (1) | Beginning January 1, 2020, calculation is based on current expected loss methodology. Prior to January 1, 2020, calculation was based on incurred loss methodology. |
| (2) | Tangible book value calculation (non-GAAP): |
Years Ended December 31, |
||||||||||||||||||||
(In thousands, except per share data) |
2020 |
2019 |
2018 |
2017 |
2016 |
|||||||||||||||
Stockholders’ equity |
$ |
1,187,618 |
$ |
1,120,397 |
$ |
1,017,909 |
$ |
958,177 |
$ |
913,316 |
||||||||||
Intangibles |
292,276 |
286,789 |
290,368 |
281,463 |
281,254 |
|||||||||||||||
Tangible equity |
895,342 |
833,608 |
727,541 |
676,714 |
632,062 |
|||||||||||||||
Diluted common shares outstanding |
43,629 |
43,797 |
43,673 |
43,543 |
43,258 |
|||||||||||||||
Tangible book value |
$ |
20.52 |
$ |
19.03 |
$ |
16.66 |
$ |
15.54 |
$ |
14.61 |
||||||||||
Selected Quarterly Financial Data
2020 |
2019 |
|||||||||||||||||||||||||||||||
(In thousands, except per share data) |
Fourth |
Third |
Second |
First |
Fourth |
Third |
Second |
First |
||||||||||||||||||||||||
Interest, fee and dividend income |
$ |
86,441 |
$ |
84,994 |
$ |
87,446 |
$ |
89,401 |
$ |
90,576 |
$ |
92,381 |
$ |
93,233 |
$ |
91,344 |
||||||||||||||||
Interest expense |
6,333 |
7,051 |
7,000 |
12,220 |
13,393 |
14,327 |
14,606 |
13,653 |
||||||||||||||||||||||||
Net interest income |
80,108 |
77,943 |
80,446 |
77,181 |
77,183 |
78,054 |
78,627 |
77,691 |
||||||||||||||||||||||||
Provision for loan losses (1) |
(607 |
) |
3,261 |
18,840 |
29,640 |
6,004 |
6,324 |
7,277 |
5,807 |
|||||||||||||||||||||||
Noninterest income excluding net securities gains (losses) |
37,955 |
37,643 |
34,831 |
36,235 |
36,052 |
35,684 |
34,310 |
33,764 |
||||||||||||||||||||||||
Net securities gains (losses) |
160 |
84 |
180 |
(812 |
) |
189 |
4,036 |
(69 |
) |
57 |
||||||||||||||||||||||
Noninterest expense |
75,204 |
66,308 |
65,340 |
70,881 |
70,294 |
69,749 |
66,231 |
68,460 |
||||||||||||||||||||||||
Net income |
34,194 |
35,113 |
24,713 |
10,368 |
28,960 |
32,379 |
30,555 |
29,127 |
||||||||||||||||||||||||
Basic earnings per share |
$ |
0.78 |
$ |
0.80 |
$ |
0.57 |
$ |
0.24 |
$ |
0.66 |
$ |
0.74 |
$ |
0.70 |
$ |
0.67 |
||||||||||||||||
Diluted earnings per share |
$ |
0.78 |
$ |
0.80 |
$ |
0.56 |
$ |
0.23 |
$ |
0.66 |
$ |
0.73 |
$ |
0.69 |
$ |
0.66 |
||||||||||||||||
Annualized net interest margin |
3.20 |
% |
3.17 |
% |
3.38 |
% |
3.52 |
% |
3.52 |
% |
3.57 |
% |
3.61 |
% |
3.64 |
% |
||||||||||||||||
Annualized return on average assets |
1.24 |
% |
1.29 |
% |
0.94 |
% |
0.43 |
% |
1.20 |
% |
1.34 |
% |
1.28 |
% |
1.24 |
% |
||||||||||||||||
Annualized return on average equity |
11.59 |
% |
12.09 |
% |
8.76 |
% |
3.69 |
% |
10.36 |
% |
11.83 |
% |
11.63 |
% |
11.52 |
% |
||||||||||||||||
Weighted average diluted common shares outstanding |
43,974 |
43,942 |
43,928 |
44,130 |
44,174 |
44,138 |
44,120 |
44,081 |
||||||||||||||||||||||||
| (1) | Beginning January 1, 2020, calculation is based on current expected loss methodology. Prior to January 1, 2020, calculation was based on incurred loss methodology. |
| ITEM 7. | MANAGEMENT’S DISCUSSION AND ANALYSIS OF FINANCIAL CONDITION AND RESULTS OF OPERATIONS |
Forward-Looking Statements
Certain statements in this filing and future filings by the NBT Bancorp Inc. (the “Company”) with the Securities and Exchange Commission (“SEC”), in the Company’s press releases or other public or stockholder communications or in oral statements made with the approval of an authorized executive officer, contain forward-looking statements, as defined in the Private Securities Litigation Reform Act. These statements may be identified by the use of phrases such as “anticipate,” “believe,” “expect,” “forecasts,” “projects,” “will,” “can,” “would,” “should,” “could,” “may,” or other similar terms. There are a number of factors, many of which are beyond the Company’s control that could cause actual results to differ materially from those contemplated by the forward-looking statements. Factors that may cause actual results to differ materially from those contemplated by such forward-looking statements include, among others, the following possibilities: (1) local, regional, national and international economic conditions and the impact they may have on the Company and its customers and the Company’s assessment of that impact; (2) changes in the level of nonperforming assets and charge-offs; (3) changes in estimates of future reserve requirements based upon the periodic review thereof under relevant regulatory and accounting requirements; (4) the effects of and changes in trade and monetary and fiscal policies and laws, including the interest rate policies of the Federal Reserve Board (“FRB”); (5) inflation, interest rate, securities market and monetary fluctuations; (6) political instability; (7) acts of war or terrorism; (8) the timely development and acceptance of new products and services and perceived overall value of these products and services by users; (9) changes in consumer spending, borrowings and savings habits; (10) changes in the financial performance and/or condition of the Company’s borrowers; (11) technological changes; (12) acquisitions and integration of acquired businesses; (13) the ability to increase market share and control expenses; (14) changes in the competitive environment among financial holding companies; (15) the effect of changes in laws and regulations (including laws and regulations concerning taxes, banking, securities and insurance) with which the Company and its subsidiaries must comply, including those under the Dodd-Frank Act, Economic Growth, Regulatory Relief, Consumer Protection Act of 2018, Coronavirus Aid, Relief and Economic Security Act (“CARES Act”), and other legislative and regulatory responses to the coronavirus (“COVID-19”) pandemic; (16) the effect of changes in accounting policies and practices, as may be adopted by the regulatory agencies, as well as the Public Company Accounting Oversight Board, the Financial Accounting Standards Board (“FASB”) and other accounting standard setters; (17) changes in the Company’s organization, compensation and benefit plans; (18) the costs and effects of legal and regulatory developments including the resolution of legal proceedings or regulatory or other governmental inquiries and the results of regulatory examinations or reviews; (19) greater than expected costs or difficulties related to the integration of new products and lines of business; (20) the adverse impact on the U.S. economy, including the markets in which we operate, of the novel coronavirus, which causes COVID-19 global pandemic; (21) the impact of a slowing U.S. economy and increased unemployment on the performance of our loan portfolio, the market value of our investment securities, the availability of sources of funding and the demand for our products; and (22) the Company’s success at managing the risks involved in the foregoing items.
Currently, one of the most significant factors that could cause actual outcomes to differ materially from the Company’s forward-looking statements is the potential adverse effect of the current COVID-19 pandemic on the financial condition, results of operations, cash flows and performance of the Company, its customers and the global economy and financial markets. The extent to which the COVID-19 pandemic impacts the Company will depend on future developments, which are highly uncertain and cannot be predicted with confidence, including the scope, severity and duration of the pandemic and its impact on the Company’s customers and demand for financial services, the actions governments, businesses and individuals take in response to the pandemic, the impact of the COVID-19 pandemic and actions taken in response to the pandemic on global and regional economies, national and local economic activity, and the pace of recovery when the COVID-19 pandemic subsides, among others. Moreover, investors are cautioned to interpret many of the risks identified under the section entitled “Risk Factors” in this Form 10-K as being heightened as a result of the ongoing and numerous adverse impacts of the COVID-19 pandemic.
The Company cautions readers not to place undue reliance on any forward-looking statements, which speak only as of the date made, and advises readers that various factors, including, but not limited to, those described above and other factors discussed in the Company’s annual and quarterly reports previously filed with the SEC, could affect the Company’s financial performance and could cause the Company’s actual results or circumstances for future periods to differ materially from those anticipated or projected.
Unless required by law, the Company does not undertake, and specifically disclaims any obligations to, publicly release any revisions that may be made to any forward-looking statements to reflect the occurrence of anticipated or unanticipated events or circumstances after the date of such statements.
General
NBT Bancorp Inc. is a financial holding company headquartered in Norwich, NY, with total assets of $10.9 billion at December 31, 2020. The Company’s business, primarily conducted through the Bank and its full service 401(k) recordkeeping and insurance agency subsidiaries, consists of providing commercial banking, retail banking, wealth management and other financial services primarily to customers in its market area, which includes central and upstate New York, northeastern Pennsylvania, southern New Hampshire, western Massachusetts, Vermont, the southern coastal Maine area and recently entering central Connecticut. The Company’s business philosophy is to operate as a community bank with local decision-making, providing a broad array of banking and financial services to individual, commercial and municipal customers. The financial review that follows focuses on the factors affecting the consolidated financial condition and results of operations of the Company and its wholly owned subsidiaries, the Bank, NBT Financial and NBT Holdings during 2020 and, in summary form, the preceding two years. Collectively, the registrant and its subsidiaries are referred to herein as “the Company.” Net interest margin is presented in this discussion on a fully taxable equivalent (“FTE”) basis. Average balances discussed are daily averages unless otherwise described. The audited consolidated financial statements and related notes as of December 31, 2020 and 2019 and for each of the years in the three-year period ended December 31, 2020 should be read in conjunction with this review.
Critical Accounting Policies
The Company has identified policies as being critical because they require management to make particularly difficult, subjective and/or complex judgments about matters that are inherently uncertain. The judgment and assumptions made are based upon historical experience or other factors that management believes to be reasonable under the circumstances. Because of the nature of the judgment and assumptions, actual results could differ from estimates, which could have a material effect on our financial condition and results of operations. These policies relate to the allowance for credit losses, pension accounting and provision for income taxes.
The allowance for credit losses consists of the allowance for credit losses and the allowance for losses on unfunded commitments. As a result of the Company’s January 1, 2020, adoption of Accounting Standards Updates (“ASU”) 2016-13, Financial Instruments - Credit Losses (Topic 326): Measurement of Credit Losses on Financial Instruments (“CECL”) and its related amendments, our methodology for estimating the reserve for credit losses changed significantly from December 31, 2019. The standard replaced the “incurred loss” approach with an “expected loss” approach known as current expected credit loss. The CECL approach requires an estimate of the credit losses expected over the life of an exposure (or pool of exposures). It removes the incurred loss approach’s threshold that delayed the recognition of a credit loss until it was “probable” a loss event was “incurred.” The estimate of expected credit losses under the CECL approach is based on relevant information about past events, current conditions, and reasonable and supportable forecasts that affect the collectability of the reported amounts. Historical loss experience is generally the starting point for estimating expected credit losses. The Company then considers whether the historical loss experience should be adjusted for asset-specific risk characteristics or current conditions at the reporting date that did not exist over the period from which historical experience was used. Finally, the Company considers forecasts about future economic conditions that are reasonable and supportable. The allowance for losses on unfunded commitments represents the expected credit losses on off-balance sheet commitments such as unfunded commitments to extend credit and standby letters of credit. However, a liability is not recognized for commitments unconditionally cancellable by the Company. The allowance for losses on unfunded commitments is determined by estimating future draws and applying the expected loss rates on those draws.
Management of the Company considers the accounting policy relating to the allowance for credit losses to be a critical accounting policy given the uncertainty in evaluating the level of the allowance required to cover management’s estimate of all expected credit losses over the expected contractual life of our loan portfolio. Determining the appropriateness of the allowance is complex and requires judgment by management about the effect of matters that are inherently uncertain. Subsequent evaluations of the then-existing loan portfolio, in light of the factors then prevailing, may result in significant changes in the allowance for credit losses in those future periods. While management’s current evaluation of the allowance for credit losses indicates that the allowance is appropriate, the allowance may need to be increased under adversely different conditions or assumptions. Going forward, the impact of utilizing the CECL approach to calculate the reserve for credit losses will be significantly influenced by the composition, characteristics and quality of our loan portfolio, as well as the prevailing economic conditions and forecasts utilized. Material changes to these and other relevant factors may result in greater volatility to the reserve for credit losses, and therefore, greater volatility to our reported earnings.
Management is required to make various assumptions in valuing the Company’s pension assets and liabilities. These assumptions include the expected rate of return on plan assets, the discount rate, the rate of increase in future compensation levels and interest rate of credit for cash balance plans. Changes to these assumptions could impact earnings in future periods. The Company takes into account the plan asset mix, funding obligations and expert opinions in determining the various rates used to estimate pension expense. The Company also considers market interest rates and discounted cash flows in setting the appropriate discount rate. In addition, the Company reviews expected inflationary and merit increases to compensation in determining the rate of increase in future compensation levels.
The Company is subject to examinations from various taxing authorities. Such examinations may result in challenges to the tax return treatment applied by the Company to specific transactions. Management believes that the assumptions and judgments used to record tax-related assets or liabilities have been appropriate. Should tax laws change or the taxing authorities determine that management’s assumptions were inappropriate, an adjustment may be required which could have a material effect on the Company’s results of operations.
The Company’s policies on the allowance for credit losses, pension accounting and provision for income taxes are disclosed in Note 1 to the consolidated financial statements of this Form 10-K. All accounting policies are important and as such, the Company encourages the reader to review each of the policies included in Note 1 to the consolidated financial statements to obtain a better understanding of how the Company’s financial performance is reported. Refer to Note 2 to the consolidated financial statements for recently adopted accounting standards.
Non-GAAP Measures
This Annual Report on Form 10-K contains financial information determined by methods other than in accordance with accounting principles generally accepted in the United States of America (“GAAP”). Where non-GAAP disclosures are used in this Annual Report on Form 10-K, the comparable GAAP measure, as well as a reconciliation to the comparable GAAP measure, is provided in the accompanying tables. Management believes that these non-GAAP measures provide useful information that is important to an understanding of the results of the Company’s core business as well as provide information standard in the financial institution industry. Non-GAAP measures should not be considered a substitute for financial measures determined in accordance with GAAP and investors should consider the Company’s performance and financial condition as reported under GAAP and all other relevant information when assessing the performance or financial condition of the Company.
Overview
Significant factors management reviews to evaluate the Company’s operating results and financial condition include, but are not limited to: net income and earnings per share, return on average assets and equity, net interest margin, noninterest income, operating expenses, asset quality indicators, loan and deposit growth, capital management, liquidity and interest rate sensitivity, enhancements to customer products and services, technology advancements, market share and peer comparisons. The Company’s results in 2020 have been impacted by the COVID-19 pandemic and the CECL accounting methodology, including the estimated impact of the COVID-19 pandemic on expected credit losses. The following information should be considered in connection with the Company’s results for the fiscal year ended December 31, 2020:
| ● | net income of $104.4 million, or $2.37 diluted earnings per share |
| ● | pre-provision net revenue (“PPNR”)(1) of $193.4 million increased 6% from the prior year reflecting higher net interest income and higher noninterest income |
| ● | loan growth for the year ended December 31, 2020 of 5% |
| ● | strong credit quality metrics including charge-offs of 0.23% and allowance to loan losses at 1.47% of total loans |
| ● | book value per share of $27.22 at December 31, 2020; tangible book value per share grew 8% from prior year $20.52(2) at December 31, 2020 |
(1) PPNR is a Non-GAAP financial measure that management believes is useful in evaluating the underlying operating results of the Company excluding the volatility in loan loss provision due to CECL adoption and the impact of the COVID-19 pandemic, net securities gains (losses) and non-recurring income and/or expense.
Years Ended December 31, |
||||||||||||
(In thousands) |
2020 |
2019 |
2018 |
|||||||||
Net income before income tax expense |
$ |
133,087 |
$ |
155,432 |
$ |
137,002 |
||||||
FTE adjustment |
1,301 |
1,667 |
2,007 |
|||||||||
Provision for loan losses |
51,134 |
25,412 |
28,828 |
|||||||||
Net securities losses (gains) |
388 |
(4,213 |
) |
6,341 |
||||||||
Nonrecurring expense |
4,750 |
3,800 |
- |
|||||||||
CECL allowance for unfunded loan commitments |
2,700 |
- |
- |
|||||||||
PPNR |
$ |
193,360 |
$ |
182,098 |
$ |
174,178 |
||||||
(2) Non-GAAP measure - Stockholders’ equity less goodwill and intangible assets divided by common shares outstanding.
COVID-19 Pandemic and Company Response
The year 2020 began with overall stable U.S. economic conditions that were significantly impacted by the COVID-19 pandemic and subsequent shut-down of non-essential business throughout the Company’s footprint. A prolonged global pandemic like COVID-19 could adversely affect our operations. The results of operations and the ultimate effect of pandemic will depend on numerous factors that are highly uncertain including how long restrictions for business and individuals will last, further information around the severity of the virus itself, additional actions taken by federal, state and local governments to contain and treat COVID-19 and what, if any, additional government relief will be provided. The expected impact of the pandemic on the Company’s business, financial condition, results of operations, and its customers has not fully manifested in 2020. The fiscal stimulus and relief programs appear to have delayed any materially adverse financial impact to the Company. Once these stimulus programs have been exhausted, the Company’s credit metrics are expected to worsen and loan losses will ultimately materialize. Any potential loan losses will be contingent upon the resurgence of the virus, including any new strains, offset by the potency of the vaccine along with its extensive distribution, and the ability for customers and businesses to return to their pre-pandemic routines. However, economic uncertainty remains high and volatility is expected to continue.
In response, the Company immediately formed an Executive Task Force and engaged its established Incident Response Team under its Business Continuity Plan to execute a comprehensive pandemic response plan. The Company has taken significant steps to address the needs of its customers impacted by COVID-19. The Company provided payment relief for all its customers for 180 days or less, waiving associated late fees while not reporting these payment deferrals as late payments to the credit bureaus for all its consumer customers who were current prior to this event. The Company has also offered longer payment deferral options on a limited, case by case basis to address certain customers’ hardships related to the pandemic where we are able to gather information on the ongoing viability of the borrower’s long-term ability to return to full payment. The Company continues to responsibly lend to qualified consumer and commercial customers and designed special lending programs as well as participating in government sponsored relief programs to respond to customers’ needs during the pandemic. The Company believes our historically strong underwriting practices, diverse and granular portfolios, and geographic footprint will help to mitigate any adverse impact to the Company.
The Company has been a participant in the Small Business Administration’s Paycheck Protection Program (“PPP”), a new loan guarantee program created under the CARES Act targeted to provide small businesses with support to cover payroll and certain other expenses. Loans made under the PPP are fully guaranteed by the Small Business Administration (“SBA”), whose guarantee is backed by the full faith and credit of the United States. PPP covered loans also afford borrowers forgiveness up to the principal amount of the PPP covered loan, plus accrued interest, if the loan proceeds are used to retain workers and maintain payroll or to make certain mortgage interest, lease and utility payments, and certain other criteria are satisfied. The SBA will reimburse PPP lenders for any amount of a PPP covered loan that is forgiven, and PPP lenders will not be held liable for any representations made by PPP borrowers in connection with their requests for loan forgiveness. Lenders receive pre-determined fees for processing and servicing PPP loans. In addition, PPP loans are risk-weighted at zero percent under the generally-applicable Standardized Approach used to calculate risk-weighted assets for regulatory capital purposes. During 2020, the Company processed approximately 3,000 loans totaling over $548 million in relief. The Company is supporting PPP’s application and forgiveness processes with online resources, educational webinars and a CPA partnership. As of January 31, 2021, the Company has received payment from the SBA on 650 of our loans totaling $123.1 million.
On December 27, 2020, the President signed into law the Consolidated Appropriation Act (“CAA”). The CAA, among other things, extends the life of the PPP, effectively creating a second round of PPP loans for eligible businesses. The Company is participating in the CAA’s second round of PPP lending. In mid-January the Company opened our lending portal and have begun processing PPP loan applications from current and new customers. As of January 31, 2021, the Company has originated $111 million in PPP loans during this round with an average loan size of $145,100 and is continuing to receive applications.
The Company established a committee to ensure employee and customer safety and nimble response across geographic and functional areas. The five focus areas for the Company’s reopening are employee well-being, alternate work plans, physical workspace, working with customers and vendors, and policies, training and communication. The Committee monitored state and local responses and adapted physical locations across its footprint in its re-opening plans and will continue to monitor and adapt its response as the impact of COVID-19 continues to develop. The Company has taken significant actions to address the needs of employees and customers:
● Employees
- Health and safety protocols protect branch and onsite workers.
- Full-time remote and hybrid work arrangements continue for the majority of non-branch staff. Work-from-home experiences have been enhanced through investment in digital tools and technology.
- Offered additional benefits for health, childcare/eldercare needs and well-being including paid time off flexibility and childcare assistance program.
- Cross-training and redeployment programs directing staff resources to areas of greatest need.
● Customers
- Branches available by drive-up services and lobbies open by appointment.
- 31% increase in consumer digital adoption in 2020, including 86% increase in online account opening and 82% increase in mobile dollars deposited.
- Over 120,000 transactions moved to self-service from teller line and call center per month in 2020 (21% increase).
- New mobile, online and mortgage banking platforms launched in 2020.
Results of Operations
The Company reported net income of $104.4 million or $2.37 per diluted share for 2020, down 13.7% from net income of $121.0 million or down 13.5% from $2.74 per diluted share for 2019. Net interest income was $315.7 million for the year ended December 31, 2020, up $4.1 million, or 1.3%, from 2019. FTE net interest margin of 3.31% for the year ended December 31, 2020, was down from 3.58% for the year ended December 31, 2019. Average interest earning assets were up $832.5 million, or 9.5%, for the year ended December 31, 2020, as compared to 2019. The provision for loan losses totaled $51.1 million for the year ended December 31, 2020, as compared with $25.4 million for the year ended December 31, 2019. Significant non-recurring transactions occurring in 2020 included a $4.8 million expense related to branch optimization. Significant non-recurring transactions occurring in the third quarter of 2019 included a $4.0 million gain on the sale of Visa Class B common stock and a $3.1 million expense primarily related to branch optimization strategies. Return on average assets was 0.99% for the year ended December 31, 2020 as compared to 1.26% for the same period last year. Return on average equity was 9.09% for the year ended December 31, 2020 as compared to 11.32% for the year ended December 31, 2019. Return on average tangible common equity was 12.48% for the year ended December 31, 2020 as compared to 15.85% for the year ended December 31, 2019.
Return on average tangible common equity is a non-GAAP measure and excludes amortization of intangible assets (net of tax) from net income and average tangible equity calculated as follows:
Years Ended December 31, |
||||||||||||
(In thousands) |
2020 |
2019 |
2018 |
|||||||||
Net income |
$ |
104,388 |
$ |
121,021 |
$ |
112,566 |
||||||
Amortization of intangible assets (net of tax) |
2,546 |
2,684 |
3,032 |
|||||||||
Net income, excluding intangible amortization |
$ |
106,934 |
$ |
123,705 |
$ |
115,598 |
||||||
Average stockholders’ equity |
$ |
1,148,475 |
$ |
1,068,948 |
$ |
980,005 |
||||||
Less: average goodwill and other intangibles |
291,787 |
288,539 |
288,273 |
|||||||||
Average tangible common equity |
$ |
856,688 |
$ |
780,409 |
$ |
691,732 |
||||||
2021 Outlook
The Company’s 2020 earnings reflected the Company’s continued ability to manage through the existing economic conditions and challenges in the financial services industry, while investing in the Company’s future. During 2020, the Company, along with other financial services companies, experienced substantial disruptions from the COVID-19 pandemic and the accompanying rapid downward shift in the yield curve. The Company has observed signs of an economic recovery in the United States with jobs, consumer spending, manufacturing, and other indicators rebounding in the second half of 2020 from their weakest levels. The path of the COVID-19 virus, the effectiveness of the COVID-19 vaccine and rollout and the efficacy of the latest and any future stimulus packages will drive the re-opening plans of state and local economies in 2021. Significant items that may have an impact on 2021 results include:
| ● | continued slow economic growth and the need to spur recovery in the wake of the pandemic may result in interest rates remaining low. This would result in principal and interest payments on currently outstanding loans and investments being reinvested at lower rates. Already-low borrowing and deposit costs are unlikely to fall further. The timing and trajectory of a post-pandemic economic rebound will dictate short-term interest rate changes, if any, along with the shape of the yield curve, and will impact net interest income in 2021. |
| ● | continued slow economic growth could further reduce demand for credit, slowing loan growth. |
| ● | the Company’s continued focus on long-term strategies including growth in the New England markets, diversification of revenue, improving operating efficiencies and investing in technology. |
| ● | the Company’s 2021 outlook is subject to factors in addition to those identified above and those risks and uncertainties that could impact the Company’s future results are explained in ITEM 1A. RISK FACTORS. |
Asset/Liability Management
The Company attempts to maximize net interest income and net income, while actively managing its liquidity and interest rate sensitivity through the mix of various core deposit products and other sources of funds, which in turn fund an appropriate mix of earning assets. The changes in the Company’s asset mix and sources of funds, and the resulting impact on net interest income, on a FTE basis, are discussed below. The following table includes the condensed consolidated average balance sheet, an analysis of interest income/expense and average yield/rate for each major category of earning assets and interest-bearing liabilities on a taxable equivalent basis. Interest income for tax-exempt securities and loans has been adjusted to a taxable-equivalent basis using the statutory Federal income tax rate of 21% for 2020, 2019 and 2018.
Average Balances and Net Interest Income
2020 |
2019 |
2018 |
||||||||||||||||||||||||||||||||||
(Dollars in thousands) |
Average Balance |
Interest |
Yield/ Rate |
Average Balance |
Interest |
Yield/ Rate |
Average Balance |
Interest |
Yield/ Rate |
|||||||||||||||||||||||||||
Assets: |
||||||||||||||||||||||||||||||||||||
Short-term interest bearing accounts |
$ |
372,144 |
$ |
610 |
0.16 |
% |
$ |
36,174 |
$ |
773 |
2.14 |
% |
$ |
3,377 |
$ |
183 |
5.42 |
% |
||||||||||||||||||
Securities available for sale (1)(3) |
1,079,600 |
22,434 |
2.08 |
% |
961,909 |
23,334 |
2.43 |
% |
1,210,013 |
27,081 |
2.24 |
% |
||||||||||||||||||||||||
Securities held to maturity (1)(3) |
624,668 |
16,363 |
2.62 |
% |
725,352 |
20,410 |
2.81 |
% |
567,117 |
14,657 |
2.58 |
% |
||||||||||||||||||||||||
Federal Reserve Bank and FHLB stock |
33,570 |
2,096 |
6.24 |
% |
43,385 |
2,879 |
6.64 |
% |
48,214 |
3,083 |
6.39 |
% |
||||||||||||||||||||||||
Loans (2)(3) |
7,461,795 |
308,080 |
4.13 |
% |
6,972,438 |
321,805 |
4.62 |
% |
6,765,748 |
301,258 |
4.45 |
% |
||||||||||||||||||||||||
Total interest-earning assets |
$ |
9,571,777 |
$ |
349,583 |
3.65 |
% |
$ |
8,739,258 |
$ |
369,201 |
4.22 |
% |
$ |
8,594,469 |
$ |
346,262 |
4.03 |
% |
||||||||||||||||||
Other assets |
942,274 |
831,954 |
764,670 |
|||||||||||||||||||||||||||||||||
Total assets |
$ |
10,514,051 |
$ |
9,571,212 |
$ |
9,359,139 |
||||||||||||||||||||||||||||||
Liabilities and stockholders’ equity: |
||||||||||||||||||||||||||||||||||||
Money market deposit accounts |
$ |
2,320,947 |
$ |
10,313 |
0.44 |
% |
$ |
1,949,147 |
$ |
22,257 |
1.14 |
% |
$ |
1,706,823 |
$ |
8,314 |
0.49 |
% |
||||||||||||||||||
NOW deposit accounts |
1,194,398 |
716 |
0.06 |
% |
1,095,402 |
1,518 |
0.14 |
% |
1,191,008 |
1,894 |
0.16 |
% |
||||||||||||||||||||||||
Savings deposits |
1,393,436 |
745 |
0.05 |
% |
1,265,112 |
733 |
0.06 |
% |
1,266,970 |
725 |
0.06 |
% |
||||||||||||||||||||||||
Time deposits |
733,073 |
10,296 |
1.40 |
% |
910,546 |
15,478 |
1.70 |
% |
866,388 |
11,211 |
1.29 |
% |
||||||||||||||||||||||||
Total interest-bearing deposits |
$ |
5,641,854 |
$ |
22,070 |
0.39 |
% |
$ |
5,220,207 |
$ |
39,986 |
0.77 |
% |
$ |
5,031,189 |
$ |
22,144 |
0.44 |
% |
||||||||||||||||||
Short-term borrowings |
352,809 |
3,408 |
0.97 |
% |
573,927 |
9,693 |
1.69 |
% |
727,635 |
10,552 |
1.45 |
% |
||||||||||||||||||||||||
Long-term debt |
62,990 |
1,553 |
2.47 |
% |
80,528 |
1,875 |
2.33 |
% |
80,195 |
1,790 |
2.23 |
% |
||||||||||||||||||||||||
Subordinated debt |
51,394 |
2,842 |
5.53 |
% |
— |
— |
— |
— |
— |
— |
||||||||||||||||||||||||||
Junior subordinated debt |
101,196 |
2,731 |
2.70 |
% |
101,196 |
4,425 |
4.37 |
% |
101,196 |
4,140 |
4.09 |
% |
||||||||||||||||||||||||
Total interest-bearing liabilities |
$ |
6,210,243 |
$ |
32,604 |
0.53 |
% |
$ |
5,975,858 |
$ |
55,979 |
0.94 |
% |
$ |
5,940,215 |
$ |
38,626 |
0.65 |
% |
||||||||||||||||||
Demand deposits |
2,895,341 |
2,351,515 |
2,321,264 |
|||||||||||||||||||||||||||||||||
Other liabilities |
259,992 |
174,891 |
117,655 |
|||||||||||||||||||||||||||||||||
Stockholders’ equity |
1,148,475 |
1,068,948 |
980,005 |
|||||||||||||||||||||||||||||||||
Total liabilities and stockholders’ equity |
$ |
10,514,051 |
$ |
9,571,212 |
$ |
9,359,139 |
||||||||||||||||||||||||||||||
Net interest income (FTE) |
$ |
316,979 |
$ |
313,222 |
$ |
307,636 |
||||||||||||||||||||||||||||||
Interest rate spread |
3.12 |
% |
3.28 |
% |
3.38 |
% |
||||||||||||||||||||||||||||||
Net interest margin (FTE) |
3.31 |
% |
3.58 |
% |
3.58 |
% |
||||||||||||||||||||||||||||||
Taxable equivalent adjustment |
$ |
1,301 |
$ |
1,667 |
$ |
2,007 |
||||||||||||||||||||||||||||||
Net interest income |
$ |
315,678 |
$ |
311,555 |
$ |
305,629 |
||||||||||||||||||||||||||||||
| (1) | Securities are shown at average amortized cost. |
| (2) | For purposes of these computations, nonaccrual loans and loans held for sale are included in the average loan balances outstanding. |
| (3) | Interest income for tax-exempt securities and loans have been adjusted to a FTE basis using the statutory Federal income tax rate of 21%. |
2020 OPERATING RESULTS AS COMPARED TO 2019 OPERATING RESULTS
Net Interest Income
Net interest income for the year ended 2020 was $315.7 million, up $4.1 million, or 1.3%, from 2019. FTE net interest margin of 3.31% for the year ended December 31, 2020, was down from 3.58% for the year ended December 31, 2019. Interest income decreased $19.3 million, or 5.2%, as the yield on average interest-earning assets decreased 57 basis points (“bps”) from 2019 to 3.65%, while average interest-earning assets increased $823.5 million primarily due to excess liquidity and an increase in average loans due to PPP loan originations. Interest expense was down $23.4 million, or 41.8%, for the year ended December 31, 2020 as compared to the year ended December 31, 2019 as the cost of interest-bearing liabilities decreased 41 bps. The Federal Reserve lowered its target fed funds rate by 150 basis points in the first quarter of 2020.
Analysis of Changes in FTE Net Interest Income
Increase (Decrease) 2020 over 2019 |
Increase (Decrease) 2019 over 2018 |
|||||||||||||||||||||||
(In thousands) |
Volume |
Rate |
Total |
Volume |
Rate |
Total |
||||||||||||||||||
Short-term interest-bearing accounts |
$ |
1,150 |
$ |
(1,313 |
) |
$ |
(163 |
) |
$ |
764 |
$ |
(174 |
) |
$ |
590 |
|||||||||
Securities available for sale |
2,666 |
(3,566 |
) |
(900 |
) |
(5,883 |
) |
2,136 |
(3,747 |
) |
||||||||||||||
Securities held to maturity |
(2,702 |
) |
(1,345 |
) |
(4,047 |
) |
4,365 |
1,388 |
5,753 |
|||||||||||||||
Federal Reserve Bank and FHLB stock |
(621 |
) |
(162 |
) |
(783 |
) |
(317 |
) |
113 |
(204 |
) |
|||||||||||||
Loans |
21,634 |
(35,359 |
) |
(13,725 |
) |
9,356 |
11,191 |
20,547 |
||||||||||||||||
Total FTE interest income |
$ |
22,127 |
$ |
(41,745 |
) |
$ |
(19,618 |
) |
$ |
8,285 |
$ |
14,654 |
$ |
22,939 |
||||||||||
Money market deposit accounts |
3,628 |
(15,572 |
) |
(11,944 |
) |
1,332 |
12,611 |
13,943 |
||||||||||||||||
NOW deposit accounts |
126 |
(928 |
) |
(802 |
) |
(145 |
) |
(231 |
) |
(376 |
) |
|||||||||||||
Savings deposits |
71 |
(59 |
) |
12 |
(1 |
) |
9 |
8 |
||||||||||||||||
Time deposits |
(2,740 |
) |
(2,442 |
) |
(5,182 |
) |
596 |
3,671 |
4,267 |
|||||||||||||||
Short-term borrowings |
(2,977 |
) |
(3,308 |
) |
(6,285 |
) |
(2,435 |
) |
1,576 |
(859 |
) |
|||||||||||||
Long-term debt |
(427 |
) |
105 |
(322 |
) |
7 |
78 |
85 |
||||||||||||||||
Subordinated debt |
2,842 |
- |
2,842 |
- |
- |
- |
||||||||||||||||||
Junior subordinated debt |
- |
(1,694 |
) |
(1,694 |
) |
- |
285 |
285 |
||||||||||||||||
Total FTE interest expense |
$ |
523 |
$ |
(23,898 |
) |
$ |
(23,375 |
) |
$ |
(646 |
) |
$ |
17,999 |
$ |
17,353 |
|||||||||
Change in FTE net interest income |
$ |
21,604 |
$ |
(17,847 |
) |
$ |
3,757 |
$ |
8,931 |
$ |
(3,345 |
) |
$ |
5,586 |
||||||||||
Loans and Corresponding Interest and Fees on Loans
The average balance of loans increased by approximately $489.4 million, or 7.0%, from 2019 to 2020. The yield on average loans decreased from 4.62% in 2019 to 4.13% in 2020, as loans re-priced downward due to the interest rate environment in 2020. FTE interest income from loans decreased 4.3%, from $321.8 million in 2019 to $308.1 million in 2020. This decrease was due to the decreases in yields. Net interest income in 2020 included $14.2 million of interest and fees on PPP loans.
Total loans increased $362.8 million, or 5.1%, from December 31, 2019 to December 31, 2020. Total PPP loans as of December 31, 2020 were $431 million (net of unamortized fees), with $548 million originated at an average loan size of $184 thousand and an average annual fee of 3.2%. Excluding PPP loans, period end loans decreased $68.0 million from December 31, 2019. Commercial and industrial loans decreased $34.5 million to $1.3 billion; commercial real estate loans increased $238.3 million to $2.4 billion; and total consumer loans decreased $271.8 million to $3.4 billion. Total loans represent approximately 68.6% of assets as of December 31, 2020, as compared to 73.4% as of December 31, 2019.
The following table reflects the loan portfolio by major categories(1) for the years indicated:
Composition of Loan Portfolio
December 31, |
||||||||||||||||||||
(In thousands) |
2020 |
2019 |
2018 |
2017 |
2016 |
|||||||||||||||
Commercial |
$ |
1,267,679 |
$ |
1,302,209 |
$ |
1,291,568 |
$ |
1,258,212 |
$ |
1,242,701 |
||||||||||
Commercial real estate |
2,380,358 |
2,142,057 |
1,930,742 |
1,769,620 |
1,543,301 |
|||||||||||||||
Paycheck protection program |
430,810 |
- |
- |
- |
- |
|||||||||||||||
Residential real estate mortgages |
1,466,662 |
1,445,156 |
1,380,836 |
1,320,370 |
1,262,041 |
|||||||||||||||
Indirect auto |
931,286 |
1,193,635 |
1,216,144 |
1,227,870 |
1,169,129 |
|||||||||||||||
Specialty lending |
579,644 |
542,063 |
524,928 |
438,866 |
361,152 |
|||||||||||||||
Home equity |
387,974 |
444,082 |
474,566 |
498,179 |
507,784 |
|||||||||||||||
Other consumer |
54,472 |
66,896 |
68,925 |
70,522 |
110,870 |
|||||||||||||||
Total loans |
$ |
7,498,885 |
$ |
7,136,098 |
$ |
6,887,709 |
$ |
6,583,639 |
$ |
6,196,978 |
||||||||||
(1) Loans are summarized by business line which do not align to how the Company assesses credit risk in the estimate for credit losses under CECL.
Residential real estate loans consist primarily of loans secured by a first or second mortgage on primary residences. We originate adjustable-rate and fixed-rate, one-to-four-family residential real estate loans for the construction, purchase or refinancing of a mortgage. These loans are generally collateralized by properties located in the Company’s market area. Subprime mortgage lending, which has been the riskiest sector of the residential housing market, is not a market that the Company has ever actively pursued. The market does not apply a uniform definition of what constitutes “subprime” lending. Our reference to subprime lending relies upon the “Statement on Subprime Mortgage Lending” issued by the OTS and the other federal bank regulatory agencies (the “Agencies”), on June 29, 2007, which further referenced the “Expanded Guidance for Subprime Lending Programs,” or the Expanded Guidance, issued by the Agencies by press release dated January 31, 2001.
Loans in the commercial and commercial real estate, consist primarily of loans made to small and medium-sized entities. The Company offers a variety of loan options to meet the specific needs of our commercial customers including term loans, time notes and lines of credit. Such loans are made available to businesses for working capital needs such as inventory and receivables, business expansion, equipment purchases, livestock purchases and seasonal crop expenses. These loans typically are usually collateralized by business assets such as equipment, accounts receivable and perishable agricultural products, which are exposed to industry price volatility. The Company offers commercial real estate (“CRE”) loans to finance real estate purchases, refinancings, expansions and improvements to commercial and agricultural properties. CRE loans are loans secured by liens on real estate, which may include both owner occupied and non-owner-occupied properties, such as apartments, commercial structures, health care facilities and other facilities.
The Company offers a variety of Consumer loan products including indirect auto, specialty lending, home equity and other consumer loans. Indirect auto loans include indirect installment loans to individuals, which are primarily secured by automobiles. Although automobile loans have generally been originated through dealers, all applications submitted through dealers are subject to the Company’s normal underwriting and loan approval procedures. The specialty lending portfolio includes unsecured consumer loans across a national footprint originated through our relationship with national technology-driven consumer lending companies that began over 10 years ago as the result of our investment in Springstone Financial LLC (“Springstone”). Advances of credit through this specialty lending business line are to prime borrowers and are subject to the Company’s underwriting standards. Other Consumer loans consist of direct installment loans to individuals most secured by automobiles and other personal property. In addition to installment loans, the Company also offers personal lines of credit, overdraft protection, home equity lines of credit and second mortgage loans (loans secured by a lien position on one-to-four family residential real estate) to finance home improvements, debt consolidation, education and other uses. For home equity loans, consumers are able to borrow up to 85% of the equity in their homes, and are generally tied to Prime with a ten year draw followed by a fifteen year amortization. As of December 31, 2020, there were $144.1 million in construction and development loans included in total loans.
Risks associated with the commercial real estate portfolio include the ability of borrowers to pay interest and principal during the loan’s term, as well as the ability of the borrowers to refinance at the end of the loan term.
The following table, Maturities and Sensitivities of Certain Loans to Changes in Interest Rates, summarizes the maturities of the commercial and commercial real estate loan portfolios and the sensitivity of those loans to interest rate fluctuations at December 31, 2020. Scheduled repayments are reported in the maturity category in which the contractual payment is due.
Maturities and Sensitivities of Certain Loans to Changes in Interest Rates
Remaining Maturity at December 31, 2020 |
||||||||||||||||
(In thousands) |
Within One Year |
After One Year But Within Five Years |
After Five Years |
Total |
||||||||||||
Floating/adjustable rate: |
||||||||||||||||
Commercial and Commercial Real Estate |
$ |
360,085 |
$ |
441,090 |
$ |
1,797,050 |
$ |
2,598,225 |
||||||||
Fixed rate: |
||||||||||||||||
Commercial and Commercial Real Estate |
77,679 |
909,770 |
493,173 |
1,480,622 |
||||||||||||
Total |
$ |
437,764 |
$ |
1,350,860 |
$ |
2,290,223 |
$ |
4,078,847 |
||||||||
Securities and Corresponding Interest and Dividend Income
The average balance of securities available for sale (“AFS”) increased $117.7 million, or 12.2%, from 2019 to 2020. The FTE yield on average AFS securities was 2.08% for 2020 compared to 2.43% in 2019.
The average balance of securities held to maturity (“HTM”) decreased from $725.4 million in 2019 to $624.7 million in 2020. At December 31, 2020, HTM securities were comprised primarily of tax-exempt municipal securities and government-sponsored collateralized mortgage obligations (“CMOs”). The FTE yield on HTM securities decreased from 2.81% in 2019 to 2.62% in 2020.
The average balance of Federal Reserve Bank and Federal Home Loan Bank (“FHLB”) stock decreased to $33.6 million in 2020 from $43.4 million in 2019. The FTE yield from investments in Federal Reserve Bank and FHLB stock decreased from 6.64% in 2019 to 6.24% in 2020.
Securities Portfolio
As of December 31, |
||||||||||||||||||||||||
2020 |
2019 |
2018 |
||||||||||||||||||||||
(In thousands) |
Amortized Cost |
Fair Value |
Amortized Cost |
Fair Value |
Amortized Cost |
Fair Value |
||||||||||||||||||
AFS securities: |
||||||||||||||||||||||||
Federal agency |
$ |
245,590 |
$ |
243,597 |
$ |
34,998 |
$ |
34,758 |
$ |
84,982 |
$ |
84,299 |
||||||||||||
State & municipal |
42,550 |
43,180 |
2,533 |
2,513 |
30,136 |
29,915 |
||||||||||||||||||
Mortgage-backed |
576,497 |
595,839 |
498,372 |
503,626 |
522,415 |
512,295 |
||||||||||||||||||
Collateralized mortgage obligations |
426,574 |
437,804 |
432,651 |
434,443 |
380,093 |
371,987 |
||||||||||||||||||
Corporate |
27,500 |
28,278 |
- |
- |
- |
- |
||||||||||||||||||
Total AFS securities |
$ |
1,318,711 |
$ |
1,348,698 |
$ |
968,554 |
$ |
975,340 |
$ |
1,017,626 |
$ |
998,496 |
||||||||||||
HTM securities: |
||||||||||||||||||||||||
Federal agency |
$ |
100,000 |
$ |
98,342 |
$ |
- |
$ |
- |
$ |
19,995 |
$ |
20,047 |
||||||||||||
Mortgage-backed |
119,447 |
125,009 |
163,115 |
166,728 |
179,848 |
178,190 |
||||||||||||||||||
Collateralized mortgage obligations |
182,250 |
190,677 |
299,900 |
304,853 |
340,623 |
338,590 |
||||||||||||||||||
State & municipal |
214,863 |
222,799 |
167,059 |
169,681 |
243,133 |
241,848 |
||||||||||||||||||
Total HTM securities |
$ |
616,560 |
$ |
636,827 |
$ |
630,074 |
$ |
641,262 |
$ |
783,599 |
$ |
778,675 |
||||||||||||
The Company’s mortgage-backed securities, U.S. agency notes and CMOs are all guaranteed by Fannie Mae, Freddie Mac, the FHLB, Federal Farm Credit Banks or Ginnie Mae (“GNMA”). GNMA securities are considered similar in credit quality to U.S. Treasury securities, as they are backed by the full faith and credit of the U.S. government. Currently, there are no subprime mortgages in our investment portfolio.
The following tables set forth information with regard to contractual maturities of debt securities at December 31, 2020:
(Dollars in thousands) |
Amortized Cost |
Estimated Fair Value |
Weighted Average Yield |
|||||||||
AFS debt securities: |
||||||||||||
Within one year |
$ |
438 |
$ |
449 |
2.98 |
% |
||||||
From one to five years |
21,476 |
22,324 |
2.62 |
% |
||||||||
From five to ten years |
545,330 |
551,215 |
1.70 |
% |
||||||||
After ten years |
751,467 |
774,710 |
2.17 |
% |
||||||||
Total AFS debt securities |
$ |
1,318,711 |
$ |
1,348,698 |
||||||||
HTM debt securities: |
||||||||||||
Within one year |
$ |
18,088 |
$ |
18,104 |
2.07 |
% |
||||||
From one to five years |
58,963 |
60,483 |
2.64 |
% |
||||||||
From five to ten years |
231,927 |
237,275 |
1.72 |
% |
||||||||
After ten years |
307,582 |
320,965 |
2.51 |
% |
||||||||
Total HTM debt securities |
$ |
616,560 |
$ |
636,827 |
||||||||
Funding Sources and Corresponding Interest Expense
The Company utilizes traditional deposit products such as time, savings, NOW, money market and demand deposits as its primary source for funding. Other sources, such as short-term FHLB advances, federal funds purchased, securities sold under agreements to repurchase, brokered time deposits and long-term FHLB borrowings are utilized as necessary to support the Company’s growth in assets and to achieve interest rate sensitivity objectives. The average balance of interest-bearing liabilities increased $234.4 million from 2019 and totaled $6.2 billion in 2020. The rate paid on interest-bearing liabilities decreased from 0.94% in 2019 to 0.53% in 2020. This decrease in rates caused a decrease in interest expense of $23.4 million, or 41.8%, from $56.0 million in 2019 to $32.6 million in 2020.
Deposits
Average interest bearing deposits increased $421.6 million, or 8.1%, from 2019 to 2020. Average money market deposits increased $371.8 million, or 19.1% during 2020 compared to 2019. Average NOW accounts increased $99.0 million, or 9.0% during 2020 as compared to 2019. The average balance of savings accounts increased $128.3 million, or 10.1% during 2020 compared to 2019. The average balance of time deposits decreased $177.5 million, or 19.5%, from 2019 to 2020. The average balance of demand deposits increased $543.8 million, or 23.1%, during 2020 compared to 2019. The high rate of deposit growth was primarily due to funding of PPP loans and various government support programs.
The rate paid on average interest-bearing deposits was down 38 basis points to 0.39% for 2020. The rate paid for money market deposit accounts decreased from 1.14% during 2019 to 0.44% during 2020. The rate paid for NOW deposit accounts decreased from 0.14% in 2019 to 0.06% in 2020. The rate paid for savings deposits was 0.06% for 2019 and 0.05% for 2020. The rate paid for time deposits decreased from 1.70% during 2019 to 1.40% during 2020.
The following table presents the maturity distribution of time deposits of $250,000 or more:
(In thousands) |
December 31, 2020 |
|||
Within three months |
$ |
16,320 |
||
After three but within twelve months |
59,081 |
|||
After one but within three years |
15,982 |
|||
Over three years |
12,703 |
|||
Total |
$ |
104,086 |
||
Borrowings
Average short-term borrowings decreased to $352.8 million in 2020 from $573.9 million in 2019. The average rate paid on short-term borrowings decreased from 1.69% in 2019 to 0.97% in 2020. Average long-term debt decreased from $80.5 million in 2019 to $63.0 million in 2020.
The average balance of junior subordinated debt remained at $101.2 million in 2020. The average rate paid for junior subordinated debt in 2020 was 2.70%, down from 4.37% in 2019.
Short-term borrowings consist of federal funds purchased and securities sold under repurchase agreements, which generally represent overnight borrowing transactions and other short-term borrowings, primarily FHLB advances, with original maturities of one year or less. The Company has unused lines of credit with the FHLB and access to brokered deposits available for short-term financing of approximately $3.1 billion and $2.4 billion at December 31, 2020 and 2019, respectively. Securities collateralizing repurchase agreements are held in safekeeping by nonaffiliated financial institutions and are under the Company’s control. Long-term debt, which is comprised primarily of FHLB advances, are collateralized by the FHLB stock owned by the Company, certain of its mortgage-backed securities and a blanket lien on its residential real estate mortgage loans.
On June 23, 2020, the Company issued $100.0 million of 5.00% fixed-to-floating rate subordinated notes due 2030. The subordinated notes, which qualify as Tier 2 capital, bear interest at an annual rate of 5.00%, payable semi-annually in arrears commencing on January 1, 2021, and a floating rate of interest equivalent to the three-month Secured Overnight Financing Rate (“SOFR”) plus a spread of 4.85%, payable quarterly in arrears commencing on October 1, 2025. The subordinated debt issuance cost, which is being amortized on a straight-line basis, was $2.2 million. As of December 31, 2020 the subordinated debt net of unamortized issuance costs was $98.1 million.
Noninterest Income
Noninterest income is a significant source of revenue for the Company and an important factor in the Company’s results of operations. The following table sets forth information by category of noninterest income for the years indicated:
Years Ended December 31, |
||||||||||||
(In thousands) |
2020 |
2019 |
2018 |
|||||||||
Service charges on deposit account |
$ |
13,201 |
$ |
17,151 |
$ |
17,224 |
||||||
ATM and debit card fees |
25,960 |
23,893 |
22,699 |
|||||||||
Retirement plan administration fees |
35,851 |
30,388 |
26,992 |
|||||||||
Wealth management |
29,247 |
28,400 |
28,747 |
|||||||||
Insurance |
14,757 |
15,770 |
15,122 |
|||||||||
Bank owned life insurance |
5,743 |
5,355 |
5,091 |
|||||||||
Net securities (losses) gains |
(388 |
) |
4,213 |
(6,341 |
) |
|||||||
Other |
21,905 |
18,853 |
15,228 |
|||||||||
Total noninterest income |
$ |
146,276 |
$ |
144,023 |
$ |
124,762 |
||||||
Noninterest income for the year ended December 31, 2020 was $146.3 million, up $2.3 million, or 1.6%, from the year ended December 31, 2019. Excluding net securities gains (losses), noninterest income for the year ended December 31, 2020 was $146.7 million, up $6.9 million or 4.9%, from the year ended December 31, 2019. The increase from the prior year was driven by an increase in retirement plan administration fees due to the April 1, 2020 acquisition of Alliance Benefit Group of Illinois, Inc.(“ABG”), an increase in other noninterest income due primarily to higher swap fee income and mortgage banking income, and an increase in ATM and debit card fees due to increased volume and higher per transaction rates, partly offset by lower service charges on deposit accounts due to lower overdraft charges during the COVID-19 pandemic.
Noninterest Expense
Noninterest expenses are also an important factor in the Company’s results of operations. The following table sets forth the major components of noninterest expense for the years indicated:
Years Ended December 31, |
||||||||||||
(In thousands) |
2020 |
2019 |
2018 |
|||||||||
Salaries and employee benefits |
$ |
161,934 |
$ |
156,867 |
$ |
151,685 |
||||||
Occupancy |
21,634 |
22,706 |
22,318 |
|||||||||
Data processing and communications |
16,527 |
18,318 |
17,652 |
|||||||||
Professional fees and outside services |
15,082 |
14,785 |
14,376 |
|||||||||
Equipment |
19,889 |
18,583 |
17,037 |
|||||||||
Office supplies and postage |
6,138 |
6,579 |
6,204 |
|||||||||
FDIC expenses |
2,688 |
1,946 |
4,651 |
|||||||||
Advertising |
2,288 |
2,773 |
2,782 |
|||||||||
Amortization of intangible assets |
3,395 |
3,579 |
4,042 |
|||||||||
Loan collection and other real estate owned, net |
3,295 |
4,158 |
4,217 |
|||||||||
Other |
24,863 |
24,440 |
19,597 |
|||||||||
Total noninterest expense |
$ |
277,733 |
$ |
274,734 |
$ |
264,561 |
||||||
Noninterest expense for the year ended December 31, 2020 was $277.7 million, up $3.0 million or 1.1%, from the year ended December 31, 2019. The increase from the prior year was driven by higher salaries and employee benefits due to the ABG acquisition, higher equipment expense due to higher technology costs associated with several digital upgrades and higher Federal Deposit Insurance Corporation (“FDIC”) expense due to receipt of the Small Bank Assessment Credit in 2019. This was partly offset by lower data processing and communication expense as transaction volumes were down due to COVID-19 and lower occupancy expense driven by a relatively mild winter in 2020, the reduction in costs related to consolidation of five branches the prior year and the COVID-19 pandemic as compared to the year ended December 31, 2019. Included in other noninterest expenses was $4.8 million in branch optimization charges in 2020 and $3.1 million in reorganization expenses incurred during 2019, primarily related to branch optimization strategies to improve future operating efficiencies.
Income Taxes
We calculate our current and deferred tax provision based on estimates and assumptions that could differ from the actual results reflected in income tax returns filed during the subsequent year. Adjustments based on filed returns are recorded when identified, which is generally in the fourth quarter of the subsequent year for U.S. federal and state provisions.
The amount of income taxes the Company pays is subject at times to ongoing audits by U.S. federal and state tax authorities, which may result in proposed assessments. Future results may include favorable or unfavorable adjustments to the estimated tax liabilities in the period the assessments are proposed or resolved or when statutes of limitation on potential assessments expire. As a result, the Company’s effective tax rate may fluctuate significantly on a quarterly or annual basis.
Income tax expense for the year ended December 31, 2020 was $28.7 million, down $5.7 million, or 16.6%, from the year ended December 31, 2019. The effective tax rate of 21.6% in 2020 was down from 22.1% in 2019. The decrease in income tax expense from the prior year was due to a lower level of taxable income as a result of the COVID-19 pandemic and increased provision for loan losses.
Risk Management – Credit Risk
Credit risk is managed through a network of loan officers, credit committees, loan policies and oversight from senior credit officers and Board of Directors. Management follows a policy of continually identifying, analyzing and grading credit risk inherent in each loan portfolio. An ongoing independent review of individual credits in the commercial loan portfolio is performed by the independent loan review function. These components of the Company’s underwriting and monitoring functions are critical to the timely identification, classification and resolution of problem credits.
Nonperforming assets consist of nonaccrual loans, loans 90 days or more past due and still accruing, restructured loans, other real estate owned (“OREO”) and nonperforming securities. Loans are generally placed on nonaccrual when principal or interest payments become 90 days past due, unless the loan is well secured and in the process of collection. Loans may also be placed on nonaccrual when circumstances indicate that the borrower may be unable to meet the contractual principal or interest payments. OREO represents property acquired through foreclosure and is valued at the lower of the carrying amount or fair value, less any estimated disposal costs.
Nonperforming Assets
As of December 31, |
||||||||
(Dollars in thousands) |
2020 |
% |
||||||
Nonaccrual loans: |
||||||||
Commercial |
$ |
23,557 |
53 |
% |
||||
Residential |
13,082 |
29 |
% |
|||||
Consumer |
3,020 |
7 |
% |
|||||
Troubled debt restructured loans |
4,988 |
11 |
% |
|||||
Total nonaccrual loans |
$ |
44,647 |
100 |
% |
||||
Loans 90 days or more past due and still accruing: |
||||||||
Commercial |
$ |
493 |
16 |
% |
||||
Residential |
518 |
16 |
% |
|||||
Consumer |
2,138 |
68 |
% |
|||||
Total loans 90 days or more past due and still accruing |
$ |
3,149 |
100 |
% |
||||
Total nonperforming loans |
$ |
47,796 |
||||||
Other real estate owned |
1,458 |
|||||||
Total nonperforming assets |
$ |
49,254 |
||||||
Total nonperforming loans to total loans |
0.64 |
% |
||||||
Total nonperforming assets to total assets |
0.45 |
% |
||||||
Total allowance for loan losses to nonperforming loans |
230.14 |
% |
||||||
The following tables are related to non-performing loans in prior periods. Non-performing loans are summarized by business line which do not align to how the Company assesses credit risk in the estimate for credit losses under CECL for 2020.
As of December 31, |
||||||||||||||||||||||||||||||||
(Dollars in thousands) |
2019 |
% |
2018 |
% |
2017 |
% |
2016 |
% |
||||||||||||||||||||||||
Nonaccrual loans: |
||||||||||||||||||||||||||||||||
Commercial |
$ |
12,379 |
49 |
% |
$ |
11,804 |
46 |
% |
$ |
12,485 |
48 |
% |
$ |
19,351 |
54 |
% |
||||||||||||||||
Residential real estate |
5,233 |
21 |
% |
6,526 |
26 |
% |
5,919 |
23 |
% |
8,027 |
23 |
% |
||||||||||||||||||||
Consumer |
4,046 |
16 |
% |
4,068 |
16 |
% |
4,324 |
17 |
% |
4,653 |
13 |
% |
||||||||||||||||||||
Troubled debt restructured loans |
3,516 |
14 |
% |
3,089 |
12 |
% |
2,980 |
12 |
% |
3,681 |
10 |
% |
||||||||||||||||||||
Total nonaccrual loans |
$ |
25,174 |
100 |
% |
$ |
25,487 |
100 |
% |
$ |
25,708 |
100 |
% |
$ |
35,712 |
100 |
% |
||||||||||||||||
Loans 90 days or more past due and still accruing: |
||||||||||||||||||||||||||||||||
Commercial |
$ |
- |
- |
$ |
588 |
12 |
% |
$ |
- |
- |
$ |
- |
- |
|||||||||||||||||||
Residential real estate |
927 |
25 |
% |
1,182 |
23 |
% |
1,402 |
26 |
% |
1,733 |
36 |
% |
||||||||||||||||||||
Consumer |
2,790 |
75 |
% |
3,315 |
65 |
% |
4,008 |
74 |
% |
3,077 |
64 |
% |
||||||||||||||||||||
Total loans 90 days or more past due and still accruing |
$ |
3,717 |
100 |
% |
$ |
5,085 |
100 |
% |
$ |
5,410 |
100 |
% |
$ |
4,810 |
100 |
% |
||||||||||||||||
Total nonperforming loans |
$ |
28,891 |
$ |
30,572 |
$ |
31,118 |
$ |
40,522 |
||||||||||||||||||||||||
Other real estate owned |
1,458 |
2,441 |
4,529 |
5,581 |
||||||||||||||||||||||||||||
Total nonperforming assets |
$ |
30,349 |
$ |
33,013 |
$ |
35,647 |
$ |
46,103 |
||||||||||||||||||||||||
Total nonperforming loans to total loans |
0.40 |
% |
0.44 |
% |
0.47 |
% |
0.65 |
% |
||||||||||||||||||||||||
Total nonperforming assets to total assets |
0.31 |
% |
0.35 |
% |
0.39 |
% |
0.52 |
% |
||||||||||||||||||||||||
Total allowance for loan losses to nonperforming loans |
252.55 |
% |
237.16 |
% |
223.34 |
% |
160.90 |
% |
||||||||||||||||||||||||
Total nonperforming assets were $49.3 million at December 31, 2020, compared to $30.3 million at December 31, 2019. Nonperforming loans at December 31, 2020 were $47.8 million, or 0.64% of total loans (0.68% excluding PPP loan originations), compared with $28.9 million, or 0.40% of total loans, at December 31, 2019. The increase in nonperforming loans resulted primarily from five COVID-19 impacted commercial relationships totaling $15.2 million moving to nonaccrual. Past due loans as a percentage of total loans was 0.37% at December 31, 2020 (0.39% excluding PPP loan originations), down from 0.49% at December 31, 2019. Past due loans as a percentage of total loans decreased due to payment relief available to COVID-19 impacted borrowers.
The Company began offering short-term loan modifications to assist borrowers during the COVID-19 national emergency. The CARES Act, along with a joint agency statement issued by banking regulatory agencies, provides that short-term modifications made in response to COVID-19 do not need to be accounted for as a troubled debt restructuring (“TDR”). The Company evaluated the short-term modification programs provided to its borrowers and has concluded the modifications were generally made to borrowers who were in good standing prior to the COVID-19 pandemic and the modifications were temporary and minor in nature and therefore do not qualify for designation as TDRs. As of December 31, 2020, 1.6% of total loans outstanding (excluding PPP loan originations) were in payment deferral programs, of which 80% are commercial borrowers and 20% are consumer borrowers.
In addition to nonperforming loans discussed above, the Company has also identified approximately $136.6 million in potential problem loans at December 31, 2020 as compared to $84.1 million at December 31, 2019. The increase in potential problem loans is primarily due to the Company’s proactive approach to risk ratings throughout the deferral process and relates to higher risk industries impacted by the COVID-19 pandemic. Higher risk industries include entertainment, restaurants, retail, healthcare and accommodations. As of December 31, 2020, 9.0% of the Company’s outstanding loans were in higher risk industries due to the COVID-19 pandemic. Potential problem loans are loans that are currently performing, with a possibility of loss if weaknesses are not corrected. Such loans may need to be disclosed as nonperforming at some time in the future. Potential problem loans are classified by the Company’s loan rating system as “substandard.” Management cannot predict the extent to which economic conditions may worsen or other factors, which may impact borrowers and the potential problem loans. Accordingly, there can be no assurance that other loans will not become 90 days or more past due, be placed on nonaccrual, become restructured or require increased allowance coverage and provision for loan losses. To mitigate this risk the Company maintains a diversified loan portfolio, has no significant concentration in any particular industry and originates loans primarily within its footprint.
Allowance for Loan Losses
Beginning January 1, 2020, we calculated the allowance for credit losses using current expected credit losses methodology. As a result of our January 1, 2020, adoption of CECL and its related amendments, our methodology for estimating the allowance for credit losses changed significantly from December 31, 2019. The Company recorded a net decrease to retained earnings of $4.3 million as of January 1, 2020 for the cumulative effect of adopting ASU 2016-13. The transition adjustment includes a $3.0 million impact due to the allowance for credit losses on loans, a $2.8 million impact due to the allowance for unfunded commitments reserve, and a $1.5 million impact to the deferred tax asset.
The CECL approach requires an estimate of the credit losses expected over the life of a loan (or pool of loans). It replaces the incurred loss approach’s threshold that required the recognition of a credit loss when it was probable a loss event was incurred. The allowance for credit losses is a valuation account that is deducted from, or added to, the loans’ amortized cost basis to present the net, lifetime amount expected to be collected on the loans. Loan losses are charged off against the allowance when management believes a loan balance is confirmed to be uncollectible. Expected recoveries do not exceed the aggregate of amounts previously charged-off and expected to be charged-off.
Management estimates the allowance balance using relevant available information, from internal and external sources, related to past events, current conditions, and reasonable and supportable forecasts. Historical credit loss experience provides the basis for the estimation of expected credit losses. Company historical loss experience was supplemented with peer information when there was insufficient loss data for the Company. Significant management judgment is required at each point in the measurement process.
The allowance for credit losses is measured on a collective (pool) basis, with both a quantitative and qualitative analysis that is applied on a quarterly basis, when similar risk characteristics exist. The respective quantitative allowance for each segment is measured using an econometric, discounted PD/LGD modeling methodology in which distinct, segment-specific multi-variate regression models are applied to multiple, probabilistically weighted external economic forecasts. Under the discounted cash flows methodology, expected credit losses are estimated over the effective life of the loans by measuring the difference between the net present value of modeled cash flows and amortized cost basis. After quantitative considerations, management applies additional qualitative adjustments so that the allowance for credit loss is reflective of the estimate of lifetime losses that exist in the loan portfolio at the balance sheet date.
Portfolio segment is defined as the level at which an entity develops and documents a systematic methodology to determine its allowance for credit losses. Upon adoption of CECL, management revised the manner in which loans were pooled for similar risk characteristics. Management developed segments for estimating loss based on type of borrower and collateral which is generally based upon federal call report segmentation and have been combined or subsegmented as needed to ensure loans of similar risk profiles are appropriately pooled.
Additional information about our Allowance for Loan Losses is included in Notes 1 and 6 to the consolidated financial statements. The Company’s management considers the allowance for credit losses to be appropriate based on evaluation and analysis of the loan portfolio.
The allowance for credit losses totaled $110.0 million at December 31, 2020, compared to $73.0 million at December 31, 2019. The allowance for credit losses as a percentage of loans was 1.47% (1.56% excluding PPP loans) at December 31, 2020, compared to 1.02% at December 31, 2019. The increase in the allowance for credit losses from January 1, 2020 to December 31, 2020 was primarily due to the deteriorated economic forecast due to the COVID-19 pandemic.
(Dollars in thousands) |
2020 |
|||
Balance at January 1* |
$ |
75,999 |
||
Loans charged-off |
||||
Commercial |
4,005 |
|||
Residential |
1,135 |
|||
Consumer |
21,938 |
|||
Total loans charged-off |
$ |
27,078 |
||
Recoveries |
||||
Commercial |
$ |
786 |
||
Residential |
618 |
|||
Consumer |
8,541 |
|||
Total recoveries |
$ |
9,945 |
||
Net loans charged-off |
$ |
17,133 |
||
Provision for loan losses |
$ |
51,134 |
||
Balance at December 31 |
$ |
110,000 |
||
Allowance for loan losses to loans outstanding at end of year |
1.47 |
% |
||
Net charge-offs to average loans outstanding |
0.23 |
% |
||
| * | Includes an adjustment of $3.0 million as a result of our January 1, 2020, adoption of Accounting Standards Codification (“ASC”) 326. |
Prior to the adoption of ASU 2016-13 on January 1, 2020, the Company’s calculated allowance for loan losses used the incurred loss methodology. The following tables related to the allowance for loan losses in prior periods under the incurred methodology. Charge-off and recoveries are summarized by business line which do not align to how the Company assesses credit risk in the estimate for credit losses under CECL for 2020.
(Dollars in thousands) |
2019 |
2018 |
2017 |
2016 |
||||||||||||
Balance at January 1 |
$ |
72,505 |
$ |
69,500 |
$ |
65,200 |
$ |
63,018 |
||||||||
Loans charged-off |
||||||||||||||||
Commercial and Agricultural |
3,151 |
3,463 |
4,169 |
4,592 |
||||||||||||
Residential Real Estate |
991 |
913 |
1,846 |
1,343 |
||||||||||||
Consumer |
28,398 |
29,752 |
27,072 |
23,364 |
||||||||||||
Total loans charged-off |
$ |
32,540 |
$ |
34,128 |
$ |
33,087 |
$ |
29,299 |
||||||||
Recoveries |
||||||||||||||||
Commercial and Agricultural |
$ |
534 |
$ |
1,178 |
$ |
1,077 |
$ |
1,887 |
||||||||
Residential Real Estate |
141 |
306 |
180 |
293 |
||||||||||||
Consumer |
6,913 |
6,821 |
5,142 |
3,870 |
||||||||||||
Total recoveries |
$ |
7,588 |
$ |
8,305 |
$ |
6,399 |
$ |
6,050 |
||||||||
Net loans charged-off |
$ |
24,952 |
$ |
25,823 |
$ |
26,688 |
$ |
23,249 |
||||||||
Provision for loan losses |
$ |
25,412 |
$ |
28,828 |
$ |
30,988 |
$ |
25,431 |
||||||||
Balance at December 31 |
$ |
72,965 |
$ |
72,505 |
$ |
69,500 |
$ |
65,200 |
||||||||
Allowance for loan losses to loans outstanding at end of year |
1.02 |
% |
1.05 |
% |
1.06 |
% |
1.05 |
% |
||||||||
Net charge-offs to average loans outstanding |
0.36 |
% |
0.38 |
% |
0.42 |
% |
0.39 |
% |
||||||||
The provision for loan losses was $51.1 million for the twelve months ended December 31, 2020, compared to $25.4 million for the twelve months ended December 31, 2019. The allowance for credit losses was 230.14% of nonperforming loans at December 31, 2020 as compared to 252.55% at December 31, 2019. The allowance for credit losses as a percentage of loans was 1.47% (1.56% excluding PPP loan originations) at December 31, 2020 compared to 1.02% at December 31, 2019. The increase to the Day 1 allowance for credit loss and provision expense was driven by the deteriorated economic forecast due to the COVID-19 pandemic. The Company expects that with the adoption of CECL beginning on January 1, 2020, provision expense may become more volatile due to changes in CECL model assumptions of credit quality, macroeconomic factors and conditions, and loan composition, which drive the allowance for credit losses balance.
Total net charge-offs for 2020 were $17.1 million, down from $25.0 million in 2019. Net charge-offs to average loans was 23 bps for 2020 compared to 36 bps for 2019. Net charge-offs to average loans decreased during 2020 due to COVID-19 pandemic relief programs.
Allocation of the Allowance for Loan Losses
December 31, |
||||||||
2020 |
||||||||
(Dollars in thousands) |
Allowance |
Category Percent of Loans |
||||||
Commercial |
$ |
50,942 |
53 |
% |
||||
Residential |
21,255 |
26 |
% |
|||||
Consumer |
37,803 |
21 |
% |
|||||
Total |
$ |
110,000 |
100 |
% |
||||
Prior to the adoption of ASU 2016-13 on January 1, 2020, the Company’s calculated allowance for loan losses used the incurred loss methodology. The following tables are related to the allowance for loan losses in prior periods. Category percentage of loans are summarized by business line which do not align to how the Company assesses credit risk in the estimate for credit losses under CECL for 2020.
December 31, |
||||||||||||||||||||||||||||||||
2019 |
2018 |
2017 |
2016 |
|||||||||||||||||||||||||||||
Dollars in thousands) |
Allowance |
Category Percent of Loans |
Allowance |
Category Percent of Loans |
Allowance |
Category Percent of Loans |
Allowance |
Category Percent of Loans |
||||||||||||||||||||||||
Commercial and Agricultural |
$ |
34,525 |
48 |
% |
$ |
32,759 |
47 |
% |
$ |
27,606 |
46 |
% |
$ |
25,444 |
45 |
% |
||||||||||||||||
Residential Real Estate |
2,793 |
20 |
% |
2,568 |
20 |
% |
5,064 |
20 |
% |
6,381 |
20 |
% |
||||||||||||||||||||
Consumer |
35,647 |
32 |
% |
37,178 |
33 |
% |
36,830 |
34 |
% |
33,375 |
35 |
% |
||||||||||||||||||||
Total |
$ |
72,965 |
100 |
% |
$ |
72,505 |
100 |
% |
$ |
69,500 |
100 |
% |
$ |
65,200 |
100 |
% |
||||||||||||||||
Allowance for Credit Losses on Off-Balance Sheet Credit Exposures
The Company estimates expected credit losses over the contractual period in which the Company has exposure to credit risk via a contractual obligation to extend credit, unless that obligation is unconditionally cancellable by the Company. The allowance for credit losses on off-balance sheet credit exposures is adjusted as an expense in other noninterest expense. The estimate includes consideration of the likelihood that funding will occur and an estimate of expected credit losses on commitments expected to be funded over their estimated lives. As of December 31, 2020, the allowance for losses on unfunded commitments totaled $6.4 million, compared to $0.9 million as of December 31, 2019. The increase in the allowance in 2020 compared to 2019 is related to an increase in expected losses due to the adoption of CECL and the deterioration of the economic forecast due to COVID-19. Prior to January 1, 2020, the Company calculated the allowance for losses on unfunded commitments using the incurred loss methodology.
Liquidity Risk
Liquidity involves the ability to meet the cash flow requirements of depositors wanting to withdraw funds or borrowers needing assurance that sufficient funds will be available to meet their credit needs. Management’s Asset Liability Committee (“ALCO”) is responsible for liquidity management and has developed guidelines, which cover all assets and liabilities, as well as off-balance sheet items that are potential sources or uses of liquidity. Liquidity policies must also provide the flexibility to implement appropriate strategies, regular monitoring of liquidity and testing of the contingent liquidity plan. Requirements change as loans grow, deposits and securities mature and payments on borrowings are made. Liquidity management includes a focus on interest rate sensitivity management with a goal of avoiding widely fluctuating net interest margins through periods of changing economic conditions.
The primary liquidity measurement the Company utilizes is called “Basic Surplus,” which captures the adequacy of its access to reliable sources of cash relative to the stability of its funding mix of average liabilities. This approach recognizes the importance of balancing levels of cash flow liquidity from short and long-term securities with the availability of dependable borrowing sources, which can be accessed when necessary. At December 31, 2020 and 2019, the Company’s Basic Surplus measurement was 25.7% and 15.8% of total assets, or $2.8 billion and $1.5 billion, respectively, which was above the Company’s minimum of 5% (calculated at $546.6 million and $485.8 million, of period end total assets at December 31, 2020 and 2019, respectively) set forth in its liquidity policies.
At December 31, 2020 and 2019, FHLB advances outstanding totaled $64.1 million and $510.7 million, respectively. At December 31, 2020 and 2019, the Bank had $74.0 million and $75.0 million, respectively of collateral encumbered by municipal letters of credit.The Bank is a member of the FHLB system and had additional borrowing capacity from the FHLB of approximately $1.6 billion and $1.2 billion at December 31, 2020 and 2019, respectively. In addition, unpledged securities could have been used to increase borrowing capacity at the FHLB by an additional $839.4 million and $627.6 million at December 31, 2020 and 2019, respectively, or used to collateralize other borrowings, such as repurchase agreements. The Company also has the ability to issue brokered time deposits and to borrow against established borrowing facilities with other banks (federal funds), which could provide additional liquidity of $1.8 billion at December 31, 2020 and $1.4 billion at December 31, 2019. In addition, the Bank has a “Borrower-in-Custody” program with the FRB with the addition of the ability to pledge automobile loans as collateral. At December 31, 2020 and 2019, the Bank had the capacity to borrow $658.1 million and $837.3 million, respectively, from this program. In addition, due to the creation of the Paycheck Protection Program Liquidity Facility during 2020, the Bank has the ability to borrow $447.8 million through this program as of December 31, 2020. The Company’s internal policies authorize borrowings up to 25% of assets. Under this policy, remaining available borrowings capacity totaled $2.6 billion at December 31, 2020 and $1.8 billion at December 31, 2019.
This Basic Surplus approach enables the Company to appropriately manage liquidity from both operational and contingency perspectives. By tempering the need for cash flow liquidity with reliable borrowing facilities, the Company is able to operate with a more fully invested and, therefore, higher interest income generating securities portfolio. The makeup and term structure of the securities portfolio is, in part, impacted by the overall interest rate sensitivity of the balance sheet. Investment decisions and deposit pricing strategies are impacted by the liquidity position. The Company considered its Basic Surplus position to be strong. However, certain events may adversely impact the Company’s liquidity position in 2021. The large inflow of deposits experienced in the second quarter of 2020 could reverse itself and flow out. In the current economic environment, draws against lines of credit could drive asset growth higher. Disruptions in wholesale funding markets could spark increased competition for deposits. These scenarios could lead to a decrease in the Company’s Basic Surplus measure below the minimum policy level of 5%. Significant monetary and fiscal policy actions taken by the federal government have helped to mitigate these risks. Enhanced liquidity monitoring was put in place to quickly respond to the changing environment during the COVID-19 pandemic including increasing the frequency of monitoring and adding additional sources of liquidity.
At December 31, 2020, a portion of the Company’s loans and securities were pledged as collateral on borrowings. Therefore, once on-balance-sheet liquidity is depleted, future growth of earning assets will depend upon the Company’s ability to obtain additional funding, through growth of core deposits and collateral management and may require further use of brokered time deposits or other higher cost borrowing arrangements.
Net cash flows provided by operating activities totaled $142.4 million and $153.5 million in 2020 and 2019, respectively. The critical elements of net operating cash flows include net income, adjusted for non-cash income and expense items such as the provision for loan losses, deferred income tax expense, depreciation and amortization and cash flows generated through changes in other assets and liabilities.
Net cash flows used in investing activities totaled $709.7 million and $64.3 million in 2020 and 2019, respectively. Critical elements of investing activities are loan and investment securities transactions.
Net cash flows provided by financing activities totaled $1.0 billion in 2020 and net cash flows used in financing activities totaled $53.2 million in 2019. The critical elements of financing activities are proceeds from deposits, borrowings and stock issuance. In addition, financing activities are impacted by dividends and treasury stock transactions.
Contractual Obligations
In connection with its financing and operating activities, the Company has entered into certain contractual obligations. The Company’s future minimum cash payments, excluding interest, associated with its contractual obligations pursuant to its borrowing agreements, leases and other obligations at December 31, 2020 are as follows:
Payments Due by Period |
||||||||||||||||||||||||||||
(In thousands) |
2021 |
2022 |
2023 |
2024 |
2025 |
Thereafter |
Total |
|||||||||||||||||||||
Long-term debt obligations |
$ |
25,003 |
$ |
10,598 |
$ |
- |
$ |
- |
$ |
- |
$ |
3,496 |
$ |
39,097 |
||||||||||||||
Subordinated debt |
- |
- |
- |
- |
- |
100,000 |
100,000 |
|||||||||||||||||||||
Junior subordinated debt |
- |
- |
- |
- |
- |
101,196 |
101,196 |
|||||||||||||||||||||
Lease obligations |
7,734 |
6,795 |
5,699 |
5,029 |
3,411 |
10,023 |
38,691 |
|||||||||||||||||||||
IT/Software obligations |
9,576 |
4,114 |
3,930 |
3,070 |
957 |
73 |
21,720 |
|||||||||||||||||||||
Data processing commitments |
15,573 |
15,573 |
15,573 |
14,843 |
14,600 |
- |
76,162 |
|||||||||||||||||||||
Total contractual obligations |
$ |
57,886 |
$ |
37,080 |
$ |
25,202 |
$ |
22,942 |
$ |
18,968 |
$ |
214,788 |
$ |
376,866 |
||||||||||||||
We have obligations under our pension, post-retirement plan, directors’ retirement and supplemental executive retirement plans as described in Note 12 to the consolidated financial statements. The supplemental executive retirement, pension and postretirement benefit and directors’ retirement payments represent actuarially determined future benefit payments to eligible plan participants.
Commitments to Extend Credit
The Company makes contractual commitments to extend credit, which include unused lines of credit, which are subject to the Company’s credit approval and monitoring procedures. At December 31, 2020 and 2019, commitments to extend credit in the form of loans, including unused lines of credit, amounted to $2.2 billion and $1.9 billion, respectively. In the opinion of management, there are no material commitments to extend credit, including unused lines of credit that represent unusual risks. All commitments to extend credit in the form of loans, including unused lines of credit, expire within one year.
Standby Letters of Credit
The Company does not issue any guarantees that would require liability-recognition or disclosure, other than its standby letters of credit. The Company guarantees the obligations or performance of customers by issuing standby letters of credit to third-parties. These standby letters of credit are frequently issued in support of third-party debt, such as corporate debt issuances, industrial revenue bonds and municipal securities. The risk involved in issuing standby letters of credit is essentially the same as the credit risk involved in extending loan facilities to customers and letters of credit are subject to the same credit origination, portfolio maintenance and management procedures in effect to monitor other credit and off-balance sheet products. Typically, these instruments have one year expirations with an option to renew upon annual review; therefore, the total amounts do not necessarily represent future cash requirements. At December 31, 2020 and 2019, outstanding standby letters of credit were approximately $54.0 million and $34.5 million, respectively. The fair value of the Company’s standby letters of credit at December 31, 2020 and 2019 was not significant. The following table sets forth the commitment expiration period for standby letters of credit at:
(In thousands) |
December 31, 2020 |
|||
Within one year |
$ |
27,417 |
||
After one but within three years |
23,917 |
|||
After three but within five years |
1,074 |
|||
After five years |
1,601 |
|||
Total |
$ |
54,009 |
||
Interest Rate Swaps
The Company records all derivatives on the balance sheet at fair value. The accounting for changes in the fair value of derivatives depends on the intended use of the derivative, whether the Company has elected to designate a derivative in a hedging relationship and apply hedge accounting, and whether the hedging relationship has satisfied the criteria necessary to apply hedge accounting. Derivatives designated and qualifying as a hedge of the exposure to changes in the fair value of an asset, liability or firm commitment attributable to a particular risk, such as interest rate risk, are considered fair value hedges. Derivatives designated and qualifying as a hedge of the exposure to variability in expected future cash flows, or other types of forecasted transactions, are considered cash flow hedges. Hedge accounting generally provides for the matching of the timing of gain or loss recognition on the hedging instrument with the recognition of the changes in the fair value of the hedged asset or liability that are attributable to the hedged risk in a fair value hedge or the earnings effect of the hedged forecasted transactions in a cash flow hedge. The Company may enter into derivative contracts that are intended to economically hedge certain of its risks, even though hedge accounting does not apply or the Company elects not to apply hedge accounting.
For derivatives designated as fair value hedges, changes in the fair value of the derivative and the hedged item related to the hedged risk are recognized in earnings. When the cash flows associated with the hedged item are realized, the gain or loss included in OCI is recognized in the consolidated statements of income.
When the Company participates with another lending institution in a commercial loan with an associated interest rate swap, it may enter a risk participation agreement with the participating lending institution. In cases where the other institution originated the swap, the Company may assume a portion of the credit risk related to the swap. In cases where the Company originated the swap, the other institution may assume a portion of the credit risk related to the swap. Any fee paid to or by the Company under a risk participation agreement is in consideration of the credit risk of the counterparties and is recognized in the income statement. Credit risk on the risk participation agreements is determined after considering the risk rating, probability of default and loss given default of the counterparties.
Loans Serviced for Others and Loans Sold with Recourse
The total amount of loans serviced by the Company for unrelated third parties was approximately $614.5 million and $612.3 million at December 31, 2020 and 2019, respectively. At December 31, 2020 and 2019, the Company had approximately $1.3 million and $0.8 million, respectively, of mortgage servicing rights. At December 31, 2020 and 2019, the Company serviced $25.7 million and $25.6 million, respectively, of agricultural loans sold with recourse. Due to sufficient collateral on these loans and government guarantees, no reserve is considered necessary at December 31, 2020 and 2019. As of December 31, 2020 and 2019, the Company serviced $11.8 million and $64.7 million, respectively, of consumer loans for Springstone.
Capital Resources
Consistent with its goal to operate a sound and profitable financial institution, the Company actively seeks to maintain a “well-capitalized” institution in accordance with regulatory standards. The principal source of capital to the Company is earnings retention. The Company’s capital measurements are in excess of both regulatory minimum guidelines and meet the requirements to be considered well-capitalized.
The Company’s primary source of funds to pay interest on trust preferred debentures and pay cash dividends to its stockholders are dividends from its subsidiaries. Various laws and regulations restrict the ability of banks to pay dividends to their stockholders. Generally, the payment of dividends by the Company in the future as well as the payment of interest on the capital securities will require the generation of sufficient future earnings by its subsidiaries.
The Bank also is subject to substantial regulatory restrictions on its ability to pay dividends to the Company. Under Office of the Comptroller of the Currency (“OCC”) regulations, the Bank may not pay a dividend, without prior OCC approval, if the total amount of all dividends declared during the calendar year, including the proposed dividend, exceeds the sum of its retained net income to date during the calendar year and its retained net income over the preceding two years. At December 31, 2020 and 2019, approximately $194.2 million and $175.0 million, respectively, of the total stockholders’ equity of the Bank was available for payment of dividends to the Company without approval by the OCC. The Bank’s ability to pay dividends also is subject to the Bank being in compliance with regulatory capital requirements. The Bank is currently in compliance with these requirements.
Stock Repurchase Plan
The Company purchased 263,507 shares of its common stock during the year ended December 31, 2020 at an average price of $30.28 per share under its previously announced plan. As of December 31, 2020, there were 736,493 shares available for repurchase under this plan, which expires on December 31, 2021. On January 27, 2021, the NBT Board of Directors approved an increase to the total number of shares authorized under the stock repurchase program to 2 million shares from 1 million shares, previously.
Recent Accounting Updates
See Note 2 to the consolidated financial statements for a detailed discussion of new accounting pronouncements.
2019 OPERATING RESULTS AS COMPARED TO 2018 OPERATING RESULTS
For similar operating and financial data and discussion of our results for the year ended December 31, 2019 compared to our results for the year ended December 31, 2018, refer to Item 7, “Management’s Discussion and Analysis of Financial Condition and Results of Operations” under Part II of our annual report on Form 10-K for the year ended December 31, 2019, which was filed with the SEC on March 2, 2020 and is incorporated herein by reference.
| ITEM 7A. | QUANTITATIVE AND QUALITATIVE DISCLOSURE ABOUT MARKET RISK |
Interest rate risk is the most significant market risk affecting the Company. Other types of market risk, such as foreign currency exchange rate risk and commodity price risk, do not arise in the normal course of the Company’s business activities or are immaterial to the results of operations.
Interest rate risk is defined as an exposure to a movement in interest rates that could have an adverse effect on the Company’s net interest income. Net interest income is susceptible to interest rate risk to the degree that interest-bearing liabilities mature or reprice on a different basis than earning assets. When interest-bearing liabilities mature or reprice more quickly than earning assets in a given period, a significant increase in market rates of interest could adversely affect net interest income. Similarly, when earning assets mature or reprice more quickly than interest-bearing liabilities, falling interest rates could result in a decrease in net interest income.
To manage the Company’s exposure to changes in interest rates, management monitors the Company’s interest rate risk. The ALCO meets monthly to review the Company’s interest rate risk position and profitability and to recommend strategies for consideration by the Board of Directors. Management also reviews loan and deposit pricing and the Company’s securities portfolio, formulates investment and funding strategies and oversees the timing and implementation of transactions to assure attainment of the Board’s objectives in the most effective manner. Notwithstanding the Company’s interest rate risk management activities, the potential for changing interest rates is an uncertainty that can have an adverse effect on net income.
In adjusting the Company’s asset/liability position, the Board and management aim to manage the Company’s interest rate risk while minimizing net interest margin compression. At times, depending on the level of general interest rates, the relationship between long and short-term interest rates, market conditions and competitive factors, the Board and management may determine to increase the Company’s interest rate risk position somewhat in order to increase its net interest margin. The Company’s results of operations and net portfolio values remain vulnerable to changes in interest rates and fluctuations in the difference between long and short-term interest rates.
The primary tool utilized by the ALCO to manage interest rate risk is earnings at risk modeling (interest rate sensitivity analysis). Information, such as principal balance, interest rate, maturity date, cash flows, next repricing date (if needed) and current rates are uploaded into the model to create an ending balance sheet. In addition, the ALCO makes certain assumptions regarding prepayment speeds for loans and mortgage related investment securities along with any optionality within the deposits and borrowings. The model is first run under an assumption of a flat rate scenario (i.e. no change in current interest rates) with a static balance sheet. Three additional models are run in which a gradual increase of 200 bps, a gradual increase of 100 bps and a gradual decrease of 50 bps takes place over a 12-month period with a static balance sheet. Under these scenarios, assets subject to prepayments are adjusted to account for faster or slower prepayment assumptions. Any investment securities or borrowings that have callable options embedded in them are handled accordingly based on the interest rate scenario. The resulting changes in net interest income are then measured against the flat rate scenario. The Company also runs other interest rate scenarios to highlight potential interest rate risk.
In the declining rate scenario, net interest income is projected to decrease when compared to the forecasted net interest income in the flat rate scenario through the simulation period. The decrease in net interest income is a result of earning assets rolling over at lower yields while interest-bearing liabilities remain at or near their floors. In the rising rate scenarios, net interest income is projected to experience a modest increase from the flat rate scenario; however, the potential impact on earnings may be affected by the ability to lag deposit repricing on NOW, savings, MMDA and time accounts. Net interest income for the next twelve months in the +200/+100/-50 bp scenarios, as described above, is within the internal policy risk limits of not more than a 7.5% change in net interest income. The following table summarizes the percentage change in net interest income in the rising and declining rate scenarios over a 12-month period from the forecasted net interest income in the flat rate scenario using the December 31, 2020 balance sheet position:
Interest Rate Sensitivity Analysis
Change in interest rates (in basis points) |
Percent change in net interest income |
|
+200 |
1.71% |
|
+100 |
0.96% |
|
-50 |
(0.66%) |
|
The Company anticipates that the trajectory of net interest income will depend significantly on the timing and path of the recovery from the recent economic downturn. In response to the economic impact of the pandemic, the federal funds rate was reduced by 150 bps in March 2020, and term interest rates fell sharply across the yield curve. The Company has reduced deposit rates, but future reductions are likely to be smaller and more selective. With deposit rates near their lower bound, the Company will focus on managing asset yields in order to maintain the net interest margin. Competitive pressure may limit the Company’s ability to maintain asset yields in the current environment, however.
| ITEM 8. | FINANCIAL STATEMENTS AND SUPPLEMENTARY DATA |
To the Stockholders and Board of Directors
NBT Bancorp Inc.:
Opinion on the Consolidated Financial Statements
We have audited the accompanying consolidated balance sheets of NBT Bancorp Inc. and subsidiaries (the Company) as of December 31, 2020 and 2019, the related consolidated statements of income, comprehensive income, changes in stockholders’ equity, and cash flows for each of the years in the three-year period ended December 31, 2020, and the related notes (collectively, the consolidated financial statements). In our opinion, the consolidated financial statements present fairly, in all material respects, the financial position of the Company as of December 31, 2020 and 2019, and the results of its operations and its cash flows for each of the years in the three-year period ended December 31, 2020, in conformity with U.S. generally accepted accounting principles.
We also have audited, in accordance with the standards of the Public Company Accounting Oversight Board (United States) (PCAOB), the Company’s internal control over financial reporting as of December 31, 2020, based on criteria established in Internal Control – Integrated Framework (2013) issued by the Committee of Sponsoring Organizations of the Treadway Commission, and our report dated March 1, 2021 expressed an unqualified opinion on the effectiveness of the Company’s internal control over financial reporting.
Change in Accounting Principle
As discussed in Note 2 to the consolidated financial statements, the Company has changed its method of accounting for the recognition and measurement of credit losses as of January 1, 2020 due to the adoption of Accounting Standards Codification Topic 326, Financial Instruments – Credit Losses.
Basis for Opinion
These consolidated financial statements are the responsibility of the Company’s management. Our responsibility is to express an opinion on these consolidated financial statements based on our audits. We are a public accounting firm registered with the PCAOB and are required to be independent with respect to the Company in accordance with the U.S. federal securities laws and the applicable rules and regulations of the Securities and Exchange Commission and the PCAOB.
We conducted our audits in accordance with the standards of the PCAOB. Those standards require that we plan and perform the audit to obtain reasonable assurance about whether the consolidated financial statements are free of material misstatement, whether due to error or fraud. Our audits included performing procedures to assess the risks of material misstatement of the consolidated financial statements, whether due to error or fraud, and performing procedures that respond to those risks. Such procedures included examining, on a test basis, evidence regarding the amounts and disclosures in the consolidated financial statements. Our audits also included evaluating the accounting principles used and significant estimates made by management, as well as evaluating the overall presentation of the consolidated financial statements. We believe that our audits provide a reasonable basis for our opinion.
Critical Audit Matter
The critical audit matter communicated below is a matter arising from the current period audit of the consolidated financial statements that was communicated or required to be communicated to the audit committee and that: (1) relates to accounts or disclosures that are material to the consolidated financial statements and (2) involved our especially challenging, subjective, or complex judgments. The communication of a critical audit matter does not alter in any way our opinion on the consolidated financial statements, taken as a whole, and we are not, by communicating the critical audit matter below, providing a separate opinion on the critical audit matter or on the accounts or disclosures to which it relates.
Allowance for Credit Losses – Loans evaluated on a collective basis
As discussed in Notes 1, 2 and 6 to the consolidated financial statements, the Company’s allowance for credit losses on loans evaluated on a collective basis (the collective ACL on loans) was $106.8 million of a total allowance for credit losses of $110.0 million as of December 31, 2020. The collective ACL on loans includes the measure of expected credit losses on a collective (pooled) basis for class segments of loans that share similar risk characteristics. The Company estimated the collective ACL on loans using relevant available information, from internal and external sources, related to past events, current conditions, and reasonable and supportable forecasts. The Company uses a discounted cash flow methodology where the respective quantitative allowance for each segment is measured by comparing the present value of expected principal and interest cash flows projected using an econometric, probability of default (PD) and loss given default (LGD) modeling methodology to the amortized cost. The Company uses regression models to develop the PD and LGD, which are derived from historical credit loss experience for both the Company and class segment-specific selected peers, that incorporate multiple weighted external economic forecasts for the economic variables over the reasonable and supportable forecast period. After the reasonable and supportable forecast period, the Company reverts to long-term average economic variables over a reversion period on a straight-line basis. Contractual cash flows over the contractual life of the loans are the basis for modeled cash flows, adjusted for modeled defaults and expected prepayments and discounted at the loan-level stated interest rate. After quantitative considerations, the Company applies additional qualitative adjustments, including the effects of limitations inherent in the quantitative model, so that the collective ACL is reflective of the estimate of lifetime losses that exist in the loan portfolio at the balance sheet date.
We identified the assessment of the collective ACL on loans as a critical audit matter. A high degree of audit effort, including specialized skills and knowledge, and subjective and complex auditor judgment was involved in the assessment of the collective ACL on loans due to significant measurement uncertainty. Specifically, the assessment encompassed the evaluation of the collective ACL on loans methodology, including the methods and models used to estimate (1) the PD and LGD and their significant assumptions including portfolio segmentation, the external economic forecasts and economic variables, and the related weighting of the forecasts, the reasonable and supportable forecast periods, the composition of the peer group and the period from which historical Company and peer experience was used, (2) the expected prepayments assumption, and (3) the qualitative adjustments and their significant assumptions, including the effects of limitations inherent in the quantitative model. The assessment also included an evaluation of the conceptual soundness and performance of the PD and LGD models. In addition, auditor judgment was required to evaluate the sufficiency of audit evidence obtained.
The following are the primary procedures we performed to address this critical audit matter. We evaluated the design and tested the operating effectiveness of certain internal controls related to the Company’s measurement of the collective ACL on loans estimate, including controls over the:
• |
development of the collective ACL on loans methodology |
• |
development of the PD and LGD models |
• |
performance monitoring of the PD and LGD models |
• |
identification and determination of the expected prepayments assumption and the significant assumptions used in the PD and LGD models |
• |
development of the qualitative adjustments, including the significant assumptions used in the measurement of the qualitative adjustments |
• |
analysis of the collective ACL on loans results, trends, and ratios. |
We evaluated the Company’s process to develop the collective ACL on loans estimate by testing certain sources of data, factors, and assumptions that the Company used, and considered the relevance and reliability of such data, factors, and assumptions. In addition, we involved credit risk professionals with specialized skills and knowledge, who assisted in:
• |
evaluating the Company’s collective ACL on loans methodology for compliance with U.S. generally accepted accounting principles |
• |
evaluating judgments made by the Company relative to the development and performance monitoring of the PD and LGD models, by comparing them to relevant Company-specific metrics and trends and the applicable industry and regulatory practices |
• |
assessing the conceptual soundness and performance testing of the PD and LGD models, by inspecting the model documentation to determine whether the models are suitable for their intended use |
• |
evaluating the expected prepayments assumption by comparing to relevant Company-specific metrics and trends and the applicable industry and regulatory practices |
• |
evaluating the economic forecasts through comparison to publicly available forecasts |
• |
assessing the weighting of the economic forecasts by comparing it to the Company’s business environment and relevant industry practices |
• |
evaluating the length of the period from which historical Company and peer experience was used and the reasonable and supportable forecast period by comparing them to specific portfolio risk characteristics and trends |
• |
assessing the composition of the peer group by comparing to Company and specific portfolio risk characteristics |
• |
determining whether the loan portfolio is segmented by similar risk characteristics by comparing to the Company’s business environment and relevant industry practices |
• |
evaluating the methodology used to develop the qualitative adjustments and the effect of those adjustments on the collective ACL on loans compared with relevant credit risk factors and consistency with credit trends and identified limitations of the underlying quantitative models. |
We also assessed the sufficiency of the audit evidence obtained related to the collective ACL on loans by evaluating the:
• |
cumulative results of the audit procedures |
• |
qualitative aspects of the Company’s accounting practices |
• |
potential bias in the accounting estimate. |
/s/ KPMG LLP
We have served as the Company’s auditor since 1987.
Albany, New York
March 1, 2021
NBT Bancorp Inc. and Subsidiaries
As of December 31, |
||||||||
2020 |
2019 |
|||||||
(In thousands except share and per share data) |
||||||||
Assets |
||||||||
Cash and due from banks |
$ |
$ |
||||||
Short-term interest bearing accounts |
||||||||
Equity securities, at fair value |
||||||||
Securities available for sale, at fair value |
||||||||
Securities held to maturity (fair value $ |
||||||||
Federal Reserve and Federal Home Loan Bank stock |
||||||||
Loans held for sale |
||||||||
Loans |
||||||||
Less allowance for loan losses (1) |
||||||||
Net loans |
$ |
$ |
||||||
Premises and equipment, net |
||||||||
Goodwill |
||||||||
Intangible assets, net |
||||||||
Bank owned life insurance |
||||||||
Other assets |
||||||||
Total assets |
$ |
$ |
||||||
Liabilities |
||||||||
Demand (noninterest bearing) |
$ |
$ |
||||||
Savings, NOW and money market |
||||||||
Time |
||||||||
Total deposits |
$ |
$ |
||||||
Short-term borrowings |
||||||||
Long-term debt |
||||||||
Subordinated debt, net |
||||||||
Junior subordinated debt |
||||||||
Other liabilities |
||||||||
Total liabilities |
$ |
$ |
||||||
Stockholders’ equity |
||||||||
Preferred stock, $ |
$ |
$ |
||||||
Common stock, $ |
||||||||
Additional paid-in-capital |
||||||||
Retained earnings |
||||||||
Accumulated other comprehensive income (loss) |
( |
) |
||||||
Common stock in treasury, at cost, |
( |
) |
( |
) |
||||
Total stockholders’ equity |
$ |
$ |
||||||
Total liabilities and stockholders’ equity |
$ |
$ |
||||||
(1) Beginning January 1, 2020, calculation is based on current expected loss methodology. Prior to January 1, 2020, calculation was based on incurred loss methodology.
See accompanying notes to consolidated financial statements.
NBT Bancorp Inc. and Subsidiaries
Years Ended December 31, |
||||||||||||
2020 |
2019 |
2018 |
||||||||||
(In thousands, except per share data) |
||||||||||||
Interest, fee and dividend income |
||||||||||||
Interest and fees on loans |
$ |
$ |
$ |
|||||||||
Securities available for sale |
||||||||||||
Securities held to maturity |
||||||||||||
Other |
||||||||||||
Total interest, fee and dividend income |
$ |
$ |
$ |
|||||||||
Interest expense |
||||||||||||
Deposits |
$ |
$ |
$ |
|||||||||
Short-term borrowings |
||||||||||||
Long-term debt |
||||||||||||
Subordinated debt |
||||||||||||
Junior subordinated debt |
||||||||||||
Total interest expense |
$ |
$ |
$ |
|||||||||
Net interest income |
$ |
$ |
$ |
|||||||||
Provision for loan losses (1) |
||||||||||||
Net interest income after provision for loan losses |
$ |
$ |
$ |
|||||||||
Noninterest income |
||||||||||||
Service charges on deposit accounts |
$ |
$ |
$ |
|||||||||
ATM and debit card fees |
||||||||||||
Retirement plan administration fees |
||||||||||||
Wealth management |
||||||||||||
Insurance |
||||||||||||
Bank owned life insurance |
||||||||||||
Net securities (losses) gains |
( |
) |
( |
) |
||||||||
Other |
||||||||||||
Total noninterest income |
$ |
$ |
$ |
|||||||||
Noninterest expense |
||||||||||||
Salaries and employee benefits |
$ |
$ |
$ |
|||||||||
Occupancy |
||||||||||||
Data processing and communications |
||||||||||||
Professional fees and outside services |
||||||||||||
Equipment |
||||||||||||
Office supplies and postage |
||||||||||||
FDIC expenses |
||||||||||||
Advertising |
||||||||||||
Amortization of intangible assets |
||||||||||||
Loan collection and other real estate owned, net |
||||||||||||
Other |
||||||||||||
Total noninterest expense |
$ |
$ |
$ |
|||||||||
Income before income tax expense |
$ |
$ |
$ |
|||||||||
Income tax expense |
||||||||||||
Net income |
$ |
$ |
$ |
|||||||||
Earnings per share |
||||||||||||
Basic |
$ |
$ |
$ |
|||||||||
Diluted |
$ |
$ |
$ |
|||||||||
(1) Beginning January 1, 2020, calculation is based on current expected loss methodology. Prior to January 1, 2020, calculation was based on incurred loss methodology.
See accompanying notes to consolidated financial statements.
NBT Bancorp Inc. and Subsidiaries
Years Ended December 31, |
||||||||||||
2020 |
2019 |
2018 |
||||||||||
(In thousands) |
||||||||||||
Net income |
$ |
$ |
$ |
|||||||||
Other comprehensive income (loss), net of tax: |
||||||||||||
Securities available for sale: |
||||||||||||
Unrealized net holding gains (losses) arising during the period, gross |
$ |
$ |
$ |
( |
) |
|||||||
Tax effect |
( |
) |
( |
) |
||||||||
Unrealized net holding gains (losses) arising during the period, net |
$ |
$ |
$ |
( |
) |
|||||||
Reclassification adjustment for net (gains) losses in net income, gross |
$ |
( |
) |
$ |
$ |
|||||||
Tax effect |
( |
) |
( |
) |
||||||||
Reclassification adjustment for net (gains) losses in net income, net |
$ |
( |
) |
$ |
$ |
|||||||
Amortization of unrealized net gains for the reclassification of available for sale securities to held to maturity, gross |
$ |
$ |
$ |
|||||||||
Tax effect |
( |
) |
( |
) |
( |
) |
||||||
Amortization of unrealized net gains for the reclassification of available for sale securities to held to maturity, net |
$ |
$ |
$ |
|||||||||
Total securities available for sale, net |
$ |
$ |
$ |
( |
) |
|||||||
Cash flow hedges: |
||||||||||||
Unrealized (losses) gains on derivatives (cash flow hedges), gross |
$ |
( |
) |
$ |
( |
) |
$ |
|||||
Tax effect |
( |
) |
||||||||||
Unrealized (losses) gains on derivatives (cash flow hedges), net |
$ |
( |
) |
$ |
( |
) |
$ |
|||||
Reclassification of net unrealized losses (gains) on cash flow hedges to interest (income), gross |
$ |
$ |
( |
) |
$ |
( |
) |
|||||
Tax effect |
( |
) |
||||||||||
Reclassification of net unrealized losses (gains) on cash flow hedges to interest (income), net |
$ |
$ |
( |
) |
$ |
( |
) |
|||||
Total cash flow hedges, net |
$ |
$ |
( |
) |
$ |
( |
) |
|||||
Pension and other benefits: |
||||||||||||
Amortization of prior service cost and actuarial losses, gross |
$ |
$ |
$ |
|||||||||
Tax effect |
( |
) |
( |
) |
( |
) |
||||||
Amortization of prior service cost and actuarial losses, net |
$ |
$ |
$ |
|||||||||
Decrease (increase) in unrecognized actuarial loss, gross |
$ |
$ |
$ |
( |
) |
|||||||
Tax effect |
( |
) |
( |
) |
||||||||
Decrease (increase) in unrecognized actuarial loss, net |
$ |
$ |
$ |
( |
) |
|||||||
Total pension and other benefits, net |
$ |
$ |
$ |
( |
) |
|||||||
Total other comprehensive income (loss) |
$ |
$ |
$ |
( |
) |
|||||||
Comprehensive income |
$ |
$ |
$ |
|||||||||
See accompanying notes to consolidated financial statements.
NBT Bancorp Inc. and Subsidiaries
(In thousands, except share and per share data) |
Common Stock |
Additional Paid-in- Capital |
Retained Earnings |
Accumulated Other Comprehensive (Loss) Income |
Common Stock in Treasury |
Total |
||||||||||||||||||
Balance at December 31, 2017 |
$ |
$ |
$ |
$ |
( |
) |
$ |
( |
) |
$ |
||||||||||||||
Net income |
||||||||||||||||||||||||
Cumulative effect adjustment for ASU 2016-01 implementation |
( |
) |
( |
) |
||||||||||||||||||||
Cumulative effect adjustment for ASU 2018-02 implementation |
( |
) |
||||||||||||||||||||||
Cash dividends - $ |
( |
) |
( |
) |
||||||||||||||||||||
Net issuance of |
( |
) |
( |
) |
||||||||||||||||||||
Stock-based compensation |
||||||||||||||||||||||||
Other comprehensive (loss) |
( |
) |
( |
) |
||||||||||||||||||||
Balance at December 31, 2018 |
$ |
$ |
$ |
$ |
( |
) |
$ |
( |
) |
$ |
||||||||||||||
Net income |
||||||||||||||||||||||||
Cash dividends - $ |
( |
) |
( |
) |
||||||||||||||||||||
Net issuance of |
( |
) |
( |
) |
||||||||||||||||||||
Stock-based compensation |
||||||||||||||||||||||||
Other comprehensive income |
||||||||||||||||||||||||
Balance at December 31, 2019 |
$ |
$ |
$ |
$ |
( |
) |
$ |
( |
) |
$ |
||||||||||||||
Net income |
||||||||||||||||||||||||
Cash dividends - $ |
( |
) |
( |
) |
||||||||||||||||||||
Cumulative effect adjustment for ASU 2016-13 implementation |
( |
) |
( |
) |
||||||||||||||||||||
Purchase of |
( |
) |
( |
) |
||||||||||||||||||||
Net issuance of |
( |
) |
( |
) |
||||||||||||||||||||
Stock-based compensation |
||||||||||||||||||||||||
Other comprehensive income |
||||||||||||||||||||||||
Balance at December 31, 2020 |
$ |
$ |
$ |
$ |
$ |
( |
) |
$ |
||||||||||||||||
See accompanying notes to consolidated financial statements.
NBT Bancorp Inc. and Subsidiaries
Years Ended December 31, |
||||||||||||
2020 |
2019 |
2018 |
||||||||||
(In thousands) |
||||||||||||
Operating activities |
||||||||||||
Net income |
$ |
$ |
$ |
|||||||||
Adjustments to reconcile net income to net cash provided by operating activities |
||||||||||||
Provision for loan losses |
||||||||||||
Depreciation and amortization of premises and equipment |
||||||||||||
Net amortization on securities |
||||||||||||
Amortization of intangible assets |
||||||||||||
Amortization of operating lease right-of-use assets |
||||||||||||
Excess tax benefit on stock-based compensation |
( |
) |
( |
) |
( |
) |
||||||
Stock-based compensation expense |
||||||||||||
Bank owned life insurance income |
( |
) |
( |
) |
( |
) |
||||||
Amortization of subordinated debt issuance costs |
||||||||||||
Proceeds from sale of loans held for sale |
||||||||||||
Originations of loans held for sale |
( |
) |
( |
) |
( |
) |
||||||
Net gains on sales of loans held for sale |
( |
) |
( |
) |
( |
) |
||||||
Net security losses (gains) |
( |
) |
||||||||||
Net (gains) losses on sale of other real estate owned |
( |
) |
( |
) |
||||||||
Lease termination loss |
||||||||||||
Net change in other assets and other liabilities |
( |
) |
( |
) |
( |
) |
||||||
Net cash provided by operating activities |
$ |
$ |
$ |
|||||||||
Investing activities |
||||||||||||
Net cash used in acquisitions |
$ |
( |
) |
$ |
$ |
( |
) |
|||||
Securities available for sale: |
||||||||||||
Proceeds from maturities, calls and principal paydowns |
||||||||||||
Proceeds from sales |
||||||||||||
Purchases |
( |
) |
( |
) |
( |
) |
||||||
Securities held to maturity: |
||||||||||||
Proceeds from maturities, calls and principal paydowns |
||||||||||||
Proceeds from sales |
||||||||||||
Purchases |
( |
) |
( |
) |
( |
) |
||||||
Equity securities: |
||||||||||||
Proceeds from calls |
||||||||||||
Proceeds from sales |
||||||||||||
Purchases |
( |
) |
( |
) |
||||||||
Other: |
||||||||||||
Net increase in loans |
( |
) |
( |
) |
( |
) |
||||||
Proceeds from Federal Home Loan Bank stock redemption |
||||||||||||
Purchases of Federal Reserve Bank and Federal Home Loan Bank stock |
( |
) |
( |
) |
( |
) |
||||||
Proceeds from settlement of bank owned life insurance |
||||||||||||
Purchases of premises and equipment, net |
( |
) |
( |
) |
( |
) |
||||||
Proceeds from sales of other real estate owned |
||||||||||||
Net cash used in investing activities |
$ |
( |
) |
$ |
( |
) |
$ |
( |
) |
|||
Financing activities |
||||||||||||
Net increase in deposits |
$ |
$ |
$ |
|||||||||
Net (decrease) increase in short-term borrowings |
( |
) |
( |
) |
||||||||
Proceeds from issuance of subordinated debt |
||||||||||||
Payment of subordinated debt issuance costs |
( |
) |
||||||||||
Proceeds from issuance of long-term debt |
||||||||||||
Repayments of long-term debt |
( |
) |
( |
) |
( |
) |
||||||
Proceeds from the issuance of shares to employee and other stock plans |
||||||||||||
Cash paid by employer for tax-withholding on stock issuance |
( |
) |
( |
) |
( |
) |
||||||
Purchase of treasury stock |
( |
) |
||||||||||
Cash dividends |
( |
) |
( |
) |
( |
) |
||||||
Net cash provided by (used in) financing activities |
$ |
$ |
( |
) |
$ |
|||||||
Net increase in cash and cash equivalents |
$ |
$ |
$ |
|||||||||
Cash and cash equivalents at beginning of year |
||||||||||||
Cash and cash equivalents at end of year |
$ |
$ |
$ |
|||||||||
NBT Bancorp Inc. and Subsidiaries
Consolidated Statements of Cash Flows (continued)
Years Ended December 31, |
||||||||||||
2020 |
2019 |
2018 |
||||||||||
Supplemental disclosure of cash flow information: |
||||||||||||
Cash paid during the year for: |
||||||||||||
Interest expense |
$ |
$ |
$ |
|||||||||
Income taxes paid, net of refund |
||||||||||||
Noncash investing activities: |
||||||||||||
Loans transferred to other real estate owned |
$ |
$ |
$ |
|||||||||
Acquisitions: |
||||||||||||
Fair value of assets acquired |
$ |
$ |
$ |
|||||||||
See accompanying notes to consolidated financial statements.
NBT Bancorp Inc. and Subsidiaries
December 31, 2020 and 2019
1. Summary of Significant Accounting Policies
The accounting and reporting policies of NBT Bancorp Inc. (“NBT Bancorp”) and its subsidiaries, NBT Bank, National Association (“NBT Bank” or the “Bank”), NBT Financial Services, Inc. and NBT Holdings, Inc., conform, in all material respects, with generally accepted accounting principles in the United States of America (“GAAP”) and to general practices within the banking industry. Collectively, NBT Bancorp and its subsidiaries are referred to herein as (“the Company”).
The preparation of financial statements in conformity with GAAP requires management to make estimates and assumptions that affect the reported amounts of assets and liabilities and disclosure of contingent assets and liabilities at the date of the financial statements and the reported amounts of revenues and expenses during the reporting period. Actual results could differ from these estimates and such estimates could be material to the financial statements.
Estimates associated with the allowance for credit losses, provision for income taxes, pension accounting, fair values of financial instruments and status of contingencies are particularly susceptible to material change in the near term.
The following is a description of significant policies and practices:
Consolidation
The accompanying consolidated financial statements include the accounts of NBT Bancorp and its wholly-owned subsidiaries mentioned above. All material intercompany transactions have been eliminated in consolidation. Amounts previously reported in the consolidated financial statements are reclassified whenever necessary to conform to the current year’s presentation. In the “Parent Company Financial Information,” the investment in subsidiaries is recorded using the equity method of accounting.
The Company determines whether it has a controlling financial interest in an entity by first evaluating whether the entity is a voting interest entity or a variable interest entity under GAAP. Voting interest entities are entities in which the total equity investment at risk is sufficient to enable the entity to finance itself independently and provides the equity holders with the obligation to absorb losses, the right to receive residual returns and the right to make decisions about the entity’s activities. The Company consolidates voting interest entities in which it has all, or at least a majority of, the voting interest. As defined in applicable accounting standards, variable interest entities (“VIEs”) are entities that lack one or more of the characteristics of a voting interest entity. A controlling financial interest in a VIE is present when the Company has both the power and ability to direct the activities of the VIE that most significantly impact the VIE’s economic performance and an obligation to absorb losses or the right to receive benefits that could potentially be significant to the VIE. The Company’s wholly-owned subsidiaries CNBF Capital Trust I, NBT Statutory Trust I, NBT Statutory Trust II, Alliance Financial Capital Trust I and Alliance Financial Capital Trust II are VIEs for which the Company is not the primary beneficiary. Accordingly, the accounts of these entities are not included in the Company’s consolidated financial statements.
Segment Reporting
The Company’s operations are primarily in the community banking industry and include the provision of traditional banking services. The Company also provides other services through its subsidiaries such as insurance, retirement plan administration and trust administration. The Company operates solely in the geographical regions of central and upstate New York, northeastern Pennsylvania, western Massachusetts, southern New Hampshire, Vermont, the southern coastal Maine area and now entering central Connecticut. The Company has no reportable operating segments.
Cash Equivalents
The Company considers amounts due from correspondent banks, cash items in process of collection and institutional money market mutual funds to be cash equivalents for purposes of the consolidated statements of cash flows.
Securities
The Company classifies its securities at date of purchase as either held to maturity (“HTM”), available for sale (“AFS”) or equity. HTM debt securities are those that the Company has the ability and intent to hold until maturity. AFS debt securities are securities that are not classified as HTM. AFS securities are recorded at fair value. Unrealized holding gains and losses, net of the related tax effect, on AFS securities are excluded from earnings and are reported in the consolidated statements of changes in stockholders’ equity and the consolidated statements of comprehensive income as a component of accumulated other comprehensive income or loss (“AOCI”). HTM securities are recorded at amortized cost. Equity securities are recorded at fair value, with net unrealized gains and losses recognized in income. Transfers of securities between categories are recorded at fair value at the date of transfer. Non-marketable equity securities are carried at cost. Equity securities without readily determinable fair values are carried at cost. The Company performs a qualitative assessment to determine whether investments are impaired. Downward or upward adjustments are recognized through the income statement.
Premiums and discounts are amortized or accreted over the life of the related security as an adjustment to yield using the interest method. Dividend and interest income are recognized when earned. Realized gains and losses on securities sold are derived using the specific identification method for determining the cost of securities sold.
Allowance for Credit Losses –HTM Debt Securities
With respect to its HTM debt securities, the Company is required to utilize the Accounting Standards Update (“ASU”) 2016-13, Financial Instruments - Credit Losses (Topic 326): Measurement of Credit Losses on Financial Instruments (“CECL”) approach to estimate expected credit losses. Management measures expected credit losses on HTM debt securities on a collective basis by major security types that share similar risk characteristics, such as (as applicable): internal or external (third-party) credit score or credit ratings, risk ratings or classification, financial asset type, collateral type, size, effective interest rate, term, geographical location, industry of the borrower, vintage, historical or expected credit loss patterns, and reasonable and supportable forecast periods. Management classifies the HTM portfolio into the following major security types: U.S. government agency or U.S. government sponsored mortgage backed and collateralized mortgage obligations securities, and state and municipal debt securities.
The mortgage-backed and collateralized mortgage obligations HTM securities are issued by U.S. government entities and agencies. These securities are either explicitly or implicitly guaranteed by the U.S. government as to timely repayment of principal and interest, are highly rated by major rating agencies, and have a long history of no credit losses. Therefore, the Company did not record a credit loss for these securities.
State and municipal bonds carry a Moody’s rating of A to AAA. In addition, the Company has a limited amount of New York state local municipal bonds that are not rated. The estimate of expected credit losses on the HTM portfolio is based on the expected cash flows of each individual CUSIP over its contractual life and considers historical credit loss information, current conditions and reasonable and supportable forecasts. Given the rarity of municipal defaults and losses, the Company utilized Moody’s Municipal Loss Forecast Model as the sole source of municipal default and loss rates which provides decades of data across all municipal sectors and geographies. As with the loan portfolio, cash flows are forecast over a 6-quarter period under various weighted economic conditions, with a reversion to long-term average economic conditions over a 4-quarter period on a straight-line basis. Management may exercise discretion to make adjustments based on environmental factors. As of December 31, 2020, the Company determined that the expected credit loss on its municipal bond portfolio was de minimis, and therefore, an allowance for credit losses was not recorded.
Allowance for Credit Losses –AFS Debt Securities
The impairment model for AFS debt securities differs from the CECL approach utilized for HTM debt securities because AFS debt securities are measured at fair value rather than amortized cost. For AFS debt securities in an unrealized loss position, the Bank first assesses whether it intends to sell, or it is more likely than not that it will be required to sell the security before recovery of its amortized cost basis. If either of the criteria regarding intent or requirement to sell is met, the security’s amortized cost basis is written down to fair value through income. For AFS debt securities that do not meet the aforementioned criteria, in making this assessment, management considers the extent to which fair value is less than amortized cost, any changes to the rating of the security by a rating agency, adverse conditions specifically related to the security, failure of the issuer of the debt security to make scheduled interest or principal payments, among other factors. If this assessment indicates that a credit loss exists, the present value of cash flows expected to be collected from the security are compared to the amortized cost basis of the security. The cash flows should be estimated using information relevant to the collectability of the security, including information about past events, current conditions and reasonable and supportable forecasts. If the present value of cash flows expected to be collected is less than the amortized cost basis, a credit loss exists and an allowance for credit losses is recorded for the credit loss, limited by the amount that the fair value is less than the amortized cost basis. Any impairment that has not been recorded through an allowance for credit losses is recognized in other comprehensive income.
Prior to the adoption of CECL on January 1, 2020, declines in the fair value of AFS and HTM securities below their amortized cost, less any current period credit loss, that are deemed to be other-than-temporary were reflected in earnings as realized losses, or in other comprehensive income (“OCI”).
Investments in Federal Reserve Bank and Federal Home Loan Bank (“FHLB”) stock are required for membership in those organizations and are carried at cost since there is no market value available. The FHLB New York continues to pay dividends and repurchase stock. As such, the Company has not recognized any impairment on its holdings of Federal Reserve Bank and FHLB stock.
Loan Held for Sale and Loan Servicing
Loans held for sale are recorded at the lower of cost or fair value on an individual basis. Loan sales are recorded when the sales are funded. Gains and losses on sales of loans held for sale are included in other noninterest income in the Consolidated Statements of Income. Mortgage loans held for sale are generally sold with servicing rights retained. Mortgage servicing rights are recorded at fair value upon sale of the loan, and are amortized in proportion to and over the period of estimated net servicing income.
Loans
Loans are recorded at their current unpaid principal balance, net of unearned income and unamortized loan fees and expenses, which are amortized under the effective interest method over the estimated lives of the loans. Interest income on loans is accrued based on the principal amount outstanding.
For all loan classes within the Company’s loan portfolio, loans are placed on nonaccrual status when timely collection of principal and/or interest in accordance with contractual terms is in doubt. Loans are transferred to nonaccrual status generally when principal or interest payments become ninety days delinquent, unless the loan is well secured and in the process of collection or sooner when management concludes circumstances indicate that borrowers may be unable to meet contractual principal or interest payments. When a loan is transferred to a nonaccrual status, all interest previously accrued in the current period but not collected is reversed against interest income in that period. Interest accrued in a prior period and not collected is charged-off against the allowance for credit losses.
If ultimate repayment of a nonaccrual loan is expected, any payments received are applied in accordance with contractual terms. If ultimate repayment of principal is not expected, any payment received on a nonaccrual loan is applied to principal until ultimate repayment becomes expected. For all loan classes within the Company’s loan portfolio, nonaccrual loans are returned to accrual status when they become current as to principal and interest and demonstrate a period of performance under the contractual terms and, in the opinion of management, are fully collectible as to principal and interest. For loans in all portfolios, the principal amount is charged off in full or in part as soon as management determines, based on available facts, that the collection of principal in full or in part is improbable. For Commercial loans, management considers specific facts and circumstances relative to individual credits in making such a determination. For Consumer and Residential Real Estate loan classes, management uses specific guidance and thresholds from the Federal Financial Institutions Examination Council’s Uniform Retail Credit Classification and Account Management Policy.
A loan is considered to be a troubled debt restructuring (“TDR”) when the Company grants a concession to the borrower because of the borrower’s financial condition that the Company would not otherwise consider. Such concessions generally include one or a combination of the following: an extension of the maturity date at a stated rate of interest lower than the current market rate for new debt with similar risk; a temporary reduction in the interest rate; or a change in scheduled payment amount. TDR loans are nonaccrual loans; however, they can be returned to accrual status after a period of performance, generally evidenced by six months of compliance with their modified terms.
Section 4013 of the Coronavirus Aid, Relief and Economic Security Act (“CARES Act”), which was enacted on March 27, 2020, provides that a qualified loan modification is exempt by law from classification as a troubled debt restructuring as defined by GAAP. To be eligible, each loan modification must be (1) related to the coronavirus (“COVID-19”) pandemic; (2) executed on a loan that was not more than 30 days past due as of December 31, 2019; and (3) executed between March 1, 2020, and the earlier of (a) 60 days after the date of termination of the National Emergency or (b) December 31, 2020. On August 3, 2020, the Federal Financial Institutions Examination Council (“FFIEC”) issued a joint statement on additional loan accommodations related to COVID-19. The joint statement clarifies that for loan modifications in which Section 4013 is being applied, subsequent modifications could also be eligible under Section 4013. Accordingly, the Company is offering modifications made in response to COVID-19 to borrowers who were current and otherwise not past due in accordance with the criteria stated in Section 4013. These include short-term, 180 days or less, modifications in the form of payment deferrals, fee waivers, extensions of repayment terms, or other delays in payment. Accordingly, the Company did not account for such loan modifications as TDRs. As of December 31, 2020, there were $110.8 million in loans in modification programs related to COVID-19. On December 27, 2020, the Consolidated Appropriations Act amended section 2014 of the CARES Act extending the exemption of qualified loan modifications from classification as a troubled debt restructuring as defined by GAAP to the earlier of January 1, 2022, or 60 days after the National Emergency concerning COVID-19 ends.
Allowance for Credit Losses - Loans
The CECL approach requires an estimate of the credit losses expected over the life of a loan (or pool of loans). It replaces the incurred loss approach’s threshold that required the recognition of a credit loss when it was probable a loss event was incurred. The allowance for credit losses is a valuation account that is deducted from, or added to, the loans’ amortized cost basis to present the net, lifetime amount expected to be collected on the loans. Loan losses are charged off against the allowance when management believes a loan balance is confirmed to be uncollectible. Expected recoveries do not exceed the aggregate of amounts previously charged-off and expected to be charged-off.
Management estimates the allowance balance using relevant available information, from internal and external sources, related to past events, current conditions, and reasonable and supportable forecasts. Historical credit loss experience provides the basis for the estimation of expected credit losses. Company historical loss experience was supplemented with peer information when there was insufficient loss data for the Company. Peer selection was based on a review of institutions with comparable loss experience as well as loan yield, bank size, portfolio concentration and geography. Adjustments to historical loss information are made for differences in current loan-specific risk characteristics such as differences in underwriting standards, portfolio mix, delinquency level or term as well as changes in environmental conditions, such as changes in unemployment rates, production metrics, property values, or other relevant factors. Significant management judgment is required at each point in the measurement process.
Portfolio segment is defined as the level at which an entity develops and documents a systematic methodology to determine its allowance for credit losses. Upon adoption of CECL, management revised the manner in which loans were pooled for similar risk characteristics. Management developed segments for estimating loss based on type of borrower and collateral which is generally based upon federal call report segmentation and have been combined or subsegmented as needed to ensure loans of similar risk profiles are appropriately pooled.
The following table illustrates the portfolio and class segments for the Company’s loan portfolio in 2020:
Portfolio Segment |
Class |
Commercial Loans |
Commercial & Industrial Paycheck Protection Program Commercial Real Estate |
Consumer Loans |
Auto Other Consumer |
Residential Loans |
|
Commercial Loans
The Company offers a variety of commercial loan products. The Company’s underwriting analysis for commercial loans typically includes credit verification, independent appraisals, a review of the borrower’s financial condition and a detailed analysis of the borrower’s underlying cash flows.
Commercial and Industrial (“C&I”) – The Company offers a variety of loan options to meet the specific needs of our C&I customers including term loans, time notes and lines of credit. Such loans are made available to businesses for working capital needs and are typically collateralized by business assets such as equipment, accounts receivable and perishable agricultural products, which are exposed to industry price volatility. To reduce these risks, management also attempts to obtain personal guarantees of the owners or to obtain government loan guarantees to provide further support.
Paycheck Protection Program (“PPP”) – Section 1102 of the CARES Ac) created the Paycheck Protection Program, a program administered by the Small Business Administration (the “SBA”) to provide loans to small businesses for payroll and other basic expenses during the COVID-19 pandemic. The Company has participated in the PPP as a lender. These loans are eligible to be forgiven if certain conditions are satisfied and are fully guaranteed by the SBA. Additionally, loan payments will also be deferred for six months of the loan. The PPP commenced on April 3, 2020 and was available to qualified borrowers through August 8, 2020, or as long as the appropriated funding was available. No collateral or personal guarantees are required. Neither the government nor lenders are permitted to charge the recipients any fees. The Company began accepting applications from qualified borrowers on April 3, 2020 and as of December 31, 2020 processed approximately 3,000 loans totaling over $548 million in relief. On December 27, 2020, President Trump signed into law the Consolidated Appropriation Act (“CAA”). The CAA, among other things, extends the life of the PPP, effectively creating a second round of PPP loans for eligible businesses. The Company is participating in the CAA’s second round of PPP lending beginning in January 2021.
Commercial Real Estate (“CRE”) – The Company offers CRE loans to finance real estate purchases, refinancing’s, expansions and improvements to commercial and agricultural properties. CRE loans are loans that are secured by liens on real estate, which may include both owner-occupied and nonowner-occupied properties, such as apartments, commercial structures, health care facilities and other facilities. The Company’s underwriting analysis includes credit verification, independent appraisals, a review of the borrower’s financial condition and a detailed analysis of the borrower’s underlying cash flows. These loans are typically originated in amounts of no more than 80 % of the appraised value of the property. Government loan guarantees may be obtained to provide further support for agricultural property.
Consumer Loans
The Company offers a variety of Consumer loan products including Auto and Other Consumer loans.
Auto – The Company provides both direct and indirect financing of automobiles (“Auto”). The Company maintains relationships with many dealers primarily in the communities that we serve. Through these relationships, the Company primarily finances the purchases of automobiles indirectly through dealer relationships. Most of these loans carry a fixed rate of interest with principal repayment terms typically ranging from to six years , based upon the nature of the collateral and the size of the loan.
Other Consumer – The Other Consumer loan segment consists primarily of specialty lending loans and direct consumer loans. The Company offers unsecured specialty lending consumer loans across a national footprint originated through our relationships with national technology-driven consumer lending companies to finance such things as dental and medical procedures, K-12 tuition, solar energy installations and other consumer purpose loans. Advances of credit through this specialty lending business line are subject to the Company’s underwriting standards including criteria such as FICO score and debt to income thresholds. The Company offers a variety of direct consumer installment loans to finance various personal expenditures. In addition to installment loans, the Company also offers personal lines of credit, overdraft protection, debt consolidation, education and other uses. Consumer installment loans carry a fixed rate of interest with principal repayment terms typically ranging from to fifteen years , based upon the nature of the collateral and the size of the loan. Consumer installment loans are often secured with collateral consisting of a perfected lien on the asset being purchased or a perfected lien on a consumer’s deposit account. Risk is reduced through underwriting criteria, which include credit verification, appraisals, a review of the borrower’s financial condition and personal cash flows. A security interest, with title insurance when necessary, is taken in the underlying real estate.
Residential
Residential loans consist primarily of loans secured by a first or second mortgage on primary residences, home equity loans and lines of credit in first and second lien positions and residential construction loans. We originate adjustable-rate and fixed rate, one-to-four-family residential loans for the construction or purchase of a residential property or the refinancing of a mortgage. These loans are collateralized by properties located in the Company’s market area. Loans on one-to-four-family residential are generally originated in amounts of no more than 85 % of the purchase price or appraised value (whichever is lower) or have private mortgage insurance. Mortgage title insurance and hazard insurance are normally required. Construction loans have a unique risk because they are secured by an incomplete dwelling. This risk is reduced through periodic site inspections, including one at each loan draw period. For home equity loans, consumers are able to borrow up to 85 % of the equity in their homes and are generally tied to Prime with a ten-year draw followed by a fifteen-year amortization. These loans carry a higher risk than first mortgage residential loans as they are often in a second position with respect to collateral.
Historical credit loss experience for both the Company and segment-specific peers provides the basis for the estimation of expected credit losses, where observed credit losses are converted to probability of default rate (“PD”) curves through the use of segment-specific loss given default (“LGD”) risk factors that convert default rates to loss severity based on industry-level, observed relationships between the two variables for each asset class, primarily due to the nature of the underlying collateral. These risk factors were assessed for reasonableness against the Company’s own loss experience and adjusted in certain cases when the relationship between the Company’s historical default and loss severity deviate from that of the wider industry. The historical PDR curves, together with corresponding economic conditions, establish a quantitative relationship between economic conditions and loan performance through an economic cycle.
Using the historical relationship between economic conditions and loan performance, management’s expectation of future loan performance is incorporated using externally developed economic forecasts which are probabilistically weighted to reflect potential forecast inaccuracy and model limitations. These forecasts are applied over a period that management has determined to be reasonable and supportable. Beyond the period over which management can develop or source a reasonable and supportable forecast, the model will revert to long-term average economic conditions using a straight-line, time-based methodology.
The allowance for credit losses is measured on a collective (pool) basis, with both a quantitative and qualitative analysis that is applied on a quarterly basis, when similar risk characteristics exist. The respective quantitative allowance for each segment is measured using an econometric, discounted PD/LGD modeling methodology in which distinct, segment-specific multi-variate regression models are applied to multiple, probabilistically weighted external economic forecasts. Under the discounted cash flows methodology, expected credit losses are estimated over the effective life of the loans by measuring the difference between the net present value of modeled cash flows and amortized cost basis. Contractual cash flows over the contractual life of the loans are the basis for modeled cash flows, adjusted for modeled defaults and expected prepayments and discounted at the loan-level stated interest rate. The contractual term excludes expected extensions, renewals, and modifications unless either of the following applies: management has a reasonable expectation at the reporting date that a TDR will be executed with an individual borrower or the extension or renewal options are included in the original or modified contract at the reporting date and are not unconditionally cancellable by the Company.
After quantitative considerations, management applies additional qualitative adjustments so that the allowance for credit loss is reflective of the estimate of lifetime losses that exist in the loan portfolio at the balance sheet date. Qualitative considerations include limitations inherent in the quantitative model; trends experienced in nonperforming and delinquent loans; changes in value of underlying collateral; changes in lending policies and procedures; nature and composition of loans; portfolio concentrations that may affect loss experience across one or more components of the portfolio; the experience, ability and depth of lending management and staff; the Company’s credit review system; and the effect of external factors; such as competition, legal and regulatory requirements.
Loans that do not share risk characteristics and meet materiality criteria are evaluated on an individual basis and are excluded from the pooled evaluation. When management determines that foreclosure is probable, expected credit losses are based on the fair value of the collateral at the reporting date, adjusted for selling costs as appropriate. If the loan is not collateral dependent, the allowance for credit losses related to individually assessed loans is based on discounted expected cash flows using the loan’s initial effective interest rate. Generally, individually assessed loans are collateral dependent.
A loan for which the terms have been modified resulting in a concession, and for which the borrower is experiencing financial difficulties is considered to be a TDR. The allowance for credit losses on a TDR is measured using the same method as all other loans held for investment, except that the original interest rate is used to discount the expected cash flows, not the rate specified within the restructuring.
Allowance for Credit Losses on Off-Balance Sheet Credit Exposures
The Company estimates expected credit losses over the contractual period in which the Company has exposure to credit risk via a contractual obligation to extend credit, unless that obligation is unconditionally cancellable by the Company. The allowance for credit losses on off-balance sheet credit exposures is adjusted as an expense in other noninterest expense. The estimate includes consideration of the likelihood that funding will occur and an estimate of expected credit losses on commitments expected to be funded over their estimated lives. Estimating credit losses on unfunded commitments requires the Bank to consider the following categories of off-balance sheet credit exposure: unfunded commitments to extend credit, unfunded lines of credit, and standby letters of credit. Each of these unfunded commitments is then analyzed for a probability of funding to calculate a probable funding amount. The life of loan loss factor by related portfolio segment from the loan allowance for credit loss calculation is then applied to the probable funding amount to calculate a reserve on unfunded commitments.
Accrued Interest Receivable
Upon adoption of CECL on January 1, 2020, the Company made the following elections regarding accrued interest receivable: (1) presented accrued interest receivable balances separately within other assets balance sheet line item; (2) excluded interest receivable that is included in amortized cost of financing receivables from related disclosures requirements and (3) continued our policy to write off accrued interest receivable by reversing interest income. For loans, write off typically occurs upon becoming over 90 to 120 days past due and therefore the amount of such write offs are immaterial. For loans given short-term loan modifications to assist borrowers during the COVID-19 national emergency, this accounting policy would not apply as the length of time between interest recognition and the write-off of uncollectible interest could exceed 120 days. Therefore, the Company estimated an allowance for credit losses for accrued interest receivable related to loans with short-term modifications due to the pandemic. Historically, the Company has not experienced uncollectible accrued interest receivable on investment securities.
Allowance for Loan Losses – Incurred Loss Method
Prior to the adoption of CECL on January 1, 2020, the Company calculated the allowance for loan losses using the incurred loss method whereby the allowance represented management’s estimate of probable incurred losses inherent in the current loan portfolio. Management believes that the allowance for loan losses is adequate. While management uses available information to recognize losses on loans, additions and reductions of the allowance for loan losses may fluctuate from one reporting period to another based on changes in economic conditions or changes in the values of properties securing loans in the process of foreclosure. The evaluation of the various components of the allowance for loan losses requires considerable judgment in order to estimate inherent loss exposures.
Historical loss rates are first applied to pools of loans with similar risk characteristics. Each segment has a distinct set of risk characteristics monitored by management. Unique characteristics such as borrower type, loan type, collateral type and risk characteristics define each class segment. The Company further assess and monitor risk and performance at a more disaggregated level, which includes our internal risk grading system for the Commercial segments. Under the incurred loss method, the loan portfolio was segmented into the Commercial, Consumer and Residential Real Estate portfolio segments. The Commercial segment was further pooled into three classes: Commercial and Industrial, Commercial Real Estate and Business Banking. The Consumer segment was further pooled into three classes: Indirect Auto, Specialty Lending and Direct. Those segments were further segregated between our loans accounted for under the amortized cost method (referred to as “originated” loans) and loans acquired in a business combination (referred to as “acquired” loans).
Loss rates are calculated by historical charge-offs that have occurred within each pool of loans over the lookback period (“LBP”), multiplied by the loss emergence period (“LEP”). The LBP represents the historical data period utilized to calculate loss rates. The LEP is an estimate of the average amount of time from the point at which a loss is incurred on a loan to the point at which the loss is confirmed. In general, the LEP will be shorter in an economic slowdown or recession and longer during times of economic stability or growth, as customers are better able to delay loss confirmation after a potential loss event has occurred. In conjunction with our annual review of the allowance for loan loss assumptions, the Company updates our study of LEPs for each portfolio segment using our loan charge-off history.
After consideration of the historic loss analysis, management applies additional qualitative adjustments so that the allowance for loan losses is reflective of the estimate of incurred losses that exist in the loan portfolio at the balance sheet date. Qualitative adjustments are made if, in the judgment of management, incurred loan losses inherent in the loan portfolio are not fully captured in the historical loss analysis. Qualitative considerations include the loan portfolio trends, composition and nature of loans; changes in lending policies and procedures, including underwriting standards and collection, charge-offs and recoveries; trends experienced in nonperforming and delinquent loans; current economic conditions in the Company’s market; portfolio concentrations that may affect loss experience across one of more components of the portfolio; the effect of external factors such as competition, legal and regulatory requirements; and the experience, ability and depth of lending management and staff.
The allowance for loan losses related to impaired loans specifically allocated for impairment is based on discounted expected cash flows using the loan’s initial effective interest rate or the fair value of the collateral for certain loans where repayment of the loan is expected to be provided solely by the underlying collateral (“collateral dependent”). The Company’s impaired loans, if any, are generally collateral dependent. The Company considers the estimated cost to sell, on a discounted basis, when determining the fair value of collateral in the measurement of impairment if those costs are expected to reduce the cash flows available to repay or otherwise satisfy the loans.
After a thorough consideration and validation of the factors discussed above, required additions or reductions to the allowance for loan losses are made periodically by charges or credits to the provision for loan losses. These are necessary to maintain the allowance at a level which management believes is reasonably reflective of the level of incurred credit losses inherent in the portfolio. Loan losses are charged off against the allowance, while recoveries of amounts previously charged off are credited to the allowance.
Premises and Equipment
Premises and equipment are stated at cost, less accumulated depreciation. Depreciation of premises and equipment is determined using the straight-line method over the estimated useful lives of the respective assets. Expenditures for maintenance, repairs and minor replacements are charged to expense as incurred.
Leases
The Company determines if a lease is present at the inception of an agreement. Right-of-use (“ROU”) assets and lease liabilities are recognized at lease commencement based on the present value of the remaining lease payments using a discount rate that represents the Company’s incremental borrowing rate at the lease commencement date. ROU assets and operating lease liabilities, are included in other assets and other liabilities, respectively, on the consolidated balance sheets. Leases with original terms of 12 months or less are recognized in profit or loss on a straight-line basis over the lease term.
Operating lease ROU assets represent the Company’s right to use an underlying asset during the lease term and operating lease liabilities represent our obligation to make lease payments arising from the lease. ROU assets are further adjusted for lease incentives. Operating lease expense, which is comprised of amortization of the ROU asset and the implicit interest accreted on the operating lease liability, is recognized on a straight-line basis over the lease term, and is recorded in occupancy expense in the consolidated statements of income.
The Company has lease agreements with lease and non-lease components, which are generally accounted for separately. For real estate leases, non-lease components and other non-components, such as common area maintenance charges, real estate taxes and insurance are not included in the measurement of the lease liability since they are generally able to be segregated. Our leases relate primarily to office space and bank branches, and some contain options to renew the lease. These options to renew are generally not considered reasonably certain to exercise, and are therefore not included in the lease term until such time that the option to renew is reasonably certain.
Other Real Estate Owned
Other real estate owned (“OREO”) consists of properties acquired through foreclosure or by acceptance of a deed in lieu of foreclosure. These assets are recorded at the lower of fair value of the asset acquired less estimated costs to sell or “cost” (defined as the fair value at initial foreclosure). At the time of foreclosure, or when foreclosure occurs in-substance, the excess, if any, of the loan over the fair market value of the assets received, less estimated selling costs, is charged to the allowance for loan losses and any subsequent valuation write-downs are charged to other expense. In connection with the determination of the allowance for loan losses and the valuation of OREO, management obtains appraisals for properties. Operating costs associated with the properties are charged to expense as incurred. Gains on the sale of OREO are included in income when title has passed and the sale has met the minimum down payment requirements prescribed by GAAP. The balance of OREO is recorded in other assets on the consolidated balance sheets.
Goodwill and Other Intangible Assets
Goodwill represents the cost of acquired business in excess of the fair value of the related net assets acquired. Goodwill is not amortized but tested at the reporting unit level for impairment on an annual basis and on an interim basis or when events or circumstances dictate. The Company has elected June 30 as the annual impairment testing date for the insurance and retirement services reporting units and December 31 for the Bank reporting unit.
The Company has the option to first assess qualitative factors, by performing a qualitative analysis, to determine whether the existence of events or circumstances leads to a determination that it is more likely than not that the fair value of a reporting unit is less than its carrying amount. If, after assessing the events or circumstances, the Company determines it is more likely than not that the fair value of a reporting unit is greater than its carrying amount, the impairment test is not required. If the Company concludes otherwise, the Company is required to perform a quantitative impairment test. In the quantitative impairment test, the estimated fair value of a reporting unit is compared to the carrying amount in order to determine if impairment is indicated. If the estimated fair value exceeds the carrying amount, the reporting unit is not deemed to be impaired. If the estimated fair value is below the carrying value of the reporting unit, the difference is the amount of impairment.
Intangible assets that have indefinite useful lives are not amortized, but are tested at least annually for impairment. Intangible assets that have finite useful lives are amortized over their useful lives. Core deposit intangibles and trust intangibles at the Company are amortized using the sum-of-the-years’-digits method. Covenants not to compete are amortized on a straight-line basis. Customer lists are amortized using an accelerated method. When facts and circumstances indicate potential impairment of amortizable intangible assets, the Company evaluates the recoverability of the asset carrying value, using estimates of undiscounted future cash flows over the remaining asset life. Any impairment loss is measured by the excess of carrying value over fair value.
Determining the fair value of a reporting unit under the goodwill impairment tests and determining the fair value of other intangible assets are judgmental and often involve the use of significant estimates and assumptions. Estimates of fair value are primarily determined using the discounted cash flows method, which uses significant estimates and assumptions including projected future cash flows, discount rates reflecting the market rate of return and projected growth rates. Future events may impact such estimates and assumptions and could cause the Company to conclude that our goodwill or intangible assets have become impaired, which would result in recording an impairment loss.
Bank-Owned Life Insurance
The Bank has purchased life insurance policies on certain employees, key executives and directors. Bank-owned life insurance is recorded at the amount that can be realized under the insurance contract at the balance sheet date, which is the cash surrender value adjusted for other charges or other amounts due that are probable at settlement.
Treasury Stock
Treasury stock acquisitions are recorded at cost. Subsequent sales of treasury stock are recorded on an average cost basis. Gains on the sale of treasury stock are credited to additional paid-in-capital. Losses on the sale of treasury stock are charged to additional paid-in-capital to the extent of previous gains, otherwise charged to retained earnings.
Income Taxes
Income taxes are accounted for under the asset and liability method. Deferred income taxes are recognized for the future tax consequences attributable to differences between the financial statement carrying amounts of existing assets and liabilities and their respective tax bases. Deferred tax assets and liabilities are measured using enacted tax rates expected to apply to taxable income in the years in which those temporary differences are expected to be recovered or settled. The effect on deferred taxes of a change in tax rates is recognized in income in the period that includes the enactment date. The Company recognizes interest accrued and penalties related to unrecognized tax benefits in income tax expense.
Tax positions are recognized as a benefit only if it is “more likely than not” that the tax position would be sustained in a tax examination, with a tax examination being presumed to occur. The amount recognized is the largest amount of tax benefit that is greater than 50 percent likely of being realized on examination. For tax positions not meeting the “more likely than not” test, no tax benefit is recorded.
Pension Costs
The Company has a qualified, noncontributory, defined benefit pension plan covering substantially all of its employees, as well as supplemental employee retirement plans to certain current and former executives and a defined benefit postretirement healthcare plan that covers certain employees. Costs associated with these plans, based on actuarial computations of current and future benefits for employees, are charged to current operating expenses.
Stock-Based Compensation
The Company maintains various long-term incentive stock benefit plans under which restricted stock units are granted to certain directors and key employees. Compensation expense are recognized in the consolidated statements of income over the requisite service period, based on the grant-date fair value of the award. For restricted stock units, compensation expense is recognized ratably over the vesting period for the fair value of the award, measured at the grant date.
Earnings Per Share
Basic earnings per share (“EPS”) excludes dilution and is computed by dividing income available to common stockholders by the weighted average number of common shares outstanding for the period. Diluted EPS reflects the potential dilution that could occur if securities or other contracts to issue common stock were exercised or converted into common stock or resulted in the issuance of common stock that then shared in the earnings of the entity (such as the Company’s dilutive stock options and restricted stock units).
Comprehensive Income
At the Company, comprehensive income represents net income plus OCI, which consists primarily of the net change in unrealized gains (losses) on AFS debt securities for the period, changes in the funded status of employee benefit plans and unrealized gains (losses) on derivatives designated as hedging instruments. AOCI represents the net unrealized gains (losses) on AFS debt securities, the previously unrecognized portion of the funded status of employee benefit plans and the fair value of instruments designated as hedging instruments, net of income taxes, as of the consolidated balance sheet dates.
Derivative Instruments and Hedging Activities
The Company records all derivatives on the balance sheet at fair value. The accounting for changes in the fair value of derivatives depends on the intended use of the derivative, whether the Company has elected to designate a derivative in a hedging relationship and apply hedge accounting and whether the hedging relationship has satisfied the criteria necessary to apply hedge accounting. Derivatives designated and qualifying as a hedge of the exposure to changes in the fair value of an asset, liability or firm commitment attributable to a particular risk, such as interest rate risk, are considered fair value hedges. Derivatives designated and qualifying as a hedge of the exposure to variability in expected future cash flows, or other types of forecasted transactions, are considered cash flow hedges. Hedge accounting generally provides for the matching of the timing of gain or loss recognition on the hedging instrument with the recognition of the changes in the fair value of the hedged asset or liability that are attributable to the hedged risk in a fair value hedge or the earnings effect of the hedged forecasted transactions in a cash flow hedge. The Company may enter into derivative contracts that are intended to economically hedge certain of its risks, even though hedge accounting does not apply or the Company elects not to apply hedge accounting.
For derivatives designated as fair value hedges, changes in the fair value of the derivative and the hedged item related to the hedged risk are recognized in earnings. For derivatives designated as cash flow hedges, changes in fair value of the cash flow hedges are reported in OCI. When the cash flows associated with the hedged item are realized, the gain or loss included in OCI is recognized in the consolidated statements of income.
When the Company purchases or sells a portion of a commercial loan that has an existing interest rate swap, it may enter into a risk participation agreement to provide credit protection to the financial institution that originated the swap transaction should the borrower fail to perform on its obligation. The Company enters into both risk participation agreements in which it purchases credit protection from other financial institutions and those in which it provides credit protection to other financial institutions. Any fee paid to the Company under a risk participation agreement is in consideration of the credit risk of the counterparties and is recognized in the income statement. Credit risk on the risk participation agreements is determined after considering the risk rating, probability of default and loss given default of the counterparties.
Fair Value Measurements
GAAP states that fair value is an exit price, representing the amount that would be received to sell an asset or paid to transfer a liability in an orderly transaction between market participants. Fair value measurements are not adjusted for transaction costs. A fair value hierarchy exists within GAAP that prioritizes the inputs to valuation techniques used to measure fair value. The hierarchy gives the highest priority to unadjusted quoted prices in active markets for identical assets or liabilities (Level 1 measurements) and the lowest priority to unobservable inputs (Level 3 measurements). The three levels of the fair value hierarchy are described below:
Level 1 - Unadjusted quoted prices in active markets that are accessible at the measurement date for identical, unrestricted assets or liabilities;
Level 2 - Quoted prices for similar assets or liabilities in active markets, quoted prices in markets that are not active or inputs that are observable, either directly or indirectly, for substantially the full term of the asset or liability;
Level 3 - Prices or valuation techniques that require inputs that are both significant to the fair value measurement and unobservable (i.e., supported by little or no market activity).
A financial instrument’s level within the fair value hierarchy is based on the lowest level of input that is significant to the fair value measurement.
The types of instruments valued based on quoted market prices in active markets include most U.S. government and agency securities, many other sovereign government obligations, liquid mortgage products, active listed equities and most money market securities. Such instruments are generally classified within Level 1 or Level 2 of the fair value hierarchy. The Company does not adjust the quoted price for such instruments.
The types of instruments valued based on quoted prices in markets that are not active, broker or dealer quotations or alternative pricing sources with reasonable levels of price transparency include most investment-grade and high-yield corporate bonds, less liquid mortgage products, less liquid agency securities, less liquid listed equities, state, municipal and provincial obligations and certain physical commodities. Such instruments are generally classified within Level 2 of the fair value hierarchy.
Certain common equity securities are reported at fair value utilizing Level 1 inputs (exchange quoted prices). Other investment securities are reported at fair value utilizing Level 1 and Level 2 inputs. The prices for Level 2 instruments are obtained through an independent pricing service or dealer market participants with whom the Company has historically transacted both purchases and sales of investment securities. Prices obtained from these sources include prices derived from market quotations and matrix pricing. The fair value measurements consider observable data that may include dealer quotes, market spreads, cash flows, the U.S. Treasury yield curve, live trading levels, trade execution data, market consensus prepayment speeds, credit information and the bond’s terms and conditions, among other things. Management reviews the methodologies used in pricing the securities by its third party providers.
Level 3 is for positions that are not traded in active markets or are subject to transfer restrictions. Valuations are adjusted to reflect illiquidity and/or non-transferability and such adjustments are generally based on available market evidence. In the absence of such evidence, management’s best estimate will be used. Management’s best estimate consists of both internal and external support on certain Level 3 investments. Subsequent to inception, management only changes Level 3 inputs and assumptions when corroborated by evidence such as transactions in similar instruments, completed or pending third-party transactions in the underlying investment or comparable entities, subsequent rounds of financing, recapitalizations and other transactions across the capital structure, offerings in the equity or debt markets and changes in financial ratios or cash flows.
Other Financial Instruments
The Company is a party to certain instruments with off-balance-sheet risk such as commitments to extend credit, unused lines of credit, standby letter of credit and certain agricultural real estate loans sold to investors with recourse. The Company’s policy is to record such instruments when funded.
Standby letters of credit are conditional commitments issued to guarantee the performance of a customer to a third party. The risk involved in issuing standby letters of credit is essentially the same as the credit risk involved in extending loan facilities to customers. Under the standby letters of credit, the Company is required to make payments to the beneficiary of the letters of credit upon request by the beneficiary contingent upon the customer’s failure to perform under the terms of the underlying contract with the beneficiary. Standby letters of credit typically have one year expirations with an option to renew upon annual review. The Company typically receives a fee for these transactions. The fair value of standby letters of credit is recorded upon inception.
Repurchase Agreements
Repurchase agreements are accounted for as secured financing transactions since the Company maintains effective control over the transferred securities and the transfer meets the other criteria for such accounting. Obligations to repurchase securities sold are reflected as a liability in the consolidated balance sheets. The securities underlying the agreements are delivered to a custodial account for the benefit of the counterparties with whom each transaction is executed. The counterparties, who may sell, loan or otherwise dispose of such securities to other parties in the normal course of their operations, agree to resell to the Company the same securities at the maturities of the agreements.
Revenue from Contracts with Customers
Effective January 1, 2018, the Company adopted Financial Accounting Standards Board (“FASB”) Accounting Standards Update (“ASU”) 2014-09, Revenue from Contracts with Customers (Accounting Standards Codification (“ASC”) Topic 606) (“ASC 606” and “ASU 2014-09”), and all subsequent ASUs that modified ASC 606. The implementation of ASC 606 did not have a material impact on the measurement or recognition of revenue; as such, a cumulative effect adjustment to opening retained earnings was not deemed necessary. ASC 606 does not apply to revenue associated with financial instruments, including revenue from loans and securities and certain noninterest income streams such as fees associated with mortgage servicing rights, financial guarantees, derivatives and certain credit card fees are also not in scope. ASC 606 is applicable to noninterest revenue streams such as retirement plan administration fees, trust and asset management income, deposit related fees and annuity and insurance commissions; however, the recognition of these revenue streams did not change significantly upon adoption of ASC 606.
Service Charges on Deposit Accounts
Service charges on deposit accounts consist of overdraft fees, monthly service fees, check orders and other deposit account related fees. Overdraft, monthly service, check orders and other deposit account related fees are transactional based, and therefore, the Company’s performance obligation is satisfied, and related revenue recognized, at a point in time. Payment for service charges on deposit accounts is primarily received immediately or in the following month through a direct charge to customers’ accounts.
ATM and Debit Card Fees
ATM fees are primarily generated when a Company cardholder uses a non-Company ATM or a non-Company cardholder uses a Company ATM. Debit card income is primarily comprised of interchange fees earned whenever the Company’s debit cards are processed through card payment networks. The Company’s performance obligations for these revenue streams are satisfied, and related revenue recognized, when the services are rendered or upon completion. Payment is typically received immediately or in the following month.
Retirement Plan Administration Fees
Retirement plan administration fees are primarily generated for services related to the recordkeeping, administration and plan design solutions of defined benefit, defined contribution and revenue sharing plans. Revenue is recognized in arrears for services already provided in accordance with fees established in contracts with customers or based on rates agreed to with investment trade platforms based on ending investment balances held. The Company’s performance obligation is satisfied, and related revenue recognized based on services completed or ending investment balances, for which receivables are recorded at the time of revenue recognition.
Wealth Management
Wealth Management revenue primarily is comprised of trust and other financial services revenue. Trust and asset management income is primarily comprised of fees earned from the management and administration of trusts, pensions and other customer assets. The Company’s performance obligation is generally satisfied with the resulting fees recognized monthly, based upon services completed or the month-end market value of the assets under management and the applicable fee rate. Payment is generally received shortly after services are rendered or a few days after month end through a direct charge to customers’ accounts. The Company does not earn performance-based incentives. Financial services revenue primarily consists of commissions received on brokered investment product sales. For other financial services revenue, the Company’s performance obligation is generally satisfied upon the issuance of the annuity policy. Shortly after the policy is issued, the carrier remits the commission payment to the Company, and the Company recognizes the revenue. The Company does not earn a significant amount of trailing commission fees on brokered investment product sales. The majority of the trailing commission fees are calculated based on a percentage of market value of a period end and revenue is recognized when an investment product’s market value can be determined.
Insurance Revenue
Insurance and other financial services revenue primarily consists of commissions received on insurance. The Company acts as an intermediary between the Company’s customer and the insurance carrier. The Company’s performance obligation related to insurance sales for both property and casualty insurance and employee benefit plans is generally satisfied upon the later of the issuance or effective date of the policy. The Company earns performance based incentives, commonly known as contingency payments, which usually are based on certain criteria established by the insurance carrier such as premium volume, growth and insured loss ratios. Contingent payments are accrued for based upon management’s expectations for the year. Commission expense associated with sales of insurance products is expensed as incurred. The Company does not earn a significant amount of trailing commission fees on insurance product sales. The majority of the trailing commission fees are calculated based on a percentage of market value of a period end and revenue is recognized when an investment product’s market value can be determined.
Other
Other noninterest income consists of other recurring revenue streams such as account and loan fees, interest rate swap fees, safe deposit box rental fees and other miscellaneous revenue streams. These revenue streams are primarily transactional based and payment is received immediately or in the following month, and therefore, the Company’s performance obligation is satisfied, and related revenue recognized, at a point in time.
The following table presents noninterest income, segregated by revenue streams in-scope and out-of-scope of ASC 606:
Years Ended December 31, |
||||||||||||
(In thousands) |
2020 |
2019 |
2018 |
|||||||||
Noninterest income |
||||||||||||
In-Scope of ASC 606: |
||||||||||||
Service charges on deposit accounts |
$ |
$ |
$ |
|||||||||
ATM and debit card fees |
||||||||||||
Retirement plan administration fees |
||||||||||||
Wealth management |
||||||||||||
Insurance |
||||||||||||
Other |
||||||||||||
Total noninterest income in-scope of ASC 606 |
$ |
$ |
$ |
|||||||||
Total noninterest income out-of-scope of ASC 606 |
$ |
$ |
$ |
( |
) |
|||||||
Total noninterest income |
$ |
$ |
$ |
|||||||||
Contract Balances
A contract asset balance occurs when an entity performs a service for a customer before the customer pays consideration or before payment is due, which would result in contract receivables or assets, respectively. A contract liability balance is an entity’s obligation to transfer a service to a customer for which the entity has already received payment or for which payment is due from the customer. The Company’s noninterest revenue streams are largely based on transactional activity, or standard month-end revenue accruals such as asset management fees based on month-end market values. Consideration is often received immediately or shortly after the Company satisfies its performance obligation and revenue is recognized. The Company does not typically enter into long-term revenue contracts with customers, and therefore, does not experience significant contract balances.
Contract Acquisition Costs
ASC 606 requires the capitalization, and subsequently amortization into expense, certain incremental costs of obtaining a contract with a customer if these costs are expected to be recovered. The incremental costs of obtaining a contract are those costs that an entity incurs to obtain a contract with a customer that it would not have incurred if the contract had not been obtained. The Company elected the practical expedient, which allows immediate expensing of contract acquisition costs when the asset that would have resulted from capitalizing these costs would have been amortized in one year or less, and did not capitalize any contract acquisition costs upon adoption of ASC 606 as of or during the year ended December 31, 2020.
Trust Operations
Assets held by the Company in a fiduciary or agency capacity for its customers are not included in the accompanying consolidated balance sheets, since such assets are not assets of the Company.
Subsequent Events
The Company has evaluated subsequent events for potential recognition and/or disclosure and there were none identified.
| 2. | Recent Accounting Pronouncements |
Recently Adopted Accounting Standards
In June 2016, the FASB issued ASU 2016-13, Financial Instruments - Credit Losses (Topic 326): Measurement of Credit Losses on Financial Instruments and all related subsequent amendments thereto. ASU 2016-13 introduces new guidance that make substantive changes to the accounting for credit losses. ASU 2016-13 introduces the CECL model, which applies to financial assets subject to credit losses and measured at amortized cost, as well as certain off-balance sheet credit exposures. This includes loans, loan commitments, standby letters of credit, net investments in leases recognized by a lessor and HTM debt securities. The CECL model requires an entity to estimate credit losses expected over the life of an exposure, considering information about historical events, current conditions and reasonable and supportable forecasts and is generally expected to result in earlier recognition of credit losses. ASU 2016-13 also modifies certain provisions of the current other-than-temporary impairment model for AFS debt securities. Credit losses on AFS debt securities will be limited to the difference between the security’s amortized cost basis and its fair value and will be recognized through an allowance for credit losses rather than as a direct reduction in amortized cost basis. ASU 2016-13 also provides for a simplified accounting model for purchased financial assets with more than insignificant credit deterioration since their origination. ASU 2016-13 requires expanded disclosures including, but not limited to, (1) information about the methods and assumptions used to estimate expected credit losses, including changes in the factors that influenced management’s estimate and the reasons for those changes, (2) financing receivables and net investment in leases measured at amortized cost, further disaggregation of information about the credit quality of those assets and (3) a rollforward of the allowance for credit losses for HTM and AFS securities. The standard also changes the accounting for purchased credit-impaired debt securities and loans. ASU 2016-13 was effective for the Company on January 1, 2020. Management expects that the CECL model may create more volatility in the level of our allowance for loan losses from quarter to quarter as changes in the level of allowance for loan losses will be dependent upon, among other things, macroeconomic forecasts and conditions, loan portfolio volumes and credit quality.
The Company adopted CECL on January 1, 2020 (“Day 1”) using the modified retrospective method for all financial assets measured at amortized cost and off-balance-sheet credit exposures. Results for reporting periods beginning after January 1, 2020 are presented under ASC 326 while prior period amounts continue to be reported in accordance with previously applicable GAAP. The Company recorded a net decrease to retained earnings of $4.3 million as of January 1, 2020 for the cumulative effect of adopting ASC 326. The transition adjustment includes a $3.0 million impact due to the allowance for credit losses on loans, a $2.8 million impact due to the allowance for credit losses on off-balance sheet credit exposure, and a $1.5 million impact to the deferred tax asset. The Company did not record an allowance for HTM debt securities on January 1, 2020 as the amount of credit risk was deemed immaterial. The Company did not record an allowance for credit losses on its AFS debt securities under the newly codified AFS debt security impairment model, as the majority of these securities are government agency-backed securities for which the risk of loss is minimal. Refer to Note 4 Securities and Note 6 Allowance for Credit Losses and Credit Quality of Loans to the Company’s consolidated financial statements included in this Form 10-K for more information.
In December 2018, the Office of Comptroller of the Currency (“OCC”), the Board of Governors of the Federal Reserve System, and the Federal Deposit Insurance Corporation (“FDIC”) approved a final rule to address changes to credit loss accounting under GAAP, including banking organizations’ implementation of CECL. The final rule provides banking organizations the option to phase in over a three-year period the day-one adverse effects on regulatory capital that may result from the adoption of the new accounting standard. In March 2020, the OCC, the Board of Governors of the Federal Reserve System, and the FDIC announced an interim final rule to delay the estimated impact on regulatory capital stemming from the implementation of CECL. The interim final rule maintains the three-year transition option in the previous rule and provides banks the option to delay for two years an estimate of CECL’s effect on regulatory capital, relative to the incurred loss methodology’s effect on regulatory capital, followed by a three-year transition period (five-year transition option). The Company adopted the capital transition relief over the permissible five-year period.
On March 22, 2020, a statement was issued by the Company’s banking regulators and titled the “Interagency Statement on Loan Modifications and Reporting for Financial Institutions Working with Customers Affected by the Coronavirus” that encourages financial institutions to work prudently with borrowers who are or may be unable to meet their contractual payment obligations due to the effects of the recent COVID-19 pandemic. Additionally, Section 4013 of the CARES Act, which was enacted on March 27, 2020, further provides that a qualified loan modification is exempt by law from classification as a troubled debt restructuring as defined by GAAP. To be eligible, each loan modification must be (1) related to the COVID-19 event; (2) executed on a loan that was not more than 30 days past due as of December 31, 2019; and (3) executed between March 1, 2020, and the earlier of (a) 60 days after the date of termination of the National Emergency or (b) December 31, 2020. On August 3, 2020, the Federal Financial Institutions Examination Council (“FFIEC”) issued a joint statement on additional loan accommodations related to COVID-19. The joint statement clarifies that for loan modifications in which Section 4013 is being applied, subsequent modifications could also be eligible under Section 4013. Accordingly, the Company is offering modifications made in response to COVID-19 to borrowers who were current and otherwise not past due in accordance with the criteria stated in Section 4013. These include short-term, 180 days or less, modifications in the form of payment deferrals, fee waivers, extensions of repayment terms, or other delays in payment. Accordingly, the Company did not account for such loan modifications as TDRs. As of December 31, 2020, there were $110.8 million in loans in modification programs related to COVID-19. On December 27, 2020, the Consolidated Appropriations Act amended section 2014 of the CARES Act extending the exemption of qualified loan modifications from classification as a troubled debt restructuring as defined by GAAP to the earlier of January 1, 2022, or 60 days after the National Emergency concerning COVID-19 ends.
In August 2018, the FASB issued ASU 2018-13, Fair value Measurement (Topic 820) – Disclosure Framework – Changes to the Disclosure Requirements for Fair value Measurement. The provisions of ASU 2018-13 modify the disclosure requirements on fair value measurements in ASC 820. The amendments on changes in unrealized gains and losses, the range and weighted average of significant unobservable inputs used to develop Level 3 fair value measurements and the narrative description of measurement uncertainty should be applied prospectively for only the most recent interim or annual period presented in the initial fiscal year of adoption. All other amendments should be applied retrospectively to all periods presented upon their effective date. ASU 2018-13 is effective January 1, 2020. The adoption did not have a material impact on the consolidated financial statements and related disclosures.
In August 2018, the FASB issued ASU 2018-15, Intangibles – Goodwill and Other – Internal-Use Software (Subtopic 350-40) – Customer’s Accounting for Implementation Costs Incurred in a Cloud Computing Arrangement that is a Service Contract. ASU 2018-15 amends existing guidance and requires a hosting arrangement that is a service contract to follow the guidance in Subtopic 350-40 to determine which implementation costs to capitalize and which costs to expense. ASU 2018-15 is effective for the Company on January 1, 2020. The adoption did not have a material impact on the consolidated financial statements and related disclosures.
In August 2018, the FASB issued ASU 2018-14, Compensation – Retirement Benefits – Defined Benefit Plans - General (Subtopic 715-20), provides changes to the disclosure requirements for defined benefit plans. The amended guidance modifies the disclosure requirements for employers that sponsor defined benefit pension or other postretirement plans. The amendments are a result of the disclosure framework project that focuses on improvements to the effectiveness of disclosures in the notes to financial statements. The amendments remove and add certain disclosure requirements. The disclosure requirements being removed relating to public companies are: (1) the amounts in accumulated other comprehensive income expected to be recognized as components of net periodic benefit cost over the next fiscal year, (2) the amount and timing of plan assets expected to be returned to the employer, (3) the 2001 disclosure requirement relating to Japanese Welfare Pension Insurance Law, (4) related party disclosures about the amount of future annual benefits covered by insurance, and (5) the effects of a one-percentage-point change in assumed health care cost trends on the benefit cost and obligation. The disclosure requirements being added relating to public companies are (1) the weighted-average interest crediting rates for cash balance plans, and (2) an explanation of the reasons for significant gains and losses related to changes in the benefit obligation for the period. ASU 2018-14 is effective for the Company on January 1, 2021 and early adoption is permitted. The Company adopted the provisions of ASU 2018-14 as of December 31, 2020 and it did not have a material impact on its disclosures to the consolidated financial statements.
Accounting Standards Issued Not Yet Adopted
In March 2020, the FASB issued ASU 2020-04, Reference Rate Reform (Topic 848): Facilitation of the Effects of Reference Rate Reform on Financial Reporting. On January 7, 2021, the FASB issued ASU 2021-01, which refines the scope of ASC 848 and clarifies some of its guidance. The ASU and related amendments provide temporary optional expedients and exceptions to the existing guidance for applying GAAP to affected contract modifications and hedge accounting relationships in the transition away from the London Interbank Offered Rate (“LIBOR”) or other interbank offered rate on financial reporting. The guidance also allows a one-time election to sell and/or reclassify to AFS or trading HTM debt securities that reference an interest rate affected by reference rate reform. The amendments in this ASU are effective March 12, 2020 through December 31, 2022 and permits relief solely for reference rate reform actions and permits different elections over the effective date for legacy and new activity. The Company is evaluating the impact of adopting the new guidance on the consolidated financial statements and does not expect it will have a material impact on the consolidated financial statements.
In December 2019, the FASB issued ASU 2019-12, Income Taxes (Topic 740): Simplifying the Accounting for Income Taxes. This ASU removes specific exceptions to the general principles in Topic 740 in GAAP. It eliminates the need for an organization to analyze whether the following apply in a given period: (1) exception to the incremental approach for intraperiod tax allocation; (2) exceptions to accounting for basis differences when there are ownership changes in foreign investments; and (3) exception in interim period income tax accounting for year-to-date losses that exceed anticipated losses. The ASU also improves financial statement preparers’ application of income tax-related guidance and simplifies GAAP for: (1) franchise taxes that are partially based on income; (2) transactions with a government that result in a step up in the tax basis of goodwill; (3) separate financial statements of legal entities that are not subject to tax; and (4) enacted changes in tax laws in interim periods. The amendments in this ASU are effective for the Company on January 1, 2021, and interim periods within those fiscal years. Early adoption is permitted. The adoption did not have a material impact on the consolidated financial statements and related disclosures.
| 3. | Acquisitions |
In 2020, the Company acquired Alliance Benefit Group of Illinois, Inc. for a total consideration of $9.1 million. As part of the acquisition, the Company recorded goodwill of $5.8 million and $5.1 million contingent consideration recorded in other liabilities on the consolidated balance sheet as of December 31, 2020.
In 2018, the Company acquired Retirement Plan Services, LLC for a total consideration of $13.0 million. As part of the acquisition, the Company recorded goodwill of $6.7 million and $5.1 million contingent consideration recorded in other liabilities on the consolidated balance sheet as of December 31, 2018.
The operating results of acquired companies are included in the consolidated results after the dates of acquisition.
| 4. | Securities |
The amortized cost, estimated fair value and unrealized gains (losses) of AFS securities are as follows:
(In thousands) |
Amortized Cost |
Unrealized Gains |
Unrealized Losses |
Estimated Fair Value |
||||||||||||
As of December 31, 2020 |
||||||||||||||||
Federal agency |
$ |
$ |
$ |
$ |
||||||||||||
State & municipal |
||||||||||||||||
Mortgage-backed: |
||||||||||||||||
Government-sponsored enterprises |
||||||||||||||||
U.S. government agency securities |
||||||||||||||||
Collateralized mortgage obligations: |
||||||||||||||||
Government-sponsored enterprises |
||||||||||||||||
U.S. government agency securities |
||||||||||||||||
Corporate |
||||||||||||||||
Total AFS securities |
$ |
$ |
$ |
$ |
||||||||||||
As of December 31, 2019 |
||||||||||||||||
Federal agency |
$ |
$ |
$ |
$ |
||||||||||||
State & municipal |
||||||||||||||||
Mortgage-backed: |
||||||||||||||||
Government-sponsored enterprises |
||||||||||||||||
U.S. government securities |
||||||||||||||||
Collateralized mortgage obligations: |
||||||||||||||||
Government-sponsored enterprises |
||||||||||||||||
U.S. government securities |
||||||||||||||||
Total AFS securities |
$ |
$ |
$ |
$ |
||||||||||||
There was no allowance for credit losses on AFS securities as of the year ending December 31, 2020.
The components of net realized gains (losses) on AFS securities are as follows. These amounts were reclassified out of AOCI and into earnings.
Years Ended December 31, |
||||||||||||
(In thousands) |
2020 |
2019 |
2018 |
|||||||||
Gross realized gains |
$ |
$ |
$ |
|||||||||
Gross realized (losses) |
( |
) |
( |
) |
||||||||
Net AFS realized gains (losses) |
$ |
$ |
( |
) |
$ |
( |
) |
|||||
Included in net realized gains (losses) on AFS securities, the Company recorded gains from calls of approximately $3 thousand for the year ended December 31, 2020, $25 thousand for the year ended December 31, 2019 and none for the year ended December 31, 2018.
The amortized cost, estimated fair value and unrealized gains (losses) of HTM securities are as follows:
(In thousands) |
Amortized Cost |
Unrealized Gains |
Unrealized Losses |
Estimated Fair Value |
||||||||||||
As of December 31, 2020 |
||||||||||||||||
Federal agency |
$ |
$ |
$ |
$ |
||||||||||||
Mortgage-backed: |
||||||||||||||||
Government-sponsored enterprises |
||||||||||||||||
U.S. government agency securities |
||||||||||||||||
Collateralized mortgage obligations: |
||||||||||||||||
Government-sponsored enterprises |
||||||||||||||||
U.S. government agency securities |
||||||||||||||||
State & municipal |
||||||||||||||||
Total HTM securities |
$ |
$ |
$ |
$ |
||||||||||||
As of December 31, 2019 |
||||||||||||||||
Mortgage-backed: |
||||||||||||||||
Government-sponsored enterprises |
$ |
$ |
$ |
$ |
||||||||||||
U.S. government agency securities |
||||||||||||||||
Collateralized mortgage obligations: |
||||||||||||||||
Government-sponsored enterprises |
||||||||||||||||
U.S. government agency securities |
||||||||||||||||
State & municipal |
||||||||||||||||
Total HTM securities |
$ |
$ |
$ |
$ |
||||||||||||
At December 31, 2020 and 2019, all of the mortgaged-backed HTM securities were comprised of U.S. government agency and Government-sponsored enterprises securities. There was no allowance for credit losses on HTM securities as of December 31, 2020.
Included in net realized gains (losses), the Company recorded gains from calls on HTM securities of approximately $24 thousand for the year ended December 31, 2020 and approximately $12 thousand for the year ended December 31, 2019. There were no recorded gains from calls on HTM securities included in the net realizes gains (losses) for the year ended December 31, 2018.
During the year ended December 31, 2020, the Company sold HTM securities with an amortized cost of $1.0 million and resulted in a realized loss of $1 thousand. Due to significant deterioration in the creditworthiness of the issuer of the HTM securities, the circumstances caused the Company to change its intent to hold the HTM securities sold to maturity, which did not affect the Company’s intent to hold the remainder of the HTM portfolio to maturity. There were no
AFS and HTM securities with amortized costs totaling $1.4 billion at December 31, 2020 and $1.3 billion at December 31, 2019 were pledged to secure public deposits and for other purposes required or permitted by law. Additionally, at December 31, 2020 and 2019, AFS and HTM securities with an amortized cost of $305.2 million and $189.8 million, respectively, were pledged as collateral for securities sold under repurchase agreements.
The following tables set forth information with regard to gains and (losses) on equity securities:
Years Ended December 31, |
||||||||
(In thousands) |
2020 |
2019 |
||||||
Net (losses) and gains recognized on equity securities |
$ |
( |
) |
$ |
||||
Less: Net gains recognized during the period on equity securities sold during the period |
||||||||
Unrealized (losses) and gains recognized on equity securities still held |
$ |
( |
) |
$ |
||||
Included in the net realized gains and (losses) recognized on equity securities during the year ended December 31, 2019, the Company recorded a $4.0 million gain from the sale of Visa Class B common stock, which had no readily determinable fair value at the time of the sale. As of December 31, 2020 and 2019 the carrying value of equity securities without readily determinable fair values was $2.0 million and $4.0 million, respectively. The Company performed a qualitative assessment to determine whether the investments were impaired and identified no areas of concern as of December 31, 2020 and 2019. There were no
The following tables set forth information with regard to contractual maturities of debt securities at December 31, 2020:
(In thousands) |
Amortized Cost |
Estimated Fair Value |
||||||
AFS debt securities: |
||||||||
Within one year |
$ |
$ |
||||||
From one to five years |
||||||||
From five to ten years |
||||||||
After ten years |
||||||||
Total AFS debt securities |
$ |
$ |
||||||
HTM debt securities: |
||||||||
Within one year |
$ |
$ |
||||||
From one to five years |
||||||||
From five to ten years |
||||||||
After ten years |
||||||||
Total HTM debt securities |
$ |
$ |
||||||
Maturities of mortgage-backed, collateralized mortgage obligations and asset-backed securities are stated based on their estimated average lives. Actual maturities may differ from estimated average lives or contractual maturities because, in certain cases, borrowers have the right to call or prepay obligations with or without call or prepayment penalties.
Except for U.S. Government securities and Government-sponsored enterprises securities, there were no
The following table sets forth information with regard to investment securities with unrealized losses, for which an allowance for credit losses has not been recorded at December 31, 2020, segregated according to the length of time the securities had been in a continuous unrealized loss position:
Less Than 12 Months |
12 Months or Longer |
Total |
||||||||||||||||||||||||||||||||||
(In thousands) |
Fair Value |
Unrealized Losses |
Number of Positions |
Fair Value |
Unrealized Losses |
Number of Positions |
Fair Value |
Unrealized Losses |
Number of Positions |
|||||||||||||||||||||||||||
As of December 31, 2020 |
||||||||||||||||||||||||||||||||||||
AFS securities: |
||||||||||||||||||||||||||||||||||||
Federal agency |
$ |
$ |
( |
) |
$ |
$ |
$ |
$ |
( |
) |
||||||||||||||||||||||||||
Mortgage-backed |
( |
) |
( |
) |
( |
) |
||||||||||||||||||||||||||||||
Collateralized mortgage obligations |
( |
) |
( |
) |
||||||||||||||||||||||||||||||||
Total securities with unrealized losses |
$ |
$ |
( |
) |
$ |
$ |
( |
) |
$ |
$ |
( |
) |
||||||||||||||||||||||||
HTM securities: |
||||||||||||||||||||||||||||||||||||
Federal agency |
$ |
$ |
( |
) |
$ |
$ |
$ |
$ |
( |
) |
||||||||||||||||||||||||||
State & municipal |
( |
) |
( |
) |
||||||||||||||||||||||||||||||||
Total securities with unrealized losses |
$ |
$ |
( |
) |
$ |
$ |
$ |
$ |
( |
) |
||||||||||||||||||||||||||
As of December 31, 2019 |
||||||||||||||||||||||||||||||||||||
AFS securities: |
||||||||||||||||||||||||||||||||||||
Federal agency |
$ |
$ |
( |
) |
$ |
$ |
( |
) |
$ |
$ |
( |
) |
||||||||||||||||||||||||
State & municipal |
( |
) |
( |
) |
||||||||||||||||||||||||||||||||
Mortgage-backed |
( |
) |
( |
) |
( |
) |
||||||||||||||||||||||||||||||
Collateralized mortgage obligations |
( |
) |
( |
) |
( |
) |
||||||||||||||||||||||||||||||
Total securities with unrealized losses |
$ |
$ |
( |
) |
$ |
$ |
( |
) |
$ |
$ |
( |
) |
||||||||||||||||||||||||
HTM securities: |
||||||||||||||||||||||||||||||||||||
Mortgage-backed |
$ |
$ |
$ |
$ |
( |
) |
$ |
$ |
( |
) |
||||||||||||||||||||||||||
Collateralized mortgage obligations |
( |
) |
( |
) |
( |
) |
||||||||||||||||||||||||||||||
State & municipal |
( |
) |
( |
) |
||||||||||||||||||||||||||||||||
Total securities with unrealized losses |
$ |
$ |
( |
) |
$ |
$ |
( |
) |
$ |
$ |
( |
) |
||||||||||||||||||||||||
The Company does not believe the AFS securities that were in an unrealized loss position as of December 31, 2020, which consisted of 23 individual securities, represented a credit loss impairment. AFS debt securities in unrealized loss positions are evaluated for impairment related to credit losses at least quarterly. As of December 31, 2020, the majority of the AFS securities in an unrealized loss position consisted of debt securities issued by U.S. government agencies or U.S. government-sponsored enterprises that carry the explicit and/or implicit guarantee of the U.S. government, which are widely recognized as “risk-free” and have a long history of zero credit losses. Total gross unrealized losses were primarily attributable to changes in interest rates, relative to when the investment securities were purchased, and not due to the credit quality of the investment securities. The Company does not intend to sell, nor is it more likely than not that the Company will be required to sell the security before recovery of its amortized cost basis, which may be at maturity. The Company elected to exclude accrued interest receivable (“AIR”) from the amortized cost basis of debt securities disclosed throughout this footnote. AIR on AFS debt securities totaled $3.3 million at December 31, 2020 and is excluded from the estimate of credit losses and reported in the financial statement line for other assets.
5. Loans
A summary of loans, net of deferred fees and origination costs, by category is as follows:
At December 31, |
||||||||
(In thousands) |
2020 |
2019 |
||||||
Commercial |
$ |
$ |
||||||
Commercial Real Estate |
||||||||
Paycheck Protection Program |
||||||||
Residential Real Estate |
||||||||
Indirect Auto |
||||||||
Specialty Lending |
||||||||
Home Equity |
||||||||
Other Consumer |
||||||||
Total loans |
$ |
$ |
||||||
Included in the above loans are net deferred loan origination costs totaling $9.4 million and $35.3 million at December 31, 2020 and 2019, respectively. The Company had $1.1 million residential loans held for sale as of December 31, 2020. The Company had $11.5 million of residential loans held for sale as of December 31, 2019.
The total amount of loans serviced by the Company for unrelated third parties was $614.5 million and $612.3 million at December 31, 2020 and 2019, respectively. At December 31, 2020 and 2019, the Company had $1.3 million and $0.8 million, respectively, of mortgage servicing rights.
At December 31, 2020 and 2019, the Company serviced $25.7 million and $25.6 million, respectively, of agricultural loans sold with recourse. Due to sufficient collateral on these loans and government guarantees, no reserve is considered necessary at December 31, 2020 and 2019.
FHLB advances are collateralized by a blanket lien on the Company’s residential real estate mortgages.
In the ordinary course of business, the Company has made loans at prevailing rates and terms to directors, officers and other related parties. Such loans, in management’s opinion, do not present more than the normal risk of collectability or incorporate other unfavorable features. The aggregate amount of loans outstanding to qualifying related parties and changes during the years are summarized as follows:
(In thousands) |
2020 |
2019 |
||||||
Balance at January 1 |
$ |
$ |
||||||
New loans |
||||||||
Adjustment due to change in composition of related parties |
||||||||
Repayments |
( |
) |
( |
) |
||||
Balance at December 31 |
$ |
$ |
||||||
6. Allowance for Credit Losses and Credit Quality of Loans
As previously mentioned in Note 1 Summary of Significant Accounting Policies, the Company’s January 1, 2020 adoption of CECL resulted in a significant change to our methodology for estimating the allowance for credit losses since December 31, 2019. Portfolio segmentation has been redefined under CECL and therefore prior year tables are presented separately.
The Day 1 increase in the allowance for credit loss on loans relating to adoption of ASU 2016-13 was $3.0 million, which decreased retained earnings by $2.3 million and increased the deferred tax asset by $0.7 million.
There were no loans purchased with credit deterioration during the year ended December 31, 2020. During 2020, the Company purchased $51.9 million of consumer loans at a 1 % discount. The allowance for credit losses recorded for these loans on the purchase date was $3.6 million. The Company made a policy election to report AIR in the other assets line item on the balance sheet. AIR on loans totaled $23.7 million at December 31, 2020 and was included in the allowance for loan credit losses to estimate the impact of accrued interest receivable related to loans with modifications due to the pandemic as the length of time between interest recognition and the write-off of uncollectible interest could exceed 120 days, exempting these loans from our policy election for accrued interest receivable. The estimated allowance for credit losses related to AIR at December 31, 2020 was $0.6 million.
The Day 1 and December 31, 2020 allowance for credit losses calculation incorporated a 6-quarter forecast period to account for forecast economic conditions under each scenario utilized in the measurement. For periods beyond the 6-quarter forecast, the model reverted to long-term economic conditions over a 4-quarter reversion period on a straight-line basis.
The quantitative model as of December 31, 2020 incorporated a baseline economic outlook, along with alternative upside and downside scenarios sourced from a reputable third-party to accommodate other potential economic conditions in the model. The baseline outlook reflected an unemployment rate environment above pre-COVID-19 levels for the entire forecast period, though steadily improving, before returning to low single digits by the end of 2023. Northeast GDP’s annual growth was expected to start 2021 in the low to mid-single digits, with a peak growth rate of 8% in the fourth quarter of 2021 and steadily falling back down to normalized levels through 2023 and 2024. Other utilized economic variables show improvement in their respective forecasts, namely business output. Key assumptions in the baseline economic outlook included an additional stimulus package passed at the same timing and a comparable level to that of the actual $900 billion COVID-19 relief package passed in December 2020 along with no significant secondary surge in COVID-19 cases or pandemic-related business closures. The alternative downside scenario assumed deteriorated economic and epidemiological conditions from the baseline outlook. In the same way, the alternative upside scenario assumed a faster economic recovery and more effective management of the COVID-19 virus from the baseline outlook. These scenarios and their respective weightings are evaluated at each measurement date and reflect management’s expectations as of December 31, 2020. Additional adjustments were made for COVID-19 related factors not incorporated in the forecasts, such as the mitigating impact of unprecedented stimulus in 2020, including direct payments to individuals, increased unemployment benefits, the Company’s loan deferral and modification initiatives and various government-sponsored loan programs. The commercial & industrial and consumer segment models were based upon percent change in unemployment with modeled values as of December 31, 2020 well outside the observed historical experience. Therefore, adjustments were required to produce outputs more aligned with default expectations given the forecast economic environment. Additionally, the Company identified a slightly higher level of criticized and classified loans during 2020 than those contemplated by the model during similar economic conditions in the past for which an adjustment was made for estimated expected additional losses above modeled output. These factors were considered through a separate quantitative process and incorporated into the estimate for allowance for credit losses at December 31, 2020.
The allowance for credit losses totaled $110.0 million at December 31, 2020, compared to $73.0 million at December 31, 2019. The allowance for credit losses as a percentage of loans was 1.47 % at December 31, 2020, compared to 1.02 % at December 31, 2019. The increase in the allowance for credit losses from January 1, 2020 to December 31, 2020 was primarily due to the deteriorated economic forecast due to the COVID-19 pandemic.
The provision for loan losses was $51.1 million for the twelve months ended December 31, 2020, compared to $25.4 million for the twelve months ended December 31, 2019. The increase to provision expense was driven by the deteriorated economic forecast due to the COVID-19 pandemic. The Company expects that with the adoption of CECL beginning on January 1, 2020, provision expense may become more volatile due to changes in CECL model assumptions of credit quality, macroeconomic factors and conditions, and loan composition, which drive the allowance for credit losses balance.
The following table illustrate the changes in the allowance for credit losses by our portfolio segments:
(In thousands) |
Commercial Loans |
Consumer Loans |
Residential |
Total |
||||||||||||
Balance as of January 1, 2020 (after adoption of ASC 326) |
$ |
$ |
$ |
$ |
||||||||||||
Charge-offs |
( |
) |
( |
) |
( |
) |
( |
) |
||||||||
Recoveries |
||||||||||||||||
Provision |
||||||||||||||||
Ending Balance as of December 31, 2020 |
$ |
$ |
$ |
$ |
||||||||||||
The increase in the allowance for credit losses from Day 1 to December 31, 2020 was primarily due to the deterioration of macroeconomic factors surrounding the COVID-19 pandemic.
Individually Evaluated Loans
As of December 31, 2020, there were five relationships identified to be evaluated for loss on an individual basis which had an amortized cost basis of $15.2 million. The allowance for credit loss was $3.2 million and was determined by an estimate of the fair value of the collateral which consisted of business assets (accounts receivable, inventory and machinery, real estate and equipment). As of Day 1, there were no relationships identified to be evaluated for loss on an individual basis.
The following table sets forth information with regard to past due and nonperforming loans by loan segment:
(In thousands) |
31-60 Days Past Due Accruing |
61-90 Days Past Due Accruing |
Greater Than 90 Days Past Due Accruing |
Total Past Due Accruing |
Nonaccrual |
Current |
Recorded Total Loans |
|||||||||||||||||||||
As of December 31, 2020 |
||||||||||||||||||||||||||||
Commercial Loans: |
||||||||||||||||||||||||||||
C&I |
$ |
$ |
$ |
$ |
$ |
$ |
$ |
|||||||||||||||||||||
CRE |
||||||||||||||||||||||||||||
PPP |
||||||||||||||||||||||||||||
Total Commercial Loans |
$ |
$ |
$ |
$ |
$ |
$ |
$ |
|||||||||||||||||||||
Consumer Loans: |
||||||||||||||||||||||||||||
Auto |
$ |
$ |
$ |
$ |
$ |
$ |
$ |
|||||||||||||||||||||
Other Consumer |
||||||||||||||||||||||||||||
Total Consumer Loans |
$ |
$ |
$ |
$ |
$ |
$ |
$ |
|||||||||||||||||||||
Residential |
$ |
$ |
$ |
$ |
$ |
$ |
$ |
|||||||||||||||||||||
Total Loans |
$ |
$ |
$ |
$ |
$ |
$ |
$ |
|||||||||||||||||||||
As of December 31, 2020, there were no loans in nonaccrual without an allowance for credit losses.
Credit Quality Indicators
The Company has developed an internal loan grading system to evaluate and quantify the Company’s loan portfolio with respect to quality and risk. The system focuses on, among other things, financial strength of borrowers, experience and depth of borrower’s management, primary and secondary sources of repayment, payment history, nature of the business and outlook on particular industries. The internal grading system enables the Company to monitor the quality of the entire loan portfolio on a consistent basis and provide management with an early warning system, enabling recognition and response to problem loans and potential problem loans.
Commercial Grading System
For C&I, PPP and CRE loans, the Company uses a grading system that relies on quantifiable and measurable characteristics when available. This includes comparison of financial strength to available industry averages, comparison of transaction factors (loan terms and conditions) to loan policy and comparison of credit history to stated repayment terms and industry averages. Some grading factors are necessarily more subjective such as economic and industry factors, regulatory environment and management. C&I and CRE loans are graded Doubtful, Substandard, Special Mention and Pass. The increase in non-pass credits from December 31, 2019 was primarily due to the Company’s proactive approach to downgrade loans that were both in payment deferral due to the COVID-19 pandemic and in higher risk industries such as entertainment, restaurants, retail, healthcare and accommodations.
Doubtful
A Doubtful loan has a high probability of total or substantial loss, but because of specific pending events that may strengthen the asset, its classification as a loss is deferred. Doubtful borrowers are usually in default, lack adequate liquidity or capital and lack the resources necessary to remain an operating entity. Pending events can include mergers, acquisitions, liquidations, capital injections, the perfection of liens on additional collateral, the valuation of collateral and refinancing. Generally, pending events should be resolved within a relatively short period and the ratings will be adjusted based on the new information. Nonaccrual treatment is required for Doubtful assets because of the high probability of loss.
Substandard
Substandard loans have a high probability of payment default or they have other well-defined weaknesses. They require more intensive supervision by bank management. Substandard loans are generally characterized by current or expected unprofitable operations, inadequate debt service coverage, inadequate liquidity or marginal capitalization. Repayment may depend on collateral or other credit risk mitigants. For some Substandard loans, the likelihood of full collection of interest and principal may be in doubt and those loans should be placed on nonaccrual. Although Substandard assets in the aggregate will have a distinct potential for loss, an individual asset’s loss potential does not have to be distinct for the asset to be rated Substandard.
Special Mention
Special Mention loans have potential weaknesses that may, if not checked or corrected, weaken the asset or inadequately protect the Company’s position at some future date. These loans pose elevated risk, but their weakness does not yet justify a Substandard classification. Borrowers may be experiencing adverse operating trends (i.e., declining revenues or margins) or may be struggling with an ill-proportioned balance sheet (i.e., increasing inventory without an increase in sales, high leverage, tight liquidity). Adverse economic or market conditions, such as interest rate increases or the entry of a new competitor, may also support a Special Mention rating. Although a Special Mention loan has a higher probability of default than a Pass asset, its default is not imminent.
Pass
Loans graded as Pass encompass all loans not graded as Doubtful, Substandard or Special Mention. Pass loans are in compliance with loan covenants and payments are generally made as agreed. Pass loans range from superior quality to fair quality. Pass loans also include any portion of a government guaranteed loan, including PPP loans.
Consumer and Residential Grading System
Consumer and Residential loans are graded as either Nonperforming or Performing.
Nonperforming
Nonperforming loans are loans that are 1) over 90
Performing
All loans not meeting any of the above criteria are considered Performing.
The following tables illustrate the Company’s credit quality by loan class by vintage as of December 31, 2020:
(In thousands) |
2020 |
2019 |
2018 |
2017 |
2016 |
Prior |
Revolving Loans Amortized Cost Basis |
Revolving Loans Converted to Term |
Total |
|||||||||||||||||||||||||||
C&I |
||||||||||||||||||||||||||||||||||||
By Internally Assigned Grade: |
||||||||||||||||||||||||||||||||||||
Pass |
$ |
$ |
$ |
$ |
$ |
$ |
$ |
$ |
$ |
|||||||||||||||||||||||||||
Special Mention |
||||||||||||||||||||||||||||||||||||
Substandard |
||||||||||||||||||||||||||||||||||||
Doubtful |
||||||||||||||||||||||||||||||||||||
Total C&I |
$ |
$ |
$ |
$ |
$ |
$ |
$ |
$ |
$ |
|||||||||||||||||||||||||||
CRE |
||||||||||||||||||||||||||||||||||||
By Internally Assigned Grade: |
||||||||||||||||||||||||||||||||||||
Pass |
$ |
$ |
$ |
$ |
$ |
$ |
$ |
$ |
$ |
|||||||||||||||||||||||||||
Special Mention |
||||||||||||||||||||||||||||||||||||
Substandard |
||||||||||||||||||||||||||||||||||||
Doubtful |
||||||||||||||||||||||||||||||||||||
Total CRE |
$ |
$ |
$ |
$ |
$ |
$ |
$ |
$ |
$ |
|||||||||||||||||||||||||||
PPP |
||||||||||||||||||||||||||||||||||||
By Internally Assigned Grade: |
||||||||||||||||||||||||||||||||||||
Pass |
$ |
$ |
$ |
$ |
$ |
$ |
$ |
$ |
$ |
|||||||||||||||||||||||||||
Total PPP |
$ |
$ |
$ |
$ |
$ |
$ |
$ |
$ |
$ |
|||||||||||||||||||||||||||
Auto |
||||||||||||||||||||||||||||||||||||
By Payment Activity: |
||||||||||||||||||||||||||||||||||||
Performing |
$ |
$ |
$ |
$ |
$ |
$ |
$ |
$ |
$ |
|||||||||||||||||||||||||||
Nonperforming |
||||||||||||||||||||||||||||||||||||
Total Auto |
$ |
$ |
$ |
$ |
$ |
$ |
$ |
$ |
$ |
|||||||||||||||||||||||||||
Other Consumer |
||||||||||||||||||||||||||||||||||||
By Payment Activity: |
||||||||||||||||||||||||||||||||||||
Performing |
$ |
$ |
$ |
$ |
$ |
$ |
$ |
$ |
$ |
|||||||||||||||||||||||||||
Nonperforming |
||||||||||||||||||||||||||||||||||||
Total Other Consumer |
$ |
$ |
$ |
$ |
$ |
$ |
$ |
$ |
$ |
|||||||||||||||||||||||||||
Residential |
||||||||||||||||||||||||||||||||||||
By Payment Activity: |
||||||||||||||||||||||||||||||||||||
Performing |
$ |
$ |
$ |
$ |
$ |
$ |
$ |
$ |
$ |
|||||||||||||||||||||||||||
Nonperforming |
||||||||||||||||||||||||||||||||||||
Total Residential |
$ |
$ |
$ |
$ |
$ |
$ |
$ |
$ |
$ |
|||||||||||||||||||||||||||
Total Loans |
$ |
$ |
$ |
$ |
$ |
$ |
$ |
$ |
$ |
|||||||||||||||||||||||||||
Allowance for Credit Losses on Off-Balance Sheet Credit Exposures
As of December 31, 2020, the allowance for losses on unfunded commitments totaled $6.4 million, compared to $0.9 million as of December 31, 2019. Prior to January 1, 2020, the Company calculated the allowance for losses on unfunded commitments using the incurred loss methodology.
Troubled Debt Restructuring
When the Company modifies a loan in a troubled debt restructuring, such modifications generally include one or a combination of the following: an extension of the maturity date at a stated rate of interest lower than the current market rate for new debt with similar risk; temporary reduction in the interest rate; or change in scheduled payment amount. Residential and Consumer TDRs occurring during 2020 were due to the reduction in the interest rate or extension of the term.
An allowance for impaired commercial and consumer loans that have been modified in a TDR is measured based on the present value of the expected future cash flows, discounted at the contractual interest rate of the original loan agreement, except when the sole (remaining) source of repayment for the loan is the operation or liquidation of the collateral. In these cases, management uses the current fair value of the collateral, less selling costs. If management determines that the value of the modified loan is less than the recorded investment in the loan an impairment charge would be recorded.
The Company began offering loan modifications to assist borrowers during the COVID-19 national emergency. The CARES Act, along with a joint agency statement issued by banking regulatory agencies, provides that modifications made in response to COVID-19 do not need to be accounted for as a TDR. The Company evaluated the modification programs provided to its borrowers and has concluded the modifications were generally made in accordance with the CARES Act guidance to borrowers who were in good standing prior to the COVID-19 pandemic and are not required to be designated as TDRs. See Note 2 Recent Accounting Pronouncements for more information.
The following tables illustrate the recorded investment and number of modifications designated as TDRs, including the recorded investment in the loans prior to a modification and the recorded investment in the loans after restructuring:
Year Ended December 31, 2020 |
||||||||||||
(Dollars in thousands) |
Number of Contracts |
Pre-Modification Outstanding Recorded Investment |
Post-Modification Outstanding Recorded Investment |
|||||||||
Commercial Loans: |
||||||||||||
C&I |
$ |
$ |
||||||||||
Total Commercial Loans |
$ |
$ |
||||||||||
Consumer Loans: |
||||||||||||
Auto |
$ |
$ |
||||||||||
Total Consumer Loans |
$ |
$ |
||||||||||
Residential |
$ |
$ |
||||||||||
Total Troubled Debt Restructurings |
$ |
$ |
||||||||||
The following table illustrates the recorded investment and number of modifications for TDRs where a concession has been made and subsequently defaulted during the year:
Year Ended December 31, 2020 |
||||||||
(Dollars in thousands) |
Number of Contracts |
Recorded Investment |
||||||
Commercial Loans: |
||||||||
C&I |
$ |
|||||||
CRE |
||||||||
Total Commercial Loans |
$ |
|||||||
Consumer Loans: |
||||||||
Auto |
$ |
|||||||
Total Consumer Loans |
$ |
|||||||
Residential |
$ |
|||||||
Total Trouble Debt Restructurings |
$ |
|||||||
Allowance for Loan Losses
Prior to the adoption of ASU 2016-13 on January 1, 2020, the Company’s calculated allowance for loan losses under the incurred loss methodology. The following tables are disclosures related to the allowance for loan losses in prior periods.
The following tables illustrate the changes in the allowance for loan losses by our portfolio segments:
(In thousands) |
Commercial Loans |
Consumer Loans |
Residential Real Estate |
Total |
||||||||||||
Balance as of December 31, 2018 |
$ |
$ |
$ |
$ |
||||||||||||
Charge-offs |
( |
) |
( |
) |
( |
) |
( |
) |
||||||||
Recoveries |
||||||||||||||||
Provision |
||||||||||||||||
Ending Balance as of December 31, 2019 |
$ |
$ |
$ |
$ |
||||||||||||
Balance as of December 31, 2017 |
$ |
$ |
$ |
$ |
||||||||||||
Charge-offs |
( |
) |
( |
) |
( |
) |
( |
) |
||||||||
Recoveries |
||||||||||||||||
Provision |
( |
) |
||||||||||||||
Ending Balance as of December 31, 2018 |
$ |
$ |
$ |
$ |
||||||||||||
The following table illustrates the allowance for loan losses and the recorded investment by portfolio segments:
(In thousands) |
Commercial Loans |
Consumer Loans |
Residential Real Estate |
Total |
||||||||||||
As of December 31, 2019 |
||||||||||||||||
Allowance for loan losses |
$ |
$ |
$ |
$ |
||||||||||||
Allowance for loans individually evaluated for impairment |
||||||||||||||||
Allowance for loans collectively evaluated for impairment |
$ |
$ |
$ |
$ |
||||||||||||
Ending balance of loans |
$ |
$ |
$ |
$ |
||||||||||||
Ending balance of originated loans individually evaluated for impairment |
||||||||||||||||
Ending balance of acquired loans collectively evaluated for impairment |
||||||||||||||||
Ending balance of originated loans collectively evaluated for impairment |
$ |
$ |
$ |
$ |
||||||||||||
The following table sets forth information with regard to past due and nonperforming loans by loan class:
(In thousands) |
31-60 Days Past Due Accruing |
61-90 Days Past Due Accruing |
Greater Than 90 Days Past Due Accruing |
Total Past Due Accruing |
Nonaccrual |
Current |
Recorded Total Loans |
|||||||||||||||||||||
As of December 31, 2019 |
||||||||||||||||||||||||||||
Originated |
||||||||||||||||||||||||||||
Commercial Loans: |
||||||||||||||||||||||||||||
C&I |
$ |
$ |
$ |
$ |
$ |
$ |
$ |
|||||||||||||||||||||
CRE |
||||||||||||||||||||||||||||
Business Banking |
||||||||||||||||||||||||||||
Total Commercial Loans |
$ |
$ |
$ |
$ |
$ |
$ |
$ |
|||||||||||||||||||||
Consumer Loans: |
||||||||||||||||||||||||||||
Indirect Auto |
$ |
$ |
$ |
$ |
$ |
$ |
$ |
|||||||||||||||||||||
Specialty Lending |
||||||||||||||||||||||||||||
Direct |
||||||||||||||||||||||||||||
Total Consumer Loans |
$ |
$ |
$ |
$ |
$ |
$ |
$ |
|||||||||||||||||||||
Residential Real Estate |
$ |
$ |
$ |
$ |
$ |
$ |
$ |
|||||||||||||||||||||
Total Originated Loans |
$ |
$ |
$ |
$ |
$ |
$ |
$ |
|||||||||||||||||||||
Acquired |
||||||||||||||||||||||||||||
Commercial Loans: |
||||||||||||||||||||||||||||
C&I |
$ |
$ |
$ |
$ |
$ |
$ |
$ |
|||||||||||||||||||||
CRE |
||||||||||||||||||||||||||||
Business Banking |
||||||||||||||||||||||||||||
Total Commercial Loans |
$ |
$ |
$ |
$ |
$ |
$ |
$ |
|||||||||||||||||||||
Consumer Loans: |
||||||||||||||||||||||||||||
Direct |
$ |
$ |
$ |
$ |
$ |
$ |
$ |
|||||||||||||||||||||
Total Consumer Loans |
$ |
$ |
$ |
$ |
$ |
$ |
$ |
|||||||||||||||||||||
Residential Real Estate |
$ |
$ |
$ |
$ |
$ |
$ |
$ |
|||||||||||||||||||||
Total Acquired Loans |
$ |
$ |
$ |
$ |
$ |
$ |
$ |
|||||||||||||||||||||
Total Loans |
$ |
$ |
$ |
$ |
$ |
$ |
$ |
|||||||||||||||||||||
The following table provides information on loans specifically evaluated for impairment:
December 31, 2019 |
||||||||||||
(In thousands) |
Recorded Investment Balance (Book) |
Unpaid Principal Balance (Legal) |
Related Allowance |
|||||||||
Originated |
||||||||||||
With no related allowance recorded: |
||||||||||||
Commercial Loans: |
||||||||||||
C&I |
$ |
$ |
||||||||||
CRE |
- |
|||||||||||
Business Banking |
||||||||||||
Total Commercial Loans |
$ |
$ |
||||||||||
Consumer Loans: |
||||||||||||
Indirect Auto |
$ |
$ |
||||||||||
Direct |
||||||||||||
Specialty Lending |
||||||||||||
Total Consumer Loans |
$ |
$ |
||||||||||
Residential Real Estate |
$ |
$ |
||||||||||
Total |
$ |
$ |
||||||||||
Total Loans |
$ |
$ |
$ |
|||||||||
The following table summarizes the average recorded investments on loans specifically evaluated for impairment and the interest income recognized:
December 31, 2019 |
December 31, 2018 |
|||||||||||||||
(In thousands) |
Average Recorded Investment |
Interest Income Recognized |
Average Recorded Investment |
Interest Income Recognized |
||||||||||||
Originated |
||||||||||||||||
Commercial Loans: |
||||||||||||||||
C&I |
$ |
$ |
$ |
$ |
||||||||||||
CRE |
||||||||||||||||
Business Banking |
||||||||||||||||
Total Commercial Loans |
$ |
$ |
$ |
$ |
||||||||||||
Consumer Loans: |
||||||||||||||||
Indirect Auto |
$ |
$ |
$ |
$ |
||||||||||||
Direct |
||||||||||||||||
Specialty Lending |
||||||||||||||||
Total Consumer Loans |
$ |
$ |
$ |
$ |
||||||||||||
Residential Real Estate |
$ |
$ |
$ |
$ |
||||||||||||
Total Originated |
$ |
$ |
$ |
$ |
||||||||||||
Total Loans |
$ |
$ |
$ |
$ |
||||||||||||
Under the incurred loss method, classified loans, including all TDRs and nonaccrual Commercial loans that are graded Substandard, Doubtful or Loss, with outstanding balances of $1.0 million or more are evaluated for impairment through the Company’s quarterly status review process. In the third quarter of 2019 the threshold for evaluating loans for impairment was increased from $750 thousand. In determining that we will be unable to collect all principal and/or interest payments due in accordance with the contractual terms of the loan agreements, we consider factors such as payment history and changes in the financial condition of individual borrowers, local economic conditions, historical loss experience and the conditions of the various markets in which the collateral may be liquidated. For loans that are identified as impaired, impairment is measured by one of three methods: 1) the fair value of collateral less cost to sell, 2) present value of expected future cash flows or 3) the loan’s observable market price. These impaired loans are reviewed on a quarterly basis for changes in the level of impairment. Impaired amounts are charged off immediately if such amounts are determined by management to be uncollectable. Any change to the previously recognized impairment loss is recognized as a component of the provision for loan losses.
The following tables illustrate the Company’s credit quality by loan class:
(In thousands) |
As of December 31, 2019 |
|||||||||||
Originated |
||||||||||||
Commercial Credit Exposure |
||||||||||||
By Internally Assigned Grade: |
C&I |
CRE |
Total |
|||||||||
Pass |
$ |
$ |
$ |
|||||||||
Special Mention |
||||||||||||
Substandard |
||||||||||||
Doubtful |
||||||||||||
Total |
$ |
$ |
$ |
|||||||||
Business Banking Credit Exposure |
Business |
|||||||
By Internally Assigned Grade: |
Banking |
Total |
||||||
Non-classified |
$ |
$ |
||||||
Classified |
||||||||
Total |
$ |
$ |
||||||
Consumer Credit Exposure |
Specialty |
|||||||||||||||
By Payment Activity: |
Indirect Auto |
Lending |
Direct |
Total |
||||||||||||
Performing |
$ |
$ |
$ |
$ |
||||||||||||
Nonperforming |
||||||||||||||||
Total |
$ |
$ |
$ |
$ |
||||||||||||
Residential Real Estate Credit Exposure |
Residential |
|||||||
By Payment Activity: |
Real Estate |
Total |
||||||
Performing |
$ |
$ |
||||||
Nonperforming |
||||||||
Total |
$ |
$ |
||||||
Acquired |
||||||||||||
Commercial Credit Exposure |
||||||||||||
By Internally Assigned Grade: |
C&I |
CRE |
Total |
|||||||||
Pass |
$ |
$ |
$ |
|||||||||
Special Mention |
||||||||||||
Substandard |
||||||||||||
Total |
$ |
$ |
$ |
|||||||||
Business Banking Credit Exposure |
Business |
|||||||
By Internally Assigned Grade: |
Banking |
Total |
||||||
Non-classified |
$ |
$ |
||||||
Classified |
||||||||
Total |
$ |
$ |
||||||
Consumer Credit Exposure |
||||||||
By Payment Activity: |
Direct |
Total |
||||||
Performing |
$ |
$ |
||||||
Nonperforming |
||||||||
Total |
$ |
$ |
||||||
Residential Real Estate Credit Exposure |
Residential |
|||||||
By Payment Activity: |
Real Estate |
Total |
||||||
Performing |
$ |
$ |
||||||
Nonperforming |
||||||||
Total |
$ |
$ |
||||||
The following tables illustrate the recorded investment and number of modifications for modified loans, including the recorded investment in the loans prior to a modification and the recorded investment in the loans after restructuring:
Year Ended December 31, 2019 |
||||||||||||
(Dollars in thousands) |
Number of Contracts |
Pre- Modification Outstanding Recorded Investment |
Post- Modification Outstanding Recorded Investment |
|||||||||
Commercial Loans: |
||||||||||||
C&I |
$ |
$ |
||||||||||
CRE |
||||||||||||
Business Banking |
||||||||||||
Total Commercial Loans |
$ |
$ |
||||||||||
Consumer Loans: |
||||||||||||
Indirect Auto |
$ |
$ |
||||||||||
Direct |
||||||||||||
Total Consumer Loans |
$ |
$ |
||||||||||
Residential Real Estate |
$ |
$ |
||||||||||
Total Troubled Debt Restructurings |
$ |
$ |
||||||||||
The following table illustrates the recorded investment and number of modifications for TDRs where a concession has been made and subsequently defaulted during the period:
Year Ended December 31, 2019 |
||||||||
(Dollars in thousands) |
Number of Contracts |
Recorded Investment |
||||||
Consumer Loans: |
||||||||
Indirect Auto |
$ |
|||||||
Direct |
||||||||
Total Consumer Loans |
$ |
|||||||
Residential Real Estate |
$ |
|||||||
Total Troubled Debt Restructurings |
$ |
|||||||
7. Premises, Equipment and Leases
A summary of premises and equipment follows:
December 31, |
||||||||
(In thousands) |
2020 |
2019 |
||||||
Land, buildings and improvements |
$ |
$ |
||||||
Equipment |
||||||||
Premises and equipment before accumulated depreciation |
$ |
$ |
||||||
Accumulated depreciation |
||||||||
Total premises and equipment |
$ |
$ |
||||||
Buildings and improvements are depreciated based on useful lives of to twenty years . Equipment is depreciated based on useful lives of to ten years .
Operating leases in which we are the lessee are recorded as operating lease ROU assets and operating lease liabilities, included in and , respectively, on the consolidated balance sheets. The Company does not have any significant finance leases in which we are the lessee as of December 31, 2020 and December 31, 2019.
Operating lease ROU assets represent the Company’s right to use an underlying asset during the lease term and operating lease liabilities represent our obligation to make lease payments arising from the lease. ROU assets and operating lease liabilities are recognized at lease commencement based on the present value of the remaining lease payments using a discount rate that represents the Company’s incremental borrowing rate at the lease commencement date. ROU assets are further adjusted for lease incentives. Operating lease expense, which is comprised of amortization of the ROU asset and the implicit interest accreted on the operating lease liability, is recognized on a straight-line basis over the lease term, and is recorded in occupancy expense in the consolidated statements of income.
We have made a policy election to exclude the recognition requirements to all classes of leases with original terms of 12 months or less. Instead, the short-term lease payments are recognized in profit or loss on a straight-line basis over the lease term.
The Company has lease agreements with lease and non-lease components, which are generally accounted for separately. For real estate leases, non-lease components and other non-components, such as common area maintenance charges, real estate taxes and insurance are not included in the measurement of the lease liability since they are generally able to be segregated.
Our leases relate primarily to office space and bank branches, and some contain options to renew the lease. These options to renew are generally not considered reasonably certain to exercise, and are therefore not included in the lease term until such time that the option to renew is reasonably certain. As of December 31, 2020, operating lease ROU assets and liabilities were $26.4 million and $32.8 million, respectively. As of December 31, 2019 operating lease ROU assets and liabilities were $34.8 million and $37.3 million, respectively.
The table below summarizes our net lease cost:
December 31, |
||||||||
(In thousands) |
2020 |
2019 |
||||||
Operating lease cost |
$ |
$ |
||||||
Variable lease cost |
||||||||
Short-term lease cost |
||||||||
Sublease income |
( |
) |
( |
) |
||||
Total premises and equipment |
$ |
$ |
||||||
The table below show future minimum rental commitments related to non-cancelable operating leases for the next five years and thereafter as of December 31, 2020.
(In thousands) |
||||
2021 |
$ |
|||
2022 |
||||
2023 |
||||
2024 |
||||
2025 |
||||
Thereafter |
||||
Total lease payments |
$ |
|||
Less: interest |
( |
) |
||
Present value of lease liabilities |
$ |
|||
The following table shows the weighted average remaining operating lease term, the weighted average discount rate and supplemental information on the consolidated statements of cash flows for operating leases:
December 31, |
||||||||
(In thousands except for percent and period data) |
2020 |
2019 |
||||||
Weighted average remaining lease term, in years |
||||||||
Weighted average discount rate |
% |
% |
||||||
Cash paid for amounts included in the measurement of lease liabilities: |
||||||||
Operating cash flows from operating leases |
$ |
$ |
||||||
ROU assets obtained in exchange for lease liabilities |
||||||||
As of December 31, 2020 there are no new significant leases that have not yet commenced.
Rental expense included in occupancy expense amounted to $8.0 million in 2020, $8.0 million in December 31, 2019 and $8.6 million in December 31, 2018.
8. Goodwill and Other Intangible Assets
A summary of goodwill is as follows:
(In thousands) |
||||
January 1, 2020 |
$ |
|||
Goodwill acquired |
||||
December 31, 2020 |
$ |
|||
January 1, 2019 |
$ |
|||
Goodwill acquired |
||||
December 31, 2019 |
$ |
|||
The Company has intangible assets with definite useful lives capitalized on its consolidated balance sheet in the form of core deposit and other identified intangible assets. These intangible assets are amortized over their estimated useful lives, which range primarily from to twenty years .
There was no
A summary of core deposit and other intangible assets follows:
December 31, |
||||||||
(In thousands) |
2020 |
2019 |
||||||
Core deposit intangibles: |
||||||||
Gross carrying amount |
$ |
$ |
||||||
Less: accumulated amortization |
||||||||
Net carrying amount |
$ |
$ |
||||||
Identified intangible assets: |
||||||||
Gross carrying amount |
$ |
$ |
||||||
Less: accumulated amortization |
||||||||
Net carrying amount |
$ |
$ |
||||||
Total intangibles: |
||||||||
Gross carrying amount |
$ |
$ |
||||||
Less: accumulated amortization |
||||||||
Net carrying amount |
$ |
$ |
||||||
Amortization expense on intangible assets with definite useful lives totaled $3.4 million for 2020, $3.6 million for 2019 and $4.0 million for 2018. Amortization expense on intangible assets with definite useful lives is expected to total $2.8 million for 2021, $2.2 million for 2022, $1.8 million for 2023, $1.5 million for 2024, $1.2 million for 2025 and $2.3 million thereafter. Other identified intangible assets include customer lists and non-compete agreements.
During the years ended December 31, 2020 and 2019, there was no
9. Deposits
The following table sets forth the maturity distribution of time deposits:
(In thousands) |
December 31, 2020 |
|||
Within one year |
$ |
|||
After one but within two years |
||||
After two but within three years |
||||
After three but within four years |
||||
After four but within five years |
||||
After five years |
||||
Total |
$ |
|||
Time deposits of $250,000 or more aggregated $104.1 million and $140.4 million December 31, 2020 and 2019, respectively.
10. Borrowings
Short-Term Borrowings
In addition to the liquidity provided by balance sheet cash flows, liquidity must also be supplemented with additional sources such as credit lines from correspondent banks as well as borrowings from the FHLB and the Federal Reserve Bank. Other funding alternatives may also be appropriate from time to time, including wholesale and retail repurchase agreements and brokered certificate of deposit (“CD”) accounts.
Short-term borrowings totaled $168.4 million and $655.3 million at December 31, 2020 and 2019, respectively, and consist of Federal funds purchased and securities sold under repurchase agreements, which generally represent overnight borrowing transactions and other short-term borrowings, primarily FHLB advances, with original maturities of one year or less.
The Company has unused lines of credit with the FHLB and access to brokered deposits available for short-term financing. Those sources totaled approximately $3.1 billion and $2.4 billion at December 31, 2020 and 2019, respectively. Borrowings on the FHLB lines are secured by FHLB stock, certain securities and one-to-four family first lien mortgage loans. Securities collateralizing repurchase agreements are held in safekeeping by nonaffiliated financial institutions and are under the Company’s control.
Information related to short-term borrowings is summarized as follows as of December 31:
(Dollars in thousands) |
2020 |
2019 |
2018 |
|||||||||
Federal funds purchased: |
||||||||||||
Balance at year-end |
$ |
$ |
$ |
|||||||||
Average during the year |
||||||||||||
Maximum month end balance |
||||||||||||
Weighted average rate during the year |
% |
% |
% |
|||||||||
Weighted average rate at year-end |
% |
% |
||||||||||
Securities sold under repurchase agreements: |
||||||||||||
Balance at year-end |
$ |
$ |
$ |
|||||||||
Average during the year |
||||||||||||
Maximum month end balance |
||||||||||||
Weighted average rate during the year |
% |
% |
% |
|||||||||
Weighted average rate at year-end |
% |
% |
% |
|||||||||
Other short-term borrowings: |
||||||||||||
Balance at year-end |
$ |
$ |
$ |
|||||||||
Average during the year |
||||||||||||
Maximum month end balance |
||||||||||||
Weighted average rate during the year |
% |
% |
% |
|||||||||
Weighted average rate at year-end |
% |
% |
% |
|||||||||
See Note 4 for additional information regarding securities pledged as collateral for securities sold under the repurchase agreements.
Long-Term Debt
Long-term debt consists of obligations having an original maturity at issuance of more than one year. A majority of the Company’s long-term debt is comprised of FHLB advances collateralized by the FHLB stock owned by the Company, and a blanket lien on its residential real estate mortgage loans. As of December 31, 2020 the Company had no callable long-term debt. A summary is as follows:
(Dollars in thousands) |
December 31, 2020 |
December 31, 2019 |
|||||
Maturity |
Amount |
Weighted Average Rate |
Amount |
Weighted Average Rate |
|||
2020 |
$ |
- |
- |
$ |
|||
2021 |
|||||||
2022 |
|||||||
2031 |
|||||||
Total |
$ |
$ |
|||||
Subordinated Debt
On June 23, 2020, the Company issued $100.0 million aggregate principal amount of 5.00 % fixed-to-floating rate subordinated notes due 2030. The subordinated notes, which qualify as Tier 2 capital, bear interest at an annual rate of 5.00 %, payable semi-annually in arrears commencing on January 1, 2021, and a floating rate of interest equivalent to the three-month Secured Overnight Financing Rate (“SOFR”) plus a spread of 4.85 %, payable quarterly in arrears commencing on October 1, 2025. The subordinated notes issuance costs of $2.2 million are being amortized on a straight-line basis into interest expense over five years .
The Company may redeem the subordinated notes (1) in whole or in part beginning with the interest payment date of July 1, 2025, and on any interest payment date thereafter or (2) in whole but not in part upon the occurrence of a “Tax Event”, a “Tier 2 Capital Event” or in the event the Company is required to register as an investment company pursuant to the Investment Company Act of 1940, as amended. The redemption price for any redemption is 100 % of the principal amount of the subordinated notes being redeemed, plus accrued and unpaid interest thereon to, but excluding, the date of redemption. Any redemption of the subordinated notes will be subject to the receipt of the approval of the Board of Governors of the Federal Reserve System to the extent then required under applicable laws or regulations, including capital regulations.
The following table summarizes the Company’s subordinated debt:
(Dollars in thousands) |
December 31, 2020 |
|||||||
Subordinated notes issued June 2020 – fixed interest rate of |
- |
$ |
||||||
Unamortized debt issuance costs |
( |
) |
||||||
Total subordinated debt, net |
$ |
|||||||
Junior Subordinated Debt
The Company sponsors five business trusts, CNBF Capital Trust I, NBT Statutory Trust I, NBT Statutory Trust II, Alliance Financial Capital Trust I and Alliance Financial Capital Trust II (collectively, the “Trusts”). The Company’s junior subordinated debentures include amounts related to the Company’s NBT Statutory Trust I and II as well as junior subordinated debentures associated with one statutory trust affiliate that was acquired from our merger with CNB Financial Corp. and two statutory trusts that were acquired from our acquisition of Alliance Financial Corporation (“Alliance”). The Trusts were formed for the purpose of issuing company-obligated mandatorily redeemable trust preferred securities to third-party investors and investing in the proceeds from the sale of such preferred securities solely in junior subordinated debt securities of the Company for general corporate purposes. The Company guarantees, on a limited basis, payments of distributions on the trust preferred securities and payments on redemption of the trust preferred securities. The Trusts are VIEs for which the Company is not the primary beneficiary, as defined by GAAP. In accordance with GAAP, the accounts of the Trusts are not included in the Company’s consolidated financial statements. See Note 1 for additional information about the Company’s consolidation policy.
The debentures held by each trust are the sole assets of that trust. The Trusts hold, as their sole assets, junior subordinated debentures of the Company with face amounts totaling $98.0 million at December 31, 2020. The Company owns all of the common securities of the Trusts and has accordingly recorded $3.2 million in equity method investments classified as other assets in our consolidated balance sheets at December 31, 2020. The Company owns all of the common stock of the Trusts, which have issued trust preferred securities in conjunction with the Company issuing trust preferred debentures to the Trusts. The terms of the trust preferred debentures are substantially the same as the terms of the trust preferred securities.
As of December 31, 2020, the Trusts had the following trust preferred securities outstanding and held the following junior subordinated debentures of the Company (dollars in thousands):
Description |
Issuance Date |
Trust Preferred Securities Outstanding |
Interest Rate |
Trust Preferred Debt Owed To Trust |
Final Maturity Date |
||||||
CNBF Capital Trust I |
$ |
plus |
$ |
||||||||
NBT Statutory Trust I |
plus |
||||||||||
NBT Statutory Trust II |
plus |
||||||||||
Alliance Financial Capital Trust I |
plus |
||||||||||
Alliance Financial Capital Trust II |
plus |
||||||||||
The Company’s junior subordinated debentures are redeemable prior to the maturity date at our option upon each trust’s stated option repurchase dates and from time to time thereafter. These debentures are also redeemable in whole at any time upon the occurrence of specific events defined within the trust indenture. Our obligations under the debentures and related documents, taken together, constitute a full and unconditional guarantee by the Company of the issuers’ obligations under the trust preferred securities. The Company owns all of the common stock of the Trusts, which have issued trust preferred securities in conjunction with the Company issuing trust preferred debentures to the Trusts. The terms of the trust preferred debentures are substantially the same as the terms of the trust preferred securities.
With respect to the Trusts, the Company has the right to defer payments of interest on the debentures issued to the Trusts at any time or from time to time for a period of up to ten consecutive semi-annual periods with respect to each deferral period. Under the terms of the debentures, if in certain circumstances there is an event of default under the debentures or the Company elects to defer interest on the debentures, the Company may not, with certain exceptions, declare or pay any dividends or distributions on its capital stock or purchase or acquire any of its capital stock.
Despite the fact that the Trusts are not included in the Company’s consolidated financial statements, $97 million of the $101 million in trust preferred securities issued by these subsidiary trusts is included in the Tier 1 capital of the Company for regulatory capital purposes as allowed by the Federal Reserve Board (NBT Bank owns $1.0 million of CNBF Trust I securities). The Dodd-Frank Wall Street Reform and Consumer Protection Act of 2010 requires bank holding companies with assets greater than $500 million to be subject to the same capital requirements as insured depository institutions, meaning, for instance, that such bank holding companies will not be able to count trust preferred securities issued after May 19, 2010 as Tier 1 capital. The aforementioned Trusts are grandfathered with respect to this enactment based on their date of issuance.
11. Income Taxes
The significant components of income tax expense attributable to operations are as follows:
Years Ended December 31, |
||||||||||||
(In thousands) |
2020 |
2019 |
2018 |
|||||||||
Current |
||||||||||||
Federal |
$ |
$ |
$ |
|||||||||
State |
||||||||||||
Total Current |
$ |
$ |
$ |
|||||||||
Deferred |
||||||||||||
Federal |
$ |
( |
) |
$ |
( |
) |
$ |
|||||
State |
( |
) |
( |
) |
||||||||
Total Deferred |
$ |
( |
) |
$ |
( |
) |
$ |
|||||
Total income tax expense |
$ |
$ |
$ |
|||||||||
During 2018, the Company recorded a $5.5 million benefit primarily related to changes in accounting methods approved by the Internal Revenue Services in the fourth quarter of 2018.
The tax effects of temporary differences that give rise to significant portions of the deferred tax assets and deferred tax liabilities are as follows:
December 31, |
||||||||
(In thousands) |
2020 |
2019 |
||||||
Deferred tax assets: |
||||||||
Allowance for loan losses |
$ |
$ |
||||||
Lease liability |
||||||||
Deferred compensation |
||||||||
Postretirement benefit obligation |
||||||||
Fair value adjustments from acquisitions |
||||||||
Loan fees |
||||||||
Accrued liabilities |
||||||||
Stock-based compensation expense |
||||||||
Other |
||||||||
Total deferred tax assets |
$ |
$ |
||||||
Deferred tax liabilities: |
||||||||
Pension benefits |
$ |
$ |
||||||
Lease right-of-use asset |
||||||||
Amortization of intangible assets |
||||||||
Premises and equipment, primarily due to accelerated depreciation |
||||||||
Unrealized gain on securities |
||||||||
Other |
||||||||
Total deferred tax liabilities |
$ |
$ |
||||||
Net deferred tax asset at year-end |
$ |
$ |
||||||
Net deferred tax asset at beginning of year |
||||||||
Increase (decrease) in net deferred tax asset |
$ |
$ |
( |
) |
||||
Realization of deferred tax assets is dependent upon the generation of future taxable income. A valuation allowance is recorded when it is more likely than not that some portion of the deferred tax asset will not be realized. Based on available evidence, gross deferred tax assets will ultimately be realized and a valuation allowance was not deemed necessary at December 31, 2020 and 2019.
The following is a reconciliation of the provision for income taxes to the amount computed by applying the applicable Federal statutory rate to income before taxes:
Years Ended December 31 |
||||||||||||
(In thousands) |
2020 |
2019 |
2018 |
|||||||||
Federal income tax at statutory rate |
$ |
$ |
$ |
|||||||||
Tax exempt income |
( |
) |
( |
) |
( |
) |
||||||
Net increase in cash surrender value of life insurance |
( |
) |
( |
) |
( |
) |
||||||
Federal tax credit |
( |
) |
( |
) |
( |
) |
||||||
State taxes, net of federal tax benefit |
||||||||||||
Accounting method changes - tax rate change impact |
( |
) |
||||||||||
Stock-based compensation, excess tax benefit |
( |
) |
( |
) |
( |
) |
||||||
Other, net |
( |
) |
( |
) |
||||||||
Income tax expense |
$ |
$ |
$ |
|||||||||
A reconciliation of the beginning and ending balance of Federal and State gross unrecognized tax benefits (“UTBs”) is as follows:
(In thousands) |
2020 |
2019 |
||||||
Balance at January 1 |
$ |
$ |
||||||
Additions for tax positions of prior years |
||||||||
Current period tax positions |
||||||||
Balance at December 31 |
$ |
$ |
||||||
Amount that would affect the effective tax rate if recognized, gross of tax |
$ |
$ |
||||||
The Company recognizes interest and penalties on the income tax expense line in the accompanying consolidated statements of income. The Company monitors changes in tax statutes and regulations to determine if significant changes will occur over the next 12 months. As of December 31, 2020, no significant changes to UTBs are projected; however, tax audit examinations are possible, but it is not reasonably possible to estimate when examinations in subsequent years will be completed. The Company recognized an insignificant amount of interest expense related to UTBs in the consolidated statement of income for the year ended December 31, 2020.
As of December 31, 2020, the Company is no longer subject to U.S. Federal tax examination by tax authorities for years prior to 2016 and New York State for years prior to 2015. The tax years are currently being audited by New York State.
12. Employee Benefit Plans
Defined Benefit Post-Retirement Plans
The Company has a qualified, noncontributory, defined benefit pension plan (“the Plan”) covering substantially all of its employees at December 31, 2020. Benefits paid from the plan are based on age, years of service, compensation and social security benefits and are determined in accordance with defined formulas. The Company’s policy is to fund the Plan in accordance with Employee Retirement Income Security Act of 1974 standards. Assets of the Plan are invested in publicly traded stocks and mutual funds. Prior to January 1, 2000, the Plan was a traditional defined benefit plan based on final average compensation. On January 1, 2000, the Plan was converted to a cash balance plan with grandfathering provisions for existing participants. Effective March 1, 2013, the Plan was amended. Benefit accruals for participants who, as of January 1, 2000, elected to continue participating in the traditional defined benefit plan design were frozen as of March 1, 2013. In May 2013, the noncontributory, frozen, defined benefit pension plan assumed from Alliance in the acquisition was merged into the Plan.
In addition to the Plan, the Company provides supplemental employee retirement plans to certain current and former executives. The Company also assumed supplemental retirement plans for certain former executives in the Alliance acquisition.
These supplemental employee retirement plans and the Plan are collectively referred to herein as “Pension Benefits.”
In addition, the Company provides certain health care benefits for retired employees. Benefits were accrued over the employees’ active service period. Only employees that were employed by the Company on or before January 1, 2000 are eligible to receive post-retirement health care benefits. The Plan is contributory for participating retirees, requiring participants to absorb certain deductibles and coinsurance amounts with contributions adjusted annually to reflect cost sharing provisions and benefit limitations called for in the Plan. Employees become eligible for these benefits if they reach normal retirement age while working for the Company. For eligible employees described above, the Company funds the cost of post-retirement health care as benefits are paid. The Company elected to recognize the transition obligation on a delayed basis over twenty years . In addition, the Company assumed post-retirement medical life insurance benefits for certain Alliance employees, retirees and their spouses, if applicable, in the Alliance acquisition. These post-retirement benefits are referred to herein as “Other Benefits.”
Accounting standards require an employer to: (1) recognize the overfunded or underfunded status of defined benefit post-retirement plans, which is measured as the difference between plan assets at fair value and the benefit obligation, as an asset or liability in its balance sheet; (2) recognize changes in that funded status in the year in which the changes occur through comprehensive income; and (3) measure the defined benefit plan assets and obligations as of the date of its year-end balance sheet.
In August 2018, the FASB issued ASU 2018-14, Compensation – Retirement Benefits – Defined Benefit Plans - General (Subtopic 715-20), provides changes to the disclosure requirements for defined benefit plans. The Company adopted the provisions of ASU 2018-14 as of December 31, 2020 and it did not have a material impact on its disclosures to the consolidated financial statements.
The components of AOCI, which have not yet been recognized as components of net periodic benefit cost, related to pensions and other post-retirement benefits are summarized below:
Pension Benefits |
Other Benefits |
|||||||||||||||
(In thousands) |
2020 |
2019 |
2020 |
2019 |
||||||||||||
Net actuarial loss |
$ |
$ |
$ |
$ |
||||||||||||
Prior service cost |
||||||||||||||||
Total amounts recognized in AOCI (pre-tax) |
$ |
$ |
$ |
$ |
||||||||||||
A December 31 measurement date is used for the pension, supplemental pension and post-retirement benefit plans. The following table sets forth changes in benefit obligations, changes in plan assets and the funded status of the pension plans and other post-retirement benefits:
Pension Benefits |
Other Benefits |
|||||||||||||||
(In thousands) |
2020 |
2019 |
2020 |
2019 |
||||||||||||
Change in benefit obligation: |
||||||||||||||||
Benefit obligation at beginning of year |
$ |
$ |
$ |
$ |
||||||||||||
Service cost |
||||||||||||||||
Interest cost |
||||||||||||||||
Plan participants’ contributions |
||||||||||||||||
Actuarial loss (gain) |
( |
) |
||||||||||||||
Curtailments |
( |
) |
||||||||||||||
Benefits paid |
( |
) |
( |
) |
( |
) |
( |
) |
||||||||
Projected benefit obligation at end of year |
$ |
$ |
$ |
$ |
||||||||||||
Change in plan assets: |
||||||||||||||||
Fair value of plan assets at beginning of year |
$ |
$ |
$ |
$ |
||||||||||||
Gain on plan assets |
||||||||||||||||
Employer contributions |
||||||||||||||||
Plan participants’ contributions |
||||||||||||||||
Benefits paid |
( |
) |
( |
) |
( |
) |
( |
) |
||||||||
Fair value of plan assets at end of year |
$ |
$ |
$ |
$ |
||||||||||||
Funded (unfunded) status at year end |
$ |
$ |
$ |
( |
) |
$ |
( |
) |
||||||||
An asset is recognized for an overfunded plan and a liability is recognized for an underfunded plan. The accumulated benefit obligation for pension benefits was $90.2 million and $90.6 million at December 31, 2020 and 2019, respectively. The accumulated benefit obligation for other post-retirement benefits was $6.0 million and $6.1 million at December 31, 2020 and 2019, respectively. The funded status of the pension and other post-retirement benefit plans has been recognized as follows in the consolidated balance sheets at December 31, 2020 and 2019.
Pension Benefits |
Other Benefits |
|||||||||||||||
(In thousands) |
2020 |
2019 |
2020 |
2019 |
||||||||||||
Other assets |
$ |
$ |
$ |
$ |
||||||||||||
Other liabilities |
( |
) |
( |
) |
( |
) |
( |
) |
||||||||
Funded status |
$ |
$ |
$ |
( |
) |
$ |
( |
) |
||||||||
The following assumptions were used to determine the benefit obligation and the net periodic pension cost for the years indicated:
Years Ended December 31, |
|||
2020 |
2019 |
2018 |
|
Weighted average assumptions: |
|||
The following assumptions were used to determine benefit obligations: |
|||
Discount rate |
|||
Expected long-term return on plan assets |
|||
Rate of compensation increase |
|||
Interest rate of credit for cash balance plan |
|||
The following assumptions were used to determine net periodic pension cost: |
|||
Discount rate |
|||
Expected long-term return on plan assets |
|||
Rate of compensation increase |
|||
Interest rate of credit for cash balance plan |
|||
Net periodic benefit cost and other amounts recognized in OCI for the years ended December 31 included the following components:
Pension Benefits |
Other Benefits |
|||||||||||||||||||||||
(In thousands) |
2020 |
2019 |
2018 |
2020 |
2019 |
2018 |
||||||||||||||||||
Components of net periodic (benefit) cost: |
||||||||||||||||||||||||
Service cost |
$ |
$ |
$ |
$ |
$ |
$ |
||||||||||||||||||
Interest cost |
||||||||||||||||||||||||
Expected return on plan assets |
( |
) |
( |
) |
( |
) |
||||||||||||||||||
Additional gain due to curtailment |
( |
) |
||||||||||||||||||||||
Amortization of prior service cost |
||||||||||||||||||||||||
Amortization of unrecognized net loss |
||||||||||||||||||||||||
Net periodic pension (benefit) cost |
$ |
( |
) |
$ |
$ |
( |
) |
$ |
$ |
$ |
||||||||||||||
Other changes in plan assets and benefit obligations recognized in OCI (pre-tax): |
||||||||||||||||||||||||
Net (gain) loss |
$ |
( |
) |
$ |
( |
) |
$ |
$ |
$ |
( |
) |
$ |
( |
) |
||||||||||
Prior service cost |
||||||||||||||||||||||||
Additional gain due to curtailment |
||||||||||||||||||||||||
Amortization of prior service cost |
( |
) |
( |
) |
( |
) |
( |
) |
( |
) |
( |
) |
||||||||||||
Amortization of unrecognized net (loss) |
( |
) |
( |
) |
( |
) |
( |
) |
||||||||||||||||
Total recognized in OCI |
$ |
( |
) |
$ |
( |
) |
$ |
$ |
$ |
( |
) |
$ |
( |
) |
||||||||||
Total recognized in net periodic (benefit) cost and OCI, pre-tax |
$ |
( |
) |
$ |
( |
) |
$ |
$ |
$ |
( |
) |
$ |
( |
) |
||||||||||
The service cost component of the net periodic (benefit) cost is included in Salaries and Employee Benefits and the interest cost, expected return on plan assets and net amortization components are included in Other Noninterest Expense on the consolidated statements of income.
The following table sets forth estimated future benefit payments for the pension plans and other post-retirement benefit plans as of December 31, 2020:
(In thousands) |
Pension Benefits |
Other Benefits |
||||||
2021 |
$ |
$ |
||||||
2022 |
||||||||
2023 |
||||||||
2024 |
||||||||
2025 |
||||||||
2026 - 2030 |
||||||||
The Company made no
For measurement purposes, the annual rates of increase in the per capita cost of covered medical and prescription drug benefits for fiscal year 2020 were assumed to be 4.5 % to 7.0 % percent. The rates were assumed to decrease gradually to 3.8 % for fiscal year 2075 and remain at that level thereafter. Assumed health care cost trend rates have a significant effect on amounts reported for health care plans.
Plan Investment Policy
The Company’s key investment objectives in managing its defined benefit plan assets are to ensure that present and future benefit obligations to all participants and beneficiaries are met as they become due; to provide a total return that, over the long-term, maximizes the ratio of the plan assets to liabilities, while minimizing the present value of required Company contributions, at the appropriate levels of risk; to meet statutory requirements and regulatory agencies’ requirements; and to satisfy applicable accounting standards. The Company periodically evaluates the asset allocations, funded status, rate of return assumption and contribution strategy for satisfaction of our investment objectives.
The target and actual allocations expressed as a percentage of the defined benefit pension plan’s assets are as follows:
Target 2020 |
2020 |
2019 |
|
Cash and cash equivalents |
|||
Fixed income securities |
|||
Equities |
|||
Total |
Only high-quality bonds are to be included in the portfolio. All issues that are rated lower than A by Standard and Poor’s are to be excluded. Equity securities at December 31, 2020 and 2019 do not include any Company common stock.
The following table presents the financial instruments recorded at fair value on a recurring basis by the Plan:
(In thousands) |
Level 1 |
Level 2 |
December 31, 2020 |
|||||||||
Cash and cash equivalents |
$ |
$ |
$ |
|||||||||
Foreign equity mutual funds |
||||||||||||
Equity mutual funds |
||||||||||||
U.S. government bonds |
||||||||||||
Corporate bonds |
||||||||||||
Total |
$ |
$ |
$ |
|||||||||
Level 1 |
Level 2 |
December 31, 2019 |
||||||||||
Cash and cash equivalents |
$ |
$ |
$ |
|||||||||
Foreign equity mutual funds |
||||||||||||
Equity mutual funds |
||||||||||||
U.S. government bonds |
||||||||||||
Corporate bonds |
||||||||||||
Total |
$ |
$ |
$ |
|||||||||
The plan had no financial instruments recorded at fair value on a non-recurring basis as of December 31, 2020 and 2019.
Determination of Assumed Rate of Return
The expected long-term rate-of-return on assets was 7.0
Employee 401(k) and Employee Stock Ownership Plans
The Company maintains a 401(k) and employee stock ownership plan (the “401(k) Plan”). The Company contributes to the 401(k) Plan based on employees’ contributions out of their annual salaries. In addition, the Company may also make discretionary contributions to the 401(k) Plan based on profitability. Participation in the 401(k) Plan is contingent upon certain age and service requirements. The employer contributions associated with the 401(k) Plan were $3.6 million in 2020, $3.6 million in 2019 and $3.2 million in 2018.
Other Retirement Benefits
Included in other liabilities is $1.6 million and $1.7 million at December 31, 2020 and 2019, respectively, for supplemental retirement benefits for retired executives from legacy plans assumed in acquisitions. The Company recognized $0.2 million, $0.1 million and $0.1 million in expense for each of the years ended December 31, 2020, 2019 and 2018 respectively, related to these plans.
13. Stock-Based Compensation
In May 2018, the Company adopted the NBT Bancorp Inc. 2018 Omnibus Incentive Plan (the “Stock Plan”) replacing the 2008 Omnibus Incentive Plan which automatically expired in April 2018. Under the terms of the Stock Plan, equity-based awards are granted to directors and employees to increase their direct proprietary interest in the operations and success of the Company. The Stock Plan assumed all prior equity-based incentive plans and any new equity-based awards are granted under the terms of the Stock Plan. Restricted shares granted under the Plan typically vest after or five years for employees and three years for non-employee directors. Restricted stock units granted under the Stock Plan may have different terms and conditions. Performance shares and units granted under the Stock Plan for executives may have different terms and conditions. Since 2011, the Company primarily grants restricted stock unit awards. Stock option grants since that time were reloads of existing grants which terminate ten years from the date of the grant. Under terms of the Stock Plan, stock options are granted to purchase shares of the Company’s common stock at a price equal to the fair market value of the common stock on the date of the grant. Shares issued as a result of stock option exercises and vesting of restricted shares and stock unit awards are funded from the Company’s treasury stock.
The Company has outstanding restricted stock granted from various plans at December 31, 2020. The Company recognized $4.6 million, $4.2 million and $3.9 million in stock-based compensation expense related to these stock awards for the years ended December 31, 2020, 2019 and 2018, respectively. Tax benefits recognized with respect to restricted stock awards and stock units were $1.0 million, $1.1 million and $1.2 million for the years ended December 31, 2020, 2019 and 2018, respectively. Unrecognized compensation cost related to restricted stock units totaled $5.1 million at December 31, 2020 and will be recognized over 1.5 years on a weighted average basis. Shares issued are funded from the Company’s treasury stock. The following table summarizes information for unvested restricted stock units outstanding as of December 31, 2020:
Number of Shares |
Weighted- Average Grant Date Fair Value |
|||||||
Unvested at January 1, 2020 |
$ |
|||||||
Forfeited |
( |
) |
||||||
Vested |
( |
) |
||||||
Granted |
||||||||
Unvested at December 31, 2020 |
$ |
|||||||
The following table summarizes information concerning stock options outstanding:
(In thousands, except share and per share data) |
Number of Shares |
Weighted Average Exercise Price |
Weighted Average Remaining Contractual Term (in Years) |
Aggregate Intrinsic Value |
||||||||||||
Outstanding at January 1, 2020 |
$ |
|||||||||||||||
Exercised |
( |
) |
||||||||||||||
Expired |
( |
) |
||||||||||||||
Outstanding at December 31, 2020 |
$ |
$ |
||||||||||||||
Exercisable at December 31, 2020 |
$ |
$ |
||||||||||||||
There was no stock-based compensation expense for stock option awards for the year ended December 31, 2020. Total stock-based compensation expense for stock option awards totaled $1 thousand and $11 thousand for the years ended December 31, 2019 and 2018, respectively. Cash proceeds, tax benefits and intrinsic value related to total stock options exercised is as follows:
Years Ended December 31, |
||||||||||||
(In thousands) |
2020 |
2019 |
2018 |
|||||||||
Proceeds from stock options exercised |
$ |
$ |
$ |
|||||||||
Tax benefits related to stock options exercised |
||||||||||||
Intrinsic value of stock options exercised |
||||||||||||
Fair value of shares vested during the year |
||||||||||||
The Company has 781,123 securities remaining available to be granted as part of the Plan at December 31, 2020.
14. Stockholders’ Equity
In accordance with GAAP, unrecognized prior service costs and net actuarial gains or losses associated with the Company’s pension and postretirement benefit plans and unrealized gains on derivatives and on AFS securities are included in AOCI, net of tax. For the years ended December 31, components of AOCI are:
(In thousands) |
2020 |
2019 |
2018 |
|||||||||
Unrecognized prior service cost and net actuarial (losses) on pension plans |
$ |
( |
) |
$ |
( |
) |
$ |
( |
) |
|||
Unrealized (losses) gains on derivatives (cash flow hedges) |
( |
) |
( |
) |
||||||||
Unrealized net holding gains (losses) on AFS securities |
( |
) |
||||||||||
AOCI |
$ |
$ |
( |
) |
$ |
( |
) |
|||||
Certain restrictions exist regarding the ability of the subsidiary bank to transfer funds to the Company in the form of cash dividends. The approval of the OCC is required to pay dividends when a bank fails to meet certain minimum regulatory capital standards or when such dividends are in excess of a subsidiary bank’s earnings retained in the current year plus retained net profits for the preceding two years as specified in applicable OCC regulations. At December 31, 2020, approximately $194.2 million of the total stockholders’ equity of the Bank was available for payment of dividends to the Company without approval by the OCC. The Bank’s ability to pay dividends also is subject to the Bank being in compliance with regulatory capital requirements. The Bank is currently in compliance with these requirements. Under the State of Delaware General Corporation Law, the Company may declare and pay dividends either out of accumulated net retained earnings or capital surplus.
The Company purchased 263,507 shares of its common stock during the year ended December 31, 2020, for a total of $8.0 million at an average price of $30.28 per share under its previously announced plan. As of December 31, 2020, there were 736,493 shares available for repurchase under this plan, which expires on December 31, 2021. On January 27, 2021, the NBT Board of Directors approved an increase to the total number of shares authorized under the stock repurchase program to 2 million shares from 1 million shares, previously.
15. Regulatory Capital Requirements
The Company and the Bank are subject to various regulatory capital requirements administered by the federal banking agencies. Failure to meet minimum capital requirements can initiate certain mandatory and possibly additional discretionary actions by regulators that, if undertaken, could have a direct material effect on the consolidated financial statements. Under capital adequacy guidelines and the regulatory framework for prompt corrective action, the Bank must meet specific capital guidelines that involve quantitative measures of NBT Bank’s assets, liabilities and certain off-balance sheet items as calculated under regulatory accounting practices. The capital amounts and classifications are also subject to qualitative judgments by the regulators about components, risk weightings and other factors.
Quantitative measures established by regulation to ensure capital adequacy require the Company and the Bank to maintain minimum amounts and ratios (set forth in the table below) of total and Tier 1 Capital to risk-weighted assets and of Tier 1 capital to average assets. In addition to maintaining minimum capital ratios, the Company is subject to a capital conservation buffer (“Buffer”) of 2.50% above the minimum to avoid restriction on capital distributions and discretionary bonus paychecks to officers. At December 31, 2020 and 2019, the Company and the Bank meet all capital adequacy requirements to which they were subject.
Under their prompt corrective action regulations, regulatory authorities are required to take certain supervisory actions (and may take additional discretionary actions) with respect to an undercapitalized institution. Such actions could have a direct material effect on an institution’s financial statements. The regulations establish a framework for the classification of banks into five categories: well-capitalized, adequately capitalized, undercapitalized, significantly undercapitalized and critically undercapitalized. As of December 31, 2020 and 2019, the most recent notifications from the Bank’s regulators categorized the Bank as well-capitalized under the regulatory framework for prompt corrective action. To be categorized as well-capitalized the Bank must maintain minimum total risk-based, Tier 1 risk-based and Tier 1 Capital to Average Asset ratios as set forth in the table below. There are no conditions or events since that notification that management believes have changed the Bank’s category.
In March 2020, the OCC, the Board of Governors of the Federal Reserve System, and the FDIC announced an interim final rule to delay the estimated impact on regulatory capital stemming from the implementation of CECL. Under the modified CECL transition provision, the regulatory capital impact of the January 1, 2020 CECL adoption date adjustment to the allowance for credit losses (after-tax) has been deferred and will phase into regulatory capital at 25% per year commencing January 1, 2022. For the ongoing impact of CECL, the Company is allowed to defer the regulatory capital impact of the allowance for credit losses in an amount equal to 25% of the change in the allowance for credit losses (pre-tax) recognized through earnings for each period between January 1, 2020 and December 31, 2021. The cumulative adjustment to the allowance for credit losses between January 1, 2020 and December 31, 2021, will also phase into regulatory capital at 25% per year commencing January 1, 2022. The Company adopted the capital transition relief over the permissible five-year period.
The Company and NBT Bank’s actual capital amounts and ratios are presented as follows:
Actual |
Regulatory Ratio Requirements |
|||||||||||||||||||
(Dollars in thousands) |
Amount |
Ratio |
Minimum Capital Adequacy |
Minimum plus Buffer |
For Classification as Well- Capitalized |
|||||||||||||||
As of December 31, 2020 |
||||||||||||||||||||
Tier I Capital (to average assets) |
||||||||||||||||||||
Company |
$ |
% |
% |
% |
||||||||||||||||
NBT Bank |
% |
% |
% |
|||||||||||||||||
Common Equity Tier 1 Capital |
||||||||||||||||||||
Company |
% |
% |
% |
% |
||||||||||||||||
NBT Bank |
% |
% |
% |
% |
||||||||||||||||
Tier I Capital (to risk-weighted assets) |
||||||||||||||||||||
Company |
% |
% |
% |
% |
||||||||||||||||
NBT Bank |
% |
% |
% |
% |
||||||||||||||||
Total Capital (to risk-weighted assets) |
||||||||||||||||||||
Company |
% |
% |
% |
% |
||||||||||||||||
NBT Bank |
% |
% |
% |
% |
||||||||||||||||
As of December 31, 2019 |
||||||||||||||||||||
Tier I Capital (to average assets) |
||||||||||||||||||||
Company |
$ |
% |
% |
% |
||||||||||||||||
NBT Bank |
% |
% |
% |
|||||||||||||||||
Common Equity Tier 1 Capital |
||||||||||||||||||||
Company |
% |
% |
% |
% |
||||||||||||||||
NBT Bank |
% |
% |
% |
% |
||||||||||||||||
Tier I Capital (to risk-weighted assets) |
||||||||||||||||||||
Company |
% |
% |
% |
% |
||||||||||||||||
NBT Bank |
% |
% |
% |
% |
||||||||||||||||
Total Capital (to risk-weighted assets) |
||||||||||||||||||||
Company |
% |
% |
% |
% |
||||||||||||||||
NBT Bank |
% |
% |
% |
% |
||||||||||||||||
16. Earnings Per Share
The following is a reconciliation of basic and diluted EPS for the years presented in the consolidated statements of income:
Years Ended December 31, |
||||||||||||||||||||||||||||||||||||
2020 |
2019 |
2018 |
||||||||||||||||||||||||||||||||||
(In thousands except per share data) |
Net Income |
Weighted Average Shares |
Per Share Amount |
Net Income |
Weighted Average Shares |
Per Share Amount |
Net Income |
Weighted Average Shares |
Per Share Amount |
|||||||||||||||||||||||||||
Basic EPS |
$ |
$ |
$ |
$ |
$ |
$ |
||||||||||||||||||||||||||||||
Effect of dilutive securities: |
||||||||||||||||||||||||||||||||||||
Stock-based compensation |
||||||||||||||||||||||||||||||||||||
Diluted EPS |
$ |
$ |
$ |
$ |
$ |
$ |
||||||||||||||||||||||||||||||
There was a nominal number of weighted average stock options outstanding for the years ended December 31, 2020, 2019 and 2018, respectively, that were not considered in the calculation of diluted EPS since the stock options’ exercise prices were greater than the average market price during these periods.
17. Reclassification Adjustments Out of Other Comprehensive Income (Loss)
The following table summarizes the reclassification adjustments out of AOCI:
Detail About AOCI Components |
Amount Reclassified From AOCI |
Affected Line Item in the Consolidated Statements of Comprehensive Income (Loss) |
|||||||||||
(In thousands) |
Years Ended December 31, |
||||||||||||
2020 |
2019 |
2018 |
|||||||||||
AFS securities: |
|||||||||||||
(Gains) losses on AFS securities |
$ |
( |
) |
$ |
$ |
Net securities (gains) losses |
|||||||
Amortization of unrealized gains related to securities transfer |
Interest income |
||||||||||||
Tax effect |
$ |
( |
) |
$ |
( |
) |
$ |
( |
) |
Income tax (benefit) |
|||
Net of tax |
$ |
$ |
$ |
||||||||||
Cash flow hedges: |
|||||||||||||
Net unrealized losses (gains) on cash flow hedges reclassified to interest expense |
$ |
$ |
( |
) |
$ |
( |
) |
Interest expense |
|||||
Tax effect |
$ |
( |
) |
$ |
$ |
Income tax (benefit) expense |
|||||||
Net of tax |
$ |
$ |
( |
) |
$ |
( |
) |
||||||
Pension and other benefits: |
|||||||||||||
Amortization of net losses |
$ |
$ |
$ |
Other noninterest expense |
|||||||||
Amortization of prior service costs |
Other noninterest expense |
||||||||||||
Tax effect |
$ |
( |
) |
$ |
( |
) |
$ |
( |
) |
Income tax (benefit) |
|||
Net of tax |
$ |
$ |
$ |
||||||||||
Total reclassifications, net of tax |
$ |
$ |
$ |
||||||||||
18. Commitments and Contingent Liabilities
The Company’s concentrations of credit risk are reflected in the consolidated balance sheets. The concentrations of credit risk with standby letters of credit, unused lines of credit, commitments to originate new loans and loans sold with recourse generally follow the loan classifications.
At December 31, 2020, approximately 59 % of the Company’s loans were secured by real estate located in central and upstate New York, northeastern Pennsylvania, southern New Hampshire, western Massachusetts, Vermont and southern coastal Maine area. Accordingly, the ultimate collectability of a substantial portion of the Company’s portfolio is susceptible to changes in market conditions of those areas. Management is not aware of any material concentrations of credit to any industry or individual borrowers.
The Company is a party to certain financial instruments with off-balance sheet risk in the normal course of business to meet the financing needs of its customers. These financial instruments include commitments to extend credit, unused lines of credit, standby letters of credit and certain agricultural real estate loans sold to investors with recourse, with the sold portion having a government guarantee that is assignable back to the Company upon repurchase of the loan in the event of default. The Company’s exposure to credit loss in the event of nonperformance by the other party to the commitments to extend credit, unused lines of credit, standby letters of credit and loans sold with recourse is represented by the contractual amount of those instruments. The credit risk associated with commitments to extend credit and standby and commercial letters of credit is essentially the same as that involved with extending loans to customers and is subject to normal credit policies. Collateral may be obtained based on management’s assessment of the customer’s creditworthiness.
At December 31, |
||||||||
(In thousands) |
2020 |
2019 |
||||||
Unused lines of credit |
$ |
$ |
||||||
Commitments to extend credits, primarily variable rate |
||||||||
Standby letters of credit |
||||||||
Loans sold with recourse |
||||||||
Since many loan commitments, standby letters of credit and guarantees and indemnification contracts expire without being funded in whole or in part, the contract amounts are not necessarily indicative of future cash flows. The Company does not issue any guarantees that would require liability-recognition or disclosure, other than its standby letters of credit.
The Company guarantees the obligations or performance of customers by issuing standby letters of credit to third-parties. These standby letters of credit are frequently issued in support of third-party debt, such as corporate debt issuances, industrial revenue bonds and municipal securities. The risk involved in issuing standby letters of credit is essentially the same as the credit risk involved in extending loan facilities to customers and letters of credit are subject to the same credit origination, portfolio maintenance and management procedures in effect to monitor other credit and off-balance sheet products. Typically, these instruments have one year expirations with an option to renew upon annual review; therefore, the total amounts do not necessarily represent future cash requirements. The fair value of the Company’s standby letters of credit at December 31, 2020 and 2019 was not significant.
In the normal course of business there are various outstanding legal proceedings. If legal costs are deemed material by management, the Company accrues for the estimated loss from a loss contingency if the information available indicates that it is probable that a liability had been incurred at the date of the financial statements and the amount of loss can be reasonably estimated.
The Company is required to maintain reserve balances with the Federal Reserve Bank. The required average total reserve for NBT Bank for the 14 -day maintenance period ending December 30, 2020 was $64.6 million.
19. Derivative Instruments and Hedging Activities
The Company is exposed to certain risks arising from both its business operations and economic conditions. The Company principally manages its exposures to a wide variety of business and operational risks through management of its core business activities. The Company manages economic risks, including interest rate, primarily by managing the amount, sources and duration of its assets and liabilities and through the use of derivative instruments. Specifically, the Company enters into derivative financial instruments to manage exposures that arise from business activities that result in the receipt or payment of future known and uncertain cash amounts, the value of which are determined by interest rates. The Company’s derivative financial instruments are used to manage differences in the amount, timing and duration of the Company’s known or expected cash receipts and its known or expected cash payments principally related to certain fixed rate borrowings. The Company also has interest rate derivatives that result from a service provided to certain qualifying customers and, therefore, are not used to manage interest rate risk in the Company’s assets or liabilities. The Company manages a matched book with respect to its derivative instruments in order to minimize its net risk exposure resulting from such transactions.
Derivatives Not Designated as Hedging Instruments
The Company enters into interest rate swaps to facilitate customer transactions and meet their financing needs. These swaps are considered derivatives, but are not designated in hedging relationships. These instruments have interest rate and credit risk associated with them. To mitigate the interest rate risk, the Company enters into offsetting interest rate swaps with counterparties. The counterparty swaps are also considered derivatives and are also not designated in hedging relationships. Interest rate swaps are recorded within other assets or other liabilities on the consolidated balance sheet at their estimated fair value. Changes to the fair value of assets and liabilities arising from these derivatives are included, net, in other operating income in the consolidated statement of income.
As of December 31, 2020 the Company had seventeen risk participation agreements with financial institution counterparties for interest rate swaps related to participated loans. The fair values included in other assets and other liabilities on the consolidated balance sheet applicable to these agreements amount to $292 thousand and $125 thousand, respectively as of December 31, 2020. As of December 31, 2019 the Company had fifteen risk participation agreements with financial institution counterparties for interest rate swaps related to participated loans. The fair values included in other assets and other liabilities on the consolidated balance sheet applicable to these agreements amount to $112 thousand and $82 thousand, respectively. Risk participation agreements provide credit protection to the financial institution that originated the swap transaction should the borrower fail to perform on its obligation. The Company enters into both risk participation agreements in which it purchases credit protection from other financial institutions and those in which it provides credit protection to other financial institutions.
Derivatives Designated as Hedging Instruments
The Company has entered into interest rate swaps to modify the interest rate characteristics of certain short-term FHLB advances from variable rate to fixed rate in order to reduce the impact of changes in future cash flows due to market interest rate changes. These agreements are designated as cash flow hedges.
The following table depicts the fair value adjustment recorded related to the notional amount of derivatives outstanding as well as the notional amount of risk participation agreements:
December 31, |
||||||||
(In thousands) |
2020 |
2019 |
||||||
Derivatives Not Designated as Hedging Instruments: |
||||||||
Fair value adjustment included in other assets and other liabilities |
||||||||
Interest rate derivatives |
$ |
$ |
||||||
Notional amount |
||||||||
Interest rate derivatives |
||||||||
Risk participation agreements |
||||||||
Derivatives Designated as Hedging Instruments: |
||||||||
Fair value adjustment included in other assets |
||||||||
Interest rate derivatives |
||||||||
Fair value adjustment included in other liabilities |
||||||||
Interest rate derivatives |
||||||||
Notional amount |
||||||||
Interest rate derivatives |
||||||||
For derivatives designated and that qualify as cash flow hedges of interest rate risk, the gain or loss on the derivative is recorded in AOCI and subsequently reclassified into interest expense in the same period during which the hedge transaction affects earnings. Amounts reported in AOCI related to derivatives will be reclassified to interest expense as interest payments are made on the Company’s short-term rate borrowings. During the next twelve months, the Company estimates that an additional $21 thousand will be reclassified from AOCI as a reduction to interest expense.
The following table indicates the effect of cash flow hedge accounting on AOCI and on the consolidated statement of income:
December 31, |
||||||||||||
(In thousands) |
2020 |
2019 |
2018 |
|||||||||
Derivatives Designated as Hedging Instruments: |
||||||||||||
Interest rate derivatives - included component |
||||||||||||
Amount of (loss) gain recognized in OCI |
$ |
( |
) |
$ |
( |
) |
$ |
|||||
Amount of loss (gain) reclassified from AOCI into interest expense |
( |
) |
( |
) |
||||||||
The following table indicates the gain or loss recognized in income on derivatives not designated as a hedging relationship:
December 31, |
||||||||||||
(In thousands) |
2020 |
2019 |
2018 |
|||||||||
Derivatives Not Designated as Hedging Instruments: |
||||||||||||
Increase (decrease) in other income |
$ |
$ |
$ |
( |
) |
|||||||
20. Fair Values of Financial Instruments
GAAP states that fair value is an exit price, representing the amount that would be received to sell an asset or paid to transfer a liability in an orderly transaction between market participants. Fair value measurements are not adjusted for transaction costs. A fair value hierarchy exists within GAAP that prioritizes the inputs to valuation techniques used to measure fair value. The hierarchy gives the highest priority to unadjusted quoted prices in active markets for identical assets or liabilities (Level 1 measurements) and the lowest priority to unobservable inputs (Level 3 measurements). The three levels of the fair value hierarchy are described below:
Level 1 - Unadjusted quoted prices in active markets that are accessible at the measurement date for identical, unrestricted assets or liabilities;
Level 2 - Quoted prices for similar assets or liabilities in active markets, quoted prices in markets that are not active or inputs that are observable, either directly or indirectly, for substantially the full term of the asset or liability;
Level 3 - Prices or valuation techniques that require inputs that are both significant to the fair value measurement and unobservable (i.e., supported by little or no market activity).
A financial instrument’s level within the fair value hierarchy is based on the lowest level of input that is significant to the fair value measurement.
The types of instruments valued based on quoted market prices in active markets include most U.S. government and agency securities, many other sovereign government obligations, liquid mortgage products, active listed equities and most money market securities. Such instruments are generally classified within Level 1 or Level 2 of the fair value hierarchy. The Company does not adjust the quoted prices for such instruments.
The types of instruments valued based on quoted prices in markets that are not active, broker or dealer quotations or alternative pricing sources with reasonable levels of price transparency include most investment-grade and high-yield corporate bonds, less liquid mortgage products, less liquid agency securities, less liquid listed equities, state, municipal and provincial obligations and certain physical commodities. Such instruments are generally classified within Level 2 of the fair value hierarchy. Certain common equity securities are reported at fair value utilizing Level 1 inputs (exchange quoted prices). Other investment securities are reported at fair value utilizing Level 1 and Level 2 inputs. The prices for Level 2 instruments are obtained through an independent pricing service or dealer market participants with whom the Company has historically transacted both purchases and sales of investment securities. Prices obtained from these sources include prices derived from market quotations and matrix pricing. The fair value measurements consider observable data that may include dealer quotes, market spreads, cash flows, the U.S. Treasury yield curve, live trading levels, trade execution data, market consensus prepayment speeds, credit information and the bond’s terms and conditions, among other things. Management reviews the methodologies used in pricing the securities by its third party providers.
Level 3 is for positions that are not traded in active markets or are subject to transfer restrictions. Valuations are adjusted to reflect illiquidity and/or non-transferability and such adjustments are generally based on available market evidence. In the absence of such evidence, management’s best estimate will be used. Management’s best estimate consists of both internal and external support on certain Level 3 investments. Subsequent to inception, management only changes Level 3 inputs and assumptions when corroborated by evidence such as transactions in similar instruments, completed or pending third-party transactions in the underlying investment or comparable entities, subsequent rounds of financing, recapitalizations and other transactions across the capital structure, offerings in the equity or debt markets and changes in financial ratios or cash flows.
The following tables sets forth the Company’s financial assets and liabilities measured on a recurring basis that were accounted for at fair value. Assets and liabilities are classified in their entirety based on the lowest level of input that is significant to the fair value measurement:
(In thousands) |
Level 1 |
Level 2 |
Level 3 |
December 31, 2020 |
||||||||||||
Assets: |
||||||||||||||||
AFS securities: |
||||||||||||||||
Federal agency |
$ |
$ |
$ |
$ |
||||||||||||
State & municipal |
||||||||||||||||
Mortgage-backed |
||||||||||||||||
Collateralized mortgage obligations |
||||||||||||||||
Corporate |
||||||||||||||||
Total AFS securities |
$ |
$ |
$ |
$ |
||||||||||||
Equity securities |
||||||||||||||||
Derivatives |
||||||||||||||||
Total |
$ |
$ |
$ |
$ |
||||||||||||
Liabilities: |
||||||||||||||||
Derivatives |
$ |
$ |
$ |
$ |
||||||||||||
Total |
$ |
$ |
$ |
$ |
||||||||||||
(In thousands) |
Level 1 |
Level 2 |
Level 3 |
December 31, 2019 |
||||||||||||
Assets: |
||||||||||||||||
AFS securities: |
||||||||||||||||
Federal agency |
$ |
$ |
$ |
$ |
||||||||||||
State & municipal |
||||||||||||||||
Mortgage-backed |
||||||||||||||||
Collateralized mortgage obligations |
||||||||||||||||
Total AFS securities |
$ |
$ |
$ |
$ |
||||||||||||
Equity securities |
||||||||||||||||
Derivatives |
||||||||||||||||
Total |
$ |
$ |
$ |
$ |
||||||||||||
Liabilities: |
||||||||||||||||
Derivatives |
$ |
$ |
$ |
$ |
||||||||||||
Total |
$ |
$ |
$ |
$ |
||||||||||||
GAAP requires disclosure of assets and liabilities measured and recorded at fair value on a non-recurring basis such as goodwill, loans held for sale, other real estate owned, collateral-dependent impaired loans, mortgage servicing rights and HTM securities. The non-recurring fair value measurements recorded during the years ended December 31, 2020 and 2019 were related to impaired loans, write-downs of other real estate owned and write-down of branch assets to fair value. The Company uses the fair value of underlying collateral, less costs to sell, to estimate the allowance for credit losses for individually evaluated collateral dependent loans. The appraisals may be adjusted by management for qualitative factors such as economic conditions and estimated liquidation expenses ranging from 10 % to 50 %. Based on the valuation techniques used, the fair value measurements for collateral dependent individually evaluated loans are classified as Level 3.
As of December 31, 2020 the Company had collateral dependent individually evaluated loans with a carrying value of $15.2 million, which had an estimated allowance for credit loss of $3.2 million. As of December 31, 2019 the Company had no collateral dependent loans.
During the year ended December 31, 2020, the Company recorded a $0.5 million write-off of branch locations due to a pending disposition of the locations. During the year ended December 31, 2019, the Company recorded a $1.0 million write-down of a branch location to fair value of $0.2 million due to a pending disposition of the location.
The following table sets forth information with regard to estimated fair values of financial instruments. This table excludes financial instruments for which the carrying amount approximates fair value. Financial instruments for which the fair value approximates carrying value include cash and cash equivalents, AFS securities, equity securities, accrued interest receivable, non-maturity deposits, short-term borrowings, accrued interest payable and derivatives.
December 31, 2020 |
December 31, 2019 |
|||||||||||
(In thousands) |
Fair Value Hierarchy |
Carrying Amount |
Estimated Fair Value |
Carrying Amount |
Estimated Fair Value |
|||||||
Financial assets: |
||||||||||||
HTM securities |
2 |
$ |
$ |
$ |
$ |
|||||||
Net loans |
3 |
|||||||||||
Financial liabilities: |
||||||||||||
Time deposits |
2 |
$ |
$ |
$ |
$ |
|||||||
Long-term debt |
2 |
|||||||||||
Subordinated debt |
1 |
|||||||||||
Junior subordinated debt |
2 |
|||||||||||
Fair value estimates are made at a specific point in time, based on relevant market information and information about the financial instrument. These estimates do not reflect any premium or discount that could result from offering for sale at one time the Company’s entire holdings of a particular financial instrument. Because no market exists for a significant portion of the Company’s financial instruments, fair value estimates are based on judgments regarding future expected loss experience, current economic conditions, risk characteristics of various financial instruments and other factors. These estimates are subjective in nature and involve uncertainties and matters of significant judgment and therefore cannot be determined with precision. Changes in assumptions could significantly affect the estimates.
Fair value estimates are based on existing on and off-balance sheet financial instruments without attempting to estimate the value of anticipated future business and the value of assets and liabilities that are not considered financial instruments. For example, the Company has a substantial wealth operation that contributes net fee income annually. The wealth management operation is not considered a financial instrument and its value has not been incorporated into the fair value estimates. Other significant assets and liabilities include the benefits resulting from the low-cost funding of deposit liabilities as compared to the cost of borrowing funds in the market and premises and equipment. In addition, the tax ramifications related to the realization of the unrealized gains and losses can have a significant effect on fair value estimates and have not been considered in the estimate of fair value.
HTM Securities
The fair value of the Company’s HTM securities is primarily measured using information from a third-party pricing service. The fair value measurements consider observable data that may include dealer quotes, market spreads, cash flows, the U.S. Treasury yield curve, live trading levels, trade execution data, market consensus prepayment speeds, credit information and the bond’s terms and conditions, among other things.
Net Loans
Net loans include portfolio loans and loans held for sale. Loans were first segregated by type and then further segmented into fixed and variable rate and loan quality categories. Expected future cash flows were projected based on contractual cash flows, adjusted for estimated prepayments, which also includes credit risk, illiquidity risk and other market factors to calculate the exit price fair value in accordance with ASC 820.
Time Deposits
The fair value of time deposits was estimated using a discounted cash flow approach that applies prevailing market interest rates for similar maturity instruments. The fair values of the Company’s time deposit liabilities do not take into consideration the value of the Company’s long-term relationships with depositors, which may have significant value.
Long-Term Debt
The fair value of long-term debt was estimated using a discounted cash flow approach that applies prevailing market interest rates for similar maturity instruments.
Subordinated Debt
The fair value of subordinated debt has been measured using the observable market price as of the period reported.
Junior Subordinated Debt
The fair value of junior subordinated debt has been estimated using a discounted cash flow analysis.
21. Parent Company Financial Information
Condensed Balance Sheets
December 31, |
||||||||
(In thousands) |
2020 |
2019 |
||||||
Assets |
||||||||
Cash and cash equivalents |
$ |
$ |
||||||
Equity securities, at estimated fair value |
||||||||
Investment in subsidiaries, on equity basis |
||||||||
Other assets |
||||||||
Total assets |
$ |
$ |
||||||
Liabilities and Stockholders’ Equity |
||||||||
Total liabilities |
$ |
$ |
||||||
Stockholders’ equity |
||||||||
Total liabilities and stockholders’ equity |
$ |
$ |
||||||
Condensed Statements of Income
Years Ended December 31, |
||||||||||||
(In thousands) |
2020 |
2019 |
2018 |
|||||||||
Dividends from subsidiaries |
$ |
$ |
$ |
|||||||||
Management fee from subsidiaries |
||||||||||||
Net securities (losses) gains |
( |
) |
||||||||||
Interest, dividends and other income |
||||||||||||
Total revenue |
$ |
$ |
$ |
|||||||||
Operating expenses |
||||||||||||
Income before income tax benefit and equity in undistributed income of subsidiaries |
$ |
$ |
$ |
|||||||||
Income tax benefit |
( |
) |
( |
) |
( |
) |
||||||
Equity in undistributed income of subsidiaries |
||||||||||||
Net income |
$ |
$ |
$ |
|||||||||
Condensed Statements of Cash Flow
Years Ended December 31, |
||||||||||||
(In thousands) |
2020 |
2019 |
2018 |
|||||||||
Operating activities |
||||||||||||
Net income |
$ |
$ |
$ |
|||||||||
Adjustments to reconcile net income to net cash provided by operating activities |
||||||||||||
Depreciation and amortization of premises and equipment |
||||||||||||
Excess tax benefit on stock-based compensation |
( |
) |
( |
) |
( |
) |
||||||
Stock-based compensation expense |
||||||||||||
Net securities losses (gains) |
( |
) |
( |
) |
||||||||
Equity in undistributed income of subsidiaries |
( |
) |
( |
) |
( |
) |
||||||
Bank owned life insurance income |
( |
) |
( |
) |
( |
) |
||||||
Amortization of subordinated debt issuance costs |
||||||||||||
Net change in other assets and other liabilities |
( |
) |
( |
) |
( |
) |
||||||
Net cash provided by operating activities |
$ |
$ |
$ |
|||||||||
Investing activities |
||||||||||||
Investment in the Bank |
$ |
( |
) |
$ |
$ |
|||||||
Proceeds from calls of equity securities |
||||||||||||
Proceeds on sales of equity securities |
||||||||||||
Purchases of equity securities |
( |
) |
( |
) |
||||||||
Net cash (used in) provided by investing activities |
$ |
( |
) |
$ |
( |
) |
$ |
|||||
Financing activities |
||||||||||||
Proceeds from issuance of subordinated debt |
$ |
$ |
$ |
|||||||||
Payment of subordinated debt issuance costs |
( |
) |
||||||||||
Proceeds from the issuance of shares to employee and other stock plans |
||||||||||||
Cash paid by employer for tax-withholding on stock issuance |
( |
) |
( |
) |
( |
) |
||||||
Purchases of treasury shares |
( |
) |
||||||||||
Cash dividends |
( |
) |
( |
) |
( |
) |
||||||
Net cash provided by (used in) financing activities |
$ |
$ |
( |
) |
$ |
( |
) |
|||||
Net increase (decrease) in cash and cash equivalents |
$ |
$ |
$ |
( |
) |
|||||||
Cash and cash equivalents at beginning of year |
||||||||||||
Cash and cash equivalents at end of year |
$ |
$ |
$ |
|||||||||
A statement of changes in stockholders’ equity has not been presented since it is the same as the consolidated statement of changes in stockholders’ equity previously presented.
None.
As of the end of the period covered by this Annual Report on Form 10-K, an evaluation was carried out by the Company’s management, with the participation of its Chief Executive Officer and Chief Financial Officer, of the effectiveness of the Company’s disclosure controls and procedures (as defined in Rule 13a-15(e) under the Securities Exchange Act of 1934). Based upon that evaluation, the Chief Executive Officer and Chief Financial Officer concluded that the disclosure controls and procedures were effective as of the end of the period covered by this report.
Effective January 1, 2020, the Company adopted the CECL accounting standard. The Company designed new controls and modified existing controls as part of its adoption. These additional controls over financial reporting included controls over model creation and design, model governance, assumptions, model operation and expanded controls over loan level data. There were no other changes in the Company’s internal control over financial reporting that occurred during the period covered by this report that have materially affected, or are reasonably likely to materially affect, the Company’s internal control over financial reporting.
Management Report on Internal Controls Over Financial Reporting
The management of NBT Bancorp Inc. (the “Company”) is responsible for establishing and maintaining adequate internal control over financial reporting. The Company’s internal control over financial reporting is a process designed under the supervision of the Company’s Chief Executive Officer and Chief Financial Officer to provide reasonable assurance regarding the reliability of financial reporting and the preparation of the Company’s consolidated financial statements for external purposes in accordance with generally accepted accounting principles.
As of December 31, 2020, management assessed the effectiveness of the Company’s internal control over financial reporting based on the criteria for effective internal control over financial reporting established in “Internal Control – Integrated Framework (2013),” issued by the Committee of Sponsoring Organizations (“COSO”) of the Treadway Commission. Based on the assessment, management determined that the Company’s internal control over financial reporting as of December 31, 2020 was effective at the reasonable assurance level based on those criteria.
KPMG LLP, the independent registered public accounting firm that audited the consolidated financial statements of the Company included in this Annual Report on Form 10-K, has issued a report on the effectiveness of the Company’s internal control over financial reporting as of December 31, 2020. The report, which expresses an unqualified opinion on the effectiveness of the Company’s internal control over financial reporting as of December 31, 2020, is included in this Item under the heading “Report of Independent Registered Public Accounting Firm” on the following page.
Report of Independent Registered Public Accounting Firm
To the Stockholders and Board of Directors
NBT Bancorp Inc.:
Opinion on Internal Control Over Financial Reporting
We have audited NBT Bancorp Inc. and subsidiaries’ (the Company) internal control over financial reporting as of December 31, 2020, based on criteria established in Internal Control – Integrated Framework (2013) issued by the Committee of Sponsoring Organizations of the Treadway Commission. In our opinion, the Company maintained, in all material respects, effective internal control over financial reporting as of December 31, 2020, based on criteria established in Internal Control – Integrated Framework (2013) issued by the Committee of Sponsoring Organizations of the Treadway Commission.
We also have audited, in accordance with the standards of the Public Company Accounting Oversight Board (United States) (PCAOB), the consolidated balance sheets of the Company as of December 31, 2020 and 2019, the related consolidated statements of income, comprehensive income, changes in stockholders’ equity, and cash flows for each of the years in the three-year period ended December 31, 2020, and the related notes (collectively, the consolidated financial statements), and our report dated March 1, 2021 expressed an unqualified opinion on those consolidated financial statements.
Basis for Opinion
The Company’s management is responsible for maintaining effective internal control over financial reporting and for its assessment of the effectiveness of internal control over financial reporting, included in the accompanying Management Report on Internal Controls Over Financial Reporting. Our responsibility is to express an opinion on the Company’s internal control over financial reporting based on our audit. We are a public accounting firm registered with the PCAOB and are required to be independent with respect to the Company in accordance with the U.S. federal securities laws and the applicable rules and regulations of the Securities and Exchange Commission and the PCAOB.
We conducted our audit in accordance with the standards of the PCAOB. Those standards require that we plan and perform the audit to obtain reasonable assurance about whether effective internal control over financial reporting was maintained in all material respects. Our audit of internal control over financial reporting included obtaining an understanding of internal control over financial reporting, assessing the risk that a material weakness exists, and testing and evaluating the design and operating effectiveness of internal control based on the assessed risk. Our audit also included performing such other procedures as we considered necessary in the circumstances. We believe that our audit provides a reasonable basis for our opinion.
Definition and Limitations of Internal Control Over Financial Reporting
A company’s internal control over financial reporting is a process designed to provide reasonable assurance regarding the reliability of financial reporting and the preparation of financial statements for external purposes in accordance with generally accepted accounting principles. A company’s internal control over financial reporting includes those policies and procedures that (1) pertain to the maintenance of records that, in reasonable detail, accurately and fairly reflect the transactions and dispositions of the assets of the company; (2) provide reasonable assurance that transactions are recorded as necessary to permit preparation of financial statements in accordance with generally accepted accounting principles, and that receipts and expenditures of the company are being made only in accordance with authorizations of management and directors of the company; and (3) provide reasonable assurance regarding prevention or timely detection of unauthorized acquisition, use, or disposition of the company’s assets that could have a material effect on the financial statements.
Because of its inherent limitations, internal control over financial reporting may not prevent or detect misstatements. Also, projections of any evaluation of effectiveness to future periods are subject to the risk that controls may become inadequate because of changes in conditions, or that the degree of compliance with the policies or procedures may deteriorate.
/s/ KPMG LLP
Albany, New York
March 1, 2021
None.
PART III
The information required by this item is incorporated herein by reference to the Company’s definitive Proxy Statement for its Annual Meeting of shareholders to be held on May 25, 2021 (the “Proxy Statement”), which will be filed with the SEC within 120 days after the Company’s 2020 fiscal year end.
The information required by this item is incorporated herein by reference to the Proxy Statement, which will be filed with the SEC within 120 days after the Company’s 2020 fiscal year end.
ITEM 12. SECURITY OWNERSHIP OF CERTAIN BENEFICIAL OWNERS AND MANAGEMENT AND RELATED STOCKHOLDER MATTERS
The following table provides information with respect to shares of common stock that may be issued under the Company’s existing equity compensation plans:
Plan Category |
A. Number of securities to be issued upon exercise of outstanding options, warrants and rights |
B. Weighted- average exercise price of outstanding options, warrants and rights |
Number of securities remaining available for future issuance under equity compensation plans (excluding securities reflected in column A) |
|||||||||
Equity compensation plans approved by stockholders |
13,800 |
$ |
27.83 |
781,123 |
||||||||
Equity compensation plans not approved by stockholders |
None |
None |
None |
|||||||||
The other information required by this item is incorporated herein by reference to the Proxy Statement, which will be filed with the SEC within 120 days of the Company’s 2020 fiscal year end.
The information required by this item is incorporated herein by reference to the Proxy Statement, which will be filed with the SEC within 120 days of the Company’s 2020 fiscal year end.
The information required by this item is incorporated herein by reference to the Proxy Statement, which will be filed with the SEC within 120 days of the Company’s 2020 fiscal year end.
PART IV
(a)(1) The following Consolidated Financial Statements are included in Part II, Item 8 hereof:
Report of Independent Registered Public Accounting Firm.
Consolidated Balance Sheets as of December 31, 2020 and 2019.
Consolidated Statements of Income for each of the three years ended December 31, 2020, 2019 and 2018.
Consolidated Statements of Changes in Stockholders’ Equity for each of the three years ended December 31, 2020, 2019 and 2018.
Consolidated Statements of Cash Flows for each of the three years ended December 31, 2020, 2019 and 2018.
Consolidated Statements of Comprehensive Income for each of the three years ended December 31, 2020, 2019 and 2018.
Notes to the Consolidated Financial Statements.
(a)(2) There are no financial statement schedules that are required to be filed as part of this form since they are not applicable or the information is included in the consolidated financial statements.
(a)(3) See below for all exhibits filed herewith and the Exhibit Index.
Restated Certificate of Incorporation of NBT Bancorp Inc. as amended through July 1, 2015 (filed as Exhibit 3.1 to Registrant’s Form 10-Q, filed on August 10, 2015, and incorporated herein by reference) |
|
Amended and Restated Bylaws of NBT Bancorp Inc. effective May 22, 2018 (filed as Exhibit 3.1 to Registrant’s Form 8-K, filed on May 23, 2018 and incorporated herein by reference). |
|
Certificate of Designation of the Series A Junior Participating Preferred Stock (filed as Exhibit A to Exhibit 4.1 of the Registrant’s Form 8-K, filed on November 18, 2004, and incorporated herein by reference). |
|
Specimen common stock certificate for NBT’s Bancorp Inc. common stock (filed as Exhibit 4.3 to the Registrant’s Amendment No. 1 to Registration Statement on Form S-4, filed on December 27, 2005, and incorporated herein by reference). |
|
Description of Registrant’s Securities (filed as Exhibit 4.2 to the Registrant’s Form 10-K for the year ended December 31, 2019, filed on March 2, 2020, and incorporated herein by reference). |
|
Subordinated Indenture, dated as of June 23, 2020, between NBT Bancorp Inc. and U.S. Bank National Association (filed as Exhibit 4.1 to Registrant’s Form 8-K, filed on June 23, 2020 and incorporated herein by reference). |
|
First Supplemental Indenture, dated as of June 23, 2020, between NBT Bancorp Inc. and U.S. Bank National Association (filed as Exhibit 4.2 to Registrant’s Form 8-K, filed on June 23, 2020 and incorporated herein by reference). |
|
Form of 5.000% Fixed-to-Floating Rate Subordinated Notes due 2030 (included in Exhibit 4.4). |
|
NBT Bancorp Inc. Non-employee Directors Restricted and Deferred Stock Plan (filed as Exhibit 10.5 to Registrant’s Form 10-K for the year ended December 31, 2008, filed on March 2, 2009, and incorporated herein by reference).* |
|
Supplemental Executive Retirement Agreement between NBT Bancorp Inc. and Martin A. Dietrich as amended and restated January 20, 2010 (filed as Exhibit 10.14 to Registrant’s Form 10-K for the year ended December 31, 2009, filed on March 1, 2010, and incorporated herein by reference).* |
|
Split-Dollar Agreement between NBT Bancorp Inc., NBT Bank, National Association and Martin A. Dietrich made November 10, 2008 (filed as Exhibit 10.1 to Registrant’s Form 10-Q for the quarterly period ended September 30, 2008, filed on November 10, 2008, and incorporated herein by reference).* |
|
First Amendment dated November 5, 2009 to Split-Dollar Agreement between NBT Bancorp Inc., NBT Bank, National Association and Martin A. Dietrich made November 10, 2008 (filed as Exhibit 10.6 to Registrant’s Form 10-Q for the quarterly period ended September 30, 2009, filed on November 9, 2009, and incorporated herein by reference).* |
|
Second Amendment dated July 28, 2014 to Split-Dollar Agreement between NBT Bancorp Inc., NBT Bank, National Association, and Martin A. Dietrich made November 10, 2008 (filed as Exhibit 10.1 to Registrant’s Form 8-K, filed on August 1, 2014, and incorporated herein by reference).* |
|
NBT Bancorp Inc. 2008 Omnibus Incentive Plan (filed as Appendix A of Registrant’s Definitive Proxy Statement on Form 14A, filed on March 31, 2008, and incorporated herein by reference).* |
|
Long-Term Incentive Compensation Plan for Named Executive Officers (filed as Exhibit 10.24 to Registrant’s Form 10-K for the year ended December 31, 2011, filed on February 29, 2012, and incorporated herein by reference).* |
|
Amended and Restated Employment Agreement, dated December 19, 2016, by and between NBT Bancorp Inc. and Timothy L. Brenner (filed as Exhibit 10.4 to Registrant’s Form 8-K, filed on December 20, 2016, and incorporated herein by reference).* |
Amended and Restated Supplemental Retirement Agreement and First Amendment to the Supplemental Retirement Agreement between Alliance Financial Corporation, Alliance Bank, N.A. and Jack H. Webb (filed as Exhibit 10.29 to Registrant’s Form 10-K for the year ended December 31, 2013, filed on March 3, 2014, and incorporated herein by reference).* |
|
Employment Agreement, dated December 19, 2016, by and between NBT Bancorp Inc. and John H. Watt, Jr. (filed as Exhibit 10.1 to Registrant’s Form 8-K, filed on December 20, 2016, and incorporated herein by reference).* |
|
Split-Dollar Agreement between NBT Bancorp Inc., NBT Bank, National Association and John H. Watt, Jr. dated May 9, 2017 (filed as Exhibit 10.1 to Registrant’s Form 10-Q, filed on May 10, 2017, and incorporated herein by reference).* |
|
Supplemental Executive Retirement Agreement, dated December 19, 2016 by and between NBT Bancorp Inc. and John H. Watt, Jr. (filed as Exhibit 10.2 to Registrant’s Form 8-K, filed on December 20, 2016, and incorporated herein by reference).* |
|
Employment Agreement, dated December 19, 2016, by and between NBT Bancorp Inc. and Joseph R. Stagliano (Filed as Exhibit 10.19 to Registrant’s Form 10-K, filed on March 1, 2018, and incorporated herein by reference).* |
|
Employment Agreement, dated December 19, 2016, by and between NBT Bancorp Inc. and Catherine M. Scarlett (Filed as Exhibit 10.18 to Registrant’s Form 10-K, filed on March 2, 2020, and incorporated herein by reference).* |
|
Form of Amendment to Employment Agreements, dated September 27, 2017, by and between NBT Bancorp Inc. and John H. Watt, Jr., Timothy L. Brenner, Joseph R. Stagliano and Catherine M. Scarlett, respectively (Filed as Exhibit 10.1 to Registrant’s Form 8-K, filed on September 29, 2017, and incorporated herein by reference).* |
|
NBT Bancorp Inc. 2018 Omnibus Incentive Plan (filed as Appendix A of Registrant’s Definitive Proxy Statement on Form 14A, filed on April 6, 2018, and incorporated herein by reference).* |
|
Employment Agreement, dated December 16, 2019, by and between NBT Bancorp Inc. and John V. Moran (Filed as Exhibit 10.1 to Registrant’s Form 8-K, filed on December 20, 2019, and incorporated herein by reference).* |
|
101.INS |
Inline XBRL Instance Document (the instance document does not appear in the Interactive Data File because its XBRL tags are embedded within the Inline XBRL document). |
101.SCH |
Inline XBRL Taxonomy Extension Schema Document. |
101.CAL |
Inline XBRL Taxonomy Extension Calculation Linkbase Document. |
101.DEF |
Inline XBRL Taxonomy Extension Definition Linkbase Document. |
101.LAB |
Inline XBRL Taxonomy Extension Label Linkbase Document. |
101.PRE |
Inline XBRL Taxonomy Extension Presentation Linkbase Document. |
104 |
Cover Page Interactive Data File (formatted as Inline XBRL and contained in Exhibit 101). |
| * | Management contract or compensatory plan or arrangement. |
| (b) | Exhibits to this Form 10-K are attached or incorporated herein by reference as noted above. |
| (c) | Not applicable. |
None.
Pursuant to the requirements of Section 13 or 15(d) of the Securities Exchange Act of 1934, NBT Bancorp Inc. has duly caused this report to be signed on its behalf by the undersigned, thereunto duly authorized.
/s/ John H. Watt, Jr. |
||
John H. Watt, Jr. |
||
Chief Executive Officer |
Pursuant to the requirements of the Securities Exchange Act of 1934, this report has been signed below by the following persons on behalf of the Registrant and in the capacities and on the dates indicated.
/s/ Martin A. Dietrich |
/s/ Andrew S. Kowalczyk III |
|
Martin A. Dietrich |
Andrew S. Kowalczyk III, Director |
|
Chairman and Director |
Date: March 1, 2021 |
|
Date: March 1, 2021 |
/s/ John H. Watt, Jr. |
/s/ John C. Mitchell |
|
John H. Watt, Jr. |
John C. Mitchell, Director |
|
President, Chief Executive Officer and Director (Principal Executive Officer) |
Date: March 1, 2021 |
|
Date: March 1, 2021 |
/s/ John V. Moran |
/s/ V. Daniel Robinson II |
|
John V. Moran |
V. Daniel Robinson II, Director |
|
Chief Financial Officer (Principal Financial Officer) |
Date: March 1, 2021 |
|
Date: March 1, 2021 |
/s/ Annette L. Burns |
/s/ Matthew J. Salanger |
|
Annette L. Burns |
Matthew J. Salanger, Director |
|
Chief Accounting Officer (Principal Accounting Officer) |
Date: March 1, 2021 |
|
Date: March 1, 2021 |
/s/ Johanna R. Ames |
/s/ Joseph A. Santangelo |
|
Johanna R. Ames, Director |
Joseph A. Santangelo, Director |
|
Date: March 1, 2021 |
Date: March 1, 2021 |
/s/ Patricia T. Civil |
/s/ Lowell A. Seifter |
|
Patricia T. Civil, Director |
Lowell A. Seifter, Director |
|
Date: March 1, 2021 |
Date: March 1, 2021 |
/s/ Timothy E. Delaney |
/s/ Robert A. Wadsworth |
|
Timothy E. Delaney, Director |
Robert A. Wadsworth, Director |
|
Date: March 1, 2021 |
Date: March 1, 2021 |
/s/ James H. Douglas |
/s/ Jack H. Webb |
|
James H. Douglas, Director |
Jack H. Webb, Director |
|
Date: March 1, 2021 |
Date: March 1, 2021 |
113