UNITED STATES
SECURITIES AND EXCHANGE COMMISSION
Washington, D.C. 20549
FORM 10-K
(Mark One)
ý | ANNUAL REPORT PURSUANT TO SECTION 13 OR 15 (d) OF THE SECURITIES EXCHANGE ACT OF 1934 | |
For the fiscal year ended December 31, 2016 | ||
OR
¨ | TRANSITION REPORT PURSUANT TO SECTION 13 OR 15(d) OF THE | |
SECURITIES EXCHANGE ACT OF 1934 | ||
For the transition period from ____________ to ____________ | ||
Commission file number 001-09148
THE BRINK’S COMPANY
(Exact name of registrant as specified in its charter)
Virginia | 54-1317776 | |||
(State or other jurisdiction of | (I.R.S. Employer | |||
incorporation or organization) | Identification No.) | |||
P.O. Box 18100, | ||||
1801 Bayberry Court | ||||
Richmond, Virginia | 23226-8100 | |||
(Address of principal executive offices) | (Zip Code) | |||
Registrant’s telephone number, including area code | (804) 289-9600 | |||
Securities registered pursuant to Section 12(b) of the Act: | ||||
Name of each exchange on | ||||
Title of each class | which registered | |||
The Brink’s Company Common Stock, Par Value $1 | New York Stock Exchange | |||
Securities registered pursuant to Section 12(g) of the Act: None | ||||
Indicate by check mark if the registrant is a well-known seasoned issuer, as defined in Rule 405 of the Securities Act.
Yes ý No ¨
Indicate by check mark if the registrant is not required to file reports pursuant to Section 13 or Section 15(d) of the Act.
Yes ¨ No ý
Indicate by check mark whether the registrant: (1) has filed all reports required to be filed by Section 13 or 15(d) of the Securities Exchange Act of 1934 during the preceding 12 months (or for such shorter period that the registrant was required to file such reports), and (2) has been subject to such filing requirements for the past 90 days.
Yes ý No ¨
Indicate by check mark whether the registrant has submitted electronically and posted on its corporate Web site, if any, every Interactive Data File required to be submitted and posted pursuant to Rule 405 of Regulation S-T (§ 232.405 of this chapter) during the preceding 12 months (or for such shorter period that the registrant was required to submit and post such files).
Yes ý No ¨
Indicate by check mark if disclosure of delinquent filers pursuant to Item 405 of Regulation S-K is not contained herein, and will not be contained, to the best of registrant’s knowledge, in definitive proxy or information statements incorporated by reference in Part III of this Form 10-K or any amendment to this Form 10-K. ý
Indicate by check mark whether the registrant is a large accelerated filer, an accelerated filer, a non-accelerated filer or a smaller reporting company. See definition of “large accelerated filer,” “accelerated filer” and “smaller reporting company” in Rule 12b-2 of the Exchange Act.
Large accelerated filer ý Accelerated filer ¨ Non-accelerated filer ¨ Smaller reporting company ¨
Indicate by check mark whether the registrant is a shell company (as defined in Rule 12b-2 of the Exchange Act).
Yes ¨ No ý
As of February 20, 2017, there were issued and outstanding 50,040,196 shares of common stock. The aggregate market value of shares of common stock held by non-affiliates as of June 30, 2016, was $1,400,285,095.
Documents incorporated by reference: Part III incorporates information by reference from portions of the Registrant’s definitive 2017 Proxy Statement to be filed pursuant to Regulation 14A.
THE BRINK’S COMPANY
FORM 10-K
FOR THE YEAR ENDED DECEMBER 31, 2016
TABLE OF CONTENTS
Page | ||
Item 16. | Form 10-K Summary | |
PART I |
ITEM 1. BUSINESS
Overview
The Brink’s Company is a premier provider of secure logistics and security solutions including cash-in-transit, ATM replenishment and maintenance, cash management services, including vault outsourcing, money processing, and intelligent safe services, international transportation of valuables, and payment services. Our customers include financial institutions, retailers, government agencies (including central banks), mints, jewelers and other commercial operations around the world. Our global network serves customers in more than 100 countries. We have ownership interests in companies in 40 countries and agency relationships with companies in additional countries. We employ approximately 60,700 people and our operations include approximately 1,000 facilities and 11,900 vehicles.
Brink’s was founded in 1859 and The Brink’s Company was first incorporated in 1930 under the laws of the State of Delaware (at that time, the Company was named The Pittston Company). It succeeded to the business of a Virginia corporation in 1986 and was renamed The Brink’s Company in 2003. Our headquarters are located in Richmond, Virginia. The Brink’s Company, along with its subsidiaries, is referred to as “we,” “our,”, “us,” “Brink’s,” or “the Company” throughout this Form 10-K.
Brink’s operations are located throughout the world with 75% of our revenues earned outside the U.S. during 2016. Brink’s Largest 5 Markets (U.S., France, Mexico, Brazil and Canada) represent 63% of consolidated revenues. The following table presents a summary of revenues by segment in 2014, 2015 and 2016.
(In millions) | 2016 | % total | % change | 2015 | % total | % change | 2014 | % total | ||||||||
Revenues by segment: | ||||||||||||||||
Largest 5 Markets: | ||||||||||||||||
U.S. | $ | 752.6 | 25 | 3 | $ | 730.4 | 24 | — | $ | 727.8 | 20 | |||||
France | 424.5 | 14 | (2 | ) | 431.5 | 14 | (17 | ) | 517.4 | 15 | ||||||
Mexico | 295.3 | 10 | (11 | ) | 333.0 | 11 | (14 | ) | 388.2 | 11 | ||||||
Brazil | 285.7 | 9 | 6 | 270.4 | 9 | (26 | ) | 364.1 | 10 | |||||||
Canada | 150.2 | 5 | (2 | ) | 153.7 | 5 | (14 | ) | 179.7 | 5 | ||||||
Largest 5 Markets | 1,908.3 | 63 | (1 | ) | 1,919.0 | 63 | (12 | ) | 2,177.2 | 61 | ||||||
Latin America | 355.1 | 12 | (4 | ) | 369.9 | 12 | (3 | ) | 380.6 | 11 | ||||||
EMEA | 387.4 | 13 | (13 | ) | 444.7 | 15 | (20 | ) | 556.3 | 16 | ||||||
Asia | 167.5 | 6 | 6 | 157.4 | 5 | 13 | 139.8 | 4 | ||||||||
Global Markets | 910.0 | 30 | (6 | ) | 972.0 | 32 | (10 | ) | 1,076.7 | 30 | ||||||
Payment Services | 90.1 | 3 | 5 | 85.9 | 3 | (11 | ) | 96.6 | 3 | |||||||
Total reportable segments | 2,908.4 | 96 | (2 | ) | 2,976.9 | 97 | (11 | ) | 3,350.5 | 94 | ||||||
Other items not allocated to segments | 112.2 | 4 | 33 | 84.5 | 3 | (60 | ) | 211.8 | 6 | |||||||
Total Revenues | $ | 3,020.6 | 100 | (1 | ) | $ | 3,061.4 | 100 | (14 | ) | $ | 3,562.3 | 100 | |||
Amounts may not add due to rounding.
Geographic financial information related to revenues and long-lived assets is included in the consolidated financial statements on page 77.
1
Vision, Mission and Strategy
Our Vision
Our vision is to be the world’s premier provider of cash management, secure logistics and payment services.
Our Mission and Goal
Our goal is to create value by leveraging our brand, enhancing the customer experience, and aggressively pursuing growth opportunities.
Our Strategy
Our strategy is designed to achieve both organic and inorganic revenue growth while driving margins consistently higher. Our strategy has three pillars:
• | Accelerate profitable growth ("APG") |
• | Close the gap with operational excellence ("CTG") |
• | Introduce differentiated services ("IDS") |
Accelerate profitable growth through:
• | growing High-Value Services |
• | growing account share with existing customers |
• | increasing focus on smaller financial institutions |
• | penetrating large, unvended retail market |
• | exploring core and adjacent acquisitions |
We have opportunities to grow revenue in higher-margin lines of business such as CompuSafe® services and recyclers, money processing outsourcing, and Brink’s Global Services. Our plan calls for growing revenue with both large and small financial institutions, and increasing penetration of the large and underserved retail market. With a Net Debt-to-Adjusted EBITDA ratio under 1X, as of December 31, 2016, we also have the financial flexibility to complete accretive acquisitions in both core and adjacent markets.
Close the gap with operational excellence by:
• | leading our industry in safety and security |
• | exceeding customer expectations |
• | increasing operational productivity |
We have already begun an aggressive drive to improve internal productivity, optimize cost and achieve industry-leading margins.
Introduce differentiated services through:
• | leveraging uniform, best-in-class global technology base for logistics and operating systems |
• | offering end-to-end cash supply chain managed services |
• | launching a customer portal and value-added, fee-based services |
The third component of our strategy is to introduce differentiated services to our customers by strengthening and leveraging our IT capabilities. Our IT strategy and systems will also drive improved service levels and operational efficiencies.
2
Services
We design customized services to meet the cash and valuables supply chain needs of our customers. We enter into contracts with our customers to establish pricing and other terms. Cash-in-Transit and ATM contracts usually cover an initial term of at least one year and in many cases one to three years, and generally remain in effect thereafter until canceled by either party. Contracts for Cash Management Services are typically longer. Following are descriptions of our service offerings:
Core Services (53% of total revenues in 2016)
Cash-in-transit and ATM Services are core services we provide to customers throughout the world. We charge customers per service performed or based on the value of goods transported. Revenues are affected by the level of economic activity in various markets as well as the volume of business for specific customers. Core services generated approximately $1.6 billion of revenues in 2016.
Cash-in-Transit Services – Serving customers since 1859, our success in Cash-in-Transit is driven by a combination of rigorous security practices, high-quality customer service, risk management and logistics expertise. Cash-in-Transit Services generally include the secure transportation of:
• | cash between businesses and financial institutions, such as banks and credit unions |
• | cash, securities and other valuables between commercial banks, central banks and investment banking and brokerage firms |
• | new currency, coins, bullion and precious metals for central banks and other customers |
ATM Services – We manage 94,600 ATMs worldwide. We provide customers who own and operate ATMs a variety of service options. Basic ATM management services include cash replenishment and first and second line maintenance. We also provide comprehensive services for ATM management through our Brink's Integrated Managed Services (“Brink’s IMS”) offering, which includes cash replenishment, replenishment forecasting, cash optimization, ATM remote monitoring, service call dispatching, transaction processing, installation services, and first and second line maintenance.
High-Value Services (40% of total revenues in 2016)
Our Core Services, combined with our brand and global infrastructure, provide a broad platform from which we offer additional High-Value Services, which generated approximately $1.2 billion of revenues in 2016.
Global Services - Brink’s Global Services ("BGS") is the leading global provider of secure transport of highly-valued commodities including diamonds, jewelry, precious metals, securities, currency, high-tech devices, electronics and pharmaceuticals. Our specialized diamond and jewelry operations have offices in the world’s major diamond and jewelry centers. Serving customers in more than 100 countries, BGS provides secure transportation services including pick-up, packaging, customs clearance, secure vault storage and inventory management. BGS uses a combination of armored vehicles and secure air and sea transportation.
Cash Management Services - We offer a variety of Cash Management Services, depending on customers’ unique needs. These include:
• | money processing (e.g., counting, sorting, wrapping, checking condition of bills, etc.) and other cash management services |
• | services related to deploying and servicing “intelligent” safes and safe control devices, including our patented CompuSafe® service |
• | integrated check and cash processing services (“Virtual Vault”) |
• | check imaging services |
Other cash management services include cashier balancing, counterfeit detection, account consolidation and electronic reporting. Retail and bank customers use Brink’s to count and reconcile coins and currency, prepare bank deposit information and replenish coins and currency in specific denominations.
Brink's offers a fully integrated approach to managing customers' supply chain of cash. These services include logistical support from point-of-sale through transport, vaulting, bank deposit and related credit reporting. We also offer a variety of advanced technology applications including online cash tracking, cash inventory management, check imaging for real-time deposit processing, and a variety of other web-based tools that enable banks and other customers to reduce costs while improving service to their customers. We believe the quality and scope of our money processing and information systems differentiate our Cash Management Services from competitive offerings.
Brink’s CompuSafe® Service. Brink’s CompuSafe® service provides an integrated, closed-loop system for preventing theft and managing cash. We market CompuSafe® services to a variety of cash-intensive customers including convenience stores, gas stations, restaurants, retail chains and entertainment venues. In a majority of instances, once the specialized safe is installed, the customer’s employees deposit currency into the safe’s cassettes, which can only be removed by Brink’s personnel. Upon removal, the cassettes are securely transported to a vault for processing where contents are verified and transferred for deposit. Our CompuSafe® service features currency-recognition and counterfeit-detection technology, multi-language touch screens and an electronic interface between the point-of-sale, back-office systems and external banks. Our electronic reporting interface with external banks enables customers to receive same-day credit on their cash balances, even if the cash remains on the customer’s premises. Recently, some customers have requested specialized safes permitting customer employees to remove money in a secure manner that was previously deposited in the safe cassettes to meet a current need. We have also implemented this capability.
3
Virtual Vault. Virtual Vault services combine Cash-in-Transit Services, Cash Management Services, vaulting and electronic reporting technologies to help banks expand into new markets while minimizing investment in vaults and branch facilities. In addition to providing secure storage, we process deposits, provide check imaging and reconciliation services, perform currency inventory management, process ATM replenishment orders and electronically transmit banking transactions.
Payment Services – We provide convenient payment services, including bill payment processing, mobile phone top-up, and Brink’s Money™ prepaid cards.
Latin America. Bill payment processing services include bill payment acceptance and processing services on behalf of utility companies and other billers. Consumers can pay bills, top-up prepaid mobile phones and manage accounts at retail agent locations that we operate on behalf of utility companies, banks and a small number of leased payment locations. This service is offered at over 31,300 locations in Brazil, Mexico, Colombia and Panama.
United States. We offer Brink’s Money™ general purpose reloadable prepaid cards and payroll cards to consumers and employers. Our general purpose reloadable cards are sold to consumers through our direct-to-consumer marketing efforts while our payroll cards are sold to employers who use them to pay employees electronically. Brink’s Money™ cards can be used at stores, restaurants, online retailers, and at ATMs worldwide. This product is targeted to the millions of unbanked and under-banked Americans looking for alternative financial products.
Commercial Security Systems – We provide commercial security system services in designated markets in Europe. Our security system design and installation services include alarms, motion detectors, closed-circuit televisions, digital video recorders, and access control systems, including card and biometric readers, electronic locks, and turnstiles. We may also provide monitoring services after systems have been installed.
Other Security Services (7% of total revenues in 2016)
Guarding – We protect airports, offices, warehouses, stores, and public venues with or without electronic surveillance, access control, fire prevention and trained patrolling personnel. Other security services generated approximately $0.2 billion of revenues in 2016.
We offer security and guarding services in France, Luxembourg, Greece and Brazil. A portion of this business involves long-term contracts related primarily to security services at airports and embassies. Generally, guarding contracts are for a one-year period, and the majority of contracts are extended.
Industry and Competition
Brink’s competes with large multinational, regional and smaller companies throughout the world. Our largest multinational competitors are G4S plc (U.K.); Loomis AB (Sweden); Prosegur, Compania de Seguridad, S.A. (Spain); and Garda World Security Corporation (Canada).
We believe the primary factors in attracting and retaining customers are security expertise, service quality, and price. Our competitive advantages include:
• | brand name recognition |
• | reputation for a high level of service and security |
• | risk management and logistics expertise |
• | global infrastructure and customer base |
• | proven operational excellence, and |
• | high-quality insurance coverage and financial strength |
Although we face competitive pricing pressure in many markets, we resist competing on price alone. We believe our high levels of service, security expertise and value-added solutions differentiate us from competitors.
Insurance Coverage
The availability of high-quality and reliable insurance coverage is an important factor in our ability to attract and retain customers and manage the risks inherent in our business. We purchase insurance coverage for losses in excess of what we consider to be prudent levels of self-insurance. Our insurance policies cover losses from most causes, with the exception of war, nuclear risk and certain other exclusions typical in such policies.
Insurance for security is provided by different groups of underwriters at negotiated rates and terms. Premiums fluctuate depending on market conditions. The security loss experience of Brink’s and, to a limited extent, other armored carriers affects our premium rates.
4
Service Mark and Patents
BRINKS is a registered service mark in the U.S. and certain foreign countries. The BRINKS mark, name and related marks are of material significance to our business. We own patents for safes and related services, iDeposit and Daily Credit processes, including our integrated CompuSafe® service, which expire between 2017 and 2032. These patents provide us with important advantages; however, we are not dependent on the existence of these patents.
We have licensed the Brink’s name to a limited number of companies, including a distributor of security products (padlocks, door hardware, etc.) offered for sale to consumers through major retail chains.
Government Regulation
Our U.S. operations are subject to regulation by the U.S. Department of Transportation with respect to safety of operations, equipment and financial responsibility. Intrastate operations in the U.S. are subject to state regulation. Operations outside of the United States are regulated to varying degrees by the countries in which we operate.
Employee Relations
At December 31, 2016, our company had approximately 60,700 full-time and contract employees, including approximately 7,400 employees in the United States (of whom approximately 380 were classified as part-time employees) and approximately 53,300 employees outside the United States. At December 31, 2016, Brink’s was a party to eleven collective bargaining agreements in the United States and Canada with various local unions covering approximately 1,600 employees. The agreements have various expiration dates from 2017 to 2019. Outside of the United States and Canada, approximately 56% of employees are represented by trade union organizations. We believe our employee relations are satisfactory.
Business Divestitures
Below is a summary of the significant businesses we disposed in the last three years. See Note 18 to the consolidated financial statements for more information on these dispositions. The results of the operations below, which met the criteria for classification as discontinued operations as of or prior to December 31, 2014, have been excluded from continuing operations and are reported as discontinued operations for the current and prior periods. The sales of the Russian cash management business and the Irish guarding operations in 2015 as well as the shutdown of the remaining Ireland operations in 2016 did not meet the criteria for classification as discontinued operations. Operating results for these businesses are included in continuing operations for the current and prior periods. We continue to operate our Global Services business in most of these countries.
Cash-in-transit operations sold or shut down:
• | Australia (sold in October 2014) |
• | Puerto Rico (shut down in November 2014) |
• | Netherlands (sold in December 2014) |
Other operations sold:
• | In February 2015, we sold a small Mexican parcel delivery business which met the criteria for classification as a discontinued operation as of December 31, 2014. |
Other divestitures not classified as discontinued operations:
• | We sold a noncontrolling interest in a CIT business based in Peru in 2014 for $60 million. |
• | We sold our 70% ownership interest in a Russian cash management business in November 2015 and recognized a $5.9 million loss on the disposition. A significant part of the loss ($5.0 million) represented the reclassification of foreign currency translation adjustments from accumulated other comprehensive income (loss) into earnings. |
• | We sold an Irish guarding operation in November 2015. |
• | In September 2016, we shut down the remaining operations in the Republic of Ireland and Northern Ireland. At December 31, 2016, we were in the process of finalizing the settlement of all remaining obligations of these businesses. During 2016, we incurred approximately $16 million in losses as we exited these operations. These losses included $5 million in severance costs and $2 million in property impairment charges. |
• | We sold a German guarding operation in October 2016. |
5
Reorganization and Restructuring
In the fourth quarter of 2014, we announced a reorganization and restructuring of Brink’s global organization (“2014 Reorganization and Restructuring”) to accelerate the execution of our strategy by reducing costs and providing for a more streamlined and centralized organization. As part of this program, we reduced our total workforce by approximately 1,700 positions. Severance costs of $21.8 million associated with these actions were recognized in 2014, with an additional $1.9 million in restructuring charges recognized in 2015. The restructuring saved annual direct costs of approximately $50 million in 2015 compared to 2014, excluding severance, lease termination and accelerated depreciation. The actions under this program were substantially completed by the end of 2015.
We initiated another global restructuring of our business in the third quarter of 2015 (“2015 Reorganization and Restructuring”), which included the recognition in 2015 of $11.6 million in costs related to employee severance, contract terminations and lease terminations. We recognized an additional $6.5 million in charges in 2016 related to this restructuring. The 2015 Reorganization and Restructuring reduced the global workforce by approximately 1,100 positions and resulted in approximately $20 million in 2016 cost savings. The actions under this program were substantially completed by the end of 2016, with cumulative pretax charges of approximately $18 million.
In the fourth quarter of 2016, management implemented restructuring actions across our global business operations and our corporate functions (“2016 Reorganization and Restructuring”). As a result of these actions, we recognized asset-related adjustments of $16.3 million, severance costs of $7.2 million, lease restructuring charges of $0.7 million, partially offset by a $6.1 million benefit related to the termination of a benefit program. Severance actions are expected to reduce our global workforce by 700 to 800 positions. We expect that the 2016 restructuring will result in $8 to $12 million in 2017 cost savings.
Executive Leadership and Board of Directors Restructuring
In January 2016, Brink’s entered into an agreement (the "Starboard Agreement") with Starboard Value LP and its affiliates ("Starboard"). As a result, our former Chief Executive Officer ("CEO"), Thomas C. Schievelbein, stepped down in May 2016, and two of the Company’s directors (including the Company’s independent lead director) retired from the Board. Pursuant to the Starboard Agreement, among other things, the Board appointed three new independent directors and delegated to the Board’s Corporate Governance and Nominating Committee the responsibility to oversee the Board's process to search for a new CEO. On June 9, 2016, the Board appointed Douglas A. Pertz as the Company’s president and CEO and as a member of the Board. Joseph W. Dziedzic served as Chief Financial Officer ("CFO") from 2009 until he was replaced on July 14, 2016 when Brink's announced that Ronald J. Domanico had joined the Company as the new CFO. In the fourth quarter of 2015, we recognized $1.8 million in costs related to the Executive Leadership and Board of Directors restructuring. We recognized an additional $4.3 million in charges, primarily severance costs, in 2016.
Available Information and Corporate Governance Documents
The following items are available free of charge on our website (www.brinks.com) as soon as reasonably possible after filing or furnishing them with the Securities and Exchange Commission (the “SEC”):
• | Annual reports on Form 10-K |
• | Quarterly reports on Form 10-Q |
• | Current reports on Form 8-K, and amendments to those reports |
The following documents are also available free of charge on our website:
• | Corporate Governance Policies |
• | Code of Ethics |
• | The charters of the following committees of our Board of Directors (the “Board”): Audit and Ethics, Compensation and Benefits, Corporate Governance and Nominating, and Finance and Strategy |
Printed versions of these items will be mailed free of charge to shareholders upon request. Such requests can be made by contacting the Corporate Secretary at 1801 Bayberry Court, P. O. Box 18100, Richmond, Virginia 23226-8100.
6
ITEM 1A. RISK FACTORS
We operate in highly competitive industries.
We compete in industries that are subject to significant competition and pricing pressures in most markets. In addition, our business model requires significant fixed costs associated with offering many of our services including costs to operate a fleet of armored vehicles and a network of secure branches. Because we believe we have competitive advantages such as brand name recognition and a reputation for a high level of service and security, we resist competing on price alone. However, continued pricing pressure from competitors or failure to achieve pricing based on the competitive advantages identified above could result in lost volume of business and have an adverse effect on our business, financial condition, results of operations and cash flows. In addition, given the highly competitive nature of our industries, it is important to develop new solutions and product and service offerings to help retain and expand our customer base. Failure to develop, sell and execute new solutions and offerings in a timely and efficient manner could also negatively affect our ability to retain our existing customer base or pricing structure and have an adverse effect on our business, financial condition, results of operations and cash flows.
Decreased use of cash could have a negative impact on our business.
The proliferation of payment options other than cash, including credit cards, debit cards, stored-value cards, mobile payments and on-line purchase activity, could result in a reduced need for cash in the marketplace and a decline in the need for physical bank branches and retail stores. To mitigate this risk, we are developing new lines of business and investing in adjacent security-related markets, but there is a risk that these initiatives may not offset the risks associated with our traditional cash-based business and that our business, financial condition, results of operations and cash flows could be negatively impacted.
Our strategy may not be successful.
Our strategy has three pillars: accelerate profitable growth, close the gap with competitors and introduce differentiated services. We may not be successful in growing revenue in high-margin lines of business, increasing our market share with existing customers or winning new business with smaller financial institutions and the retail market. Although we have already begun a drive to improve productivity and optimize costs, we may not be able to achieve industry-leading margins. We also may not be successful in strengthening and leveraging our IT capabilities to improve service levels and drive efficiencies. If we are unable to achieve our strategic objectives and anticipated operating profit improvements, our results of operations and cash flows may be adversely affected.
We have significant operations outside the United States.
We currently serve customers in more than 100 countries, including 40 countries where we operate subsidiaries. Seventy-five percent (75%) of our revenues in 2016 came from operations outside the U.S. We expect revenues outside the U.S. to continue to represent a significant portion of total revenues. Business operations outside the U.S. are subject to political, economic and other risks inherent in operating in foreign countries, such as:
• | the difficulty of enforcing agreements, collecting receivables and protecting assets through foreign legal systems; |
• | trade protection measures and import or export licensing requirements; |
• | difficulty in staffing and managing widespread operations; |
• | required compliance with a variety of foreign laws and regulations; |
• | enforcement of our global compliance program in foreign countries with a variety of laws, cultures and customs; |
• | varying permitting and licensing requirements in different jurisdictions; |
• | foreign ownership laws; |
• | changes in the general political and economic conditions in the countries where we operate, particularly in emerging markets; |
• | threat of nationalization and expropriation; |
• | higher costs and risks of doing business in a number of foreign jurisdictions; |
• | laws or other requirements and restrictions associated with organized labor; |
• | limitations on the repatriation of earnings; |
• | fluctuations in equity, revenues and profits due to changes in foreign currency exchange rates, including measures taken by governments to devalue official currency exchange rates; |
• | inflation levels exceeding that of the U.S; and |
• | inability to collect for services provided to government entities. |
We are exposed to certain risks when we operate in countries that have high levels of inflation, including the risk that:
• | the rate of price increases for services will not keep pace with the cost of inflation; |
• | adverse economic conditions may discourage business growth which could affect demand for our services; |
• | the devaluation of the currency may exceed the rate of inflation and reported U.S. dollar revenues and profits may decline; and |
• | these countries may be deemed “highly inflationary” for U.S. generally accepted accounting principles (“GAAP”) purposes. |
We manage these risks by monitoring current and anticipated political and economic developments, monitoring adherence to our global compliance program and adjusting operations as appropriate. Changes in the political or economic environments of the countries in which we operate could have a material adverse effect on our business, financial condition, results of operations and cash flows.
7
Our business success depends on retaining our leadership team and attracting and retaining qualified personnel.
Our future success depends, in part, on the continuing services and contributions of our leadership team to execute on our strategic plan and to identify and pursue new opportunities. Our future success also depends, in part, on our continued ability to attract and retain highly skilled and qualified personnel. Any unplanned turnover in senior management or inability to attract and retain qualified personnel could have a negative effect on our results of operations. Turnover in key leadership positions within the Company may adversely affect our ability to manage the company efficiently and effectively, could be disruptive and distracting to management and may lead to additional departures of current personnel, any of which could have a material adverse effect on our business and results of operations.
We may be unable to achieve, or may be delayed in achieving, our initiatives to drive efficiency and control costs.
We have launched a number of initiatives, including the reorganization and restructuring actions described on page 6, to improve efficiencies and reduce operating costs. Although we have achieved annual cost savings associated with these initiatives, we may be unable to sustain the cost savings that we have achieved. In addition, if we are unable to achieve, or have any unexpected delays in achieving additional cost savings, our results of operations and cash flow may be adversely affected. Even if we meet our goals as a result of these initiatives, we may not receive the expected financial benefits of these initiatives.
We may not be successful in pursuing strategic investments or acquisitions or realize the expected benefits of those transactions because of integration difficulties and other challenges.
While we may identify opportunities for investments to support our growth strategy, as well as acquisition and divestiture opportunities, our due diligence examinations and positions that we may take with respect to appropriate valuations for acquisitions and divestitures and other transaction terms and conditions may hinder our ability to successfully complete business transactions to achieve our strategic goals. Our ability to realize the anticipated benefits from acquisitions will depend, in part, on successfully integrating each business with our company as well as improving operating performance and profitability through our management efforts and capital investments. The risks to a successful integration and improvement of operating performance and profitability include, among others, failure to implement our business plan, unanticipated issues in integrating operations with ours, unanticipated changes in laws and regulations, labor unrest resulting from union operations, regulatory, environmental and permitting issues, the effect on our internal controls and compliance with the regulatory requirements under the Sarbanes-Oxley Act of 2002, and difficulties in fully identifying and evaluating potential liabilities, risks and operating issues. The occurrence of any of these events may adversely affect our expected benefits of any acquisitions and may have a material adverse effect on our financial condition, results of operations or cash flows.
We have significant deferred tax assets in the United States that may not be realized.
Deferred tax assets are future tax deductions that result primarily from the net tax effects of temporary differences between the carrying amount of assets and liabilities for financial statement and income tax purposes. At December 31, 2016, we have $271 million of U.S. deferred tax assets, net of valuation allowances, primarily related to our retirement plan obligations. These future tax deductions may not be realized if tax rules change, if forecasted U.S. operational results are not realized or if any other U.S. projected future taxable income is insufficient. Consequently, not realizing our U.S. deferred tax assets may significantly and materially affect our financial condition, results of operations and cash flows.
It is possible that we will incur restructuring charges in the future.
It is possible that we will take restructuring actions in one or more of our markets in the future to reduce expenses. These actions could result in significant restructuring charges at these subsidiaries, including recognizing impairment charges to write down assets, and recording accruals for employee severance and the termination of operating leases. These charges, if required, could significantly and materially affect results of operations and cash flows.
We have significant retirement obligations. Poor investment performance of retirement plan holdings and / or lower interest rates used to discount the obligations could unfavorably affect our liquidity and results of operations.
We have substantial pension and retiree medical obligations, a portion of which have been funded. The amount of these obligations is significantly affected by factors that are not in our control, including interest rates used to determine the present value of future payment streams, investment returns, medical inflation rates, participation rates and changes in laws and regulations. The funded status of the primary U.S. pension plan was approximately 87% as of December 31, 2016. Based on actuarial assumptions at the end of 2016, we do not expect to make any contributions until 2021. A change in assumptions could result in funding obligations that could adversely affect our liquidity and our ability to use our resources to make acquisitions and to otherwise grow our business.
We have $699 million of actuarial losses recorded in accumulated other comprehensive income (loss) at the end of 2016. These losses relate to changes in actuarial assumptions that have increased the net liability for benefit plans. These losses have not been recognized in earnings. These losses will be recognized in earnings in future periods to the extent they are not offset by future actuarial gains. Our projections of future cash requirements and expenses for these plans could be adversely affected if our retirement plans have additional actuarial losses.
8
Our earnings and cash flow could be materially affected by increased losses of customer valuables.
We purchase insurance coverage for losses of customer valuables for amounts in excess of what we consider prudent deductibles and/or retentions. Insurance is provided by different groups of underwriters at negotiated rates and terms. Coverage is available to us in major insurance markets, although premiums charged are subject to fluctuations depending on market conditions. Our loss experience and that of other companies in our industry affects premium rates. We are not insured for losses below our coverage limits and recognize expense up to these limits for actual losses. Our insurance policies cover losses from most causes, with the exception of war, nuclear risk and various other exclusions typical for such policies. The availability of high-quality and reliable insurance coverage is an important factor in obtaining and retaining customers and managing the risks of our business. If our losses increase, or if we are unable to obtain adequate insurance coverage at reasonable rates, our financial condition, results of operations and cash flows could be materially and adversely affected.
Currency restrictions in Venezuela limit our ability to use earnings and cash flows outside of Venezuela and may negatively affect ongoing operations in Venezuela.
Because most of our past requests to convert bolivars to dollars have not been approved and certain past processes to obtain dollars are no longer available, we do not expect to be able to repatriate cash from Venezuela for the foreseeable future. Therefore, we do not expect to be able to use cash held in Venezuela for any purpose outside of that country, including reducing our U.S. debt, funding growth or business acquisitions or returning cash to shareholders.
We believe that currency exchange restrictions in Venezuela may disrupt the operation of our business in Venezuela because we may be unable to pay for goods and services that are required to be paid in dollars. This could reduce our ability to provide services to our customers in Venezuela, or could increase the cost of delivering the services, which would negatively affect our earnings and cash flows, and could result in a loss of control, deconsolidation, shutdown or loss of the business in Venezuela.
We have risks associated with confidential information.
In the normal course of business, we collect, process and retain sensitive and confidential information, including information about individuals. Despite the security measures we have in place, our facilities and systems, and those of third-party service providers and business partners, could be vulnerable to security breaches (including cybersecurity breaches), acts of vandalism, computer viruses, misplaced or lost data, programming or human errors or other similar events. Any security breach involving the misappropriation, loss or other unauthorized disclosure of confidential information, whether by us or by third-party service providers, could damage our reputation, expose us to the risks of litigation and liability, disrupt our business or otherwise have a material adverse effect on our business, financial condition, results of operations and cash flows.
Negative publicity to our name or brand could lead to a loss of revenues or profitability.
We are in the security business and our success and longevity are based to a large extent on our reputation for trust and integrity. Our reputation or brand, particularly the trust placed in us by our customers, could be negatively impacted in the event of perceived or actual breaches in our ability to conduct our business ethically, securely and responsibly. Any damage to our brand could have a material adverse effect on our business, financial condition, results of operations and cash flows.
Failures of our IT system could have a material adverse effect on our business.
We are heavily dependent on our information technology ("IT") infrastructure. Significant problems with our infrastructure, such as telephone or IT system failure, cybersecurity breaches, or failure to develop new technology platforms to support new initiatives and product and service offerings, could halt or delay our ability to service our customers, hinder our ability to conduct and expand our business and require significant remediation costs. In addition, we continue to evaluate and implement upgrades to our IT systems. We are aware of inherent risks associated with replacing these systems, including accurately capturing data and system disruptions, and believe we are taking appropriate action to mitigate these risks through testing, training, and staging implementation. However, there can be no assurances that we will successfully launch these systems as planned or that they will occur without disruptions to our operations. Any of these events could have a material adverse effect on our business, financial condition, results of operations and cash flows.
9
We operate in regulated industries.
Our U.S. operations are subject to regulation by the U.S. Department of Transportation with respect to safety of operations and equipment and financial responsibility. Intrastate operations in the U.S. are subject to regulation by state regulatory authorities and interprovincial operations in Canada are subject to regulation by Canadian and provincial regulatory authorities. Our other international operations are regulated to varying degrees by the countries in which we operate. Many countries have permit requirements for security services and prohibit foreign companies from providing different types of security services.
Changes in laws or regulations could require a change in the way we operate, which could increase costs or otherwise disrupt operations. In addition, failure to comply with any applicable laws or regulations could result in substantial fines or revocation of our operating permits and licenses. If laws and regulations were to change or we failed to comply, our business, financial condition, results of operations and cash flows could be materially and adversely affected.
Our inability to access capital or significant increases in our cost of capital could adversely affect our business.
Our ability to obtain adequate and cost-effective financing depends on our credit quality as well as the liquidity of financial markets. A negative change in our ratings outlook or any downgrade in our credit ratings by the rating agencies could adversely affect our cost and/or access to sources of liquidity and capital. Additionally, such a downgrade could increase the costs of borrowing under available credit lines. Disruptions in the capital and credit markets could adversely affect our ability to access short-term and long-term capital. Our access to funds under current credit facilities is dependent on the ability of the participating banks to meet their funding commitments. Those banks may not be able to meet their funding commitments if they experience shortages of capital and liquidity. Longer disruptions in the capital and credit markets as a result of uncertainty, changing or increased regulation, reduced alternatives, or failures of significant financial institutions could adversely affect our access to capital needed for our business.
We are subject to covenants for our credit facilities, our unsecured notes and our unsecured term loan.
Our credit facilities as well as our unsecured notes and our unsecured term loan are subject to financial covenants, including a limit on the ratio of debt to earnings before interest, taxes, depreciation, and amortization, limits on the ability to pledge assets, limits on the total amount of indebtedness we can incur, limits on the use of proceeds of asset sales and minimum coverage of interest costs. Although we believe none of these covenants are presently restrictive to operations, the ability to meet the financial covenants can be affected by changes in our results of operations or financial condition. We cannot provide assurance that we will meet these covenants. A breach of any of these covenants could result in a default under existing credit facilities. Upon the occurrence of an event of default under any of our credit facilities, the lenders could cause amounts outstanding to be immediately payable and terminate all commitments to extend further credit. The occurrence of these events would have a significant effect on our liquidity and cash flows.
Our effective income tax rate could change.
We operate subsidiaries in 40 countries, all of which have different income tax laws and associated income tax rates. Our effective income tax rate can be significantly affected by changes in the mix of pretax earnings by country and the related income tax rates in those countries. In addition, our effective income tax rate is significantly affected by the ability to realize deferred tax assets, including those associated with net operating losses. Changes in income tax laws, income apportionment, or estimates of the ability to realize deferred tax assets, could significantly affect our effective income tax rate, financial position and results of operations. The recent proposals to lower the U.S. corporate income tax rate would require us to recognize a significant income tax expense to reduce the U.S. deferred tax asset, if such a proposal is enacted into law. We are subject to the regular examination of our income tax returns by various tax authorities. We regularly assess the likelihood of adverse outcomes resulting from these examinations to determine the adequacy of our provision for income taxes. There can be no assurance that the outcomes from these examinations will not have a material adverse effect on our business.
We have certain environmental and other exposures related to our former coal operations.
We may incur future environmental and other liabilities in connection with our former coal operations, which could materially and adversely affect our financial condition, results of operations and cash flows.
We may be exposed to certain regulatory and financial risks related to climate change.
Growing concerns about climate change may result in the imposition of additional environmental regulations to which we are subject. Some form of federal regulation may be forthcoming with respect to greenhouse gas emissions (including carbon dioxide) and/or "cap and trade" legislation. The outcome of this legislation may result in new regulation, additional charges to fund energy efficiency activities or other regulatory actions. Compliance with these actions could result in the creation of additional costs to us, including, among other things, increased fuel prices or additional taxes or emission allowances. We may not be able to recover the cost of compliance with new or more stringent environmental laws and regulations from our customers, which could adversely affect our business. Furthermore, the potential effects of climate change and related regulation on our customers are highly uncertain and may adversely affect our operations.
10
Forward-Looking Statements
This document contains both historical and forward-looking information. Words such as “anticipates,” “assumes,” “estimates,” “expects,” “projects,” “predicts,” “intends,” “plans,” “potential,” “believes,” “may,” “should” and similar expressions may identify forward-looking information. Forward-looking information in this document includes, but is not limited to, statements regarding future performance of The Brink’s Company and its global operations, including: execution of our business strategy; anticipated savings from reorganization and restructuring activities; amortization expense for finite-lived intangibles; the repatriation of cash from our Venezuelan operations; restrictions on foreign currency convention, the anticipated financial effect of pending litigation; the realization of deferred tax assets; the reinvestment of earnings on operations outside the United States; the ability to meet liquidity needs; expenses and payouts for the U.S. retirement plans and the non-U.S. pension plans and the expected long-term rate of return and funded status of the primary U.S. pension plan; compensation cost related to certain equity awards; expected liability for and future contributions to the UMWA plans, liability for black lung obligations; the projected impact of future excise tax on the UMWA plans, our ability to obtain U.S. dollars to operate our business in Venezuela and the impact of future events or actions on the carrying value of long-lived assets in Venezuela and the reclassification of accumulated other comprehensive losses related to our Venezuela operations into earnings; the performance of counterparties to hedging agreements; the recognition of unrecognized tax positions; expected future payments under contractual obligations, and the impact of recent accounting pronouncements. Forward-looking information in this document is subject to known and unknown risks, uncertainties, and contingencies, which are difficult to quantify and which could cause actual results, performance or achievements to differ materially from those that are anticipated.
These risks, uncertainties and contingencies, many of which are beyond our control, include, but are not limited to:
• | our ability to improve profitability in our largest five markets; |
• | our ability to identify and execute further cost and operational improvements and efficiencies in our core businesses; |
• | continuing market volatility and commodity price fluctuations and their impact on the demand for our services; |
• | our ability to maintain or improve volumes at favorable pricing levels and increase cost and productivity efficiencies, particularly in the United States and Mexico; |
• | investments in information technology and adjacent businesses and their impact on revenues and profit growth; |
• | our ability to develop and implement solutions for our customers and gain market acceptance of those solutions; |
• | our ability to maintain an effective IT infrastructure and safeguard confidential information; |
• | risks customarily associated with operating in foreign countries including changing labor and economic conditions, currency restrictions and devaluations, safety and security issues, political instability, restrictions on repatriation of earnings and capital, nationalization, expropriation and other forms of restrictive government actions; |
• | the strength of the U.S. dollar relative to foreign currencies and foreign currency exchange rates; |
• | the stability of the Venezuelan economy, changes in Venezuelan policy regarding foreign-owned businesses; |
• | regulatory and labor issues in many of our global operations, including negotiations with organized labor and the possibility of work stoppages; |
• | our ability to integrate successfully recently acquired companies and improve their operating profit margins; |
• | costs related to dispositions and market exits; |
• | our ability to identify evaluate and pursue acquisitions and other strategic opportunities; |
• | the willingness of our customers to absorb fuel surcharges and other future price increases; |
• | our ability to obtain necessary information technology and other services at favorable pricing levels from third party service providers; |
• | variations in costs or expenses and performance delays of any public or private sector supplier, service provider or customer; |
• | our ability to obtain appropriate insurance coverage, positions taken by insurers with respect to claims made and the financial condition of insurers, safety and security performance, our loss experience, and changes in insurance costs; |
• | security threats worldwide and losses of customer valuables; |
• | costs associated with the purchase and implementation of cash processing and security equipment; |
• | employee, environmental and other liabilities in connection with our former coal operations, including black lung claims incidence; |
• | the impact of the Patient Protection and Affordable Care Act on black lung liability and the Company's ongoing operations; |
• | changes to estimated liabilities and assets in actuarial assumptions due to payments made, investment returns, interest rates and annual actuarial revaluations, the funding requirements, accounting treatment, investment performance and costs and expenses of our pension plans, the VEBA and other employee benefits, mandatory or voluntary pension plan contributions; |
• | the nature of our hedging relationships; |
• | changes in estimates and assumptions underlying our critical accounting policies; |
• | our ability to realize deferred tax assets; |
• | the outcome of pending and future claims, litigation, and administrative proceedings; |
• | public perception of the Company's business and reputation; |
• | access to the capital and credit markets; |
• | seasonality, pricing and other competitive industry factors; and |
• | the promulgation and adoption of new accounting standards and interpretations, new government regulations and interpretation of existing regulations. |
The information included in this document is representative only as of the date of this document, and The Brink’s Company undertakes no obligation to update any information contained in this document.
11
ITEM 1B. UNRESOLVED STAFF COMMENTS
Not applicable.
12
ITEM 2. PROPERTIES
We have property and equipment in locations throughout the world. Branch facilities generally have office space to support operations, a vault to securely process and store valuables and a garage to house armored vehicles and serve as a vehicle terminal. Many branches have additional space to repair and maintain vehicles.
We own or lease armored vehicles, panel trucks and other vehicles that are primarily service vehicles. Our armored vehicles are of bullet-resistant construction and are specially designed and equipped to provide security for the crew and cargo.
The following table discloses leased and owned facilities and vehicles for Brink’s most significant operations as of December 31, 2016.
Facilities | Vehicles | ||||||||||||||||
Leased | Owned | Total | Leased | Owned | Total | ||||||||||||
Largest 5 Markets | |||||||||||||||||
U.S. | 121 | 25 | 146 | 2,076 | 138 | 2,214 | |||||||||||
France | 83 | 33 | 116 | 835 | 535 | 1,370 | |||||||||||
Mexico | 72 | 57 | 129 | 91 | 2,160 | 2,251 | |||||||||||
Brazil | 66 | 3 | 69 | 422 | 836 | 1,258 | |||||||||||
Canada | 38 | 15 | 53 | 493 | 8 | 501 | |||||||||||
Global Markets | |||||||||||||||||
Latin America | 108 | 27 | 135 | — | 1,213 | 1,213 | |||||||||||
EMEA | 118 | 3 | 121 | 589 | 739 | 1,328 | |||||||||||
Asia | 166 | — | 166 | 4 | 652 | 656 | |||||||||||
Payment Services | 38 | — | 38 | 100 | 8 | 108 | |||||||||||
Corporate Items | 6 | — | 6 | — | — | — | |||||||||||
Venezuela | 40 | 29 | 69 | — | 1,032 | 1,032 | |||||||||||
Total | 856 | 192 | 1,048 | 4,610 | 7,321 | 11,931 | |||||||||||
As of December 31, 2016, we had approximately 22,900 units for our CompuSafe® service installed worldwide, of which approximately 16,300 units were located in the U.S.
ITEM 3. LEGAL PROCEEDINGS
For a discussion of legal proceedings, see Note 22 to the consolidated financial statements, “Other Commitments and Contingencies,” in Part II, Item 8 of this 10-K.
ITEM 4. MINE SAFETY DISCLOSURES
Not applicable.
13
Executive Officers of the Registrant
The following is a list as of February 23, 2017, of the names and ages of the executive officers of The Company indicating the principal positions and offices held by each. There are no family relationships among any of the officers named.
Name | Age | Positions and Offices Held | Held Since | |||
Douglas A. Pertz | 62 | Director, President and Chief Executive Officer | 2016 | |||
Ronald J. Domanico | 58 | Executive Vice President, Chief Financial Officer and Treasurer | 2016 | |||
Michael F. Beech | 55 | Executive Vice President | 2014 | |||
McAlister C. Marshall, II | 47 | Senior Vice President, General Counsel and Chief Administrative Officer | 2008 | |||
Rohan Pal | 51 | Senior Vice President, Chief Information Officer and Chief Digital Officer | 2016 | |||
Amit Zukerman | 45 | Executive Vice President | 2014 | |||
Executive and other officers of the Company are elected annually and serve at the pleasure of the Board.
Mr. Pertz was appointed President and Chief Executive Officer of the Company in June 2016. Before joining the Company, Mr. Pertz served as president and CEO of Recall Holdings Limited, a global provider of digital and physical information management and security services, from 2013 until 2016. Prior to joining Recall, Mr. Pertz served as a partner with Bolder Capital, LLC (a private equity firm) from 2011 to 2013.
Mr. Domanico was appointed Executive Vice President and Chief Financial Officer of the Company in July 2016 and was appointed Treasurer in January 2017. Before joining Brink’s, Mr. Domanico served as senior vice president, strategic initiatives and capital markets at Recall Holdings Limited, a global provider of digital and physical information management and security services. From 2010 to 2014, he was senior vice president and CFO for HD Supply, one of the largest industrial distributors in North America.
Mr. Beech was appointed Executive Vice President of the Company in December 2014. He has oversight responsibility for the Company's Brazil and Mexico operations as well as global safety and security. From December 2014 to July 2016, Mr. Beech had oversight responsibility for the Company's operations in the Largest 5 Markets. He served as President, Europe, Middle East and Africa for the Company’s operating subsidiary, Brink’s, Incorporated, from 2011 to December 2014, as President, Asia Pacific from 2011 to 2012 and as Vice President, Global Security from 2009 to 2011.
Mr. Marshall was appointed Vice President and General Counsel of the Company in September 2008 and was appointed Senior Vice President in July 2016 and Chief Administrative Officer in January 2017. He also previously held the office of Secretary from June 2012 to November 2013.
Rohan Pal was appointed Senior Vice President, Chief Information Officer and Chief Digital Officer of the Company in July 2016. Before joining Brink’s, Mr. Pal served as senior vice president and chief information officer/chief digital officer at Recall Holdings Limited, a global provider of digital and physical information management and security services from June 2013 to June 2016. From 2008 to 2013, he served as vice president and chief information officer for Tyco Fire Protection Products.
Mr. Zukerman was appointed as the Company’s Executive Vice President in December 2014. He has oversight responsibility for the Company's operations in the Global Markets and its Brink's Global Services Business. He served as President, Brink’s Global Services and Asia Pacific for the Company’s operating subsidiary, Brink’s, Incorporated, from 2012 to December 2014 and as President, Brink’s Global Services from 2008 to 2012.
14
PART II |
ITEM 5. MARKET FOR REGISTRANT’S COMMON EQUITY, RELATED STOCKHOLDER MATTERS AND ISSUER PURCHASES OF EQUITY SECURITIES
Our common stock trades on the New York Stock Exchange under the symbol “BCO.” As of February 20, 2017, there were 1,464 shareholders of record of common stock.
The dividends declared and the high and low prices of our common stock for each full quarterly period within the last two years are as follows:
2015 Quarters | 2016 Quarters | ||||||||||||||||||||||||
1st | 2nd | 3rd | 4th | 1st | 2nd | 3rd | 4th | ||||||||||||||||||
Dividends declared per common share | $ | 0.1000 | 0.1000 | 0.1000 | 0.1000 | $ | 0.1000 | 0.1000 | 0.1000 | 0.1000 | |||||||||||||||
Stock prices: | |||||||||||||||||||||||||
High | $ | 28.98 | 33.62 | 31.76 | 33.37 | $ | 34.13 | 35.35 | 37.92 | 45.10 | |||||||||||||||
Low | 22.24 | 25.99 | 25.80 | 26.87 | 25.87 | 26.86 | 26.96 | 36.24 | |||||||||||||||||
See Note 17 to the consolidated financial statements for a description of limitations of our ability to pay dividends in the future.
15
The following graph compares the cumulative 5-year total return provided to shareholders of The Brink’s Company’s common stock compared to the cumulative total returns of the S&P SmallCap 600 Index and the S&P 600 Commercial & Professional Services Index. The graph tracks the performance of a $100 investment in our common stock and in each index from December 31, 2011, through December 31, 2016. The performance of The Brink’s Company’s common stock assumes that the shareholder reinvested all dividends received during the period.
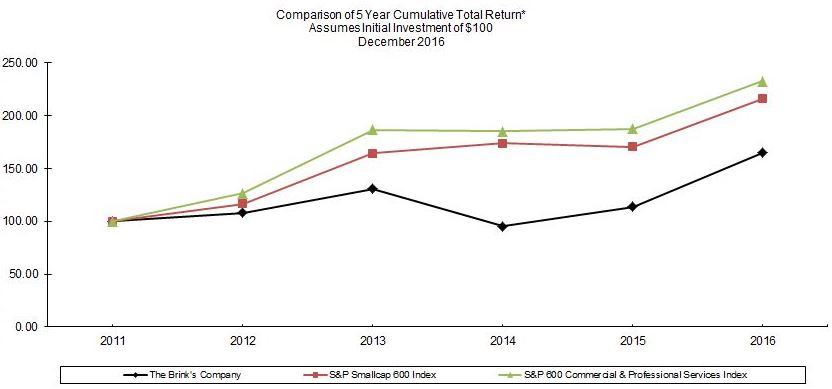
*$100 invested on 12/31/11 in stock or index, including reinvestment of dividends
Fiscal Year ending December 31.
Source: Zacks Investment Research, Inc.
Comparison of Five-Year Cumulative Total Return(a)
Years Ended December 31, | ||||||||||||||||||
2011 | 2012 | 2013 | 2014 | 2015 | 2016 | |||||||||||||
The Brink's Company | $ | 100.00 | 107.83 | 130.82 | 94.97 | 113.86 | 164.77 | |||||||||||
S&P SmallCap 600 Index | 100.00 | 116.33 | 164.38 | 173.84 | 170.41 | 215.67 | ||||||||||||
S&P 600 Commercial & Professional Services Index | 100.00 | 126.37 | 186.71 | 184.98 | 187.37 | 232.24 | ||||||||||||
(a) | For the line designated as “The Brink’s Company” the graph depicts the cumulative return on $100 invested in The Brink’s Company’s common stock at December 31, 2011. The cumulative return for each index is measured on an annual basis for the periods from December 31, 2011, through December 31, 2016, with the value of each index set to $100 on December 31, 2011. Total return assumes reinvestment of dividends. We chose the S&P SmallCap 600 Index and the S&P 600 Commercial & Professional Services Index as appropriate comparisons. We believe that these indices broadly measure the performance of small-cap companies in the United States market and for a smaller subset of small-cap companies in the commercial services industry, respectively. |
16
ITEM 6. SELECTED FINANCIAL DATA
Five Years in Review
GAAP Basis | |||||||||||||||
(In millions, except for per share amounts) | 2016 | 2015 | 2014 | 2013 | 2012 | ||||||||||
Revenues | $ | 3,020.6 | 3,061.4 | 3,562.3 | 3,778.6 | 3,577.6 | |||||||||
Operating profit (loss) | 144.2 | 56.6 | (27.5 | ) | 163.2 | 162.2 | |||||||||
Income (loss) attributable to Brink’s | |||||||||||||||
Continuing operations | $ | 36.2 | (9.1 | ) | (54.8 | ) | 66.0 | 102.3 | |||||||
Discontinued operations | (1.7 | ) | (2.8 | ) | (29.1 | ) | (9.2 | ) | (13.4 | ) | |||||
Net income (loss) attributable to Brink’s | $ | 34.5 | (11.9 | ) | (83.9 | ) | 56.8 | 88.9 | |||||||
Financial Position | |||||||||||||||
Property and equipment, net | $ | 531.0 | 549.0 | 669.5 | 758.7 | 793.8 | |||||||||
Total assets | 1,994.8 | 1,946.7 | 2,192.0 | 2,497.4 | 2,553.1 | ||||||||||
Long-term debt, less current maturities | 247.6 | 358.1 | 373.1 | 329.9 | 334.8 | ||||||||||
Brink’s shareholders’ equity | 337.1 | 317.9 | 434.0 | 693.9 | 501.8 | ||||||||||
Supplemental Information | |||||||||||||||
Depreciation and amortization | $ | 131.6 | 139.9 | 161.9 | 165.8 | 148.4 | |||||||||
Capital expenditures | 112.2 | 101.1 | 136.1 | 172.9 | 170.9 | ||||||||||
Earnings (loss) per share attributable to Brink’s common shareholders | |||||||||||||||
Basic: | |||||||||||||||
Continuing operations | $ | 0.72 | (0.19 | ) | (1.12 | ) | 1.36 | 2.12 | |||||||
Discontinued operations | (0.03 | ) | (0.06 | ) | (0.59 | ) | (0.19 | ) | (0.28 | ) | |||||
Net income (loss) | 0.69 | (0.24 | ) | (1.71 | ) | 1.17 | 1.84 | ||||||||
Diluted: | |||||||||||||||
Continuing operations | $ | 0.72 | (0.19 | ) | (1.12 | ) | 1.35 | 2.11 | |||||||
Discontinued operations | (0.03 | ) | (0.06 | ) | (0.59 | ) | (0.19 | ) | (0.28 | ) | |||||
Net income (loss) | 0.68 | (0.24 | ) | (1.71 | ) | 1.16 | 1.83 | ||||||||
Cash dividends | $ | 0.40 | 0.40 | 0.40 | 0.40 | 0.40 | |||||||||
Weighted-average Shares | |||||||||||||||
Basic | 50.0 | 49.3 | 49.0 | 48.7 | 48.4 | ||||||||||
Diluted | 50.6 | 49.3 | 49.0 | 49.0 | 48.6 | ||||||||||
Non-GAAP Basis* | |||||||||||||||
(In millions, except for per share amounts) | 2016 | 2015 | 2014 | 2013 | 2012 | ||||||||||
Non-GAAP revenues | $ | 2,908.4 | 2,976.9 | 3,350.5 | 3,331.5 | 3,235.0 | |||||||||
Non-GAAP operating profit | 206.5 | 156.8 | 124.2 | 147.0 | 166.7 | ||||||||||
Amounts attributable to Brink’s | |||||||||||||||
Non-GAAP income from continuing operations | $ | 113.1 | 84.2 | 49.4 | 61.1 | 78.1 | |||||||||
Non-GAAP diluted EPS – continuing operations | $ | 2.24 | 1.69 | 1.01 | 1.25 | 1.61 | |||||||||
*Reconciliations to GAAP results are found beginning on page 36.
17
ITEM 7. MANAGEMENT’S DISCUSSION AND ANALYSIS OF FINANCIAL CONDITION AND RESULTS OF OPERATIONS
THE BRINK’S COMPANY
MANAGEMENT’S DISCUSSION AND ANALYSIS OF
FINANCIAL CONDITION AND RESULTS OF OPERATIONS
FOR THE YEAR ENDED DECEMBER 31, 2016
TABLE OF CONTENTS
Page | ||
Analysis of Results: 2016 versus 2015 | ||
Analysis of Results: 2015 versus 2014 | ||
18
OPERATIONS
The Brink’s Company offers transportation and logistics management services for cash and valuables throughout the world. These services include:
• | Cash-in-Transit (“CIT”) Services – armored vehicle transportation of valuables |
• | ATM Services – replenishing and maintaining customers’ automated teller machines; providing network infrastructure services |
• | Global Services – secure international transportation of valuables |
• | Cash Management Services |
◦ | Currency and coin counting and sorting; deposit preparation and reconciliations; other cash management services |
◦ | Safe and safe control device installation and servicing (including our patented CompuSafe® service) |
◦ | Check and cash processing services for banking customers (“Virtual Vault Services”) |
◦ | Check imaging services for banking customers |
• | Payment Services – bill payment and processing services on behalf of utility companies and other billers at any of our Brink’s or Brink’s – operated payment locations in Latin America and Brink’s Money™ general purpose reloadable prepaid cards and payroll cards in the U.S. |
• | Commercial Security Systems Services – design and installation of security systems in designated markets in Europe |
• | Guarding Services – protection of airports, offices, and certain other locations in Europe and Brazil with or without electronic surveillance, access control, fire prevention and highly trained patrolling personnel |
We have nine operating segments:
• | Each of the five countries within Largest 5 Markets (U.S., France, Mexico, Brazil and Canada) |
• | Each of the three regions within Global Markets (Latin America, EMEA and Asia) |
• | Payment Services |
We believe that Brink’s has significant competitive advantages including:
• | track record of refining our business portfolio to deliver shareholder value |
• | medium-term growth drivers from high-value services |
• | global footprint in a world with increasing security needs |
• | brand name recognition |
• | reputation for a high level of service and security |
• | risk management and logistics expertise |
• | value-based solutions expertise |
• | proven operational excellence |
• | high-quality insurance coverage and general financial strength |
We focus our time and resources on service quality, protecting and strengthening our brand, and addressing our risks. Our marketing and sales efforts are enhanced by the “Brink’s” brand, so we seek to protect and build its value. Because our services focus on handling, transporting, protecting and managing valuables, we strive to understand and manage risk.
In order to earn an adequate return on capital, we focus on the effective and efficient use of resources in addition to our pricing discipline. We attempt to maximize the amount of business that flows through our branches, vehicles and systems in order to obtain the lowest costs possible without compromising safety, security or service.
Operating results may vary from period to period. Because revenues are generated from charges per service performed or based on the value of goods transported, they can be affected by both the level of economic activity and the volume of business for specific customers. We also periodically incur costs to change the scale of our operations when volumes increase or decrease. Incremental costs incurred usually relate to increasing or decreasing the number of employees and increasing or decreasing branches or administrative facilities. In addition, security costs can vary depending on performance, the cost of insurance coverage, and changes in crime rates (i.e., attacks and robberies).
Brink’s revenues and related operating profit are generally higher in the second half of the year, particularly in the fourth quarter, due to generally increased economic activity associated with the holiday season.
19
RESULTS OF OPERATIONS
Analysis of Results: 2016 versus 2015
Consolidated Results
GAAP and Non-GAAP Financial Measures We provide an analysis of our operations below on both a generally accepted accounting principles (“GAAP”) and non-GAAP basis. The purpose of the non-GAAP information is to report our operating profit, income from continuing operations and earnings per share without certain income and expense items that do not reflect the ordinary earnings of our operations and to reflect a constant tax rate for quarterly results equal to the full-year non-GAAP tax rate. The non-GAAP financial measures are intended to provide information to assist comparability and estimates of future performance. The non-GAAP adjustments used to reconcile our GAAP results are described in detail on page 36.
Definition of Organic Growth Organic growth represents the change in revenues or operating profit between the current and prior period, excluding the effect of: acquisitions and dispositions, changes in currency exchange rates (as described on page 22) and the accounting effects of reporting Venezuela under highly inflationary accounting.
Years Ended December 31, | 2016 | 2015 | % Change | ||||||
(In millions, except for per share amounts) | |||||||||
GAAP | |||||||||
Revenues | $ | 3,020.6 | 3,061.4 | (1 | ) | ||||
Cost of revenues | 2,424.8 | 2,471.6 | (2 | ) | |||||
Selling, general and administrative expenses | 431.5 | 463.8 | (7 | ) | |||||
Operating profit | 144.2 | 56.6 | fav | ||||||
Income (loss) from continuing operations(a) | 36.2 | (9.1 | ) | fav | |||||
Diluted EPS from continuing operations(a) | $ | 0.72 | (0.19 | ) | fav | ||||
Non-GAAP(b) | |||||||||
Non-GAAP revenues | $ | 2,908.4 | 2,976.9 | (2 | ) | ||||
Non-GAAP operating profit | 206.5 | 156.8 | 32 | ||||||
Non-GAAP income from continuing operations(a) | 113.1 | 84.2 | 34 | ||||||
Non-GAAP diluted EPS from continuing operations(a) | $ | 2.24 | 1.69 | 33 | |||||
(a) | Amounts reported in this table are attributable to the shareholders of Brink’s and exclude earnings related to noncontrolling interests. |
(b) | Non-GAAP results are reconciled to the applicable GAAP results on pages 36–37. |
GAAP Basis
Analysis of Consolidated Results: 2016 versus 2015
Consolidated Revenues Revenues decreased $40.8 million or 1% due to unfavorable changes in currency exchange rates ($399.6 million), the impact of dispositions ($34.3 million), and an organic decrease in EMEA ($9.4 million) and France ($5.6 million), partially offset by organic growth in Venezuela ($226.4 million), Latin America ($92.1 million), Brazil ($28.9 million), the U.S. ($22.2 million) and Mexico ($15.6 million). A significant portion of the reduction in revenues from currency exchange rates relates to a devaluation of the Venezuelan bolivar after February 2016. The U.S. dollar also strengthened against the Mexican peso, Brazilian real, and most currencies in Latin America. Revenues increased 13% on an organic basis due mainly to higher average selling prices in Venezuela and Latin America (including the effects of inflation). See above for our definition of “organic.”
Consolidated Costs and Expenses Cost of revenues decreased 2% to $2,424.8 million as changes in currency rates more than offset higher labor costs from inflation-based increases. Selling, general and administrative costs decreased 7% to $431.5 million due primarily to changes in currency exchange rates.
Consolidated Operating Profit Operating profit increased $87.6 million due mainly to:
• | a $35.3 million charge in 2015 related to impairment of fixed assets in Venezuela, which did not reoccur in 2016, |
• | an organic increase in Venezuela ($82.5 million), Latin America ($45.1 million), Payment Services ($9.1 million), and Brazil ($6.4 million), and |
• | lower corporate expenses ($13.4 million on an organic basis), |
partially offset by:
• | unfavorable changes in currency exchange rates ($73.3 million), including the effects of Venezuela devaluations, |
• | higher reorganization and restructuring costs in 2016 ($15.0 million), |
• | negative impact of exiting operations in Ireland ($10.5 million), and |
• | organic decreases in the U.S. ($8.8 million). |
20
Consolidated Income (Loss) from Continuing Operations Attributable to Brink’s and Related Per Share Amounts Income from continuing operations attributable to Brink’s shareholders in 2016 improved $45.3 million from the prior year primarily due to the operating profit increase mentioned above, partially offset by higher income attributable to noncontrolling interests ($26.6 million) and higher income tax expense ($12.0 million). Earnings per share from continuing operations was $0.72, up from negative $0.19 in 2015.
Non-GAAP Basis
Analysis of Consolidated Results: 2016 versus 2015
Non-GAAP Consolidated Revenues Non-GAAP revenues decreased $68.5 million or 2% due to unfavorable changes in currency exchange rates ($198.1 million), the impact of dispositions ($37.1 million), and an organic decrease in EMEA ($9.4 million) and France ($5.6 million), partially offset by organic growth in Latin America ($92.1 million), Brazil ($28.9 million), the U.S. ($22.2 million) and Mexico ($15.6 million). The reduction in non-GAAP revenues from currency exchange rates relates to a strengthening of the U.S. dollar against the Mexican peso, Brazilian real, and most currencies in Latin America. Non-GAAP revenues increased 6% on an organic basis due mainly to higher average selling prices in Latin America (including the effects of inflation). See page 20 for our definition of “organic.”
Non-GAAP Consolidated Operating Profit Non-GAAP operating profit increased $49.7 million in 2016 due mainly to:
• | an organic increase in Latin America ($45.1 million), Payment Services ($9.1 million), and Brazil ($6.4 million), and |
• | lower corporate expenses ($13.4 million on an organic basis), |
partially offset by:
• | unfavorable changes in currency exchange rates ($22.4 million), and |
• | organic decreases in the U.S. ($8.8 million). |
Non-GAAP Consolidated Income from Continuing Operations Attributable to Brink’s and Related Per Share Amounts Non-GAAP income from continuing operations attributable to Brink’s shareholders in 2016 increased $28.9 million to $113.1 million primarily due to the non-GAAP operating profit increase mentioned above, partially offset by the corresponding higher non-GAAP income tax expense ($16.8 million). Non-GAAP earnings per share from continuing operations was $2.24, up from $1.69 in 2015.
21
Revenues and Operating Profit by Segment: 2016 versus 2015
Organic | Acquisitions / | % Change | ||||||||||||||||||||
(In millions) | 2015 | Change | Dispositions(a) | Currency(b) | 2016 | Total | Organic | |||||||||||||||
Revenues: | ||||||||||||||||||||||
U.S. | $ | 730.4 | 22.2 | — | — | 752.6 | 3 | 3 | ||||||||||||||
France | 431.5 | (5.6 | ) | — | (1.4 | ) | 424.5 | (2 | ) | (1 | ) | |||||||||||
Mexico | 333.0 | 15.6 | — | (53.3 | ) | 295.3 | (11 | ) | 5 | |||||||||||||
Brazil | 270.4 | 28.9 | — | (13.6 | ) | 285.7 | 6 | 11 | ||||||||||||||
Canada | 153.7 | 2.1 | — | (5.6 | ) | 150.2 | (2 | ) | 1 | |||||||||||||
Largest 5 Markets | 1,919.0 | 63.2 | — | (73.9 | ) | 1,908.3 | (1 | ) | 3 | |||||||||||||
Latin America | 369.9 | 92.1 | — | (106.9 | ) | 355.1 | (4 | ) | 25 | |||||||||||||
EMEA | 444.7 | (9.4 | ) | (37.1 | ) | (10.8 | ) | 387.4 | (13 | ) | (2 | ) | ||||||||||
Asia | 157.4 | 11.6 | — | (1.5 | ) | 167.5 | 6 | 7 | ||||||||||||||
Global Markets | 972.0 | 94.3 | (37.1 | ) | (119.2 | ) | 910.0 | (6 | ) | 10 | ||||||||||||
Payment Services | 85.9 | 9.2 | — | (5.0 | ) | 90.1 | 5 | 11 | ||||||||||||||
Revenues - non-GAAP | 2,976.9 | 166.7 | (37.1 | ) | (198.1 | ) | 2,908.4 | (2 | ) | 6 | ||||||||||||
Other items not allocated to segments(d) | 84.5 | 226.4 | 2.8 | (201.5 | ) | 112.2 | 33 | fav | ||||||||||||||
Revenues - GAAP | $ | 3,061.4 | $ | 393.1 | (34.3 | ) | (399.6 | ) | 3,020.6 | (1 | ) | 13 | ||||||||||
Operating profit: | ||||||||||||||||||||||
U.S. | $ | 15.1 | (8.8 | ) | — | — | 6.3 | (58 | ) | (58 | ) | |||||||||||
France | 34.7 | 2.1 | — | — | 36.8 | 6 | 6 | |||||||||||||||
Mexico | 24.2 | (0.1 | ) | — | (3.7 | ) | 20.4 | (16 | ) | — | ||||||||||||
Brazil | 23.8 | 6.4 | — | (0.1 | ) | 30.1 | 26 | 27 | ||||||||||||||
Canada | 10.7 | (2.2 | ) | — | (0.2 | ) | 8.3 | (22 | ) | (21 | ) | |||||||||||
Largest 5 Markets | 108.5 | (2.6 | ) | — | (4.0 | ) | 101.9 | (6 | ) | (2 | ) | |||||||||||
Latin America | 76.3 | 45.1 | — | (31.5 | ) | 89.9 | 18 | 59 | ||||||||||||||
EMEA | 35.7 | 1.1 | 4.2 | (0.9 | ) | 40.1 | 12 | 3 | ||||||||||||||
Asia | 28.7 | 1.8 | — | — | 30.5 | 6 | 6 | |||||||||||||||
Global Markets | 140.7 | 48.0 | 4.2 | (32.4 | ) | 160.5 | 14 | 34 | ||||||||||||||
Payment Services | (7.2 | ) | 9.1 | — | 0.4 | 2.3 | fav | fav | ||||||||||||||
Corporate expenses(c) | (85.2 | ) | 13.4 | — | 13.6 | (58.2 | ) | (32 | ) | (16 | ) | |||||||||||
Operating profit - non-GAAP | 156.8 | 67.9 | 4.2 | (22.4 | ) | 206.5 | 32 | 43 | ||||||||||||||
Other items not allocated to segments(d) | (100.2 | ) | 96.6 | (7.8 | ) | (50.9 | ) | (62.3 | ) | (38 | ) | (96 | ) | |||||||||
Operating profit (loss) - GAAP | $ | 56.6 | 164.5 | (3.6 | ) | (73.3 | ) | 144.2 | fav | fav | ||||||||||||
Amounts may not add due to rounding.
(a) | Includes operating results and gains/losses on acquisitions and dispositions of assets and of businesses. The 2014 divestiture of an equity interest in a business in Peru is included in “Other items not allocated to segments”. |
(b) | The amounts in the “Currency” column consist of the effects of Venezuela devaluations and the sum of monthly currency changes. Monthly currency changes represent the accumulation throughout the year of the impact on current period results of changes in foreign currency rates from the prior year period. |
(c) | Corporate expenses are not allocated to segment results. Corporate expenses include salaries and other costs to manage the global business and to perform activities required by public companies. |
(d) | See pages 28–30 for more information. |
22
Analysis of Segment Results: 2016 versus 2015
Largest 5 Markets
U.S. Revenues increased 3% ($22.2 million) due to organic revenue growth as a result of volume increases, driven by the increased sales of cash recyclers to a large retailer. Operating profit decreased $8.8 million to $6.3 million due to higher fleet and insurance costs.
France Revenues decreased 2% ($7.0 million) due to volume and pricing pressure, the loss of an airport guarding contract, and unfavorable currency ($1.4 million). Operating profit increased 6% ($2.1 million) due to growth in cash management and a benefit recognized related to social charges.
Mexico Revenues decreased 11% ($37.7 million) due to unfavorable currency impact ($53.3 million), partially offset by a 5% organic increase ($15.6 million) from price and volume increases. Operating profit decreased ($3.8 million) due primarily to unfavorable currency ($3.7 million).
Brazil Revenues increased 6% ($15.3 million) due to 11% organic growth ($28.9 million) driven by price increases, partially offset by the negative impact of currency exchange rates ($13.6 million). Operating profit increased 26% ($6.3 million), driven by organic growth ($6.4 million) on a favorable tax ruling and productivity improvements.
Canada Revenues decreased 2% ($3.5 million) primarily due to the negative impact of currency exchange rates ($5.6 million). Operating profit decreased 22% ($2.4 million) driven by inflationary cost increases and low organic revenue growth.
Global Markets
Latin America Revenues decreased 4% ($14.8 million) as the negative impact of currency exchange rates ($106.9 million) was partially offset by organic growth of 25% ($92.1 million) driven by inflation-based price increases in Argentina. Operating profit increased 18% ($13.6 million) due to higher organic results in Argentina and Chile, partially offset by unfavorable currency impact ($31.5 million).
EMEA Revenues decreased 13% ($57.3 million) due to the impact of dispositions ($37.1 million), unfavorable currency ($10.8 million), and organic revenue decreases throughout the region ($9.4 million) on lower BGS volumes. Operating profit increased 12% ($4.4 million) due to the favorable impact of dispositions ($4.2 million) and slightly higher organic results ($1.1 million), partially offset by unfavorable currency ($0.9 million).
Asia Revenues increased 6% ($10.1 million) due to mainly to organic growth in Hong Kong and Singapore. Operating profit increased 6% ($1.8 million) primarily due to revenue growth.
Payment Services
Payment Services Revenues increased 5% ($4.2 million) as negative currency ($5.0 million) was more than offset by 11% organic growth ($9.2 million). Operating profit increased $9.5 million, driven by revenue growth and lower marketing expenditures related to increasing cardholders in the U.S. Payments business.
23
Analysis of Results: 2015 versus 2014
Consolidated Results
Years Ended December 31, | 2015 | 2014 | % Change | ||||||
(In millions, except for per share amounts) | |||||||||
GAAP | |||||||||
Revenues | $ | 3,061.4 | 3,562.3 | (14 | ) | ||||
Cost of revenues | 2,471.6 | 2,948.2 | (16 | ) | |||||
Selling, general and administrative expenses | 463.8 | 560.6 | (17 | ) | |||||
Operating profit (loss) | 56.6 | (27.5 | ) | fav | |||||
Income (loss) from continuing operations(a) | (9.1 | ) | (54.8 | ) | (83 | ) | |||
Diluted EPS from continuing operations(a) | $ | (0.19 | ) | (1.12 | ) | (83 | ) | ||
Non-GAAP(b) | |||||||||
Non-GAAP revenues | $ | 2,976.9 | 3,350.5 | (11 | ) | ||||
Non-GAAP operating profit | 156.8 | 124.2 | 26 | ||||||
Non-GAAP income from continuing operations(a) | 84.2 | 49.4 | 70 | ||||||
Non-GAAP diluted EPS from continuing operations(a) | $ | 1.69 | 1.01 | 67 | |||||
(a) | Amounts reported in this table are attributable to the shareholders of Brink’s and exclude earnings related to noncontrolling interests. |
(b) | Non-GAAP results are reconciled to the applicable GAAP results on pages 36–37. |
GAAP Basis
Analysis of Consolidated Results: 2015 versus 2014
Consolidated Revenues Revenues decreased $500.9 million or 14% due to unfavorable changes in currency exchange rates ($891.3 million) and an organic decrease in EMEA ($38.0 million), partially offset by organic growth in Venezuela ($296.8 million), Latin America ($58.4 million), Payment Services ($18.9 million), Asia ($18.3 million), Brazil ($17.7 million) and Mexico ($8.5 million). A significant portion of the reduction in revenues from currency exchange rates relates to a devaluation of the Venezuelan bolivar in February 2015. The U.S. dollar also strengthened against the euro, Brazilian real, Mexican peso and most currencies in Latin America. Revenues increased 11% on an organic basis due mainly to higher average selling prices in Venezuela and Latin America (including the effects of inflation, which results in pricing adjustments in certain countries). See page 20 for our definition of “organic.”
Consolidated Costs and Expenses Cost of revenues decreased 16% to $2,471.6 million as higher labor costs from inflation-based wage increases were more than offset by changes in currency rates, including devaluation in Venezuela, lower U.S. retirement costs ($31.2 million) and cost cutting initiatives. Selling, general and administrative costs decreased 17% to $463.8 million due primarily to changes in currency exchange rates, including devaluation in Venezuela, lower U.S. retirement costs ($15.3 million) and cost cutting initiatives.
Consolidated Operating Profit (Loss) Operating profit improved from a loss of $27.5 million to a profit of $56.6 million due mainly to:
• | lower remeasurement loss of net monetary assets ($103.5 million) as a result of the devaluation of the Venezuelan currency (a $121.6 million charge in 2014 compared to an $18.1 million charge in 2015), |
• | lower retirement benefit cost ($46.5 million), |
• | organic profit improvement in Latin America ($38.5 million), Venezuela ($36.0 million), Mexico ($19.1 million), and Asia ($6.0 million), and |
• | lower corporate expenses ($39.4 million) on an organic basis due to lower security costs and other cost reductions. |
The positive impact of these factors was partially offset by:
• | unfavorable currency impact due to changes in exchange rates ($100.4 million), including devaluation in Venezuela, |
• | a $44.3 million gain on sale of our minority interest in a CIT business in Peru in 2014, |
• | impairment charges in Venezuela ($35.3 million), and |
• | organic profit decreases in EMEA ($13.6 million) and the U.S. ($7.7 million). |
Consolidated Income (Loss) from Continuing Operations Attributable to Brink’s and Related Per Share Amounts Loss from continuing operations attributable to Brink’s shareholders in 2015 improved $45.7 million to a loss of $9.1 million primarily due to the operating profit increase mentioned above and lower interest expense ($4.5 million), partially offset by higher income tax expense ($29.8 million) and a lower loss attributable to noncontrolling interests ($14.6 million). Earnings per share from continuing operations was negative $0.19, an improvement from negative $1.12 in 2014.
24
Non-GAAP Basis
Analysis of Consolidated Results: 2015 versus 2014
Non-GAAP Consolidated Revenues Non-GAAP revenues decreased $373.6 million or 11% due to unfavorable changes in currency exchange rates ($467.2 million) and an organic decrease in EMEA ($38.0 million), partially offset by organic growth in Latin America ($58.4 million), Payment Services ($18.9 million), Asia ($18.3 million), Brazil ($17.7 million) and Mexico ($8.5 million). The reduction in non-GAAP revenues from currency exchange rates relates to a strengthening of the U.S. dollar against the euro, Brazilian real and Mexican peso and most currencies in Latin America. Non-GAAP revenues increased 3% on an organic basis due mainly to higher average selling prices in Latin America (including the effects of inflation and related pricing adjustments). See page 20 for our definition of “organic.”
Non-GAAP Consolidated Operating Profit Non-GAAP operating profit increased $32.6 million in 2015 due mainly to:
• | organic profit improvement in Latin America ($38.5 million), Mexico ($19.1 million) and Asia ($6.0 million), and |
• | lower corporate expenses ($39.4 million) on an organic basis due to lower security costs and other cost reductions. |
The positive impact of these factors were partially offset by:
• | the negative impact of changes in currency exchange rates ($50.4 million) and |
• | organic profit decreases in EMEA ($13.6 million) and the U.S. ($7.7 million). |
Non-GAAP Consolidated Income from Continuing Operations Attributable to Brink’s and Related Per Share Amounts Non-GAAP income from continuing operations attributable to Brink’s shareholders in 2015 increased $34.8 million primarily due to the non-GAAP operating profit increase mentioned above and lower interest expense ($4.4 million), partially offset by the corresponding higher non-GAAP tax expense ($5.4 million). Non-GAAP earnings per share from continuing operations was $1.69, an improvement from $1.01 in 2014.
25
Revenues and Operating Profit by Segment: 2015 versus 2014
Organic | Acquisitions / | % Change | ||||||||||||||||||||
(In millions) | 2014 | Change | Dispositions(a) | Currency(b) | 2015 | Total | Organic | |||||||||||||||
Revenues: | ||||||||||||||||||||||
U.S. | $ | 727.8 | 2.6 | — | — | 730.4 | — | — | ||||||||||||||
France | 517.4 | (0.3 | ) | — | (85.6 | ) | 431.5 | (17 | ) | — | ||||||||||||
Mexico | 388.2 | 8.5 | — | (63.7 | ) | 333.0 | (14 | ) | 2 | |||||||||||||
Brazil | 364.1 | 17.7 | — | (111.4 | ) | 270.4 | (26 | ) | 5 | |||||||||||||
Canada | 179.7 | (1.6 | ) | — | (24.4 | ) | 153.7 | (14 | ) | (1 | ) | |||||||||||
Largest 5 Markets | 2,177.2 | 26.9 | — | (285.1 | ) | 1,919.0 | (12 | ) | 1 | |||||||||||||
Latin America | 380.6 | 58.4 | — | (69.1 | ) | 369.9 | (3 | ) | 15 | |||||||||||||
EMEA | 556.3 | (38.0 | ) | — | (73.6 | ) | 444.7 | (20 | ) | (7 | ) | |||||||||||
Asia | 139.8 | 18.3 | 9.1 | (9.8 | ) | 157.4 | 13 | 13 | ||||||||||||||
Global Markets | 1,076.7 | 38.7 | 9.1 | (152.5 | ) | 972.0 | (10 | ) | 4 | |||||||||||||
Payment Services | 96.6 | 18.9 | — | (29.6 | ) | 85.9 | (11 | ) | 20 | |||||||||||||
Revenues - non-GAAP | 3,350.5 | 84.5 | 9.1 | (467.2 | ) | 2,976.9 | (11 | ) | 3 | |||||||||||||
Other items not allocated to segments(d) | 211.8 | 296.8 | — | (424.1 | ) | 84.5 | (60 | ) | fav | |||||||||||||
Revenues - GAAP | $ | 3,562.3 | $ | 381.3 | 9.1 | (891.3 | ) | 3,061.4 | (14 | ) | 11 | |||||||||||
Operating profit: | ||||||||||||||||||||||
U.S. | $ | 22.8 | (7.7 | ) | — | — | 15.1 | (34 | ) | (34 | ) | |||||||||||
France | 39.4 | 1.9 | — | (6.6 | ) | 34.7 | (12 | ) | 5 | |||||||||||||
Mexico | 9.6 | 19.1 | — | (4.5 | ) | 24.2 | fav | fav | ||||||||||||||
Brazil | 34.2 | 0.1 | — | (10.5 | ) | 23.8 | (30 | ) | — | |||||||||||||
Canada | 12.8 | (0.3 | ) | — | (1.8 | ) | 10.7 | (16 | ) | (2 | ) | |||||||||||
Largest 5 Markets | 118.8 | 13.1 | — | (23.4 | ) | 108.5 | (9 | ) | 11 | |||||||||||||
Latin America | 50.4 | 38.5 | — | (12.6 | ) | 76.3 | 51 | 76 | ||||||||||||||
EMEA | 52.5 | (13.6 | ) | — | (3.2 | ) | 35.7 | (32 | ) | (26 | ) | |||||||||||
Asia | 23.1 | 6.0 | 1.0 | (1.4 | ) | 28.7 | 24 | 26 | ||||||||||||||
Global Markets | 126.0 | 30.9 | 1.0 | (17.2 | ) | 140.7 | 12 | 25 | ||||||||||||||
Payment Services | (4.9 | ) | (1.4 | ) | — | (0.9 | ) | (7.2 | ) | 47 | 29 | |||||||||||
Corporate expenses(c) | (115.7 | ) | 39.4 | — | (8.9 | ) | (85.2 | ) | (26 | ) | (34 | ) | ||||||||||
Operating profit - non-GAAP | 124.2 | 82.0 | 1.0 | (50.4 | ) | 156.8 | 26 | 66 | ||||||||||||||
Other items not allocated to segments(d) | (151.7 | ) | 53.4 | (55.4 | ) | 53.5 | (100.2 | ) | (34 | ) | (35 | ) | ||||||||||
Operating profit (loss) - GAAP | $ | (27.5 | ) | 135.4 | (54.4 | ) | 3.1 | 56.6 | fav | fav | ||||||||||||
Amounts may not add due to rounding.
See page 22 for footnotes.
26
Analysis of Segment Results: 2015 versus 2014
Largest 5 Markets
U.S. Revenues increased ($2.6 million) due to organic revenue growth as a result of volume increases. Operating profit decreased 34% ($7.7 million) due to higher labor and security costs associated with challenges managing volume increases while reducing headcount, partially offset by the impact of cost cutting and productivity initiatives and lower health care costs.
France Revenues decreased 17% ($85.9 million) due to unfavorable currency impact ($85.6 million). Revenues were flat organically due to volume and pricing pressure. Operating profit decreased 12% ($4.7 million) due to unfavorable currency ($6.6 million), partially offset by the impact of cost cutting initiatives and the inclusion in last year's results of several large unfavorable settlements that did not repeat.
Mexico Revenues decreased 14% ($55.2 million) due to unfavorable currency impact ($63.7 million), partially offset by 2% organic growth ($8.5 million) from higher volumes. Operating profit increased significantly ($14.6 million) due to a change in employee benefit structure, lower security losses and the impact of cost cutting and productivity initiatives.
Brazil Revenues decreased 26% ($93.7 million) primarily due to the negative impact of currency exchange rates ($111.4 million), partially offset by 5% organic growth ($17.7 million) from price increases. Operating profit decreased 30% ($10.4 million) driven by unfavorable currency ($10.5 million) and flat profits on an organic basis, resulting from low volume growth, slower price growth and higher costs. partially offset by the positive impact of cost cutting initiatives.
Canada Revenues decreased 14% ($26.0 million) primarily due to the negative impact of currency exchange rates ($24.4 million). Operating profit decreased 16% ($2.1 million) driven by unfavorable currency impact ($1.8 million) and higher pension costs from a lower discount rate, partially offset by the positive impact of cost cutting initiatives.
Global Markets
Latin America Revenues decreased 3% ($10.7 million) as the negative impact of currency exchange rates ($69.1 million) was offset by organic growth of 15% ($58.4 million) driven by inflation-based revenue increases in Argentina. Operating profit increased 51% ($25.9 million) driven by higher organic results in Argentina and Chile and the positive impact of cost cutting initiatives throughout the region, partially offset by lower organic results in Colombia and unfavorable currency impact ($12.6 million). Argentina accounted for over half of Latin America’s profit in 2015.
EMEA Revenues decreased 20% ($111.6 million) primarily due to unfavorable currency ($73.6 million). Revenue decreased 7% ($38.0 million) on an organic basis as lower revenue in Germany, Greece and Ireland was partially offset by growth in Israel, Turkey, Luxembourg and Switzerland. Operating profit decreased 32% ($16.8 million) due to lower profits in Ireland and Germany, as well as unfavorable currency ($3.2 million), partially offset by the positive impact of cost cutting initiatives.
Asia Revenues increased 13% ($17.6 million) due to organic growth across the region. Operating profit increased 24% ($5.6 million) primarily due to the revenue growth.
Payment Services
Payment Services Revenues decreased 11% ($10.7 million) as negative currency ($29.6 million) was partially offset by 20% organic growth ($18.9 million). Operating profit decreased $2.3 million, driven by unfavorable currency ($0.9 million) and marketing expenditures to increase cardholders in the U.S. Payments business.
27
Income and Expense Not Allocated to Segments
Corporate Expenses
Corporate expenses include former non-segment and regional management costs, currency transaction gains and losses, and costs related to global initiatives.
Years Ended December 31, | % change | ||||||||||||||
(In millions) | 2016 | 2015 | 2014 | 2016 | 2015 | ||||||||||
General, administrative and other expenses | $ | (59.8 | ) | (81.0 | ) | (110.8 | ) | (26 | ) | (27 | ) | ||||
Foreign currency transaction gains (losses) | 3.8 | (8.8 | ) | (2.6 | ) | fav | unfav | ||||||||
Reconciliation of segment policies to GAAP | (2.2 | ) | 4.6 | (2.3 | ) | unfav | fav | ||||||||
Corporate items | $ | (58.2 | ) | (85.2 | ) | (115.7 | ) | (32 | ) | (26 | ) | ||||
Corporate expenses in 2016 were $27.0 million lower than the prior year period due to lower compensation-related expenses, along with the recognition of foreign currency transaction gains in the current year period compared to foreign currency transaction losses in the prior year period.
Corporate expenses in 2015 were $30.5 million lower than the prior year period due to cost reductions from reorganization and restructuring and lower security losses.
Other Items Not Allocated to Segments
Years Ended December 31, | % change | ||||||||||||||
(In millions) | 2016 | 2015 | 2014 | 2016 | 2015 | ||||||||||
Revenues: | |||||||||||||||
Venezuela operations | $ | 109.4 | 84.5 | 211.8 | 29 | (60 | ) | ||||||||
Acquisitions and dispositions | 2.8 | — | — | fav | — | ||||||||||
Revenues | $ | 112.2 | 84.5 | 211.8 | 33 | (60 | ) | ||||||||
Operating profit: | |||||||||||||||
Venezuela operations | $ | 15.8 | (47.7 | ) | (97.9 | ) | fav | (51 | ) | ||||||
Reorganization and Restructuring | (30.3 | ) | (15.3 | ) | (21.8 | ) | 98 | (30 | ) | ||||||
Retirement plans | (31.5 | ) | (31.2 | ) | (79.0 | ) | 1 | (61 | ) | ||||||
Acquisitions and dispositions | (16.3 | ) | (6.0 | ) | 49.4 | unfav | unfav | ||||||||
Share-based compensation adj. | — | — | (2.4 | ) | — | fav | |||||||||
Operating profit | $ | (62.3 | ) | (100.2 | ) | (151.7 | ) | (38 | ) | (34 | ) | ||||
Venezuela operations We have excluded from our segment results all of our Venezuela operating results, including remeasurement losses on net monetary assets related to currency devaluations ($4.8 million in 2016, $18.1 million in 2015 and $121.6 million in 2014) and charges related to the impairment of property and equipment ($35.3 million in 2015), due to management’s inability to allocate, generate or redeploy resources in-country or globally. In light of these unique circumstances, our operations in Venezuela are largely independent of the rest of our global operations. As a result, the Chief Executive Officer, the Company's Chief Operating Decision maker ("CODM"), assesses segment performance and makes resource decisions by segment excluding Venezuela operating results. Additionally, management believes excluding Venezuela from segment results makes it possible to more effectively evaluate the company’s performance between periods.
Factors considered by management in excluding Venezuela results include:
• | Continued inability to repatriate cash to redeploy to other operations or dividend to shareholders |
• | Highly inflationary environment |
• | Fixed exchange rate policy |
• | Continued currency devaluations and |
• | Difficulty raising prices and controlling costs |
28
Reorganization and Restructuring
2016 Restructuring
In the fourth quarter of 2016, management implemented restructuring actions across our global business operations and our corporate functions. As a result of these actions, we recognized asset-related adjustments of $16.3 million, severance costs of $7.2 million, lease restructuring charges of $0.7 million, partially offset by a $6.1 million benefit related to the termination of a benefit program. Severance actions are expected to reduce our global workforce by 700 to 800 positions. We expect that the 2016 restructuring will result in $8 to $12 million in 2017 cost savings.
Executive Leadership and Board of Directors
In 2015, we recognized $1.8 million in charges related to Executive Leadership and Board of Directors restructuring actions, which were announced in January 2016. We recognized $4.3 million in charges in 2016 related to the Executive Leadership and Board of Directors restructuring actions.
2015 Restructuring
Brink's initiated an additional restructuring of its business in the third quarter of 2015. We recognized $11.6 million in 2015 costs related to employee severance, contract terminations, and lease terminations associated with the 2015 restructuring, which reduced the global workforce by approximately 1,100 positions and resulted in approximately $20 million in 2016 cost savings. We recognized charges of $6.5 million in 2016 related to this restructuring.
2014 Restructuring
Brink’s reorganized and restructured its business in December 2014, eliminating the management roles and structures in its former Latin America and EMEA regions and implementing a plan to reduce the cost structure of various country operations by eliminating approximately 1,700 positions across its global workforce. Severance costs of $21.8 million associated with these actions were recognized in 2014. An additional $1.9 million in costs were recognized in 2015 related to the 2014 restructuring. The restructuring saved annual direct costs of approximately $50 million in 2015 compared to 2014, excluding charges for severance, lease termination and accelerated depreciation.
Due to the unique circumstances around these charges, they have not been allocated to segment results and are excluded from non-GAAP results. Charges related to the employees, assets, leases and contracts impacted by these restructuring actions were excluded from the segments and corporate expenses as shown in the table below.
Years Ended December 31, | % change | ||||||||||||||
(In millions) | 2016 | 2015 | 2014 | 2016 | 2015 | ||||||||||
Reportable Segments: | |||||||||||||||
U.S. | $ | (4.6 | ) | (0.9 | ) | (2.2 | ) | unfav | (59 | ) | |||||
France | (3.8 | ) | (1.4 | ) | (1.5 | ) | unfav | (7 | ) | ||||||
Brazil | (1.1 | ) | (0.8 | ) | (1.7 | ) | 38 | (53 | ) | ||||||
Canada | (1.4 | ) | (0.8 | ) | (1.7 | ) | 75 | (53 | ) | ||||||
Largest 5 Markets | (10.9 | ) | (3.9 | ) | (7.1 | ) | unfav | (45 | ) | ||||||
Latin America | (2.9 | ) | (0.4 | ) | (10.5 | ) | unfav | (96 | ) | ||||||
EMEA | (2.3 | ) | (3.1 | ) | (1.7 | ) | (26 | ) | 82 | ||||||
Asia | (7.1 | ) | (2.2 | ) | — | unfav | unfav | ||||||||
Global Markets | (12.3 | ) | (5.7 | ) | (12.2 | ) | unfav | (53 | ) | ||||||
Payment Services | (0.6 | ) | — | — | unfav | — | |||||||||
Total reportable segments | (23.8 | ) | (9.6 | ) | (19.3 | ) | unfav | (50 | ) | ||||||
Corporate items | (6.5 | ) | (5.7 | ) | (2.5 | ) | 14 | unfav | |||||||
Total | $ | (30.3 | ) | (15.3 | ) | (21.8 | ) | 98 | (30 | ) | |||||
Retirement plans
U.S. Plans
Because our U.S. retirement plans are frozen, costs related to these plans have not been allocated to segment results. Brink’s primary U.S. pension plan settled a portion of its obligation in the fourth quarter of 2014 under a lump sum buy-out offer. Approximately 4,300 terminated participants were paid about $150 million of plan assets under this offer in lieu of receiving their pension benefit. A $56 million settlement loss was recognized as a result of the settlement.
Non-U.S. Plans
We have operations outside of the U.S. with employee benefits that are accounted for as retirement benefits under Financial Accounting Standards Board ("FASB") Accounting Standards Codification ("ASC") Topic 715, Compensation — Retirement Benefits. Whenever settlement charges related to these retirement benefits occur, they are not allocated to segment results. We recognized settlement charges in Mexico ($2.2 million in 2016, $4.6 million in 2015 and $5.9 million in 2014) and Switzerland ($0.3 million in 2016).
29
Acquisitions and dispositions Certain acquisition and disposition items that are not considered part of the ongoing activities of the business and are special in nature are consistently excluded from non-GAAP results. These items are described below:
2016 Acquisitions and Dispositions
• | Due to management's decision in the first quarter of 2016 to exit the Republic of Ireland, the prospective impacts of shutting down this operation are included in items not allocated to segments and are excluded from the operating segments effective March 1, 2016. This activity is also excluded from the consolidated non-GAAP results. Beginning May 1, 2016, due to management's decision to also exit Northern Ireland, the results of shutting down these operations are treated similarly to the Republic of Ireland. 2015 revenues from both Ireland operations were approximately $20 million. Charges included in our GAAP results include $4.9 million in severance costs, $1.8 million in property impairment charges, lease restructuring charges of $0.5 million and an additional $7.0 million in operating and other exit costs. These costs have been excluded from our segment and our consolidated non-GAAP results. International shipments to and from Ireland will continue to be provided through BGS. |
• | Brink's recognized a $2.0 million loss related to the sale of corporate assets in the second quarter of 2016. |
2015 Acquisitions and Dispositions
• | These items related primarily to Brink's sale of its 70% interest in a cash management business in Russia in the fourth quarter of 2015 from which we recognized a $5.9 million loss on the sale. |
2014 Acquisitions and Dispositions
These items related primarily to:
• | Brink’s sold an equity investment in a CIT business in Peru and recognized a $44.3 million gain. Other divestiture gains were $0.6 million. |
• | A favorable adjustment of $0.7 million to the 2010 business acquisition gain for Mexico. |
Share-based compensation adjustment Accounting adjustment related to share-based compensation of $2.4 million in 2014 was not allocated to segment results. The accounting adjustments revised the accounting for certain share-based awards from fixed to variable fair value accounting. As of July 11, 2014, all outstanding equity awards had met the conditions for a grant date as defined in ASC Topic 718 and have since been accounted for as fixed share-based compensation expense.
2016 versus 2015
The impact of other items not allocated to segments on operating profit was a smaller loss ($62.3 million in 2016 versus $100.2 million in the prior year period). The reduction was primarily due to the $35.3 million of Venezuela impairment charges recognized in the prior year period as well as lower losses related to currency devaluation in Venezuela in the current year period. The Venezuela-related items were partially offset by charges related to the shutdown of operations in Ireland, a loss on the sale of corporate assets and higher reorganization and restructuring costs in 2016.
2015 versus 2014
Other items not allocated to segments was a lower expense in 2015 versus the prior year period primarily due to lower devaluation charges in Venezuela, a decrease in U.S. retirement plans expense and lower restructuring charges, partially offset by the $44.3 million gain on the 2014 sale of our former equity method investment in Peru in 2014, the 2015 Venezuela impairment charges of $35.3 million and lower profits from Venezuela operations.
30
Other Operating Income and Expense
Amounts below represent consolidated other operating income and expense.
Years Ended December 31, | % change | ||||||||||||||
(In millions) | 2016 | 2015 | 2014 | 2016 | 2015 | ||||||||||
Foreign currency items: | |||||||||||||||
Transaction gains (losses) | $ | 1.4 | (26.8 | ) | (127.2 | ) | fav | (79 | ) | ||||||
Foreign currency derivative instrument gains (losses) | (2.4 | ) | 2.9 | 1.4 | unfav | fav | |||||||||
Gains (losses) on sale of property and equity investment | (1.3 | ) | 0.9 | 44.9 | unfav | (98 | ) | ||||||||
Argentina conversion losses | (0.1 | ) | (7.1 | ) | (3.6 | ) | (99 | ) | 97 | ||||||
Impairment losses | (20.6 | ) | (37.2 | ) | (3.3 | ) | (45 | ) | unfav | ||||||
Share in earnings (losses) of equity affiliates | (1.5 | ) | 0.5 | 4.3 | unfav | (88 | ) | ||||||||
Royalty income | 2.6 | 2.1 | 1.5 | 24 | 40 | ||||||||||
Gains (losses) on business acquisitions and dispositions | 0.1 | (6.3 | ) | — | fav | unfav | |||||||||
Other | 1.7 | 1.6 | 1.0 | 6 | 60 | ||||||||||
Other operating income (expense) | $ | (20.1 | ) | (69.4 | ) | (81.0 | ) | (71 | ) | (14 | ) | ||||
2016 versus 2015
Other operating expense decreased in 2016 primarily due to lower losses from foreign currency items, property impairments, Argentina currency conversions and business dispositions. The reduction in foreign currency transaction losses mainly resulted from lower remeasurement losses associated with Venezuelan currency devaluation ($4.8 million in 2016 versus $18.1 million in 2015). Impairment charges declined in 2016 as the 2015 Venezuela property impairment of $35.3 million exceeded current year impairment losses, primarily from 2016 restructuring actions. After the December 2015 devaluation of the Argentine peso, we did not incur significant losses from converting Argentina pesos to U.S. dollars ($0.1 million in 2016 versus $7.1 million in 2015). In 2015, we recognized a $5.9 million loss on the sale of a Russian cash management business.
2015 versus 2014
Other operating expense decreased in 2015 primarily as a result of lower remeasurement losses associated with the currency devaluation in Venezuela ($18.1 million) versus the remeasurement charges related to the currency devaluation in the prior year ($121.6 million). The lower remeasurement charges in 2015 were partially offset by a 2014 gain on the sale of a Peru CIT business ($44.3 million), the 2015 Venezuela property impairment charges ($35.3 million) and a $5.9 million loss on the sale of a Russian cash management business, of which $5.0 million represented foreign currency translation adjustments reclassified from accumulated other comprehensive income (loss) into earnings. See Note 1 to the consolidated financial statements for a description of the change in currency exchange processes and rates and the 2015 impairment of long-lived assets in Venezuela.
31
Nonoperating Income and Expense
Interest Expense
Years Ended December 31, | % change | |||||||||||||
(In millions) | 2016 | 2015 | 2014 | 2016 | 2015 | |||||||||
Interest expense | $ | 20.4 | 18.9 | 23.4 | 8 | (19 | ) | |||||||
Interest expense was higher in 2016 due to interest recognized on a non-recourse financing liability in Mexico (see Note 19) and the impact of higher weighted-average interest rates in 2016 versus the prior year.
Interest expense was lower in 2015 due to lower weighted-average interest rates, the impact of a stronger U.S. dollar on foreign currency-denominated debt and the redemption of the fixed-rate Dominion Terminal Associates bonds in the third quarter of 2014.
Interest and Other Income
Years Ended December 31, | % change | ||||||||||||||
(In millions) | 2016 | 2015 | 2014 | 2016 | 2015 | ||||||||||
Interest income | $ | 2.6 | 3.3 | 3.0 | (21 | ) | 10 | ||||||||
Gain on available-for-sale securities | 0.5 | 1.1 | 0.4 | (55 | ) | fav | |||||||||
Derivative instruments | (0.6 | ) | (0.5 | ) | (1.0 | ) | 20 | (50 | ) | ||||||
Other | (1.3 | ) | (0.5 | ) | (0.5 | ) | unfav | — | |||||||
Interest and other income | $ | 1.2 | 3.4 | 1.9 | (65 | ) | 79 | ||||||||
Interest and other income was lower in 2016 compared to 2015 primarily due to lower interest income and a decrease in gains on available-for-sale securities.
Interest and other income was higher in 2015 compared to 2014 primarily due to higher gains on available-for-sale securities and lower derivative instrument losses.
32
Income Taxes
Summary Rate Reconciliation – GAAP
(In percentages) | 2016 | 2015 | 2014 | |||||
U.S. federal tax rate | 35.0 | % | 35.0 | % | 35.0 | % | ||
Increases (reductions) in taxes due to: | ||||||||
Venezuela devaluation | 2.9 | 61.3 | (86.3 | ) | ||||
Tax on accelerated U.S. income(a) | — | 57.3 | — | |||||
Adjustments to valuation allowances | 18.2 | 18.9 | (16.9 | ) | ||||
Foreign income taxes | 4.2 | (18.2 | ) | (0.7 | ) | |||
French business tax | 3.0 | 8.9 | (9.0 | ) | ||||
Taxes on undistributed earnings of foreign affiliates | 0.7 | (1.2 | ) | (3.7 | ) | |||
State income taxes, net | (1.0 | ) | (4.1 | ) | 5.2 | |||
Other | (0.2 | ) | 3.9 | 1.5 | ||||
Income tax rate on continuing operations | 62.8 | % | 161.8 | % | (74.9 | )% | ||
(a) | In the fourth quarter of 2015, we recognized a $23.5 million increase to current tax expense related to a transaction that accelerated U.S. taxable income. |
Summary Rate Reconciliation – Non-GAAP(a)
(In percentages) | 2016 | 2015 | 2014 | |||||
U.S. federal tax rate | 35.0 | % | 35.0 | % | 35.0 | % | ||
Increases (reductions) in taxes due to: | ||||||||
Adjustments to valuation allowances | 1.3 | 2.0 | 6.7 | |||||
French business tax | 2.0 | 2.6 | 4.3 | |||||
Other | (1.4 | ) | (2.6 | ) | (0.3 | ) | ||
Income tax rate on Non-GAAP continuing operations | 36.9 | % | 37.0 | % | 45.7 | % | ||
(a) | See pages 36–37 for a reconciliation of non-GAAP results to GAAP. |
Overview
Our effective tax rate has varied in the past three years from the statutory U.S. federal rate due to various factors, including
• | changes in judgment about the need for valuation allowances |
• | changes in the geographical mix of earnings |
• | nontaxable acquisition gains and losses |
• | changes in laws in the U.S., France and Mexico |
• | U.S. tax on accelerated taxable income |
• | changes in the foreign currency rate used to measure Venezuela’s tax results |
• | timing of benefit recognition for uncertain tax positions |
• | state income taxes |
We establish or reverse valuation allowances for deferred tax assets depending on all available information including historical and expected future operating performance of our subsidiaries. Changes in judgment about the future realization of deferred tax assets can result in significant adjustments to the valuation allowances. Based on our historical and future expected taxable earnings, we believe it is more-likely-than-not that we will realize the benefit of the deferred tax assets, net of valuation allowances.
Continuing Operations
2016 Compared to U.S. Statutory Rate
The effective income tax rate on continuing operations in 2016 was greater than the 35% U.S. statutory tax rate primarily due to the significant losses related to operations in the Republic of Ireland, for which no tax benefit can be recorded, a change in judgment resulting in a valuation allowance against certain U.S. tax attributes with a limited statutory carryforward period that are no longer more-likely-than-not to be realized, and the non-deductible expenses resulting from the currency devaluation in Venezuela.
Excluding those items, our effective tax rate on continuing operations in 2016 was 42%. This rate is higher than the 35% U.S. statutory rate primarily due to book losses for which no tax benefit can be recorded, non-deductible expenses in Mexico, taxes on undistributed earnings and the characterization of a French business tax as an income tax, partially offset by the geographical mix of earnings and a French income tax credit.
33
2015 Compared to U.S. Statutory Rate
The effective income tax rate on continuing operations in 2015 was higher than the 35% U.S. statutory tax rate primarily due to a significant Venezuela currency remeasurement loss and impairment loss, which were largely non-deductible, and U.S. tax on accelerated taxable income. Excluding these items, the effective income tax rate was higher than the 35% U.S. statutory tax rate due to $3.7 million of tax expense due to the characterization of a French business tax as an income tax.
2014 Compared to U.S. Statutory Rate
The effective income tax rate on continuing operations in 2014 was lower than the 35% U.S. statutory tax rate (negative 75%) primarily due to a significant Venezuela currency remeasurement loss, which was largely non-deductible. Excluding the remeasurement loss, the effective income tax rate was higher than the 35% U.S. statutory tax rate due to $9.9 million of tax expense from cross border payments and $4.4 million of tax expense due to the characterization of a French business tax as an income tax, mostly offset by a $4.6 million tax benefit due to the jurisdictional mix of earnings including the favorable Venezuela permanent inflation adjustment.
Undistributed Foreign Earnings
As of December 31, 2016, we have not recorded U.S. federal deferred income taxes on approximately $229 million of undistributed earnings of foreign subsidiaries and equity affiliates in accordance with FASB ASC Topic 740, Income Taxes. We expect that these earnings will be permanently reinvested in operations outside the U.S. It is not practical to determine the income tax liability that might be incurred if all such income was remitted to the U.S. due to the inherent complexities associated with any hypothetical calculation, which would be dependent upon the exact form of repatriation.
Noncontrolling Interests
Years Ended December 31, | % change | |||||||||||||
(In millions) | 2016 | 2015 | 2014 | 2016 | 2015 | |||||||||
Net income (loss) attributable to noncontrolling interests | $ | 10.3 | (16.3 | ) | (30.9 | ) | fav | (47 | ) | |||||
The change from a $16.3 million net loss attributable to noncontrolling interests in 2015 to $10.3 million net income attributable to noncontrolling interests in 2016 was primarily due to improved results in our Venezuelan subsidiaries and lower currency remeasurement charges from the devaluation of Venezuelan currency.
The net loss attributable to noncontrolling interests in 2015 was primarily due to a $35.3 million impairment charge related to Venezuelan property and equipment and $18.1 million in currency remeasurement charges from the devaluation of Venezuelan currency.
The net loss attributable to noncontrolling interests in 2014 was primarily due to $121.6 million in currency remeasurement charges from the devaluation of Venezuelan currency.
See Note 1 to the consolidated financial statements for more information about the currency remeasurement charges of our Venezuelan subsidiaries and the Venezuela impairment charge that occurred in 2015.
34
Loss from Discontinued Operations
Years Ended December 31, | |||||||||
(In millions) | 2016 | 2015 | 2014 | ||||||
Loss from operations(a)(b) | $ | — | (2.4 | ) | (13.3 | ) | |||
Loss on sales | — | (0.8 | ) | (18.9 | ) | ||||
Adjustments to contingencies of former operations(c): | |||||||||
Workers' compensation | (2.8 | ) | (0.7 | ) | (4.4 | ) | |||
Insurance recoveries related to BAX Global indemnification(d) | — | — | 9.5 | ||||||
Other | — | 0.1 | (1.6 | ) | |||||
Loss from discontinued operations before income taxes | (2.8 | ) | (3.8 | ) | (28.7 | ) | |||
Provision (benefit) for income taxes | (1.1 | ) | (1.0 | ) | 0.4 | ||||
Loss from discontinued operations, net of tax | $ | (1.7 | ) | (2.8 | ) | (29.1 | ) | ||
(a) | Discontinued operations include gains and losses related to businesses that we recently sold or shut down. No interest expense was included in discontinued operations in 2015 and 2014. |
(b) | The loss from operations in 2015 included $1.0 million in pension settlement charges related to the Mexican parcel delivery business sold in February 2015. The loss from operations in 2014 included $15.6 million in non-cash severance and impairment charges related to the Netherlands cash-in-transit operations. |
(c) | Primarily related to former coal businesses and BAX Global, a former freight forwarding and logistics business. |
(d) | BAX Global had been defending a claim related to the apparent diversion by a third party of goods being transported for a customer. In 2010, the Dutch Supreme Court denied the final appeal of BAX Global, letting stand the lower court ruling that BAX Global was liable for this claim. We had contractually indemnified the purchaser of BAX Global for this contingency. Through 2010, we had recognized $11.5 million of expense related to the payment made in satisfaction of the judgment. In 2014, we recovered $9.5 million from insurance companies related to this matter. |
Cash-in-transit operations sold or shut down:
• | Australia (sold in October 2014) |
• | Puerto Rico (shut down in November 2014) |
• | Netherlands (sold in December 2014) |
Other operations sold:
• | In February 2015, we sold a small Mexican parcel delivery business which met the criteria for classification as a discontinued operation as of December 31, 2014. |
Other divestitures not classified as discontinued operations:
• | We sold our 70% ownership interest in a Russian cash management business in November 2015 and recognized a $5.9 million loss on the disposition. A significant part of the loss ($5.0 million) represented the reclassification of foreign currency translation adjustments from accumulated other comprehensive income (loss) into earnings. |
• | We sold our Irish guarding operation in November 2015. |
• | We shut down our remaining Irish domestic operations in September 2016. |
• | We sold our German guarding operation in October 2016. |
The table below shows revenues and income (loss) from operations before tax for other divestitures not classified as discontinued operations:
Years Ended December 31, | |||||||||
(In millions) | 2016 | 2015 | 2014 | ||||||
Other divestitures | |||||||||
Revenues | $ | 12.3 | 46.6 | 94.4 | |||||
Income (loss) from operations before tax | (16.0 | ) | (8.2 | ) | 3.4 | ||||
35
Non-GAAP Results Reconciled to GAAP
Non-GAAP results described in this filing are financial measures that are not required by or presented in accordance with GAAP. The purpose of the Non-GAAP results is to report financial information from the primary operations of our business by excluding the effects of certain income and expenses that do not reflect the ordinary earnings of our operations. The specific items excluded have not been allocated to segments, are described in detail on pages 28–30, and are reconciled to comparable GAAP measures below.
The full-year Non-GAAP tax rate in each year excludes certain pretax and income tax amounts. Amounts reported for prior periods have been updated in this report to present information consistently for all periods presented.
The Non-GAAP information is intended to provide information to assist analysts and investors with comparability and estimates of future performance. Brink’s believes these measures are helpful in assessing operations and estimating future results and enable period-to-period comparability of financial performance. In addition, Brink’s believes the measures will help analysts and investors assess the ongoing operations of both our consolidated business and individual segments. Management uses Non-GAAP results to evaluate our period-over-period operating performance because our management believes this provides a more comparable measure of our continuing business. Additionally, Non-GAAP results are utilized as performance measures in certain management incentive compensation plans. Non-GAAP results should not be considered as an alternative to revenue, income or earnings per share amounts determined in accordance with GAAP and should be read in conjunction with their GAAP counterparts.
2016 | 2015 | ||||||||||||||||||
Pre-tax | Tax | Effective tax rate | Pre-tax | Tax | Effective tax rate | ||||||||||||||
Effective Income Tax Rate(a) | |||||||||||||||||||
GAAP | $ | 125.0 | 78.5 | 62.8 | % | $ | 41.1 | 66.5 | 161.8 | % | |||||||||
Other items not allocated to segments(b) | 62.3 | 5.3 | 100.2 | 9.3 | |||||||||||||||
Deferred tax valuation allowance(c) | — | (14.7 | ) | — | — | ||||||||||||||
U.S. tax on accelerated U.S. income(d) | — | — | — | (23.5 | ) | ||||||||||||||
Non-GAAP | $ | 187.3 | 69.1 | 36.9 | % | $ | 141.3 | 52.3 | 37.0 | % | |||||||||
2014 | |||||||||||||||||||
Pre-tax | Tax | Effective tax rate | |||||||||||||||||
Effective Income Tax Rate(a) | |||||||||||||||||||
GAAP | $ | (49.0 | ) | 36.7 | (74.9 | )% | |||||||||||||
Other items not allocated to segments(b) | 151.7 | 10.2 | |||||||||||||||||
Non-GAAP | $ | 102.7 | 46.9 | 45.7 | % | ||||||||||||||
Amounts may not add due to rounding.
(a) | From continuing operations. |
(b) | See “Other Items Not Allocated To Segments” on pages 28–30 for pre-tax amounts and details. Other Items Not Allocated To Segments for nonoperating expense, noncontrolling interests, income from continuing operations attributable to Brink's and EPS are the effects of the same items at their respective line items of the consolidated statements of operations. |
(c) | There was a change in judgment resulting in a valuation allowance against certain tax attributes with a limited statutory carryforward period that are no longer more-likely-than-not to be realized due to lower than expected U.S. operating results, certain non-GAAP pre-tax items, and the timing of tax deductions related to executive leadership transition. |
(d) | The non-GAAP tax rate excludes the U.S. tax on a transaction that accelerated U.S. taxable income because it will be offset by foreign tax benefits in future years. |
36
Non-GAAP reconciled to GAAP
Years Ended December 31, | |||||||||
(In millions) | 2016 | 2015 | 2014 | ||||||
Revenues: | |||||||||
GAAP | $ | 3,020.6 | 3,061.4 | 3,562.3 | |||||
Other items not allocated to segments(b) | (112.2 | ) | (84.5 | ) | (211.8 | ) | |||
Non-GAAP | $ | 2,908.4 | 2,976.9 | 3,350.5 | |||||
Operating profit (loss): | |||||||||
GAAP | $ | 144.2 | 56.6 | (27.5 | ) | ||||
Other items not allocated to segments(b) | 62.3 | 100.2 | 151.7 | ||||||
Non-GAAP | $ | 206.5 | 156.8 | 124.2 | |||||
Nonoperating expense: | |||||||||
GAAP | $ | (19.2 | ) | (15.5 | ) | (21.5 | ) | ||
Other items not allocated to segments(b) | — | 0.1 | — | ||||||
Non-GAAP | $ | (19.2 | ) | (15.4 | ) | (21.5 | ) | ||
Provision for income taxes: | |||||||||
GAAP | $ | 78.5 | 66.5 | 36.7 | |||||
Other items not allocated to segments(b) | 5.3 | 9.3 | 10.2 | ||||||
Deferred tax valuation allowance(c) | (14.7 | ) | — | — | |||||
U.S. tax on accelerated U.S. income(d) | — | (23.5 | ) | — | |||||
Non-GAAP | $ | 69.1 | 52.3 | 46.9 | |||||
Net income (loss) attributable to noncontrolling interests: | |||||||||
GAAP | $ | 10.3 | (16.3 | ) | (30.9 | ) | |||
Other items not allocated to segments(b) | (5.2 | ) | 21.2 | 37.3 | |||||
Non-GAAP | $ | 5.1 | 4.9 | 6.4 | |||||
Income (loss) from continuing operations attributable to Brink's: | |||||||||
GAAP | $ | 36.2 | (9.1 | ) | (54.8 | ) | |||
Other items not allocated to segments(b) | 62.2 | 69.8 | 104.2 | ||||||
Deferred tax valuation allowance(c) | 14.7 | — | — | ||||||
U.S. tax on accelerated U.S. income(d) | — | 23.5 | — | ||||||
Non-GAAP | $ | 113.1 | 84.2 | 49.4 | |||||
Diluted EPS | |||||||||
GAAP | $ | 0.72 | (0.19 | ) | (1.12 | ) | |||
Other items not allocated to segments(b) | 1.23 | 1.40 | 2.12 | ||||||
Deferred tax valuation allowance(c) | 0.29 | — | — | ||||||
U.S. tax on accelerated U.S. income(d) | — | 0.47 | — | ||||||
Non-GAAP | $ | 2.24 | 1.69 | 1.01 | |||||
Non-GAAP margin | 7.1 | % | 5.3 | % | 3.7 | % | |||
Amounts may not add due to rounding.
See page 36 for footnote explanations.
37
Foreign Operations
We currently serve customers in more than 100 countries, including 40 countries where we operate subsidiaries.
We are subject to risks customarily associated with doing business in foreign countries, including labor and economic conditions, political instability, controls on repatriation of earnings and capital, nationalization, expropriation and other forms of restrictive action by local governments. Changes in the political or economic environments in the countries in which we operate could have a material adverse effect on our business, financial condition and results of operations. The future effects, if any, of these risks are unknown.
Our international operations conduct a majority of their business in local currencies. Because our financial results are reported in U.S. dollars, they are affected by changes in the value of various local currencies in relation to the U.S. dollar. Recent strengthening of the U.S. dollar has reduced our reported dollar revenues and operating profit, which may continue in 2017. Our operations in Venezuela are subject to local laws and regulatory interpretations that determine the exchange rate at which repatriating dividends may be converted. See Application of Critical Accounting Policies—Foreign Currency Translation on pages 56–57 for a description of our accounting methods and assumptions used to include our Venezuelan operations in our consolidated financial statements, and a description of the accounting for subsidiaries operating in highly inflationary economies.
Changes in exchange rates may also affect transactions which are denominated in currencies other than the functional currency. From time to time, we use foreign currency forward and swap contracts to hedge transactional risks associated with foreign currencies, as discussed in Item 7A on page 59. At December 31, 2016, the notional value of our shorter term outstanding foreign currency forward and swap contracts was $41.9 million with average contract maturities of approximately one month. These shorter term foreign currency forward and swap contracts primarily offset exposures in the British pound and the Mexican peso. Additionally, these shorter term contracts are not designated as hedges for accounting purposes, and accordingly, changes in their fair value are recorded immediately in earnings. We recognized losses of $2.4 million on these contracts in 2016. At December 31, 2016, the fair value of these outstanding foreign currency forward and swap contracts was not significant.
We also have a longer term cross currency swap contract to hedge exposure in Brazilian real which is designated as a cash flow hedge for accounting purposes. At December 31, 2016, the notional value of this longer term contract was $7.9 million with a weighted-average maturity of 0.6 years. We recognized net losses of $1.6 million on this contract, of which losses of $1.3 million were included in other operating income (expense) to offset transaction gains of $1.3 million and expenses of $0.3 million were included in interest and other income (expense) in 2016. At December 31, 2016 the fair value of the longer term cross currency swap contract was $3.1 million, of which $2.4 million is included in prepaid expenses and other and $0.7 million is included in other assets on the consolidated balance sheet.
See Note 1 to the consolidated financial statements for a description of government currency processes and restrictions in Venezuela and Argentina, their effect on our operations, and how we account for currency remeasurement for our Venezuelan subsidiaries.
38
LIQUIDITY AND CAPITAL RESOURCES
Overview
Over the last three years, we used cash generated from our operations, proceeds from sales of investments and borrowings to
• | invest in the infrastructure of our business (new facilities, cash sorting and other equipment for our Cash Management Services operations, armored trucks, CompuSafe® units, and information technology) ($349 million), |
• | contribute funds to a U.S. pension plan ($87 million), and |
• | pay dividends to Brink’s shareholders ($59 million). |
Cash flows from operating activities decreased by $28.4 million in 2016 as compared to the prior year primarily due to higher amounts paid for income taxes. Cash used for investing activities increased by $5.2 million in 2016 as higher capital expenditures and lower net cash inflows from marketable securities in 2016 were partially offset by a reduction in cash outflows related to business divestitures. Cash also decreased $12.1 million in 2016 as a result of the strengthening of the U.S. dollar, primarily against currencies in Latin America including the Venezuelan bolivar and the Argentine peso. We financed our liquidity needs in 2016 with cash flows from operations supplemented by short-term borrowings.
Cash flows from operating activities increased by $54.6 million in 2015 as compared to the prior year primarily due to contributions made to our primary U.S. pension plan in 2014. Cash used for investing activities increased by $9.7 million in 2015 as lower capital expenditures and a decrease in cash outflows from discontinued operations were more than offset by lower cash inflows from asset sales in 2015 as we received $60 million in 2014 from the sale of the Peru CIT business. Cash also decreased $34.0 million in 2015 as a result of the strengthening of the U.S. dollar, primarily against most currencies in Latin America including the Venezuelan bolivar, Argentine peso and Brazilian real. We financed our liquidity needs in 2015 with cash flows from operations.
Operating Activities
Years Ended December 31, | $ change | |||||||||||||||
(In millions) | 2016 | 2015 | 2014 | 2016 | 2015 | |||||||||||
Cash flows from operating activities | ||||||||||||||||
Operating activities - GAAP | $ | 167.5 | 195.9 | 141.3 | $ | (28.4 | ) | 54.6 | ||||||||
Venezuela operations | (16.4 | ) | (2.3 | ) | (20.7 | ) | (14.1 | ) | 18.4 | |||||||
Contributions to primary U.S. pension plan | — | — | 87.2 | — | (87.2 | ) | ||||||||||
(Increase) decrease in certain customer obligations(a) | 13.2 | (12.5 | ) | (15.4 | ) | 25.7 | 2.9 | |||||||||
Discontinued operations | — | 2.0 | (5.5 | ) | (2.0 | ) | 7.5 | |||||||||
Operating activities - non-GAAP | $ | 164.3 | 183.1 | 186.9 | $ | (18.8 | ) | (3.8 | ) | |||||||
(a) | To adjust for the change in the balance of customer obligations related to cash received and processed in certain of our secure Cash Management Services operations. The title to this cash transfers to us for a short period of time. The cash is generally credited to customers’ accounts the following day and we do not consider it as available for general corporate purposes in the management of our liquidity and capital resources. |
Non-GAAP cash flows from operating activities is a supplemental financial measure that is not required by, or presented in accordance with GAAP. The purpose of this non-GAAP measure is to report financial information excluding cash flows from Venezuela operations, contributions to the primary U.S. pension plan, the impact of cash received and processed in certain of our Cash Management Services operations and without cash flows from discontinued operations. We believe this measure is helpful in assessing cash flows from operations, enables period-to-period comparability and is useful in predicting future operating cash flows. This non-GAAP measure should not be considered as an alternative to cash flows from operating activities determined in accordance with GAAP and should be read in conjunction with our consolidated statements of cash flows.
39
2016 versus 2015
GAAP
Operating cash flows decreased by $28.4 million in 2016 compared to 2015. The decrease was primarily due to changes in customer obligations of certain of our secure Cash Management Services operations (cash held for customers decreased by $13.2 million in 2016 compared to an increase of $12.5 million in 2015), increases in cash paid for income taxes in the current year, and increases in cash used for working capital, partially offset by an increase in operating profit and an increase in operating cash provided by Venezuela operations of $14.1 million.
Non-GAAP
Non-GAAP cash flows from operating activities decreased by $18.8 million in 2016 as compared to 2015. The decrease was primarily due to increases in cash paid for income taxes in the current year and increases in cash used for working capital, partially offset by an increase in operating profit.
2015 versus 2014
GAAP
Operating cash flows increased by $54.6 million in 2015 compared to 2014. The increase was primarily due to contributions made to our primary U.S. pension plan in 2014, an increase in operating profit, and lower amounts paid for income taxes, offset by an increase in cash used for working capital and discontinued operations as well as a decrease in cash provided by Venezuela operations.
Non-GAAP
Non-GAAP cash flows from operating activities decreased by $3.8 million in 2015 as compared to 2014. The decrease was primarily due to an increase in cash used for working capital partially offset by an increase in operating profit and lower amounts paid for income taxes.
Investing Activities
Years Ended December 31, | $ change | |||||||||||||||
(In millions) | 2016 | 2015 | 2014 | 2016 | 2015 | |||||||||||
Cash flows from investing activities | ||||||||||||||||
Capital expenditures | $ | (112.2 | ) | (101.1 | ) | (136.1 | ) | $ | (11.1 | ) | 35.0 | |||||
Acquisitions | (0.7 | ) | — | (4.6 | ) | (0.7 | ) | 4.6 | ||||||||
Dispositions, net of cash disposed | (0.6 | ) | (14.6 | ) | — | 14.0 | (14.6 | ) | ||||||||
Marketable securities: | ||||||||||||||||
Purchases | (9.2 | ) | (27.3 | ) | — | 18.1 | (27.3 | ) | ||||||||
Sales | 9.1 | 33.9 | 0.9 | (24.8 | ) | 33.0 | ||||||||||
Proceeds from sale of property, equipment and investments | 4.7 | 1.9 | 62.7 | 2.8 | (60.8 | ) | ||||||||||
Other | — | 1.6 | (3.6 | ) | (1.6 | ) | 5.2 | |||||||||
Discontinued operations | — | 1.9 | (13.3 | ) | (1.9 | ) | 15.2 | |||||||||
Investing activities | $ | (108.9 | ) | (103.7 | ) | (94.0 | ) | $ | (5.2 | ) | (9.7 | ) | ||||
Cash used by investing activities increased by $5.2 million in 2016 versus 2015. The increase was due to higher capital expenditures of $11.1 million and lower net cash inflows from purchases and sales of marketable securities. These amounts were partially offset by a reduction in cash outflows related to business divestitures.
Cash used by investing activities increased by $9.7 million in 2015 versus 2014. The change was due to the proceeds of $59.6 million received on the 2014 sale of an equity interest in a Peru CIT business and 2015 outflows of cash held for customers related to a business divestiture in Russia. These amounts were partially offset by lower capital expenditures of $35.0 million, less cash used in discontinued operations of $15.2 million and higher net cash inflows from purchases and sales of marketable securities, primarily in Argentina.
40
Capital expenditures and depreciation and amortization were as follows:
Years Ended December 31, | $ change | |||||||||||||||
(In millions) | 2016 | 2015 | 2014 | 2016 | 2015 | |||||||||||
Property and Equipment Acquired during the year | ||||||||||||||||
Capital expenditures(a): | ||||||||||||||||
Largest 5 Markets | $ | 68.2 | 59.3 | 83.4 | $ | 8.9 | (24.1 | ) | ||||||||
Global Markets | 28.6 | 28.8 | 30.0 | (0.2 | ) | (1.2 | ) | |||||||||
Payment Services | 1.4 | 1.7 | 0.8 | (0.3 | ) | 0.9 | ||||||||||
Corporate items | 9.0 | 7.0 | 16.5 | 2.0 | (9.5 | ) | ||||||||||
Capital expenditures - non-GAAP | 107.2 | 96.8 | 130.7 | 10.4 | (33.9 | ) | ||||||||||
Venezuela | 5.0 | 4.3 | 5.4 | 0.7 | (1.1 | ) | ||||||||||
Capital expenditures - GAAP | $ | 112.2 | 101.1 | 136.1 | $ | 11.1 | (35.0 | ) | ||||||||
Capital leases(b): | ||||||||||||||||
Largest 5 Markets | $ | 28.0 | 18.8 | 10.6 | $ | 9.2 | 8.2 | |||||||||
Global Markets | 1.4 | — | 0.3 | 1.4 | (0.3 | ) | ||||||||||
Payment Services | — | 0.1 | 1.2 | (0.1 | ) | (1.1 | ) | |||||||||
Capital leases - GAAP and non-GAAP | $ | 29.4 | 18.9 | 12.1 | $ | 10.5 | 6.8 | |||||||||
Total: | ||||||||||||||||
Largest 5 Markets | $ | 96.2 | 78.1 | 94.0 | $ | 18.1 | (15.9 | ) | ||||||||
Global Markets | 30.0 | 28.8 | 30.3 | 1.2 | (1.5 | ) | ||||||||||
Payment Services | 1.4 | 1.8 | 2.0 | (0.4 | ) | (0.2 | ) | |||||||||
Corporate items | 9.0 | 7.0 | 16.5 | 2.0 | (9.5 | ) | ||||||||||
Total - non-GAAP | 136.6 | 115.7 | 142.8 | 20.9 | (27.1 | ) | ||||||||||
Venezuela | 5.0 | 4.3 | 5.4 | 0.7 | (1.1 | ) | ||||||||||
Total - GAAP | $ | 141.6 | 120.0 | 148.2 | $ | 21.6 | (28.2 | ) | ||||||||
Depreciation and amortization(a) | ||||||||||||||||
Largest 5 Markets | $ | 91.3 | 94.6 | 107.7 | $ | (3.3 | ) | (13.1 | ) | |||||||
Global Markets | 25.5 | 27.2 | 31.3 | (1.7 | ) | (4.1 | ) | |||||||||
Payment Services | 2.4 | 2.9 | 3.7 | (0.5 | ) | (0.8 | ) | |||||||||
Corporate items | 10.9 | 11.3 | 9.7 | (0.4 | ) | 1.6 | ||||||||||
Depreciation and amortization - non-GAAP | 130.1 | 136.0 | 152.4 | (5.9 | ) | (16.4 | ) | |||||||||
Venezuela | 0.7 | 3.9 | 9.5 | (3.2 | ) | (5.6 | ) | |||||||||
2016 Restructuring | 0.8 | — | — | 0.8 | — | |||||||||||
Depreciation and amortization - GAAP | $ | 131.6 | 139.9 | 161.9 | $ | (8.3 | ) | (22.0 | ) | |||||||
(a) | Capital expenditures as well as depreciation and amortization related to Venezuela have been excluded from Global Markets. In addition, accelerated depreciation related to 2016 Restructuring activities has been excluded from non-GAAP amounts. |
(b) | Represents the amount of property and equipment acquired using capital leases. Because the assets are acquired without using cash, the acquisitions are not reflected in the consolidated cash flow statement. Amounts are provided here to assist in the comparison of assets acquired in the current year versus prior years. Sale leaseback transactions are excluded from “Capital leases” in this table. |
We continue to focus on maximizing asset utilization and we have reduced our annual spend to a level more in line with depreciation. Our reinvestment ratio, which we define as the annual amount of property and equipment acquired during the year divided by the annual amount of depreciation, was 1.1 in 2016, 0.9 in 2015, and 0.9 in 2014.
Capital expenditures in 2016 for our operating units were primarily for machinery and equipment, armored vehicles, and information technology. Capital expenditures in 2016 were $11.1 million higher compared to 2015. Total property and equipment acquired in 2016 was $21.6 million higher than the prior year.
Capital expenditures in 2015 for our operating units were primarily for machinery and equipment, armored vehicles, and information technology. Capital expenditures in 2015 were $35.0 million lower compared to 2014. Total property and equipment acquired in 2015 was $28.2 million lower than the prior year.
Corporate capital expenditures in the last three years were primarily for implementing a new finance shared service center and investing in information technology.
41
Financing Activities
Years Ended December 31, | $ change | |||||||||||||||
(In millions) | 2016 | 2015 | 2014 | 2016 | 2015 | |||||||||||
Cash flows from financing activities | ||||||||||||||||
Borrowings and repayments: | ||||||||||||||||
Short-term borrowings | $ | 115.0 | (22.7 | ) | (7.8 | ) | $ | 137.7 | (14.9 | ) | ||||||
Long-term revolving credit facilities, net | (112.2 | ) | (64.4 | ) | 115.0 | (47.8 | ) | (179.4 | ) | |||||||
Other long-term debt, net | (34.2 | ) | 44.1 | (73.5 | ) | (78.3 | ) | 117.6 | ||||||||
Borrowings (repayments) | (31.4 | ) | (43.0 | ) | 33.7 | 11.6 | (76.7 | ) | ||||||||
Nonrecourse financing of real estate transaction | — | 14.5 | — | (14.5 | ) | 14.5 | ||||||||||
Common stock issued | 3.0 | — | — | 3.0 | — | |||||||||||
Dividends to: | ||||||||||||||||
Shareholders of Brink’s | (19.8 | ) | (19.5 | ) | (19.4 | ) | (0.3 | ) | (0.1 | ) | ||||||
Noncontrolling interests in subsidiaries | (4.6 | ) | (5.3 | ) | (8.6 | ) | 0.7 | 3.3 | ||||||||
Acquisitions of noncontrolling interests | — | (1.5 | ) | — | 1.5 | (1.5 | ) | |||||||||
Proceeds from exercise of stock options | 12.2 | 3.8 | 0.4 | 8.4 | 3.4 | |||||||||||
Other | (4.3 | ) | (1.7 | ) | (2.8 | ) | (2.6 | ) | 1.1 | |||||||
Discontinued operations | — | 0.2 | — | (0.2 | ) | 0.2 | ||||||||||
Financing activities | $ | (44.9 | ) | (52.5 | ) | 3.3 | $ | 7.6 | (55.8 | ) | ||||||
2016 versus 2015
Cash used by financing activities decreased by $7.6 million in 2016 compared to 2015 due to higher short-term borrowings and increased proceeds from stock option exercises. These financing cash flow increases were partially offset by higher net repayments of our revolving credit facilities and other long-term debt as well as cash receipts in 2015 from the Mexico real estate transaction which did not reoccur in 2016.
2015 versus 2014
Cash used by financing activities increased by $55.8 million in 2015 compared to 2014 as net repayments of our revolving credit facilities and short-term borrowings exceeded net borrowings of other long-term debt. Our ability to repay debt in 2015 resulted primarily from higher operating cash flows as no contributions were made to the primary U.S. pension plan in 2015 along with lower capital expenditures. The higher cash outflows from debt repayments were partially offset by the receipt of $14.5 million in cash in 2015 related to a real estate transaction in Mexico. Due to continuing involvement, the transaction did not qualify for sale-leaseback accounting, therefore the cash proceeds are reported as a nonrecourse financing liability.
Common stock issued
We received $3.0 million in 2016 when our CEO and CFO purchased a combined 100,440 shares of our common stock.
Dividends
We paid dividends to Brink’s shareholders of $0.10 per share in each of the last 12 quarters. Future dividends are dependent on our earnings, financial condition, shareholders’ equity levels, our cash flow and business requirements, as determined by the Board of Directors.
Effect of Exchange Rate Changes on Cash and Cash Equivalents
Changes in currency exchange rates reduced the amount of cash and cash equivalents by $12.1 million during 2016, compared to a reduction of $34.0 million in 2015 and $129.9 million in 2014. The decrease in 2016 was caused by strengthening of the U.S. dollar, primarily against currencies in Latin America including the Venezuelan bolivar and the Argentine peso. The decrease in 2015 was caused by the strengthening of the U.S. dollar, primarily against most currencies in Latin America including the Venezuelan bolivar, Argentine peso and Brazilian real. Approximately $93 million of the 2014 reduction was due to a currency devaluation in Venezuela that occurred in the first quarter of that year. See Note 1 to the consolidated financial statements for more information. The rest of the change related to the strengthening of the U.S. dollar against many of the currencies in the countries where we operate, particularly in Russia and Latin America.
42
Capitalization
We use a combination of debt, leases and equity to capitalize our operations.
As of December 31, 2016, debt as a percentage of capitalization (defined as total debt and equity) was 56% compared to 57% at December 31, 2015. The ratio decreased in 2016 because our equity increased by a higher amount than the increase in our debt. Our equity in 2016 increased primarily from current year net income and proceeds from stock option exercises. These positive changes were partially offset by dividend payments and other comprehensive losses resulting primarily from the negative impact of foreign currency translation adjustments in 2016. Our debt increased in 2016 as higher short-term borrowings exceeded net repayments of long-term debt.
Summary of Debt, Equity and Other Liquidity Information
Amount available under credit facilities | Outstanding balance | |||||||||||||
December 31, | December 31, | |||||||||||||
(In millions) | 2016 | 2016 | 2015 | $ change(a) | ||||||||||
Debt: | ||||||||||||||
Short-term borrowings | ||||||||||||||
Uncommitted credit facilities | $ | 15.7 | $ | 108.3 | — | 108.3 | ||||||||
Restricted cash borrowings(b) | — | 22.3 | 3.5 | 18.8 | ||||||||||
Other | — | 32.2 | 29.1 | 3.1 | ||||||||||
Total Short-term borrowings | $ | 15.7 | $ | 162.8 | 32.6 | 130.2 | ||||||||
Long-term debt | ||||||||||||||
Revolving Facility | $ | 469.2 | $ | 55.8 | 163.3 | $ | (107.5 | ) | ||||||
Private Placement Notes | — | 85.6 | 92.8 | (7.2 | ) | |||||||||
Term Loan | — | 65.6 | 70.9 | (5.3 | ) | |||||||||
Multi-currency revolving facilities | 11.9 | 3.6 | 1.1 | 2.5 | ||||||||||
Unsecured committed credit facility | — | — | 4.1 | (4.1 | ) | |||||||||
Letter of Credit Facilities | 27.8 | — | — | — | ||||||||||
Other | — | 2.8 | 6.2 | (3.4 | ) | |||||||||
Capital leases | — | 67.0 | 59.5 | 7.5 | ||||||||||
Total Long-term debt | $ | 508.9 | $ | 280.4 | 397.9 | $ | (117.5 | ) | ||||||
Total Debt | $ | 524.6 | $ | 443.2 | 430.5 | $ | 12.7 | |||||||
Total equity | $ | 354.8 | 330.6 | $ | 24.2 | |||||||||
(a) | In addition to cash borrowings and repayments, the change in the debt balance also includes changes in currency exchange rates. |
(b) | These 2016 and 2015 amounts are for short-term borrowings related to cash borrowed under lending arrangements used in the process of managing customer cash supply chains, which is currently classified as restricted cash and not available for general corporate purposes. See Note 19 for more details. |
43
Reconciliation of Net Debt to U.S. GAAP Measures
December 31, | ||||||||||
(In millions) | 2016 | 2015 | $ change | |||||||
Debt: | ||||||||||
Short-term borrowings(a) | $ | 140.5 | 29.1 | $ | 111.4 | |||||
Long-term debt | 280.4 | 397.9 | (117.5 | ) | ||||||
Total Debt | 420.9 | 427.0 | (6.1 | ) | ||||||
Less: | ||||||||||
Cash and cash equivalents | 183.5 | 181.9 | 1.6 | |||||||
Amounts held by Cash Management Services operations(b) | (9.8 | ) | (24.2 | ) | 14.4 | |||||
Cash and cash equivalents available for general corporate purposes | 173.7 | 157.7 | 16.0 | |||||||
Net Debt | $ | 247.2 | 269.3 | $ | (22.1 | ) | ||||
(a) | Amount excludes $22.3 million at December 31, 2016 and $3.5 million at December 31, 2015 for short-term borrowings related to cash borrowed under lending arrangements used in the process of managing customer cash supply chains, which is currently classified as restricted cash and not available for general corporate purposes. See Note 19 for more details. |
(b) | Title to cash received and processed in certain of our secure Cash Management Services operations transfers to us for a short period of time. The cash is generally credited to customers’ accounts the following day and we do not consider it as available for general corporate purposes in the management of our liquidity and capital resources and in our computation of Net Debt. |
Net Debt is a supplemental non-GAAP financial measure that is not required by, or presented in accordance with GAAP. We use Net Debt as a measure of our financial leverage. We believe that investors also may find Net Debt to be helpful in evaluating our financial leverage. Net Debt should not be considered as an alternative to Debt determined in accordance with GAAP and should be reviewed in conjunction with our consolidated balance sheets. Set forth above is a reconciliation of Net Debt, a non-GAAP financial measure, to Debt, which is the most directly comparable financial measure calculated and reported in accordance with GAAP, as of December 31, 2016, and December 31, 2015. Net Debt excluding cash and debt in Venezuelan operations was $255 million at December 31, 2016, and $275 million at December 31, 2015.
Net Debt at the end of 2016 decreased by $22.1 million when compared to Net Debt at the end of 2015 primarily due to the repayments of debt from operating cash flows and the decrease in cash amounts held by Cash Management Services operations due to the shutdown of Ireland operations. As of December 31, 2015, our former Ireland operations had $18.5 million of cash amounts held by Cash Management Services operations.
Liquidity Needs
Our operating liquidity needs are typically financed by cash from operations, short-term borrowings and the Revolving Facility (our debt facilities are described below). We have certain limitations and considerations related to the cash and borrowing capacity that are reported in our consolidated financial statements. Based on our current cash on hand, amounts available under our credit facilities and current projections of cash flows from operations, we believe that we will be able to meet our liquidity needs for more than the next twelve months.
Limitations on dividends from foreign subsidiaries. A significant portion of our operations are outside the U.S. which may make it difficult to repatriate additional cash for use in the U.S. See Item 1A., Risk Factors, for more information on the risks associated with having businesses outside the U.S.
Incremental taxes. Of the $184 million of cash and cash equivalents at December 31, 2016, $159 million is held by subsidiaries that we consider to be permanently invested and for which we do not expect to repatriate to the U.S. If we were to decide to repatriate this cash to the U.S., we may have to accrue and pay additional income taxes. Given the number of foreign operations and the complexities of the tax law, it is not practical to estimate the potential tax liability, but the amount of taxes owed could be material depending on how and when the repatriation occurred.
Venezuela
We have $6.8 million of cash and cash equivalents denominated in Venezuelan bolivars (as remeasured at the published DICOM rate of 674 bolivars to the U.S. dollar) at December 31, 2016. We believe that the DICOM process to convert bolivars (as described in Note 1 to the consolidated financial statements) is the only method for which we could receive U.S. dollars that we need to operate our business and to repatriate earnings. The Venezuelan government has restricted conversions of bolivars into U.S. dollars in the past and may do so in the future. We did not repatriate any U.S. dollars from Venezuela in 2016 or 2015.
In Note 3, we are required to present projected benefit payments of our Venezuela benefit plan for the next 10 years. Because the economy in Venezuela has had significant inflation in the last several years, we applied highly inflationary assumptions when calculating the projected benefit payments. Due to the uncertainties associated with the significant inflation in Venezuela, there can be no assurances that these assumptions provide an accurate reflection of future payments. We assumed an inflation rate of 500% in 2017 with a gradual decline to 4% in 2032, as we expect the economy of Venezuela over time to return to inflation rates more typical for the region. When these undiscounted
44
bolivar-denominated projected benefit payments are translated into U.S. dollars at the December 31, 2016 DICOM exchange rate, the result is projected benefit payments of $4.4 billion over the next 10 years. If we applied the same inflation rate assumption to the December 31, 2016 DICOM exchange rate over the next 10 years, the projected benefit payments would be less than our December 31, 2016 liability of $5.6 million. In 2016, we made payments in local currency of approximately $0.6 million related to this benefit plan. In future years, we expect to continue to make these payments in bolivars with cash generated from our Venezuelan operations.
Argentina. At December 31, 2016, we had cash denominated in Argentine pesos of $11.6 million. The government in Argentina had previously imposed limits on the exchange of Argentine pesos into U.S. dollars. As a result, we elected in the past and may continue in the future to repatriate cash from Argentina using different markets to convert Argentine pesos into U.S. dollars if U.S. dollars are not readily available. Prior to the December 2015 devaluation of the Argentine peso, we converted Argentine pesos into U.S. dollars at rates less favorable than the rates at which we translated the financial statements of our subsidiary in Argentina. However, after the December 2015 devaluation of the Argentine peso, the market rates used to convert Argentine pesos into U.S. dollars have been similar to the rates at which we translate the financial statements of our subsidiary in Argentina.
Debt
Short-Term Borrowings
Uncommitted Credit Facilities
In October 2016, we entered into a $100 million uncommitted credit facility. Borrowings under this facility have a maximum maturity of not more than thirty days. Interest on this facility is generally based on LIBOR plus a margin of 1.00%. As of December 31, 2016, $100 million was outstanding.
In February 2016, we entered into a $24 million uncommitted credit facility with an initial expiration date in February 2017. The facility was amended in February 2017, which extended the expiration date to February 2018. Interest on this facility is based on LIBOR plus a margin of 1.00%. As of December 31, 2016, $8 million was outstanding.
Long-Term Debt
Revolving Facility
We have a $525 million unsecured multi-currency revolving bank credit facility (the “Revolving Facility”) that matures in March 2020. The Revolving Facility’s interest rate is based on LIBOR plus a margin or an alternate base rate plus a margin. The Revolving Facility allows us to borrow loans or issue letters of credit (or otherwise satisfy credit needs) on a revolving basis over the term of the facility. As of December 31, 2016, $469 million was available under the Revolving Facility. Amounts outstanding under the Revolving Facility, as of December 31, 2016, were denominated primarily in U.S. dollars and to a lesser extent in euros.
The margin on LIBOR borrowings under the Revolving Facility, which can range from 1.0% to 1.70% depending on either our credit rating or leverage ratio as defined within the Revolving Facility, was 1.30% at December 31, 2016. The margin on alternate base rate borrowings under the Revolving Facility ranges from 0.0% to 0.70%. We also pay an annual facility fee on the Revolving Facility based on our credit rating or the leverage ratio. The facility fee can range from 0.125% to 0.30% and was 0.20% at December 31, 2016.
Private Placement Notes
We have $86 million principal amount of unsecured notes outstanding, which were issued through a private placement debt transaction (the “Notes”). The Notes comprise $36 million in series A notes with a fixed interest rate of 4.57% and $50 million in series B notes with a fixed interest rate of 5.20%. Annual principal payments under the series A notes began in January 2015 and continue through maturity. The series B notes are due in January 2021.
Term Loan
We entered into a $75 million unsecured term loan in March 2015. Interest on this loan is based on LIBOR plus a margin of 1.75%. Monthly principal payments began April 2015 and continue through to maturity, with the remaining balance of $34 million due in March 2022. As of December 31, 2016, the principal amount outstanding was $66 million.
Other Facilities
As of December 31, 2016, we have one $20 million unsecured multi-currency revolving bank credit facility, of which $4 million was outstanding. As of December 31, 2016, we had undrawn letters of credit and guarantees of $5 million issued under the multi-currency revolving bank credit facilities. This $20 million facility expires in March 2019. Interest on this facility is based on LIBOR plus a margin, which ranges from 1.0% to 1.7%. We also have the ability to borrow from other banks, at the banks' discretion, under short-term uncommitted agreements. Various foreign subsidiaries maintain other lines of credit and overdraft facilities with a number of banks.
Letter of Credit Facilities
We have a $40 million uncommitted letter of credit facility that expires in May 2017. As of December 31, 2016, $5 million was utilized.
We have two unsecured letter of credit facilities totaling $94 million, of which approximately $28 million was available at December 31, 2016. At December 31, 2016, we had undrawn letters of credit and guarantees of $66 million issued under these letter of credit facilities. A $40 million facility expires in December 2018 and a $54 million facility expires in December 2019. The Revolving Facility and the multi-currency revolving credit facilities are also used for issuance of letters of credit and bank guarantees.
45
The Revolving Facility, the Notes, the unsecured multi-currency revolving bank credit facilities, the unsecured committed credit facility, the letter of credit facilities and the unsecured term loan contain certain subsidiary guarantees and various financial and other covenants. The financial covenants, among other things, limit our total indebtedness, restrict certain payments to shareholders, limit priority debt, limit asset sales, limit the use of proceeds from asset sales, provide for a maximum leverage ratio and provide for minimum coverage of interest costs. These agreements do not provide for the acceleration of payments should our credit rating be reduced. If we were not to comply with the terms of our various financing agreements, the repayment terms could be accelerated and the commitments could be withdrawn. An acceleration of the repayment terms under one agreement could trigger the acceleration of the repayment terms under the other financing agreements. We were in compliance with all financial covenants at December 31, 2016.
Equity
Common Stock
At December 31, 2016, we had 100 million shares of common stock authorized and 50.0 million shares issued and outstanding.
Preferred Stock
At December 31, 2016, we had the authority to issue up to 2 million shares of preferred stock, par value $10 per share.
Off Balance Sheet Arrangements
We have operating leases that are described in the notes to the consolidated financial statements. We use operating leases to lower our cost of financings. We believe that operating leases are an important component of our capital structure.
46
Contractual Obligations
The following table reflects our contractual obligations as of December 31, 2016.
Estimated Payments Due by Period | |||||||||||||||||||||
(In millions) | 2017 | 2018 | 2019 | 2020 | 2021 | Later Years | Total | ||||||||||||||
Contractual obligations: | |||||||||||||||||||||
Long-term debt obligations | $ | 14.3 | 13.1 | 16.0 | 69.8 | 65.2 | 35.0 | 213.4 | |||||||||||||
Capital lease obligations | 18.5 | 14.8 | 11.1 | 9.1 | 7.6 | 5.9 | 67.0 | ||||||||||||||
Operating lease obligations | 59.9 | 74.3 | 40.6 | 30.1 | 19.8 | 41.9 | 266.6 | ||||||||||||||
Purchase obligations | 19.6 | 2.6 | 1.9 | 1.8 | 1.7 | 1.1 | 28.7 | ||||||||||||||
Other long-term liabilities reflected on the | |||||||||||||||||||||
Company’s balance sheet under GAAP: | |||||||||||||||||||||
Primary U.S. pension plan | — | — | — | — | 13.1 | 43.4 | 56.5 | ||||||||||||||
Other retirement obligations: | |||||||||||||||||||||
UMWA plans | — | — | — | — | — | 425.6 | 425.6 | ||||||||||||||
Black lung and other plans | 7.5 | 6.8 | 7.1 | 6.2 | 5.6 | 67.0 | 100.2 | ||||||||||||||
Workers compensation and other claims | 19.2 | 12.8 | 8.2 | 5.4 | 4.6 | 25.5 | 75.7 | ||||||||||||||
Uncertain tax positions | 0.8 | — | — | — | — | — | 0.8 | ||||||||||||||
Other | 0.8 | 0.8 | 0.8 | 0.8 | 0.8 | 7.8 | 11.8 | ||||||||||||||
Total | $ | 140.6 | 125.2 | 85.7 | 123.2 | 118.4 | 653.2 | 1,246.3 | |||||||||||||
U.S. primary pension plan. Pension benefits provided to eligible U.S. employees were frozen on December 31, 2005, and benefits are not provided to employees hired after 2005 or to those covered by a collective bargaining agreement. We did not make cash contributions to the primary U.S. pension plan in 2016. There are approximately 14,800 beneficiaries in the plans.
Based on current assumptions, we do not expect to make additional contributions until 2021.
UMWA plans. Retirement benefits related to former coal operations include medical benefits provided by the Pittston Coal Group Companies Employee Benefit Plan for UMWA Represented Employees. There are approximately 3,600 beneficiaries in the UMWA plans. The company does not expect to make additional contributions to these plans until 2027, based on actuarial assumptions.
Black Lung plans. Under the Federal Black Lung Benefits Act of 1972, Brink’s is responsible for paying lifetime black lung benefits to miners and their dependents for claims filed and approved after June 30, 1973. There are approximately 750 black lung beneficiaries.
Non-U.S. defined-benefit pension plans. We have various defined-benefit pension plans covering eligible current and former employees of some of our international operations. See Note 3 for information about these non-U.S. plans' benefit obligation and estimated future benefit payments over the next 10 years.
Assumptions for U.S. Retirement Obligations
We have made various assumptions to estimate the amount of payments to be made in the future. The most significant assumptions include:
• | Changing discount rates and other assumptions in effect at measurement dates (normally December 31) |
• | Investment returns of plan assets |
• | Addition of new participants (historically immaterial due to freezing of pension benefits and exit from coal business) |
• | Mortality rates |
• | Change in laws |
The Contractual Obligations table above represents payments projected to be paid with our corporate funds and does not represent payments projected to be made to beneficiaries with retirement plan assets.
47
Funded Status of U.S. Retirement Plans
Actual | Projected | ||||||||||||
(In millions) | 2016 | 2017 | 2018 | 2019 | 2020 | 2021 | |||||||
Primary U.S. pension plan | |||||||||||||
Beginning funded status | $ | (113.7 | ) | (107.8 | ) | (91.6 | ) | (74.8 | ) | (57.2 | ) | (38.9 | ) |
Net periodic pension credit(a) | 17.9 | 18.3 | 18.7 | 18.6 | 18.3 | 19.6 | |||||||
Payment from Brink’s | — | — | — | — | — | 13.1 | |||||||
Benefit plan experience gain (loss) | (12.0 | ) | (2.1 | ) | (1.9 | ) | (1.0 | ) | — | — | |||
Ending funded status | $ | (107.8 | ) | (91.6 | ) | (74.8 | ) | (57.2 | ) | (38.9 | ) | (6.2 | ) |
UMWA plans | |||||||||||||
Beginning funded status | $ | (205.7 | ) | (226.6 | ) | (227.6 | ) | (229.2 | ) | (231.6 | ) | (234.8 | ) |
Net periodic postretirement cost(a) | (1.4 | ) | (1.0 | ) | (1.6 | ) | (2.4 | ) | (3.2 | ) | (4.1 | ) | |
Benefit plan experience gain (loss) | (19.2 | ) | — | — | — | — | — | ||||||
Other | (0.3 | ) | — | — | — | — | — | ||||||
Ending funded status | $ | (226.6 | ) | (227.6 | ) | (229.2 | ) | (231.6 | ) | (234.8 | ) | (238.9 | ) |
Black lung plans | |||||||||||||
Beginning funded status | $ | (55.4 | ) | (57.2 | ) | (53.0 | ) | (49.1 | ) | (45.4 | ) | (42.0 | ) |
Net periodic postretirement cost(a) | (2.3 | ) | (2.1 | ) | (2.0 | ) | (1.8 | ) | (1.7 | ) | (1.5 | ) | |
Payment from Brink’s | 8.1 | 6.3 | 5.9 | 5.5 | 5.1 | 4.7 | |||||||
Benefit plan experience gain (loss) | (7.6 | ) | — | — | — | — | — | ||||||
Ending funded status | $ | (57.2 | ) | (53.0 | ) | (49.1 | ) | (45.4 | ) | (42.0 | ) | (38.8 | ) |
(a) | Excludes amounts reclassified from accumulated other comprehensive income (loss). |
Summary of Total Expenses Related to All U.S. Retirement Liabilities
This table summarizes actual and projected expense (income) related to U.S. retirement liabilities. These expenses are not allocated to segment results.
Actual | Projected | ||||||||||||
(In millions) | 2016 | 2017 | 2018 | 2019 | 2020 | 2021 | |||||||
Primary U.S. pension plan | $ | 6.8 | 6.7 | 4.8 | 4.0 | 3.8 | 0.1 | ||||||
UMWA plans | 14.8 | 13.9 | 13.8 | 13.8 | 13.9 | 14.2 | |||||||
Black lung plans | 7.3 | 7.5 | 6.6 | 4.6 | 4.2 | 3.9 | |||||||
Total | $ | 28.9 | 28.1 | 25.2 | 22.4 | 21.9 | 18.2 | ||||||
Summary of Total Payments from U.S. Plans to Participants
This table summarizes actual and estimated payments from the plans to participants.
Actual | Projected | ||||||||||||
(In millions) | 2016 | 2017 | 2018 | 2019 | 2020 | 2021 | |||||||
Payments from U.S. Plans to participants | |||||||||||||
Primary U.S. pension plan | $ | 47.1 | 49.9 | 50.2 | 50.5 | 50.7 | 50.8 | ||||||
UMWA plans | 31.7 | 31.9 | 31.9 | 31.7 | 32.7 | 31.9 | |||||||
Black lung plans | 8.1 | 6.3 | 5.9 | 5.5 | 5.1 | 4.7 | |||||||
Total | $ | 86.9 | 88.1 | 88.0 | 87.7 | 88.5 | 87.4 | ||||||
48
Summary of Projected Payments from Brink’s to U.S. Plans
This table summarizes estimated payments from Brink’s to U.S. retirement plans.
Projected Payments to Plans from Brink's | ||||||||||||
(In millions) | Primary U.S. Pension Plan | UMWA Plans | Black Lung Plans | Total | ||||||||
Projected payments | ||||||||||||
2017 | $ | — | — | 6.3 | 6.3 | |||||||
2018 | — | — | 5.9 | 5.9 | ||||||||
2019 | — | — | 5.5 | 5.5 | ||||||||
2020 | — | — | 5.1 | 5.1 | ||||||||
2021 | 13.1 | — | 4.7 | 17.8 | ||||||||
2022 | 21.1 | — | 4.4 | 25.5 | ||||||||
2023 | 17.1 | — | 4.0 | 21.1 | ||||||||
2024 | 5.2 | — | 3.7 | 8.9 | ||||||||
2025 | — | — | 3.3 | 3.3 | ||||||||
2026 | — | — | 3.1 | 3.1 | ||||||||
2027 | — | 11.4 | 2.9 | 14.3 | ||||||||
2028 | — | 24.8 | 2.8 | 27.6 | ||||||||
2029 | — | 23.9 | 2.6 | 26.5 | ||||||||
2030 | — | 23.2 | 2.4 | 25.6 | ||||||||
2031 and thereafter | — | 342.3 | 25.7 | 368.0 | ||||||||
Total projected payments | $ | 56.5 | 425.6 | 82.4 | 564.5 | |||||||
The amounts in the tables above are based on a variety of estimates, including actuarial assumptions as of December 31, 2016. The estimated amounts will change in the future to reflect payments made, investment returns, actuarial revaluations, and other changes in estimates. Actual amounts could differ materially from the estimated amounts.
Contingent Matters
During the fourth quarter of 2015, we became aware of an investigation initiated by COFECE (the Mexican antitrust agency) related to potential anti-competitive practices among competitors in the cash logistics industry in Mexico (the industry in which Brink’s Mexican subsidiary, SERPAPROSA, is active). Because no legal proceedings have been initiated against SERPAPROSA, we cannot estimate the probability of loss or any range of estimate of possible loss at this time. It is possible that SERPAPROSA could become the subject of legal or administrative claims or proceedings, however, that could result in a loss that could be material to the Company’s results in a future period.
On March 21, 2016, The Bruce McDonald Holding Company, et al., filed a lawsuit in Circuit Court of Logan County, West Virginia against Addington, Inc. (“Addington”) and The Brink’s Company related to an Agreement of Lease dated September 19, 1978, between the Plaintiffs and Addington. Plaintiffs seek declaratory judgment and unspecified damages related to allegations that Addington failed to mine coal on the property leased from the Plaintiffs and failed to pay correct minimum royalties to the Plaintiffs. The Company denies the allegations asserted by the Plaintiffs, is vigorously defending itself in this matter, and has filed a counterclaim against the Plaintiffs related to Plaintiffs’ failure to consent to the assignment and subleasing the leasehold to others. Due to numerous uncertain and unresolved factors presented in this case, it is not possible to estimate a range of loss at this time and, accordingly, no accrual has been recorded in the Company’s financial statements.
In addition, we are involved in various other lawsuits and claims in the ordinary course of business. We are not able to estimate the loss or range of losses for some of these matters. We have recorded accruals for losses that are considered probable and reasonably estimable. Other than the matters noted above, we do not believe that the ultimate disposition of any of the lawsuits currently pending against the Company should have a material adverse effect on our liquidity, financial position or results of operations.
49
APPLICATION OF CRITICAL ACCOUNTING POLICIES
The application of accounting principles requires the use of assumptions, estimates and judgments. We make assumptions, estimates and judgments based on, among other things, knowledge of operations, markets, historical trends and likely future changes, similarly situated businesses and, when appropriate, the opinions of advisors with relevant knowledge and experience. Reported results could have been materially different had we used a different set of assumptions, estimates and judgments.
Deferred Tax Asset Valuation Allowance
Deferred tax assets result primarily from net operating losses, tax credit carryforwards, and the net tax effects of temporary differences between the carrying amount of assets and liabilities for financial statement and income tax purposes, as determined under enacted tax laws and rates.
Accounting Policy
We establish valuation allowances, in accordance with FASB ASC Topic 740, Income Taxes, when we estimate it is not more likely than not that a deferred tax asset will be realized. We decide to record valuation allowances primarily based on an assessment of positive and negative evidence including historical earnings and future taxable income that incorporates prudent, feasible tax-planning strategies. We assess deferred tax assets on an individual jurisdiction basis. Changes in tax statutes, the timing of deductibility of expenses or expectations for future performance could result in material adjustments to our valuation allowances, which would increase or decrease tax expense. Our valuation allowances are as follows.
Valuation Allowances
December 31, | ||||||
(In millions) | 2016 | 2015 | ||||
U.S. | $ | 38.1 | 20.4 | |||
Non-U.S. | 24.7 | 25.3 | ||||
Total | $ | 62.8 | 45.7 | |||
Application of Accounting Policy
U.S. Deferred Tax Assets
We had $320 million of net deferred tax assets at December 31, 2016, of which $271 million related to U.S. jurisdictions. In 2016, we changed our judgment about the need for valuation allowances for certain U.S. tax attributes with a limited statutory carryforward period that were no longer more-likely-than-not to be realized due to lower than expected U.S. operating results, certain pre-tax items, and other timing of tax deductions related to executive leadership transition. As a result, we recognized a $14.7 million valuation allowance in 2016 through income from continuing operations.
We used various estimates and assumptions to evaluate the need for the valuation allowance in the U.S. These included
• | projected revenues and operating income for our U.S. entities, |
• | projected royalties and management fees paid to U.S. entities from subsidiaries outside the U.S., |
• | estimated required contributions to our U.S. retirement plans, and |
• | interest rates on projected U.S. borrowings. |
Our projections assumed continued growth of our revenues and operating profit both in the U.S. and outside the U.S. Had we used different assumptions, we might have made different conclusions about the need for valuation allowances. For example, using different assumptions we might have concluded that we require a full valuation allowance offsetting our U.S. deferred tax assets.
Non-U.S. Deferred Tax Assets
In 2015, we changed our judgment about the need for valuation allowances for deferred tax assets in certain non-U.S. jurisdictions as a result of changes in operating results and the outlook about the future operating performance in those jurisdictions. As a result, we recognized $1.5 million of valuation allowances in 2015 through continuing operations.
50
Goodwill, Other Intangible Assets and Property and Equipment Valuations
Accounting Policy
At December 31, 2016, we had property and equipment of $531.0 million, goodwill of $186.2 million and other intangible assets of $19.1 million, net of accumulated depreciation and amortization. We review these assets for possible impairment using the guidance in FASB ASC Topic 350, Intangibles - Goodwill and Other, for goodwill and other intangible assets and FASB ASC Topic 360, Property, Plant and Equipment, for property and equipment. Our review for impairment requires the use of significant judgments about the future performance of our operating subsidiaries. Due to the many variables inherent in the estimates of the fair value of these assets, differences in assumptions could have a material effect on the impairment analyses.
Application of Accounting Policy
Goodwill
We review goodwill for impairment annually and whenever events or circumstances make it more likely than not that impairment may have occurred. Application of the goodwill impairment test requires judgment, including the identification of reporting units, assignment of assets and liabilities to reporting units, assignment of goodwill to reporting units, and determination of the fair value of each reporting unit.
Under U.S. GAAP, the annual impairment test may be either a quantitative test or a qualitative assessment. The qualitative assessment can be performed in order to determine whether facts and circumstances support a determination that reporting unit fair values are greater than their carrying values.
For 2016, we elected to bypass the optional qualitative assessment and we performed a quantitative goodwill impairment test instead. We estimated the fair value of each reporting unit using projections of cash flows and compared to its carrying value. We completed the annual goodwill impairment test as of October 1, 2016 and concluded that the fair value of each reporting unit substantially exceeded its carrying value ranging from 30% to 215%.
Finite-lived Intangible Assets and Property and Equipment
We review finite-lived intangible assets and property and equipment for impairment whenever events or changes in circumstances indicate that the related carrying amounts may not be recoverable. For purposes of assessing impairment, assets are grouped at the lowest levels for which there are identifiable cash flows that are largely independent of the cash flows of other groups of assets. To determine whether impairment has occurred, we compare estimates of the future undiscounted net cash flows of groups of assets to their carrying value.
Estimates of Future Cash Flows
We made significant assumptions when preparing financial projections of cash flow used in our impairment analyses, including assumptions of future results of operations, capital requirements, income taxes, long-term growth rates for determining terminal value, and discount rates. Our projections assumed continued growth of our revenues and operating profit both in the U.S. and outside the U.S. Our conclusions regarding asset impairment may have been different if we had used different assumptions.
51
Retirement and Postemployment Benefit Obligations
We provide benefits through defined benefit pension plans and retiree medical benefit plans and under statutory requirements.
Accounting Policy
We account for pension and other retirement benefit obligations under FASB Accounting Standards Update (“ASU”) Topic 715, Compensation – Retirement Benefits. We account for postemployment benefit obligations, including workers’ compensation obligations, under FASB ASC Topic 712, Compensation – Nonretirement Postemployment Benefits.
To account for these benefits, we make assumptions of expected return on assets, discount rates, inflation, demographic factors and changes in the laws and regulations covering the benefit obligations. Because of the inherent volatility of these items and because the obligations are significant, changes in the assumptions could have a material effect on our liabilities and expenses related to these benefits.
Our most significant retirement plans include our primary U.S. pension plan and the retiree medical plans of our former coal business that were collectively bargained with the United Mine Workers of America (the “UMWA”). The critical accounting estimates that determine the carrying values of liabilities and the resulting annual expense are discussed below.
Application of Accounting Policy
Discount Rate Assumptions
For plans accounted under FASB ASC Topic 715, we discount estimated future payments using discount rates based on market conditions at the end of the year. In general, our liability changes in an inverse relationship to interest rates. That is, the lower the discount rate, the higher the associated plan obligation.
U.S. Plans
For our largest retirement plans, including the primary U.S. pension and UMWA plans and black lung obligations, we derive the discount rates used to measure the present value of benefit obligations using the cash flow matching method. Under this method, we compare the plan’s projected payment obligations by year with the corresponding yields on a Mercer yield curve. Each year’s projected cash flows are then discounted back to their present value at the measurement date and an overall discount rate is determined. The overall discount rate is then rounded to the nearest tenth of a percentage point.
We used Mercer’s Above-Mean Curve to determine the discount rates for retirement cost and the year-end benefit obligation.
To derive the Above-Mean Curve, Mercer uses only those bonds with a yield higher than the mean yield of the same portfolio of high quality bonds. The Above-Mean Curve reflects the way an active investment manager would select high-quality bonds to match the cash flows of the plan.
Non-U.S. Plans
We use the same cash flow matching method to derive the discount rates of our major non-U.S. retirement plans. Where the cash flow matching method is not possible, rates of local high-quality long-term government bonds are used to estimate the discount rate.
The discount rates for the primary U.S. pension plan, UMWA retiree medical plans and black lung obligations were:
Primary U.S. Plan | UMWA Plans | Black Lung | ||||||||||||||||||||||||
2016 | 2015 | 2014 | 2016 | 2015 | 2014 | 2016 | 2015 | 2014 | ||||||||||||||||||
Discount rate: | ||||||||||||||||||||||||||
Retirement cost | 4.5 | % | 4.1 | % | 5.0 | % | 4.4 | % | 4.0 | % | 4.7 | % | 4.2 | % | 3.7 | % | 4.4 | % | ||||||||
Benefit obligation at year end | 4.3 | % | 4.5 | % | 4.1 | % | 4.1 | % | 4.4 | % | 4.0 | % | 3.9 | % | 4.2 | % | 3.7 | % | ||||||||
Sensitivity Analysis
The discount rate we select at year end materially affects the valuations of plan obligations at year end and calculations of net periodic expenses for the following year. The tables below compare hypothetical plan obligation valuations for our largest plans as of December 31, 2016, actual expenses for 2016 and projected expenses for 2017 assuming we had used discount rates that were one percentage point lower or higher.
Plan Obligations at December 31, 2016
(In millions) | Hypothetical 1% lower | Actual | Hypothetical 1% higher | ||
Primary U.S. pension plan | $ | 944.5 | 836.3 | 747.8 | |
UMWA plans | 498.2 | 444.2 | 399.4 | ||
52
Actual 2016 and Projected 2017 Expense (Income)
(In millions, except for percentages) | Hypothetical sensitivity analysis for discount rate assumption | Hypothetical sensitivity analysis for discount rate assumption | ||||||||||||
Actual | 1% lower | 1% higher | Projected | 1% lower | 1% higher | |||||||||
Years Ending December 31, | 2016 | 2016 | 2016 | 2017 | 2017 | 2017 | ||||||||
Primary U.S. pension plan | ||||||||||||||
Discount rate assumption | 4.5 | % | 3.5 | % | 5.5 | % | 4.3 | % | 3.3 | % | 5.3 | % | ||
Retirement cost | $ | 6.8 | 13.8 | 0.8 | $ | 6.7 | 14.0 | 0.2 | ||||||
UMWA plans | ||||||||||||||
Discount rate assumption | 4.4 | % | 3.4 | % | 5.4 | % | 4.1 | % | 3.1 | % | 5.1 | % | ||
Retirement cost | $ | 14.8 | 15.9 | 13.8 | $ | 13.9 | 15.3 | 12.8 | ||||||
Expected-Return-on-Assets Assumption
Our expected-return-on-assets assumption, which materially affects our net periodic benefit cost, reflects the long-term average rate of return we expect the plan assets to earn. We select the expected-return-on-assets assumption using advice from our investment advisor considering each plan’s asset allocation targets and expected overall investment manager performance and a review of the most recent long-term historical average compounded rates of return, as applicable. We selected 7.50% as the expected-return-on-assets assumption for our primary U.S. plan and 8.25% for our UMWA retiree medical plans for actual 2016 expense. We selected 7.25% as the expected-return-on-assets assumption for our primary U.S. plan and 8.25% for our UMWA retiree medical plans for projected 2017 expense.
The twenty to thirty year compound annual return of our primary U.S. pension plan has averaged from 7.2% to 8.8%.
Sensitivity Analysis
Effect of using different expected-rate-of-return assumptions. Our 2016 and projected 2017 expense would have been different if we had used different expected-rate-of-return assumptions. For every hypothetical change of one percentage point in the assumed long-term rate of return on plan assets (and holding other assumptions constant), our actual 2016 and projected 2017 expense would be as follows:
(In millions, except for percentages) | Hypothetical sensitivity analysis for expected-return-on asset assumption | Hypothetical sensitivity analysis for expected-return-on asset assumption | ||||||||||||
Actual | 1% lower | 1% higher | Projected | 1% lower | 1% higher | |||||||||
Years Ending December 31, | 2016 | 2016 | 2016 | 2017 | 2017 | 2017 | ||||||||
Expected-return-on-asset assumption | ||||||||||||||
Primary U.S. pension plan | 7.50 | % | 6.50 | % | 8.50 | % | 7.25 | % | 6.25 | % | 8.25 | % | ||
UMWA plans | 8.25 | % | 7.25 | % | 9.25 | % | 8.25 | % | 7.25 | % | 9.25 | % | ||
Primary U.S. pension plan | $ | 6.8 | 14.1 | (0.5 | ) | $ | 6.7 | 14.0 | (0.6 | ) | ||||
UMWA plans | 14.8 | 16.9 | 12.7 | 13.9 | 15.9 | 11.9 | ||||||||
53
Effect of improving or deteriorating actual future market returns. Our funded status at December 31, 2017, and our 2018 expense will be different from currently projected amounts if our projected 2017 returns are better or worse than the returns we have assumed for each plan.
(In millions, except for percentages) | Hypothetical sensitivity analysis of 2017 asset return better or worse than expected | ||||||
Years Ending December 31, | Projected | Better return | Worse return | ||||
Return on investments in 2017 | |||||||
Primary U.S. pension plan | 7.25 | % | 14.50 | % | — | % | |
UMWA plans | 8.25 | % | 16.50 | % | — | % | |
Projected Funded Status at December 31, 2017 | |||||||
Primary U.S. pension plan | $ | (92 | ) | (41 | ) | (143 | ) |
UMWA plans | (228 | ) | (211 | ) | (244 | ) | |
2018 Expense(a) | |||||||
Primary U.S. pension plan | $ | 5 | 3 | 7 | |||
UMWA plans | 14 | 11 | 17 | ||||
(a) | Actual future returns on investments will not affect our earnings until 2018 since the earnings in 2017 will be based on the "expected return on assets" assumption. |
Effect of using fair market value of assets to determine expense. For our defined-benefit pension plans, we calculate expected investment returns by applying the expected long-term rate of return to the market-related value of plan assets. In addition, our plan asset actuarial gains and losses that are subject to amortization are based on the market-related value.
The market-related value of the plan assets is different from the actual or fair market value of the assets. The actual or fair market value is, at a point in time, the value of the assets that is available to make payments to pensioners and to cover any transaction costs. The market-related value recognizes changes in fair value from the expected value on a straight-line basis over five years. This recognition method spreads the effects of year-over-year volatility in the financial markets over several years.
Our expenses related to our primary U.S. pension plan would have been different if our accounting policy were to use the fair market value of plan assets instead of the market-related value to recognize investment gains and losses.
(In millions) | Based on market-related value of assets | Hypothetical(a) | |||||||||||||||||
Actual | Projected | Projected | |||||||||||||||||
Years Ending December 31, | 2016 | 2017 | 2018 | 2016 | 2017 | 2018 | |||||||||||||
Primary U.S. pension plan expense | $ | 6.8 | 6.7 | 4.8 | $ | 12.7 | 11.9 | 8.3 | |||||||||||
(a) | Assumes that our accounting policy was to use the fair market value of assets instead of the market-related value of assets to determine our expense related to our primary U.S. pension plan. |
For our UMWA plans, we calculate expected investment returns by applying the expected long-term rate of return to the fair market value of the assets at the beginning of the year. This method is likely to cause the expected return on assets, which is recorded in earnings, to fluctuate more than had we used the accounting methodology of our defined-benefit pension plans.
Medical Inflation Assumption
We estimate the trend in healthcare cost inflation to predict future cash flows related to our retiree medical plans. Our assumption is based on recent plan experience and industry trends.
For the UMWA plans, our largest retiree medical plans, we have assumed a medical inflation rate of 7% for 2017, and we project this rate to decline to 5% in 2023 and hold at 5% thereafter. Our medical inflation rate assumption (including the assumption that medical inflation rates will gradually decline over the next seven years and hold at 5%) is based on macroeconomic assumptions of gross domestic growth rates, the excess of national health expenditures over other goods and services, and population growth. The average annual medical inflation rate of the company over the last five to ten years ranged from 6.0% to 6.6%.
If we had assumed that medical inflation rates were one percentage point higher in each future year, the plan obligation for these plans at December 31, 2016, would have been approximately $50.1 million higher and the expense for 2016 would have been $2.1 million higher. If we had assumed that the medical inflation rates were one percentage point lower, the plan obligation at December 31, 2016, would have been approximately $42.6 million lower and the related 2016 expenses would have been $1.7 million lower.
54
If we had projected medical inflation rates to decline from 6.7% to 4.5% by 2028, instead of our projected decline from 7% to 5% by 2023, the plan obligation for the UMWA retiree medical benefit plan would have been $0.4 million lower for 2016 and our expense would be $0.1 million lower for 2017.
Excise Tax on Administrators by Patient Protection and Affordable Care Act
A 40% excise tax is expected to be imposed on high-cost health plans (“Cadillac plans”) beginning in 2020. The tax will apply to plan costs that exceed a certain threshold level for individuals and for families, which will be indexed to inflation. Even though the tax is not assessed directly to an employer but rather to the benefits plan administrator, the cost is expected to be passed through to plan sponsors as higher premiums or higher claims administration fees, increasing the plan sponsor’s obligations. We project that we will have to pay the benefits plan administrator this excise tax beginning in 2020, and our plan obligations at December 31, 2016, include $19.4 million related to this tax. We are currently unable to reduce the benefit levels of our UMWA medical plans to avoid this excise tax because these benefit levels are required by the Coal Industry Retiree Health Benefit Act of 1992.
Workers’ Compensation
Besides the effects of changes in medical costs, worker’s compensation costs are affected by the severity and types of injuries, changes in state and federal regulations and their application and the quality of programs which assist an employee’s return to work. Our liability for future payments for workers’ compensation claims is evaluated annually with the assistance of an actuary.
Numbers of Participants
Mortality tables. We use the Mercer modified RP-2014 base table and Mercer modified MP-2016 projection scale, with Blue Collar adjustments for majority of our U.S. retirement plans and White Collar adjustment for our nonqualified U.S. pension plan.
Lump sum offer to participants in 2014. In August 2014, we offered approximately 9,000 terminated participants that had not yet retired the option of receiving the value of their pension benefit in a lump-sum payment, or as a reduced annuity that would begin earlier. The lump-sum elections were accepted by approximately 4,300 terminated participants resulting in payments by the plan of about $150 million. This action helped reduce the premiums paid to the Pension Benefit Guaranty Corporation (“PBGC”) as a portion of the premiums is based on the number of participants in the plan. We recognized a settlement loss in the fourth quarter of 2014 related to the lump-sum payment of $56 million.
Number of participants. The number of participants by major plan in the past five years is as follows:
Number of participants | |||||||||
Plan | 2016 | 2015 | 2014 | 2013 | 2012 | ||||
UMWA plans | 3,600 | 3,700 | 3,900 | 4,100 | 4,300 | ||||
Black Lung | 750 | 700 | 700 | 710 | 780 | ||||
U.S. pension | 14,800 | 15,000 | 15,200 | 19,800 | 20,100 | ||||
Because we are no longer operating in the coal industry, we anticipate that the number of participants in the UMWA retirement medical plan will decline over time due to mortality. Because the U.S. pension plan has been frozen, the number of its participants will also decline over time.
55
Foreign Currency Translation
The majority of our subsidiaries outside the U.S. conduct business in their local currencies. Our financial results are reported in U.S. dollars, which include the results of these subsidiaries.
Accounting Policy
Our accounting policy for foreign currency translation is different depending on whether the economy in which our foreign subsidiary operates has been designated as highly inflationary. Economies with a three-year cumulative inflation rate of more than 100% are considered highly inflationary. Subsequent reductions in cumulative inflation rates below 100% do not change the method of translation unless the reduction is deemed to be other than temporary.
Non-Highly Inflationary Economies
Assets and liabilities of foreign subsidiaries in non-highly inflationary economies are translated into U.S. dollars using rates of exchange at the balance sheet date. Translation adjustments are recorded in other comprehensive income (loss). Revenues and expenses are translated at rates of exchange in effect during the year. Transaction gains and losses are recorded in net income (loss).
Highly Inflationary Economies
Foreign subsidiaries that operate in highly inflationary countries must use the reporting currency (the U.S. dollar) as the functional currency. Local-currency monetary assets and liabilities are remeasured into dollars each balance sheet date, with remeasurement adjustments and other transaction gains and losses recognized in earnings. Non-monetary assets and liabilities do not fluctuate with changes in local currency exchange rates to the dollar.
Application of Accounting Policy
Venezuela
The economy in Venezuela has had significant inflation in the last several years. We consolidate our Venezuelan results using our accounting policy for subsidiaries operating in highly inflationary economies.
Since 2003, the Venezuelan government has controlled the exchange of local currency into other currencies, including the U.S. dollar, and has required that currency exchanges be made at official rates established by the government instead of allowing open markets to determine currency rates. Different official rates exist for different industries and purposes and the government does not approve all requests to convert bolivars to other currencies.
As a result of the restrictions on currency exchange, we have in the past been unable to obtain sufficient U.S. dollars to purchase certain imported supplies and fixed assets to fully operate our business in Venezuela. Consequently, we have occasionally purchased more expensive, bolivar-denominated supplies and fixed assets. Furthermore, there is a risk that official currency exchange mechanisms will be discontinued or will not be accessible when needed in the future, which may prevent us from repatriating dividends or obtaining dollars to operate our Venezuelan operations. Since the end of 2013, we have only obtained $1.2 million dollars through official exchange mechanisms and these amounts were used in Venezuela operations.
Remeasurement rates during 2014. Through March 23, 2014, we used an official rate of 6.3 bolivars to the dollar to remeasure our bolivar-denominated monetary assets and liabilities into U.S. dollars and to translate our revenues and expenses. Effective March 24, 2014, the government initiated another exchange mechanism known as SICAD II and we began to use this exchange rate to remeasure bolivar-denominated monetary assets and liabilities and to translate our revenues and expenses. During 2014, the SICAD II rate averaged approximately 50 bolivars to the dollar and, at December 31, 2014, the rate was approximately 50 bolivars to the dollar.
We recognized a $121.6 million net remeasurement loss in 2014 when we changed from the official rate of 6.3 to the SICAD II exchange rate. The after-tax effect of these losses attributable to noncontrolling interests was $39.7 million in 2014. While the SICAD II process existed, we received approval to obtain $1.2 million (weighted-average exchange rate of 51) through this exchange mechanism.
Remeasurement rates during 2015. Through February 11, 2015, we used the SICAD II rates to remeasure our bolivar-denominated monetary assets and liabilities into U.S. dollars and to translate our revenue and expenses. Effective February 12, 2015, the SICAD II exchange mechanism was disbanded and we began to use the rate under the new exchange mechanism, known as SIMADI, to remeasure bolivar-denominated monetary assets and liabilities and to translate our revenue and expenses. The SIMADI rate ranged from 170 to 200 bolivars to the dollar since it was first published through the end of 2015. At December 31, 2015, it was 199 bolivars to the dollar. We recognized an $18.1 million net remeasurement loss in 2015. The after-tax effect of this loss attributable to noncontrolling interests was $5.6 million. We received minimal U.S. dollars using the SIMADI process.
Remeasurement rates during 2016. In the first quarter of 2016, the Venezuelan government announced that they would replace the SIMADI exchange mechanism with the DICOM exchange mechanism and would allow the DICOM exchange mechanism rate to float freely. At March 31, 2016, the DICOM rate was approximately 273 bolivars to the dollar. Since March 31, 2016, the rate has declined 59% to close at approximately 674 bolivars to the dollar at December 31, 2016. We have received only minimal U.S. dollars through this exchange mechanism. We recognized a $4.8 million pretax remeasurement loss in 2016. However, the after-tax effect in the current period attributable to noncontrolling interest was income of $2.7 million.
56
Items related to our Venezuelan operations are as follows:
• | Our investment in our Venezuelan operations on an equity-method basis was $19.2 million at December 31, 2016, and $26.0 million at December 31, 2015. |
• | Our Venezuelan operations had net payables to other Brink's affiliates of $6.1 million at December 31, 2016 and $18.7 million at December 31, 2015. |
• | Our Venezuelan operations had net nonmonetary assets of $17.6 million at December 31, 2016, and $13.5 million at December 31, 2015. |
• | Our bolivar-denominated net monetary net assets were $1.4 million (including $6.8 million of cash and cash equivalents) at December 31, 2016, and $9.5 million (including $6.2 million of cash and cash equivalents) at December 31, 2015. |
• | Accumulated other comprehensive losses attributable to Brink’s shareholders related to our operations in Venezuela were approximately $114.7 million at December 31, 2016 and $113.0 million at December 31, 2015. |
Argentina
We use the official exchange rate to translate the Brink's Argentina balance sheet and income statement. During 2015, the official exchange rate ranged from 8.5 to 9.8 local pesos to the U.S. dollar until December 17, 2015 when the currency was devalued. At December 31, 2016, the official exchange rate was 15.9 Argentine pesos to the U.S. dollar.
The government in Argentina had previously imposed limits on the exchange of Argentine pesos into U.S. dollars. As a result, we elected in the past and may continue in the future to repatriate cash from Argentina using different markets to convert Argentine pesos into U.S. dollars if U.S. dollars are not readily available. Conversions prior to the December 17, 2015 devaluation had settled at rates approximately 30% to 40% less favorable than the rates at which we translated the financial statements of our subsidiary in Argentina. After the December 2015 devaluation of the Argentine peso, the market rates used to convert Argentine pesos into U.S. dollars have been similar to the rates at which we translate the financial statements of our subsidiary in Argentina. See Note 19 for more information.
We recognized losses from converting Argentine pesos into U.S. dollars of $0.1 million in 2016, $7.1 million in 2015 and $3.6 million in 2014. These conversion losses are classified in the consolidated statements of operations as other operating income (expense). At December 31, 2016, we had cash denominated in Argentine pesos of $11.6 million.
The economy in Argentina has had significant inflation in recent years. As of December 31, 2016, Argentina was not designated as a highly inflationary economy for accounting purposes. We will continue to monitor developments in Argentina at each reporting date to determine whether we should consolidate Brink's Argentina results using our accounting policy for subsidiaries operating in highly inflationary economies.
RECENT ACCOUNTING PRONOUNCEMENTS
In February 2016, the FASB issued ASU 2016-02, Leases (Topic 842), which will require the recognition of assets and liabilities by lessees for certain leases classified as operating leases under current accounting guidance. The new standard also requires expanded disclosures regarding leasing activities. ASU 2016-02 will be effective January 1, 2019 and we are assessing the potential impact of the standard on financial reporting.
In March 2016, the FASB issued ASU 2016-09, Improvements to Employee Share-Based Payment Accounting, which simplifies how certain features related to share-based payments are accounted for and presented in the financial statements. We elected to early adopt this ASU in the fourth quarter of 2016 and, per the requirements of the pronouncement, we applied the amendments to the beginning of 2016. Under ASU 2016-09, accounting changes adopted using the modified retrospective method must be calculated as of the beginning of 2016 and reported as a cumulative-effect adjustment. As a result, we recognized a $0.2 million cumulative-effect adjustment to January 1, 2016 retained earnings for previously unrecognized excess tax benefits. We have elected to continue our previous accounting policy of estimating forfeitures and, therefore, we did not recognize any cumulative-effect adjustment related to forfeitures. ASU 2016-09 requires that accounting changes adopted using the prospective method should be reported in the applicable interim periods of 2016. We did not have any material changes to previously reported interim financial information in 2016 as it relates to the recognition of excess tax benefits in the statement of operations or the classification of excess tax benefits in the statement of cash flows.
In June 2016, the FASB issued ASU 2016-13, Measurement of Credit Losses on Financial Instruments, which significantly changes the way entities recognize impairment of many financial assets by requiring immediate recognition of estimated credit losses expected to occur over their remaining life. ASU 2016-13 is effective January 1, 2020, with early adoption permitted January 1, 2019. We are assessing the potential impact of this new standard on financial reporting.
In November 2016, the FASB issues ASU 2016-18, Statement of Cash Flows: Restricted Cash, which requires entities to include restricted cash and restricted cash equivalent balances with cash and cash equivalent balances in the statement of cash flows. ASU 2016-18 will be effective January 1, 2018 and will impact the presentation of our statement of cash flows.
In May 2014, the FASB issued ASU 2014-09, Revenue From Contracts with Customers, a new standard related to revenue recognition which requires an entity to recognize an amount of revenue to which it expects to be entitled for the transfer of promised goods and services to customers. The new standard will replace most of the existing revenue recognition standards in U.S. GAAP. In August 2015, the FASB issued ASU 2015-14, which defers the effective date of this new standard to January 1, 2018. Subsequently, the FASB has continued to refine
57
the standard and has issued several amendments. We have not yet completed our final review of the impact of this guidance but we believe that the most likely effects will be related to variable consideration and capitalization of costs to obtain contracts. We are also continuing to review potential disclosures and our method of adoption in order to complete our evaluation. Based on our preliminary assessment, we do not expect a material impact on our financial reporting.
58
ITEM 7A. QUANTITATIVE AND QUALITATIVE DISCLOSURES ABOUT MARKET RISK
We currently serve customers in more than 100 countries, including 40 countries where we operate subsidiaries. These operations expose us to a variety of market risks, including the effects of changes in interest rates, commodity prices and foreign currency exchange rates. These financial and commodity exposures are monitored and managed by us as an integral part of our overall risk management program.
We periodically use various derivative and non-derivative financial instruments, as discussed below, to hedge our interest rate, commodity prices and foreign currency exposures when appropriate. The risk that counterparties to these instruments may be unable to perform is minimized by limiting the counterparties used to major financial institutions with investment grade credit ratings. We do not expect to incur a loss from the failure of any counterparty to perform under the agreements. We do not use derivative financial instruments for purposes other than hedging underlying financial or commercial exposures.
The sensitivity analyses discussed below for the market risk exposures were based on the facts and circumstances in effect at December 31, 2016. Actual results will be determined by a number of factors that are not under management’s control and could vary materially from those disclosed.
Interest Rate Risk
We use both fixed and floating rate debt and leases to finance our operations. Floating rate obligations, including our Revolving Facility, expose us to fluctuations in cash flows due to changes in the general level of interest rates. Fixed rate obligations, including our unsecured notes, are subject to fluctuations in fair values as a result of changes in interest rates.
Our floating rate debt typically is based on an underlying floating rate component as well as a fixed rate margin component. Based on the contractual interest rates on our floating rate debt at December 31, 2016, a hypothetical 10% increase in rates would increase cash outflows by approximately $0.5 million over a twelve-month period. In other words, the weighted-average interest rate on our floating rate instruments (including any fixed rate margin component) was 2.8% per annum at December 31, 2016. If the underlying floating rate component were to increase by 10%, our average rate on this debt would increase by 0.2 percentage points to 3.0%. The effect on the fair values on our unsecured notes for a hypothetical 10% decrease in the yield curve from year-end 2016 levels would result in a $1.2 million increase for our unsecured notes in the fair values of the debt.
Foreign Currency Risk
We have exposure to the effects of foreign currency exchange rate fluctuations on the results of all of our foreign operations. Our foreign operations generally use local currencies to conduct business but their results are reported in U.S. dollars.
We are also exposed periodically to the foreign currency rate fluctuations that affect transactions not denominated in the functional currency of domestic and foreign operations. To mitigate these exposures, we, from time to time, enter into foreign currency forward and swap contracts. At December 31, 2016, the notional value of our shorter term outstanding foreign currency forward and swap contracts was $41.9 million with average contract maturities of approximately one month. These shorter term contracts primarily offset exposures in the British pound and the Mexican peso. Additionally, these shorter term contracts are not designated as hedges for accounting purposes, and accordingly, changes in their fair value are recorded immediately in earnings. We also have a longer term cross currency swap contract to hedge exposure in the Brazilian real which is designated as a cash flow hedge for accounting purposes. At December 31, 2016, the notional value of that longer term contract was $7.9 million with a weighted-average maturity of 0.6 years. We do not use derivative financial instruments to hedge investments in foreign subsidiaries since such investments are long-term in nature.
The effects of a hypothetical simultaneous 10% appreciation in the U.S. dollar from the 2016 levels against all other currencies of countries in which we have continuing operations are as follows:
(In millions) | Hypothetical Effects Increase/ (decrease) | ||
Effect on Earnings: | |||
Translation of 2016 earnings into U.S. dollars | $ | (13.6 | ) |
Transaction gains (losses) | 0.4 | ||
Effect on Other Comprehensive Income (Loss): | |||
Translation of net assets of foreign subsidiaries | (70.0 | ) | |
The hypothetical foreign currency effects above detail the consolidated effect attributable to Brink’s of a simultaneous change in the value of a large number of foreign currencies relative to the U. S. dollar. The foreign currency exposure effect related to a change in an individual currency could be significantly different.
59
ITEM 8. FINANCIAL STATEMENTS AND SUPPLEMENTARY DATA
THE BRINK’S COMPANY
CONSOLIDATED FINANCIAL STATEMENTS
FOR THE YEAR ENDED DECEMBER 31, 2016
TABLE OF CONTENTS
Page | ||
60
MANAGEMENT’S ANNUAL REPORT ON INTERNAL CONTROL OVER FINANCIAL REPORTING
Management of the Company is responsible for establishing and maintaining adequate internal control over financial reporting as defined in Rule 13a-15(f) under the Securities Exchange Act of 1934. Our internal control over financial reporting is designed to provide reasonable assurance to our management and board of directors regarding the preparation and fair presentation of published financial statements.
Because of its inherent limitations, internal control over financial reporting may not prevent or detect misstatements. Therefore, even those systems determined to be effective can provide only reasonable assurance with respect to financial statement preparation and presentation.
Management assessed the effectiveness of our internal control over financial reporting as of December 31, 2016. In making this assessment, management used the criteria set forth by the Committee of Sponsoring Organizations of the Treadway Commission (COSO) in “Internal Control – Integrated Framework (2013).”
Based on this assessment, our management believes that, as of December 31, 2016, our internal control over financial reporting is effective based on the COSO criteria.
KPMG LLP, the independent registered public accounting firm which audits our consolidated financial statements, has issued an attestation report of our internal control over financial reporting. KPMG’s attestation report appears on page 62.
61
Report of Independent Registered Public Accounting Firm
The Board of Directors and Stockholders
The Brink’s Company:
We have audited The Brink’s Company’s (the Company) internal control over financial reporting as of December 31, 2016, based on criteria established in Internal Control - Integrated Framework (2013) issued by the Committee of Sponsoring Organizations of the Treadway Commission (COSO). The Company’s management is responsible for maintaining effective internal control over financial reporting and for its assessment of the effectiveness of internal control over financial reporting, included in the accompanying Management’s Annual Report on Internal Control over Financial Reporting. Our responsibility is to express an opinion on the Company’s internal control over financial reporting based on our audit.
We conducted our audit in accordance with the standards of the Public Company Accounting Oversight Board (United States). Those standards require that we plan and perform the audit to obtain reasonable assurance about whether effective internal control over financial reporting was maintained in all material respects. Our audit included obtaining an understanding of internal control over financial reporting, assessing the risk that a material weakness exists, and testing and evaluating the design and operating effectiveness of internal control based on the assessed risk. Our audit also included performing such other procedures as we considered necessary in the circumstances. We believe that our audit provides a reasonable basis for our opinion.
A company’s internal control over financial reporting is a process designed to provide reasonable assurance regarding the reliability of financial reporting and the preparation of financial statements for external purposes in accordance with generally accepted accounting principles. A company’s internal control over financial reporting includes those policies and procedures that (1) pertain to the maintenance of records that, in reasonable detail, accurately and fairly reflect the transactions and dispositions of the assets of the company; (2) provide reasonable assurance that transactions are recorded as necessary to permit preparation of financial statements in accordance with generally accepted accounting principles, and that receipts and expenditures of the company are being made only in accordance with authorizations of management and directors of the company; and (3) provide reasonable assurance regarding prevention or timely detection of unauthorized acquisition, use, or disposition of the company’s assets that could have a material effect on the financial statements.
Because of its inherent limitations, internal control over financial reporting may not prevent or detect misstatements. Also, projections of any evaluation of effectiveness to future periods are subject to the risk that controls may become inadequate because of changes in conditions, or that the degree of compliance with the policies or procedures may deteriorate.
In our opinion, The Brink’s Company maintained, in all material respects, effective internal control over financial reporting as of December 31, 2016, based on criteria established in Internal Control - Integrated Framework (2013) issued by the Committee of Sponsoring Organizations of the Treadway Commission (COSO).
We also have audited, in accordance with the standards of the Public Company Accounting Oversight Board (United States), the consolidated balance sheets of The Brink’s Company and subsidiaries as of December 31, 2016 and 2015, and the related consolidated statements of operations, comprehensive income (loss), equity, and cash flows for each of the years in the three-year period ended December 31, 2016, and our report dated February 23, 2017, expressed an unqualified opinion on those consolidated financial statements.
/s/ KPMG LLP
Richmond, Virginia
February 23, 2017
62
Report of Independent Registered Public Accounting Firm
The Board of Directors and Stockholders
The Brink’s Company:
We have audited the accompanying consolidated balance sheets of The Brink’s Company and subsidiaries as of December 31, 2016 and 2015, and the related consolidated statements of operations, comprehensive income (loss), equity, and cash flows for each of the years in the three‑year period ended December 31, 2016. These consolidated financial statements are the responsibility of the Company’s management. Our responsibility is to express an opinion on these consolidated financial statements based on our audits.
We conducted our audits in accordance with the standards of the Public Company Accounting Oversight Board (United States). Those standards require that we plan and perform the audit to obtain reasonable assurance about whether the financial statements are free of material misstatement. An audit includes examining, on a test basis, evidence supporting the amounts and disclosures in the financial statements. An audit also includes assessing the accounting principles used and significant estimates made by management, as well as evaluating the overall financial statement presentation. We believe that our audits provide a reasonable basis for our opinion.
In our opinion, the consolidated financial statements referred to above present fairly, in all material respects, the financial position of The Brink’s Company and subsidiaries as of December 31, 2016 and 2015, and the results of their operations and their cash flows for each of the years in the three‑year period ended December 31, 2016, in conformity with U.S. generally accepted accounting principles.
We also have audited, in accordance with the standards of the Public Company Accounting Oversight Board (United States), The Brink’s Company’s internal control over financial reporting as of December 31, 2016, based on criteria established in Internal Control - Integrated Framework (2013) issued by the Committee of Sponsoring Organizations of the Treadway Commission (COSO), and our report dated February 23, 2017 expressed an unqualified opinion on the effectiveness of the Company’s internal control over financial reporting.
/s/ KPMG LLP
Richmond, Virginia
February 23, 2017
63
THE BRINK’S COMPANY
and subsidiaries
Consolidated Balance Sheets
December 31, | ||||||
(In millions, except for per share amounts) | 2016 | 2015 | ||||
ASSETS | ||||||
Current assets: | ||||||
Cash and cash equivalents | $ | 183.5 | 181.9 | |||
Restricted cash | 55.5 | 16.4 | ||||
Accounts receivable (net of allowance: 2016 - $8.3; 2015 - $9.1) | 501.1 | 478.1 | ||||
Prepaid expenses and other | 103.6 | 101.3 | ||||
Total current assets | 843.7 | 777.7 | ||||
Property and equipment, net | 531.0 | 549.0 | ||||
Goodwill | 186.2 | 185.3 | ||||
Other intangibles | 19.1 | 28.5 | ||||
Deferred income taxes | 327.9 | 329.8 | ||||
Other | 86.9 | 76.4 | ||||
Total assets | $ | 1,994.8 | 1,946.7 | |||
LIABILITIES AND EQUITY | ||||||
Current liabilities: | ||||||
Short-term borrowings | $ | 162.8 | 32.6 | |||
Current maturities of long-term debt | 32.8 | 39.8 | ||||
Accounts payable | 139.3 | 155.3 | ||||
Accrued liabilities | 385.7 | 401.2 | ||||
Restricted cash held for customers | 33.2 | 12.9 | ||||
Total current liabilities | 753.8 | 641.8 | ||||
Long-term debt | 247.6 | 358.1 | ||||
Accrued pension costs | 208.8 | 219.4 | ||||
Retirement benefits other than pensions | 286.1 | 259.2 | ||||
Deferred income taxes | 7.6 | 8.1 | ||||
Other | 136.1 | 129.5 | ||||
Total liabilities | 1,640.0 | 1,616.1 | ||||
Commitments and contingent liabilities (notes 3, 4, 13, 15, 18, 22 and 23) | ||||||
Equity: | ||||||
The Brink’s Company (“Brink’s”) shareholders: | ||||||
Common stock, par value $1 per share: | ||||||
Shares authorized: 100.0 | ||||||
Shares issued and outstanding: 2016 - 50.0; 2015 - 48.9 | 50.0 | 48.9 | ||||
Capital in excess of par value | 618.1 | 599.6 | ||||
Retained earnings | 576.0 | 561.3 | ||||
Accumulated other comprehensive income (loss): | ||||||
Benefit plan adjustments | (559.6 | ) | (570.5 | ) | ||
Foreign currency translation | (349.1 | ) | (322.6 | ) | ||
Unrealized gains on available-for-sale securities | 1.0 | 1.1 | ||||
Gains on cash flow hedges | 0.7 | 0.1 | ||||
Accumulated other comprehensive loss | (907.0 | ) | (891.9 | ) | ||
Brink’s shareholders | 337.1 | 317.9 | ||||
Noncontrolling interests | 17.7 | 12.7 | ||||
Total equity | 354.8 | 330.6 | ||||
Total liabilities and equity | $ | 1,994.8 | 1,946.7 | |||
See accompanying notes to consolidated financial statements.
64
THE BRINK’S COMPANY
and subsidiaries
Consolidated Statements of Operations
Years Ended December 31, | |||||||||
(In millions, except for per share amounts) | 2016 | 2015 | 2014 | ||||||
Revenues | $ | 3,020.6 | 3,061.4 | 3,562.3 | |||||
Costs and expenses: | |||||||||
Cost of revenues | 2,424.8 | 2,471.6 | 2,948.2 | ||||||
Selling, general and administrative expenses | 431.5 | 463.8 | 560.6 | ||||||
Total costs and expenses | 2,856.3 | 2,935.4 | 3,508.8 | ||||||
Other operating expense | (20.1 | ) | (69.4 | ) | (81.0 | ) | |||
Operating profit (loss) | 144.2 | 56.6 | (27.5 | ) | |||||
Interest expense | (20.4 | ) | (18.9 | ) | (23.4 | ) | |||
Interest and other income | 1.2 | 3.4 | 1.9 | ||||||
Income (loss) from continuing operations before tax | 125.0 | 41.1 | (49.0 | ) | |||||
Provision for income taxes | 78.5 | 66.5 | 36.7 | ||||||
Income (loss) from continuing operations | 46.5 | (25.4 | ) | (85.7 | ) | ||||
Loss from discontinued operations, net of tax | (1.7 | ) | (2.8 | ) | (29.1 | ) | |||
Net income (loss) | 44.8 | (28.2 | ) | (114.8 | ) | ||||
Less net income (loss) attributable to noncontrolling interests | 10.3 | (16.3 | ) | (30.9 | ) | ||||
Net income (loss) attributable to Brink’s | $ | 34.5 | (11.9 | ) | (83.9 | ) | |||
Amounts attributable to Brink’s: | |||||||||
Continuing operations | $ | 36.2 | (9.1 | ) | (54.8 | ) | |||
Discontinued operations | (1.7 | ) | (2.8 | ) | (29.1 | ) | |||
Net income (loss) attributable to Brink’s | $ | 34.5 | (11.9 | ) | (83.9 | ) | |||
Earnings (loss) per share attributable to Brink’s common shareholders(a): | |||||||||
Basic: | |||||||||
Continuing operations | $ | 0.72 | (0.19 | ) | (1.12 | ) | |||
Discontinued operations | (0.03 | ) | (0.06 | ) | (0.59 | ) | |||
Net income (loss) | 0.69 | (0.24 | ) | (1.71 | ) | ||||
Diluted: | |||||||||
Continuing operations | $ | 0.72 | (0.19 | ) | (1.12 | ) | |||
Discontinued operations | (0.03 | ) | (0.06 | ) | (0.59 | ) | |||
Net income (loss) | 0.68 | (0.24 | ) | (1.71 | ) | ||||
Weighted-average shares | |||||||||
Basic | 50.0 | 49.3 | 49.0 | ||||||
Diluted | 50.6 | 49.3 | 49.0 | ||||||
(a) Amounts may not add due to rounding.
See accompanying notes to consolidated financial statements.
65
THE BRINK’S COMPANY
and subsidiaries
Consolidated Statements of Comprehensive Income (Loss)
Years Ended December 31, | |||||||||
(In millions) | 2016 | 2015 | 2014 | ||||||
Net income (loss) | $ | 44.8 | (28.2 | ) | (114.8 | ) | |||
Benefit plan adjustments: | |||||||||
Benefit plan experience gains (losses) | 12.6 | 4.4 | (134.3 | ) | |||||
Benefit plan prior service costs | (1.6 | ) | (3.6 | ) | (2.9 | ) | |||
Deferred profit sharing | (0.3 | ) | — | 0.3 | |||||
Total benefit plan adjustments | 10.7 | 0.8 | (136.9 | ) | |||||
Foreign currency translation adjustments | (26.3 | ) | (104.1 | ) | (87.0 | ) | |||
Unrealized net losses on available-for-sale securities | (0.1 | ) | (0.5 | ) | (0.4 | ) | |||
Gains (loss) on cash flow hedges | 0.8 | (0.3 | ) | (0.2 | ) | ||||
Other comprehensive loss before tax | (14.9 | ) | (104.1 | ) | (224.5 | ) | |||
Provision (benefit) for income taxes | 0.9 | (0.7 | ) | (43.0 | ) | ||||
Other comprehensive loss | (15.8 | ) | (103.4 | ) | (181.5 | ) | |||
Comprehensive income (loss) | 29.0 | (131.6 | ) | (296.3 | ) | ||||
Less comprehensive income (loss) attributable to noncontrolling interests | 9.6 | (20.1 | ) | (37.7 | ) | ||||
Comprehensive income (loss) attributable to Brink’s | $ | 19.4 | (111.5 | ) | (258.6 | ) | |||
See accompanying notes to consolidated financial statements.
66
THE BRINK’S COMPANY
and subsidiaries
Consolidated Statements of Equity
Years Ended December 31, 2016, 2015 and 2014
(In millions) | Shares | Common Stock | Capital in Excess of Par Value | Retained Earnings | Accumulated Other Comprehensive Loss | Attributable to Noncontrolling Interests | Total | ||||||||
Balance as of December 31, 2013 | 48.4 | $ | 48.4 | 566.4 | 696.4 | (617.3 | ) | 85.6 | 779.5 | ||||||
Net loss | — | — | — | (83.9 | ) | — | (30.9 | ) | (114.8 | ) | |||||
Other comprehensive loss | — | — | — | — | (174.7 | ) | (6.8 | ) | (181.5 | ) | |||||
Dividends to: | |||||||||||||||
Brink’s common shareholders ($0.40 per share) | — | — | — | (19.4 | ) | — | — | (19.4 | ) | ||||||
Noncontrolling interests | — | — | — | — | — | (8.6 | ) | (8.6 | ) | ||||||
Share-based compensation: | |||||||||||||||
Stock options and awards: | |||||||||||||||
Compensation expense | — | — | 17.3 | — | — | — | 17.3 | ||||||||
Consideration from exercise of stock options | — | — | 0.4 | — | — | — | 0.4 | ||||||||
Reduction in excess tax benefit of stock compensation | — | — | (0.6 | ) | — | — | — | (0.6 | ) | ||||||
Other share-based benefit transactions | 0.2 | 0.2 | 1.0 | (0.2 | ) | — | — | 1.0 | |||||||
Capital contributions from noncontrolling interest | — | — | — | — | — | 0.5 | 0.5 | ||||||||
Balance as of December 31, 2014 | 48.6 | 48.6 | 584.5 | 592.9 | (792.0 | ) | 39.8 | 473.8 | |||||||
Net loss | — | — | — | (11.9 | ) | — | (16.3 | ) | (28.2 | ) | |||||
Other comprehensive loss | — | — | — | — | (99.6 | ) | (3.8 | ) | (103.4 | ) | |||||
Dividends to: | |||||||||||||||
Brink’s common shareholders ($0.40 per share) | — | — | — | (19.5 | ) | — | — | (19.5 | ) | ||||||
Noncontrolling interests | — | — | — | — | — | (5.3 | ) | (5.3 | ) | ||||||
Share-based compensation: | |||||||||||||||
Stock options and awards: | |||||||||||||||
Compensation expense | — | — | 14.1 | — | — | — | 14.1 | ||||||||
Consideration from exercise of stock options | 0.2 | 0.2 | 3.6 | — | — | — | 3.8 | ||||||||
Reduction in excess tax benefit of stock compensation | — | — | (1.8 | ) | — | — | — | (1.8 | ) | ||||||
Other share-based benefit transactions | 0.1 | 0.1 | 0.6 | (0.2 | ) | — | — | 0.5 | |||||||
Business dispositions | — | — | — | — | — | (1.9 | ) | (1.9 | ) | ||||||
Acquisitions of noncontrolling interests | — | — | (1.4 | ) | — | (0.3 | ) | 0.2 | (1.5 | ) | |||||
Balance as of December 31, 2015 | 48.9 | 48.9 | 599.6 | 561.3 | (891.9 | ) | 12.7 | 330.6 | |||||||
Cumulative effect of change in accounting principle(a) | — | — | — | 0.2 | — | — | 0.2 | ||||||||
Net income | — | — | — | 34.5 | — | 10.3 | 44.8 | ||||||||
Other comprehensive loss | — | — | — | — | (15.1 | ) | (0.7 | ) | (15.8 | ) | |||||
Common stock issued | 0.1 | 0.1 | 2.9 | — | — | — | 3.0 | ||||||||
Dividends to: | |||||||||||||||
Brink’s common shareholders ($0.40 per share) | — | — | — | (19.8 | ) | — | — | (19.8 | ) | ||||||
Noncontrolling interests | — | — | — | — | — | (4.6 | ) | (4.6 | ) | ||||||
Share-based compensation: | |||||||||||||||
Stock options and awards: | |||||||||||||||
Compensation expense | — | — | 9.5 | — | — | — | 9.5 | ||||||||
Consideration from exercise of stock options | 0.5 | 0.5 | 11.7 | — | — | — | 12.2 | ||||||||
Other share-based benefit transactions | 0.5 | 0.5 | (5.6 | ) | (0.2 | ) | — | — | (5.3 | ) | |||||
Balance as of December 31, 2016 | 50.0 | $ | 50.0 | 618.1 | 576.0 | (907.0 | ) | 17.7 | 354.8 | ||||||
(a) | We elected to early adopt the provisions of ASU 2016-09, Improvements to Employee Share-Based Payment Accounting, in the fourth quarter of 2016 resulting in a cumulative effect adjustment to Retained Earnings for previously unrecognized excess tax benefits. See Note 1 for further discussion of the impacts of this standard. |
See accompanying notes to consolidated financial statements.
67
THE BRINK’S COMPANY
and subsidiaries
Consolidated Statements of Cash Flows
Years Ended December 31, | |||||||||
(In millions) | 2016 | 2015 | 2014 | ||||||
Cash flows from operating activities: | |||||||||
Net income (loss) | $ | 44.8 | (28.2 | ) | (114.8 | ) | |||
Adjustments to reconcile net income (loss) to net cash provided by operating activities: | |||||||||
Loss from discontinued operations, net of tax | 1.7 | 2.8 | 29.1 | ||||||
Depreciation and amortization | 131.6 | 139.9 | 161.9 | ||||||
Share-based compensation expense | 9.5 | 14.1 | 17.3 | ||||||
Deferred income taxes | (2.9 | ) | 7.1 | (28.4 | ) | ||||
Gains and losses: | |||||||||
Marketable securities | (0.5 | ) | (1.1 | ) | (0.4 | ) | |||
Property and other assets | 1.3 | (0.9 | ) | (44.9 | ) | ||||
Business acquisitions and dispositions | (0.1 | ) | 6.3 | — | |||||
Venezuela impairment | — | 35.3 | — | ||||||
Other impairment losses | 20.6 | 1.9 | 3.3 | ||||||
Retirement benefit funding (more) less than expense: | |||||||||
Pension | 13.6 | 10.8 | (23.6 | ) | |||||
Other than pension | 13.7 | 9.2 | 1.5 | ||||||
Remeasurement losses due to Venezuela currency devaluations | 4.8 | 18.1 | 121.6 | ||||||
Other operating | 3.7 | 2.6 | 7.6 | ||||||
Changes in operating assets and liabilities, net of effects of acquisitions: | |||||||||
Accounts receivable and income taxes receivable | (53.2 | ) | (44.8 | ) | (90.7 | ) | |||
Accounts payable, income taxes payable and accrued liabilities | 13.9 | 20.1 | 105.5 | ||||||
Customer obligations | (13.2 | ) | 12.5 | 15.4 | |||||
Prepaid and other current assets | (10.0 | ) | (3.4 | ) | (9.9 | ) | |||
Other | (11.8 | ) | (4.4 | ) | (14.7 | ) | |||
Discontinued operations | — | (2.0 | ) | 5.5 | |||||
Net cash provided by operating activities | 167.5 | 195.9 | 141.3 | ||||||
Cash flows from investing activities: | |||||||||
Capital expenditures | (112.2 | ) | (101.1 | ) | (136.1 | ) | |||
Acquisitions | (0.7 | ) | — | (4.6 | ) | ||||
Dispositions, net of cash disposed | (0.6 | ) | (14.6 | ) | — | ||||
Marketable securities: | |||||||||
Purchases | (9.2 | ) | (27.3 | ) | — | ||||
Sales | 9.1 | 33.9 | 0.9 | ||||||
Cash proceeds from sale of property, equipment and investments | 4.7 | 1.9 | 62.7 | ||||||
Other | — | 1.6 | (3.6 | ) | |||||
Discontinued operations | — | 1.9 | (13.3 | ) | |||||
Net cash used by investing activities | (108.9 | ) | (103.7 | ) | (94.0 | ) | |||
Cash flows from financing activities: | |||||||||
Borrowings (repayments) of debt: | |||||||||
Short-term borrowings | 115.0 | (22.7 | ) | (7.8 | ) | ||||
Long-term revolving credit facilities: | |||||||||
Borrowings | 494.0 | 569.5 | 703.8 | ||||||
Repayments | (606.2 | ) | (633.9 | ) | (588.8 | ) | |||
Other long-term debt: | |||||||||
Borrowings | 4.8 | 86.1 | 7.5 | ||||||
Repayments | (39.0 | ) | (42.0 | ) | (81.0 | ) | |||
Acquisitions of noncontrolling interests | — | (1.5 | ) | — | |||||
Nonrecourse financing of real estate transaction | — | 14.5 | — | ||||||
Common stock issued | 3.0 | — | — | ||||||
Dividends to: | |||||||||
Shareholders of Brink’s | (19.8 | ) | (19.5 | ) | (19.4 | ) | |||
Noncontrolling interests in subsidiaries | (4.6 | ) | (5.3 | ) | (8.6 | ) | |||
Proceeds from exercise of stock options | 12.2 | 3.8 | 0.4 | ||||||
Minimum tax withholdings associated with share-based compensation | (6.6 | ) | (2.0 | ) | (1.2 | ) | |||
Other | 2.3 | 0.3 | (1.6 | ) | |||||
Discontinued operations | — | 0.2 | — | ||||||
Net cash (used) provided by financing activities | (44.9 | ) | (52.5 | ) | 3.3 | ||||
Effect of exchange rate changes on cash and cash equivalents | (12.1 | ) | (34.0 | ) | (129.9 | ) | |||
Cash and cash equivalents: | |||||||||
Increase (decrease) | 1.6 | 5.7 | (79.3 | ) | |||||
Balance at beginning of period | 181.9 | 176.2 | 255.5 | ||||||
Balance at end of period | $ | 183.5 | 181.9 | 176.2 | |||||
See accompanying notes to consolidated financial statements.
68
THE BRINK’S COMPANY
and subsidiaries
NOTES TO CONSOLIDATED FINANCIAL STATEMENTS
Note 1 - Summary of Significant Accounting Policies
Basis of Presentation
The Brink’s Company (along with its subsidiaries, “we,” “our,” “Brink’s” or the “Company”), based in Richmond, Virginia, is a leading provider of secure transportation, cash management services and other security-related services to banks and financial institutions, retailers, government agencies, mints, jewelers and other commercial operations around the world. Brink’s is the oldest and largest secure transportation and cash management services company in the U.S., and a market leader in many other countries.
Principles of Consolidation
The consolidated financial statements include the accounts of Brink’s and the subsidiaries it controls. Control is determined based on ownership rights or, when applicable, based on whether we are considered to be the primary beneficiary of a variable interest entity. Our interest in 20% to 50% owned companies that are not controlled are accounted for using the equity method (“equity affiliates”), unless we do not sufficiently influence the management of the investee. Other investments are accounted for as cost-method investments or as available-for-sale investments. All significant intercompany accounts and transactions have been eliminated in consolidation.
Revenue Recognition
Revenue is recognized when services related to armored vehicle transportation, ATM services, Cash Management Services, payment services, guarding and the secure international transportation of valuables are performed. Customer contracts have prices that are fixed and determinable and we assess the customer’s ability to meet the contractual terms, including payment terms, before entering into contracts. Taxes collected from customers and remitted to governmental authorities are not included in revenues in the consolidated statements of operations.
Cash and Cash Equivalents
Cash and cash equivalents include cash on hand, demand deposits and investments with original maturities of three months or less. Cash and cash equivalents include amounts held by certain of our secure Cash Management Services operations for customers for which, under local regulations, the title transfers to us for a short period of time. The cash is generally credited to customers’ accounts the following day and we do not consider it as available for general corporate purposes in the management of our liquidity and capital resources. We record a liability for the amounts owed to customers (see Note 11).
Trade Accounts Receivable
Trade accounts receivable are recorded at the invoiced amount and do not bear interest. The allowance for doubtful accounts is our best estimate of the amount of probable credit losses on our existing accounts receivable. We determine the allowance based on historical write-off experience. We review our allowance for doubtful accounts quarterly. Account balances are charged off against the allowance after all means of collection have been exhausted and the potential for recovery is considered remote.
Property and Equipment
Property and equipment are recorded at cost. Depreciation is calculated principally on the straight-line method based on the estimated useful lives of individual assets or classes of assets.
Leased property and equipment meeting capital lease criteria are capitalized at the lower of the present value of the related lease payments or the fair value of the leased asset at the inception of the lease. Amortization is calculated on the straight-line method based on the lease term.
Leasehold improvements are recorded at cost. Amortization is calculated principally on the straight-line method over the lesser of the estimated useful life of the leasehold improvement or the lease term. Renewal periods are included in the lease term when the renewal is determined to be reasonably assured.
Part of the costs related to the development or purchase of internal-use software is capitalized and amortized over the estimated useful life of the software. Costs that are capitalized include external direct costs of materials and services to develop or obtain the software, and internal costs, including compensation and employee benefits for employees directly associated with a software development project.
Estimated Useful Lives | Years |
Buildings | 16 to 25 |
Building leasehold improvements | 3 to 10 |
Vehicles | 3 to 10 |
Capitalized software | 3 to 5 |
Other machinery and equipment | 3 to 10 |
Expenditures for routine maintenance and repairs on property and equipment are charged to expense. Major renewals, betterments and modifications are capitalized and depreciated over the lesser of the remaining life of the asset or, if applicable, the lease term.
69
Goodwill and Other Intangible Assets
Goodwill is recognized for the excess of the purchase price over the fair value of tangible and identifiable intangible net assets of businesses acquired. Intangible assets arising from business acquisitions include customer lists, customer relationships, covenants not to compete, trademarks and other identifiable intangibles. At December 31, 2016, finite-lived intangible assets have remaining useful lives ranging from 1 to 11 years and are amortized based on the pattern in which the economic benefits are used or on a straight-line basis.
Impairment of Goodwill and Long-Lived Assets
Goodwill is not amortized but is tested at least annually for impairment at the reporting unit level, which is at the operating segment level or one level below an operating segment. Goodwill is assigned to one or more reporting units at the date of acquisition.
We have ten reporting units which are comprised of:
• | each of the five countries within Largest 5 Markets (U.S., France, Mexico, Brazil and Canada), |
• | each of the three regions within Global Markets (Latin America, EMEA and Asia), |
• | the Latin American Payment Services businesses, and |
• | the U.S. Payment Services business |
We performed goodwill impairment tests on the reporting units that had goodwill as of October 1, 2016. We performed a quantitative analysis to determine whether reporting unit fair values exceeded their carrying amounts. We based our estimates of fair value on projected future cash flows and completed these impairment tests, as well as the tests in the previous two years, with no impairment charges required.
Indefinite-lived intangibles are also tested for impairment at least annually by comparing their carrying values to their estimated fair values. We have had no significant impairments of indefinite-lived intangibles in the last three years.
Long-lived assets other than goodwill and other indefinite-lived intangibles are reviewed for impairment when events or changes in circumstances indicate the carrying value of an asset may not be recoverable.
For long-lived assets other than goodwill that are to be held and used in operations, an impairment is indicated when the estimated total undiscounted cash flow associated with the asset or group of assets is less than carrying value. If impairment exists, an adjustment is made to write the asset down to its fair value, and a loss is recorded as the difference between the carrying value and fair value.
Retirement Benefit Plans
We account for retirement benefit obligations under Financial Accounting Standards Board ("FASB") Accounting Standards Codification ("ASC") Topic 715, Compensation – Retirement Benefits. For U.S. and certain non-U.S. retirement plans, we derive the discount rates used to measure the present value of benefit obligations using the cash flow matching method. Under this method, we compare the plan’s projected payment obligations by year with the corresponding yields on a Mercer yield curve. Each year’s projected cash flows are then discounted back to their present value at the measurement date and an overall discount rate is determined. The overall discount rate is then rounded to the nearest tenth of a percentage point. In non-U.S. locations where the cash flow matching method is not possible, rates of local high-quality long-term government bonds are used to select the discount rate.
We used Mercer’s Above-Mean Curve to determine the discount rates for the year-end benefit obligations and retirement cost of our U.S. retirement plans.
We select the expected long-term rate of return assumption for our U.S. pension plan and retiree medical plans using advice from our investment advisor. The selected rate considers plan asset allocation targets, expected overall investment manager performance and long-term historical average compounded rates of return.
Benefit plan experience gains and losses are recognized in other comprehensive income (loss). Accumulated net benefit plan experience gains and losses that exceed 10% of the greater of a plan’s benefit obligation or plan assets at the beginning of the year are amortized into earnings from other comprehensive income (loss) on a straight-line basis. The amortization period for pension plans is the average remaining service period of employees expected to receive benefits under the plans. The amortization period for other retirement plans is primarily the average remaining life expectancy of inactive participants.
Income Taxes
Deferred tax assets and liabilities are recorded to recognize the expected future tax benefits or costs of events that have been, or will be, reported in different years for financial statement purposes than tax purposes. Deferred tax assets and liabilities are determined based on the difference between the financial statement and tax bases of assets and liabilities using enacted tax rates in effect for the year in which these items are expected to reverse. We recognize tax benefits related to uncertain tax positions if we believe it is more likely than not the benefit will be realized. We review our deferred tax assets to determine if it is more-likely-than-not that they will be realized. If we determine it is not more-likely-than-not that a deferred tax asset will be realized, we record a valuation allowance to reverse the previously recognized tax benefit.
70
Foreign Currency Translation
Our consolidated financial statements are reported in U.S. dollars. Our foreign subsidiaries maintain their records primarily in the currency of the country in which they operate.
The method of translating local currency financial information into U.S. dollars depends on whether the economy in which our foreign subsidiary operates has been designated as highly inflationary or not. Economies with a three-year cumulative inflation rate of more than 100% are considered highly inflationary.
Assets and liabilities of foreign subsidiaries in non-highly inflationary economies are translated into U.S. dollars using rates of exchange at the balance sheet date. Translation adjustments are recorded in other comprehensive income (loss). Revenues and expenses are translated at rates of exchange in effect during the year. Transaction gains and losses are recorded in net income (loss).
Foreign subsidiaries that operate in highly inflationary countries use the U.S. dollar as their functional currency. Local currency monetary assets and liabilities are remeasured into U.S. dollars using rates of exchange as of each balance sheet date, with remeasurement adjustments and other transaction gains and losses recognized in earnings. Non-monetary assets and liabilities do not fluctuate with changes in local currency exchange rates to the dollar.
Venezuela
The economy in Venezuela has had significant inflation in the last several years. We consolidate our Venezuelan results using our accounting policy for subsidiaries operating in highly inflationary economies.
Since 2003, the Venezuelan government has controlled the exchange of local currency into other currencies, including the U.S. dollar, and has required that currency exchanges be made at official rates established by the government instead of allowing open markets to determine currency rates. Different official rates exist for different industries and purposes and the government does not approve all requests to convert bolivars to other currencies.
As a result of the restrictions on currency exchange, we have in the past been unable to obtain sufficient U.S. dollars to purchase certain imported supplies and fixed assets to fully operate our business in Venezuela. Consequently, we have occasionally purchased more expensive, bolivar-denominated supplies and fixed assets. Furthermore, there is a risk that official currency exchange mechanisms will be discontinued or will not be accessible when needed in the future, which may prevent us from repatriating dividends or obtaining dollars to operate our Venezuelan operations.
Remeasurement rates during 2014. Through March 23, 2014, we used the official rate of 6.3 bolivars to the dollar to remeasure our bolivar-denominated monetary assets and liabilities into U.S. dollars and to translate our revenues and expenses. Effective March 24, 2014, the government initiated another exchange mechanism known as SICAD II and we began to use this exchange rate to remeasure bolivar-denominated monetary assets and liabilities and to translate our revenues and expenses. During 2014, the SICAD II rate averaged approximately 50 bolivars to the dollar and, at December 31, 2014, the rate was approximately 50 bolivars to the dollar.
We recognized a $121.6 million net remeasurement loss in 2014 when we changed from the 6.3 rate to the SICAD II exchange rate. The after-tax effect of these losses attributable to noncontrolling interests was $39.7 million in 2014.
While the SICAD II process existed, we received approval to obtain $1.2 million (weighted-average exchange rate of 51) through this exchange mechanism.
Remeasurement rates during 2015. Through February 11, 2015, we used the SICAD II rates to remeasure our bolivar-denominated monetary assets and liabilities into U.S. dollars and to translate our revenue and expenses. Effective February 12, 2015, the SICAD II exchange mechanism was disbanded and we began to use the rate under the new exchange mechanism, known as SIMADI, to remeasure bolivar-denominated monetary assets and liabilities and to translate our revenue and expenses. The SIMADI rate ranged from 170 to 200 bolivars to the dollar and, at December 31, 2015, it was 199 bolivars to the dollar. We recognized an $18.1 million net remeasurement loss in 2015. The after-tax effect of this loss attributable to noncontrolling interests was $5.6 million. We have received only minimal U.S. dollars using the SIMADI process.
Remeasurement rates during 2016. In the first quarter of 2016, the Venezuelan government announced that they would replace the SIMADI exchange mechanism with the DICOM exchange mechanism and would allow the DICOM exchange mechanism rate to float freely. At March 31, 2016, the DICOM rate was approximately 273 bolivars to the dollar. Since March 31, 2016, the rate declined 59% to close at approximately 674 bolivars to the dollar at December 31, 2016. We have received only minimal U.S. dollars through this exchange mechanism. We recognized a $4.8 million pretax remeasurement loss in 2016. However, the after-tax effect in the current period attributable to noncontrolling interest was income of $2.7 million.
71
Items related to our Venezuelan operations are as follows:
• | Our investment in our Venezuelan operations on an equity-method basis was $19.2 million at December 31, 2016, and $26.0 million at December 31, 2015. |
• | Our Venezuelan operations had net payables to other Brink's affiliates of $6.1 million at December 31, 2016 and $18.7 million at December 31, 2015. |
• | Our Venezuelan operations had net nonmonetary assets of $17.6 million at December 31, 2016, and $13.5 million at December 31, 2015. |
• | Our bolivar-denominated net monetary net assets were $1.4 million (including $6.8 million of cash and cash equivalents) at December 31, 2016, and $9.5 million (including $6.2 million of cash and cash equivalents) at December 31, 2015. |
• | Accumulated other comprehensive losses attributable to Brink’s shareholders related to our operations in Venezuela were approximately $114.7 million at December 31, 2016 and $113.0 million at December 31, 2015. |
Impairment of Long-lived Assets in Venezuela
During the second quarter of 2015, Brink's elected to evaluate and pursue strategic options for the Venezuelan business, which required us to perform an impairment review of the carrying values of our Venezuelan long-lived assets in accordance with FASB ASC Topic 360, Property, Plant and Equipment. Our asset impairment analysis included management's best estimate of associated cash flows relating to the long-lived assets and included fair value assumptions that reflect conditions that exist in a volatile economic environment. Future events or actions relative to our Venezuelan business may result in further adjustments.
As a result of our impairment analysis, we recognized a $35.3 million impairment charge in 2015. The current carrying value of the long-lived assets of our Venezuelan operations is $10.1 million at December 31, 2016. We have not reclassified any of the $114.7 million of accumulated other comprehensive losses attributable to Brink’s shareholders related to our operations in Venezuela into earnings.
Argentina
We use the official exchange rate to translate the Brink's Argentina balance sheet and income statement. During 2015, the official exchange rate ranged from 8.5 to 9.8 local pesos to the U.S. dollar until December 17, 2015 when the currency was devalued. At December 31, 2016, the official exchange rate was 15.9 Argentine pesos to the U.S. dollar.
The government in Argentina had previously imposed limits on the exchange of Argentine pesos into U.S. dollars. As a result, we elected in the past and may continue in the future to repatriate cash from Argentina using different markets to convert Argentine pesos into U.S. dollars if U.S. dollars are not readily available. Conversions prior to the December 17, 2015 devaluation had settled at rates approximately 30% to 40% less favorable than the rates at which we translated the financial statements of our subsidiary in Argentina. After the December 2015 devaluation of the Argentine peso, the market rates used to convert Argentine pesos into U.S. dollars have been similar to the rates at which we translate the financial statements of our subsidiary in Argentina. See Note 19 for more information.
We recognized losses from converting Argentine pesos into U.S. dollars of $0.1 million in 2016, $7.1 million in 2015 and $3.6 million in 2014. These conversion losses are classified in the consolidated statements of operations as other operating income (expense). At December 31, 2016, we had cash denominated in Argentine pesos of $11.6 million.
Ireland
Due to management's decision in the first quarter of 2016 to exit the Republic of Ireland, the prospective impacts of shutting down this operation are included in items not allocated to segments and are excluded from the operating segments effective March 1, 2016. Beginning May 1, 2016, due to management's decision to also exit Northern Ireland, the results of shutting down these operations are treated similarly to the Republic of Ireland. Revenues from both Ireland operations shut down in 2016 were approximately $20 million in 2015. International shipments to and from Ireland will continue to be provided through BGS.
Restricted Cash
In France, we offer services to certain of our customers where we manage some or all of their cash supply chains. In connection with this offering, we take temporary title to certain customers' cash, which is included as restricted cash in our financial statements due to customer agreement or regulation (see Note 19). During the second quarter of 2016, we identified a misclassification in our December 31, 2015 consolidated balance sheet included in our 2015 Annual Report on Form 10-K. This misclassification, which was corrected on our December 31, 2015 condensed consolidated balance sheet included on our Quarterly Report on Form 10-Q for the quarterly period ended June 30, 2016, decreased our December 31, 2015 cash and cash equivalents balance and increased restricted cash by $16.4 million, increased restricted cash held for customers and decreased accrued liabilities by $12.9 million, increased short-term borrowings and decreased current maturities of long-term debt by $3.5 million. This misclassification had no impact on our December 31, 2015 current assets and current liabilities and it did not impact our consolidated statement of operations, but impacts the December 31, 2015 consolidated statement of cash flows by reducing net cash provided by operating activities from $208.8 million to $195.9 million and increasing net cash used by financing activities from $49.0 million to $52.5 million. Neither of these changes affect comparability to the previous period. Accordingly, we do not consider this correction to be material to our consolidated balance sheet or statement of cash flows.
Concentration of Credit Risks
We routinely assess the financial strength of significant customers and this assessment, combined with the large number and geographic diversity of our customers, limits our concentration of risk with respect to accounts receivable. Financial instruments which potentially
72
subject us to concentrations of credit risks are principally cash and cash equivalents and accounts receivables. Cash and cash equivalents are held by major financial institutions.
Use of Estimates
In accordance with U.S. generally accepted accounting principles (“GAAP”), we have made a number of estimates and assumptions relating to the reporting of assets and liabilities and the disclosure of contingent assets and liabilities to prepare these consolidated financial statements. Actual results could differ materially from those estimates. The most significant estimates are related to goodwill, intangibles and other long-lived assets, pension and other retirement benefit assets and obligations, legal contingencies, deferred tax assets, purchase price allocations and foreign currency translation.
Fair-value estimates. We have various financial instruments included in our financial statements. Financial instruments are carried in our financial statements at either cost or fair value. We estimate fair value of assets using the following hierarchy using the highest level possible:
Level 1: Quoted prices in active markets that are accessible at the measurement date for identical assets and liabilities.
Level 2: Observable prices that are based on inputs not quoted on active markets, but are corroborated by market data.
Level 3: Unobservable inputs are used when little or no market data is available.
New Accounting Standards
In February 2016, the FASB issued ASU 2016-02, Leases (Topic 842), which will require the recognition of assets and liabilities by lessees for certain leases classified as operating leases under current accounting guidance. The new standard also requires expanded disclosures regarding leasing activities. ASU 2016-02 will be effective January 1, 2019 and we are assessing the potential impact of the standard on financial reporting.
In March 2016, the FASB issued ASU 2016-09, Improvements to Employee Share-Based Payment Accounting, which simplifies how certain features related to share-based payments are accounted for and presented in the financial statements. We elected to early adopt this ASU in the fourth quarter of 2016 and, per the requirements of the pronouncement, we applied the amendments to the beginning of 2016. Under ASU 2016-09, accounting changes adopted using the modified retrospective method must be calculated as of the beginning of 2016 and reported as a cumulative-effect adjustment. As a result, we recognized a $0.2 million cumulative-effect adjustment to January 1, 2016 retained earnings for previously unrecognized excess tax benefits. We have elected to continue our previous accounting policy of estimating forfeitures and, therefore, we did not recognize any cumulative-effect adjustment related to forfeitures. ASU 2016-09 requires that accounting changes adopted using the prospective method should be reported in the applicable interim periods of 2016. We did not have any material changes to previously reported interim financial information in 2016 as it relates to the recognition of excess tax benefits in the statement of operations or the classification of excess tax benefits in the statement of cash flows.
In June 2016, the FASB issued ASU 2016-13, Measurement of Credit Losses on Financial Instruments, which significantly changes the way entities recognize impairment of many financial assets by requiring immediate recognition of estimated credit losses expected to occur over their remaining life. ASU 2016-13 is effective January 1, 2020, with early adoption permitted January 1, 2019. We are assessing the potential impact of this new standard on financial reporting.
In November 2016, the FASB issues ASU 2016-18, Statement of Cash Flows: Restricted Cash, which requires entities to include restricted cash and restricted cash equivalent balances with cash and cash equivalent balances in the statement of cash flows. ASU 2016-18 will be effective January 1, 2018 and will impact the presentation of our statement of cash flows.
In May 2014, the FASB issued ASU 2014-09, Revenue From Contracts with Customers, a new standard related to revenue recognition which requires an entity to recognize an amount of revenue to which it expects to be entitled for the transfer of promised goods and services to customers. The new standard will replace most of the existing revenue recognition standards in U.S. GAAP. In August 2015, the FASB issued ASU 2015-14, which defers the effective date of this new standard to January 1, 2018. Subsequently, the FASB has continued to refine the standard and has issued several amendments. We have not yet completed our final review of the impact of this guidance but we believe that the most likely effects will be related to variable consideration and capitalization of costs to obtain contracts. We are also continuing to review potential disclosures and our method of adoption in order to complete our evaluation. Based on our preliminary assessment, we do not expect a material impact on our financial reporting.
73
Note 2 - Segment Information
The Brink’s Company offers transportation and logistics management services for cash and valuables throughout the world. These services include:
• | CIT Services – armored vehicle transportation of valuables |
• | ATM Services – replenishing and maintaining customers’ automated teller machines; providing network infrastructure services |
• | Global Services – secure international transportation of valuables |
• | Cash Management Services |
◦ | Currency and coin counting and sorting; deposit preparation and reconciliations; other cash management services |
◦ | Safe and safe control device installation and servicing (including our patented CompuSafe® service) |
◦ | Check and cash processing services for banking customers (“Virtual Vault Services”) |
◦ | Check imaging services for banking customers |
• | Payment Services – bill payment and processing services on behalf of utility companies and other billers at any of our Brink’s or Brink’s operated payment locations in Latin America and Brink’s Money™ general purpose reloadable prepaid cards and payroll cards in the U.S. |
• | Commercial Security Systems – design and installation of security systems in designated markets in Europe. |
• | Guarding Services – protection of airports, offices, and certain other locations in Europe and Brazil with or without electronic surveillance, access control, fire prevention and highly trained patrolling personnel |
We identify our operating segments based on how our chief operating decision maker (“CODM”) allocates resources, assesses performance and makes decisions. Our CODM is our President and Chief Executive Officer. Our CODM evaluates performance and allocates resources to each operating segment based on operating profit or loss, excluding income and expenses not allocated to segments.
We currently serve customers in more than 100 countries, including 40 countries where we operate subsidiaries.
We have nine operating segments:
• | Each of the five countries within Largest 5 Markets (U.S., France, Mexico, Brazil and Canada) |
• | Each of the three regions within Global Markets (Latin America, EMEA and Asia) |
• | Payment Services |
74
Revenues | Operating Profit (Loss) | ||||||||||||||||||
Years Ended December 31, | Years Ended December 31, | ||||||||||||||||||
(In millions) | 2016 | 2015 | 2014 | 2016 | 2015 | 2014 | |||||||||||||
Reportable Segments: | |||||||||||||||||||
U.S. | $ | 752.6 | 730.4 | 727.8 | $ | 6.3 | 15.1 | 22.8 | |||||||||||
France | 424.5 | 431.5 | 517.4 | 36.8 | 34.7 | 39.4 | |||||||||||||
Mexico | 295.3 | 333.0 | 388.2 | 20.4 | 24.2 | 9.6 | |||||||||||||
Brazil | 285.7 | 270.4 | 364.1 | 30.1 | 23.8 | 34.2 | |||||||||||||
Canada | 150.2 | 153.7 | 179.7 | 8.3 | 10.7 | 12.8 | |||||||||||||
Largest 5 Markets | 1,908.3 | 1,919.0 | 2,177.2 | 101.9 | 108.5 | 118.8 | |||||||||||||
Latin America | 355.1 | 369.9 | 380.6 | 89.9 | 76.3 | 50.4 | |||||||||||||
EMEA | 387.4 | 444.7 | 556.3 | 40.1 | 35.7 | 52.5 | |||||||||||||
Asia | 167.5 | 157.4 | 139.8 | 30.5 | 28.7 | 23.1 | |||||||||||||
Global Markets | 910.0 | 972.0 | 1,076.7 | 160.5 | 140.7 | 126.0 | |||||||||||||
Payment Services | 90.1 | 85.9 | 96.6 | 2.3 | (7.2 | ) | (4.9 | ) | |||||||||||
Total reportable segments | 2,908.4 | 2,976.9 | 3,350.5 | 264.7 | 242.0 | 239.9 | |||||||||||||
Reconciling Items: | |||||||||||||||||||
Corporate items: | |||||||||||||||||||
General, administrative and other expenses | — | — | — | (59.8 | ) | (81.0 | ) | (110.8 | ) | ||||||||||
Foreign currency transaction losses | — | — | — | 3.8 | (8.8 | ) | (2.6 | ) | |||||||||||
Reconciliation of segment policies to GAAP | — | — | — | (2.2 | ) | 4.6 | (2.3 | ) | |||||||||||
Other items not allocated to segments: | |||||||||||||||||||
Venezuela operations | 109.4 | 84.5 | 211.8 | 15.8 | (47.7 | ) | (97.9 | ) | |||||||||||
Reorganization and Restructuring | — | — | — | (30.3 | ) | (15.3 | ) | (21.8 | ) | ||||||||||
U.S. and Mexican retirement plans | — | — | — | (31.5 | ) | (31.2 | ) | (79.0 | ) | ||||||||||
Acquisitions and dispositions | 2.8 | — | — | (16.3 | ) | (6.0 | ) | 49.4 | |||||||||||
Share-based compensation adj. | — | — | — | — | — | (2.4 | ) | ||||||||||||
Total | $ | 3,020.6 | 3,061.4 | 3,562.3 | $ | 144.2 | 56.6 | (27.5 | ) | ||||||||||
See "Other Items Not Allocated to Segment" on pages 28–30 to the consolidated financial statements for explanations of each of the other items not allocated to segments.
75
Years Ended December 31, | |||||||||
(In millions) | 2016 | 2015 | 2014 | ||||||
Capital Expenditures by Business Segment | |||||||||
U.S. | $ | 19.9 | 21.7 | 31.1 | |||||
France | 17.3 | 16.0 | 17.9 | ||||||
Mexico | 12.6 | 9.3 | 13.3 | ||||||
Brazil | 8.9 | 6.2 | 14.7 | ||||||
Canada | 9.5 | 6.1 | 6.4 | ||||||
Largest 5 Markets | 68.2 | 59.3 | 83.4 | ||||||
Latin America | 13.7 | 13.5 | 17.0 | ||||||
EMEA | 9.9 | 11.1 | 9.4 | ||||||
Asia | 5.0 | 4.2 | 3.6 | ||||||
Global Markets | 28.6 | 28.8 | 30.0 | ||||||
Payment Services | 1.4 | 1.7 | 0.8 | ||||||
Segments | 98.2 | 89.8 | 114.2 | ||||||
Corporate items | 9.0 | 7.0 | 16.5 | ||||||
Venezuela | 5.0 | 4.3 | 5.4 | ||||||
Total | $ | 112.2 | 101.1 | 136.1 | |||||
Depreciation and Amortization by Business Segment | |||||||||
Depreciation and amortization of property and equipment: | |||||||||
U.S. | $ | 45.6 | 47.6 | 49.8 | |||||
France | 15.4 | 15.5 | 19.3 | ||||||
Mexico | 11.6 | 14.4 | 19.6 | ||||||
Brazil | 7.8 | 7.6 | 8.8 | ||||||
Canada | 9.6 | 8.1 | 8.5 | ||||||
Largest 5 Markets | 90.0 | 93.2 | 106.0 | ||||||
Latin America | 9.7 | 10.0 | 12.2 | ||||||
EMEA | 10.8 | 11.5 | 13.6 | ||||||
Asia | 3.6 | 3.9 | 3.2 | ||||||
Global Markets | 24.1 | 25.4 | 29.0 | ||||||
Payment Services | 1.5 | 1.9 | 2.2 | ||||||
Segments | 115.6 | 120.5 | 137.2 | ||||||
Corporate items | 10.9 | 11.3 | 9.7 | ||||||
Venezuela | 0.7 | 3.9 | 9.5 | ||||||
2016 Restructuring | 0.8 | — | — | ||||||
Depreciation and amortization of property and equipment | 128.0 | 135.7 | 156.4 | ||||||
Amortization of intangible assets: | |||||||||
France | 0.2 | 0.2 | 0.3 | ||||||
Brazil | 1.1 | 1.2 | 1.4 | ||||||
Largest 5 Markets | 1.3 | 1.4 | 1.7 | ||||||
Latin America | 0.2 | 0.3 | 0.3 | ||||||
EMEA | 0.4 | 0.6 | 1.1 | ||||||
Asia | 0.8 | 0.9 | 0.9 | ||||||
Global Markets | 1.4 | 1.8 | 2.3 | ||||||
Payment Services | 0.9 | 1.0 | 1.5 | ||||||
Amortization of intangible assets | 3.6 | 4.2 | 5.5 | ||||||
Total | $ | 131.6 | 139.9 | 161.9 | |||||
76
December 31, | |||||||||
(In millions) | 2016 | 2015 | 2014 | ||||||
Assets held by Segment | |||||||||
U.S. | $ | 338.0 | 325.0 | 327.4 | |||||
France | 286.7 | 239.6 | 244.7 | ||||||
Mexico | 201.4 | 229.0 | 258.9 | ||||||
Brazil | 145.6 | 109.7 | 165.0 | ||||||
Canada | 87.0 | 81.3 | 92.3 | ||||||
Largest 5 Markets | 1,058.7 | 984.6 | 1,088.3 | ||||||
Latin America | 172.8 | 155.3 | 189.8 | ||||||
EMEA | 238.9 | 274.6 | 308.0 | ||||||
Asia | 96.2 | 99.8 | 109.2 | ||||||
Global Markets | 507.9 | 529.7 | 607.0 | ||||||
Payment Services | 56.0 | 53.1 | 63.7 | ||||||
Segments | 1,622.6 | 1,567.4 | 1,759.0 | ||||||
Corporate items | 321.3 | 332.4 | 326.8 | ||||||
Venezuela | 50.9 | 46.9 | 106.2 | ||||||
Total | $ | 1,994.8 | 1,946.7 | 2,192.0 | |||||
Long-Lived Assets by Geographic Area(a) | |||||||||
Non-U.S.: | |||||||||
France | $ | 67.5 | 68.1 | 75.7 | |||||
Mexico | 78.1 | 93.2 | 114.4 | ||||||
Brazil | 45.3 | 34.0 | 47.9 | ||||||
Canada | 42.4 | 38.9 | 47.9 | ||||||
Other | 127.2 | 122.7 | 175.5 | ||||||
Subtotal | 360.5 | 356.9 | 461.4 | ||||||
U.S. | 170.5 | 192.1 | 208.1 | ||||||
Total | $ | 531.0 | 549.0 | 669.5 | |||||
(a) | Long-lived assets include only property and equipment. |
Years Ended December 31, | |||||||||
(In millions) | 2016 | 2015 | 2014 | ||||||
Revenues by Geographic Area(a) | |||||||||
Outside the U.S.: | |||||||||
France | $ | 424.5 | 431.5 | 517.4 | |||||
Mexico | 296.3 | 333.7 | 388.5 | ||||||
Brazil | 344.9 | 336.4 | 442.3 | ||||||
Canada | 150.2 | 153.7 | 179.7 | ||||||
Other | 1,040.9 | 1,069.6 | 1,305.8 | ||||||
Subtotal | 2,256.8 | 2,324.9 | 2,833.7 | ||||||
U.S. | 763.8 | 736.5 | 728.6 | ||||||
Total | $ | 3,020.6 | 3,061.4 | 3,562.3 | |||||
(a) | Revenues are recorded in the country where service is initiated or performed. No single customer represents more than 10% of total revenue. Geographic disclosures of country revenues include the Payments Services segment in Mexico, Brazil, Colombia and the U.S. |
77
December 31, | |||||||||
(In millions) | 2016 | 2015 | 2014 | ||||||
Net assets outside the U.S. | |||||||||
France | $ | 102.1 | 87.1 | 96.3 | |||||
Other EMEA countries | 133.8 | 147.5 | 146.1 | ||||||
Mexico | 86.1 | 86.1 | 88.4 | ||||||
Brazil | 106.3 | 87.9 | 111.1 | ||||||
Other Latin American countries | 127.0 | 115.2 | 182.4 | ||||||
Asian countries | 71.2 | 73.7 | 69.2 | ||||||
Canada | 57.6 | 50.3 | 53.4 | ||||||
Total | $ | 684.1 | 647.8 | 746.9 | |||||
(In millions) | 2016 | 2015 | 2014 | ||||||
Information about Unconsolidated Equity Affiliates held by Global Markets: | |||||||||
Carrying value of investments and advances at December 31 | $ | 3.5 | 4.9 | 2.7 | |||||
Undistributed earnings at December 31 | 2.5 | 2.2 | 1.1 | ||||||
Share of equity earnings (loss) | (1.5 | ) | 0.5 | 0.5 | |||||
In 2016, Brink's recorded an impairment charge of $1.8 million related to an equity investment in a BGS business in Belgium. In 2014, Brink’s sold an equity investment in a CIT business in Peru. The equity earnings from this investment in Peru were $3.8 million in 2014.
78
Note 3 - Retirement Benefits
Defined-benefit Pension Plans
Summary
We have various defined-benefit pension plans covering eligible current and former employees. Benefits under most plans are based on salary and years of service. There are limits to the amount of benefits which can be paid to participants from a U.S. qualified pension plan. We maintain a nonqualified U.S. plan to pay benefits for those eligible current and former employees in the U.S. whose benefits exceed the regulatory limits. Pension benefits provided to eligible U.S. employees were frozen on December 31, 2005.
Components of Net Periodic Pension Cost
(In millions) | U.S. Plans | Non-U.S. Plans | Total | ||||||||||||||||||||||||||
Years Ended December 31, | 2016 | 2015 | 2014 | 2016 | 2015 | 2014 | 2016 | 2015 | 2014 | ||||||||||||||||||||
Service cost | $ | — | — | — | $ | 10.5 | 10.4 | 12.5 | $ | 10.5 | 10.4 | 12.5 | |||||||||||||||||
Interest cost on projected benefit obligation | 37.1 | 36.0 | 45.3 | 11.5 | 11.2 | 18.4 | 48.6 | 47.2 | 63.7 | ||||||||||||||||||||
Return on assets – expected | (54.6 | ) | (54.6 | ) | (63.9 | ) | (9.5 | ) | (9.5 | ) | (14.4 | ) | (64.1 | ) | (64.1 | ) | (78.3 | ) | |||||||||||
Amortization of losses | 24.9 | 31.2 | 28.2 | 5.1 | 5.0 | 2.3 | 30.0 | 36.2 | 30.5 | ||||||||||||||||||||
Amortization of prior service cost | — | — | — | 1.0 | 0.9 | 1.0 | 1.0 | 0.9 | 1.0 | ||||||||||||||||||||
Settlement loss (a) | — | — | 56.1 | 3.1 | 5.7 | 6.3 | 3.1 | 5.7 | 62.4 | ||||||||||||||||||||
Net periodic pension cost | $ | 7.4 | 12.6 | 65.7 | $ | 21.7 | 23.7 | 26.1 | $ | 29.1 | 36.3 | 91.8 | |||||||||||||||||
Included in: | |||||||||||||||||||||||||||||
Continuing operations | $ | 7.4 | 12.6 | 65.7 | $ | 21.7 | 22.6 | 24.4 | $ | 29.1 | 35.2 | 90.1 | |||||||||||||||||
Discontinued operations | — | — | — | — | 1.1 | 1.7 | — | 1.1 | 1.7 | ||||||||||||||||||||
Net periodic pension cost | $ | 7.4 | 12.6 | 65.7 | $ | 21.7 | 23.7 | 26.1 | $ | 29.1 | 36.3 | 91.8 | |||||||||||||||||
(a) | Settlement losses recognized in the U.S. in 2014 relate to a lump-sum buy-out of 4,300 participants. Settlement losses outside the U.S. relate primarily to terminated employees that participate in a Mexican severance indemnity program that is accounted for as a defined benefit plan. |
79
Obligations and Funded Status
Changes in the projected benefit obligation (“PBO”) and plan assets for our pension plans are as follows:
(In millions) | U.S. Plans | Non-U.S. Plans | Total | |||||||||||||||
Years Ended December 31, | 2016 | 2015 | 2016 | 2015 | 2016 | 2015 | ||||||||||||
Benefit obligation at beginning of year | $ | 844.8 | 904.1 | 262.8 | 283.1 | 1,107.6 | 1,187.2 | |||||||||||
Service cost | — | — | 10.5 | 10.4 | 10.5 | 10.4 | ||||||||||||
Interest cost | 37.1 | 36.0 | 11.5 | 11.2 | 48.6 | 47.2 | ||||||||||||
Participant contributions | — | — | 0.2 | 0.4 | 0.2 | 0.4 | ||||||||||||
Plan amendments | — | — | (0.2 | ) | 2.4 | (0.2 | ) | 2.4 | ||||||||||
Plan combinations | — | — | 0.4 | 1.2 | 0.4 | 1.2 | ||||||||||||
Settlements | — | — | (9.3 | ) | — | (9.3 | ) | — | ||||||||||
Benefits paid | (47.8 | ) | (51.0 | ) | (12.7 | ) | (19.5 | ) | (60.5 | ) | (70.5 | ) | ||||||
Actuarial (gains) losses | 11.8 | (44.3 | ) | 17.7 | 14.8 | 29.5 | (29.5 | ) | ||||||||||
Foreign currency exchange effects | — | — | (13.6 | ) | (41.2 | ) | (13.6 | ) | (41.2 | ) | ||||||||
Benefit obligation at end of year | $ | 845.9 | 844.8 | 267.3 | 262.8 | 1,113.2 | 1,107.6 | |||||||||||
Fair value of plan assets at beginning of year | $ | 721.4 | 786.3 | 164.8 | 179.3 | 886.2 | 965.6 | |||||||||||
Return on assets – actual | 54.3 | (14.2 | ) | 18.2 | 4.3 | 72.5 | (9.9 | ) | ||||||||||
Participant contributions | — | — | 0.2 | 0.4 | 0.2 | 0.4 | ||||||||||||
Plan combinations | — | — | 0.4 | 1.2 | 0.4 | 1.2 | ||||||||||||
Employer contributions | 0.6 | 0.3 | 14.9 | 24.1 | 15.5 | 24.4 | ||||||||||||
Settlements | — | — | (9.3 | ) | — | (9.3 | ) | — | ||||||||||
Benefits paid | (47.8 | ) | (51.0 | ) | (12.7 | ) | (19.5 | ) | (60.5 | ) | (70.5 | ) | ||||||
Foreign currency exchange effects | — | — | (3.1 | ) | (25.0 | ) | (3.1 | ) | (25.0 | ) | ||||||||
Fair value of plan assets at end of year | $ | 728.5 | 721.4 | 173.4 | 164.8 | 901.9 | 886.2 | |||||||||||
Funded status | $ | (117.4 | ) | (123.4 | ) | (93.9 | ) | (98.0 | ) | (211.3 | ) | (221.4 | ) | |||||
Included in: | ||||||||||||||||||
Current liability, included in accrued liabilities | $ | 0.9 | 0.6 | 1.6 | 1.4 | 2.5 | 2.0 | |||||||||||
Noncurrent liability | 116.5 | 122.8 | 92.3 | 96.6 | 208.8 | 219.4 | ||||||||||||
Net pension liability | $ | 117.4 | 123.4 | 93.9 | 98.0 | 211.3 | 221.4 | |||||||||||
80
Other Changes in Plan Assets and Benefit Recognized in Other Comprehensive Income (Loss)
(In millions) | U.S. Plans | Non-U.S. Plans | Total | |||||||||||||||
Years Ended December 31, | 2016 | 2015 | 2016 | 2015 | 2016 | 2015 | ||||||||||||
Benefit plan net experience losses recognized in accumulated other comprehensive income (loss): | ||||||||||||||||||
Beginning of year | $ | (333.7 | ) | (340.4 | ) | (95.0 | ) | (85.7 | ) | (428.7 | ) | (426.1 | ) | |||||
Net experience gains (losses) arising during the year | (12.1 | ) | (24.5 | ) | (9.0 | ) | (20.0 | ) | (21.1 | ) | (44.5 | ) | ||||||
Reclassification adjustment for amortization of prior experience losses included in net income (loss) | 24.9 | 31.2 | 8.2 | 10.7 | 33.1 | 41.9 | ||||||||||||
Foreign currency exchange effects | — | — | 12.9 | — | 12.9 | — | ||||||||||||
End of year | $ | (320.9 | ) | (333.7 | ) | (82.9 | ) | (95.0 | ) | (403.8 | ) | (428.7 | ) | |||||
Benefit plan prior service cost recognized in accumulated other comprehensive income (loss): | ||||||||||||||||||
Beginning of year | $ | — | — | (10.8 | ) | (9.3 | ) | (10.8 | ) | (9.3 | ) | |||||||
Prior service credit (cost) from plan amendments during the year | — | — | 0.2 | (2.4 | ) | 0.2 | (2.4 | ) | ||||||||||
Reclassification adjustment for amortization of prior service cost included in net income (loss) | — | — | 1.0 | 0.9 | 1.0 | 0.9 | ||||||||||||
Foreign currency exchange effects | — | — | 0.4 | — | 0.4 | — | ||||||||||||
End of year | $ | — | — | (9.2 | ) | (10.8 | ) | (9.2 | ) | (10.8 | ) | |||||||
Approximately $29.9 million of experience loss and $0.1 million of prior service cost are expected to be amortized from accumulated other comprehensive income (loss) into net periodic pension cost during 2017.
The net experience losses in 2016 were primarily due to the lower discount rates at the end of the year compared to the prior year, partially offset by actual return on assets being higher than expected. The net experience losses in 2015 were primarily due to actual return on assets being lower than expected, partially offset by a higher U.S. plans discount rate at the end of the year compared to the prior year.
Information Comparing Plan Assets to Plan Obligations
Information comparing plan assets to plan obligations as of December 31, 2016 and 2015 are aggregated below. The accumulated benefit obligation (“ABO”) differs from the PBO in that the ABO is based on the benefit earned through the date noted. The PBO includes assumptions about future compensation levels for plans that have not been frozen. The total ABO for our U.S. pension plans was $845.9 million in 2016 and $844.8 million in 2015. The total ABO for our Non-U.S. pension plans was $232.3 million in 2016 and $226.5 million in 2015.
(In millions) | U.S. Plans | Non-U.S. Plans | Total | |||||||||||||||
December 31, | 2016 | 2015 | 2016 | 2015 | 2016 | 2015 | ||||||||||||
Information for pension plans with an ABO in excess of plan assets: | ||||||||||||||||||
Fair value of plan assets | $ | 728.5 | 721.4 | 41.3 | 47.7 | 769.8 | 769.1 | |||||||||||
Accumulated benefit obligation | 845.9 | 844.8 | 107.3 | 111.9 | 953.2 | 956.7 | ||||||||||||
Projected benefit obligation | 845.9 | 844.8 | 127.9 | 135.2 | 973.8 | 980.0 | ||||||||||||
81
Assumptions
The weighted-average assumptions used in determining the net pension cost and benefit obligations for our pension plans were as follows:
U.S. Plans | Non-U.S. Plans(b) | ||||||||||||||||
2016 | 2015 | 2014 | 2016 | 2015 | 2014 | ||||||||||||
Discount rate: | |||||||||||||||||
Pension cost | 4.5 | % | 4.1 | % | 5.0 | % | 5.1 | % | 5.1 | % | 6.3 | % | |||||
Benefit obligation at year end | 4.3 | % | 4.5 | % | 4.1 | % | 3.7 | % | 5.1 | % | 5.1 | % | |||||
Expected return on assets – pension cost | 7.50 | % | 7.50 | % | 8.00 | % | 5.65 | % | 5.58 | % | 5.83 | % | |||||
Average rate of increase in salaries(a): | |||||||||||||||||
Pension cost | N/A | N/A | N/A | 3.8 | % | 3.9 | % | 3.9 | % | ||||||||
Benefit obligation at year end | N/A | N/A | N/A | 2.7 | % | 3.8 | % | 3.9 | % | ||||||||
(a) | Salary scale assumptions are determined through historical experience and vary by age and industry. The U.S. plan benefits are frozen. Pension benefits will not increase due to future salary increases. |
(b) | The discount and salary increase rates of our Venezuela benefit plan are not adjusted for inflation. See the separate section below for more details. |
Mortality Tables for our U.S. Retirement Benefits
We use the Mercer modified RP-2014 base table and Mercer modified MP-2016 projection scale, with Blue Collar adjustments for the majority of our U.S. retirement plans and a White Collar adjustment for our nonqualified U.S. pension plan.
Estimated Future Cash Flows
Estimated Future Contributions from the Company into Plan Assets
Our policy is to fund at least the minimum actuarially determined amounts required by applicable regulations. We do not expect to make contributions to our primary U.S. pension plan in 2017. We expect to contribute $10.9 million to our non-U.S. pension plans and $0.9 million to our nonqualified U.S. pension plan in 2017.
Estimated Future Benefit Payments from Plan Assets to Beneficiaries
Projected benefit payments of the plans in the next 10 years using assumptions in effect at December 31, 2016, are as follows:
(In millions) | U.S. Plans | Non-U.S. Plans(a) | Total | ||||||
2017 | $ | 50.8 | 9.8 | 60.6 | |||||
2018 | 50.9 | 9.9 | 60.8 | ||||||
2019 | 51.8 | 10.5 | 62.3 | ||||||
2020 | 51.5 | 12.3 | 63.8 | ||||||
2021 | 51.4 | 12.4 | 63.8 | ||||||
2022 through 2026 | 257.6 | 75.9 | 333.5 | ||||||
(a) | Excludes projected benefit payments related to our Venezuela benefit plan, which are presented in the separate section below. |
82
Venezuela
Our non-U.S. net pension liability includes projected benefit obligations related to Venezuela of $5.6 million, $4.1 million, and $6.6 million in 2016, 2015 and 2014, respectively. The net periodic pension cost related to these benefit obligations was $2.9 million, $2.5 million, and $3.7 million in 2016, 2015 and 2014, respectively.
As discussed in Note 1, the economy in Venezuela has had significant inflation in the last several years and we consolidate our Venezuelan results using highly inflationary accounting rules. In determining the projected benefit obligation and net periodic pension cost, we project our bolivar-denominated expected cash outflows using expected salary increases and discount the expected cash outflows to present value. Our discount rate for Venezuela was 4% and was determined using government bonds within the region. There are no salary increases expected other than inflationary increases. The discount rate and salary scale are adjusted for expected inflation.
The assumption for inflation in Venezuela was made considering the current economic situation in Venezuela and an analysis of regional economic performances during hyperinflationary cycles. Over the long term, we expect the economy of Venezuela will return to inflation rates more typical for the region. Based on these considerations, we assumed an inflation rate of 500% in 2017 with a gradual decline to 4% in 2032. For 2016, this inflation adjustment has been excluded from the non-U.S. assumptions table above.
As the projected salary increases and discount rate are both adjusted for inflation, there is not a significant impact to our current year projected benefit obligation as a result of increasing expected inflation. However, the inflation adjustment for Venezuela results in significant expected bolivar-denominated cash outflows in the next 10 years. When these undiscounted bolivar-denominated cash outflows are translated into U.S dollars at the December 31, 2016 DICOM exchange rate of approximately 674 bolivars to the dollar for purposes of U.S. GAAP reporting, the result is projected cash outflows of $4.4 billion as presented in the table below. These amounts have been excluded from the estimated future non-U.S. projected benefit payments table above. We expect to make these payments in bolivars with cash generated from our Venezuelan operations.
Venezuela Estimated Future Benefit Payments to Beneficiaries
Projected benefit payments of our Venezuela benefit plan in the next 10 years using assumptions in effect at December 31, 2016, are as follows:
(In millions) | Venezuela | |
2017 | 0.9 | |
2018 | 2.4 | |
2019 | 6.9 | |
2020 | 17.4 | |
2021 | 43.5 | |
2022 through 2026 | 4,327.8 | |
83
Retirement Benefits Other than Pensions
Summary
We provide retirement healthcare benefits for eligible current and former U.S., Canadian, and Brazilian employees. Retirement benefits related to our former U.S. coal operation include medical benefits provided by the Pittston Coal Group Companies Employee Benefit Plan for UMWA Represented Employees (the “UMWA plans”) as well as costs related to black lung obligations.
Components of Net Periodic Postretirement Cost
The components of net periodic postretirement cost related to retirement benefits other than pensions were as follows:
(In millions) | UMWA Plans | Black Lung and Other Plans | Total | ||||||||||||||||||||||||||
Years Ended December 31, | 2016 | 2015 | 2014 | 2016 | 2015 | 2014 | 2016 | 2015 | 2014 | ||||||||||||||||||||
Service cost | $ | — | — | — | $ | — | 0.2 | 0.1 | $ | — | 0.2 | 0.1 | |||||||||||||||||
Interest cost on APBO | 18.9 | 17.1 | 17.9 | 2.7 | 2.8 | 2.3 | 21.6 | 19.9 | 20.2 | ||||||||||||||||||||
Return on assets – expected | (17.5 | ) | (20.6 | ) | (22.2 | ) | — | — | — | (17.5 | ) | (20.6 | ) | (22.2 | ) | ||||||||||||||
Amortization of losses | 18.0 | 15.5 | 12.3 | 2.5 | 3.1 | 0.6 | 20.5 | 18.6 | 12.9 | ||||||||||||||||||||
Amortization of prior service cost (credit) | (4.6 | ) | (4.6 | ) | (4.6 | ) | 1.7 | 1.8 | 1.7 | (2.9 | ) | (2.8 | ) | (2.9 | ) | ||||||||||||||
Curtailment (gain) | — | — | — | — | (0.1 | ) | — | — | (0.1 | ) | — | ||||||||||||||||||
Net periodic postretirement cost | $ | 14.8 | 7.4 | 3.4 | $ | 6.9 | 7.8 | 4.7 | $ | 21.7 | 15.2 | 8.1 | |||||||||||||||||
Obligations and Funded Status
Changes in the accumulated postretirement benefit obligation (“APBO’) and plan assets related to retirement healthcare benefits are as follows:
(In millions) | UMWA Plans | Black Lung and Other Plans | Total | |||||||||||||||
Years Ended December 31, | 2016 | 2015 | 2016 | 2015 | 2016 | 2015 | ||||||||||||
APBO at beginning of year | $ | 433.1 | 461.8 | 59.8 | 66.2 | 492.9 | 528.0 | |||||||||||
Service cost | — | — | — | 0.2 | — | 0.2 | ||||||||||||
Interest cost | 18.9 | 17.1 | 2.7 | 2.8 | 21.6 | 19.9 | ||||||||||||
Plan amendments | — | — | — | (0.7 | ) | — | (0.7 | ) | ||||||||||
Curtailment | — | — | — | (0.5 | ) | — | (0.5 | ) | ||||||||||
Benefits paid | (31.7 | ) | (36.0 | ) | (8.3 | ) | (6.3 | ) | (40.0 | ) | (42.3 | ) | ||||||
Actuarial (gains) losses, net | 23.9 | (9.8 | ) | 11.2 | 0.4 | 35.1 | (9.4 | ) | ||||||||||
Foreign currency exchange effects | — | — | 0.7 | (2.3 | ) | 0.7 | (2.3 | ) | ||||||||||
APBO at end of year | $ | 444.2 | 433.1 | 66.1 | 59.8 | 510.3 | 492.9 | |||||||||||
Fair value of plan assets at beginning of year | $ | 227.4 | 264.6 | — | — | 227.4 | 264.6 | |||||||||||
Return on assets – actual | 22.2 | (0.9 | ) | — | — | 22.2 | (0.9 | ) | ||||||||||
Employer contributions | (0.3 | ) | (0.3 | ) | 8.3 | 6.3 | 8.0 | 6.0 | ||||||||||
Benefits paid | (31.7 | ) | (36.0 | ) | (8.3 | ) | (6.3 | ) | (40.0 | ) | (42.3 | ) | ||||||
Fair value of plan assets at end of year | $ | 217.6 | 227.4 | — | — | 217.6 | 227.4 | |||||||||||
Funded status | $ | (226.6 | ) | (205.7 | ) | (66.1 | ) | (59.8 | ) | (292.7 | ) | (265.5 | ) | |||||
Included in: | ||||||||||||||||||
Current, included in accrued liabilities | $ | — | — | 6.6 | 6.3 | 6.6 | 6.3 | |||||||||||
Noncurrent | 226.6 | 205.7 | 59.5 | 53.5 | 286.1 | 259.2 | ||||||||||||
Retirement benefits other than pension liability | $ | 226.6 | 205.7 | 66.1 | 59.8 | 292.7 | 265.5 | |||||||||||
84
Other Changes in Plan Assets and Benefit Recognized in Other Comprehensive Income (Loss)
Changes in accumulated other comprehensive income (loss) of our retirement benefit plans other than pensions are as follows:
(In millions) | UMWA Plans | Black Lung and Other Plans | Total | |||||||||||||||
Years Ended December 31, | 2016 | 2015 | 2016 | 2015 | 2016 | 2015 | ||||||||||||
Benefit plan net experience gain (loss) recognized in accumulated other comprehensive income (loss): | ||||||||||||||||||
Beginning of year | $ | (261.8 | ) | (265.6 | ) | (25.8 | ) | (29.0 | ) | (287.6 | ) | (294.6 | ) | |||||
Net experience gains (losses) arising during the year | (19.2 | ) | (11.7 | ) | (11.2 | ) | 0.1 | (30.4 | ) | (11.6 | ) | |||||||
Reclassification adjustment for amortization of prior experience losses included in net income (loss) | 18.0 | 15.5 | 2.5 | 3.1 | 20.5 | 18.6 | ||||||||||||
Foreign currency exchange effects | — | 2.3 | — | 2.3 | — | |||||||||||||
End of year | $ | (263.0 | ) | (261.8 | ) | (32.2 | ) | (25.8 | ) | (295.2 | ) | (287.6 | ) | |||||
Benefit plan prior service (cost) credit recognized in accumulated other comprehensive income (loss): | ||||||||||||||||||
Beginning of year | $ | 46.5 | 51.1 | (3.5 | ) | (6.0 | ) | 43.0 | 45.1 | |||||||||
Prior service credit from plan amendments during the year | — | — | — | 0.7 | — | 0.7 | ||||||||||||
Reclassification adjustment for amortization or curtailment of prior service cost included in net income (loss) | (4.6 | ) | (4.6 | ) | 1.7 | 1.8 | (2.9 | ) | (2.8 | ) | ||||||||
Foreign currency exchange effects | — | — | (0.3 | ) | — | (0.3 | ) | — | ||||||||||
End of year | $ | 41.9 | 46.5 | (2.1 | ) | (3.5 | ) | 39.8 | 43.0 | |||||||||
We estimate that $21.2 million of experience loss and $2.9 million of prior service credit will be amortized from accumulated other comprehensive income (loss) into net periodic postretirement cost during 2017.
We recognized net experience losses in 2016 associated with the UMWA obligations primarily due to a lower discount rate, partially offset by return on assets being higher than expected. We recognized net experience losses in 2016 associated with the black lung and other plans primarily related to a lower discount rate.
We recognized net experience losses in 2015 associated with the UMWA obligations primarily due to the return on assets being lower than expected, partially offset by a higher discount rate. We recognized net experience gains in 2015 associated with the black lung and other plans primarily related to a higher discount rate.
Assumptions
See Mortality Tables for our U.S. Retirement Benefits on page 82 for a description of the mortality assumptions.
The APBO for each of the plans was determined using the unit credit method and assumed rates as follows:
2016 | 2015 | 2014 | ||||||
Weighted-average discount rate: | ||||||||
Postretirement cost: | ||||||||
UMWA plans | 4.4 | % | 4.0 | % | 4.7 | % | ||
Black lung | 4.2 | % | 3.7 | % | 4.4 | % | ||
Weighted-average | 4.4 | % | 4.1 | % | 4.7 | % | ||
Benefit obligation at year end: | ||||||||
UMWA plans | 4.1 | % | 4.4 | % | 4.0 | % | ||
Black lung | 3.9 | % | 4.2 | % | 3.7 | % | ||
Weighted-average | 4.2 | % | 4.4 | % | 4.1 | % | ||
Expected return on assets | 8.25 | % | 8.25 | % | 8.25 | % | ||
85
Healthcare Cost Trend Rates
For UMWA plans, the assumed healthcare cost trend rate used to compute the 2016 APBO is 7.0% for 2017, declining to 5.0% in 2023 and thereafter (in 2015: 7.0% for 2016 declining to 5.0% in 2022 and thereafter). For the black lung obligation, the assumed healthcare cost trend rate used to compute the 2016 APBO was 5.0%. Other plans in the U.S. provide for fixed-dollar value coverage for eligible participants and, accordingly, are not adjusted for inflation.
For the Canadian plan, the assumed healthcare cost trend rate used to compute the 2016 APBO is 7.0% for 2017, declining to 5.0% in 2023. For the Brazilian plan, the assumed healthcare cost trend rate used to compute the 2016 APBO is 3.0%.
The table below shows the estimated effects of a one percentage-point change in the assumed healthcare cost trend rates for each future year.
Effect of Change in Assumed Healthcare Trend Rates | ||||||
(In millions) | Increase 1% | Decrease 1% | ||||
Higher (lower): | ||||||
Service and interest cost in 2017 | $ | 2.2 | (1.9 | ) | ||
APBO at December 31, 2017 | 53.5 | (45.6 | ) | |||
We provide healthcare benefits to our UMWA retirees who are eligible for the Medicare Prescription Drug, Improvement and Modernization Act of 2003 (the “Medicare Act”) subsidy reimbursement under an employer group waiver plan (“EGWP”). Under this arrangement, a government approved health insurance provider receives the Medicare Act subsidy reimbursement on our behalf and passes these savings to us. Additionally, by providing healthcare benefits under an EGWP, we are able to benefit from the mandatory 50% discount that pharmaceutical companies must provide for Medicare Act-eligible prescription drugs.
Excise Tax on Administrators by Patient Protection and Affordable Care Act of 2010
A 40% excise tax on third-party benefit plan administrators by the Patient Protection and Affordable Care Act will be imposed on high-cost health plans (“Cadillac plans”) beginning in 2020. We are currently unable to reduce the benefit levels of our UMWA medical plans to avoid this excise tax because these benefit levels are required by the Coal Industry Retiree Health Benefit Act of 1992. We have assumed that the cost of the excise tax paid by administrators will be passed through to us in the form of higher premiums or higher claims administration fees, increasing our obligations. We project that we will have to pay the benefits plan administrator this excise tax beginning in 2020, and our plan obligations at December 31, 2016, include $19.4 million related to this tax ($15.1 million at December 31, 2015).
Cash Flows
Estimated Contributions from the Company to Plan Assets
Based on the funded status and assumptions at December 31, 2016, we expect the Company to contribute $6.6 million in cash to the plans to pay 2017 beneficiary payments for black lung and other plans. We do not expect to contribute cash to our UMWA plans in 2017 since we believe these plans have sufficient amounts held in trust to pay for beneficiary payments until 2027 based on actuarial assumptions. Our UMWA plans are not covered by ERISA or other funding laws or regulations that require these plans to meet funding ratios.
Estimated Future Benefit Payments from Plan Assets to Beneficiaries
Projected benefit payments of the plans in the next 10 years using assumptions in effect at December 31, 2016, are as follows:
(In millions) | UMWA Plans | Black Lung and Other Plans | Total | ||||||
2017 | $ | 31.9 | 6.6 | 38.5 | |||||
2018 | 31.9 | 6.2 | 38.1 | ||||||
2019 | 31.7 | 5.8 | 37.5 | ||||||
2020 | 32.7 | 5.4 | 38.1 | ||||||
2021 | 31.9 | 5.0 | 36.9 | ||||||
2022 through 2026 | 141.9 | 20.4 | 162.3 | ||||||
86
Retirement Plan Assets
U.S. Plans
December 31, 2016 | December 31, 2015 | |||||||||||||||
(In millions, except for percentages) | Fair Value Level | Total Fair Value | % Actual Allocation | % Target Allocation | Total Fair Value | % Actual Allocation | % Target Allocation | |||||||||
U.S. Pension Plans | ||||||||||||||||
Cash, cash equivalents and receivables | $ | 4.0 | — | — | 4.2 | 1 | — | |||||||||
Equity securities: | ||||||||||||||||
U.S. large-cap(a) | 1 | 94.1 | 13 | 14 | 80.1 | 11 | 12 | |||||||||
U.S. small/mid-cap(a) | 1 | 40.6 | 6 | 6 | 30.0 | 4 | 5 | |||||||||
International(a) | 1 | 80.1 | 11 | 12 | 66.1 | 9 | 10 | |||||||||
Emerging markets(b) | 1 | 9.9 | 1 | 2 | 8.6 | 1 | 2 | |||||||||
Dynamic asset allocation(c) | 1 | 26.6 | 4 | 4 | 23.9 | 4 | 4 | |||||||||
U.S. managed volatility equities(n) | 1 | — | — | — | — | — | 5 | |||||||||
Fixed-income securities: | ||||||||||||||||
Long duration - mutual fund(d) | 1 | 282.6 | 48 | 48 | 290.0 | 50 | 48 | |||||||||
Long duration - Treasury strips(d) | 2 | 65.3 | 71.7 | |||||||||||||
High yield(e) | 1 | 10.5 | 1 | 2 | 9.0 | 1 | 2 | |||||||||
Emerging markets(f) | 1 | 9.7 | 1 | 2 | 9.0 | 1 | 2 | |||||||||
Other types of investments: | ||||||||||||||||
Hedge fund of funds(g) (m) | — | — | — | 36.6 | 5 | — | ||||||||||
Core property(h) (m) | 56.9 | 8 | 5 | 51.5 | 7 | 5 | ||||||||||
Structured credit(i) (m) | 48.2 | 7 | 5 | 40.7 | 6 | 5 | ||||||||||
Total | $ | 728.5 | 100 | 100 | 721.4 | 100 | 100 | |||||||||
UMWA Plans | ||||||||||||||||
Cash, cash equivalents and receivables | $ | — | — | — | 1.6 | 1 | — | |||||||||
Equity securities: | ||||||||||||||||
U.S. large-cap(a) | 1 | 45.5 | 21 | 22 | 47.5 | 21 | 22 | |||||||||
U.S. small/mid-cap(a) | 1 | 19.9 | 9 | 10 | 20.2 | 9 | 10 | |||||||||
International(a) | 1 | 40.1 | 19 | 19 | 40.5 | 18 | 19 | |||||||||
Emerging markets(b) | 1 | 8.2 | 4 | 4 | 9.0 | 4 | 4 | |||||||||
Dynamic asset allocation(c) | 1 | 14.9 | 7 | 7 | 15.9 | 7 | 7 | |||||||||
Fixed-income securities: | ||||||||||||||||
High yield(e) | 1 | 4.4 | 2 | 2 | 6.9 | 3 | 2 | |||||||||
Emerging markets(f) | 1 | 8.1 | 4 | 4 | 9.0 | 4 | 4 | |||||||||
Multi asset real return(j) | 1 | 10.6 | 5 | 5 | 14.7 | 6 | 5 | |||||||||
Other types of investments: | ||||||||||||||||
Hedge fund of funds(g) (m) | — | — | — | 6.4 | 3 | — | ||||||||||
Core property(h) (m) | 24.9 | 11 | 10 | 32.9 | 14 | 10 | ||||||||||
Structured credit(i) (m) | 16.1 | 7 | 5 | 13.6 | 6 | 5 | ||||||||||
Global private equity(k) (m) | 8.6 | 4 | 7 | 3.2 | 1 | 7 | ||||||||||
Energy debt(l) (m) | 16.3 | 7 | 5 | 6.0 | 3 | 5 | ||||||||||
Total | $ | 217.6 | 100 | 100 | 227.4 | 100 | 100 | |||||||||
(a) | These categories include passively managed U.S. large-cap mutual funds and actively managed U.S. small/mid-cap and international mutual funds that track various indices such as the S&P 500 Index, the Russell 2500 Index and the MSCI All Country World Ex-U.S. Index. |
(b) | This category represents an actively managed mutual fund that invests primarily in equity securities of emerging market issuers. Emerging market countries are those countries that are characterized as developing or emerging by any of the World Bank, the United Nations, the International Finance Corporation, or the European Bank for Reconstruction and Development or included in an emerging markets index by a recognized index provider. |
(c) | This category represents an actively managed mutual fund that seeks to generate total return over time by selecting investments from among a broad range of asset classes. The fund’s allocations among asset classes may be adjusted over short periods and can vary from multiple to a single asset class. |
(d) | This category represents actively managed mutual funds that seek to duplicate the risk and return characteristics of a long-term fixed-income security portfolio with approximate duration of 10 years and longer by using a long duration bond portfolio. This category also includes Treasury future contracts and zero-coupon securities created by the U.S. Treasury. |
(e) | This category represents an actively managed mutual fund that invests primarily in fixed-income securities rated below investment grade, including corporate bonds and debentures, convertible and preferred securities and zero-coupon obligations. The fund’s average weighted maturity may vary and will generally not exceed ten years. |
(f) | This category represents an actively managed mutual fund that invests primarily in U.S. dollar-denominated debt securities of government, government-related and corporate issuers in emerging market countries, as well as entities organized to restructure the outstanding debt of such issuers. |
(g) | This category represents an actively managed hedge fund of funds. The fund holds approximately 30 separate hedge-fund investments. Strategies included (1) long-short equity, (2) event-driven and distressed-debt, (3) global macro, (4) credit hedging, (5) multi-strategy, and (6) fixed-income arbitrage. Its investment objective is to seek to achieve an attractive risk-adjusted return with moderate volatility and moderate directional market exposure over a full market cycle. |
(h) | This category represents an actively managed real estate fund of funds that seeks both current income and long-term capital appreciation through investing in underlying funds that acquire, manage, and dispose of commercial real estate properties. These properties are high-quality, low-leveraged, income-generating office, industrial, retail, and multi-family properties, generally fully-leased to creditworthy companies and governmental entities. |
(i) | This category invests primarily in a diversified portfolio comprised primarily of collateralized loan obligations and other structured credit investments backed primarily by bank loans. |
(j) | This category represents an actively managed mutual fund that invests primarily in fixed income and equity securities and commodity linked instruments. The category seeks total returns that exceed the rate of inflation over a full market cycle regardless of market conditions. |
(k) | This category will offer exposure to a diversified pool of global private assets fund investments. Further, the category will seek to shorten the duration of the typical private assets fund of funds through a dedicated focus on secondary strategies (i.e. funds whose investment strategy is to purchase interests in other private market investments/funds as a way |
87
to provide the original investors liquidity prior to the end of those investments’/funds’ contracted end date), income-producing investment strategies (e.g. debt, real estate, and to a lesser extent, real assets), and underlying funds whose stated life is five to seven years, as opposed to the more typical 10-year life of private assets funds.
(l) | This category invests in credit securities of commodity oriented companies affected by the dislocation in the commodity markets with the investment objective of producing an equity like return with less downside risk than equity or commodity investments. |
(m) | In accordance with Subtopic 820-10, certain investments that are measured at fair value using the net asset value per share (or its equivalent) practical expedient have not been classified in the fair value hierarchy. The fair value amounts presented in this table are intended to permit reconciliation of the fair value hierarchy to the amounts presented in the consolidated balance sheets. |
(n) | The U.S. managed volatility fund seeks capital appreciation with lower volatility than the broad U.S. equity market. The Fund will typically invest in equity securities of U.S. companies of all capitalization ranges that exhibit low relative volatility. Over the long term, the Fund is expected to achieve a return similar to that of the Russell 3000 Index with a lower level of volatility. |
Assets of our U.S. plans are invested with an objective of maximizing the total return, taking into consideration the liabilities of the plan, and minimizing the risks that could create the need for excessive contributions. Plan assets are invested primarily using actively managed accounts with asset allocation targets listed in the tables above. Our policy does not permit the purchase of Brink’s common stock if immediately after any such purchase the aggregate fair market value of the plan assets invested in Brink’s common stock exceeds 10% of the aggregate fair market value of the assets of the plan, except as permitted by an exemption under ERISA. The plans rebalance their assets on a quarterly basis if actual allocations of assets are outside predetermined ranges. Among other factors, the performance of asset groups and investment managers will affect the long-term rate of return.
The pension plan acquired the structured-credit investment in 2013. The investment is subject to a two-year lockup provision, which expired in 2015.
The UMWA plans acquired the structured-credit investment in 2014. The investment is subject to a two-year lockup provision, which expired in 2016. The UMWA plans also acquired the energy debt investment in 2015, which is subject to a three-year lockup provision, which will expire in 2018.
The global private equity investment cannot be redeemed due to the nature of the underlying investments. As the global private equity investment matures and becomes fully invested, liquidating distributions will be provided back to investors. We expect to receive liquidating distributions over the stated life of the underlying investments. We have $14 million in unfunded commitments related to the global private equity investment.
Most of the investments of our U.S. retirement plans can be redeemed daily. The core-property and structured-credit investments can be redeemed quarterly with 65 days’ notice. The hedge fund of funds investment can be redeemed quarterly with 95 days’ notice. The energy debt investment can be redeemed semi-annually with 95 days' notice.
We believe all plans have sufficient liquidity to meet the needs of the plans' beneficiaries in all market scenarios.
88
Non-U.S. Plans
December 31, 2016 | December 31, 2015 | |||||||||||||
(In millions, except for percentages) | Total Fair Value | % Actual Allocation | % Target Allocation | Total Fair Value | % Actual Allocation | % Target Allocation | ||||||||
Non-U.S. Pension Plans | ||||||||||||||
Cash and cash equivalents | $ | 0.9 | — | — | 0.8 | — | — | |||||||
Equity securities: | ||||||||||||||
U.S. equity funds(a) | 25.5 | 24.5 | ||||||||||||
Canadian equity funds(a) | 33.9 | 28.6 | ||||||||||||
European equity funds(a) | 4.5 | 9.5 | ||||||||||||
Asia Pacific equity funds(a) | — | 1.8 | ||||||||||||
Emerging markets(a) | 4.6 | 4.5 | ||||||||||||
Other non-U.S. equity funds(a) | 22.7 | 17.2 | ||||||||||||
Total equity securities | 91.2 | 53 | 53 | 86.1 | 52 | 60 | ||||||||
Fixed-income securities: | ||||||||||||||
Global credit(b) | — | 0.4 | ||||||||||||
European fixed-income funds(c) | 14.1 | 13.0 | ||||||||||||
High-yield(d) | 1.2 | 1.2 | ||||||||||||
Emerging markets(e) | 1.4 | 1.2 | ||||||||||||
Long-duration(f) | 63.1 | 60.8 | ||||||||||||
Total fixed-income securities | 79.8 | 46 | 46 | 76.6 | 47 | 38 | ||||||||
Other types of investments: | ||||||||||||||
Other | 1.5 | 1.3 | ||||||||||||
Total other types of investments | 1.5 | 1 | 1 | 1.3 | 1 | 2 | ||||||||
Total | $ | 173.4 | 100 | 100 | 164.8 | 100 | 100 | |||||||
(a) | These categories are comprised of equity index actively and passively managed funds that track various indices such as S&P 500 Composite Total Return Index, Russell 1000 and 2000 Indices, MSCI Europe Ex-UK Index, S&P/TSX Total Return Index, MSCI EAFE Index and others. Some of these funds use a dynamic asset allocation investment strategy seeking to generate total return over time by selecting investments from among a broad range of asset classes, investing primarily through the use of derivatives. |
(b) | This category represents investment-grade fixed income debt securities of European issuers from diverse industries. |
(c) | This category is primarily designed to generate income and exhibit volatility similar to that of the Sterling denominated bond market. This category primarily invests in investment grade or better securities. |
(d) | This category consists of global high-yield bonds. This category invests in lower rated and unrated fixed income, floating rate and other debt securities issued by European and American companies. |
(e) | This category consists of a diversified portfolio of debt securities issued by governments, financial institutions, companies or other entities domiciled in emerging market countries. |
(f) | This category is designed to achieve a return consistent with holding longer term debt instruments. This category invests in interest rate and inflation derivatives, government-issued bonds, real-return bonds, and futures contracts. |
Asset allocation strategies for our non-U.S. plans are designed to accumulate a diversified portfolio among markets and asset classes in order to reduce market risk and increase the likelihood that pension assets are available to pay benefits as they are due. Assets of non-U.S. pension plans are invested primarily using actively managed accounts. The weighted-average asset allocation targets are listed in the table above, and reflect limitations on types of investments held and allocations among assets classes, as required by local regulation or market practice of the country where the assets are invested. Most of the investments of our non-U.S. retirement plans can be redeemed at least monthly, except for a portion of “Other” in the above table, which can be redeemed quarterly.
Non-U.S. Plans - Fair Value Measurements
(In millions) | December 31, 2016 | December 31, 2015 | ||||
Quoted prices in active markets for identical assets (Level 1) | $ | 156.0 | 149.1 | |||
Net asset value per share practical expedient(a) | 17.4 | 15.7 | ||||
Total fair value | $ | 173.4 | 164.8 | |||
(a) | In accordance with Subtopic 820-10, certain investments that are measured at fair value using the net asset value per share (or its equivalent) practical expedient have not been classified in the fair value hierarchy. The fair value amounts presented in this table are intended to permit reconciliation of the fair value hierarchy to the amounts presented in the consolidated balance sheets. |
89
Savings Plans
We sponsor various defined contribution plans to help eligible employees provide for retirement. We record expense for amounts that we contribute on behalf of employees, usually in the form of matching contributions. Prior to April 1, 2015, we matched the first 1% of employees’ eligible contributions to our U.S. 401(k) plan. In April 2015, we increased the matching contribution to the first 1.5% of employees' eligible contributions. Our matching contribution expense is as follows:
(In millions) | |||||||||
Years Ended December 31, | 2016 | 2015 | 2014 | ||||||
U.S. 401(K) | $ | 3.4 | 3.6 | 2.2 | |||||
Other plans | 4.5 | 0.3 | 2.3 | ||||||
Total | $ | 7.9 | 3.9 | 4.5 | |||||
90
Note 4 - Income Taxes
Years Ended December 31, | |||||||||
(In millions) | 2016 | 2015 | 2014 | ||||||
Income (loss) from continuing operations before income taxes | |||||||||
U.S. | $ | (28.3 | ) | (23.2 | ) | (79.4 | ) | ||
Foreign | 153.3 | 64.3 | 30.4 | ||||||
Income (loss) from continuing operations before income taxes | $ | 125.0 | 41.1 | (49.0 | ) | ||||
Provision (benefit) for income taxes from continuing operations | |||||||||
Current tax expense (benefit) | |||||||||
U.S. federal | $ | (3.3 | ) | (1.0 | ) | (3.8 | ) | ||
State | 0.5 | (0.2 | ) | (0.8 | ) | ||||
Foreign | 84.2 | 60.6 | 69.7 | ||||||
Current tax expense | 81.4 | 59.4 | 65.1 | ||||||
Deferred tax expense (benefit) | |||||||||
U.S. federal | 0.6 | 7.7 | (7.6 | ) | |||||
State | (0.1 | ) | — | (1.9 | ) | ||||
Foreign | (3.4 | ) | (0.6 | ) | (18.9 | ) | |||
Deferred tax benefit | (2.9 | ) | 7.1 | (28.4 | ) | ||||
Provision (benefit) for income taxes of continuing operations | $ | 78.5 | 66.5 | 36.7 | |||||
Years Ended December 31, | |||||||||
(In millions) | 2016 | 2015 | 2014 | ||||||
Comprehensive provision (benefit) for income taxes allocable to | |||||||||
Continuing operations | $ | 78.5 | 66.5 | 36.7 | |||||
Discontinued operations | (1.1 | ) | (1.0 | ) | 0.4 | ||||
Other comprehensive income (loss) | 0.9 | (0.7 | ) | (43.0 | ) | ||||
Equity | (0.2 | ) | 1.8 | 0.6 | |||||
Comprehensive provision (benefit) for income taxes | $ | 78.1 | 66.6 | (5.3 | ) | ||||
Rate Reconciliation
The following table reconciles the difference between the actual tax rate on continuing operations and the statutory U.S. federal income tax rate of 35%.
Years Ended December 31, | ||||||||
(In percentages) | 2016 | 2015 | 2014 | |||||
U.S. federal tax rate | 35.0 | % | 35.0 | % | 35.0 | % | ||
Increases (reductions) in taxes due to: | ||||||||
Venezuela devaluation | 2.9 | 61.3 | (86.3 | ) | ||||
Tax on accelerated U.S. income(a) | — | 57.3 | — | |||||
Adjustments to valuation allowances | 18.2 | 18.9 | (16.9 | ) | ||||
Foreign income taxes | 4.2 | (18.2 | ) | (0.7 | ) | |||
French business tax | 3.0 | 8.9 | (9.0 | ) | ||||
Taxes on undistributed earnings of foreign affiliates | 0.7 | (1.2 | ) | (3.7 | ) | |||
State income taxes, net | (1.0 | ) | (4.1 | ) | 5.2 | |||
Other | (0.2 | ) | 3.9 | 1.5 | ||||
Actual income tax rate on continuing operations | 62.8 | % | 161.8 | % | (74.9 | )% | ||
(a) | In the fourth quarter of 2015, we recognized a $23.5 million increase to current tax expense related to a transaction that accelerated U.S. taxable income. |
91
Components of Deferred Tax Assets and Liabilities
December 31, | ||||||
(In millions) | 2016 | 2015 | ||||
Deferred tax assets | ||||||
Pension liabilities | $ | 74.5 | 76.4 | |||
Retirement benefits other than pensions | 87.2 | 79.4 | ||||
Workers’ compensation and other claims | 41.7 | 41.2 | ||||
Property and equipment, net | 6.6 | 2.5 | ||||
Other assets and liabilities | 107.3 | 120.6 | ||||
Net operating loss carryforwards | 42.4 | 37.1 | ||||
Alternative minimum and other tax credits(a) | 62.0 | 47.5 | ||||
Subtotal | 421.7 | 404.7 | ||||
Valuation allowances | (62.8 | ) | (45.7 | ) | ||
Total deferred tax assets | 358.9 | 359.0 | ||||
Deferred tax liabilities | ||||||
Retirement benefits other than pensions | 2.1 | 1.0 | ||||
Other assets and miscellaneous | 36.5 | 36.3 | ||||
Deferred tax liabilities | 38.6 | 37.3 | ||||
Net deferred tax asset | $ | 320.3 | 321.7 | |||
Included in: | ||||||
Noncurrent assets | 327.9 | 329.8 | ||||
Noncurrent liabilities | (7.6 | ) | (8.1 | ) | ||
Net deferred tax asset | $ | 320.3 | 321.7 | |||
(a) | U.S. alternative minimum tax credits of $32.6 million have an unlimited carryforward period, U.S. foreign tax credits of $26.2 million have a 10 year carryforward period and the remaining credits of $3.2 million have various carryforward periods. The U.S. foreign tax credits have a $26.2 million valuation allowance. |
Valuation Allowances
Valuation allowances relate to deferred tax assets for certain federal credit carryforwards, certain state and non-U.S. jurisdictions. Based on our analysis of positive and negative evidence including historical and expected future taxable earnings, and a consideration of available tax-planning strategies, we believe it is more-likely-than-not that we will realize the benefit of the existing deferred tax assets, net of valuation allowances, at December 31, 2016.
In 2016, we changed our judgment about the need for valuation allowances for certain U.S. tax attributes with a limited statutory carryforward period that are no longer more-likely-than-not to be realized due to lower than expected U.S. operating results, certain pre-tax items, and other timing of tax deductions related to executive leadership transition. As a result, we recognized a $14.7 million valuation allowance in 2016 through income from continuing operations.
Years Ended December 31, | |||||||||
(In millions) | 2016 | 2015 | 2014 | ||||||
Valuation allowances: | |||||||||
Beginning of year | $ | 45.7 | 40.1 | 32.4 | |||||
Expiring tax credits | (0.4 | ) | (0.3 | ) | (0.5 | ) | |||
Acquisitions and dispositions | (0.3 | ) | — | (1.0 | ) | ||||
Changes in judgment about deferred tax assets(a) | 2.6 | 1.5 | 1.9 | ||||||
Other changes in deferred tax assets, charged to: | |||||||||
Income from continuing operations | 20.5 | 8.4 | 6.3 | ||||||
Income from discontinued operations | — | — | 3.3 | ||||||
Other comprehensive income (loss) | 0.7 | 0.3 | 0.6 | ||||||
Retained earnings(b) | 2.5 | — | — | ||||||
Foreign currency exchange effects | (8.5 | ) | (4.3 | ) | (2.9 | ) | |||
End of year | $ | 62.8 | 45.7 | 40.1 | |||||
(a) | Changes in judgment about valuation allowances are based on a recognition threshold of “more-likely-than-not” of realizing beginning-of-year balances of deferred tax assets. Amounts are recognized in income from continuing operations. |
(b) | We recognized $2.5 million in retained earnings as a result of the early adoption of ASU 2016-09. |
92
Undistributed Foreign Earnings
As of December 31, 2016, we have not recorded U.S. federal deferred income taxes on approximately $229 million of undistributed earnings of foreign subsidiaries and equity affiliates. We expect that these earnings will be permanently reinvested in operations outside the U.S. It is not practical to determine the income tax liability that might be incurred if all such income was remitted to the U.S. due to the inherent complexities associated with any hypothetical calculation, which would be dependent upon the exact form of repatriation.
Net Operating Losses
The gross amount of the net operating loss carryforwards as of December 31, 2016, was $373.8 million. The tax benefit of net operating loss carryforwards, before valuation allowances, as of December 31, 2016, was $42.4 million, and expires as follows:
(In millions) | Federal | State | Foreign | Total | ||||||||
Years of expiration | ||||||||||||
2016-2020 | $ | — | 0.2 | 3.7 | 3.9 | |||||||
2021-2025 | — | 0.1 | 11.1 | 11.2 | ||||||||
2026 and thereafter | — | 15.0 | 0.4 | 15.4 | ||||||||
No expiration | — | — | 11.9 | 11.9 | ||||||||
$ | — | 15.3 | 27.1 | 42.4 | ||||||||
Uncertain Tax Positions
A reconciliation of the beginning and ending amount of unrecognized tax benefits is as follows:
Years Ended December 31, | |||||||||
(In millions) | 2016 | 2015 | 2014 | ||||||
Uncertain tax positions: | |||||||||
Beginning of year | $ | 6.9 | 7.2 | 10.8 | |||||
Increases related to prior-year tax positions | 0.6 | — | 0.4 | ||||||
Decreases related to prior-year tax positions | (0.4 | ) | (0.3 | ) | — | ||||
Increases related to current-year tax positions | 1.2 | 1.1 | 1.1 | ||||||
Settlements | (0.8 | ) | — | — | |||||
Effect of the expiration of statutes of limitation | (0.8 | ) | (0.7 | ) | (1.3 | ) | |||
Decrease related to dispositions | — | — | (1.0 | ) | |||||
Foreign currency exchange effects | (0.3 | ) | (0.4 | ) | (2.8 | ) | |||
End of year | $ | 6.4 | 6.9 | 7.2 | |||||
Included in the balance of unrecognized tax benefits at December 31, 2016, are potential benefits of approximately $5.7 million that, if recognized, will reduce the effective tax rate on income from continuing operations.
We recognize accrued interest and penalties related to unrecognized tax benefits in provision (benefit) for income taxes. We reverse interest and penalties accruals when a statute of limitation lapses or when we otherwise conclude the amounts should not be accrued. Net increase (reversal) included in provision (benefit) for income taxes were $0.1 million in 2016, ($0.1) million in 2015, and ($0.6) million in 2014. We had accrued interest and penalties of $0.9 million at December 31, 2016, and $1.0 million at December 31, 2015.
We file income tax returns in the U.S. federal and various state and foreign jurisdictions. With a few exceptions, as of December 31, 2016, we were no longer subject to U.S. federal, state and local, or non-U.S. income tax examinations by tax authorities for years before 2013. Additionally, due to statute of limitations expirations and audit settlements, it is reasonably possible that approximately $0.8 million of currently remaining unrecognized tax positions may be recognized by the end of 2017.
93
Note 5 - Property and Equipment
The following table presents our property and equipment that is classified as held and used:
December 31, | ||||||
(In millions) | 2016 | 2015 | ||||
Land | $ | 51.4 | 56.3 | |||
Buildings | 196.4 | 192.8 | ||||
Leasehold improvements | 187.5 | 181.3 | ||||
Vehicles | 394.5 | 369.4 | ||||
Capitalized software(a) | 179.1 | 183.6 | ||||
Other machinery and equipment | 549.6 | 572.1 | ||||
1,558.5 | 1,555.5 | |||||
Accumulated depreciation and amortization | (1,027.5 | ) | (1,006.5 | ) | ||
Property and equipment, net | $ | 531.0 | 549.0 | |||
(a) | Amortization of capitalized software costs included in continuing operations was $19.6 million in 2016, $20.7 million in 2015 and $20.3 million in 2014. |
Note 6 - Goodwill and Other Intangible Assets
Goodwill
The changes in the carrying amount of goodwill by operating segment for the years ended December 31, 2016 and 2015 are as follows:
December 31, 2016 | ||||||||||||
(In millions) | Beginning Balance | Acquisitions/ Dispositions | Currency | Ending Balance | ||||||||
Goodwill: | ||||||||||||
Largest 5 Markets: | ||||||||||||
U.S. | $ | 11.6 | — | 0.1 | 11.7 | |||||||
France | 41.6 | — | (1.3 | ) | 40.3 | |||||||
Mexico | 7.5 | — | 1.4 | 8.9 | ||||||||
Brazil | 10.4 | — | 2.2 | 12.6 | ||||||||
Canada | 3.2 | — | 0.1 | 3.3 | ||||||||
Global Markets: | ||||||||||||
Latin America | 11.7 | — | 1.7 | 13.4 | ||||||||
EMEA | 75.0 | (0.2 | ) | (2.7 | ) | 72.1 | ||||||
Asia | 23.4 | — | (0.6 | ) | 22.8 | |||||||
Payment Services | 0.9 | — | 0.2 | 1.1 | ||||||||
Total Goodwill | $ | 185.3 | (0.2 | ) | 1.1 | 186.2 | ||||||
December 31, 2015 | ||||||||||||
(In millions) | Beginning Balance | Acquisitions/ Dispositions | Currency | Ending Balance | ||||||||
Goodwill: | ||||||||||||
Largest 5 Markets: | ||||||||||||
U.S. | $ | 12.5 | — | (0.9 | ) | 11.6 | ||||||
France | 46.3 | — | (4.7 | ) | 41.6 | |||||||
Mexico | 11.3 | (0.1 | ) | (3.7 | ) | 7.5 | ||||||
Brazil | 15.5 | — | (5.1 | ) | 10.4 | |||||||
Canada | 3.8 | — | (0.6 | ) | 3.2 | |||||||
Global Markets: | ||||||||||||
Latin America | 16.0 | — | (4.3 | ) | 11.7 | |||||||
EMEA | 84.4 | (1.8 | ) | (7.6 | ) | 75.0 | ||||||
Asia | 24.5 | — | (1.1 | ) | 23.4 | |||||||
Payment Services | 1.4 | — | (0.5 | ) | 0.9 | |||||||
Total Goodwill | $ | 215.7 | (1.9 | ) | (28.5 | ) | 185.3 | |||||
94
Intangible Assets
The following table summarizes our other intangible assets by category:
December 31, 2016 | December 31, 2015 | ||||||||||||||||||
(In millions) | Gross Carrying Amount | Accumulated Amortization | Net Carrying Amount | Gross Carrying Amount | Accumulated Amortization | Net Carrying Amount | |||||||||||||
Customer relationships | 50.2 | (43.5 | ) | 6.7 | 54.4 | (40.0 | ) | 14.4 | |||||||||||
Indefinite-lived trade names | 7.5 | — | 7.5 | 9.0 | — | 9.0 | |||||||||||||
Finite-lived trade names | 1.3 | (1.2 | ) | 0.1 | 1.1 | (0.9 | ) | 0.2 | |||||||||||
Other contract-related assets | 6.7 | (2.4 | ) | 4.3 | 5.6 | (1.5 | ) | 4.1 | |||||||||||
Other | 3.7 | (3.2 | ) | 0.5 | 3.7 | (2.9 | ) | 0.8 | |||||||||||
Total | $ | 69.4 | (50.3 | ) | 19.1 | $ | 73.8 | (45.3 | ) | 28.5 | |||||||||
In 2016, we recognized a $6.5 million impairment charge related to a customer relationship intangible asset in our Brink's India operations, which is included in other operating expense. Total amortization expense for our finite-lived intangible assets was $3.6 million in 2016. Our estimated aggregate amortization expense for finite-lived intangibles recorded at December 31, 2016, for the next five years is as follows:
(In millions) | 2017 | 2018 | 2019 | 2020 | 2021 | ||||||||||
Amortization expense | $ | 2.4 | 2.1 | 1.8 | 1.7 | 1.4 | |||||||||
Note 7 - Prepaid Expenses and Other
December 31, | ||||||
(In millions) | 2016 | 2015 | ||||
Prepaid expenses | $ | 60.3 | 53.4 | |||
Mobile airtime inventory | 10.9 | 13.3 | ||||
Income tax receivable | 16.5 | 19.7 | ||||
Other | 15.9 | 14.9 | ||||
Prepaid expenses and other | $ | 103.6 | 101.3 | |||
Note 8 - Other Assets
December 31, | ||||||
(In millions) | 2016 | 2015 | ||||
Deposits | $ | 12.4 | 12.1 | |||
Deferred profit sharing asset | 11.3 | 12.4 | ||||
Income tax receivable | 31.9 | 22.9 | ||||
Derivative instruments | 1.6 | 4.2 | ||||
Equity method investment in unconsolidated entities | 3.5 | 4.9 | ||||
Marketable securities | 4.1 | 3.5 | ||||
Other | 22.1 | 16.4 | ||||
Other assets | $ | 86.9 | 76.4 | |||
95
Note 9 - Accumulated Other Comprehensive Income (Loss)
The following tables provide the components of other comprehensive income (loss), including the amounts reclassified from accumulated other comprehensive income (loss) into earnings:
Amounts Arising During the Current Period | Amounts Reclassified to Net Income (Loss) | ||||||||||||||
(In millions) | Pretax | Income Tax | Pretax | Income Tax | Total Other Comprehensive Income (Loss) | ||||||||||
2016 | |||||||||||||||
Amounts attributable to Brink's: | |||||||||||||||
Benefit plan adjustments | $ | (39.5 | ) | 16.7 | 51.3 | (17.6 | ) | 10.9 | |||||||
Foreign currency translation adjustments | (26.6 | ) | 0.2 | (0.1 | ) | — | (26.5 | ) | |||||||
Unrealized gains (losses) on available-for-sale securities | 0.4 | (0.2 | ) | (0.5 | ) | 0.2 | (0.1 | ) | |||||||
Gains (losses) on cash flow hedges | (1.2 | ) | — | 2.0 | (0.2 | ) | 0.6 | ||||||||
(66.9 | ) | 16.7 | 52.7 | (17.6 | ) | (15.1 | ) | ||||||||
Amounts attributable to noncontrolling interests: | |||||||||||||||
Benefit plan adjustments | (1.5 | ) | — | 0.4 | — | (1.1 | ) | ||||||||
Foreign currency translation adjustments | 0.4 | — | — | — | 0.4 | ||||||||||
(1.1 | ) | — | 0.4 | — | (0.7 | ) | |||||||||
Total | |||||||||||||||
Benefit plan adjustments(a) | (41.0 | ) | 16.7 | 51.7 | (17.6 | ) | 9.8 | ||||||||
Foreign currency translation adjustments(b) | (26.2 | ) | 0.2 | (0.1 | ) | — | (26.1 | ) | |||||||
Unrealized gains (losses) on available-for-sale securities(c) | 0.4 | (0.2 | ) | (0.5 | ) | 0.2 | (0.1 | ) | |||||||
Gains (losses) on cash flow hedges(d) | (1.2 | ) | — | 2.0 | (0.2 | ) | 0.6 | ||||||||
$ | (68.0 | ) | 16.7 | 53.1 | (17.6 | ) | (15.8 | ) | |||||||
2015 | |||||||||||||||
Amounts attributable to Brink's: | |||||||||||||||
Benefit plan adjustments | $ | (57.1 | ) | 20.4 | 58.1 | (20.2 | ) | 1.2 | |||||||
Foreign currency translation adjustments | (106.2 | ) | 0.3 | 5.7 | — | (100.2 | ) | ||||||||
Unrealized gains (losses) on available-for-sale securities | 0.6 | (0.2 | ) | (1.1 | ) | 0.4 | (0.3 | ) | |||||||
Gains (losses) on cash flow hedges | 3.3 | — | (3.6 | ) | — | (0.3 | ) | ||||||||
(159.4 | ) | 20.5 | 59.1 | (19.8 | ) | (99.6 | ) | ||||||||
Amounts attributable to noncontrolling interests: | |||||||||||||||
Benefit plan adjustments | (0.7 | ) | — | 0.5 | — | (0.2 | ) | ||||||||
Foreign currency translation adjustments | (3.6 | ) | — | — | — | (3.6 | ) | ||||||||
(4.3 | ) | — | 0.5 | — | (3.8 | ) | |||||||||
Total | |||||||||||||||
Benefit plan adjustments(a)(b) | (57.8 | ) | 20.4 | 58.6 | (20.2 | ) | 1.0 | ||||||||
Foreign currency translation adjustments(b) | (109.8 | ) | 0.3 | 5.7 | — | (103.8 | ) | ||||||||
Unrealized gains (losses) on available-for-sale securities(c) | 0.6 | (0.2 | ) | (1.1 | ) | 0.4 | (0.3 | ) | |||||||
Gains (losses) on cash flow hedges(d) | 3.3 | — | (3.6 | ) | — | (0.3 | ) | ||||||||
$ | (163.7 | ) | 20.5 | 59.6 | (19.8 | ) | (103.4 | ) | |||||||
96
Amounts Arising During the Current Period | Amounts Reclassified to Net Income (Loss) | ||||||||||||||
(In millions) | Pretax | Income Tax | Pretax | Income Tax | Total Other Comprehensive Income (Loss) | ||||||||||
2014 | |||||||||||||||
Amounts attributable to Brink's: | |||||||||||||||
Benefit plan adjustments | $ | (231.2 | ) | 78.1 | 95.3 | (35.9 | ) | (93.7 | ) | ||||||
Foreign currency translation adjustments | (82.2 | ) | — | 1.3 | 0.3 | (80.6 | ) | ||||||||
Unrealized gains (losses) on available-for-sale securities | 0.1 | — | (0.5 | ) | 0.2 | (0.2 | ) | ||||||||
Gains (losses) on cash flow hedges | 0.7 | — | (0.9 | ) | — | (0.2 | ) | ||||||||
(312.6 | ) | 78.1 | 95.2 | (35.4 | ) | (174.7 | ) | ||||||||
Amounts attributable to noncontrolling interests: | |||||||||||||||
Benefit plan adjustments | (1.4 | ) | 0.4 | 0.4 | (0.1 | ) | (0.7 | ) | |||||||
Foreign currency translation adjustments | (6.1 | ) | — | — | — | (6.1 | ) | ||||||||
(7.5 | ) | 0.4 | 0.4 | (0.1 | ) | (6.8 | ) | ||||||||
Total | |||||||||||||||
Benefit plan adjustments(a) | (232.6 | ) | 78.5 | 95.7 | (36.0 | ) | (94.4 | ) | |||||||
Foreign currency translation adjustments(b) | (88.3 | ) | — | 1.3 | 0.3 | (86.7 | ) | ||||||||
Unrealized gains (losses) on available-for-sale securities(c) | 0.1 | — | (0.5 | ) | 0.2 | (0.2 | ) | ||||||||
Gains (losses) on cash flow hedges(d) | 0.7 | — | (0.9 | ) | — | (0.2 | ) | ||||||||
$ | (320.1 | ) | 78.5 | 95.6 | (35.5 | ) | (181.5 | ) | |||||||
(a) | The amortization of prior experience losses and prior service cost is part of total net periodic retirement benefit cost when reclassified to net income (loss). Net periodic retirement benefit cost also includes service cost, interest cost, expected returns on assets, and settlement costs. The total pretax expense is allocated between cost of revenues and selling, general and administrative expenses on a plan-by-plan basis: |
December 31, | |||||||||
(In millions) | 2016 | 2015 | 2014 | ||||||
Total net periodic retirement benefit cost included in: | |||||||||
Cost of revenues | $ | 42.0 | 36.1 | 68.0 | |||||
Selling, general and administrative expenses | 8.8 | 14.3 | 29.5 | ||||||
(b) | Reclassification of foreign currency translation amounts in 2015 relate primarily to the sale of our Russian cash management operations. These amounts are included in other operating income (expense). Pretax benefit plan adjustments of $8 million (including related deferred tax component) and foreign currency translation adjustments reclassified to the consolidated statements of operations in 2014 relate to the sale of CIT operations in the Netherlands. The 2014 amounts are included in loss from discontinued operations in the consolidated statements of operations. |
(c) | Gains and losses on sales of available-for-sale securities are reclassified from accumulated other comprehensive loss to the consolidated statements of operations when the gains or losses are realized. Pretax amounts are classified in the consolidated statements of operations as interest and other income (expense). |
(d) | Pretax gains and losses on cash flow hedges are classified in the consolidated statements of operations as |
• | other operating income (expense) ($1.3 million losses in 2016, $4.1 million gains in 2015 and $1.9 million gains in 2014) |
• | interest and other income (expense) ($0.3 million losses in 2016, $0.5 million losses in 2015 and $1.0 million in 2014.) |
97
The changes in accumulated other comprehensive loss attributable to Brink’s are as follows:
(In millions) | Benefit Plan Adjustments | Foreign Currency Translation Adjustments | Unrealized Gains (Losses) on Available-for-Sale Securities | Gains (Losses) on Cash Flow Hedges | Total | ||||||||||
Balance as of December 31, 2013 | $ | (478.0 | ) | (141.5 | ) | 1.6 | 0.6 | (617.3 | ) | ||||||
Other comprehensive income (loss) before reclassifications | (153.1 | ) | (82.2 | ) | 0.1 | 0.7 | (234.5 | ) | |||||||
Amounts reclassified from accumulated other comprehensive loss | 59.4 | 1.6 | (0.3 | ) | (0.9 | ) | 59.8 | ||||||||
Other comprehensive income (loss) attributable to Brink's | (93.7 | ) | (80.6 | ) | (0.2 | ) | (0.2 | ) | (174.7 | ) | |||||
Balance as of December 31, 2014 | (571.7 | ) | (222.1 | ) | 1.4 | 0.4 | (792.0 | ) | |||||||
Other comprehensive income (loss) before reclassifications | (36.7 | ) | (105.9 | ) | 0.4 | 3.3 | (138.9 | ) | |||||||
Amounts reclassified from accumulated other comprehensive loss | 37.9 | 5.7 | (0.7 | ) | (3.6 | ) | 39.3 | ||||||||
Other comprehensive income (loss) attributable to Brink's | 1.2 | (100.2 | ) | (0.3 | ) | (0.3 | ) | (99.6 | ) | ||||||
Acquisitions of noncontrolling interests | — | (0.3 | ) | — | — | (0.3 | ) | ||||||||
Balance as of December 31, 2015 | (570.5 | ) | (322.6 | ) | 1.1 | 0.1 | (891.9 | ) | |||||||
Other comprehensive income (loss) before reclassifications | (22.8 | ) | (26.4 | ) | 0.2 | (1.2 | ) | (50.2 | ) | ||||||
Amounts reclassified from accumulated other comprehensive loss | 33.7 | (0.1 | ) | (0.3 | ) | 1.8 | 35.1 | ||||||||
Other comprehensive income (loss) attributable to Brink's | 10.9 | (26.5 | ) | (0.1 | ) | 0.6 | (15.1 | ) | |||||||
Balance as of December 31, 2016 | $ | (559.6 | ) | (349.1 | ) | 1.0 | 0.7 | (907.0 | ) | ||||||
98
Note 10 - Fair Value of Financial Instruments
Investments in Trading Securities and Available-for-sale Securities
We have investments in mutual funds designated as trading securities and as available-for-sale securities that are carried at fair value in the financial statements. For these investments, fair value was estimated based on quoted prices categorized as a Level 1 valuation.
Fixed-Rate Debt
The fair value and carrying value of our fixed-rate debt are as follows:
December 31, | ||||||
(In millions) | 2016 | 2015 | ||||
Unsecured notes issued in a private placement | ||||||
Carrying value | $ | 85.7 | 92.9 | |||
Fair value | 88.2 | 95.7 | ||||
The fair value estimate of our unsecured private-placement notes is based on the present value of future cash flows, discounted at rates for similar instruments at the respective measurement dates, which we have categorized as a Level 3 valuation.
Forward and Swap Contracts
We have outstanding foreign currency forward and swap contracts to hedge transactional risks associated with foreign currencies. At December 31, 2016, the notional value of our shorter term outstanding foreign currency forward and swap contracts was $41.9 million, with average maturities of approximately one month. These shorter term foreign currency forward and swap contracts primarily offset exposures in the British pound and the Mexican peso and are not designated as hedges for accounting purposes. At December 31, 2016, the fair value of these shorter term foreign currency contracts was not significant.
In 2013, we entered into a longer term cross-currency swap to hedge against the change in value of a long-term intercompany loan denominated in Brazilian real. This longer term contract is designated as a cash flow hedge for accounting purposes. At December 31, 2016, the notional value of this contract was $7.9 million with a weighted-average maturity of 0.6 years. At December 31, 2016, the fair value of this longer term swap contract was a net asset of $3.1 million, of which $2.4 million is included in prepaid expenses and other and $0.7 million is included in other assets on the consolidated balance sheet.
In the first quarter of 2016, we entered into two interest rate swaps with a total notional value of $40 million with a weighted-average maturity of 1.9 years. These swaps were entered into to hedge cash flow risk associated with changes in variable interest rates and are designated as cash flow hedges for accounting purposes. At December 31, 2016, the fair value of these interest rate swaps was a net asset of $0.8 million, of which $0.9 million in included in other assets and $0.1 million was included in accrued liabilities.
The fair values of these forward and swap contracts are determined using Level 2 valuation techniques and are based on the present value of net future cash payments and receipts.
Other Financial Instruments
Other financial instruments include cash and cash equivalents, accounts receivable, floating rate debt, accounts payable and accrued liabilities. The financial statement carrying amounts of these items approximate the fair value.
There were no transfers in or out of any of the levels of the valuation hierarchy in 2016.
99
Note 11 - Accrued Liabilities
December 31, | ||||||
(In millions) | 2016 | 2015 | ||||
Payroll and other employee liabilities | $ | 123.2 | 120.3 | |||
Taxes, except income taxes | 80.8 | 89.4 | ||||
Cash held by Cash Management Services operations(a) | 9.8 | 24.2 | ||||
Workers’ compensation and other claims | 19.2 | 24.2 | ||||
Retirement benefits (see Note 3) | 9.1 | 8.3 | ||||
Income taxes payable | 23.2 | 16.8 | ||||
Other | 120.4 | 118.0 | ||||
Accrued liabilities | $ | 385.7 | 401.2 | |||
(a) | Title to cash received and processed in certain of our secure Cash Management Services operations transfers to us for a short period of time. The cash is generally credited to customers’ accounts the following day and we record a liability while the cash is in our possession. |
Note 12 - Other Liabilities
December 31, | ||||||
(In millions) | 2016 | 2015 | ||||
Workers’ compensation and other claims | $ | 56.5 | 46.3 | |||
Non-recourse financing liability(a) | 12.6 | 14.4 | ||||
Post-employment benefits | 11.5 | 12.0 | ||||
Asset retirement and remediation obligations | 14.3 | 12.9 | ||||
Employee-related liabilities | 1.2 | 4.2 | ||||
Noncurrent tax liabilities | 5.3 | 5.7 | ||||
Other | 34.7 | 34.0 | ||||
Other liabilities | $ | 136.1 | 129.5 | |||
(a) Our Brink's Mexico operations entered into a transaction in 2015 to sell its headquarters building in Mexico City and lease the property back for two years. The transaction did not qualify for sale-leaseback accounting due to continuing involvement with the property. Therefore, proceeds received are recorded as a financing liability.
100
Note 13 - Debt
December 31, | ||||||
(In millions) | 2016 | 2015 | ||||
Debt: | ||||||
Short-term borrowings | ||||||
Uncommitted credit facilities (year-end weighted-average interest rate of 1.7% in 2016) | $ | 108.3 | — | |||
Restricted cash borrowings (year-end weighted-average interest rate of 0.5% in 2016 and 0.1% in 2015)(a) | 22.3 | 3.5 | ||||
Other (year-end weighted-average interest rate of 8.1% in 2016 and 8.7% in 2015) | 32.2 | 29.1 | ||||
Total short-term borrowings | $ | 162.8 | 32.6 | |||
Long-term debt | ||||||
Bank credit facilities: | ||||||
Revolving Facility (year-end weighted-average interest | ||||||
rate of 1.8% in 2016 and 1.8% in 2015) | $ | 55.8 | 163.3 | |||
Private Placement Notes (Series A effective interest rate of 4.6%, Series B effective interest | ||||||
rate of 5.2%), due 2021, less unamortized debt costs of $0.1 million in 2016 and $0.1 million in 2015 | 85.6 | 92.8 | ||||
Term loan (year-end effective interest rate of 2.5% in 2016 and 2.2% in 2015) | ||||||
less unamortized debt costs of $0.2 million in 2016 and $0.2 million in 2015 | 65.6 | 70.9 | ||||
Other primarily non-U.S. dollar-denominated facilities (year-end weighted- | ||||||
average interest rate of 6.9% in 2016 and 5.1% in 2015) | 6.4 | 11.4 | ||||
Capital leases (year-end weighted-average interest rate of 4.2% in 2016 and 3.6% in 2015) | 67.0 | 59.5 | ||||
Total long-term debt | $ | 280.4 | 397.9 | |||
Total Debt | $ | 443.2 | 430.5 | |||
Included in: | ||||||
Current liabilities | $ | 195.6 | 72.4 | |||
Noncurrent liabilities | 247.6 | 358.1 | ||||
Total debt | $ | 443.2 | 430.5 | |||
(a) | These 2016 and 2015 amounts are for short-term borrowings related to cash borrowed under lending arrangements used in the process of managing customer cash supply chains, which is currently classified as restricted cash and not available for general corporate purposes. See Note 19 for more details. |
Short-Term Borrowings
Uncommitted Credit Facilities
In October 2016, we entered into a $100 million uncommitted credit facility. Borrowings under this facility have a maximum maturity of not more than thirty days. Interest on this facility is generally based on LIBOR plus a margin of 1.00%. As of December 31, 2016, $100 million was outstanding.
In February 2016, we entered into a $24 million uncommitted credit facility with an initial expiration date in February 2017. The facility was amended in February 2017, which extended the expiration date to February 2018. Interest on this facility is currently based on LIBOR plus a margin of 1.00%. As of December 31, 2016, $8 million was outstanding.
Long-Term Debt
Revolving Facility
We have a $525 million unsecured multi-currency revolving bank credit facility (the “Revolving Facility”) that matures in March 2020. The Revolving Facility’s interest rate is based on LIBOR plus a margin or an alternate base rate plus a margin. The Revolving Facility allows us to borrow loans or issue letters of credit (or otherwise satisfy credit needs) on a revolving basis over the term of the facility. As of December 31, 2016, $469 million was available under the Revolving Facility. Amounts outstanding under the Revolving Facility, as of December 31, 2016, were denominated primarily in U.S. dollars and to a lesser extent in euros.
The margin on LIBOR borrowings under the Revolving Facility, which can range from 1.0% to 1.70% depending on either our credit rating or leverage ratio as defined within the Revolving Facility, was 1.30% at December 31, 2016. The margin on alternate base rate borrowings under the Revolving Facility ranges from 0.0% to 0.70%. We also pay an annual facility fee on the Revolving Facility based on our credit rating or the leverage ratio. The facility fee can range from 0.125% to 0.30% and was 0.20% at December 31, 2016.
101
Private Placement Notes
We have $86 million principal amount of unsecured notes outstanding, which were issued through a private placement debt transaction (the “Notes”). The Notes comprise $36 million in series A notes with a fixed interest rate of 4.57% and $50 million in series B notes with a fixed interest rate of 5.20%. Annual principal payments under the series A notes began in January 2015 and continue through maturity. The series B notes are due in January 2021.
Term Loan
We entered into a $75 million unsecured term loan in March 2015. Interest on this loan is based on LIBOR plus a margin of 1.75%. Monthly principal payments began April 2015 and continue through to maturity, with the remaining balance of $34 million due in March 2022. As of December 31, 2016, the principal amount outstanding was $66 million.
Other Facilities
As of December 31, 2016, we have one $20 million unsecured multi-currency revolving bank credit facility, of which $4 million was outstanding. As of December 31, 2016, we had undrawn letters of credit and guarantees of $66 million issued under the letter of credit facilities and $5 million issued under the multi-currency revolving bank credit facilities. This $20 million facility expires in March 2019. Interest on this facility is based on LIBOR plus a margin, which ranges from 1.0% to 1.7%. We also have the ability to borrow from other banks, at the banks' discretion, under short-term uncommitted agreements. Various foreign subsidiaries maintain other lines of credit and overdraft facilities with a number of banks.
Letter of Credit Facilities
We have a $40 million uncommitted letter of credit facility that expires in May 2017. As of December 31, 2016, $5 million was utilized.
We have two unsecured letter of credit facilities totaling $94 million, of which approximately $28 million was available at December 31, 2016. At December 31, 2016, we had undrawn letters of credit and guarantees of $66 million issued under these letter of credit facilities. A $40 million facility expires in December 2018 and a $54 million facility expires in December 2019. The Revolving Facility and the multi-currency revolving credit facilities are also used for issuance of letters of credit and bank guarantees.
Minimum repayments of long-term debt are as follows:
(In millions) | Capital leases | Other long-term debt | Total | ||||||
2017 | $ | 18.5 | 14.3 | 32.8 | |||||
2018 | 14.8 | 13.1 | 27.9 | ||||||
2019 | 11.1 | 16.0 | 27.1 | ||||||
2020 | 9.1 | 69.8 | 78.9 | ||||||
2021 | 7.6 | 65.2 | 72.8 | ||||||
Later years | 5.9 | 35.0 | 40.9 | ||||||
Total | $ | 67.0 | 213.4 | 280.4 | |||||
The Revolving Facility, the Notes, the unsecured multi-currency revolving bank credit facilities, the unsecured committed credit facility, the letter of credit facilities and the unsecured term loan contain certain subsidiary guarantees and various financial and other covenants. The financial covenants, among other things, limit our total indebtedness, restrict certain payments to shareholders, limit priority debt, limit asset sales, limit the use of proceeds from asset sales, provide for a maximum leverage ratio and provide for minimum coverage of interest costs. These agreements do not provide for the acceleration of payments should our credit rating be reduced. If we were not to comply with the terms of our various financing agreements, the repayment terms could be accelerated and the commitments could be withdrawn. An acceleration of the repayment terms under one agreement could trigger the acceleration of the repayment terms under the other financing agreements. We were in compliance with all financial covenants at December 31, 2016.
102
Capital Leases
Property and equipment acquired under capital leases are included in property and equipment as follows:
December 31, | ||||||
(In millions) | 2016 | 2015 | ||||
Asset class: | ||||||
Buildings | $ | 2.0 | 2.0 | |||
Vehicles | 131.8 | 114.1 | ||||
Machinery and equipment | 1.4 | 13.6 | ||||
135.2 | 129.7 | |||||
Less: accumulated amortization | (63.5 | ) | (66.0 | ) | ||
Total | $ | 71.7 | 63.7 | |||
Note 14 - Accounts Receivable
December 31, | ||||||
(In millions) | 2016 | 2015 | ||||
Trade | $ | 485.9 | 468.2 | |||
Other | 23.5 | 19.0 | ||||
Total accounts receivable | 509.4 | 487.2 | ||||
Allowance for doubtful accounts | (8.3 | ) | (9.1 | ) | ||
Accounts receivable, net | $ | 501.1 | 478.1 | |||
Years Ended December 31, | |||||||||
(In millions) | 2016 | 2015 | 2014 | ||||||
Allowance for doubtful accounts: | |||||||||
Beginning of year | $ | 9.1 | 10.0 | 8.2 | |||||
Provision for uncollectible accounts receivable: | |||||||||
Continuing operations | 2.8 | 2.9 | 7.5 | ||||||
Discontinued operations | — | (0.2 | ) | (0.5 | ) | ||||
Write offs less recoveries | (3.0 | ) | (0.9 | ) | (2.6 | ) | |||
Foreign currency exchange effects | (0.6 | ) | (2.7 | ) | (2.6 | ) | |||
End of year | $ | 8.3 | 9.1 | 10.0 | |||||
103
Note 15 - Operating Leases
We lease facilities, vehicles, computers and other equipment under long-term operating and capital leases with varying terms. Most of the operating leases contain renewal and/or purchase options. We expect that in the normal course of business, the majority of operating leases will be renewed or replaced by other leases.
As of December 31, 2016, future minimum lease payments under noncancellable operating leases with initial or remaining lease terms in excess of one year are included below.
(In millions) | Facilities | Vehicles | Other | Total | ||||||||
2017 | $ | 39.0 | 5.8 | 15.1 | 59.9 | |||||||
2018 | 37.0 | 4.5 | 32.8 | 74.3 | ||||||||
2019 | 24.6 | 3.1 | 12.9 | 40.6 | ||||||||
2020 | 19.9 | 1.4 | 8.8 | 30.1 | ||||||||
2021 | 15.5 | 0.9 | 3.4 | 19.8 | ||||||||
Later years | 40.2 | 1.7 | — | 41.9 | ||||||||
$ | 176.2 | 17.4 | 73.0 | 266.6 | ||||||||
The cost related to operating leases is recognized as rental expense. Net rent expense included in continuing operations amounted to $96.0 million in 2016, $92.5 million in 2015 and $101.7 million in 2014.
104
Note 16 - Share-Based Compensation Plans
We have share-based compensation plans to attract and retain employees and nonemployee directors and to more closely align their interests with those of our shareholders.
We have granted share-based awards to employees under the 2005 Equity Incentive Plan ("2005 Plan") and the 2013 Equity Incentive Plan ("2013 Plan"). These plans permit grants of restricted stock, restricted stock units, performance stock, performance units, stock appreciation rights, stock options, as well as other share-based awards to eligible employees. The 2013 Plan also permits cash awards to eligible employees. The 2005 Plan was replaced by the 2013 Plan effective February 2013. No further grants of awards will be made under the 2005 Plan.
We have granted deferred stock units to directors through the Non-Employee Directors’ Equity Plan. Share-based awards were granted to directors and remain outstanding under the Non-Employee Directors’ Stock Option Plan and the Directors’ Stock Accumulation Plan, both of which have expired.
There are 2.4 million shares underlying share-based plans that are authorized, but not yet granted. Outstanding awards at December 31, 2016, include performance share units, market share units, restricted stock units, deferred stock units, performance-based stock options and time-based vesting stock options.
Compensation Expense
Compensation expense is measured using the fair-value-based method. For employee and director awards considered equity grants, compensation expense is recognized from the award or grant date to the earlier of the retirement-eligible date or the vesting date.
The grant date for accounting purposes may be different than the date the award is granted to the employee. To establish a grant date for accounting purposes, the employee and the employer must have a mutual understanding of the important terms and conditions of the award. For awards considered liabilities and for equity awards that have not had a grant date established because a mutual understanding does not exist, compensation cost is based on the change in the fair value of the instrument for each reporting period and the percentage of the requisite service that has been rendered.
For certain awards granted since 2010, we concluded in the second quarter of 2014 that the employee and employer did not have a mutual understanding related to the application of a compensation recoupment policy that was established in 2010. As a result, we concluded that the service inception date preceded the grant date for equity awards outstanding at that time. Our recoupment policy was revised in July 2014 and, as a result, we concluded that certain outstanding awards have grant dates that reflect the date of the revision of the policy on July 11, 2014. Approximately 130 employees who received share-based awards were affected by the change in policy. As a result, we recognized $4.2 million of expense during the second quarter of 2014 for the cumulative effect of this accounting error.
Compensation expenses are classified as selling, general and administrative expenses in the consolidated statements of operations. Compensation expenses for the last three years and the amount of unrecognized expense for awards outstanding at December 31, 2016, were as follows:
Compensation Expense | Unrecognized Expense for Nonvested Awards at | Weighted-average No. of Years Unrecognized Expense to be Recognized | |||||||||||||
Years Ended December 31, | Dec 31, 2016 | ||||||||||||||
(in millions except years) | 2016 | 2015 | 2014 | ||||||||||||
Performance Share Units | $ | 4.1 | 8.1 | 6.8 | $ | 9.2 | 2.0 | ||||||||
Market Share Units | 0.1 | 2.3 | 1.6 | 0.3 | 1.1 | ||||||||||
Restricted Stock Units | 3.8 | 3.2 | 6.0 | 3.7 | 1.8 | ||||||||||
Deferred Stock Units | 0.9 | 0.5 | 0.6 | 0.3 | 0.3 | ||||||||||
Performance-based Options | 0.6 | — | — | 2.9 | 2.5 | ||||||||||
Options | — | — | 2.3 | — | 0.0 | ||||||||||
Share-based payment expense | 9.5 | 14.1 | 17.3 | ||||||||||||
Income tax benefit | (3.0 | ) | (4.6 | ) | (5.6 | ) | |||||||||
Share-based payment expense, net of tax | $ | 6.5 | 9.5 | 11.7 | |||||||||||
105
Fair Value of Distributed or Exercised Awards
The fair value of shares distributed or options exercised in the last three years is as follows:
Fair Value of Shares Distributed or Exercised(a) | |||||||||
Years Ended December 31, | |||||||||
(in millions) | 2016 | 2015 | 2014 | ||||||
Performance Share Units(b) | $ | 8.2 | — | — | |||||
Market Share Units(b) | 2.7 | — | — | ||||||
Restricted Stock Units | 4.1 | 5.3 | 4.1 | ||||||
Deferred Stock Units | 1.9 | 0.2 | 0.3 | ||||||
Options | 5.3 | 1.1 | 0.1 | ||||||
Total | $ | 22.2 | 6.6 | 4.5 | |||||
(a) | Intrinsic value for Options. |
(b) | No Performance Share Units or Market Share Units had vested as of December 31, 2015. |
Restricted Stock Units (“RSUs”)
We granted RSUs to senior executives and select employees in the last three years that contain only a service condition. RSUs are paid out in shares of Brink’s stock when the awards vest. For RSUs granted during the last three years, the units generally vest ratably in three equal annual installments. We measure the fair value of RSUs based on the price of Brink’s stock at the grant date, adjusted for a discount for dividends not received or accrued during the vesting period. The weighted-average fair value per share at issuance date was $29.06 in 2016, $27.09 in 2015 and $27.91 in 2014. The weighted-average discount was approximately 3% in 2016, 2015 and 2014.
The following table summarizes RSU activity during 2016:
Shares (in thousands) | Weighted-Average Grant Date Fair Value | |||||
Nonvested balance as of December 31, 2015 | 273.0 | $ | 26.16 | |||
Activity from January 1 to December 31, 2016: | ||||||
Granted | 211.3 | 29.06 | ||||
Forfeited | (56.4 | ) | 27.62 | |||
Vested | (131.4 | ) | 26.39 | |||
Nonvested balance as of December 31, 2016 | 296.5 | $ | 27.84 | |||
Performance Share Units (“PSUs”)
Prior to 2016, we granted PSUs which contained a performance condition, a market condition and a service condition. In 2016, we granted Internal Metric PSUs ("IM PSUs") and Total Shareholder Return PSUs ("TSR PSUs").
IM PSUs contain a performance condition as well as a service condition. We measure the fair value of these PSUs based on the price of Brink’s stock at the grant date, adjusted for a discount for dividends not received or accrued during the vesting period. For the majority of the IM PSUs granted in 2016, the performance period is from January 1, 2016 to December 31, 2017, with an additional year of service required.
Other IM PSUs granted in 2016 have a performance period from July 1, 2016 to June 30, 2017, with an additional two years of service required.
TSR PSUs contain a market condition as well as a service condition. We measure the fair value of PSUs containing a market condition at the grant date using a Monte Carlo simulation model. For the TSR PSUs granted in 2016, the performance period is from January 1, 2016 to December 1, 2018.
PSUs granted to senior executives and select employees in 2016, 2015 and 2014 typically vest over three years and are paid out in shares of Brink’s stock. The number of shares paid out ranges from 0% to 200% of an employee’s award, depending on the achievement of pre-established financial goals over the performance period, which can be three years, two years or one year, depending on the underlying award. Shares are not paid out if the financial results do not meet a pre-established threshold level of performance.
For PSUs granted before 2016, the number of shares paid out is also affected by Brink’s total shareholder return relative to the total return of a pre-established stock index over the performance period. The number of shares paid out is increased by 25% if Brink’s total shareholder return is at or above the 75th percentile of the index’s total return. The number of shares paid out is reduced by 25% if Brink’s performance is at or below the 25th percentile. The number of shares is not adjusted if Brink’s performance is between the 25th and 75th percentile.
Changes to Performance Goals for the 2013, 2014 and 2015 PSU Grants. The performance goals for the 2013, 2014 and 2015 PSU grants were or are based on consolidated operating profit over the performance period, which were or are adjusted for various items including
106
corporate items, acquisition and dispositions, unusual or infrequently occurring events and foreign currency. In 2014, the Compensation and Benefits Committee of the Board of Directors approved a second performance goal for the PSU awards granted in 2013 and 2014 to reflect the change in currency exchange rate used to report the results of Venezuela because the rate had changed significantly. Additionally, in February 2016, the Compensation and Benefits Committee of the Board of Directors modified the terms of performance share units originally awarded or granted in 2013, 2014 and 2015 to reflect the impact of removing Venezuela operations from the Company’s segment results beginning in 2015. For each of the affected performance share units, consolidated results for 2015 and each subsequent year within the respective performance period was or will be adjusted to reflect Venezuela results at the amount originally projected in the applicable performance target. After the conclusion of each performance period, the payout will be equal to the lower of the calculated payout under the adjusted performance goals and the original performance goals. Approximately 100 employees who received PSUs in 2013, 2014 and 2015 were affected by the change. No incremental compensation cost associated with the modifications was recognized or is expected to be recognized as the additional goals were or are expected to be more difficult to achieve and, in accordance with FASB ASC Topic 718, Compensation - Stock Compensation, we continue to recognize expense as calculated using the original performance goals.
The following table summarizes all PSU activity during 2016:
Shares (in thousands) | Weighted-Average Grant Date Fair Value | |||||
Nonvested balance as of December 31, 2015 | 503.4 | $ | 25.93 | |||
Activity from January 1 to December 31, 2016: | ||||||
Granted | 375.2 | 29.19 | ||||
Forfeited | (112.5 | ) | 28.78 | |||
Vested(a) | (162.9 | ) | 23.73 | |||
Nonvested balance as of December 31, 2016 | 603.2 | $ | 28.02 | |||
(a) | The vested PSUs presented are based on the target amount of the award. Pursuant to the actual performance for the period ended December 31, 2015, the actual shares earned and distributed were 277.1, representing 171% of target or, for a smaller award, 125% of target. |
The following table provides the terms and weighted-average assumptions used in the Monte Carlo simulation model for the TSR PSUs granted in 2016:
Terms and Assumptions Used to Estimate Fair Value of TSR PSUs | |||
Terms of awards: | |||
Performance period | Jan. 1, 2016 to | ||
Dec. 31, 2018 | |||
Weighted-average assumptions used to estimate fair value: | |||
Expected dividend yield(a) | 1.4 | % | |
Expected stock price volatility(b) | 29.1 | % | |
Risk-free interest rate(c) | 0.8 | % | |
Contractual term in years | 2.7 | ||
Weighted-average fair value estimates at grant date: | |||
In millions | $ | 2.3 | |
Fair value per share | $ | 31.64 | |
(a) | TSR is determined assuming that dividends are reinvested. The stock price projection in the Monte Carlo simulation model assumed a 0% dividend yield, which is mathematically equivalent to reinvesting dividends over the performance period. For the valuation of the TSR PSU awards, because the holders of the TSR PSU awards have no rights to any dividend paid during the vesting period, we applied a dividend yield in the Monte Carlo simulation model to reduce the projected stock price as of the grant date. |
(b) | The expected stock price volatility was calculated on the grant date for the most recent term equivalent to the contractual term in years. |
(c) | The risk-free interest rate on each date of grant is the rate for a zero-coupon U.S. Treasury bill that was commensurate with the grant date contractual term. |
107
Market Share Units (“MSUs”)
Prior to 2016, we granted MSUs, which contain a market condition as well as a service condition. We measure the fair value of MSUs using a Monte Carlo simulation model.
We granted MSUs to senior executives in 2015 and 2014. MSUs are paid out in shares of Brink’s stock when an award vests. MSUs reward the achievement of the appreciation of Brink’s stock over the performance period (generally three years) at a rate of 0% to 150% of the initial target number of shares awarded. The multiplier to the initial target number of MSUs awarded is calculated as the ratio of the price of Brink’s stock at the end of the performance period divided by the price of Brink’s stock at the beginning of the performance period. If the price of Brink’s stock at the end of the performance period is less than 50% of the initial price, no payout for MSUs will occur.
The following table summarizes all MSU activity during 2016:
Shares (in thousands) | Weighted-Average Grant Date Fair Value | |||||
Nonvested balance as of December 31, 2015 | 258.8 | $ | 27.40 | |||
Activity from January 1 to December 31, 2016: | ||||||
Granted | — | — | ||||
Forfeited | (32.8 | ) | 29.30 | |||
Vested(a) | (84.3 | ) | 27.30 | |||
Nonvested balance as of December 31, 2016 | 141.7 | $ | 27.02 | |||
(a) | The vested MSUs presented are based on the target amount of the award. Pursuant to the actual performance for the period ended December 31, 2015, the actual shares earned and distributed were 91.1, or 108% of target. No additional compensation expense was required, as the market condition was included in the $27.30 grant date fair value. |
Options
In 2016, we granted performance-based stock options that have a service condition as well as a market condition. In addition, some of the awards granted contain a non-financial performance condition. We measure the fair value of these options at the grant date using a Monte Carlo simulation model. No performance-based options were granted in 2015 and 2014. Prior to 2013, we granted time-based vesting stock options to select senior executives and select employees. When vested, options entitle the holder to purchase a specified number of shares of Brink’s stock at a price set at the date the options were granted. The option price for Brink’s options was equal to the market price of Brink’s stock on the award date. Options granted to employees have a maximum term of six years and options previously granted to directors have a maximum term of ten years.
Performance-Based Option Activity
The table below summarizes the activity associated with grants of performance-based options:
Shares (in thousands) | Weighted-Average Grant Date Fair Value | |||||
Outstanding balance as of December 31, 2015 | — | $ | — | |||
Activity from January 1 to December 31, 2016: | ||||||
Granted | 580.9 | 6.01 | ||||
Forfeited or expired | — | — | ||||
Exercised | — | — | ||||
Outstanding balance as of December 31, 2016 | 580.9 | $ | 6.01 | |||
108
The table below summarizes additional information related to grants of performance-based options:
Shares (in thousands) | Weighted- Average Exercise Price Per Share | Weighted- Average Remaining Contractual Term (in years) | Aggregate Intrinsic Value(a) (in millions) | |||||||||
Outstanding at December 31, 2015 | — | $ | — | |||||||||
Granted | 580.9 | 30.33 | ||||||||||
Forfeited or expired | — | — | ||||||||||
Exercised | — | — | ||||||||||
Outstanding at December 31, 2016 | 580.9 | 30.33 | 5.5 | $ | 6.3 | |||||||
Of the above, as of December 31, 2016: | ||||||||||||
Exercisable | — | $ | — | 0 | $ | — | ||||||
Expected to vest in future periods(b) | 580.9 | $ | 30.33 | 5.5 | $ | 6.3 | ||||||
(a) | The intrinsic value of a stock option is the difference between the market price of the shares underlying the option and the exercise price of the option. The market price at December 30, 2016 was $41.25. |
(b) | The number of options expected to vest takes into account an estimate of expected forfeitures. We currently have applied a 0% expected forfeiture rate to these options. |
The following table provides the term of the performance period and the weighted-average assumptions used in the Monte Carlo simulation model for the performance-based options:
Terms and Assumptions Used to Estimate Fair Value of Performance-Based Options | |||
Terms of awards: | |||
Performance period for achieving stock price hurdles | Three years from date | ||
of grant | |||
Assumptions used to estimate fair value: | |||
Expected dividend yield(a) | 1.3 | % | |
Expected stock price volatility(b) | 30.9 | % | |
Risk-free interest rate(c) | 1.1 | % | |
Expected term in years(d) | 4.5 | ||
Weighted-average fair value estimates at grant date: | |||
In millions | $ | 3.5 | |
Fair value per share | $ | 6.01 | |
(a) | Since the holders of the awards have no rights to any dividend paid during the vesting period, we applied a dividend yield in the Monte Carlo simulation model. At each grant date, the dividend yield was calculated based on the most recent annualized dividend payment of $0.40 and Brink's stock price at the date of grant. |
(b) | The expected stock price volatility was calculated on each grant date for the most recent 4.5 year term. |
(c) | The risk-free interest rate on each grant date is the rate for a zero-coupon U.S. Treasury bill that was commensurate with the expected life of 4.5 years. |
(d) | Because we did not have historical exercise behavior for instruments with premiums, we assumed that the exercise of vested options occurred at the mid-point between the three-year vesting date and the six-year contractual term. In the Monte Carlo simulation, at each iteration of forecasted Brink's stock prices, the option was assumed to be exercised at the mid-point of 4.5 years if the stock price hurdle had been achieved. When the hurdle is achieved, the exercise price was then subtracted from the projected stock price, and discounted back to the grant date. In situations where the projected price had not met the hurdle, no value was attributed. |
Time-based Vesting Option Activity
The table below summarizes the activity associated with previous grants of time-based vesting options:
Shares (in thousands) | Weighted-Average Grant Date Fair Value | |||||
Outstanding balance as of December 31, 2015 | 688.3 | $ | 6.28 | |||
Activity from January 1 to December 31, 2016: | ||||||
Granted | — | — | ||||
Forfeited or expired | (31.1 | ) | 13.39 | |||
Exercised | (535.7 | ) | 5.95 | |||
Outstanding balance as of December 31, 2016 | 121.5 | $ | 5.90 | |||
109
The table below summarizes additional information related to previous grants of time-based vesting stock options:
Shares (in thousands) | Weighted- Average Exercise Price Per Share | Weighted- Average Remaining Contractual Term (in years) | Aggregate Intrinsic Value(a) (in millions) | |||||||||
Outstanding at December 31, 2015 | 688.3 | $ | 26.01 | |||||||||
Granted | — | — | ||||||||||
Forfeited or expired | (31.1 | ) | 30.81 | |||||||||
Exercised | (535.7 | ) | 25.10 | |||||||||
Outstanding at December 31, 2016(b) | 121.5 | $ | 28.80 | 0.9 | $ | 1.5 | ||||||
Of the above, as of December 31, 2016: | ||||||||||||
Exercisable | 121.5 | $ | 28.80 | 0.9 | $ | 1.5 | ||||||
(a) | The intrinsic value of a stock option is the difference between the market price of the shares underlying the option and the exercise price of the option. The market price at December 30, 2016 was $41.25. |
(b) | There were 0.7 million shares of exercisable options with a weighted-average exercise price of $26.01 per share at December 31, 2015 and 0.7 million shares of exercisable options with a weighted-average exercise price of $26.44 per share at December 31, 2014. |
Deferred Stock Units (“DSUs”)
We granted DSUs to our independent directors in 2016 and prior years. We measure the fair value of DSUs at the grant date, based on the price of Brink's stock.
In 2016 and 2015, our independent directors received grants of DSUs that vest and will be paid out in shares of Brink's stock on the first anniversary of the grant date, provided that the director has not elected to defer the distribution of shares until a later date. DSUs are forfeited if a director leaves before the vesting date. However, in connection with the retirement of two directors in January 2016, our Board of Directors waived the one-year vesting provision for those DSUs granted in 2015. The impact of this modification was recorded in the first quarter of 2016 and was not significant.
DSUs granted prior to 2015, in general, will be paid out in shares of stock following separation from service.
The following table summarizes all DSU activity during 2016:
Shares (in thousands) | Weighted-Average Grant-Date Fair Value | |||||
Nonvested balance as of December 31, 2015 | 21.4 | $ | 32.79 | |||
Granted | 29.7 | 29.41 | ||||
Vested | (21.4 | ) | 31.72 | |||
Nonvested balance as of December 31, 2016 | 29.7 | $ | 29.41 | |||
The weighted-average grant-date fair value estimate per share for DSUs granted was $29.41 in 2016, $32.79 in 2015 and $24.70 in 2014.
Other Share-Based Compensation
We have a deferred compensation plan that allows participants to defer a portion of their compensation into stock units. Units may be redeemed by employees for an equal number of shares of Brink’s stock. Employee accounts held 234,426 units at December 31, 2016, and 302,041 units at December 31, 2015.
We have a stock accumulation plan for our non-employee directors that, prior to 2014, provided for awards of stock units. Directors’ accounts held 34,200 units at December 31, 2016, and 54,050 units at December 31, 2015.
110
Note 17 - Capital Stock
Common Stock
At December 31, 2016, we had 100 million shares of common stock authorized and 50.0 million shares issued and outstanding.
Dividends
We paid regular quarterly dividends on our common stock during the last three years. On January 20, 2017, the Board declared a regular quarterly dividend of 10 cents per share payable on March 1, 2017. The payment of future dividends is at the discretion of the Board of Directors and is dependent on our future earnings, financial condition, shareholder equity levels, cash flow, business requirements and other factors.
Preferred Stock
At December 31, 2016, we had the authority to issue up to 2.0 million shares of preferred stock with a par value of $10 per share.
Shares Used to Calculate Earnings per Share
Years Ended December 31, | ||||||||
(In millions) | 2016 | 2015 | 2014 | |||||
Weighted-average shares | ||||||||
Basic(a) | 50.0 | 49.3 | 49.0 | |||||
Effect of dilutive stock awards | 0.6 | — | — | |||||
Diluted(a) | 50.6 | 49.3 | 49.0 | |||||
Antidilutive stock awards excluded from denominator | 0.1 | 1.7 | 1.7 | |||||
(a) | We have deferred compensation plans for directors and certain of our employees. Some amounts owed to participants are denominated in common stock units. Each unit represents one share of common stock. The number of shares used to calculate basic earnings per share includes the weighted-average common stock units credited to employees and directors under the deferred compensation plans. Additionally, nonvested units are also included in the computation of basic weighted-average shares when the requisite service period has been completed. Accordingly, basic and diluted shares include weighted-average units of 0.5 million in 2016, 0.5 million in 2015 and 0.5 million in 2014. |
111
Note 18 - Loss from Discontinued Operations
Years Ended December 31, | |||||||||
(In millions) | 2016 | 2015 | 2014 | ||||||
Loss from operations(a)(b) | $ | — | (2.4 | ) | (13.3 | ) | |||
Loss on sales | — | (0.8 | ) | (18.9 | ) | ||||
Adjustments to contingencies of former operations(c): | |||||||||
Workers' compensation | (2.8 | ) | (0.7 | ) | (4.4 | ) | |||
Insurance recoveries related to BAX Global indemnification(d) | — | — | 9.5 | ||||||
Other | — | 0.1 | (1.6 | ) | |||||
Loss from discontinued operations before income taxes | (2.8 | ) | (3.8 | ) | (28.7 | ) | |||
Provision (benefit) for income taxes | (1.1 | ) | (1.0 | ) | 0.4 | ||||
Loss from discontinued operations, net of tax | $ | (1.7 | ) | (2.8 | ) | (29.1 | ) | ||
(a) | Discontinued operations include gains and losses related to businesses that we recently sold or shut down. No interest expense was included in discontinued operations in 2015 and 2014. |
(b) | The loss from operations in 2015 included $1.0 million in pension settlement charges related to the Mexican parcel delivery business sold in February 2015. The loss from operations in 2014 included $15.6 million in non-cash severance and impairment charges related to the Netherlands cash-in-transit operations. |
(c) | Primarily related to former coal businesses and BAX Global, a former freight forwarding and logistics business. |
(d) | BAX Global had been defending a claim related to the apparent diversion by a third party of goods being transported for a customer. In 2010, the Dutch Supreme Court denied the final appeal of BAX Global, letting stand the lower court ruling that BAX Global was liable for this claim. We had contractually indemnified the purchaser of BAX Global for this contingency. Through 2010, we had recognized $11.5 million of expense related to the payment made in satisfaction of the judgment. In 2014, we recovered $9.5 million from insurance companies related to this matter. |
Cash-in-transit operations sold or shut down:
• | Australia (sold in October 2014) |
• | Puerto Rico (shut down in November 2014) |
• | Netherlands (sold in December 2014) |
Other operations sold:
• | In February 2015, we sold a small Mexican parcel delivery business which met the criteria for classification as a discontinued operation as of December 31, 2014. |
The results of the above operations have been excluded from continuing operations and are reported as discontinued operations for the prior periods. The table below shows revenues by operating segment which have been reclassified to discontinued operations:
December 31, | |||||||||
(In millions) | 2016 | 2015 | 2014 | ||||||
Mexico | $ | — | 4.6 | 21.2 | |||||
Largest 5 Markets | — | 4.6 | 21.2 | ||||||
Latin America | — | — | 4.9 | ||||||
EMEA | — | — | 126.0 | ||||||
Asia | — | — | 7.6 | ||||||
Global Markets | — | — | 138.5 | ||||||
Total | $ | — | 4.6 | 159.7 | |||||
112
The table below shows revenues and loss from operations before tax for the Netherlands cash-in-transit operations sold in 2014:
Years Ended December 31, | |||||||||
(In millions) | 2016 | 2015 | 2014 | ||||||
Netherlands CIT operations: | |||||||||
Revenues | $ | — | — | 126.0 | |||||
Loss from operations before tax | — | — | (2.0 | ) | |||||
Other divestitures not classified as discontinued operations:
• | We sold our 70% ownership interest in a Russian cash management business in November 2015 and recognized a $5.9 million loss on the disposition. A significant part of the loss ($5.0 million) represented the reclassification of foreign currency translation adjustments from accumulated other comprehensive income (loss) into earnings. |
• | We sold our Irish guarding operation in November 2015. |
• | We shut down our remaining Irish domestic operations in September 2016. |
• | We sold our German guarding operation in October 2016. |
The table below shows revenues and income (loss) from operations before tax for these other divestitures:
Years Ended December 31, | |||||||||
(In millions) | 2016 | 2015 | 2014 | ||||||
Other divestitures | |||||||||
Revenues | $ | 12.3 | 46.6 | 94.4 | |||||
Income (loss) from operations before tax | (16.0 | ) | (8.2 | ) | 3.4 | ||||
113
Note 19 - Supplemental Cash Flow Information
Years Ended December 31, | |||||||||
(In millions) | 2016 | 2015 | 2014 | ||||||
Cash paid for: | |||||||||
Interest | $ | 20.1 | 18.6 | 22.9 | |||||
Income taxes, net | 64.3 | 45.4 | 68.6 | ||||||
Argentina Debt Security Transactions
We have elected in the past and could continue in the future to repatriate cash from Brink's Argentina using different means to convert Argentine pesos into U.S. dollars. In 2016, cash outflows from the purchase of debt securities totaled $2.1 million and cash inflows from the sale of these securities totaled $2.0 million. In 2015, cash outflows from the purchase of debt securities totaled $25.8 million and cash inflows from the sale of these securities totaled $18.7 million. In 2014, cash outflows from the purchase of debt securities totaled $11.0 million and cash inflows from the sale of these securities totaled $7.4 million. The net cash flows from these transactions are treated as operating cash flows as the debt securities are purchased specifically for resale and are generally sold within a short period of time from the date of purchase.
Mexico Real Estate Transaction
Brink's Mexico entered into a transaction in 2015 to sell its headquarters building in Mexico City and lease the property back for two years. The transaction did not qualify for sale-leaseback accounting due to continuing involvement with the property. Transaction proceeds of $14.5 million in 2015 are reported as cash inflows from financing activities.
Non-cash Investing and Financing Activities
We acquired armored vehicles, CompuSafe® units and other equipment under capital lease arrangements in the last three years including $29.4 million in 2016, $18.9 million in 2015 and $12.1 million in 2014.
Cash Supply Chain Services
In France, we offer services to certain of our customers where we manage some or all of their cash supply chains. Providing this service requires our French subsidiary to take temporary title to the cash received from the management of our customers' cash supply chains until the cash is returned to the customers. As part of this service offering, we have entered into lending arrangements with some of our customers. Cash borrowed under these lending arrangements is used in the process of managing these customers' cash supply chains. The cash for which we have temporary title and the cash borrowed under these customer lending arrangements is restricted and cannot be used for any other purpose other than to service our customers who participate in this service offering.
At December 31, 2016, we held $55.5 million of restricted cash ($22.3 million represented short-term borrowings and $33.2 million represented restricted cash held for customers). At December 31, 2015, we held $16.4 million of restricted cash ($3.5 million represented short-term borrowings and $12.9 million represented restricted cash held for customers).
Note 20 - Other Operating Income (Expense)
Years Ended December 31, | |||||||||
(In millions) | 2016 | 2015 | 2014 | ||||||
Foreign currency items: | |||||||||
Transaction gains (losses)(a) | $ | 1.4 | (26.8 | ) | (127.2 | ) | |||
Foreign currency derivative instrument gains (losses) | (2.4 | ) | 2.9 | 1.4 | |||||
Gains (losses) on sale of property and equity investment(b) | (1.3 | ) | 0.9 | 44.9 | |||||
Argentina conversion losses | (0.1 | ) | (7.1 | ) | (3.6 | ) | |||
Impairment losses(c) | (20.6 | ) | (37.2 | ) | (3.3 | ) | |||
Share in earnings (losses) of equity affiliates | (1.5 | ) | 0.5 | 4.3 | |||||
Royalty income | 2.6 | 2.1 | 1.5 | ||||||
Gains (losses) on business acquisitions and dispositions | 0.1 | (6.3 | ) | — | |||||
Other | 1.7 | 1.6 | 1.0 | ||||||
Other operating income (expense) | $ | (20.1 | ) | (69.4 | ) | (81.0 | ) | ||
(a) | Includes losses from devaluations in Venezuela of $4.8 million in 2016, $18.1 million in 2015, and $121.6 million in 2014. |
(b) | Includes a $44.3 million gain on the sale of a noncontrolling interest in a Peruvian cash-in-transit business in 2014. |
(c) | Includes $13.6 million of impairment losses related to the 2016 Reorganization and Restructuring and $35.3 million of impairment losses in 2015 related to property and equipment in Venezuela. |
114
Note 21 - Interest and Other Nonoperating Income (Expense)
Years Ended December 31, | |||||||||
(In millions) | 2016 | 2015 | 2014 | ||||||
Interest income | $ | 2.6 | 3.3 | 3.0 | |||||
Gain on marketable securities | 0.5 | 1.1 | 0.4 | ||||||
Derivative instruments | (0.6 | ) | (0.5 | ) | (1.0 | ) | |||
Other | (1.3 | ) | (0.5 | ) | (0.5 | ) | |||
Total | $ | 1.2 | 3.4 | 1.9 | |||||
Note 22 - Other Commitments and Contingencies
During the fourth quarter of 2015, we became aware of an investigation initiated by COFECE (the Mexican antitrust agency) related to potential anti-competitive practices among competitors in the cash logistics industry in Mexico (the industry in which Brink’s Mexican subsidiary, SERPAPROSA, is active). Because no legal proceedings have been initiated against SERPAPROSA, we cannot estimate the probability of loss or any range of estimate of possible loss at this time. It is possible that SERPAPROSA could become the subject of legal or administrative claims or proceedings, however, that could result in a loss that could be material to the Company’s results in a future period.
On March 21, 2016, The Bruce McDonald Holding Company, et al., filed a lawsuit in Circuit Court of Logan County, West Virginia against Addington, Inc. (“Addington”) and The Brink’s Company related to an Agreement of Lease dated September 19, 1978, between the Plaintiffs and Addington. Plaintiffs seek declaratory judgment and unspecified damages related to allegations that Addington failed to mine coal on the property leased from the Plaintiffs and failed to pay correct minimum royalties to the Plaintiffs. The Company denies the allegations asserted by the Plaintiffs, is vigorously defending itself in this matter, and has filed a counterclaim against the Plaintiffs related to Plaintiffs’ failure to consent to the assignment and subleasing the leasehold to others. Due to numerous uncertain and unresolved factors presented in this case, it is not possible to estimate a range of loss at this time and, accordingly, no accrual has been recorded in the Company’s financial statements.
In addition, we are involved in various other lawsuits and claims in the ordinary course of business. We are not able to estimate the loss or range of losses for some of these matters. We have recorded accruals for losses that are considered probable and reasonably estimable. Other than the matters noted above, we do not believe that the ultimate disposition of any of the lawsuits currently pending against the Company should have a material adverse effect on our liquidity, financial position or results of operations.
At December 31, 2016, we had noncancellable commitments for $28.7 million in equipment purchases, and information technology and other services.
115
Note 23 - Reorganization and Restructuring
2016 Reorganization and Restructuring
In the fourth quarter of 2016, management implemented restructuring actions across our global business operations and our corporate functions. As a result of these actions, we recognized asset-related adjustments of $16.3 million, severance costs of $7.2 million, lease restructuring charges of $0.7 million, partially offset by a $6.1 million benefit related to the termination of a benefit program. Severance actions are expected to reduce our global workforce by 700 to 800 positions. We expect that the 2016 restructuring will result in $8 to $12 million in 2017 cost savings. We expect to incur additional costs between $15 million and $20 million in 2017, primarily severance costs.
The following table summarizes the costs incurred, payments and utilization, and foreign currency exchange effects of the 2016 Reorganization and Restructuring:
(In millions) | Asset Related Adjustments | Severance Costs | Lease Terminations | Benefit Program Termination | Total | ||||||||||
Balance as of January 1, 2016 | $ | — | — | — | — | — | |||||||||
Expense (benefit) | 16.3 | 7.2 | 0.7 | (6.1 | ) | 18.1 | |||||||||
Payments and utilization | (16.3 | ) | (0.2 | ) | (0.1 | ) | 6.1 | (10.5 | ) | ||||||
Balance as of December 31, 2016 | $ | — | 7.0 | 0.6 | — | 7.6 | |||||||||
Executive Leadership and Board of Directors Restructuring
In the fourth quarter of 2015, we recognized $1.8 million in costs related to the restructuring of Executive Leadership and Board of Directors, which was announced in January 2016. We also recognized an additional $4.3 million in charges, primarily severance costs, in 2016.
2015 Reorganization and Restructuring
Brink's initiated a global restructuring of its business in the third quarter of 2015. We recognized $11.6 million in 2015 costs related to employee severance, contract terminations, and property impairment. We recognized an additional $6.5 million in 2016 related to this restructuring for additional severance costs, contract terminations and lease terminations. The 2015 Reorganization and Restructuring reduced the global workforce by approximately 1,100 positions and resulted in approximately $20 million in 2016 savings. The actions under this program were substantially completed by the end of 2016, with cumulative pretax charges of approximately $18 million.
The following table summarizes the costs incurred, payments and utilization, and foreign currency exchange effects of the 2015 Reorganization and Restructuring:
(In millions) | Severance Costs | Contract Terminations | Lease Terminations | Total | ||||||||
Balance as of January 1, 2016 | $ | 6.3 | — | — | 6.3 | |||||||
Expense | 3.6 | 0.8 | 2.1 | 6.5 | ||||||||
Payments and utilization | (8.1 | ) | (0.8 | ) | (1.5 | ) | (10.4 | ) | ||||
Balance as of December 31, 2016 | $ | 1.8 | — | 0.6 | 2.4 | |||||||
2014 Reorganization and Restructuring
In the fourth quarter of 2014, we announced a reorganization and restructuring of Brink’s global organization to accelerate the execution of our strategy by reducing costs and providing for a more streamlined and centralized organization. As part of this program, we reduced our total workforce by approximately 1,700 positions. The restructuring saved annual direct costs of approximately $50 million in 2015 compared to 2014, excluding charges for severance, lease termination and accelerated depreciation. We recorded total pretax charges of $21.8 million in 2014 and an additional $1.9 million of pretax charges in 2015 related to the 2014 Reorganization and Restructuring. The actions under this program were substantially completed by the end of 2015 with cumulative pretax charges of approximately $24 million, primarily severance costs.
116
Note 24 - Selected Quarterly Financial Data (unaudited)
2016 Quarters | 2015 Quarters | ||||||||||||||||||||||||
(In millions, except for per share amounts) | 1st | 2nd | 3rd | 4th | 1st | 2nd | 3rd | 4th | |||||||||||||||||
Revenues | $ | 721.8 | 739.5 | 755.8 | 803.5 | $ | 776.1 | 760.3 | 759.2 | 765.8 | |||||||||||||||
Operating profit | 13.8 | 22.1 | 50.0 | 58.3 | 12.9 | (14.6 | ) | 25.3 | 33.0 | ||||||||||||||||
Amounts attributable to Brink’s: | |||||||||||||||||||||||||
Income (loss) from: | |||||||||||||||||||||||||
Continuing operations | $ | (3.1 | ) | 0.3 | 24.5 | 14.5 | $ | (0.6 | ) | (13.0 | ) | 7.7 | (3.2 | ) | |||||||||||
Discontinued operations | — | — | — | (1.7 | ) | (2.4 | ) | 0.1 | (0.1 | ) | (0.4 | ) | |||||||||||||
Net income (loss) attributable to Brink’s | $ | (3.1 | ) | 0.3 | 24.5 | 12.8 | $ | (3.0 | ) | (12.9 | ) | 7.6 | (3.6 | ) | |||||||||||
Depreciation and amortization | $ | 32.2 | 32.9 | 32.4 | 34.1 | $ | 36.7 | 36.5 | 33.1 | 33.6 | |||||||||||||||
Capital expenditures | 20.8 | 24.2 | 27.4 | 39.8 | 14.3 | 20.9 | 26.0 | 39.9 | |||||||||||||||||
Earnings (loss) per share attributable to Brink’s common shareholders: | |||||||||||||||||||||||||
Basic | |||||||||||||||||||||||||
Continuing operations | $ | (0.06 | ) | 0.01 | 0.49 | 0.29 | $ | (0.01 | ) | (0.26 | ) | 0.16 | (0.07 | ) | |||||||||||
Discontinued operations | — | — | — | (0.03 | ) | (0.05 | ) | — | — | (0.01 | ) | ||||||||||||||
Net income (loss) | $ | (0.06 | ) | 0.01 | 0.49 | 0.25 | $ | (0.06 | ) | (0.26 | ) | 0.16 | (0.07 | ) | |||||||||||
Diluted | |||||||||||||||||||||||||
Continuing operations | $ | (0.06 | ) | 0.01 | 0.48 | 0.28 | $ | (0.01 | ) | (0.26 | ) | 0.16 | (0.07 | ) | |||||||||||
Discontinued operations | — | — | — | (0.03 | ) | (0.05 | ) | — | — | (0.01 | ) | ||||||||||||||
Net income (loss) | $ | (0.06 | ) | 0.01 | 0.48 | 0.25 | $ | (0.06 | ) | (0.26 | ) | 0.15 | (0.07 | ) | |||||||||||
Earnings per share. Earnings per share amounts for each quarter are required to be computed independently. As a result, their sum may not equal the annual earnings per share.
Discontinued operations. In early 2015, we sold a small Mexican parcel delivery business which met the criteria for classification as a discontinued operation as of December 31, 2014. The results of this operation have been excluded from continuing operations and are reported as discontinued operations.
Significant pretax items in a quarter.
First quarter of 2016 We decided to exit operations in the Republic of Ireland and, as a result, we recognized $4.2 million in severance costs and another $1.7 million in operating and other exit costs. In addition, we recognized $3.2 million in charges related to the Executive Leadership and Board of Directors restructuring. We also recognized a $2.8 million net currency remeasurement loss when the Venezuelan government announced that they would replace the SIMADI exchange mechanism with the DICOM exchange mechanism.
Second quarter of 2016 We decided to exit operations in Northern Ireland and recognized another $4.5 million in exit-related charges related to our Ireland businesses. We also recognized a $2.0 million loss related to the sale of corporate assets.
Fourth quarter of 2016 Management implemented restructuring actions across our global operations and our corporate functions. As a result of these actions, we recognized asset-related adjustments of $16.3 million, severance costs of $7.2 million, lease restructuring charges of $0.7 million, partially offset by a $6.1 million benefit related to the termination of a benefit program.
First quarter of 2015 We recognized an $18.0 million remeasurement loss related to our change in February 2015 from the SICAD II exchange mechanism to the SIMADI.
Second quarter of 2015 We recognized a $34.5 million impairment of the Venezuela property and equipment (and another $0.8 million in the third quarter).
Third quarter of 2015 We initiated a restructuring of our business and recognized a $2.0 million charge related to contract terminations, employee severance and property impairment (and another $9.6 million in the fourth quarter).
Fourth quarter of 2015 We recognized a $5.9 million loss on the sale of our interest in a cash management business in Russia.
Significant after-tax items in a quarter. In the fourth quarter of 2015, we recognized a $23.5 million increase to current tax expense related to a transaction that accelerated U.S. taxable income. In the fourth quarter of 2016, we recognized a $14.7 million valuation allowance on U.S. deferred tax assets.
117
ITEM 9. CHANGES IN AND DISAGREEMENTS WITH ACCOUNTANTS ON ACCOUNTING AND FINANCIAL DISCLOSURE
Not applicable.
ITEM 9A. CONTROLS AND PROCEDURES
(a) Disclosure Controls and Procedures
Pursuant to Rule 13a-15(b) under the Securities Exchange Act of 1934, we carried out an evaluation, with the participation of our management, including our Chief Executive Officer and Executive Vice President and Chief Financial Officer, of the effectiveness of our disclosure controls and procedures (as defined under Rule 13a-15(e) under the Securities Exchange Act of 1934) as of the end of the period covered by this report. Based upon that evaluation, our Chief Executive Officer and Executive Vice President and Chief Financial Officer concluded that our disclosure controls and procedures are effective in ensuring that information required to be disclosed by us in the reports that we file or submit under the Securities Exchange Act of 1934, is recorded, processed, summarized and reported, within the time periods specified in the SEC’s rules and forms, and that such information is accumulated and communicated to our management, including our Chief Executive Officer and Executive Vice President and Chief Financial Officer, as appropriate, to allow timely decisions regarding required disclosure.
(b) Internal Controls over Financial Reporting
See pages 61 and 62 for Management’s Annual Report on Internal Control over Financial Reporting and the Attestation Report of the Registered Public Accounting Firm.
(c) Changes in Internal Controls over Financial Reporting
There has been no change in our internal control over financial reporting during the quarter ended December 31, 2016, that has materially affected, or is reasonably likely to materially affect, our internal control over financial reporting.
ITEM 9B. OTHER INFORMATION
Subsequent Event
As a result of recent changes in our organizational structure, which took effect in the first quarter of 2017, we have changed our reportable operating segments. We expect to present financial statements for our report on Form 10-Q for the quarter ended March 31, 2017 on the basis of these new reportable operating segments.
118
PART III |
ITEM 10. DIRECTORS, EXECUTIVE OFFICERS AND CORPORATE GOVERNANCE
We have adopted a Code of Ethics that applies to all of the directors, officers and employees (including the Chief Executive Officer, Chief Financial Officer and Controller) and have posted the Code of Ethics on our website. We intend to satisfy the disclosure requirement under Item 5.05 of Form 8-K relating to amendments to or waivers from any provision of the Code of Ethics applicable to the Chief Executive Officer, Chief Financial Officer or Controller by posting this information on the website. The internet address is www.brinks.com.
Our Chief Executive Officer is required to make, and he has made, an annual certification to the New York Stock Exchange (“NYSE”) stating that he was not aware of any violation by us of the corporate governance listing standards of the NYSE. Our Chief Executive Officer made his annual certification to that effect to the NYSE as of May 11, 2016. In addition, we are filing, as exhibits to this Annual Report on Form 10-K, the certification of our principal executive officer and principal financial officer required under sections 906 and 302 of the Sarbanes-Oxley Act of 2002 to be filed with the Securities and Exchange Commission regarding the quality of our public disclosure.
The information regarding executive officers is included in this report following Item 4, under the caption “Executive Officers of the Registrant.” Other information required by Item 10 is incorporated by reference to our definitive proxy statement to be filed pursuant to Regulation 14A within 120 days after December 31, 2016.
ITEM 11. EXECUTIVE COMPENSATION
The information required by Item 11 is incorporated by reference to our definitive proxy statement to be filed pursuant to Regulation 14A within 120 days after December 31, 2016.
ITEM 12. SECURITY OWNERSHIP OF CERTAIN BENEFICIAL OWNERS AND MANAGEMENT AND RELATED STOCKHOLDER MATTERS
The information required by Item 12 is incorporated by reference to our definitive proxy statement to be filed pursuant to Regulation 14A within 120 days after December 31, 2016.
ITEM 13. CERTAIN RELATIONSHIPS AND RELATED TRANSACTIONS, AND DIRECTOR INDEPENDENCE
The information required by Item 13 is incorporated by reference to our definitive proxy statement to be filed pursuant to Regulation 14A within 120 days after December 31, 2016.
ITEM 14. PRINCIPAL ACCOUNTANT FEES AND SERVICES
The information required by Item 14 is incorporated by reference to our definitive proxy statement to be filed pursuant to Regulation 14A within 120 days after December 31, 2016.
119
PART IV |
ITEM 15. EXHIBITS AND FINANCIAL STATEMENT SCHEDULES
(a) | 1. | All financial statements – see pages 60–117. |
2. | Financial statement schedules – not applicable. | |
3. | Exhibits – see exhibit index. | |
ITEM 16. FORM 10-K SUMMARY
None.
120
Signatures
Pursuant to the requirements of Section 13 or 15(d) of the Securities Exchange Act of 1934, the Registrant has duly caused this report to be signed on its behalf by the undersigned, thereunto duly authorized, on February 23, 2017.
The Brink’s Company | ||
(Registrant) | ||
By | /s/ Douglas A. Pertz | |
Douglas A. Pertz | ||
(President and | ||
Chief Executive Officer) | ||
Pursuant to the requirements of the Securities Exchange Act of 1934, this report has been signed below by the following persons on behalf of the Registrant and in the capacities indicated, on February 23, 2017.
Signature | Title |
/s/ Douglas A. Pertz | Director, President and Chief Executive Officer (Principal Executive Officer) |
Douglas A. Pertz | |
/s/ Ronald J. Domanico | Executive Vice President and Chief Financial Officer (Principal Financial Officer) |
Ronald J. Domanico | |
/s/ Thomas R. Colan | Controller (Principal Accounting Officer) |
Thomas R. Colan | |
* | Director |
Paul G. Boynton | |
* | Director |
Ian D. Clough | |
* | Director |
Susan E. Docherty | |
* | Director |
Peter A. Feld | |
* | Director |
Reginald D. Hedgebeth | |
* | Director |
Michael J. Herling | |
* | Director |
George I. Stoeckert | |
* By: | /s/ Douglas A. Pertz | |
Douglas A. Pertz, Attorney-in-Fact | ||
121
Exhibit Index
Each exhibit listed as a previously filed document is hereby incorporated by reference to such document.
Exhibit Number | Description | |
3(i) | Second Amended and Restated Articles of Incorporation of the Registrant. Exhibit 3(i) to the Registrant's Quarterly Report on Form 10-Q filed July 31, 2015. | |
3(ii) | Bylaws of the Registrant. Exhibit 3(ii) to the Registrant’s Current Report on Form 8-K filed January 25, 2017. | |
10(a)* | Amended and Restated Key Employees Incentive Plan, amended and restated as of May 6, 2011. Exhibit 10.1 to the Registrant’s Current Report on Form 8-K filed May 10, 2011. | |
10(b)* | Key Employees’ Deferred Compensation Program, as amended and restated as of July 10, 2014. Exhibit 10.1 to the Registrant’s Quarterly Report on Form 10-Q for the quarter ended September 30, 2014. | |
10(c)* | Pension Equalization Plan, as amended and restated as of July 23, 2012. Exhibit 10.1 to the Registrant’s Quarterly Report on Form 10-Q for the quarter ended June 30, 2012 (the “Second Quarter 2012 Form 10-Q”). | |
10(d)* | Executive Salary Continuation Plan. Exhibit 10(e) to the Registrant’s Annual Report on Form 10-K for the year ended December 31, 1991 (the “1991 Form 10-K”). | |
10(e)* | 2005 Equity Incentive Plan, as amended and restated as of February 19, 2010. Exhibit 10(f) to the Registrant’s Form 10-K for the year ended December 31, 2009 (the “2009 Form 10-K”). | |
10(f)* | 2013 Equity Incentive Plan, effective as of February 22, 2013. Exhibit 10.1 to the Registrant’s Current Report on Form 8-K filed May 9, 2013. | |
10(g)* | (i) | Form of Option Agreement for options granted before July 8, 2010 under 2005 Equity Incentive Plan. Exhibit 99 to the Registrant’s Current Report on Form 8-K filed July 13, 2005. |
(ii) | Form of Option Agreement for options granted under 2005 Equity Incentive Plan, effective July 8, 2010. Exhibit 10.2 to the Registrant’s Current Report on Form 8-K filed July 12, 2010. | |
(iii) | Terms and Conditions for options granted under 2005 Equity Incentive Plan, effective July 7, 2011. Exhibit 10.1 to the Registrant’s Quarterly Report on Form 10-Q for the quarter ended June 30, 2011 (the “Second Quarter 2011 Form 10-Q”). | |
(iv) | Terms and Conditions for options granted under 2005 Equity Incentive Plan, effective July 11, 2012. Exhibit 10.3 to the Registrant’s Second Quarter 2012 Form 10-Q. | |
(v) | Form of Inducement Stock Option Award Agreement, effective July 14, 2016. Exhibit 10.2 to the Registrant’s Quarterly Report on Form 10-Q for the quarter ended September 30, 2016. | |
(vi) | Form of Promotion Stock Option Award Agreement, effective July 28, 2016. Exhibit 10.4 to the Registrant’s Quarterly Report on Form 10-Q for the quarter ended September 30, 2016. | |
10(h)* | (i) | Form of Restricted Stock Units Award Agreement, effective November 13, 2014. Exhibit 10.1 to the Registrant’s Current Report on Form 8-K filed February 25, 2015. |
(ii) | Form of Inducement Restricted Stock Unit Award Agreement, effective July 14, 2016. Exhibit 10.1 to the Registrant’s Quarterly Report on Form 10-Q for the quarter ended September 30, 2016. | |
(iii) | Form of Promotion Restricted Stock Unit Award Agreement, effective July 28, 2016. Exhibit 10.3 to the Registrant’s Quarterly Report on Form 10-Q for the quarter ended September 30, 2016. | |
122
10(i)* | Form of Market Share Units Award Agreement, effective November 13, 2014. Exhibit 10.2 to the Registrant’s Current Report on Form 8-K filed February 25, 2015. | |
10(j)* | (i) | Form of Performance Share Units Award Agreement, effective November 13, 2014. Exhibit 10.3 to the Registrant’s Current Report on Form 8-K filed February 25, 2015. |
(ii) | Form of Internal Metric Performance Share Units Award Agreement, effective February 24, 2016. Exhibit 10.1 to the Registrant’s Quarterly Report on Form 10-Q for the quarter ended March 31, 2016. | |
(iii) | Form of Relative Total Shareholder Return Performance Share Units Award Agreement, effective February 24, 2016. Exhibit 10.2 to the Registrant’s Quarterly Report on Form 10-Q for the quarter ended March 31, 2016. | |
10(k)* | Form of Change in Control Agreement. Exhibit 10.1 to the Registrant’s Current Report on Form 8-K filed November 16, 2015. | |
10(l)* | Form of Indemnification Agreement entered into by the Registrant with its directors and officers. Exhibit 10(l) to the 1991 Form 10-K. | |
10(m)* | Offer Letter, dated June 9, 2016, between The Brink’s Company and Douglas A. Pertz. Exhibit 10.1 to the Registrant’s Current Report on Form 8-K filed June 10, 2016. | |
10(n)* | Change in Control Agreement, dated June 9, 2016, between The Brink’s Company and Douglas A. Pertz. Exhibit 10.2 to the Registrant’s Current Report on Form 8-K filed June 10, 2016. | |
10(o)* | Inducement Restricted Stock Unit Award Agreement with Douglas A. Pertz, effective June 9, 2016. Exhibit 10.1 to the Registrant’s Quarterly Report on Form 10-Q for the quarter ended June 30, 2016. | |
10(p)* | Inducement Stock Option Award Agreement with Douglas A. Pertz, effective June 9, 2016. Exhibit 10.2 to the Registrant’s Quarterly Report on Form 10-Q for the quarter ended June 30, 2016. | |
10(q)* | Offer Letter, dated July 14, 2016, between The Brink’s Company and Ronald J. Domanico. Exhibit 10.1 to the Registrant’s Current Report on Form 8-K filed July 15, 2016. | |
10(r)* | Offer Letter, dated July 28, 2016, between The Brink’s Company and Amit Zukerman. Exhibit 10.1 to the Registrant’s Current Report on Form 8-K filed July 29, 2016. | |
10(s)* | Non-Employee Directors’ Stock Option Plan, as amended and restated as of July 8, 2005. Exhibit 10.2 to the Registrant’s Quarterly Report on Form 10-Q for the quarter ended June 30, 2005. | |
10(t)* | Non-Employee Directors’ Equity Plan, as amended and restated as of July 12, 2012. Exhibit 10.9 to the Registrant’s Second Quarter 2012 Form 10-Q. | |
10(u)* | (i) | Form of Award Agreement for deferred stock units granted in 2008 under the Non-Employee Directors’ Equity Plan. Exhibit 10.3 to the Registrant’s Quarterly Report on Form 10-Q for the quarter ended June 30, 2008. |
(ii) | Form of Award Agreement for deferred stock units granted in 2009, 2010, 2011, 2012, 2013 and 2014 under the Non-Employee Directors’ Equity Plan. Exhibit 10.5 to the Registrant’s Quarterly Report on Form 10-Q for the quarter ended June 30, 2009. | |
(iii) | Form of Award Agreement for deferred stock units granted in 2014 and 2015 to be distributed upon vesting under the Non-Employee Directors’ Equity Plan. Exhibit 10.2 to the Registrant’s Quarterly Report on Form 10-Q for the quarter ended June 30, 2014 (the “Second Quarter 2014 Form 10-Q”). | |
10(v)* | Plan for Deferral of Directors’ Fees, as amended and restated as of November 11, 2016. | |
10(w) | Amendment and Restatement of The Brink’s Company Employee Welfare Benefit Trust. Exhibit 10.1 to the Registrant’s Quarterly Report on Form 10-Q for the quarter ended September 30, 2013. | |
123
10(x) | $525,000,000 Credit Agreement, dated as of March 10, 2015, among The Brink’s Company, as Parent Borrower and as a Guarantor, the subsidiary borrowers referred to therein, as Subsidiary Borrowers, certain of Parent Borrower’s subsidiaries, as Guarantors, Wells Fargo Bank, National Association, as Administrative Agent, an Issuing Lender and Swingline Lender, and various other Lenders named therein. Exhibit 10.1 to the Registrant's Current Report on Form 8-K filed March 13, 2015. | |
10(y) | $75,000,000 Credit Agreement, dated as of March 12, 2015, among The Brink’s Company, as Parent Borrower, certain of Parent Borrower’s subsidiaries, as Guarantors, and PNC Bank, National Association, as Lender. Exhibit 10.2 to the Registrant's Current Report on Form 8-K filed March 13, 2015. | |
10(z) | $100,000,000 Uncommitted Facility Agreement, dated as of October 31, 2016, by and among The Brink’s Company, certain of its subsidiaries, and Banco Santander, S.A. Exhibit 10.1 to the Registrant’s Current Report on Form 8-K filed November 4, 2016. | |
10(aa) | Note Purchase Agreement, dated as of January 24, 2011, among the Registrant, Pittston Services Group Inc., Brink’s Holding Company, Brink’s, Incorporated, and the purchasers party thereto. Exhibit 10.1 to the Registrant’s Current Report on Form 8-K filed January 26, 2011. | |
10(bb) | Stock Purchase Agreement, dated as of November 15, 2005, by and among BAX Holding Company, BAX Global Inc., The Brink’s Company and Deutsche Bahn AG. Exhibit 2.1 to the Registrant’s Current Report on Form 8-K filed November 16, 2005. | |
10(cc) | Separation and Distribution Agreement between the Registrant and Brink’s Home Security Holdings, Inc. dated as of October 31, 2008. Exhibit 10.1 to the Registrant’s Current Report on Form 8-K filed November 5, 2008. | |
10(dd) | Tax Matters Agreement between the Registrant and Brink’s Home Security Holdings, Inc. dated as of October 31, 2008. Exhibit 10.3 to the Registrant’s Current Report on Form 8-K filed November 5, 2008. | |
10(ee) | Employee Matters Agreement between the Registrant and Brink’s Home Security Holdings, Inc. dated as of October 31, 2008. Exhibit 10.5 to the Registrant’s Current Report on Form 8-K filed November 5, 2008. | |
10(ff)* | Severance Pay Plan of The Brink's Company effective November 13, 2015. Exhibit 10.2 to the Registrant's Current Report on Form 8-K filed November 16, 2015. | |
10(gg)* | Succession Agreement by and between the Registrant and Thomas C. Schievelbein dated January 3, 2016. Exhibit 10.2 to the Registrant's Current Report on form 8-K filed January 5, 2016. | |
21 | Subsidiaries of the Registrant. | |
23 | Consent of Independent Registered Public Accounting Firm. | |
24 | Powers of Attorney. | |
31.1 | Certification of Chief Executive Officer of the Brink's Company pursuant to Rule 13a-14(a) of the Securities Exchange Act of 1934. | |
31.2 | Certification of Chief Financial Officer of the Brink's Company pursuant to Rule 13a-14(a) of the Securities Exchange Act of 1934. | |
32.1 | Certification of Chief Executive Officer of the Brink's Company pursuant to Rule 13a-14(a) or Rule 15d-14(b) and 18 U.S.C. 1350. | |
32.2 | Certification of Chief Financial Officer of the Brink's Company pursuant to Rule 13a-14(a) or Rule 15d-14(b) and 18 U.S.C. 1350. | |
124
99(a)* | Excerpt from Pension-Retirement Plan relating to preservation of assets of the Pension-Retirement Plan upon a change in control. Exhibit 99(a) to the Registrant’s Annual Report on Form 10-K for the year ended December 31, 2008. | |
99(b)* | Subscription Agreement, dated June 9, 2016, between The Brink’s Company and Douglas A. Pertz. Exhibit 99.2 to the Registrant’s Current Report on Form 8-K filed June 10, 2016. | |
99(c)* | Subscription Agreement, dated July 14, 2016, between The Brink’s Company and Ronald J. Domanico. Exhibit 99.2 to the Registrant’s Current Report on Form 8-K filed July 15, 2016. | |
101 | Interactive Data File (Annual Report on Form 10-K, for the year ended December 31, 2016, furnished in XBRL (eXtensible Business Reporting Language)). Attached as Exhibit 101 to this report are the following documents formatted in XBRL: (i) the Consolidated Balance Sheets at December 31, 2016, and December 31, 2015, (ii) the Consolidated Statements of Operations for the years ended December 31, 2016, 2015 and 2014, (iii) the Consolidated Statements of Comprehensive Income (Loss) for the years ended December 31, 2016, 2015 and 2014, (iv) the Consolidated Statements of Equity for the years ended December 31, 2016, 2015 and 2014, (v) the Consolidated Statements of Cash Flows for the years ended December 31, 2016, 2015 and 2014, and (vi) the Notes to Consolidated Financial Statements, tagged as blocks of text. Users of this data are advised pursuant to Rule 406T of Regulation S-T that this interactive data file is deemed not filed or part of a registration statement or prospectus for purposes of sections 11 or 12 of the Securities Act of 1933, is deemed not filed for purposes of section 18 of the Securities Exchange Act of 1934, and otherwise is not subject to liability under these sections. | |
*Management contract or compensatory plan or arrangement.
125