J. P. Morgan Healthcare Conference San Francisco, CA January 13, 2015 Jay Grinney, President and Chief Executive Officer

2 The information contained in this presentation includes certain estimates, projections and other forward- looking information that reflect our current outlook, views and plans with respect to future events, including legislative and regulatory developments, strategy, capital expenditures, development activities, dividend strategies, repurchases of securities, effective tax rates, financial performance, and business model. These estimates, projections and other forward-looking information are based on assumptions that HealthSouth believes, as of the date hereof, are reasonable. Inevitably, there will be differences between such estimates and actual events or results, and those differences may be material. There can be no assurance that any estimates, projections or forward-looking information will be realized. All such estimates, projections and forward-looking information speak only as of the date hereof. HealthSouth undertakes no duty to publicly update or revise the information contained herein. You are cautioned not to place undue reliance on the estimates, projections and other forward-looking information in this presentation as they are based on current expectations and general assumptions and are subject to various risks, uncertainties and other factors, including those set forth in the Form 10-K for the year ended December 31, 2013, the Form 10-Q for the quarters ended March 31, 2014, June 30, 2014, and September 30, 2014, and in other documents we previously filed with the SEC, many of which are beyond our control, that may cause actual events or results to differ materially from the views, beliefs and estimates expressed herein. Note Regarding Presentation of Non-GAAP Financial Measures The following presentation includes certain “non-GAAP financial measures” as defined in Regulation G under the Securities Exchange Act of 1934. Schedules are attached that reconcile the non-GAAP financial measures included in the following presentation to the most directly comparable financial measures calculated and presented in accordance with Generally Accepted Accounting Principles in the United States. Our Form 8-K, dated January 13, 2015 to which the following supplemental slides are attached as Exhibit 99.1, provides further explanation and disclosure regarding our use of non-GAAP financial measures and should be read in conjunction with these supplemental slides. Forward-Looking Statements

3 Inpatient Rehabilitation Portfolio - As of December 31, 2014 107 Inpatient Rehabilitation Hospitals (“IRF”) • 32 operate as JV’s with Acute Care Hospitals 25 Hospital-Based Home Health Agencies (2) 16 Outpatient Rehabilitation Satellite Clinics 29 Number of States (plus Puerto Rico) ~ 24,100 Employees Key Statistics - Year-Ended December 31, 2014 ~ $2.4 Billion Revenue (2) 134,512 Inpatient Discharges 739,227 Outpatient Visits (2) Company Overview (1) Encompass Home Health and Hospice (1) Portfolio – As of December 31, 2014 107 Home Health Locations 8 Pediatric Home Health Locations 20 Hospice Locations 12 Number of States ~ 4,900 Employees Key Statistics - Year-Ended December 31, 2014 ~ $370 million Revenue 98,627 Home Health Episodes 387 Hospice Census Inpatient Rehabilitation Hospitals Encompass Home Health Encompass Hospice Encompass Pediatrics New Inpatient Rehabilitation Hospitals under development (1) HealthSouth completed the acquisition of Encompass Home Health and Hospice on December 31, 2014. (2) Existing 25 HealthSouth home health agencies will be integrated into Encompass during 2015. HealthSouth revenue and outpatient visits include the revenue and visits from these 25 agencies in 2014. IRF Marketshare ~ 9% of IRFs ~ 18% of Licensed Beds ~ 21% of Patients Served Home Health and Hospice Marketshare 5th largest provider of Medicare-focused home health services
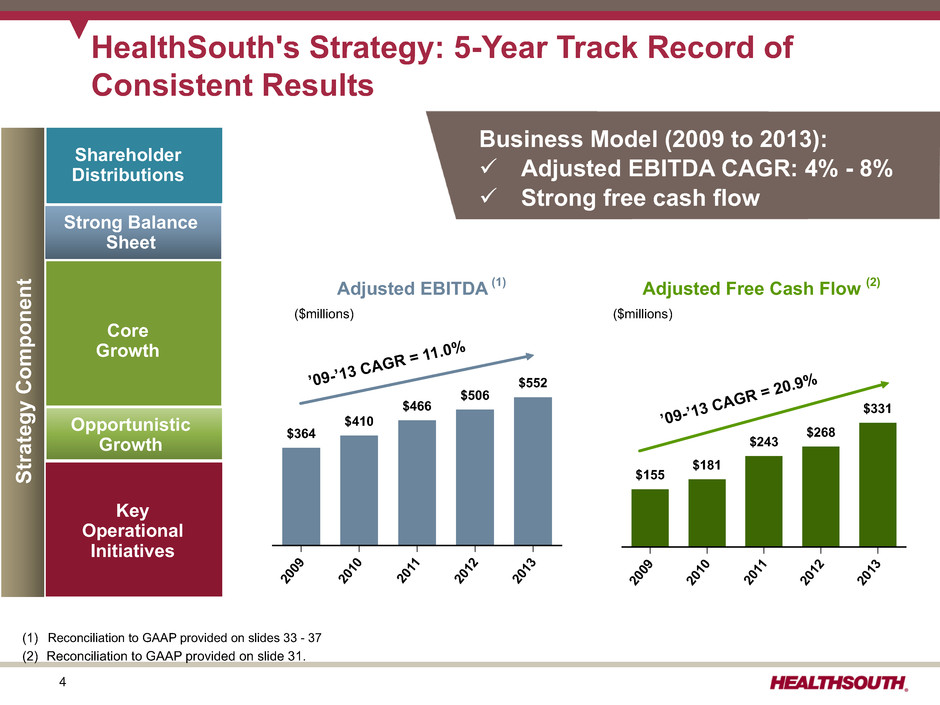
4 HealthSouth's Strategy: 5-Year Track Record of Consistent Results Business Model (2009 to 2013): ü Adjusted EBITDA CAGR: 4% - 8% ü Strong free cash flow Shareholder Distributions Core Growth Strategy Componen t Key Operational Initiatives Shareholder Distributions Core Growth Strong Balance Sheet Opportunistic Growth (1) Reconciliation to GAAP provided on slides 33 - 37 (2) Reconciliation to GAAP provided on slide 31. 20 09 20 10 20 11 20 12 20 13 $364 $410 $466 $506 $552’09-’13 CAGR = 11.0% Adjusted EBITDA (1) Adjusted Free Cash Flow (2) 20 09 20 10 20 11 20 12 20 13 $155 $181 $243 $268 $331 ($millions) ($millions) ’09-’13 CAGR = 20.9 %
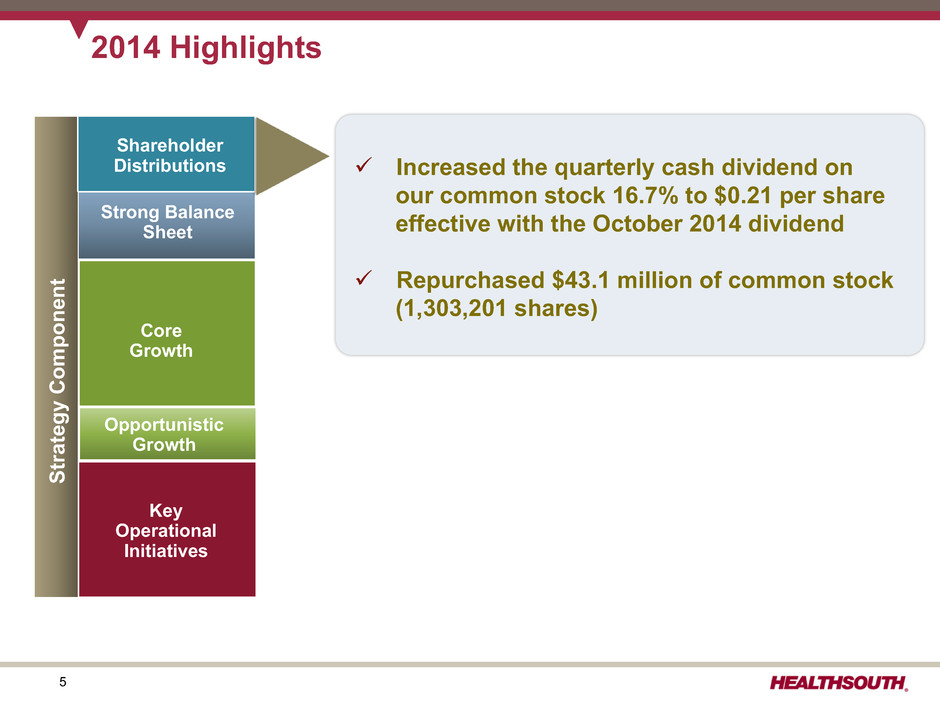
5 2014 Highlights ü Increased the quarterly cash dividend on our common stock 16.7% to $0.21 per share effective with the October 2014 dividend ü Repurchased $43.1 million of common stock (1,303,201 shares) Key Operational Initiatives Key Operational Initiatives Shareholder Distributions Core Growth Strategy Componen t Key Operational Initiatives Core Growth Strong Balance Sheet Opportunistic Growth Shareholder Distributions
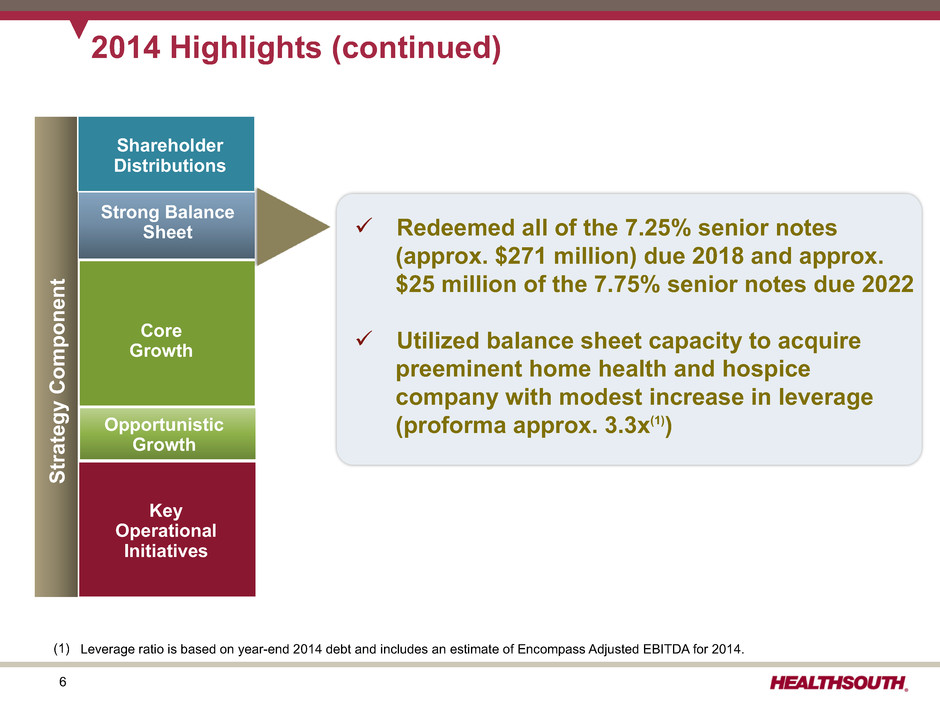
6 2014 Highlights (continued) Key Operational Initiatives ü Redeemed all of the 7.25% senior notes (approx. $271 million) due 2018 and approx. $25 million of the 7.75% senior notes due 2022 ü Utilized balance sheet capacity to acquire preeminent home health and hospice company with modest increase in leverage (proforma approx. 3.3x(1)) Shareholder Distributions Core Growth Strategy Componen t Key Operational Initiatives Core Growth Strong Balance Sheet Opportunistic Growth Shareholder Distributions (1) Leverage ratio is based on year-end 2014 debt and includes an estimate of Encompass Adjusted EBITDA for 2014.
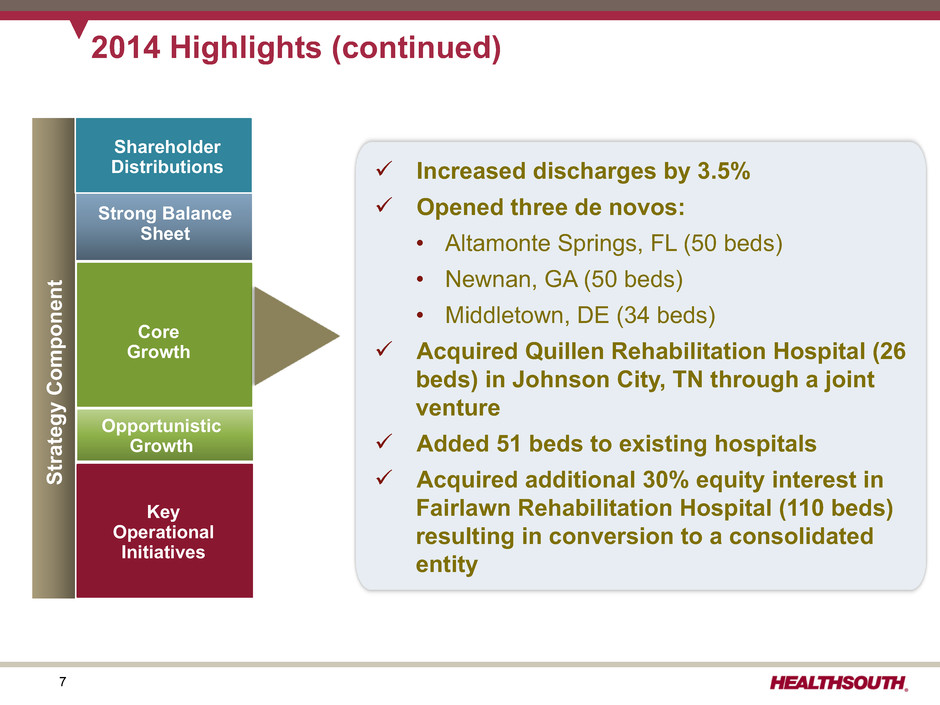
7 2014 Highlights (continued) ü Increased discharges by 3.5% ü Opened three de novos: • Altamonte Springs, FL (50 beds) • Newnan, GA (50 beds) • Middletown, DE (34 beds) ü Acquired Quillen Rehabilitation Hospital (26 beds) in Johnson City, TN through a joint venture ü Added 51 beds to existing hospitals ü Acquired additional 30% equity interest in Fairlawn Rehabilitation Hospital (110 beds) resulting in conversion to a consolidated entity Key Operational Initiatives Shareholder Distributions Core Growth Strategy Componen t Key Operational Initiatives Core Growth Strong Balance Sheet Opportunistic Growth Shareholder Distributions

8 2014 Highlights (continued) Key Operational Initiatives ü Acquired Encompass Home Health & Hospice • $750 million purchase price; $695.5 million cash + $64.5 million Encompass management equity roll • Transaction funded with expanded credit facility – $300 million additional term loan – Proforma leverage of approx. 3.3x(1) • New HealthSouth home health and hospice operating segment – Retained Encompass management and trade names – Existing 25 HealthSouth home health agencies to be integrated into Encompass • Accretive upon closing – Expected Adjusted EBITDA contribution of approx. $75 million in 2015 – Expected EPS accretion to be determined pending final purchase price allocation Shareholder Distributions Core Growth Key Operational Initiatives Core Growth Strong Balance Sheet Opportunistic Growth Shareholder Distributions Strategy Componen t (1) Leverage ratio is based on year-end 2014 debt and includes an estimate of Encompass Adjusted EBITDA for 2014.

9 2014 Highlights (continued) Key Operational Initiatives 3Q13 4Q13 1Q14 2Q14 3Q14 35.6 36.4 36.8 37.5 37.6 27.8 27.9 28.0 28.1 28.3 HLS Average UDSMR Average(1) without HealthSouth ü Achieved consistently higher FIM® Gains(2) ü Installed electronic clinical information system in 22 additional hospitals bringing to 58 the total number of hospitals on this system • All hospitals to be operational by YE 2017 Key Operational Initiatives Shareholder Distributions Core Growth Strategy Componen t Key Operational Initiatives Core Growth Strong Balance Sheet Opportunistic Growth Shareholder Distributions Source: UDSMR Database (1) Average = Expected, Risk-adjusted (2) FIM® instrument is a trademark of Uniform Data System for Medical Rehabilitation, a division of UB Foundation Activities, Inc. FIM® Gain is based on the change from admission to discharge of an 18 point assessment.
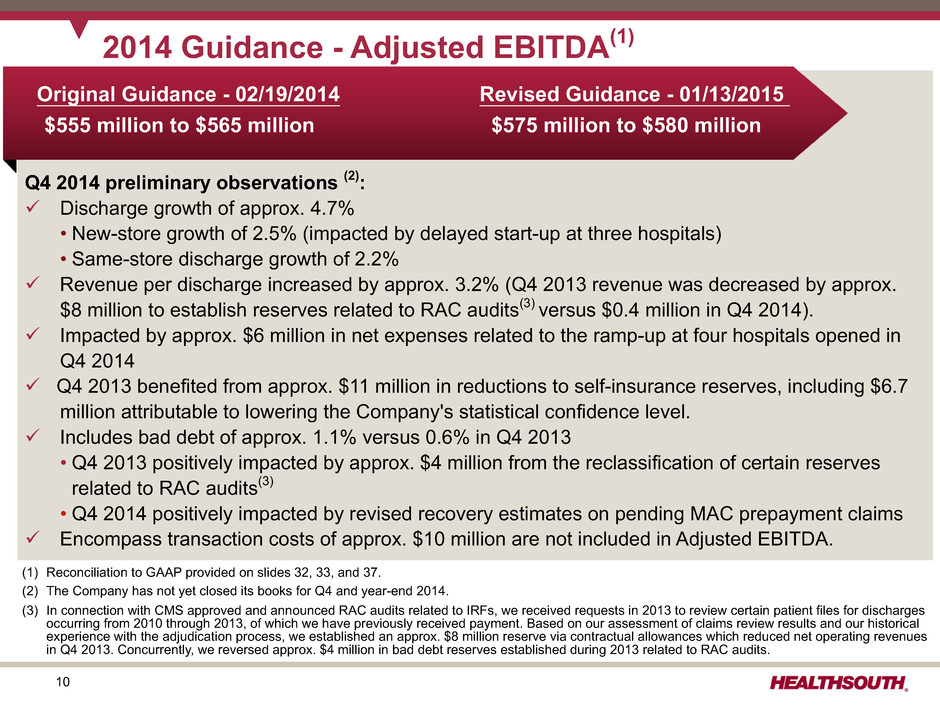
10 2014 Guidance - Adjusted EBITDA(1) Q4 2014 preliminary observations (2): ü Discharge growth of approx. 4.7% • New-store growth of 2.5% (impacted by delayed start-up at three hospitals) • Same-store discharge growth of 2.2% ü Revenue per discharge increased by approx. 3.2% (Q4 2013 revenue was decreased by approx. $8 million to establish reserves related to RAC audits(3) versus $0.4 million in Q4 2014). ü Impacted by approx. $6 million in net expenses related to the ramp-up at four hospitals opened in Q4 2014 ü Q4 2013 benefited from approx. $11 million in reductions to self-insurance reserves, including $6.7 million attributable to lowering the Company's statistical confidence level. ü Includes bad debt of approx. 1.1% versus 0.6% in Q4 2013 • Q4 2013 positively impacted by approx. $4 million from the reclassification of certain reserves related to RAC audits(3) • Q4 2014 positively impacted by revised recovery estimates on pending MAC prepayment claims ü Encompass transaction costs of approx. $10 million are not included in Adjusted EBITDA. (1) Reconciliation to GAAP provided on slides 32, 33, and 37. (2) The Company has not yet closed its books for Q4 and year-end 2014. (3) In connection with CMS approved and announced RAC audits related to IRFs, we received requests in 2013 to review certain patient files for discharges occurring from 2010 through 2013, of which we have previously received payment. Based on our assessment of claims review results and our historical experience with the adjudication process, we established an approx. $8 million reserve via contractual allowances which reduced net operating revenues in Q4 2013. Concurrently, we reversed approx. $4 million in bad debt reserves established during 2013 related to RAC audits. Original Guidance - 02/19/2014 Revised Guidance - 01/13/2015 $555 million to $565 million $575 million to $580 million

11 2014 Guidance – EPS (1) Considerations: • Includes approx. $10 million, or $0.06 per share, for Encompass transaction costs • Includes approx. $13 million, or $0.08 per share, loss on early extinguishment of debt in Q4 2014 • Higher depreciation and amortization related to recent capital investments • Higher interest expense and amortization of debt discounts and fees related to the exchange of Convertible Senior Subordinated Notes for Convertible Perpetual Preferred Stock completed in Q4 2013 • Assumes provision for income tax of approx. 35% (cash taxes expected to be approx $16 million for full-year 2014) Earnings per Share from Continuing Operations Attributable to HealthSouth (2) $ 2.20 to $ 2.23 (1) The Company has not yet closed its books for Q4 and year-end 2014. (2) Income from continuing operations attributable to HealthSouth (3) The income allocated to participating securities, the convertible perpetual preferred dividends, and the repurchase premium on preferred stock need to be subtracted from income from continuing operations to calculate basic earnings per share. (4) The interest and amortization related to the convertible senior subordinated notes must be added to income from continuing operations when calculating diluted earnings per share. (5) Diluted earnings per share are the same as basic earnings per share due to antidilution. EPS Guidance Actual Low High (In Millions, Except Per Share Data) 2013 2014 Adjusted EBITDA $ 551.6 $ 575 $ 580 Interest expense and amortization of debt discounts and fees (100.4) (109) Depreciation and amortization (94.7) (108) Stock-based compensation expense (24.8) (24) Other, including noncash loss on disposal and impairment of assets (5.9) (7) 325.8 327 332 Certain Nonrecurring Expenses: Government, class action, and related settlements 23.5 2 Professional fees - accounting, tax, and legal (9.5) (9) Loss on early extinguishment of debt (2.4) (13) Gain related to consolidation of Fairlawn Rehabilitation Hospital — 27 Transaction costs — (10) Pre-tax income 337.4 324 329 Income tax (12.7) (111) (113) Income from continuing operations (2) 324.7 213 216 Income allocated to participating securities (3) (3.4) (2) (2) Convertible perpetual preferred dividends (3) (21.0) (6) (6) Repurchase of convertible perpetual preferred stock (3) (71.6) — — After-tax convertible debt interest expense (4) — 9 9 Basic shares (3) 88.1 87.0 87.0 Diluted shares (4) 102.1 101.0 101.0 Earnings per share $ 2.59 (5) $ 2.20 $ 2.23
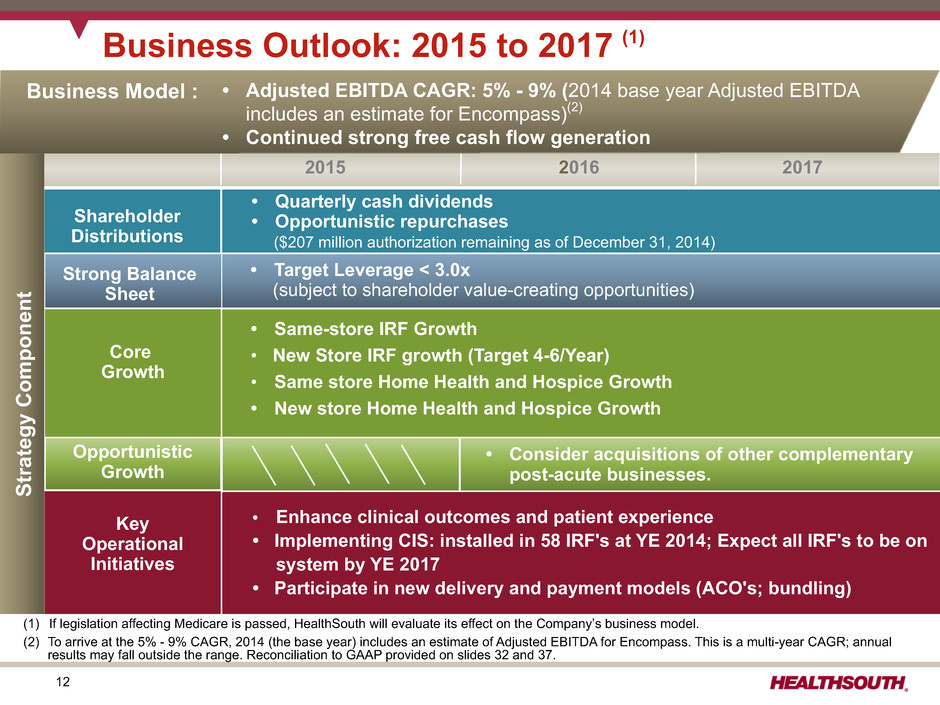
12 Key Operational Initiatives Shareholder Distributions Core Growth Opportunistic Growth 2015 2016 2017 • Quarterly cash dividends • Opportunistic repurchases ($207 million authorization remaining as of December 31, 2014) • Target Leverage < 3.0x (subject to shareholder value-creating opportunities) Strong Balance Sheet • Same-store IRF Growth • New Store IRF growth (Target 4-6/Year) • Same store Home Health and Hospice Growth • New store Home Health and Hospice Growth • Consider acquisitions of other complementary post-acute businesses. • Enhance clinical outcomes and patient experience • Implementing CIS: installed in 58 IRF's at YE 2014; Expect all IRF's to be on system by YE 2017 • Participate in new delivery and payment models (ACO's; bundling) Strategy Componen t Business Outlook: 2015 to 2017 (1) (1) If legislation affecting Medicare is passed, HealthSouth will evaluate its effect on the Company’s business model. (2) To arrive at the 5% - 9% CAGR, 2014 (the base year) includes an estimate of Adjusted EBITDA for Encompass. This is a multi-year CAGR; annual results may fall outside the range. Reconciliation to GAAP provided on slides 32 and 37. • Adjusted EBITDA CAGR: 5% - 9% (2014 base year Adjusted EBITDA includes an estimate for Encompass)(2) • Continued strong free cash flow generation Business Model :
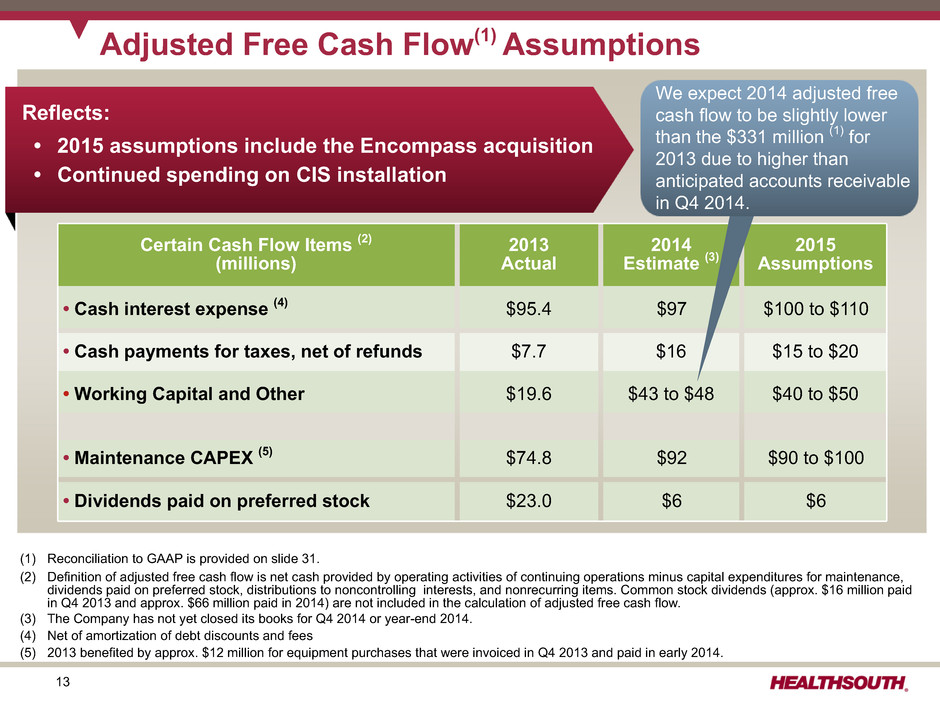
13 (1) Reconciliation to GAAP is provided on slide 31. (2) Definition of adjusted free cash flow is net cash provided by operating activities of continuing operations minus capital expenditures for maintenance, dividends paid on preferred stock, distributions to noncontrolling interests, and nonrecurring items. Common stock dividends (approx. $16 million paid in Q4 2013 and approx. $66 million paid in 2014) are not included in the calculation of adjusted free cash flow. (3) The Company has not yet closed its books for Q4 2014 or year-end 2014. (4) Net of amortization of debt discounts and fees (5) 2013 benefited by approx. $12 million for equipment purchases that were invoiced in Q4 2013 and paid in early 2014. Adjusted Free Cash Flow(1) Assumptions Certain Cash Flow Items (2) (millions) 2013 Actual 2014 Estimate (3) 2015 Assumptions • Cash interest expense (4) $95.4 $97 $100 to $110 • Cash payments for taxes, net of refunds $7.7 $16 $15 to $20 • Working Capital and Other $19.6 $43 to $48 $40 to $50 • Maintenance CAPEX (5) $74.8 $92 $90 to $100 • Dividends paid on preferred stock $23.0 $6 $6 Reflects: • 2015 assumptions include the Encompass acquisition • Continued spending on CIS installation We expect 2014 adjusted free cash flow to be slightly lower than the $331 million (1) for 2013 due to higher than anticipated accounts receivable in Q4 2014.
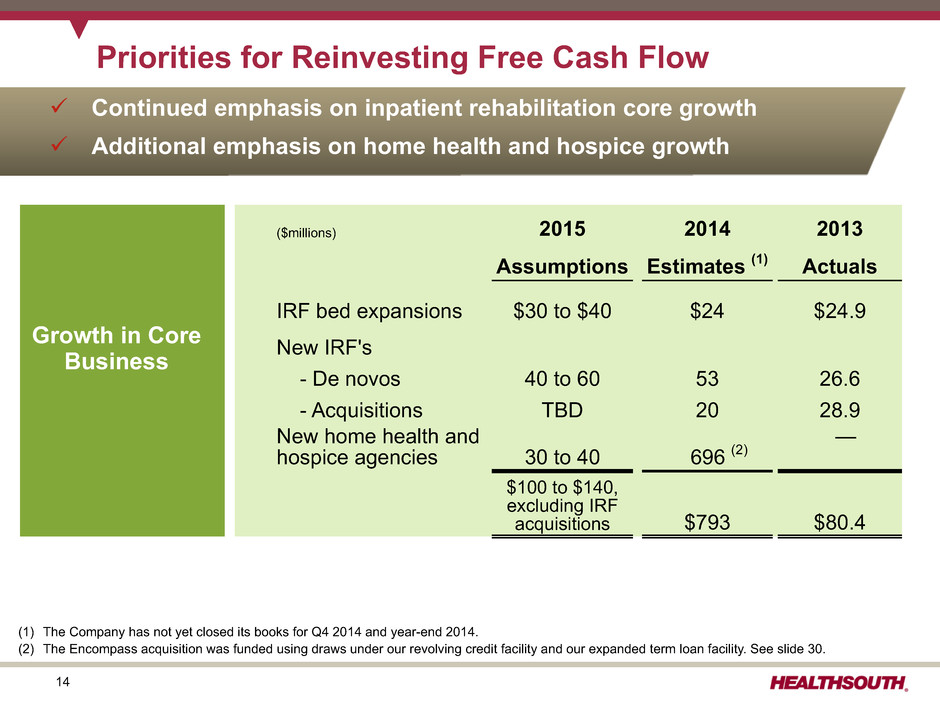
14 Priorities for Reinvesting Free Cash Flow ($millions) 2015 2014 2013 Assumptions Estimates (1) Actuals IRF bed expansions $30 to $40 $24 $24.9 New IRF's - De novos 40 to 60 53 26.6 - Acquisitions TBD 20 28.9 New home health and hospice agencies 30 to 40 696 (2) — $100 to $140, excluding IRF acquisitions $793 $80.4 (1) The Company has not yet closed its books for Q4 2014 and year-end 2014. (2) The Encompass acquisition was funded using draws under our revolving credit facility and our expanded term loan facility. See slide 30. Growth in Core Business ü Continued emphasis on inpatient rehabilitation core growth ü Additional emphasis on home health and hospice growth
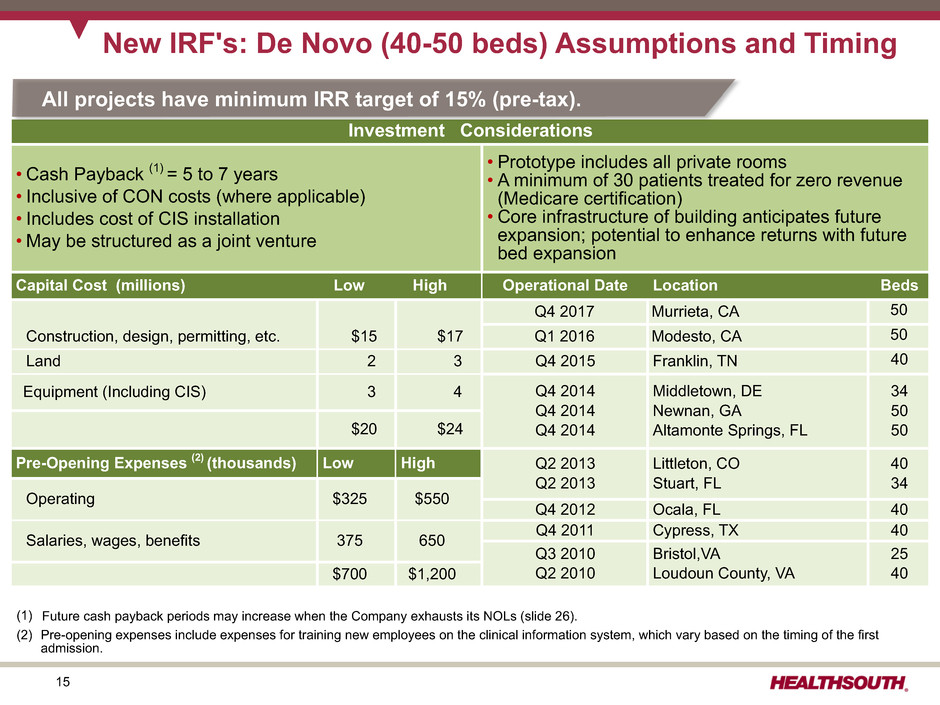
15 Investment Considerations • Cash Payback (1) = 5 to 7 years • Inclusive of CON costs (where applicable) • Includes cost of CIS installation • May be structured as a joint venture • Prototype includes all private rooms • A minimum of 30 patients treated for zero revenue (Medicare certification) • Core infrastructure of building anticipates future expansion; potential to enhance returns with future bed expansion Capital Cost (millions) Low High Operational Date Location Beds Q4 2017 Murrieta, CA 50 Construction, design, permitting, etc. $15 $17 Q1 2016 Modesto, CA 50 Land 2 3 Q4 2015 Franklin, TN 40 Equipment (Including CIS) 3 4 Q4 2014 Q4 2014 Q4 2014 Middletown, DE Newnan, GA Altamonte Springs, FL 34 50 50$20 $24 Pre-Opening Expenses (2) (thousands) Low High Q2 2013 Q2 2013 Littleton, CO Stuart, FL 40 34 Operating $325 $550 Q4 2012 Ocala, FL 40 Salaries, wages, benefits 375 650 Q4 2011 Cypress, TX 40 Q3 2010 Q2 2010 Bristol,VA Loudoun County, VA 25 40$700 $1,200 New IRF's: De Novo (40-50 beds) Assumptions and Timing All projects have minimum IRR target of 15% (pre-tax). (1) Future cash payback periods may increase when the Company exhausts its NOLs (slide 26). (2) Pre-opening expenses include expenses for training new employees on the clinical information system, which vary based on the timing of the first admission.

16 New IRF's: Acquisition Assumptions and Timing Unit/Equity Acquisitions Location Beds Date Acquired Worcester, MA (2) 110 Q2 2014 San Antonio, TX 34 Q3 2012 Ft. Smith, AR 30 Q3 2010 Little Rock, AR 23 Q1 2010 Altoona, PA 18 Q4 2009 Arlington, TX 30 Q3 2008 IRF Acquisitions Location Date Acquired Acquired Census One Year Later Census Savannah, GA (3) 1st half 2015 TBD TBD Johnson City, TN Q4 2014 6 TBD Augusta, GA Q2 2013 31 39 Cincinnati, OH Q4 2011 — 27 Sugar Land, TX Q3 2010 26 35 Las Vegas, NV Q2 2010 16 35 Vineland, NJ Q3 2008 26 31 All projects have minimum IRR target of 15% (pre-tax). Investment Considerations Value Added • Price varies depending on size, market, and physical asset • Cash Payback (1) = 4 to 6 years • May be structured as a joint venture • Clinical information system is additive to the purchase price. • TeamWorks approach to sales/marketing • Labor management tools and best practices • Clinical expertise • Clinical technology and programming • Supply chain efficiency • Medical leadership and clinical advisory boards (1) Future cash payback periods may increase when the Company exhausts its NOLs (slide 26). (2) Worcester, MA is an increase in equity and consolidation of Fairlawn Rehabilitation Hospital effective June 1, 2014. (3) Expect to commence operations of an inpatient rehabilitation hospital under a joint venture agreement with Memorial Health in the first half of 2015 and plan to begin building a 50-bed replacement hospital, which is expected to be completed in early 2016. .
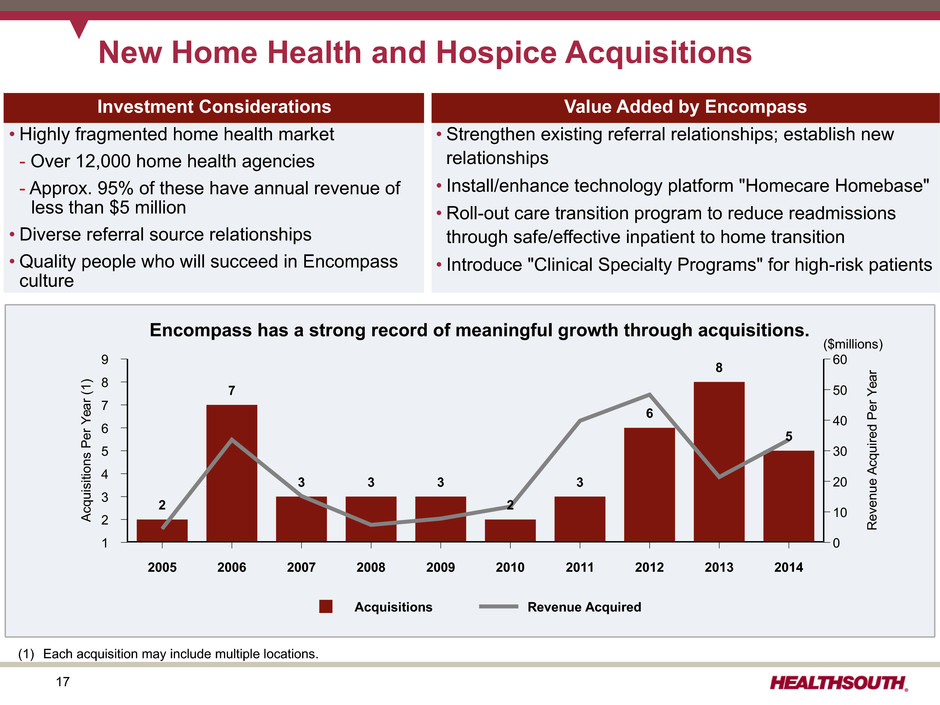
17 New Home Health and Hospice Acquisitions Acquisitions Revenue Acquired 9 8 7 6 5 4 3 2 1 Ac qu is iti on s Pe rY ea r( 1) 60 50 40 30 20 10 0 R ev en ue Ac qu ire d Pe rY ea r 2005 2006 2007 2008 2009 2010 2011 2012 2013 2014 2 7 3 3 3 2 3 6 8 5 Investment Considerations Value Added by Encompass • Highly fragmented home health market - Over 12,000 home health agencies - Approx. 95% of these have annual revenue of less than $5 million • Diverse referral source relationships • Quality people who will succeed in Encompass culture • Strengthen existing referral relationships; establish new relationships • Install/enhance technology platform "Homecare Homebase" • Roll-out care transition program to reduce readmissions through safe/effective inpatient to home transition • Introduce "Clinical Specialty Programs" for high-risk patients Encompass has a strong record of meaningful growth through acquisitions. (1) Each acquisition may include multiple locations. ($millions)
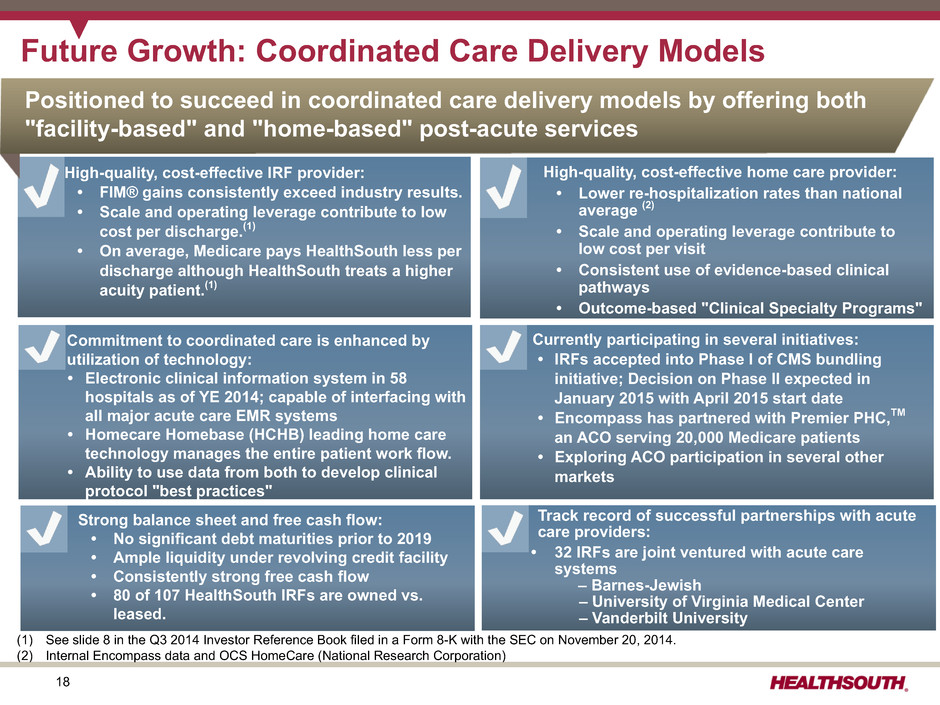
18 Future Growth: Coordinated Care Delivery Models Commitment to coordinated care is enhanced by utilization of technology: • Electronic clinical information system in 58 hospitals as of YE 2014; capable of interfacing with all major acute care EMR systems • Homecare Homebase (HCHB) leading home care technology manages the entire patient work flow. • Ability to use data from both to develop clinical protocol "best practices" Strong balance sheet and free cash flow: • No significant debt maturities prior to 2019 • Ample liquidity under revolving credit facility • Consistently strong free cash flow Currently participating in several initiatives: • IRFs accepted into Phase I of CMS bundling initiative; Decision on Phase II expected in January 2015 with April 2015 start date • Encompass has partnered with Premier PHC,TM an ACO serving 20,000 Medicare patients • Exploring ACO participation in several other markets (1) See slide 8 in the Q3 2014 Investor Reference Book filed in a Form 8-K with the SEC on November 20, 2014. (2) Internal Encompass data and OCS HomeCare (National Research Corporation) High-quality, cost-effective IRF provider: • FIM® gains consistently exceed industry results. • Scale and operating leverage contribute to low cost per discharge.(1) • On average, Medicare pays HealthSouth less per discharge although HealthSouth treats a higher acuity patient.(1) High-quality, cost-effective home care provider: • Lower re-hospitalization rates than national average (2) • Scale and operating leverage contribute to low cost per visit • Consistent use of evidence-based clinical pathways • Outcome-based "Clinical Specialty Programs" Strong balance sheet and free cash flow: • No significant debt maturities prior to 2019 • Ample liquidity under revolving credit facility • Consistently strong free cash flow • 80 of 107 HealthSouth IRFs are owned vs. leased. Positioned to succeed in coordinated care delivery models by offering both "facility-based" and "home-based" post-acute services Track record of successful partnerships with acute care providers: • 32 IRFs are joint ventured with acute care systems – Barnes-Jewish – University of Virginia Medical Center – Vanderbilt University
19 Appendix
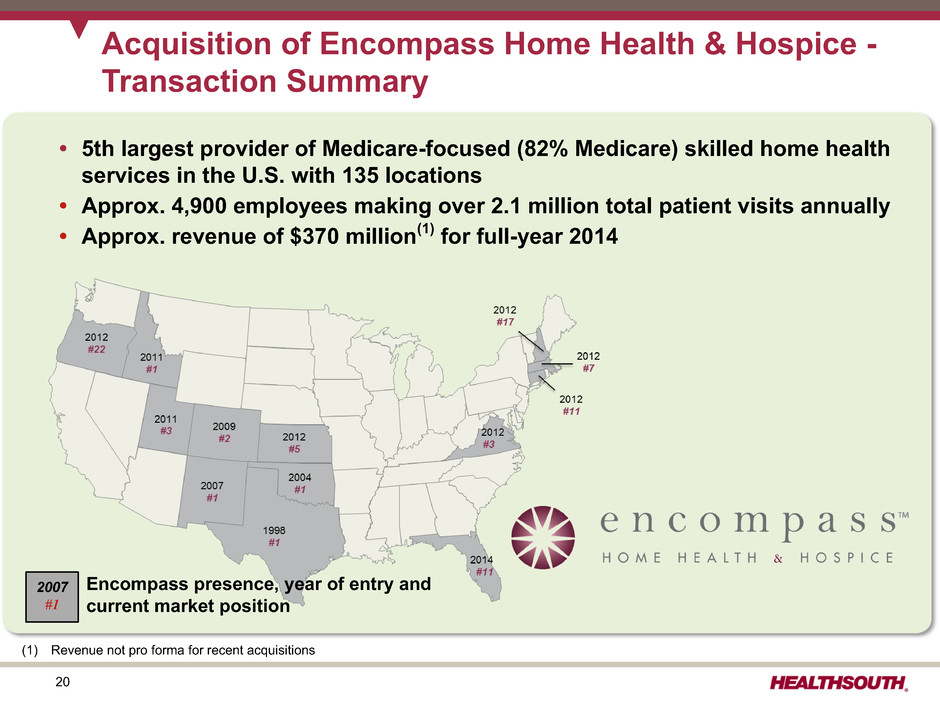
20 Acquisition of Encompass Home Health & Hospice - Transaction Summary • 5th largest provider of Medicare-focused (82% Medicare) skilled home health services in the U.S. with 135 locations • Approx. 4,900 employees making over 2.1 million total patient visits annually • Approx. revenue of $370 million(1) for full-year 2014 (1) Revenue not pro forma for recent acquisitions Encompass presence, year of entry and current market position 2007 #1

21 Acquisition of Encompass Home Health & Hospice - Strategic Rationale ü New growth opportunity: $33.5 billion in Medicare spending on home health and hospice services ü Brings together two best-of-class, post-acute providers with regard to patient outcomes and operating efficiency ü Compatible corporate cultures dedicated to patient care, employee satisfaction and shareholder value ü Highly complementary business serving the Medicare beneficiary population ü Favorable demographic trends driving increased demand for both inpatient rehabilitation and home health/hospice services ü Enhanced positioning to participate in integrated delivery and value-based payment models ü Shared commitment to technology-enabled business processes ü Scalable management teams and supporting infrastructure facilitating accelerated growth ü Ability to leverage balance sheet capacity into a highly accretive transaction ü Sufficient free cash flow and capital available to fund growth opportunities in both IRF and home health/hospice segments

22 Encompass Home Health & Hospice 2013 2014 $302 $370 Medicare: 82% Managed Care/ MA/Other: 10% Medicaid: 8% Revenue (1) Payor Mix (1) Admissions Total Episodes Hospice Daily Census 2013 2014 39,350 49,007 2013 2014 80,594 98,627 Visits per Episode 21.0 20.4 2013 2014 268 387 (1) Revenue for 2014 is estimated; Payor mix reflects estimated 2014 revenue

23 Approx. 54% or approx. 72,300 (1) of HealthSouth's discharges went to home health in 2014. 55% of Encompass' locations overlap with 30% of HealthSouth's hospitals. ~72,300 Discharges to Home Health HealthSouth 70% non-overlap Encompass 45% non-overlap ~21,700 Discharges to Home Health (1) Represents 2014 full-year discharges HealthSouth and Encompass Market Overlap Approx. 5,900 discharges, or 8%, went to HealthSouth home health. Approx. 850 discharges, or 1%, went to Encompass home health. Approx. 800 discharges, or 4%, went to Encompass home health.
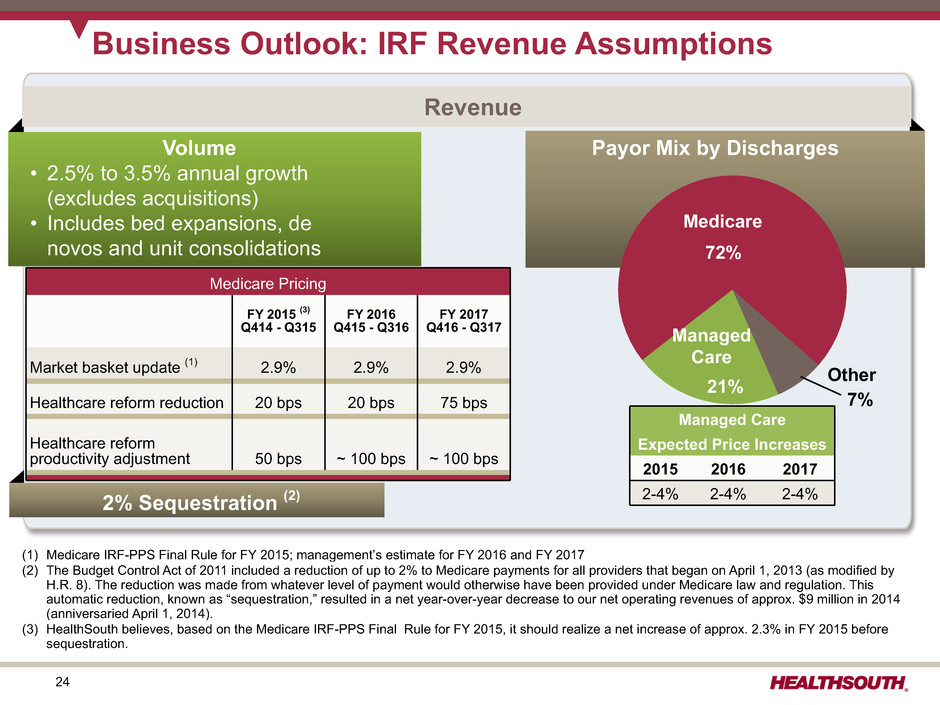
24 Business Outlook: IRF Revenue Assumptions Volume • 2.5% to 3.5% annual growth (excludes acquisitions) • Includes bed expansions, de novos and unit consolidations 2% Sequestration (2) Medicare Pricing FY 2015 (3) Q414 - Q315 FY 2016 Q415 - Q316 FY 2017 Q416 - Q317 Market basket update (1) 2.9% 2.9% 2.9% Healthcare reform reduction 20 bps 20 bps 75 bps Healthcare reform productivity adjustment 50 bps ~ 100 bps ~ 100 bps Payor Mix by Discharges Managed Care Medicare 72% 21% Other7% Managed Care Expected Price Increases 2015 2016 2017 2-4% 2-4% 2-4% (1) Medicare IRF-PPS Final Rule for FY 2015; management’s estimate for FY 2016 and FY 2017 (2) The Budget Control Act of 2011 included a reduction of up to 2% to Medicare payments for all providers that began on April 1, 2013 (as modified by H.R. 8). The reduction was made from whatever level of payment would otherwise have been provided under Medicare law and regulation. This automatic reduction, known as “sequestration,” resulted in a net year-over-year decrease to our net operating revenues of approx. $9 million in 2014 (anniversaried April 1, 2014). (3) HealthSouth believes, based on the Medicare IRF-PPS Final Rule for FY 2015, it should realize a net increase of approx. 2.3% in FY 2015 before sequestration. Revenue

25 Business Outlook: IRF Expense Assumptions General and Administrative ~4% of revenue (excludes stock-based compensation) Expense Salaries & Benefits (1) 2015 2016 2017 Merit increases 2.0-2.5% 2.5-3.0% 2.5-3.0% Benefit costs increases 5-8% 5-8% 5-8% Hospital Expenses • Other operating expenses and supply costs tracking with inflation • Occupancy costs declining as a percent of revenue • Bad debt expense of approx. 1.5% Salaries & Benefits Hospital Expenses (1) Salaries, Wages and Benefits: ~ 89% Salaries and Wages; ~11% Benefits
26 Income Tax Considerations GAAP Considerations: • As of 9/30/14, the Company’s federal NOL had a gross balance of approx. $688 million. • The Company has a remaining valuation allowance of approx. $30 million related to state NOLs. • The Encompass acquisition includes an approx. $40 million (NPV) tax benefit. Cash Tax Payment: • In 2014, the Company expects to pay approx. $16 million of income tax, net of refunds. • HealthSouth is not currently subject to an annual use limitation ("AUL") under Internal Revenue Code Section 382 ("Section 382"). An "ownership change," as defined by Section 382, could subject the Company to an AUL, which would approximate the value of the Company at the time of the "ownership change" multiplied by the long- term tax exempt rate.

27 Priorities for Reinvesting Free Cash Flow Opportunity «« Remain s Highest Priorit y 2015 2014 2013 Assumptions Estimates (1) Actuals IRF bed expansions $30 to $40 $24 $24.9 New IRF's - De novos 40 to 60 53 26.6 - Acquisitions TBD 20 28.9 New home health and hospice acquisitions 30 to 40 696 (2) — $100 to $140, excluding IRF acquisitions $793 $80.4 2015 2014 2013 Assumptions Estimates Actuals Debt borrowings (redemptions), net (2) (3) (4) TBD $610 ($264.0) Purchase leased properties — 20 90.3 Convertible preferred stock repurchase (3) — — 249.0 Cash dividends on common stock(5) 74 66 15.7 Common stock repurchase (~$207 million authorization remaining as of December 31, 2014)(6) TBD 43 234.1 TBD $739 $325.1 (1) The Company has not yet closed its books for Q4 2014 and year-end 2014. (2) The Encompass acquisition was funded using draws under our revolving credit facility and our expanded term loan facility. See slide 30. (3) In 2013, the Company issued $320 million of 2.0% Convertible Senior Subordinated Notes due 2043 in exchange for 257,110 shares of the Company’s 6.5% Series A Convertible Perpetual Preferred Stock. Excluding fees, no cash was used in the transaction. The Company recorded approx. $249 million as debt and approx. $71 million as equity. (4) Detailed information on debt transactions can be found on slide 30. (5) On July 25, 2013, the board of directors approved the initiation of a quarterly cash dividend on our common stock of $0.18 per share. On July 17, 2014, the board of directors approved a $0.03 per share, or 16.7%, increase to the quarterly cash dividend on our common stock. (6) On February 14, 2014, the board of directors approved an increase in our existing common stock repurchase authorization from $200 million to $250 million. The $234 million reflects the tender offer completed in Q1 2013 for approx. 9.5% of the common shares. Complements Growth Investments Shareholder Distributions Growth in Core Business Debt Reduction
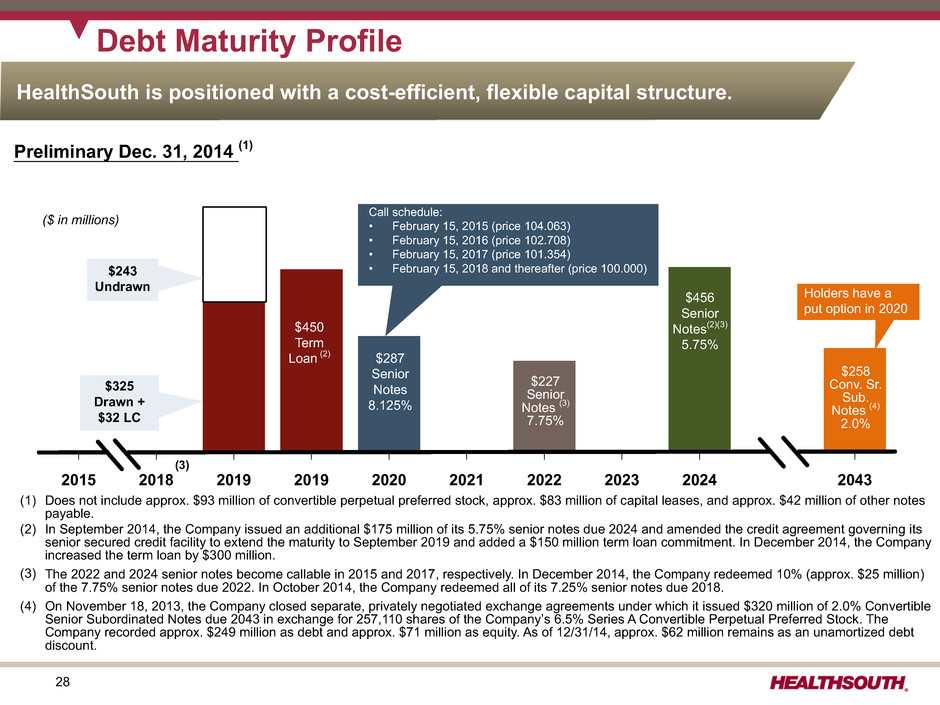
28 2015 2018 2019 2019 2020 2021 2022 2023 2024 2043 $287 Senior Notes 8.125% $456 Senior Notes(2)(3) 5.75% $258 Conv. Sr. Sub. Notes (4) 2.0% $227 Senior Notes (3) 7.75% $325 Drawn + $32 LC Holders have a put option in 2020 Preliminary Dec. 31, 2014 (1) Debt Maturity Profile (1) Does not include approx. $93 million of convertible perpetual preferred stock, approx. $83 million of capital leases, and approx. $42 million of other notes payable. (2) In September 2014, the Company issued an additional $175 million of its 5.75% senior notes due 2024 and amended the credit agreement governing its senior secured credit facility to extend the maturity to September 2019 and added a $150 million term loan commitment. In December 2014, the Company increased the term loan by $300 million. (3) The 2022 and 2024 senior notes become callable in 2015 and 2017, respectively. In December 2014, the Company redeemed 10% (approx. $25 million) of the 7.75% senior notes due 2022. In October 2014, the Company redeemed all of its 7.25% senior notes due 2018. (4) On November 18, 2013, the Company closed separate, privately negotiated exchange agreements under which it issued $320 million of 2.0% Convertible Senior Subordinated Notes due 2043 in exchange for 257,110 shares of the Company’s 6.5% Series A Convertible Perpetual Preferred Stock. The Company recorded approx. $249 million as debt and approx. $71 million as equity. As of 12/31/14, approx. $62 million remains as an unamortized debt discount. Call schedule: • February 15, 2015 (price 104.063) • February 15, 2016 (price 102.708) • February 15, 2017 (price 101.354) • February 15, 2018 and thereafter (price 100.000) HealthSouth is positioned with a cost-efficient, flexible capital structure. ($ in millions) $243 Undrawn $450 Term Loan (2) (3)

29 Debt and Liquidity Liquidity Credit Ratings (1) Based on 2009 Adjusted EBITDA of $363.7 million and 2014 Adjusted EBITDA guidance of $575 - $580 million; reconciliation to GAAP provided on slides 32 - 37. (2) In December 2014, the Company increased the draw on the term loan by $300 million. In December 2014, the Company redeemed 10% (approx. $25 million) of the 7.75% senior notes due 2022. In October 2014, the Company redeemed all of its 7.25% senior notes due 2018. In September 2014, the Company issued an additional $175 million of its 5.75% senior notes due 2024 and amended the credit agreement governing its senior secured credit facility to extend the maturity to September 2019 and add a $150 million term loan commitment. On December 31, 2014 HealthSouth closed on the acquisition of Encompass for a purchase price of $750 million. 2009 2010 2011 2012 2013 Prelim. 2014 $1.66 $1.51 $1.25 $1.25 $1.52 $2.13 (billions) Leverage Ratio(1) Total Debt 4.6x 3.7x Preliminary Dec. 31, 2014 Dec. 31, 2013 Cash Available $ 47.5 $ 64.5 Revolver and Term Loan Total $ 1,050.0 $ 600.0 Less: - Draws (775.0) (45.0) - Letters of Credit (31.8) (36.5) Available $ 243.2 $ 518.5 Total Liquidity $ 290.7 $ 583.0 (2) S&P Moody's Corporate Rating BB- Ba3 Stable Stable Revolver Rating BB+ Baa3 Senior Notes Rating BB- B1
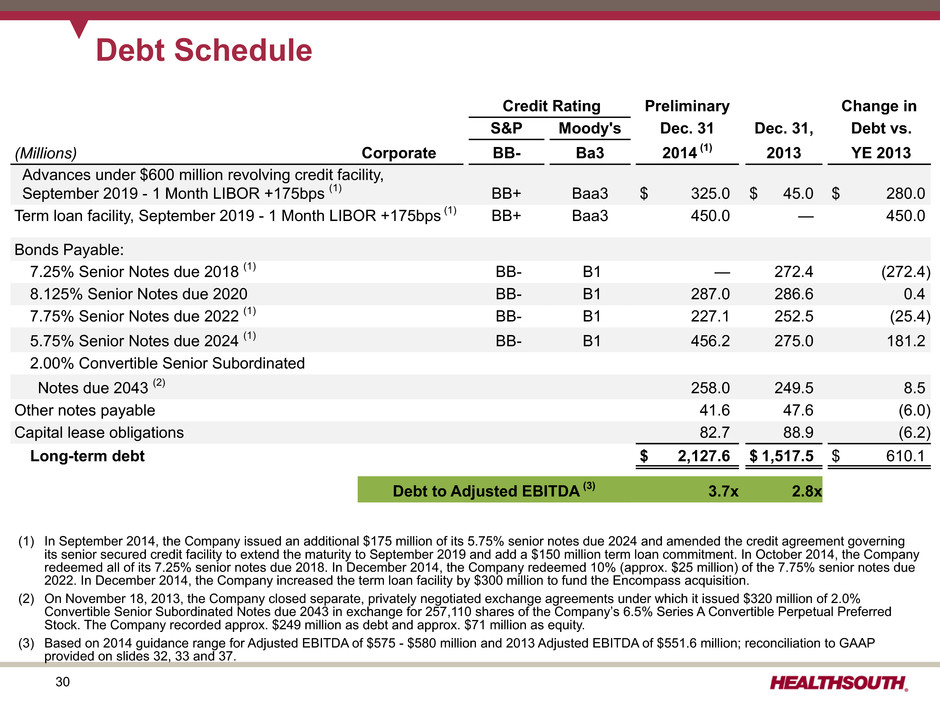
30 Debt Schedule Credit Rating Preliminary Change in S&P Moody's Dec. 31 Dec. 31, Debt vs. (Millions) Corporate BB- Ba3 2014 (1) 2013 YE 2013 Advances under $600 million revolving credit facility, September 2019 - 1 Month LIBOR +175bps (1) BB+ Baa3 $ 325.0 $ 45.0 $ 280.0 Term loan facility, September 2019 - 1 Month LIBOR +175bps (1) BB+ Baa3 450.0 — 450.0 Bonds Payable: 7.25% Senior Notes due 2018 (1) BB- B1 — 272.4 (272.4) 8.125% Senior Notes due 2020 BB- B1 287.0 286.6 0.4 7.75% Senior Notes due 2022 (1) BB- B1 227.1 252.5 (25.4) 5.75% Senior Notes due 2024 (1) BB- B1 456.2 275.0 181.2 2.00% Convertible Senior Subordinated Notes due 2043 (2) 258.0 249.5 8.5 Other notes payable 41.6 47.6 (6.0) Capital lease obligations 82.7 88.9 (6.2) Long-term debt $ 2,127.6 $ 1,517.5 $ 610.1 Debt to Adjusted EBITDA (3) 3.7x 2.8x (1) In September 2014, the Company issued an additional $175 million of its 5.75% senior notes due 2024 and amended the credit agreement governing its senior secured credit facility to extend the maturity to September 2019 and add a $150 million term loan commitment. In October 2014, the Company redeemed all of its 7.25% senior notes due 2018. In December 2014, the Company redeemed 10% (approx. $25 million) of the 7.75% senior notes due 2022. In December 2014, the Company increased the term loan facility by $300 million to fund the Encompass acquisition. (2) On November 18, 2013, the Company closed separate, privately negotiated exchange agreements under which it issued $320 million of 2.0% Convertible Senior Subordinated Notes due 2043 in exchange for 257,110 shares of the Company’s 6.5% Series A Convertible Perpetual Preferred Stock. The Company recorded approx. $249 million as debt and approx. $71 million as equity. (3) Based on 2014 guidance range for Adjusted EBITDA of $575 - $580 million and 2013 Adjusted EBITDA of $551.6 million; reconciliation to GAAP provided on slides 32, 33 and 37.
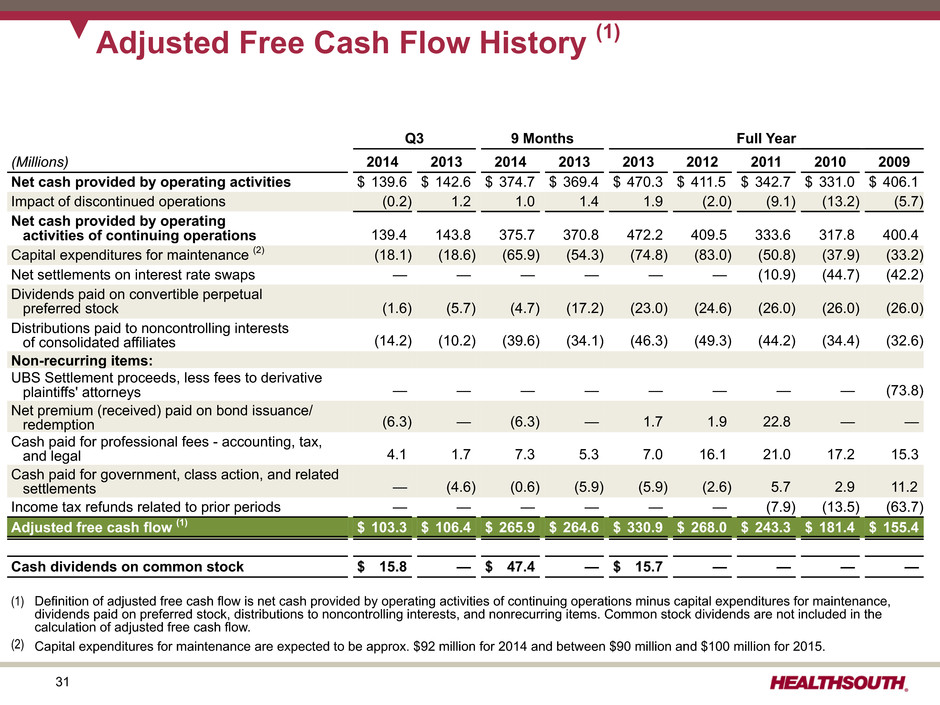
31 Adjusted Free Cash Flow History (1) Q3 9 Months Full Year (Millions) 2014 2013 2014 2013 2013 2012 2011 2010 2009 Net cash provided by operating activities $ 139.6 $ 142.6 $ 374.7 $ 369.4 $ 470.3 $ 411.5 $ 342.7 $ 331.0 $ 406.1 Impact of discontinued operations (0.2) 1.2 1.0 1.4 1.9 (2.0) (9.1) (13.2) (5.7) Net cash provided by operating activities of continuing operations 139.4 143.8 375.7 370.8 472.2 409.5 333.6 317.8 400.4 Capital expenditures for maintenance (2) (18.1) (18.6) (65.9) (54.3) (74.8) (83.0) (50.8) (37.9) (33.2) Net settlements on interest rate swaps — — — — — — (10.9) (44.7) (42.2) Dividends paid on convertible perpetual preferred stock (1.6) (5.7) (4.7) (17.2) (23.0) (24.6) (26.0) (26.0) (26.0) Distributions paid to noncontrolling interests of consolidated affiliates (14.2) (10.2) (39.6) (34.1) (46.3) (49.3) (44.2) (34.4) (32.6) Non-recurring items: UBS Settlement proceeds, less fees to derivative plaintiffs' attorneys — — — — — — — — (73.8) Net premium (received) paid on bond issuance/ redemption (6.3) — (6.3) — 1.7 1.9 22.8 — — Cash paid for professional fees - accounting, tax, and legal 4.1 1.7 7.3 5.3 7.0 16.1 21.0 17.2 15.3 Cash paid for government, class action, and related settlements — (4.6) (0.6) (5.9) (5.9) (2.6) 5.7 2.9 11.2 Income tax refunds related to prior periods — — — — — — (7.9) (13.5) (63.7) Adjusted free cash flow (1) $ 103.3 $ 106.4 $ 265.9 $ 264.6 $ 330.9 $ 268.0 $ 243.3 $ 181.4 $ 155.4 Cash dividends on common stock $ 15.8 — $ 47.4 — $ 15.7 — — — — (1) Definition of adjusted free cash flow is net cash provided by operating activities of continuing operations minus capital expenditures for maintenance, dividends paid on preferred stock, distributions to noncontrolling interests, and nonrecurring items. Common stock dividends are not included in the calculation of adjusted free cash flow. (2) Capital expenditures for maintenance are expected to be approx. $92 million for 2014 and between $90 million and $100 million for 2015.

32 Reconciliation of Net Income to Adjusted EBITDA (1) 2014 Q1 Q2 Q3 9 Months (in millions, except per share data) Total Per Share Total Per Share Total Per Share Total Per Share Net Income $ 61.5 $ 97.9 $ 64.8 $ 224.2 Loss (income) from disc ops, net of tax, attributable to HealthSouth 0.1 (3.8) 0.9 (2.8) Net income attributable to noncontrolling interests (14.8) (14.8) (14.7) (44.3) Income from continuing operations attributable to HealthSouth (2) 46.8 $ 0.48 79.3 $ 0.81 51.0 $ 0.53 177.1 $ 1.82 Gov't, class action, and related settlements — (0.8) — (0.8) Pro fees - acct, tax, and legal 1.6 2.0 4.0 7.6 Provision for income tax expense 32.8 36.5 22.1 91.4 Interest expense and amortization of debt discounts and fees 27.9 27.8 27.8 83.5 Depreciation and amortization 26.4 26.4 27.4 80.2 Gain on consolidation of Fairlawn Rehabilitation Hospital — (27.2) — (27.2) Other, including net noncash loss on disposal or impairment of assets 1.3 1.7 2.7 5.7 Stock-based compensation expense 7.3 7.0 5.0 19.3 Adjusted EBITDA (1) $ 144.1 $ 152.7 $ 140.0 $ 436.8 Weighted average common shares outstanding: Basic 87.3 86.7 86.5 86.8 Diluted 100.9 100.6 100.5 100.7 (1) (2) – See notes on slide 37.

33 Reconciliation of Net Income to Adjusted EBITDA (1) 2013 Q1 Q2 Q3 Q4 Full Year (in millions, except per share data) Total Per Share Total Per Share Total Per Share Total Per Share Total Per Share Net income $ 65.9 $ 179.0 $ 72.3 $ 64.2 $ 381.4 Loss (income) from disc ops, net of tax, attributable to HealthSouth 0.4 (0.1) 0.9 (0.1) 1.1 Net income attributable to noncontrolling interests (14.6) (13.8) (14.1) (15.3) (57.8) Income from continuing operations attributable to HealthSouth (2) 51.7 $ 0.48 165.1 $ 1.66 59.1 $ 0.59 48.8 $ (0.31) 324.7 $ 2.59 Gov't, class action, and related settlements — (2.0) (21.3) (0.2) (23.5) Pro fees - acct, tax, and legal 1.4 2.2 4.2 1.7 9.5 Provision for income tax expense (benefit) 33.5 (86.5) 35.2 30.5 12.7 Interest expense and amortization of debt discounts and fees 24.2 24.4 25.3 26.5 100.4 Depreciation and amortization 22.1 23.1 24.3 25.2 94.7 Loss on early extinguishment of debt — — — 2.4 2.4 Other, including net noncash loss on disposal of assets 0.1 1.7 2.5 1.6 5.9 Stock-based compensation expense 6.3 6.5 6.2 5.8 24.8 Adjusted EBITDA (1) $ 139.3 $ 134.5 $ 135.5 $ 142.3 $ 551.6 Weighted average common shares outstanding: Basic 94.0 86.1 86.2 86.4 88.1 Diluted 107.1 99.8 100.4 100.8 102.1 (1) (2) – See notes on slide 37.

34 Reconciliation of Net Income to Adjusted EBITDA (1) 2012 Q1 Q2 Q3 Q4 Full Year (in millions, except per share data) Total Per Share Total Per Share Total Per Share Total Per Share Total Per Share Net Income $ 56.8 $ 59.9 $ 59.9 $ 59.3 $ 235.9 Loss (income) from disc ops, net of tax, attributable to HealthSouth 0.4 (3.5) 0.5 (1.9) (4.5) Net income attributable to noncontrolling interests (12.6) (13.2) (12.8) (12.3) (50.9) Income from continuing operations attributable to HealthSouth (2) 44.6 $ 0.39 43.2 $ 0.38 47.6 $ 0.44 45.1 $ 0.41 180.5 $ 1.62 Gov't, class action, and related settlements — — (3.5) — (3.5) Pro fees - acct, tax, and legal 3.6 5.5 4.1 2.9 16.1 Provision for income tax expense 29.1 26.9 28.1 24.5 108.6 Interest expense and amortization of debt discounts and fees 23.3 23.0 23.5 24.3 94.1 Depreciation and amortization 19.5 20.0 21.3 21.7 82.5 Loss on early extinguishment of debt — — 1.3 2.7 4.0 Gain on consolidation of St. Vincent Rehabilitation Hospital — — (4.9) — (4.9) Other, including net noncash loss on disposal of assets 0.8 0.6 1.6 1.4 4.4 Stock-based compensation expense 6.1 5.9 6.1 6.0 24.1 Adjusted EBITDA (1) $ 127.0 $ 125.1 $ 125.2 $ 128.6 $ 505.9 Weighted average common shares outstanding: Basic 94.5 94.6 94.7 94.7 94.6 Diluted 108.7 108.0 108.1 108.0 108.1 (1) (2) – See notes on slide 37.
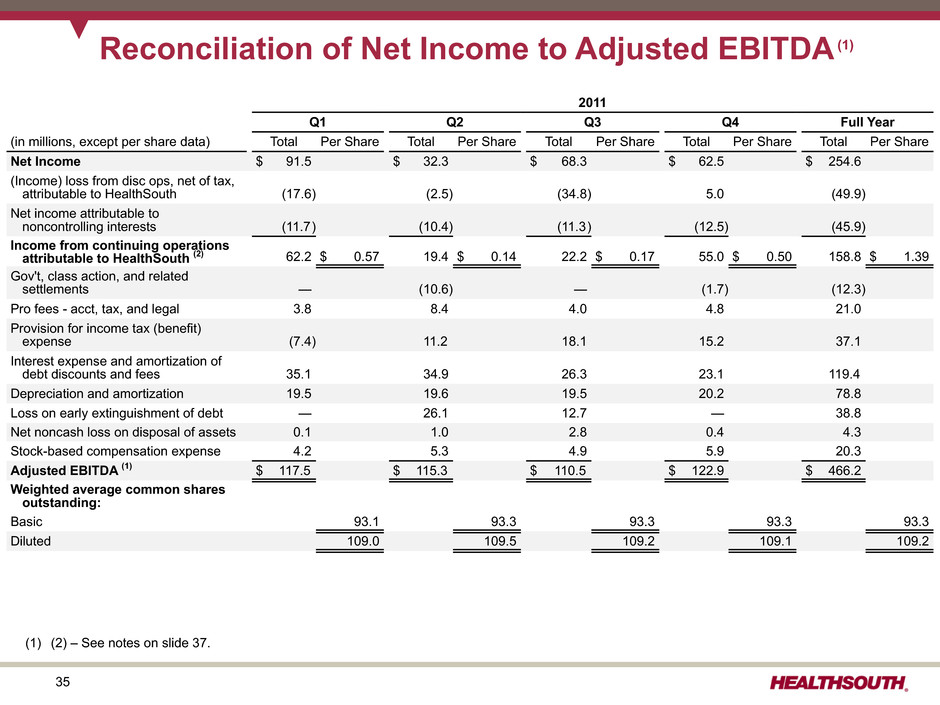
35 Reconciliation of Net Income to Adjusted EBITDA (1) 2011 Q1 Q2 Q3 Q4 Full Year (in millions, except per share data) Total Per Share Total Per Share Total Per Share Total Per Share Total Per Share Net Income $ 91.5 $ 32.3 $ 68.3 $ 62.5 $ 254.6 (Income) loss from disc ops, net of tax, attributable to HealthSouth (17.6) (2.5) (34.8) 5.0 (49.9) Net income attributable to noncontrolling interests (11.7) (10.4) (11.3) (12.5) (45.9) Income from continuing operations attributable to HealthSouth (2) 62.2 $ 0.57 19.4 $ 0.14 22.2 $ 0.17 55.0 $ 0.50 158.8 $ 1.39 Gov't, class action, and related settlements — (10.6) — (1.7) (12.3) Pro fees - acct, tax, and legal 3.8 8.4 4.0 4.8 21.0 Provision for income tax (benefit) expense (7.4) 11.2 18.1 15.2 37.1 Interest expense and amortization of debt discounts and fees 35.1 34.9 26.3 23.1 119.4 Depreciation and amortization 19.5 19.6 19.5 20.2 78.8 Loss on early extinguishment of debt — 26.1 12.7 — 38.8 Net noncash loss on disposal of assets 0.1 1.0 2.8 0.4 4.3 Stock-based compensation expense 4.2 5.3 4.9 5.9 20.3 Adjusted EBITDA (1) $ 117.5 $ 115.3 $ 110.5 $ 122.9 $ 466.2 Weighted average common shares outstanding: Basic 93.1 93.3 93.3 93.3 93.3 Diluted 109.0 109.5 109.2 109.1 109.2 (1) (2) – See notes on slide 37.
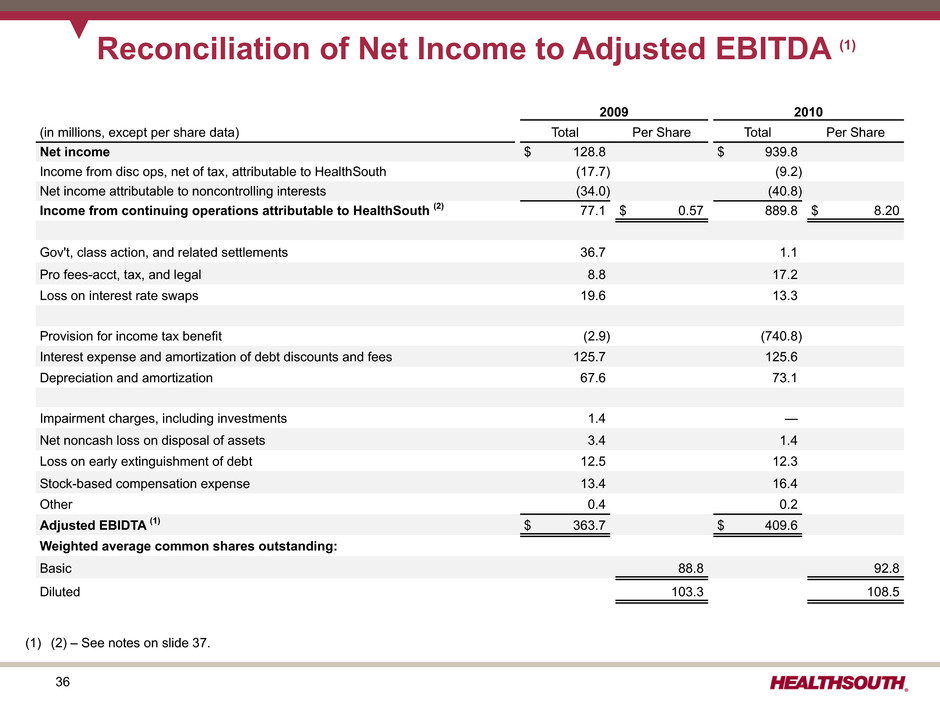
36 Reconciliation of Net Income to Adjusted EBITDA (1) 2009 2010 (in millions, except per share data) Total Per Share Total Per Share Net income $ 128.8 $ 939.8 Income from disc ops, net of tax, attributable to HealthSouth (17.7) (9.2) Net income attributable to noncontrolling interests (34.0) (40.8) Income from continuing operations attributable to HealthSouth (2) 77.1 $ 0.57 889.8 $ 8.20 Gov't, class action, and related settlements 36.7 1.1 Pro fees-acct, tax, and legal 8.8 17.2 Loss on interest rate swaps 19.6 13.3 Provision for income tax benefit (2.9) (740.8) Interest expense and amortization of debt discounts and fees 125.7 125.6 Depreciation and amortization 67.6 73.1 Impairment charges, including investments 1.4 — Net noncash loss on disposal of assets 3.4 1.4 Loss on early extinguishment of debt 12.5 12.3 Stock-based compensation expense 13.4 16.4 Other 0.4 0.2 Adjusted EBIDTA (1) $ 363.7 $ 409.6 Weighted average common shares outstanding: Basic 88.8 92.8 Diluted 103.3 108.5 (1) (2) – See notes on slide 37.
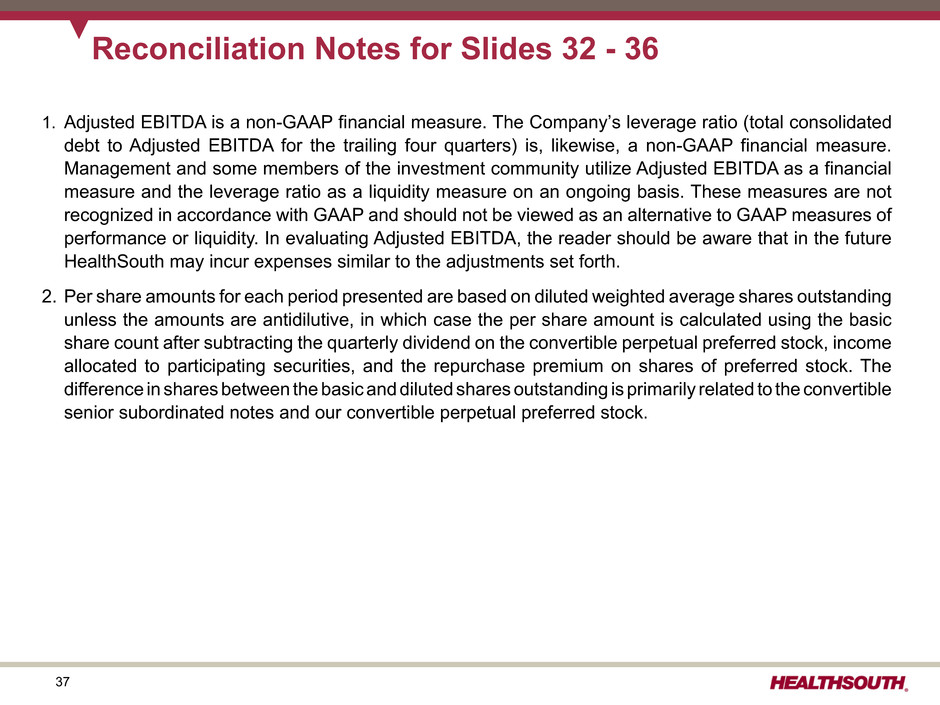
37 Reconciliation Notes for Slides 32 - 36 1. Adjusted EBITDA is a non-GAAP financial measure. The Company’s leverage ratio (total consolidated debt to Adjusted EBITDA for the trailing four quarters) is, likewise, a non-GAAP financial measure. Management and some members of the investment community utilize Adjusted EBITDA as a financial measure and the leverage ratio as a liquidity measure on an ongoing basis. These measures are not recognized in accordance with GAAP and should not be viewed as an alternative to GAAP measures of performance or liquidity. In evaluating Adjusted EBITDA, the reader should be aware that in the future HealthSouth may incur expenses similar to the adjustments set forth. 2. Per share amounts for each period presented are based on diluted weighted average shares outstanding unless the amounts are antidilutive, in which case the per share amount is calculated using the basic share count after subtracting the quarterly dividend on the convertible perpetual preferred stock, income allocated to participating securities, and the repurchase premium on shares of preferred stock. The difference in shares between the basic and diluted shares outstanding is primarily related to the convertible senior subordinated notes and our convertible perpetual preferred stock.