Exhibit 99.1
|
|
NEWS RELEASE | |
| Investor Contact: | ||
| Jessica Vanden Heuvel, Vice President, Director of Investor Relations | ||
| 920-491-7059 | ||
| Media Contact: | ||
| Jennifer Kaminski, Vice President, Public Relations Senior Manager | ||
| 920-491-7576 |

Associated Banc-Corp Reports Second Quarter Earnings of $0.36 per share
Earnings per share up 16% from prior year
Robust loan growth and improving fee-based income trends
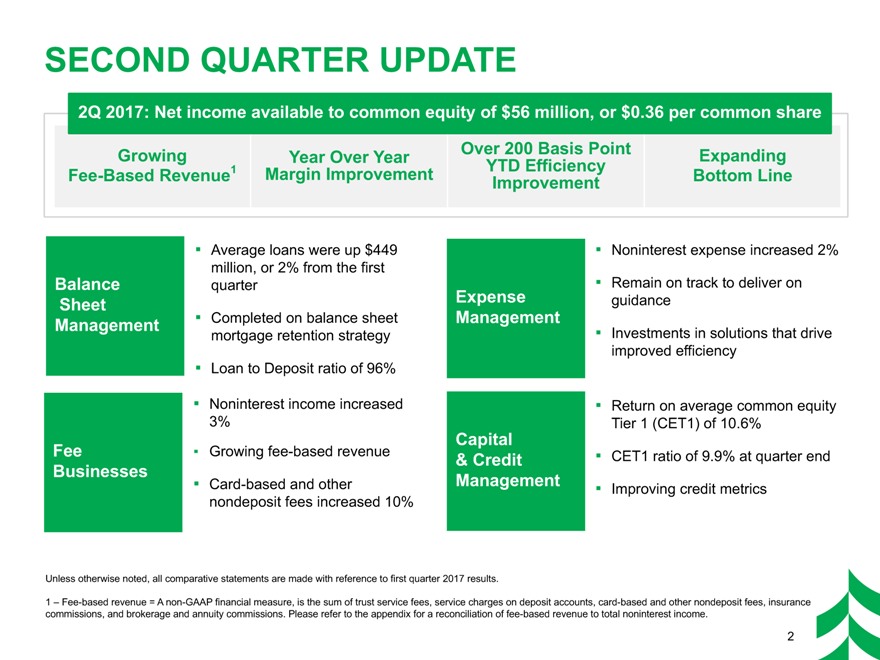
GREEN BAY, Wis. — July 20, 2017 — Associated Banc-Corp (NYSE: ASB) today reported net income available to common equity of $56 million, or $0.36 per common share for the quarter ended June 30, 2017. This compares to net income available to common equity of $47 million, or $0.31 per common share for the quarter ended June 30, 2016.
“Robust loan growth and improving fee-based income trends drove this quarter’s results. Our residential mortgage retention strategy contributed to most of this quarter’s loan growth and we are also pleased to report solid commercial and business lending growth. We also benefited from improving fee-based revenue streams; particularly, card-based and nondeposit fees, trust service fees, and brokerage and annuity commissions which contributed to bottom line expansion,” said President and CEO Philip B. Flynn. “Disciplined expense controls combined with improving credit trends rounded out the quarter. We remain on track to deliver on our full year guidance.”
SECOND QUARTER SUMMARY
| • | Average loans of $20.5 billion grew $880 million, or 4% from the year ago quarter |
| • | Average deposits of $21.5 billion grew $1.2 billion, or 6% from the year ago quarter |
| • | Net interest income of $184 million increased $7 million, or 4% from the year ago quarter |
| • | Net interest margin of 2.83% improved from 2.81% in the year ago quarter |
| • | Provision for credit losses of $12 million improved $2 million, or 14% from the year ago quarter |
| • | Noninterest income of $82 million improved modestly from the year ago quarter |
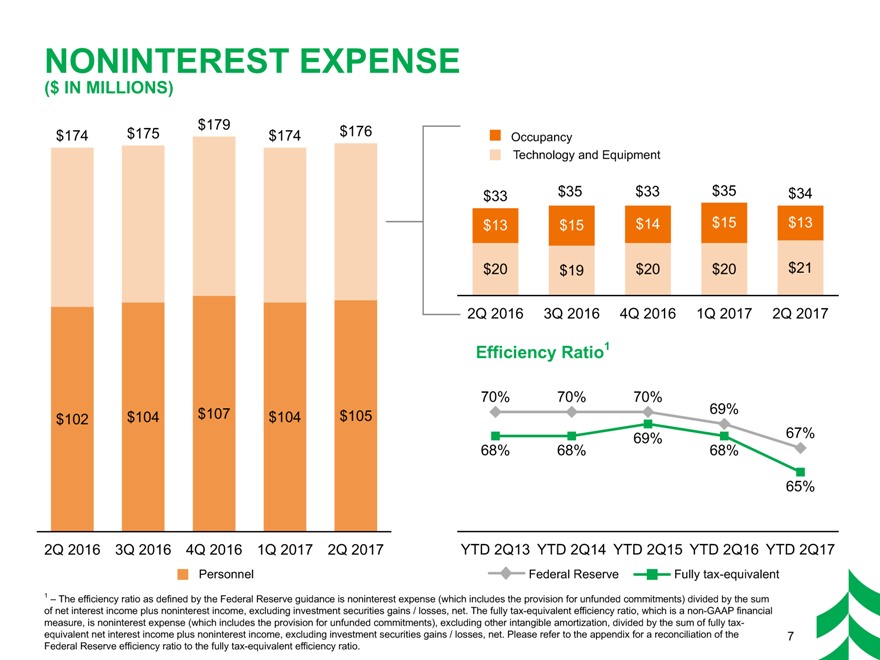
| • | Noninterest expense of $176 million increased $2 million, or 1% from the year ago quarter |
| • | Return on average common equity Tier 1 (CET1) improved to 10.6% from 9.9% in the year ago quarter |
| • | Total dividends per common share of $0.12 were up 9% from the year ago quarter |
| • | Capital ratios remain strong with a CET1 ratio of 9.9% at quarter end |
SECOND QUARTER FINANCIAL RESULTS
Loans
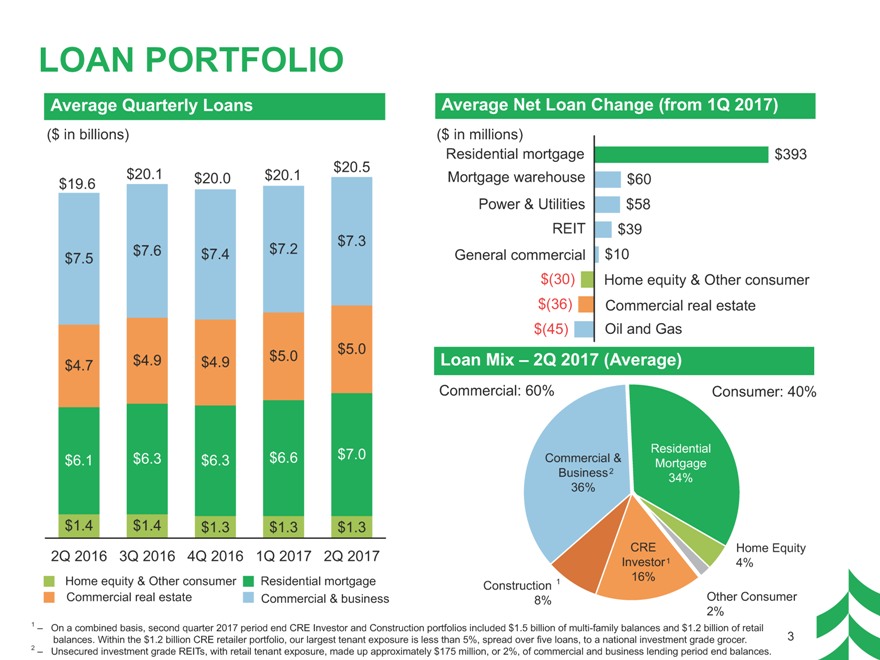
Year-to-date average loans were up over 5% from the first half of last year. Second quarter average loans of $20.5 billion were up 4%, or $880 million from the year ago quarter and were up $449 million from the first quarter.
With respect to second quarter average balances:
| • | Consumer lending increased 10%, or $723 million from the year ago quarter and grew $363 million from the first quarter to $8.2 billion, primarily driven by the Company’s on balance sheet mortgage retention strategy. |
| • | Commercial real estate lending increased 7%, or $310 million from the year ago quarter to $5.0 billion, primarily driven by increased construction lending, but decreased $36 million from the first quarter. |
| • | Commercial and business lending decreased 2% from the year ago quarter to $7.3 billion, primarily driven by reductions in the oil and gas portfolio, however, commercial and business lending increased $122 million from the first quarter. |
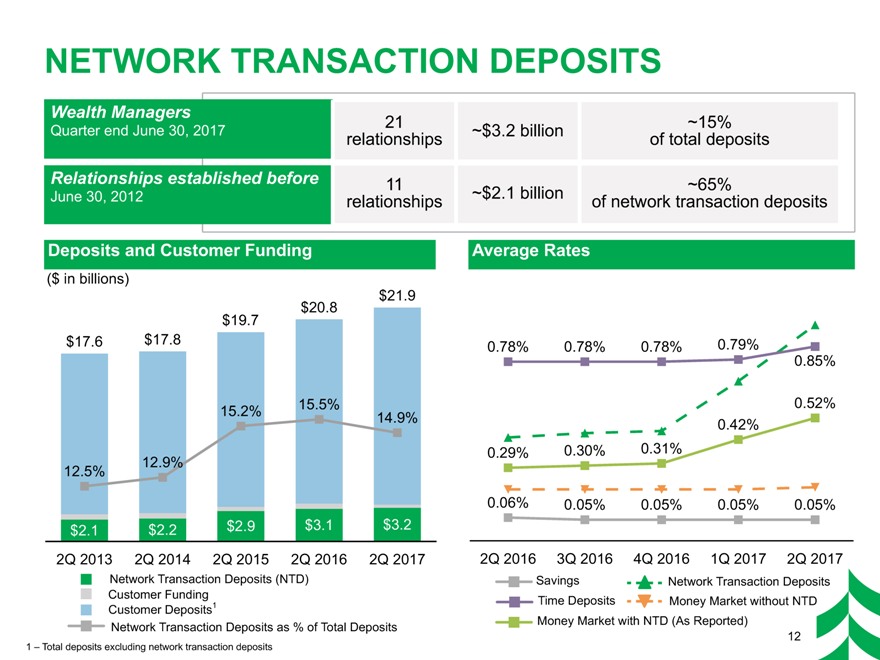
Deposits
Year-to-date average deposits were up over 5% from the first half of last year. Second quarter average deposits of $21.5 billion were up 6%, or $1.2 billion from the year ago quarter and were up modestly from the first quarter. The loan to deposit ratio was 96% at quarter-end.
With respect to second quarter average balances:
| • | Interest-bearing demand deposits increased 17%, or $632 million from the year ago quarter to $4.3 billion and increased $21 million from the first quarter. |
| • | Savings and time deposits increased 10%, or $308 million from the year ago quarter and increased $214 million from the first quarter to $3.3 billion. |
| • | Money market deposits increased 4%, or $372 million from the year ago quarter to $9.1 billion, but decreased $104 million from the first quarter. |
| • | Noninterest-bearing demand deposits decreased 2%, or $78 million from the year ago quarter and decreased $74 million from the first quarter to $4.9 billion, reflecting expected seasonal patterns. |
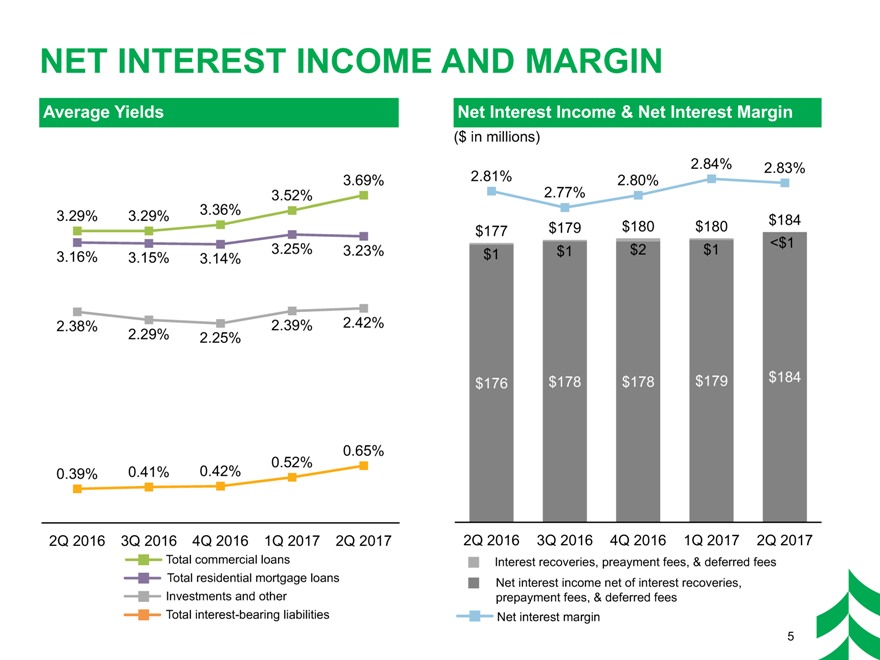
Net Interest Income and Net Interest Margin
Net interest income was up 4%, or $7 million from the year ago quarter, with net interest margin increasing 2 basis points year over year. Second quarter net interest income of $184 million was up 2%, or $4 million from the first quarter.
| • | The average yield on total loans increased 27 basis points to 3.62% from the year ago quarter and increased 11 basis points from the prior quarter. |
| • | The average cost of interest-bearing deposits increased 20 basis points to 0.51% from the year ago quarter and increased 9 basis points from the prior quarter. |
Noninterest Income
Second quarter total noninterest income of $82 million improved modestly from the year ago quarter and increased 3%, or $3 million from the prior quarter.
With respect to second quarter noninterest income line items:
| • | Card-based and other nondeposit fees were up $1 million from the year ago and prior quarters. |
| • | Mortgage banking was up $1 million from the year ago quarter primarily driven by a favorable change in the mortgage servicing rights valuation. |
| • | Combined, trust service fees and brokerage and annuity commissions were up over $1 million year over year and up from the first quarter. |
Noninterest Expense
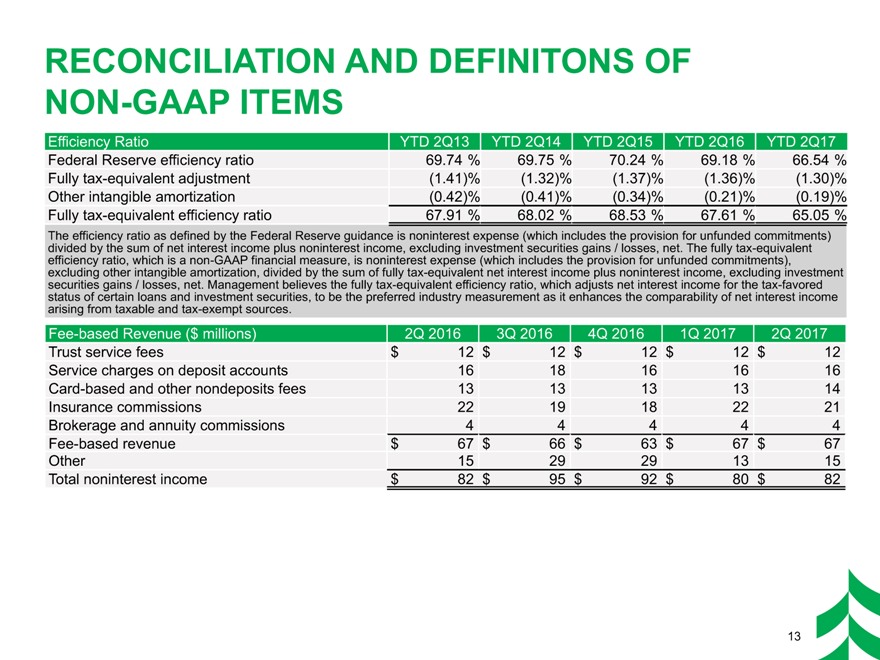
Second quarter total noninterest expense of $176 million was up $2 million, or 1% from the year ago quarter and up $3 million, or 2% from the prior quarter. The year-to-date efficiency ratio improved by over 200 basis points from the comparable period last year.
With respect to second quarter noninterest expense line items:
| • | Personnel expense was up $3 million from the year ago quarter primarily driven by increased health insurance costs. |
| • | Technology expense was up $1 million from the year ago and prior quarters as the Company continues to invest in solutions that drive operational efficiency. |
| • | All other noninterest expense line items, collectively, decreased $2 million from the year ago quarter and increased $2 million from the prior quarter. |
Taxes
Second quarter income tax expense was $20 million with an effective tax rate of 26%, compared to $21 million and 30% in the year ago quarter, and $21 million and 27% in the prior quarter. The second quarter’s lower effective tax rate benefited from a partial release of reserves due a favorable state tax court ruling.
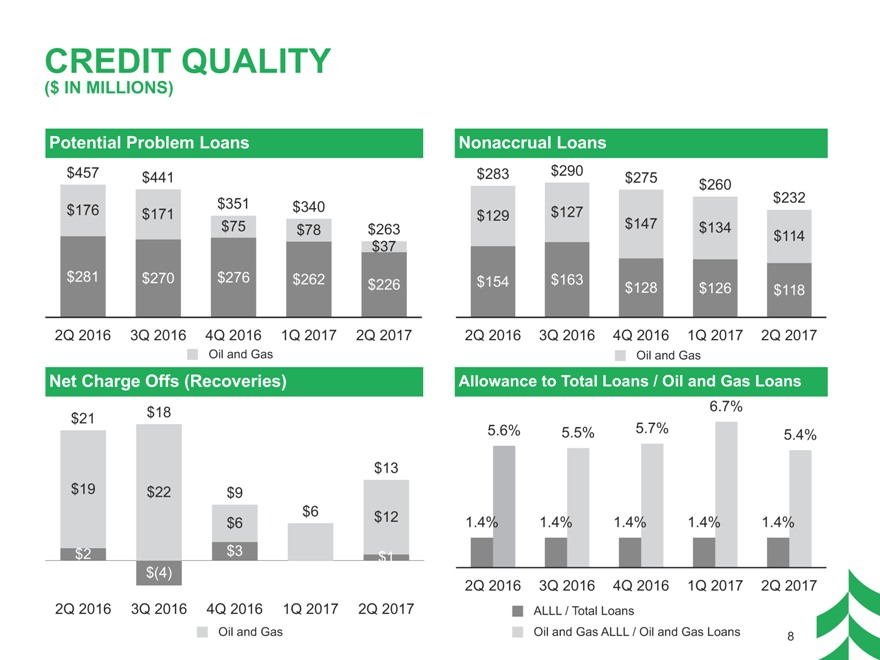
Credit
The second quarter provision for credit losses of $12 million was down $2 million from the year ago quarter, but up $3 million from the prior quarter.
| • | Potential problem loans of $263 million were down $194 million from the year ago quarter and down $77 million from the prior quarter. |
| • | Nonaccrual loans of $232 million were down $51 million from the year ago quarter and down $28 million from the prior quarter. The nonaccrual loans to total loans ratio improved to 1.12% in the second quarter, compared to 1.43% in the year ago quarter, and 1.29% in the prior quarter. |
| • | Second quarter net charge offs of $13 million were down $8 million from the year ago quarter and up $7 million from the prior quarter. |
| • | The allowance for loan losses of $281 million was up $13 million from the year ago quarter and was down $2 million from the prior quarter. The allowance for loan losses to total loans ratio was 1.35% in the second quarter and the year ago quarter compared to 1.40% in the prior quarter. |
| • | The allowance related to the oil and gas portfolio was $33 million at June 30, 2017 and represented 5.4% of total oil and gas loans. |
Capital
The Company’s capital position remains strong, with a CET1 ratio of 9.9% at June 30, 2017. The Company’s capital ratios continue to be in excess of the Basel III “well-capitalized” regulatory benchmarks on a fully phased in basis.
SECOND QUARTER 2017 EARNINGS RELEASE CONFERENCE CALL
The Company will host a conference call for investors and analysts at 4:00 p.m. Central Time (CT) today, July 20, 2017. Interested parties can access the live webcast of the call through the Investor Relations section of the Company’s website, http://investor.associatedbank.com. Parties may also dial into the call at 877-407-8037 (domestic) or 201-689-8037 (international) and request the Associated Banc-Corp second quarter 2017 earnings call. The second quarter 2017 financial tables with an accompanying slide presentation will be available on the Company’s website just prior to the call. An audio archive of the webcast will be available on the Company’s website approximately fifteen minutes after the call is over.
ABOUT ASSOCIATED BANC-CORP
Associated Banc-Corp (NYSE: ASB) has total assets of nearly $30 billion and is one of the top 50 publicly traded U.S. bank holding companies. Headquartered in Green Bay, Wisconsin, Associated is a leading Midwest banking franchise, offering a full range of financial products and services from over 200 banking locations serving more than 100 communities throughout Wisconsin, Illinois and Minnesota, and commercial financial services in Indiana, Michigan, Missouri, Ohio, and Texas. Associated Bank, N.A. is an Equal Housing Lender, Equal Opportunity Lender and Member FDIC. More information about Associated Banc-Corp is available at www.associatedbank.com.
FORWARD LOOKING STATEMENTS
Statements made in this document which are not purely historical are forward-looking statements, as defined in the Private Securities Litigation Reform Act of 1995. This includes any statements regarding management’s plans, objectives, or goals for future operations, products or services, and forecasts of its revenues, earnings, or other measures of performance. Such forward-looking statements may be identified by the use of words such as “believe,” “expect,” “anticipate,” “plan,” “estimate,” “should,” “will,” “intend,” “outlook,” or similar expressions. Forward-looking statements are based on current management expectations and, by their nature, are subject to risks and uncertainties. Actual results may differ materially from those contained in the forward-looking statements. Factors which may cause actual results to differ materially from those contained in such forward-looking statements include those identified in the Company’s most recent Form 10-K and subsequent SEC filings. Such factors are incorporated herein by reference.
NON-GAAP FINANCIAL MEASURES
This press release and related materials may contain references to measures which are not defined in generally accepted accounting principles (“GAAP”). Information concerning these non-GAAP financial measures can be found in the financial tables.
# # #
Associated Banc-Corp
Consolidated Balance Sheets (Unaudited)
| (In thousands) |
Jun 30, 2017 | Mar 31, 2017 | Seql Qtr $ Change |
Dec 31, 2016 | Sep 30, 2016 | Jun 30, 2016 | Comp Qtr $ Change |
|||||||||||||||||||||
| Assets |
||||||||||||||||||||||||||||
| Cash and due from banks |
$ | 396,677 | $ | 332,601 | $ | 64,076 | $ | 446,558 | $ | 356,047 | $ | 333,000 | $ | 63,677 | ||||||||||||||
| Interest-bearing deposits in other financial institutions |
126,232 | 337,167 | (210,935 | ) | 149,175 | 240,010 | 131,680 | (5,448 | ) | |||||||||||||||||||
| Federal funds sold and securities purchased under agreements to resell |
43,000 | 19,700 | 23,300 | 46,500 | 14,250 | 13,200 | 29,800 | |||||||||||||||||||||
| Investment securities held to maturity, at amortized cost |
2,255,395 | 1,554,843 | 700,552 | 1,273,536 | 1,253,494 | 1,236,140 | 1,019,255 | |||||||||||||||||||||
| Investment securities available for sale, at fair value |
3,687,470 | 4,300,490 | (613,020 | ) | 4,680,226 | 4,846,088 | 4,801,766 | (1,114,296 | ) | |||||||||||||||||||
| Federal Home Loan Bank and Federal Reserve Bank stocks, at cost |
181,180 | 139,273 | 41,907 | 140,001 | 140,215 | 194,501 | (13,321 | ) | ||||||||||||||||||||
| Residential loans held for sale(1) |
41,620 | 34,051 | 7,569 | 108,010 | 213,883 | 253,682 | (212,062 | ) | ||||||||||||||||||||
| Commercial loans held for sale |
4,772 | 2,901 | 1,871 | 12,474 | 16,912 | 30,694 | (25,922 | ) | ||||||||||||||||||||
| Loans |
20,783,069 | 20,147,683 | 635,386 | 20,054,716 | 19,844,005 | 19,815,286 | 967,783 | |||||||||||||||||||||
| Allowance for loan losses |
(281,101 | ) | (282,672 | ) | 1,571 | (278,335 | ) | (269,540 | ) | (267,780 | ) | (13,321 | ) | |||||||||||||||
|
|
|
|
|
|
|
|
|
|
|
|
|
|
|
|||||||||||||||
| Loans, net |
20,501,968 | 19,865,011 | 636,957 | 19,776,381 | 19,574,465 | 19,547,506 | 954,462 | |||||||||||||||||||||
| Premises and equipment, net |
328,404 | 332,884 | (4,480 | ) | 330,315 | 329,726 | 331,427 | (3,023 | ) | |||||||||||||||||||
| Goodwill |
972,006 | 972,006 | — | 971,951 | 971,951 | 971,951 | 55 | |||||||||||||||||||||
| Mortgage servicing rights, net |
59,395 | 60,702 | (1,307 | ) | 61,476 | 58,414 | 57,474 | 1,921 | ||||||||||||||||||||
| Other intangible assets, net |
14,530 | 15,026 | (496 | ) | 15,377 | 15,902 | 16,427 | (1,897 | ) | |||||||||||||||||||
| Trading assets |
48,576 | 49,306 | (730 | ) | 52,398 | 60,780 | 77,112 | (28,536 | ) | |||||||||||||||||||
| Other assets |
1,107,800 | 1,093,896 | 13,904 | 1,074,937 | 1,060,627 | 1,042,139 | 65,661 | |||||||||||||||||||||
|
|
|
|
|
|
|
|
|
|
|
|
|
|
|
|||||||||||||||
| Total assets |
$ | 29,769,025 | $ | 29,109,857 | $ | 659,168 | $ | 29,139,315 | $ | 29,152,764 | $ | 29,038,699 | $ | 730,326 | ||||||||||||||
|
|
|
|
|
|
|
|
|
|
|
|
|
|
|
|||||||||||||||
| Liabilities and Stockholders’ Equity |
||||||||||||||||||||||||||||
| Noninterest-bearing demand deposits |
$ | 5,038,162 | $ | 5,338,212 | $ | (300,050 | ) | $ | 5,392,208 | $ | 5,337,677 | $ | 5,039,336 | $ | (1,174 | ) | ||||||||||||
| Interest-bearing deposits |
16,580,018 | 16,489,823 | 90,195 | 16,496,240 | 16,410,035 | 15,253,514 | 1,326,504 | |||||||||||||||||||||
|
|
|
|
|
|
|
|
|
|
|
|
|
|
|
|||||||||||||||
| Total deposits |
21,618,180 | 21,828,035 | (209,855 | ) | 21,888,448 | 21,747,712 | 20,292,850 | 1,325,330 | ||||||||||||||||||||
| Federal funds purchased and securities sold under agreements to repurchase |
607,669 | 650,188 | (42,519 | ) | 508,347 | 698,772 | 509,150 | 98,519 | ||||||||||||||||||||
| Other short-term funding |
794,813 | 430,679 | 364,134 | 583,688 | 541,321 | 1,402,407 | (607,594 | ) | ||||||||||||||||||||
| Long-term funding |
3,262,120 | 2,761,955 | 500,165 | 2,761,795 | 2,761,635 | 3,511,475 | (249,355 | ) | ||||||||||||||||||||
| Trading liabilities |
47,143 | 47,561 | (418 | ) | 51,103 | 62,301 | 79,466 | (32,323 | ) | |||||||||||||||||||
| Accrued expenses and other liabilities |
247,598 | 246,645 | 953 | 254,622 | 243,908 | 213,204 | 34,394 | |||||||||||||||||||||
|
|
|
|
|
|
|
|
|
|
|
|
|
|
|
|||||||||||||||
| Total liabilities |
26,577,523 | 25,965,063 | 612,460 | 26,048,003 | 26,055,649 | 26,008,552 | 568,971 | |||||||||||||||||||||
| Stockholders’ Equity |
||||||||||||||||||||||||||||
| Preferred equity |
159,929 | 159,929 | — | 159,929 | 159,929 | 120,201 | 39,728 | |||||||||||||||||||||
| Common equity: |
||||||||||||||||||||||||||||
| Common stock |
1,630 | 1,630 | — | 1,630 | 1,630 | 1,630 | — | |||||||||||||||||||||
| Surplus |
1,474,301 | 1,469,744 | 4,557 | 1,459,498 | 1,459,161 | 1,453,285 | 21,016 | |||||||||||||||||||||
| Retained earnings |
1,747,632 | 1,709,514 | 38,118 | 1,695,764 | 1,662,778 | 1,629,915 | 117,717 | |||||||||||||||||||||
| Accumulated other comprehensive income (loss) |
(53,470 | ) | (56,344 | ) | 2,874 | (54,679 | ) | (1,254 | ) | 13,453 | (66,923 | ) | ||||||||||||||||
| Treasury stock, at cost |
(138,520 | ) | (139,679 | ) | 1,159 | (170,830 | ) | (185,129 | ) | (188,337 | ) | 49,817 | ||||||||||||||||
|
|
|
|
|
|
|
|
|
|
|
|
|
|
|
|||||||||||||||
| Total common equity |
3,031,573 | 2,984,865 | 46,708 | 2,931,383 | 2,937,186 | 2,909,946 | 121,627 | |||||||||||||||||||||
|
|
|
|
|
|
|
|
|
|
|
|
|
|
|
|||||||||||||||
| Total stockholders’ equity |
3,191,502 | 3,144,794 | 46,708 | 3,091,312 | 3,097,115 | 3,030,147 | 161,355 | |||||||||||||||||||||
|
|
|
|
|
|
|
|
|
|
|
|
|
|
|
|||||||||||||||
| Total liabilities and stockholders’ equity |
$ | 29,769,025 | $ | 29,109,857 | $ | 659,168 | $ | 29,139,315 | $ | 29,152,764 | $ | 29,038,699 | $ | 730,326 | ||||||||||||||
|
|
|
|
|
|
|
|
|
|
|
|
|
|
|
|||||||||||||||
| (1) | Effective January 1, 2017, residential loans originated for sale are accounted for under the fair value option. Prior periods have not been restated. |
Page 6
Associated Banc-Corp
Consolidated Statements of Income (Unaudited)
| Comp Qtr | YTD | YTD | Comp YTD | |||||||||||||||||||||||||||||
| (in thousands, except per share data) |
2Q17 | 2Q16 | $ Change | % Change | Jun 2017 | Jun 2016 | $ Change | % Change | ||||||||||||||||||||||||
| Interest Income |
||||||||||||||||||||||||||||||||
| Interest and fees on loans |
$ | 184,246 | $ | 163,059 | $ | 21,187 | 13 | % | $ | 357,895 | $ | 322,715 | $ | 35,180 | 11 | % | ||||||||||||||||
| Interest and dividends on investment securities: |
||||||||||||||||||||||||||||||||
| Taxable |
23,658 | 24,270 | (612 | ) | (3 | )% | 47,133 | 49,786 | (2,653 | ) | (5 | )% | ||||||||||||||||||||
| Tax-exempt |
8,143 | 7,894 | 249 | 3 | % | 16,272 | 15,724 | 548 | 3 | % | ||||||||||||||||||||||
| Other interest |
1,553 | 1,318 | 235 | 18 | % | 3,089 | 2,385 | 704 | 30 | % | ||||||||||||||||||||||
|
|
|
|
|
|
|
|
|
|
|
|
|
|||||||||||||||||||||
| Total interest income |
217,600 | 196,541 | 21,059 | 11 | % | 424,389 | 390,610 | 33,779 | 9 | % | ||||||||||||||||||||||
| Interest Expense |
||||||||||||||||||||||||||||||||
| Interest on deposits |
21,180 | 11,678 | 9,502 | 81 | % | 38,104 | 23,444 | 14,660 | 63 | % | ||||||||||||||||||||||
| Interest on Federal funds purchased and securities sold under agreements to repurchase |
824 | 378 | 446 | 118 | % | 1,339 | 674 | 665 | 99 | % | ||||||||||||||||||||||
| Interest on other short-term funding |
1,827 | 845 | 982 | 116 | % | 2,907 | 1,360 | 1,547 | 114 | % | ||||||||||||||||||||||
| Interest on long-term funding |
9,950 | 6,923 | 3,027 | 44 | % | 17,946 | 16,428 | 1,518 | 9 | % | ||||||||||||||||||||||
|
|
|
|
|
|
|
|
|
|
|
|
|
|||||||||||||||||||||
| Total interest expense |
33,781 | 19,824 | 13,957 | 70 | % | 60,296 | 41,906 | 18,390 | 44 | % | ||||||||||||||||||||||
|
|
|
|
|
|
|
|
|
|
|
|
|
|||||||||||||||||||||
| Net Interest Income |
183,819 | 176,717 | 7,102 | 4 | % | 364,093 | 348,704 | 15,389 | 4 | % | ||||||||||||||||||||||
| Provision for credit losses |
12,000 | 14,000 | (2,000 | ) | (14 | )% | 21,000 | 34,000 | (13,000 | ) | (38 | )% | ||||||||||||||||||||
|
|
|
|
|
|
|
|
|
|
|
|
|
|||||||||||||||||||||
| Net interest income after provision for credit losses |
171,819 | 162,717 | 9,102 | 6 | % | 343,093 | 314,704 | 28,389 | 9 | % | ||||||||||||||||||||||
| Noninterest Income |
||||||||||||||||||||||||||||||||
| Trust service fees |
12,346 | 11,509 | 837 | 7 | % | 24,281 | 22,956 | 1,325 | 6 | % | ||||||||||||||||||||||
| Service charges on deposit accounts |
16,030 | 16,444 | (414 | ) | (3 | )% | 32,386 | 32,717 | (331 | ) | (1 | )% | ||||||||||||||||||||
| Card-based and other nondeposit fees |
13,764 | 12,717 | 1,047 | 8 | % | 26,229 | 24,708 | 1,521 | 6 | % | ||||||||||||||||||||||
| Insurance commissions |
20,853 | 22,005 | (1,152 | ) | (5 | )% | 42,473 | 43,387 | (914 | ) | (2 | )% | ||||||||||||||||||||
| Brokerage and annuity commissions |
4,346 | 4,098 | 248 | 6 | % | 8,679 | 7,892 | 787 | 10 | % | ||||||||||||||||||||||
| Mortgage banking, net |
5,027 | 4,067 | 960 | 24 | % | 9,606 | 8,271 | 1,335 | 16 | % | ||||||||||||||||||||||
| Capital market fees, net |
4,042 | 3,793 | 249 | 7 | % | 7,925 | 7,331 | 594 | 8 | % | ||||||||||||||||||||||
| Bank owned life insurance income |
3,899 | 2,973 | 926 | 31 | % | 6,514 | 7,743 | (1,229 | ) | (16 | )% | |||||||||||||||||||||
| Asset gains (losses), net |
(466 | ) | (343 | ) | (123 | ) | 36 | % | (700 | ) | 181 | (881 | ) | N/M | ||||||||||||||||||
| Investment securities gains (losses), net |
356 | 3,116 | (2,760 | ) | (89 | )% | 356 | 6,214 | (5,858 | ) | (94 | )% | ||||||||||||||||||||
| Other |
2,213 | 1,789 | 424 | 24 | % | 4,492 | 3,960 | 532 | 13 | % | ||||||||||||||||||||||
|
|
|
|
|
|
|
|
|
|
|
|
|
|||||||||||||||||||||
| Total noninterest income |
82,410 | 82,168 | 242 | — | % | 162,241 | 165,360 | (3,119 | ) | (2 | )% | |||||||||||||||||||||
| Noninterest Expense |
||||||||||||||||||||||||||||||||
| Personnel expense |
104,683 | 102,129 | 2,554 | 3 | % | 209,102 | 203,527 | 5,575 | 3 | % | ||||||||||||||||||||||
| Occupancy |
12,832 | 13,215 | (383 | ) | (3 | )% | 28,051 | 27,017 | 1,034 | 4 | % | |||||||||||||||||||||
| Equipment |
5,234 | 5,396 | (162 | ) | (3 | )% | 10,719 | 10,842 | (123 | ) | (1 | )% | ||||||||||||||||||||
| Technology |
15,473 | 14,450 | 1,023 | 7 | % | 29,893 | 28,714 | 1,179 | 4 | % | ||||||||||||||||||||||
| Business development and advertising |
7,152 | 6,591 | 561 | 9 | % | 12,987 | 14,802 | (1,815 | ) | (12 | )% | |||||||||||||||||||||
| Other intangible amortization |
496 | 539 | (43 | ) | (8 | )% | 1,009 | 1,043 | (34 | ) | (3 | )% | ||||||||||||||||||||
| Loan expense |
2,974 | 3,442 | (468 | ) | (14 | )% | 5,594 | 6,663 | (1,069 | ) | (16 | )% | ||||||||||||||||||||
| Legal and professional fees |
5,711 | 4,856 | 855 | 18 | % | 9,877 | 9,881 | (4 | ) | — | % | |||||||||||||||||||||
| Foreclosure / OREO expense, net |
1,182 | 1,330 | (148 | ) | (11 | )% | 2,687 | 3,207 | (520 | ) | (16 | )% | ||||||||||||||||||||
| FDIC expense |
8,000 | 8,750 | (750 | ) | (9 | )% | 16,000 | 16,500 | (500 | ) | (3 | )% | ||||||||||||||||||||
| Other |
12,579 | 13,662 | (1,083 | ) | (8 | )% | 24,088 | 26,135 | (2,047 | ) | (8 | )% | ||||||||||||||||||||
|
|
|
|
|
|
|
|
|
|
|
|
|
|||||||||||||||||||||
| Total noninterest expense |
176,316 | 174,360 | 1,956 | 1 | % | 350,007 | 348,331 | 1,676 | — | % | ||||||||||||||||||||||
|
|
|
|
|
|
|
|
|
|
|
|
|
|||||||||||||||||||||
| Income before income taxes |
77,913 | 70,525 | 7,388 | 10 | % | 155,327 | 131,733 | 23,594 | 18 | % | ||||||||||||||||||||||
| Income tax expense |
19,930 | 21,434 | (1,504 | ) | (7 | )% | 41,074 | 40,108 | 966 | 2 | % | |||||||||||||||||||||
|
|
|
|
|
|
|
|
|
|
|
|
|
|||||||||||||||||||||
| Net income |
57,983 | 49,091 | 8,892 | 18 | % | 114,253 | 91,625 | 22,628 | 25 | % | ||||||||||||||||||||||
| Preferred stock dividends |
2,339 | 2,169 | 170 | 8 | % | 4,669 | 4,367 | 302 | 7 | % | ||||||||||||||||||||||
|
|
|
|
|
|
|
|
|
|
|
|
|
|||||||||||||||||||||
| Net income available to common equity |
$ | 55,644 | $ | 46,922 | $ | 8,722 | 19 | % | $ | 109,584 | $ | 87,258 | $ | 22,326 | 26 | % | ||||||||||||||||
|
|
|
|
|
|
|
|
|
|
|
|
|
|||||||||||||||||||||
| Earnings Per Common Share: |
||||||||||||||||||||||||||||||||
| Basic |
$ | 0.36 | $ | 0.31 | $ | 0.05 | 16 | % | $ | 0.72 | $ | 0.58 | $ | 0.14 | 24 | % | ||||||||||||||||
| Diluted |
$ | 0.36 | $ | 0.31 | $ | 0.05 | 16 | % | $ | 0.71 | $ | 0.58 | $ | 0.13 | 22 | % | ||||||||||||||||
| Average Common Shares Outstanding: |
||||||||||||||||||||||||||||||||
| Basic |
151,573 | 148,511 | 3,062 | 2 | % | 151,196 | 148,556 | 2,640 | 2 | % | ||||||||||||||||||||||
| Diluted |
154,302 | 149,530 | 4,772 | 3 | % | 154,147 | 149,518 | 4,629 | 3 | % | ||||||||||||||||||||||
| N/M - Not meaningful |
||||||||||||||||||||||||||||||||
Page 7
Associated Banc-Corp
Consolidated Statements of Income (Unaudited)—Quarterly Trend
| Seql Qtr | Comp Qtr | |||||||||||||||||||||||||||||||||||
| (In thousands, except per share data) |
2Q17 | 1Q17 | $ Change | % Change | 4Q16 | 3Q16 | 2Q16 | $ Change | % Change | |||||||||||||||||||||||||||
| Interest Income |
||||||||||||||||||||||||||||||||||||
| Interest and fees on loans |
$ | 184,246 | $ | 173,649 | $ | 10,597 | 6 | % | $ | 169,473 | $ | 167,350 | $ | 163,059 | $ | 21,187 | 13 | % | ||||||||||||||||||
| Interest and dividends on investment securities: |
||||||||||||||||||||||||||||||||||||
| Taxable |
23,658 | 23,475 | 183 | 1 | % | 22,418 | 22,948 | 24,270 | (612 | ) | (3 | )% | ||||||||||||||||||||||||
| Tax-exempt |
8,143 | 8,129 | 14 | — | % | 8,184 | 8,141 | 7,894 | 249 | 3 | % | |||||||||||||||||||||||||
| Other interest |
1,553 | 1,536 | 17 | 1 | % | 1,380 | 1,064 | 1,318 | 235 | 18 | % | |||||||||||||||||||||||||
|
|
|
|
|
|
|
|
|
|
|
|
|
|
|
|||||||||||||||||||||||
| Total interest income |
217,600 | 206,789 | 10,811 | 5 | % | 201,455 | 199,503 | 196,541 | 21,059 | 11 | % | |||||||||||||||||||||||||
| Interest Expense |
||||||||||||||||||||||||||||||||||||
| Interest on deposits |
21,180 | 16,924 | 4,256 | 25 | % | 13,773 | 13,118 | 11,678 | 9,502 | 81 | % | |||||||||||||||||||||||||
| Interest on Federal funds purchased and securities sold under agreements to repurchase |
824 | 515 | 309 | 60 | % | 314 | 326 | 378 | 446 | 118 | % | |||||||||||||||||||||||||
| Interest on other short-term funding |
1,827 | 1,080 | 747 | 69 | % | 458 | 296 | 845 | 982 | 116 | % | |||||||||||||||||||||||||
| Interest on long-term funding |
9,950 | 7,996 | 1,954 | 24 | % | 6,875 | 7,229 | 6,923 | 3,027 | 44 | % | |||||||||||||||||||||||||
|
|
|
|
|
|
|
|
|
|
|
|
|
|
|
|||||||||||||||||||||||
| Total interest expense |
33,781 | 26,515 | 7,266 | 27 | % | 21,420 | 20,969 | 19,824 | 13,957 | 70 | % | |||||||||||||||||||||||||
|
|
|
|
|
|
|
|
|
|
|
|
|
|
|
|||||||||||||||||||||||
| Net Interest Income |
183,819 | 180,274 | 3,545 | 2 | % | 180,035 | 178,534 | 176,717 | 7,102 | 4 | % | |||||||||||||||||||||||||
| Provision for credit losses |
12,000 | 9,000 | 3,000 | 33 | % | 15,000 | 21,000 | 14,000 | (2,000 | ) | (14 | )% | ||||||||||||||||||||||||
|
|
|
|
|
|
|
|
|
|
|
|
|
|
|
|||||||||||||||||||||||
| Net interest income after provision for credit losses |
171,819 | 171,274 | 545 | — | % | 165,035 | 157,534 | 162,717 | 9,102 | 6 | % | |||||||||||||||||||||||||
| Noninterest Income |
||||||||||||||||||||||||||||||||||||
| Trust service fees |
12,346 | 11,935 | 411 | 3 | % | 12,211 | 11,700 | 11,509 | 837 | 7 | % | |||||||||||||||||||||||||
| Service charges on deposit accounts |
16,030 | 16,356 | (326 | ) | (2 | )% | 16,447 | 17,445 | 16,444 | (414 | ) | (3 | )% | |||||||||||||||||||||||
| Card-based and other nondeposit fees |
13,764 | 12,465 | 1,299 | 10 | % | 12,592 | 12,777 | 12,717 | 1,047 | 8 | % | |||||||||||||||||||||||||
| Insurance commissions |
20,853 | 21,620 | (767 | ) | (4 | )% | 17,977 | 19,431 | 22,005 | (1,152 | ) | (5 | )% | |||||||||||||||||||||||
| Brokerage and annuity commissions |
4,346 | 4,333 | 13 | — | % | 4,188 | 4,155 | 4,098 | 248 | 6 | % | |||||||||||||||||||||||||
| Mortgage banking, net |
5,027 | 4,579 | 448 | 10 | % | 11,559 | 18,291 | 4,067 | 960 | 24 | % | |||||||||||||||||||||||||
| Capital market fees, net |
4,042 | 3,883 | 159 | 4 | % | 7,716 | 7,012 | 3,793 | 249 | 7 | % | |||||||||||||||||||||||||
| Bank owned life insurance income |
3,899 | 2,615 | 1,284 | 49 | % | 3,338 | 3,290 | 2,973 | 926 | 31 | % | |||||||||||||||||||||||||
| Asset gains (losses), net |
(466 | ) | (234 | ) | (232 | ) | 99 | % | 767 | (1,034 | ) | (343 | ) | (123 | ) | 36 | % | |||||||||||||||||||
| Investment securities gains (losses), net |
356 | — | 356 | N/M | 3,115 | (13 | ) | 3,116 | (2,760 | ) | (89 | )% | ||||||||||||||||||||||||
| Other |
2,213 | 2,279 | (66 | ) | (3 | )% | 2,379 | 2,180 | 1,789 | 424 | 24 | % | ||||||||||||||||||||||||
|
|
|
|
|
|
|
|
|
|
|
|
|
|
|
|||||||||||||||||||||||
| Total noninterest income |
82,410 | 79,831 | 2,579 | 3 | % | 92,289 | 95,234 | 82,168 | 242 | — | % | |||||||||||||||||||||||||
| Noninterest Expense |
||||||||||||||||||||||||||||||||||||
| Personnel expense |
104,683 | 104,419 | 264 | — | % | 107,491 | 103,819 | 102,129 | 2,554 | 3 | % | |||||||||||||||||||||||||
| Occupancy |
12,832 | 15,219 | (2,387 | ) | (16 | )% | 13,690 | 15,362 | 13,215 | (383 | ) | (3 | )% | |||||||||||||||||||||||
| Equipment |
5,234 | 5,485 | (251 | ) | (5 | )% | 5,328 | 5,319 | 5,396 | (162 | ) | (3 | )% | |||||||||||||||||||||||
| Technology |
15,473 | 14,420 | 1,053 | 7 | % | 14,413 | 14,173 | 14,450 | 1,023 | 7 | % | |||||||||||||||||||||||||
| Business development and advertising |
7,152 | 5,835 | 1,317 | 23 | % | 6,298 | 5,251 | 6,591 | 561 | 9 | % | |||||||||||||||||||||||||
| Other intangible amortization |
496 | 513 | (17 | ) | (3 | )% | 525 | 525 | 539 | (43 | ) | (8 | )% | |||||||||||||||||||||||
| Loan expense |
2,974 | 2,620 | 354 | 14 | % | 3,443 | 3,535 | 3,442 | (468 | ) | (14 | )% | ||||||||||||||||||||||||
| Legal and professional fees |
5,711 | 4,166 | 1,545 | 37 | % | 5,184 | 4,804 | 4,856 | 855 | 18 | % | |||||||||||||||||||||||||
| Foreclosure / OREO expense, net |
1,182 | 1,505 | (323 | ) | (21 | )% | 677 | 960 | 1,330 | (148 | ) | (11 | )% | |||||||||||||||||||||||
| FDIC expense |
8,000 | 8,000 | — | — | % | 9,250 | 9,000 | 8,750 | (750 | ) | (9 | )% | ||||||||||||||||||||||||
| Other |
12,579 | 11,509 | 1,070 | 9 | % | 12,616 | 12,566 | 13,662 | (1,083 | ) | (8 | )% | ||||||||||||||||||||||||
|
|
|
|
|
|
|
|
|
|
|
|
|
|
|
|||||||||||||||||||||||
| Total noninterest expense |
176,316 | 173,691 | 2,625 | 2 | % | 178,915 | 175,314 | 174,360 | 1,956 | 1 | % | |||||||||||||||||||||||||
|
|
|
|
|
|
|
|
|
|
|
|
|
|
|
|||||||||||||||||||||||
| Income before income taxes |
77,913 | 77,414 | 499 | 1 | % | 78,409 | 77,454 | 70,525 | 7,388 | 10 | % | |||||||||||||||||||||||||
| Income tax expense |
19,930 | 21,144 | (1,214 | ) | (6 | )% | 23,576 | 23,638 | 21,434 | (1,504 | ) | (7 | )% | |||||||||||||||||||||||
|
|
|
|
|
|
|
|
|
|
|
|
|
|
|
|||||||||||||||||||||||
| Net income |
57,983 | 56,270 | 1,713 | 3 | % | 54,833 | 53,816 | 49,091 | 8,892 | 18 | % | |||||||||||||||||||||||||
| Preferred stock dividends |
2,339 | 2,330 | 9 | — | % | 2,348 | 2,188 | 2,169 | 170 | 8 | % | |||||||||||||||||||||||||
|
|
|
|
|
|
|
|
|
|
|
|
|
|
|
|||||||||||||||||||||||
| Net income available to common equity |
$ | 55,644 | $ | 53,940 | $ | 1,704 | 3 | % | $ | 52,485 | $ | 51,628 | $ | 46,922 | $ | 8,722 | 19 | % | ||||||||||||||||||
|
|
|
|
|
|
|
|
|
|
|
|
|
|
|
|||||||||||||||||||||||
| Earnings Per Common Share: |
||||||||||||||||||||||||||||||||||||
| Basic |
$ | 0.36 | $ | 0.36 | $ | — | — | % | $ | 0.35 | $ | 0.34 | $ | 0.31 | $ | 0.05 | 16 | % | ||||||||||||||||||
| Diluted |
$ | 0.36 | $ | 0.35 | $ | 0.01 | 3 | % | $ | 0.34 | $ | 0.34 | $ | 0.31 | $ | 0.05 | 16 | % | ||||||||||||||||||
| Average Common Shares Outstanding: |
||||||||||||||||||||||||||||||||||||
| Basic |
151,573 | 150,815 | 758 | 1 | % | 149,253 | 148,708 | 148,511 | 3,062 | 2 | % | |||||||||||||||||||||||||
| Diluted |
154,302 | 153,869 | 433 | — | % | 151,563 | 149,973 | 149,530 | 4,772 | 3 | % | |||||||||||||||||||||||||
| N/M - Not meaningful |
||||||||||||||||||||||||||||||||||||
Page 8
Associated Banc-Corp
Selected Quarterly Information
| ($ in millions, except share and per share, full time equivalent employee data and branch count) |
YTD Jun 2017 |
YTD Jun 2016 |
2Q17 | 1Q17 | 4Q16 | 3Q16 | 2Q16 | |||||||||||||||||||||
| Per Common Share Data |
||||||||||||||||||||||||||||
| Dividends |
$ | 0.24 | $ | 0.22 | $ | 0.12 | $ | 0.12 | $ | 0.12 | $ | 0.11 | $ | 0.11 | ||||||||||||||
| Market value: |
||||||||||||||||||||||||||||
| High |
26.50 | 18.84 | 25.50 | 26.50 | 25.15 | 19.91 | 18.84 | |||||||||||||||||||||
| Low |
23.25 | 15.48 | 23.25 | 23.40 | 19.05 | 16.49 | 15.84 | |||||||||||||||||||||
| Close |
25.20 | 17.15 | 25.20 | 24.40 | 24.70 | 19.59 | 17.15 | |||||||||||||||||||||
| Book value |
19.70 | 19.27 | 19.70 | 19.42 | 19.27 | 19.42 | 19.27 | |||||||||||||||||||||
| Tangible book value / share |
$ | 13.29 | $ | 12.72 | $ | 13.29 | $ | 13.00 | $ | 12.78 | $ | 12.89 | $ | 12.72 | ||||||||||||||
|
|
|
|
|
|
|
|
|
|
|
|
|
|
|
|||||||||||||||
| Performance Ratios (Annualized) |
||||||||||||||||||||||||||||
| Return on average assets |
0.79 | % | 0.66 | % | 0.80 | % | 0.79 | % | 0.75 | % | 0.74 | % | 0.69 | % | ||||||||||||||
| Effective tax rate |
26.44 | % | 30.45 | % | 25.58 | % | 27.31 | % | 30.07 | % | 30.52 | % | 30.39 | % | ||||||||||||||
| Dividend payout ratio(1) |
33.33 | % | 37.93 | % | 32.43 | % | 33.33 | % | 34.29 | % | 32.35 | % | 35.48 | % | ||||||||||||||
| Net interest margin |
2.83 | % | 2.81 | % | 2.83 | % | 2.84 | % | 2.80 | % | 2.77 | % | 2.81 | % | ||||||||||||||
|
|
|
|
|
|
|
|
|
|
|
|
|
|
|
|||||||||||||||
| Selected Trend Information |
||||||||||||||||||||||||||||
| Average full time equivalent employees |
4,361 | 4,394 | 4,352 | 4,370 | 4,439 | 4,477 | 4,415 | |||||||||||||||||||||
| Branch count |
214 | 215 | 217 | 217 | 215 | |||||||||||||||||||||||
| Trust assets under management, at market value |
$ | 8,997 | $ | 8,716 | $ | 8,302 | $ | 8,179 | $ | 7,944 | ||||||||||||||||||
| Mortgage loans originated for sale during period |
$ | 220 | $ | 518 | $ | 119 | $ | 101 | $ | 287 | $ | 466 | $ | 324 | ||||||||||||||
| Mortgage loan settlements during period |
$ | 364 | $ | 492 | $ | 167 | $ | 197 | $ | 396 | $ | 655 | $ | 270 | ||||||||||||||
| Mortgage portfolio serviced for others |
$ | 7,768 | $ | 7,909 | $ | 7,975 | $ | 8,011 | $ | 7,776 | ||||||||||||||||||
| Mortgage servicing rights, net / mortgage portfolio serviced for others |
0.76 | % | 0.77 | % | 0.77 | % | 0.73 | % | 0.74 | % | ||||||||||||||||||
| Shares outstanding, end of period |
153,848 | 153,734 | 152,121 | 151,243 | 151,036 | |||||||||||||||||||||||
|
|
|
|
|
|
|
|
|
|
|
|||||||||||||||||||
| Selected Quarterly Ratios |
||||||||||||||||||||||||||||
| Loans / deposits |
96.14 | % | 92.30 | % | 91.62 | % | 91.25 | % | 97.65 | % | ||||||||||||||||||
| Stockholders’ equity / assets |
10.72 | % | 10.80 | % | 10.61 | % | 10.62 | % | 10.43 | % | ||||||||||||||||||
|
|
|
|
|
|
|
|
|
|
|
|||||||||||||||||||
| Risk-based Capital (2) (3) |
||||||||||||||||||||||||||||
| Total risk-weighted assets |
$ | 21,590 | $ | 21,129 | $ | 21,341 | $ | 21,265 | $ | 21,168 | ||||||||||||||||||
| Common equity Tier 1 |
$ | 2,130 | $ | 2,085 | $ | 2,033 | $ | 1,984 | $ | 1,941 | ||||||||||||||||||
| Common equity Tier 1 capital ratio |
9.87 | % | 9.87 | % | 9.52 | % | 9.33 | % | 9.17 | % | ||||||||||||||||||
| Tier 1 capital ratio |
10.61 | % | 10.62 | % | 10.27 | % | 10.08 | % | 9.73 | % | ||||||||||||||||||
| Total capital ratio |
13.01 | % | 13.05 | % | 12.68 | % | 12.49 | % | 12.16 | % | ||||||||||||||||||
| Tier 1 leverage ratio |
8.09 | % | 8.05 | % | 7.83 | % | 7.64 | % | 7.43 | % | ||||||||||||||||||
|
|
|
|
|
|
|
|
|
|
|
|||||||||||||||||||
| (1) | Ratio is based upon basic earnings per common share. |
| (2) | The Federal Reserve establishes regulatory capital requirements, including well-capitalized standards for the Corporation. The regulatory capital requirements effective for the Corporation follow Basel III, subject to certain transition provisions. |
| (3) | June 30, 2017 data is estimated. |
Page 9
Associated Banc-Corp
Selected Asset Quality Information
| (In thousands) | Jun 30, 2017 | Mar 31, 2017 | Seql Qtr % Change |
Dec 31, 2016 | Sep 30, 2016 | Jun 30, 2016 | Comp Qtr % Change |
|||||||||||||||||||||
| Allowance for Loan Losses |
||||||||||||||||||||||||||||
| Balance at beginning of period |
$ | 282,672 | $ | 278,335 | 2 | % | $ | 269,540 | $ | 267,780 | $ | 277,370 | 2 | % | ||||||||||||||
| Provision for loan losses |
11,000 | 10,000 | 10 | % | 18,000 | 20,000 | 11,000 | — | % | |||||||||||||||||||
| Charge offs |
(15,376 | ) | (11,854 | ) | 30 | % | (11,609 | ) | (28,964 | ) | (24,621 | ) | (38 | )% | ||||||||||||||
| Recoveries |
2,805 | 6,191 | (55 | )% | 2,404 | 10,724 | 4,031 | (30 | )% | |||||||||||||||||||
|
|
|
|
|
|
|
|
|
|
|
|||||||||||||||||||
| Net charge offs |
(12,571 | ) | (5,663 | ) | 122 | % | (9,205 | ) | (18,240 | ) | (20,590 | ) | (39 | )% | ||||||||||||||
|
|
|
|
|
|
|
|
|
|
|
|||||||||||||||||||
| Balance at end of period |
$ | 281,101 | $ | 282,672 | (1 | )% | $ | 278,335 | $ | 269,540 | $ | 267,780 | 5 | % | ||||||||||||||
|
|
|
|
|
|
|
|
|
|
|
|||||||||||||||||||
| Allowance for Unfunded Commitments |
||||||||||||||||||||||||||||
| Balance at beginning of period |
$ | 24,400 | $ | 25,400 | (4 | )% | $ | 28,400 | $ | 27,400 | $ | 24,400 | — | % | ||||||||||||||
| Provision for unfunded commitments |
1,000 | (1,000 | ) | (200 | )% | (3,000 | ) | 1,000 | 3,000 | (67 | )% | |||||||||||||||||
|
|
|
|
|
|
|
|
|
|
|
|||||||||||||||||||
| Balance at end of period |
$ | 25,400 | $ | 24,400 | 4 | % | $ | 25,400 | $ | 28,400 | $ | 27,400 | (7 | )% | ||||||||||||||
|
|
|
|
|
|
|
|
|
|
|
|||||||||||||||||||
| Allowance for credit losses |
$ | 306,501 | $ | 307,072 | — | % | $ | 303,735 | $ | 297,940 | $ | 295,180 | 4 | % | ||||||||||||||
|
|
|
|
|
|
|
|
|
|
|
|||||||||||||||||||
| Provision for credit losses |
$ | 12,000 | $ | 9,000 | 33 | % | $ | 15,000 | $ | 21,000 | $ | 14,000 | (14 | )% | ||||||||||||||
|
|
|
|
|
|
|
|
|
|
|
|||||||||||||||||||
| Net Charge Offs | Jun 30, 2017 | Mar 31, 2017 | Seql Qtr % Change |
Dec 31, 2016 | Sep 30, 2016 | Jun 30, 2016 | Comp Qtr % Change |
|||||||||||||||||||||
| Commercial and industrial |
$ | (11,046 | ) | $ | (4,368 | ) | 153 | % | $ | (6,566 | ) | $ | (16,407 | ) | $ | (18,564 | ) | (40 | )% | |||||||||
| Commercial real estate—owner occupied |
43 | 19 | 126 | % | (221 | ) | (154 | ) | (20 | ) | N/M | |||||||||||||||||
|
|
|
|
|
|
|
|
|
|
|
|||||||||||||||||||
| Commercial and business lending |
(11,003 | ) | (4,349 | ) | 153 | % | (6,787 | ) | (16,561 | ) | (18,584 | ) | (41 | )% | ||||||||||||||
| Commercial real estate—investor |
(126 | ) | (514 | ) | (75 | )% | 5 | (564 | ) | (560 | ) | (78 | )% | |||||||||||||||
| Real estate construction |
(26 | ) | 11 | N/M | (86 | ) | (22 | ) | (219 | ) | (88 | )% | ||||||||||||||||
|
|
|
|
|
|
|
|
|
|
|
|||||||||||||||||||
| Commercial real estate lending |
(152 | ) | (503 | ) | (70 | )% | (81 | ) | (586 | ) | (779 | ) | (80 | )% | ||||||||||||||
|
|
|
|
|
|
|
|
|
|
|
|||||||||||||||||||
| Total commercial |
(11,155 | ) | (4,852 | ) | 130 | % | (6,868 | ) | (17,147 | ) | (19,363 | ) | (42 | )% | ||||||||||||||
| Residential mortgage |
(564 | ) | (128 | ) | N/M | (1,048 | ) | (540 | ) | (757 | ) | (25 | )% | |||||||||||||||
| Home equity |
54 | 173 | (69 | )% | (491 | ) | 125 | 317 | (83 | )% | ||||||||||||||||||
| Other consumer |
(906 | ) | (856 | ) | 6 | % | (798 | ) | (678 | ) | (787 | ) | 15 | % | ||||||||||||||
|
|
|
|
|
|
|
|
|
|
|
|||||||||||||||||||
| Total consumer |
(1,416 | ) | (811 | ) | 75 | % | (2,337 | ) | (1,093 | ) | (1,227 | ) | 15 | % | ||||||||||||||
|
|
|
|
|
|
|
|
|
|
|
|||||||||||||||||||
| Total net charge offs |
$ | (12,571 | ) | $ | (5,663 | ) | 122 | % | $ | (9,205 | ) | $ | (18,240 | ) | $ | (20,590 | ) | (39 | )% | |||||||||
|
|
|
|
|
|
|
|
|
|
|
|||||||||||||||||||
| Net Charge Offs to Average Loans (in basis points)* | Jun 30, 2017 | Mar 31, 2017 | Dec 31, 2016 | Sep 30, 2016 | Jun 30, 2016 | |||||||||||||||||||||||
| Commercial and industrial |
(69 | ) | (28 | ) | (40 | ) | (98 | ) | (114 | ) | ||||||||||||||||||
| Commercial real estate—owner occupied |
2 | 1 | (10 | ) | (7 | ) | (1 | ) | ||||||||||||||||||||
|
|
|
|
|
|
|
|
|
|
|
|||||||||||||||||||
| Commercial and business lending |
(60 | ) | (24 | ) | (36 | ) | (87 | ) | (100 | ) | ||||||||||||||||||
| Commercial real estate—investor |
(2 | ) | (6 | ) | N/M | (6 | ) | (7 | ) | |||||||||||||||||||
| Real estate construction |
(1 | ) | N/M | (3 | ) | (1 | ) | (7 | ) | |||||||||||||||||||
|
|
|
|
|
|
|
|
|
|
|
|||||||||||||||||||
| Commercial real estate lending |
(1 | ) | (4 | ) | (1 | ) | (5 | ) | (7 | ) | ||||||||||||||||||
|
|
|
|
|
|
|
|
|
|
|
|||||||||||||||||||
| Total commercial |
(36 | ) | (16 | ) | (22 | ) | (55 | ) | (64 | ) | ||||||||||||||||||
| Residential mortgage |
(3 | ) | (1 | ) | (7 | ) | (3 | ) | (5 | ) | ||||||||||||||||||
| Home equity |
2 | 8 | (21 | ) | 5 | 13 | ||||||||||||||||||||||
| Other consumer |
(98 | ) | (90 | ) | (80 | ) | (67 | ) | (78 | ) | ||||||||||||||||||
|
|
|
|
|
|
|
|
|
|
|
|||||||||||||||||||
| Total consumer |
(7 | ) | (4 | ) | (12 | ) | (6 | ) | (7 | ) | ||||||||||||||||||
|
|
|
|
|
|
|
|
|
|
|
|||||||||||||||||||
| Total net charge offs |
(25 | ) | (11 | ) | (18 | ) | (36 | ) | (42 | ) | ||||||||||||||||||
|
|
|
|
|
|
|
|
|
|
|
|||||||||||||||||||
| Credit Quality | Jun 30, 2017 | Mar 31, 2017 | Seql Qtr % Change |
Dec 31, 2016 | Sep 30, 2016 | Jun 30, 2016 | Comp Qtr % Change |
|||||||||||||||||||||
| Nonaccrual loans |
$ | 231,888 | $ | 259,991 | (11 | )% | $ | 275,303 | $ | 289,911 | $ | 282,602 | (18 | )% | ||||||||||||||
| Other real estate owned (OREO) |
7,782 | 7,540 | 3 | % | 10,274 | 14,499 | 13,669 | (43 | )% | |||||||||||||||||||
| Other nonperforming assets |
7,418 | 7,418 | — | % | 7,418 | — | — | N/M | ||||||||||||||||||||
|
|
|
|
|
|
|
|
|
|
|
|||||||||||||||||||
| Total nonperforming assets |
$ | 247,088 | $ | 274,949 | (10 | )% | $ | 292,995 | $ | 304,410 | $ | 296,271 | (17 | )% | ||||||||||||||
|
|
|
|
|
|
|
|
|
|
|
|||||||||||||||||||
| Loans 90 or more days past due and still accruing |
$ | 1,535 | $ | 1,720 | (11 | )% | $ | 1,613 | $ | 1,511 | $ | 1,494 | 3 | % | ||||||||||||||
| Allowance for loan losses to loans |
1.35 | % | 1.40 | % | 1.39 | % | 1.36 | % | 1.35 | % | ||||||||||||||||||
| Allowance for loan losses to nonaccrual loans |
121.22 | % | 108.72 | % | 101.10 | % | 92.97 | % | 94.76 | % | ||||||||||||||||||
| Nonaccrual loans to total loans |
1.12 | % | 1.29 | % | 1.37 | % | 1.46 | % | 1.43 | % | ||||||||||||||||||
| Nonperforming assets to total loans plus OREO |
1.19 | % | 1.36 | % | 1.46 | % | 1.53 | % | 1.49 | % | ||||||||||||||||||
| Nonperforming assets to total assets |
0.83 | % | 0.94 | % | 1.01 | % | 1.04 | % | 1.02 | % | ||||||||||||||||||
| Year-to-date net charge offs to average loans * |
0.18 | % | 0.11 | % | 0.33 | % | 0.38 | % | 0.39 | % | ||||||||||||||||||
| * | Annualized |
N/M = Not meaningful
Page 10
Associated Banc-Corp
Selected Asset Quality Information (continued)
| (in thousands) | Jun 30, 2017 | Mar 31, 2017 | Seql Qtr % Change |
Dec 31, 2016 | Sep 30, 2016 | Jun 30, 2016 | Comp Qtr % Change |
|||||||||||||||||||||
| Nonaccrual loans |
||||||||||||||||||||||||||||
| Commercial and industrial |
$ | 141,475 | $ | 164,891 | (14 | )% | $ | 183,371 | $ | 205,902 | $ | 193,439 | (27 | )% | ||||||||||||||
| Commercial real estate—owner occupied |
15,800 | 17,925 | (12 | )% | 9,544 | 6,995 | 9,635 | 64 | % | |||||||||||||||||||
|
|
|
|
|
|
|
|
|
|
|
|||||||||||||||||||
| Commercial and business lending |
157,275 | 182,816 | (14 | )% | 192,915 | 212,897 | 203,074 | (23 | )% | |||||||||||||||||||
| Commercial real estate—investor |
7,206 | 8,273 | (13 | )% | 18,051 | 8,028 | 11,528 | (37 | )% | |||||||||||||||||||
| Real estate construction |
1,717 | 1,247 | 38 | % | 844 | 864 | 957 | 79 | % | |||||||||||||||||||
|
|
|
|
|
|
|
|
|
|
|
|||||||||||||||||||
| Commercial real estate lending |
8,923 | 9,520 | (6 | )% | 18,895 | 8,892 | 12,485 | (29 | )% | |||||||||||||||||||
|
|
|
|
|
|
|
|
|
|
|
|||||||||||||||||||
| Total commercial |
166,198 | 192,336 | (14 | )% | 211,810 | 221,789 | 215,559 | (23 | )% | |||||||||||||||||||
| Residential mortgage |
51,975 | 54,183 | (4 | )% | 50,236 | 53,475 | 52,300 | (1 | )% | |||||||||||||||||||
| Home equity |
13,482 | 13,212 | 2 | % | 13,001 | 14,347 | 14,363 | (6 | )% | |||||||||||||||||||
| Other consumer |
233 | 260 | (10 | )% | 256 | 300 | 380 | (39 | )% | |||||||||||||||||||
|
|
|
|
|
|
|
|
|
|
|
|||||||||||||||||||
| Total consumer |
65,690 | 67,655 | (3 | )% | 63,493 | 68,122 | 67,043 | (2 | )% | |||||||||||||||||||
|
|
|
|
|
|
|
|
|
|
|
|||||||||||||||||||
| Total nonaccrual loans |
$ | 231,888 | $ | 259,991 | (11 | )% | $ | 275,303 | $ | 289,911 | $ | 282,602 | (18 | )% | ||||||||||||||
|
|
|
|
|
|
|
|
|
|
|
|||||||||||||||||||
| Restructured loans (accruing) | Jun 30, 2017 | Mar 31, 2017 | Seql Qtr % Change |
Dec 31, 2016 | Sep 30, 2016 | Jun 30, 2016 | Comp Qtr % Change |
|||||||||||||||||||||
| Commercial and industrial |
$ | 31,540 | $ | 30,852 | 2 | % | $ | 31,884 | $ | 30,248 | $ | 29,179 | 8 | % | ||||||||||||||
| Commercial real estate—owner occupied |
4,145 | 5,532 | (25 | )% | 5,490 | 7,445 | 7,509 | (45 | )% | |||||||||||||||||||
|
|
|
|
|
|
|
|
|
|
|
|||||||||||||||||||
| Commercial and business lending |
35,685 | 36,384 | (2 | )% | 37,374 | 37,693 | 36,688 | (3 | )% | |||||||||||||||||||
| Commercial real estate—investor |
14,628 | 14,563 | — | % | 15,289 | 15,352 | 20,191 | (28 | )% | |||||||||||||||||||
| Real estate construction |
321 | 327 | (2 | )% | 359 | 365 | 372 | (14 | )% | |||||||||||||||||||
|
|
|
|
|
|
|
|
|
|
|
|||||||||||||||||||
| Commercial real estate lending |
14,949 | 14,890 | — | % | 15,648 | 15,717 | 20,563 | (27 | )% | |||||||||||||||||||
|
|
|
|
|
|
|
|
|
|
|
|||||||||||||||||||
| Total commercial |
50,634 | 51,274 | (1 | )% | 53,022 | 53,410 | 57,251 | (12 | )% | |||||||||||||||||||
| Residential mortgage |
17,624 | 18,535 | (5 | )% | 18,100 | 18,049 | 18,314 | (4 | )% | |||||||||||||||||||
| Home equity |
7,985 | 8,209 | (3 | )% | 7,756 | 7,685 | 6,955 | 15 | % | |||||||||||||||||||
| Other consumer |
1,082 | 1,041 | 4 | % | 979 | 926 | 906 | 19 | % | |||||||||||||||||||
|
|
|
|
|
|
|
|
|
|
|
|||||||||||||||||||
| Total consumer |
26,691 | 27,785 | (4 | )% | 26,835 | 26,660 | 26,175 | 2 | % | |||||||||||||||||||
|
|
|
|
|
|
|
|
|
|
|
|||||||||||||||||||
| Total restructured loans (accruing) |
$ | 77,325 | $ | 79,059 | (2 | )% | $ | 79,857 | $ | 80,070 | $ | 83,426 | (7 | )% | ||||||||||||||
|
|
|
|
|
|
|
|
|
|
|
|||||||||||||||||||
| Restructured loans included in nonaccrual loans (not included with restructed loans (accruing)) |
$ | 51,715 | $ | 78,902 | (34 | )% | $ | 29,385 | $ | 31,758 | $ | 34,841 | 48 | % | ||||||||||||||
|
|
|
|
|
|
|
|
|
|
|
|||||||||||||||||||
| Accruing Loans 30-89 Days Past Due | Jun 30, 2017 | Mar 31, 2017 | Seql Qtr % Change |
Dec 31, 2016 | Sep 30, 2016 | Jun 30, 2016 | Comp Qtr % Change |
|||||||||||||||||||||
| Commercial and industrial |
$ | 1,255 | $ | 1,675 | (25 | )% | $ | 1,413 | $ | 950 | $ | 2,124 | (41 | )% | ||||||||||||||
| Commercial real estate—owner occupied |
1,284 | 970 | 32 | % | 1,384 | 869 | 193 | N/M | ||||||||||||||||||||
|
|
|
|
|
|
|
|
|
|
|
|||||||||||||||||||
| Commercial and business lending |
2,539 | 2,645 | (4 | )% | 2,797 | 1,819 | 2,317 | 10 | % | |||||||||||||||||||
| Commercial real estate—investor |
899 | 1,122 | (20 | )% | 931 | 630 | 2,715 | (67 | )% | |||||||||||||||||||
| Real estate construction |
135 | 431 | (69 | )% | 369 | 402 | 524 | (74 | )% | |||||||||||||||||||
|
|
|
|
|
|
|
|
|
|
|
|||||||||||||||||||
| Commercial real estate lending |
1,034 | 1,553 | (33 | )% | 1,300 | 1,032 | 3,239 | (68 | )% | |||||||||||||||||||
|
|
|
|
|
|
|
|
|
|
|
|||||||||||||||||||
| Total commercial |
3,573 | 4,198 | (15 | )% | 4,097 | 2,851 | 5,556 | (36 | )% | |||||||||||||||||||
| Residential mortgage |
9,165 | 7,243 | 27 | % | 8,142 | 6,697 | 7,382 | 24 | % | |||||||||||||||||||
| Home equity |
5,924 | 4,512 | 31 | % | 5,849 | 5,473 | 7,730 | (23 | )% | |||||||||||||||||||
| Other consumer |
1,746 | 1,658 | 5 | % | 3,189 | 2,046 | 1,895 | (8 | )% | |||||||||||||||||||
|
|
|
|
|
|
|
|
|
|
|
|||||||||||||||||||
| Total consumer |
16,835 | 13,413 | 26 | % | 17,180 | 14,216 | 17,007 | (1 | )% | |||||||||||||||||||
|
|
|
|
|
|
|
|
|
|
|
|||||||||||||||||||
| Total accruing loans 30-89 days past due |
$ | 20,408 | $ | 17,611 | 16 | % | $ | 21,277 | $ | 17,067 | $ | 22,563 | (10 | )% | ||||||||||||||
|
|
|
|
|
|
|
|
|
|
|
|||||||||||||||||||
| Potential Problem Loans | Jun 30, 2017 | Mar 31, 2017 | Seql Qtr % Change |
Dec 31, 2016 | Sep 30, 2016 | Jun 30, 2016 | Comp Qtr % Change |
|||||||||||||||||||||
| Commercial and industrial |
$ | 142,607 | $ | 218,930 | (35 | )% | $ | 227,196 | $ | 351,290 | $ | 379,818 | (62 | )% | ||||||||||||||
| Commercial real estate—owner occupied |
60,724 | 58,994 | 3 | % | 64,524 | 47,387 | 45,671 | 33 | % | |||||||||||||||||||
|
|
|
|
|
|
|
|
|
|
|
|||||||||||||||||||
| Commercial and business lending |
203,331 | 277,924 | (27 | )% | 291,720 | 398,677 | 425,489 | (52 | )% | |||||||||||||||||||
| Commercial real estate—investor |
48,569 | 49,217 | (1 | )% | 51,228 | 36,765 | 25,081 | 94 | % | |||||||||||||||||||
| Real estate construction |
8,901 | 10,141 | (12 | )% | 2,465 | 1,929 | 2,117 | N/M | ||||||||||||||||||||
|
|
|
|
|
|
|
|
|
|
|
|||||||||||||||||||
| Commercial real estate lending |
57,470 | 59,358 | (3 | )% | 53,693 | 38,694 | 27,198 | 111 | % | |||||||||||||||||||
|
|
|
|
|
|
|
|
|
|
|
|||||||||||||||||||
| Total commercial |
260,801 | 337,282 | (23 | )% | 345,413 | 437,371 | 452,687 | (42 | )% | |||||||||||||||||||
| Residential mortgage |
1,576 | 2,155 | (27 | )% | 5,615 | 3,226 | 3,953 | (60 | )% | |||||||||||||||||||
| Home equity |
208 | 220 | (5 | )% | 114 | 78 | 94 | 121 | % | |||||||||||||||||||
|
|
|
|
|
|
|
|
|
|
|
|||||||||||||||||||
| Total consumer |
1,784 | 2,375 | (25 | )% | 5,729 | 3,304 | 4,047 | (56 | )% | |||||||||||||||||||
|
|
|
|
|
|
|
|
|
|
|
|||||||||||||||||||
| Total potential problem loans |
$ | 262,585 | $ | 339,657 | (23 | )% | $ | 351,142 | $ | 440,675 | $ | 456,734 | (43 | )% | ||||||||||||||
|
|
|
|
|
|
|
|
|
|
|
|||||||||||||||||||
N/M = Not meaningful
Page 11
Associated Banc-Corp
Net Interest Income Analysis—Fully Tax-Equivalent Basis — Sequential and Comparable Quarter
| Quarter ended, | ||||||||||||||||||||||||||||||||||||
| June 30, 2017 | March 31, 2017 | June 30, 2016 | ||||||||||||||||||||||||||||||||||
| (In thousands) | Average Balance |
Interest Income / Expense |
Average Yield / Rate |
Average Balance |
Interest Income / Expense |
Average Yield / Rate |
Average Balance |
Interest Income / Expense |
Average Yield / Rate |
|||||||||||||||||||||||||||
| Assets |
||||||||||||||||||||||||||||||||||||
| Earning assets: |
||||||||||||||||||||||||||||||||||||
| Loans: (1) (2) (3) |
||||||||||||||||||||||||||||||||||||
| Commercial and business lending |
$ | 7,321,523 | $ | 65,507 | 3.59 | % | $ | 7,199,481 | $ | 60,680 | 3.42 | % | $ | 7,474,633 | $ | 59,088 | 3.18 | % | ||||||||||||||||||
| Commercial real estate lending |
4,964,257 | 47,562 | 3.84 | % | 4,999,994 | 45,135 | 3.66 | % | 4,654,111 | 40,169 | 3.47 | % | ||||||||||||||||||||||||
|
|
|
|
|
|
|
|
|
|
|
|
|
|||||||||||||||||||||||||
| Total commercial |
12,285,780 | 113,069 | 3.69 | % | 12,199,475 | 105,815 | 3.52 | % | 12,128,744 | 99,257 | 3.29 | % | ||||||||||||||||||||||||
| Residential mortgage |
6,957,865 | 56,097 | 3.23 | % | 6,564,600 | 53,306 | 3.25 | % | 6,129,924 | 48,382 | 3.16 | % | ||||||||||||||||||||||||
| Retail |
1,278,345 | 16,048 | 5.03 | % | 1,308,650 | 15,450 | 4.74 | % | 1,383,317 | 16,378 | 4.74 | % | ||||||||||||||||||||||||
|
|
|
|
|
|
|
|
|
|
|
|
|
|||||||||||||||||||||||||
| Total loans |
20,521,990 | 185,214 | 3.62 | % | 20,072,725 | 174,571 | 3.51 | % | 19,641,985 | 164,017 | 3.35 | % | ||||||||||||||||||||||||
| Investment securities: |
||||||||||||||||||||||||||||||||||||
| Taxable |
4,781,488 | 23,658 | 1.98 | % | 4,830,421 | 23,475 | 1.94 | % | 4,967,437 | 24,270 | 1.95 | % | ||||||||||||||||||||||||
|
Tax-exempt(1) |
1,143,736 | 12,459 | 4.36 | % | 1,138,010 | 12,438 | 4.37 | % | 1,064,252 | 12,077 | 4.54 | % | ||||||||||||||||||||||||
| Other short-term investments |
297,341 | 1,553 | 2.09 | % | 298,158 | 1,536 | 2.08 | % | 294,375 | 1,318 | 1.80 | % | ||||||||||||||||||||||||
|
|
|
|
|
|
|
|
|
|
|
|
|
|||||||||||||||||||||||||
| Investments and other |
6,222,565 | 37,670 | 2.42 | % | 6,266,589 | 37,449 | 2.39 | % | 6,326,064 | 37,665 | 2.38 | % | ||||||||||||||||||||||||
|
|
|
|
|
|
|
|
|
|
|
|
|
|||||||||||||||||||||||||
| Total earning assets |
26,744,555 | $ | 222,884 | 3.34 | % | 26,339,314 | $ | 212,020 | 3.24 | % | 25,968,049 | $ | 201,682 | 3.12 | % | |||||||||||||||||||||
| Other assets, net |
2,454,351 | 2,441,013 | 2,674,427 | |||||||||||||||||||||||||||||||||
|
|
|
|
|
|
|
|||||||||||||||||||||||||||||||
| Total assets |
$ | 29,198,906 | $ | 28,780,327 | $ | 28,642,476 | ||||||||||||||||||||||||||||||
|
|
|
|
|
|
|
|||||||||||||||||||||||||||||||
| Liabilities and stockholders’ equity |
||||||||||||||||||||||||||||||||||||
| Interest-bearing liabilities: |
||||||||||||||||||||||||||||||||||||
| Interest-bearing deposits: |
||||||||||||||||||||||||||||||||||||
| Savings |
$ | 1,541,129 | $ | 201 | 0.05 | % | $ | 1,465,811 | $ | 188 | 0.05 | % | $ | 1,445,020 | $ | 228 | 0.06 | % | ||||||||||||||||||
| Interest-bearing demand |
4,272,620 | 5,506 | 0.52 | % | 4,251,357 | 4,210 | 0.40 | % | 3,640,733 | 2,144 | 0.24 | % | ||||||||||||||||||||||||
| Money market |
9,064,874 | 11,763 | 0.52 | % | 9,169,141 | 9,388 | 0.42 | % | 8,692,782 | 6,309 | 0.29 | % | ||||||||||||||||||||||||
| Time deposits |
1,752,255 | 3,710 | 0.85 | % | 1,613,331 | 3,138 | 0.79 | % | 1,540,424 | 2,997 | 0.78 | % | ||||||||||||||||||||||||
|
|
|
|
|
|
|
|
|
|
|
|
|
|||||||||||||||||||||||||
| Total interest-bearing deposits |
16,630,878 | 21,180 | 0.51 | % | 16,499,640 | 16,924 | 0.42 | % | 15,318,959 | 11,678 | 0.31 | % | ||||||||||||||||||||||||
| Federal funds purchased and securities sold under agreements to repurchase |
489,571 | 824 | 0.67 | % | 495,311 | 515 | 0.42 | % | 674,360 | 378 | 0.23 | % | ||||||||||||||||||||||||
| Other short-term funding |
842,305 | 1,827 | 0.87 | % | 683,306 | 1,080 | 0.64 | % | 1,209,511 | 845 | 0.28 | % | ||||||||||||||||||||||||
|
|
|
|
|
|
|
|
|
|
|
|
|
|||||||||||||||||||||||||
| Total short-term funding |
1,331,876 | 2,651 | 0.80 | % | 1,178,617 | 1,595 | 0.55 | % | 1,883,871 | 1,223 | 0.26 | % | ||||||||||||||||||||||||
| Long-term funding |
2,932,348 | 9,950 | 1.36 | % | 2,761,850 | 7,996 | 1.17 | % | 3,052,581 | 6,923 | 0.91 | % | ||||||||||||||||||||||||
|
|
|
|
|
|
|
|
|
|
|
|
|
|||||||||||||||||||||||||
| Total short and long-term funding |
4,264,224 | 12,601 | 1.18 | % | 3,940,467 | 9,591 | 0.98 | % | 4,936,452 | 8,146 | 0.66 | % | ||||||||||||||||||||||||
|
|
|
|
|
|
|
|
|
|
|
|
|
|||||||||||||||||||||||||
| Total interest-bearing liabilities |
20,895,102 | $ | 33,781 | 0.65 | % | 20,440,107 | $ | 26,515 | 0.52 | % | 20,255,411 | $ | 19,824 | 0.39 | % | |||||||||||||||||||||
| Noninterest-bearing demand deposits |
4,892,271 | 4,966,082 | 4,969,994 | |||||||||||||||||||||||||||||||||
| Other liabilities |
246,395 | 250,747 | 228,027 | |||||||||||||||||||||||||||||||||
| Stockholders’ equity |
3,165,138 | 3,123,391 | 3,189,044 | |||||||||||||||||||||||||||||||||
|
|
|
|
|
|
|
|||||||||||||||||||||||||||||||
| Total liabilities and stockholders’ equity |
$ | 29,198,906 | $ | 28,780,327 | $ | 28,642,476 | ||||||||||||||||||||||||||||||
|
|
|
|
|
|
|
|||||||||||||||||||||||||||||||
| Interest rate spread |
2.69 | % | 2.72 | % | 2.73 | % | ||||||||||||||||||||||||||||||
| Net free funds |
0.14 | % | 0.12 | % | 0.08 | % | ||||||||||||||||||||||||||||||
|
|
|
|
|
|
|
|
|
|
|
|
|
|||||||||||||||||||||||||
| Fully tax-equivalent net interest income and net interest margin |
$ | 189,103 | 2.83 | % | $ | 185,505 | 2.84 | % | $ | 181,858 | 2.81 | % | ||||||||||||||||||||||||
|
|
|
|
|
|
|
|
|
|
|
|
|
|||||||||||||||||||||||||
| Fully tax-equivalent adjustment |
5,284 | 5,231 | 5,141 | |||||||||||||||||||||||||||||||||
|
|
|
|
|
|
|
|||||||||||||||||||||||||||||||
| Net interest income |
$ | 183,819 | $ | 180,274 | $ | 176,717 | ||||||||||||||||||||||||||||||
|
|
|
|
|
|
|
|||||||||||||||||||||||||||||||
| (1) | The yield on tax-exempt loans and securities is computed on a fully tax-equivalent basis using a tax rate of 35% for all periods presented and is net of the effects of certain disallowed interest deductions. |
| (2) | Nonaccrual loans and loans held for sale have been included in the average balances. |
| (3) | Interest income includes net loan fees. |
Page 12
Associated Banc-Corp
Net Interest Income Analysis—Fully Tax-Equivalent Basis — Year Over Year
| Six Months ended June 30, | ||||||||||||||||||||||||
| 2017 | 2016 | |||||||||||||||||||||||
| (in thousands) | Average Balance |
Interest Income /Expense |
Average Yield /Rate |
Average Balance |
Interest Income /Expense |
Average Yield /Rate |
||||||||||||||||||
| Assets |
||||||||||||||||||||||||
| Earning assets: |
||||||||||||||||||||||||
| Loans: (1) (2) (3) |
||||||||||||||||||||||||
| Commercial and business lending |
$ | 7,260,839 | $ | 126,187 | 3.50 | % | $ | 7,297,847 | $ | 116,380 | 3.21 | % | ||||||||||||
| Commercial real estate lending |
4,982,027 | 92,697 | 3.75 | % | 4,561,821 | 79,158 | 3.49 | % | ||||||||||||||||
|
|
|
|
|
|
|
|
|
|||||||||||||||||
| Total commercial |
12,242,866 | 218,884 | 3.60 | % | 11,859,668 | 195,538 | 3.31 | % | ||||||||||||||||
| Residential mortgage |
6,762,319 | 109,404 | 3.24 | % | 6,025,102 | 96,130 | 3.19 | % | ||||||||||||||||
| Retail |
1,293,414 | 31,497 | 4.88 | % | 1,397,638 | 32,984 | 4.73 | % | ||||||||||||||||
|
|
|
|
|
|
|
|
|
|||||||||||||||||
| Total loans |
20,298,599 | 359,785 | 3.56 | % | 19,282,408 | 324,652 | 3.38 | % | ||||||||||||||||
| Investment securities: |
||||||||||||||||||||||||
| Taxable |
4,805,819 | 47,133 | 1.96 | % | 5,000,754 | 49,786 | 1.99 | % | ||||||||||||||||
| Tax-exempt (1) |
1,140,889 | 24,897 | 4.36 | % | 1,054,731 | 24,057 | 4.56 | % | ||||||||||||||||
| Other short-term investments |
297,747 | 3,089 | 2.09 | % | 282,318 | 2,385 | 1.70 | % | ||||||||||||||||
|
|
|
|
|
|
|
|
|
|||||||||||||||||
| Investments and other |
6,244,455 | 75,119 | 2.41 | % | 6,337,803 | 76,228 | 2.41 | % | ||||||||||||||||
|
|
|
|
|
|
|
|
|
|||||||||||||||||
| Total earning assets |
26,543,054 | $ | 434,904 | 3.29 | % | 25,620,211 | $ | 400,880 | 3.14 | % | ||||||||||||||
| Other assets, net |
2,447,719 | 2,450,451 | ||||||||||||||||||||||
|
|
|
|
|
|||||||||||||||||||||
| Total assets |
$ | 28,990,773 | $ | 28,070,662 | ||||||||||||||||||||
|
|
|
|
|
|||||||||||||||||||||
| Liabilities and stockholders’ equity |
||||||||||||||||||||||||
| Interest-bearing liabilities: |
||||||||||||||||||||||||
| Interest-bearing deposits: |
||||||||||||||||||||||||
| Savings |
$ | 1,503,678 | $ | 389 | 0.05 | % | $ | 1,406,333 | $ | 464 | 0.07 | % | ||||||||||||
| Interest-bearing demand |
4,262,047 | 9,716 | 0.46 | % | 3,430,571 | 4,176 | 0.24 | % | ||||||||||||||||
| Money market |
9,116,719 | 21,150 | 0.47 | % | 9,062,514 | 12,753 | 0.28 | % | ||||||||||||||||
| Time deposits |
1,683,177 | 6,849 | 0.82 | % | 1,549,351 | 6,051 | 0.79 | % | ||||||||||||||||
|
|
|
|
|
|
|
|
|
|||||||||||||||||
| Total interest-bearing deposits |
16,565,621 | 38,104 | 0.46 | % | 15,448,769 | 23,444 | 0.31 | % | ||||||||||||||||
| Federal funds purchased and securities sold under agreements to repurchase |
492,425 | 1,339 | 0.55 | % | 617,007 | 674 | 0.22 | % | ||||||||||||||||
| Other short-term funding |
763,245 | 2,907 | 0.77 | % | 993,704 | 1,360 | 0.28 | % | ||||||||||||||||
|
|
|
|
|
|
|
|
|
|||||||||||||||||
| Total short-term funding |
1,255,670 | 4,246 | 0.68 | % | 1,610,711 | 2,034 | 0.25 | % | ||||||||||||||||
| Long-term funding |
2,847,570 | 17,946 | 1.27 | % | 2,817,560 | 16,428 | 1.17 | % | ||||||||||||||||
|
|
|
|
|
|
|
|
|
|||||||||||||||||
| Total short and long-term funding |
4,103,240 | 22,192 | 1.09 | % | 4,428,271 | 18,462 | 0.84 | % | ||||||||||||||||
|
|
|
|
|
|
|
|
|
|||||||||||||||||
| Total interest-bearing liabilities |
20,668,861 | $ | 60,296 | 0.59 | % | 19,877,040 | $ | 41,906 | 0.42 | % | ||||||||||||||
| Noninterest-bearing demand deposits |
4,928,973 | 4,983,197 | ||||||||||||||||||||||
| Other liabilities |
248,559 | 230,528 | ||||||||||||||||||||||
| Stockholders’ equity |
3,144,380 | 2,979,897 | ||||||||||||||||||||||
|
|
|
|
|
|||||||||||||||||||||
| Total liabilities and stockholders’ equity |
$ | 28,990,773 | $ | 28,070,662 | ||||||||||||||||||||
|
|
|
|
|
|||||||||||||||||||||
| Interest rate spread |
2.70 | % | 2.72 | % | ||||||||||||||||||||
| Net free funds |
0.13 | % | 0.09 | % | ||||||||||||||||||||
|
|
|
|
|
|
|
|
|
|||||||||||||||||
| Fully tax-equivalent net interest income and net interest margin |
$ | 374,608 | 2.83 | % | $ | 358,974 | 2.81 | % | ||||||||||||||||
|
|
|
|
|
|
|
|
|
|||||||||||||||||
| Fully tax-equivalent adjustment |
10,515 | 10,270 | ||||||||||||||||||||||
|
|
|
|
|
|||||||||||||||||||||
| Net interest income |
$ | 364,093 | $ | 348,704 | ||||||||||||||||||||
|
|
|
|
|
|||||||||||||||||||||
| (1) | The yield on tax exempt loans and securities is computed on a fully tax-equivalent basis using a tax rate of 35% for all periods presented and is net of the effects of certain disallowed interest deductions. |
| (2) | Nonaccrual loans and loans held for sale have been included in the average balances. |
| (3) | Interest income includes net loan fees. |
Page 13
Associated Banc-Corp
Loan and Deposit Composition
(In thousands)
| Period End Loan Composition | Jun 30, 2017 | Mar 31, 2017 | Seql Qtr % Change |
Dec 31, 2016 | Sep 30, 2016 | Jun 30, 2016 | Comp Qtr % Change |
|||||||||||||||||||||
| Commercial and industrial |
$ | 6,571,000 | $ | 6,300,646 | 4 | % | $ | 6,489,014 | $ | 6,721,557 | $ | 6,701,986 | (2 | )% | ||||||||||||||
| Commercial real estate—owner occupied |
845,336 | 878,391 | (4 | )% | 897,724 | 892,678 | 921,736 | (8 | )% | |||||||||||||||||||
|
|
|
|
|
|
|
|
|
|
|
|||||||||||||||||||
| Commercial and business lending |
7,416,336 | 7,179,037 | 3 | % | 7,386,738 | 7,614,235 | 7,623,722 | (3 | )% | |||||||||||||||||||
| Commercial real estate—investor |
3,329,585 | 3,415,355 | (3 | )% | 3,574,732 | 3,530,370 | 3,495,791 | (5 | )% | |||||||||||||||||||
| Real estate construction |
1,651,805 | 1,553,205 | 6 | % | 1,432,497 | 1,314,431 | 1,285,573 | 28 | % | |||||||||||||||||||
|
|
|
|
|
|
|
|
|
|
|
|||||||||||||||||||
| Commercial real estate lending |
4,981,390 | 4,968,560 | — | % | 5,007,229 | 4,844,801 | 4,781,364 | 4 | % | |||||||||||||||||||
|
|
|
|
|
|
|
|
|
|
|
|||||||||||||||||||
| Total commercial |
12,397,726 | 12,147,597 | 2 | % | 12,393,967 | 12,459,036 | 12,405,086 | — | % | |||||||||||||||||||
| Residential mortgage |
7,115,457 | 6,715,282 | 6 | % | 6,332,327 | 6,034,166 | 6,035,720 | 18 | % | |||||||||||||||||||
| Home equity |
897,111 | 911,969 | (2 | )% | 934,443 | 951,594 | 968,771 | (7 | )% | |||||||||||||||||||
| Other consumer |
372,775 | 372,835 | — | % | 393,979 | 399,209 | 405,709 | (8 | )% | |||||||||||||||||||
|
|
|
|
|
|
|
|
|
|
|
|||||||||||||||||||
| Total consumer |
8,385,343 | 8,000,086 | 5 | % | 7,660,749 | 7,384,969 | 7,410,200 | 13 | % | |||||||||||||||||||
|
|
|
|
|
|
|
|
|
|
|
|||||||||||||||||||
| Total loans |
$ | 20,783,069 | $ | 20,147,683 | 3 | % | $ | 20,054,716 | $ | 19,844,005 | $ | 19,815,286 | 5 | % | ||||||||||||||
|
|
|
|
|
|
|
|
|
|
|
|||||||||||||||||||
| Period End Deposit and Customer Funding Composition | Jun 30, 2017 | Mar 31, 2017 | Seql Qtr % Change |
Dec 31, 2016 | Sep 30, 2016 | Jun 30, 2016 | Comp Qtr % Change |
|||||||||||||||||||||
| Noninterest-bearing demand |
$ | 5,038,162 | $ | 5,338,212 | (6 | )% | $ | 5,392,208 | $ | 5,337,677 | $ | 5,039,336 | — | % | ||||||||||||||
| Savings |
1,552,820 | 1,530,155 | 1 | % | 1,431,494 | 1,441,187 | 1,451,801 | 7 | % | |||||||||||||||||||
| Interest-bearing demand |
3,858,739 | 4,736,236 | (19 | )% | 4,687,656 | 4,548,390 | 3,789,138 | 2 | % | |||||||||||||||||||
| Money market |
9,228,129 | 8,608,523 | 7 | % | 8,770,963 | 8,894,357 | 8,448,543 | 9 | % | |||||||||||||||||||
| Brokered CDs |
131,184 | 54,993 | 139 | % | 52,725 | 44,373 | 46,268 | 184 | % | |||||||||||||||||||
| Other time |
1,809,146 | 1,559,916 | 16 | % | 1,553,402 | 1,481,728 | 1,517,764 | 19 | % | |||||||||||||||||||
|
|
|
|
|
|
|
|
|
|
|
|||||||||||||||||||
| Total deposits |
21,618,180 | 21,828,035 | (1 | )% | 21,888,448 | 21,747,712 | 20,292,850 | 7 | % | |||||||||||||||||||
| Customer funding |
262,318 | 326,823 | (20 | )% | 300,197 | 477,607 | 464,880 | (44 | )% | |||||||||||||||||||
|
|
|
|
|
|
|
|
|
|
|
|||||||||||||||||||
| Total deposits and customer funding |
$ | 21,880,498 | $ | 22,154,858 | (1 | )% | $ | 22,188,645 | $ | 22,225,319 | $ | 20,757,730 | 5 | % | ||||||||||||||
|
|
|
|
|
|
|
|
|
|
|
|||||||||||||||||||
| Network transaction deposits (1) |
$ | 3,220,956 | $ | 3,417,380 | (6 | )% | $ | 3,895,467 | $ | 3,730,513 | $ | 3,141,214 | 3 | % | ||||||||||||||
| Total deposits and customer funding, excluding Brokered CDs and network transaction deposits |
$ | 18,528,358 | $ | 18,682,485 | (1 | )% | $ | 18,240,453 | $ | 18,450,433 | $ | 17,570,248 | 5 | % | ||||||||||||||
|
|
|
|
|
|
|
|
|
|
|
|||||||||||||||||||
| Quarter Average Loan Composition | Jun 30, 2017 | Mar 31, 2017 | Seql Qtr % Change |
Dec 31, 2016 | Sep 30, 2016 | Jun 30, 2016 | Comp Qtr % Change |
|||||||||||||||||||||
| Commercial and industrial |
$ | 6,449,250 | $ | 6,313,389 | 2 | % | $ | 6,514,974 | $ | 6,674,688 | $ | 6,559,613 | (2 | )% | ||||||||||||||
| Commercial real estate—owner occupied |
872,273 | 886,092 | (2 | )% | 891,836 | 902,782 | 915,020 | (5 | )% | |||||||||||||||||||
|
|
|
|
|
|
|
|
|
|
|
|||||||||||||||||||
| Commercial and business lending |
7,321,523 | 7,199,481 | 2 | % | 7,406,810 | 7,577,470 | 7,474,633 | (2 | )% | |||||||||||||||||||
| Commercial real estate—investor |
3,359,817 | 3,502,769 | (4 | )% | 3,546,559 | 3,532,861 | 3,448,741 | (3 | )% | |||||||||||||||||||
| Real estate construction |
1,604,440 | 1,497,225 | 7 | % | 1,368,084 | 1,322,966 | 1,205,370 | 33 | % | |||||||||||||||||||
|
|
|
|
|
|
|
|
|
|
|
|||||||||||||||||||
| Commercial real estate lending |
4,964,257 | 4,999,994 | (1 | )% | 4,914,643 | 4,855,827 | 4,654,111 | 7 | % | |||||||||||||||||||
|
|
|
|
|
|
|
|
|
|
|
|||||||||||||||||||
| Total commercial |
12,285,780 | 12,199,475 | 1 | % | 12,321,453 | 12,433,297 | 12,128,744 | 1 | % | |||||||||||||||||||
| Residential mortgage |
6,957,865 | 6,564,600 | 6 | % | 6,317,769 | 6,255,264 | 6,129,924 | 14 | % | |||||||||||||||||||
| Home equity |
906,208 | 923,896 | (2 | )% | 942,620 | 961,034 | 975,313 | (7 | )% | |||||||||||||||||||
| Other consumer |
372,137 | 384,754 | (3 | )% | 395,228 | 403,181 | 408,004 | (9 | )% | |||||||||||||||||||
|
|
|
|
|
|
|
|
|
|
|
|||||||||||||||||||
| Total consumer |
8,236,210 | 7,873,250 | 5 | % | 7,655,617 | 7,619,479 | 7,513,241 | 10 | % | |||||||||||||||||||
|
|
|
|
|
|
|
|
|
|
|
|||||||||||||||||||
| Total loans |
$ | 20,521,990 | $ | 20,072,725 | 2 | % | $ | 19,977,070 | $ | 20,052,776 | $ | 19,641,985 | 4 | % | ||||||||||||||
|
|
|
|
|
|
|
|
|
|
|
|||||||||||||||||||
| Quarter Average Deposit Composition | Jun 30, 2017 | Mar 31, 2017 | Seql Qtr % Change |
Dec 31, 2016 | Sep 30, 2016 | Jun 30, 2016 | Comp Qtr % Change |
|||||||||||||||||||||
| Noninterest-bearing demand |
$ | 4,892,271 | $ | 4,966,082 | (1 | )% | $ | 5,294,078 | $ | 5,161,802 | $ | 4,969,994 | (2 | )% | ||||||||||||||
| Savings |
1,541,129 | 1,465,811 | 5 | % | 1,451,803 | 1,448,223 | 1,445,020 | 7 | % | |||||||||||||||||||
| Interest-bearing demand |
4,272,620 | 4,251,357 | 1 | % | 4,140,072 | 4,151,708 | 3,640,733 | 17 | % | |||||||||||||||||||
| Money market |
9,064,874 | 9,169,141 | (1 | )% | 9,296,364 | 9,088,943 | 8,692,782 | 4 | % | |||||||||||||||||||
| Time deposits |
1,752,255 | 1,613,331 | 9 | % | 1,560,145 | 1,553,349 | 1,540,424 | 14 | % | |||||||||||||||||||
|
|
|
|
|
|
|
|
|
|
|
|||||||||||||||||||
| Total deposits |
$ | 21,523,149 | $ | 21,465,722 | — | % | $ | 21,742,462 | $ | 21,404,025 | $ | 20,288,953 | 6 | % | ||||||||||||||
|
|
|
|
|
|
|
|
|
|
|
|||||||||||||||||||
| (1) | Included above in interest-bearing demand and money market. |
Page 14
Associated Banc-Corp
Non-GAAP Financial Measures Reconciliation
| ($ in millions) | YTD Jun 2017 |
YTD Jun 2016 |
2Q17 | 1Q17 | 4Q16 | 3Q16 | 2Q16 | |||||||||||||||||||||
| Tangible Common Equity Reconciliation (1) |
||||||||||||||||||||||||||||
| Common equity |
$ | 3,032 | $ | 2,985 | $ | 2,931 | $ | 2,937 | $ | 2,910 | ||||||||||||||||||
| Goodwill and other intangible assets, net |
(987 | ) | (987 | ) | (987 | ) | (988 | ) | (988 | ) | ||||||||||||||||||
|
|
|
|
|
|
|
|
|
|
|
|||||||||||||||||||
| Tangible common equity |
$ | 2,045 | $ | 1,998 | $ | 1,944 | $ | 1,949 | $ | 1,922 | ||||||||||||||||||
|
|
|
|
|
|
|
|
|
|
|
|||||||||||||||||||
| Tangible Assets Reconciliation (1) |
||||||||||||||||||||||||||||
| Total assets |
$ | 29,769 | $ | 29,110 | $ | 29,139 | $ | 29,153 | $ | 29,039 | ||||||||||||||||||
| Goodwill and other intangible assets, net |
(987 | ) | (987 | ) | (987 | ) | (988 | ) | (988 | ) | ||||||||||||||||||
|
|
|
|
|
|
|
|
|
|
|
|||||||||||||||||||
| Tangible assets |
$ | 28,782 | $ | 28,123 | $ | 28,152 | $ | 28,165 | $ | 28,051 | ||||||||||||||||||
|
|
|
|
|
|
|
|
|
|
|
|||||||||||||||||||
| Average Tangible Common Equity and Average Common Equity Tier 1 Reconciliation (1) |
||||||||||||||||||||||||||||
| Common equity |
$ | 2,985 | $ | 2,859 | $ | 3,005 | $ | 2,963 | $ | 2,925 | $ | 2,911 | $ | 2,869 | ||||||||||||||
| Goodwill and other intangible assets, net |
(987 | ) | (989 | ) | (987 | ) | (987 | ) | (988 | ) | (988 | ) | (989 | ) | ||||||||||||||
|
|
|
|
|
|
|
|
|
|
|
|
|
|
|
|||||||||||||||
| Tangible common equity |
1,998 | 1,870 | 2,018 | 1,976 | 1,937 | 1,923 | 1,880 | |||||||||||||||||||||
| Less: Accumulated other comprehensive income / loss |
52 | 2 | 50 | 54 | 28 | (3 | ) | 1 | ||||||||||||||||||||
| Less: Deferred tax assets / deferred tax liabilities, net |
31 | 33 | 32 | 32 | 33 | 33 | 32 | |||||||||||||||||||||
|
|
|
|
|
|
|
|
|
|
|
|
|
|
|
|||||||||||||||
| Average common equity Tier 1 |
$ | 2,081 | $ | 1,905 | $ | 2,100 | $ | 2,062 | $ | 1,998 | $ | 1,953 | $ | 1,913 | ||||||||||||||
|
|
|
|
|
|
|
|
|
|
|
|
|
|
|
|||||||||||||||
| Selected Trend Information (2) |
||||||||||||||||||||||||||||
| Trust service fees |
$ | 12 | $ | 12 | $ | 12 | $ | 12 | $ | 12 | ||||||||||||||||||
| Service charges on deposit accounts |
16 | 16 | 16 | 18 | 16 | |||||||||||||||||||||||
| Card-based and other nondeposit fees |
14 | 13 | 13 | 13 | 13 | |||||||||||||||||||||||
| Insurance commissions |
21 | 22 | 18 | 19 | 22 | |||||||||||||||||||||||
| Brokerage and annuity commissions |
4 | 4 | 4 | 4 | 4 | |||||||||||||||||||||||
|
|
|
|
|
|
|
|
|
|
|
|||||||||||||||||||
| Fee-based revenue |
67 | 67 | 63 | 66 | 67 | |||||||||||||||||||||||
| Other |
15 | 13 | 29 | 29 | 15 | |||||||||||||||||||||||
|
|
|
|
|
|
|
|
|
|
|
|||||||||||||||||||
| Total noninterest income |
$ | 82 | $ | 80 | $ | 92 | $ | 95 | $ | 82 | ||||||||||||||||||
|
|
|
|
|
|
|
|
|
|
|
|||||||||||||||||||
| Selected Equity and Performance Ratios (1) (3) |
||||||||||||||||||||||||||||
| Tangible common equity / tangible assets |
7.11 | % | 7.10 | % | 6.91 | % | 6.92 | % | 6.85 | % | ||||||||||||||||||
| Return on average equity |
7.33 | % | 6.18 | % | 7.35 | % | 7.31 | % | 7.07 | % | 7.03 | % | 6.19 | % | ||||||||||||||
| Return on average tangible common equity |
11.06 | % | 9.38 | % | 11.06 | % | 11.07 | % | 10.78 | % | 10.68 | % | 10.04 | % | ||||||||||||||
| Return on average common equity Tier 1 |
10.62 | % | 9.21 | % | 10.63 | % | 10.61 | % | 10.45 | % | 10.52 | % | 9.86 | % | ||||||||||||||
|
|
|
|
|
|
|
|
|
|
|
|
|
|
|
|||||||||||||||
| Efficiency Ratio Reconciliation (4) |
||||||||||||||||||||||||||||
| Federal Reserve efficiency ratio |
66.54 | % | 69.18 | % | 66.69 | % | 66.39 | % | 65.35 | % | 64.40 | % | 69.34 | % | ||||||||||||||
| Fully tax-equivalent adjustment |
(1.30 | )% | (1.36 | )% | (1.30 | )% | (1.30 | )% | (1.25 | )% | (1.21 | )% | (1.36 | )% | ||||||||||||||
| Other intangible amortization |
(0.19 | )% | (0.21 | )% | (0.18 | )% | (0.20 | )% | (0.20 | )% | (0.19 | )% | (0.21 | )% | ||||||||||||||
|
|
|
|
|
|
|
|
|
|
|
|
|
|
|
|||||||||||||||
| Fully tax-equivalent efficiency ratio |
65.05 | % | 67.61 | % | 65.21 | % | 64.89 | % | 63.90 | % | 63.00 | % | 67.77 | % | ||||||||||||||
|
|
|
|
|
|
|
|
|
|
|
|
|
|
|
|||||||||||||||
| (1) | The ratio tangible common equity to tangible assets excludes goodwill and other intangible assets, net. This financial measure has been included as it is considered to be a critical metric with which to analyze and evaluate financial condition and capital strength. |
| (2) | These financial measures have been included as they provide meaningful supplemental information to assess trends in the Corporation’s results of operations. May not match the income statement due to rounding. |
| (3) | These capital measurements are used by management, regulators, investors, and analysts to assess, monitor and compare the quality and composition of our capital with the capital of other financial services companies. |
| (4) | The efficiency ratio as defined by the Federal Reserve guidance is noninterest expense (which includes the provision for unfunded commitments) divided by the sum of net interest income plus noninterest income, excluding investment securities gains / losses, net. The fully tax-equivalent efficiency ratio is noninterest expense (which includes the provision for unfunded commitments), excluding other intangible amortization, divided by the sum of fully tax-equivalent net interest income plus noninterest income, excluding investment securities gains / losses, net. Management believes the fully tax-equivalent efficiency ratio, which adjusts net interest income for the tax-favored status of certain loans and investment securities, to be the preferred industry measurement as it enhances the comparability of net interest income arising from taxable and tax-exempt sources. |
Page 15