Exhibit 99.1

|
NEWS RELEASE Investor Contact: Tim Sedabres, Vice President, Finance 920-491-7059
Media Contact: Autumn Latimore, Senior Vice President, Public Relations Director 414-278-1860 |
Associated Reports Fourth Quarter Earnings of $0.23 per share
Full year net income to common shareholders of $115 million, or $0.66 per share
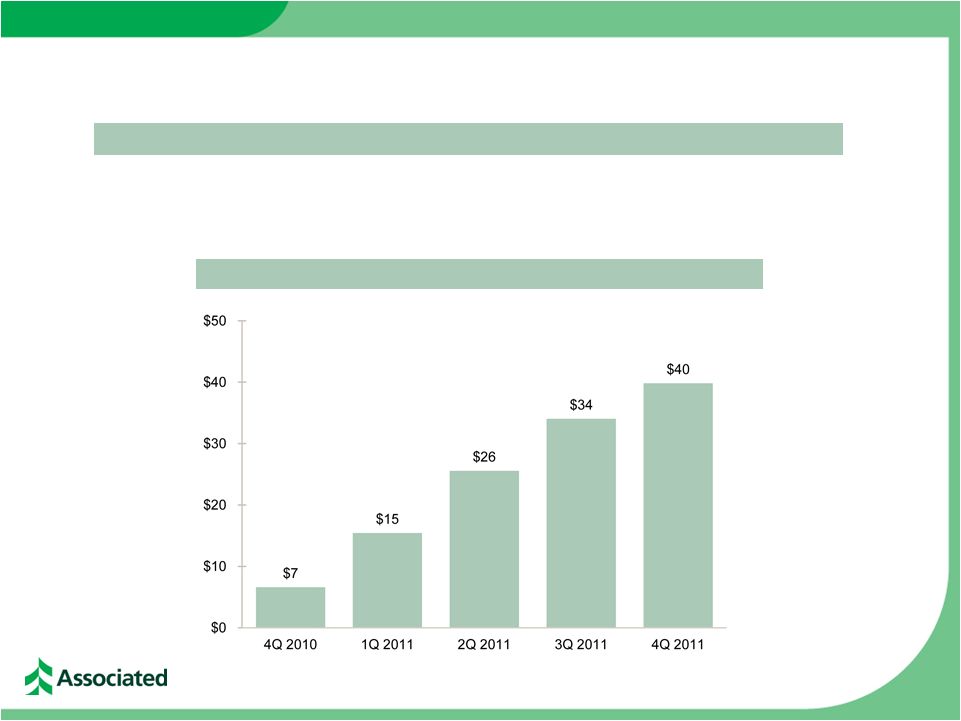
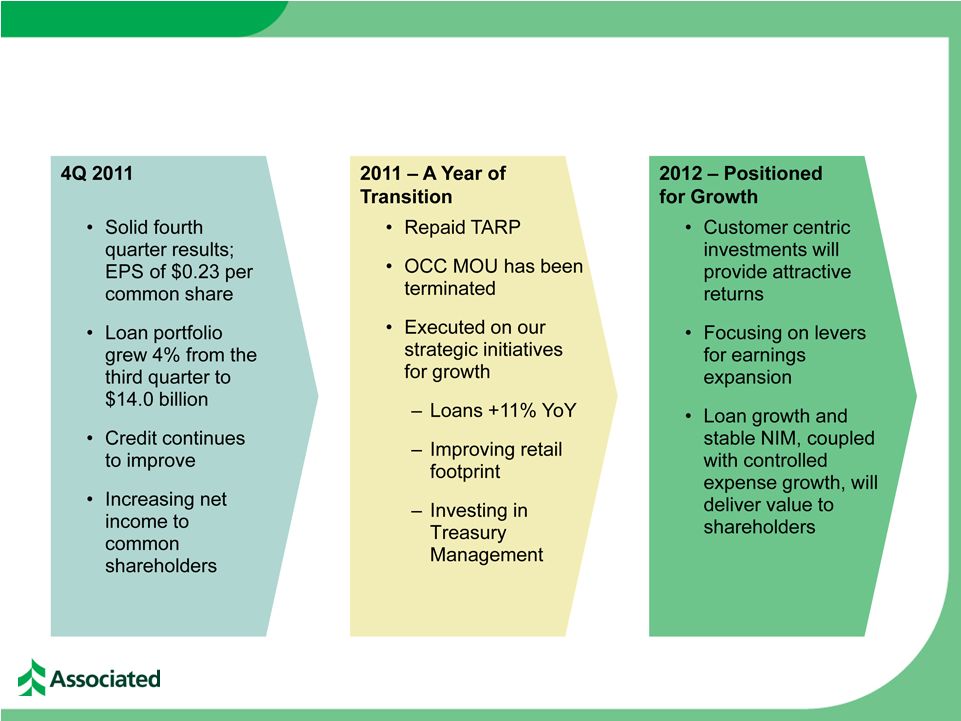
GREEN BAY, Wis. –– January 19, 2012 –– Associated Banc-Corp (NASDAQ: ASBC) today reported net income to common shareholders of $40 million, or $0.23 per common share, for the quarter ended December 31, 2011. This compares to net income to common shareholders of $34 million, or $0.20 per common share, for the quarter ended September 30, 2011, and net income to common shareholders of $7 million, or $0.04 per common share, for the quarter ended December 31, 2010.
For the year ended December 31, 2011, the Company reported net income to common shareholders of $115 million, or $0.66 per common share. This compares to a net loss to common shareholders of $30 million, or $0.18 per common share for the year ended December 31, 2010.
“We are pleased with the results and accomplishments achieved over the past year. We have been serving our customers for 150 years and remain committed to meeting their needs. We believe that results from the fourth quarter reflect both our core franchise strength and our ability to deliver value to customers and shareholders,” said President and CEO Philip B. Flynn.
HIGHLIGHTS
| • | Quarterly net income to common shareholders improved by 17%, or $6 million from the prior quarter |
| • | Full year 2011 net income to common shareholders of $115 million |
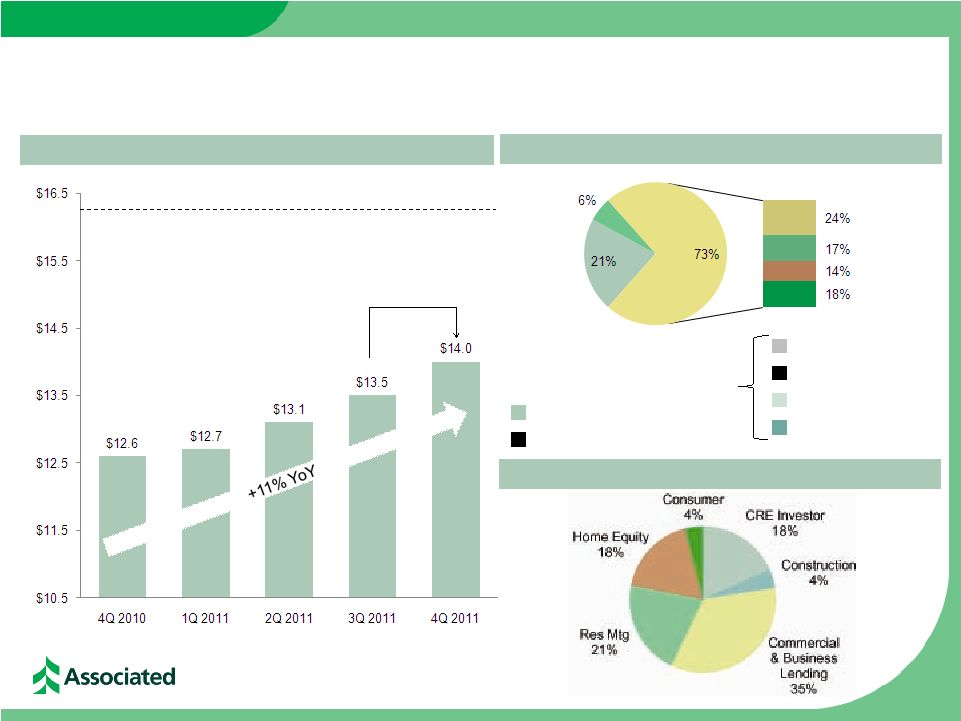
| • | Loan balances increased by a net $528 million, or 4%, during the fourth quarter to $14.0 billion; loans grew in each major portfolio during the fourth quarter, including: |
| • | Commercial and business lending grew $386 million |
| • | Commercial real estate lending increased $112 million |
| • | Residential mortgage loans grew $111 million |
| • | Loans increased by $1.4 billion, or 11%, during 2011 |
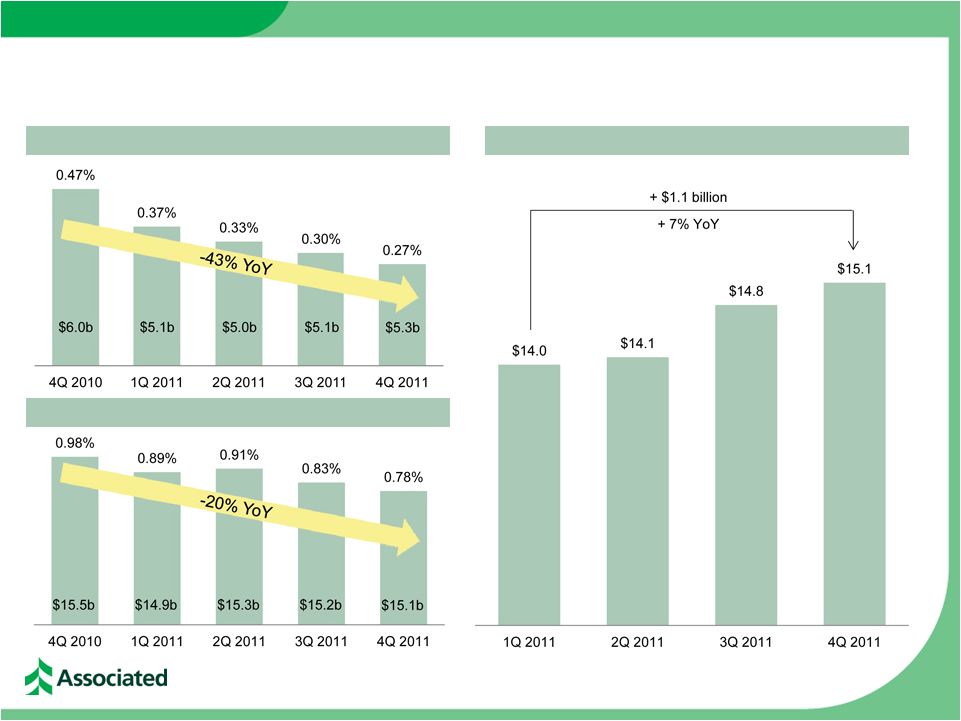
| • | Credit metrics continued to improve during the fourth quarter; nonaccrual loans declined $47 million, or 12%, from the prior quarter to $357 million, the lowest level in eight quarters, while net charge offs were down 25% from the prior quarter |
| • | Nonaccruals have declined 38% from $574 million at the fourth quarter of 2010 |
| • | Net charge offs of $151 million for full year 2011 declined 69% from full year 2010 |
– More –
| ASSOCIATED BANC-CORP REPORTS FOURTH QUARTER 2011 RESULTS | PAGE 2 |
FOURTH QUARTER 2011 FINANCIAL RESULTS
Loans
At December 31, 2011, the Company’s loan portfolio was $14.0 billion, up $528 million, or 4%, from $13.5 billion at September 30, 2011, and up $1.4 billion, or 11%, from $12.6 billion a year ago. Total commercial loans grew $498 million on a linked-quarter basis, with strong growth coming from both the commercial and industrial (C&I) and commercial real estate (CRE) portfolios. The retail loan and residential mortgage portfolios grew by a net $29 million from the third quarter, with a $111 million increase in residential mortgage partially offset by a decrease in the home equity loan book of $67 million.
Deposits
Total deposits of $15.1 billion at the end of the fourth quarter were up 2% from $14.8 billion at the end of the third quarter. The net deposit growth during the quarter included a $217 million, or 6% increase, in demand deposits and a $226 million, or 11% increase, in interest-bearing demand deposits.
Net Interest Income and Net Interest Margin
Fourth quarter net interest income was $152 million. Consistent with the Company’s strategy of funding loan growth primarily through securities run-off, net interest income from loans grew quarter over quarter while interest income from securities continued to contract. The net interest margin for the fourth quarter was 3.21%, a decline of 2 basis points from the prior quarter. Yields on earning assets compressed by 7 basis points quarter over quarter, while the cost of interest-bearing liabilities declined by 5 basis points; contributing to the modest reduction in overall net interest margin.
Noninterest Income and Expense
Noninterest income for the quarter was $74 million, up $2 million, or 3%, from the third quarter. Card-based and other nondeposit revenues declined by $4 million from the prior quarter, primarily due to the expected phased-in impact of the Durbin amendment. Mortgage banking income increased by $5 million from the third quarter, driven by higher mortgage production, lower valuation expense on mortgage servicing rights, and a $3 million gain on sale of $94 million of portfolio mortgages.
Personnel and occupancy expenses remained relatively flat from the prior quarter. However, total noninterest expense for the quarter ended December 31, 2011 was $175 million, up $13 million, or 8%, from the third quarter, primarily attributable to a $10 million change in losses other than loans. The largest contributor to losses other than loans related to additional litigation reserves established for the previously disclosed settlement of a legal matter. Other drivers of the increase in noninterest expense include increased data processing expense and increased business development and advertising expenses. Offsetting the net income impact of the losses other than loans was a reversal of certain prior years’ tax reserves as a result of the expiration of the statute of limitations.
– More –
| ASSOCIATED BANC-CORP REPORTS FOURTH QUARTER 2011 RESULTS | PAGE 3 |
In December, the Company announced plans to consolidate 21 retail branches during the first and second quarters of 2012 as part of its footprint enhancement strategy. All of the impacted branches are within close proximity to other remaining Associated locations, in most cases within two miles, and the Company remains committed to continuing to invest throughout its three-state footprint. The consolidations are expected to increase the deposits per branch in the remaining locations while allowing the Company to service the impacted markets more efficiently.
Key Credit Metrics
The Company reported another quarter of improving credit metrics with nonaccrual loans down 12% to $357 million from $403 million at September 30, 2011, and down 38% from $574 million at December 31, 2010. Net charge offs were $23 million for the fourth quarter, down 25% from $30 million for the third quarter of 2011, and down 79% from $108 million for the fourth quarter of 2010. Fourth quarter provision for loan losses was $1 million, down from $4 million for the third quarter of 2011, and down from $63 million for the fourth quarter of 2010. The Company’s allowance for loan losses was $378 million, representing an allowance equal to 2.70% of loans, and covered over 105% of nonaccrual loans at December 31, 2011.
Capital Ratios
The Company’s capital position remains very strong, with a Tier 1 common equity ratio of 12.24% at December 31, 2011, compared to 12.26% a year ago. The Company’s capital ratios continue to be in excess of “well-capitalized” regulatory benchmarks, and also exceed the proposed Basel III guidelines.
“We are pleased with the solid results of this quarter and with our progress throughout the year,” Flynn continued. “We believe that our recent success is a result of our customer centric focus and of the investments we have made to strengthen our core businesses. Despite the challenging environment, we remain optimistic and are committed to building shareholder value through our long-term strategy for growth at Associated.”
– More –
| ASSOCIATED BANC-CORP REPORTS FOURTH QUARTER 2011 RESULTS | PAGE 4 |
FOURTH QUARTER 2011 EARNINGS RELEASE CONFERENCE CALL
The Company will host a conference call for investors and analysts at 4:00 p.m. Central Time (CT) today, January 19, 2012. Interested parties can listen to the call live on the Internet through the investor relations section of the company’s website, http://investor.associatedbank.com/ or by dialing 877-348-9354. The slide presentation for the call will be available on the company’s website just prior to the call. The number for international callers is 253-237-1160. Participants should ask the operator for the Associated Banc-Corp fourth quarter 2011 earnings call, or conference ID number 37612937.
An audio archive of the webcast will be available on the company’s website for one month following the call. A replay of the call will be available starting at 7:00 p.m. CT on January 19, 2012 through 11:00 p.m. CT on February 19, 2012 by dialing 855-859-2056 and entering the conference ID number 37612937. The replay number for international callers is 404-537-3406.
ABOUT ASSOCIATED BANC-CORP
Associated Banc-Corp (NASDAQ: ASBC) has total assets of $22 billion and is one of the top 50 financial services holding companies operating in the United States. Headquartered in Green Bay, Wis., Associated has approximately 270 banking locations serving more than 150 communities throughout Wisconsin, Illinois and Minnesota. The company offers a full range of banking services and other financial products and services. More information about Associated Banc-Corp is available at www.associatedbank.com.
FORWARD LOOKING STATEMENTS
Statements made in this document that are not purely historical are forward-looking statements, as defined in the Private Securities Litigation Reform Act of 1995. This includes any statements regarding management’s plans, objectives, or goals for future operations, products or services, and forecasts of its revenues, earnings, or other measures of performance. Forward-looking statements are based on current management expectations and, by their nature, are subject to risks and uncertainties. These statements may be identified by the use of words such as “believe,” “expect,” “anticipate,” “plan,” “estimate,” “should,” “will,” “intend,” “outlook,” or similar expressions. Outcomes related to such statements are subject to numerous risk factors and uncertainties including those listed in the Company’s most recent Annual Report filed on Form 10-K as updated by the Company’s most recent Form 10-Q.
# # #
Consolidated Balance Sheets (Unaudited)
Associated Banc-Corp
| (in thousands) |
December 31, 2011 |
September 30, 2011 |
Seql Qtr $ Change |
June 30, 2011 |
March 31, 2011 |
December 31, 2010 |
Comp Qtr $ Change |
|||||||||||||||||||||
| Assets |
||||||||||||||||||||||||||||
| Cash and due from banks |
$ | 454,958 | $ | 410,644 | $ | 44,314 | $ | 314,682 | $ | 299,040 | $ | 319,487 | $ | 135,471 | ||||||||||||||
| Interest-bearing deposits in other financial institutions |
154,562 | 250,648 | (96,086 | ) | 777,675 | 498,094 | 546,125 | (391,563 | ) | |||||||||||||||||||
| Federal funds sold and securities purchased under agreements to resell |
7,075 | 4,180 | 2,895 | 2,400 | 2,015 | 2,550 | 4,525 | |||||||||||||||||||||
| Securities available for sale, at fair value |
4,937,483 | 5,453,816 | (516,333 | ) | 5,742,034 | 5,883,541 | 6,101,341 | (1,163,858 | ) | |||||||||||||||||||
| Federal Home Loan Bank and Federal Reserve Bank stocks, at cost |
191,188 | 191,128 | 60 | 191,075 | 191,017 | 190,968 | 220 | |||||||||||||||||||||
| Loans held for sale |
249,195 | 201,142 | 48,053 | 84,323 | 85,493 | 144,808 | 104,387 | |||||||||||||||||||||
| Loans |
14,031,071 | 13,503,507 | 527,564 | 13,089,589 | 12,655,322 | 12,616,735 | 1,414,336 | |||||||||||||||||||||
| Allowance for loan losses |
(378,151 | ) | (399,723 | ) | 21,572 | (425,961 | ) | (454,461 | ) | (476,813 | ) | 98,662 | ||||||||||||||||
|
|
|
|
|
|
|
|
|
|
|
|
|
|
|
|||||||||||||||
| Loans, net |
13,652,920 | 13,103,784 | 549,136 | 12,663,628 | 12,200,861 | 12,139,922 | 1,512,998 | |||||||||||||||||||||
| Premises and equipment, net |
223,736 | 208,301 | 15,435 | 192,506 | 186,329 | 190,533 | 33,203 | |||||||||||||||||||||
| Goodwill |
929,168 | 929,168 | — | 929,168 | 929,168 | 929,168 | — | |||||||||||||||||||||
| Other intangible assets, net |
67,574 | 67,970 | (396 | ) | 74,872 | 85,200 | 88,044 | (20,470 | ) | |||||||||||||||||||
| Other assets |
1,056,358 | 1,081,868 | (25,510 | ) | 1,076,112 | 1,112,807 | 1,132,650 | (76,292 | ) | |||||||||||||||||||
|
|
|
|
|
|
|
|
|
|
|
|
|
|
|
|||||||||||||||
| Total assets |
$ | 21,924,217 | $ | 21,902,649 | $ | 21,568 | $ | 22,048,475 | $ | 21,473,565 | $ | 21,785,596 | 138,621 | |||||||||||||||
|
|
|
|
|
|
|
|
|
|
|
|
|
|
|
|||||||||||||||
| Liabilities and Stockholders’ Equity |
||||||||||||||||||||||||||||
| Noninterest-bearing deposits |
$ | 3,928,792 | $ | 3,711,570 | $ | 217,222 | $ | 3,218,722 | $ | 3,285,604 | $ | 3,684,965 | 243,827 | |||||||||||||||
| Interest-bearing deposits, excl Brokered CDs |
10,958,915 | 10,867,013 | 91,902 | 10,530,658 | 10,413,994 | 11,097,788 | (138,873 | ) | ||||||||||||||||||||
| Brokered CDs |
202,948 | 203,827 | (879 | ) | 316,670 | 324,045 | 442,640 | (239,692 | ) | |||||||||||||||||||
|
|
|
|
|
|
|
|
|
|
|
|
|
|
|
|||||||||||||||
| Total deposits |
15,090,655 | 14,782,410 | 308,245 | 14,066,050 | 14,023,643 | 15,225,393 | (134,738 | ) | ||||||||||||||||||||
| Short-term funding |
2,514,485 | 2,531,776 | (17,291 | ) | 3,255,670 | 2,547,805 | 1,747,382 | 767,103 | ||||||||||||||||||||
| Long-term funding |
1,177,071 | 1,477,408 | (300,337 | ) | 1,484,174 | 1,484,177 | 1,413,605 | (236,534 | ) | |||||||||||||||||||
| Accrued expenses and other liabilities |
276,212 | 260,436 | 15,776 | 243,433 | 223,226 | 240,425 | 35,787 | |||||||||||||||||||||
|
|
|
|
|
|
|
|
|
|
|
|
|
|
|
|||||||||||||||
| Total liabilities |
19,058,423 | 19,052,030 | 6,393 | 19,049,327 | 18,278,851 | 18,626,805 | 431,618 | |||||||||||||||||||||
| Stockholders’ Equity |
||||||||||||||||||||||||||||
| Preferred equity |
63,272 | 63,272 | — | 258,051 | 515,238 | 514,388 | (451,116 | ) | ||||||||||||||||||||
| Common stock |
1,746 | 1,746 | — | 1,745 | 1,744 | 1,739 | 7 | |||||||||||||||||||||
| Surplus |
1,586,401 | 1,585,208 | 1,193 | 1,581,594 | 1,576,903 | 1,573,372 | 13,029 | |||||||||||||||||||||
| Retained earnings |
1,148,773 | 1,111,080 | 37,693 | 1,079,076 | 1,055,344 | 1,041,666 | 107,107 | |||||||||||||||||||||
| Accumulated other comprehensive income |
65,602 | 89,313 | (23,711 | ) | 79,345 | 45,731 | 27,626 | 37,976 | ||||||||||||||||||||
| Treasury stock |
— | — | — | (663 | ) | (246 | ) | — | — | |||||||||||||||||||
|
|
|
|
|
|
|
|
|
|
|
|
|
|
|
|||||||||||||||
| Total stockholders’ equity |
2,865,794 | 2,850,619 | 15,175 | 2,999,148 | 3,194,714 | 3,158,791 | (292,997 | ) | ||||||||||||||||||||
|
|
|
|
|
|
|
|
|
|
|
|
|
|
|
|||||||||||||||
| Total liabilities and stockholders’ equity |
$ | 21,924,217 | $ | 21,902,649 | $ | 21,568 | $ | 22,048,475 | $ | 21,473,565 | $ | 21,785,596 | $ | 138,621 | ||||||||||||||
|
|
|
|
|
|
|
|
|
|
|
|
|
|
|
|||||||||||||||
Consolidated Statements of Income (Unaudited)
Associated Banc-Corp
| For The Three Months Ended December 31, |
Quarter | For The Year Ended, December 31, |
Year-to-Date | |||||||||||||||||||||||||||||
| (in thousands, except per share amounts) |
2011 | 2010 | $ Change | % Change | 2011 | 2010 | $ Change | % Change | ||||||||||||||||||||||||
| Interest Income |
||||||||||||||||||||||||||||||||
| Interest and fees on loans |
$ | 149,832 | $ | 146,444 | $ | 3,388 | 2.3 | % | $ | 582,739 | $ | 608,487 | $ | (25,748 | ) | (4.2 | %) | |||||||||||||||
| Interest and dividends on investment securities: |
||||||||||||||||||||||||||||||||
| Taxable |
22,855 | 32,420 | (9,565 | ) | (29.5 | %) | 123,371 | 155,031 | (31,660 | ) | (20.4 | %) | ||||||||||||||||||||
| Tax-exempt |
7,344 | 8,150 | (806 | ) | (9.9 | %) | 29,937 | 33,915 | (3,978 | ) | (11.7 | %) | ||||||||||||||||||||
| Other interest |
1,251 | 2,078 | (827 | ) | (39.8 | %) | 5,575 | 8,693 | (3,118 | ) | (35.9 | %) | ||||||||||||||||||||
|
|
|
|
|
|
|
|
|
|
|
|
|
|||||||||||||||||||||
| Total interest income |
181,282 | 189,092 | (7,810 | ) | (4.1 | %) | 741,622 | 806,126 | (64,504 | ) | (8.0 | %) | ||||||||||||||||||||
| Interest Expense |
||||||||||||||||||||||||||||||||
| Interest on deposits |
14,954 | 23,039 | (8,085 | ) | (35.1 | %) | 65,748 | 106,023 | (40,275 | ) | (38.0 | %) | ||||||||||||||||||||
| Interest on short-term borrowings |
2,156 | 2,288 | (132 | ) | (5.8 | %) | 12,411 | 7,983 | 4,428 | 55.5 | % | |||||||||||||||||||||
| Interest on long-term funding |
12,347 | 12,905 | (558 | ) | (4.3 | %) | 50,632 | 58,341 | (7,709 | ) | (13.2 | %) | ||||||||||||||||||||
|
|
|
|
|
|
|
|
|
|
|
|
|
|||||||||||||||||||||
| Total interest expense |
29,457 | 38,232 | (8,775 | ) | (23.0 | %) | 128,791 | 172,347 | (43,556 | ) | (25.3 | %) | ||||||||||||||||||||
|
|
|
|
|
|
|
|
|
|
|
|
|
|||||||||||||||||||||
| Net Interest Income |
151,825 | 150,860 | 965 | 0.6 | % | 612,831 | 633,779 | (20,948 | ) | (3.3 | %) | |||||||||||||||||||||
| Provision for loan losses |
1,000 | 63,000 | (62,000 | ) | (98.4 | %) | 52,000 | 390,010 | (338,010 | ) | (86.7 | %) | ||||||||||||||||||||
|
|
|
|
|
|
|
|
|
|
|
|
|
|||||||||||||||||||||
| Net interest income after provision for loan losses |
150,825 | 87,860 | 62,965 | 71.7 | % | 560,831 | 243,769 | 317,062 | 130.1 | % | ||||||||||||||||||||||
| Noninterest Income |
||||||||||||||||||||||||||||||||
| Trust service fees |
9,511 | 9,518 | (7 | ) | (0.1 | %) | 39,145 | 37,853 | 1,292 | 3.4 | % | |||||||||||||||||||||
| Service charges on deposit accounts |
17,783 | 20,390 | (2,607 | ) | (12.8 | %) | 75,908 | 96,740 | (20,832 | ) | (21.5 | %) | ||||||||||||||||||||
| Card-based and other nondeposit fees |
11,269 | 15,842 | (4,573 | ) | (28.9 | %) | 57,905 | 59,299 | (1,394 | ) | (2.4 | %) | ||||||||||||||||||||
| Retail commissions |
14,881 | 14,441 | 440 | 3.0 | % | 62,784 | 61,256 | 1,528 | 2.5 | % | ||||||||||||||||||||||
|
|
|
|
|
|
|
|
|
|
|
|
|
|||||||||||||||||||||
| Total core fee-based revenue |
53,444 | 60,191 | (6,747 | ) | (11.2 | %) | 235,742 | 255,148 | (19,406 | ) | (7.6 | %) | ||||||||||||||||||||
| Mortgage banking, net |
9,677 | 13,229 | (3,552 | ) | (26.9 | %) | 12,723 | 33,136 | (20,413 | ) | (61.6 | %) | ||||||||||||||||||||
| Capital market fees, net |
3,950 | 5,187 | (1,237 | ) | (23.8 | %) | 8,711 | 6,072 | 2,639 | 43.5 | % | |||||||||||||||||||||
| Bank owned life insurance income |
3,820 | 4,509 | (689 | ) | (15.3 | %) | 14,896 | 15,761 | (865 | ) | (5.5 | %) | ||||||||||||||||||||
| Asset sale gains (losses), net |
525 | 514 | 11 | 2.1 | % | (2,849 | ) | (2,004 | ) | (845 | ) | 42.2 | % | |||||||||||||||||||
| Investment securities gains (losses), net |
(310 | ) | (1,883 | ) | 1,573 | (83.5 | %) | (1,112 | ) | 24,917 | (26,029 | ) | (104.5 | %) | ||||||||||||||||||
| Other |
2,750 | 2,950 | (200 | ) | (6.8 | %) | 14,358 | 12,493 | 1,865 | 14.9 | % | |||||||||||||||||||||
|
|
|
|
|
|
|
|
|
|
|
|
|
|||||||||||||||||||||
| Total noninterest income |
73,856 | 84,697 | (10,841 | ) | (12.8 | %) | 282,469 | 345,523 | (63,054 | ) | (18.2 | %) | ||||||||||||||||||||
| Noninterest Expense |
||||||||||||||||||||||||||||||||
| Personnel expense |
89,785 | 83,912 | 5,873 | 7.0 | % | 358,295 | 323,249 | 35,046 | 10.8 | % | ||||||||||||||||||||||
| Occupancy |
13,796 | 12,899 | 897 | 7.0 | % | 55,939 | 49,937 | 6,002 | 12.0 | % | ||||||||||||||||||||||
| Equipment |
5,286 | 4,899 | 387 | 7.9 | % | 19,873 | 18,371 | 1,502 | 8.2 | % | ||||||||||||||||||||||
| Data processing |
9,080 | 7,047 | 2,033 | 28.8 | % | 32,475 | 29,714 | 2,761 | 9.3 | % | ||||||||||||||||||||||
| Business development and advertising |
6,904 | 4,870 | 2,034 | 41.8 | % | 23,038 | 18,385 | 4,653 | 25.3 | % | ||||||||||||||||||||||
| Other intangible amortization |
1,179 | 1,206 | (27 | ) | (2.2 | %) | 4,714 | 4,919 | (205 | ) | (4.2 | %) | ||||||||||||||||||||
| Loan expense |
3,469 | 2,735 | 734 | 26.8 | % | 12,008 | 9,965 | 2,043 | 20.5 | % | ||||||||||||||||||||||
| Legal and professional fees |
4,651 | 5,353 | (702 | ) | (13.1 | %) | 18,205 | 20,439 | (2,234 | ) | (10.9 | %) | ||||||||||||||||||||
| Losses other than loans |
11,890 | 7,470 | 4,420 | 59.2 | % | 17,921 | 14,793 | 3,128 | 21.1 | % | ||||||||||||||||||||||
| Foreclosure/OREO expense |
7,493 | 9,860 | (2,367 | ) | (24.0 | %) | 30,743 | 33,844 | (3,101 | ) | (9.2 | %) | ||||||||||||||||||||
| FDIC expense |
6,136 | 11,095 | (4,959 | ) | (44.7 | %) | 28,484 | 46,377 | (17,893 | ) | (38.6 | %) | ||||||||||||||||||||
| Other |
14,982 | 15,497 | (515 | ) | (3.3 | %) | 58,178 | 60,327 | (2,149 | ) | (3.6 | %) | ||||||||||||||||||||
|
|
|
|
|
|
|
|
|
|
|
|
|
|||||||||||||||||||||
| Total noninterest expense |
174,651 | 166,843 | 7,808 | 4.7 | % | 659,873 | 630,320 | 29,553 | 4.7 | % | ||||||||||||||||||||||
|
|
|
|
|
|
|
|
|
|
|
|
|
|||||||||||||||||||||
| Income (Loss) before income taxes |
50,030 | 5,714 | 44,316 | N/M | 183,427 | (41,028 | ) | 224,455 | N/M | |||||||||||||||||||||||
| Income tax expense (benefit) |
8,905 | (8,294 | ) | 17,199 | N/M | 43,728 | (40,172 | ) | 83,900 | N/M | ||||||||||||||||||||||
|
|
|
|
|
|
|
|
|
|
|
|
|
|||||||||||||||||||||
| Net income (loss) |
41,125 | 14,008 | 27,117 | 193.6 | % | $ | 139,699 | $ | (856 | ) | $ | 140,555 | N/M | |||||||||||||||||||
| Preferred stock dividends and discount |
1,300 | 7,400 | (6,100 | ) | (82.4 | %) | 24,830 | 29,531 | (4,701 | ) | (15.9 | %) | ||||||||||||||||||||
|
|
|
|
|
|
|
|
|
|
|
|
|
|||||||||||||||||||||
| Net income (loss) available to common equity |
$ | 39,825 | $ | 6,608 | $ | 33,217 | N/M | $ | 114,869 | $ | (30,387 | ) | $ | 145,256 | N/M | |||||||||||||||||
|
|
|
|
|
|
|
|
|
|
|
|
|
|||||||||||||||||||||
| Earnings (Loss) Per Common Share: |
||||||||||||||||||||||||||||||||
| Basic |
$ | 0.23 | $ | 0.04 | $ | 0.19 | N/M | $ | 0.66 | $ | (0.18 | ) | $ | 0.84 | N/M | |||||||||||||||||
| Diluted |
$ | 0.23 | $ | 0.04 | $ | 0.19 | N/M | $ | 0.66 | $ | (0.18 | ) | $ | 0.84 | N/M | |||||||||||||||||
| Average Common Shares Outstanding: |
||||||||||||||||||||||||||||||||
| Basic |
173,523 | 173,068 | 455 | 0.3 | % | 173,370 | 171,230 | 2,140 | 1.3 | % | ||||||||||||||||||||||
| Diluted |
173,523 | 173,072 | 451 | 0.3 | % | 173,372 | 171,230 | 2,142 | 1.3 | % | ||||||||||||||||||||||
N/M = Not meaningful.
Consolidated Statements of Income (Unaudited) - Quarterly Trend
Associated Banc-Corp
| Sequential Qtr | Comparable Qtr | |||||||||||||||||||||||||||||||||||
| (in thousands, except per share amounts) |
4Q11 | 3Q11 | $ Change | % Change | 2Q11 | 1Q11 | 4Q10 | $ Change | % Change | |||||||||||||||||||||||||||
| Interest Income |
||||||||||||||||||||||||||||||||||||
| Interest and fees on loans |
$ | 149,832 | $ | 145,778 | $ | 4,054 | 2.8 | % | $ | 144,358 | $ | 142,771 | $ | 146,444 | $ | 3,388 | 2.3 | % | ||||||||||||||||||
| Interest and dividends on investment securities: |
||||||||||||||||||||||||||||||||||||
| Taxable |
22,855 | 30,513 | (7,658 | ) | (25.1 | %) | 35,351 | 34,652 | 32,420 | (9,565 | ) | (29.5 | %) | |||||||||||||||||||||||
| Tax-exempt |
7,344 | 7,376 | (32 | ) | (0.4 | %) | 7,504 | 7,713 | 8,150 | (806 | ) | (9.9 | %) | |||||||||||||||||||||||
| Other interest |
1,251 | 1,428 | (177 | ) | (12.4 | %) | 1,438 | 1,458 | 2,078 | (827 | ) | (39.8 | %) | |||||||||||||||||||||||
|
|
|
|
|
|
|
|
|
|
|
|
|
|
|
|||||||||||||||||||||||
| Total interest income |
181,282 | 185,095 | (3,813 | ) | (2.1 | %) | 188,651 | 186,594 | 189,092 | (7,810 | ) | (4.1 | %) | |||||||||||||||||||||||
| Interest Expense |
||||||||||||||||||||||||||||||||||||
| Interest on deposits |
14,954 | 15,644 | (690 | ) | (4.4 | %) | 16,901 | 18,249 | 23,039 | (8,085 | ) | (35.1 | %) | |||||||||||||||||||||||
| Interest on short-term borrowings |
2,156 | 3,039 | (883 | ) | (29.1 | %) | 3,637 | 3,579 | 2,288 | (132 | ) | (5.8 | %) | |||||||||||||||||||||||
| Interest on long-term funding |
12,347 | 13,252 | (905 | ) | (6.8 | %) | 13,990 | 11,043 | 12,905 | (558 | ) | (4.3 | %) | |||||||||||||||||||||||
|
|
|
|
|
|
|
|
|
|
|
|
|
|
|
|||||||||||||||||||||||
| Total interest expense |
29,457 | 31,935 | (2,478 | ) | (7.8 | %) | 34,528 | 32,871 | 38,232 | (8,775 | ) | (23.0 | %) | |||||||||||||||||||||||
|
|
|
|
|
|
|
|
|
|
|
|
|
|
|
|||||||||||||||||||||||
| Net Interest Income |
151,825 | 153,160 | (1,335 | ) | (0.9 | %) | 154,123 | 153,723 | 150,860 | 965 | 0.6 | % | ||||||||||||||||||||||||
| Provision for loan losses |
1,000 | 4,000 | (3,000 | ) | (75.0 | %) | 16,000 | 31,000 | 63,000 | (62,000 | ) | (98.4 | %) | |||||||||||||||||||||||
|
|
|
|
|
|
|
|
|
|
|
|
|
|
|
|||||||||||||||||||||||
| Net interest income after provision for loan losses |
150,825 | 149,160 | 1,665 | 1.1 | % | 138,123 | 122,723 | 87,860 | 62,965 | 71.7 | % | |||||||||||||||||||||||||
| Noninterest Income |
||||||||||||||||||||||||||||||||||||
| Trust service fees |
9,511 | 9,791 | (280 | ) | (2.9 | %) | 10,012 | 9,831 | 9,518 | (7 | ) | (0.1 | %) | |||||||||||||||||||||||
| Service charges on deposit accounts |
17,783 | 19,949 | (2,166 | ) | (10.9 | %) | 19,112 | 19,064 | 20,390 | (2,607 | ) | (12.8 | %) | |||||||||||||||||||||||
| Card-based and other nondeposit fees |
11,269 | 15,291 | (4,022 | ) | (26.3 | %) | 15,747 | 15,598 | 15,842 | (4,573 | ) | (28.9 | %) | |||||||||||||||||||||||
| Retail commissions |
14,881 | 15,047 | (166 | ) | (1.1 | %) | 16,475 | 16,381 | 14,441 | 440 | 3.0 | % | ||||||||||||||||||||||||
|
|
|
|
|
|
|
|
|
|
|
|
|
|
|
|||||||||||||||||||||||
| Total core fee-based revenue |
53,444 | 60,078 | (6,634 | ) | (11.0 | %) | 61,346 | 60,874 | 60,191 | (6,747 | ) | (11.2 | %) | |||||||||||||||||||||||
| Mortgage banking, net |
9,677 | 4,521 | 5,156 | 114.0 | % | (3,320 | ) | 1,845 | 13,229 | (3,552 | ) | (26.9 | %) | |||||||||||||||||||||||
| Capital market fees, net |
3,950 | 3,273 | 677 | 20.7 | % | (890 | ) | 2,378 | 5,187 | (1,237 | ) | (23.8 | %) | |||||||||||||||||||||||
| Bank owned life insurance income |
3,820 | 3,990 | (170 | ) | (4.3 | %) | 3,500 | 3,586 | 4,509 | (689 | ) | (15.3 | %) | |||||||||||||||||||||||
| Asset sale gains (losses), net |
525 | (1,179 | ) | 1,704 | (144.5 | %) | (209 | ) | (1,986 | ) | 514 | 11 | 2.1 | % | ||||||||||||||||||||||
| Investment securities losses, net |
(310 | ) | (744 | ) | 434 | (58.3 | %) | (36 | ) | (22 | ) | (1,883 | ) | 1,573 | (83.5 | %) | ||||||||||||||||||||
| Other |
2,750 | 1,737 | 1,013 | 58.3 | % | 4,364 | 5,507 | 2,950 | (200 | ) | (6.8 | %) | ||||||||||||||||||||||||
|
|
|
|
|
|
|
|
|
|
|
|
|
|
|
|||||||||||||||||||||||
| Total noninterest income |
73,856 | 71,676 | 2,180 | 3.0 | % | 64,755 | 72,182 | 84,697 | (10,841 | ) | (12.8 | %) | ||||||||||||||||||||||||
| Noninterest Expense |
||||||||||||||||||||||||||||||||||||
| Personnel expense |
89,785 | 90,377 | (592 | ) | (0.7 | %) | 89,203 | 88,930 | 83,912 | 5,873 | 7.0 | % | ||||||||||||||||||||||||
| Occupancy |
13,796 | 14,205 | (409 | ) | (2.9 | %) | 12,663 | 15,275 | 12,899 | 897 | 7.0 | % | ||||||||||||||||||||||||
| Equipment |
5,286 | 4,851 | 435 | 9.0 | % | 4,969 | 4,767 | 4,899 | 387 | 7.9 | % | |||||||||||||||||||||||||
| Data processing |
9,080 | 7,887 | 1,193 | 15.1 | % | 7,974 | 7,534 | 7,047 | 2,033 | 28.8 | % | |||||||||||||||||||||||||
| Business development and advertising |
6,904 | 5,539 | 1,365 | 24.6 | % | 5,652 | 4,943 | 4,870 | 2,034 | 41.8 | % | |||||||||||||||||||||||||
| Other intangible amortization |
1,179 | 1,179 | — | 0.0 | % | 1,178 | 1,178 | 1,206 | (27 | ) | (2.2 | %) | ||||||||||||||||||||||||
| Loan expense |
3,469 | 2,600 | 869 | 33.4 | % | 2,983 | 2,956 | 2,735 | 734 | 26.8 | % | |||||||||||||||||||||||||
| Legal and professional fees |
4,651 | 4,289 | 362 | 8.4 | % | 4,783 | 4,482 | 5,353 | (702 | ) | (13.1 | %) | ||||||||||||||||||||||||
| Losses other than loans |
11,890 | 1,659 | 10,231 | N/M | (1,925 | ) | 6,297 | 7,470 | 4,420 | 59.2 | % | |||||||||||||||||||||||||
| Foreclosure/OREO expense |
7,493 | 7,662 | (169 | ) | (2.2 | %) | 9,527 | 6,061 | 9,860 | (2,367 | ) | (24.0 | %) | |||||||||||||||||||||||
| FDIC expense |
6,136 | 6,906 | (770 | ) | (11.1 | %) | 7,198 | 8,244 | 11,095 | (4,959 | ) | (44.7 | %) | |||||||||||||||||||||||
| Other |
14,982 | 15,006 | (24 | ) | (0.2 | %) | 14,681 | 13,509 | 15,497 | (515 | ) | (3.3 | %) | |||||||||||||||||||||||
|
|
|
|
|
|
|
|
|
|
|
|
|
|
|
|||||||||||||||||||||||
| Total noninterest expense |
174,651 | 162,160 | 12,491 | 7.7 | % | 158,886 | 164,176 | 166,843 | 7,808 | 4.7 | % | |||||||||||||||||||||||||
|
|
|
|
|
|
|
|
|
|
|
|
|
|
|
|||||||||||||||||||||||
| Income before income taxes |
50,030 | 58,676 | (8,646 | ) | (14.7 | %) | 43,992 | 30,729 | 5,714 | 44,316 | N/M | |||||||||||||||||||||||||
| Income tax expense (benefit) |
8,905 | 17,337 | (8,432 | ) | (48.6 | %) | 9,610 | 7,876 | (8,294 | ) | 17,199 | N/M | ||||||||||||||||||||||||
|
|
|
|
|
|
|
|
|
|
|
|
|
|
|
|||||||||||||||||||||||
| Net income |
41,125 | 41,339 | (214 | ) | (0.5 | %) | 34,382 | 22,853 | 14,008 | 27,117 | 193.6 | % | ||||||||||||||||||||||||
| Preferred stock dividends and discount |
1,300 | 7,305 | (6,005 | ) | (82.2 | %) | 8,812 | 7,413 | 7,400 | (6,100 | ) | (82.4 | %) | |||||||||||||||||||||||
|
|
|
|
|
|
|
|
|
|
|
|
|
|
|
|||||||||||||||||||||||
| Net income available to common equity |
$ | 39,825 | $ | 34,034 | $ | 5,791 | 17.0 | % | $ | 25,570 | $ | 15,440 | $ | 6,608 | $ | 33,217 | N/M | |||||||||||||||||||
|
|
|
|
|
|
|
|
|
|
|
|
|
|
|
|||||||||||||||||||||||
| Earnings Per Common Share: |
||||||||||||||||||||||||||||||||||||
| Basic |
$ | 0.23 | $ | 0.20 | $ | 0.03 | 15.0 | % | $ | 0.15 | $ | 0.09 | $ | 0.04 | $ | 0.19 | N/M | |||||||||||||||||||
| Diluted |
$ | 0.23 | $ | 0.20 | $ | 0.03 | 15.0 | % | $ | 0.15 | $ | 0.09 | $ | 0.04 | $ | 0.19 | N/M | |||||||||||||||||||
| Average Common Shares Outstanding: |
||||||||||||||||||||||||||||||||||||
| Basic |
173,523 | 173,418 | 105 | 0.1 | % | 173,323 | 173,213 | 173,068 | 455 | 0.3 | % | |||||||||||||||||||||||||
| Diluted |
173,523 | 173,418 | 105 | 0.1 | % | 173,327 | 173,217 | 173,072 | 451 | 0.3 | % | |||||||||||||||||||||||||
N/M = Not meaningful.
Selected Quarterly Information
Associated Banc-Corp
| (in thousands, except per share and full time equivalent |
YTD 2011 | YTD 2010 | 4th Qtr 2011 | 3rd Qtr 2011 | 2nd Qtr 2011 | 1st Qtr 2011 | 4th Qtr 2010 | |||||||||||||||||||||
| Summary of Operations |
||||||||||||||||||||||||||||
| Net interest income |
$ | 612,831 | $ | 633,779 | $ | 151,825 | $ | 153,160 | $ | 154,123 | $ | 153,723 | $ | 150,860 | ||||||||||||||
| Provision for loan losses |
52,000 | 390,010 | 1,000 | 4,000 | 16,000 | 31,000 | 63,000 | |||||||||||||||||||||
| Asset sale gains (losses), net |
(2,849 | ) | (2,004 | ) | 525 | (1,179 | ) | (209 | ) | (1,986 | ) | 514 | ||||||||||||||||
| Investment securities gains (losses), net |
(1,112 | ) | 24,917 | (310 | ) | (744 | ) | (36 | ) | (22 | ) | (1,883 | ) | |||||||||||||||
| Noninterest income (excluding securities & asset gains) |
286,430 | 322,610 | 73,641 | 73,599 | 65,000 | 74,190 | 86,066 | |||||||||||||||||||||
| Noninterest expense |
659,873 | 630,320 | 174,651 | 162,160 | 158,886 | 164,176 | 166,843 | |||||||||||||||||||||
| Income (loss) before income taxes |
183,427 | (41,028 | ) | 50,030 | 58,676 | 43,992 | 30,729 | 5,714 | ||||||||||||||||||||
| Income tax expense (benefit) |
43,728 | (40,172 | ) | 8,905 | 17,337 | 9,610 | 7,876 | (8,294 | ) | |||||||||||||||||||
| Net income (loss) |
139,699 | (856 | ) | 41,125 | 41,339 | 34,382 | 22,853 | 14,008 | ||||||||||||||||||||
| Net income (loss) available to common equity |
114,869 | (30,387 | ) | 39,825 | 34,034 | 25,570 | 15,440 | 6,608 | ||||||||||||||||||||
| Taxable equivalent adjustment |
21,374 | 23,635 | 5,307 | 5,295 | 5,332 | 5,440 | 5,721 | |||||||||||||||||||||
| Per Common Share Data |
||||||||||||||||||||||||||||
| Net income (loss): |
||||||||||||||||||||||||||||
| Basic |
$ | 0.66 | $ | (0.18 | ) | $ | 0.23 | $ | 0.20 | $ | 0.15 | $ | 0.09 | $ | 0.04 | |||||||||||||
| Diluted |
0.66 | (0.18 | ) | 0.23 | 0.20 | 0.15 | 0.09 | 0.04 | ||||||||||||||||||||
| Dividends |
0.04 | 0.04 | 0.01 | 0.01 | 0.01 | 0.01 | 0.01 | |||||||||||||||||||||
| Market Value: |
||||||||||||||||||||||||||||
| High |
$ | 15.36 | $ | 16.10 | $ | 11.78 | $ | 14.17 | $ | 15.02 | $ | 15.36 | $ | 15.49 | ||||||||||||||
| Low |
8.95 | 11.48 | 9.15 | 8.95 | 13.06 | 13.83 | 12.57 | |||||||||||||||||||||
| Close |
11.17 | 15.15 | 11.17 | 9.30 | 13.90 | 14.85 | 15.15 | |||||||||||||||||||||
| Book value |
16.15 | 15.28 | 16.15 | 16.07 | 15.81 | 15.46 | 15.28 | |||||||||||||||||||||
| Tangible book value |
10.68 | 9.77 | 10.68 | 10.59 | 10.33 | 9.97 | 9.77 | |||||||||||||||||||||
| Performance Ratios (annualized) |
||||||||||||||||||||||||||||
| Earning assets yield |
3.92 | % | 4.03 | % | 3.81 | % | 3.88 | % | 4.00 | % | 4.01 | % | 3.89 | % | ||||||||||||||
| Interest-bearing liabilities rate |
0.85 | 1.06 | 0.78 | 0.83 | 0.91 | 0.89 | 0.98 | |||||||||||||||||||||
| Net interest margin |
3.26 | 3.20 | 3.21 | 3.23 | 3.29 | 3.32 | 3.13 | |||||||||||||||||||||
| Return on average assets |
0.65 | (0.00 | ) | 0.75 | 0.75 | 0.64 | 0.43 | 0.25 | ||||||||||||||||||||
| Return on average equity |
4.66 | (0.03 | ) | 5.71 | 5.49 | 4.63 | 2.92 | 1.74 | ||||||||||||||||||||
| Return on average Tier 1 common equity (1) |
6.71 | (1.95 | ) | 8.96 | 7.83 | 6.07 | 3.76 | 1.59 | ||||||||||||||||||||
| Efficiency ratio (2) |
71.68 | 64.32 | 75.68 | 69.88 | 70.79 | 70.36 | 68.76 | |||||||||||||||||||||
| Effective tax rate (benefit) |
23.84 | 97.91 | 17.80 | 29.55 | 21.84 | 25.63 | (145.13 | ) | ||||||||||||||||||||
| Dividend payout ratio (3) |
6.06 | 22.22 | 4.35 | 5.00 | 6.67 | 11.11 | 25.00 | |||||||||||||||||||||
| Average Balances |
||||||||||||||||||||||||||||
| Assets |
$ | 21,588,620 | $ | 22,625,065 | $ | 21,755,870 | $ | 21,729,187 | $ | 21,526,155 | $ | 21,336,858 | $ | 22,034,041 | ||||||||||||||
| Earning assets |
19,442,263 | 20,568,495 | 19,506,627 | 19,530,007 | 19,431,292 | 19,297,866 | 19,950,784 | |||||||||||||||||||||
| Interest-bearing liabilities |
15,120,824 | 16,304,220 | 15,095,689 | 15,215,517 | 15,261,514 | 14,907,465 | 15,476,002 | |||||||||||||||||||||
| Loans (4) |
13,278,848 | 13,186,712 | 14,043,585 | 13,376,928 | 13,004,904 | 12,673,844 | 12,587,702 | |||||||||||||||||||||
| Deposits |
14,401,127 | 16,946,301 | 14,893,469 | 14,405,311 | 14,052,689 | 14,245,614 | 16,452,473 | |||||||||||||||||||||
| Short and long-term funding |
4,100,825 | 2,452,610 | 3,857,252 | 4,227,319 | 4,434,500 | 3,883,122 | 2,311,016 | |||||||||||||||||||||
| Common stockholders’ equity |
2,730,643 | 2,670,953 | 2,792,823 | 2,765,023 | 2,704,909 | 2,657,956 | 2,681,813 | |||||||||||||||||||||
| Stockholders’ equity |
2,997,290 | 3,183,572 | 2,856,095 | 2,987,178 | 2,976,840 | 3,172,636 | 3,195,657 | |||||||||||||||||||||
| Common stockholders’ equity / assets |
12.65 | % | 11.81 | % | 12.84 | % | 12.72 | % | 12.57 | % | 12.46 | % | 12.17 | % | ||||||||||||||
| Stockholders’ equity / assets |
13.88 | % | 14.07 | % | 13.13 | % | 13.75 | % | 13.83 | % | 14.87 | % | 14.50 | % | ||||||||||||||
| At Period End |
||||||||||||||||||||||||||||
| Assets |
$ | 21,924,217 | $ | 21,902,649 | $ | 22,048,475 | $ | 21,473,565 | $ | 21,785,596 | ||||||||||||||||||
| Loans |
14,031,071 | 13,503,507 | 13,089,589 | 12,655,322 | 12,616,735 | |||||||||||||||||||||||
| Allowance for loan losses |
378,151 | 399,723 | 425,961 | 454,461 | 476,813 | |||||||||||||||||||||||
| Goodwill |
929,168 | 929,168 | 929,168 | 929,168 | 929,168 | |||||||||||||||||||||||
| Mortgage servicing rights, net |
48,152 | 47,370 | 53,093 | 62,243 | 63,909 | |||||||||||||||||||||||
| Other intangible assets |
19,422 | 20,600 | 21,779 | 22,957 | 24,135 | |||||||||||||||||||||||
| Deposits |
15,090,655 | 14,782,410 | 14,066,050 | 14,023,643 | 15,225,393 | |||||||||||||||||||||||
| Short and long-term funding |
3,691,556 | 4,009,184 | 4,739,844 | 4,031,982 | 3,160,987 | |||||||||||||||||||||||
| Stockholders’ equity |
2,865,794 | 2,850,619 | 2,999,148 | 3,194,714 | 3,158,791 | |||||||||||||||||||||||
| Stockholders’ equity / assets |
13.07 | % | 13.01 | % | 13.60 | % | 14.88 | % | 14.50 | % | ||||||||||||||||||
| Tangible common equity / tangible assets (5) |
8.84 | % | 8.77 | % | 8.49 | % | 8.42 | % | 8.12 | % | ||||||||||||||||||
| Tangible equity/tangible assets (6) |
9.14 | % | 9.07 | % | 9.71 | % | 10.93 | % | 10.59 | % | ||||||||||||||||||
| Tier 1 common equity / risk-weighted assets (7) |
12.24 | % | 12.44 | % | 12.61 | % | 12.65 | % | 12.26 | % | ||||||||||||||||||
| Tier 1 leverage ratio |
9.81 | % | 9.62 | % | 10.46 | % | 11.65 | % | 11.19 | % | ||||||||||||||||||
| Tier 1 risk-based capital ratio |
14.08 | % | 14.35 | % | 16.03 | % | 18.08 | % | 17.58 | % | ||||||||||||||||||
| Total risk-based capital ratio |
15.53 | % | 15.81 | % | 17.50 | % | 19.56 | % | 19.05 | % | ||||||||||||||||||
| Shares outstanding, end of period |
173,575 | 173,474 | 173,374 | 173,274 | 173,112 | |||||||||||||||||||||||
| Selected trend information |
||||||||||||||||||||||||||||
| Average full time equivalent employees |
5,056 | 4,980 | 4,977 | 4,929 | 4,865 | |||||||||||||||||||||||
| Trust assets under management, at market value |
$ | 5,600,000 | $ | 5,300,000 | $ | 5,700,000 | $ | 5,900,000 | $ | 5,700,000 | ||||||||||||||||||
| Mortgage loans originated for sale during period |
843,614 | 470,530 | 250,880 | 290,013 | 629,978 | |||||||||||||||||||||||
| Mortgage portfolio serviced for others |
7,321,000 | 7,281,000 | 7,367,000 | 7,476,000 | 7,453,000 | |||||||||||||||||||||||
| Mortgage servicing rights, net / Portfolio serviced for others |
0.66 | % | 0.65 | % | 0.72 | % | 0.83 | % | 0.86 | % | ||||||||||||||||||
| (1) | Return on average Tier 1 common equity = Net income available to common equity divided by average Tier 1 capital excluding qualifying perpetual preferred stock and qualifying trust preferred securities. This is a non-GAAP financial measure. |
| (2) | Efficiency ratio = Noninterest expense divided by sum of taxable equivalent net interest income plus noninterest income, excluding investment securities gains, net, and asset sales gains, net. This is a non-GAAP financial measure. |
| (3) | Ratio is based upon basic earnings per common share. |
| (4) | Loans held for sale have been included in the average balances. |
| (5) | Tangible common equity to tangible assets = Common stockholders’ equity excluding goodwill and other intangible assets divided by assets excluding goodwill and other intangible assets. This is a non-GAAP financial measure. |
| (6) | Tangible equity to tangible assets = Stockholders’ equity excluding goodwill and other intangible assets divided by assets excluding goodwill and other intangible assets. This is a non-GAAP financial measure. |
| (7) | Tier 1 common equity to risk-weighted assets = Tier 1 capital excluding qualifying perpetual preferred stock and qualifying trust preferred securities divided by risk-weighted assets. This is a non-GAAP financial measure. |
Selected Asset Quality Information
Associated Banc-Corp
| (in thousands) |
Dec 31, 2011 | Sep 30, 2011 | Dec11 vs Sep11 % Change |
Jun 30, 2011 | Mar 31, 2011 | Dec 31, 2010 | Dec11 vs Dec10 % Change |
|||||||||||||||||||||
| Allowance for Loan Losses |
||||||||||||||||||||||||||||
| Beginning balance |
$ | 399,723 | $ | 425,961 | (6.2 | %) | $ | 454,461 | $ | 476,813 | $ | 522,018 | (23.4 | %) | ||||||||||||||
| Provision for loan losses |
1,000 | 4,000 | (75.0 | %) | 16,000 | 31,000 | 63,000 | (98.4 | %) | |||||||||||||||||||
| Charge offs |
(34,056 | ) | (38,155 | ) | (10.7 | %) | (52,365 | ) | (65,156 | ) | (118,368 | ) | (71.2 | %) | ||||||||||||||
| Recoveries |
11,484 | 7,917 | 45.1 | % | 7,865 | 11,804 | 10,163 | 13.0 | % | |||||||||||||||||||
|
|
|
|
|
|
|
|
|
|
|
|||||||||||||||||||
| Net charge offs |
(22,572 | ) | (30,238 | ) | (25.4 | %) | (44,500 | ) | (53,352 | ) | (108,205 | ) | (79.1 | %) | ||||||||||||||
|
|
|
|
|
|
|
|
|
|
|
|||||||||||||||||||
| Ending balance |
$ | 378,151 | $ | 399,723 | (5.4 | %) | $ | 425,961 | $ | 454,461 | $ | 476,813 | (20.7 | %) | ||||||||||||||
|
|
|
|
|
|
|
|
|
|
|
|||||||||||||||||||
| Reserve for losses on unfunded commitments |
$ | 14,700 | $ | 14,900 | (1.3 | %) | $ | 14,900 | $ | 17,800 | $ | 17,374 | (15.4 | %) | ||||||||||||||
| Dec 31, 2011 | Sep 30, 2011 | Dec11 vs Sep11 % Change |
Jun 30, 2011 | Mar 31, 2011 | Dec 31, 2010 | Dec11 vs Dec10 % Change |
||||||||||||||||||||||
| Net Charge Offs |
||||||||||||||||||||||||||||
| Commercial and industrial |
$ | 231 | $ | 3,741 | (93.8 | %) | $ | 14,026 | $ | 4,314 | $ | 27,041 | (99.1 | %) | ||||||||||||||
| Commercial real estate - owner occupied |
539 | 134 | 302.2 | % | 4,436 | 1,867 | 11,778 | (95.4 | %) | |||||||||||||||||||
| Lease financing |
19 | (1,889 | ) | (101.0 | %) | 60 | 28 | 9,159 | (99.8 | %) | ||||||||||||||||||
|
|
|
|
|
|
|
|
|
|
|
|||||||||||||||||||
| Commercial and business lending |
789 | 1,986 | (60.3 | %) | 18,522 | 6,209 | 47,978 | (98.4 | %) | |||||||||||||||||||
| Commercial real estate - investor |
2,394 | 10,472 | (77.1 | %) | 4,941 | 6,006 | 8,325 | (71.2 | %) | |||||||||||||||||||
| Real estate - construction |
7,088 | 5,646 | 25.5 | % | 6,031 | 11,936 | 31,879 | (77.8 | %) | |||||||||||||||||||
|
|
|
|
|
|
|
|
|
|
|
|||||||||||||||||||
| Commercial real estate lending |
9,482 | 16,118 | (41.2 | %) | 10,972 | 17,942 | 40,204 | (76.4 | %) | |||||||||||||||||||
|
|
|
|
|
|
|
|
|
|
|
|||||||||||||||||||
| Total commercial |
10,271 | 18,104 | (43.3 | %) | 29,494 | 24,151 | 88,182 | (88.4 | %) | |||||||||||||||||||
| Home equity |
8,113 | 8,736 | (7.1 | %) | 8,251 | 14,322 | 14,541 | (44.2 | %) | |||||||||||||||||||
| Installment(1) |
452 | 764 | (40.8 | %) | 664 | 12,670 | 2,369 | (80.9 | %) | |||||||||||||||||||
|
|
|
|
|
|
|
|
|
|
|
|||||||||||||||||||
| Total retail |
8,565 | 9,500 | (9.8 | %) | 8,915 | 26,992 | 16,910 | (49.3 | %) | |||||||||||||||||||
| Residential mortgage |
3,736 | 2,634 | 41.8 | % | 6,091 | 2,209 | 3,113 | 20.0 | % | |||||||||||||||||||
|
|
|
|
|
|
|
|
|
|
|
|||||||||||||||||||
| Total net charge offs |
$ | 22,572 | $ | 30,238 | (25.4 | %) | $ | 44,500 | $ | 53,352 | $ | 108,205 | (79.1 | %) | ||||||||||||||
|
|
|
|
|
|
|
|
|
|
|
|||||||||||||||||||
| Dec 31, 2011 | Sep 30, 2011 | Jun 30, 2011 | Mar 31, 2011 | Dec 31, 2010 | ||||||||||||||||||||||||
| Net Charge Offs to Average Loans (in basis points) * |
||||||||||||||||||||||||||||
| Commercial and industrial |
3 | 46 | 180 | 60 | 364 | |||||||||||||||||||||||
| Commercial real estate - owner occupied |
20 | 5 | 174 | 72 | 438 | |||||||||||||||||||||||
| Lease financing |
14 | (1,396 | ) | 44 | 20 | 5,051 | ||||||||||||||||||||||
|
|
|
|
|
|
|
|
|
|
|
|||||||||||||||||||
| Commercial and business lending |
7 | 18 | 177 | 63 | 466 | |||||||||||||||||||||||
| Commercial real estate - investor |
38 | 169 | 83 | 104 | 139 | |||||||||||||||||||||||
| Real estate - construction |
502 | 407 | 454 | 888 | 1,820 | |||||||||||||||||||||||
|
|
|
|
|
|
|
|
|
|
|
|||||||||||||||||||
| Commercial real estate lending |
122 | 213 | 151 | 252 | 518 | |||||||||||||||||||||||
|
|
|
|
|
|
|
|
|
|
|
|||||||||||||||||||
| Total commercial |
53 | 98 | 166 | 142 | 488 | |||||||||||||||||||||||
| Home equity |
127 | 134 | 127 | 227 | 231 | |||||||||||||||||||||||
| Installment |
32 | 52 | 42 | 759 | 131 | |||||||||||||||||||||||
|
|
|
|
|
|
|
|
|
|
|
|||||||||||||||||||
| Total retail |
110 | 119 | 111 | 338 | 209 | |||||||||||||||||||||||
| Residential mortgage |
46 | 36 | 92 | 35 | 56 | |||||||||||||||||||||||
|
|
|
|
|
|
|
|
|
|
|
|||||||||||||||||||
| Total net charge offs |
64 | 90 | 137 | 171 | 341 | |||||||||||||||||||||||
|
|
|
|
|
|
|
|
|
|
|
|||||||||||||||||||
| Dec 31, 2011 | Sep 30, 2011 | Dec11 vs Sep11 % Change |
Jun 30, 2011 | Mar 31, 2011 | Dec 31, 2010 | Dec11 vs Dec10 % Change |
||||||||||||||||||||||
| Credit Quality |
||||||||||||||||||||||||||||
| Nonaccrual loans |
$ | 356,772 | $ | 403,392 | (11.6 | %) | $ | 467,611 | $ | 488,321 | $ | 574,356 | (37.9 | %) | ||||||||||||||
| Other real estate owned (OREO) |
41,571 | 42,076 | (1.2 | %) | 45,712 | 49,019 | 44,330 | (6.2 | %) | |||||||||||||||||||
|
|
|
|
|
|
|
|
|
|
|
|||||||||||||||||||
| Total nonperforming assets |
$ | 398,343 | $ | 445,468 | (10.6 | %) | $ | 513,323 | $ | 537,340 | $ | 618,686 | (35.6 | %) | ||||||||||||||
|
|
|
|
|
|
|
|
|
|
|
|||||||||||||||||||
| Loans 90 or more days past due and still accruing |
4,925 | 1,220 | 303.7 | % | 12,123 | 9,380 | 3,418 | 44.1 | % | |||||||||||||||||||
| Restructured loans (accruing) |
113,164 | 113,083 | 0.1 | % | 100,343 | 88,193 | 79,935 | 41.6 | % | |||||||||||||||||||
| Allowance for loan losses / loans |
2.70 | % | 2.96 | % | 3.25 | % | 3.59 | % | 3.78 | % | ||||||||||||||||||
| Allowance for loan losses / nonaccrual loans |
105.99 | 99.09 | 91.09 | 93.07 | 83.02 | |||||||||||||||||||||||
| Nonaccrual loans / total loans |
2.54 | 2.99 | 3.57 | 3.86 | 4.55 | |||||||||||||||||||||||
| Nonperforming assets / total loans plus OREO |
2.83 | 3.29 | 3.91 | 4.23 | 4.89 | |||||||||||||||||||||||
| Nonperforming assets / total assets |
1.82 | 2.03 | 2.33 | 2.50 | 2.84 | |||||||||||||||||||||||
| Net charge offs / average loans (annualized) |
0.64 | 0.90 | 1.37 | 1.71 | 3.41 | |||||||||||||||||||||||
| Year-to-date net charge offs / average loans |
1.13 | 1.32 | 1.54 | 1.71 | 3.69 | |||||||||||||||||||||||
| Nonaccrual loans by type: |
||||||||||||||||||||||||||||
| Commercial and industrial |
$ | 56,075 | $ | 61,256 | (8.5 | %) | $ | 71,183 | $ | 76,780 | $ | 99,845 | (43.8 | %) | ||||||||||||||
| Commercial real estate - owner occupied |
35,718 | 47,202 | (24.3 | %) | 59,725 | 57,168 | 59,317 | (39.8 | %) | |||||||||||||||||||
| Lease financing |
10,644 | 11,667 | (8.8 | %) | 12,898 | 15,270 | 17,080 | (37.7 | %) | |||||||||||||||||||
|
|
|
|
|
|
|
|
|
|
|
|||||||||||||||||||
| Commercial and business lending |
102,437 | 120,125 | (14.7 | %) | 143,806 | 149,218 | 176,242 | (41.9 | %) | |||||||||||||||||||
| Commercial real estate - investor |
99,352 | 97,691 | 1.7 | % | 133,770 | 129,379 | 164,610 | (39.6 | %) | |||||||||||||||||||
| Real estate - construction |
41,806 | 72,300 | (42.2 | %) | 72,782 | 84,903 | 94,929 | (56.0 | %) | |||||||||||||||||||
|
|
|
|
|
|
|
|
|
|
|
|||||||||||||||||||
| Commercial real estate lending |
141,158 | 169,991 | (17.0 | %) | 206,552 | 214,282 | 259,539 | (45.6 | %) | |||||||||||||||||||
|
|
|
|
|
|
|
|
|
|
|
|||||||||||||||||||
| Total commercial |
243,595 | 290,116 | (16.0 | %) | 350,358 | 363,500 | 435,781 | (44.1 | %) | |||||||||||||||||||
| Home equity |
46,907 | 46,119 | 1.7 | % | 46,777 | 49,618 | 51,712 | (9.3 | %) | |||||||||||||||||||
| Installment |
2,715 | 3,195 | (15.0 | %) | 3,724 | 4,949 | 10,544 | (74.3 | %) | |||||||||||||||||||
|
|
|
|
|
|
|
|
|
|
|
|||||||||||||||||||
| Total retail |
49,622 | 49,314 | 0.6 | % | 50,501 | 54,567 | 62,256 | (20.3 | %) | |||||||||||||||||||
| Residential mortgage |
63,555 | 63,962 | (0.6 | %) | 66,752 | 70,254 | 76,319 | (16.7 | %) | |||||||||||||||||||
|
|
|
|
|
|
|
|
|
|
|
|||||||||||||||||||
| Total nonaccrual loans |
$ | 356,772 | $ | 403,392 | (11.6 | %) | $ | 467,611 | $ | 488,321 | $ | 574,356 | (37.9 | %) | ||||||||||||||
|
|
|
|
|
|
|
|
|
|
|
|||||||||||||||||||
| * | Annualized. |
| (1) | Charge offs for the three months ended March 31, 2011, include $10 million of write-downs related to installment loans transferred to held for sale. |
Selected Asset Quality Information (continued)
Associated Banc-Corp
| (in thousands) |
Dec 31, 2011 | Sep 30, 2011 | Dec11 vs Sep11 % Change |
Jun 30, 2011 | Mar 31, 2011 | Dec 31, 2010 | Dec11 vs Dec10 % Change |
|||||||||||||||||||||
| Restructured loans (accruing) |
||||||||||||||||||||||||||||
| Commercial and industrial |
$ | 22,552 | $ | 23,020 | (2.0 | %) | $ | 22,760 | $ | 16,047 | $ | 9,980 | 126.0 | % | ||||||||||||||
| Commercial real estate - owner occupied |
8,138 | 5,439 | 49.6 | % | 1,579 | 382 | 382 | N/M | ||||||||||||||||||||
| Lease financing |
— | — | 0.0 | % | — | — | — | 0.0 | % | |||||||||||||||||||
|
|
|
|
|
|
|
|
|
|
|
|||||||||||||||||||
| Commercial and business lending |
30,690 | 28,459 | 7.8 | % | 24,339 | 16,429 | 10,362 | 196.2 | % | |||||||||||||||||||
| Commercial real estate - investor |
43,417 | 43,453 | (0.1 | %) | 34,612 | 33,784 | 15,230 | 185.1 | % | |||||||||||||||||||
| Real estate - construction |
10,977 | 10,707 | 2.5 | % | 10,706 | 7,859 | 22,532 | (51.3 | %) | |||||||||||||||||||
|
|
|
|
|
|
|
|
|
|
|
|||||||||||||||||||
| Commercial real estate lending |
54,394 | 54,160 | 0.4 | % | 45,318 | 41,643 | 37,762 | 44.0 | % | |||||||||||||||||||
|
|
|
|
|
|
|
|
|
|
|
|||||||||||||||||||
| Total commercial |
85,084 | 82,619 | 3.0 | % | 69,657 | 58,072 | 48,124 | 76.8 | % | |||||||||||||||||||
| Home equity |
8,950 | 10,556 | (15.2 | %) | 11,453 | 11,630 | 11,741 | (23.8 | %) | |||||||||||||||||||
| Installment |
1,015 | 965 | 5.2 | % | 1,017 | 1,149 | 692 | 46.7 | % | |||||||||||||||||||
|
|
|
|
|
|
|
|
|
|
|
|||||||||||||||||||
| Total retail |
9,965 | 11,521 | (13.5 | %) | 12,470 | 12,779 | 12,433 | (19.9 | %) | |||||||||||||||||||
| Residential mortgage |
18,115 | 18,943 | (4.4 | %) | 18,216 | 17,342 | 19,378 | (6.5 | %) | |||||||||||||||||||
|
|
|
|
|
|
|
|
|
|
|
|||||||||||||||||||
| Total restructured loans (accruing) |
$ | 113,164 | $ | 113,083 | 0.1 | % | $ | 100,343 | $ | 88,193 | $ | 79,935 | 41.6 | % | ||||||||||||||
|
|
|
|
|
|
|
|
|
|
|
|||||||||||||||||||
| Restructured loans in nonaccrual loans (not included above) |
$ | 87,493 | $ | 80,063 | 9.3 | % | $ | 71,084 | $ | 49,352 | $ | 35,939 | 143.4 | % | ||||||||||||||
| Dec 31, 2011 | Sep 30, 2011 | Dec11 vs Sep11 % Change |
Jun 30, 2011 | Mar 31, 2011 | Dec 31, 2010 | Dec11 vs Dec10 % Change |
||||||||||||||||||||||
| Loans Past Due 30-89 Days |
||||||||||||||||||||||||||||
| Commercial and industrial |
$ | 8,743 | $ | 6,255 | 39.8 | % | $ | 7,581 | $ | 36,205 | $ | 33,013 | (73.5 | %) | ||||||||||||||
| Commercial real estate - owner occupied |
7,092 | 29,409 | (75.9 | %) | 33,753 | 21,820 | 9,295 | (23.7 | %) | |||||||||||||||||||
| Lease financing |
104 | 507 | (79.5 | %) | 79 | 135 | 132 | (21.2 | %) | |||||||||||||||||||
|
|
|
|
|
|
|
|
|
|
|
|||||||||||||||||||
| Commercial and business lending |
15,939 | 36,171 | (55.9 | %) | 41,413 | 58,160 | 42,440 | (62.4 | %) | |||||||||||||||||||
| Commercial real estate - investor |
4,970 | 70,136 | (92.9 | %) | 27,487 | 18,717 | 37,191 | (86.6 | %) | |||||||||||||||||||
| Real estate - construction |
996 | 5,493 | (81.9 | %) | 13,217 | 3,410 | 8,016 | (87.6 | %) | |||||||||||||||||||
|
|
|
|
|
|
|
|
|
|
|
|||||||||||||||||||
| Commercial real estate lending |
5,966 | 75,629 | (92.1 | %) | 40,704 | 22,127 | 45,207 | (86.8 | %) | |||||||||||||||||||
|
|
|
|
|
|
|
|
|
|
|
|||||||||||||||||||
| Total commercial |
21,905 | 111,800 | (80.4 | %) | 82,117 | 80,287 | 87,647 | (75.0 | %) | |||||||||||||||||||
| Home equity |
12,189 | 18,165 | (32.9 | %) | 14,818 | 14,808 | 13,886 | (12.2 | %) | |||||||||||||||||||
| Installment |
2,592 | 1,956 | 32.5 | % | 3,851 | 2,714 | 9,624 | (73.1 | %) | |||||||||||||||||||
|
|
|
|
|
|
|
|
|
|
|
|||||||||||||||||||
| Total retail |
14,781 | 20,121 | (26.5 | %) | 18,669 | 17,522 | 23,510 | (37.1 | %) | |||||||||||||||||||
| Residential mortgage |
7,224 | 12,114 | (40.4 | %) | 12,573 | 7,940 | 8,722 | (17.2 | %) | |||||||||||||||||||
|
|
|
|
|
|
|
|
|
|
|
|||||||||||||||||||
| Total loans past due 30-89 days |
$ | 43,910 | $ | 144,035 | (69.5 | %) | $ | 113,359 | $ | 105,749 | $ | 119,879 | (63.4 | %) | ||||||||||||||
|
|
|
|
|
|
|
|
|
|
|
|||||||||||||||||||
| Dec 31, 2011 | Sep 30, 2011 | Dec11 vs Sep11 % Change |
Jun 30, 2011 | Mar 31, 2011 | Dec 31, 2010 | Dec11 vs Dec10 % Change |
||||||||||||||||||||||
| Potential Problem Loans |
||||||||||||||||||||||||||||
| Commercial and industrial |
$ | 153,306 | $ | 207,351 | (26.1 | %) | $ | 229,407 | $ | 348,949 | $ | 354,284 | (56.7 | %) | ||||||||||||||
| Commercial real estate - owner occupied |
136,366 | 140,406 | (2.9 | %) | 145,622 | 172,662 | 193,819 | (29.6 | %) | |||||||||||||||||||
| Lease financing |
158 | 507 | (68.8 | %) | 1,399 | 1,705 | 2,617 | (94.0 | %) | |||||||||||||||||||
|
|
|
|
|
|
|
|
|
|
|
|||||||||||||||||||
| Commercial and business lending |
289,830 | 348,264 | (16.8 | %) | 376,428 | 523,316 | 550,720 | (47.4 | %) | |||||||||||||||||||
| Commercial real estate - investor |
230,206 | 252,331 | (8.8 | %) | 236,434 | 292,714 | 298,959 | (23.0 | %) | |||||||||||||||||||
| Real estate - construction |
27,649 | 37,155 | (25.6 | %) | 63,186 | 70,824 | 91,618 | (69.8 | %) | |||||||||||||||||||
|
|
|
|
|
|
|
|
|
|
|
|||||||||||||||||||
| Commercial real estate lending |
257,855 | 289,486 | (10.9 | %) | 299,620 | 363,538 | 390,577 | (34.0 | %) | |||||||||||||||||||
|
|
|
|
|
|
|
|
|
|
|
|||||||||||||||||||
| Total commercial |
547,685 | 637,750 | (14.1 | %) | 676,048 | 886,854 | 941,297 | (41.8 | %) | |||||||||||||||||||
| Home equity |
5,451 | 4,975 | 9.6 | % | 4,515 | 4,737 | 3,057 | 78.3 | % | |||||||||||||||||||
| Installment |
233 | 272 | (14.3 | %) | 216 | 230 | 703 | (66.9 | %) | |||||||||||||||||||
|
|
|
|
|
|
|
|
|
|
|
|||||||||||||||||||
| Total retail |
5,684 | 5,247 | 8.3 | % | 4,731 | 4,967 | 3,760 | 51.2 | % | |||||||||||||||||||
| Residential mortgage |
13,037 | 16,550 | (21.2 | %) | 18,575 | 19,710 | 18,672 | (30.2 | %) | |||||||||||||||||||
|
|
|
|
|
|
|
|
|
|
|
|||||||||||||||||||
| Total potential problem loans |
$ | 566,406 | $ | 659,547 | (14.1 | %) | $ | 699,354 | $ | 911,531 | $ | 963,729 | (41.2 | %) | ||||||||||||||
|
|
|
|
|
|
|
|
|
|
|
|||||||||||||||||||
N/M - Not meaningful.
Net Interest Income Analysis - Taxable Equivalent Basis
Associated Banc-Corp
| Year ended December 31, 2011 | Year ended December 31, 2010 | |||||||||||||||||||||||
| (in thousands) | Average Balance |
Interest Income / Expense |
Average Yield / Rate |
Average Balance |
Interest Income / Expense |
Average Yield / Rate |
||||||||||||||||||
| Earning assets: |
||||||||||||||||||||||||
| Loans: (1) (2) (3) |
||||||||||||||||||||||||
| Commercial |
$ | 7,274,728 | $ | 315,151 | 4.33 | % | $ | 7,790,554 | $ | 339,595 | 4.36 | % | ||||||||||||
| Residential mortgage |
2,819,702 | 116,207 | 4.12 | 2,059,156 | 99,163 | 4.82 | ||||||||||||||||||
| Retail |
3,184,418 | 154,793 | 4.86 | 3,337,002 | 173,015 | 5.18 | ||||||||||||||||||
|
|
|
|
|
|
|
|
|
|||||||||||||||||
| Total loans |
13,278,848 | 586,151 | 4.41 | 13,186,712 | 611,773 | 4.64 | ||||||||||||||||||
| Investment securities |
5,497,297 | 171,270 | 3.12 | 5,439,729 | 209,295 | 3.85 | ||||||||||||||||||
| Other short-term investments |
666,118 | 5,575 | 0.84 | 1,942,054 | 8,693 | 0.45 | ||||||||||||||||||
|
|
|
|
|
|
|
|
|
|||||||||||||||||
| Investments and other |
6,163,415 | 176,845 | 2.87 | 7,381,783 | 217,988 | 2.95 | ||||||||||||||||||
|
|
|
|
|
|
|
|
|
|||||||||||||||||
| Total earning assets |
19,442,263 | 762,996 | 3.92 | 20,568,495 | 829,761 | 4.03 | ||||||||||||||||||
| Other assets, net |
2,146,357 | 2,056,570 | ||||||||||||||||||||||
|
|
|
|
|
|||||||||||||||||||||
| Total assets |
$ | 21,588,620 | $ | 22,625,065 | ||||||||||||||||||||
|
|
|
|
|
|||||||||||||||||||||
| Interest-bearing liabilities: |
||||||||||||||||||||||||
| Savings deposits |
$ | 987,198 | $ | 1,091 | 0.11 | % | $ | 898,019 | $ | 1,176 | 0.13 | % | ||||||||||||
| Interest-bearing demand deposits |
1,947,506 | 3,429 | 0.18 | 2,780,525 | 6,314 | 0.23 | ||||||||||||||||||
| Money market deposits |
5,147,437 | 16,385 | 0.32 | 6,374,071 | 33,417 | 0.52 | ||||||||||||||||||
| Time deposits, excluding Brokered CDs |
2,647,632 | 41,257 | 1.56 | 3,251,667 | 60,280 | 1.85 | ||||||||||||||||||
|
|
|
|
|
|
|
|
|
|||||||||||||||||
| Total interest-bearing deposits, excluding Brokered CDs |
10,729,773 | 62,162 | 0.58 | 13,304,282 | 101,187 | 0.76 | ||||||||||||||||||
| Brokered CDs |
290,226 | 3,586 | 1.24 | 547,328 | 4,836 | 0.88 | ||||||||||||||||||
|
|
|
|
|
|
|
|
|
|||||||||||||||||
| Total interest-bearing deposits |
11,019,999 | 65,748 | 0.60 | 13,851,610 | 106,023 | 0.77 | ||||||||||||||||||
| Short and long-term funding |
4,100,825 | 63,043 | 1.54 | 2,452,610 | 66,324 | 2.70 | ||||||||||||||||||
|
|
|
|
|
|
|
|
|
|||||||||||||||||
| Total interest-bearing liabilities |
15,120,824 | 128,791 | 0.85 | 16,304,220 | 172,347 | 1.06 | ||||||||||||||||||
| Noninterest-bearing demand deposits |
3,381,128 | 3,094,691 | ||||||||||||||||||||||
| Other liabilities |
89,378 | 42,582 | ||||||||||||||||||||||
| Stockholders’ equity |
2,997,290 | 3,183,572 | ||||||||||||||||||||||
|
|
|
|
|
|||||||||||||||||||||
| Total liabilities and stockholders’ equity |
$ | 21,588,620 | $ | 22,625,065 | ||||||||||||||||||||
|
|
|
|
|
|
|
|
|
|||||||||||||||||
| Net interest income and rate spread (1) |
$ | 634,205 | 3.07 | % | $ | 657,414 | 2.97 | % | ||||||||||||||||
|
|
|
|
|
|||||||||||||||||||||
| Net interest margin (1) |
3.26 | % | 3.20 | % | ||||||||||||||||||||
| Taxable equivalent adjustment |
$ | 21,374 | $ | 23,635 | ||||||||||||||||||||
|
|
|
|
|
|||||||||||||||||||||
| Net Interest Income Analysis - Taxable Equivalent Basis | ||||||||||||||||||||||||
| Associated Banc-Corp | ||||||||||||||||||||||||
| Three months ended December 31, 2011 | Three months ended December 31, 2010 | |||||||||||||||||||||||
| (in thousands) | Average Balance |
Interest Income / Expense |
Average Yield / Rate |
Average Balance |
Interest Income / Expense |
Average Yield / Rate |
||||||||||||||||||
| Earning assets: |
||||||||||||||||||||||||
| Loans: (1) (2) (3) |
||||||||||||||||||||||||
| Commercial |
$ | 7,728,803 | $ | 82,424 | 4.23 | % | $ | 7,161,913 | $ | 81,120 | 4.50 | % | ||||||||||||
| Residential mortgage |
3,216,466 | 31,643 | 3.93 | 2,214,502 | 24,887 | 4.49 | ||||||||||||||||||
| Retail |
3,098,316 | 36,666 | 4.71 | 3,211,287 | 41,267 | 5.11 | ||||||||||||||||||
|
|
|
|
|
|
|
|
|
|||||||||||||||||
| Total loans |
14,043,585 | 150,733 | 4.27 | 12,587,702 | 147,274 | 4.65 | ||||||||||||||||||
| Investment securities |
5,020,429 | 34,605 | 2.76 | 5,598,564 | 45,461 | 3.25 | ||||||||||||||||||
| Other short-term investments |
442,613 | 1,251 | 1.13 | 1,764,518 | 2,078 | 0.48 | ||||||||||||||||||
|
|
|
|
|
|
|
|
|
|||||||||||||||||
| Investments and other |
5,463,042 | 35,856 | 2.63 | 7,363,082 | 47,539 | 2.58 | ||||||||||||||||||
|
|
|
|
|
|
|
|
|
|||||||||||||||||
| Total earning assets |
19,506,627 | 186,589 | 3.81 | 19,950,784 | 194,813 | 3.89 | ||||||||||||||||||
| Other assets, net |
2,249,243 | 2,083,257 | ||||||||||||||||||||||
|
|
|
|
|
|||||||||||||||||||||
| Total assets |
$ | 21,755,870 | $ | 22,034,041 | ||||||||||||||||||||
|
|
|
|
|
|||||||||||||||||||||
| Interest-bearing liabilities: |
||||||||||||||||||||||||
| Savings deposits |
$ | 1,017,271 | $ | 230 | 0.09 | % | $ | 908,625 | $ | 319 | 0.14 | % | ||||||||||||
| Interest-bearing demand deposits |
2,152,518 | 1,115 | 0.21 | 2,733,728 | 1,345 | 0.20 | ||||||||||||||||||
| Money market deposits |
5,308,174 | 3,649 | 0.27 | 6,027,526 | 7,202 | 0.47 | ||||||||||||||||||
| Time deposits, excluding Brokered CDs |
2,557,120 | 9,256 | 1.44 | 3,057,052 | 12,986 | 1.69 | ||||||||||||||||||
|
|
|
|
|
|
|
|
|
|||||||||||||||||
| Total interest-bearing deposits, excluding Brokered CDs |
11,035,083 | 14,250 | 0.51 | 12,726,931 | 21,852 | 0.68 | ||||||||||||||||||
| Brokered CDs |
203,354 | 704 | 1.37 | 438,055 | 1,187 | 1.07 | ||||||||||||||||||
|
|
|
|
|
|
|
|
|
|||||||||||||||||
| Total interest-bearing deposits |
11,238,437 | 14,954 | 0.53 | 13,164,986 | 23,039 | 0.69 | ||||||||||||||||||
| Short and long-term funding |
3,857,252 | 14,503 | 1.50 | 2,311,016 | 15,193 | 2.62 | ||||||||||||||||||
|
|
|
|
|
|
|
|
|
|||||||||||||||||
| Total interest-bearing liabilities |
15,095,689 | 29,457 | 0.78 | 15,476,002 | 38,232 | 0.98 | ||||||||||||||||||
| Noninterest-bearing demand deposits |
3,655,032 | 3,287,487 | ||||||||||||||||||||||
| Other liabilities |
149,054 | 74,895 | ||||||||||||||||||||||
| Stockholders’ equity |
2,856,095 | 3,195,657 | ||||||||||||||||||||||
|
|
|
|
|
|||||||||||||||||||||
| Total liabilities and stockholders’ equity |
$ | 21,755,870 | $ | 22,034,041 | ||||||||||||||||||||
|
|
|
|
|
|
|
|
|
|||||||||||||||||
| Net interest income and rate spread (1) |
$ | 157,132 | 3.03 | % | $ | 156,581 | 2.91 | % | ||||||||||||||||
|
|
|
|
|
|||||||||||||||||||||
| Net interest margin (1) |
3.21 | % | 3.13 | % | ||||||||||||||||||||
| Taxable equivalent adjustment |
$ | 5,307 | $ | 5,721 | ||||||||||||||||||||
|
|
|
|
|
|||||||||||||||||||||
| (1) | The yield on tax exempt loans and securities is computed on a taxable equivalent basis using a tax rate of 35% for all periods presented and is net of the effects of certain disallowed interest deductions. |
| (2) | Nonaccrual loans and loans held for sale have been included in the average balances. |
| (3) | Interest income includes net loan fees. |
Net Interest Income Analysis - Taxable Equivalent Basis
Associated Banc-Corp
| Three months ended December 31, 2011 | Three months ended September 30, 2011 | |||||||||||||||||||||||
| (in thousands) | Average Balance |
Interest Income / Expense |
Average Yield / Rate |
Average Balance |
Interest Income / Expense |
Average Yield / Rate |
||||||||||||||||||
| Earning assets: |
||||||||||||||||||||||||
| Loans: (1) (2) (3) |
||||||||||||||||||||||||
| Commercial |
$ | 7,728,803 | $ | 82,424 | 4.23 | % | $ | 7,337,527 | $ | 79,161 | 4.28 | % | ||||||||||||
| Residential mortgage |
3,216,466 | 31,643 | 3.93 | 2,869,445 | 29,385 | 4.09 | ||||||||||||||||||
| Retail |
3,098,316 | 36,666 | 4.71 | 3,169,956 | 38,102 | 4.78 | ||||||||||||||||||
|
|
|
|
|
|
|
|
|
|||||||||||||||||
| Total loans |
14,043,585 | 150,733 | 4.27 | 13,376,928 | 146,648 | 4.36 | ||||||||||||||||||
| Investment securities |
5,020,429 | 34,605 | 2.76 | 5,430,677 | 42,314 | 3.12 | ||||||||||||||||||
| Other short-term investments |
442,613 | 1,251 | 1.13 | 722,402 | 1,428 | 0.79 | ||||||||||||||||||
|
|
|
|
|
|
|
|
|
|||||||||||||||||
| Investments and other |
5,463,042 | 35,856 | 2.63 | 6,153,079 | 43,742 | 2.84 | ||||||||||||||||||
|
|
|
|
|
|
|
|
|
|||||||||||||||||
| Total earning assets |
19,506,627 | 186,589 | 3.81 | 19,530,007 | 190,390 | 3.88 | ||||||||||||||||||
| Other assets, net |
2,249,243 | 2,199,180 | ||||||||||||||||||||||
|
|
|
|
|
|||||||||||||||||||||
| Total assets |
$ | 21,755,870 | $ | 21,729,187 | ||||||||||||||||||||
|
|
|
|
|
|||||||||||||||||||||
| Interest-bearing liabilities: |
||||||||||||||||||||||||
| Savings deposits |
$ | 1,017,271 | $ | 230 | 0.09 | % | $ | 1,013,333 | $ | 289 | 0.11 | % | ||||||||||||
| Interest-bearing demand deposits |
2,152,518 | 1,115 | 0.21 | 2,056,082 | 945 | 0.18 | ||||||||||||||||||
| Money market deposits |
5,308,174 | 3,649 | 0.27 | 5,092,120 | 3,841 | 0.30 | ||||||||||||||||||
| Time deposits, excluding Brokered CDs |
2,557,120 | 9,256 | 1.44 | 2,565,898 | 9,718 | 1.50 | ||||||||||||||||||
|
|
|
|
|
|
|
|
|
|||||||||||||||||
| Total interest-bearing deposits, excluding Brokered CDs |
11,035,083 | 14,250 | 0.51 | 10,727,433 | 14,793 | 0.55 | ||||||||||||||||||
| Brokered CDs |
203,354 | 704 | 1.37 | 260,765 | 851 | 1.29 | ||||||||||||||||||
|
|
|
|
|
|
|
|
|
|||||||||||||||||
| Total interest-bearing deposits |
11,238,437 | 14,954 | 0.53 | 10,988,198 | 15,644 | 0.56 | ||||||||||||||||||
| Short and long-term funding |
3,857,252 | 14,503 | 1.50 | 4,227,319 | 16,291 | 1.54 | ||||||||||||||||||
|
|
|
|
|
|
|
|
|
|||||||||||||||||
| Total interest-bearing liabilities |
15,095,689 | 29,457 | 0.78 | 15,215,517 | 31,935 | 0.83 | ||||||||||||||||||
| Noninterest-bearing demand deposits |
3,655,032 | 3,417,113 | ||||||||||||||||||||||
| Other liabilities |
149,054 | 109,379 | ||||||||||||||||||||||
| Stockholders’ equity |
2,856,095 | 2,987,178 | ||||||||||||||||||||||
|
|
|
|
|
|||||||||||||||||||||
| Total liabilities and stockholders’ equity |
$ | 21,755,870 | $ | 21,729,187 | ||||||||||||||||||||
|
|
|
|
|
|
|
|
|
|||||||||||||||||
| Net interest income and rate spread (1) |
$ | 157,132 | 3.03 | % | $ | 158,455 | 3.05 | % | ||||||||||||||||
|
|
|
|
|
|||||||||||||||||||||
| Net interest margin (1) |
3.21 | % | 3.23 | % | ||||||||||||||||||||
| Taxable equivalent adjustment |
$ | 5,307 | $ | 5,295 | ||||||||||||||||||||
|
|
|
|
|
|||||||||||||||||||||
| (1) | The yield on tax exempt loans and securities is computed on a taxable equivalent basis using a tax rate of 35% for all periods presented and is net of the effects of certain disallowed interest deductions. |
| (2) | Nonaccrual loans and loans held for sale have been included in the average balances. |
| (3) | Interest income includes net loan fees. |
Financial Summary and Comparison
Associated Banc-Corp
| Dec 31, 2011 | Sept 30, 2011 | Dec11 vs Sep11 % Change |
Jun 30, 2011 | Mar 31, 2011 | Dec 31, 2010 | Dec11 vs Dec10 % Change |
||||||||||||||||||||||
| Period End Loan Composition |
||||||||||||||||||||||||||||
| Commercial and industrial |
$ | 3,724,736 | $ | 3,360,502 | 10.8 | % | $ | 3,202,301 | $ | 2,972,651 | $ | 3,049,752 | 22.1 | % | ||||||||||||||
| Commercial real estate - owner occupied |
1,086,829 | 1,068,616 | 1.7 | % | 1,030,060 | 1,027,826 | 1,049,798 | 3.5 | % | |||||||||||||||||||
| Lease financing |
58,194 | 54,849 | 6.1 | % | 54,001 | 56,458 | 60,254 | (3.4 | %) | |||||||||||||||||||
|
|
|
|
|
|
|
|
|
|
|
|||||||||||||||||||
| Commercial and business lending |
4,869,759 | 4,483,967 | 8.6 | % | 4,286,362 | 4,056,935 | 4,159,804 | 17.1 | % | |||||||||||||||||||
| Commercial real estate - investor |
2,563,767 | 2,481,411 | 3.3 | % | 2,393,626 | 2,354,655 | 2,339,415 | 9.6 | % | |||||||||||||||||||
| Real estate - construction |
584,046 | 554,024 | 5.4 | % | 533,804 | 525,236 | 553,069 | 5.6 | % | |||||||||||||||||||
|
|
|
|
|
|
|
|
|
|
|
|||||||||||||||||||
| Commercial real estate lending |
3,147,813 | 3,035,435 | 3.7 | % | 2,927,430 | 2,879,891 | 2,892,484 | 8.8 | % | |||||||||||||||||||
|
|
|
|
|
|
|
|
|
|
|
|||||||||||||||||||
| Total commercial |
8,017,572 | 7,519,402 | 6.6 | % | 7,213,792 | 6,936,826 | 7,052,288 | 13.7 | % | |||||||||||||||||||
| Home equity |
2,504,704 | 2,571,404 | (2.6 | %) | 2,594,029 | 2,576,736 | 2,523,057 | (0.7 | %) | |||||||||||||||||||
| Installment |
557,782 | 572,243 | (2.5 | %) | 589,714 | 605,767 | 695,383 | (19.8 | %) | |||||||||||||||||||
|
|
|
|
|
|
|
|
|
|
|
|||||||||||||||||||
| Total retail |
3,062,486 | 3,143,647 | (2.6 | %) | 3,183,743 | 3,182,503 | 3,218,440 | (4.8 | %) | |||||||||||||||||||
| Residential mortgage |
2,951,013 | 2,840,458 | 3.9 | % | 2,692,054 | 2,535,993 | 2,346,007 | 25.8 | % | |||||||||||||||||||
|
|
|
|
|
|
|
|
|
|
|
|||||||||||||||||||
| Total loans |
$ | 14,031,071 | $ | 13,503,507 | 3.9 | % | $ | 13,089,589 | $ | 12,655,322 | $ | 12,616,735 | 11.2 | % | ||||||||||||||
|
|
|
|
|
|
|
|
|
|
|
|||||||||||||||||||
| Dec 31, 2011 | Sept 30, 2011 | Dec11 vs Sep11 % Change |
Jun 30, 2011 | Mar 31, 2011 | Dec 31, 2010 | Dec11 vs Dec10 % Change |
||||||||||||||||||||||
| Period End Deposit and Customer Funding Composition |
||||||||||||||||||||||||||||
| Demand |
$ | 3,928,792 | $ | 3,711,570 | 5.9 | % | $ | 3,218,722 | $ | 3,285,604 | $ | 3,684,965 | 6.6 | % | ||||||||||||||
| Savings |
986,766 | 1,013,195 | (2.6 | %) | 1,007,337 | 973,122 | 887,236 | 11.2 | % | |||||||||||||||||||
| Interest-bearing demand |
2,297,454 | 2,071,627 | 10.9 | % | 1,931,519 | 1,755,367 | 1,870,664 | 22.8 | % | |||||||||||||||||||
| Money market |
5,150,275 | 5,205,401 | (1.1 | %) | 4,982,492 | 4,968,510 | 5,434,867 | (5.2 | %) | |||||||||||||||||||
| Brokered CDs |
202,948 | 203,827 | (0.4 | %) | 316,670 | 324,045 | 442,640 | (54.2 | %) | |||||||||||||||||||
| Other time deposits |
2,524,420 | 2,576,790 | (2.0 | %) | 2,609,310 | 2,716,995 | 2,905,021 | (13.1 | %) | |||||||||||||||||||
|
|
|
|
|
|
|
|
|
|
|
|||||||||||||||||||
| Total deposits |
15,090,655 | 14,782,410 | 2.1 | % | 14,066,050 | 14,023,643 | 15,225,393 | (0.9 | %) | |||||||||||||||||||
| Customer repo sweeps |
664,624 | 871,619 | (23.7 | %) | 930,101 | 1,048,516 | 563,884 | 17.9 | % | |||||||||||||||||||
| Customer repo term |
695,131 | 1,141,450 | (39.1 | %) | 1,147,938 | 887,434 | — | N/M | ||||||||||||||||||||
|
|
|
|
|
|
|
|
|
|
|
|||||||||||||||||||
| Total customer funding |
1,359,755 | 2,013,069 | (32.5 | %) | 2,078,039 | 1,935,950 | 563,884 | 141.1 | % | |||||||||||||||||||
|
|
|
|
|
|
|
|
|
|
|
|||||||||||||||||||
| Total deposits and customer funding |
$ | 16,450,410 | $ | 16,795,479 | (2.1 | %) | $ | 16,144,089 | $ | 15,959,593 | $ | 15,789,277 | 4.2 | % | ||||||||||||||
|
|
|
|
|
|
|
|
|
|
|
|||||||||||||||||||
| Network transaction deposits included above in interest-bearing demand and money market |
875,052 | 875,630 | (0.1 | %) | 824,003 | 936,688 | 1,144,134 | (23.5 | %) | |||||||||||||||||||
| Brokered CDs |
202,948 | 203,827 | (0.4 | %) | 316,670 | 324,045 | 442,640 | (54.2 | %) | |||||||||||||||||||
|
|
|
|
|
|
|
|
|
|
|
|||||||||||||||||||
| Total network and brokered funding |
1,078,000 | 1,079,457 | (0.1 | %) | 1,140,673 | 1,260,733 | 1,586,774 | (32.1 | %) | |||||||||||||||||||
|
|
|
|
|
|
|
|
|
|
|
|||||||||||||||||||
| Net customer deposits and funding (4) |
15,372,410 | 15,716,022 | (2.2 | %) | 15,003,416 | 14,698,860 | 14,202,503 | 8.2 | % | |||||||||||||||||||
|
|
|
|
|
|
|
|
|
|
|
|||||||||||||||||||
| (4) | Total deposits and customer funding excluding total network and brokered funding. |
N/M = Not meaningful.