| Label |
Element |
Value |
| Risk/Return: |
rr_RiskReturnAbstract |
|
|
| Registrant Name |
dei_EntityRegistrantName |
OPPENHEIMER DISCOVERY FUND
|
|
| Prospectus Date |
rr_ProspectusDate |
Nov. 28, 2018
|
|
| OPPENHEIMER DISCOVERY FUND |
|
|
|
| Risk/Return: |
rr_RiskReturnAbstract |
|
|
| Risk/Return [Heading] |
rr_RiskReturnHeading |
<b>The Fund Summary </b>
|
|
| Objective [Heading] |
rr_ObjectiveHeading |
<b>Investment Objective.</b>
|
|
| Objective, Primary [Text Block] |
rr_ObjectivePrimaryTextBlock |
The Fund seeks capital appreciation.
|
|
| Expense [Heading] |
rr_ExpenseHeading |
<b>Fees and Expenses of the Fund.</b>
|
|
| Expense Narrative [Text Block] |
rr_ExpenseNarrativeTextBlock |
This table describes the fees and expenses that you may pay if you buy and hold or redeem shares of the Fund. You may qualify for sales charge discounts if you (or you and your spouse) invest, or agree to invest in the future, at least $25,000 in certain funds in the Oppenheimer family of funds. More information about these and other discounts and sales charge waivers is available from your financial professional and in the section “About Your Account” beginning on page 12 of the prospectus, in the appendix to the prospectus titled “Special Sales Charge Arrangements and Waivers” and in the section “How to Buy Shares” beginning on page 44 in the Fund’s Statement of Additional Information.
|
|
| Shareholder Fees Caption [Text] |
rr_ShareholderFeesCaption |
<b>Shareholder Fees </b><br/> (fees paid directly from your investment)
|
|
| Operating Expenses Caption [Text] |
rr_OperatingExpensesCaption |
<b>Annual Fund Operating Expenses</b><br/>(expenses that you pay each year as a percentage of the value of your investment)
|
|
| Portfolio Turnover [Heading] |
rr_PortfolioTurnoverHeading |
<b>Portfolio Turnover. </b>
|
|
| Portfolio Turnover [Text Block] |
rr_PortfolioTurnoverTextBlock |
The Fund pays transaction costs, such as commissions, when it buys and sells securities (or “turns over” its portfolio). A higher portfolio turnover rate may indicate higher transaction costs and may result in higher taxes when Fund shares are held in a taxable account. These costs, which are not reflected in the annual fund operating expenses or in the Example, affect the Fund’s performance. During the most recent fiscal year, the Fund’s portfolio turnover rate was 91% of the average value of its portfolio.
|
|
| Portfolio Turnover, Rate |
rr_PortfolioTurnoverRate |
91.00%
|
|
| Expense Breakpoint Discounts [Text] |
rr_ExpenseBreakpointDiscounts |
You may qualify for sales charge discounts if you (or you and your spouse) invest, or agree to invest in the future, at least $25,000 in certain funds in the Oppenheimer family of funds.
|
|
| Expense Breakpoint, Minimum Investment Required [Amount] |
rr_ExpenseBreakpointMinimumInvestmentRequiredAmount |
$ 25,000
|
|
| Expenses Restated to Reflect Current [Text] |
rr_ExpensesRestatedToReflectCurrent |
Expenses have been restated to reflect current fees.
|
|
| Expense Example [Heading] |
rr_ExpenseExampleHeading |
<b>Example.</b>
|
|
| Expense Example Narrative [Text Block] |
rr_ExpenseExampleNarrativeTextBlock |
The following Example is intended to help you compare the cost of investing in the Fund with the cost of investing in other mutual funds. The Example assumes that you invest $10,000 in a class of shares of the Fund for the time periods indicated and then redeem all of your shares at the end of those periods. The Example also assumes that your investment has a 5% return each year and that the Fund’s operating expenses remain the same. Any applicable fee waivers and/or expense reimbursements are reflected in the below examples for the first year only. Although your actual costs may be higher or lower, based on these assumptions your expenses would be as follows:
|
|
| Expense Example by, Year, Caption [Text] |
rr_ExpenseExampleByYearCaption |
<b>If shares are redeemed</b>
|
|
| Expense Example, No Redemption, By Year, Caption [Text] |
rr_ExpenseExampleNoRedemptionByYearCaption |
<b>If shares are not redeemed</b>
|
|
| Strategy [Heading] |
rr_StrategyHeading |
<b>Principal Investment Strategies.</b>
|
|
| Strategy Narrative [Text Block] |
rr_StrategyNarrativeTextBlock |
The Fund mainly invests in common stocks of U.S. companies that the portfolio managers believe have favorable growth prospects. The Fund emphasizes stocks of small-capitalization (or “small-cap”) companies, which are defined as those issuers that are at the time of purchase within the range of market capitalizations of the Russell 2000 Growth Index. A company’s “market capitalization” is the value of its outstanding common stock and the determination whether the company is small- , mid- or large-cap is based on the company’s market capitalization relative to that of other companies.
The portfolio managers look for companies with high growth potential. This approach includes fundamental analysis of a company’s financial statements and management structure and consideration of the company’s operations and product development, as well as its position in its industry. The portfolio managers also evaluate research on particular industries, market trends and general economic conditions.
The portfolio managers currently seek companies with proven management records that are able to handle rapid growth, companies with innovative products or services, and companies that have above average growth profiles and have what the portfolio manager believes are sustainable growth rates. These criteria can vary.
|
|
| Risk [Heading] |
rr_RiskHeading |
<b>Principal Risks.</b>
|
|
| Risk Narrative [Text Block] |
rr_RiskNarrativeTextBlock |
The price of the Fund’s shares can go up and down substantially. The value of the Fund’s investments may fall due to adverse changes in the markets in which the Fund invests or because of poor investment selection, which could cause the Fund to underperform other funds with similar investment objectives. There is no assurance that the Fund will achieve its investment objective. When you redeem your shares, they may be worth less than what you paid for them. These risks mean that you can lose money by investing in the Fund.
Risks of Investing in Stocks. The value of the Fund’s portfolio may be affected by changes in the stock markets. Stock markets may experience significant short-term volatility and may fall sharply at times. Adverse events in any part of the equity or fixed-income markets may have unexpected negative effects on other market segments. Different stock markets may behave differently from each other and U.S. stock markets may move in the opposite direction from one or more foreign stock markets.
The prices of individual stocks generally do not all move in the same direction at the same time. A variety of factors can negatively affect the price of a particular company’s stock. These factors may include, but are not limited to: poor earnings reports, a loss of customers, litigation against the company, general unfavorable performance of the company’s sector or industry, or changes in government regulations affecting the company or its industry. To the extent that securities of a particular type are emphasized (for example foreign stocks, stocks of small- or mid-cap companies, growth or value stocks, or stocks of companies in a particular industry), fund share values may fluctuate more in response to events affecting the market for those types of securities.
Industry and Sector Focus. At times the Fund may increase the relative emphasis of its investments in a particular industry or sector. The prices of stocks of issuers in a particular industry or sector may go up and down in response to changes in economic conditions, government regulations, availability of basic resources or supplies, or other events that affect that industry or sector more than others. To the extent that the Fund increases the relative emphasis of its investments in a particular industry or sector, its share values may fluctuate in response to events affecting that industry or sector. To some extent that risk may be limited by the Fund’s policy of not concentrating its investments in any one industry.
Risks of Small- and Mid-Cap Companies. Small-cap companies may be either established or newer companies, including “unseasoned” companies that have typically been in operation for less than three years. Mid-cap companies are generally companies that have completed their initial start-up cycle, and in many cases have established markets and developed seasoned market teams. While smaller companies might offer greater opportunities for gain than larger companies, they also may involve greater risk of loss. They may be more sensitive to changes in a company’s earnings expectations and may experience more abrupt and erratic price movements. Small- and mid-cap companies’ securities may trade in lower volumes and it might be harder for the Fund to dispose of its holdings at an acceptable price when it wants to sell them. Small- and mid-cap companies may not have established markets for their products or services and may have fewer customers and product lines. They may have more limited access to financial resources and may not have the financial strength to sustain them through business downturns or adverse market conditions. Since small- and mid-cap companies typically reinvest a high proportion of their earnings in their business, they may not pay dividends for some time, particularly if they are newer companies. Small- and mid-cap companies may have unseasoned management or less depth in management skill than larger, more established companies. They may be more reliant on the efforts of particular members of their management team and management changes may pose a greater risk to the success of the business. It may take a substantial period of time before the Fund realizes a gain on an investment in a small- or mid-cap company, if it realizes any gain at all.
Risks of Growth Investing. If a growth company’s earnings or stock price fails to increase as anticipated, or if its business plans do not produce the expected results, its securities may decline sharply. Growth companies may be newer or smaller companies that may experience greater stock price fluctuations and risks of loss than larger, more established companies. Newer growth companies tend to retain a large part of their earnings for research, development or investments in capital assets. Therefore, they may not pay any dividends for some time. Growth investing has gone in and out of favor during past market cycles and is likely to continue to do so. During periods when growth investing is out of favor or when markets are unstable, it may be more difficult to sell growth company securities at an acceptable price. Growth stocks may also be more volatile than other securities because of investor speculation.
Cyclical Opportunities. At times, the Fund might seek to take advantage of short-term market movements or changes in the business cycle by investing in companies or industries that are sensitive to those changes. For example, when the economy is expanding, companies in consumer durables and the technology sector might benefit. There is a risk that, if a cyclical event does not have the anticipated effect or when the issuer or industry is out of phase in the business cycle, the value of the Fund’s investment could fall.
Who is the Fund Designed For? The Fund is designed primarily for investors seeking capital growth over the long term from small-cap stocks. Those investors should be willing to assume the risks of short-term share price fluctuations and losses that are typical for an aggressive growth fund focusing on stocks of small-cap issuers. Because of its focus on long-term growth, the Fund may be appropriate for investors with a higher risk tolerance and longer term investment goals. The Fund does not seek current income and the income from its investments will likely be small, so it is not designed for investors needing current income. The Fund is not a complete investment program and may not be appropriate for all investors. You should carefully consider your own investment goals and risk tolerance before investing in the Fund.
An investment in the Fund is not a deposit of any bank and is not insured or guaranteed by the Federal Deposit Insurance Corporation or any other government agency.
|
|
| Risk Lose Money [Text] |
rr_RiskLoseMoney |
<i>These risks mean that you can lose money by investing in the Fund.</i>
|
|
| Risk Not Insured Depository Institution [Text] |
rr_RiskNotInsuredDepositoryInstitution |
<b>An investment in the Fund is not a deposit of any bank and is not insured or guaranteed by the Federal Deposit Insurance Corporation or any other government agency.</b>
|
|
| Bar Chart and Performance Table [Heading] |
rr_BarChartAndPerformanceTableHeading |
<b>The Fund’s Past Performance.</b>
|
|
| Performance Narrative [Text Block] |
rr_PerformanceNarrativeTextBlock |
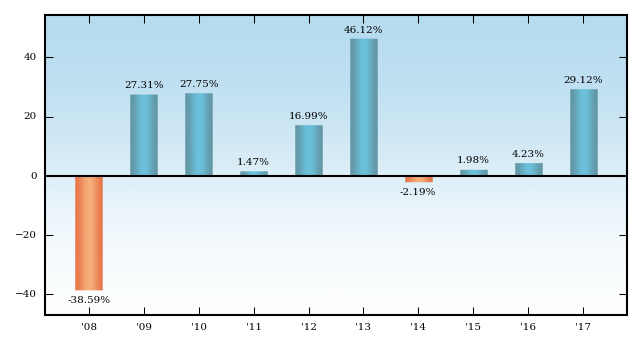
The bar chart and table below provide some indication of the risks of investing in the Fund by showing changes in the Fund’s performance (for Class A Shares) from calendar year to calendar year and by showing how the Fund’s average annual returns for the periods of time shown in the table compare with those of a broad measure of market performance. The Fund’s past investment performance (before and after taxes) is not necessarily an indication of how the Fund will perform in the future. Sales charges and taxes are not reflected in the bar chart and if those charges were included, returns would be less than those shown. More recent performance information is available by calling the toll-free number on the back of this prospectus and on the Fund’s website: https://www.oppenheimerfunds.com/fund/DiscoveryFund
|
|
| Performance Information Illustrates Variability of Returns [Text] |
rr_PerformanceInformationIllustratesVariabilityOfReturns |
The bar chart and table below provide some indication of the risks of investing in the Fund by showing changes in the Fund’s performance (for Class A Shares) from calendar year to calendar year and by showing how the Fund’s average annual returns for the periods of time shown in the table compare with those of a broad measure of market performance.
|
|
| Performance Availability Website Address [Text] |
rr_PerformanceAvailabilityWebSiteAddress |
<i>https://www.oppenheimerfunds.com/fund/DiscoveryFund</i>
|
|
| Performance Past Does Not Indicate Future [Text] |
rr_PerformancePastDoesNotIndicateFuture |
The Fund’s past investment performance (before and after taxes) is not necessarily an indication of how the Fund will perform in the future.
|
|
| Bar Chart Does Not Reflect Sales Loads [Text] |
rr_BarChartDoesNotReflectSalesLoads |
Sales charges and taxes are not reflected in the bar chart and if those charges were included, returns would be less than those shown.
|
|
| Bar Chart Closing [Text Block] |
rr_BarChartClosingTextBlock |
Sales charges and taxes are not included and the returns would be lower if they were. During the period shown, the highest return for a calendar quarter was 18.32% (4th Qtr 10) and the lowest return for a calendar quarter was -25.33% (4th Qtr 08). For the period from January 1, 2018 to September 30, 2018 the return before sales charges and taxes was 22.24%.
|
|
| Performance Table Heading |
rr_PerformanceTableHeading |
<b>Average Annual Total Returns </b>for the periods ended December 31, 2017
|
|
| Performance Table Uses Highest Federal Rate |
rr_PerformanceTableUsesHighestFederalRate |
After-tax returns are calculated using the highest individual federal marginal income tax rates and do not reflect the impact of state or local taxes.
|
|
| Performance Table Not Relevant to Tax Deferred |
rr_PerformanceTableNotRelevantToTaxDeferred |
Your actual after-tax returns, depending on your individual tax situation, may differ from those shown and after-tax returns shown are not relevant to investors who hold their Fund shares through tax-deferred arrangements, such as 401(k) plans or individual retirement accounts.
|
|
| Performance Table One Class of after Tax Shown [Text] |
rr_PerformanceTableOneClassOfAfterTaxShown |
After-tax returns are shown for only one class and after-tax returns for other classes will vary.
|
|
| Performance Table Narrative |
rr_PerformanceTableNarrativeTextBlock |
The following table shows the average annual total returns for each class of the Fund’s shares. After-tax returns are calculated using the highest individual federal marginal income tax rates and do not reflect the impact of state or local taxes. Your actual after-tax returns, depending on your individual tax situation, may differ from those shown and after-tax returns shown are not relevant to investors who hold their Fund shares through tax-deferred arrangements, such as 401(k) plans or individual retirement accounts. After-tax returns are shown for only one class and after-tax returns for other classes will vary.
|
|
| OPPENHEIMER DISCOVERY FUND | Class A |
|
|
|
| Risk/Return: |
rr_RiskReturnAbstract |
|
|
| Maximum Sales Charge (Load) imposed on purchases (as % of offering price) |
rr_MaximumSalesChargeImposedOnPurchasesOverOfferingPrice |
5.75%
|
|
| Maximum Deferred Sales Charge (Load) (as % of the lower of original offering price or redemption proceeds) |
rr_MaximumDeferredSalesChargeOverOther |
none
|
|
| Management Fees |
rr_ManagementFeesOverAssets |
0.63%
|
[1] |
| Distribution and/or Service (12b-1) Fees |
rr_DistributionAndService12b1FeesOverAssets |
0.25%
|
[1] |
| Other Expenses |
rr_OtherExpensesOverAssets |
0.20%
|
[1] |
| Total Annual Fund Operating Expenses |
rr_ExpensesOverAssets |
1.08%
|
[1] |
| 1 Year |
rr_ExpenseExampleYear01 |
$ 679
|
|
| 3 Years |
rr_ExpenseExampleYear03 |
900
|
|
| 5 Years |
rr_ExpenseExampleYear05 |
1,139
|
|
| 10 Years |
rr_ExpenseExampleYear10 |
1,823
|
|
| 1 Year |
rr_ExpenseExampleNoRedemptionYear01 |
679
|
|
| 3 Years |
rr_ExpenseExampleNoRedemptionYear03 |
900
|
|
| 5 Years |
rr_ExpenseExampleNoRedemptionYear05 |
1,139
|
|
| 10 Years |
rr_ExpenseExampleNoRedemptionYear10 |
$ 1,823
|
|
| 2008 |
rr_AnnualReturn2008 |
(38.59%)
|
|
| 2009 |
rr_AnnualReturn2009 |
27.31%
|
|
| 2010 |
rr_AnnualReturn2010 |
27.75%
|
|
| 2011 |
rr_AnnualReturn2011 |
1.47%
|
|
| 2012 |
rr_AnnualReturn2012 |
16.99%
|
|
| 2013 |
rr_AnnualReturn2013 |
46.12%
|
|
| 2014 |
rr_AnnualReturn2014 |
(2.19%)
|
|
| 2015 |
rr_AnnualReturn2015 |
1.98%
|
|
| 2016 |
rr_AnnualReturn2016 |
4.23%
|
|
| 2017 |
rr_AnnualReturn2017 |
29.12%
|
|
| Year to Date Return, Label |
rr_YearToDateReturnLabel |
For the period from January 1, 2018 to September 30, 2018
|
|
| Bar Chart, Year to Date Return, Date |
rr_BarChartYearToDateReturnDate |
Sep. 30, 2018
|
|
| Bar Chart, Year to Date Return |
rr_BarChartYearToDateReturn |
22.24%
|
|
| Highest Quarterly Return, Label |
rr_HighestQuarterlyReturnLabel |
highest return
|
|
| Highest Quarterly Return, Date |
rr_BarChartHighestQuarterlyReturnDate |
Dec. 31, 2010
|
|
| Highest Quarterly Return |
rr_BarChartHighestQuarterlyReturn |
18.32%
|
|
| Lowest Quarterly Return, Label |
rr_LowestQuarterlyReturnLabel |
lowest return
|
|
| Lowest Quarterly Return, Date |
rr_BarChartLowestQuarterlyReturnDate |
Dec. 31, 2008
|
|
| Lowest Quarterly Return |
rr_BarChartLowestQuarterlyReturn |
(25.33%)
|
|
| 1 Year |
rr_AverageAnnualReturnYear01 |
21.69%
|
|
| 5 Years |
rr_AverageAnnualReturnYear05 |
13.07%
|
|
| 10 Years |
rr_AverageAnnualReturnYear10 |
8.16%
|
|
| Inception Date |
rr_AverageAnnualReturnInceptionDate |
Sep. 11, 1986
|
|
| OPPENHEIMER DISCOVERY FUND | Class C |
|
|
|
| Risk/Return: |
rr_RiskReturnAbstract |
|
|
| Maximum Sales Charge (Load) imposed on purchases (as % of offering price) |
rr_MaximumSalesChargeImposedOnPurchasesOverOfferingPrice |
none
|
|
| Maximum Deferred Sales Charge (Load) (as % of the lower of original offering price or redemption proceeds) |
rr_MaximumDeferredSalesChargeOverOther |
1.00%
|
|
| Management Fees |
rr_ManagementFeesOverAssets |
0.63%
|
[1] |
| Distribution and/or Service (12b-1) Fees |
rr_DistributionAndService12b1FeesOverAssets |
1.00%
|
[1] |
| Other Expenses |
rr_OtherExpensesOverAssets |
0.21%
|
[1] |
| Total Annual Fund Operating Expenses |
rr_ExpensesOverAssets |
1.84%
|
[1] |
| 1 Year |
rr_ExpenseExampleYear01 |
$ 289
|
|
| 3 Years |
rr_ExpenseExampleYear03 |
584
|
|
| 5 Years |
rr_ExpenseExampleYear05 |
1,005
|
|
| 10 Years |
rr_ExpenseExampleYear10 |
2,178
|
|
| 1 Year |
rr_ExpenseExampleNoRedemptionYear01 |
189
|
|
| 3 Years |
rr_ExpenseExampleNoRedemptionYear03 |
584
|
|
| 5 Years |
rr_ExpenseExampleNoRedemptionYear05 |
1,005
|
|
| 10 Years |
rr_ExpenseExampleNoRedemptionYear10 |
$ 2,178
|
|
| 1 Year |
rr_AverageAnnualReturnYear01 |
27.13%
|
|
| 5 Years |
rr_AverageAnnualReturnYear05 |
13.55%
|
|
| 10 Years |
rr_AverageAnnualReturnYear10 |
7.97%
|
|
| Inception Date |
rr_AverageAnnualReturnInceptionDate |
Oct. 02, 1995
|
|
| OPPENHEIMER DISCOVERY FUND | Class R |
|
|
|
| Risk/Return: |
rr_RiskReturnAbstract |
|
|
| Maximum Sales Charge (Load) imposed on purchases (as % of offering price) |
rr_MaximumSalesChargeImposedOnPurchasesOverOfferingPrice |
none
|
|
| Maximum Deferred Sales Charge (Load) (as % of the lower of original offering price or redemption proceeds) |
rr_MaximumDeferredSalesChargeOverOther |
none
|
|
| Management Fees |
rr_ManagementFeesOverAssets |
0.63%
|
[1] |
| Distribution and/or Service (12b-1) Fees |
rr_DistributionAndService12b1FeesOverAssets |
0.50%
|
[1] |
| Other Expenses |
rr_OtherExpensesOverAssets |
0.20%
|
[1] |
| Total Annual Fund Operating Expenses |
rr_ExpensesOverAssets |
1.33%
|
[1] |
| 1 Year |
rr_ExpenseExampleYear01 |
$ 136
|
|
| 3 Years |
rr_ExpenseExampleYear03 |
424
|
|
| 5 Years |
rr_ExpenseExampleYear05 |
734
|
|
| 10 Years |
rr_ExpenseExampleYear10 |
1,612
|
|
| 1 Year |
rr_ExpenseExampleNoRedemptionYear01 |
136
|
|
| 3 Years |
rr_ExpenseExampleNoRedemptionYear03 |
424
|
|
| 5 Years |
rr_ExpenseExampleNoRedemptionYear05 |
734
|
|
| 10 Years |
rr_ExpenseExampleNoRedemptionYear10 |
$ 1,612
|
|
| 1 Year |
rr_AverageAnnualReturnYear01 |
28.78%
|
|
| 5 Years |
rr_AverageAnnualReturnYear05 |
14.11%
|
|
| 10 Years |
rr_AverageAnnualReturnYear10 |
8.52%
|
|
| Inception Date |
rr_AverageAnnualReturnInceptionDate |
Mar. 01, 2001
|
|
| OPPENHEIMER DISCOVERY FUND | Class Y |
|
|
|
| Risk/Return: |
rr_RiskReturnAbstract |
|
|
| Maximum Sales Charge (Load) imposed on purchases (as % of offering price) |
rr_MaximumSalesChargeImposedOnPurchasesOverOfferingPrice |
none
|
|
| Maximum Deferred Sales Charge (Load) (as % of the lower of original offering price or redemption proceeds) |
rr_MaximumDeferredSalesChargeOverOther |
none
|
|
| Management Fees |
rr_ManagementFeesOverAssets |
0.63%
|
[1] |
| Distribution and/or Service (12b-1) Fees |
rr_DistributionAndService12b1FeesOverAssets |
none
|
[1] |
| Other Expenses |
rr_OtherExpensesOverAssets |
0.21%
|
[1] |
| Total Annual Fund Operating Expenses |
rr_ExpensesOverAssets |
0.84%
|
[1] |
| 1 Year |
rr_ExpenseExampleYear01 |
$ 86
|
|
| 3 Years |
rr_ExpenseExampleYear03 |
269
|
|
| 5 Years |
rr_ExpenseExampleYear05 |
468
|
|
| 10 Years |
rr_ExpenseExampleYear10 |
1,041
|
|
| 1 Year |
rr_ExpenseExampleNoRedemptionYear01 |
86
|
|
| 3 Years |
rr_ExpenseExampleNoRedemptionYear03 |
269
|
|
| 5 Years |
rr_ExpenseExampleNoRedemptionYear05 |
468
|
|
| 10 Years |
rr_ExpenseExampleNoRedemptionYear10 |
$ 1,041
|
|
| 1 Year |
rr_AverageAnnualReturnYear01 |
29.40%
|
|
| 5 Years |
rr_AverageAnnualReturnYear05 |
14.71%
|
|
| 10 Years |
rr_AverageAnnualReturnYear10 |
9.14%
|
|
| Inception Date |
rr_AverageAnnualReturnInceptionDate |
Jun. 01, 1994
|
|
| OPPENHEIMER DISCOVERY FUND | Class I |
|
|
|
| Risk/Return: |
rr_RiskReturnAbstract |
|
|
| Maximum Sales Charge (Load) imposed on purchases (as % of offering price) |
rr_MaximumSalesChargeImposedOnPurchasesOverOfferingPrice |
none
|
|
| Maximum Deferred Sales Charge (Load) (as % of the lower of original offering price or redemption proceeds) |
rr_MaximumDeferredSalesChargeOverOther |
none
|
|
| Management Fees |
rr_ManagementFeesOverAssets |
0.63%
|
[1] |
| Distribution and/or Service (12b-1) Fees |
rr_DistributionAndService12b1FeesOverAssets |
none
|
[1] |
| Other Expenses |
rr_OtherExpensesOverAssets |
0.04%
|
[1] |
| Total Annual Fund Operating Expenses |
rr_ExpensesOverAssets |
0.67%
|
[1] |
| 1 Year |
rr_ExpenseExampleYear01 |
$ 69
|
|
| 3 Years |
rr_ExpenseExampleYear03 |
215
|
|
| 5 Years |
rr_ExpenseExampleYear05 |
374
|
|
| 10 Years |
rr_ExpenseExampleYear10 |
837
|
|
| 1 Year |
rr_ExpenseExampleNoRedemptionYear01 |
69
|
|
| 3 Years |
rr_ExpenseExampleNoRedemptionYear03 |
215
|
|
| 5 Years |
rr_ExpenseExampleNoRedemptionYear05 |
374
|
|
| 10 Years |
rr_ExpenseExampleNoRedemptionYear10 |
$ 837
|
|
| 1 Year |
rr_AverageAnnualReturnYear01 |
29.64%
|
|
| 5 Years |
rr_AverageAnnualReturnYear05 |
14.93%
|
|
| (or life of class, if less) |
rr_AverageAnnualReturnSinceInception |
14.34%
|
|
| Inception Date |
rr_AverageAnnualReturnInceptionDate |
Jan. 27, 2012
|
|
| OPPENHEIMER DISCOVERY FUND | Return After Taxes on Distributions | Class A |
|
|
|
| Risk/Return: |
rr_RiskReturnAbstract |
|
|
| 1 Year |
rr_AverageAnnualReturnYear01 |
18.40%
|
|
| 5 Years |
rr_AverageAnnualReturnYear05 |
11.02%
|
|
| 10 Years |
rr_AverageAnnualReturnYear10 |
6.95%
|
|
| Inception Date |
rr_AverageAnnualReturnInceptionDate |
Sep. 11, 1986
|
|
| OPPENHEIMER DISCOVERY FUND | Return After Taxes on Distributions and Sale of Fund Shares | Class A |
|
|
|
| Risk/Return: |
rr_RiskReturnAbstract |
|
|
| 1 Year |
rr_AverageAnnualReturnYear01 |
14.86%
|
|
| 5 Years |
rr_AverageAnnualReturnYear05 |
10.15%
|
|
| 10 Years |
rr_AverageAnnualReturnYear10 |
6.47%
|
|
| Inception Date |
rr_AverageAnnualReturnInceptionDate |
Sep. 11, 1986
|
|
| OPPENHEIMER DISCOVERY FUND | Russell 2000 Growth Index (reflects no deduction for fees, expenses, or taxes) |
|
|
|
| Risk/Return: |
rr_RiskReturnAbstract |
|
|
| 1 Year |
rr_AverageAnnualReturnYear01 |
22.17%
|
|
| 5 Years |
rr_AverageAnnualReturnYear05 |
15.21%
|
|
| 10 Years |
rr_AverageAnnualReturnYear10 |
9.19%
|
|
| (or life of class, if less) |
rr_AverageAnnualReturnSinceInception |
13.75%
|
[2] |
| OPPENHEIMER DISCOVERY FUND | Russell 2000 Index (reflects no deduction for fees, expenses, or taxes) |
|
|
|
| Risk/Return: |
rr_RiskReturnAbstract |
|
|
| 1 Year |
rr_AverageAnnualReturnYear01 |
14.65%
|
|
| 5 Years |
rr_AverageAnnualReturnYear05 |
14.12%
|
|
| 10 Years |
rr_AverageAnnualReturnYear10 |
8.71%
|
|
| (or life of class, if less) |
rr_AverageAnnualReturnSinceInception |
13.22%
|
[2] |
| OPPENHEIMER DISCOVERY FUND | S&P 500 Index (reflects no deduction for fees, expenses, or taxes) |
|
|
|
| Risk/Return: |
rr_RiskReturnAbstract |
|
|
| 1 Year |
rr_AverageAnnualReturnYear01 |
21.83%
|
|
| 5 Years |
rr_AverageAnnualReturnYear05 |
15.79%
|
|
| 10 Years |
rr_AverageAnnualReturnYear10 |
8.50%
|
|
| (or life of class, if less) |
rr_AverageAnnualReturnSinceInception |
15.12%
|
[2] |
|
|