Exhibit (c)(7)
SPECIAL COMMITTEE OF THE BOARD OF DIRECTORS August 3, 2009 PBG The Pepsi Bottling Group Perella Weinberg Partners
LEGAL NOTICE This Presentation has been provided to you by Perella Weinberg Partners and its affiliates (collectively Perella Weinberg Partners or the Firm) and may not be used or relied upon for any purpose without the written consent of Perella Weinberg Partners. The information contained herein (the Information) is confidential. By accepting this Information, you agree that you and your directors, partners, officers, employees, attorney(s), agents and representatives agree to use it for informational purposes only and will not divulge any such Information to any other party. This presentation has not been prepared with a view toward public disclosure under state or federal securities laws or otherwise, except pursuant to a filing under section 13e-3 disclosure requirements. Reproduction, dissemination, quotation, summarization or reference to this Information, in whole or in part, is prohibited. These contents are proprietary and a product of Perella Weinberg Partners. The Information contained herein is not an offer to buy or sell or a solicitation of an offer to buy or sell any corporate advisory services or security or to participate in any corporate advisory services or trading strategy and is not a commitment by the firm (or any affiliate) to provide or arrange any financing for any transaction or to purchase any security in connection. Any decision regarding corporate advisory services or to invest in the investments described herein should be made after, as applicable, conducting such investigations as you deem necessary and consulting the investors own investment, legal, accounting and tax advisors in order to make an independent determination of the suitability and consequences of an investment or service. The information used in preparing these materials may have been obtained from or through you or your representatives or from public sources. Perella Weinberg Partners assumes no responsibility for independent investigation or verification of such information and has relied on such information being complete and accurate in all material respects. To the extent such information includes estimates and/or forecasts of future financial performance (including estimates of potential cost savings and synergies) prepared by or reviewed or discussed with the managements of your company and/or other potential transaction participants or obtained from public sources, we have assumed that such estimates and forecasts have been reasonably prepared on bases reflecting the best currently available estimates and judgments of such managements (or, with respect to estimates and forecasts obtained from public sources, represent reasonable estimates). The Firm has no obligation (express or implied) to update any or all of the Information or to advise you of any changes; nor do we make any express or implied warranties or representations as to the completeness or accuracy of the information or accept responsibility for errors. Nothing contained herein should be construed as tax, accounting or legal advice. You (and each of your employees, representatives or other agents) may disclose to any and all persons, without limitation of any kind, the tax treatment and tax structure of the transactions contemplated by these materials and all materials of any kind (including opinions or other tax analyses) that are provided to you relating to such tax treatment and structure. For this purpose, the tax treatment of a transaction is the purported or claimed U.S. federal income tax treatment of the transaction and the tax structure of a transaction is any fact that may be relevant to understanding the purported or claimed U.S. federal income tax treatment of the transaction. These materials were designed for use by specific persons familiar with the business and affairs of the Company and are being furnished and should be considered only in connection with other information, oral or written, being provided by Perella Weinberg Partners in connection herewith. These materials are not intended to provide the sole basis for evaluating, and should not be considered a recommendation with respect to, any transaction or other matter. Prior to entering into any transaction the Company should determine, without reliance on the Firm or its affiliates, the economic risks and merits as well as the legal, tax and accounting characterizations and consequences of any such transaction. In this regard, by accepting the Information, the Company acknowledges that (a) the Firm is not in the business of providing (and the Company is not relying on the Firm for) legal, tax or accounting advice, (b) there may be legal, tax or accounting risks associated with any transaction, (c) the Company should receive (and rely on) separate and qualified legal, tax and accounting advice and (d) the Company should apprise senior management as to such legal, tax and accounting advice (and any risks associated with any transaction) and the Firms disclaimer as to these matters. Perella Weinberg Partners is not acting in any other capacity as a fiduciary to the Company. In the ordinary course of our business activities, Perella Weinberg Partners or its affiliates may at any time hold long or short positions, and may trade or otherwise effect transactions, for our own account or the accounts of customers, in debt or equity or other securities (or related derivative securities) or financial instruments (including bank loans or other obligations) of the Company, potential counterparties, or any other company that may be involved in a transaction or any of their respective affiliates. In preparing this presentation, Perella Weinberg Partners has made certain assumptions regarding the information contained herein, and certain limitations apply to such information. For a detailed description of these assumptions and limitations, we refer you to the fairness opinion to be delivered to the Special Committee of the Board of Directors of the Company by Perella Weinberg Partners. Confidential 2 Perella Weinberg Partners

TABLE OF CONTENTS I. TRANSACTION OVERVIEW II. VALUATION ANALYSIS III. ILLUSTRATIVE PRO FORMA ANALYSIS APPENDIX Confidential 3 Perella Weinberg Partners
I. TRANSACTION OVERVIEW Perella Weinberg Partners
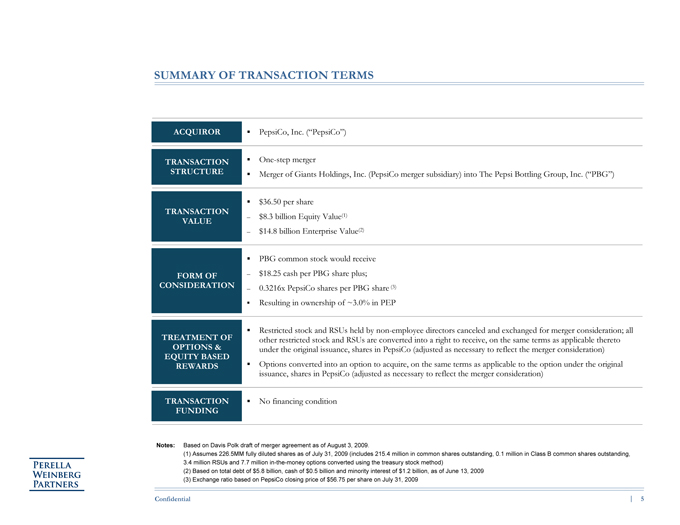
SUMMARY OF TRANSACTION TERMS ACQUIROR PepsiCo, Inc. (PepsiCo) TRANSACTION STRUCTURE One-step merger Merger of Giants Holdings, Inc. (PepsiCo merger subsidiary) into The Pepsi Bottling Group, Inc. (PBG) TRANSACTION VALUE $36.50 per share $8.3 billion Equity Value(1) $14.8 billion Enterprise Value(2) FORM OF CONSIDERATION PBG common stock would receive $18.25 cash per PBG share plus; 0.3216x PepsiCo shares per PBG share (3) Resulting in ownership of ~3.0% in PEP TREATMENT OF OPTIONS & amp; EQUITY BASED REWARDS Restricted stock and RSUs held by non-employee directors canceled and exchanged for merger consideration; all other restricted stock and RSUs are converted into a right to receive, on the same terms as applicable thereto under the original issuance, shares in PepsiCo (adjusted as necessary to reflect the merger consideration) Options converted into an option to acquire, on the same terms as applicable to the option under the original issuance, shares in PepsiCo (adjusted as necessary to reflect the merger consideration) TRANSACTION FUNDING No financing condition Notes: Based on Davis Polk draft of merger agreement as of August 3, 2009. (1) Assumes 226.5MM fully diluted shares as of July 31, 2009 (includes 215.4 million in common shares outstanding, 0.1 million in Class B common shares outstanding, 3.4 million RSUs and 7.7 million in-the-money options converted using the treasury stock method) (2) Based on total debt of $5.8 billion, cash of $0.5 billion and minority interest of $1.2 billion, as of June 13, 2009 (3) Exchange ratio based on PepsiCo closing price of $56.75 per share on July 31, 2009 Confidential 5 Perella Weinberg Partners
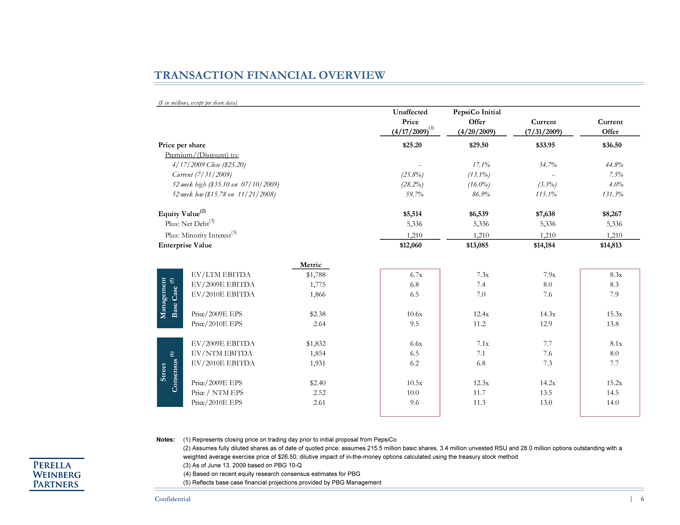
TRANSACTION FINANCIAL OVERVIEW ($ in millions, except per share data) Unaffected PepsiCo Initial Price Offer Current Current (4/17/2009)(1)(4/20/2009)(7/31/2009) Offer Price per share $25.20 $29.50 $33.95 $36.50 Premium/(Discount) to: 4/17/2009 Close ($25.20) 17.1% 34.7% 44.8% Current (7/31/2009)(25.8%)(13.1%) 7.5% 52-week high ($35.10 on 07/10/2009)(28.2%)(16.0%)(3.3%) 4.0% 52-week low ($15.78 on 11/21/2008) 59.7% 86.9% 115.1% 131.3% Equity Value(2) $5,514 $6,539 $7,638 $8,267 Plus: Net Debt(3) 5,336 5,336 5,336 5,336 Plus: Minority Interest(3) 1,210 1,210 1,210 1,210 Enterprise Value $12,060 $13,085 $14,184 $14,813 Metric EV/LTM EBITDA $1,788 6.7x 7.3x 7.9x 8.3x (5) EV/2009E EBITDA 1,775 6.8 7.4 8.0 8.3 Case EV/2010E EBITDA 1,866 6.5 7.0 7.6 7.9 Management Base Price/2009E EPS $2.38 10.6x 12.4x 14.3x 15.3x Price/2010E EPS 2.64 9.5 11.2 12.9 13.8 EV/2009E EBITDA $1,832 6.6x 7.1x 7.7 8.1x (6) EV/NTM EBITDA 1,854 6.5 7.1 7.6 8.0 EV/2010E EBITDA 1,931 6.2 6.8 7.3 7.7 Street Consensus Price/2009E EPS $2.40 10.5x 12.3x 14.2x 15.2x Price / NTM EPS 2.52 10.0 11.7 13.5 14.5 Price/2010E EPS 2.61 9.6 11.3 13.0 14.0 Notes: (1) Represents closing price on trading day prior to initial proposal from PepsiCo (2) Assumes fully diluted shares as of date of quoted price; assumes 215.5 million basic shares, 3.4 million unvested RSU and 28.0 million options outstanding with a weighted average exercise price of $26.50; dilutive impact of in-the-money options calculated using the treasury stock method (3) As of June 13, 2009 based on PBG 10-Q (4) Based on recent equity research consensus estimates for PBG (5) Reflects base case financial projections provided by PBG Management Confidential 6 Perella Weinberg Partners
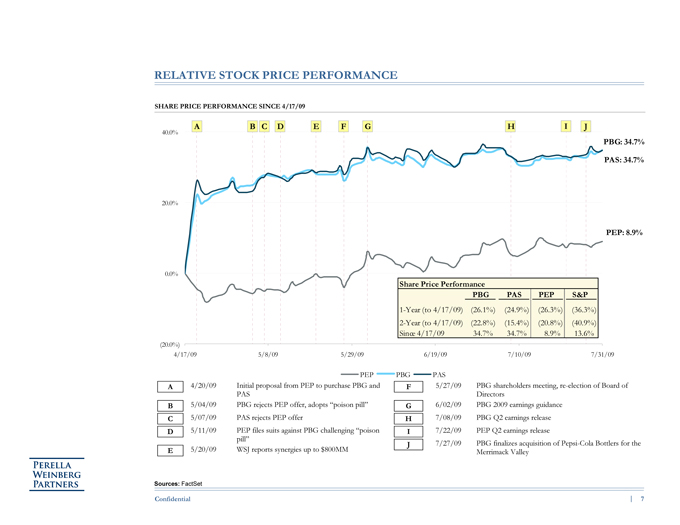
RELATIVE STOCK PRICE PERFORMANCE SHARE PRICE PERFORMANCE SINCE 4/17/09 40.0% A B C D E F G H I J PBG: 34. PAS: 34. 20.0% PEP: 8. 0.0% Share Price Performance PBG PAS PEP S & amp; P 1-Year (to 4/17/09) (26.1%) (24.9%) (26.3%) (36.3%) 2-Year (to 4/17/09) (22.8%) (15.4%) (20.8%) (40.9%) Since 4/17/09 34.7% 34.7% 8.9% 13.6% (20.0%) 4/17/09 5/8/09 5/29/09 6/19/09 7/10/09 7/31/09 PEP PBG PAS A 4/20/09 Initial proposal from PEP to purchase PBG and PAS B 5/04/09 PBG rejects PEP offer, adopts poison pill C 5/07/09 PAS rejects PEP offer D 5/11/09 PEP files suits against PBG challenging poison pill E 5/20/09 WSJ reports synergies up to $800MM F 5/27/09 PBG shareholders meeting, re-election of Board of Directors G 6/02/09 PBG 2009 earnings guidance H 7/08/09 PBG Q2 earnings release I 7/22/09 PEP Q2 earnings release J 7/27/09 PBG finalizes acquisition of Pepsi-Cola Bottlers for the Merrimack Valley Sources: FactSet Confidential 7 Perella Weinberg Partners
II. VALUATION ANALYSIS Perella Weinberg Partners
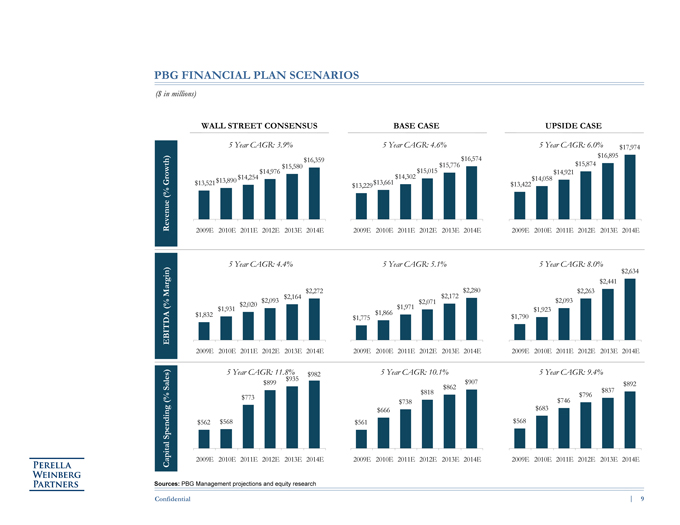
PBG FINANCIAL PLAN SCENARIOS ($ in millions) WALL STREET CONSENSUS BASE CASE UPSIDE CASE 5 Year CAGR: 3.9% 5 Year CAGR: 4.6% 5 Year CAGR: 6.0% $17,974 $16,895 $16,359 $16,574 $15,580 $15,776 $15,874 $14,254 $14,976 $14,302 $15,015 $14,921 $13,890 $14,058 Growth) $13,521 $13,661 $13,422 (% $13,229 Revenue 2009E 2010E 2011E 2012E 2013E 2014E 2009E 2010E 2011E 2012E 2013E 2014E 2009E 2010E 2011E 2012E 2013E 2014E 5 Year CAGR: 4.4% 5 Year CAGR: 5.1% 5 Year CAGR: 8.0% $2,634 $2,441 Margin) $2,272 $2,172 $2,280 $2,263 $2,093 $2,164 $2,093 (% $2,020 $2,071 $1,931 $1,866 $1,971 $1,923 $1,832 $1,790 EBITDA $1,775 2009E 2010E 2011E 2012E 2013E 2014E 2009E 2010E 2011E 2012E 2013E 2014E 2009E 2010E 2011E 2012E 2013E 2014E 5 Year CAGR: 11.8% $935 $982 5 Year CAGR: 10.1% 5 Year CAGR: 9.4% $899 $907 $892 Sales) $862 $818 $837 (% $773 $746 $796 $738 $683 $666 Spending $562 $568 $561 $568 Capital 2009E 2010E 2011E 2012E 2013E 2014E 2009E 2010E 2011E 2012E 2013E 2014E 2009E 2010E 2011E 2012E 2013E 2014E Sources: PBG Management projections and equity research Confidential 9 Perella Weinberg Partners
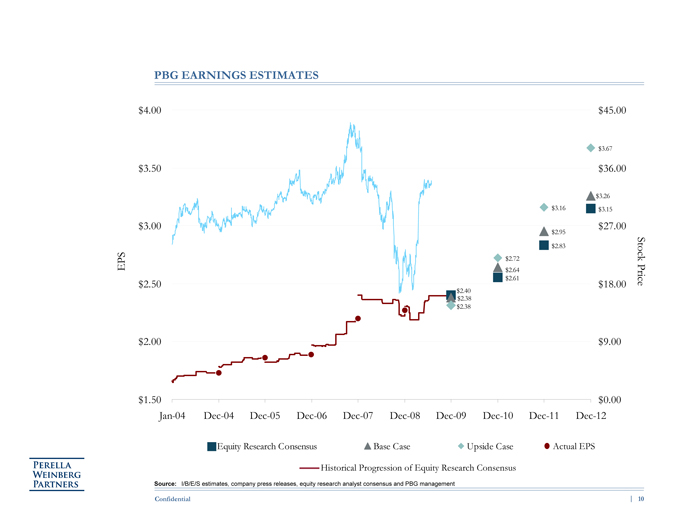
PBG EARNINGS ESTIMATES $4.00 $45.00 $3.67 $3.50 $36.00 $3.26 $3.16 $3.15 $3.00 $27.00 $2.95 $2.83 $2.72 Stock EPS $2.64 $2.61 Price $2.50 $18.00 $2.40 $2.38 $2.38 $2.00 $9.00 $1.50 $0.00 Jan-04 Dec-04 Dec-05 Dec-06 Dec-07 Dec-08 Dec-09 Dec-10 Dec-11 Dec-12 Equity Research Consensus Base Case Upside Case Actual EPS Historical Progression of Equity Research Consensus Source: I/B/E/S estimates, company press releases, equity research analyst consensus and PBG management Confidential 10 Perella Weinberg Partners
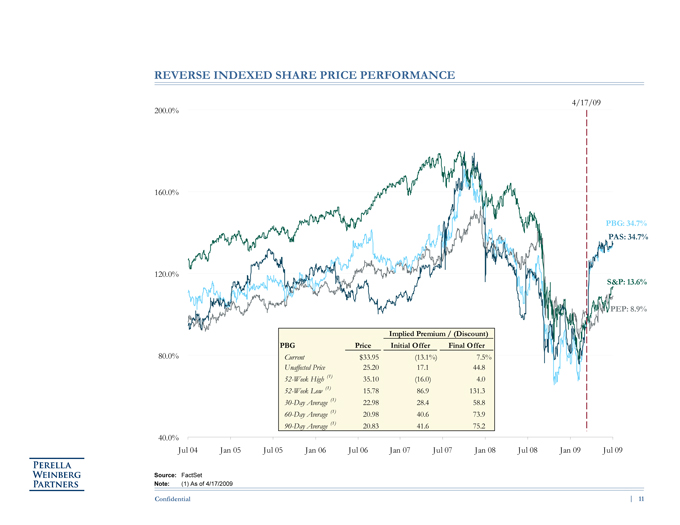
REVERSE INDEXED SHARE PRICE PERFORMANCE 4/17/09 200.0% 160.0% PBG: 34.7% PAS: 34.7% 120.0% S & amp;P: 13.6% PEP: 8.9% Implied Premium / (Discount) PBG Price Initial Offer Final Offer 80.0% Current $33.95 (13.1%) 7.5% Unaffected Price 25.20 17.1 44.8 52-Week High (1) 35.10 (16.0) 4.0 52-Week Low (1) 15.78 86.9 131.3 30-Day Average (1) 22.98 28.4 58.8 60-Day Average (1) 20.98 40.6 73.9 90-Day Average (1) 20.83 41.6 75.2 40.0% Jul 04 Jan 05 Jul 05 Jan 06 Jul 06 Jan 07 Jul 07 Jan 08 Jul 08 Jan 09 Jul 09 Source: FactSet Note: (1) As of 4/17/2009 Confidential 11 Perella Weinberg Partners
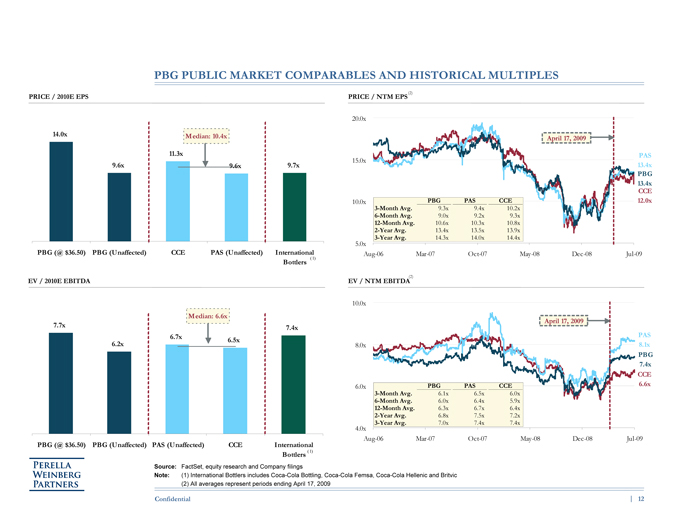
PBG PUBLIC MARKET COMPARABLES AND HISTORICAL MULTIPLES (2) PRICE / 2010E EPS PRICE / NTM EPS 20.0x 14.0x Median: 10.4x April 17, 2009 11.3x PAS 15.0x 9.6x 9.6x 9.7x 13.4x PBG 13.4x CCE 10.0x PBG PAS CCE 12.0x 3-Month Avg. 9.3x 9.4x 10.2x 6-Month Avg. 9.0x 9.2x 9.3x 12-Month Avg. 10.6x 10.3x 10.8x 2-Year Avg. 13.4x 13.5x 13.9x 5.0x 3-Year Avg. 14.3x 14.0x 14.4x PBG (@ $36.50) PBG (Unaffected) CCE PAS (Unaffected) International Aug-06 Mar-07 Oct-07 May-08 Dec-08 Jul-09 (1) Bottlers (2) EV / 2010E EBITDA EV / NTM EBITDA 10.0x Median: 6.6x April 17, 2009 7.7x 7.4x 6.7x PAS 6.5x 6.2x 8.0x 8.1x PBG 7.4x CCE 6.0x PBG PAS CCE 6.6x 3-Month Avg. 6.1x 6.5x 6.0x 6-Month Avg. 6.0x 6.4x 5.9x 12-Month Avg. 6.3x 6.7x 6.4x 2-Year Avg. 6.8x 7.5x 7.2x 4.0x 3-Year Avg. 7.0x 7.4x 7.4x PBG (@ $36.50) PBG (Unaffected) PAS (Unaffected) CCE International Aug-06 Mar-07 Oct-07 May-08 Dec-08 Jul-09 Bottlers ( 1) Source: FactSet, equity research and Company filings Note: (1) International Bottlers includes Coca-Cola Bottling, Coca-Cola Femsa, Coca-Cola Hellenic and Britvic (2) All averages represent periods ending April 17, 2009 Confidential 12 Perella Weinberg Partners
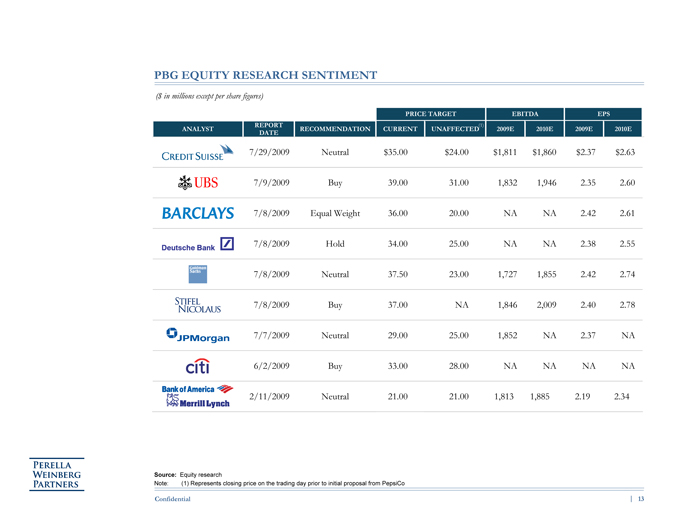
PBG EQUITY RESEARCH SENTIMENT ($ in millions except per share figures) PRICE TARGET EBITDA EPS REPORT (1) ANALYST RECOMMENDATION CURRENT UNAFFECTED 2009E 2010E 2009E 2010E DATE 7/29/2009 Neutral $35.00 $24.00 $1,811 $1,860 $2.37 $2.63 7/9/2009 Buy 39.00 31.00 1,832 1,946 2.35 2.60 7/8/2009 Equal Weight 36.00 20.00 NA NA 2.42 2.61 7/8/2009 Hold 34.00 25.00 NA NA 2.38 2.55 7/8/2009 Neutral 37.50 23.00 1,727 1,855 2.42 2.74 7/8/2009 Buy 37.00 NA 1,846 2,009 2.40 2.78 7/7/2009 Neutral 29.00 25.00 1,852 NA 2.37 NA 6/2/2009 Buy 33.00 28.00 NA NA NA NA 2/11/2009 Neutral 21.00 21.00 1,813 1,885 2.19 2.34 Source: Equity research Note: (1) Represents closing price on the trading day prior to initial proposal from PepsiCo Confidential 13 Perella Weinberg Partners

PBG: VALUATION SUMMARY Unaffected Price: Offer Price: $25.20 $36.50 52-Week Trading Range $15.78 $35.10 As of Unaffected Share Date (4/17/09) Equity Research Analyst Target Price Range $20.00 $31.00 (Pre-Bid) Equity Research Analyst Target Price Range $21.00 $39.00 (Current) Premiums Paid $30.00 $35.00 20%40% premium to Unaffected Share Price (4/17/09) Precedent Transaction Comparables $27.00 $42.00 7.0x 9.0x LTM EBITDA Street Discounted Cash Flows (1) $28.00 $37.00 Case Wall Public Comparables (2) $23.00 $31.00 Case Discounted Cash Flows (1) $28.00 $37.00 Management Base Public Comparables (2) $21.00 $32.00 Case Discounted Cash Flows (1) $36.00 $46.00 Management Upside Public Comparables (2) $23.00 $33.00 Source: Company filings, PBG Management projections and equity research$0 $10 $20 $30 $40 $50 $60 Note: All values are rounded to the nearest dollar. Values based on fully diluted shares calculated at the given price using the treasury stock method, assuming accelerated vesting of restricted stock and options due to change in control (1) Based on a 7.0%8.0% WACC and 6.0x 7.0x EBITDA exit multiple (2) Based on a 6.0x 7.0x 2010E EBITDA multiple range and a 10.0x 12.0x 2010 price/earnings multiple range Confidential 14 Perella Weinberg Partners
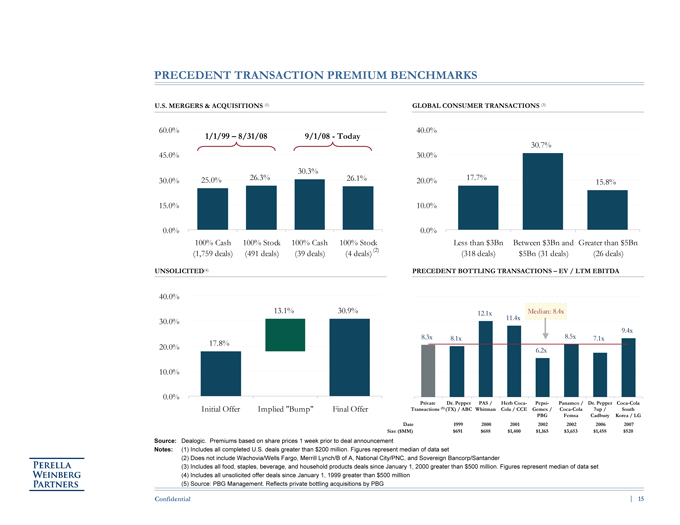
PRECEDENT TRANSACTION PREMIUM BENCHMARKS U.S. MERGERS & amp; ACQUISITIONS (1) GLOBAL CONSUMER TRANSACTIONS (3) 60.0% 40.0% 1/1/99 8/31/08 9/1/08 Today 30.7% 45.0% 30.0% 30.3% 30.0% 25.0% 26.3% 26.1% 20.0% 17.7% 15.8% 15.0% 10.0% 0.0% 0.0% 100% Cash 100% Stock 100% Cash 100% Stock Less than $3Bn Between $3Bn and Greater than $5Bn (1,759 deals) (491 deals) (39 deals) (4 deals)(2) (318 deals) $5Bn (31 deals) (26 deals) UNSOLICITED(4) PRECEDENT BOTTLING TRANSACTIONS EV / LTM EBITDA 40.0% 13.1% 30.9% 12.1x Median: 8.4x 30.0% 11.4x 8.3x 8.5x 9.4x 8.1x 7.1x 17.8% 20.0% 6.2x 10.0% 0.0% Private Dr. Pepper PAS / Herb Coca- Pepsi- Panamco / Dr. Pepper Coca-Cola Initial Offer Implied Bump Final Offer Transactions (5) (TX) / ABC Whitman Cola / CCE Gemex / Coca-Cola 7up / South PBG Femsa Cadbury Korea / LG Date 1999 2000 2001 2002 2002 2006 2007 Size ($MM) $691 $688 $1,400 $1,165 $3,653 $1,458 $520 Source: Dealogic. Premiums based on share prices 1 week prior to deal announcement Notes: (1) Includes all completed U.S. deals greater than $200 million. Figures represent median of data set (2) Does not include Wachovia/Wells Fargo, Merrill Lynch/B of A, National City/PNC, and Sovereign Bancorp/Santander (3) Includes all food, staples, beverage, and household products deals since January 1, 2000 greater than $500 million. Figures represent median of data set (4) Includes all unsolicited offer deals since January 1, 1999 greater than $500 milllion (5) Source: PBG Management. Reflects private bottling acquisitions by PBG Confidential 15 Perella Weinberg Partners
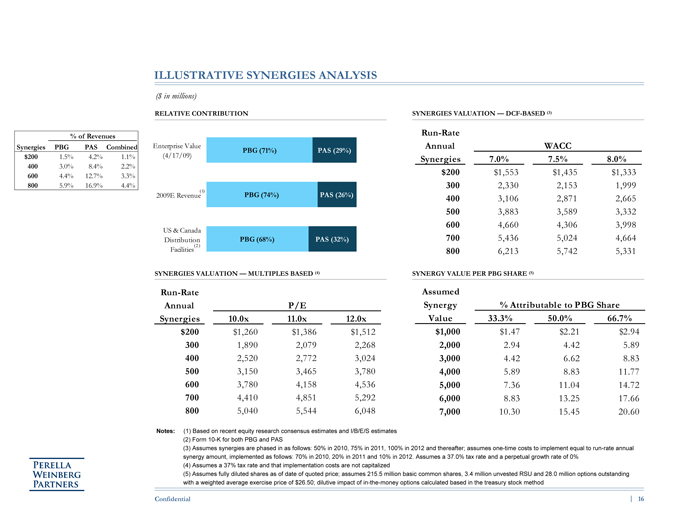
% of Revenues Synergies PBG PAS Combined $200 1.5% 4.2% 1.1% 400 3.0% 8.4% 2.2% 600 4.4% 12.7% 3.3% 800 5.9% 16.9% 4.4% ILLUSTRATIVE SYNERGIES ANALYSIS ($ in millions) RELATIVE CONTRIBUTION SYNERGIES VALUATION DCF-BASED (3) Run-Rate Enterprise Value Annual WACC PBG (71%) PAS (29%) (4/17/09) Synergies 7.0% 7.5% 8.0% $200 $1,553 $1,435 $1,333 (1) 300 2,330 2,153 1,999 2009E Revenue PBG (74%) PAS (26%) 400 3,106 2,871 2,665 500 3,883 3,589 3,332 600 4,660 4,306 3,998 US & amp; Canada 700 5,436 5,024 4,664 Distribution PBG (68%) PAS (32%) (2 ) Facilities 800 6,213 5,742 5,331 SYNERGIES VALUATION MULTIPLES BASED (4) SYNERGY VALUE PER PBG SHARE (5) Run-Rate Assumed Annual P/E Synergy % Attributable to PBG Share Synergies 10.0x 11.0x 12.0x Value 33.3% 50.0% 66.7% $200 $1,260 $1,386 $1,512 $1,000 $1.47 $2.21 $2.94 300 1,890 2,079 2,268 2,000 2.94 4.42 5.89 400 2,520 2,772 3,024 3,000 4.42 6.62 8.83 500 3,150 3,465 3,780 4,000 5.89 8.83 11.77 600 3,780 4,158 4,536 5,000 7.36 11.04 14.72 700 4,410 4,851 5,292 6,000 8.83 13.25 17.66 800 5,040 5,544 6,048 7,000 10.30 15.45 20.60 Notes: (1) Based on recent equity research consensus estimates and I/B/E/S estimates (2) Form 10-K for both PBG and PAS (3) Assumes synergies are phased in as follows: 50% in 2010, 75% in 2011, 100% in 2012 and thereafter; assumes one-time costs to implement equal to run-rate annual synergy amount, implemented as follows: 70% in 2010, 20% in 2011 and 10% in 2012. Assumes a 37.0% tax rate and a perpetual growth rate of 0% (4) Assumes a 37% tax rate and that implementation costs are not capitalized (5) Assumes fully diluted shares as of date of quoted price; assumes 215.5 million basic common shares, 3.4 million unvested RSU and 28.0 million options outstanding with a weighted average exercise price of $26.50; dilutive impact of in-the-money options calculated based in the treasury stock method Confidential 16 Perella Weinberg Partners
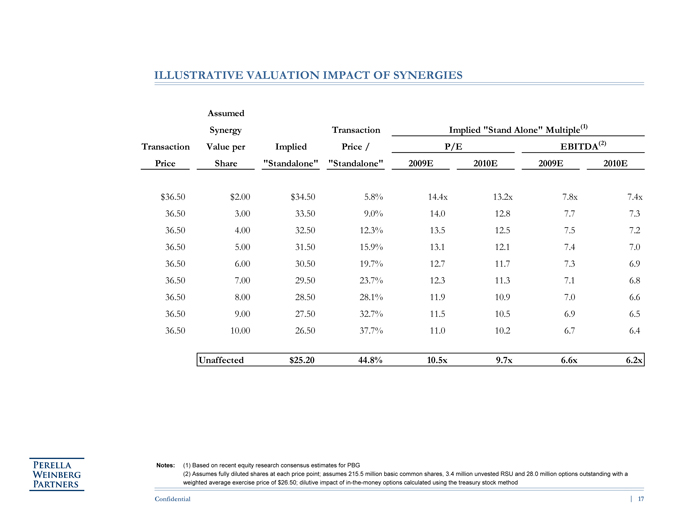
ILLUSTRATIVE VALUATION IMPACT OF SYNERGIES Assumed Synergy Transaction Implied Stand Alone Multiple(1) Transaction Value per Implied Price / P/E EBITDA(2) Price Share Standalone Standalone 2009E 2010E 2009E 2010E $36.50 $2.00 $34.50 5.8% 14.4x 13.2x 7.8x 7.4x 36.50 3.00 33.50 9.0% 14.0 12.8 7.7 7.3 36.50 4.00 32.50 12.3% 13.5 12.5 7.5 7.2 36.50 5.00 31.50 15.9% 13.1 12.1 7.4 7.0 36.50 6.00 30.50 19.7% 12.7 11.7 7.3 6.9 36.50 7.00 29.50 23.7% 12.3 11.3 7.1 6.8 36.50 8.00 28.50 28.1% 11.9 10.9 7.0 6.6 36.50 9.00 27.50 32.7% 11.5 10.5 6.9 6.5 36.50 10.00 26.50 37.7% 11.0 10.2 6.7 6.4 36.50 Unaffected $25.20 44.8% 10.5x 9.7x 6.6x 6.2x Notes: (1) Based on recent equity research consensus estimates for PBG (2) Assumes fully diluted shares at each price point; assumes 215.5 million basic common shares, 3.4 million unvested RSU and 28.0 million options outstanding with a weighted average exercise price of $26.50; dilutive impact of in-the-money options calculated using the treasury stock method Confidential 17 Perella Weinberg Partners
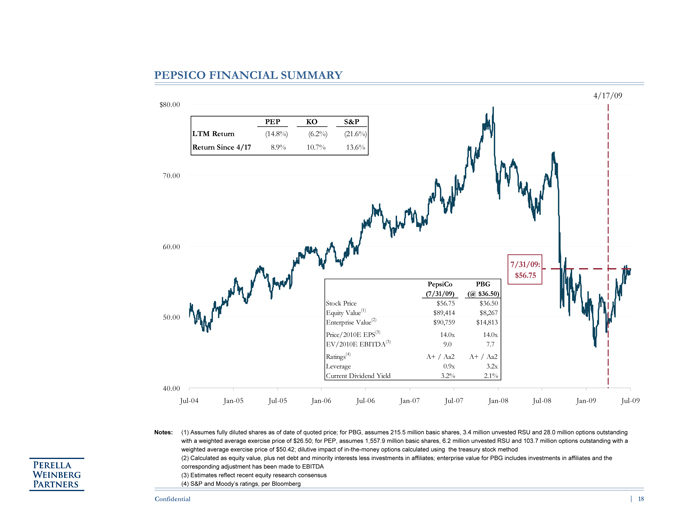
PEPSICO FINANCIAL SUMMARY 4/17/09 $80.00 PEP KO S&P LTM Return (14.8%) (6.2%) (21.6%) Return Since 4/17 8.9% 10.7% 13.6% 70.00 60.00 7/31/09: $56.75 PepsiCo PBG (7/31/09) (@ $36.50) Stock Price $56.75 $36.50 Equity Value(1) $89,414 $8,267 50.00 (2) Enterprise Value $90,759 $14,813 Price/2010E EPS(3) 14.0x 14.0x EV/2010E EBITDA(3) 9.0 7.7 Ratings(4) A+ / Aa2 A+ / Aa2 Leverage 0.9x 3.2x Current Dividend Yield 3.2% 2.1% 40.00 Jul-04 Jan-05 Jul-05 Jan-06 Jul-06 Jan-07 Jul-07 Jan-08 Jul-08 Jan-09 Jul-09 Notes: (1) Assumes fully diluted shares as of date of quoted price; for PBG, assumes 215.5 million basic shares, 3.4 million unvested RSU and 28.0 million options outstanding with a weighted average exercise price of $26.50; for PEP, assumes 1,557.9 million basic shares, 6.2 million unvested RSU and 103.7 million options outstanding with a weighted average exercise price of $50.42; dilutive impact of in-the-money options calculated using the treasury stock method (2) Calculated as equity value, plus net debt and minority interests less investments in affiliates; enterprise value for PBG includes investments in affiliates and the corresponding adjustment has been made to EBITDA (3) Estimates reflect recent equity research consensus (4) S&P and Moodys ratings, per Bloomberg Confidential 18 Perella Weinberg Partners
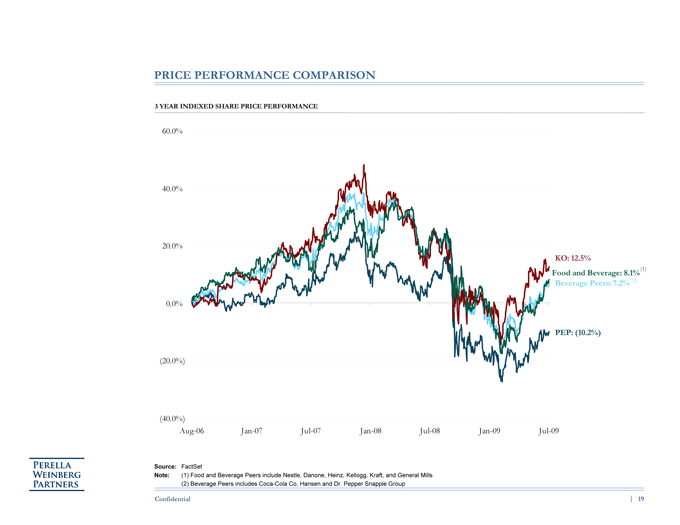
PRICE PERFORMANCE COMPARISON 3 YEAR INDEXED SHARE PRICE PERFORMANCE 60.0% 40.0% 20.0% KO: 12.5% (1) Food and Beverage: 8.1% Beverage Peers: 7.2% (2) 0.0% PEP: (10.2%) (20.0%) (40.0%) Aug-06 Jan-07 Jul-07 Jan-08 Jul-08 Jan-09 Jul-09 Source: FactSet Note: (1) Food and Beverage Peers include Nestle, Danone, Heinz, Kellogg, Kraft, and General Mills (2) Beverage Peers includes Coca-Cola Co, Hansen and Dr. Pepper Snapple Group Confidential 19 Perella Weinberg Partners

PEPSICO PUBLIC MARKET COMPARABLES EV / 2010E REVENUE EV / 2010E EBITDA Median: 9.1x 3.3x 9.9x 10.0x 9.0x Median: 8.0x 9.2x 9.2x 9.1x 9.0x 8.7x 8.0x 7.2x 2.0x 2.2x 1.9x 1.8x 1.7x 1.7x 1.6x 1.6x 1.4x PEP KO HANS DPS BN-FR K GIS HNZ NESN- KFT PEP KO DPS HANS BN-FR K KFT HNZ NESN- GIS CH CH PRICE / 2010E EPS DIVIDEND YIELD Median: 13.7x Median: 12.9x 15.0x 14.8x 4.4% 13.9x 13.8x 13.8x 13.6x 4.1% 12.9x 12.2x 13.2x 3.2% 3.3% 3.2% 3.2% 3.2% 3.2% 10.1x 0.0% 0.0% PEP KO DPS HANS NESN- HNZ K KFT GIS BN-FR PEP KO HANS DPS HNZ KFT BN-FR GIS NESN- K CH CH Beverage Peer Group Food & Beverage Peer Group Source: Company filings, equity research and FactSet; prices as of 7/31/2009 Confidential 20 Perella Weinberg Partners
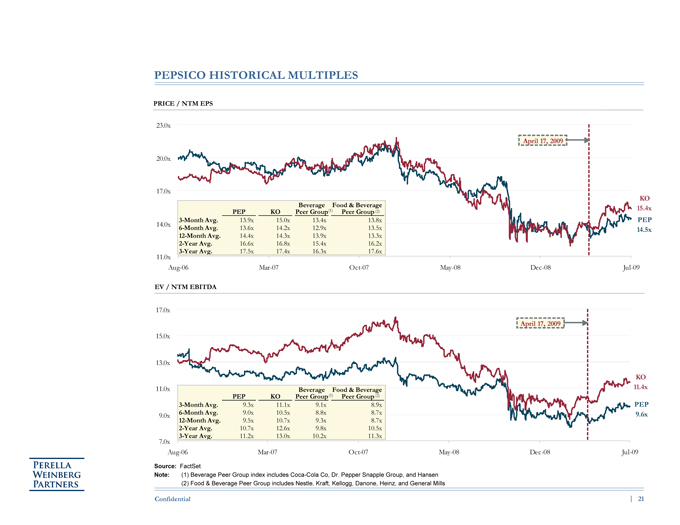
PEPSICO HISTORICAL MULTIPLES PRICE / NTM EPS 23.0x April 17, 2009 20.0x 17.0x KO Beverage Food & Beverage 15.4x PEP KO Peer Group(1) Peer Group(2) 3-Month Avg. 13.9x 15.0x 13.4x 13.8x PEP 14.0x 6-Month Avg. 13.6x 14.2x 12.9x 13.5x 14.5x 12-Month Avg. 14.4x 14.3x 13.9x 13.3x 2-Year Avg. 16.6x 16.8x 15.4x 16.2x 11.0x 3-Year Avg. 17.5x 17.4x 16.3x 17.6x Aug-06 Mar-07 Oct-07 May-08 Dec-08 Jul-09 EV / NTM EBITDA 17.0x April 17, 2009 15.0x 13.0x KO 11.0x Beverage Food & Beverage 11.4x PEP KO Peer Group(1) Peer Group(2) 3-Month Avg. 9.3x 11.1x 9.1x 8.9x PEP 9.0x 6-Month Avg. 9.0x 10.5x 8.8x 8.7x 9.6x 12-Month Avg. 9.5x 10.7x 9.3x 8.7x 2-Year Avg. 10.7x 12.6x 9.8x 10.5x 7.0x 3-Year Avg. 11.2x 13.0x 10.2x 11.3x Aug-06 Mar-07 Oct-07 May-08 Dec-08 Jul-09 Source: FactSet Note: (1) Beverage Peer Group index includes Coca-Cola Co, Dr. Pepper Snapple Group, and Hansen (2) Food & Beverage Peer Group includes Nestle, Kraft, Kellogg, Danone, Heinz, and General Mills Confidential 21 Perella Weinberg Partners
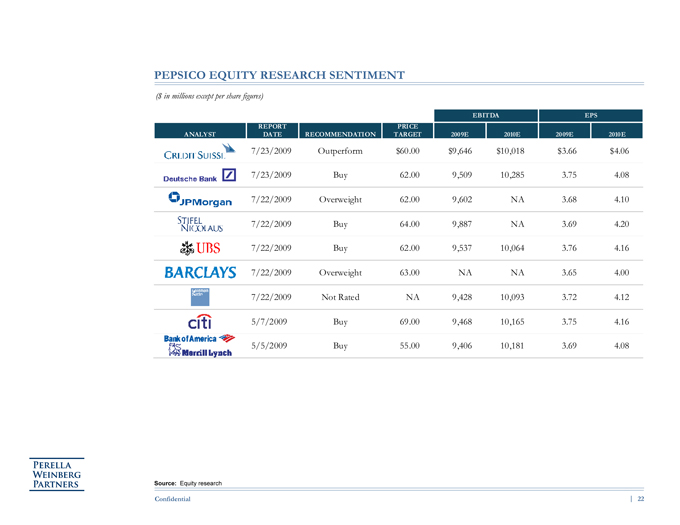
PEPSICO EQUITY RESEARCH SENTIMENT ($ in millions except per share figures) EBITDA EPS REPORT PRICE ANALYST DATE RECOMMENDATION TARGET 2009E 2010E 2009E 2010E 7/23/2009 Outperform $60.00 $9,646 $10,018 $3.66 $4.06 7/23/2009 Buy 62.00 9,509 10,285 3.75 4.08 7/22/2009 Overweight 62.00 9,602 NA 3.68 4.10 7/22/2009 Buy 64.00 9,887 NA 3.69 4.20 7/22/2009 Buy 62.00 9,537 10,064 3.76 4.16 7/22/2009 Overweight 63.00 NA NA 3.65 4.00 7/22/2009 Not Rated NA 9,428 10,093 3.72 4.12 5/7/2009 Buy 69.00 9,468 10,165 3.75 4.16 5/5/2009 Buy 55.00 9,406 10,181 3.69 4.08 Source: Equity research Confidential 22 Perella Weinberg Partners
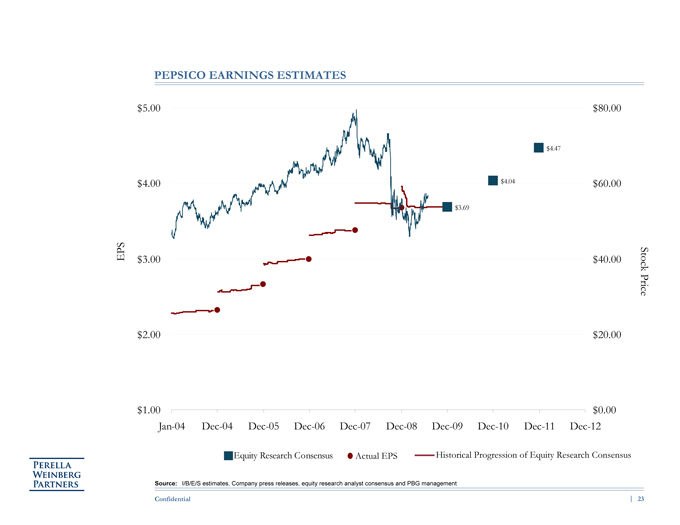
PEPSICO EARNINGS ESTIMATES $5.00 $80.00 $4.47 $4.00 $4.04 $60.00 $3.69 EPS $3.00 $40.00 Stock Price $2.00 $20.00 $1.00 $0.00 Jan-04 Dec-04 Dec-05 Dec-06 Dec-07 Dec-08 Dec-09 Dec-10 Dec-11 Dec-12 Equity Research Consensus Actual EPS Historical Progression of Equity Research Consensus Source: I/B/E/S estimates, Company press releases, equity research analyst consensus and PBG management Confidential 23 Perella Weinberg Partners
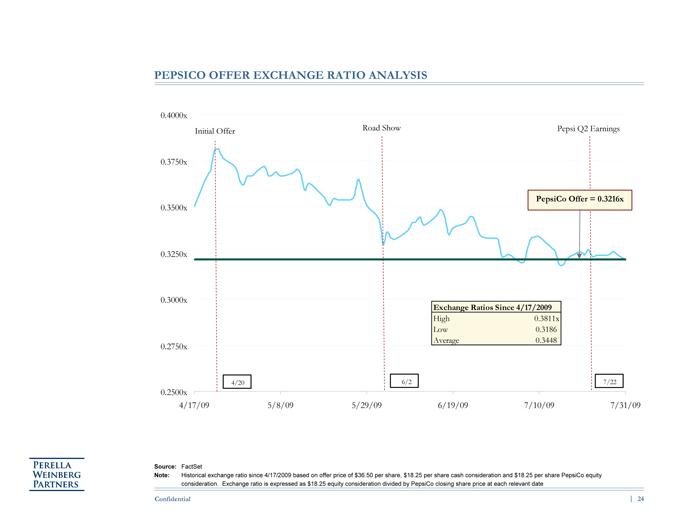
PEPSICO OFFER EXCHANGE RATIO ANALYSIS 0.4000x Initial Offer Road Show Pepsi Q2 Earnings 0.3750x PepsiCo Offer = 0.3216x 0.3500x 0.3250x 0.3000x Exchange Ratios Since 4/17/2009 High 0.3811x Low 0.3186 Average 0.3448 0.2750x 4/20 6/2 7/22 0.2500x 4/17/09 5/8/09 5/29/09 6/19/09 7/10/09 7/31/09 Source: FactSet Note: Historical exchange ratio since 4/17/2009 based on offer price of $36.50 per share, $18.25 per share cash consideration and $18.25 per share PepsiCo equity consideration. Exchange ratio is expressed as $18.25 equity consideration divided by PepsiCo closing share price at each relevant date Confidential 24 Perella Weinberg Partners
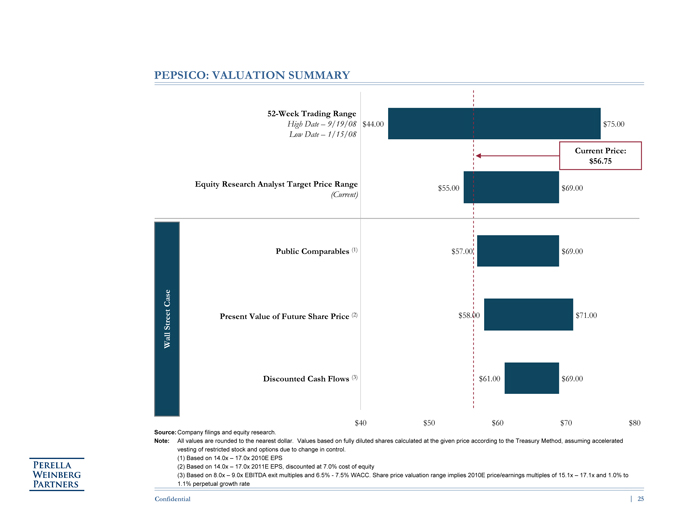
PEPSICO: VALUATION SUMMARY 52-Week Trading Range High Date 9/19/08 $44.00 $75.00 Low Date 1/15/08 Current Price: $56.75 Equity Research Analyst Target Price Range $55.00 $69.00 (Current) Public Comparables (1) $57.00 $69.00 Case Street Present Value of Future Share Price (2) $58.00 $71.00 Wall Discounted Cash Flows (3) $61.00 $69.00 $40 $50 $60 $70 $80 Source: Company filings and equity research. Note: All values are rounded to the nearest dollar. Values based on fully diluted shares calculated at the given price according to the Treasury Method, assuming accelerated vesting of restricted stock and options due to change in control. (1) Based on 14.0x 17.0x 2010E EPS (2) Based on 14.0x 17.0x 2011E EPS, discounted at 7.0% cost of equity (3) Based on 8.0x 9.0x EBITDA exit multiples and 6.5%7.5% WACC. Share price valuation range implies 2010E price/earnings multiples of 15.1x 17.1x and 1.0% to 1.1% perpetual growth rate Confidential 25 Perella Weinberg Partners
III. ILLUSTRATIVE PRO FORMA ANALYSIS Perella Weinberg Partners
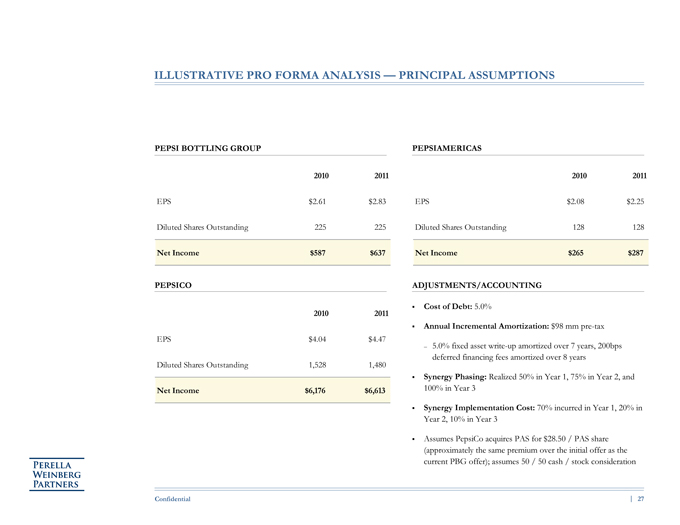
ILLUSTRATIVE PRO FORMA ANALYSIS PRINCIPAL ASSUMPTIONS PEPSI BOTTLING GROUP PEPSIAMERICAS 2010 2011 2010 2011 EPS $2.61 $2.83 EPS $2.08 $2.25 Diluted Shares Outstanding 225 225 Diluted Shares Outstanding 128 128 Net Income $587 $637 Net Income $265 $287 PEPSICO ADJUSTMENTS/ACCOUNTING 2010 2011 ??Cost of Debt: 5.0% ??Annual Incremental Amortization: $98 mm pre-tax EPS $4.04 $4.47 5.0% fixed asset write-up amortized over 7 years, 200bps deferred financing fees amortized over 8 years Diluted Shares Outstanding 1,528 1,480 ??Synergy Phasing: Realized 50% in Year 1, 75% in Year 2, and Net Income $6,176 $6,613 100% in Year 3 ??Synergy Implementation Cost: 70% incurred in Year 1, 20% in Year 2, 10% in Year 3 ??Assumes PepsiCo acquires PAS for $28.50 / PAS share (approximately the same premium over the initial offer as the current PBG offer); assumes 50 / 50 cash / stock consideration Confidential 27 Perella Weinberg Partners
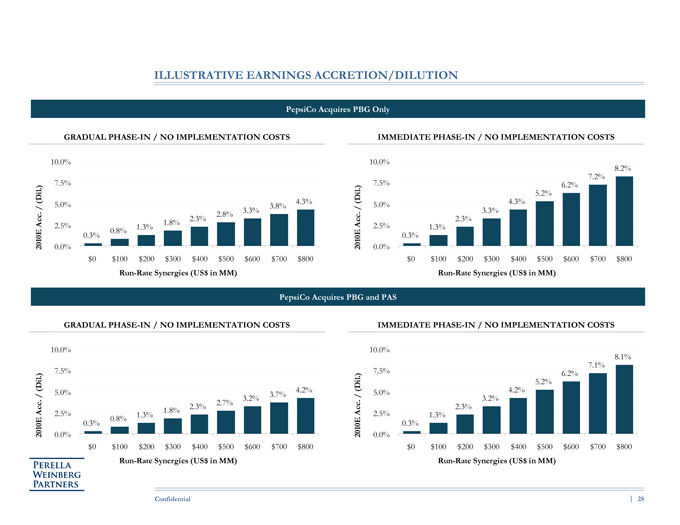
ILLUSTRATIVE EARNINGS ACCRETION/DILUTION PepsiCo Acquires PBG Only GRADUAL PHASE-IN / NO IMPLEMENTATION COSTS IMMEDIATE PHASE-IN / NO IMPLEMENTATION COSTS 10.0% 10.0% 8.2% 7.2% 7.5% 7.5% 6.2% . ) . ) (Dil (Dil 5.2% 5.0% 4.3% 5.0% 4.3% / 3.8% / . 2.8% 3.3% . 3.3% 2.3% 2.3% Acc 2.5% 1.8% Acc 2.5% 0.8% 1.3% 1.3% 0.3% 0.3% 2010E 0.0% 2010E 0.0% $0 $100 $200 $300 $400 $500 $600 $700 $800 $0 $100 $200 $300 $400 $500 $600 $700 $800 Run-Rate Synergies (US$ in MM) Run-Rate Synergies (US$ in MM) PepsiCo Acquires PBG and PAS GRADUAL PHASE-IN / NO IMPLEMENTATION COSTS IMMEDIATE PHASE-IN / NO IMPLEMENTATION COSTS 10.0% 10.0% 8.1% 7.1% 7.5% 7.5% ) . . ) 6.2% (Dil (Dil 5.2% 4.2% 4.2% / 5.0% 3.7%/ 5.0% . 2.7% 3.2%. 3.2% 2.3% 2.3% Acc 2.5% 1.8% Acc 2.5% 0.8% 1.3% 1.3% 0.3% 0.3% 2010E 0.0% 2010E 0.0% $0 $100 $200 $300 $400 $500 $600 $700 $800 $0 $100 $200 $300 $400 $500 $600 $700 $800 Run-Rate Synergies (US$ in MM) Run-Rate Synergies (US$ in MM) Confidential 28 Perella Weinberg Partners
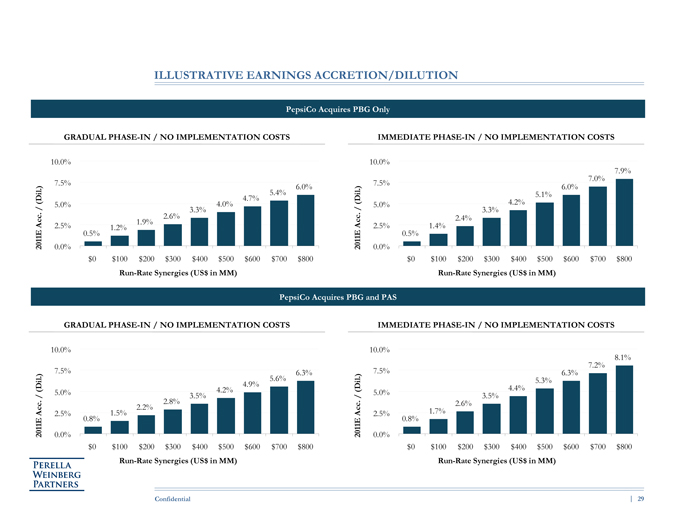
ILLUSTRATIVE EARNINGS ACCRETION/DILUTION PepsiCo Acquires PBG Only GRADUAL PHASE-IN / NO IMPLEMENTATION COSTS IMMEDIATE PHASE-IN / NO IMPLEMENTATION COSTS 10.0% 10.0% 7.9% 7.0% ) 7.5% ) 7.5% 6.0% 6.0% . 5.4% . 5.1% (Dil 4.7% (Dil 5.0% 4.0% 5.0% 4.2% / 3.3%/ 3.3% . 2.6% . 2.4% Acc 1.9% Acc 2.5% 1.2% 2.5% 1.4% 0.5% 0.5% 2011E 0.0% 2011E 0.0% $0 $100 $200 $300 $400 $500 $600 $700 $800 $0 $100 $200 $300 $400 $500 $600 $700 $800 Run-Rate Synergies (US$ in MM) Run-Rate Synergies (US$ in MM) PepsiCo Acquires PBG and PAS GRADUAL PHASE-IN / NO IMPLEMENTATION COSTS IMMEDIATE PHASE-IN / NO IMPLEMENTATION COSTS 10.0% 10.0% 8.1% 7.2% ) 7.5% 6.3% ) 7.5% 6.3% . 5.6% . 5.3% 4.9% (Dil 4.2% (Dil 4.4% / 5.0% 3.5%/ 5.0% 3.5% . 2.8%. 2.6% 2.2% Acc 2.5% 1.5% Acc 2.5% 1.7% 0.8% 0.8% 2011E 0.0% 2011E 0.0% $0 $100 $200 $300 $400 $500 $600 $700 $800 $0 $100 $200 $300 $400 $500 $600 $700 $800 Run-Rate Synergies (US$ in MM) Run-Rate Synergies (US$ in MM) Confidential 29 Perella Weinberg Partners
APPENDIX Perella Weinberg Partners
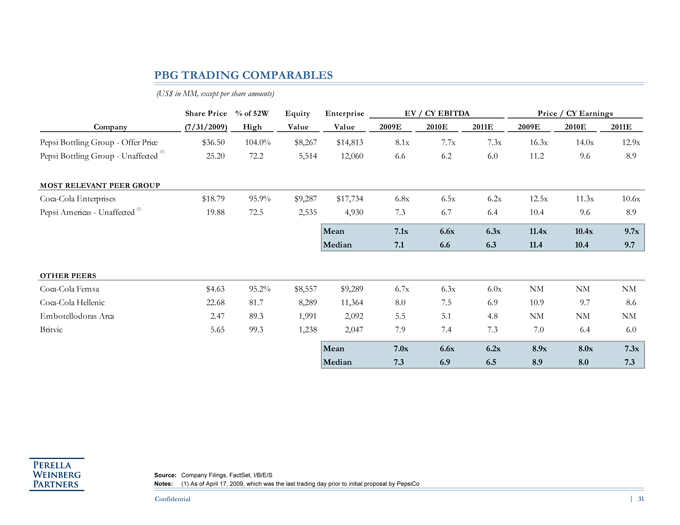
PBG TRADING COMPARABLES (US$ in MM, except per share amounts) Share Price % of 52 W Equity Enterprise EV / CY EBITDA Price / CY Earnings Company (7/31/2009) High Value Value 2009E 2010E 2011E 2009E 2010E 2011E Pepsi Bottling Group Offer Price $36.50 104.0% $8,267 $14,813 8.1x 7.7x 7.3x 16.3x 14.0x 12.9x (1) Pepsi Bottling Group Unaffected 25.20 72.2 5,514 12,060 6.6 6.2 6.0 11.2 9.6 8.9 MOST RELEVANT PEER GROUP Coca-Cola Enterprises $18.79 95.9% $9,287 $17,734 6.8x 6.5x 6.2x 12.5x 11.3x 10.6x Pepsi Americas Unaffected (1) 19.88 72.5 2,535 4,930 7.3 6.7 6.4 10.4 9.6 8.9 Mean 7.1x 6.6x 6.3x 11.4x 10.4x 9.7x Median 7.1 6.6 6.3 11.4 10.4 9.7 OTHER PEERS Coca-Cola Femsa $4.63 95.2% $8,557 $9,289 6.7x 6.3x 6.0x NM NM NM Coca-Cola Hellenic 22.68 81.7 8,289 11,364 8.0 7.5 6.9 10.9 9.7 8.6 Embotellodoras Arca 2.47 89.3 1,991 2,092 5.5 5.1 4.8 NM NM NM Britvic 5.65 99.3 1,238 2,047 7.9 7.4 7.3 7.0 6.4 6.0 Mean 7.0x 6.6x 6.2x 8.9x 8.0x 7.3x Median 7.3 6.9 6.5 8.9 8.0 7.3 Source: Company Filings, FactSet, I/B/E/S Notes: (1) As of April 17, 2009, which was the last trading day prior to initial proposal by PepsiCo Confidential 31 Perella Weinberg Partners
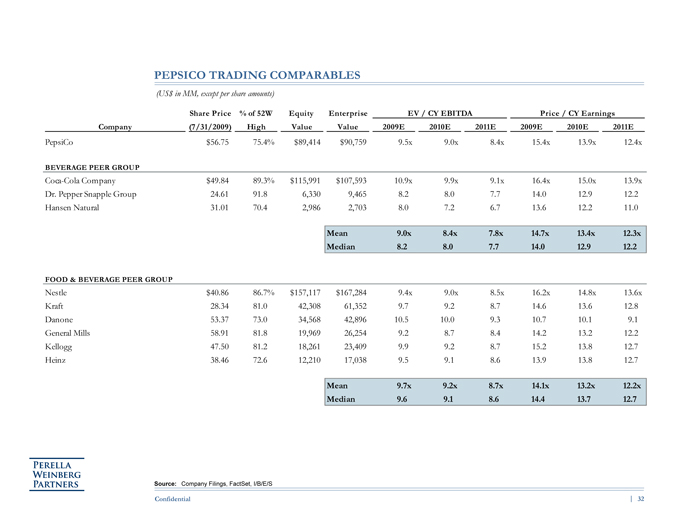
PEPSICO TRADING COMPARABLES (US$ in MM, except per share amounts) Share Price % of 52W Equity Enterprise EV / CY EBITDA Price / CY Earnings Company (7/31/2009) High Value Value 2009E 2010E 2011E 2009E 2010E 2011E PepsiCo $56.75 75.4% $89,414 $90,759 9.5x 9.0x 8.4x 15.4x 13.9x 12.4x BEVERAGE PEER GROUP Coca-Cola Company $49.84 89.3% $115,991 $107,593 10.9x 9.9x 9.1x 16.4x 15.0x 13.9x Dr. Pepper Snapple Group 24.61 91.8 6,330 9,465 8.2 8.0 7.7 14.0 12.9 12.2 Hansen Natural 31.01 70.4 2,986 2,703 8.0 7.2 6.7 13.6 12.2 11.0 Mean 9.0x 8.4x 7.8x 14.7x 13.4x 12.3x Median 8.2 8.0 7.7 14.0 12.9 12.2 FOOD & BEVERAGE PEER GROUP Nestle $40.86 86.7% $157,117 $167,284 9.4x 9.0x 8.5x 16.2x 14.8x 13.6x Kraft 28.34 81.0 42,308 61,352 9.7 9.2 8.7 14.6 13.6 12.8 Danone 53.37 73.0 34,568 42,896 10.5 10.0 9.3 10.7 10.1 9.1 General Mills 58.91 81.8 19,969 26,254 9.2 8.7 8.4 14.2 13.2 12.2 Kellogg 47.50 81.2 18,261 23,409 9.9 9.2 8.7 15.2 13.8 12.7 Heinz 38.46 72.6 12,210 17,038 9.5 9.1 8.6 13.9 13.8 12.7 Mean 9.7x 9.2x 8.7x 14.1x 13.2x 12.2x Median 9.6 9.1 8.6 14.4 13.7 12.7 Source: Company Filings, FactSet, I/B/E/S Confidential 32 Perella Weinberg Partners
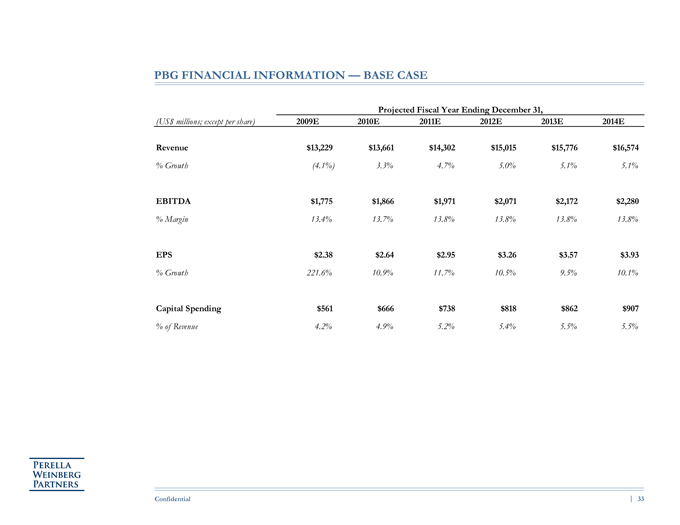
PBG FINANCIAL INFORMATION BASE CASE Projected Fiscal Year Ending December 31, (US$ millions; except per share) 2009E 2010E 2011E 2012E 2013E 2014E Revenue $13,229 $13,661 $14,302 $15,015 $15,776 $16,574 % Growth (4.1%) 3.3% 4.7% 5.0% 5.1% 5.1% EBITDA $1,775 $1,866 $1,971 $2,071 $2,172 $2,280 % Margin 13.4% 13.7% 13.8% 13.8% 13.8% 13.8% EPS $2.38 $2.64 $2.95 $3.26 $3.57 $3.93 % Growth 221.6% 10.9% 11.7% 10.5% 9.5% 10.1% Capital Spending $561 $666 $738 $818 $862 $907 % of Revenue 4.2% 4.9% 5.2% 5.4% 5.5% 5.5% Confidential 33 Perella Weinberg Partners
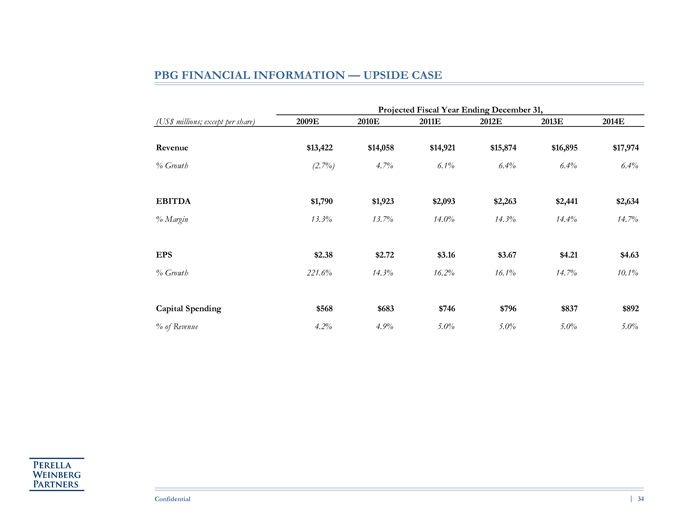
PBG FINANCIAL INFORMATION UPSIDE CASE Projected Fiscal Year Ending December 31, (US$ millions; except per share) 2009E 2010E 2011E 2012E 2013E 2014E Revenue $13,422 $14,058 $14,921 $15,874 $16,895 $17,974 % Growth (2.7%) 4.7% 6.1% 6.4% 6.4% 6.4% EBITDA $1,790 $1,923 $2,093 $2,263 $2,441 $2,634 % Margin 13.3% 13.7% 14.0% 14.3% 14.4% 14.7% EPS $2.38 $2.72 $3.16 $3.67 $4.21 $4.63 % Growth 221.6% 14.3% 16.2% 16.1% 14.7% 10.1% Capital Spending $568 $683 $746 $796 $837 $892 % of Revenue 4.2% 4.9% 5.0% 5.0% 5.0% 5.0% Confidential 34 Perella Weinberg Partners
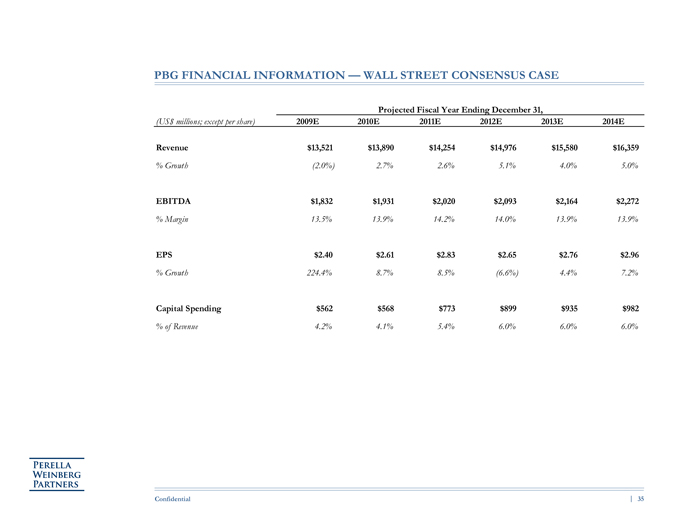
PBG FINANCIAL INFORMATION WALL STREET CONSENSUS CASE Projected Fiscal Year Ending December 31, (US$ millions; except per share) 2009E 2010E 2011E 2012E 2013E 2014E Revenue $13,521 $13,890 $14,254 $14,976 $15,580 $16,359 % Growth (2.0%) 2.7% 2.6% 5.1% 4.0% 5.0% EBITDA $1,832 $1,931 $2,020 $2,093 $2,164 $2,272 % Margin 13.5% 13.9% 14.2% 14.0% 13.9% 13.9% EPS $2.40 $2.61 $2.83 $2.65 $2.76 $2.96 % Growth 224.4% 8.7% 8.5% (6.6%) 4.4% 7.2% Capital Spending $562 $568 $773 $899 $935 $982 % of Revenue 4.2% 4.1% 5.4% 6.0% 6.0% 6.0% Confidential 35 Perella Weinberg Partners
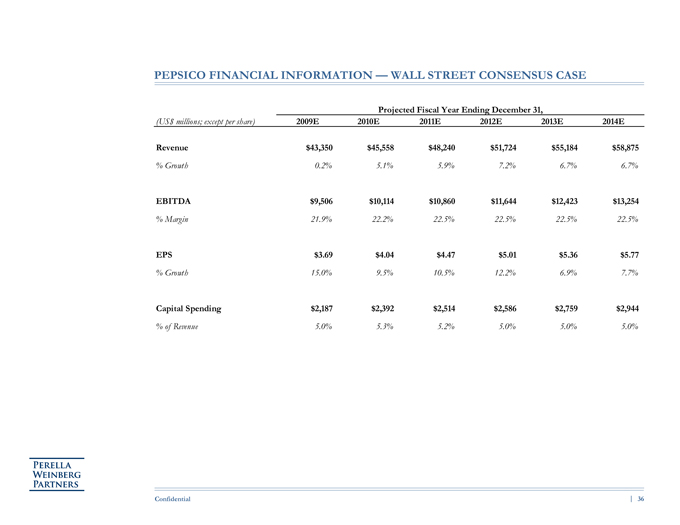
PEPSICO FINANCIAL INFORMATION WALL STREET CONSENSUS CASE Projected Fiscal Year Ending December 31, (US$ millions; except per share) 2009E 2010E 2011E 2012E 2013E 2014E Revenue $43,350 $45,558 $48,240 $51,724 $55,184 $58,875 % Growth 0.2% 5.1% 5.9% 7.2% 6.7% 6.7% EBITDA $9,506 $10,114 $10,860 $11,644 $12,423 $13,254 % Margin 21.9% 22.2% 22.5% 22.5% 22.5% 22.5% EPS $3.69 $4.04 $4.47 $5.01 $5.36 $5.77 % Growth 15.0% 9.5% 10.5% 12.2% 6.9% 7.7% Capital Spending $2,187 $2,392 $2,514 $2,586 $2,759 $2,944 % of Revenue 5.0% 5.3% 5.2% 5.0% 5.0% 5.0% Confidential 36 Perella Weinberg Partners
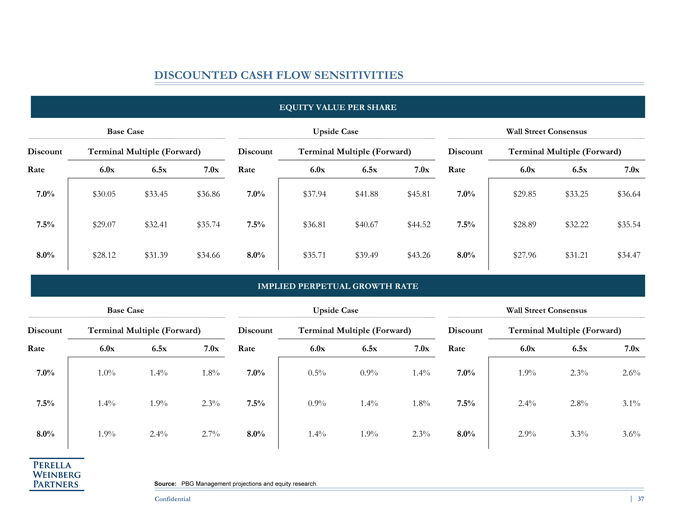
DISCOUNTED CASH FLOW SENSITIVITIES EQUITY VALUE PER SHARE Base Case Upside Case Wall Street Consensus Discount Terminal Multiple (Forward) Discount Terminal Multiple (Forward) Discount Terminal Multiple (Forward) Rate 6.0x 6.5x 7.0x Rate 6.0x 6.5x 7.0x Rate 6.0x 6.5x 7.0x 7.0% $30.05 $33.45 $36.86 7.0% $37.94 $41.88 $45.81 7.0% $29.85 $33.25 $36.64 7.5% $29.07 $32.41 $35.74 7.5% $36.81 $40.67 $44.52 7.5% $28.89 $32.22 $35.54 8.0% $28.12 $31.39 $34.66 8.0% $35.71 $39.49 $43.26 8.0% $27.96 $31.21 $34.47 IMPLIED PERPETUAL GROWTH RATE Base Case Upside Case Wall Street Consensus Discount Terminal Multiple (Forward) Discount Terminal Multiple (Forward) Discount Terminal Multiple (Forward) Rate 6.0x 6.5x 7.0x Rate 6.0x 6.5x 7.0x Rate 6.0x 6.5x 7.0x 7.0% 1.0% 1.4% 1.8% 7.0% 0.5% 0.9% 1.4% 7.0% 1.9% 2.3% 2.6% 7.5% 1.4% 1.9% 2.3% 7.5% 0.9% 1.4% 1.8% 7.5% 2.4% 2.8% 3.1% 8.0% 1.9% 2.4% 2.7% 8.0% 1.4% 1.9% 2.3% 8.0% 2.9% 3.3% 3.6% Source: PBG Management projections and equity research. Confidential 37 Perella Weinberg Partners
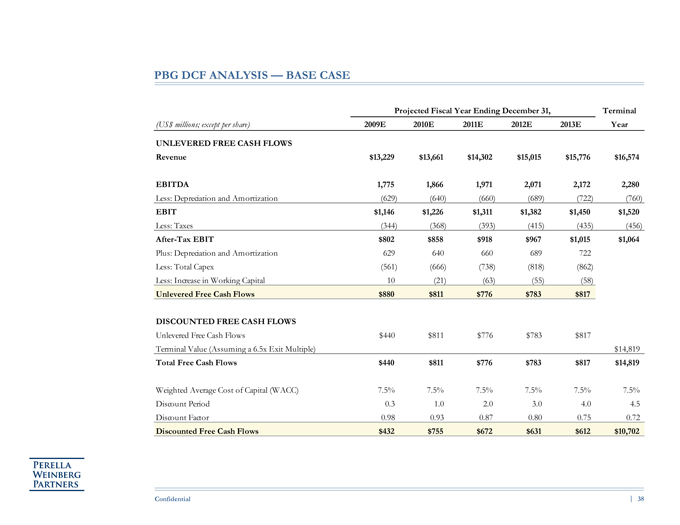
PBG DCF ANALYSIS BASE CASE Projected Fiscal Year Ending December 31, Terminal (US$ millions; except per share) 2008 2009E 2010E 2011E 2012E 2013E Year UNLEVERED FREE CASH FLOWS Revenue $13,796 $13,229 $13,661 $14,302 $15,015 $15,776 $16,574 EBITDA 1,775 1,866 1,971 2,071 2,172 2,280 Less: Depreciation and Amortization (629) (640) (660) (689) (722) (760) EBIT $1,146 $1,226 $1,311 $1,382 $1,450 $1,520 Less: Taxes (344) (368) (393) (415) (435) (456) After-Tax EBIT $802 $858 $918 $967 $1,015 $1,064 Plus: Depreciation and Amortization 629 640 660 689 722 Less: Total Capex (561) (666) (738) (818) (862) Less: Increase in Working Capital 10 (21) (63) (55) (58) Unlevered Free Cash Flows $880 $811 $776 $783 $817 DISCOUNTED FREE CASH FLOWS Unlevered Free Cash Flows $440 $811 $776 $783 $817 Terminal Value (Assuming a 6.5x Exit Multiple) $14,819 Total Free Cash Flows $440 $811 $776 $783 $817 $14,819 Weighted Average Cost of Capital (WACC) 7.5% 7.5% 7.5% 7.5% 7.5% 7.5% Discount Period 0.3 1.0 2.0 3.0 4.0 4.5 Discount Factor 0.98 0.93 0.87 0.80 0.75 0.72 Discounted Free Cash Flows $432 $755 $672 $631 $612 $10,702 Confidential 38 Perella Weinberg Partners

PBG DCF ANALYSIS UPSIDE CASE Projected Fiscal Year Ending December 31, Terminal (US$ millions; except per share) 2008 2009E 2010E 2011E 2012E 2013E Year UNLEVERED FREE CASH FLOWS Revenue $13,796 $13,422 $14,058 $14,921 $15,874 $16,895 $17,974 EBITDA 1,790 1,923 2,093 2,263 2,441 2,634 Less: Depreciation and Amortization (630) (644) (666) (688) (713) (743) EBIT $1,160 $1,279 $1,428 $1,575 $1,728 $1,891 Less: Taxes (348) (384) (428) (473) (518) (567) After-Tax EBIT $812 $895 $999 $1,103 $1,210 $1,324 Plus: Depreciation and Amortization 630 644 666 688 713 Less: Total Capex (568) (683) (746) (796) (837) Less: Increase in Working Capital 10 (21) (63) (55) (58) Unlevered Free Cash Flows $883 $835 $856 $940 $1,027 DISCOUNTED FREE CASH FLOWS Unlevered Free Cash Flows $442 $835 $856 $940 $1,027 Terminal Value (Assuming a 6.5x Exit Multiple) $17,121 Total Free Cash Flows $442 $835 $856 $940 $1,027 $17,121 Weighted Average Cost of Capital (WACC) 7.5% 7.5% 7.5% 7.5% 7.5% 7.5% Discount Period 0.3 1.0 2.0 3.0 4.0 4.5 Discount Factor 0.98 0.93 0.87 0.80 0.75 0.72 Discounted Free Cash Flows $434 $777 $740 $756 $769 $12,365 Confidential 39 Perella Weinberg Partners
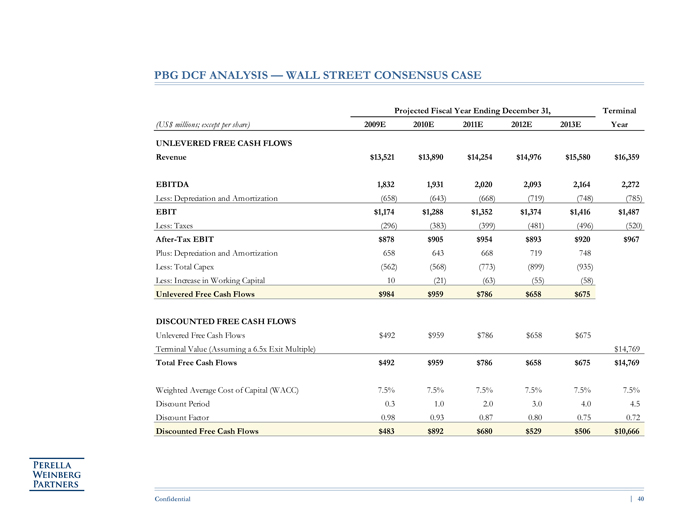
PBG DCF ANALYSIS WALL STREET CONSENSUS CASE Projected Fiscal Year Ending December 31, Terminal (US$ millions; except per share) 2008 2009E 2010E 2011E 2012E 2013E Year UNLEVERED FREE CASH FLOWS Revenue $13,796 $13,521 $13,890 $14,254 $14,976 $15,580 $16,359 EBITDA 1,832 1,931 2,020 2,093 2,164 2,272 Less: Depreciation and Amortization (658) (643) (668) (719) (748) (785) EBIT $1,174 $1,288 $1,352 $1,374 $1,416 $1,487 Less: Taxes (296) (383) (399) (481) (496) (520) After-Tax EBIT $878 $905 $954 $893 $920 $967 Plus: Depreciation and Amortization 658 643 668 719 748 Less: Total Capex (562) (568) (773) (899) (935) Less: Increase in Working Capital 10 (21) (63) (55) (58) Unlevered Free Cash Flows $984 $959 $786 $658 $675 DISCOUNTED FREE CASH FLOWS Unlevered Free Cash Flows $492 $959 $786 $658 $675 Terminal Value (Assuming a 6.5x Exit Multiple) $14,769 Total Free Cash Flows $492 $959 $786 $658 $675 $14,769 Weighted Average Cost of Capital (WACC) 7.5% 7.5% 7.5% 7.5% 7.5% 7.5% Discount Period 0.3 1.0 2.0 3.0 4.0 4.5 Discount Factor 0.98 0.93 0.87 0.80 0.75 0.72 Discounted Free Cash Flows $483 $892 $680 $529 $506 $10,666 Confidential 40 Perella Weinberg Partners
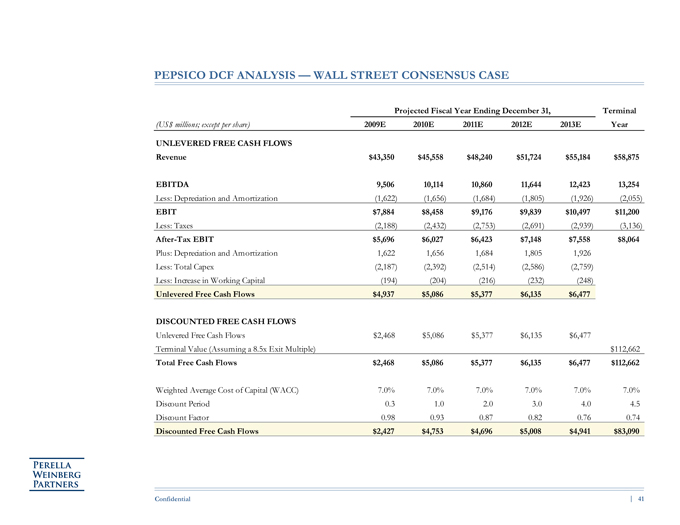
PEPSICO DCF ANALYSIS WALL STREET CONSENSUS CASE Projected Fiscal Year Ending December 31, Terminal (US$ millions; except per share) 2008 2009E 2010E 2011E 2012E 2013E Year UNLEVERED FREE CASH FLOWS Revenue $43,251 $43,350 $45,558 $48,240 $51,724 $55,184 $58,875 EBITDA 9,506 10,114 10,860 11,644 12,423 13,254 Less: Depreciation and Amortization (1,622) (1,656) (1,684) (1,805) (1,926) (2,055) EBIT $7,884 $8,458 $9,176 $9,839 $10,497 $11,200 Less: Taxes (2,188) (2,432) (2,753) (2,691) (2,939) (3,136) After-Tax EBIT $5,696 $6,027 $6,423 $7,148 $7,558 $8,064 Plus: Depreciation and Amortization 1,622 1,656 1,684 1,805 1,926 Less: Total Capex (2,187) (2,392) (2,514) (2,586) (2,759) Less: Increase in Working Capital (194) (204) (216) (232) (248) Unlevered Free Cash Flows $4,937 $5,086 $5,377 $6,135 $6,477 DISCOUNTED FREE CASH FLOWS Unlevered Free Cash Flows $2,468 $5,086 $5,377 $6,135 $6,477 Terminal Value (Assuming a 8.5x Exit Multiple) $112,662 Total Free Cash Flows $2,468 $5,086 $5,377 $6,135 $6,477 $112,662 Weighted Average Cost of Capital (WACC) 7.0% 7.0% 7.0% 7.0% 7.0% 7.0% Discount Period 0.3 1.0 2.0 3.0 4.0 4.5 Discount Factor 0.98 0.93 0.87 0.82 0.76 0.74 Discounted Free Cash Flows $2,427 $4,753 $4,696 $5,008 $4,941 $83,090 Confidential 41 Perella Weinberg Partners
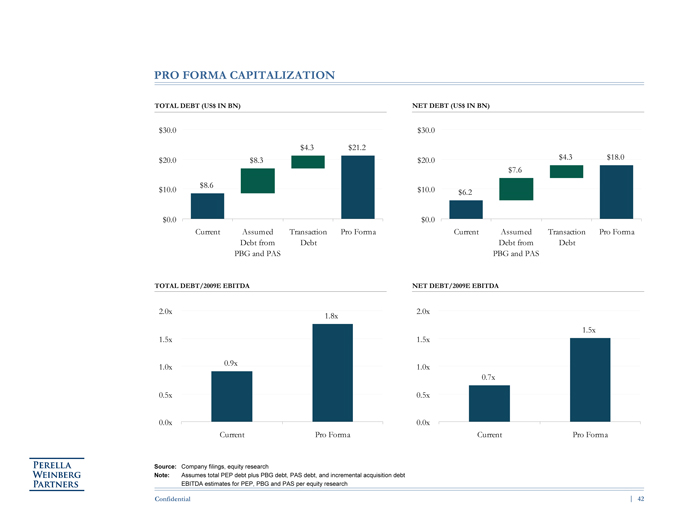
PRO FORMA CAPITALIZATION TOTAL DEBT (US$ IN BN) NET DEBT (US$ IN BN) $30.0 $30.0 $4.3 $21.2 $20.0 $8.3 $20.0 $4.3 $18.0 $7.6 $8.6 $10.0 $10.0 $6.2 $0.0 $0.0 Current Assumed Transaction Pro Forma Current Assumed Transaction Pro Forma Debt from Debt Debt from Debt PBG and PAS PBG and PAS TOTAL DEBT/2009E EBITDA NET DEBT/2009E EBITDA 2.0x 2.0x 1.8x 1.5x 1.5x 1.5x 0.9x 1.0x 1.0x 0.7x 0.5x 0.5x 0.0x 0.0x Current Pro Forma Current Pro Forma Source: Company filings, equity research Note: Assumes total PEP debt plus PBG debt, PAS debt, and incremental acquisition debt EBITDA estimates for PEP, PBG and PAS per equity research Confidential 42 Perella Weinberg Partners
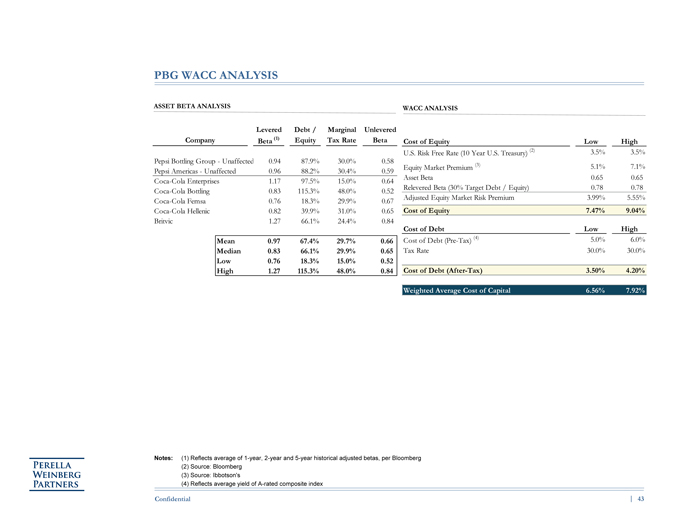
PBG WACC ANALYSIS ASSET BETA ANALYSIS WACC ANALYSIS Levered Debt / Marginal Unlevered Company Beta (1) Equity Tax Rate Beta Cost of Equity Low High U.S. Risk Free Rate (10 Year U.S. Treasury) (2) 3.5% 3.5% Pepsi Bottling GroupUnaffected 0.94 87.9% 30.0% 0.58 Equity Market Premium (3) 5.1% 7.1% Pepsi AmericasUnaffected 0.96 88.2% 30.4% 0.59 Asset Beta 0.65 0.65 Coca-Cola Enterprises 1.17 97.5% 15.0% 0.64 Relevered Beta (30% Target Debt / Equity) 0.78 0.78 Coca-Cola Bottling 0.83 115.3% 48.0% 0.52 Adjusted Equity Market Risk Premium 3.99% 5.55% Coca-Cola Femsa 0.76 18.3% 29.9% 0.67 Coca-Cola Hellenic 0.82 39.9% 31.0% 0.65 Cost of Equity 7.47% 9.04% Britvic 1.27 66.1% 24.4% 0.84 Cost of Debt Low High Mean 0.97 67.4% 29.7% 0.66 Cost of Debt (Pre-Tax) (4) 5.0% 6.0% Median 0.83 66.1% 29.9% 0.65 Tax Rate 30.0% 30.0% Low 0.76 18.3% 15.0% 0.52 High 1.27 115.3% 48.0% 0.84 Cost of Debt (After-Tax) 3.50% 4.20% Weighted Average Cost of Capital 6.56% 7.92% Notes: (1) Reflects average of 1-year, 2-year and 5-year historical adjusted betas, per Bloomberg (2) Source: Bloomberg (3) Source: Ibbotsons (4) Reflects average yield of A-rated composite index Confidential 43 Perella Weinberg Partners
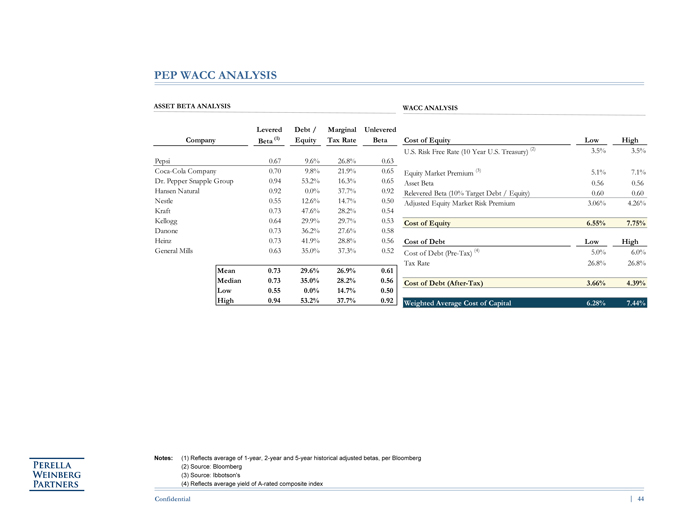
PEP WACC ANALYSIS ASSET BETA ANALYSIS WACC ANALYSIS Levered Debt / Marginal Unlevered Company Beta (1) Equity Tax Rate Beta Cost of Equity Low High U.S. Risk Free Rate (10 Year U.S. Treasury) (2) 3.5% 3.5% Pepsi 0.67 9.6% 26.8% 0.63 Coca-Cola Company 0.70 9.8% 21.9% 0.65 Equity Market Premium (3) 5.1% 7.1% Dr. Pepper Snapple Group 0.94 53.2% 16.3% 0.65 Asset Beta 0.56 0.56 Hansen Natural 0.92 0.0% 37.7% 0.92 Relevered Beta (10% Target Debt / Equity) 0.60 0.60 Nestle 0.55 12.6% 14.7% 0.50 Adjusted Equity Market Risk Premium 3.06% 4.26% Kraft 0.73 47.6% 28.2% 0.54 Kellogg 0.64 29.9% 29.7% 0.53 Cost of Equity 6.55% 7.75% Danone 0.73 36.2% 27.6% 0.58 Heinz 0.73 41.9% 28.8% 0.56 Cost of Debt Low High General Mills 0.63 35.0% 37.3% 0.52 Cost of Debt (Pre-Tax) (4) 5.0% 6.0% Tax Rate 26.8% 26.8% Mean 0.73 29.6% 26.9% 0.61 Median 0.73 35.0% 28.2% 0.56 Cost of Debt (After-Tax) 3.66% 4.39% Low 0.55 0.0% 14.7% 0.50 High 0.94 53.2% 37.7% 0.92 Weighted Average Cost of Capital 6.28% 7.44% Notes: (1) Reflects average of 1-year, 2-year and 5-year historical adjusted betas, per Bloomberg (2) Source: Bloomberg (3) Source: Ibbotsons (4) Reflects average yield of A-rated composite index Confidential 44