UNITED STATES
SECURITIES AND EXCHANGE COMMISSION
Washington, D.C. 20549
FORM N-CSR
CERTIFIED SHAREHOLDER REPORT OF REGISTERED MANAGEMENT
INVESTMENT COMPANIES
Investment Company Act file number: 811-04375
Name of Fund: BlackRock Multi-State Municipal Series Trust
BlackRock New Jersey Municipal Bond Fund
BlackRock Pennsylvania Municipal Bond Fund
Fund Address: 100 Bellevue Parkway, Wilmington, DE 19809
Name and address of agent for service: John M. Perlowski, Chief Executive Officer, BlackRock Multi-State Municipal Series Trust, 55 East 52nd Street, New York, NY 10055
Registrant’s telephone number, including area code: (800) 441-7762
Date of fiscal year end: 05/31/2019
Date of reporting period: 05/31/2019
Item 1 – Report to Stockholders
MAY 31, 2019
| ANNUAL REPORT |

|
BlackRock California Municipal Series Trust
| Ø | BlackRock California Municipal Opportunities Fund |
BlackRock Multi-State Municipal Series Trust
| Ø | BlackRock New Jersey Municipal Bond Fund |
| Ø | BlackRock Pennsylvania Municipal Bond Fund |
BlackRock Municipal Series Trust
| Ø | BlackRock Strategic Municipal Opportunities Fund |
Beginning on January 1, 2021, as permitted by regulations adopted by the Securities and Exchange Commission, paper copies of each Fund’s shareholder reports will no longer be sent by mail, unless you specifically request paper copies of the reports from BlackRock or from your financial intermediary, such as a broker-dealer or bank. Instead, the reports will be made available on a website, and you will be notified by mail each time a report is posted and provided with a website link to access the report.
You may elect to receive all future reports in paper free of charge. If you hold accounts directly with BlackRock, you can call 1-800-441-7762 to inform BlackRock that you wish to continue receiving paper copies of your shareholder reports. If you hold accounts through a financial intermediary, you can follow the instructions included with this disclosure, if applicable, or contact your financial intermediary to request that you continue to receive paper copies of your shareholder reports. Please note that not all financial intermediaries may offer this service. Your election to receive reports in paper will apply to all funds advised by BlackRock Advisors, LLC, BlackRock Fund Advisors or their affiliates, or all funds held with your financial intermediary, as applicable.
If you already elected to receive shareholder reports electronically, you will not be affected by this change and you need not take any action. You may elect to receive electronic delivery of shareholder reports and other communications by: (i) accessing the BlackRock website at www.blackrock.com/edelivery and logging into your accounts, if you hold accounts directly with BlackRock, or (ii) contacting your financial intermediary, if you hold accounts through a financial intermediary. Please note that not all financial intermediaries may offer this service.
| Not FDIC Insured • May Lose Value • No Bank Guarantee |


| 2 | THIS PAGE IS NOT PART OF YOUR FUND REPORT |
| Page | ||||
| 2 | ||||
| Annual Report: |
||||
| 4 | ||||
| 12 | ||||
| 14 | ||||
| 15 | ||||
| 17 | ||||
| 17 | ||||
| Financial Statements: |
||||
| 18 | ||||
| 59 | ||||
| 61 | ||||
| 62 | ||||
| 64 | ||||
| 65 | ||||
| 90 | ||||
| 105 | ||||
| 105 | ||||
| 106 | ||||
| 109 | ||||
| 110 | ||||

| 3 |
| Fund Summary as of May 31, 2019 | BlackRock California Municipal Opportunities Fund |
Investment Objective
BlackRock California Municipal Opportunities Fund’s (the “Fund”) investment objective is to provide shareholders with income exempt from Federal and California income taxes.
Portfolio Management Commentary
How did the Fund perform?
For the 12-month period ended May 31, 2019, the Fund underperformed its primary benchmark, the S&P® Municipal Bond Index, and its secondary benchmark, the S&P® California Municipal Bond Index. The following discussion of relative performance pertains to the S&P® California Municipal Bond Index.
What factors influenced performance?
Municipal bonds produced a healthy gain in the 12-month period, largely as a result of the sharp decline in U.S. Treasury yields from November onward. Government bonds were boosted by the combination of slowing economic growth and the Fed’s pivot toward a more accommodative monetary policy. Tax-exempt issues gained a further boost from the continued improvement in municipal finances and a favorable supply-and-demand trends in the market. California municipal debt slightly lagged the national index, primarily due to elevated new issuance and a reversion from the state’s outperformance in 2017 and the first half of 2018.
The Fund’s use of U.S. Treasury futures to manage interest rate risk was the largest detractor to Fund performance, as it prevented the Fund from gaining the full benefit of falling rates.
On the positive side, the Fund benefited from its positions in longer-maturity securities, which outperformed shorter-dated issues. Overweight allocations to the transportation and utilities sectors added value, as did security selection in the tobacco sector. The use of leverage also contributed to results in the rising market.
Describe recent portfolio activity.
The Fund aims to deliver a balance of competitive total return and tax-free income using a tactical strategy that is designed to take advantage of credit, yield curve and interest rate trends.
The investment adviser put cash to work in late 2018 and 2019 to take advantage of elevated yields. Cash reserves, which started the period near 5% of net assets, fell below 1% by early 2019 as a result. Later in the period, the Fund sought to capitalize on robust market performance by selling select holdings to lock in profits.
The Fund continued to seek opportunities to manage interest rate risk by actively adjusting its positioning in U.S. Treasury futures. Once rates began to decline in the second half of the period, the investment adviser reduced the size of the position.
The Fund used market volatility to add to the portfolio’s weighting in bonds rated below investment grade. The Fund had a 9% allocation to the category as of May 31, 2019, with the majority held in the tobacco sector and Puerto Rico. The portfolio’s allocation to taxable bonds, which stood at 5.2% of assets at the close of the period, remained relatively steady.
Describe portfolio positioning at period end.
The Fund closed the period with an elevated cash weighting of 8%. The investment adviser made an active decision to reduce duration (interest-rate sensitivity) by selling some positions in longer-term bonds that had performed well in the rally. In addition, the combination of low absolute yields and tight yield spreads indicated that valuations had become less compelling. The investment adviser therefore kept some cash on hand in the event that less favorable market conditions created more attractive values. Strong inflows into the Fund also played a role in the larger cash position. The investment adviser chose to take a cautious approach and await better opportunities to deploy these assets rather than buying securities at rich valuations. The Fund’s higher cash position had no material impact on Fund performance.
The Fund was positioned defensively at the close of the period. In addition to maintaining the above-average cash weighting and using interest-rate risk-management strategies, the Fund held a duration below that of the benchmark. The Fund’s portfolio duration stood at 4.8 years on May 31, 2019 when risk-management strategies were included. The Fund also maintained an above-average credit quality of AA, as elevated valuations for lower-quality securities indicated a higher degree of potential risk.
The views expressed reflect the opinions of BlackRock as of the date of this report and are subject to change based on changes in market, economic or other conditions. These views are not intended to be a forecast of future events and are no guarantee of future results.
| 4 | 2019 BLACKROCK ANNUAL REPORT TO SHAREHOLDERS |
| Fund Summary as of May 31, 2019 (continued) | BlackRock California Municipal Opportunities Fund |
TOTAL RETURN BASED ON A $10,000 INVESTMENT

| (a) | Assuming maximum sales charges, if any, transaction costs and other operating expenses, including advisory fees. Institutional Shares do not have a sales charge. See “About Fund Performance” on page 14 for more information about the performance of Investor A Shares. |
| (b) | Under normal circumstances, the Fund will invest at least 80% of its assets in California municipal bonds. The Fund’s total returns prior to January 26, 2015 are the returns of the Fund when it followed different investment strategies under the name BlackRock California Municipal Bond Fund. |
| (c) | The S&P® Municipal Bond Index is composed of bonds held by managed municipal bond fund customers of Standard & Poor’s Securities Pricing, Inc. that are priced daily. Bonds in the S&P® Municipal Bond Index must have an outstanding par value of at least $2 million and a remaining maturity of not less than one month. |
| (d) | The S&P® California Municipal Bond Index includes all California bonds in the S&P® Municipal Bond Index. |
Performance Summary for the Period Ended May 31, 2019
| Average Annual Total Returns (a)(b) | ||||||||||||||||||||||||||||||||||||||||||||||||
| 1 Year | 5 Years | 10 Years | ||||||||||||||||||||||||||||||||||||||||||||||
| Standardized 30-Day Yields |
Unsubsidized 30-Day Yields |
6-Month Total Returns |
w/o sales charge |
w/sales charge |
w/o sales charge |
w/sales charge |
w/o sales charge |
w/sales charge |
||||||||||||||||||||||||||||||||||||||||
| Institutional |
2.03 | % | 2.01 | % | 4.08 | % | 4.28 | % | N/A | 4.30 | % | N/A | 5.54 | % | N/A | |||||||||||||||||||||||||||||||||
| Investor A |
1.71 | 1.68 | 3.95 | 4.02 | (0.40 | )% | 4.05 | 3.15 | % | 5.30 | 4.85 | % | ||||||||||||||||||||||||||||||||||||
| Investor A1 |
1.86 | 1.84 | 4.04 | 4.18 | N/A | 4.18 | N/A | 5.46 | N/A | |||||||||||||||||||||||||||||||||||||||
| Investor C |
1.03 | 1.01 | 3.57 | 3.24 | 2.25 | 3.25 | 3.25 | 4.52 | 4.52 | |||||||||||||||||||||||||||||||||||||||
| Investor C1 |
1.47 | 1.45 | 3.79 | 3.68 | N/A | 3.66 | N/A | 4.93 | N/A | |||||||||||||||||||||||||||||||||||||||
| Class K |
2.08 | 2.06 | 4.03 | 4.33 | N/A | 4.31 | N/A | 5.55 | N/A | |||||||||||||||||||||||||||||||||||||||
| S&P® Municipal Bond Index |
— | — | 5.68 | 6.06 | N/A | 3.55 | N/A | 4.72 | N/A | |||||||||||||||||||||||||||||||||||||||
| S&P® California Municipal Bond Index |
— | — | 5.74 | 5.79 | N/A | 3.80 | N/A | 5.27 | N/A | |||||||||||||||||||||||||||||||||||||||
| (a) | Assuming maximum sales charges, if any. Average annual total returns with and without sales charges reflect reductions for distribution and service fees. See “About Fund Performance” on page 14 for a detailed description of share classes, including any related sales charges and fees, and how performance was calculated for certain share classes. |
| (b) | Under normal circumstances, the Fund will invest at least 80% of its assets in California municipal bonds. The Fund’s total returns prior to January 26, 2015 are the returns of the Fund when it followed different investment strategies under the name BlackRock California Municipal Bond Fund. |
N/A — Not applicable as share class and index do not have a sales charge.
Past performance is not indicative of future results.
Performance results may include adjustments made for financial reporting purposes in accordance with U.S. generally accepted accounting principles.
| FUND SUMMARY | 5 |
| Fund Summary as of May 31, 2019 | BlackRock New Jersey Municipal Bond Fund |
Investment Objective
BlackRock New Jersey Municipal Bond Fund’s (the “Fund”) investment objective is to provide shareholders with income exempt from Federal income tax and New Jersey personal income taxes.
Portfolio Management Commentary
How did the Fund perform?
For the 12-month period ended May 31, 2019, the Fund underperformed its primary benchmark, the S&P® Municipal Bond Index, except for the Fund’s Institutional Shares, which performed in line with the primary benchmark, and Class K Shares, which outperformed. For the same period, the Fund underperformed its secondary benchmark, the Custom New Jersey Index. The following discussion of relative performance pertains to the Custom New Jersey Index.
What factors influenced performance?
Municipal bonds produced a healthy gain in the 12-month period, largely as a result of the sharp decline in U.S. Treasury yields from November onward. Government bonds were boosted by the combination of slowing economic growth and the Fed’s pivot toward a more accommodative monetary policy. Tax-exempt issues gained further support from the continued improvement in municipal finances and favorable supply-and-demand trends in the market.
New Jersey municipal bonds benefited from positive fundamental revenue surprises and thriving investor demand, which pushed yield spreads tighter and helped the state outperform the broader, national index. Investors’ appetite for income led to outperformance for both longer-dated and lower-quality issues. Supply-and-demand factors in the state were also supportive in the year-to-date period ended May 31, 2019, as net negative supply in New Jersey exceeded $10 billion.
The Fund sought to manage interest rate risk using U.S. Treasury futures. Since Treasury yields fell, as prices rose, this aspect of the Fund’s positioning detracted from returns. Underweight positions in the state tax-backed and transportation sectors, both of which outperformed the broader market, hurt relative Fund performance. The Fund’s allocation to higher-rated securities, which underperformed lower-quality bonds, also detracted from returns. Reinvestment had an adverse effect on the Fund’s income, as the proceeds of higher-yielding bonds that matured or were called needed to be reinvested at lower prevailing rates.
The Fund benefited from its overweight position in the long end of the yield curve (bonds with maturities of 20 years and above). At the sector level, overweights in health care and education issues helped performance. A modest amount of portfolio leverage augmented returns and provided additional income.
Describe recent portfolio activity.
Portfolio activity centered on reinvesting the proceeds from income, as well as from bonds that matured or were called. The Fund’s purchases were focused on longer-term securities in revenue sectors, together with a few select local general obligation issues that augmented diversification. The Fund’s investment adviser took the opportunity to diversify into Puerto Rico bonds at attractive yields, which helped total returns for the period.
Describe portfolio positioning at period end.
The Fund continued to favor higher-yielding, lower-rated investment-grade issues in revenue sectors such as health care and higher education. Conversely, it had a less favorable view on state general obligation debt. Despite the recent positive revenue surprises, New Jersey’s credit rating and yield spreads continued to reflect the state’s high unfunded pension liabilities. The Fund closed the period with a modestly long duration (above-average interest-rate sensitivity) and an emphasis on longer-term bonds, particularly those with maturities of 20 years and above.
The views expressed reflect the opinions of BlackRock as of the date of this report and are subject to change based on changes in market, economic or other conditions. These views are not intended to be a forecast of future events and are no guarantee of future results.
| 6 | 2019 BLACKROCK ANNUAL REPORT TO SHAREHOLDERS |
| Fund Summary as of May 31, 2019 (continued) | BlackRock New Jersey Municipal Bond Fund |
TOTAL RETURN BASED ON A $10,000 INVESTMENT

| (a) | Assuming maximum sales charges, if any, transaction costs and other operating expenses, including advisory fees. Institutional Shares do not have a sales charge. See “About Fund Performance” on page 14 for more information about the performance of Investor A Shares. |
| (b) | The Fund invests primarily in a portfolio of long-term investment grade New Jersey municipal bonds. |
| (c) | The S&P® Municipal Bond Index is composed of bonds held by managed municipal bond fund customers of Standard & Poor’s Securities Pricing, Inc. that are priced daily. Bonds in the S&P® Municipal Bond Index must have an outstanding par value of at least $2 million and a remaining maturity of not less than one month. |
| (d) | The Custom New Jersey Index is a customized benchmark that reflects the returns of the S&P® New Jersey Municipal Bond Index for periods prior to January 1, 2013, and the returns of only those New Jersey bonds in the S&P® New Jersey Municipal Bond Index that have maturities greater than 5 years for periods subsequent to January 1, 2013. |
Performance Summary for the Period Ended May 31, 2019
| Average Annual Total Returns (a) | ||||||||||||||||||||||||||||||||||||||||||||||||
| 1 Year | 5 Years | 10 Years | ||||||||||||||||||||||||||||||||||||||||||||||
| Standardized 30-Day Yields |
Unsubsidized 30-Day Yields |
6-Month Total Returns |
w/o sales charge |
w/sales charge |
w/o sales charge |
w/sales charge |
w/o sales charge |
w/sales charge |
||||||||||||||||||||||||||||||||||||||||
| Institutional |
2.29 | % | 2.15 | % | 5.94 | % | 6.05 | % | N/A | 4.04 | % | N/A | 5.44 | % | N/A | |||||||||||||||||||||||||||||||||
| Service |
2.04 | 1.92 | 5.81 | 5.79 | N/A | 3.85 | N/A | 5.26 | N/A | |||||||||||||||||||||||||||||||||||||||
| Investor A |
1.96 | 1.87 | 5.81 | 5.79 | 1.29 | % | 3.85 | 2.96 | % | 5.26 | 4.81 | % | ||||||||||||||||||||||||||||||||||||
| Investor A1 |
2.11 | 2.03 | 5.79 | 5.95 | N/A | 4.00 | N/A | 5.41 | N/A | |||||||||||||||||||||||||||||||||||||||
| Investor C |
1.31 | 1.22 | 5.42 | 5.00 | 4.00 | 3.09 | 3.09 | 4.47 | 4.47 | |||||||||||||||||||||||||||||||||||||||
| Investor C1 |
1.76 | 1.67 | 5.65 | 5.45 | N/A | 3.48 | N/A | 4.89 | N/A | |||||||||||||||||||||||||||||||||||||||
| Class K |
2.34 | 2.23 | 5.97 | 6.20 | N/A | 4.06 | N/A | 5.44 | N/A | |||||||||||||||||||||||||||||||||||||||
| S&P® Municipal Bond Index |
— | — | 5.68 | 6.06 | N/A | 3.55 | N/A | 4.72 | N/A | |||||||||||||||||||||||||||||||||||||||
| Custom New Jersey Index |
— | — | 7.97 | 8.71 | N/A | 5.01 | N/A | 5.59 | N/A | |||||||||||||||||||||||||||||||||||||||
| (a) | Assuming maximum sales charges, if any. Average annual total returns with and without sales charges reflect reductions for distribution and service fees. See “About Fund Performance” on page 14 for a detailed description of share classes, including any related sales charges and fees, and how performance was calculated for certain share classes. |
N/A — Not applicable as share class and index do not have a sales charge.
Past performance is not indicative of future results.
Performance results may include adjustments made for financial reporting purposes in accordance with U.S. generally accepted accounting principles.
| FUND SUMMARY | 7 |
| Fund Summary as of May 31, 2019 | BlackRock Pennsylvania Municipal Bond Fund |
Investment Objective
BlackRock Pennsylvania Municipal Bond Fund’s (the “Fund”) investment objective is to provide shareholders with income exempt from Federal income tax and Pennsylvania personal income taxes.
Portfolio Management Commentary
How did the Fund perform?
For the 12-month period ended May 31, 2019, the Fund underperformed both its primary benchmark, the S&P® Municipal Bond Index, and its secondary benchmark, the Custom Pennsylvania Index. The following discussion of relative performance pertains to the Custom Pennsylvania Index.
What factors influenced performance?
Municipal bonds produced a healthy gain in the 12-month period, largely as a result of the sharp decline in U.S. Treasury yields from November onward. Government bonds were boosted by the combination of slowing economic growth and the Fed’s pivot toward a more accommodative monetary policy. Tax-exempt issues gained further support from the continued improvement in municipal finances and favorable supply-and-demand trends in the market.
Pennsylvania municipal bonds benefited from a positive fundamental backdrop with growing tax collections. Demand for higher-yielding investment-grade debt led to tightening yield spreads on the state’s general obligation bonds and helped the state outperform the broader, national index.
The Fund sought to manage interest rate risk using U.S. Treasury futures. Since Treasury yields fell, as prices rose, this aspect of the Fund’s positioning detracted from Fund returns. The Fund’s allocation to higher-rated securities, which underperformed lower-quality bonds, also detracted. Reinvestment had an adverse effect on the Fund’s income, as the proceeds of higher-yielding bonds that matured or were called needed to be reinvested at lower prevailing rates.
The Fund benefited from overweight positions in the health and education sectors. However, an underweight position in the state tax-backed sector, which outperformed the broader market, hurt relative performance. A sizable overweight in pre-refunded bonds, while generating positive absolute returns, lagged other sectors due to its low duration characteristics. (Duration is a measure of interest-rate sensitivity.) The Fund’s preference for these bonds reflects their higher yields and low risk profile.
The Fund was helped by its overweight in the long end of the yield curve (bonds with maturities of 20 years and above). A modest amount of portfolio leverage augmented returns and provided additional income.
Describe recent portfolio activity.
The Fund’s investment adviser took the opportunity to diversify into Puerto Rico bonds at attractive yields, which helped total returns. This move also contributed to an increase in the Fund’s duration, as well as a decline in its average credit quality. New-issue bonds provided the Fund with opportunities to capitalize on the contrast between the dearth of supply and the record pace of mutual fund inflows in the year-to-date period ended May 31, 2019.
The Fund remained fully invested, leaving its barbell strategy intact and using pre-refunded bonds as a source of income and to fund new purchases. (A barbell structure is an overweight in long- and short-term bonds, with a corresponding underweight in intermediate-term issues.)
Describe portfolio positioning at period end.
The Fund continued to favor higher-yielding, lower-rated investment-grade issues in revenue sectors such as health care and higher education. Conversely, it had a less favorable view toward state general obligation debt. The Fund closed the period with an above-benchmark duration and a barbell curve structure with concentrations in bonds maturing in zero to two years as well as 20 years and above.
The views expressed reflect the opinions of BlackRock as of the date of this report and are subject to change based on changes in market, economic or other conditions. These views are not intended to be a forecast of future events and are no guarantee of future results.
| 8 | 2019 BLACKROCK ANNUAL REPORT TO SHAREHOLDERS |
| Fund Summary as of May 31, 2019 (continued) | BlackRock Pennsylvania Municipal Bond Fund |
TOTAL RETURN BASED ON A $10,000 INVESTMENT
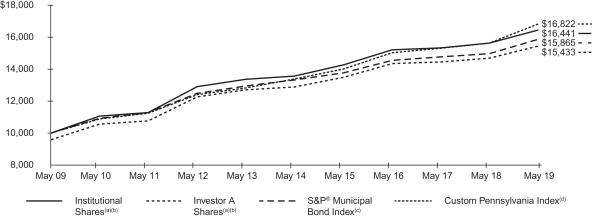
| (a) | Assuming maximum sales charges, if any, transaction costs and other operating expenses, including advisory fees. Institutional Shares do not have a sales charge. See “About Fund Performance” on page 14 for more information about the performance of Investor A Shares. |
| (b) | The Fund invests primarily in a portfolio of long-term investment grade Pennsylvania municipal bonds. |
| (c) | The S&P® Municipal Bond Index is composed of bonds held by managed municipal bond fund customers of Standard & Poor’s Securities Pricing, Inc. that are priced daily. Bonds in the S&P® Municipal Bond Index must have an outstanding par value of at least $2 million and a remaining maturity of not less than one month. |
| (d) | The Custom Pennsylvania Index is customized benchmark that reflects the returns of the S&P® Pennsylvania Municipal Bond Index for periods prior to January 1, 2013, and the returns of only those Pennsylvania bonds in the S&P® Pennsylvania Municipal Bond Index that have maturities greater than 5 years for periods subsequent to January 1, 2013. |
Performance Summary for the Period Ended May 31, 2019
| Average Annual Total Returns (a) | ||||||||||||||||||||||||||||||||||||||||||||||||
| 1 Year | 5 Years | 10 Years | ||||||||||||||||||||||||||||||||||||||||||||||
| Standardized 30-Day Yields |
Unsubsidized 30-Day Yields |
6-Month Total Returns |
w/o sales charge |
w/sales charge |
w/o sales charge |
w/sales charge |
w/o sales charge |
w/sales charge |
||||||||||||||||||||||||||||||||||||||||
| Institutional |
2.33 | % | 2.18 | % | 5.45 | % | 5.22 | % | N/A | 3.91 | % | N/A | 5.10 | % | N/A | |||||||||||||||||||||||||||||||||
| Service |
2.08 | 1.94 | 5.41 | 5.05 | N/A | 3.70 | N/A | 4.91 | N/A | |||||||||||||||||||||||||||||||||||||||
| Investor A |
2.00 | 1.94 | 5.41 | 5.05 | 0.59 | % | 3.68 | 2.79 | % | 4.89 | 4.44 | % | ||||||||||||||||||||||||||||||||||||
| Investor A1 |
2.14 | 2.07 | 5.39 | 5.11 | N/A | 3.85 | N/A | 5.05 | N/A | |||||||||||||||||||||||||||||||||||||||
| Investor C |
1.34 | 1.28 | 4.92 | 4.18 | 3.18 | 2.90 | 2.90 | 4.07 | 4.07 | |||||||||||||||||||||||||||||||||||||||
| Investor C1 |
1.61 | 1.39 | 5.14 | 4.62 | N/A | 3.32 | N/A | 4.51 | N/A | |||||||||||||||||||||||||||||||||||||||
| Class K |
2.41 | 2.33 | 5.47 | 5.28 | N/A | 3.92 | N/A | 5.10 | N/A | |||||||||||||||||||||||||||||||||||||||
| S&P® Municipal Bond Index |
— | — | 5.68 | 6.06 | N/A | 3.55 | N/A | 4.72 | N/A | |||||||||||||||||||||||||||||||||||||||
| Custom Pennsylvania Index |
— | — | 7.49 | 7.69 | N/A | 4.67 | N/A | 5.34 | N/A | |||||||||||||||||||||||||||||||||||||||
| (a) | Assuming maximum sales charges, if any. Average annual total returns with and without sales charges reflect reductions for distribution and service fees. See “About Fund Performance” on page 14 for a description of share classes, including any related sales charges and fees, and how performance was calculated for certain share classes. |
N/A — Not applicable as share class and index do not have a sales charge.
Past performance is not indicative of future results.
Performance results may include adjustments made for financial reporting purposes in accordance with U.S. generally accepted accounting principles.
| FUND SUMMARY | 9 |
| Fund Summary as of May 31, 2019 | BlackRock Strategic Municipal Opportunities Fund |
Investment Objective
BlackRock Strategic Municipal Opportunities Fund’s (the “Fund”) investment objective is to provide shareholders with a high level of income exempt from Federal income taxes.
Portfolio Management Commentary
How did the Fund perform?
For the 12-month period ended May 31, 2019, the Fund underperformed its primary benchmark, the S&P® Municipal Bond Index, as well as its custom blended secondary benchmark comprised of 65% S&P® Municipal Bond Investment Grade Index, 30% S&P® Municipal Bond High Yield Index and 5% Bloomberg Barclays Taxable Municipal: U.S. Aggregate Eligible Index. The following discussion of relative performance pertains to the custom blended benchmark.
What factors influenced performance?
Municipal bonds produced a healthy gain in the 12-month period, largely as a result of the sharp decline in U.S. Treasury yields from November onward. Government bonds were boosted by the combination of slowing economic growth and the Fed’s pivot toward a more accommodative monetary policy. Tax-exempt issues gained further support from the continued improvement in municipal finances and favorable supply-and-demand trends in the market.
The Fund’s use of U.S. Treasury futures to manage interest rate risk detracted from performance by preventing the Fund from gaining the full benefit of falling rates. Underweight positions in bonds with 10- to 18-year maturities also detracted, as did an underweight in non-rated issues.
The Fund’s sector allocations helped offset some of the underperformance, with positive contributions coming from overweight positions in transportation, housing and health care. From a credit perspective, overweight positions in A and BBB rated debt outperformed the benchmark. Long-term bonds with maturities of 20 years and above further contributed to the Fund’s performance.
Describe recent portfolio activity.
The Fund opened the period with a duration of 4.65 years and closed at 4.5 years. (Duration is a measure of interest-rate sensitivity.) In comparison, the benchmark’s duration stood at 6.6 years as of May 31, 2019.
At the sector level, the Fund’s investment adviser made the largest increases in housing and state tax-backed issues. The Fund maintained a high-quality bias with its largest allocations to the AA and A rating tiers. About 18% of the Fund’s assets were invested in high yield (below investment-grade) bonds at period end, with the majority held in the tobacco sector and Puerto Rico. In comparison, the Fund had a 19% weighting in this area at the start of the period. The Fund held an allocation of approximately 58% to bonds with maturities of 20 years and above as of May 31, 2019, up from 55% one year ago. The portfolio’s weighting in taxable securities remained at 6%. Toward the end of the period, the Fund’s activity focused on taking gains in strong recent performers.
Describe portfolio positioning at period end.
The Fund was notably overweight in the transportation and housing sectors and underweight in school district, local tax-backed and pre-refunded/escrowed bonds. The Fund’s average credit quality remained at A+.
The views expressed reflect the opinions of BlackRock as of the date of this report and are subject to change based on changes in market, economic or other conditions. These views are not intended to be a forecast of future events and are no guarantee of future results.
| 10 | 2019 BLACKROCK ANNUAL REPORT TO SHAREHOLDERS |
| Fund Summary as of May 31, 2019 (continued) | BlackRock Strategic Municipal Opportunities Fund |
TOTAL RETURN BASED ON A $10,000 INVESTMENT

| (a) | Assuming maximum sales charges, if any, transaction costs and other operating expenses, including advisory fees. Institutional Shares do not have a sales charge. See “About Fund Performance” on page 14 for more information about the performance of Investor A Shares. |
| (b) | Under normal circumstances the Fund invests at least 80% of its assets in municipal bonds. The Fund’s returns prior to January 27, 2014 are the returns of the Fund when it followed different investment strategies under the name BlackRock Intermediate Municipal Fund. |
| (c) | The S&P® Municipal Bond Index is composed of bonds held by managed municipal bond fund customers of Standard & Poor’s Securities Pricing, Inc. that are priced daily. Bonds in the S&P® Municipal Bond Index must have an outstanding par value of at least $2 million and a remaining maturity of not less than one month. |
| (d) | See “About Fund Performance” on page 14 for descriptions of the indexes. |
Performance Summary for the Period Ended May 31, 2019
| Average Annual Total Returns (a)(b) | ||||||||||||||||||||||||||||||||||||||||||||||||
| 1 Year | 5 Years | 10 Years | ||||||||||||||||||||||||||||||||||||||||||||||
| Standardized 30-Day Yields |
Unsubsidized 30-Day Yields |
6-Month Total Returns |
w/o sales charge |
w/sales charge |
w/o sales charge |
w/sales charge |
w/o sales charge |
w/sales charge |
||||||||||||||||||||||||||||||||||||||||
| Institutional |
2.36 | % | 2.31 | % | 4.32 | % | 4.41 | % | N/A | 4.16 | % | N/A | 5.32 | % | N/A | |||||||||||||||||||||||||||||||||
| Investor A |
2.05 | 2.00 | 4.12 | 4.17 | (0.26 | )% | 3.92 | 3.02 | % | 5.08 | 4.63 | % | ||||||||||||||||||||||||||||||||||||
| Investor A1 |
2.27 | 2.22 | 4.29 | 4.33 | N/A | 4.08 | N/A | 5.23 | N/A | |||||||||||||||||||||||||||||||||||||||
| Investor C |
1.39 | 1.33 | 3.82 | 3.39 | 2.39 | 3.14 | 3.14 | 4.29 | 4.29 | |||||||||||||||||||||||||||||||||||||||
| Class K |
2.42 | 2.37 | 4.36 | 4.47 | N/A | 4.18 | N/A | 5.33 | N/A | |||||||||||||||||||||||||||||||||||||||
| S&P® Municipal Bond Index |
— | — | 5.68 | 6.06 | N/A | 3.55 | N/A | 4.72 | N/A | |||||||||||||||||||||||||||||||||||||||
| S&P® Municipal Bond Investment Grade Index |
— | — | 5.61 | 5.97 | N/A | 3.41 | N/A | 4.52 | N/A | |||||||||||||||||||||||||||||||||||||||
| S&P® Municipal Bond High Yield Index |
— | — | 6.83 | 7.62 | N/A | 5.70 | N/A | 8.44 | N/A | |||||||||||||||||||||||||||||||||||||||
| Bloomberg Barclays Taxable Municipal: U.S. Aggregate Eligible Index |
— | — | 12.28 | 10.33 | N/A | 5.92 | N/A | 8.06 | N/A | |||||||||||||||||||||||||||||||||||||||
| 65% S&P® Municipal Bond Investment Grade Index, 30% S&P® Municipal Bond High Yield Index and 5% Bloomberg Barclays Taxable Municipal: U.S. Aggregate Eligible Index |
— | — | 6.31 | 6.68 | N/A | 4.23 | N/A | 5.88 | N/A | |||||||||||||||||||||||||||||||||||||||
| (a) | Assuming maximum sales charges, if any. Average annual total returns with and without sales charges reflect reductions for distribution and service fees. See “About Fund Performance” on page 14 for a description of share classes, including any related sales charges and fees, and how performance was calculated for certain share classes. |
| (b) | Under normal circumstances, the Fund invests at least 80% of its assets in municipal bonds. The Fund’s returns prior to January 27, 2014 are the returns of the Fund when it followed different investment strategies under the name BlackRock Intermediate Municipal Fund. |
N/A — Not applicable as share class and index do not have a sales charge.
Past performance is not indicative of future results.
Performance results may include adjustments made for financial reporting purposes in accordance with U.S. generally accepted accounting principles.
| FUND SUMMARY | 11 |
Portfolio Information as of May 31, 2019
| (a) | For Fund compliance purposes, the Fund’s sector classifications refer to one or more of the sector sub-classifications used by one or more widely recognized market indexes or rating group indexes, and/or as defined by the investment adviser. These definitions may not apply for purposes of this report, which may combine such sector sub-classifications for reporting ease. |
| (b) | Excludes short-term securities. |
| (c) | For financial reporting purposes, credit quality ratings shown above reflect the highest rating assigned by either S&P Global Ratings (“S&P”) or Moody’s Investors Service (“Moody’s”) if ratings differ. These rating agencies are independent, nationally recognized statistical rating organizations and are widely used. Investment grade ratings are credit ratings of BBB/Baa or higher. Below investment grade ratings are credit ratings of BB/Ba or lower. Investments designated N/R are not rated by either rating agency. Unrated investments do not necessarily indicate low credit quality. Credit quality ratings are subject to change. |
| (d) | The investment adviser evaluates the credit quality of unrated investments based upon certain factors including, but not limited to, credit ratings for similar investments and financial analysis of sectors and individual investments. Using this approach, the investment adviser has deemed certain of these unrated securities as investment grade quality. As of May 31, 2019, the market value of unrated securities deemed by the investment adviser to be investment grade represented less than 1% of the Fund’s long-term investments. |
| (e) | Scheduled maturity dates and/or bonds that are subject to potential calls by issuers over the next five years. |
| 12 | 2019 BLACKROCK ANNUAL REPORT TO SHAREHOLDERS |
Portfolio Information as of May 31, 2019 (continued)
| (a) | For Fund compliance purposes, the Fund’s sector classifications refer to one or more of the sector sub-classifications used by one or more widely recognized market indexes or rating group indexes, and/or as defined by the investment adviser. These definitions may not apply for purposes of this report, which may combine such sector sub-classifications for reporting ease. |
| (b) | Excludes short-term securities. |
| (c) | For financial reporting purposes, credit quality ratings shown above reflect the highest rating assigned by either S&P or Moody’s if ratings differ. These rating agencies are independent, nationally recognized statistical rating organizations and are widely used. Investment grade ratings are credit ratings of BBB/Baa or higher. Below investment grade ratings are credit ratings of BB/Ba or lower. Investments designated N/R are not rated by either rating agency. Unrated investments do not necessarily indicate low credit quality. Credit quality ratings are subject to change. |
| (d) | The investment adviser evaluates the credit quality of unrated investments based upon certain factors including, but not limited to, credit ratings for similar investments and financial analysis of sectors and individual investments. Using this approach, the investment adviser has deemed certain of these unrated securities as investment grade quality. As of May 31, 2019, the market value of unrated securities deemed by the investment adviser to be investment grade represented 2% for BlackRock Pennsylvania Municipal Bond Fund and less than 1% for BlackRock Strategic Municipal Opportunities Fund long-term investments. |
| (e) | Represents less than 1% of total investments. |
| (f) | Scheduled maturity dates and/or bonds that are subject to potential calls by issuers over the next five years. |
| PORTFOLIO INFORMATION | 13 |
Institutional Shares are not subject to any sales charge. These shares bear no ongoing distribution or service fees and are available only to certain eligible investors.
Class K Shares are not subject to any sales charge. These shares bear no ongoing distribution or service fees and are available only to certain eligible investors. For each Fund, Class K Shares performance shown prior to the Class K January 25, 2018 inception date is that of Institutional Shares. The performance of the Funds’ Class K Shares would be substantially similar to Institutional Shares because Class K Shares and Institutional Shares invest in the same portfolio of securities and performance would only differ to the extent that Class K Shares and Institutional Shares have different expenses. The actual returns of Class K Shares would have been higher than those of the Institutional Shares because Class K Shares have lower expenses than the Institutional Shares.
Service Shares (available only in BlackRock New Jersey Municipal Bond Fund and BlackRock Pennsylvania Municipal Bond Fund) are not subject to any sales charge. These shares are subject to a service fee of 0.25% per year (but no distribution fee) and are only available to certain eligible investors.
Investor A Shares are subject to a maximum initial sales charge (front-end load) of 4.25% and a service fee of 0.25% per year (but no distribution fee). Certain redemptions of these shares may be subject to a contingent deferred sales charge (“CDSC”) where no initial sales charge was paid at the time of purchase. These shares are generally available through financial intermediaries.
Investor A1 Shares (for all Funds except BlackRock Strategic Municipal Opportunities Fund) are subject to a maximum initial sales charge (front-end load) of 4.00% and a service fee of 0.10% per year (but no distribution fee). Investor A1 Shares for BlackRock Strategic Municipal Opportunities Fund incur a maximum initial sales charge (front-end load) of 1.00% and a service fee of 0.10% per year (but no distribution fee). The maximum initial sales charge does not apply to current eligible shareholders of Investor A1 Shares of the Funds. Certain redemptions of these shares may be subject to a CDSC where no initial sales charge was paid at the time of purchase. However, the CDSC does not apply to redemptions by certain employer-sponsored retirement plans or to redemptions of shares acquired through the reinvestment of dividends and capital gains by existing shareholders and, for BlackRock California Municipal Opportunities Fund only, fee based programs previously approved by the Fund.
Investor C Shares are subject to a 1.00% CDSC if redeemed within one year of purchase. In addition, these shares are subject to a distribution fee of 0.75% per year and a service fee of 0.25% per year. These shares are generally available through financial intermediaries. Effective November 8, 2018, each Fund adopted an automatic conversion feature whereby Investor C Shares held for approximately ten years will be automatically converted into Investor A Shares and, thereafter, investors will be subject to lower ongoing fees.
Investor C1 Shares (available in all Funds except BlackRock Strategic Municipal Opportunities Fund) are subject to a 1.00% CDSC if redeemed within one year of purchase. However, the CDSC does not apply to redemptions by certain employer-sponsored retirement plans or to redemptions of shares acquired through the reinvestment of dividends and capital gains by existing shareholders and, for BlackRock California Municipal Opportunities Fund only, fee based programs previously approved by the Fund. In addition, these shares are subject to a distribution fee of 0.35% per year and a service fee of 0.25% per year. Effective November 8, 2018, each Fund adopted an automatic conversion feature whereby Investor C1 Shares held for approximately ten years will be automatically converted into Investor A Shares and, thereafter, investors will be subject to lower ongoing fees.
Investor A1 and Investor C1 Shares are only available for dividend and capital gain reinvestment by existing shareholders, and for purchase by certain employer-sponsored retirement plans and, for BlackRock California Municipal Opportunities Fund only, fee based programs previously approved by the Fund.
Performance information reflects past performance and does not guarantee future results. Current performance may be lower or higher than the performance data quoted. Refer to www.blackrock.com to obtain performance data current to the most recent month end. Performance results do not reflect the deduction of taxes that a shareholder would pay on fund distributions or the redemption of fund shares. Figures shown in the performance tables on the previous pages assume reinvestment of all distributions, if any, at net asset value (“NAV”) on the ex-dividend date/payable date. Investment return and principal value of shares will fluctuate so that shares, when redeemed, may be worth more or less than their original cost. Distributions paid to each class of shares will vary because of the different levels of service, distribution and transfer agency fees applicable to each class, which are deducted from the income available to be paid to shareholders.
BlackRock Advisors, LLC (the “Manager”), each Fund’s investment adviser, has contractually agreed to waive and/or reimburse a portion of each Fund’s expenses. Without such waiver and/or reimbursement, each Fund’s performance would have been lower. The Manager is under no obligation to continue waiving and/or reimbursing its fees after the applicable termination date of such agreement. See Note 6 of the Notes to Financial Statements for additional information on waivers and/or reimbursements. The standardized 30-day yield includes the effects of any waivers and/or reimbursements. The unsubsidized 30-day yield excludes the effects of any waivers and/or reimbursements.
The Manager voluntarily waived a portion of each Fund’s expenses. Without such waiver, each Fund’s performance would have been lower. The Manager is under no obligation to waive or to continue waiving its fees and such voluntary waiver may be reduced or discontinued at any time. See Note 6 of the Notes to Financial Statements for additional information on waivers.
Bloomberg Barclays Taxable Municipal: U.S. Aggregate Eligible Index — represents securities that are taxable, dollar-denominated, and issued by a U.S. state or territory, and have at least one year to final maturity regardless of call features, have at least $250 million par amount outstanding, and are rated investment-grade (at least BBB- by S&P or Fitch Ratings (“Fitch”) and/or Baa3 by Moody’s) by at least two of the following ratings agencies: S&P, Moody’s and Fitch.
S&P® Municipal Bond High Yield Index — a market-value-weighted index that consists of bonds in the S&P Municipal Bond Index that are nonrated or that are rated BB+ by S&P and/or Ba1 by Moody’s or lower; bonds that are prerefunded or escrowed to maturity are not included in this index.
S&P® Municipal Bond Investment Grade Index — a market-value-weighted index that consists of bonds in the S&P Municipal Bond Index that are rated at least BBB- by S&P and/or Baa3 by Moody’s.
| 14 | 2019 BLACKROCK ANNUAL REPORT TO SHAREHOLDERS |
| Disclosure of Expenses |
Shareholders of the Funds may incur the following charges: (a) transactional expenses, such as sales charges; and (b) operating expenses, including investment advisory fees, service and distribution fees, including 12b-1 fees, acquired fund fees and expenses, and other Fund expenses. The expense examples shown below (which are based on a hypothetical investment of $1,000 invested on December 1, 2018 and held through May 31, 2019) are intended to assist shareholders both in calculating expenses based on an investment in each Fund and in comparing these expenses with similar costs of investing in other mutual funds.
The expense examples provide information about actual account values and actual expenses. In order to estimate the expenses a shareholder paid during the period covered by this report, shareholders can divide their account value by $1,000 and then multiply the result by the number corresponding to their Fund and share class under the heading entitled “Expenses Paid During the Period.”
The expense examples also provide information about hypothetical account values and hypothetical expenses based on a Fund’s actual expense ratio and an assumed rate of return of 5% per year before expenses. In order to assist shareholders in comparing the ongoing expenses of investing in these Funds and other funds, compare the 5% hypothetical examples with the 5% hypothetical examples that appear in shareholder reports of other funds.
The expenses shown in the expense examples are intended to highlight shareholders’ ongoing costs only and do not reflect transactional expenses, such as sales charges, if any. Therefore, the hypothetical examples are useful in comparing ongoing expenses only, and will not help shareholders determine the relative total expenses of owning different funds. If these transactional expenses were included, shareholder expenses would have been higher.
Expense Examples
| Actual | Hypothetical (c) | |||||||||||||||||||||||||||||||||||||||
| Including Interest Expense and Fees |
Excluding Interest Expense and Fees |
Including Interest Expense and Fees |
Excluding Interest Expense and Fees |
|||||||||||||||||||||||||||||||||||||
| BlackRock California Municipal Opportunities Fund |
Beginning Account Value |
Ending Account Value |
Expenses Paid During the Period (a) |
Expenses Paid During the Period (b) |
Beginning Account Value |
Ending Account Value |
Expenses Paid During the Period (a) |
Ending Account Value |
Expenses Paid During the Period (b) |
|||||||||||||||||||||||||||||||
| Institutional |
$ | 1,000.00 | $ | 1,040.80 | $ | 3.15 | $ | 2.24 | $ | 1,000.00 | $ | 1,021.84 | $ | 3.13 | $ | 1,022.74 | $ | 2.22 | ||||||||||||||||||||||
| Investor A |
1,000.00 | 1,039.50 | 4.42 | 3.51 | 1,000.00 | 1,020.59 | 4.38 | 1,021.49 | 3.48 | |||||||||||||||||||||||||||||||
| Investor A1 |
1,000.00 | 1,040.40 | 3.61 | 2.70 | 1,000.00 | 1,021.39 | 3.58 | 1,022.29 | 2.67 | |||||||||||||||||||||||||||||||
| Investor C |
1,000.00 | 1,035.70 | 8.22 | 7.31 | 1,000.00 | 1,016.85 | 8.15 | 1,017.75 | 7.24 | |||||||||||||||||||||||||||||||
| Investor C1 |
1,000.00 | 1,037.90 | 6.76 | 5.13 | 1,000.00 | 1,018.30 | 6.69 | 1,019.90 | 5.09 | |||||||||||||||||||||||||||||||
| Class K |
1,000.00 | 1,040.30 | 2.90 | 1.98 | 1,000.00 | 1,022.09 | 2.87 | 1,022.99 | 1.97 | |||||||||||||||||||||||||||||||
| (a) | For each class of the Fund, expenses are equal to the annualized expense ratio for the class (0.62% for Institutional, 0.87% for Investor A, 0.71% for Investor A1, 1.62% for Investor C, 1.33% for Investor C1 and 0.57% for Class K), multiplied by the average account value over the period, multiplied by 182/365 (to reflect the one-half year period shown). |
| (b) | For each class of the Fund, expenses are equal to the annualized expense ratio for the class (0.44% for Institutional, 0.69% for Investor A, 0.53% for Investor A1, 1.44% for Investor C, 1.01% for Investor C1 and 0.39% for Class K), multiplied by the average account value over the period, multiplied by 182/365 (to reflect the one half year period shown). |
| (c) | Hypothetical 5% annual return before expenses is calculated by prorating the number of days in the most recent fiscal half year divided by 365. |
| Actual | Hypothetical (c) | |||||||||||||||||||||||||||||||||||||||
| Including Interest Expense and Fees |
Excluding Interest Expense and Fees |
Including Interest Expense and Fees |
Excluding Interest Expense and Fees |
|||||||||||||||||||||||||||||||||||||
| BlackRock New Jersey Municipal Bond Fund |
Beginning Account Value (12/01/18) |
Ending Account Value (05/31/19) |
Expenses Paid During the Period (a) |
Expenses Paid During the Period (b) |
Beginning Account Value |
Ending Account Value (05/31/19) |
Expenses Paid During the Period (a) |
Ending Account Value (05/31/19) |
Expenses Paid During the Period (b) |
|||||||||||||||||||||||||||||||
| Institutional |
$ | 1,000.00 | $ | 1,059.40 | $ | 3.34 | $ | 2.67 | $ | 1,000.00 | $ | 1,021.69 | $ | 3.28 | $ | 1,022.34 | $ | 2.62 | ||||||||||||||||||||||
| Service |
1,000.00 | 1,058.10 | 4.62 | 3.95 | 1,000.00 | 1,020.44 | 4.53 | 1,021.09 | 3.88 | |||||||||||||||||||||||||||||||
| Investor A |
1,000.00 | 1,058.10 | 4.62 | 3.95 | 1,000.00 | 1,020.44 | 4.53 | 1,021.09 | 3.88 | |||||||||||||||||||||||||||||||
| Investor A1 |
1,000.00 | 1,057.90 | 3.80 | 3.13 | 1,000.00 | 1,021.24 | 3.73 | 1,021.89 | 3.07 | |||||||||||||||||||||||||||||||
| Investor C |
1,000.00 | 1,054.20 | 8.40 | 7.78 | 1,000.00 | 1,016.75 | 8.25 | 1,017.35 | 7.64 | |||||||||||||||||||||||||||||||
| Investor C1 |
1,000.00 | 1,056.50 | 6.77 | 5.54 | 1,000.00 | 1,018.35 | 6.64 | 1,019.55 | 5.44 | |||||||||||||||||||||||||||||||
| Class K |
1,000.00 | 1,059.70 | 3.08 | 2.41 | 1,000.00 | 1,021.94 | 3.02 | 1,022.59 | 2.37 | |||||||||||||||||||||||||||||||
| (a) | For each class of the Fund, expenses are equal to the annualized expense ratio for the class (0.65% for Institutional, 0.90% for Service, 0.90% for Investor A, 0.74% for Investor A1, 1.64% for Investor C, 1.32% for Investor C1 and 0.60% for Class K), multiplied by the average account value over the period, multiplied by 182/365 (to reflect the one-half year period shown). |
| (b) | For each class of the Fund, expenses are equal to the annualized expense ratio for the class (0.52% for Institutional, 0.77% for Service, 0.77% for Investor A, 0.61% for Investor A1, 1.52% for Investor C, 1.08% for Investor C1 and 0.47% for Class K), multiplied by the average account value over the period, multiplied by 182/365 (to reflect the one-half year period shown). |
| (c) | Hypothetical 5% annual return before expenses is calculated by prorating the number of days in the most recent fiscal half year divided by 365. |
| DISCLOSURE OF EXPENSES | 15 |
| Disclosure of Expenses (continued) |
Expense Examples (continued)
| Actual | Hypothetical (c) | |||||||||||||||||||||||||||||||||||||||
| Including Interest Expense and Fees |
Excluding Interest Expense and Fees |
Including Interest Expense and Fees |
Excluding Interest Expense and Fees |
|||||||||||||||||||||||||||||||||||||
| BlackRock Pennsylvania Municipal Bond Fund |
Beginning Account Value (12/01/18) |
Ending Account Value (05/31/19) |
Expenses Paid During the Period (a) |
Expenses Paid During the Period (b) |
Beginning Account Value (12/01/18) |
Ending Account Value (05/31/19) |
Expenses Paid During the Period (a) |
Ending Account Value (05/31/19) |
Expenses Paid During the Period (b) |
|||||||||||||||||||||||||||||||
| Institutional |
$ | 1,000.00 | $ | 1,054.50 | $ | 4.30 | $ | 2.77 | $ | 1,000.00 | $ | 1,020.74 | $ | 4.23 | $ | 1,022.24 | $ | 2.72 | ||||||||||||||||||||||
| Service |
1,000.00 | 1,054.10 | 5.58 | 4.05 | 1,000.00 | 1,019.50 | 5.49 | 1,020.99 | 3.98 | |||||||||||||||||||||||||||||||
| Investor A |
1,000.00 | 1,054.10 | 5.58 | 4.05 | 1,000.00 | 1,019.50 | 5.49 | 1,020.99 | 3.98 | |||||||||||||||||||||||||||||||
| Investor A1 |
1,000.00 | 1,053.90 | 4.86 | 3.28 | 1,000.00 | 1,020.20 | 4.78 | 1,021.74 | 3.22 | |||||||||||||||||||||||||||||||
| Investor C |
1,000.00 | 1,049.20 | 9.40 | 7.87 | 1,000.00 | 1,015.76 | 9.25 | 1,017.25 | 7.75 | |||||||||||||||||||||||||||||||
| Investor C1 |
1,000.00 | 1,051.40 | 7.67 | 5.68 | 1,000.00 | 1,017.45 | 7.54 | 1,019.40 | 5.59 | |||||||||||||||||||||||||||||||
| Class K |
1,000.00 | 1,054.70 | 4.10 | 2.51 | 1,000.00 | 1,020.94 | 4.03 | 1,020.94 | 2.47 | |||||||||||||||||||||||||||||||
| (a) | For each class of the Fund, expenses are equal to the annualized expense ratio for the class (0.84% for Institutional, 1.09% for Service, 1.09% for Investor A, 0.95% for Investor A1, 1.84% for Investor C, 1.50% for Investor C1 and 0.80% for Class K), multiplied by the average account value over the period, multiplied by 182/365 (to reflect the one-half year period shown). |
| (b) | For each class of the Fund, expenses are equal to the annualized expense ratio for the class (0.54% for Institutional, 0.79% for Service, 0.79% for Investor A, 0.64% for Investor A1, 1.53% for Investor C, 1.10% for Investor C1 and 0.49% for Class K), multiplied by the average account value over the period, multiplied by 182/365 (to reflect the one-half year period shown). |
| (c) | Hypothetical 5% annual return before expenses is calculated by prorating the number of days in the most recent fiscal half year divided by 365. |
| Actual | Hypothetical (c) | |||||||||||||||||||||||||||||||||||||||
| Including Interest Expense and Fees |
Excluding Interest Expense and Fees |
Including Interest Expense and Fees |
Excluding Interest Expense and Fees |
|||||||||||||||||||||||||||||||||||||
| BlackRock Strategic Municipal Opportunities Fund |
Beginning Account Value (12/01/18) |
Ending Account Value (05/31/19) |
Expenses Paid During the Period (a) |
Expenses Paid During the Period (b) |
Beginning Account Value (12/01/18) |
Ending Account Value (05/31/19) |
Expenses Paid During the Period (a) |
Ending Account Value (05/31/19) |
Expenses Paid During the Period (b) |
|||||||||||||||||||||||||||||||
| Institutional |
$ | 1,000.00 | $ | 1,043.20 | $ | 3.92 | $ | 2.80 | $ | 1,000.00 | $ | 1,021.09 | $ | 3.88 | $ | 1,022.19 | $ | 2.77 | ||||||||||||||||||||||
| Investor A |
1,000.00 | 1,041.20 | 5.09 | 3.97 | 1,000.00 | 1,019.95 | 5.04 | 1,021.04 | 3.93 | |||||||||||||||||||||||||||||||
| Investor A1 |
1,000.00 | 1,042.90 | 4.28 | 3.16 | 1,000.00 | 1,020.74 | 4.23 | 1,021.84 | 3.12 | |||||||||||||||||||||||||||||||
| Investor C |
1,000.00 | 1,038.20 | 8.89 | 7.77 | 1,000.00 | 1,016.21 | 8.80 | 1,017.30 | 7.70 | |||||||||||||||||||||||||||||||
| Class K |
1,000.00 | 1,043.60 | 3.62 | 2.50 | 1,000.00 | 1,021.39 | 3.58 | 1,021.39 | 2.47 | |||||||||||||||||||||||||||||||
| (a) | For each class of the Fund, expenses are equal to the annualized expense ratio for the class (0.77% for Institutional, 1.00% for Investor A, 0.84% for Investor A1, 1.75% for Investor C and 0.71% for Class K), multiplied by the average account value over the period, multiplied by 182/365 (to reflect the one-half year period shown). |
| (b) | For each class of the Fund, expenses are equal to the annualized expense ratio for the class (0.55% for Institutional, 0.78% for Investor A, 0.62% for Investor A1, 1.53% for Investor C and 0.49% for Class K), multiplied by the average account value over the period, multiplied by 182/365 (to reflect the one-half year period shown). |
| (c) | Hypothetical 5% annual return before expenses is calculated by prorating the number of days in the most recent fiscal half year divided by 365. |
| 16 | 2019 BLACKROCK ANNUAL REPORT TO SHAREHOLDERS |
The Benefits and Risks of Leveraging
The Funds may utilize leverage to seek to enhance returns and NAV. However, there is no guarantee that these objectives can be achieved in all interest rate environments.
Each Fund may leverage its assets through the use of proceeds received in tender option bond (“TOB”) transactions, as described in the Notes to Financial Statements. In a TOB Trust transaction, the Funds transfer municipal bonds or other municipal securities into a special purpose entity (a “TOB Trust”). TOB investments generally provide the Funds with economic benefits in periods of declining short-term interest rates, but expose the Funds to risks during periods of rising short-term interest rates. Additionally, fluctuations in the market value of municipal bonds deposited into a TOB Trust may adversely affect the Funds’ NAV per share.
In general, the concept of leveraging is based on the premise that the financing cost of leverage, which is based on short-term interest rates, is normally lower than the income earned by each Fund on its longer-term portfolio investments purchased with the proceeds from leverage. To the extent that the total assets of each Fund (including the assets obtained from leverage) are invested in higher-yielding portfolio investments, such Fund’s shareholders benefit from the incremental net income.
The interest earned on securities purchased with the proceeds from leverage is distributed to the Funds’ shareholders, and the value of these portfolio holdings is reflected in the Funds’ per share NAV. However, in order to benefit shareholders, the return on assets purchased with leverage proceeds must exceed the ongoing costs associated with the leverage. If interest and other ongoing costs of leverage exceed a Fund’s return on assets purchased with leverage proceeds, income to shareholders is lower than if the Funds had not used leverage.
Furthermore, the value of each Fund’s portfolio investments generally varies inversely with the direction of long-term interest rates, although other factors can also influence the value of portfolio investments. As a result, changes in interest rates can influence each Fund’s NAV positively or negatively in addition to the impact on each Fund’s performance from leverage. Changes in the direction of interest rates are difficult to predict accurately, and there is no assurance that a Fund’s leveraging strategy will be successful.
The use of leverage also generally causes greater changes in each Fund’s NAV and dividend rates than comparable portfolios without leverage. In a declining market, leverage is likely to cause a greater decline in the NAV of a Fund’s shares than if the Fund were not leveraged. In addition, each Fund may be required to sell portfolio securities at inopportune times or at distressed values in order to comply with regulatory requirements applicable to the use of leverage or as required by the terms of the leverage instruments, which may cause the Fund to incur losses. The use of leverage may limit a Fund’s ability to invest in certain types of securities or use certain types of hedging strategies. Each Fund incurs expenses in connection with the use of leverage, all of which are borne by such Fund’s shareholders and may reduce income.
Derivative Financial Instruments
The Funds may invest in various derivative financial instruments. These instruments are used to obtain exposure to a security, commodity, index, market, and/or other assets without owning or taking physical custody of securities, commodities and/or other referenced assets or to manage market, equity, credit, interest rate, foreign currency exchange rate, commodity and/or other risks. Derivative financial instruments may give rise to a form of economic leverage and involve risks, including the imperfect correlation between the value of a derivative financial instrument and the underlying asset, possible default of the counterparty to the transaction or illiquidity of the instrument. The Funds’ successful use of a derivative financial instrument depends on the investment adviser’s ability to predict pertinent market movements accurately, which cannot be assured. The use of these instruments may result in losses greater than if they had not been used, may limit the amount of appreciation a Fund can realize on an investment and/or may result in lower distributions paid to shareholders. The Funds’ investments in these instruments, if any, are discussed in detail in the Notes to Financial Statements.
| THE BENEFITS AND RISKS OF LEVERAGING / DERIVATIVE FINANCIAL INSTRUMENTS | 17 |
|
May 31, 2019 |
BlackRock California Municipal Opportunities Fund (Percentages shown are based on Net Assets) |
| 18 | 2019 BLACKROCK ANNUAL REPORT TO SHAREHOLDERS |
| Schedule of Investments (continued) May 31, 2019 |
BlackRock California Municipal Opportunities Fund (Percentages shown are based on Net Assets) |
| SCHEDULES OF INVESTMENTS | 19 |
| Schedule of Investments (continued) May 31, 2019 |
BlackRock California Municipal Opportunities Fund (Percentages shown are based on Net Assets) |
| 20 | 2019 BLACKROCK ANNUAL REPORT TO SHAREHOLDERS |
| Schedule of Investments (continued) May 31, 2019 |
BlackRock California Municipal Opportunities Fund (Percentages shown are based on Net Assets) |
| SCHEDULES OF INVESTMENTS | 21 |
| Schedule of Investments (continued) May 31, 2019 |
BlackRock California Municipal Opportunities Fund (Percentages shown are based on Net Assets) |
| 22 | 2019 BLACKROCK ANNUAL REPORT TO SHAREHOLDERS |
| Schedule of Investments (continued) May 31, 2019 |
BlackRock California Municipal Opportunities Fund (Percentages shown are based on Net Assets) |
| (k) | During the year ended May 31, 2019, investments in issuers considered to be an affiliate/affiliates of the Fund for purposes of Section 2(a)(3) of the Investment Company Act of 1940, as amended, and/or related parties of the Fund were as follows: |
| Affiliate Persons and/or Related Parties | Shares Held at 05/31/18 |
Shares Purchased |
Shares Sold |
Shares Held at 05/31/19 |
Value at 05/31/19 |
Income | Net Realized Gain (Loss) (a) |
Change in Unrealized Appreciation (Depreciation) |
||||||||||||||||||||||||
| BlackRock Liquidity Funds California Money Fund, Institutional Class |
— | 256,535,508 | (b) | — | 256,535,508 | $ | 256,586,815 | $ | 1,465,742 | $ | — | $ | — | |||||||||||||||||||
| BlackRock Liquidity Funds, MuniCash, Institutional Class* |
148,286,820 | — | (148,286,820 | )(c) | — | — | 935,295 | 15,111 | (11,753 | ) | ||||||||||||||||||||||
| iShares California Muni Bond ETF* |
— | 875,000 | (875,000 | ) | — | — | 184,090 | (656,616 | ) | — | ||||||||||||||||||||||
| iShares National Municipal Bond Fund |
250,000 | 1,705,000 | (1,620,000 | ) | 335,000 | 37,811,450 | 1,178,819 | 565,715 | 897,167 | |||||||||||||||||||||||
|
|
|
|
|
|
|
|
|
|||||||||||||||||||||||||
| $ | 294,398,265 | $ | 3,763,946 | $ | (75,790 | ) | $ | 885,414 | ||||||||||||||||||||||||
|
|
|
|
|
|
|
|
|
|||||||||||||||||||||||||
| * | No longer held by the Fund as of period end. |
| (a) | Includes net capital gain distributions, if applicable. |
| (b) | Represents net shares purchased. |
| (c) | Represents net shares sold. |
For Fund compliance purposes, the Fund’s sector classifications refer to one or more of the sector sub-classifications used by one or more widely recognized market indexes or rating group indexes, and/or as defined by the investment adviser. These definitions may not apply for purposes of this report, which may combine such sector sub-classifications for reporting ease.
Derivative Financial Instruments Outstanding as of Period End
Futures Contracts
| Description | Number of Contracts |
Expiration Date |
Notional Amount (000) |
Value/ Unrealized Appreciation (Depreciation) |
||||||||||||
| Short Contracts: |
||||||||||||||||
| 10-Year U.S. Treasury Note |
4,200 | 09/19/19 | $ | 532,350 | $ | (3,527,630 | ) | |||||||||
| Long U.S. Treasury Bond |
4,777 | 09/19/19 | 734,314 | (7,642,709 | ) | |||||||||||
|
|
|
|||||||||||||||
| $ | (11,170,339 | ) | ||||||||||||||
|
|
|
|||||||||||||||
| SCHEDULES OF INVESTMENTS | 23 |
| Schedule of Investments (continued) May 31, 2019 |
BlackRock California Municipal Opportunities Fund |
Derivative Financial Instruments Categorized by Risk Exposure
As of period end, the fair values of derivative financial instruments located in the Statements of Assets and Liabilities were as follows:
| Commodity Contracts |
Credit Contracts |
Equity Contracts |
Foreign Currency Exchange Contracts |
Interest Rate Contracts |
Other Contracts |
Total | ||||||||||||||||||||||
| Liabilities — Derivative Financial Instruments |
||||||||||||||||||||||||||||
| Futures contracts |
||||||||||||||||||||||||||||
| Unrealized depreciation on futures contracts(a) |
$ | — | $ | — | $ | — | $ | — | $ | 11,170,339 | $ | — | $ | 11,170,339 | ||||||||||||||
|
|
|
|
|
|
|
|
|
|
|
|
|
|
|
|||||||||||||||
| (a) | Net cumulative unrealized appreciation (depreciation) on futures, are reported in the Schedule of Investments. In the Statements of Assets and Liabilities, only current day’s variation margin is reported in receivables or payables and the net cumulative unrealized appreciation (depreciation) is included in accumulated earnings (loss). |
For the year ended May 31, 2019, the effect of derivative financial instruments in the Statements of Operations was as follows:
| Commodity Contracts |
Credit Contracts |
Equity Contracts |
Foreign Currency Exchange Contracts |
Interest Rate Contracts |
Other Contracts |
Total | ||||||||||||||||||||||
| Net Realized Gain (Loss) from: |
||||||||||||||||||||||||||||
| Futures contracts |
$ | — | $ | — | $ | — | $ | — | $ | (76,470,437 | ) | $ | — | $ | (76,470,437 | ) | ||||||||||||
|
|
|
|
|
|
|
|
|
|
|
|
|
|
|
|||||||||||||||
| Net Change in Unrealized Appreciation (Depreciation) on: | ||||||||||||||||||||||||||||
| Futures contracts |
$ | — | $ | — | $ | — | $ | — | $ | (2,193,285 | ) | $ | — | $ | (2,193,285 | ) | ||||||||||||
|
|
|
|
|
|
|
|
|
|
|
|
|
|
|
|||||||||||||||
Average Quarterly Balances of Outstanding Derivative Financial Instruments
| Futures contracts: |
| |||
| Average notional value of contracts — long |
$ | — | (a) | |
| Average notional value of contracts — short |
$ | 1,047,362,734 | ||
| (a) | Derivative not held at any quarter-end. The risk exposure table serves as an indicator of activity during the period. |
For more information about the Fund’s investment risks regarding derivative financial instruments, refer to the Notes to Financial Statements.
Fair Value Hierarchy as of Period End
Various inputs are used in determining the fair value of investments and derivative financial instruments. For information about the Fund’s policy regarding valuation of investments and derivative financial instruments, refer to the Notes to Financial Statements.
The following tables summarize the Fund’s investments and derivative financial instruments categorized in the disclosure hierarchy:
| Level 1 | Level 2 | Level 3 | Total | |||||||||||||
| Assets: |
| |||||||||||||||
| Investments: |
| |||||||||||||||
| Long-Term Investments(a) |
$ | 37,811,450 | $ | 3,293,162,902 | $ | — | $ | 3,330,974,352 | ||||||||
| Short-Term Securities |
256,586,815 | — | — | 256,586,815 | ||||||||||||
|
|
|
|
|
|
|
|
|
|||||||||
| $ | 294,398,265 | $ | 3,293,162,902 | $ | — | $ | 3,587,561,167 | |||||||||
|
|
|
|
|
|
|
|
|
|||||||||
| Derivative Financial Instruments(b) |
||||||||||||||||
| Liabilities: |
| |||||||||||||||
| Interest rate contracts |
$ | (11,170,339 | ) | $ | — | $ | — | $ | (11,170,339 | ) | ||||||
|
|
|
|
|
|
|
|
|
|||||||||
| (a) | See above Schedule of Investments for values in each sector. |
| (b) | Derivative financial instruments are futures contracts which are valued at the unrealized appreciation (depreciation) on the instrument. |
The Fund may hold liabilities in which the fair value approximates the carrying amount for financial statement purposes. As of period end, TOB Trust Certificates of $253,167,157 are categorized as Level 2 within the disclosure hierarchy.
See notes to financial statements.
| 24 | 2019 BLACKROCK ANNUAL REPORT TO SHAREHOLDERS |
| Schedule of Investments May 31, 2019 |
BlackRock New Jersey Municipal Bond Fund (Percentages shown are based on Net Assets) |
| SCHEDULES OF INVESTMENTS | 25 |
| Schedule of Investments (continued) May 31, 2019 |
BlackRock New Jersey Municipal Bond Fund (Percentages shown are based on Net Assets) |
| 26 | 2019 BLACKROCK ANNUAL REPORT TO SHAREHOLDERS |
| Schedule of Investments (continued) May 31, 2019 |
BlackRock New Jersey Municipal Bond Fund (Percentages shown are based on Net Assets) |
| SCHEDULES OF INVESTMENTS | 27 |
| Schedule of Investments (continued) May 31, 2019 |
BlackRock New Jersey Municipal Bond Fund (Percentages shown are based on Net Assets) |
| (a) | Security is collateralized by municipal bonds or U.S. Treasury obligations. |
| (b) | Security exempt from registration pursuant to Rule 144A under the Securities Act of 1933, as amended. These securities may be resold in transactions exempt from registration to qualified institutional investors. |
| (c) | U.S. Government securities held in escrow, are used to pay interest on this security, as well as to retire the bond in full at the date indicated, typically at a premium to par. |
| (d) | Zero-coupon bond. |
| (e) | Represent bonds transferred to a TOB Trust in exchange of cash and residual certificates received by the Fund. These bonds serve as collateral in a secured borrowing. See Note 4 of the Notes to Financial Statements for details. |
| (f) | All or a portion of the security is subject to a recourse agreement. The aggregate maximum potential amount the Fund could ultimately be required to pay under the agreement, which expires on December 15, 2020, is $3,884,927. See Note 4 of the Notes to Financial Statements for details. |
| (g) | Annualized 7-day yield as of period end. |
| (h) | During the year ended May 31, 2019, investments in issuers considered to be an affiliate/affiliates of the Fund for purposes of Section 2(a)(3) of the Investment Company Act of 1940, as amended, were as follows: |
| Affiliate | Shares Held at 05/31/18 |
Net Activity |
Shares Held at 05/31/19 |
Value at 05/31/19 |
Income | Net Realized Gain (Loss) (a) |
Change in Unrealized Appreciation (Depreciation) |
|||||||||||||||||||||
| BlackRock Liquidity Funds, MuniCash, Institutional Class |
4,956,992 | 10,980,179 | 15,937,171 | $ | 15,940,358 | $ | 159,329 | $ | 1,377 | $ | 606 | |||||||||||||||||
|
|
|
|
|
|
|
|
|
|||||||||||||||||||||
| (a) | Includes net capital gain distributions, if applicable. |
For Fund compliance purposes, the Fund’s sector classifications refer to one or more of the sector sub-classifications used by one or more widely recognized market indexes or rating group indexes, and/or as defined by the investment adviser. These definitions may not apply for purposes of this report, which may combine such sector sub-classifications for reporting ease.
Derivative Financial Instruments Outstanding as of Period End
Futures Contracts
| Description | Number of Contracts |
Expiration Date |
Notional Amount (000) |
Value/ Unrealized Appreciation (Depreciation) |
||||||||||||
| Short Contracts: |
||||||||||||||||
| 10-Year U.S. Treasury Note |
99 | 09/19/19 | $ | 12,548 | $ | (83,151 | ) | |||||||||
| Long U.S. Treasury Bond |
104 | 09/19/19 | 15,987 | (166,389 | ) | |||||||||||
| 5-Year U.S. Treasury Note |
81 | 09/30/19 | 9,507 | (38,729 | ) | |||||||||||
|
|
|
|||||||||||||||
| $ | (288,269 | ) | ||||||||||||||
|
|
|
|||||||||||||||
| 28 | 2019 BLACKROCK ANNUAL REPORT TO SHAREHOLDERS |
| Schedule of Investments (continued) May 31, 2019 |
BlackRock New Jersey Municipal Bond Fund |
Derivative Financial Instruments Categorized by Risk Exposure
As of period end, the fair values of derivative financial instruments located in the Statements of Assets and Liabilities were as follows:
| Commodity Contracts |
Credit Contracts |
Equity Contracts |
Foreign Currency Exchange Contracts |
Interest Rate Contracts |
Other Contracts |
Total | ||||||||||||||||||||||
| Liabilities — Derivative Financial Instruments |
||||||||||||||||||||||||||||
| Futures contracts |
||||||||||||||||||||||||||||
| Unrealized depreciation on futures contracts(a) |
$ | — | $ | — | $ | — | $ | — | $ | 288,269 | $ | — | $ | 288,269 | ||||||||||||||
|
|
|
|
|
|
|
|
|
|
|
|
|
|
|
|||||||||||||||
| (a) | Net cumulative unrealized appreciation (depreciation) on futures contracts, if any, are reported in the Schedule of Investments. In the Statements of Assets and Liabilities, only current day’s variation margin is reported in receivables or payables and the net cumulative unrealized appreciation (depreciation) is included in accumulated earnings (loss). |
For the year ended May 31, 2019, the effect of derivative financial instruments in the Statements of Operations was as follows:
| Commodity Contracts |
Credit Contracts |
Equity Contracts |
Foreign Currency Exchange Contracts |
Interest Rate Contracts |
Other Contracts |
Total | ||||||||||||||||||||||
| Net Realized Gain (Loss) from: |
||||||||||||||||||||||||||||
| Futures contracts |
$ | — | $ | — | $ | — | $ | — | $ | (2,490,449 | ) | $ | — | $ | (2,490,449 | ) | ||||||||||||
|
|
|
|
|
|
|
|
|
|
|
|
|
|
|
|||||||||||||||
| Net Change in Unrealized Appreciation (Depreciation) on: |
||||||||||||||||||||||||||||
| Futures contracts |
$ | — | $ | — | $ | — | $ | — | $ | (86,994 | ) | $ | — | $ | (86,994 | ) | ||||||||||||
|
|
|
|
|
|
|
|
|
|
|
|
|
|
|
|||||||||||||||
Average Quarterly Balances of Outstanding Derivative Financial Instruments
| Futures contracts: |
| |||
| Average notional value of contracts — short |
$ | 31,872,486 | ||
For more information about the Fund’s investment risks regarding derivative financial instruments, refer to the Notes to Financial Statements.
Fair Value Hierarchy as of Period End
Various inputs are used in determining the fair value of investments and derivative financial instruments. For information about the Fund’s policy regarding valuation of investments and derivative financial instruments, refer to the Notes to Financial Statements.
The following tables summarize the Fund’s investments and derivative financial instruments categorized in the disclosure hierarchy:
| Level 1 | Level 2 | Level 3 | Total | |||||||||||||
| Assets: |
||||||||||||||||
| Investments: |
||||||||||||||||
| Long-Term Investments(a) |
$ | — | $ | 325,585,848 | $ | — | $ | 325,585,848 | ||||||||
| Short-Term Securities |
15,940,358 | — | — | 15,940,358 | ||||||||||||
|
|
|
|
|
|
|
|
|
|||||||||
| $ | 15,940,358 | $ | 325,585,848 | $ | — | $ | 341,526,206 | |||||||||
|
|
|
|
|
|
|
|
|
|||||||||
| Derivative Financial Instruments(b) |
||||||||||||||||
| Liabilities: |
||||||||||||||||
| Interest rate contracts |
$ | (288,269 | ) | $ | — | $ | — | $ | (288,269 | ) | ||||||
|
|
|
|
|
|
|
|
|
|||||||||
| (a) | See above Schedule of Investments for values in each sector. |
| (b) | Derivative financial instruments are futures contracts which are valued at the unrealized appreciation (depreciation) on the instrument. |
The Fund may hold assets and/or liabilities in which the fair value approximates the carrying amount for financial statement purposes. As of period end, TOB Trust Certificates of $16,418,726 are categorized as Level 2 within the disclosure hierarchy.
See notes to financial statements.
| SCHEDULES OF INVESTMENTS | 29 |
| Schedule of Investments May 31, 2019 |
BlackRock Pennsylvania Municipal Bond Fund (Percentages shown are based on Net Assets) |
| 30 | 2019 BLACKROCK ANNUAL REPORT TO SHAREHOLDERS |
| Schedule of Investments (continued) May 31, 2019 |
BlackRock Pennsylvania Municipal Bond Fund (Percentages shown are based on Net Assets) |
| SCHEDULES OF INVESTMENTS | 31 |
| Schedule of Investments (continued) May 31, 2019 |
BlackRock Pennsylvania Municipal Bond Fund (Percentages shown are based on Net Assets) |
| 32 | 2019 BLACKROCK ANNUAL REPORT TO SHAREHOLDERS |
| Schedule of Investments (continued) May 31, 2019 |
BlackRock Pennsylvania Municipal Bond Fund (Percentages shown are based on Net Assets) |
During the year ended May 31, 2019, investments in issuers considered to be an affiliate/affiliates of the Fund for purposes of Section 2(a)(3) of the Investment Company Act of 1940, as amended, were as follows:
| Affiliate | Shares Held at 05/31/18 |
Net Activity |
Shares Held at 05/31/19 |
Value at 05/31/19 |
Income | Net Realized Gain (Loss) (a) |
Change in Unrealized Appreciation (Depreciation) |
|||||||||||||||||||||
| BlackRock Liquidity Funds, MuniCash, Institutional Class* |
8,267,642 | (8,267,642 | ) | — | $ | — | $ | 93,613 | $ | 1,529 | $ | (827 | ) | |||||||||||||||
|
|
|
|
|
|
|
|
|
|||||||||||||||||||||
| * | No longer held by the Fund as of period end. |
| (a) | Includes net capital gain distributions, if applicable. |
For Fund compliance purposes, the Fund’s sector classifications refer to one or more of the sector sub-classifications used by one or more widely recognized market indexes or rating group indexes, and/or as defined by the investment adviser. These definitions may not apply for purposes of this report, which may combine such sector sub-classifications for reporting ease.
Derivative Financial Instruments Outstanding as of Period End
Futures Contracts
| Description | Number of Contracts |
Expiration Date |
Notional Amount (000) |
Value/ Unrealized Appreciation (Depreciation) |
||||||||||||
| Short Contracts: |
||||||||||||||||
| 10-Year U.S. Treasury Note |
147 | 09/19/19 | $ | 18,632 | $ | (123,466 | ) | |||||||||
| U.S. Treasury Long Bond |
234 | 09/19/19 | 35,970 | (374,368 | ) | |||||||||||
| 5-Year U.S. Treasury Note |
72 | 09/30/19 | 8,450 | (34,426 | ) | |||||||||||
|
|
|
|||||||||||||||
| $ | (532,260 | ) | ||||||||||||||
|
|
|
|||||||||||||||
| SCHEDULES OF INVESTMENTS | 33 |
| Schedule of Investments (continued) May 31, 2019 |
BlackRock Pennsylvania Municipal Bond Fund |
Derivative Financial Instruments Outstanding as of Period End
As of period end, the fair values of derivative financial instruments located in the Statements of Assets and Liabilities were as follows:
| Commodity Contracts |
Credit Contracts |
Equity Contracts |
Foreign Currency Exchange Contracts |
Interest Rate Contracts |
Other Contracts |
Total | ||||||||||||||||||||||
| Liabilities — Derivative Financial Instruments |
||||||||||||||||||||||||||||
| Futures contracts |
||||||||||||||||||||||||||||
| Unrealized depreciation on futures contracts(a) |
$ | — | $ | — | $ | — | $ | — | $ | 532,260 | $ | — | $ | 532,260 | ||||||||||||||
|
|
|
|
|
|
|
|
|
|
|
|
|
|
|
|||||||||||||||
| (a) | Net cumulative unrealized appreciation (depreciation) on futures contracts, are reported in the Schedule of Investments. In the Statements of Assets and Liabilities, only current day’s variation margin is reported in receivables or payables and the net cumulative unrealized appreciation (depreciation) is included in accumulated earnings (loss). |
For the year ended May 31, 2019, the effect of derivative financial instruments in the Statements of Operations was as follows:
| Commodity Contracts |
Credit Contracts |
Equity Contracts |
Foreign Currency Exchange Contracts |
Interest Rate Contracts |
Other Contracts |
Total | ||||||||||||||||||||||
| Net Realized Gain (Loss) from: |
||||||||||||||||||||||||||||
| Futures contracts |
$ | — | $ | — | $ | — | $ | — | $ | (4,197,684 | ) | $ | — | $ | (4,197,684 | ) | ||||||||||||
|
|
|
|
|
|
|
|
|
|
|
|
|
|
|
|||||||||||||||
| Net Change in Unrealized Appreciation (Depreciation) on: |
||||||||||||||||||||||||||||
| Futures contracts |
$ | — | $ | — | $ | — | $ | — | $ | (174,646 | ) | $ | — | $ | (174,646 | ) | ||||||||||||
|
|
|
|
|
|
|
|
|
|
|
|
|
|
|
|||||||||||||||
Average Quarterly Balances of Outstanding Derivative Financial Instruments
| Futures contracts: |
| |||
| Average notional value of contracts — short |
$ | 52,946,908 | ||
For more information about the Fund’s investment risks regarding derivative financial instruments, refer to the Notes to Financial Statements.
Fair Value Hierarchy as of Period End
Various inputs are used in determining the fair value of investments and derivative financial instruments. For information about the Fund’s policy regarding valuation of investments and derivative financial instruments, refer to the Notes to Financial Statements.
The following tables summarize the Fund’s investments and derivative financial instruments categorized in the disclosure hierarchy:
| Level 1 | Level 2 | Level 3 | Total | |||||||||||||
| Assets: |
| |||||||||||||||
| Investments: |
| |||||||||||||||
| Long-Term Investments(a) |
$ | — | $ | 606,497,270 | $ | — | $ | 606,497,270 | ||||||||
|
|
|
|
|
|
|
|
|
|||||||||
| Derivative Financial Instruments(b) |
| |||||||||||||||
| Liabilities: |
| |||||||||||||||
| Interest rate contracts |
$ | (532,260 | ) | $ | — | $ | — | $ | (532,260 | ) | ||||||
|
|
|
|
|
|
|
|
|
|||||||||
| (a) | See above Schedule of Investments for values in each sector. |
| (b) | Derivative financial instruments are futures contracts which are valued at the unrealized appreciation (depreciation) on the instrument. |
The Fund may hold assets and/or liabilities in which the fair value approximates the carrying amount for financial statement purposes. As of period end, TOB Trust Certificates of $64,404,012 are categorized as Level 2 within the disclosure hierarchy.
See notes to financial statements.
| 34 | 2019 BLACKROCK ANNUAL REPORT TO SHAREHOLDERS |
| Schedule of Investments May 31, 2019 |
BlackRock Strategic Municipal Opportunities Fund (Percentages shown are based on Net Assets) |
| SCHEDULES OF INVESTMENTS | 35 |
| Schedule of Investments (continued) May 31, 2019 |
BlackRock Strategic Municipal Opportunities Fund (Percentages shown are based on Net Assets) |
| 36 | 2019 BLACKROCK ANNUAL REPORT TO SHAREHOLDERS |
| Schedule of Investments (continued) May 31, 2019 |
BlackRock Strategic Municipal Opportunities Fund (Percentages shown are based on Net Assets) |
| SCHEDULES OF INVESTMENTS | 37 |
| Schedule of Investments (continued) May 31, 2019 |
BlackRock Strategic Municipal Opportunities Fund (Percentages shown are based on Net Assets) |
| 38 | 2019 BLACKROCK ANNUAL REPORT TO SHAREHOLDERS |
| Schedule of Investments (continued) May 31, 2019 |
BlackRock Strategic Municipal Opportunities Fund (Percentages shown are based on Net Assets) |
| SCHEDULES OF INVESTMENTS | 39 |
| Schedule of Investments (continued) May 31, 2019 |
BlackRock Strategic Municipal Opportunities Fund (Percentages shown are based on Net Assets) |
| 40 | 2019 BLACKROCK ANNUAL REPORT TO SHAREHOLDERS |
| Schedule of Investments (continued) May 31, 2019 |
BlackRock Strategic Municipal Opportunities Fund (Percentages shown are based on Net Assets) |
| SCHEDULES OF INVESTMENTS | 41 |
| Schedule of Investments (continued) May 31, 2019 |
BlackRock Strategic Municipal Opportunities Fund (Percentages shown are based on Net Assets) |
| 42 | 2019 BLACKROCK ANNUAL REPORT TO SHAREHOLDERS |
| Schedule of Investments (continued) May 31, 2019 |
BlackRock Strategic Municipal Opportunities Fund (Percentages shown are based on Net Assets) |
| SCHEDULES OF INVESTMENTS | 43 |
| Schedule of Investments (continued) May 31, 2019 |
BlackRock Strategic Municipal Opportunities Fund (Percentages shown are based on Net Assets) |
| 44 | 2019 BLACKROCK ANNUAL REPORT TO SHAREHOLDERS |
| Schedule of Investments (continued) May 31, 2019 |
BlackRock Strategic Municipal Opportunities Fund (Percentages shown are based on Net Assets) |
| SCHEDULES OF INVESTMENTS | 45 |
| Schedule of Investments (continued) May 31, 2019 |
BlackRock Strategic Municipal Opportunities Fund (Percentages shown are based on Net Assets) |
| 46 | 2019 BLACKROCK ANNUAL REPORT TO SHAREHOLDERS |
| Schedule of Investments (continued) May 31, 2019 |
BlackRock Strategic Municipal Opportunities Fund (Percentages shown are based on Net Assets) |
| SCHEDULES OF INVESTMENTS | 47 |
| Schedule of Investments (continued) May 31, 2019 |
BlackRock Strategic Municipal Opportunities Fund (Percentages shown are based on Net Assets) |
| 48 | 2019 BLACKROCK ANNUAL REPORT TO SHAREHOLDERS |
| Schedule of Investments (continued) May 31, 2019 |
BlackRock Strategic Municipal Opportunities Fund (Percentages shown are based on Net Assets) |
| SCHEDULES OF INVESTMENTS | 49 |
| Schedule of Investments (continued) May 31, 2019 |
BlackRock Strategic Municipal Opportunities Fund (Percentages shown are based on Net Assets) |
| 50 | 2019 BLACKROCK ANNUAL REPORT TO SHAREHOLDERS |
| Schedule of Investments (continued) May 31, 2019 |
BlackRock Strategic Municipal Opportunities Fund (Percentages shown are based on Net Assets) |
| SCHEDULES OF INVESTMENTS | 51 |
| Schedule of Investments (continued) May 31, 2019 |
BlackRock Strategic Municipal Opportunities Fund (Percentages shown are based on Net Assets) |
| 52 | 2019 BLACKROCK ANNUAL REPORT TO SHAREHOLDERS |
| Schedule of Investments (continued) May 31, 2019 |
BlackRock Strategic Municipal Opportunities Fund (Percentages shown are based on Net Assets) |
| SCHEDULES OF INVESTMENTS | 53 |
| Schedule of Investments (continued) May 31, 2019 |
BlackRock Strategic Municipal Opportunities Fund (Percentages shown are based on Net Assets) |
| 54 | 2019 BLACKROCK ANNUAL REPORT TO SHAREHOLDERS |
| Schedule of Investments (continued) May 31, 2019 |
BlackRock Strategic Municipal Opportunities Fund (Percentages shown are based on Net Assets) |
| SCHEDULES OF INVESTMENTS | 55 |
| Schedule of Investments (continued) May 31, 2019 |
BlackRock Strategic Municipal Opportunities Fund (Percentages shown are based on Net Assets) |
| 56 | 2019 BLACKROCK ANNUAL REPORT TO SHAREHOLDERS |
| Schedule of Investments (continued) May 31, 2019 |
BlackRock Strategic Municipal Opportunities Fund (Percentages shown are based on Net Assets) |
| (m) | During the year ended May 31, 2019, investments in issuers considered to be an affiliate/affiliates of the Fund for purposes of Section 2(a)(3) of the Investment Company Act of 1940, as amended, and/or related parties of the Fund were as follows: |
| Affiliated Persons and/or Related Parties |
Shares Held at 05/31/18 |
Shares Purchased |
Shares Sold |
Shares Held at 05/31/19 |
Value at 05/31/19 |
Income | Net Realized Gain (Loss) (a) |
Change in Unrealized Appreciation (Depreciation) |
||||||||||||||||||||||||
| BlackRock Liquidity Funds, MuniCash, Institutional Class |
107,978,271 | — | (92,455,756 | )(b) | 15,522,515 | $ | 15,525,620 | $ | 2,526,401 | $ | (17,431 | ) | $ | (2,592 | ) | |||||||||||||||||
| iShares National Municipal Bond Fund* |
2,500,000 | 700,000 | (3,200,000 | ) | — | — | 2,799,288 | (3,064,303 | ) | (1,202,825 | ) | |||||||||||||||||||||
|
|
|
|
|
|
|
|
|
|||||||||||||||||||||||||
| $ | 15,525,620 | $ | 5,325,689 | $ | (3,081,734 | ) | $ | (1,205,417 | ) | |||||||||||||||||||||||
|
|
|
|
|
|
|
|
|
|||||||||||||||||||||||||
| * | No longer held by the Fund as of period end. |
| (a) | Includes net capital gain distributions, if applicable. |
| (b) | Represents net shares sold. |
For Fund compliance purposes, the Fund’s sector classifications refer to one or more of the sector sub-classifications used by one or more widely recognized market indexes or rating group indexes, and/or as defined by the investment adviser. These definitions may not apply for purposes of this report, which may combine such sector sub-classifications for reporting ease.
Derivative Financial Instruments Outstanding as of Period End
Futures Contracts
| Description | Number of Contracts |
Expiration Date |
Notional Amount (000) |
Value / Unrealized Appreciation (Depreciation) |
||||||||||||
| Short Contracts: |
||||||||||||||||
| 10-Year U.S. Treasury Note |
11,577 | 09/19/19 | $ | 1,467,385 | $ | (9,723,661 | ) | |||||||||
| Long U.S. Treasury Bond |
15,373 | 09/19/19 | 2,363,118 | (24,571,850 | ) | |||||||||||
| 5-Year U.S. Treasury Note |
4,997 | 09/30/19 | 586,484 | (2,389,231 | ) | |||||||||||
|
|
|
|||||||||||||||
| $ | (36,684,742 | ) | ||||||||||||||
|
|
|
|||||||||||||||
| SCHEDULES OF INVESTMENTS | 57 |
| Schedule of Investments (continued) May 31, 2019 |
BlackRock Strategic Municipal Opportunities Fund |
Derivative Financial Instruments Categorized by Risk Exposure
As of period end, the fair values of derivative financial instruments located in the Statements of Assets and Liabilities were as follows:
| Commodity Contracts |
Credit Contracts |
Equity Contracts |
Foreign Currency Exchange Contracts |
Interest Rate Contracts |
Other Contracts |
Total | ||||||||||||||||||||||
| Liabilities — Derivative Financial Instruments |
||||||||||||||||||||||||||||
| Futures contracts |
||||||||||||||||||||||||||||
| Unrealized depreciation on futures contracts(a) |
$ | — | $ | — | $ | — | $ | — | $ | 36,684,742 | $ | — | $ | 36,684,742 | ||||||||||||||
|
|
|
|
|
|
|
|
|
|
|
|
|
|
|
|||||||||||||||
| (a) | Net cumulative unrealized appreciation (depreciation) on futures contracts, if any, are reported in the Schedule of Investments. In the Statements of Assets and Liabilities, only current day’s variation margin is reported in receivables or payables and the net cumulative unrealized appreciation (depreciation) is included in accumulated earnings (loss). |
For the year ended May 31, 2019, the effect of derivative financial instruments in the Statements of Operations was as follows:
| Commodity Contracts |
Credit Contracts |
Equity Contracts |
Foreign Currency Exchange Contracts |
Interest Rate Contracts |
Other Contracts |
Total | ||||||||||||||||||||||
| Net Realized Gain (Loss) from: |
||||||||||||||||||||||||||||
| Futures contracts |
$ | — | $ | — | $ | — | $ | — | $ | (239,477,136 | ) | $ | — | $ | (239,477,136 | ) | ||||||||||||
|
|
|
|
|
|
|
|
|
|
|
|
|
|
|
|||||||||||||||
| Net Change in Unrealized Appreciation (Depreciation) on: | ||||||||||||||||||||||||||||
| Futures contracts |
$ | — | $ | — | $ | — | $ | — | $ | (745,761 | ) | $ | — | $ | (745,761 | ) | ||||||||||||
|
|
|
|
|
|
|
|
|
|
|
|
|
|
|
|||||||||||||||
Average Quarterly Balances of Outstanding Derivative Financial Instruments
| Futures contracts: |
| |||||||||||||
| Average notional value of contracts — long |
$ | 4,038,328 | ||||||||||||
| Average notional value of contracts — short |
3,551,062,921 | |||||||||||||
For more information about the Fund’s investment risks regarding derivative financial instruments, refer to the Notes to Financial Statements.
Fair Value Hierarchy as of Period End
Various inputs are used in determining the fair value of investments and derivative financial instruments. For information about the Fund’s policy regarding valuation of investments and derivative financial instruments, refer to the Notes to Financial Statements.
The following tables summarize the Fund’s investments and derivative financial instruments categorized in the disclosure hierarchy:
| Level 1 | Level 2 | Level 3 | Total | |||||||||||||
| Assets: |
| |||||||||||||||
| Investments: |
| |||||||||||||||
| Long-Term Investments(a) |
$ | 15,376,000 | $ | 11,764,547,837 | $ | — | $ | 11,779,923,837 | ||||||||
| Short-Term Securities |
15,525,620 | — | — | 15,525,620 | ||||||||||||
|
|
|
|
|
|
|
|
|
|||||||||
| $ | 30,901,620 | $ | 11,764,547,837 | $ | $ | 11,795,449,457 | ||||||||||
|
|
|
|
|
|
|
|
|
|||||||||
| Derivative Financial Instruments(b) |
| |||||||||||||||
| Liabilities: |
| |||||||||||||||
| Interest rate contracts |
$ | (36,684,742 | ) | $ | — | $ | — | $ | (36,684,742 | ) | ||||||
|
|
|
|
|
|
|
|
|
|||||||||
| (a) | See above Schedule of Investments for values in each sector, state or political subdivision. |
| (b) | Derivative financial instruments are futures contracts which are valued at the unrealized appreciation (depreciation) on the instrument. |
The Fund may hold assets and/or liabilities in which the fair value approximates the carrying amount for financial statement purposes. As of period end, TOB Trust Certificates of $960,204,952 are categorized as Level 2 within the disclosure hierarchy.
See notes to financial statements.
| 58 | 2019 BLACKROCK ANNUAL REPORT TO SHAREHOLDERS |
Statements of Assets and Liabilities
May 31, 2019
| BlackRock California Municipal Opportunities Fund |
BlackRock New Jersey Municipal Bond Fund |
BlackRock Pennsylvania Municipal Bond Fund |
BlackRock Strategic Municipal Opportunities Fund |
|||||||||||||
| ASSETS |
| |||||||||||||||
| Investments at value — unaffiliated(a) |
$ | 3,293,162,902 | $ | 325,585,848 | $ | 606,497,270 | $ | 11,779,923,837 | ||||||||
| Investments at value — affiliated(b) |
294,398,265 | 15,940,358 | — | 15,525,620 | ||||||||||||
| Cash |
212,000 | — | — | — | ||||||||||||
| Cash pledged for futures contracts |
16,033,900 | 408,000 | 768,750 | 53,249,800 | ||||||||||||
| Receivables: |
| |||||||||||||||
| Investments sold |
6,689,800 | — | 85,000 | 53,159,997 | ||||||||||||
| Capital shares sold |
16,671,808 | 454,807 | 1,390,660 | 28,880,563 | ||||||||||||
| Dividends — affiliated |
314,348 | 16,465 | 13,519 | 189,750 | ||||||||||||
| Interest — unaffiliated |
34,252,819 | 4,783,554 | 8,236,039 | 142,215,713 | ||||||||||||
| Prepaid expenses |
78,497 | 18,026 | 20,932 | 511,116 | ||||||||||||
|
|
|
|
|
|
|
|
|
|||||||||
| Total assets |
3,661,814,339 | 347,207,058 | 617,012,170 | 12,073,656,396 | ||||||||||||
|
|
|
|
|
|
|
|
|
|||||||||
| ACCRUED LIABILITIES |
| |||||||||||||||
| Bank overdraft |
— | — | 1,868,796 | 749,998 | ||||||||||||
| Payables: |
| |||||||||||||||
| Investments purchased |
55,893,203 | — | 11,553,703 | 198,997,517 | ||||||||||||
| Board realignment and consolidation |
— | 1,572 | 1,614 | — | ||||||||||||
| Capital shares redeemed |
4,100,792 | 335,968 | 1,486,666 | 14,562,856 | ||||||||||||
| Income dividend distributions |
2,143,974 | 421,298 | 869,223 | 8,620,703 | ||||||||||||
| Interest expense and fees |
733,813 | 104,477 | 348,112 | 4,439,258 | ||||||||||||
| Investment advisory fees |
949,109 | 117,993 | 209,694 | 4,049,859 | ||||||||||||
| Trustees’ and Officer’s fees |
5,340 | 793 | 1,155 | 22,990 | ||||||||||||
| Other accrued expenses |
816,891 | 189,279 | 253,367 | 2,974,665 | ||||||||||||
| Other affiliates |
7,952 | 883 | 1,517 | 27,104 | ||||||||||||
| Service and distribution fees |
328,261 | 48,137 | 49,408 | 645,384 | ||||||||||||
| Recoupment of past waived fees |
229,158 | — | — | — | ||||||||||||
| Variation margin on futures contracts |
9,204,926 | 246,453 | 443,766 | 30,947,370 | ||||||||||||
|
|
|
|
|
|
|
|
|
|||||||||
| Total accrued liabilities |
74,413,419 | 1,466,853 | 17,087,021 | 266,037,704 | ||||||||||||
|
|
|
|
|
|
|
|
|
|||||||||
| OTHER LIABILITIES |
| |||||||||||||||
| TOB Trust Certificates |
253,167,157 | 16,418,726 | 64,404,012 | 960,204,952 | ||||||||||||
|
|
|
|
|
|
|
|
|
|||||||||
| Total liabilities |
327,580,576 | 17,885,579 | 81,491,033 | 1,226,242,656 | ||||||||||||
|
|
|
|
|
|
|
|
|
|||||||||
| NET ASSETS |
$ | 3,334,233,763 | $ | 329,321,479 | $ | 535,521,137 | $ | 10,847,413,740 | ||||||||
|
|
|
|
|
|
|
|
|
|||||||||
| NET ASSETS CONSIST OF |
| |||||||||||||||
| Paid-in capital |
$ | 3,276,222,666 | $ | 309,388,749 | $ | 521,491,361 | $ | 10,711,289,141 | ||||||||
| Accumulated earnings |
58,011,097 | 19,932,730 | 14,029,776 | 136,124,599 | ||||||||||||
|
|
|
|
|
|
|
|
|
|||||||||
| NET ASSETS |
$ | 3,334,233,763 | $ | 329,321,479 | $ | 535,521,137 | $ | 10,847,413,740 | ||||||||
|
|
|
|
|
|
|
|
|
|||||||||
| (a) Investments at cost — unaffiliated |
$ | 3,157,629,934 | $ | 300,293,340 | $ | 576,918,281 | $ | 11,327,990,063 | ||||||||
| (b) Investments at cost — affiliated |
$ | 293,306,098 | $ | 15,939,256 | $ | — | $ | 15,525,294 | ||||||||
See notes to financial statements.
| FINANCIAL STATEMENTS | 59 |
Statements of Assets and Liabilities (continued)
May 31, 2019
| BlackRock California Municipal Opportunities Fund |
BlackRock New Jersey Municipal Bond Fund |
BlackRock Pennsylvania Municipal Bond Fund |
BlackRock Strategic Municipal Opportunities Fund |
|||||||||||||
| NET ASSET VALUE |
| |||||||||||||||
| Institutional | ||||||||||||||||
| Net assets |
$ | 2,016,386,812 | $ | 178,715,849 | $ | 379,910,775 | $ | 8,539,776,016 | ||||||||
|
|
|
|
|
|
|
|
|
|||||||||
| Shares outstanding(c) |
158,642,139 | 15,815,703 | 34,185,516 | 730,046,844 | ||||||||||||
|
|
|
|
|
|
|
|
|
|||||||||
| Net asset value |
$ | 12.71 | $ | 11.30 | $ | 11.11 | $ | 11.70 | ||||||||
|
|
|
|
|
|
|
|
|
|||||||||
| Service | ||||||||||||||||
| Net assets |
$ | — | $ | 7,873,605 | $ | 2,079,585 | $ | — | ||||||||
|
|
|
|
|
|
|
|
|
|||||||||
| Shares outstanding(c) |
— | 696,799 | 186,923 | — | ||||||||||||
|
|
|
|
|
|
|
|
|
|||||||||
| Net asset value |
$ | — | $ | 11.30 | $ | 11.13 | $ | — | ||||||||
|
|
|
|
|
|
|
|
|
|||||||||
| Investor A | ||||||||||||||||
| Net assets |
$ | 941,068,876 | $ | 90,055,338 | $ | 110,755,627 | $ | 1,846,093,894 | ||||||||
|
|
|
|
|
|
|
|
|
|||||||||
| Shares outstanding(c) |
74,106,712 | 7,963,162 | 9,954,942 | 157,889,544 | ||||||||||||
|
|
|
|
|
|
|
|
|
|||||||||
| Net asset value |
$ | 12.70 | $ | 11.31 | $ | 11.13 | $ | 11.69 | ||||||||
|
|
|
|
|
|
|
|
|
|||||||||
| Investor A1 | ||||||||||||||||
| Net assets |
$ | 112,553,958 | $ | 19,760,253 | $ | 10,501,738 | $ | 27,605,512 | ||||||||
|
|
|
|
|
|
|
|
|
|||||||||
| Shares outstanding(c) |
8,855,658 | 1,746,695 | 943,576 | 2,360,386 | ||||||||||||
|
|
|
|
|
|
|
|
|
|||||||||
| Net asset value |
$ | 12.71 | $ | 11.31 | $ | 11.13 | $ | 11.70 | ||||||||
|
|
|
|
|
|
|
|
|
|||||||||
| Investor C | ||||||||||||||||
| Net assets |
$ | 150,542,551 | $ | 31,233,533 | $ | 29,936,336 | $ | 307,887,383 | ||||||||
|
|
|
|
|
|
|
|
|
|||||||||
| Shares outstanding(c) |
11,843,000 | 2,764,787 | 2,691,304 | 26,321,805 | ||||||||||||
|
|
|
|
|
|
|
|
|
|||||||||
| Net asset value |
$ | 12.71 | $ | 11.30 | $ | 11.12 | $ | 11.70 | ||||||||
|
|
|
|
|
|
|
|
|
|||||||||
| Investor C1 | ||||||||||||||||
| Net assets |
$ | 201,927 | $ | 22,518 | $ | 8,252 | $ | — | ||||||||
|
|
|
|
|
|
|
|
|
|||||||||
| Shares outstanding(c) |
15,891 | 1,993 | 743 | — | ||||||||||||
|
|
|
|
|
|
|
|
|
|||||||||
| Net asset value |
$ | 12.71 | $ | 11.30 | $ | 11.11 | $ | — | ||||||||
|
|
|
|
|
|
|
|
|
|||||||||
| Class K | ||||||||||||||||
| Net assets |
$ | 113,479,639 | $ | 1,660,383 | $ | 2,328,824 | $ | 126,050,935 | ||||||||
|
|
|
|
|
|
|
|
|
|||||||||
| Shares outstanding(c) |
8,924,898 | 146,997 | 209,571 | 10,774,788 | ||||||||||||
|
|
|
|
|
|
|
|
|
|||||||||
| Net asset value |
$ | 12.71 | $ | 11.30 | $ | 11.11 | $ | 11.70 | ||||||||
|
|
|
|
|
|
|
|
|
|||||||||
| (c) Unlimited number of shares authorized, $0.10 par value |
||||||||||||||||
See notes to financial statements.
| 60 | 2019 BLACKROCK ANNUAL REPORT TO SHAREHOLDERS |
Year Ended May 31, 2019
| BlackRock California Municipal Opportunities Fund |
BlackRock New Jersey Municipal Bond Fund |
BlackRock Pennsylvania Municipal Bond Fund |
BlackRock Strategic Municipal Opportunities Fund |
|||||||||||||
| INVESTMENT INCOME |
| |||||||||||||||
| Dividends — affiliated |
$ | 3,763,946 | $ | 159,329 | $ | 93,613 | $ | 5,325,689 | ||||||||
| Dividends — unaffiliated |
— | — | — | 586,424 | ||||||||||||
| Interest — unaffiliated |
84,282,960 | 12,581,561 | 23,819,468 | 341,660,174 | ||||||||||||
|
|
|
|
|
|
|
|
|
|||||||||
| Total investment income |
88,046,906 | 12,740,890 | 23,913,081 | 347,572,287 | ||||||||||||
|
|
|
|
|
|
|
|
|
|||||||||
| EXPENSES |
| |||||||||||||||
| Investment advisory |
9,774,668 | 1,544,662 | 2,608,298 | 45,562,871 | ||||||||||||
| Service and distribution — class specific |
3,388,163 | 529,809 | 570,138 | 6,925,863 | ||||||||||||
| Transfer agent — class specific |
1,170,240 | 255,344 | 619,289 | 5,890,834 | ||||||||||||
| Accounting services |
320,667 | 67,914 | 100,235 | 926,060 | ||||||||||||
| Registration |
279,336 | 33,601 | 31,629 | 1,223,748 | ||||||||||||
| Recoupment of past waived and/or reimbursed fees — class specific |
189,175 | — | — | — | ||||||||||||
| Professional |
98,078 | 63,751 | 67,657 | 172,525 | ||||||||||||
| Printing |
74,688 | 33,771 | 36,470 | 53,354 | ||||||||||||
| Custodian |
57,763 | 5,180 | 12,168 | 169,972 | ||||||||||||
| Trustees and Officer |
38,498 | 9,072 | 11,508 | 114,350 | ||||||||||||
| Offering |
23,150 | 17,767 | 19,542 | 26,315 | ||||||||||||
| Board realignment and consolidation |
17,524 | 4,797 | 6,859 | 72,628 | ||||||||||||
| Recoupment of past waived and/or reimbursed fees |
16,727 | — | — | — | ||||||||||||
| Miscellaneous |
89,189 | 41,978 | 45,206 | 329,438 | ||||||||||||
|
|
|
|
|
|
|
|
|
|||||||||
| Total expenses excluding interest expense and fees |
15,537,866 | 2,607,646 | 4,128,999 | 61,467,958 | ||||||||||||
| Interest expense and fees(a) |
4,498,876 | 368,945 | 1,502,371 | 20,069,721 | ||||||||||||
|
|
|
|
|
|
|
|
|
|||||||||
| Total expenses |
20,036,742 | 2,976,591 | 5,631,370 | 81,537,679 | ||||||||||||
| Less: |
| |||||||||||||||
| Fees waived and/or reimbursed by the Manager |
(459,967 | ) | (421,388 | ) | (474,722 | ) | (5,197,032 | ) | ||||||||
| Transfer agent fees waived and/or reimbursed — class specific |
(20,306 | ) | (109,317 | ) | (369,830 | ) | — | |||||||||
|
|
|
|
|
|
|
|
|
|||||||||
| Total expenses after fees waived and/or reimbursed |
19,556,469 | 2,445,886 | 4,786,818 | 76,340,647 | ||||||||||||
|
|
|
|
|
|
|
|
|
|||||||||
| Net investment income |
68,490,437 | 10,295,004 | 19,126,263 | 271,231,640 | ||||||||||||
|
|
|
|
|
|
|
|
|
|||||||||
| REALIZED AND UNREALIZED GAIN (LOSS) |
| |||||||||||||||
| Net realized gain (loss) from: |
| |||||||||||||||
| Investments — unaffiliated |
27,025,766 | (411,444 | ) | 360,024 | 26,765,805 | |||||||||||
| Investments — affiliated |
(75,790 | ) | 1,202 | 1,463 | (3,087,811 | ) | ||||||||||
| Futures contracts |
(76,470,437 | ) | (2,490,449 | ) | (4,197,684 | ) | (239,477,136 | ) | ||||||||
| Capital gain distributions from investment companies — affiliated |
— | 175 | 66 | 6,077 | ||||||||||||
|
|
|
|
|
|
|
|
|
|||||||||
| (49,520,461 | ) | (2,900,516 | ) | (3,836,131 | ) | (215,793,065 | ) | |||||||||
|
|
|
|
|
|
|
|
|
|||||||||
| Net change in unrealized appreciation (depreciation) on: |
| |||||||||||||||
| Investments — unaffiliated |
102,627,876 | 10,135,784 | 10,261,542 | 364,014,708 | ||||||||||||
| Investments — affiliated |
885,414 | 606 | (827 | ) | (1,205,417 | ) | ||||||||||
| Futures contracts |
(2,193,285 | ) | (86,994 | ) | (174,646 | ) | (745,761 | ) | ||||||||
|
|
|
|
|
|
|
|
|
|||||||||
| 101,320,005 | 10,049,396 | 10,086,069 | 362,063,530 | |||||||||||||
|
|
|
|
|
|
|
|
|
|||||||||
| Net realized and unrealized gain |
51,799,544 | 7,148,880 | 6,249,938 | 146,270,465 | ||||||||||||
|
|
|
|
|
|
|
|
|
|||||||||
| NET INCREASE IN NET ASSETS RESULTING FROM OPERATIONS |
$ | 120,289,981 | $ | 17,443,884 | $ | 25,376,201 | $ | 417,502,105 | ||||||||
|
|
|
|
|
|
|
|
|
|||||||||
| (a) | Related to TOB Trusts. |
See notes to financial statements.
| FINANCIAL STATEMENTS | 61 |
Statements of Changes in Net Assets
| BlackRock California Municipal Opportunities Fund |
BlackRock New Jersey Municipal Bond Fund |
|||||||||||||||||||
| Year Ended May 31, | Year Ended May 31, | |||||||||||||||||||
| 2019 | 2018 | 2019 | 2018 | |||||||||||||||||
| INCREASE (DECREASE) IN NET ASSETS |
|
|||||||||||||||||||
| OPERATIONS |
|
|||||||||||||||||||
| Net investment income |
$ | 68,490,437 | $ | 41,350,990 | $ | 10,295,004 | $ | 9,846,571 | ||||||||||||
| Net realized gain (loss) |
(49,520,461 | ) | 45,057,540 | (2,900,516 | ) | 1,809,015 | ||||||||||||||
| Net change in unrealized appreciation (depreciation) |
101,320,005 | (18,478,872 | ) | 10,049,396 | (2,081,650 | ) | ||||||||||||||
|
|
|
|
|
|
|
|
|
|||||||||||||
| Net increase in net assets resulting from operations |
120,289,981 | 67,929,658 | 17,443,884 | 9,573,936 | ||||||||||||||||
|
|
|
|
|
|
|
|
|
|||||||||||||
| DISTRIBUTIONS TO SHAREHOLDERS(a)(b) |
|
|||||||||||||||||||
| Institutional |
(72,422,029 | ) | (26,318,008 | ) | (5,875,681 | ) | (5,466,207 | ) | ||||||||||||
| Service |
— | — | (259,059 | ) | (279,012 | ) | ||||||||||||||
| Investor A |
(33,319,192 | ) | (14,115,090 | ) | (2,658,015 | ) | (2,579,621 | ) | ||||||||||||
| Investor A1 |
(5,086,830 | ) | (3,591,749 | ) | (708,382 | ) | (756,468 | ) | ||||||||||||
| Investor C |
(4,866,719 | ) | (2,341,538 | ) | (779,858 | ) | (759,230 | ) | ||||||||||||
| Investor C1 |
(26,910 | ) | (63,344 | ) | (18,740 | ) | (41,155 | ) | ||||||||||||
| Class K |
(2,475,633 | ) | (64,324 | ) | (65,270 | ) | (13,422 | ) | ||||||||||||
|
|
|
|
|
|
|
|
|
|||||||||||||
| Decrease in net assets resulting from distributions to shareholders |
(118,197,313 | ) | (46,494,053 | ) | (10,365,005 | ) | (9,895,115 | ) | ||||||||||||
|
|
|
|
|
|
|
|
|
|||||||||||||
| CAPITAL SHARE TRANSACTIONS |
|
|||||||||||||||||||
| Net increase in net assets derived from capital share transactions |
1,228,955,798 | 789,622,883 | 35,829,294 | 4,258,527 | ||||||||||||||||
|
|
|
|
|
|
|
|
|
|||||||||||||
| NET ASSETS(b) |
|
|||||||||||||||||||
| Total increase in net assets |
1,231,048,466 | 811,058,488 | 42,908,173 | 3,937,348 | ||||||||||||||||
| Beginning of year |
2,103,185,297 | 1,292,126,809 | 286,413,306 | 282,475,958 | ||||||||||||||||
|
|
|
|
|
|
|
|
|
|||||||||||||
| End of year |
$ | 3,334,233,763 | $ | 2,103,185,297 | $ | 329,321,479 | $ | 286,413,306 | ||||||||||||
|
|
|
|
|
|
|
|
|
|||||||||||||
| (a) | Distributions for annual periods determined in accordance with U.S. federal income tax regulations. |
| (b) | Prior year distribution character information and undistributed net investment income has been modified or removed to conform with current year Regulation S-X presentation changes. Refer to Note 12 for this prior year information. |
See notes to financial statements.
| 62 | 2019 BLACKROCK ANNUAL REPORT TO SHAREHOLDERS |
Statements of Changes in Net Assets (continued)
| BlackRock Pennsylvania Municipal Bond Fund |
BlackRock Strategic Municipal Opportunities Fund |
|||||||||||||||||||
| Year Ended May 31, | Year Ended May 31, | |||||||||||||||||||
| 2019 | 2018 | 2019 | 2018 | |||||||||||||||||
| INCREASE (DECREASE) IN NET ASSETS |
||||||||||||||||||||
| OPERATIONS |
||||||||||||||||||||
| Net investment income |
$ | 19,126,263 | $ | 19,326,577 | $ | 271,231,640 | $ | 161,179,703 | ||||||||||||
| Net realized gain (loss) |
(3,836,131 | ) | 1,185,927 | (215,793,065 | ) | 144,732,946 | ||||||||||||||
| Net change in unrealized appreciation (depreciation) |
10,086,069 | (11,247,491 | ) | 362,063,530 | (52,826,778 | ) | ||||||||||||||
|
|
|
|
|
|
|
|
|
|||||||||||||
| Net increase in net assets resulting from operations |
25,376,201 | 9,265,013 | 417,502,105 | 253,085,871 | ||||||||||||||||
|
|
|
|
|
|
|
|
|
|||||||||||||
| DISTRIBUTIONS TO SHAREHOLDERS(a)(b) |
||||||||||||||||||||
| Institutional |
(14,043,437 | ) | (13,256,749 | ) | (334,041,445 | ) | (122,949,305 | ) | ||||||||||||
| Service |
(63,405 | ) | (58,703 | ) | — | — | ||||||||||||||
| Investor A |
(3,640,257 | ) | (4,371,905 | ) | (72,684,296 | ) | (31,688,920 | ) | ||||||||||||
| Investor A1 |
(449,183 | ) | (578,208 | ) | (1,316,283 | ) | (826,386 | ) | ||||||||||||
| Investor C |
(890,655 | ) | (1,019,422 | ) | (10,659,763 | ) | (4,744,212 | ) | ||||||||||||
| Investor C1 |
(25,025 | ) | (54,763 | ) | — | — | ||||||||||||||
| Class K |
(89,471 | ) | (19,222 | ) | (4,089,237 | ) | (286,704 | ) | ||||||||||||
|
|
|
|
|
|
|
|
|
|||||||||||||
| Decrease in net assets resulting from distributions to shareholders |
(19,201,433 | ) | (19,358,972 | ) | (422,791,024 | ) | (160,495,527 | ) | ||||||||||||
|
|
|
|
|
|
|
|
|
|||||||||||||
| CAPITAL SHARE TRANSACTIONS |
||||||||||||||||||||
| Net increase in net assets derived from capital share transactions |
22,898,530 | 35,884,999 | 3,257,020,457 | 2,658,424,815 | ||||||||||||||||
|
|
|
|
|
|
|
|
|
|||||||||||||
| NET ASSETS(b) |
||||||||||||||||||||
| Total increase in net assets |
29,073,298 | 25,791,040 | 3,251,731,538 | 2,751,015,159 | ||||||||||||||||
| Beginning of year |
506,447,839 | 480,656,799 | 7,595,682,202 | 4,844,667,043 | ||||||||||||||||
|
|
|
|
|
|
|
|
|
|||||||||||||
| End of year |
$ | 535,521,137 | $ | 506,447,839 | $ | 10,847,413,740 | $ | 7,595,682,202 | ||||||||||||
|
|
|
|
|
|
|
|
|
|||||||||||||
| (a) | Distributions for annual periods determined in accordance with U.S. federal income tax regulations. |
| (b) | Prior year distribution character information and undistributed net investment income has been modified or removed to conform with current year Regulation S-X presentation changes. Refer to Note 12 for this prior year information. |
See notes to financial statements.
| FINANCIAL STATEMENTS | 63 |
Year Ended May 31, 2019
| BlackRock Pennsylvania Municipal Bond Fund |
||||
| CASH PROVIDED BY OPERATING ACTIVITIES |
| |||
| Net increase in net assets resulting from operations |
$ | 25,376,201 | ||
| Adjustments to reconcile net increase in net assets resulting from operations to net cash provided by operating activities: |
| |||
| Proceeds from sales of long-term investments |
131,863,880 | |||
| Purchases of long-term investments |
(156,726,984 | ) | ||
| Net proceeds from sales of short-term securities |
8,269,105 | |||
| Amortization of premium and accretion of discount on investments and other fees |
2,201,641 | |||
| Net realized (gain) on investments |
(361,487 | ) | ||
| Net unrealized (appreciation) on investments |
(10,260,715 | ) | ||
| (Increase) Decrease in Assets: |
| |||
| Receivables: |
| |||
| Dividends — affiliated |
2,990 | |||
| Interest — unaffiliated |
(328,036 | ) | ||
| Prepaid expenses |
(6,674 | ) | ||
| Deferred offering costs |
27,534 | |||
| Increase (Decrease) in Liabilities: |
| |||
| Payables: |
| |||
| Board realignment and consolidation |
(384 | ) | ||
| Interest expense and fees |
53,277 | |||
| Investment advisory fees |
41,897 | |||
| Trustees’ and Officer’s fees |
(1,510 | ) | ||
| Other accrued expenses |
49,106 | |||
| Other affiliates |
181 | |||
| Service and distribution fees |
(780 | ) | ||
| Variation margin on futures contracts |
363,735 | |||
|
|
|
|||
| Net cash provided by operating activities |
562,977 | |||
|
|
|
|||
| CASH PROVIDED BY (USED FOR) FINANCING ACTIVITIES |
| |||
| Cash dividends paid to shareholders |
(9,119,008 | ) | ||
| Payments for offering costs |
(15,640 | ) | ||
| Repayments of TOB Trust Certificates |
(40,916,302 | ) | ||
| Repayments of Loan for TOB Trust Certificates |
(16,995,099 | ) | ||
| Payments on redemption of capital shares |
(131,222,921 | ) | ||
| Proceeds from TOB Trust Certificates |
35,121,640 | |||
| Proceeds from Loan for TOB Trust Certificates |
16,995,099 | |||
| Increase in bank overdraft |
1,868,796 | |||
| Proceeds from issuance of capital shares |
143,950,802 | |||
|
|
|
|||
| Net cash (used for) financing activities |
(332,633 | ) | ||
|
|
|
|||
| CASH |
| |||
| Net increase in restricted and unrestricted cash |
230,344 | |||
| Restricted and unrestricted cash at beginning of year |
538,406 | |||
|
|
|
|||
| Restricted and unrestricted cash at end of year |
$ | 768,750 | ||
|
|
|
|||
| SUPPLEMENTAL DISCLOSURE OF CASH FLOW INFORMATION |
| |||
| Cash paid during the year for interest expense |
$ | 1,449,094 | ||
|
|
|
|||
| NON-CASH FINANCING ACTIVITIES |
| |||
| Capital shares issued in reinvestment of distributions paid to shareholders |
$ | 9,310,694 | ||
|
|
|
|||
| RECONCILIATION OF RESTRICTED AND UNRESTRICTED CASH AT THE END OF YEAR TO THE STATEMENTS OF ASSETS AND LIABILITIES |
| |||
| Cash pledged: |
| |||
| Futures contracts |
$ | 768,750 | ||
|
|
|
|||
| RECONCILIATION OF RESTRICTED AND UNRESTRICTED CASH AT THE BEGINNING OF YEAR TO THE STATEMENTS OF ASSETS AND LIABILITIES |
| |||
| Cash |
$ | 170,656 | ||
| Cash pledged: |
| |||
| Futures contracts |
367,750 | |||
|
|
|
|||
| $ | 538,406 | |||
|
|
|
|||
See notes to financial statements.
| 64 | 2019 BLACKROCK ANNUAL REPORT TO SHAREHOLDERS |
(For a share outstanding throughout each period)
| BlackRock California Municipal Opportunities Fund | ||||||||||||||||||||
| Institutional | ||||||||||||||||||||
| Year Ended May 31, | ||||||||||||||||||||
| 2019 | 2018 | 2017 | 2016 | 2015 | ||||||||||||||||
| Net asset value, beginning of year |
$ | 12.76 | $ | 12.60 | $ | 12.73 | $ | 12.33 | $ | 12.22 | ||||||||||
|
|
|
|
|
|
|
|
|
|
|
|||||||||||
| Net investment income(a) |
0.34 | 0.34 | 0.36 | 0.39 | 0.43 | |||||||||||||||
| Net realized and unrealized gain (loss) |
0.19 | 0.20 | (0.13 | ) | 0.40 | 0.11 | ||||||||||||||
|
|
|
|
|
|
|
|
|
|
|
|||||||||||
| Net increase from investment operations |
0.53 | 0.54 | 0.23 | 0.79 | 0.54 | |||||||||||||||
|
|
|
|
|
|
|
|
|
|
|
|||||||||||
| Distributions(b) |
||||||||||||||||||||
| From net investment income |
(0.34 | ) | (0.34 | ) | (0.36 | ) | (0.39 | ) | (0.43 | ) | ||||||||||
| From net realized gain |
(0.24 | ) | (0.04 | ) | — | — | — | |||||||||||||
|
|
|
|
|
|
|
|
|
|
|
|||||||||||
| Total distributions |
(0.58 | ) | (0.38 | ) | (0.36 | ) | (0.39 | ) | (0.43 | ) | ||||||||||
|
|
|
|
|
|
|
|
|
|
|
|||||||||||
| Net asset value, end of year |
$ | 12.71 | $ | 12.76 | $ | 12.60 | $ | 12.73 | $ | 12.33 | ||||||||||
|
|
|
|
|
|
|
|
|
|
|
|||||||||||
| Total Return(c) |
||||||||||||||||||||
| Based on net asset value |
4.28 | % | 4.37 | % | 1.88 | % | 6.54 | % | 4.46 | % | ||||||||||
|
|
|
|
|
|
|
|
|
|
|
|||||||||||
| Ratios to Average Net Assets(d) |
||||||||||||||||||||
| Total expenses(e) |
0.63 | % | 0.57 | % | 0.61 | % | 0.68 | % | 0.73 | % | ||||||||||
|
|
|
|
|
|
|
|
|
|
|
|||||||||||
| Total expenses after fees waived and/or reimbursed and paid indirectly |
0.61 | % | 0.54 | % | 0.54 | % | 0.66 | % | 0.68 | % | ||||||||||
|
|
|
|
|
|
|
|
|
|
|
|||||||||||
| Total expenses after fees waived and/or reimbursed and paid indirectly and excluding interest expense and fees, and amortization of offering costs(f) |
0.44 | % | 0.44 | % | 0.46 | % | 0.62 | % | 0.64 | % | ||||||||||
|
|
|
|
|
|
|
|
|
|
|
|||||||||||
| Net investment income |
2.70 | % | 2.68 | % | 2.88 | % | 3.10 | % | 3.49 | % | ||||||||||
|
|
|
|
|
|
|
|
|
|
|
|||||||||||
| Supplemental Data |
||||||||||||||||||||
| Net assets, end of year (000) |
$ | 2,016,387 | $ | 1,190,045 | $ | 611,571 | $ | 494,888 | $ | 315,431 | ||||||||||
|
|
|
|
|
|
|
|
|
|
|
|||||||||||
| Borrowings outstanding, end of year (000) |
$ | 253,167 | $ | 141,267 | $ | 60,642 | $ | 40,310 | $ | 69,453 | ||||||||||
|
|
|
|
|
|
|
|
|
|
|
|||||||||||
| Portfolio turnover rate |
126 | % | 129 | % | 142 | % | 119 | % | 70 | % | ||||||||||
|
|
|
|
|
|
|
|
|
|
|
|||||||||||
| (a) | Based on average shares outstanding. |
| (b) | Distributions for annual periods determined in accordance with U.S. federal income tax regulations. |
| (c) | Where applicable, assumes the reinvestment of distributions. |
| (d) | Excludes expenses incurred indirectly as a result of investments in underlying funds as follows: |
| For the Year Ended May 31, | ||||||||||||||||||||||||||||||||||||||||
| 2019 | 2018 | 2017 | 2016 | 2015 | ||||||||||||||||||||||||||||||||||||
| Investments in underlying funds |
0.02 | % | 0.01 | % | 0.01 | % | — | % | — | % | ||||||||||||||||||||||||||||||
|
|
|
|
|
|
|
|
|
|
|
|||||||||||||||||||||||||||||||
| (e) | Includes recoupment of past waived and/or reimbursed fees. Excluding the recoupment of past waived and/or reimbursed fees, the expense ratios were as follows: |
| For the Year Ended May 31, | ||||||||||||||||||||||||||||||||||||||||
| 2019 | 2018 | 2017 | 2016 | 2015 | ||||||||||||||||||||||||||||||||||||
| Expense ratios |
0.62 | % | 0.57 | % | N/A | 0.68 | % | N/A | ||||||||||||||||||||||||||||||||
|
|
|
|
|
|
|
|
|
|
|
|||||||||||||||||||||||||||||||
| (f) | Interest expense and fees relate to TOB Trusts. See Note 4 of the Notes to Financial Statements for details. |
See notes to financial statements.
| FINANCIAL HIGHLIGHTS | 65 |
Financial Highlights (continued)
(For a share outstanding throughout each period)
| BlackRock California Municipal Opportunities Fund (continued) | ||||||||||||||||||||
| Investor A | ||||||||||||||||||||
| Year Ended May 31, | ||||||||||||||||||||
| 2019 | 2018 | 2017 | 2016 | 2015 | ||||||||||||||||
| Net asset value, beginning of year |
$ | 12.75 | $ | 12.58 | $ | 12.71 | $ | 12.32 | $ | 12.21 | ||||||||||
|
|
|
|
|
|
|
|
|
|
|
|||||||||||
| Net investment income(a) |
0.31 | 0.31 | 0.33 | 0.36 | 0.40 | |||||||||||||||
| Net realized and unrealized gain (loss) |
0.19 | 0.21 | (0.13 | ) | 0.40 | 0.11 | ||||||||||||||
|
|
|
|
|
|
|
|
|
|
|
|||||||||||
| Net increase from investment operations |
0.50 | 0.52 | 0.20 | 0.76 | 0.51 | |||||||||||||||
|
|
|
|
|
|
|
|
|
|
|
|||||||||||
| Distributions(b) |
||||||||||||||||||||
| From net investment income |
(0.31 | ) | (0.31 | ) | (0.33 | ) | (0.37 | ) | (0.40 | ) | ||||||||||
| From net realized gain |
(0.24 | ) | (0.04 | ) | — | — | — | |||||||||||||
|
|
|
|
|
|
|
|
|
|
|
|||||||||||
| Total distributions |
(0.55 | ) | (0.35 | ) | (0.33 | ) | (0.37 | ) | (0.40 | ) | ||||||||||
|
|
|
|
|
|
|
|
|
|
|
|||||||||||
| Net asset value, end of year |
$ | 12.70 | $ | 12.75 | $ | 12.58 | $ | 12.71 | $ | 12.32 | ||||||||||
|
|
|
|
|
|
|
|
|
|
|
|||||||||||
| Total Return(c) |
||||||||||||||||||||
| Based on net asset value |
4.02 | % | 4.19 | % | 1.63 | % | 6.23 | % | 4.25 | % | ||||||||||
|
|
|
|
|
|
|
|
|
|
|
|||||||||||
| Ratios to Average Net Assets(d) |
||||||||||||||||||||
| Total expenses |
0.88 | %(e) | 0.81 | %(e) | 0.85 | %(e) | 0.93 | % | 0.95 | % | ||||||||||
|
|
|
|
|
|
|
|
|
|
|
|||||||||||
| Total expenses after fees waived and/or reimbursed and paid indirectly |
0.86 | % | 0.79 | % | 0.79 | % | 0.88 | % | 0.88 | % | ||||||||||
|
|
|
|
|
|
|
|
|
|
|
|||||||||||
| Total expenses after fees waived and/or reimbursed and paid indirectly and excluding interest expense and fees, and amortization of offering costs(f) |
0.69 | % | 0.69 | % | 0.71 | % | 0.84 | % | 0.84 | % | ||||||||||
|
|
|
|
|
|
|
|
|
|
|
|||||||||||
| Net investment income |
2.45 | % | 2.45 | % | 2.64 | % | 2.87 | % | 3.28 | % | ||||||||||
|
|
|
|
|
|
|
|
|
|
|
|||||||||||
| Supplemental Data |
||||||||||||||||||||
| Net assets, end of year (000) |
$ | 941,069 | $ | 631,410 | $ | 438,543 | $ | 364,093 | $ | 178,774 | ||||||||||
|
|
|
|
|
|
|
|
|
|
|
|||||||||||
| Borrowings outstanding, end of year (000) |
$ | 253,167 | $ | 141,267 | $ | 60,642 | $ | 40,310 | $ | 69,453 | ||||||||||
|
|
|
|
|
|
|
|
|
|
|
|||||||||||
| Portfolio turnover rate |
126 | % | 129 | % | 142 | % | 119 | % | 70 | % | ||||||||||
|
|
|
|
|
|
|
|
|
|
|
|||||||||||
| (a) | Based on average shares outstanding. |
| (b) | Distributions for annual periods determined in accordance with U.S. federal income tax regulations. |
| (c) | Where applicable, excludes the effects of any sales charges and assumes the reinvestment of distributions. |
| (d) | Excludes expenses incurred indirectly as a result of investments in underlying funds as follows: |
| For the Year Ended May 31, | ||||||||||||||||||||||||||||||||||||||||
| 2019 | 2018 | 2017 | 2016 | 2015 | ||||||||||||||||||||||||||||||||||||
| Investments in underlying funds |
0.02 | % | 0.01 | % | 0.01 | % | — | % | — | % | ||||||||||||||||||||||||||||||
|
|
|
|
|
|
|
|
|
|
|
|||||||||||||||||||||||||||||||
| (e) | Includes recoupment of past waived and/or reimbursed fees with no financial impact to the expense ratio. |
| (f) | Interest expense and fees relate to TOB Trusts. See Note 4 of the Notes to Financial Statements for details. |
See notes to financial statements.
| 66 | 2019 BLACKROCK ANNUAL REPORT TO SHAREHOLDERS |
Financial Highlights (continued)
(For a share outstanding throughout each period)
| BlackRock California Municipal Opportunities Fund (continued) | ||||||||||||||||||||
| Investor A1 | ||||||||||||||||||||
| Year Ended May 31, | ||||||||||||||||||||
| 2019 | 2018 | 2017 | 2016 | 2015 | ||||||||||||||||
| Net asset value, beginning of year |
$ | 12.76 | $ | 12.59 | $ | 12.72 | $ | 12.33 | $ | 12.23 | ||||||||||
|
|
|
|
|
|
|
|
|
|
|
|||||||||||
| Net investment income(a) |
0.33 | 0.33 | 0.35 | 0.38 | 0.42 | |||||||||||||||
| Net realized and unrealized gain (loss) |
0.19 | 0.21 | (0.13 | ) | 0.39 | 0.10 | ||||||||||||||
|
|
|
|
|
|
|
|
|
|
|
|||||||||||
| Net increase from investment operations |
0.52 | 0.54 | 0.22 | 0.77 | 0.52 | |||||||||||||||
|
|
|
|
|
|
|
|
|
|
|
|||||||||||
| Distributions(b) |
||||||||||||||||||||
| From net investment income |
(0.33 | ) | (0.33 | ) | (0.35 | ) | (0.38 | ) | (0.42 | ) | ||||||||||
| From net realized gain |
(0.24 | ) | (0.04 | ) | — | — | — | |||||||||||||
|
|
|
|
|
|
|
|
|
|
|
|||||||||||
| Total dividends and distributions |
(0.57 | ) | (0.37 | ) | (0.35 | ) | (0.38 | ) | (0.42 | ) | ||||||||||
|
|
|
|
|
|
|
|
|
|
|
|||||||||||
| Net asset value, end of year |
$ | 12.71 | $ | 12.76 | $ | 12.59 | $ | 12.72 | $ | 12.33 | ||||||||||
|
|
|
|
|
|
|
|
|
|
|
|||||||||||
| Total Return(c) |
||||||||||||||||||||
| Based on net asset value |
4.18 | % | 4.35 | % | 1.78 | % | 6.35 | % | 4.29 | % | ||||||||||
|
|
|
|
|
|
|
|
|
|
|
|||||||||||
| Ratios to Average Net Assets(d) |
||||||||||||||||||||
| Total expenses(e) |
0.72 | % | 0.66 | % | 0.70 | % | 0.79 | % | 0.81 | % | ||||||||||
|
|
|
|
|
|
|
|
|
|
|
|||||||||||
| Total expenses after fees waived and/or reimbursed and paid indirectly |
0.70 | % | 0.64 | % | 0.64 | % | 0.77 | % | 0.77 | % | ||||||||||
|
|
|
|
|
|
|
|
|
|
|
|||||||||||
| Total expenses after fees waived and/or reimbursed and paid indirectly and excluding interest expense and fees and, amortization of offering costs(f) |
0.53 | % | 0.54 | % | 0.56 | % | 0.72 | % | 0.73 | % | ||||||||||
|
|
|
|
|
|
|
|
|
|
|
|||||||||||
| Net investment income |
2.61 | % | 2.61 | % | 2.78 | % | 3.06 | % | 3.39 | % | ||||||||||
|
|
|
|
|
|
|
|
|
|
|
|||||||||||
| Supplemental Data |
||||||||||||||||||||
| Net assets, end of year (000) |
$ | 112,554 | $ | 118,780 | $ | 126,274 | $ | 139,805 | $ | 143,879 | ||||||||||
|
|
|
|
|
|
|
|
|
|
|
|||||||||||
| Borrowings outstanding, end of year (000) |
$ | 253,167 | $ | 141,267 | $ | 60,642 | $ | 40,310 | $ | 69,453 | ||||||||||
|
|
|
|
|
|
|
|
|
|
|
|||||||||||
| Portfolio turnover rate |
126 | % | 129 | % | 142 | % | 119 | % | 70 | % | ||||||||||
|
|
|
|
|
|
|
|
|
|
|
|||||||||||
| (a) | Based on average shares outstanding. |
| (b) | Distributions for annual periods determined in accordance with U.S. federal income tax regulations. |
| (c) | Where applicable, excludes the effects of any sales charges and assumes the reinvestment of distributions. |
| (d) | Excludes expenses incurred indirectly as a result of investments in underlying funds as follows: |
| For the Year Ended May 31, | ||||||||||||||||||||||||||||||||||||||||
| 2019 | 2018 | 2017 | 2016 | 2015 | ||||||||||||||||||||||||||||||||||||
| Investments in underlying funds |
0.02 | % | 0.01 | % | 0.01 | % | — | % | — | % | ||||||||||||||||||||||||||||||
|
|
|
|
|
|
|
|
|
|
|
|||||||||||||||||||||||||||||||
| (e) | Includes recoupment of past waived and/or reimbursed fees. Excluding the recoupment of past waived and/or reimbursed fees, the expense ratios were as follows: |
| For the Year Ended May 31, | ||||||||||||||||||||||||||||||||||||||||
| 2019 | 2018 | 2017 | 2016 | 2015 | ||||||||||||||||||||||||||||||||||||
| Expense ratios |
0.71 | % | 0.66 | % | N/A | N/A | N/A | |||||||||||||||||||||||||||||||||
|
|
|
|
|
|
|
|
|
|
|
|||||||||||||||||||||||||||||||
| (f) | Interest expense and fees relate to TOB Trusts. See Note 4 of the Notes to Financial Statements for details. |
See notes to financial statements.
| FINANCIAL HIGHLIGHTS | 67 |
Financial Highlights (continued)
(For a share outstanding throughout each period)
| BlackRock California Municipal Opportunities Fund (continued) | ||||||||||||||||||||
| Investor C | ||||||||||||||||||||
| Year Ended May 31, | ||||||||||||||||||||
| 2019 | 2018 | 2017 | 2016 | 2015 | ||||||||||||||||
| Net asset value, beginning of year |
$ | 12.76 | $ | 12.60 | $ | 12.73 | $ | 12.33 | $ | 12.23 | ||||||||||
|
|
|
|
|
|
|
|
|
|
|
|||||||||||
| Net investment income(a) |
0.21 | 0.22 | 0.24 | 0.27 | 0.31 | |||||||||||||||
| Net realized and unrealized gain (loss) |
0.19 | 0.20 | (0.13 | ) | 0.40 | 0.10 | ||||||||||||||
|
|
|
|
|
|
|
|
|
|
|
|||||||||||
| Net increase from investment operations |
0.40 | 0.42 | 0.11 | 0.67 | 0.41 | |||||||||||||||
|
|
|
|
|
|
|
|
|
|
|
|||||||||||
| Distributions(b) |
||||||||||||||||||||
| From net investment income |
(0.21 | ) | (0.22 | ) | (0.24 | ) | (0.27 | ) | (0.31 | ) | ||||||||||
| From net realized gain |
(0.24 | ) | (0.04 | ) | — | — | — | |||||||||||||
|
|
|
|
|
|
|
|
|
|
|
|||||||||||
| Total distributions |
(0.45 | ) | (0.26 | ) | (0.24 | ) | (0.27 | ) | (0.31 | ) | ||||||||||
|
|
|
|
|
|
|
|
|
|
|
|||||||||||
| Net asset value, end of year |
$ | 12.71 | $ | 12.76 | $ | 12.60 | $ | 12.73 | $ | 12.33 | ||||||||||
|
|
|
|
|
|
|
|
|
|
|
|||||||||||
| Total Return(c) |
||||||||||||||||||||
| Based on net asset value |
3.24 | % | 3.33 | % | 0.87 | % | 5.51 | % | 3.38 | % | ||||||||||
|
|
|
|
|
|
|
|
|
|
|
|||||||||||
| Ratios to Average Net Assets(d) |
||||||||||||||||||||
| Total expenses |
1.63 | %(e) | 1.57 | %(e) | 1.61 | %(e) | 1.70 | % | 1.72 | % | ||||||||||
|
|
|
|
|
|
|
|
|
|
|
|||||||||||
| Total expenses after fees waived and/or reimbursed and paid indirectly |
1.61 | % | 1.54 | % | 1.54 | % | 1.64 | % | 1.64 | % | ||||||||||
|
|
|
|
|
|
|
|
|
|
|
|||||||||||
| Total expenses after fees waived and/or reimbursed and paid indirectly and excluding interest expense and fees, and amortization of offering costs(f) |
1.44 | % | 1.44 | % | 1.46 | % | 1.60 | % | 1.60 | % | ||||||||||
|
|
|
|
|
|
|
|
|
|
|
|||||||||||
| Net investment income |
1.70 | % | 1.70 | % | 1.89 | % | 2.14 | % | 2.52 | % | ||||||||||
|
|
|
|
|
|
|
|
|
|
|
|||||||||||
| Supplemental Data |
||||||||||||||||||||
| Net assets, end of year (000) |
$ | 150,543 | $ | 124,032 | $ | 112,978 | $ | 103,993 | $ | 67,789 | ||||||||||
|
|
|
|
|
|
|
|
|
|
|
|||||||||||
| Borrowings outstanding, end of year (000) |
$ | 253,167 | $ | 141,267 | $ | 60,642 | $ | 40,310 | $ | 69,453 | ||||||||||
|
|
|
|
|
|
|
|
|
|
|
|||||||||||
| Portfolio turnover rate |
126 | % | 129 | % | 142 | % | 119 | % | 70 | % | ||||||||||
|
|
|
|
|
|
|
|
|
|
|
|||||||||||
| (a) | Based on average shares outstanding. |
| (b) | Distributions for annual periods determined in accordance with U.S. federal income tax regulations. |
| (c) | Where applicable, excludes the effects of any sales charges and assumes the reinvestment of distributions. |
| (d) | Excludes expenses incurred indirectly as a result of investments in underlying funds as follows: |
| For the Year Ended May 31, | ||||||||||||||||||||||||||||||||||||||||
| 2019 | 2018 | 2017 | 2016 | 2015 | ||||||||||||||||||||||||||||||||||||
| Investments in underlying funds |
0.02 | % | 0.01 | % | 0.01 | % | — | % | — | % | ||||||||||||||||||||||||||||||
|
|
|
|
|
|
|
|
|
|
|
|||||||||||||||||||||||||||||||
| (e) | Includes recoupment of past waived and/or reimbursed fees with no financial impact to the expense ratio. |
| (f) | Interest expense and fees relate to TOB Trusts. See Note 4 of the Notes to Financial Statements for details. |
See notes to financial statements.
| 68 | 2019 BLACKROCK ANNUAL REPORT TO SHAREHOLDERS |
Financial Highlights (continued)
(For a share outstanding throughout each period)
| BlackRock California Municipal Opportunities Fund (continued) | ||||||||||||||||||||
| Investor C1 | ||||||||||||||||||||
| Year Ended May 31, | ||||||||||||||||||||
| 2019 | 2018 | 2017 | 2016 | 2015 | ||||||||||||||||
| Net asset value, beginning of year |
$ | 12.76 | $ | 12.60 | $ | 12.73 | $ | 12.33 | $ | 12.23 | ||||||||||
|
|
|
|
|
|
|
|
|
|
|
|||||||||||
| Net investment income(a) |
0.26 | 0.27 | 0.29 | 0.32 | 0.36 | |||||||||||||||
| Net realized and unrealized gain (loss) |
0.19 | 0.20 | (0.13 | ) | 0.40 | 0.10 | ||||||||||||||
|
|
|
|
|
|
|
|
|
|
|
|||||||||||
| Net increase from investment operations |
0.45 | 0.47 | 0.16 | 0.72 | 0.46 | |||||||||||||||
|
|
|
|
|
|
|
|
|
|
|
|||||||||||
| Distributions(b) |
||||||||||||||||||||
| From net investment income |
(0.26 | ) | (0.27 | ) | (0.29 | ) | (0.32 | ) | (0.36 | ) | ||||||||||
| From net realized gain |
(0.24 | ) | (0.04 | ) | — | — | — | |||||||||||||
|
|
|
|
|
|
|
|
|
|
|
|||||||||||
| Total distributions |
(0.50 | ) | (0.31 | ) | (0.29 | ) | (0.32 | ) | (0.36 | ) | ||||||||||
|
|
|
|
|
|
|
|
|
|
|
|||||||||||
| Net asset value, end of year |
$ | 12.71 | $ | 12.76 | $ | 12.60 | $ | 12.73 | $ | 12.33 | ||||||||||
|
|
|
|
|
|
|
|
|
|
|
|||||||||||
| Total Return(c) |
||||||||||||||||||||
| Based on net asset value |
3.68 | % | 3.75 | % | 1.27 | % | 5.90 | % | 3.76 | % | ||||||||||
|
|
|
|
|
|
|
|
|
|
|
|||||||||||
| Ratios to Average Net Assets(d) |
||||||||||||||||||||
| Total expenses(e) |
1.23 | % | 1.17 | % | 1.21 | % | 1.30 | % | 1.32 | % | ||||||||||
|
|
|
|
|
|
|
|
|
|
|
|||||||||||
| Total expenses after fees waived and/or reimbursed and paid indirectly |
1.21 | % | 1.14 | % | 1.14 | % | 1.27 | % | 1.27 | % | ||||||||||
|
|
|
|
|
|
|
|
|
|
|
|||||||||||
| Total expenses after fees waived and/or reimbursed and paid indirectly and excluding interest expense and fees, and amortization of offering costs(f) |
1.04 | % | 1.04 | % | 1.06 | % | 1.23 | % | 1.23 | % | ||||||||||
|
|
|
|
|
|
|
|
|
|
|
|||||||||||
| Net investment income |
2.05 | % | 2.10 | % | 2.27 | % | 2.56 | % | 2.89 | % | ||||||||||
|
|
|
|
|
|
|
|
|
|
|
|||||||||||
| Supplemental Data |
||||||||||||||||||||
| Net assets, end of year (000) |
$ | 202 | $ | 2,478 | $ | 2,760 | $ | 15,180 | $ | 15,873 | ||||||||||
|
|
|
|
|
|
|
|
|
|
|
|||||||||||
| Borrowings outstanding, end of year (000) |
$ | 253,167 | $ | 141,267 | $ | 60,642 | $ | 40,310 | $ | 69,453 | ||||||||||
|
|
|
|
|
|
|
|
|
|
|
|||||||||||
| Portfolio turnover rate |
126 | % | 129 | % | 142 | % | 119 | % | 70 | % | ||||||||||
|
|
|
|
|
|
|
|
|
|
|
|||||||||||
| (a) | Based on average shares outstanding. |
| (b) | Distributions for annual periods determined in accordance with U.S. federal income tax regulations. |
| (c) | Where applicable, excludes the effects of any sales charges and assumes the reinvestment of distributions. |
| (d) | Excludes expenses incurred indirectly as a result of investments in underlying funds as follows: |
| For the Year Ended May 31, | ||||||||||||||||||||||||||||||||||||||||
| 2019 | 2018 | 2017 | 2016 | 2015 | ||||||||||||||||||||||||||||||||||||
| Investments in underlying funds |
0.02 | % | 0.01 | % | 0.01 | % | — | % | — | % | ||||||||||||||||||||||||||||||
|
|
|
|
|
|
|
|
|
|
|
|||||||||||||||||||||||||||||||
| (e) | Includes recoupment of past waived and/or reimbursed fees. Excluding the recoupment of past waived and/or reimbursed fees, the expense ratios were as follows: |
| For the Year Ended May 31, | ||||||||||||||||||||||||||||||||||||||||
| 2019 | 2018 | 2017 | 2016 | 2015 | ||||||||||||||||||||||||||||||||||||
| Expense ratios |
1.21 | % | 1.17 | % | N/A | N/A | N/A | |||||||||||||||||||||||||||||||||
|
|
|
|
|
|
|
|
|
|
|
|||||||||||||||||||||||||||||||
| (f) | Interest expense and fees relate to TOB Trusts. See Note 4 of the Notes to Financial Statements for details. |
See notes to financial statements.
| FINANCIAL HIGHLIGHTS | 69 |
Financial Highlights (continued)
(For a share outstanding throughout each period)
| BlackRock California Municipal Opportunities Fund (continued) |
||||||||
| Class K | ||||||||
| Year Ended 05/31/19 |
Period from to 05/31/18 |
|||||||
| Net asset value, beginning of period |
$ | 12.76 | $ | 12.71 | ||||
|
|
|
|
|
|||||
| Net investment income(b) |
0.34 | 0.11 | ||||||
| Net realized and unrealized gain |
0.19 | 0.06 | ||||||
|
|
|
|
|
|||||
| Net increase from investment operations |
0.53 | 0.17 | ||||||
|
|
|
|
|
|||||
| Distributions(c) |
||||||||
| From net investment income |
(0.34 | ) | (0.12 | ) | ||||
| From net realized gain |
(0.24 | ) | — | |||||
|
|
|
|
|
|||||
| Total distributions |
(0.58 | ) | (0.12 | ) | ||||
|
|
|
|
|
|||||
| Net asset value, end of period |
$ | 12.71 | $ | 12.76 | ||||
|
|
|
|
|
|||||
| Total Return(d) |
||||||||
| Based on net asset value |
4.33 | % | 1.31 | %(e) | ||||
|
|
|
|
|
|||||
| Ratios to Average Net Assets(f) |
||||||||
| Total expenses |
0.58 | % | 0.54 | %(g)(h) | ||||
|
|
|
|
|
|||||
| Total expenses after fees waived and/or reimbursed and paid indirectly |
0.56 | % | 0.49 | %(g) | ||||
|
|
|
|
|
|||||
| Total expenses after fees waived and/or reimbursed and paid indirectly and excluding interest expense and fees, and amortization of offering costs(i) |
0.39 | % | 0.39 | %(g) | ||||
|
|
|
|
|
|||||
| Net investment income |
2.71 | % | 2.76 | %(g) | ||||
|
|
|
|
|
|||||
| Supplemental Data |
||||||||
| Net assets, end of period (000) |
$ | 113,480 | $ | 36,441 | ||||
|
|
|
|
|
|||||
| Borrowings outstanding, end of period (000) |
$ | 253,167 | $ | 141,267 | ||||
|
|
|
|
|
|||||
| Portfolio turnover rate |
126 | % | 129 | % | ||||
|
|
|
|
|
|||||
| (a) | Commencement of operations. |
| (b) | Based on average shares outstanding. |
| (c) | Distributions for annual periods determined in accordance with U.S. federal income tax regulations. |
| (d) | Where applicable, assumes the reinvestment of distributions. |
| (e) | Aggregate total return. |
| (f) | Excludes expenses incurred indirectly as a result of investments in underlying funds as follows: |
| For the Year Ended 05/31/19 |
Period from to 05/31/18 |
|||||||||||||||
| Investments in underlying funds |
0.02 | % | 0.01 | % | ||||||||||||
|
|
|
|
|
|||||||||||||
| (g) | Annualized. |
| (h) | Offering costs were not annualized in the calculation of the expense ratios. If these expenses were annualized, the total expenses would have been 0.54%. |
| (i) | Interest expense and fees relate to TOB Trusts. See Note 4 of the Notes to Financial Statements for details. |
See notes to financial statements.
| 70 | 2019 BLACKROCK ANNUAL REPORT TO SHAREHOLDERS |
Financial Highlights (continued)
(For a share outstanding throughout each period)
| BlackRock New Jersey Municipal Bond Fund | ||||||||||||||||||||
| Institutional | ||||||||||||||||||||
| Year Ended May 31, | ||||||||||||||||||||
| 2019 | 2018 | 2017 | 2016 | 2015 | ||||||||||||||||
| Net asset value, beginning of year |
$ | 11.05 | $ | 11.05 | $ | 11.38 | $ | 11.01 | $ | 11.09 | ||||||||||
|
|
|
|
|
|
|
|
|
|
|
|||||||||||
| Net investment income(a) |
0.40 | 0.40 | 0.39 | 0.40 | 0.41 | |||||||||||||||
| Net realized and unrealized gain (loss) |
0.25 | 0.00 | (b) | (0.33 | ) | 0.37 | (0.08 | ) | ||||||||||||
|
|
|
|
|
|
|
|
|
|
|
|||||||||||
| Net increase from investment operations |
0.65 | 0.40 | 0.06 | 0.77 | 0.33 | |||||||||||||||
|
|
|
|
|
|
|
|
|
|
|
|||||||||||
| Distributions from net investment income(c) |
(0.40 | ) | (0.40 | ) | (0.39 | ) | (0.40 | ) | (0.41 | ) | ||||||||||
|
|
|
|
|
|
|
|
|
|
|
|||||||||||
| Net asset value, end of year |
$ | 11.30 | $ | 11.05 | $ | 11.05 | $ | 11.38 | $ | 11.01 | ||||||||||
|
|
|
|
|
|
|
|
|
|
|
|||||||||||
| Total Return(d) |
||||||||||||||||||||
| Based on net asset value |
6.05 | % | 3.69 | % | 0.56 | % | 7.13 | % | 2.93 | % | ||||||||||
|
|
|
|
|
|
|
|
|
|
|
|||||||||||
| Ratios to Average Net Assets(e) |
||||||||||||||||||||
| Total expenses |
0.85 | % | 0.84 | % | 0.80 | % | 0.81 | % | 0.84 | % | ||||||||||
|
|
|
|
|
|
|
|
|
|
|
|||||||||||
| Total expenses after fees waived and/or reimbursed and paid indirectly |
0.65 | % | 0.64 | % | 0.66 | % | 0.75 | % | 0.77 | % | ||||||||||
|
|
|
|
|
|
|
|
|
|
|
|||||||||||
| Total expenses after fees waived and/or reimbursed and paid indirectly and excluding interest expense, fees and amortization of offering costs(f) |
0.52 | % | 0.54 | % | 0.61 | % | 0.72 | % | 0.74 | % | ||||||||||
|
|
|
|
|
|
|
|
|
|
|
|||||||||||
| Net investment income |
3.65 | % | 3.60 | % | 3.51 | % | 3.58 | % | 3.62 | % | ||||||||||
|
|
|
|
|
|
|
|
|
|
|
|||||||||||
| Supplemental Data |
||||||||||||||||||||
| Net assets, end of year (000) |
$ | 178,716 | $ | 152,759 | $ | 141,585 | $ | 135,174 | $ | 115,135 | ||||||||||
|
|
|
|
|
|
|
|
|
|
|
|||||||||||
| Borrowings outstanding, end of year (000) |
$ | 16,419 | $ | 16,419 | $ | 9,281 | $ | 9,281 | $ | 7,231 | ||||||||||
|
|
|
|
|
|
|
|
|
|
|
|||||||||||
| Portfolio turnover rate |
15 | % | 16 | % | 21 | % | 7 | % | 14 | % | ||||||||||
|
|
|
|
|
|
|
|
|
|
|
|||||||||||
| (a) | Based on average shares outstanding. |
| (b) | Amount is less than $0.005 per share. |
| (c) | Distributions for annual periods determined in accordance with U.S. federal income tax regulations. |
| (d) | Where applicable, assumes the reinvestment of distributions. |
| (e) | Excludes expenses incurred indirectly as a result of investments in underlying funds as follows: |
| For the Year Ended May 31, | ||||||||||||||||||||||||||||||||||||||||
| 2019 | 2018 | 2017 | 2016 | 2015 | ||||||||||||||||||||||||||||||||||||
| Investments in underlying funds |
0.01 | % | — | % | 0.01 | % | — | % | — | % | ||||||||||||||||||||||||||||||
|
|
|
|
|
|
|
|
|
|
|
|||||||||||||||||||||||||||||||
| (f) | Interest expense and fees relate to TOB Trusts. See Note 4 of the Notes to Financial Statements for details. |
See notes to financial statements.
| FINANCIAL HIGHLIGHTS | 71 |
Financial Highlights (continued)
(For a share outstanding throughout each period)
| BlackRock New Jersey Municipal Bond Fund (continued) | ||||||||||||||||||||
| Service | ||||||||||||||||||||
| Year Ended May 31, | ||||||||||||||||||||
| 2019 | 2018 | 2017 | 2016 | 2015 | ||||||||||||||||
| Net asset value, beginning of year |
$ | 11.05 | $ | 11.05 | $ | 11.38 | $ | 11.01 | $ | 11.09 | ||||||||||
|
|
|
|
|
|
|
|
|
|
|
|||||||||||
| Net investment income(a) |
0.37 | 0.37 | 0.36 | 0.38 | 0.39 | |||||||||||||||
| Net realized and unrealized gain (loss) |
0.25 | (0.00 | )(b) | (0.32 | ) | 0.38 | (0.08 | ) | ||||||||||||
|
|
|
|
|
|
|
|
|
|
|
|||||||||||
| Net increase from investment operations |
0.62 | 0.37 | 0.04 | 0.76 | 0.31 | |||||||||||||||
|
|
|
|
|
|
|
|
|
|
|
|||||||||||
| Distributions from net investment income(c) |
(0.37 | ) | (0.37 | ) | (0.37 | ) | (0.39 | ) | (0.39 | ) | ||||||||||
|
|
|
|
|
|
|
|
|
|
|
|||||||||||
| Net asset value, end of year |
$ | 11.30 | $ | 11.05 | $ | 11.05 | $ | 11.38 | $ | 11.01 | ||||||||||
|
|
|
|
|
|
|
|
|
|
|
|||||||||||
| Total Return(d) |
||||||||||||||||||||
| Based on net asset value |
5.79 | % | 3.43 | % | 0.36 | % | 7.00 | % | 2.83 | % | ||||||||||
|
|
|
|
|
|
|
|
|
|
|
|||||||||||
| Ratios to Average Net Assets(e) |
||||||||||||||||||||
| Total expenses |
1.08 | % | 1.09 | % | 1.05 | % | 1.05 | % | 1.04 | % | ||||||||||
|
|
|
|
|
|
|
|
|
|
|
|||||||||||
| Total expenses after fees waived and/or reimbursed and paid indirectly |
0.90 | % | 0.89 | % | 0.86 | % | 0.87 | % | 0.86 | % | ||||||||||
|
|
|
|
|
|
|
|
|
|
|
|||||||||||
| Total expenses after fees waived and/or reimbursed and paid indirectly and excluding interest expense, fees and amortization of offering costs(f) |
0.77 | % | 0.79 | % | 0.82 | % | 0.84 | % | 0.84 | % | ||||||||||
|
|
|
|
|
|
|
|
|
|
|
|||||||||||
| Net investment income |
3.34 | % | 3.35 | % | 3.27 | % | 3.43 | % | 3.53 | % | ||||||||||
|
|
|
|
|
|
|
|
|
|
|
|||||||||||
| Supplemental Data |
||||||||||||||||||||
| Net assets, end of year (000) |
$ | 7,874 | $ | 7,921 | $ | 9,594 | $ | 10,514 | $ | 17,654 | ||||||||||
|
|
|
|
|
|
|
|
|
|
|
|||||||||||
| Borrowings outstanding, end of year (000) |
$ | 16,419 | $ | 16,419 | $ | 9,281 | $ | 9,281 | $ | 7,231 | ||||||||||
|
|
|
|
|
|
|
|
|
|
|
|||||||||||
| Portfolio turnover rate |
15 | % | 16 | % | 21 | % | 7 | % | 14 | % | ||||||||||
|
|
|
|
|
|
|
|
|
|
|
|||||||||||
| (a) | Based on average shares outstanding. |
| (b) | Amount is greater than $(0.005) per share. |
| (c) | Distributions for annual periods determined in accordance with U.S. federal income tax regulations. |
| (d) | Where applicable, assumes the reinvestment of distributions. |
| (e) | Excludes expenses incurred indirectly as a result of investments in underlying funds as follows: |
| For the Year Ended May 31, | ||||||||||||||||||||||||||||||||||||||||
| 2019 | 2018 | 2017 | 2016 | 2015 | ||||||||||||||||||||||||||||||||||||
| Investments in underlying funds |
0.01 | % | — | % | 0.01 | % | — | % | — | % | ||||||||||||||||||||||||||||||
|
|
|
|
|
|
|
|
|
|
|
|||||||||||||||||||||||||||||||
| (f) | Interest expense and fees relate to TOB Trusts. See Note 4 of the Notes to Financial Statements for details. |
See notes to financial statements.
| 72 | 2019 BLACKROCK ANNUAL REPORT TO SHAREHOLDERS |
Financial Highlights (continued)
(For a share outstanding throughout each period)
| BlackRock New Jersey Municipal Bond Fund (continued) | ||||||||||||||||||||
| Investor A | ||||||||||||||||||||
| Year Ended May 31, | ||||||||||||||||||||
| 2019 | 2018 | 2017 | 2016 | 2015 | ||||||||||||||||
| Net asset value, beginning of year |
$ | 11.06 | $ | 11.06 | $ | 11.39 | $ | 11.02 | $ | 11.10 | ||||||||||
|
|
|
|
|
|
|
|
|
|
|
|||||||||||
| Net investment income(a) |
0.37 | 0.37 | 0.37 | 0.38 | 0.39 | |||||||||||||||
| Net realized and unrealized gain (loss) |
0.25 | (0.00 | )(b) | (0.33 | ) | 0.38 | (0.08 | ) | ||||||||||||
|
|
|
|
|
|
|
|
|
|
|
|||||||||||
| Net increase from investment operations |
0.62 | 0.37 | 0.04 | 0.76 | 0.31 | |||||||||||||||
|
|
|
|
|
|
|
|
|
|
|
|||||||||||
| Distributions from net investment income(c) |
(0.37 | ) | (0.37 | ) | (0.37 | ) | (0.39 | ) | (0.39 | ) | ||||||||||
|
|
|
|
|
|
|
|
|
|
|
|||||||||||
| Net asset value, end of year |
$ | 11.31 | $ | 11.06 | $ | 11.06 | $ | 11.39 | $ | 11.02 | ||||||||||
|
|
|
|
|
|
|
|
|
|
|
|||||||||||
| Total Return(d) |
||||||||||||||||||||
| Based on net asset value |
5.79 | % | 3.43 | % | 0.36 | % | 6.99 | % | 2.83 | % | ||||||||||
|
|
|
|
|
|
|
|
|
|
|
|||||||||||
| Ratios to Average Net Assets(e) |
||||||||||||||||||||
| Total expenses |
1.05 | % | 1.02 | % | 0.99 | % | 0.99 | % | 0.98 | % | ||||||||||
|
|
|
|
|
|
|
|
|
|
|
|||||||||||
| Total expenses after fees waived and/or reimbursed and paid indirectly |
0.90 | % | 0.89 | % | 0.86 | % | 0.87 | % | 0.86 | % | ||||||||||
|
|
|
|
|
|
|
|
|
|
|
|||||||||||
| Total expenses after fees waived and/or reimbursed and paid indirectly and excluding interest expense, fees and amortization of offering costs(f) |
0.77 | % | 0.79 | % | 0.82 | % | 0.84 | % | 0.84 | % | ||||||||||
|
|
|
|
|
|
|
|
|
|
|
|||||||||||
| Net investment income |
3.39 | % | 3.35 | % | 3.29 | % | 3.44 | % | 3.52 | % | ||||||||||
|
|
|
|
|
|
|
|
|
|
|
|||||||||||
| Supplemental Data |
||||||||||||||||||||
| Net assets, end of year (000) |
$ | 90,055 | $ | 72,565 | $ | 77,920 | $ | 81,164 | $ | 66,469 | ||||||||||
|
|
|
|
|
|
|
|
|
|
|
|||||||||||
| Borrowings outstanding, end of year (000) |
$ | 16,419 | $ | 16,419 | $ | 9,281 | $ | 9,281 | $ | 7,231 | ||||||||||
|
|
|
|
|
|
|
|
|
|
|
|||||||||||
| Portfolio turnover rate |
15 | % | 16 | % | 21 | % | 7 | % | 14 | % | ||||||||||
|
|
|
|
|
|
|
|
|
|
|
|||||||||||
| (a) | Based on average shares outstanding. |
| (b) | Amount is greater than $(0.005) per share. |
| (c) | Distributions for annual periods determined in accordance with U.S. federal income tax regulations. |
| (d) | Where applicable, excludes the effects of any sales charges and assumes the reinvestment of distributions. |
| (e) | Excludes expenses incurred indirectly as a result of investments in underlying funds as follows: |
| For the Year Ended May 31, | ||||||||||||||||||||||||||||||||||||||||
| 2019 | 2018 | 2017 | 2016 | 2015 | ||||||||||||||||||||||||||||||||||||
| Investments in underlying funds |
0.01 | % | — | % | 0.01 | % | — | % | — | % | ||||||||||||||||||||||||||||||
|
|
|
|
|
|
|
|
|
|
|
|||||||||||||||||||||||||||||||
| (f) | Interest expense and fees relate to TOB Trusts. See Note 4 of the Notes to Financial Statements for details. |
See notes to financial statements.
| FINANCIAL HIGHLIGHTS | 73 |
Financial Highlights (continued)
(For a share outstanding throughout each period)
| BlackRock New Jersey Municipal Bond Fund (continued) | ||||||||||||||||||||
| Investor A1 | ||||||||||||||||||||
| Year Ended May 31, | ||||||||||||||||||||
| 2019 | 2018 | 2017 | 2016 | 2015 | ||||||||||||||||
| Net asset value, beginning of year |
$ | 11.06 | $ | 11.07 | $ | 11.39 | $ | 11.02 | $ | 11.10 | ||||||||||
|
|
|
|
|
|
|
|
|
|
|
|||||||||||
| Net investment income(a) |
0.39 | 0.39 | 0.38 | 0.40 | 0.41 | |||||||||||||||
| Net realized and unrealized gain (loss) |
0.25 | (0.01 | ) | (0.32 | ) | 0.37 | (0.08 | ) | ||||||||||||
|
|
|
|
|
|
|
|
|
|
|
|||||||||||
| Net increase from investment operations |
0.64 | 0.38 | 0.06 | 0.77 | 0.33 | |||||||||||||||
|
|
|
|
|
|
|
|
|
|
|
|||||||||||
| Distributions from net investment income(b) |
(0.39 | ) | (0.39 | ) | (0.38 | ) | (0.40 | ) | (0.41 | ) | ||||||||||
|
|
|
|
|
|
|
|
|
|
|
|||||||||||
| Net asset value, end of year |
$ | 11.31 | $ | 11.06 | $ | 11.07 | $ | 11.39 | $ | 11.02 | ||||||||||
|
|
|
|
|
|
|
|
|
|
|
|||||||||||
| Total Return(c) |
||||||||||||||||||||
| Based on net asset value |
5.95 | % | 3.49 | % | 0.59 | % | 7.12 | % | 2.95 | % | ||||||||||
|
|
|
|
|
|
|
|
|
|
|
|||||||||||
| Ratios to Average Net Assets(d) |
||||||||||||||||||||
| Total expenses |
0.88 | % | 0.87 | % | 0.83 | % | 0.83 | % | 0.83 | % | ||||||||||
|
|
|
|
|
|
|
|
|
|
|
|||||||||||
| Total expenses after fees waived and/or reimbursed and paid indirectly |
0.74 | % | 0.74 | % | 0.72 | % | 0.75 | % | 0.74 | % | ||||||||||
|
|
|
|
|
|
|
|
|
|
|
|||||||||||
| Total expenses after fees waived and/or reimbursed and paid indirectly and excluding interest expense, fees and amortization of offering costs(e) |
0.62 | % | 0.64 | % | 0.68 | % | 0.72 | % | 0.72 | % | ||||||||||
|
|
|
|
|
|
|
|
|
|
|
|||||||||||
| Net investment income |
3.54 | % | 3.50 | % | 3.43 | % | 3.57 | % | 3.65 | % | ||||||||||
|
|
|
|
|
|
|
|
|
|
|
|||||||||||
| Supplemental Data |
||||||||||||||||||||
| Net assets, end of year (000) |
$ | 19,760 | $ | 20,534 | $ | 22,697 | $ | 26,092 | $ | 29,707 | ||||||||||
|
|
|
|
|
|
|
|
|
|
|
|||||||||||
| Borrowings outstanding, end of year (000) |
$ | 16,419 | $ | 16,419 | $ | 9,281 | $ | 9,281 | $ | 7,231 | ||||||||||
|
|
|
|
|
|
|
|
|
|
|
|||||||||||
| Portfolio turnover rate |
15 | % | 16 | % | 21 | % | 7 | % | 14 | % | ||||||||||
|
|
|
|
|
|
|
|
|
|
|
|||||||||||
| (a) | Based on average shares outstanding. |
| (b) | Distributions for annual periods determined in accordance with U.S. federal income tax regulations. |
| (c) | Where applicable, excludes the effects of any sales charges and assumes the reinvestment of distributions. |
| (d) | Excludes expenses incurred indirectly as a result of investments in underlying funds as follows: |
| For the Year Ended May 31, | ||||||||||||||||||||||||||||||||||||||||
| 2019 | 2018 | 2017 | 2016 | 2015 | ||||||||||||||||||||||||||||||||||||
| Investments in underlying funds |
0.01 | % | — | % | 0.01 | % | — | % | — | % | ||||||||||||||||||||||||||||||
|
|
|
|
|
|
|
|
|
|
|
|||||||||||||||||||||||||||||||
| (e) | Interest expense and fees relate to TOB Trusts. See Note 4 of the Notes to Financial Statements for details. |
See notes to financial statements.
| 74 | 2019 BLACKROCK ANNUAL REPORT TO SHAREHOLDERS |
Financial Highlights (continued)
(For a share outstanding throughout each period)
| BlackRock New Jersey Municipal Bond Fund (continued) | ||||||||||||||||||||
| Investor C | ||||||||||||||||||||
| Year Ended May 31, | ||||||||||||||||||||
| 2019 | 2018 | 2017 | 2016 | 2015 | ||||||||||||||||
| Net asset value, beginning of year |
$ | 11.05 | $ | 11.05 | $ | 11.38 | $ | 11.00 | $ | 11.08 | ||||||||||
|
|
|
|
|
|
|
|
|
|
|
|||||||||||
| Net investment income(a) |
0.29 | 0.29 | 0.28 | 0.30 | 0.31 | |||||||||||||||
| Net realized and unrealized gain (loss) |
0.25 | 0.00 | (b) | (0.33 | ) | 0.38 | (0.08 | ) | ||||||||||||
|
|
|
|
|
|
|
|
|
|
|
|||||||||||
| Net increase from investment operations |
0.54 | 0.29 | (0.05 | ) | 0.68 | 0.23 | ||||||||||||||
|
|
|
|
|
|
|
|
|
|
|
|||||||||||
| Distributions from net investment income(c) |
(0.29 | ) | (0.29 | ) | (0.28 | ) | (0.30 | ) | (0.31 | ) | ||||||||||
|
|
|
|
|
|
|
|
|
|
|
|||||||||||
| Net asset value, end of year |
$ | 11.30 | $ | 11.05 | $ | 11.05 | $ | 11.38 | $ | 11.00 | ||||||||||
|
|
|
|
|
|
|
|
|
|
|
|||||||||||
| Total Return(d) |
||||||||||||||||||||
| Based on net asset value |
5.00 | % | 2.65 | % | (0.41 | )% | 6.28 | % | 2.04 | % | ||||||||||
|
|
|
|
|
|
|
|
|
|
|
|||||||||||
| Ratios to Average Net Assets(e) |
||||||||||||||||||||
| Total expenses |
1.79 | % | 1.78 | % | 1.73 | % | 1.73 | % | 1.73 | % | ||||||||||
|
|
|
|
|
|
|
|
|
|
|
|||||||||||
| Total expenses after fees waived and/or reimbursed and paid indirectly |
1.64 | % | 1.64 | % | 1.62 | % | 1.64 | % | 1.63 | % | ||||||||||
|
|
|
|
|
|
|
|
|
|
|
|||||||||||
| Total expenses after fees waived and/or reimbursed and paid indirectly and excluding interest expense, fees and amortization of offering costs(f) |
1.52 | % | 1.54 | % | 1.57 | % | 1.61 | % | 1.61 | % | ||||||||||
|
|
|
|
|
|
|
|
|
|
|
|||||||||||
| Net investment income |
2.64 | % | 2.60 | % | 2.53 | % | 2.67 | % | 2.75 | % | ||||||||||
|
|
|
|
|
|
|
|
|
|
|
|||||||||||
| Supplemental Data |
||||||||||||||||||||
| Net assets, end of year (000) |
$ | 31,234 | $ | 29,509 | $ | 29,276 | $ | 30,810 | $ | 28,614 | ||||||||||
|
|
|
|
|
|
|
|
|
|
|
|||||||||||
| Borrowings outstanding, end of year (000) |
$ | 16,419 | $ | 16,419 | $ | 9,281 | $ | 9,281 | $ | 7,231 | ||||||||||
|
|
|
|
|
|
|
|
|
|
|
|||||||||||
| Portfolio turnover rate |
15 | % | 16 | % | 21 | % | 7 | % | 14 | % | ||||||||||
|
|
|
|
|
|
|
|
|
|
|
|||||||||||
| (a) | Based on average shares outstanding. |
| (b) | Amount is less than $0.005 per share. |
| (c) | Distributions for annual periods determined in accordance with U.S. federal income tax regulations. |
| (d) | Where applicable, excludes the effects of any sales charges and assumes the reinvestment of distributions. |
| (e) | Excludes expenses incurred indirectly as a result of investments in underlying funds as follows: |
| For the Year Ended May 31, | ||||||||||||||||||||||||||||||||||||||||
| 2019 | 2018 | 2017 | 2016 | 2015 | ||||||||||||||||||||||||||||||||||||
| Investments in underlying funds |
0.01 | % | — | % | 0.01 | % | — | % | — | % | ||||||||||||||||||||||||||||||
|
|
|
|
|
|
|
|
|
|
|
|||||||||||||||||||||||||||||||
| (f) | Interest expense and fees relate to TOB Trusts. See Note 4 of the Notes to Financial Statements for details. |
See notes to financial statements.
| FINANCIAL HIGHLIGHTS | 75 |
Financial Highlights (continued)
(For a share outstanding throughout each period)
| BlackRock New Jersey Municipal Bond Fund (continued) | ||||||||||||||||||||
| Investor C1 | ||||||||||||||||||||
| Year Ended May 31, | ||||||||||||||||||||
| 2019 | 2018 | 2017 | 2016 | 2015 | ||||||||||||||||
| Net asset value, beginning of year |
$ | 11.05 | $ | 11.05 | $ | 11.38 | $ | 11.01 | $ | 11.09 | ||||||||||
|
|
|
|
|
|
|
|
|
|
|
|||||||||||
| Net investment income(a) |
0.34 | 0.34 | 0.33 | 0.34 | 0.35 | |||||||||||||||
| Net realized and unrealized gain (loss) |
0.25 | (0.00 | )(b) | (0.33 | ) | 0.37 | (0.08 | ) | ||||||||||||
|
|
|
|
|
|
|
|
|
|
|
|||||||||||
| Net increase from investment operations |
0.59 | 0.34 | — | 0.71 | 0.27 | |||||||||||||||
|
|
|
|
|
|
|
|
|
|
|
|||||||||||
| Distributions from net investment income(c) |
(0.34 | ) | (0.34 | ) | (0.33 | ) | (0.34 | ) | (0.35 | ) | ||||||||||
|
|
|
|
|
|
|
|
|
|
|
|||||||||||
| Net asset value, end of year |
$ | 11.30 | $ | 11.05 | $ | 11.05 | $ | 11.38 | $ | 11.01 | ||||||||||
|
|
|
|
|
|
|
|
|
|
|
|||||||||||
| Total Return(d) |
||||||||||||||||||||
| Based on net asset value |
5.45 | % | 3.08 | % | (0.01 | )% | 6.59 | % | 2.43 | % | ||||||||||
|
|
|
|
|
|
|
|
|
|
|
|||||||||||
| Ratios to Average Net Assets(e) |
||||||||||||||||||||
| Total expenses |
1.39 | % | 1.37 | % | 1.32 | % | 1.32 | % | 1.33 | % | ||||||||||
|
|
|
|
|
|
|
|
|
|
|
|||||||||||
| Total expenses after fees waived and/or reimbursed and paid indirectly |
1.23 | % | 1.22 | % | 1.23 | % | 1.26 | % | 1.25 | % | ||||||||||
|
|
|
|
|
|
|
|
|
|
|
|||||||||||
| Total expenses after fees waived and/or reimbursed and paid indirectly and excluding interest expense, fees and amortization of offering costs(f) |
1.10 | % | 1.12 | % | 1.18 | % | 1.23 | % | 1.23 | % | ||||||||||
|
|
|
|
|
|
|
|
|
|
|
|||||||||||
| Net investment income |
3.10 | % | 3.02 | % | 2.92 | % | 3.05 | % | 3.14 | % | ||||||||||
|
|
|
|
|
|
|
|
|
|
|
|||||||||||
| Supplemental Data |
||||||||||||||||||||
| Net assets, end of year (000) |
$ | 23 | $ | 1,350 | $ | 1,403 | $ | 7,815 | $ | 7,981 | ||||||||||
|
|
|
|
|
|
|
|
|
|
|
|||||||||||
| Borrowings outstanding, end of year (000) |
$ | 16,419 | $ | 16,419 | $ | 9,281 | $ | 9,281 | $ | 7,231 | ||||||||||
|
|
|
|
|
|
|
|
|
|
|
|||||||||||
| Portfolio turnover rate |
15 | % | 16 | % | 21 | % | 7 | % | 14 | % | ||||||||||
|
|
|
|
|
|
|
|
|
|
|
|||||||||||
| (a) | Based on average shares outstanding. |
| (b) | Amount is greater than $(0.005) per share. |
| (c) | Distributions for annual periods determined in accordance with U.S. federal income tax regulations. |
| (d) | Where applicable, excludes the effects of any sales charges and assumes the reinvestment of distributions. |
| (e) | Excludes expenses incurred indirectly as a result of investments in underlying funds as follows: |
| For the Year Ended May 31, | ||||||||||||||||||||||||||||||||||||||||
| 2019 | 2018 | 2017 | 2016 | 2015 | ||||||||||||||||||||||||||||||||||||
| Investments in underlying funds |
0.01 | % | — | % | 0.01 | % | — | % | — | % | ||||||||||||||||||||||||||||||
|
|
|
|
|
|
|
|
|
|
|
|||||||||||||||||||||||||||||||
| (f) | Interest expense and fees relate to TOB Trusts. See Note 4 of the Notes to Financial Statements for details. |
See notes to financial statements.
| 76 | 2019 BLACKROCK ANNUAL REPORT TO SHAREHOLDERS |
Financial Highlights (continued)
(For a share outstanding throughout each period)
| BlackRock New Jersey Municipal Bond Fund |
||||||||
| Class K | ||||||||
| Year Ended 05/31/19 |
Period from 01/25/18 (a) to 05/31/18 |
|||||||
| Net asset value, beginning of period |
$ | 11.04 | $ | 11.11 | ||||
|
|
|
|
|
|||||
| Net investment income(b) |
0.41 | 0.14 | ||||||
| Net realized and unrealized gain (loss) |
0.26 | (0.07 | ) | |||||
|
|
|
|
|
|||||
| Net increase from investment operations |
0.67 | 0.07 | ||||||
|
|
|
|
|
|||||
| Distributions from net investment income(c) |
(0.41 | ) | (0.14 | ) | ||||
|
|
|
|
|
|||||
| Net asset value, end of period |
$ | 11.30 | $ | 11.04 | ||||
|
|
|
|
|
|||||
| Total Return(d) |
||||||||
| Based on net asset value |
6.20 | % | 0.66 | %(e) | ||||
|
|
|
|
|
|||||
| Ratios to Average Net Assets(f) |
||||||||
| Total expenses |
0.75 | % | 0.74 | %(g)(h) | ||||
|
|
|
|
|
|||||
| Total expenses after fees waived and/or reimbursed and paid indirectly |
0.60 | % | 0.57 | %(g) | ||||
|
|
|
|
|
|||||
| Total expenses after fees waived and/or reimbursed and paid indirectly and excluding interest expense, fees and amortization of offering costs(i) |
0.47 | % | 0.47 | %(g) | ||||
|
|
|
|
|
|||||
| Net investment income |
3.70 | % | 3.88 | %(g) | ||||
|
|
|
|
|
|||||
| Supplemental Data |
||||||||
| Net assets, end of period (000) |
$ | 1,660 | $ | 1,776 | ||||
|
|
|
|
|
|||||
| Preferred Shares outstanding at $25,000 liquidation preference, end of period (000) |
$ | 16,419 | $ | 16,419 | ||||
|
|
|
|
|
|||||
| Portfolio turnover rate |
15 | % | 16 | % | ||||
|
|
|
|
|
|||||
| (a) | Commencement of operations. |
| (b) | Based on average shares outstanding. |
| (c) | Distributions for annual periods determined in accordance with U.S. federal income tax regulations. |
| (d) | Where applicable, assumes the reinvestment of distributions. |
| (e) | Aggregate total return. |
| (f) | Excludes expenses incurred indirectly as a result of investments in underlying funds as follows: |
| For the Year Ended 05/31/19 |
Period from to 05/31/18 |
|||||||||||||||
| Investments in underlying funds |
0.01 | % | — | % | ||||||||||||
|
|
|
|
|
|||||||||||||
| (g) | Annualized. |
| (h) | Offering costs were not annualized in the calculation of the expense ratios. If these expenses were annualized, the total expenses would have been 0.74%. |
| (i) | Interest expense and fees relate to TOB Trusts. See Note 4 of the Notes to Financial Statements for details. |
See notes to financial statements.
| FINANCIAL HIGHLIGHTS | 77 |
Financial Highlights (continued)
(For a share outstanding throughout each period)
| BlackRock Pennsylvania Municipal Bond Fund | ||||||||||||||||||||
| Institutional | ||||||||||||||||||||
| Year Ended May 31, | ||||||||||||||||||||
| 2019 | 2018 | 2017 | 2016 | 2015 | ||||||||||||||||
| Net asset value, beginning of year |
$ | 10.98 | $ | 11.21 | $ | 11.58 | $ | 11.31 | $ | 11.21 | ||||||||||
|
|
|
|
|
|
|
|
|
|
|
|||||||||||
| Net investment income(a) |
0.43 | 0.45 | 0.46 | 0.46 | 0.46 | |||||||||||||||
| Net realized and unrealized gain (loss) |
0.13 | (0.23 | ) | (0.37 | ) | 0.27 | 0.10 | |||||||||||||
|
|
|
|
|
|
|
|
|
|
|
|||||||||||
| Net increase from investment operations |
0.56 | 0.22 | 0.09 | 0.73 | 0.56 | |||||||||||||||
|
|
|
|
|
|
|
|
|
|
|
|||||||||||
| Distributions from net investment income(b) |
(0.43 | ) | (0.45 | ) | (0.46 | ) | (0.46 | ) | (0.46 | ) | ||||||||||
|
|
|
|
|
|
|
|
|
|
|
|||||||||||
| Net asset value, end of year |
$ | 11.11 | $ | 10.98 | $ | 11.21 | $ | 11.58 | $ | 11.31 | ||||||||||
|
|
|
|
|
|
|
|
|
|
|
|||||||||||
| Total Return(c) |
||||||||||||||||||||
| Based on net asset value |
5.22 | % | 2.02 | % | 0.81 | % | 6.59 | % | 5.02 | % | ||||||||||
|
|
|
|
|
|
|
|
|
|
|
|||||||||||
| Ratios to Average Net Assets |
||||||||||||||||||||
| Total expenses |
1.04 | % | 0.97 | % | 0.95 | % | 0.87 | % | 0.87 | % | ||||||||||
|
|
|
|
|
|
|
|
|
|
|
|||||||||||
| Total expenses after fees waived and/or reimbursed and paid indirectly |
0.84 | % | 0.78 | % | 0.78 | % | 0.79 | % | 0.78 | % | ||||||||||
|
|
|
|
|
|
|
|
|
|
|
|||||||||||
| Total expenses after fees waived and/or reimbursed and paid indirectly and excluding interest expense, fees and amortization of offering costs(d) |
0.54 | % | 0.55 | % | 0.61 | % | 0.71 | % | 0.71 | % | ||||||||||
|
|
|
|
|
|
|
|
|
|
|
|||||||||||
| Net investment income |
3.93 | % | 4.06 | % | 4.05 | % | 4.04 | % | 4.01 | % | ||||||||||
|
|
|
|
|
|
|
|
|
|
|
|||||||||||
| Supplemental Data |
||||||||||||||||||||
| Net assets, end of year (000) |
$ | 379,911 | $ | 356,315 | $ | 298,557 | $ | 327,314 | $ | 321,896 | ||||||||||
|
|
|
|
|
|
|
|
|
|
|
|||||||||||
| Borrowings outstanding, end of year (000) |
$ | 64,404 | $ | 70,199 | $ | 59,064 | $ | 49,627 | $ | 46,127 | ||||||||||
|
|
|
|
|
|
|
|
|
|
|
|||||||||||
| Portfolio turnover rate |
23 | % | 17 | % | 18 | % | 19 | % | 18 | % | ||||||||||
|
|
|
|
|
|
|
|
|
|
|
|||||||||||
| (a) | Based on average shares outstanding. |
| (b) | Distributions for annual periods determined in accordance with U.S. federal income tax regulations. |
| (c) | Where applicable, assumes the reinvestment of distributions. |
| (d) | Interest expense and fees relate to TOB Trusts. See Note 4 of the Notes to Financial Statements for details. |
See notes to financial statements.
| 78 | 2019 BLACKROCK ANNUAL REPORT TO SHAREHOLDERS |
Financial Highlights (continued)
(For a share outstanding throughout each period)
| BlackRock Pennsylvania Municipal Bond Fund (continued) | ||||||||||||||||||||
| Service | ||||||||||||||||||||
| Year Ended May 31, | ||||||||||||||||||||
| 2019 | 2018 | 2017 | 2016 | 2015 | ||||||||||||||||
| Net asset value, beginning of year |
$ | 10.99 | $ | 11.22 | $ | 11.59 | $ | 11.31 | $ | 11.22 | ||||||||||
|
|
|
|
|
|
|
|
|
|
|
|||||||||||
| Net investment income(a) |
0.40 | 0.42 | 0.43 | 0.44 | 0.44 | |||||||||||||||
| Net realized and unrealized gain (loss) |
0.14 | (0.23 | ) | (0.37 | ) | 0.28 | 0.09 | |||||||||||||
|
|
|
|
|
|
|
|
|
|
|
|||||||||||
| Net increase from investment operations |
0.54 | 0.19 | 0.06 | 0.72 | 0.53 | |||||||||||||||
|
|
|
|
|
|
|
|
|
|
|
|||||||||||
| Distributions from net investment income(b) |
(0.40 | ) | (0.42 | ) | (0.43 | ) | (0.44 | ) | (0.44 | ) | ||||||||||
|
|
|
|
|
|
|
|
|
|
|
|||||||||||
| Net asset value, end of year |
$ | 11.13 | $ | 10.99 | $ | 11.22 | $ | 11.59 | $ | 11.31 | ||||||||||
|
|
|
|
|
|
|
|
|
|
|
|||||||||||
| Total Return(c) |
||||||||||||||||||||
| Based on net asset value |
5.05 | % | 1.76 | % | 0.59 | % | 6.50 | % | 4.73 | % | ||||||||||
|
|
|
|
|
|
|
|
|
|
|
|||||||||||
| Ratios to Average Net Assets |
||||||||||||||||||||
| Total expenses |
1.26 | % | 1.19 | % | 1.13 | % | 1.12 | % | 1.04 | % | ||||||||||
|
|
|
|
|
|
|
|
|
|
|
|||||||||||
| Total expenses after fees waived and/or reimbursed and paid indirectly |
1.09 | % | 1.03 | % | 1.00 | % | 0.97 | % | 0.96 | % | ||||||||||
|
|
|
|
|
|
|
|
|
|
|
|||||||||||
| Total expenses after fees waived and/or reimbursed and paid indirectly and excluding interest expense, fees and amortization of offering costs(d) |
0.79 | % | 0.80 | % | 0.83 | % | 0.89 | % | 0.89 | % | ||||||||||
|
|
|
|
|
|
|
|
|
|
|
|||||||||||
| Net investment income |
3.67 | % | 3.81 | % | 3.84 | % | 3.85 | % | 3.83 | % | ||||||||||
|
|
|
|
|
|
|
|
|
|
|
|||||||||||
| Supplemental Data |
||||||||||||||||||||
| Net assets, end of year (000) |
$ | 2,080 | $ | 1,783 | $ | 1,427 | $ | 1,217 | $ | 8,636 | ||||||||||
|
|
|
|
|
|
|
|
|
|
|
|||||||||||
| Borrowings outstanding, end of year (000) |
$ | 64,404 | $ | 70,199 | $ | 59,064 | $ | 49,627 | $ | 46,127 | ||||||||||
|
|
|
|
|
|
|
|
|
|
|
|||||||||||
| Portfolio turnover rate |
23 | % | 17 | % | 18 | % | 19 | % | 18 | % | ||||||||||
|
|
|
|
|
|
|
|
|
|
|
|||||||||||
| (a) | Based on average shares outstanding. |
| (b) | Distributions for annual periods determined in accordance with U.S. federal income tax regulations. |
| (c) | Where applicable, assumes the reinvestment of distributions. |
| (d) | Interest expense and fees relate to TOB Trusts. See Note 4 of the Notes to Financial Statements for details. |
See notes to financial statements.
| FINANCIAL HIGHLIGHTS | 79 |
Financial Highlights (continued)
(For a share outstanding throughout each period)
| BlackRock Pennsylvania Municipal Bond Fund (continued) | ||||||||||||||||||||
| Investor A | ||||||||||||||||||||
| Year Ended May 31, | ||||||||||||||||||||
| 2019 | 2018 | 2017 | 2016 | 2015 | ||||||||||||||||
| Net asset value, beginning of year |
$ | 10.99 | $ | 11.22 | $ | 11.59 | $ | 11.32 | $ | 11.23 | ||||||||||
|
|
|
|
|
|
|
|
|
|
|
|||||||||||
| Net investment income(a) |
0.40 | 0.42 | 0.43 | 0.44 | 0.44 | |||||||||||||||
| Net realized and unrealized gain (loss) |
0.14 | (0.23 | ) | (0.37 | ) | 0.27 | 0.09 | |||||||||||||
|
|
|
|
|
|
|
|
|
|
|
|||||||||||
| Net increase from investment operations |
0.54 | 0.19 | 0.06 | 0.71 | 0.53 | |||||||||||||||
|
|
|
|
|
|
|
|
|
|
|
|||||||||||
| Distributions from net investment income(b) |
(0.40 | ) | (0.42 | ) | (0.43 | ) | (0.44 | ) | (0.44 | ) | ||||||||||
|
|
|
|
|
|
|
|
|
|
|
|||||||||||
| Net asset value, end of year |
$ | 11.13 | $ | 10.99 | $ | 11.22 | $ | 11.59 | $ | 11.32 | ||||||||||
|
|
|
|
|
|
|
|
|
|
|
|||||||||||
| Total Return(c) |
||||||||||||||||||||
| Based on net asset value |
5.05 | % | 1.76 | % | 0.59 | % | 6.40 | % | 4.73 | % | ||||||||||
|
|
|
|
|
|
|
|
|
|
|
|||||||||||
| Ratios to Average Net Assets |
||||||||||||||||||||
| Total expenses |
1.19 | % | 1.16 | % | 1.11 | % | 1.04 | % | 1.02 | % | ||||||||||
|
|
|
|
|
|
|
|
|
|
|
|||||||||||
| Total expenses after fees waived and/or reimbursed and paid indirectly |
1.09 | % | 1.03 | % | 1.00 | % | 0.97 | % | 0.96 | % | ||||||||||
|
|
|
|
|
|
|
|
|
|
|
|||||||||||
| Total expenses after fees waived and/or reimbursed and paid indirectly and excluding interest expense, fees and amortization of offering costs(d) |
0.79 | % | 0.80 | % | 0.83 | % | 0.89 | % | 0.89 | % | ||||||||||
|
|
|
|
|
|
|
|
|
|
|
|||||||||||
| Net investment income |
3.67 | % | 3.82 | % | 3.83 | % | 3.85 | % | 3.83 | % | ||||||||||
|
|
|
|
|
|
|
|
|
|
|
|||||||||||
| Supplemental Data |
||||||||||||||||||||
| Net assets, end of year (000) |
$ | 110,756 | $ | 98,414 | $ | 130,405 | $ | 88,994 | $ | 64,720 | ||||||||||
|
|
|
|
|
|
|
|
|
|
|
|||||||||||
| Borrowings outstanding, end of year (000) |
$ | 64,404 | $ | 70,199 | $ | 59,064 | $ | 49,627 | $ | 46,127 | ||||||||||
|
|
|
|
|
|
|
|
|
|
|
|||||||||||
| Portfolio turnover rate |
23 | % | 17 | % | 18 | % | 19 | % | 18 | % | ||||||||||
|
|
|
|
|
|
|
|
|
|
|
|||||||||||
| (a) | Based on average shares outstanding. |
| (b) | Distributions for annual periods determined in accordance with U.S. federal income tax regulations. |
| (c) | Where applicable, excludes the effects of any sales charges and assumes the reinvestment of distributions. |
| (d) | Interest expense and fees relate to TOB Trusts. See Note 4 of the Notes to Financial Statements for details. |
See notes to financial statements.
| 80 | 2019 BLACKROCK ANNUAL REPORT TO SHAREHOLDERS |
Financial Highlights (continued)
(For a share outstanding throughout each period)
| BlackRock Pennsylvania Municipal Bond Fund (continued) | ||||||||||||||||||||
| Investor A1 | ||||||||||||||||||||
| Year Ended May 31, | ||||||||||||||||||||
| 2019 | 2018 | 2017 | 2016 | 2015 | ||||||||||||||||
| Net asset value, beginning of year |
$ | 11.00 | $ | 11.22 | $ | 11.60 | $ | 11.33 | $ | 11.23 | ||||||||||
|
|
|
|
|
|
|
|
|
|
|
|||||||||||
| Net investment income(a) |
0.42 | 0.44 | 0.45 | 0.46 | 0.46 | |||||||||||||||
| Net realized and unrealized gain (loss) |
0.13 | (0.22 | ) | (0.38 | ) | 0.27 | 0.10 | |||||||||||||
|
|
|
|
|
|
|
|
|
|
|
|||||||||||
| Net increase from investment operations |
0.55 | 0.22 | 0.07 | 0.73 | 0.56 | |||||||||||||||
|
|
|
|
|
|
|
|
|
|
|
|||||||||||
| Distributions from net investment income(b) |
(0.42 | ) | (0.44 | ) | (0.45 | ) | (0.46 | ) | (0.46 | ) | ||||||||||
|
|
|
|
|
|
|
|
|
|
|
|||||||||||
| Net asset value, end of year |
$ | 11.13 | $ | 11.00 | $ | 11.22 | $ | 11.60 | $ | 11.33 | ||||||||||
|
|
|
|
|
|
|
|
|
|
|
|||||||||||
| Total Return(c) |
||||||||||||||||||||
| Based on net asset value |
5.11 | % | 2.01 | % | 0.66 | % | 6.57 | % | 5.00 | % | ||||||||||
|
|
|
|
|
|
|
|
|
|
|
|||||||||||
| Ratios to Average Net Assets |
||||||||||||||||||||
| Total expenses |
1.05 | % | 0.98 | % | 0.94 | % | 0.87 | % | 0.86 | % | ||||||||||
|
|
|
|
|
|
|
|
|
|
|
|||||||||||
| Total expenses after fees waived and/or reimbursed and paid indirectly |
0.94 | % | 0.88 | % | 0.85 | % | 0.81 | % | 0.80 | % | ||||||||||
|
|
|
|
|
|
|
|
|
|
|
|||||||||||
| Total expenses after fees waived and/or reimbursed and paid indirectly and excluding interest expense, fees and amortization of offering costs(d) |
0.64 | % | 0.65 | % | 0.68 | % | 0.73 | % | 0.73 | % | ||||||||||
|
|
|
|
|
|
|
|
|
|
|
|||||||||||
| Net investment income |
3.83 | % | 3.96 | % | 3.99 | % | 4.02 | % | 4.00 | % | ||||||||||
|
|
|
|
|
|
|
|
|
|
|
|||||||||||
| Supplemental Data |
||||||||||||||||||||
| Net assets, end of year (000) |
$ | 10,502 | $ | 13,763 | $ | 15,266 | $ | 16,030 | $ | 16,548 | ||||||||||
|
|
|
|
|
|
|
|
|
|
|
|||||||||||
| Borrowings outstanding, end of year (000) |
$ | 64,404 | $ | 70,199 | $ | 59,064 | $ | 49,627 | $ | 46,127 | ||||||||||
|
|
|
|
|
|
|
|
|
|
|
|||||||||||
| Portfolio turnover rate |
23 | % | 17 | % | 18 | % | 19 | % | 18 | % | ||||||||||
|
|
|
|
|
|
|
|
|
|
|
|||||||||||
| (a) | Based on average shares outstanding. |
| (b) | Distributions for annual periods determined in accordance with U.S. federal income tax regulations. |
| (c) | Where applicable, excludes the effects of any sales charges and assumes the reinvestment of distributions. |
| (d) | Interest expense and fees relate to TOB Trusts. See Note 4 of the Notes to Financial Statements for details. |
See notes to financial statements.
| FINANCIAL HIGHLIGHTS | 81 |
Financial Highlights (continued)
(For a share outstanding throughout each period)
| BlackRock Pennsylvania Municipal Bond Fund (continued) | ||||||||||||||||||||
| Investor C | ||||||||||||||||||||
| Year Ended May 31, | ||||||||||||||||||||
| 2019 | 2018 | 2017 | 2016 | 2015 | ||||||||||||||||
| Net asset value, beginning of year |
$ | 10.99 | $ | 11.22 | $ | 11.59 | $ | 11.32 | $ | 11.22 | ||||||||||
|
|
|
|
|
|
|
|
|
|
|
|||||||||||
| Net investment income(a) |
0.32 | 0.34 | 0.35 | 0.35 | 0.35 | |||||||||||||||
| Net realized and unrealized gain (loss) |
0.13 | (0.23 | ) | (0.37 | ) | 0.27 | 0.10 | |||||||||||||
|
|
|
|
|
|
|
|
|
|
|
|||||||||||
| Net increase (decrease) from investment operations |
0.45 | 0.11 | (0.02 | ) | 0.62 | 0.45 | ||||||||||||||
|
|
|
|
|
|
|
|
|
|
|
|||||||||||
| Distributions from net investment income(b) |
(0.32 | ) | (0.34 | ) | (0.35 | ) | (0.35 | ) | (0.35 | ) | ||||||||||
|
|
|
|
|
|
|
|
|
|
|
|||||||||||
| Net asset value, end of year |
$ | 11.12 | $ | 10.99 | $ | 11.22 | $ | 11.59 | $ | 11.32 | ||||||||||
|
|
|
|
|
|
|
|
|
|
|
|||||||||||
| Total Return(c) |
||||||||||||||||||||
| Based on net asset value |
4.18 | % | 1.01 | % | (0.17 | )% | 5.57 | % | 4.01 | % | ||||||||||
|
|
|
|
|
|
|
|
|
|
|
|||||||||||
| Ratios to Average Net Assets |
||||||||||||||||||||
| Total expenses |
1.95 | % | 1.87 | % | 1.84 | % | 1.76 | % | 1.75 | % | ||||||||||
|
|
|
|
|
|
|
|
|
|
|
|||||||||||
| Total expenses after fees waived and/or reimbursed and paid indirectly |
1.84 | % | 1.78 | % | 1.76 | % | 1.76 | % | 1.74 | % | ||||||||||
|
|
|
|
|
|
|
|
|
|
|
|||||||||||
| Total expenses after fees waived and/or reimbursed and paid indirectly and excluding interest expense, fees and amortization of offering costs(d) |
1.54 | % | 1.54 | % | 1.59 | % | 1.68 | % | 1.68 | % | ||||||||||
|
|
|
|
|
|
|
|
|
|
|
|||||||||||
| Net investment income |
2.93 | % | 3.06 | % | 3.08 | % | 3.07 | % | 3.04 | % | ||||||||||
|
|
|
|
|
|
|
|
|
|
|
|||||||||||
| Supplemental Data |
||||||||||||||||||||
| Net assets, end of year (000) |
$ | 29,936 | $ | 32,105 | $ | 33,427 | $ | 34,195 | $ | 28,972 | ||||||||||
|
|
|
|
|
|
|
|
|
|
|
|||||||||||
| Borrowings outstanding, end of year (000) |
$ | 64,404 | $ | 70,199 | $ | 59,064 | $ | 49,627 | $ | 46,127 | ||||||||||
|
|
|
|
|
|
|
|
|
|
|
|||||||||||
| Portfolio turnover rate |
23 | % | 17 | % | 18 | % | 19 | % | 18 | % | ||||||||||
|
|
|
|
|
|
|
|
|
|
|
|||||||||||
| (a) | Based on average shares outstanding. |
| (b) | Distributions for annual periods determined in accordance with U.S. federal income tax regulations. |
| (c) | Where applicable, excludes the effects of any sales charges and assumes the reinvestment of distributions. |
| (d) | Interest expense and fees relate to TOB Trusts. See Note 4 of the Notes to Financial Statements for details. |
See notes to financial statements.
| 82 | 2019 BLACKROCK ANNUAL REPORT TO SHAREHOLDERS |
Financial Highlights (continued)
(For a share outstanding throughout each period)
| BlackRock Pennsylvania Municipal Bond Fund (continued) | ||||||||||||||||||||
| Investor C1 | ||||||||||||||||||||
| Year Ended May 31, | ||||||||||||||||||||
| 2019 | 2018 | 2017 | 2016 | 2015 | ||||||||||||||||
| Net asset value, beginning of year |
$ | 10.98 | $ | 11.21 | $ | 11.58 | $ | 11.31 | $ | 11.21 | ||||||||||
|
|
|
|
|
|
|
|
|
|
|
|||||||||||
| Net investment income(a) |
0.36 | 0.39 | 0.39 | 0.40 | 0.39 | |||||||||||||||
| Net realized and unrealized gain (loss) |
0.13 | (0.23 | ) | (0.37 | ) | 0.27 | 0.10 | |||||||||||||
|
|
|
|
|
|
|
|
|
|
|
|||||||||||
| Net increase from investment operations |
0.49 | 0.16 | 0.02 | 0.67 | 0.49 | |||||||||||||||
|
|
|
|
|
|
|
|
|
|
|
|||||||||||
| Distributions from net investment income(b) |
(0.36 | ) | (0.39 | ) | (0.39 | ) | (0.40 | ) | (0.39 | ) | ||||||||||
|
|
|
|
|
|
|
|
|
|
|
|||||||||||
| Net asset value, end of year |
$ | 11.11 | $ | 10.98 | $ | 11.21 | $ | 11.58 | $ | 11.31 | ||||||||||
|
|
|
|
|
|
|
|
|
|
|
|||||||||||
| Total Return(c) |
||||||||||||||||||||
| Based on net asset value |
4.62 | % | 1.42 | % | 0.23 | % | 6.01 | % | 4.45 | % | ||||||||||
|
|
|
|
|
|
|
|
|
|
|
|||||||||||
| Ratios to Average Net Assets |
||||||||||||||||||||
| Total expenses |
1.52 | % | 1.47 | % | 1.44 | % | 1.36 | % | 1.35 | % | ||||||||||
|
|
|
|
|
|
|
|
|
|
|
|||||||||||
| Total expenses after fees waived and/or reimbursed and paid indirectly |
1.41 | % | 1.36 | % | 1.36 | % | 1.34 | % | 1.33 | % | ||||||||||
|
|
|
|
|
|
|
|
|
|
|
|||||||||||
| Total expenses after fees waived and/or reimbursed and paid indirectly and excluding interest expense, fees and amortization of offering costs(d) |
1.11 | % | 1.14 | % | 1.19 | % | 1.26 | % | 1.26 | % | ||||||||||
|
|
|
|
|
|
|
|
|
|
|
|||||||||||
| Net investment income |
3.31 | % | 3.48 | % | 3.47 | % | 3.49 | % | 3.46 | % | ||||||||||
|
|
|
|
|
|
|
|
|
|
|
|||||||||||
| Supplemental Data |
||||||||||||||||||||
| Net assets, end of year (000) |
$ | 8 | $ | 1,580 | $ | 1,575 | $ | 4,528 | $ | 4,735 | ||||||||||
|
|
|
|
|
|
|
|
|
|
|
|||||||||||
| Borrowings outstanding, end of year (000) |
$ | 64,404 | $ | 70,199 | $ | 59,064 | $ | 49,627 | $ | 46,127 | ||||||||||
|
|
|
|
|
|
|
|
|
|
|
|||||||||||
| Portfolio turnover rate |
23 | % | 17 | % | 18 | % | 19 | % | 18 | % | ||||||||||
|
|
|
|
|
|
|
|
|
|
|
|||||||||||
| (a) | Based on average shares outstanding. |
| (b) | Distributions for annual periods determined in accordance with U.S. federal income tax regulations. |
| (c) | Where applicable, excludes the effects of any sales charges and assumes the reinvestment of distributions. |
| (d) | Interest expense and fees relate to TOB Trusts. See Note 4 of the Notes to Financial Statements for details. |
See notes to financial statements.
| FINANCIAL HIGHLIGHTS | 83 |
Financial Highlights (continued)
(For a share outstanding throughout each period)
| BlackRock Pennsylvania Municipal Bond Fund (continued) |
||||||||
| Class K | ||||||||
| Year Ended 05/31/19 |
Period from to 05/31/18 |
|||||||
| Net asset value, beginning of period |
$ | 10.98 | $ | 11.07 | ||||
|
|
|
|
|
|||||
| Net investment income(b) |
0.43 | 0.15 | ||||||
| Net realized and unrealized gain (loss) |
0.13 | (0.09 | ) | |||||
|
|
|
|
|
|||||
| Net increase from investment operations |
0.56 | 0.06 | ||||||
|
|
|
|
|
|||||
| Distributions from net investment income(c) |
(0.43 | ) | (0.15 | ) | ||||
|
|
|
|
|
|||||
| Net asset value, end of period |
$ | 11.11 | $ | 10.98 | ||||
|
|
|
|
|
|||||
| Total Return(d) |
||||||||
| Based on net asset value |
5.28 | % | 0.60 | %(e) | ||||
|
|
|
|
|
|||||
| Ratios to Average Net Assets |
||||||||
| Total expenses |
0.90 | % | 0.84 | %(f)(g) | ||||
|
|
|
|
|
|||||
| Total expenses after fees waived and/or reimbursed and paid indirectly |
0.79 | % | 0.72 | %(f) | ||||
|
|
|
|
|
|||||
| Total expenses after fees waived and/or reimbursed and paid indirectly and excluding interest expense, fees and amortization of offering costs(h) |
0.49 | % | 0.49 | %(f) | ||||
|
|
|
|
|
|||||
| Net investment income |
3.98 | % | 4.41 | %(f) | ||||
|
|
|
|
|
|||||
| Supplemental Data |
||||||||
| Net assets, end of period (000) |
$ | 2,329 | $ | 2,488 | ||||
|
|
|
|
|
|||||
| Borrowings outstanding, end of period (000) |
$ | 64,404 | $ | 70,199 | ||||
|
|
|
|
|
|||||
| 23 | % | 17 | % | |||||
|
|
|
|
|
|||||
| (a) | Commencement of operations. |
| (b) | Based on average shares outstanding. |
| (c) | Distributions for annual periods determined in accordance with U.S. federal income tax regulations |
| (d) | Where applicable, assumes the reinvestment of distributions. |
| (e) | Aggregate total return. |
| (f) | Annualized. |
| (g) | Offering costs were not annualized in the calculation of the expense ratios. If these expenses were annualized, the total expenses would have been 0.84%. |
| (h) | Interest expense and fees relate to TOB Trusts. See Note 4 of the Notes to Financial Statements for details. |
See notes to financial statements.
| 84 | 2019 BLACKROCK ANNUAL REPORT TO SHAREHOLDERS |
Financial Highlights (continued)
(For a share outstanding throughout each period)
| BlackRock Strategic Municipal Opportunities Fund | ||||||||||||||||||||
| Institutional | ||||||||||||||||||||
| Year Ended May 31, | ||||||||||||||||||||
| 2019 | 2018 | 2017 | 2016 | 2015 | ||||||||||||||||
| Net asset value, beginning of year |
$ | 11.75 | $ | 11.57 | $ | 11.79 | $ | 11.24 | $ | 11.35 | ||||||||||
|
|
|
|
|
|
|
|
|
|
|
|||||||||||
| Net investment income(a) |
0.35 | 0.33 | 0.31 | 0.31 | 0.32 | |||||||||||||||
| Net realized and unrealized gain (loss) |
0.14 | 0.18 | (0.07 | ) | 0.55 | (0.07 | ) | |||||||||||||
|
|
|
|
|
|
|
|
|
|
|
|||||||||||
| Net increase from investment operations |
0.49 | 0.51 | 0.24 | 0.86 | 0.25 | |||||||||||||||
|
|
|
|
|
|
|
|
|
|
|
|||||||||||
| Distributions(b) |
||||||||||||||||||||
| From net investment income |
(0.35 | ) | (0.33 | ) | (0.31 | ) | (0.31 | ) | (0.32 | ) | ||||||||||
| From net realized gain |
(0.19 | ) | — | (0.15 | ) | — | (0.04 | ) | ||||||||||||
|
|
|
|
|
|
|
|
|
|
|
|||||||||||
| Total distributions |
(0.54 | ) | (0.33 | ) | (0.46 | ) | (0.31 | ) | (0.36 | ) | ||||||||||
|
|
|
|
|
|
|
|
|
|
|
|||||||||||
| Net asset value, end of year |
$ | 11.70 | $ | 11.75 | $ | 11.57 | $ | 11.79 | $ | 11.24 | ||||||||||
|
|
|
|
|
|
|
|
|
|
|
|||||||||||
| Total Return(c) |
||||||||||||||||||||
| Based on net asset value |
4.41 | % | 4.47 | % | 2.13 | % | 7.76 | % | 2.13 | % | ||||||||||
|
|
|
|
|
|
|
|
|
|
|
|||||||||||
| Ratios to Average Net Assets(d) |
||||||||||||||||||||
| Total expenses |
0.82 | % | 0.81 | % | 0.74 | % | 0.72 | % | 0.69 | % | ||||||||||
|
|
|
|
|
|
|
|
|
|
|
|||||||||||
| Total expenses after fees waived and/or reimbursed and paid indirectly |
0.77 | % | 0.75 | % | 0.69 | % | 0.67 | % | 0.64 | % | ||||||||||
|
|
|
|
|
|
|
|
|
|
|
|||||||||||
| Total expenses after fees waived and/or reimbursed and paid indirectly and excluding interest expense and fees and amortization of offering costs(e) |
0.55 | % | 0.57 | % | 0.57 | % | 0.59 | % | 0.59 | % | ||||||||||
|
|
|
|
|
|
|
|
|
|
|
|||||||||||
| Net investment income |
3.05 | % | 2.83 | % | 2.71 | % | 2.69 | % | 2.82 | % | ||||||||||
|
|
|
|
|
|
|
|
|
|
|
|||||||||||
| Supplemental Data |
||||||||||||||||||||
| Net assets, end of year (000) |
$ | 8,539,776 | $ | 5,791,442 | $ | 3,512,455 | $ | 3,197,986 | $ | 2,186,540 | ||||||||||
|
|
|
|
|
|
|
|
|
|
|
|||||||||||
| Borrowings outstanding, end of year (000) |
$ | 960,205 | $ | 767,480 | $ | 526,645 | $ | 412,485 | $ | 298,790 | ||||||||||
|
|
|
|
|
|
|
|
|
|
|
|||||||||||
| Portfolio turnover rate |
68 | % | 145 | % | 171 | % | 174 | % | 185 | % | ||||||||||
|
|
|
|
|
|
|
|
|
|
|
|||||||||||
| (a) | Based on average shares outstanding. |
| (b) | Distributions for annual periods determined in accordance with U.S. federal income tax regulations. |
| (c) | Where applicable, assumes the reinvestment of distributions. |
| (d) | Excludes expenses incurred indirectly as a result of investments in underlying funds as follows: |
| For the Year Ended May 31, | ||||||||||||||||||||||||||||||||||||||||
| 2019 | 2018 | 2017 | 2016 | 2015 | ||||||||||||||||||||||||||||||||||||
| Investments in underlying funds |
0.01 | % | 0.01 | % | 0.01 | % | 0.01 | % | 0.01 | % | ||||||||||||||||||||||||||||||
|
|
|
|
|
|
|
|
|
|
|
|||||||||||||||||||||||||||||||
| (e) | Interest expense and fees relate to TOB Trusts. See Note 4 of the Notes to Financial Statements for details. |
See notes to financial statements.
| FINANCIAL HIGHLIGHTS | 85 |
Financial Highlights (continued)
(For a share outstanding throughout each period)
| BlackRock Strategic Municipal Opportunities Fund (continued) | ||||||||||||||||||||
| Investor A | ||||||||||||||||||||
| Year Ended May 31, | ||||||||||||||||||||
| 2019 | 2018 | 2017 | 2016 | 2015 | ||||||||||||||||
| Net asset value, beginning of year |
$ | 11.74 | $ | 11.56 | $ | 11.78 | $ | 11.23 | $ | 11.35 | ||||||||||
|
|
|
|
|
|
|
|
|
|
|
|||||||||||
| Net investment income(a) |
0.33 | 0.31 | 0.29 | 0.28 | 0.28 | |||||||||||||||
| Net realized and unrealized gain (loss) |
0.14 | 0.18 | (0.07 | ) | 0.55 | (0.07 | ) | |||||||||||||
|
|
|
|
|
|
|
|
|
|
|
|||||||||||
| Net increase from investment operations |
0.47 | 0.49 | 0.22 | 0.83 | 0.21 | |||||||||||||||
|
|
|
|
|
|
|
|
|
|
|
|||||||||||
| Distributions(b) |
||||||||||||||||||||
| From net investment income |
(0.33 | ) | (0.31 | ) | (0.29 | ) | (0.28 | ) | (0.29 | ) | ||||||||||
| From net realized gain |
(0.19 | ) | — | (0.15 | ) | — | (0.04 | ) | ||||||||||||
|
|
|
|
|
|
|
|
|
|
|
|||||||||||
| Total distributions |
(0.52 | ) | (0.31 | ) | (0.44 | ) | (0.28 | ) | (0.33 | ) | ||||||||||
|
|
|
|
|
|
|
|
|
|
|
|||||||||||
| Net asset value, end of year |
$ | 11.69 | $ | 11.74 | $ | 11.56 | $ | 11.78 | $ | 11.23 | ||||||||||
|
|
|
|
|
|
|
|
|
|
|
|||||||||||
| Total Return(c) |
||||||||||||||||||||
| Based on net asset value |
4.17 | % | 4.26 | % | 1.92 | % | 7.62 | % | 1.81 | % | ||||||||||
|
|
|
|
|
|
|
|
|
|
|
|||||||||||
| Ratios to Average Net Assets(d) |
||||||||||||||||||||
| Total expenses |
1.05 | % | 1.02 | % | 0.95 | % | 0.94 | % | 0.92 | % | ||||||||||
|
|
|
|
|
|
|
|
|
|
|
|||||||||||
| Total expenses after fees waived and/or reimbursed and paid indirectly |
1.00 | % | 0.96 | % | 0.90 | % | 0.89 | % | 0.87 | % | ||||||||||
|
|
|
|
|
|
|
|
|
|
|
|||||||||||
| Total expenses after fees waived and/or reimbursed and paid indirectly and excluding interest expense and fees and amortization of offering costs(e) |
0.78 | % | 0.78 | % | 0.78 | % | 0.80 | % | 0.82 | % | ||||||||||
|
|
|
|
|
|
|
|
|
|
|
|||||||||||
| Net investment income |
2.82 | % | 2.63 | % | 2.50 | % | 2.47 | % | 2.59 | % | ||||||||||
|
|
|
|
|
|
|
|
|
|
|
|||||||||||
| Supplemental Data |
||||||||||||||||||||
| Net assets, end of year (000) |
$ | 1,846,094 | $ | 1,441,879 | $ | 1,049,555 | $ | 1,111,770 | $ | 801,753 | ||||||||||
|
|
|
|
|
|
|
|
|
|
|
|||||||||||
| Borrowings outstanding, end of year (000) |
$ | 960,205 | $ | 767,480 | $ | 526,645 | $ | 412,485 | $ | 298,790 | ||||||||||
|
|
|
|
|
|
|
|
|
|
|
|||||||||||
| Portfolio turnover rate |
68 | % | 145 | % | 171 | % | 174 | % | 185 | % | ||||||||||
|
|
|
|
|
|
|
|
|
|
|
|||||||||||
| (a) | Based on average shares outstanding. |
| (b) | Distributions for annual periods determined in accordance with U.S. federal income tax regulations. |
| (c) | Where applicable, excludes the effects of any sales charges and assumes the reinvestment of distributions. |
| (d) | Excludes expenses incurred indirectly as a result of investments in underlying funds as follows: |
| For the Year Ended May 31, | ||||||||||||||||||||||||||||||||||||||||
| 2019 | 2018 | 2017 | 2016 | 2015 | ||||||||||||||||||||||||||||||||||||
| Investments in underlying funds |
0.01 | % | 0.01 | % | 0.01 | % | 0.01 | % | 0.01 | % | ||||||||||||||||||||||||||||||
|
|
|
|
|
|
|
|
|
|
|
|||||||||||||||||||||||||||||||
| (e) | Interest expense and fees relate to TOB Trusts. See Note 4 of the Notes to Financial Statements for details. |
See notes to financial statements.
| 86 | 2019 BLACKROCK ANNUAL REPORT TO SHAREHOLDERS |
Financial Highlights (continued)
(For a share outstanding throughout each period)
| BlackRock Strategic Municipal Opportunities Fund (continued) | ||||||||||||||||||||
| Investor A1 | ||||||||||||||||||||
| Year Ended May 31, | ||||||||||||||||||||
| 2019 | 2018 | 2017 | 2016 | 2015 | ||||||||||||||||
| Net asset value, beginning of year |
$ | 11.75 | $ | 11.56 | $ | 11.79 | $ | 11.23 | $ | 11.35 | ||||||||||
|
|
|
|
|
|
|
|
|
|
|
|||||||||||
| Net investment income(a) |
0.35 | 0.32 | 0.31 | 0.30 | 0.31 | |||||||||||||||
| Net realized and unrealized gain (loss) |
0.14 | 0.19 | (0.09 | ) | 0.56 | (0.09 | ) | |||||||||||||
|
|
|
|
|
|
|
|
|
|
|
|||||||||||
| Net increase from investment operations |
0.49 | 0.51 | 0.22 | 0.86 | 0.22 | |||||||||||||||
|
|
|
|
|
|
|
|
|
|
|
|||||||||||
| Distributions(b) |
||||||||||||||||||||
| From net investment income |
(0.35 | ) | (0.32 | ) | (0.30 | ) | (0.30 | ) | (0.30 | ) | ||||||||||
| From net realized gain |
(0.19 | ) | — | (0.15 | ) | — | (0.04 | ) | ||||||||||||
|
|
|
|
|
|
|
|
|
|
|
|||||||||||
| Total distributions |
(0.54 | ) | (0.32 | ) | (0.45 | ) | (0.30 | ) | (0.34 | ) | ||||||||||
|
|
|
|
|
|
|
|
|
|
|
|||||||||||
| Net asset value, end of year |
$ | 11.70 | $ | 11.75 | $ | 11.56 | $ | 11.79 | $ | 11.23 | ||||||||||
|
|
|
|
|
|
|
|
|
|
|
|||||||||||
| Total Return(c) |
||||||||||||||||||||
| Based on net asset value |
4.33 | % | 4.49 | % | 1.98 | % | 7.78 | % | 1.94 | % | ||||||||||
|
|
|
|
|
|
|
|
|
|
|
|||||||||||
| Ratios to Average Net Assets(d) |
||||||||||||||||||||
| Total expenses |
0.90 | % | 0.88 | % | 0.81 | % | 0.79 | % | 0.78 | % | ||||||||||
|
|
|
|
|
|
|
|
|
|
|
|||||||||||
| Total expenses after fees waived and/or reimbursed and paid indirectly |
0.84 | % | 0.83 | % | 0.76 | % | 0.74 | % | 0.73 | % | ||||||||||
|
|
|
|
|
|
|
|
|
|
|
|||||||||||
| Total expenses after fees waived and/or reimbursed and paid indirectly and excluding interest expense and fees and amortization of offering costs(e) |
0.62 | % | 0.64 | % | 0.64 | % | 0.66 | % | 0.68 | % | ||||||||||
|
|
|
|
|
|
|
|
|
|
|
|||||||||||
| Net investment income |
2.99 | % | 2.77 | % | 2.64 | % | 2.65 | % | 2.70 | % | ||||||||||
|
|
|
|
|
|
|
|
|
|
|
|||||||||||
| Supplemental Data |
||||||||||||||||||||
| Net assets, end of year (000) |
$ | 27,606 | $ | 29,233 | $ | 30,691 | $ | 33,472 | $ | 34,264 | ||||||||||
|
|
|
|
|
|
|
|
|
|
|
|||||||||||
| Borrowings outstanding, end of year (000) |
$ | 960,205 | $ | 767,480 | $ | 526,645 | $ | 412,485 | $ | 298,790 | ||||||||||
|
|
|
|
|
|
|
|
|
|
|
|||||||||||
| Portfolio turnover rate |
68 | % | 145 | % | 171 | % | 174 | % | 185 | % | ||||||||||
|
|
|
|
|
|
|
|
|
|
|
|||||||||||
| (a) | Based on average shares outstanding. |
| (b) | Distributions for annual periods determined in accordance with U.S. federal income tax regulations. |
| (c) | Where applicable, excludes the effects of any sales charges and assumes the reinvestment of distributions. |
| (d) | Excludes expenses incurred indirectly as a result of investments in underlying funds as follows: |
| For the Year Ended May 31, | ||||||||||||||||||||||||||||||||||||||||
| 2019 | 2018 | 2017 | 2016 | 2015 | ||||||||||||||||||||||||||||||||||||
| Investments in underlying funds |
0.01 | % | 0.01 | % | 0.01 | % | 0.01 | % | 0.01 | % | ||||||||||||||||||||||||||||||
|
|
|
|
|
|
|
|
|
|
|
|||||||||||||||||||||||||||||||
| (e) | Interest expense and fees relate to TOB Trusts. See Note 4 of the Notes to Financial Statements for details. |
See notes to financial statements.
| FINANCIAL HIGHLIGHTS | 87 |
Financial Highlights (continued)
(For a share outstanding throughout each period)
| BlackRock Strategic Municipal Opportunities Fund (continued) | ||||||||||||||||||||
| Investor C | ||||||||||||||||||||
| Year Ended May 31, | ||||||||||||||||||||
| 2019 | 2018 | 2017 | 2016 | 2015 | ||||||||||||||||
| Net asset value, beginning of year |
$ | 11.75 | $ | 11.56 | $ | 11.79 | $ | 11.23 | $ | 11.35 | ||||||||||
|
|
|
|
|
|
|
|
|
|
|
|||||||||||
| Net investment income(a) |
0.24 | 0.22 | 0.20 | 0.20 | 0.20 | |||||||||||||||
| Net realized and unrealized gain (loss) |
0.14 | 0.19 | (0.08 | ) | 0.56 | (0.08 | ) | |||||||||||||
|
|
|
|
|
|
|
|
|
|
|
|||||||||||
| Net increase from investment operations |
0.38 | 0.41 | 0.12 | 0.76 | 0.12 | |||||||||||||||
|
|
|
|
|
|
|
|
|
|
|
|||||||||||
| Distributions(b) |
||||||||||||||||||||
| From net investment income |
(0.24 | ) | (0.22 | ) | (0.20 | ) | (0.20 | ) | (0.20 | ) | ||||||||||
| From net realized gain |
(0.19 | ) | — | (0.15 | ) | — | (0.04 | ) | ||||||||||||
|
|
|
|
|
|
|
|
|
|
|
|||||||||||
| Total distributions |
(0.43 | ) | (0.22 | ) | (0.35 | ) | (0.20 | ) | (0.24 | ) | ||||||||||
|
|
|
|
|
|
|
|
|
|
|
|||||||||||
| Net asset value, end of year |
$ | 11.70 | $ | 11.75 | $ | 11.56 | $ | 11.79 | $ | 11.23 | ||||||||||
|
|
|
|
|
|
|
|
|
|
|
|||||||||||
| Total Return(c) |
||||||||||||||||||||
| Based on net asset value |
3.39 | % | 3.54 | % | 1.05 | % | 6.80 | % | 1.03 | % | ||||||||||
|
|
|
|
|
|
|
|
|
|
|
|||||||||||
| Ratios to Average Net Assets(d) |
||||||||||||||||||||
| Total expenses |
1.81 | % | 1.79 | % | 1.72 | % | 1.70 | % | 1.69 | % | ||||||||||
|
|
|
|
|
|
|
|
|
|
|
|||||||||||
| Total expenses after fees waived and/or reimbursed and paid indirectly |
1.75 | % | 1.73 | % | 1.67 | % | 1.65 | % | 1.64 | % | ||||||||||
|
|
|
|
|
|
|
|
|
|
|
|||||||||||
| Total expenses after fees waived and/or reimbursed and paid indirectly and excluding interest expense and fees and amortization of offering costs(e) |
1.53 | % | 1.55 | % | 1.55 | % | 1.57 | % | 1.58 | % | ||||||||||
|
|
|
|
|
|
|
|
|
|
|
|||||||||||
| Net investment income |
2.07 | % | 1.86 | % | 1.73 | % | 1.72 | % | 1.80 | % | ||||||||||
|
|
|
|
|
|
|
|
|
|
|
|||||||||||
| Supplemental Data |
||||||||||||||||||||
| Net assets, end of year (000) |
$ | 307,887 | $ | 269,156 | $ | 251,966 | $ | 262,800 | $ | 205,674 | ||||||||||
|
|
|
|
|
|
|
|
|
|
|
|||||||||||
| Borrowings outstanding, end of year (000) |
$ | 960,205 | $ | 767,480 | $ | 526,645 | $ | 412,485 | $ | 298,790 | ||||||||||
|
|
|
|
|
|
|
|
|
|
|
|||||||||||
| Portfolio turnover rate |
68 | % | 145 | % | 171 | % | 174 | % | 185 | % | ||||||||||
|
|
|
|
|
|
|
|
|
|
|
|||||||||||
| (a) | Based on average shares outstanding. |
| (b) | Distributions for annual periods determined in accordance with U.S. federal income tax regulations. |
| (c) | Where applicable, excludes the effects of any sales charges and assumes the reinvestment of distributions. |
| (d) | Excludes expenses incurred indirectly as a result of investments in underlying funds as follows: |
| For the Year Ended May 31, | ||||||||||||||||||||||||||||||||||||||||
| 2019 | 2018 | 2017 | 2016 | 2015 | ||||||||||||||||||||||||||||||||||||
| Investments in underlying funds |
0.01 | % | 0.01 | % | 0.01 | % | 0.01 | % | 0.01 | % | ||||||||||||||||||||||||||||||
|
|
|
|
|
|
|
|
|
|
|
|||||||||||||||||||||||||||||||
| (e) | Interest expense and fees relate to TOB Trusts. See Note 4 of the Notes to Financial Statements for details. |
See notes to financial statements.
| 88 | 2019 BLACKROCK ANNUAL REPORT TO SHAREHOLDERS |
Financial Highlights (continued)
(For a share outstanding throughout each period)
| BlackRock Strategic Municipal Opportunities Fund (continued) |
||||||||
| Class K | ||||||||
| Year Ended 05/31/19 |
Period from 01/25/18 (a) to 05/31/18 |
|||||||
| Net asset value, beginning of period |
$ | 11.75 | $ | 11.73 | ||||
|
|
|
|
|
|||||
| Net investment income(b) |
0.36 | 0.11 | ||||||
| Net realized and unrealized gain (loss) |
0.14 | 0.02 | ||||||
|
|
|
|
|
|||||
| Net increase from investment operations |
0.50 | 0.13 | ||||||
|
|
|
|
|
|||||
| Distributions(c) |
||||||||
| From net investment income |
(0.36 | ) | (0.11 | ) | ||||
| From net realized gain |
(0.19 | ) | — | |||||
|
|
|
|
|
|||||
| Total distributions |
(0.55 | ) | (0.11 | ) | ||||
|
|
|
|
|
|||||
| Net asset value, end of period |
$ | 11.70 | $ | 11.75 | ||||
|
|
|
|
|
|||||
| Total Return(d) |
||||||||
| Based on net asset value |
4.47 | % | 1.16 | %(e) | ||||
|
|
|
|
|
|||||
| Ratios to Average Net Assets(f) |
||||||||
| Total expenses |
0.76 | % | 0.74 | %(g)(h) | ||||
|
|
|
|
|
|||||
| Total expenses after fees waived and/or reimbursed and paid indirectly |
0.71 | % | 0.68 | %(h) | ||||
|
|
|
|
|
|||||
| Total expenses after fees waived and/or reimbursed and paid indirectly and excluding interest expense and fees and amortization of offering costs(i) |
0.48 | % | 0.50 | %(h) | ||||
|
|
|
|
|
|||||
| Net investment income |
3.11 | % | 3.20 | %(h) | ||||
|
|
|
|
|
|||||
| Supplemental Data |
||||||||
| Net assets, end of period (000) |
$ | 126,051 | $ | 63,971 | ||||
|
|
|
|
|
|||||
| Borrowings outstanding, end of period (000) |
$ | 960,205 | $ | 767,480 | ||||
|
|
|
|
|
|||||
| Portfolio turnover rate |
68 | % | 145 | % | ||||
|
|
|
|
|
|||||
| (a) | Commencement of operations. |
| (b) | Based on average shares outstanding. |
| (c) | Distributions for annual periods determined in accordance with U.S. federal income tax regulations. |
| (d) | Where applicable, assumes the reinvestment of distributions. |
| (e) | Aggregate total return. |
| (f) | Excludes expenses incurred indirectly as a result of investments in underlying funds as follows: |
| For the Year Ended 05/31/19 |
Period from 01/25/18 (a) to 05/31/18 |
|||||||||||||||
| Investments in underlying funds |
0.01 | % | 0.01 | % | ||||||||||||
|
|
|
|
|
|||||||||||||
| (g) | Offering costs were not annualized in the calculation of the expense ratios. If these expenses were annualized, the total expenses would have been 0.74%. |
| (h) | Annualized. |
| (i) | Interest expense and fees relate to TOB Trusts. See Note 4 of the Notes to Financial Statements for details. |
See notes to financial statements.
| FINANCIAL HIGHLIGHTS | 89 |
| 1. | ORGANIZATION |
BlackRock California Municipal Series Trust, BlackRock Multi-State Municipal Series Trust and BlackRock Municipal Series Trust (each, a “Trust” or collectively, the “Trusts”) are each registered under the Investment Company Act of 1940, as amended (the “1940 Act”), as open-end management investment companies. Each Trust is organized as a Massachusetts business trust. The following are referred to herein collectively as the “Funds” and individually as a “Fund”:
| Registrant Name | Fund Name | Herein Referred To As | Diversification Classification | |||
| BlackRock California Municipal Series Trust |
BlackRock California Municipal Opportunities Fund | California Municipal Opportunities | Diversified | |||
| BlackRock Multi-State Municipal Series Trust |
BlackRock New Jersey Municipal Bond Fund | New Jersey Municipal Bond | Non-diversified | |||
| BlackRock Pennsylvania Municipal Bond Fund | Pennsylvania Municipal Bond | Non-diversified | ||||
| BlackRock Municipal Series Trust |
BlackRock Strategic Municipal Opportunities Fund | Strategic Municipal Opportunities | Diversified |
Each Fund offers multiple classes of shares. All classes of shares have identical voting, dividend, liquidation and other rights and are subject to the same terms and conditions, except that certain classes bear expenses related to the shareholder servicing and distribution of such shares. Institutional, Service and Class K Shares are sold without a sales charge and only to certain eligible investors. Investor A and Investor C Shares are generally available through financial intermediaries. Investor A1 and C1 Shares are only available for dividend and capital gain reinvestment by existing shareholders, and for purchase by certain employer-sponsored retirement plans and, for California Municipal Opportunities only, fee based programs previously approved by the Fund. Each class has exclusive voting rights with respect to matters relating to its shareholder servicing and distribution expenditures (except that Investor C shareholders may vote on material changes to the Investor A distribution and service plan). Effective November 8, 2018, each Fund adopted an automatic conversion feature whereby Investor C and C1 Shares held for approximately ten years will be automatically converted into Investor A Shares and, thereafter, investors will be subject to lower ongoing fees.
| Share Class | Initial Sales Charge | CDSC | Conversion Privilege | |||||||
| Institutional, Service and Class K Shares |
No | No | None | |||||||
| Investor A Shares |
Yes | No | (a) | None | ||||||
| Investor A1 Shares |
No | (b) | No | (c) | None | |||||
| Investor C Shares |
No | Yes | To Investor A Shares after approximately 10 years | |||||||
| Investor C1 Shares |
No | No | (d) | To Investor A Shares after approximately 10 years | ||||||
| (a) | Investor A Shares may be subject to a contingent deferred sales charge (“CDSC”) for certain redemptions where no initial sales charge was paid at the time of purchase. |
| (b) | Investor A1 Shares are subject to a maximum sales charge on purchases of 1.00%. The sales charge does not apply to dividend and capital gain reinvestments by existing shareholders and new purchases for certain employer-sponsored retirement plans or, for California Municipal Opportunities only, fee based programs previously approved by the Fund, which are currently the only investors who may invest in Investor A1 Shares. |
| (c) | Investor A1 Shares may be subject to CDSC for certain redemptions where no initial sales charge was paid at the time of purchase. However, the CDSC does not apply to redemptions by certain employer-sponsored retirement plans or to redemptions of shares acquired through the reinvestment of dividends and capital gains by existing shareholders and, for California Municipal Opportunities only, fee based programs previously approved by the Fund. |
| (d) | A CDSC of 1.00% is assessed on certain redemptions of Investor C1 Shares made within one year after purchase. The CDSC does not apply to redemptions by certain employer-sponsored retirement plans or to redemptions of shares acquired through reinvestment of dividends and capital gains by existing shareholders, and for California Municipal Opportunities only, fee based programs previously approved by the Fund. |
The Funds, together with certain other registered investment companies advised by BlackRock Advisors, LLC (the “Manager”) or its affiliates, are included in a complex of non-index fixed-income mutual funds and all BlackRock-advised closed-end funds referred to as the BlackRock Fixed-Income Complex.
| 2. | SIGNIFICANT ACCOUNTING POLICIES |
The financial statements are prepared in conformity with accounting principles generally accepted in the United States of America (“U.S. GAAP”), which may require management to make estimates and assumptions that affect the reported amounts of assets and liabilities in the financial statements, disclosure of contingent assets and liabilities at the date of the financial statements and the reported amounts of increases and decreases in net assets from operations during the reporting period. Actual results could differ from those estimates. Each Fund is considered an investment company under U.S. GAAP and follows the accounting and reporting guidance applicable to investment companies. Below is a summary of significant accounting policies:
Investment Transactions and Income Recognition: For financial reporting purposes, investment transactions are recorded on the dates the transactions are executed (the “trade dates”). Realized gains and losses on investment transactions are determined on the identified cost basis. Dividend income is recorded on the ex-dividend date. Interest income, including amortization and accretion of premiums and discounts on debt securities, is recognized on an accrual basis. Income, expenses and realized and unrealized gains and losses are allocated daily to each class based on its relative net assets.
Segregation and Collateralization: In cases where a Fund enters into certain investments (e.g., futures contracts) or certain borrowings (e.g., TOB Trust transactions) that would be treated as “senior securities” for 1940 Act purposes, a Fund may segregate or designate on its books and records cash or liquid assets having a market value at least equal to the amount of its future obligations under such investments or borrowings. Doing so allows the investment or borrowing to be excluded from treatment as a “senior security.” Furthermore, if required by an exchange or counterparty agreement, the Funds may be required to deliver/deposit cash and/or securities to/with an exchange, or broker-dealer or custodian as collateral for certain investments or obligations.
Distributions: Distributions from net investment income are declared daily and paid monthly. Distributions of capital gains are recorded on the ex-dividend date and made at least annually. The portion of distributions, if any, that exceeds a Fund’s current and accumulated earnings and profits, as measured on a tax basis, constitute a non-taxable return of capital. The character and timing of distributions are determined in accordance with U.S. federal income tax regulations, which may differ from U.S. GAAP.
| 90 | 2019 BLACKROCK ANNUAL REPORT TO SHAREHOLDERS |
Notes to Financial Statements (continued)
Deferred Compensation Plan: Under the Deferred Compensation Plan (the “Plan”) approved by each Trust’s Board effective January 1, 2019, the trustees who are not “interested persons” of the Funds, as defined in the 1940 Act (“Independent Trustees”), may defer a portion of their annual complex-wide compensation. Deferred amounts earn an approximate return as though equivalent dollar amounts had been invested in common shares of certain funds in the BlackRock Fixed-Income Complex selected by the Independent Trustees. This has the same economic effect for the Independent Trustees as if the Independent Trustees had invested the deferred amounts directly in certain funds in the BlackRock Fixed-Income Complex.
The Plan is not funded and obligations thereunder represent general unsecured claims against the general assets of each Trust, as applicable. Deferred compensation liabilities are included in the Trustees’ and Officer’s fees payable in the Statements of Assets and Liabilities and will remain as a liability of the Trusts until such amounts are distributed in accordance with the Plan.
Offering Costs: Offering costs are amortized over a 12-month period beginning with the commencement of operations of a class of shares.
Recent Accounting Standards: In March 2017, the Financial Accounting Standards Board issued Accounting Standards Update “Premium Amortization of Purchased Callable Debt Securities” which amends the amortization period for certain purchased callable debt securities. Under the new guidance, the premium amortization of purchased callable debt securities that have explicit, non-contingent call features and are callable at fixed prices will be amortized to the earliest call date. The guidance will be applied on a modified retrospective basis and is effective for fiscal years, and their interim periods, beginning after December 15, 2018. Management continues to evaluate the impact of this guidance on the Funds.
Indemnifications: In the normal course of business, a Fund enters into contracts that contain a variety of representations that provide general indemnification. A Fund’s maximum exposure under these arrangements is unknown because it involves future potential claims against a Fund, which cannot be predicted with any certainty.
Other: Expenses directly related to a Fund or its classes are charged to that Fund or the applicable class. Other operating expenses shared by several funds, including other funds managed by the Manager, are prorated among those funds on the basis of relative net assets or other appropriate methods. Expenses directly related to the Funds and other shared expenses prorated to the Funds are allocated daily to each class based on their relative net assets or other appropriate methods.
| 3. | INVESTMENT VALUATION AND FAIR VALUE MEASUREMENTS |
Investment Valuation Policies: The Funds’ investments are valued at fair value (also referred to as “market value” within the financial statements) as of the close of trading on the New York Stock Exchange (“NYSE”) (generally 4:00 p.m., Eastern time). U.S. GAAP defines fair value as the price the Funds would receive to sell an asset or pay to transfer a liability in an orderly transaction between market participants at the measurement date. The Funds determine the fair values of their financial instruments using various independent dealers or pricing services under policies approved by the Board of Trustees of each Fund (the “Board”). The BlackRock Global Valuation Methodologies Committee (the “Global Valuation Committee”) is the committee formed by management to develop global pricing policies and procedures and to oversee the pricing function for all financial instruments.
Fair Value Inputs and Methodologies: The following methods and inputs are used to establish the fair value of each Fund’s assets and liabilities:
| • | Fixed-income securities for which market quotations are readily available are generally valued using the last available bid prices or current market quotations provided by independent dealers or third party pricing services. Floating rate loan interests are valued at the mean of the bid prices from one or more independent brokers or dealers as obtained from a third party pricing service. Pricing services generally value fixed-income securities assuming orderly transactions of an institutional round lot size, but a fund may hold or transact in such securities in smaller, odd lot sizes. Odd lots may trade at lower prices than institutional round lots. The pricing services may use matrix pricing or valuation models that utilize certain inputs and assumptions to derive values, including transaction data (e.g., recent representative bids and offers), credit quality information, perceived market movements, news, and other relevant information. Certain fixed-income securities, including asset-backed and mortgage related securities may be valued based on valuation models that consider the estimated cash flows of each tranche of the entity, establish a benchmark yield and develop an estimated tranche specific spread to the benchmark yield based on the unique attributes of the tranche. The amortized cost method of valuation may be used with respect to debt obligations with sixty days or less remaining to maturity unless the Manager determines such method does not represent fair value. |
| • | Municipal investments (including commitments to purchase such investments on a “when-issued” basis) are valued on the basis of prices provided by dealers or pricing services. In determining the value of a particular investment, pricing services may use certain information with respect to transactions in such investments, quotations from dealers, pricing matrixes, market transactions in comparable investments and information with respect to various relationships between investments. |
| • | Exchange-traded funds (“ETFs”) traded on a recognized securities exchange are valued at the official closing price each day, if available. For ETFs traded on more than one exchange, the official closing price on the exchange where the stock is primarily traded is used. ETFs traded on a recognized exchange for which there were no sales on that day may be valued at the last available bid (long positions) or ask (short positions) price. |
| • | Investments in open-end U.S. mutual funds are valued at net asset value (“NAV”) each business day. |
| • | Futures contracts traded on exchanges are valued at their last sale price. |
If events (e.g., a company announcement, market volatility or a natural disaster) occur that are expected to materially affect the value of such investments, or in the event that the application of these methods of valuation results in a price for an investment that is deemed not to be representative of the market value of such investment, or if a price is not available, the investment will be valued by the Global Valuation Committee, or its delegate, in accordance with a policy approved by the Board as reflecting fair value (“Fair Valued Investments”). The fair valuation approaches that may be used by the Global Valuation Committee will include market approach, income approach and cost approach. Valuation techniques such as discounted cash flow, use of market comparables and matrix pricing are types of valuation approaches and are typically used
| NOTES TO FINANCIAL STATEMENTS | 91 |
Notes to Financial Statements (continued)
in determining fair value. When determining the price for Fair Valued Investments, the Global Valuation Committee, or its delegate, seeks to determine the price that each Fund might reasonably expect to receive or pay from the current sale or purchase of that asset or liability in an arm’s-length transaction. Fair value determinations shall be based upon all available factors that the Global Valuation Committee, or its delegate, deems relevant and consistent with the principles of fair value measurement. The pricing of all Fair Valued Investments is subsequently reported to the Board or a committee thereof on a quarterly basis.
Fair Value Hierarchy: Various inputs are used in determining the fair value of investments and derivative financial instruments. These inputs to valuation techniques are categorized into a fair value hierarchy consisting of three broad levels for financial statement purposes as follows:
| • | Level 1 — Unadjusted price quotations in active markets/exchanges for identical assets or liabilities that each Fund has the ability to access |
| • | Level 2 — Other observable inputs (including, but not limited to, quoted prices for similar assets or liabilities in markets that are active, quoted prices for identical or similar assets or liabilities in markets that are not active, inputs other than quoted prices that are observable for the assets or liabilities (such as interest rates, yield curves, volatilities, prepayment speeds, loss severities, credit risks and default rates) or other market–corroborated inputs) |
| • | Level 3 — Unobservable inputs based on the best information available in the circumstances, to the extent observable inputs are not available (including each Fund’s own assumptions used in determining the fair value of investments and derivative financial instruments) |
The hierarchy gives the highest priority to unadjusted quoted prices in active markets for identical assets or liabilities (Level 1 measurements) and the lowest priority to unobservable inputs (Level 3 measurements). Accordingly, the degree of judgment exercised in determining fair value is greatest for instruments categorized in Level 3. The inputs used to measure fair value may fall into different levels of the fair value hierarchy. In such cases, for disclosure purposes, the fair value hierarchy classification is determined based on the lowest level input that is significant to the fair value measurement in its entirety. Investments classified within Level 3 have significant unobservable inputs used by the Global Valuation Committee in determining the price for Fair Valued Investments. Level 3 investments include equity or debt issued by privately held companies or funds. There may not be a secondary market, and/or there are a limited number of investors. The categorization of a value determined for investments and derivative financial instruments is based on the pricing transparency of the investments and derivative financial instruments and is not necessarily an indication of the risks associated with investing in those securities.
| 4. | SECURITIES AND OTHER INVESTMENTS |
Zero-Coupon Bonds: Zero-coupon bonds are normally issued at a significant discount from face value and do not provide for periodic interest payments. These bonds may experience greater volatility in market value than other debt obligations of similar maturity which provide for regular interest payments.
Forward Commitments, When-Issued and Delayed Delivery Securities: Certain funds may purchase securities on a when-issued basis and may purchase or sell securities on a forward commitment basis. Settlement of such transactions normally occurs within a month or more after the purchase or sale commitment is made. A fund may purchase securities under such conditions with the intention of actually acquiring them, but may enter into a separate agreement to sell the securities before the settlement date. Since the value of securities purchased may fluctuate prior to settlement, a fund may be required to pay more at settlement than the security is worth. In addition, a fund is not entitled to any of the interest earned prior to settlement. When purchasing a security on a delayed delivery basis, a fund assumes the rights and risks of ownership of the security, including the risk of price and yield fluctuations. In the event of default by the counterparty, a fund’s maximum amount of loss is the unrealized appreciation of unsettled when-issued transactions.
Municipal Bonds Transferred to TOB Trusts: Certain funds leverage their assets through the use of “TOB Trust” transactions. The funds transfer municipal bonds into a special purpose trust (a “TOB Trust”). A TOB Trust issues two classes of beneficial interests: short-term floating rate interests (“TOB Trust Certificates”), which are sold to third party investors, and residual inverse floating rate interests (“TOB Residuals”), which are issued to the participating funds that contributed the municipal bonds to the TOB Trust. The TOB Trust Certificates have interest rates that reset weekly and their holders have the option to tender such certificates to the TOB Trust for redemption at par and any accrued interest at each reset date. The TOB Residuals held by a fund provide the fund with the right to cause the holders of a proportional share of the TOB Trust Certificates to tender their certificates to the TOB Trust at par plus accrued interest. The funds may withdraw a corresponding share of the municipal bonds from the TOB Trust. Other funds managed by the investment adviser may also contribute municipal bonds to a TOB Trust into which a fund has contributed bonds. If multiple BlackRock-advised funds participate in the same TOB Trust, the economic rights and obligations under the TOB Residuals will be shared among the funds ratably in proportion to their participation in the TOB Trust.
TOB Trusts are supported by a liquidity facility provided by a third party bank or other financial institution (the “Liquidity Provider”) that allows the holders of the TOB Trust Certificates to tender their certificates in exchange for payment of par plus accrued interest on any business day. The tendered TOB Trust Certificates are remarketed by a Remarketing Agent. In the event of a failed remarketing, the TOB Trust may draw upon a loan from the Liquidity Provider to purchase the tendered TOB Trust Certificates. Any loans made by the Liquidity Provider will be secured by the purchased TOB Trust Certificates held by the TOB Trust and will be subject to an increased interest rate based on number of days the loan is outstanding.
The TOB Trust may be collapsed without the consent of a fund, upon the occurrence of a termination event as defined in the TOB Trust agreement. Upon the occurrence of a termination event, a TOB Trust would be liquidated with the proceeds applied first to any accrued fees owed to the trustee of the TOB Trust, the Remarketing Agent and the Liquidity Provider. Upon certain termination events, TOB Trust Certificates holders will be paid before the TOB Residuals holders (i.e., the Funds) whereas in other termination events, TOB Trust Certificates holders and TOB Residuals holders will be paid pro rata.
While a fund’s investment policies and restrictions expressly permit investments in inverse floating rate securities, such as TOB Residuals, they restrict the ability of a fund to borrow money for purposes of making investments. Each fund’s transfer of the municipal bonds to a TOB Trust is considered a secured borrowing for financial reporting purposes. The cash received by the TOB Trust from the sale of the TOB Trust Certificates, less certain transaction expenses, is paid to a fund. A fund typically invests the cash received in additional municipal bonds.
| 92 | 2019 BLACKROCK ANNUAL REPORT TO SHAREHOLDERS |
Notes to Financial Statements (continued)
Accounting for TOB Trusts: The municipal bonds deposited into a TOB Trust are presented in a fund’s Schedule of Investments and the TOB Trust Certificates are shown in Other Liabilities in the Statements of Assets and Liabilities. Any loans drawn by the TOB Trust pursuant to the liquidity facility to purchase tendered TOB Trust Certificates are shown as Loan for TOB Trust Certificates. The carrying amount of a fund’s payable to the holder of the TOB Trust Certificates or the Liquidity Provider, as reported in the Statements of Assets and Liabilities as TOB Trust Certificates or Loan for TOB Trust Certificates, approximates its fair value.
Interest income, including amortization and accretion of premiums and discounts, from the underlying municipal bonds is recorded by a fund on an accrual basis. Interest expense incurred on the TOB Trust transaction and other expenses related to remarketing, administration, trustee, liquidity and other services to a TOB Trust are shown as interest expense, fees and amortization of offering costs in the Statements of Operations. Fees paid upon creation of the TOB Trust are recorded as debt issuance costs and are amortized to interest expense, fees and amortization of offering costs in the Statements of Operations to the expected maturity of the TOB Trust. In connection with the restructurings of the TOB Trusts to non-bank sponsored TOB Trusts, a fund incurred non-recurring, legal and restructuring fees, which are recorded as interest expense, fees and amortization of deferred offering costs in the Statements of Operations. Amounts recorded within interest expense, fees and amortization of offering costs in the Statements of Operations are:
| Interest Expense | Liquidity Fees | Other Expenses | Total | |||||||||||||
| California Municipal Opportunities |
$ | 3,344,613 | $ | 900,661 | $ | 253,602 | $ | 4,498,876 | ||||||||
| New Jersey Municipal Bond |
261,793 | 67,199 | 39,953 | 368,945 | ||||||||||||
| Pennsylvania Municipal Bond |
1,088,977 | 330,050 | 83,344 | 1,502,371 | ||||||||||||
| Strategic Municipal Opportunities |
14,671,380 | 4,128,171 | 1,270,170 | 20,069,721 | ||||||||||||
For the year ended May 31, 2019, the following table is a summary of each fund’s TOB Trusts:
| Underlying Municipal Bonds Transferred to TOB Trusts (a) |
Liability for TOB Trust Certificates (b) |
Range of Interest Rates on TOB Trust Certificates at Period End |
Average TOB Trust Certificates Outstanding |
Daily Weighted Average Rate of Interest and Other Expenses on TOB Trusts |
||||||||||||||||
| California Municipal Opportunities |
$ | 597,384,174 | $ | 253,167,157 | 1.37% — 1.67% | $ | 210,324,729 | 2.13 | % | |||||||||||
| New Jersey Municipal Bond |
28,741,619 | 16,418,726 | 1.42% — 1.57% | 16,418,726 | 2.25 | |||||||||||||||
| Pennsylvania Municipal Bond |
123,352,661 | 64,404,012 | 1.42% — 1.60% | 69,503,342 | 2.15 | |||||||||||||||
| Strategic Municipal Opportunities |
1,527,563,286 | 960,204,952 | 1.38% — 1.67% | 936,476,326 | 2.14 | |||||||||||||||
| (a) | The municipal bonds transferred to a TOB Trust are generally high grade municipal bonds. In certain cases, when municipal bonds transferred are lower grade municipal bonds, the TOB Trust transaction may include a credit enhancement feature that provides for the timely payment of principal and interest on the bonds to the TOB Trust by a credit enhancement provider in the event of default of the municipal bond. The TOB Trust would be responsible for the payment of the credit enhancement fee and the funds, as TOB Residuals holders, would be responsible for reimbursement of any payments of principal and interest made by the credit enhancement provider. The maximum potential amounts owed by the funds, for such reimbursements, as applicable, are included in the maximum potential amounts disclosed for recourse TOB Trusts. |
| (b) | TOB Trusts may be structured on a non-recourse or recourse basis. When a Fund invests in TOB Trusts on a non-recourse basis, the Liquidity Provider may be required to make a payment under the liquidity facility to allow the TOB Trust to repurchase TOB Trust Certificates. The Liquidity Provider will be reimbursed from the liquidation of bonds held in the TOB Trust. If a fund invests in a TOB Trust on a recourse basis, a fund enters into a reimbursement agreement with the Liquidity Provider where a fund is required to reimburse the Liquidity Provider for any shortfall between the amount paid by the Liquidity Provider and proceeds received from liquidation of municipal bonds held in the TOB Trust (the “Liquidation Shortfall”). As a result, if a fund invests in a recourse TOB Trust, a fund will bear the risk of loss with respect to any Liquidation Shortfall. If multiple funds participate in any such TOB Trust, these losses will be shared ratably, including the maximum potential amounts owed by a fund at May 31, 2019, in proportion to their participation in the TOB Trust. The recourse TOB Trusts are identified in the Schedules of Investments including the maximum potential amounts owed by a Fund at May 31, 2019. |
For the year ended May 31, 2019, the following table is a summary of each fund’s Loan for TOB Trust Certificates:
| Loans Outstanding |
Range of Interest Rates on Loans at Period End |
Average Loans Outstanding |
Daily Weighted Average Rate of Interest and Other Expenses on Loans |
|||||||||||||
| California Municipal Opportunities |
$ | — | — | % | $ | 545,977 | 0.68 | % | ||||||||
| Pennsylvania Municipal Bond |
— | — | 372,495 | 0.78 | ||||||||||||
| Strategic Municipal Opportunities |
— | — | 618,425 | 0.81 | ||||||||||||
| 5. | DERIVATIVE FINANCIAL INSTRUMENTS |
The Funds engage in various portfolio investment strategies using derivative contracts both to increase the returns of the Funds and/or to manage their exposure to certain risks such as credit risk, equity risk, interest rate risk, foreign currency exchange rate risk, commodity price risk or other risks (e.g., inflation risk). Derivative financial instruments categorized by risk exposure are included in the Schedules of Investments. These contracts may be transacted on an exchange or over-the-counter (“OTC”).
Futures Contracts: Futures contracts are purchased or sold to gain exposure to, or manage exposure to, changes in interest rates (interest rate risk) and changes in the value of equity securities (equity risk) or foreign currencies (foreign currency exchange rate risk).
| NOTES TO FINANCIAL STATEMENTS | 93 |
Notes to Financial Statements (continued)
Futures contracts are agreements between the Funds and a counterparty to buy or sell a specific quantity of an underlying instrument at a specified price and on a specified date. Depending on the terms of a contract, it is settled either through physical delivery of the underlying instrument on the settlement date or by payment of a cash amount on the settlement date. Upon entering into a futures contract, the Funds are required to deposit initial margin with the broker in the form of cash or securities in an amount that varies depending on a contract’s size and risk profile. The initial margin deposit must then be maintained at an established level over the life of the contract. Amounts pledged, which are considered restricted, are included in cash pledged for futures contracts in the Statements of Assets and Liabilities.
Securities deposited as initial margin are designated in the Schedules of Investments and cash deposited, if any, is shown as cash pledged for futures contracts in the Statements of Assets and Liabilities. Pursuant to the contract, the Funds agree to receive from or pay to the broker an amount of cash equal to the daily fluctuation in market value of the contract (“variation margin”). Variation margin is recorded as unrealized appreciation (depreciation) and, if any, shown as variation margin receivable (or payable) on futures contracts in the Statements of Assets and Liabilities. When the contract is closed, a realized gain or loss is recorded in the Statements of Operations equal to the difference between the notional amount of the contract at the time it was opened and the notional amount at the time it was closed. The use of futures contracts involves the risk of an imperfect correlation in the movements in the price of futures contracts and interest, foreign currency exchange rates or underlying assets.
| 6. | INVESTMENT ADVISORY AGREEMENT AND OTHER TRANSACTIONS WITH AFFILIATES |
Investment Advisory: Each Trust, on behalf of its Funds, entered into an Investment Advisory Agreement with the Manager, the Funds’ investment adviser and an indirect, wholly-owned subsidiary of BlackRock, Inc. (“BlackRock”), to provide investment advisory and administrative services. The Manager is responsible for the management of each Fund’s portfolio and provides the personnel, facilities, equipment and certain other services necessary to the operations of each Fund.
For such services, each Fund pays the Manager a monthly fee at an annual rate equal to the following percentages of the average daily value of each Fund’s net assets:
| Investment Advisory Fees | ||||||||||||||||
| Average Daily Net Assets | California Municipal Opportunities |
New Jersey Municipal Bond |
Pennsylvania Municipal Bond |
Strategic Municipal Opportunities |
||||||||||||
| First $1 Billion |
0.38 | % | 0.52 | % | 0.52 | % | 0.55 | % | ||||||||
| $1 Billion — $3 Billion |
0.36 | 0.49 | 0.49 | 0.52 | ||||||||||||
| $3 Billion — $5 Billion |
0.34 | 0.47 | 0.47 | 0.50 | ||||||||||||
| $5 Billion — $10 Billion |
0.33 | 0.45 | 0.45 | 0.48 | ||||||||||||
| Greater than $10 Billion |
0.32 | 0.44 | 0.44 | 0.47 | ||||||||||||
Service and Distribution Fees: Each Trust, on behalf of its Funds, entered into a Distribution Agreement and a Distribution and Service Plan with BlackRock Investments, LLC (“BRIL”), an affiliate of the Manager. Pursuant to the Distribution and Service Plan and in accordance with Rule 12b-1 under the 1940 Act, each Fund pays BRIL ongoing service and distribution fees. The fees are accrued daily and paid monthly at annual rates based upon the average daily net assets of the relevant share class of each Fund as follows:
| Service Fees | ||||||||||||||||
| California Municipal Opportunities |
New Jersey Municipal Bond |
Pennsylvania Municipal Bond |
Strategic Municipal Opportunities |
|||||||||||||
| Service |
— | % | 0.25 | % | 0.25 | % | — | % | ||||||||
| Investor A |
0.25 | 0.25 | 0.25 | 0.25 | ||||||||||||
| Investor A1 |
0.10 | 0.10 | 0.10 | 0.10 | ||||||||||||
| Investor C |
0.25 | 0.25 | 0.25 | 0.25 | ||||||||||||
| Investor C1 |
0.25 | 0.25 | 0.25 | — | ||||||||||||
| Distribution Fees | ||||||||||||||||
| California Municipal Opportunities |
New Jersey Municipal Bond |
Pennsylvania Municipal Bond |
Strategic Municipal Opportunities |
|||||||||||||
| Investor C |
0.75 | % | 0.75 | % | 0.75 | % | 0.75 | % | ||||||||
| Investor C1 |
0.35 | 0.35 | 0.35 | — | ||||||||||||
BRIL and broker-dealers, pursuant to sub-agreements with BRIL, provide shareholder servicing and distribution services to the Funds. The ongoing service and/or distribution fee compensates BRIL and each broker-dealer for providing shareholder servicing and/or distribution related services to shareholders.
For the year ended May 31, 2019, the following table shows the class specific service and distribution fees borne directly by each share class of each Fund:
| Service and Distribution Fees | Service | Investor A | Investor A1 | Investor C | Investor C1 | Total | ||||||||||||||||||
| California Municipal Opportunities |
$ | — | $ | 1,908,583 | $ | 114,010 | $ | 1,358,510 | $ | 7,060 | $ | 3,388,163 | ||||||||||||
| New Jersey Municipal Bond |
18,954 | 194,536 | 19,821 | 292,837 | 3,661 | 529,809 | ||||||||||||||||||
| Pennsylvania Municipal Bond |
4,295 | 246,622 | 11,679 | 303,126 | 4,416 | 570,138 | ||||||||||||||||||
| Strategic Municipal Opportunities |
— | 4,038,595 | 28,174 | 2,859,094 | — | 6,925,863 | ||||||||||||||||||
| 94 | 2019 BLACKROCK ANNUAL REPORT TO SHAREHOLDERS |
Notes to Financial Statements (continued)
Transfer Agent: Pursuant to written agreements, certain financial intermediaries, some of which may be affiliates, provide the Funds with sub-accounting, recordkeeping, sub-transfer agency and other administrative services with respect to servicing of underlying investor accounts. For these services, these entities receive an asset-based fee or an annual fee per shareholder account, which will vary depending on share class and/or net assets. For the year ended May 31, 2019, the Funds paid the following amounts to affiliates of BlackRock in return for these services, which are included in transfer agent — class specific in the Statements of Operations:
| Institutional | Service | Investor A | Class C | Total | ||||||||||||||||
| New Jersey Municipal Bond |
$ | 128,816 | $ | — | $ | — | $ | — | $ | 128,816 | ||||||||||
| Pennsylvania Municipal Bond |
456,057 | — | — | 43 | 456,100 | |||||||||||||||
| Strategic Municipal Opportunities |
990,881 | — | 79 | — | 990,960 | |||||||||||||||
The Manager maintains a call center that is responsible for providing certain shareholder services to the Funds. Shareholder services include responding to inquiries and processing purchases and sales based upon instructions from shareholders. For the year ended May 31, 2019, each Fund reimbursed the Manager the following amounts for costs incurred in running the call center, which are included in transfer agent — class specific in the Statements of Operations:
| Institutional | Service | Investor A | Investor A1 | Investor C | Investor C1 | Class K | Total | |||||||||||||||||||||||||
| California Municipal Opportunities |
$ | 3,456 | $ | — | $ | 3,625 | $ | 2,009 | $ | 717 | $ | 58 | $ | 132 | $ | 9,997 | ||||||||||||||||
| New Jersey Municipal Bond |
547 | 1,693 | 844 | 469 | 340 | 58 | — | 3,951 | ||||||||||||||||||||||||
| Pennsylvania Municipal Bond |
853 | 64 | 1,149 | 590 | 467 | 20 | — | 3,143 | ||||||||||||||||||||||||
| Strategic Municipal Opportunities |
14,692 | — | 8,751 | 238 | 2,048 | — | 180 | 25,909 | ||||||||||||||||||||||||
For the year ended May 31, 2019, the following table shows the class specific transfer agent fees borne directly by each share class of each Fund:
| Institutional | Service | Investor A | Investor A1 | Investor C | Investor C1 | Class K | Total | |||||||||||||||||||||||||
| California Municipal Opportunities |
$ | 654,279 | $ | — | $ | 403,264 | $ | 38,496 | $ | 72,623 | $ | 360 | $ | 1,218 | $ | 1,170,240 | ||||||||||||||||
| New Jersey Municipal Bond |
175,422 | 7,019 | 48,303 | 8,694 | 15,550 | 212 | 144 | 255,344 | ||||||||||||||||||||||||
| Pennsylvania Municipal Bond |
533,672 | 2,219 | 55,169 | 7,755 | 20,101 | 178 | 195 | 619,289 | ||||||||||||||||||||||||
| Strategic Municipal Opportunities |
4,932,983 | — | 791,293 | 11,417 | 149,083 | — | 6,058 | 5,890,834 | ||||||||||||||||||||||||
Other Fees: For the year ended May 31, 2019, affiliates earned underwriting discounts, direct commissions and dealer concessions on sales of each Fund’s Investor A Shares as follows:
| California Municipal |
New Jersey Municipal Bond |
Pennsylvania Municipal Bond |
Strategic Municipal Opportunities |
|||||||||||||
| Investor A |
$ | 18,853 | $ | 5,909 | $ | 8,308 | $ | 54,203 | ||||||||
For the year ended May 31, 2019, affiliates received CDSCs as follows:
| California Municipal Opportunities |
New Jersey Municipal Bond |
Pennsylvania Municipal Bond |
Strategic Municipal Opportunities |
|||||||||||||
| Investor A |
$ | 84,829 | $ | 20,563 | 30,633 | $ | 379,611 | |||||||||
| Investor A1 |
— | — | 38 | — | ||||||||||||
| Investor C |
22,716 | 1,743 | 1,554 | 42,971 | ||||||||||||
Expense Limitations, Waivers, Reimbursements, and Recoupments: With respect to Strategic Municipal Opportunities, the Manager contractually agreed to waive a portion of its investment advisory fees equal to the annual rate of 0.05% of the Fund’s average daily net assets through September 30, 2019. The agreement may be terminated upon 90 days’ notice by a majority of trustees of BlackRock Municipal Series Trust who are not ‘‘interested persons’’ of the Fund, as defined in the 1940 Act (‘‘Independent Trustees”) or by a vote of a majority of the outstanding voting securities of the Fund. For the year ended May 31, 2019, the Manager waived $4,549,085 which is included in fees waived and/or reimbursed by the Manager in the Statements of Operations.
With respect to each Fund, the Manager voluntarily agreed to waive its investment advisory fees by the amount of investment advisory fees each Fund pays to the Manager indirectly through its investment in affiliated money market funds (the “affiliated money market fund waiver”). These amounts are included in fees waived and/or reimbursed by the Manager in the Statements of Operations. For the year ended May 31, 2019, the amounts waived were as follows:
| California Municipal Opportunities |
New Jersey Municipal Bond |
Pennsylvania Municipal Bond |
Strategic Municipal Opportunities |
|||||||||||||
| Amount waived |
$ | 128,765 | $ | 10,522 | $ | 6,066 | $ | 172,034 | ||||||||
The Manager has contractually agreed to waive its investment advisory fee with respect to any portion of each Fund’s assets invested in affiliated equity and fixed-income mutual funds and affiliated exchange-traded funds that have a contractual management fee through September 30, 2019. The contractual agreement may be terminated upon 90 days’ notice by a majority of the Independent Trustees or by a vote of a majority of the outstanding voting securities of a Fund. These amounts are included in fees waived and/or reimbursed by the Manager in the Statements of Operations.
| NOTES TO FINANCIAL STATEMENTS | 95 |
Notes to Financial Statements (continued)
For the year ended May 31, 2019, the amounts waived in investment advisory fees pursuant to these arrangements were as follows:
| California Municipal Opportunities |
Strategic Municipal Opportunities |
|||||||
| Amount waived |
$ | 193,330 | $ | 403,285 | ||||
The Funds have incurred expenses in connection with the realignment and consolidation of the boards of trustees of certain BlackRock-advised funds. The Manager has voluntarily agreed to reimburse certain Funds for all or a portion of such expenses, which amounts are included in fees waived and/or reimbursed by the Manager in the Statements of Operations.
For the year ended May 31, 2019, the amounts reimbursed were as follows:
| California Municipal Opportunities |
Strategic Municipal Opportunities |
|||||||
| Amount reimbursed |
$ | 17,524 | $ | 72,628 | ||||
With respect to California Municipal Opportunities, New Jersey Municipal Bond and Pennsylvania Municipal Bond, the Manager contractually agreed to waive and/or reimburse fees or expenses in order to limit expenses, excluding interest expense, dividend expense, tax expense, acquired fund fees and expenses and certain other fund expenses, which constitute extraordinary expenses not incurred in the ordinary course of each Fund’s business. The current expense limitations as a percentage of average daily net assets are as follows:
| Share Class | California Municipal Opportunities |
New Jersey Municipal Bond |
Pennsylvania Municipal Bond |
|||||||||
| Institutional |
0.44 | % | 0.52 | % | 0.54 | % | ||||||
| Service |
— | 0.77 | 0.79 | |||||||||
| Investor A |
0.69 | 0.77 | 0.79 | |||||||||
| Investor A1 |
0.54 | 0.62 | 0.64 | |||||||||
| Investor C |
1.44 | 1.52 | 1.54 | |||||||||
| Investor C1 |
1.04 | 1.12 | 1.14 | |||||||||
| Class K |
0.39 | 0.47 | 0.49 | |||||||||
The Manager has agreed not to reduce or discontinue these contractual expense limitations through September 30, 2019, unless approved by the Board, including a majority of the Independent Trustees, or by a vote of a majority of the outstanding voting securities of the applicable Fund.
In addition, the following Funds had a waiver of investment advisory fees, which are included in fees waived and/or reimbursed by Manager in the Statements of Operations. For the year ended May 31, 2019, the amounts waived were as follows:
| California Municipal Opportunities |
New Jersey Municipal Bond |
Pennsylvania Municipal Bond |
||||||||||
| Amount waived |
$ | 120,348 | $ | 410,866 | $ | 468,656 | ||||||
For the year ended May 31, 2019, the Funds reimbursed the Manager for certain accounting services, which is included in accounting services in the Statements of Operations. The reimbursements were as follows:
| California Municipal Opportunities |
New Jersey Municipal Bond |
Pennsylvania Municipal Bond |
Strategic Municipal Opportunities |
|||||||||||||
| Amount reimbursed |
$ | 28,599 | $ | 3,318 | $ | 5,728 | $ | 99,934 | ||||||||
For the year ended May 31, 2019, the amounts included in transfer agent fees waived and/or reimbursed — class specific in the Statements of Operations were as follows:
| Institutional | Service | Investor A | Investor A1 | Investor C | Investor C1 | Class K | Total | |||||||||||||||||||||||||
| California Municipal Opportunities |
$ | 246 | $ | — | $ | 14,994 | $ | — | $ | 4,218 | $ | 26 | $ | 822 | $ | 20,306 | ||||||||||||||||
| New Jersey Municipal Bond |
95,329 | 3,228 | 9,396 | — | 1,196 | 25 | 143 | 109,317 | ||||||||||||||||||||||||
| Pennsylvania Municipal Bond |
355,541 | 1,360 | 5,845 | 1,916 | 4,953 | 21 | 194 | 369,830 | ||||||||||||||||||||||||
With respect to the contractual expense limitation, if during California Municipal Opportunities’ fiscal year the operating expenses of a share class, that at any time during the prior two fiscal years received a waiver and/or reimbursement from the Manager, are less than the current expense limitation for that share class, the Manager is entitled to be reimbursed by such share class up to the lesser of: (a) the amount of fees waived and/or expenses reimbursed during those prior two fiscal years under the
| 96 | 2019 BLACKROCK ANNUAL REPORT TO SHAREHOLDERS |
Notes to Financial Statements (continued)
agreement and (b) an amount not to exceed either the current expense limitation of that share class or the expense limitation of the share class in effect at the time that the share class received the applicable waiver and/or reimbursement, provided that:
(1) the Fund, of which the share class is a part, has more than $50 million in assets for the fiscal year, and
(2) the Manager or an affiliate continues to serve as the Fund’s investment adviser or administrator.
This repayment applies only to the contractual expense limitation on net expenses for California Municipal Opportunities and does not apply to the contractual investment advisory fee waiver described above or any voluntary waivers that may be in effect from time to time.
For the year ended May 31, 2019, the Manager recouped the following class specific waivers and/or reimbursements previously recorded by California Municipal Opportunities:
| Fund Level |
$ | 16,727 | ||
| Institutional |
167,558 | |||
| Investor A |
6,347 | |||
| Investor A1 |
13,025 | |||
| Investor C |
2,007 | |||
| Investor C1 |
238 |
On May 31, 2019, the fund level and class specific waivers and/or reimbursements subject to possible future recoupment under the expense limitation agreement are as follows:
| Expiring May 31, | ||||||||
| 2020 | 2021 | |||||||
| Fund Level |
$ | 151,796 | $ | 120,348 | ||||
| Institutional |
51,237 | 246 | ||||||
| Investor A |
7,210 | 14,994 | ||||||
| Investor C |
10,578 | 4,218 | ||||||
| Investor C1 |
599 | 26 | ||||||
| Class K |
— | 822 | ||||||
The following fund level and class specific waivers and/or reimbursements previously recorded by California Municipal Opportunities, which were subject to recoupment by the Manager, expired on May 31, 2019:
| Investor A |
$ | 23,850 | ||
| Investor C |
21,303 | |||
| Investor C1 |
783 |
Interfund Lending: In accordance with an exemptive order (the “Order”) from the U.S. Securities and Exchange Commission (“SEC”), each Fund may participate in a joint lending and borrowing facility for temporary purposes (the “Interfund Lending Program”), subject to compliance with the terms and conditions of the Order, and to the extent permitted by each Fund’s investment policies and restrictions. Each Fund is currently permitted to borrow under the Interfund Lending Program.
A lending BlackRock fund may lend in aggregate up to 15% of its net assets, but may not lend more than 5% of its net assets to any one borrowing fund through the Interfund Lending Program. A borrowing BlackRock fund may not borrow through the Interfund Lending Program or from any other source more than 33 1/3% of its total assets (or any lower threshold provided for by the fund’s investment restrictions). If a borrowing BlackRock fund’s total outstanding borrowings exceed 10% of its total assets, each of its outstanding interfund loans will be subject to collateralization of at least 102% of the outstanding principal value of the loan. All interfund loans are for temporary or emergency purposes and the interest rate to be charged will be the average of the highest current overnight repurchase agreement rate available to a lending fund and the bank loan rate, as calculated according to a formula established by the Board.
During the year ended May 31, 2019, the Funds did not participate in the Interfund Lending Program.
Trustees and Officers: Certain trustees and/or officers of the Trusts are trustees and/or officers of BlackRock or its affiliates. The Funds reimburse the Manager for a portion of the compensation paid to the Funds’ Chief Compliance Officer, which is included in Trustees and Officer in the Statements of Operations.
Other Transactions: The Trusts may purchase securities from, or sell securities to, an affiliated fund provided the affiliation is due solely to having a common investment adviser, common officers, or common trustees. For the year ended May 31, 2019, the purchase and sale transactions and any net realized gains (losses) with an affiliated fund in compliance with Rule 17a-7 under the 1940 Act were as follows:
| Purchases | ||||
| Strategic Municipal Opportunities |
$ | 8,235,063 | ||
| NOTES TO FINANCIAL STATEMENTS | 97 |
Notes to Financial Statements (continued)
| 7. | PURCHASES AND SALES |
For the year ended May 31, 2019, purchases and sales of investments, excluding short-term securities, were as follows:
| California Municipal Opportunities |
New Jersey Municipal |
Pennsylvania Municipal |
Strategic Municipal Opportunities |
|||||||||||||
| Purchases |
$ | 4,474,710,832 | $ | 67,984,039 | $ | 151,532,329 | $ | 9,889,197,570 | ||||||||
| Sales |
3,284,801,061 | 45,858,211 | 130,197,967 | 6,756,335,394 | ||||||||||||
| 8. | INCOME TAX INFORMATION |
It is each Fund’s policy to comply with the requirements of the Internal Revenue Code of 1986, as amended, applicable to regulated investment companies, and to distribute substantially all of its taxable income to its shareholders. Therefore, no U.S. federal income tax provision is required.
Each Fund files U.S. federal and various state and local tax returns. No income tax returns are currently under examination. The statute of limitations on each Fund’s U.S. federal tax returns generally remains open for each of the four years ended May 31, 2019. The statutes of limitations on each Fund’s state and local tax returns may remain open for an additional year depending upon the jurisdiction.
Management has analyzed tax laws and regulations and their application to the Funds as of May 31, 2019, inclusive of the open tax return years, and does not believe that there are any uncertain tax positions that require recognition of a tax liability in the Funds’ financial statements.
U.S. GAAP requires that certain components of net assets be adjusted to reflect permanent differences between financial and tax reporting. These reclassifications have no effect on net assets or net asset values per share. As of period end, the following permanent differences attributable to non-deductible expenses and the expiration of capital loss carryforwards were reclassified to the following accounts:
| BlackRock California Municipal Opportunities Fund |
BlackRock New Jersey Municipal Bond Fund |
BlackRock Pennsylvania Municipal Bond Fund |
BlackRock Strategic Municipal Opportunities Fund |
|||||||||||||
| Paid-in capital |
$ | (23,150 | ) | $ | (261,524 | ) | $ | (740,323 | ) | $ | (26,315 | ) | ||||
| Accumulated earnings |
23,150 | 261,524 | 740,323 | 26,315 | ||||||||||||
The tax character of distributions paid was as follows:
| BlackRock California Municipal Opportunities Fund |
BlackRock New Jersey Municipal Bond Fund |
BlackRock Pennsylvania Municipal Bond Fund |
BlackRock Strategic Municipal Opportunities Fund |
|||||||||||||
| Tax-exempt income |
||||||||||||||||
| 05/31/19 |
$ | 63,921,330 | $ | 10,353,312 | $ | 19,196,801 | $ | 250,420,858 | ||||||||
| 05/31/18 |
38,425,769 | 9,844,996 | 19,323,048 | 146,873,706 | ||||||||||||
| Ordinary income |
||||||||||||||||
| 05/31/19 |
20,969,717 | 11,693 | 4,632 | 51,518,375 | ||||||||||||
| 05/31/18 |
2,859,682 | 50,119 | 35,924 | 13,621,821 | ||||||||||||
| Long-term capital gains |
||||||||||||||||
| 05/31/19 |
33,306,266 | — | — | 120,851,791 | ||||||||||||
| 05/31/18 |
5,208,602 | — | — | — | ||||||||||||
|
|
|
|
|
|
|
|
|
|||||||||
| Total |
||||||||||||||||
| 05/31/19 |
$ | 118,197,313 | $ | 10,365,005 | $ | 19,201,433 | $ | 422,791,024 | ||||||||
|
|
|
|
|
|
|
|
|
|||||||||
| 05/31/18 |
$ | 46,494,053 | $ | 9,895,115 | $ | 19,358,972 | $ | 160,495,527 | ||||||||
|
|
|
|
|
|
|
|
|
|||||||||
| 98 | 2019 BLACKROCK ANNUAL REPORT TO SHAREHOLDERS |
Notes to Financial Statements (continued)
As of period end, the tax components of accumulated earnings were as follows:
| BlackRock California Municipal Opportunities Fund |
BlackRock New Jersey Municipal Bond Fund |
BlackRock Pennsylvania Municipal Bond Fund |
BlackRock Strategic Municipal Opportunities Fund |
|||||||||||||
| Undistributed tax-exempt income |
$ | — | $ | 834,644 | $ | — | $ | — | ||||||||
| Undistributed ordinary income |
1,822 | 3,750 | 7,205 | 28,064 | ||||||||||||
| Non-expiring capital loss carryforwards(a) |
— | (5,580,654 | ) | (15,414,729 | ) | — | ||||||||||
| Net unrealized gains(b) |
135,737,025 | 24,674,990 | 29,437,300 | 444,342,400 | ||||||||||||
| Qualified late-year losses(c) |
(77,727,750 | ) | — | — | (308,245,865 | ) | ||||||||||
|
|
|
|
|
|
|
|
|
|||||||||
| $ | 58,011,097 | $ | 19,932,730 | $ | 14,029,776 | $ | 136,124,599 | |||||||||
|
|
|
|
|
|
|
|
|
|||||||||
| (a) | Amounts available to offset future realized capital gains. |
| (b) | The difference between book-basis and tax-basis net unrealized gains was attributable primarily to the tax deferral of losses on wash sales, amortization methods for premiums and discounts on fixed income securities, the accrual of income on securities in default, the realization for tax purposes of unrealized gains/losses on certain futures contracts, the treatment of residual interests in tender option bond trusts and the deferral of compensation to trustees. |
| (c) | The Fund has elected to defer certain qualified late-year losses and recognize such losses in the next taxable year. |
As of May 31, 2019, gross unrealized appreciation and depreciation for investments and derivatives based on cost for U.S. federal income tax purposes were as follows:
| BlackRock California Municipal Opportunities Fund |
BlackRock New Jersey Municipal Bond Fund |
BlackRock Pennsylvania Municipal Bond Fund |
BlackRock Strategic Municipal Opportunities Fund |
|||||||||||||
| Tax cost |
$ | 3,198,581,888 | $ | 300,432,489 | $ | 512,373,146 | $ | 10,388,420,101 | ||||||||
|
|
|
|
|
|
|
|
|
|||||||||
| Gross unrealized appreciation |
$ | 147,811,155 | $ | 25,292,440 | $ | 30,271,347 | $ | 459,602,852 | ||||||||
| Gross unrealized depreciation |
(11,999,034 | ) | (617,450 | ) | (551,233 | ) | (12,778,450 | ) | ||||||||
|
|
|
|
|
|
|
|
|
|||||||||
| Net unrealized appreciation |
$ | 135,812,121 | $ | 24,674,990 | $ | 29,720,114 | $ | 446,824,402 | ||||||||
|
|
|
|
|
|
|
|
|
|||||||||
| 9. | BANK BORROWINGS |
Each Trust, on behalf of its Funds, along with certain other funds managed by the Manager and its affiliates (“Participating Funds”), is a party to a 364-day, $2.25 billion credit agreement with a group of lenders. Under this agreement, the Funds may borrow to fund shareholder redemptions. Excluding commitments designated for certain individual funds, the Participating Funds, including the Funds, can borrow up to an aggregate commitment amount of $1.75 billion at any time outstanding, subject to asset coverage and other limitations as specified in the agreement. The credit agreement has the following terms: a fee of 0.10% per annum on unused commitment amounts and interest at a rate equal to the higher of (a) one-month LIBOR (but, in any event, not less than 0.00%) on the date the loan is made plus 0.80% per annum or (b) the Fed Funds rate (but, in any event, not less than 0.00%) in effect from time to time plus 0.80% per annum on amounts borrowed. The agreement expires in April 2020 unless extended or renewed. Prior to April 18, 2019, Participating Funds paid an upfront commitment fee of 0.02% on the total commitment amounts, in addition to administration, legal and arrangement fees, which are included in miscellaneous expenses in the Statements of Operations. These fees were allocated among such funds based upon portions of the aggregate commitment available to them and relative net assets of Participating Funds. During the year ended May 31, 2019, the Funds did not borrow under the credit agreement.
| 10. | PRINCIPAL RISKS |
Many municipalities insure repayment of their bonds, which may reduce the potential for loss due to credit risk. The market value of these bonds may fluctuate for other reasons, including market perception of the value of such insurance, and there is no guarantee that the insurer will meet its obligation.
Inventories of municipal bonds held by brokers and dealers may decrease, which would lessen their ability to make a market in these securities. Such a reduction in market making capacity could potentially decrease a Fund’s ability to buy or sell bonds. As a result, a Fund may sell a security at a lower price, sell other securities to raise cash, or give up an investment opportunity, any of which could have a negative impact on performance. If a Fund needed to sell large blocks of bonds, those sales could further reduce the bonds’ prices and impact performance.
In the normal course of business, certain Funds invest in securities or other instruments and may enter into certain transactions, and such activities subject each Fund to various risks, including among others, fluctuations in the market (market risk) or failure of an issuer to meet all of its obligations. The value of securities or other instruments may also be affected by various factors, including, without limitation: (i) the general economy; (ii) the overall market as well as local, regional or global political and/or social instability; (iii) regulation, taxation or international tax treaties between various countries; or (iv) currency, interest rate and price fluctuations. Each Fund’s prospectus provides details of the risks to which each Fund is subject.
Each Fund may be exposed to prepayment risk, which is the risk that borrowers may exercise their option to prepay principal earlier than scheduled during periods of declining interest rates, which would force each Fund to reinvest in lower yielding securities. Each Fund may also be exposed to reinvestment risk, which is the risk that income from each Fund’s portfolio will decline if each Fund invests the proceeds from matured, traded or called fixed-income securities at market interest rates that are below each Fund portfolio’s current earnings rate.
| NOTES TO FINANCIAL STATEMENTS | 99 |
Notes to Financial Statements (continued)
The Funds may hold a significant amount of bonds subject to calls by the issuers at defined dates and prices. When bonds are called by issuers and the Funds reinvest the proceeds received, such investments may be in securities with lower yields than the bonds originally held, and correspondingly, could adversely impact the yield and total return performance of a Fund.
A Fund structures and “sponsors” the TOB Trusts in which it holds TOB Residuals and has certain duties and responsibilities, which may give rise to certain additional risks including, but not limited to, compliance, securities law and operational risks.
Should short-term interest rates rise, the Funds’ investments in the TOB Trusts may adversely affect the Funds’ net investment income and dividends to shareholders. Also, fluctuations in the market value of municipal bonds deposited into the TOB Trust may adversely affect the Funds’ NAVs per share.
The SEC and various federal banking and housing agencies have adopted credit risk retention rules for securitizations (the “Risk Retention Rules”). The Risk Retention Rules would require the sponsor of a TOB Trust to retain at least 5% of the credit risk of the underlying assets supporting the TOB Trust’s municipal bonds. The Risk Retention Rules may adversely affect the Funds’ ability to engage in TOB Trust transactions or increase the costs of such transactions in certain circumstances.
TOB Trusts constitute an important component of the municipal bond market. Any modifications or changes to rules governing TOB Trusts may adversely impact the municipal market and the Funds, including through reduced demand for and liquidity of municipal bonds and increased financing costs for municipal issuers. The ultimate impact of any potential modifications on the TOB Trust market and the overall municipal market is not yet certain.
Counterparty Credit Risk: Certain Funds may be exposed to counterparty credit risk, or the risk that an entity may fail to or be unable to perform on its commitments related to unsettled or open transactions. The Funds manage counterparty credit risk by entering into transactions only with counterparties that the Manager believes have the financial resources to honor their obligations and by monitoring the financial stability of those counterparties. Financial assets, which potentially expose the Funds to market, issuer and counterparty credit risks, consist principally of financial instruments and receivables due from counterparties. The extent of the Funds’ exposure to market, issuer and counterparty credit risks with respect to these financial assets is approximately their value recorded in the Statements of Assets and Liabilities, less any collateral held by the Funds.
A derivative contract may suffer a mark-to-market loss if the value of the contract decreases due to an unfavorable change in the market rates or values of the underlying instrument. Losses can also occur if the counterparty does not perform under the contract.
With exchange-traded futures, there is less counterparty credit risk to the Funds since the exchange or clearinghouse, as counterparty to such instruments, guarantees against a possible default. The clearinghouse stands between the buyer and the seller of the contract; therefore, credit risk is limited to failure of the clearinghouse. While offset rights may exist under applicable law, a Fund does not have a contractual right of offset against a clearing broker or clearinghouse in the event of a default (including the bankruptcy or insolvency). Additionally, credit risk exists in exchange-traded futures with respect to initial and variation margin that is held in a clearing broker’s customer accounts. While clearing brokers are required to segregate customer margin from their own assets, in the event that a clearing broker becomes insolvent or goes into bankruptcy and at that time there is a shortfall in the aggregate amount of margin held by the clearing broker for all its clients, typically the shortfall would be allocated on a pro rata basis across all the clearing broker’s customers, potentially resulting in losses to the Funds.
Concentration Risk: Each Fund invests a substantial amount of its assets in issuers located in a single state or limited number of states. This may subject each Fund to the risk that economic, political or social issues impacting a particular state or group of states could have an adverse and disproportionate impact on the income from, or the value or liquidity of, the Funds’ respective portfolios. Investment percentages in specific states or U.S. territories are presented in the Schedules of Investments.
As of period end, California Municipal Opportunities invested a significant portion of its assets in securities in the county, city, health, special district, school district and utilities sector. Pennsylvania Municipal Bond invested a significant portion of their assets in securities in the health sector. Changes in economic conditions affecting such sectors would have a greater impact on the Funds and could affect the value, income and/or liquidity of positions in such securities.
The Funds invest a significant portion of their assets in fixed-income securities and/or use derivatives tied to the fixed-income markets. Changes in market interest rates or economic conditions may affect the value and/or liquidity of such investments. Interest rate risk is the risk that prices of bonds and other fixed-income securities will increase as interest rates fall and decrease as interest rates rise. The Funds may be subject to a greater risk of rising interest rates due to the current period of historically low rates.
| 11. | CAPITAL SHARE TRANSACTIONS |
Transactions in capital shares for each class were as follows:
| Year Ended 05/31/19 |
Year Ended 05/31/18 |
|||||||||||||||
| BlackRock California Municipal Opportunities Fund | Shares | Amount | Shares | Amount | ||||||||||||
| Institutional |
||||||||||||||||
| Shares sold |
115,908,754 | $ | 1,456,570,908 | 62,704,887 | $ | 795,369,501 | ||||||||||
| Shares issued in reinvestment of distributions |
4,793,829 | 59,951,733 | 1,712,582 | 21,717,935 | ||||||||||||
| Shares redeemed |
(55,324,342 | ) | (691,717,890 | ) | (19,709,216 | ) | (249,993,714 | ) | ||||||||
|
|
|
|
|
|
|
|
|
|||||||||
| Net increase |
65,378,241 | $ | 824,804,751 | 44,708,253 | $ | 567,093,722 | ||||||||||
|
|
|
|
|
|
|
|
|
|||||||||
| 100 | 2019 BLACKROCK ANNUAL REPORT TO SHAREHOLDERS |
Notes to Financial Statements (continued)
| Year Ended 05/31/19 |
Year Ended 05/31/18 |
|||||||||||||||
| BlackRock California Municipal Opportunities Fund (continued) | Shares | Amount | Shares | Amount | ||||||||||||
| Investor A |
||||||||||||||||
| Shares sold |
40,902,353 | $ | 514,860,620 | 23,708,717 | $ | 300,459,601 | ||||||||||
| Shares issued in reinvestment of distributions |
2,456,061 | 30,677,114 | 1,017,860 | 12,895,140 | ||||||||||||
| Shares redeemed |
(18,780,774 | ) | (235,673,424 | ) | (10,047,996 | ) | (127,293,969 | ) | ||||||||
|
|
|
|
|
|
|
|
|
|||||||||
| Net increase |
24,577,640 | $ | 309,864,310 | 14,678,581 | $ | 186,060,772 | ||||||||||
|
|
|
|
|
|
|
|
|
|||||||||
| Investor A1 |
||||||||||||||||
| Shares sold |
218 | $ | 3,114 | 6,682 | $ | 85,173 | ||||||||||
| Shares issued in reinvestment of distributions |
246,117 | 3,077,643 | 158,985 | 2,014,908 | ||||||||||||
| Shares redeemed |
(699,828 | ) | (8,821,600 | ) | (882,640 | ) | (11,202,856 | ) | ||||||||
|
|
|
|
|
|
|
|
|
|||||||||
| Net decrease |
(453,493 | ) | $ | (5,740,843 | ) | (716,973 | ) | $ | (9,102,775 | ) | ||||||
|
|
|
|
|
|
|
|
|
|||||||||
| Investor C |
||||||||||||||||
| Shares sold |
4,097,737 | $ | 51,632,420 | 2,785,365 | $ | 35,314,252 | ||||||||||
| Shares issued in reinvestment of distributions |
355,383 | 4,436,387 | 164,405 | 2,084,839 | ||||||||||||
| Shares redeemed |
(2,330,412 | ) | (29,269,082 | ) | (2,199,443 | ) | (27,882,829 | ) | ||||||||
|
|
|
|
|
|
|
|
|
|||||||||
| Net increase |
2,122,708 | $ | 26,799,725 | 750,327 | $ | 9,516,262 | ||||||||||
|
|
|
|
|
|
|
|
|
|||||||||
| Investor C1 |
||||||||||||||||
| Shares sold |
— | $ | 69 | 3 | $ | 43 | ||||||||||
| Shares issued in reinvestment of distributions |
1,970 | 24,887 | 4,988 | 63,236 | ||||||||||||
| Shares redeemed |
(180,293 | ) | (2,263,760 | ) | (29,918 | ) | (378,853 | ) | ||||||||
|
|
|
|
|
|
|
|
|
|||||||||
| Net decrease |
(178,323 | ) | $ | (2,238,804 | ) | (24,927 | ) | $ | (315,574 | ) | ||||||
|
|
|
|
|
|
|
|
|
|||||||||
| Period from 01/25/18 (a) to 05/31/18 |
||||||||||||||||
| Class K |
| |||||||||||||||
| Shares sold |
8,156,044 | $ | 101,572,186 | 2,886,027 | $ | 36,762,023 | ||||||||||
| Shares issued in reinvestment of distributions |
170,426 | 2,135,970 | 4,983 | 63,455 | ||||||||||||
| Shares redeemed |
(2,256,800 | ) | (28,241,497 | ) | (35,782 | ) | (455,002 | ) | ||||||||
|
|
|
|
|
|
|
|
|
|||||||||
| Net increase |
6,069,670 | $ | 75,466,659 | 2,855,228 | $ | 36,370,476 | ||||||||||
|
|
|
|
|
|
|
|
|
|||||||||
| Total Net Increase |
97,516,443 | $ | 1,228,955,798 | 62,250,489 | $ | 789,622,883 | ||||||||||
|
|
|
|
|
|
|
|
|
|||||||||
| Year Ended 05/31/19 |
Year Ended 05/31/18 |
|||||||||||||||
| BlackRock New Jersey Municipal Bond Fund | Shares | Amount | Shares | Amount | ||||||||||||
| Institutional |
||||||||||||||||
| Shares sold |
4,493,677 | $ | 49,467,803 | 2,986,027 | $ | 33,221,276 | ||||||||||
| Shares issued in reinvestment of distributions |
308,429 | 3,399,468 | 263,189 | 2,913,995 | ||||||||||||
| Shares redeemed |
(2,812,478 | ) | (30,789,124 | ) | (2,231,251 | ) | (24,676,792 | ) | ||||||||
|
|
|
|
|
|
|
|
|
|||||||||
| Net increase |
1,989,628 | $ | 22,078,147 | 1,017,965 | $ | 11,458,479 | ||||||||||
|
|
|
|
|
|
|
|
|
|||||||||
| Service |
||||||||||||||||
| Shares sold |
47,225 | $ | 526,273 | 64,813 | $ | 723,671 | ||||||||||
| Shares issued in reinvestment of distributions |
21,785 | 239,932 | 21,946 | 243,003 | ||||||||||||
| Shares redeemed |
(89,106 | ) | (975,883 | ) | (237,786 | ) | (2,635,790 | ) | ||||||||
|
|
|
|
|
|
|
|
|
|||||||||
| Net decrease |
(20,096 | ) | $ | (209,678 | ) | (151,027 | ) | $ | (1,669,116 | ) | ||||||
|
|
|
|
|
|
|
|
|
|||||||||
| Investor A |
||||||||||||||||
| Shares sold |
3,440,961 | $ | 37,829,122 | 1,690,680 | $ | 18,817,701 | ||||||||||
| Shares issued in reinvestment of distributions |
222,128 | 2,449,784 | 215,836 | 2,392,225 | ||||||||||||
| Shares redeemed |
(2,262,696 | ) | (24,740,736 | ) | (2,386,935 | ) | (26,536,296 | ) | ||||||||
|
|
|
|
|
|
|
|
|
|||||||||
| Net increase (decrease) |
1,400,393 | $ | 15,538,170 | (480,419 | ) | $ | (5,326,370 | ) | ||||||||
|
|
|
|
|
|
|
|
|
|||||||||
| Investor A1 |
||||||||||||||||
| Shares sold |
70 | $ | 762 | 5,619 | $ | 62,731 | ||||||||||
| Shares issued in reinvestment of distributions |
42,174 | 465,111 | 42,546 | 471,430 | ||||||||||||
| Shares redeemed |
(151,921 | ) | (1,669,810 | ) | (242,642 | ) | (2,686,771 | ) | ||||||||
|
|
|
|
|
|
|
|
|
|||||||||
| Net decrease |
(109,677 | ) | $ | (1,203,937 | ) | (194,477 | ) | $ | (2,152,610 | ) | ||||||
|
|
|
|
|
|
|
|
|
|||||||||
| NOTES TO FINANCIAL STATEMENTS | 101 |
Notes to Financial Statements (continued)
| Year Ended 05/31/19 |
Year Ended 05/31/18 |
|||||||||||||||
| BlackRock New Jersey Municipal Bond Fund (continued) | Shares | Amount | Shares | Amount | ||||||||||||
| Investor C |
||||||||||||||||
| Shares sold |
750,824 | $ | 8,268,272 | 600,631 | $ | 6,658,287 | ||||||||||
| Shares issued in reinvestment of distributions |
59,723 | 657,763 | 57,477 | 636,275 | ||||||||||||
| Shares redeemed |
(717,461 | ) | (7,849,651 | ) | (635,629 | ) | (7,060,246 | ) | ||||||||
|
|
|
|
|
|
|
|
|
|||||||||
| Net increase |
93,086 | $ | 1,076,384 | 22,479 | $ | 234,316 | ||||||||||
|
|
|
|
|
|
|
|
|
|||||||||
| Investor C1 |
| |||||||||||||||
| Shares sold |
— | $ | (125 | ) | 2 | $ | 18 | |||||||||
| Shares issued in reinvestment of distributions |
1,680 | 18,429 | 3,714 | 41,116 | ||||||||||||
| Shares redeemed |
(121,889 | ) | (1,315,730 | ) | (8,454 | ) | (93,933 | ) | ||||||||
|
|
|
|
|
|
|
|
|
|||||||||
| Net decrease |
(120,209 | ) | $ | (1,297,426 | ) | (4,738 | ) | $ | (52,799 | ) | ||||||
|
|
|
|
|
|
|
|
|
|||||||||
| Period from 01/25/18 (a) to 05/31/18 |
||||||||||||||||
| Class K |
||||||||||||||||
| Shares sold |
38,184 | $ | 422,503 | 167,712 | $ | 1,842,979 | ||||||||||
| Shares issued in reinvestment of distributions |
5,229 | 57,581 | 1,109 | 12,192 | ||||||||||||
| Shares redeemed |
(57,195 | ) | (632,450 | ) | (8,042 | ) | (88,544 | ) | ||||||||
|
|
|
|
|
|
|
|
|
|||||||||
| Net increase (decrease) |
(13,782 | ) | $ | (152,366 | ) | 160,779 | $ | 1,766,627 | ||||||||
|
|
|
|
|
|
|
|
|
|||||||||
| Total Net Increase |
3,219,343 | $ | 35,829,294 | 370,562 | $ | 4,258,527 | ||||||||||
|
|
|
|
|
|
|
|
|
|||||||||
| Year Ended 05/31/19 |
Year Ended 05/31/18 |
|||||||||||||||
| BlackRock Pennsylvania Municipal Bond Fund | Shares | Amount | Shares | Amount | ||||||||||||
| Institutional |
| |||||||||||||||
| Shares sold |
9,419,819 | $ | 102,303,401 | 10,292,937 | $ | 114,183,689 | ||||||||||
| Shares issued in reinvestment of distributions |
500,787 | 5,456,679 | 385,158 | 4,259,533 | ||||||||||||
| Shares redeemed |
(8,187,076 | ) | (88,538,178 | ) | (4,864,889 | ) | (53,782,174 | ) | ||||||||
|
|
|
|
|
|
|
|
|
|||||||||
| Net increase |
1,733,530 | $ | 19,221,902 | 5,813,206 | $ | 64,661,048 | ||||||||||
|
|
|
|
|
|
|
|
|
|||||||||
| Service |
| |||||||||||||||
| Shares sold |
87,159 | $ | 946,989 | 64,724 | $ | 715,640 | ||||||||||
| Shares issued in reinvestment of distributions |
5,707 | 62,276 | 5,211 | 57,766 | ||||||||||||
| Shares redeemed |
(68,175 | ) | (732,397 | ) | (34,872 | ) | (387,104 | ) | ||||||||
|
|
|
|
|
|
|
|
|
|||||||||
| Net increase |
24,691 | $ | 276,868 | 35,063 | $ | 386,302 | ||||||||||
|
|
|
|
|
|
|
|
|
|||||||||
| Investor A |
| |||||||||||||||
| Shares sold |
3,381,545 | $ | 36,743,125 | 2,832,504 | $ | 31,578,196 | ||||||||||
| Shares issued in reinvestment of distributions |
308,066 | 3,359,167 | 352,373 | 3,913,032 | ||||||||||||
| Shares redeemed |
(2,688,372 | ) | (29,200,775 | ) | (5,853,729 | ) | (65,335,757 | ) | ||||||||
|
|
|
|
|
|
|
|
|
|||||||||
| Net increase (decrease) |
1,001,239 | $ | 10,901,517 | (2,668,852 | ) | $ | (29,844,529 | ) | ||||||||
|
|
|
|
|
|
|
|
|
|||||||||
| Investor A1 |
| |||||||||||||||
| Shares sold |
16 | $ | 208 | 1,145 | $ | 12,791 | ||||||||||
| Shares issued in reinvestment of distributions |
23,489 | 256,039 | 26,510 | 294,145 | ||||||||||||
| Shares redeemed |
(331,516 | ) | (3,572,846 | ) | (136,134 | ) | (1,510,949 | ) | ||||||||
|
|
|
|
|
|
|
|
|
|||||||||
| Net decrease |
(308,011 | ) | $ | (3,316,599 | ) | (108,479 | ) | $ | (1,204,013 | ) | ||||||
|
|
|
|
|
|
|
|
|
|||||||||
| Investor C |
| |||||||||||||||
| Shares sold |
351,430 | $ | 3,835,593 | 398,592 | $ | 4,438,550 | ||||||||||
| Shares issued in reinvestment of distributions |
73,632 | 802,268 | 83,407 | 924,849 | ||||||||||||
| Shares redeemed |
(655,353 | ) | (7,117,874 | ) | (540,400 | ) | (5,993,761 | ) | ||||||||
|
|
|
|
|
|
|
|
|
|||||||||
| Net decrease |
(230,291 | ) | $ | (2,480,013 | ) | (58,401 | ) | $ | (630,362 | ) | ||||||
|
|
|
|
|
|
|
|
|
|||||||||
| Investor C1 |
| |||||||||||||||
| Shares sold |
5 | $ | (340 | ) | — | $ | 5 | |||||||||
| Shares issued in reinvestment of distributions |
2,194 | 23,818 | 4,873 | 53,973 | ||||||||||||
| Shares redeemed |
(145,368 | ) | (1,554,847 | ) | (1,488 | ) | (16,603 | ) | ||||||||
|
|
|
|
|
|
|
|
|
|||||||||
| Net increase (decrease) |
(143,169 | ) | $ | (1,531,369 | ) | 3,385 | $ | 37,375 | ||||||||
|
|
|
|
|
|
|
|
|
|||||||||
| 102 | 2019 BLACKROCK ANNUAL REPORT TO SHAREHOLDERS |
Notes to Financial Statements (continued)
| Year Ended 05/31/19 |
Period
from 01/25/18 (a) to 05/31/18 |
|||||||||||||||
| BlackRock Pennsylvania Municipal Bond Fund (continued) | Shares | Amount | Shares | Amount | ||||||||||||
| Class K |
||||||||||||||||
| Shares sold |
113,348 | $ | 1,232,815 | 229,838 | $ | 2,514,155 | ||||||||||
| Shares issued in reinvestment of distributions |
7,457 | 81,120 | 1,637 | 17,912 | ||||||||||||
| Shares redeemed |
(137,868 | ) | (1,487,711 | ) | (4,841 | ) | (52,889 | ) | ||||||||
|
|
|
|
|
|
|
|
|
|||||||||
| Net increase (decrease) |
(17,063 | ) | $ | (173,776 | ) | 226,634 | $ | 2,479,178 | ||||||||
|
|
|
|
|
|
|
|
|
|||||||||
| Total Net Increase |
2,060,926 | $ | 22,898,530 | 3,242,556 | $ | 35,884,999 | ||||||||||
|
|
|
|
|
|
|
|
|
|||||||||
| Year Ended 05/31/19 |
Year Ended 05/31/18 |
|||||||||||||||
| BlackRock Strategic Municipal Opportunities Fund | Shares | Amount | Shares | Amount | ||||||||||||
| Institutional |
| |||||||||||||||
| Shares sold |
424,159,901 | $ | 4,902,103,070 | 246,959,050 | $ | 2,883,901,310 | ||||||||||
| Shares issued in reinvestment of distributions |
22,190,343 | 255,471,978 | 7,736,733 | 90,194,483 | ||||||||||||
| Shares redeemed |
(209,250,857 | ) | (2,408,474,429 | ) | (65,457,559 | ) | (763,801,344 | ) | ||||||||
|
|
|
|
|
|
|
|
|
|||||||||
| Net increase |
237,099,387 | $ | 2,749,100,619 | 189,238,224 | $ | 2,210,294,449 | ||||||||||
|
|
|
|
|
|
|
|
|
|||||||||
| Investor A |
| |||||||||||||||
| Shares sold |
70,818,841 | $ | 819,966,183 | 50,862,911 | $ | 593,342,404 | ||||||||||
| Shares issued in reinvestment of distributions |
5,863,312 | 67,460,707 | 2,491,600 | 29,024,685 | ||||||||||||
| Shares redeemed |
(41,574,543 | ) | (479,087,785 | ) | (21,362,682 | ) | (249,126,409 | ) | ||||||||
|
|
|
|
|
|
|
|
|
|||||||||
| Net increase |
35,107,610 | $ | 408,339,105 | 31,991,829 | $ | 373,240,680 | ||||||||||
|
|
|
|
|
|
|
|
|
|||||||||
| Investor A1 |
| |||||||||||||||
| Shares sold |
14 | $ | 165 | 1,629 | $ | 19,104 | ||||||||||
| Shares issued in reinvestment of distributions |
72,985 | 840,116 | 43,179 | 502,806 | ||||||||||||
| Shares redeemed |
(201,324 | ) | (2,330,888 | ) | (210,354 | ) | (2,452,599 | ) | ||||||||
|
|
|
|
|
|
|
|
|
|||||||||
| Net decrease |
(128,325 | ) | $ | (1,490,607 | ) | (165,546 | ) | $ | (1,930,689 | ) | ||||||
|
|
|
|
|
|
|
|
|
|||||||||
| Investor C |
| |||||||||||||||
| Shares sold |
7,848,189 | $ | 90,763,176 | 5,485,639 | $ | 64,003,026 | ||||||||||
| Shares issued in reinvestment of distributions |
840,284 | 9,657,647 | 360,679 | 4,202,630 | ||||||||||||
| Shares redeemed |
(5,278,387 | ) | (61,026,197 | ) | (4,722,846 | ) | (55,051,676 | ) | ||||||||
|
|
|
|
|
|
|
|
|
|||||||||
| Net increase |
3,410,086 | $ | 39,394,626 | 1,123,472 | $ | 13,153,980 | ||||||||||
|
|
|
|
|
|
|
|
|
|||||||||
| Period from 01/25/18 (a) to 05/31/18 |
||||||||||||||||
| Class K |
| |||||||||||||||
| Shares sold |
7,541,691 | $ | 87,217,846 | 5,591,102 | $ | 65,377,205 | ||||||||||
| Shares issued in reinvestment of distributions |
297,854 | 3,428,548 | 19,055 | 222,912 | ||||||||||||
| Shares redeemed |
(2,509,491 | ) | (28,969,680 | ) | (165,423 | ) | (1,933,722 | ) | ||||||||
|
|
|
|
|
|
|
|
|
|||||||||
| Net increase |
5,330,054 | $ | 61,676,714 | 5,444,734 | $ | 63,666,395 | ||||||||||
|
|
|
|
|
|
|
|
|
|||||||||
| Total Net Increase |
280,818,812 | $ | 3,257,020,457 | 227,632,713 | $ | 2,658,424,815 | ||||||||||
|
|
|
|
|
|
|
|
|
|||||||||
| (a) | Commencement of operations. |
As of May 31, 2019, shares owned by BlackRock Financial Management Inc., an affiliate of the Funds, were as follows:
| Class K | ||||
| California Municipal Opportunities |
15,811 | |||
| New Jersey Municipal Bond |
18,124 | |||
| Pennsylvania Municipal Bond |
18,204 | |||
| Strategic Municipal Opportunities |
17,136 | |||
| 12. | REGULATION S-X AMENDMENTS |
On August 17, 2018, the SEC adopted amendments to certain disclosure requirements in Securities Act Release No. 33-10532, Disclosure Update and Simplification. The Funds have adopted the amendments pertinent to Regulation S-X in this shareholder report. The amendments impacted certain disclosure presentation on the Statements of Assets and Liabilities, Statements of Changes in Net Assets and Notes to the Financial Statements.
| NOTES TO FINANCIAL STATEMENTS | 103 |
Notes to Financial Statements (continued)
Prior year distribution information and undistributed net investment income in the Statements of Changes in Net Assets has been modified to conform to the current year presentation in accordance with the Regulation S-X changes.
Distributions for the year ended May 31, 2018 were classified as follows:
| Share Class | Net Investment Income | Net Realized Gain | ||||||||||||
| California Municipal Opportunities |
I | $ | 23,475,635 | $ | 2,842,373 | |||||||||
| A | 12,510,916 | 1,604,174 | ||||||||||||
| A1 | 3,201,830 | 389,919 | ||||||||||||
| C | 1,977,683 | 363,855 | ||||||||||||
| C1 | 55,063 | 8,281 | ||||||||||||
| K | 64,324 | — | ||||||||||||
| New Jersey Municipal Bond |
I | 5,466,207 | — | |||||||||||
| Service | 279,012 | — | ||||||||||||
| A | 2,579,621 | — | ||||||||||||
| A1 | 756,468 | — | ||||||||||||
| C | 759,230 | — | ||||||||||||
| C1 | 41,155 | — | ||||||||||||
| K | 13,422 | — | ||||||||||||
| Pennsylvania Municipal Bond |
I | 13,256,749 | — | |||||||||||
| Service | 58,703 | — | ||||||||||||
| A | 4,371,905 | — | ||||||||||||
| A1 | 578,208 | — | ||||||||||||
| C | 1,019,422 | — | ||||||||||||
| C1 | 54,763 | — | ||||||||||||
| K | 19,222 | — | ||||||||||||
| Strategic Municipal Opportunities |
I | 122,949,305 | — | |||||||||||
| A | 31,688,920 | — | ||||||||||||
| A1 | 826,386 | — | ||||||||||||
| C | 4,744,212 | — | ||||||||||||
| K | 286,704 | — | ||||||||||||
Undistributed net investment income as of May 31, 2018 was as follows:
| Undistributed Net Investment Income |
||||
| California Municipal Opportunities |
$ | 627,546 | ||
| New Jersey Municipal Bond |
873,153 | |||
| Pennsylvania Municipal Bond |
740,460 | |||
| Strategic Municipal Opportunities |
1,894,810 | |||
| 13. | SUBSEQUENT EVENTS |
Management has evaluated the impact of all subsequent events on the Funds through the date the financial statements were issued and has determined that there were no subsequent events requiring adjustment or additional disclosure in the financial statements.
| 104 | 2019 BLACKROCK ANNUAL REPORT TO SHAREHOLDERS |
Report of Independent Registered Public Accounting Firm
To the Shareholders of BlackRock California Municipal Opportunities Fund, BlackRock New Jersey Municipal Bond Fund, BlackRock Pennsylvania Municipal Bond Fund, and BlackRock Strategic Municipal Opportunities Fund and the Boards of Trustees of BlackRock California Municipal Series Trust, BlackRock Multi-State Municipal Series Trust, and BlackRock Municipal Series Trust:
Opinion on the Financial Statements and Financial Highlights
We have audited the accompanying statements of assets and liabilities of BlackRock California Municipal Opportunities Fund of BlackRock California Municipal Series Trust, BlackRock New Jersey Municipal Bond Fund and BlackRock Pennsylvania Municipal Bond Fund of BlackRock Multi-State Municipal Series Trust, and BlackRock Strategic Municipal Opportunities Fund of BlackRock Municipal Series Trust (the “Funds”), including the schedules of investments, as of May 31, 2019, the related statements of operations for the year then ended, the statement of cash flows for BlackRock Pennsylvania Municipal Bond Fund for the year then ended, the statements of changes in net assets for each of the two years in the period then ended, the financial highlights for each of the five years in the period then ended, and the related notes. In our opinion, the financial statements and financial highlights present fairly, in all material respects, the financial position of the Funds as of May 31, 2019, and the results of their operations and BlackRock Pennsylvania Municipal Bond Fund’s cash flows for the year then ended, the changes in their net assets for each of the two years in the period then ended, and the financial highlights for each of the five years in the period then ended, in conformity with accounting principles generally accepted in the United States of America.
Basis for Opinion
These financial statements and financial highlights are the responsibility of the Funds’ management. Our responsibility is to express an opinion on the Funds’ financial statements and financial highlights based on our audits. We are a public accounting firm registered with the Public Company Accounting Oversight Board (United States) (PCAOB) and are required to be independent with respect to the Funds in accordance with the U.S. federal securities laws and the applicable rules and regulations of the Securities and Exchange Commission and the PCAOB.
We conducted our audits in accordance with the standards of the PCAOB. Those standards require that we plan and perform the audit to obtain reasonable assurance about whether the financial statements and financial highlights are free of material misstatement, whether due to error or fraud. The Funds are not required to have, nor were we engaged to perform, an audit of their internal control over financial reporting. As part of our audits we are required to obtain an understanding of internal control over financial reporting but not for the purpose of expressing an opinion on the effectiveness of the Funds’ internal control over financial reporting. Accordingly, we express no such opinion.
Our audits included performing procedures to assess the risks of material misstatement of the financial statements and financial highlights, whether due to error or fraud, and performing procedures that respond to those risks. Such procedures included examining, on a test basis, evidence regarding the amounts and disclosures in the financial statements and financial highlights. Our audits also included evaluating the accounting principles used and significant estimates made by management, as well as evaluating the overall presentation of the financial statements and financial highlights. Our procedures included confirmation of securities owned as of May 31, 2019, by correspondence with the custodian and brokers; when replies were not received from brokers, we performed other auditing procedures. We believe that our audits provide a reasonable basis for our opinion.
Deloitte & Touche LLP
Boston, Massachusetts
July 23, 2019
We have served as the auditor of one or more BlackRock investment companies since 1992.
Important Tax Information (unaudited)
During the fiscal year ended May 31, 2019 the following information is provided with respect to the ordinary income distributions paid by the Funds:
| Payable Dates | BlackRock California Municipal Opportunities Fund |
BlackRock New Jersey Municipal Bond Fund |
BlackRock Pennsylvania Municipal Bond Fund |
BlackRock Strategic Municipal Opportunities Fund |
||||||||||||||
| Interest-Related Dividends and Qualified Short-Term Capital Gains for Non-US Residents(a) |
June 2018 — December 2018 | 100.00 | % | 100.00 | % | 100.00 | % | 100.00 | % | |||||||||
| January 2019 — May 2019 | 100.00 | — | — | 100.00 | ||||||||||||||
| (a) | Represents the portion of the taxable ordinary income dividends eligible for exemption from U.S. withholding tax for nonresident aliens and foreign corporations. |
Additionally, California Municipal Opportunities Fund and Strategic Municipal Opportunities Fund distributed long-term capital gains of $0.160172 and $0.156083 per share to shareholders of record on December 6, 2018, respectively.
All other net investment income distributions paid by BlackRock California Municipal Opportunities Fund, BlackRock New Jersey Municipal Bond Fund, BlackRock Pennsylvania Municipal Bond Fund and BlackRock Strategic Municipal Opportunities Fund qualify as tax-exempt interest dividends for federal income tax purposes.
| REPORT OF INDEPENDENT REGISTERED PUBLIC ACCOUNTING FIRM / IMPORTANT TAX INFORMATION | 105 |
Trustee and Officer Information
| Independent Trustees (a) | ||||||||
| Name Year of Birth (b) |
Position(s) Held (Length of Service) (c) |
Principal Occupation(s) During Past Five Years |
Number of BlackRock-Advised (“RICs”) Consisting of |
Public Company and Other Investment Company Directorships Held During Past Five Years | ||||
| Richard E. Cavanagh 1946 |
Co-Chair of the Board and Trustee (Since 2019) |
Director, The Guardian Life Insurance Company of America since 1998; Board Chair, Volunteers of America (a not-for-profit organization) from 2015 to 2018 (board member since 2009); Director, Arch Chemicals (chemical and allied products) from 1999 to 2011; Trustee, Educational Testing Service from 1997 to 2009 and Chairman thereof from 2005 to 2009; Senior Advisor, The Fremont Group since 2008 and Director thereof since 1996; Faculty Member/Adjunct Lecturer, Harvard University since 2007 and Executive Dean from 1987 to 1995; President and Chief Executive Officer, The Conference Board, Inc. (global business research organization) from 1995 to 2007. | 88 RICs consisting of 112 Portfolios | None | ||||
| Karen P. Robards 1950 |
Co-Chair of the Board and Trustee (Since 2019) |
Principal of Robards & Company, LLC (consulting and private investing) since 1987; Co-founder and Director of the Cooke Center for Learning and Development (a not-for-profit organization) since 1987; Director of Enable Injections, LLC (medical devices) since 2019; Investment Banker at Morgan Stanley from 1976 to 1987. | 88 RICs consisting of 112 Portfolios | Greenhill & Co., Inc.; AtriCure, Inc. (medical devices) from 2000 until 2017 | ||||
| Michael J. Castellano 1946 |
Trustee (Since 2019) |
Chief Financial Officer of Lazard Group LLC from 2001 to 2011; Chief Financial Officer of Lazard Ltd from 2004 to 2011; Director, Support Our Aging Religious (non-profit) from 2009 to June 2015 and since 2017; Director, National Advisory Board of Church Management at Villanova University since 2010; Trustee, Domestic Church Media Foundation since 2012; Director, CircleBlack Inc. (financial technology company) since 2015. | 88 RICs consisting of 112 Portfolios | None | ||||
| Cynthia L. Egan 1955 |
Trustee (Since 2019) |
Advisor, U.S. Department of the Treasury from 2014 to 2015; President, Retirement Plan Services for T. Rowe Price Group, Inc. from 2007 to 2012; executive positions within Fidelity Investments from 1989 to 2007. | 88 RICs consisting of 112 Portfolios | Unum (insurance); The Hanover Insurance Group (insurance); Envestnet (investment platform) from 2013 until 2016 | ||||
| Frank J. Fabozzi 1948 |
Trustee (Since 2019) |
Editor of The Journal of Portfolio Management since 1986; Professor of Finance, EDHEC Business School (France) since 2011; Visiting Professor, Princeton University for the 2013 to 2014 academic year and Spring 2017 semester; Professor in the Practice of Finance, Yale University School of Management from 1994 to 2011 and currently a Teaching Fellow in Yale’s Executive Programs; Board Member, BlackRock Equity-Liquidity Funds from 2014 to 2016; affiliated professor Karlsruhe Institute of Technology from 2008 to 2011. | 88 RICs consisting of 112 Portfolios | None | ||||
| Henry Gabbay 1947 |
Trustee (Since 2007) |
Board Member, BlackRock Equity-Bond Board from 2007 to 2018; Board Member, BlackRock Equity-Liquidity and BlackRock Closed-End Fund Boards from 2007 through 2014; Consultant, BlackRock, Inc. from 2007 to 2008; Managing Director, BlackRock, Inc. from 1989 to 2007; Chief Administrative Officer, BlackRock Advisors, LLC from 1998 to 2007; President of BlackRock Funds and BlackRock Allocation Target Shares (formerly, BlackRock Bond Allocation Target Shares) from 2005 to 2007 and Treasurer of certain closed-end funds in the BlackRock fund complex from 1989 to 2006. | 88 RICs consisting of 112 Portfolios | None | ||||
| 106 | 2019 BLACKROCK ANNUAL REPORT TO SHAREHOLDERS |
Trustee and Officer Information (continued)
| Independent Trustees (a) (continued) | ||||||||
| Name Year of Birth (b) |
Position(s) Held (Length of Service) (c) |
Principal Occupation(s) During Past Five Years |
Number of BlackRock-Advised (“RICs”) Consisting of |
Public Company and Other Investment Company Directorships Held During Past Five Years | ||||
| R. Glenn Hubbard 1958 |
Trustee (Since 2019) |
Dean, Columbia Business School since 2004; Faculty member, Columbia Business School since 1988. | 88 RICs consisting of 112 Portfolios | ADP (data and information services); Metropolitan Life Insurance Company (insurance); KKR Financial Corporation (finance) from 2004 until 2014 | ||||
| W. Carl Kester 1951 |
Trustee (Since 2019) |
George Fisher Baker Jr. Professor of Business Administration, Harvard Business School since 2008; Deputy Dean for Academic Affairs from 2006 to 2010; Chairman of the Finance Unit, from 2005 to 2006; Senior Associate Dean and Chairman of the MBA Program from 1999 to 2005; Member of the faculty of Harvard Business School since 1981. | 88 RICs consisting of 112 Portfolios | None | ||||
| Catherine A. Lynch 1961 |
Trustee (Since 2019) |
Chief Executive Officer, Chief Investment Officer and various other positions, National Railroad Retirement Investment Trust from 2003 to 2016; Associate Vice President for Treasury Management, The George Washington University from 1999 to 2003; Assistant Treasurer, Episcopal Church of America from 1995 to 1999. | 88 RICs consisting of 112 Portfolios | None | ||||
| Interested Trustees (a)(d) | ||||||||
| Name Year of Birth (b) |
Position(s) Held (Length of Service) (c) |
Principal Occupation(s) During Past Five Years | Number of BlackRock-Advised Registered Investment Companies (“RICs”) Consisting of Investment Portfolios (“Portfolios”) Overseen |
Public Company and Other Investment Company Directorships Held During Past Five Years | ||||
| Robert Fairbairn 1965 |
Trustee (Since 2015) |
Vice Chairman of BlackRock, Inc. since 2019; Member of BlackRock’s Global Executive and Global Operating Committees; Co-Chair of BlackRock’s Human Capital Committee; Senior Managing Director of BlackRock, Inc. from 2010 to 2019; oversaw BlackRock’s Strategic Partner Program and Strategic Product Management Group from 2012 to 2019; Member of the Board of Managers of BlackRock Investments, LLC from 2011 to 2018; Global Head of BlackRock’s Retail and iShares® businesses from 2012 to 2016. | 126 RICs consisting of 294 Portfolios | None | ||||
| John M. Perlowski 1964 |
Trustee (Since 2015); President and Chief Executive Officer (Since 2010) |
Managing Director of BlackRock, Inc. since 2009; Head of BlackRock Global Accounting and Product Services since 2009; Advisory Director of Family Resource Network (charitable foundation) since 2009. | 126 RICs consisting of 294 Portfolios | None | ||||
| (a) The address of each Trustee is c/o BlackRock, Inc., 55 East 52nd Street, New York, New York 10055. | ||||||||
| (b) Each Independent Trustee holds office until his or her successor is duly elected and qualifies or until his or her earlier death, resignation, retirement or removal as provided by the Trust’s by-laws or charter or statute, or until December 31 of the year in which he or she turns 75. Trustees who are “interested persons,” as defined in the Investment Company Act serve until their successor is duly elected and qualifies or until their earlier death, resignation, retirement or removal as provided by the Trust’s by-laws or statute, or until December 31 of the year in which they turn 72. The Board may determine to extend the terms of Independent Trustees on a case-by-case basis, as appropriate. | ||||||||
| (c) Following the combination of Merrill Lynch Investment Managers, L.P. (“MLIM”) and BlackRock, Inc. in September 2006, the various legacy MLIM and legacy BlackRock fund boards were realigned and consolidated into three new fund boards in 2007. Certain Independent Trustees first became members of the boards of other legacy MLIM or legacy BlackRock funds as follows: Richard E. Cavanagh, 1994; Frank J. Fabozzi, 1988; R. Glenn Hubbard, 2004; W. Carl Kester, 1995; and Karen P. Robards, 1998. Certain other Independent Trustees became members of the boards of the closed-end funds in the Fixed-Income Complex as follows: Michael J. Castellano, 2011; Cynthia L. Egan, 2016; and Catherine A. Lynch, 2016. | ||||||||
| (d) Mr. Fairbairn and Mr. Perlowski are both “interested persons,” as defined in the Investment Company Act 1940 Act, of the Trust based on their positions with BlackRock, Inc. and its affiliates. Mr. Fairbairn and Mr. Perlowski are also board members of the BlackRock Multi-Asset Complex. | ||||||||
| TRUSTEE AND OFFICER INFORMATION | 107 |
Trustee and Officer Information (continued)
| Officers Who Are Not Trustees (a) | ||||
| Name Year of Birth (b) |
Position(s) Held (Length of Service) |
Principal Occupation(s) During Past Five Years | ||
| Jennifer McGovern 1977 |
Vice President (Since 2014) |
Managing Director of BlackRock, Inc. since 2016; Director of BlackRock, Inc. from 2011 to 2015; Head of Product Development and Oversight for BlackRock’s Strategic Product Management Group since 2019; Previously Head of Product Structure and Oversight for BlackRock’s U.S. Wealth Advisory Group from 2013 to 2019. | ||
| Neal J. Andrews 1966 |
Chief Financial Officer (Since 2007) |
Chief Financial Officer of the iShares® exchange traded funds since 2019; Managing Director of BlackRock, Inc. since 2006. | ||
| Jay M. Fife 1970 |
Treasurer (Since 2007) |
Managing Director of BlackRock, Inc. since 2007. | ||
| Charles Park 1967 |
Chief Compliance Officer (Since 2014) |
Anti-Money Laundering Compliance Officer for certain BlackRock-advised Funds from 2014 to 2015; Chief Compliance Officer of BlackRock Advisors, LLC and the BlackRock-advised Funds in the BlackRock Multi-Asset Complex and the BlackRock Fixed-Income Complex since 2014; Principal of and Chief Compliance Officer for iShares® Delaware Trust Sponsor LLC since 2012 and BlackRock Fund Advisors (“BFA”) since 2006; Chief Compliance Officer for the BFA-advised iShares® exchange traded funds since 2006; Chief Compliance Officer for BlackRock Asset Management International Inc. since 2012. | ||
| John MacKessy 1972 |
Anti-Money Laundering Compliance Officer (Since 2018) |
Director of BlackRock, Inc. since 2017; Global Head of Anti-Money Laundering at BlackRock, Inc. since 2017; Director of AML Monitoring and Investigations Group of Citibank from 2015 to 2017; Global Anti-Money Laundering and Economic Sanctions Officer for MasterCard from 2011 to 2015. | ||
| Benjamin Archibald 1975 |
Secretary (Since 2012) |
Managing Director of BlackRock, Inc. since 2014; Director of BlackRock, Inc. from 2010 to 2013; Secretary of the iShares® exchange traded funds since 2015; Secretary of the BlackRock-advised mutual funds since 2012. | ||
| (a) The address of each Officer is c/o BlackRock, Inc., 55 East 52nd Street, New York, New York 10055. | ||||
| (b) Officers of the Trust serve at the pleasure of the Board. | ||||
Further information about the Trust’s Trustees and Officers is available in the Trust’s Statement of Additional Information, which can be obtained without charge by calling (800) 441-7762.
Effective January 1, 2019, Richard E. Cavanagh and Karen P. Robards were appointed as a Co-Chair of the Board. Prior to January 1, 2019, Mr. Cavanagh served as Chair of the Board and Ms. Robards served as Vice Chair of the Board.
| 108 | 2019 BLACKROCK ANNUAL REPORT TO SHAREHOLDERS |
General Information
Quarterly performance, semi-annual and annual reports, current net asset value and other information regarding the Funds, may be found on BlackRock’s website, which can be accessed at http://www.blackrock.com. Any reference to BlackRock’s website in this report is intended to allow investors public access to information regarding the Funds and does not, and is not intended to, incorporate BlackRock’s website in this report.
Householding
The Funds will mail only one copy of shareholder documents, including prospectuses, annual and semi-annual reports and proxy statements, to shareholders with multiple accounts at the same address. This practice is commonly called “householding” and is intended to reduce expenses and eliminate duplicate mailings of shareholder documents. Mailings of your shareholder documents may be householded indefinitely unless you instruct us otherwise. If you do not want the mailing of these documents to be combined with those for other members of your household, please call the Funds at (800) 441-7762.
Availability of Quarterly Schedule of Investments
The Funds file their complete schedule of portfolio holdings with the SEC for the first and third quarters of each fiscal year as an exhibit to its reports on Form N-PORT, and for reporting periods ended prior to March 31, 2019, filed such information on Form N-Q. The Funds’ Forms N-PORT and N-Q are available on the SEC’s website at http://www.sec.gov. The Funds’ Forms N-PORT and N-Q may also be obtained upon request and without charge by calling (800) 441-7762.
Availability of Proxy Voting Policies and Procedures
A description of the policies and procedures that the Funds use to determine how to vote proxies relating to portfolio securities is available upon request and without charge, (1) by calling (800) 441-7762; (2) at http://www.blackrock.com; and (3) on the SEC’s website at http://www.sec.gov.
Availability of Proxy Voting Record
Information about how the Funds voted proxies relating to securities held in the Funds’ portfolios during the most recent 12-month period ended June 30 is available upon request and without charge (1) at http://www.blackrock.com; or by calling (800) 441-7762 and (2) on the SEC’s website at http://www.sec.gov.
BlackRock’s Mutual Fund Family
BlackRock offers a diverse lineup of open-end mutual funds crossing all investment styles and managed by experts in equity, fixed income and tax-exempt investing. Visit http://www.blackrock.com for more information.
Shareholder Privileges
Account Information
Call us at (800) 441-7762 from 8:00 AM to 6:00 PM ET on any business day to get information about your account balances, recent transactions and share prices. You can also reach us on the Web at http://www.blackrock.com.
Automatic Investment Plans
Investor Class shareholders who want to invest regularly can arrange to have $50 or more automatically deducted from their checking or savings account and invested in any of the BlackRock funds.
Systematic Withdrawal Plans
Investor Class shareholders can establish a systematic withdrawal plan and receive periodic payments of $50 or more from their BlackRock funds, as long as their account balance is at least $10,000.
Retirement Plans
Shareholders may make investments in conjunction with Traditional, Rollover, Roth, Coverdell, Simple IRAs, SEP IRAs and 403(b) Plans.
| ADDITIONAL INFORMATION | 109 |
Additional Information (continued)
BlackRock Privacy Principles
BlackRock is committed to maintaining the privacy of its current and former fund investors and individual clients (collectively, “Clients”) and to safeguarding their non-public personal information. The following information is provided to help you understand what personal information BlackRock collects, how we protect that information and why in certain cases we share such information with select parties.
If you are located in a jurisdiction where specific laws, rules or regulations require BlackRock to provide you with additional or different privacy-related rights beyond what is set forth below, then BlackRock will comply with those specific laws, rules or regulations.
BlackRock obtains or verifies personal non-public information from and about you from different sources, including the following: (i) information we receive from you or, if applicable, your financial intermediary, on applications, forms or other documents; (ii) information about your transactions with us, our affiliates, or others; (iii) information we receive from a consumer reporting agency; and (iv) from visits to our websites.
BlackRock does not sell or disclose to non-affiliated third parties any non-public personal information about its Clients, except as permitted by law or as is necessary to respond to regulatory requests or to service Client accounts. These non-affiliated third parties are required to protect the confidentiality and security of this information and to use it only for its intended purpose.
We may share information with our affiliates to service your account or to provide you with information about other BlackRock products or services that may be of interest to you. In addition, BlackRock restricts access to non-public personal information about its Clients to those BlackRock employees with a legitimate business need for the information. BlackRock maintains physical, electronic and procedural safeguards that are designed to protect the non-public personal information of its Clients, including procedures relating to the proper storage and disposal of such information.
Glossary of Terms Used in this Report
| 110 | 2019 BLACKROCK ANNUAL REPORT TO SHAREHOLDERS |
This report is intended for current holders. It is not authorized for use as an offer of sale or a solicitation of an offer to buy shares of a Fund unless preceded or accompanied by the Fund’s current prospectus. Past performance results shown in this report should not be considered a representation of future performance. Investment returns and principal value of shares will fluctuate so that shares, when redeemed, may be worth more or less than their original cost. Statements and other information herein are as dated and are subject to change.

| MUNI4-5/19-AR |

|
| Item 2 – | Code of Ethics – The registrant (or the “Fund”) has adopted a code of ethics, as of the end of the period covered by this report, applicable to the registrant’s principal executive officer, principal financial officer, principal accounting officer or controller, or persons performing similar functions. During the period covered by this report, the code of ethics was amended to update certain information and to make other non-material changes. During the period covered by this report, there have been no waivers granted under the code of ethics. The registrant undertakes to provide a copy of the code of ethics to any person upon request, without charge, who calls 1-800-441-7762. |
| Item 3 – | Audit Committee Financial Expert – The registrant’s board of trustees (the “board of trustees”), has determined that (i) the registrant has the following audit committee financial experts serving on its audit committee and (ii) each audit committee financial expert is independent: |
Michael Castellano
Frank J. Fabozzi
Henry Gabbay
Catherine A. Lynch
Karen P. Robards
The registrant’s board of trustees has determined that Karen P. Robards qualifies as an audit committee financial expert pursuant to Item 3(c)(4) of Form N-CSR.
Ms. Robards has a thorough understanding of generally accepted accounting principles, financial statements and internal control over financial reporting as well as audit committee functions. Ms. Robards has been President of Robards & Company, a financial advisory firm, since 1987. Ms. Robards was formerly an investment banker for more than 10 years where she was responsible for evaluating and assessing the performance of companies based on their financial results. Ms. Robards has over 30 years of experience analyzing financial statements. She also is a member of the audit committee of one publicly held company and a non-profit organization.
Under applicable securities laws, a person determined to be an audit committee financial expert will not be deemed an “expert” for any purpose, including without limitation for the purposes of Section 11 of the Securities Act of 1933, as a result of being designated or identified as an audit committee financial expert. The designation or identification as an audit committee financial expert does not impose on such person any duties, obligations, or liabilities greater than the duties, obligations, and liabilities imposed on such person as a member of the audit committee and board of trustees in the absence of such designation or identification. The designation or identification of a person as an audit committee financial expert does not affect the duties, obligations, or liability of any other member of the audit committee or board of trustees.
| Item 4 – | Principal Accountant Fees and Services |
The following table presents fees billed by Deloitte & Touche LLP (“D&T”) in each of the last two fiscal years for the services rendered to the Fund:
| (a) Audit Fees | (b) Audit-Related Fees1 |
(c) Tax Fees2 | (d) All Other Fees | |||||||||||||||
| Entity Name | Current Fiscal Year End |
Previous Fiscal Year End |
Current Fiscal Year End |
Previous Fiscal Year End |
Current Fiscal Year End |
Previous Fiscal Year End |
Current Fiscal Year End |
Previous Fiscal Year End | ||||||||||
| BlackRock New Jersey Municipal Bond Fund | $31,620 | $31,620 | $4,000 | $0 | $13,500 | $14,100 | $0 | $0 | ||||||||||
| BlackRock Pennsylvania Municipal Bond Fund | $29,784 | $29,784 | $4,000 | $0 | $13,500 | $14,100 | $0 | $0 | ||||||||||
2
The following table presents fees billed by D&T that were required to be approved by the registrant’s audit committee (the “Committee”) for services that relate directly to the operations or financial reporting of the Fund and that are rendered on behalf of BlackRock Advisors, LLC ( the “Investment Adviser” or “BlackRock”) and entities controlling, controlled by, or under common control with BlackRock (not including any sub-adviser whose role is primarily portfolio management and is subcontracted with or overseen by another investment adviser) that provide ongoing services to the Fund (“Affiliated Service Providers”):
| Current Fiscal Year End | Previous Fiscal Year End | |||
|
(b) Audit-Related Fees1 |
$0 | $0 | ||
| (c) Tax Fees2 |
$0 | $0 | ||
| (d) All Other Fees3 |
$2,050,500 | $2,274,000 |
1 The nature of the services includes assurance and related services reasonably related to the performance of the audit or review of financial statements not included in Audit Fees, including accounting consultations, agreed-upon procedure reports, attestation reports, comfort letters, out-of-pocket expenses and internal control reviews not required by regulators.
2 The nature of the services includes tax compliance and/or tax preparation, including services relating to the filing or amendment of federal, state or local income tax returns, regulated investment company qualification reviews, taxable income and tax distribution calculations.
3 Non-audit fees of $2,050,500 and $2,274,000 for the current fiscal year and previous fiscal year, respectively, were paid to the Fund’s principal accountant in their entirety by BlackRock, in connection with services provided to the Affiliated Service Providers of the Fund and of certain other funds sponsored and advised by BlackRock or its affiliates for a service organization review and an accounting research tool subscription. These amounts represent aggregate fees paid by BlackRock and were not allocated on a per fund basis.
(e)(1) Audit Committee Pre-Approval Policies and Procedures:
The Committee has adopted policies and procedures with regard to the pre-approval of services. Audit, audit-related and tax compliance services provided to the registrant on an annual basis require specific pre-approval by the Committee. The Committee also must approve other non-audit services provided to the registrant and those non-audit services provided to the Investment Adviser and Affiliated Service Providers that relate directly to the operations and the financial reporting of the registrant. Certain of these non-audit services that the Committee believes are (a) consistent with the SEC’s auditor independence rules and (b) routine and recurring services that will not impair the independence of the independent accountants may be approved by the Committee without consideration on a specific case-by-case basis (“general pre-approval”). The term of any general pre-approval is 12 months from the date of the pre-approval, unless the Committee provides for a different period. Tax or other non-audit services provided to the registrant which have a direct impact on the operations or financial reporting of the registrant will only be deemed pre-approved provided that any individual project does not exceed $10,000 attributable to the registrant or $50,000 per project. For this purpose, multiple projects will be aggregated to determine if they exceed the previously mentioned cost levels.
Any proposed services exceeding the pre-approved cost levels will require specific pre-approval by the Committee, as will any other services not subject to general pre-approval (e.g., unanticipated but permissible services). The Committee is informed of each service approved
3
subject to general pre-approval at the next regularly scheduled in-person board meeting. At this meeting, an analysis of such services is presented to the Committee for ratification. The Committee may delegate to the Committee Chairman the authority to approve the provision of and fees for any specific engagement of permitted non-audit services, including services exceeding pre-approved cost levels.
(e)(2) None of the services described in each of Items 4(b) through (d) were approved by the Committee pursuant to the de minimis exception in paragraph (c)(7)(i)(C) of Rule 2-01 of Regulation S-X.
(f) Not Applicable
(g) The aggregate non-audit fees, defined as the sum of the fees shown under “Audit-Related Fees,” “Tax Fees” and “All Other Fees,” paid to the accountant for services rendered by the accountant to the registrant, the Investment Adviser and the Affiliated Service Providers were:
| Entity Name | Current Fiscal Year End |
Previous Fiscal Year End |
||||
| BlackRock New Jersey Municipal Bond Fund | $17,500 | $14,100 | ||||
| BlackRock Pennsylvania Municipal Bond Fund | $17,500 | $14,100 |
Additionally, the amounts billed by D&T in connection with services provided to the Affiliated Service Providers of the Fund and of other funds sponsored and advised by BlackRock or its affiliates during the current and previous fiscal years for a service organization review and an accounting research tool subscription were:
| Current Fiscal Year End |
Previous Fiscal Year End | |
|
$2,050,500 |
$2,274,000 |
These amounts represent aggregate fees paid by BlackRock and were not allocated on a per fund basis.
(h) The Committee has considered and determined that the provision of non-audit services that were rendered to the Investment Adviser and the Affiliated Service Providers that were not pre-approved pursuant to paragraph (c)(7)(ii) of Rule 2-01 of Regulation S-X is compatible with maintaining the principal accountant’s independence.
| Item 5 – | Audit Committee of Listed Registrants – Not Applicable |
| Item 6 – | Investments |
(a) The registrant’s Schedule of Investments is included as part of the Report to Stockholders filed under Item 1 of this Form.
(b) Not Applicable due to no such divestments during the semi-annual period covered since the previous Form N-CSR filing.
4
| Item 7 – | Disclosure of Proxy Voting Policies and Procedures for Closed-End Management Investment Companies – Not Applicable |
| Item 8 – | Portfolio Managers of Closed-End Management Investment Companies – Not Applicable |
| Item 9 – | Purchases of Equity Securities by Closed-End Management Investment Company and Affiliated Purchasers – Not Applicable |
| Item 10 – | Submission of Matters to a Vote of Security Holders – There have been no material changes to these procedures. |
| Item 11 – | Controls and Procedures |
(a) The registrant’s principal executive and principal financial officers, or persons performing similar functions, have concluded that the registrant’s disclosure controls and procedures (as defined in Rule 30a-3(c) under the Investment Company Act of 1940, as amended (the “1940 Act”)) are effective as of a date within 90 days of the filing of this report based on the evaluation of these controls and procedures required by Rule 30a-3(b) under the 1940 Act and Rule 15d-15(b) under the Securities Exchange Act of 1934, as amended.
(b) There were no changes in the registrant’s internal control over financial reporting (as defined in Rule 30a-3(d) under the 1940 Act) that occurred during the last fiscal quarter of the period covered by this report that have materially affected, or are reasonably likely to materially affect, the registrant’s internal control over financial reporting.
| Item 12 – | Disclosure of Securities Lending Activities for Closed-End Management Investment Companies – Not Applicable |
| Item 13 – | Exhibits attached hereto |
(a)(1) Code of Ethics – See Item 2
(a)(2) Certifications – Attached hereto
(a)(3) Not Applicable
(a)(4) Not Applicable
(b) Certifications – Attached hereto
5
Pursuant to the requirements of the Securities Exchange Act of 1934 and the Investment Company Act of 1940, the registrant has duly caused this report to be signed on its behalf by the undersigned, thereunto duly authorized.
BlackRock Multi-State Municipal Series Trust
| By: | /s/ John M. Perlowski | |
| John M. Perlowski | ||
| Chief Executive Officer (principal executive officer) of | ||
| BlackRock Multi-State Municipal Series Trust |
Date: August 2, 2019
Pursuant to the requirements of the Securities Exchange Act of 1934 and the Investment Company Act of 1940, this report has been signed below by the following persons on behalf of the registrant and in the capacities and on the dates indicated.
| By: | /s/ John M. Perlowski | |
| John M. Perlowski | ||
| Chief Executive Officer (principal executive officer) of | ||
| BlackRock Multi-State Municipal Series Trust |
Date: August 2, 2019
| By: | /s/ Neal J. Andrews | |
| Neal J. Andrews | ||
| Chief Financial Officer (principal financial officer) of | ||
| BlackRock Multi-State Municipal Series Trust |
Date: August 2, 2019
6