| T. Rowe Price New America Growth Fund | |||||||||||||||||||||||||||||||||||||||||||||||||||||||||||||||||
| T. Rowe Price New America Growth Fund Investor Class I Class Advisor Class SUMMARY | |||||||||||||||||||||||||||||||||||||||||||||||||||||||||||||||||
| Investment Objective | |||||||||||||||||||||||||||||||||||||||||||||||||||||||||||||||||
| The fund seeks to provide long-term capital growth by investing primarily in the common stocks of growth companies. | |||||||||||||||||||||||||||||||||||||||||||||||||||||||||||||||||
| Fees and Expenses | |||||||||||||||||||||||||||||||||||||||||||||||||||||||||||||||||
| This table describes the fees and expenses that you may pay if you buy and hold shares of the fund. You may also incur brokerage commissions and other charges when buying or selling shares of the fund, which are not reflected in the table. | |||||||||||||||||||||||||||||||||||||||||||||||||||||||||||||||||
| Fees and Expenses of the Fund Shareholder fees (fees paid directly from your investment) | |||||||||||||||||||||||||||||||||||||||||||||||||||||||||||||||||
| |||||||||||||||||||||||||||||||||||||||||||||||||||||||||||||||||
| Annual fund operating expenses (expenses that you pay each year as a percentage of the value of your investment) | |||||||||||||||||||||||||||||||||||||||||||||||||||||||||||||||||
| |||||||||||||||||||||||||||||||||||||||||||||||||||||||||||||||||
| Example | |||||||||||||||||||||||||||||||||||||||||||||||||||||||||||||||||
| This example is intended to help you compare the cost of investing in the fund with the cost of investing in other mutual funds. The example assumes that you invest $10,000 in the fund for the time periods indicated and then redeem all of your shares at the end of those periods, that your investment has a 5% return each year, and that the fund’s operating expenses remain the same. Although your actual costs may be higher or lower, based on these assumptions your costs would be: | |||||||||||||||||||||||||||||||||||||||||||||||||||||||||||||||||
| |||||||||||||||||||||||||||||||||||||||||||||||||||||||||||||||||
| Portfolio Turnover | |||||||||||||||||||||||||||||||||||||||||||||||||||||||||||||||||
| The fund pays transaction costs, such as commissions, when it buys and sells securities (or “turns over” its portfolio). A higher portfolio turnover rate may indicate higher transaction costs and may result in higher taxes when the fund’s shares are held in a taxable account. These costs, which are not reflected in annual fund operating expenses or in the example, affect the fund’s performance. During the most recent fiscal year, the fund’s portfolio turnover rate was 92.7% of the average value of its portfolio. | |||||||||||||||||||||||||||||||||||||||||||||||||||||||||||||||||
| Investments, Risks, and Performance Principal Investment Strategies | |||||||||||||||||||||||||||||||||||||||||||||||||||||||||||||||||
| The fund invests primarily (at least 65% of its total assets) in common stocks of U.S. companies operating in those sectors of the economy that, in T. Rowe Price’s view, are the fastest growing or have the greatest growth potential. The U.S. economy continues to evolve, in part because of the application of new technologies and scientific advances. Growing companies that are positioned to benefit from dynamic technological, social, medical, and business developments that help define the current U.S. economic landscape can be found across an array of industries. The fund’s allocation to industry sectors will generally reflect such factors as the overall revenue growth of the component companies in a sector and the sector’s contribution to U.S. gross domestic product from year to year, although the fund may at times invest significantly in stocks of technology companies. Holdings range from large-cap to small-cap companies. In selecting stocks, the advisor looks for many characteristics, typically including, but not limited to:
While most assets will typically be invested in U.S. common stocks, the fund may invest in foreign stocks in keeping with the fund’s objectives. The fund may sell securities for a variety of reasons, such as to secure gains, limit losses, or redeploy assets into more promising opportunities. | |||||||||||||||||||||||||||||||||||||||||||||||||||||||||||||||||
| Principal Risks | |||||||||||||||||||||||||||||||||||||||||||||||||||||||||||||||||
| As with any mutual fund, there is no guarantee that the fund will achieve its objective. The fund’s share price fluctuates, which means you could lose money by investing in the fund. The principal risks of investing in this fund are summarized as follows: Active management risks The investment adviser’s judgments about the attractiveness, value, or potential appreciation of the fund’s investments may prove to be incorrect. If the investments selected and strategies employed by the fund fail to produce the intended results, the fund could underperform in comparison to other funds with similar objectives and investment strategies. Risks of U.S. stock investing Stocks generally fluctuate in value more than bonds and may decline significantly over short time periods. There is a chance that stock prices overall will decline because stock markets tend to move in cycles, with periods of rising and falling prices. The value of a stock in which the fund invests may decline due to general weakness in the U.S. stock market, such as when the U.S. financial markets decline, or because of factors that affect a particular company or industry. Investment style risks Different investment styles tend to shift in and out of favor depending on market conditions and investor sentiment. The fund’s growth approach to investing could cause it to underperform other stock funds that employ a different investment style. Growth stocks tend to be more volatile than certain other types of stocks, and their prices may fluctuate more dramatically than the overall stock market. A stock with growth characteristics can have sharp price declines due to decreases in current or expected earnings and may lack dividends that can help cushion its share price in a declining market. Market capitalization risks Because the fund may invest in companies of any size, its share price could be more volatile than a fund that invests only in large companies. Small and medium-sized companies often have less experienced management, narrower product lines, more limited financial resources, and less publicly available information than larger companies. Larger companies may not be able to attain the high growth rates of successful smaller companies, especially during strong economic periods, and they may be less capable of responding quickly to competitive challenges and industry changes. Industry risks To the extent the fund invests in specific industries or sectors, it may be more susceptible to developments affecting those industries and sectors. For example, the fund may at times have significant investments in technology companies, which could result in the fund performing poorly during a downturn in one or more of the industries that heavily impact technology companies. Technology companies can be adversely affected by, among other things, intense competition, earnings disappointments, and rapid obsolescence of products and services due to technological innovations or changing consumer preferences. Foreign investing risks The fund’s investments in foreign securities may be adversely affected by local, political, social, and economic conditions overseas, greater volatility, reduced liquidity, or decreases in foreign currency values relative to the U.S. dollar. These risks are heightened for the fund’s investments in emerging markets, which are more susceptible to governmental interference, less efficient trading markets, and the imposition of local taxes or restrictions on gaining access to sales proceeds for foreign investors. | |||||||||||||||||||||||||||||||||||||||||||||||||||||||||||||||||
| Performance | |||||||||||||||||||||||||||||||||||||||||||||||||||||||||||||||||
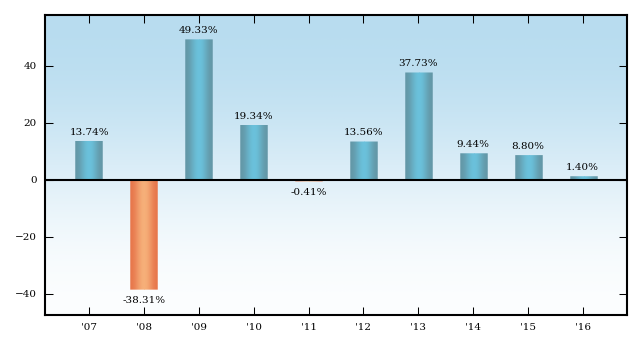
| The following performance information provides some indication of the risks of investing in the fund. The fund’s performance information represents only past performance (before and after taxes) and is not necessarily an indication of future results. The following bar chart illustrates how much returns can differ from year to year by showing calendar year returns and the best and worst calendar quarter returns during those years for the fund’s Investor Class. Returns for other share classes vary since they have different expenses. | |||||||||||||||||||||||||||||||||||||||||||||||||||||||||||||||||
| New America Growth Fund Calendar Year Returns | |||||||||||||||||||||||||||||||||||||||||||||||||||||||||||||||||
| |||||||||||||||||||||||||||||||||||||||||||||||||||||||||||||||||
| |||||||||||||||||||||||||||||||||||||||||||||||||||||||||||||||||
| The following table shows the average annual total returns for each class of the fund that has been in operation for at least one full calendar year, and also compares the returns with the returns of a relevant broad-based market index, as well as with the returns of one or more comparative indexes that have investment characteristics similar to those of the fund. In addition, the table shows hypothetical after-tax returns to demonstrate how taxes paid by a shareholder may influence returns. After-tax returns are calculated using the historical highest individual federal marginal income tax rates and do not reflect the impact of state and local taxes. Actual after-tax returns depend on an investor’s tax situation and may differ from those shown. After-tax returns shown are not relevant to investors who hold their fund shares through tax-deferred arrangements, such as a 401(k) account or individual retirement account. After-tax returns are shown only for the Investor Class and will differ for other share classes. | |||||||||||||||||||||||||||||||||||||||||||||||||||||||||||||||||
| Average Annual Total Returns Periods ended December 31, 2016 | |||||||||||||||||||||||||||||||||||||||||||||||||||||||||||||||||
| |||||||||||||||||||||||||||||||||||||||||||||||||||||||||||||||||
| Updated performance information is available through troweprice.com. | |||||||||||||||||||||||||||||||||||||||||||||||||||||||||||||||||