Table of Contents
UNITED STATES
SECURITIES AND EXCHANGE COMMISSION
Washington, D.C. 20549
FORM N-CSR
CERTIFIED SHAREHOLDER REPORT OF REGISTERED
MANAGEMENT INVESTMENT COMPANIES
Investment Company Act file number: 811-04323
Natixis Funds Trust I
(Exact name of Registrant as specified in charter)
399 Boylston Street, Boston, Massachusetts 02116
(Address of principal executive offices) (Zip code)
Coleen Downs Dinneen, Esq.
Natixis Distributors, L.P.
399 Boylston Street
Boston, Massachusetts 02116
(Name and address of agent for service)
Registrant’s telephone number, including area code: (617) 449-2810
Date of fiscal year end: September 30
Date of reporting period: September 30, 2009
Table of Contents
| Item 1. | Reports to Stockholders. |
The Registrant’s annual report transmitted to shareholders pursuant to Rule 30e-1 under the Investment Company Act of 1940 is as follows:
Table of Contents

INCOME FUNDS
ANNUAL REPORT
September 30, 2009
Loomis Sayles Core Plus Bond Fund
Loomis Sayles High Income Fund
Loomis Sayles International Bond Fund
Loomis Sayles Limited Term Government and Agency Fund
Loomis Sayles Strategic Income Fund


Management Discussion and Performancepage 1
Portfolio of Investmentspage 18
Table of Contents
LOOMIS SAYLES CORE PLUS BOND FUND
PORTFOLIO PROFILE
Objective:
Seeks a high level of current income consistent with what the fund considers reasonable risk
Strategy:
Invests primarily in U.S. corporate and U.S. government bonds
Fund Inception:
November 7, 1973
Managers:
Peter W. Palfrey, CFA
Richard G. Raczkowski
Loomis, Sayles & Company, L.P.
Symbols:
| Class A | NEFRX | |
| Class B | NERBX | |
| Class C | NECRX | |
| Class Y | NERYX |
What You Should Know:
Fixed-income securities are subject to credit risk and interest rate risk; their value generally rises when prevailing interest rates fall and falls when rates rise.
The fund can invest a significant percentage of assets in debt securities that are rated below investment grade and the value of fund shares can be adversely affected by changes in economic conditions or other circumstances. Lower rated debt securities have speculative characteristics and may be subject to greater price volatility than higher rated investments. In addition, the secondary market for these securities may lack liquidity. The fund can also invest a significant percentage of assets in foreign securities and the value of the fund shares can be adversely affected by changes in currency exchange rates, political, and economic developments. In emerging markets, these risks can be significant. Fund shares should be viewed as a long-term investment.
In the extremely difficult market environment that characterized the end of 2008 and early 2009, widespread concern about the world’s financial markets triggered a massive flight to safety. This hurt risk markets and drove yields on U.S. Treasury securities to record lows. As the risk markets neared a bottom, Loomis Sayles Core Plus Bond Fund moved aggressively back into credit and securitized markets as well as into Treasury Inflation Protected Securities (TIPS) at attractive valuations. These moves worked well for the fund.
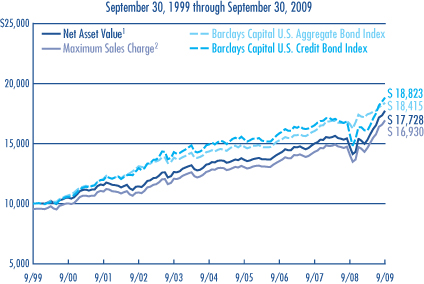
For the fiscal year ended September 30, 2009, the total return on Class A shares of the fund was 20.07% based on the net asset value and $0.66 in reinvested dividends. By comparison, the fund’s benchmark, Barclays Capital U.S. Aggregate Bond Index, returned 10.56% for the fiscal period, while Morningstar’s Intermediate-Term Bond peer group returned 11.81%.
WHICH OF THE TACTICS YOU USED WAS MOST HELPFUL TO THE FUND?
Our move from a very defensive positioning in the fall of 2008 to a much more aggressive positioning late in 2008 and in 2009 as risk markets recovered was key to protecting capital through the worst of the financial crisis and participating in the upturn. Our increased allocation to higher-yielding securities was also strongly positive. Corporate bonds performed well, particularly industrials, which were the largest contributor. Strong security selection and our overweight positions in investment-grade financial and utility companies were also positive.
The recovery in the high-yield market began late in December of 2008 and continued through September of 2009. We doubled the fund’s exposure to high-yield securities during the year and began harvesting gains in earnest in the second quarter of 2009 as evidence mounted that economic conditions were stabilizing. An increasing number of companies issued new debt and some of our holdings in previously distressed companies — including Ford and GMAC — came back into favor.
DID THE DECLINE IN THE U.S. DOLLAR IMPACT THE FUND?
The fund’s significant allocation to the Japanese yen was an effective defensive measure during the closing quarter of 2008, and we sold most of the fund’s yen-denominated holdings late in 2008 at substantial gains. We opportunistically added positions in Australian and Canadian dollars to capture the anticipated rebound in commodity currencies as risk markets began to stabilize. During the summer of 2009, we shifted the fund’s remaining non-U.S.-dollar position back into Treasuries due to concerns mounting that the depreciating U.S. dollar might be overdue for a correction.
WHAT ABOUT OTHER POSITIONS? HOW DID THEY IMPACT PERFORMANCE?
Commercial mortgage-backed securities (CMBS) detracted from performance in the final quarter of 2008 and early in 2009, but this sector was very positive throughout the remainder of the fiscal year. This reflected improving investor confidence in higher-rated CMBS and support from government stimulus programs. Following a significant rally, we trimmed holdings in CMBS at a profit in the third quarter or 2009.
WHAT’S YOUR OUTLOOK?
The significant rebound from such distressed price levels and the sharp contraction in yield spreads has helped normalize most markets, but we believe there is still good value to be found should the U.S. and global economies continue to recover as expected. Going forward, the timing of the government’s exit strategy from its current levels of monetary and fiscal support, as well as investor risk preferences, will likely drive the markets over the next 12 months. Portfolio yield in the shorter maturity sectors should become increasingly important as Treasury yields start to normalize and inflation fears become more prevalent. We plan to maintain a high degree of liquidity in the fund in anticipation of what we expect to be a bumpy recovery and to take advantage of volatility we see ahead for the markets in the coming year.
1
Table of Contents
LOOMIS SAYLES CORE PLUS BOND FUND
Investment Results through September 30, 2009
PERFORMANCE IN PERSPECTIVE
The charts comparing the fund’s performance to two indexes provide you with a general sense of how it performed. The fund’s total return for the period shown below appears with and without sales charges and includes fund expenses and fees. An index measures the performance of a theoretical portfolio. Unlike a fund, the index is unmanaged and does not have expenses that affect the results. It is not possible to invest directly in an index. Investors would incur transaction costs and other expenses if they purchased the securities necessary to match the index.
Growth of a $10,000 Investment in Class A Shares4
Average Annual Total Returns — September 30, 20094
| 1 YEAR | 5 YEARS | 10 YEARS | |||||||
| CLASS A (Inception 11/7/73) |
|||||||||
| Net Asset Value1 |
20.07 | % | 5.88 | % | 5.89 | % | |||
| With Maximum Sales Charge2 |
14.63 | 4.91 | 5.41 | ||||||
| CLASS B (Inception 9/13/93) |
|||||||||
| Net Asset Value1 |
19.19 | 5.10 | 5.12 | ||||||
| With CDSC3 |
14.19 | 4.77 | 5.12 | ||||||
| CLASS C (Inception 12/30/94) |
|||||||||
| Net Asset Value1 |
19.20 | 5.08 | 5.11 | ||||||
| With CDSC3 |
18.20 | 5.08 | 5.11 | ||||||
| CLASS Y (Inception 12/30/94) |
|||||||||
| Net Asset Value1 |
20.37 | 6.16 | 6.26 | ||||||
| COMPARATIVE PERFORMANCE | 1 YEAR | 5 YEARS | 10 YEARS | ||||||
| Barclays Capital U.S. Aggregate Bond Index |
10.56 | % | 5.13 | % | 6.30 | % | |||
| Barclays Capital U.S. Credit Bond Index |
19.49 | 4.72 | 6.53 | ||||||
| Morningstar Int.-Term Bond Fund Avg. |
11.81 | 3.82 | 5.38 | ||||||
See page 11 for a description of the indices.
All returns represent past performance and do not guarantee future results. Periods of less than one year are not annualized. Share price and return will vary and you may have a gain or loss when you sell your shares. All results include reinvestment of any dividends and capital gains. Current returns may be higher or lower than those shown. For performance current to the most recent month-end, visit www.funds.natixis.com. Class Y shares are available to certain investors, as described in the prospectus.
The table and graph do not reflect taxes shareholders might owe on any fund distributions or when they redeem their shares.
PORTFOLIO FACTS
| % of Net Assets as of | ||||
| CREDIT QUALITY | 9/30/09 | 9/30/08 | ||
| Aaa |
51.5 | 59.1 | ||
| Aa |
4.7 | 5.6 | ||
| A |
9.0 | 4.8 | ||
| Baa |
19.6 | 14.6 | ||
| Ba |
5.9 | 4.8 | ||
| B |
3.3 | 5.7 | ||
| Caa |
1.3 | 0.5 | ||
| Ca |
1.0 | 0.3 | ||
| Not Rated* |
1.9 | 3.8 | ||
| Short-term and other |
1.8 | 0.8 | ||
Credit quality is based on ratings from Moody’s Investors Service.
* Securities that are not rated by Moody’s may be rated by another rating agency or by Loomis Sayles.
| % of Net Assets as of | ||||||
| EFFECTIVE DURATION | 9/30/09 | 9/30/08 | ||||
| 1 year or less |
6.7 | 8.8 | ||||
| 1-5 years |
36.6 | 39.7 | ||||
| 5-10 years |
43.9 | 40.0 | ||||
| 10+ years |
12.8 | 11.5 | ||||
| Average Effective Duration |
5.9 | years | 5.7 | years | ||
Portfolio characteristics will vary.
EXPENSE RATIOS AS STATED IN THE MOST RECENT PROSPECTUS
| Share Class | Gross Expense Ratio5 | Net Expense Ratio6 | ||||
| A |
1.04 | % | 0.90 | % | ||
| B |
1.80 | 1.65 | ||||
| C |
1.79 | 1.65 | ||||
| Y |
0.75 | 0.65 |
NOTES TO CHARTS
| 1 | Does not include a sales charge. |
| 2 | Includes maximum sales charge of 4.50%. |
| 3 | Performance for Class B shares assumes a maximum 5% contingent deferred sales charge (“CDSC”) applied when you sell shares, which declines annually between years 1-6 according to the following schedule: 5, 4, 3, 3, 2, 1, 0%. Class C shares performance assumes a 1% CDSC applied when you sell shares within one year of purchase. |
| 4 | Fund performance has been increased by expense reductions and reimbursements, if any, without which performance would have been lower. |
| 5 | Before reductions and reimbursements. |
| 6 | After reductions and reimbursements. Expense reductions are contractual and are set to expire on 1/31/10. |
2
Table of Contents
LOOMIS SAYLES HIGH INCOME FUND
PORTFOLIO PROFILE
Objective:
Seeks high current income plus the opportunity for capital appreciation to produce a high total return
Strategy:
Invests primarily in lower-quality fixed-income securities
Fund Inception:
February 22, 1984
Managers:
Matthew J. Eagan, CFA
Kathleen C. Gaffney, CFA
Elaine M. Stokes
Loomis, Sayles & Company, L.P.
Symbols:
| Class A | NEFHX | |
| Class B | NEHBX | |
| Class C | NEHCX | |
| Class Y | NEHYX |
What You Should Know:
Fixed-income securities are subject to credit risk and interest rate risk; their value generally rises when prevailing interest rates fall and falls when rates rise.
The fund can invest a significant percentage of assets in debt securities that are rated below investment grade and the value of fund shares can be adversely affected by changes in economic conditions or other circumstances. Lower rated debt securities have speculative characteristics and may be subject to greater price volatility than higher rated investments. In addition, the secondary market for these securities may lack liquidity. The fund can also invest a significant percentage of assets in foreign securities and the value of the fund shares can be adversely affected by changes in currency exchange rates, political, and economic developments. In emerging markets, these risks can be significant. Fund shares should be viewed as a long-term investment.
Management Discussion
As the credit crisis eased last spring, investors turned away from low-yielding, government-backed issues in search of better returns in other sectors. High-yield bonds in particular benefited from this renewed risk appetite. Increased demand and stronger market liquidity pushed prices of lower-rated issues sharply higher and their yields plunged. By the end of the period, spreads – the yield advantage high-yield issues have over Treasury issues of similar maturity – had narrowed dramatically from the exceptionally wide levels that had prevailed at the height of the financial crisis.
For the fiscal year ended September 30, 2009, Class A shares of Loomis Sayles High Income Fund provided a total return at net asset value of 15.97%, including $0.33 in dividends reinvested during the period. The fund underperformed its benchmark, Barclays Capital U.S. Corporate High-Yield Bond Index, which returned 22.34% for the period. However, its performance was above the 13.16% average of the funds in Morningstar’s High Yield Bond category.
WHAT WERE THE BEST PERFORMING MARKET AREAS?
As capital returned to the credit markets in the latter part of fiscal 2009, lower-rated industrial bonds made the strongest contribution to results. The ability of lower-rated companies to refinance pending maturities brought default assumptions down significantly and enticed investors to reach for higher returns in the lower-rated portions of the market.
Improving conditions in the world financial system also spurred merger talks, notably in the consolidating pharmaceutical industry. This trend, combined with the broader debate over universal healthcare, spurred demand in the healthcare sector. As a result, consumer non-cyclicals led sector performance for the period. In terms of quality, the fund’s strongest returns came from securities rated B by Moody’s Investors Service.
WHAT CAUSED THE FUND TO LAG ITS BENCHMARK DURING THE YEAR?
In general, the fund underperformed its benchmark because its portfolio included more higher-quality issues during a period when the lower-quality sector provided the best results. Specifically, the fund was underweight in high-yield financials, where government guarantees of certain issues increased investor confidence. Subsequent infusions of capital as part of the government’s stimulus programs also enhanced performance in this area, but the fund’s participation was limited. The fund’s underweight in bonds rated CCC by Moody’s also hindered performance, as this sector recorded some of the period’s better gains. Moreover, our commitment to bank loans and Treasury securities – which are not part of the benchmark – also handicapped results, as higher-rated holdings lost favor in the second half of the year.
WHAT’S YOUR OUTLOOK?
Looking ahead, we continue to believe there is select value in corporate bonds. Despite their recent tightening, spreads remain wide relative to long-term averages. A vast majority of the spread tightening that has taken place this year is due to the re-emergence of liquidity in the markets. Over the long term, further spread tightening from these levels will most likely be generated by an improvement in global and U.S. economic fundamentals. Our view is that maintaining specific risk in the portfolio will present the best opportunity for long-term performance.
Global risk appetite has weakened the U.S. dollar, and we expect this may continue. Currencies from developed and emerging markets may offer more long-term upside potential, particularly the European peripheral currencies and Asian currencies tied to China and its global-growth story.
3
Table of Contents
LOOMIS SAYLES HIGH INCOME FUND
Investment Results through September 30, 2009
PERFORMANCE IN PERSPECTIVE
The charts comparing the fund’s performance to an index provide you with a general sense of how it performed. The fund’s total return for the period shown below appears with and without sales charges and includes fund expenses and fees. An index measures the performance of a theoretical portfolio. Unlike a fund, the index is unmanaged and does not have expenses that affect the results. It is not possible to invest directly in an index. Investors would incur transaction costs and other expenses if they purchased the securities necessary to match the index.
Growth of a $10,000 Investment in Class A Shares4

Average Annual Total Returns — September 30, 20094
| 1 YEAR | 5 YEARS | 10 YEARS | SINCE INCEPTION |
|||||||||
| CLASS A (Inception 2/22/84) |
||||||||||||
| Net Asset Value1 |
15.97 | % | 6.14 | % | 2.31 | % | — | |||||
| With Maximum Sales Charge2 |
10.75 | 5.15 | 1.84 | — | ||||||||
| CLASS B (Inception 9/20/93) |
||||||||||||
| Net Asset Value1 |
15.06 | 5.32 | 1.55 | — | ||||||||
| With CDSC3 |
10.06 | 5.02 | 1.55 | — | ||||||||
| CLASS C (Inception 3/2/98) |
||||||||||||
| Net Asset Value1 |
15.37 | 5.34 | 1.56 | — | ||||||||
| With CDSC3 |
14.37 | 5.34 | 1.56 | — | ||||||||
| CLASS Y (Inception 2/29/08) |
||||||||||||
| Net Asset Value1 |
16.29 | — | — | 3.56 | % | |||||||
| COMPARATIVE PERFORMANCE | 1 YEAR | 5 YEARS | 10 YEARS | SINCE CLASS Y INCEPTION7 |
||||||||
| Barclays Capital U.S. Corporate High-Yield Bond Index |
22.34 | % | 6.13 | % | 6.25 | % | 8.05 | % | ||||
| Morningstar High Yield Bond Fund Avg. |
13.16 | 4.11 | 4.47 | 3.47 | ||||||||
See page 11 for a description of the indices.
All returns represent past performance and do not guarantee future results. Periods of less than one year are not annualized. Share price and return will vary and you may have a gain or loss when you sell your shares. All results include reinvestment of dividends and capital gains. Current returns may be higher or lower than those shown. For performance current to the most recent month-end, visit www.funds.natixis.com. Performance history includes periods from a predecessor fund. Class Y shares are available to certain investors, as described in the prospectus.
The table and graph do not reflect taxes shareholders might owe on any fund distributions or when they redeem their shares.
PORTFOLIO FACTS
| % of Net Assets as of | ||||
| CREDIT QUALITY | 9/30/09 | 9/30/08 | ||
| Aaa |
10.0 | 17.3 | ||
| Aa |
0.5 | 2.0 | ||
| A |
0.2 | 1.0 | ||
| Baa |
5.3 | 7.6 | ||
| Ba |
28.5 | 14.9 | ||
| B |
28.2 | 28.9 | ||
| Caa |
12.9 | 16.4 | ||
| Ca |
1.9 | 0.5 | ||
| C |
— | 0.0 | ||
| Not Rated* |
5.6 | 10.1 | ||
| Short-term and other |
6.9 | 1.3 | ||
Credit quality is based on ratings from Moody’s Investors Service.
* Securities that are not rated by Moody’s may be rated by another rating agency or by Loomis Sayles.
| % of Net Assets as of | ||||||
| EFFECTIVE MATURITY | 9/30/09 | 9/30/08 | ||||
| 1 year or less |
6.8 | 16.0 | ||||
| 1-5 years |
32.1 | 25.7 | ||||
| 5-10 years |
34.2 | 28.5 | ||||
| 10+ years |
26.9 | 29.8 | ||||
| Average Effective Maturity |
8.6 | years | 8.8 | years | ||
Portfolio characteristics will vary.
EXPENSE RATIOS AS STATED IN THE MOST RECENT PROSPECTUS
| Share Class | Gross Expense Ratio5 | Net Expense Ratio6 | ||||
| A |
1.40 | % | 1.15 | % | ||
| B |
2.15 | 1.90 | ||||
| C |
2.15 | 1.90 | ||||
| Y |
1.15 | 0.90 |
NOTES TO CHARTS
| 1 | Does not include a sales charge. |
| 2 | Includes maximum sales charge of 4.50%. |
| 3 | Performance for Class B shares assumes a maximum 5% contingent deferred sales charge (“CDSC”) applied when you sell shares, which declines annually between years 1-6 according to the following schedule: 5, 4, 3, 3, 2, 1, 0%. Class C shares performance assumes a 1% CDSC applied when you sell shares within one year of purchase. |
| 4 | Fund performance has been increased by expense reductions and reimbursements, if any, without which performance would have been lower. |
| 5 | Before reductions and reimbursements. |
| 6 | After reductions and reimbursements. Expense reductions are contractual and are set to expire on 1/31/10. |
| 7 | The since-inception comparative performance figures shown for Class Y shares are calculated from 3/1/08. |
4
Table of Contents
LOOMIS SAYLES INTERNATIONAL BOND FUND
PORTFOLIO PROFILE
Objective:
Seeks high total return through a combination of high current income and capital appreciation
Strategy:
Invests primarily in fixed-income securities located outside the U.S.
Fund Inception:
February 1, 2008
Managers:
Lynda L. Schweitzer, CFA
Kenneth M. Buntrock, CFA, CIC
David W. Rolley, CFA
Loomis, Sayles & Company, L.P.
Symbols:
| Class A | LSIAX | |
| Class C | LSICX | |
| Class Y | LSIYX |
What You Should Know:
Fixed-income securities are subject to credit risk and interest rate risk; their value generally rises when prevailing interest rates fall and falls when rates rise. The fund may also invest in public or private debt obligations issued or guaranteed by U.S. or non-U.S. issuers. The fund can invest a significant percentage of assets in foreign securities and the value of the fund shares can be adversely affected by changes in currency exchange rates, political, and economic developments. In emerging markets these risks can be significant. The fund can invest a significant percentage of assets in debt securities that are rated below investment grade. Lower-rated debt securities have speculative characteristics and may be subject to greater price volatility than higher-rated investments. In addition, the secondary market for these securities may lack liquidity. Fund shares should be viewed as a long-term investment.
Management Discussion
Trends in global fixed-income markets reversed course in the spring of 2009, as rising optimism about an economic recovery replaced fears of a protracted worldwide recession. The changing market sentiment helped investment-grade corporate bonds, high-yield debt and emerging market securities stage strong comebacks over the second half of the 12-month period ended September 30, 2009. The robust rally offset many of the losses incurred during the previous six months.
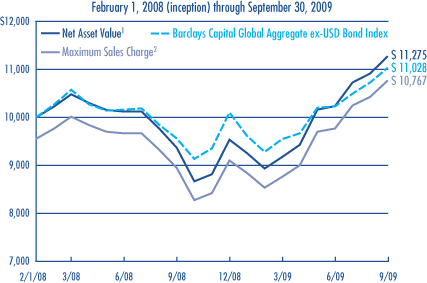
The fund’s positioning for a global economic recovery helped drive Loomis Sayles International Bond Fund’s strong relative performance for the fiscal year ended September 30, 2009. Based on the net asset value of Class A Shares, the fund produced a total return of 20.41%, including $0.20 in dividends reinvested during the period. The fund outpaced the 15.41% return on its benchmark, Barclays Capital Global Aggregate ex-USD Bond Index and the 14.82% average return of the funds in Morningstar’s World Bond category.
WHAT FACTORS CONTRIBUTED TO THE FUND’S STRONG PERFORMANCE?
The fund’s emphasis on the U.S., U.K. and European corporate bond markets, as well as strong security selection, was primarily responsible for its outperformance. Our focus on corporate bonds had held back results during the first half of the fiscal year, but the fund was positioned well when credit markets began a recovery about halfway through the period. As investors became less risk-averse and more interested in the yield advantage that corporate bonds have over government debt, money poured into the higher-yield sectors of the fixed-income markets.
In addition to investment-grade corporate debt, holdings in high-yield corporate bonds and emerging-market securities helped propel the fund’s solid return. The fund’s overall currency strategy also helped, as our overweight position in the Norwegian krone and tactical positioning in the South Korean won also contributed to strongly positive returns.
WHICH STRATEGIES DETRACTED FROM THE FUND’S RESULTS?
While our exposure to U.S. corporate securities supported performance, the financial institutions represented in the portfolio generally detracted in the closing quarter of 2008 and early 2009 as a result of the rapid deterioration in the international financial markets.
Despite the overall success of our Scandinavian currency strategy, the fund’s performance was negatively impacted by its underweight relative to its benchmark in the Icelandic krona. The fund was also underweight in the Japanese yen, which was a drag on performance when the yen strengthened against the U.S. dollar during the latter part of the year.
WHAT’S YOUR OUTLOOK?
Despite strong performance this past quarter, we still see attractive opportunities in corporate bonds, the high-yield sectors of the securitized market and selected currencies. Yield spreads – the difference in yield between corporate bonds and Treasury securities – are still wide relative to their long-term averages and may tighten further as the economy recovers.
Market trends and conditions vary from country to country, but we believe the overall global economy is moving toward a gradual recovery. In the United States, however, we think the recovery is likely to be weak, hampered by high unemployment and sluggish consumer and investment spending. Accordingly, we limited the fund’s exposure to U.S. high-yield corporate debt. We also added to the fund’s holdings in non-U.S. dollar currencies. We also plan to reduce the duration of our U.S. dollar-based investments in anticipation of higher yields in 2010.
5
Table of Contents
LOOMIS SAYLES INTERNATIONAL BOND FUND
Investment Results through September 30, 2009
PERFORMANCE IN PERSPECTIVE
The charts comparing the fund’s performance to an index provide you with general sense of how it performed. The fund’s total return for the period shown below appears with and without sales charges and includes fund expenses and fees. An index measures the performance of a theoretical portfolio. Unlike a fund, an index is unmanaged and does not have expenses that affect the results. It is not possible to invest directly in an index. Investors would incur transaction costs and other expenses if they purchased the securities necessary to match the index.
Growth of $10,000 Investment in Class A Shares4
Average Annual Total Returns — September 30, 20094
| 1 YEAR | SINCE INCEPTION |
|||||
| CLASS A (Inception 2/1/08) |
||||||
| Net Asset Value1 |
20.41 | % | 7.48 | % | ||
| With Maximum Sales Charge2 |
15.03 | 4.55 | ||||
| CLASS C (Inception 2/1/08) |
||||||
| Net Asset Value1 |
19.58 | 6.63 | ||||
| With CDSC3 |
18.58 | 6.63 | ||||
| CLASS Y (Inception 2/1/08) |
||||||
| Net Asset Value1 |
20.73 | 7.63 | ||||
| COMPARATIVE PERFORMANCE | 1 YEAR | SINCE INCEPTION |
||||
| Barclays Capital Global Aggregate ex-USD Bond Index |
15.41 | % | 6.05 | % | ||
| Morningstar World Bond Fund Avg. |
14.82 | 4.92 | ||||
See page 11 for a description of the indices.
All returns represent past performance and do not guarantee future results. Periods of less than one year are not annualized. Share price and return will vary and you may have a gain or loss when you sell your shares. All results include reinvestment of dividends and capital gains. Current returns may be higher or lower than those shown. For performance current to the most recent month-end, visit www.funds.natixis.com. Class Y shares are available to certain investors, as described in the prospectus.
The table does not reflect taxes shareholders might owe on any fund distributions or when they redeem their shares.
PORTFOLIO FACTS
| % of Net Assets as of | ||||
| CREDIT QUALITY | 9/30/09 | 9/30/08 | ||
| Aaa |
52.5 | 54.2 | ||
| Aa |
19.1 | 18.7 | ||
| A |
7.0 | 8.3 | ||
| Baa |
10.7 | 10.5 | ||
| Ba |
2.7 | 3.1 | ||
| B |
1.2 | 0.5 | ||
| Caa |
0.4 | 0.7 | ||
| Not Rated* |
3.3 | 2.3 | ||
| Short-term and other |
3.1 | 1.7 | ||
Credit quality is based on ratings from Moody’s Investors Service.
* Securities that are not rated by Moody’s may be rated by another rating agency or by Loomis Sayles.
| % of Net Assets as of | ||||||
| EFFECTIVE MATURITY | 9/30/09 |
9/30/08 |
||||
| 1 year or less |
17.3 | 12.5 | ||||
| 1-5 years |
35.9 | 18.4 | ||||
| 5-10 years |
29.2 | 55.2 | ||||
| 10+ years |
17.6 | 13.9 | ||||
| Average Effective Maturity |
6.7 | years | 8.1 | years | ||
Portfolio characteristics will vary.
EXPENSE RATIOS AS STATED IN THE MOST RECENT PROSPECTUS
| Share Class | Gross Expense Ratio5 | Net Expense Ratio6 | ||||
| A |
2.20 | % | 1.10 | % | ||
| C |
2.93 | 1.85 | ||||
| Y |
1.83 | 0.85 |
NOTES TO CHARTS
| 1 | Does not include a sales charge. |
| 2 | Includes maximum sales charge of 4.50%. |
| 3 | Class C shares performance assumes a 1% CDSC applied when you sell shares within one year of purchase. |
| 4 | Fund performance has been increased by expense reductions and reimbursements, if any, without which performance would have been lower. |
| 5 | Before reductions and reimbursements. |
| 6 | After reductions and reimbursements. Expense reductions are contractual and are set to expire on 1/31/10. |
6
Table of Contents
LOOMIS SAYLES LIMITED TERM GOVERNMENT AND AGENCY FUND
PORTFOLIO PROFILE
Objective:
Seeks a high current return consistent with preservation of capital
Strategy:
Invests primarily in securities issued or guaranteed by the U.S. government, its agencies or instrumentalities
Fund Inception:
January 3, 1989
Managers:
John Hyll
Clifton V. Rowe, CFA
Loomis, Sayles & Company, L.P.
Symbols:
| Class A | NEFLX | |
| Class B | NELBX | |
| Class C | NECLX | |
| Class Y | NELYX |
What You Should Know:
Fixed-income securities are subject to credit risk and interest rate risk; their value generally rises when prevailing interest rates fall and falls when rates rise. Securities issued by the U.S. government are guaranteed by the U.S. government if held to maturity; mutual funds that invest in these securities are not guaranteed. Securities issued by U.S. government agencies may not be government guaranteed.
Management Discussion
After a difficult start to the fiscal year last fall, Loomis Sayles Limited Term Government and Agency Fund experienced strong performance during the balance of the year, outperforming both its benchmark and the average return of its Morningstar peer group. The massive flight to quality, which was triggered by the financial meltdown during the closing quarter of 2008, gave way to an increasing willingness on the part of investors to accept greater risk. Price recovery in the fund’s position in mortgage-related securities was primarily responsible for the fund’s outperformance.
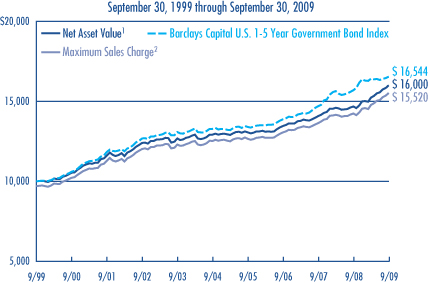
For the fiscal year ended September 30, 2009, the fund’s total return based on the net asset value of Class A shares was 9.05% including $0.36 in reinvested dividends. For the same period, Barclays Capital U.S. 1-5 Year Government Bond Index returned 5.43%, while Morningstar’s Short Government category returned 5.48%.
WHICH SECTORS HAD THE MOST POSITIVE IMPACT ON FUND PERFORMANCE?
Although mortgage-related and asset-backed securities offer a yield advantage over U.S. Treasury securities, they had become significantly undervalued in the latter part of 2008, as concerns surrounding the real estate and mortgage markets mounted. However, beginning in the second quarter of 2009 and continuing into the third quarter, confidence began to return to the markets and investors recognized the compelling values offered by higher-quality mortgage securities. As a result, investors’ appetite for risk led to a shift away from safety and toward securities with a combination of better income and capital appreciation potential.
Treasury inflation protected securities (TIPS) also performed well, reflecting the modest improvement in the economic outlook during the second and third quarter of 2009. Concerns about deflation eased, resulting in strengthened TIPS valuations.
WHICH SECTORS HAD A NEGATIVE IMPACT DURING THE YEAR?
The same sectors that had provided the most support for the fund in the turbulent period at the end of 2008 and early 2009 were relative underperformers during the market recovery in the second and third quarters of 2009. Investors turned their attention from Treasuries and securities issued by government sponsored entities (GSEs) toward higher-yielding, lower-quality sectors. Performance in the top-quality arena fell behind. As interest rates declined, securities with shorter maturities also lagged relative to longer-term securities with higher yields, so the fund’s relatively short maturity detracted from overall performance.
WHICH OF THE TACTICS YOU USED WAS MOST HELPFUL DURING THE PERIOD?
This fund’s mandate is to seek a high current return consistent with preservation of capital, primarily by investing in short-term government securities. However, within that framework, we strive to provide shareholders with attractive returns with as little risk as possible in any given market environment. Early in the fund’s fiscal year, we increased its holdings in TIPS because they appeared to be attractively valued. This move gave the fund yields similar to non-inflation-protected securities at a lower cost. As the year progressed, we turned our attention to securities offering even higher income potential, primarily in the mortgage-related market.
WHAT IS YOUR OUTLOOK?
For the intermediate term, we look for a gradual rise in interest rates and we believe our mortgage positions will benefit from the relatively stable interest-rate environment we see ahead. We believe the Federal Reserve Board will hold off on raising interest rates longer than the majority of investors expect, and we do not anticipate any significant shifts in the yield curve.
Despite the market’s positive performance in the latter part of 2009, we still see attractive opportunities for conservative bond investors, but we think the “rising tide lifts all boats” phenomenon may be nearing an end. Good results are likely to become harder to find.
7
Table of Contents
LOOMIS SAYLES LIMITED TERM GOVERNMENT AND AGENCY FUND
Investment Results through September 30, 2009
PERFORMANCE IN PERSPECTIVE
The charts comparing the fund’s performance to an index provide you with a general sense of how it performed. The fund’s total return for the period shown below appears with and without sales charges and includes fund expenses and fees. An index measures the performance of a theoretical portfolio. Unlike a fund, the index is unmanaged and does not have expenses that affect the results. It is not possible to invest directly in an index. Investors would incur transaction costs and other expenses if they purchased the securities necessary to match the index.
Growth of a $10,000 Investment in Class A Shares4
Average Annual Total Returns — September 30, 20094
| 1 YEAR | 5 YEARS | 10 YEARS | |||||||
| CLASS A (Inception 1/3/89) |
|||||||||
| Net Asset Value1 |
9.05 | % | 4.38 | % | 4.81 | % | |||
| With Maximum Sales Charge2 |
5.77 | 3.74 | 4.49 | ||||||
| CLASS B (Inception 9/27/93) |
|||||||||
| Net Asset Value1 |
8.24 | 3.59 | 4.08 | ||||||
| With CDSC3 |
3.24 | 3.24 | 4.08 | ||||||
| CLASS C (Inception 12/30/94) |
|||||||||
| Net Asset Value1 |
8.24 | 3.60 | 4.08 | ||||||
| With CDSC3 |
7.24 | 3.60 | 4.08 | ||||||
| CLASS Y (Inception 3/31/94) |
|||||||||
| Net Asset Value1 |
9.40 | 4.65 | 5.15 | ||||||
| COMPARATIVE PERFORMANCE | 1 YEAR | 5 YEARS | 10 YEARS | ||||||
| Barclays Capital U.S. 1-5 Year Government Bond Index |
5.43 | % | 4.51 | % | 5.16 | % | |||
| Morningstar Short Gov’t Fund Avg. |
5.48 | 3.79 | 4.38 | ||||||
See page 11 for a description of the indices.
All returns represent past performance and do not guarantee future results. Periods of less than one year are not annualized. Share price and return will vary and you may have a gain or loss when you sell your shares. All results include reinvestment of dividends and capital gains. Current returns may be higher or lower than those shown. For performance current to the most recent month-end, visit www.funds.natixis.com. Performance history includes periods from a predecessor fund. Class Y shares are available to certain investors, as described in the prospectus.
The table and graph do not reflect taxes shareholders might owe on any fund distributions or when they redeem their shares.
PORTFOLIO FACTS
| % of Net Assets as of | ||||
| FUND COMPOSITION* | 9/30/09 | 9/30/08 | ||
| Mortgage Related |
42.4 | 70.6 | ||
| Treasuries |
14.6 | 4.6 | ||
| Commercial Mortgage-Backed Securities |
10.9 | — | ||
| Government Owned - No Guarantee |
10.0 | — | ||
| Government Sponsored |
8.3 | — | ||
| Government Guaranteed |
3.5 | — | ||
| ABS Credit Card |
3.4 | 2.7 | ||
| ABS Car Loan |
2.1 | — | ||
| Automotive |
— | 1.8 | ||
| Hybrid ARMs |
2.0 | 1.6 | ||
| ABS Home Equity |
1.2 | — | ||
| Collateralized Mortgage Obligations |
0.4 | 0.1 | ||
| ABS Other |
0.3 | — | ||
| Asset-Backed Securities |
— | 3.5 | ||
| Mortgage Backed Securities |
— | 2.0 | ||
| Short-Term Investments & Other |
0.9 | 13.1 | ||
| * Security classification changes made by Barclays Capital during the year ended 9/30/09 are not reflected in Fund Composition as of 9/30/08. |
| % of Net Assets as of | ||||||
| EFFECTIVE MATURITY | 9/30/09 |
9/30/08 |
||||
| 1 year or less |
1.9 | 19.0 | ||||
| 1-5 years |
83.5 | 74.5 | ||||
| 5-10 years |
14.6 | 6.5 | ||||
| 10+ years |
n/a | n/a | ||||
| Average Effective Maturity |
3.5 | years | 3.0 | years | ||
Portfolio characteristics will vary.
EXPENSE RATIOS AS STATED IN THE MOST RECENT PROSPECTUS
| Share Class | Gross Expense Ratio5 | Net Expense Ratio6 | ||||
| A |
1.07 | % | 0.90 | % | ||
| B |
1.82 | 1.65 | ||||
| C |
1.83 | 1.65 | ||||
| Y |
0.72 | 0.65 |
NOTES TO CHARTS
| 1 | Does not include a sales charge. |
| 2 | Includes maximum sales charge of 3.00%. |
| 3 | Performance for Class B shares assumes a maximum 5% contingent deferred sales charge (“CDSC”) applied when you sell shares, which declines annually between years 1-6 according to the following schedule: 5, 4, 3, 3, 2, 1, 0%. Class C shares performance assumes a 1% CDSC applied when you sell shares within one year of purchase. |
| 4 | Fund performance has been increased by expense reductions and reimbursements, if any, without which performance would have been lower. |
| 5 | Before reductions and reimbursements. |
| 6 | After reductions and reimbursements. Expense reductions are contractual and are set to expire on 1/31/10. |
8
Table of Contents
LOOMIS SAYLES STRATEGIC INCOME FUND
PORTFOLIO PROFILE
Objective:
Seeks high current income, with a secondary objective of capital growth
Strategy:
Invests primarily in income-producing securities in the U.S. and around the world
Fund Inception:
May 1, 1995
Managers:
Daniel J. Fuss, CFA, CIC
Kathleen C. Gaffney, CFA
Associate Managers:
Matthew J. Eagan, CFA
Elaine M. Stokes
Loomis, Sayles & Company, L.P.
Symbols:
| Class A | NEFZX | |
| Class B | NEZBX | |
| Class C | NECZX | |
| Class Y | NEZYX |
What You Should Know:
Fixed-income securities are subject to credit risk and interest rate risk; their value generally rises when prevailing interest rates fall and falls when rates rise.
The fund can invest a significant percentage of assets in debt securities that are rated below investment grade and the value of fund shares can be adversely affected by changes in economic conditions or other circumstances. Lower rated debt securities have speculative characteristics and may be subject to greater price volatility than higher rated investments. In addition, the secondary market for these securities may lack liquidity. The fund can also invest a significant percentage of assets in foreign securities and the value of the fund shares can be adversely affected by changes in currency exchange rates, political, and economic developments. In emerging markets, these risks can be significant. Fund shares should be viewed as a long-term investment.
Management Discussion
Beginning in March of 2009, signs that the recession was easing and the global economy was righting itself drew investors away from top-quality issues to seek higher returns. As a result of rigorous rallies following last winter’s severely depressed market, bond prices rose in a variety of corporate sectors and ratings categories. Resulting higher prices narrowed the extraordinarily wide spreads, or yield advantage, that had prevailed between Treasury and corporate issues during the economic crisis.
For the fiscal year ended September 30, 2009, Class A shares of Loomis Sayles Strategic Income Fund provided a total return at net asset value of 20.56%, including $0.86 in dividends and $0.08 in capital gains reinvested during the year. The fund outperformed its benchmark, Barclays Capital U.S. Aggregate Bond Index, which returned 10.56% over the period. It also outdistanced Morningstar’s Multisector Bond category, which had an average return of 13.15%.
WHAT WAS RESPONSIBLE FOR THE FUND’S STRONG PERFORMANCE?
Investment-grade corporate issues were among the best performers, with industrial bonds rated BBB by Moody’s Investor Services leading results. In addition, our emphasis on investment-grade industrials aided returns relative to the benchmark. Notable strength came from cable, wireline communications and oil field services companies. Consumer-related sectors, including healthcare and tobacco, also delivered strong performance, as did retail issues and others expected to benefit from an anticipated economic upturn. Financials were another source of positive performance, as surviving banks and other financial firms recovered from a period of exceptional stress. Real estate investment trusts and select utility companies also contributed. The high-yield sector as a whole gained the greatest impetus from investors’ renewed risk appetite, with financial securities rated CC by Moody’s Investors Service leading the way. Among high-yield industrial issues, automotive, pharmaceutical, and residential construction, as well as wireless telecommunications all boosted portfolio returns.
As currencies of commodity-rich countries rallied amid improving global growth prospects, the fund gained positive momentum from holdings denominated in the Brazilian real, the Norwegian krone, the New Zealand dollar and Indonesia’s rupiah. Although Canada’s dollar also strengthened, weak local market conditions diluted the contributions of the fund’s Canadian holdings. In contrast, strong regional markets amplified the positive impact of the fund’s euro-denominated investments.
Among convertibles, security-specific gains in the technology, wireline telecommunications and automotive industries added to results. Asset-backed obligations, especially credit-card issues, also moved higher. In addition, the fund’s relatively small positions in U.S. Treasury and government agency securities, as well as its underweight in mortgage-backed securities, proved helpful as improving risk tolerance caused investors to turn toward riskier assets in search of higher returns.
WHAT WERE THE PERIOD’S DISAPPOINTMENTS?
The fund experienced few areas of underperformance amid the widespread bullish sentiment in the past several months. High-yield electric utilities were a relative underperformer. In terms of quality categories, industrial bonds rated CCC by Moody’s detracted from the fund’s relative performance.
WHAT’S YOUR OUTLOOK?
Looking ahead, we continue to believe there is select value in corporate bonds. Despite their recent tightening, spreads remain wide relative to long-term averages. A vast majority of the spread tightening that has taken place this year is due to the re-emergence of liquidity in the markets. Over the long term, further spread tightening from these levels will most likely be generated by an improvement in global and U.S. economic fundamentals. Our view is that maintaining specific risk in the portfolio will present the best opportunity for long-term performance.
Global risk appetite has weakened the U.S. dollar, and we expect this may continue. Currencies from developed and emerging markets may offer more long-term upside potential, particularly the European peripheral currencies and Asian currencies tied to China and its global-growth story.
9
Table of Contents
LOOMIS SAYLES STRATEGIC INCOME FUND
Investment Results through September 30, 2009
PERFORMANCE IN PERSPECTIVE
The charts comparing the fund’s performance to two indexes provide you with a general sense of how it performed. The fund’s total return for the period shown below appears with and without sales charges and includes fund expenses and fees. An index measures the performance of a theoretical portfolio. Unlike a fund, the index is unmanaged and does not have expenses that affect the results. It is not possible to invest directly in an index. Investors would incur transaction costs and other expenses if they purchased the securities necessary to match the index.
Growth of a $10,000 Investment in Class A Shares4

Average Annual Total Returns — September 30, 20094
| 1 YEAR | 5 YEARS | 10 YEARS | SINCE INCEPTION |
|||||||||
| CLASS A (Inception 5/1/95) |
||||||||||||
| Net Asset Value1 |
20.56 | % | 6.35 | % | 9.03 | % | — | |||||
| With Maximum Sales Charge2 |
15.14 | 5.38 | 8.53 | — | ||||||||
| CLASS B (Inception 5/1/95) |
||||||||||||
| Net Asset Value1 |
19.62 | 5.56 | 8.21 | — | ||||||||
| With CDSC3 |
14.62 | 5.24 | 8.21 | — | ||||||||
| CLASS C (Inception 5/1/95) |
||||||||||||
| Net Asset Value1 |
19.66 | 5.55 | 8.21 | — | ||||||||
| With CDSC3 |
18.66 | 5.55 | 8.21 | — | ||||||||
| CLASS Y (Inception 12/1/99) |
||||||||||||
| Net Asset Value1 |
20.91 | 6.63 | — | 9.22 | % | |||||||
| COMPARATIVE PERFORMANCE | 1 YEAR | 5 YEARS | 10 YEARS | SINCE CLASS Y INCEPTION |
||||||||
| Barclays Capital U.S. Aggregate Bond Index |
10.56 | % | 5.13 | % | 6.30 | % | 6.37 | % | ||||
| Barclays Capital U.S. Universal Bond Index |
10.91 | 5.15 | 6.42 | 6.47 | ||||||||
| Morningstar Multisector Bond Fund Avg. |
13.15 | 4.99 | 6.21 | 6.16 | ||||||||
See page 11 for a description of the indices.
All returns represent past performance and do not guarantee future results. Periods of less than one year are not annualized. Share price and return will vary and you may have a gain or loss when you sell your shares. All results include reinvestment of dividends and capital gains. Current returns may be higher or lower than those shown. Performance history includes periods from a predecessor fund. For performance current to the most recent month-end, visit www.funds.natixis.com. Class Y shares are available to certain investors, as described in the prospectus.
The table and graph do not reflect taxes shareholders might owe on any fund distributions or when they redeem their shares.
PORTFOLIO FACTS
| % of Net Assets as of | ||||
| CREDIT QUALITY | 9/30/09 | 9/30/08 | ||
| Aaa |
15.6 | 18.3 | ||
| Aa |
6.1 | 4.1 | ||
| A |
7.4 | 8.1 | ||
| Baa |
30.8 | 32.0 | ||
| Ba |
10.5 | 10.0 | ||
| B |
6.9 | 10.3 | ||
| Caa |
8.1 | 7.4 | ||
| Ca |
3.9 | 0.8 | ||
| C |
0.0 | 0.0 | ||
| Not Rated* |
6.7 | 8.8 | ||
| Short-term and other |
4.0 | 0.2 | ||
Credit quality is based on ratings from Moody’s Investors Service.
* Securities that are not rated by Moody’s may be rated by another rating agency or by Loomis Sayles.
| % of Net Assets as of | ||||||
| EFFECTIVE MATURITY | 9/30/09 |
9/30/08 |
||||
| 1 year or less |
5.7 | 8.6 | ||||
| 1-5 years |
25.8 | 20.6 | ||||
| 5-10 years |
33.1 | 28.2 | ||||
| 10+ years |
35.4 | 42.6 | ||||
| Average Effective Maturity |
12.3 | years | 13.8 | years | ||
Portfolio characteristics will vary.
EXPENSE RATIOS AS STATED IN THE MOST RECENT PROSPECTUS
| Share Class | Gross Expense Ratio5 | Net Expense Ratio6 | ||||
| A |
0.98 | % | 0.98 | % | ||
| B |
1.73 | 1.73 | ||||
| C |
1.73 | 1.73 | ||||
| Y |
0.73 | 0.73 |
NOTES TO CHARTS
| 1 | Does not include a sales charge. |
| 2 | Includes maximum sales charge of 4.50%. |
| 3 | Performance for Class B shares assumes a maximum 5% contingent deferred sales charge (“CDSC”) applied when you sell shares, which declines annually between years 1-6 according to the following schedule: 5, 4, 3, 3, 2, 1, 0%. Class C share performance assumes a 1.00% CDSC applied when you sell shares within one year of purchase. |
| 4 | Fund performance has been increased by expense reductions and reimbursements, if any, without which performance would have been lower. |
| 5 | Before reductions and reimbursements. |
| 6 | After reductions and reimbursements. Expense reductions are contractual and are set to expire on 1/31/10. |
10
Table of Contents
ADDITIONAL INFORMATION
The views expressed in this report reflect those of the portfolio managers as of the dates indicated. The managers’ views are subject to change at any time without notice based on changes in market or other conditions. References to specific securities or industries should not be regarded as investment advice. Because the funds are actively managed, there is no assurance that they will continue to invest in the securities or industries mentioned.
For more complete information on any Natixis Fund, contact your financial professional, visit the funds website at www.funds.natixis.com or call Natixis Funds at 800-225-5478 and ask for a free prospectus, which contains more complete information including charges and other ongoing expenses. Investors should consider a fund’s objective, risks and expenses carefully before investing. This and other fund information can be found in the prospectus. Please read the prospectus carefully before investing.
INDEX/AVERAGE DESCRIPTIONS
Barclays Capital U.S. Aggregate Bond Index is an unmanaged index of investment-grade bonds with one- to ten-year maturities issued by the U.S. government, its agencies and U.S. corporations.
Barclays Capital Global Aggregate ex-USD Bond Index is an unmanaged index which provides a broad-based measure of the international investment-grade bond market.
Barclays Capital U.S. Corporate High-Yield Bond Index is a market-weighted, unmanaged index of fixed-rate, non-investment grade debt.
Barclays Capital U.S. 1-5 Year Government Bond Index is an unmanaged, market-weighted index of bonds issued by the U.S. government and its agencies, with maturities between one and five years.
Barclays Capital U.S. Credit Bond Index is an unmanaged index that includes all publicly issued, fixed-rate, nonconvertible, dollar-denominated, SEC-registered, U.S. investment-grade corporate debt, and foreign debt that meets specific maturity, liquidity and quality requirements.
Barclays Capital U.S. Universal Bond Index is an unmanaged index representing a blend of the Lehman Aggregate Bond Index, the High Yield Index, and the Emerging Market Index, among other indexes.
Morningstar Fund Averages are the average performance without sales charge of funds with similar investment objectives, as calculated by Morningstar, Inc.
PROXY VOTING INFORMATION
A description of the funds’ proxy voting policies and procedures is available without charge, upon request, by calling Natixis Funds at 800-225-5478; on the funds’ website at www.funds.natixis.com; and on the Securities and Exchange Commission’s (SEC’s) website at www.sec.gov. Information regarding how the funds voted proxies relating to portfolio securities during the 12-month period ended June 30, 2009 is available from the funds’ website and the SEC’s website.
QUARTERLY PORTFOLIO SCHEDULES
The funds file a complete schedule of portfolio holdings with the SEC for the first and third quarters of each fiscal year on Form N-Q. The funds’ Forms N-Q are available on the SEC’s website at www.sec.gov and may be
reviewed and copied at the SEC’s Public Reference Room in Washington, DC. Information on the operation of the Public Reference Room may be obtained by calling
1-800-SEC-0330.
| NOT FDIC INSURED | MAY LOSE VALUE | NO BANK GUARANTEE |
11
Table of Contents
UNDERSTANDING FUND EXPENSES
As a mutual fund shareholder, you incur different costs: transaction costs, including sales charges (loads) on purchases, redemption fees and contingent deferred sales charges on redemptions; certain exchange fees; and ongoing costs, including management fees, distribution and/or service fees (12b-1 fees), and other fund expenses. In addition, each fund may assess a minimum balance fee of $20 on an annual basis for accounts that fall below the required minimum to establish an account. Certain exemptions may apply. These costs are described in more detail in the funds’ prospectuses. The examples below are intended to help you understand the ongoing costs of investing in the funds and help you compare these with the ongoing costs of investing in other mutual funds.
The first line in the table of each Class of fund shares shows the actual account values and actual fund expenses you would have paid on a $1,000 investment in the fund from April 1, 2009 through September 30, 2009. To estimate the expenses you paid over the period, simply divide your account value by $1,000 (for example $8,600 account value divided by $1,000 = 8.60) and multiply the result by the number in the Expenses Paid During Period column as shown below for your Class.
The second line in the table of each Class of fund shares provides information about hypothetical account values and hypothetical expenses based on the fund’s actual expense ratios and an assumed rate of return of 5% per year before expenses, which is not the fund’s actual return. The hypothetical account values and expenses may not be used to estimate the actual ending account balance or expenses you paid on your investment for the period. You may use this information to compare the ongoing costs of investing in the fund and other funds. To do so, compare this 5% hypothetical example with the 5% hypothetical examples that appear in the shareholder reports of the other funds.
Please note that the expenses shown reflect ongoing costs only, and do not include any transaction costs such as sales charges, redemption fees, or exchange fees. Therefore, the second line in the table of each fund is useful in comparing ongoing costs only, and will not help you determine the relative costs of owning different funds. If transaction costs were included, total costs would be higher.
| LOOMIS SAYLES CORE PLUS BOND FUND | BEGINNING ACCOUNT VALUE 4/1/2009 |
ENDING ACCOUNT VALUE 9/30/2009 |
EXPENSES PAID DURING PERIOD* 4/1/2009 – 9/30/2009 | |||
| CLASS A |
||||||
| Actual |
$1,000.00 | $1,156.70 | $4.87 | |||
| Hypothetical (5% return before expenses) |
$1,000.00 | $1,020.56 | $4.56 | |||
| CLASS B |
||||||
| Actual |
$1,000.00 | $1,152.70 | $8.90 | |||
| Hypothetical (5% return before expenses) |
$1,000.00 | $1,016.80 | $8.34 | |||
| CLASS C |
||||||
| Actual |
$1,000.00 | $1,152.30 | $8.90 | |||
| Hypothetical (5% return before expenses) |
$1,000.00 | $1,016.80 | $8.34 | |||
| CLASS Y |
||||||
| Actual |
$1,000.00 | $1,158.40 | $3.52 | |||
| Hypothetical (5% return before expenses) |
$1,000.00 | $1,021.81 | $3.29 |
| * | Expenses are equal to the Fund’s annualized expense ratio (after fee reduction/reimbursement): 0.90%, 1.65%, 1.65% and 0.65% for Class A, B, C and Y, respectively, multiplied by the average account value over the period, multiplied by the number of days in the most recent fiscal half-year, divided by 365 (to reflect the half-year period). |
12
Table of Contents
UNDERSTANDING FUND EXPENSES
| LOOMIS SAYLES HIGH INCOME FUND | BEGINNING ACCOUNT VALUE 4/1/2009 |
ENDING ACCOUNT VALUE 9/30/2009 |
EXPENSES PAID DURING PERIOD* 4/1/2009 – 9/30/2009 | |||
| CLASS A |
||||||
| Actual |
$1,000.00 | $1,321.70 | $6.69 | |||
| Hypothetical (5% return before expenses) |
$1,000.00 | $1,019.30 | $5.82 | |||
| CLASS B |
||||||
| Actual |
$1,000.00 | $1,319.60 | $11.05 | |||
| Hypothetical (5% return before expenses) |
$1,000.00 | $1,015.54 | $9.60 | |||
| CLASS C |
||||||
| Actual |
$1,000.00 | $1,319.80 | $11.05 | |||
| Hypothetical (5% return before expenses) |
$1,000.00 | $1,015.54 | $9.60 | |||
| CLASS Y |
||||||
| Actual |
$1,000.00 | $1,323.60 | $5.24 | |||
| Hypothetical (5% return before expenses) |
$1,000.00 | $1,020.56 | $4.56 |
| * | Expenses are equal to the Fund’s annualized expense ratio (after fee reduction/reimbursement): 1.15%, 1.90%, 1.90% and 0.90% for Class A, B, C and Y, respectively, multiplied by the average account value over the period, multiplied by the number of days in the most recent fiscal half-year, divided by 365 (to reflect the half-year period). |
| LOOMIS SAYLES INTERNATIONAL BOND FUND | BEGINNING ACCOUNT VALUE 4/1/2009 |
ENDING ACCOUNT VALUE 9/30/2009 |
EXPENSES PAID DURING PERIOD* 4/1/2009 – 9/30/2009 | |||
| CLASS A |
||||||
| Actual |
$1,000.00 | $1,229.20 | $6.15 | |||
| Hypothetical (5% return before expenses) |
$1,000.00 | $1,019.55 | $5.57 | |||
| CLASS C |
||||||
| Actual |
$1,000.00 | $1,225.30 | $10.32 | |||
| Hypothetical (5% return before expenses) |
$1,000.00 | $1,015.79 | $9.35 | |||
| CLASS Y |
||||||
| Actual |
$1,000.00 | $1,229.70 | $4.75 | |||
| Hypothetical (5% return before expenses) |
$1,000.00 | $1,020.81 | $4.31 |
| * | Expenses are equal to the Fund’s annualized expense ratio (after fee reduction/reimbursement): 1.10%, 1.85% and 0.85%, for Class A, C and Y, respectively, multiplied by the average account value over the period, multiplied by the number of days in the most recent fiscal half-year, divided by 365 (to reflect the half-year period). |
13
Table of Contents
UNDERSTANDING FUND EXPENSES
| LOOMIS SAYLES LIMITED TERM
GOVERNMENT AND AGENCY FUND |
BEGINNING ACCOUNT VALUE 4/1/2009 |
ENDING ACCOUNT VALUE 9/30/2009 |
EXPENSES PAID DURING PERIOD* 4/1/2009 – 9/30/2009 | |||
| CLASS A |
||||||
| Actual |
$1,000.00 | $1,050.60 | $4.63 | |||
| Hypothetical (5% return before expenses) |
$1,000.00 | $1,020.56 | $4.56 | |||
| CLASS B |
||||||
| Actual |
$1,000.00 | $1,047.70 | $8.47 | |||
| Hypothetical (5% return before expenses) |
$1,000.00 | $1,016.80 | $8.34 | |||
| CLASS C |
||||||
| Actual |
$1,000.00 | $1,047.70 | $8.47 | |||
| Hypothetical (5% return before expenses) |
$1,000.00 | $1,016.80 | $8.34 | |||
| CLASS Y |
||||||
| Actual |
$1,000.00 | $1,052.80 | $3.34 | |||
| Hypothetical (5% return before expenses) |
$1,000.00 | $1,021.81 | $3.29 |
| * | Expenses are equal to the Fund’s annualized expense ratio (after fee reduction/reimbursement): 0.90%, 1.65%, 1.65% and 0.65%, for Class A, B, C and Y, respectively, multiplied by the average account value over the period multiplied by the number of days in the most recent fiscal half-year, divided by 365 (to reflect the half-year period). |
| LOOMIS SAYLES STRATEGIC INCOME FUND | BEGINNING ACCOUNT VALUE 4/1/2009 |
ENDING ACCOUNT VALUE 9/30/2009 |
EXPENSES PAID DURING PERIOD* 4/1/2009 – 9/30/2009 | |||
| CLASS A |
||||||
| Actual |
$1,000.00 | $1,331.70 | $5.73 | |||
| Hypothetical (5% return before expenses) |
$1,000.00 | $1,020.16 | $4.96 | |||
| CLASS B |
||||||
| Actual |
$1,000.00 | $1,327.00 | $10.09 | |||
| Hypothetical (5% return before expenses) |
$1,000.00 | $1,016.39 | $8.74 | |||
| CLASS C |
||||||
| Actual |
$1,000.00 | $1,326.20 | $10.09 | |||
| Hypothetical (5% return before expenses) |
$1,000.00 | $1,016.39 | $8.74 | |||
| CLASS Y |
||||||
| Actual |
$1,000.00 | $1,333.90 | $4.15 | |||
| Hypothetical (5% return before expenses) |
$1,000.00 | $1,021.51 | $3.60 |
| * | Expenses are equal to the Fund’s annualized expense ratio: 0.98%, 1.73%, 1.73% and 0.71% for Class A, B, C and Y, respectively, multiplied by the average account value over the period, multiplied by the number of days in the most recent fiscal half-year, divided by 365 (to reflect the half-year period). |
14
Table of Contents
BOARD APPROVAL OF THE EXISTING ADVISORY AND SUB-ADVISORY AGREEMENTS
The Board of Trustees, including the Independent Trustees, considers matters bearing on each Fund’s advisory agreement and, with respect to the Loomis Sayles Core Plus Bond Fund, its Advisory Administration Agreement (collectively, the “Agreements”) at most of its meetings throughout the year. Each year, usually in the spring, the Contract Review and Governance Committee of the Board meets to review the Agreements to determine whether to recommend that the full Board approve the continuation of the Agreements, typically for an additional one-year period. After the Committee has made its recommendation, the full Board, including the Independent Trustees, determines whether to approve the continuation of the Agreements.
In connection with these meetings, the Trustees receive materials that the Funds’ investment adviser ( the “Adviser”) believes to be reasonably necessary for the Trustees to evaluate the Agreements. These materials generally include, among other items, (i) information on the investment performance of the Funds and the performance of peer groups of funds and the Funds’ performance benchmarks, (ii) information on the Funds’ advisory fees and other expenses, including information comparing the Funds’ expenses to those of peer groups of funds and information about any applicable expense caps and fee “breakpoints,” (iii) sales and redemption data in respect of the Funds, (iv) information about the profitability of the Agreements to the Funds’ Adviser and (v) information obtained through the completion of a questionnaire by the Adviser (the Trustees are consulted as to the information requested through that questionnaire). The Board of Trustees, including the Independent Trustees, also consider other matters such as (i) the Adviser’s financial results and financial condition, (ii) each Fund’s investment objective and strategies and the size, education and experience of the Adviser’s investment staff and its use of technology, external research and trading cost measurement tools, (iii) arrangements in respect of the distribution of the Funds’ shares and the related costs, (iv) the procedures employed to determine the value of the Funds’ assets, (v) the allocation of the Funds’ brokerage, if any, including, if applicable, allocations to brokers affiliated with the Adviser and the use of “soft” commission dollars to pay Fund expenses and to pay for research and other similar services, (vi) the resources devoted to, and the record of compliance with, the Funds’ investment policies and restrictions, policies on personal securities transactions and other compliance policies, (vii) information about amounts invested by the Funds’ portfolio managers in the Funds or in similar accounts that they manage and (viii) the general economic outlook with particular emphasis on the mutual fund industry. Throughout the process, the Trustees are afforded the opportunity to ask questions of and request additional materials from the Adviser.
In addition to the materials requested by the Trustees in connection with their annual consideration of the continuation of the Agreements, the Trustees receive materials in advance of each regular quarterly meeting of the Board of Trustees that provide detailed information about the Funds’ investment performance and the fees charged to the Funds for advisory and other services. This information generally includes, among other things, an internal performance rating for each Fund based on agreed-upon criteria, graphs showing each Fund’s performance and fee differentials against each Fund’s peer group of funds, performance ratings provided by a third-party, total return information for various periods, and third-party performance rankings for various periods comparing a Fund against its peer group. The portfolio management team for each Fund or other representatives of the Adviser make periodic presentations to the Contract Review and Governance Committee and/or the full Board of Trustees, and Funds identified as presenting possible performance concerns may be subject to more frequent board presentations and reviews. In addition, each quarter the Trustees are provided with detailed statistical information about each Fund’s portfolio.
The Board of Trustees most recently approved the continuation of the Agreements at their meeting held in June 2009. The Agreements were continued for a one-year period for the Funds. In considering whether to approve the continuation of the Agreements, the Board of Trustees, including the Independent Trustees, did not identify any single factor as determinative. Individual Trustees may have evaluated the information presented differently from one another, giving different weights to various factors. Matters considered by the Trustees, including the Independent Trustees, in connection with their approval of the Agreements included the factors listed below.
The nature, extent and quality of the services provided to the Funds under the Agreements. The Trustees considered the nature, extent and quality of the services provided by the Adviser and its affiliates to the Funds and the resources dedicated to the Funds by the Adviser and its affiliates, including recent or planned investments by the Adviser in additional personnel or other resources. They considered the need for the Adviser to offer competitive compensation in order to attract and retain capable personnel and the need for the Adviser to expend additional resources as the Funds grew in size.
For each Fund, the Trustees also considered the benefits to shareholders of investing in a mutual fund that is part of a family of funds that offers shareholders the right to exchange shares of one type of fund for shares of another type of fund, and provides a variety of fund and shareholder services.
15
Table of Contents
BOARD APPROVAL OF THE EXISTING ADVISORY AND SUB-ADVISORY AGREEMENTS
After reviewing these and related factors, the Trustees concluded, within the context of their overall conclusions regarding each of the Agreements, that the nature, extent and quality of services provided supported the renewal of the Agreements.
Investment performance of the Funds and the Adviser. As noted above, the Trustees received information about the performance of the Funds over various time periods, including information which compared the performance of the Funds to the performance of peer groups of funds and the Funds’ respective performance benchmarks. In addition, the Trustees also reviewed data prepared by an independent third party which analyzed the performance of the Funds using a variety of performance metrics, including metrics which also measured the performance of the Funds on a risk adjusted basis.
With respect to each Fund, the Board concluded that the Fund’s performance or other relevant factors supported the renewal of the Agreement relating to that Fund. In the case of each Fund that had performance that lagged that of a relevant peer group for certain (although not necessarily all) periods, the Board concluded that other factors relevant to performance supported renewal of the Funds’ Agreements. These factors varied from Fund to Fund, but included one or more of the following: (1) that the Fund had a limited operating history, (2) that the underperformance was attributable, to a significant extent, to investment decisions (such as security selection or sector allocation) by the Fund’s Adviser that were reasonable and consistent with the Fund’s investment objective and policies (3) that the Fund’s performance, although lagging in certain recent periods, was stronger over the longer term (4) that the Fund’s more recent performance was competitive when compared to relevant performance benchmarks or peer groups, and (5) reductions in the Fund’s expense levels resulting from decreased expenses were not yet fully reflected in the Fund’s performance results.
The Trustees also considered the Adviser’s performance and reputation generally, the Funds’ performance as a fund family generally (as noted by certain financial publications), and the historical responsiveness of the Adviser to Trustee concerns about performance and the willingness of the Adviser to take steps intended to improve performance.
After reviewing these and related factors, the Trustees concluded, within the context of their overall conclusions regarding each of the Agreements, that the performance of the Funds and the Adviser and/or other relevant factors supported the renewal of the Agreements.
The costs of the services to be provided and profits to be realized by the Adviser and its affiliates from their respective relationships with the Funds. The Trustees considered the fees charged to the Funds for advisory services as well as the total expense levels of the Funds. This information included comparisons (provided both by management and also by an independent third party) of the Funds’ advisory fees and total expense levels to those of their peer groups and information about the advisory fees charged by the Adviser to comparable accounts. In considering the fees charged to comparable accounts, the Trustees considered, among other things, management’s representations about the differences between managing mutual funds as compared to other types of accounts, including the additional resources required to effectively manage and the greater regulatory costs associated with the management of mutual fund assets. In evaluating each Fund’s advisory fee, the Trustees also took into account the demands, complexity and quality of the investment management of such Fund. The Trustees considered that over the past several years, management had made recommendations regarding reductions in advisory fee rates, implementation of advisory fee breakpoints and the institution of advisory fee waivers and expense caps for various Funds in the Fund family. They noted that, as of December 31, 2008, all of the Natixis Funds in this report have expense caps in place, and the Trustees considered the amounts waived or reimbursed by the Adviser under these caps. The Trustees noted that the Loomis Sayles Strategic Income Fund had an advisory fee rate that was above the median of a peer group of funds. The Trustees considered the circumstances that accounted for such relatively higher expenses. The Trustees noted that for the Loomis Sayles Strategic Income Fund, the Fund’s total expense ratio was below the median even though the advisory fee was above the median and they noted that they had recently implemented an additional breakpoint in the Fund’s advisory fee schedule. The Trustees also noted that while the Loomis Sayles Limited Term Government and Agency Fund’s advisory fee was above the median for its peer group of funds, after the application of the Fund’s expense cap, it was below the median.
The Trustees also considered the compensation directly or indirectly received or to be received by the Adviser and its affiliates from their relationships with the Funds. The Trustees reviewed information provided by management as to the profitability of the Adviser’s and its affiliates’ relationships with the Funds, and information about the allocation of expenses used to calculate profitability. They also reviewed information provided by management about the effect of distribution costs and changes in asset levels on Adviser profitability, including information regarding resources spent on distribution activities. When reviewing profitability, the Trustees also considered information about court cases in which adviser profitability was an issue, the performance of the relevant Funds, the expense levels of the Funds, and whether the Adviser had implemented breakpoints and/or expense caps with respect to such Funds.
16
Table of Contents
BOARD APPROVAL OF THE EXISTING ADVISORY AND SUB-ADVISORY AGREEMENTS
After reviewing these and related factors, the Trustees concluded, within the context of their overall conclusions regarding each of the Agreements, that the advisory fee charged to each of the Funds was fair and reasonable, and that the costs of these services generally and the related profitability of the Adviser and its affiliates in respect of their relationships with the Funds supported the renewal of the Agreements.
Economies of Scale. The Trustees considered the existence of any economies of scale in the provision of services by the Adviser and whether those economies are shared with the Funds through breakpoints in their investment advisory fees or other means, such as expense waivers or caps. The Trustees noted that each of the Funds was subject to an expense cap or waiver. For Loomis Sayles Strategic Income Fund, the Trustees noted that they had recently implemented an additional breakpoint in response to the growth of assets in the Fund. The Trustees further considered the effect of recent market volatility on all of the Fund’s assets and possible effect on the Fund’s future profitability. In considering these issues, the Trustees also took note of the costs of the services provided (both on an absolute and a relative basis) and the profitability to the Adviser and its affiliates of their relationships with the Funds, as discussed above.
After reviewing these and related factors, the Trustees considered, within the context of their overall conclusions regarding each of the Agreements, that the extent to which economies of scale were shared with the Funds supported the renewal of the Agreements.
The Trustees also considered other factors, which included but were not limited to the following:
| · | the effect of recent market and economic turmoil on the performance, asset levels and expense ratios of each Fund. |
| · | whether each Fund has operated in accordance with its investment objective and the Fund’s record of compliance with its investment restrictions, and the compliance programs of the Funds and the Adviser. They also considered the compliance-related resources the Adviser and its affiliates were providing to the Funds. |
| · | the nature, quality, cost and extent of administrative and shareholder services performed by the Adviser and its affiliates, both under the Agreements and under separate agreements covering administrative services. |
| · | so-called “fallout benefits” to the Adviser, such as the engagement of affiliates of the Adviser to provide distribution, administrative and brokerage services to the Funds, and the benefits of research made available to the Adviser by reason of brokerage commissions generated by the Funds’ securities transactions. The Trustees considered the possible conflicts of interest associated with these fallout and other benefits, and the reporting, disclosure and other processes in place to disclose and monitor such possible conflicts of interest. |
| · | the Trustees’ review and discussion of the Funds’ advisory arrangements in prior years, and management’s record of responding to Trustee concerns raised during the year and in prior years. |
Based on their evaluation of all factors that they deemed to be material, including those factors described above, and assisted by the advice of independent counsel, the Trustees, including the Independent Trustees, concluded that each of the existing Agreements should be continued through June 30, 2010.
17
Table of Contents
LOOMIS SAYLES CORE PLUS BOND FUND — PORTFOLIO OF INVESTMENTS
Investments as of September 30, 2009
| Principal Amount |
Description | Value (†) | ||||
| Bonds and Notes — 96.3% of Net Assets | ||||||
| ABS Home Equity — 0.6% | ||||||
| $ | 1,017,940 | Countrywide Asset-Backed Certificates, Series 2004-S1, Class A3, 4.615%, 2/25/2035 |
$ | 765,387 | ||
| 836,743 | Residential Asset Securities Corp., Series 2003-KS10, Class AI4, 4.470%, 3/25/2032 |
699,644 | ||||
| 1,465,031 | ||||||
| Automotive — 0.9% | ||||||
| 1,640,000 | Ford Motor Credit Co. LLC, 7.000%, 10/01/2013 |
1,539,327 | ||||
| 810,000 | Ford Motor Credit Co. LLC, 8.000%, 12/15/2016 |
751,490 | ||||
| 2,290,817 | ||||||
| Banking — 6.1% | ||||||
| 2,105,000 | Barclays Bank PLC, 6.750%, 5/22/2019 |
2,354,306 | ||||
| 1,365,000 | Bear Stearns Cos., Inc. (The), 6.400%, 10/02/2017 |
1,484,941 | ||||
| 2,135,000 | Citigroup, Inc., 6.500%, 8/19/2013 |
2,241,214 | ||||
| 1,115,000 | Citigroup, Inc., 8.125%, 7/15/2039 |
1,248,119 | ||||
| 625,000 | Goldman Sachs Group, Inc. (The), 5.300%, 2/14/2012 |
660,291 | ||||
| 1,040,000 | Goldman Sachs Group, Inc. (The), 6.150%, 4/01/2018 |
1,093,990 | ||||
| 1,560,000 | JPMorgan Chase & Co., 6.000%, 1/15/2018 |
1,674,387 | ||||
| 1,670,000 | Merrill Lynch & Co., Inc., MTN, 6.875%, 4/25/2018 |
1,756,334 | ||||
| 800,000 | Morgan Stanley, 4.000%, 1/15/2010 |
806,230 | ||||
| 615,000 | Morgan Stanley, 5.375%, 10/15/2015 |
634,822 | ||||
| 100,000 | Morgan Stanley, 6.750%, 4/15/2011 |
106,627 | ||||
| 835,000 | Morgan Stanley, Series F, GMTN, 6.625%, 4/01/2018 |
882,948 | ||||
| 835,000 | Morgan Stanley, Series F, MTN, 5.550%, 4/27/2017 |
831,834 | ||||
| 15,776,043 | ||||||
| Building Materials — 1.5% | ||||||
| 2,520,000 | Holcim Capital Corp. Ltd., 144A, 6.875%, 9/29/2039 |
2,596,895 | ||||
| 815,000 | Owens Corning, Inc., 7.000%, 12/01/2036 |
667,798 | ||||
| 795,000 | USG Corp., 6.300%, 11/15/2016 |
675,750 | ||||
| 3,940,443 | ||||||
| Chemicals — 0.5% | ||||||
| 1,000,000 | Chevron Phillips Chemical Co. LLC, 144A, 8.250%, 6/15/2019 |
1,207,713 | ||||
| Commercial Mortgage-Backed Securities — 7.2% | ||||||
| 795,000 | Banc of America Commercial Mortgage, Inc., Series 2005-6, Class A2, 5.165%, 9/10/2047 |
803,235 | ||||
| Principal Amount |
Description | Value (†) | ||||
| Commercial Mortgage-Backed Securities — continued | ||||||
| $ | 850,000 | Banc of America Commercial Mortgage, Inc., Series 2006-1, Class A2, 5.334%, 9/10/2045 |
$ | 859,204 | ||
| 1,305,000 | Banc of America Commercial Mortgage, Inc., Series 2007-2, Class A2, 5.634%, 4/10/2049 |
1,295,483 | ||||
| 1,245,000 | Bear Stearns Commercial Mortgage Securities, Inc., Series 2005-PW10, Class A2, 5.270%, 12/11/2040 |
1,247,215 | ||||
| 1,200,000 | Bear Stearns Commercial Mortgage Securities, Inc., Series 2007-PW16, Class A2, 5.667%, 6/11/2040(b) |
1,183,159 | ||||
| 145,000 | Bear Stearns Commercial Mortgage Securities, Series 2007-PW15, Class A4, 5.331%, 2/11/2044 |
130,526 | ||||
| 1,000,000 | Citigroup Commercial Mortgage Trust, Series 2008-C7, Class A4, 6.095%, 12/10/2049(b) |
900,310 | ||||
| 710,000 | Citigroup/Deutsche Bank Commercial Mortgage Trust, Series 2006-CD2, Class A2, 5.408%, 1/15/2046 |
714,745 | ||||
| 1,800,000 | Greenwich Capital Commercial Funding Corp., Series 2005-GG5, Class A2, 5.117%, 4/10/2037 |
1,795,601 | ||||
| 960,000 | Greenwich Capital Commercial Funding Corp., Series 2006-GG7, Class A4, 5.918%, 7/10/2038(b) |
878,303 | ||||
| 274,000 | GS Mortgage Securities Corp. II, Series 2006-GG6, Class A4, 5.553%, 4/10/2038 |
247,456 | ||||
| 1,140,000 | GS Mortgage Securities Corp. II, Series 2006-GG8, Class A4, 5.560%, 11/10/2039 |
1,001,888 | ||||
| 1,375,000 | JP Morgan Chase Commercial Mortgage Securities Corp., Series 2006-LDP7, Class A4, 5.875%, 4/15/2045(b) |
1,278,701 | ||||
| 850,000 | JP Morgan Chase Commercial Mortgage Securities Corp., Series 2007-CB18, Class A4, 5.440%, 6/12/2047 |
730,316 | ||||
| 1,710,000 | LB-UBS Commercial Mortgage Trust, Series 2005-C3, Class A3, 4.647%, 7/15/2030 |
1,712,618 | ||||
| 900,000 | Morgan Stanley Capital I, Series 2007-T27, Class A4, 5.650%, 6/11/2042(b) |
849,315 | ||||
| 1,175,000 | Morgan Stanley Capital I, Series 2008-T29, Class A4, 6.280%, 1/11/2043(b) |
1,139,794 | ||||
| 2,070,000 | Wachovia Bank Commercial Mortgage Trust, Series 2006-C29, Class A4, 5.308%, 11/15/2048 |
1,863,884 | ||||
| 18,631,753 | ||||||
| Consumer Products — 0.2% | ||||||
| 255,000 | Whirlpool Corp., 8.000%, 5/01/2012 |
275,248 | ||||
| 250,000 | Whirlpool Corp., MTN, 8.600%, 5/01/2014 |
279,656 | ||||
| 554,904 | ||||||
| Distributors — 0.3% | ||||||
| 605,000 | EQT Corp., 8.125%, 6/01/2019 |
690,529 | ||||
| Diversified Manufacturing — 2.7% | ||||||
| 1,200,000 | Crane Co., 6.550%, 11/15/2036(c) |
1,177,523 | ||||
See accompanying notes to financial statements.
18
Table of Contents
LOOMIS SAYLES CORE PLUS BOND FUND — PORTFOLIO OF INVESTMENTS (continued)
Investments as of September 30, 2009
| Principal Amount |
Description | Value (†) | ||||
| Diversified Manufacturing — continued | ||||||
| $ | 2,145,000 | General Electric Co., 5.250%, 12/06/2017 |
$ | 2,201,306 | ||
| 2,790,000 | Hutchison Whampoa International Ltd., 144A, 5.750%, 9/11/2019 |
2,806,857 | ||||
| 760,000 | Timken Co. (The), 6.000%, 9/15/2014 |
789,532 | ||||
| 6,975,218 | ||||||
| Electric — 2.4% | ||||||
| 290,000 | AES Corp. (The), 7.750%, 10/15/2015 |
291,450 | ||||
| 570,000 | AES Corp. (The), 8.000%, 10/15/2017 |
573,563 | ||||
| 715,000 | AES Corp. (The), 8.000%, 6/01/2020 |
709,637 | ||||
| 110,000 | CMS Energy Corp., 8.750%, 6/15/2019 |
119,657 | ||||
| 950,000 | Enersis SA, Chile, 7.375%, 1/15/2014 |
1,048,121 | ||||
| 630,000 | Exelon Generation Co. LLC, 5.200%, 10/01/2019 |
636,894 | ||||
| 1,535,000 | Exelon Generation Co. LLC, 6.250%, 10/01/2039 |
1,566,716 | ||||
| 690,000 | Ipalco Enterprises, Inc., 144A, 7.250%, 4/01/2016 |
691,725 | ||||
| 590,000 | Southern California Edison Co., 7.625%, 1/15/2010 |
601,083 | ||||
| 6,238,846 | ||||||
| Environmental — 0.2% | ||||||
| 545,000 | Waste Management, Inc., 7.375%, 3/11/2019 |
634,240 | ||||
| Financial Other — 0.6% | ||||||
| 1,430,000 | HKCG Finance Ltd., 144A, 6.250%, 8/07/2018 |
1,570,367 | ||||
| Food & Beverage — 2.6% | ||||||
| 560,000 | Anheuser-Busch Cos., Inc., 4.500%, 4/01/2018 |
543,080 | ||||
| 605,000 | Bunge Ltd. Finance Co., 8.500%, 6/15/2019 |
697,462 | ||||
| 2,235,000 | Del Monte Corp., 144A, 7.500%, 10/15/2019 |
2,257,350 | ||||
| 1,015,000 | Dr Pepper Snapple Group, Inc., 6.820%, 5/01/2018 |
1,153,835 | ||||
| 915,000 | Kraft Foods, Inc., 6.125%, 8/23/2018 |
970,532 | ||||
| 1,040,000 | Smithfield Foods, Inc., 144A, 10.000%, 7/15/2014 |
1,092,000 | ||||
| 6,714,259 | ||||||
| Government Guaranteed — 0.4% | ||||||
| 910,000 | JPMorgan Chase & Co., 2.125%, 6/22/2012, (FDIC insured) |
923,341 | ||||
| Government Owned — No Guarantee — 0.9% | ||||||
| 1,280,000 | Export-Import Bank of Korea, 8.125%, 1/21/2014 |
1,466,217 | ||||
| 750,000 | Qtel International Finance Ltd., 144A, 7.875%, 6/10/2019 |
857,431 | ||||
| 2,323,648 | ||||||
| Principal Amount |
Description | Value (†) | ||||
| Health Insurance — 0.6% | ||||||
| $ | 1,470,000 | WellPoint, Inc., 7.000%, 2/15/2019 |
$ | 1,671,033 | ||
| Healthcare — 1.0% | ||||||
| 190,000 | Express Scripts, Inc., 7.250%, 6/15/2019 |
223,146 | ||||
| 575,000 | HCA, Inc., 7.500%, 12/15/2023 |
464,179 | ||||
| 685,000 | HCA, Inc., 9.125%, 11/15/2014 |
707,262 | ||||
| 485,000 | Hospira, Inc., 6.050%, 3/30/2017 |
507,880 | ||||
| 670,000 | Medco Health Solutions, 7.250%, 8/15/2013 |
749,723 | ||||
| 2,652,190 | ||||||
| Hybrid ARMs — 0.9% | ||||||
| 1,117,659 | FHLMC, 5.980%, 11/01/2036(b) |
1,174,939 | ||||
| 1,104,898 | FNMA, 6.026%, 2/01/2037(b) |
1,174,915 | ||||
| 120,903 | JPMorgan Mortgage Trust, Series 2006-A7, Class 1A3, 4.552%, 1/25/2037(b) |
112,760 | ||||
| 2,462,614 | ||||||
| Independent Energy — 1.6% | ||||||
| 1,710,000 | Anadarko Petroleum Corp., 6.950%, 6/15/2019 |
1,906,450 | ||||
| 2,000,000 | XTO Energy, Inc., 6.375%, 6/15/2038 |
2,127,554 | ||||
| 4,034,004 | ||||||
| Lodging — 0.6% | ||||||
| 1,390,000 | Royal Caribbean Cruises Ltd., 11.875%, 7/15/2015 |
1,563,750 | ||||
| Media Cable — 2.1% | ||||||
| 590,000 | Comcast Corp., 6.450%, 3/15/2037 |
624,745 | ||||
| 1,770,000 | Comcast Corp., 6.950%, 8/15/2037 |
1,975,607 | ||||
| 755,000 | Cox Communications, Inc., 6.750%, 3/15/2011 |
799,553 | ||||
| 1,760,000 | Time Warner Cable, Inc., 8.250%, 4/01/2019 |
2,127,305 | ||||
| 5,527,210 | ||||||
| Metals & Mining — 1.1% | ||||||
| 1,010,000 | ArcelorMittal, 9.850%, 6/01/2019 |
1,194,632 | ||||
| 790,000 | Rio Tinto Finance (USA) Ltd., 9.000%, 5/01/2019 |
969,783 | ||||
| 710,000 | United States Steel Corp., 6.650%, 6/01/2037 |
579,103 | ||||
| 2,743,518 | ||||||
| Mortgage Related — 16.9% | ||||||
| 721,470 | FHLMC, 4.000%, 7/01/2019 |
750,406 | ||||
| 1,499,037 | FHLMC, 4.500%, 12/01/2034 |
1,524,646 | ||||
| 349,803 | FHLMC, 5.000%, 11/01/2018 |
371,941 | ||||
See accompanying notes to financial statements.
19
Table of Contents
LOOMIS SAYLES CORE PLUS BOND FUND — PORTFOLIO OF INVESTMENTS (continued)
Investments as of September 30, 2009
| Principal Amount |
Description | Value (†) | ||||
| Mortgage Related — continued | ||||||
| $ | 983,685 | FHLMC 5.500%, with various maturities in 2018(d) |
$ | 1,054,747 | ||
| 142,523 | FHLMC, 6.000%, 6/01/2035 |
151,573 | ||||
| 577,436 | FNMA, 4.000%, 6/01/2019 |
600,596 | ||||
| 5,769,643 | FNMA 4.500%, with various maturities from 2019 to 2035(d) |
5,964,505 | ||||
| 782,549 | FNMA, 5.500%, 5/01/2018 |
837,510 | ||||
| 7,225,983 | FNMA 6.000%, with various maturities from 2016 to 2039(d) |
7,650,895 | ||||
| 3,295,592 | FNMA 6.500%, with various maturities from 2029 to 2037(d) |
3,531,964 | ||||
| 151,800 | FNMA 7.000%, with various maturities in 2030(d) |
167,567 | ||||
| 174,950 | FNMA 7.500%, with various maturities from 2024 to 2032(d) |
195,964 | ||||
| 5,049,511 | GNMA 5.000%, with various maturities from 2035 to 2038(d) |
5,241,610 | ||||
| 11,465,903 | GNMA 5.500%, with various maturities from 2034 to 2039(d) |
12,060,450 | ||||
| 2,376,967 | GNMA 6.000%, with various maturities from 2029 to 2037(d) |
2,517,115 | ||||
| 456,462 | GNMA 6.500%, with various maturities from 2028 to 2032(d) |
492,236 | ||||
| 293,761 | GNMA 7.000%, with various maturities from 2025 to 2029(d) |
323,799 | ||||
| 107,647 | GNMA, 7.500%, with various maturities from 2025 to 2030(d) |
120,422 | ||||
| 58,955 | GNMA, 8.000%, 11/15/2029 |
67,026 | ||||
| 94,983 | GNMA 8.500%, with various maturities from 2017 to 2023(d) |
107,601 | ||||
| 17,021 | GNMA 9.000%, with various maturities in 2016(d) |
18,599 | ||||
| 35,492 | GNMA 11.500%, with various maturities from 2013 to 2015(d) |
39,752 | ||||
| 43,790,924 | ||||||
| Non-Captive Consumer — 0.9% | ||||||
| 735,000 | HSBC Finance Corp., 7.000%, 5/15/2012 |
793,993 | ||||
| 245,000 | SLM Corp., MTN, 5.050%, 11/14/2014 |
180,098 | ||||
| 215,000 | SLM Corp., Series A, MTN, 5.000%, 10/01/2013 |
171,153 | ||||
| 120,000 | SLM Corp., Series A, MTN, 5.000%, 6/15/2018 |
75,255 | ||||
| 35,000 | SLM Corp., Series A, MTN, 5.375%, 5/15/2014 |
26,788 | ||||
| 420,000 | SLM Corp., Series A, MTN, 5.625%, 8/01/2033 |
263,606 | ||||
| 1,135,000 | SLM Corp., Series A, MTN, 8.450%, 6/15/2018 |
905,162 | ||||
| 2,416,055 | ||||||
| Non-Captive Diversified — 2.0% | ||||||
| 745,000 | General Electric Capital Corp., 5.875%, 1/14/2038 |
683,225 | ||||
| 1,180,000 | General Electric Capital Corp., Series A, MTN, 5.625%, 9/15/2017 |
1,194,790 | ||||
| Principal Amount |
Description | Value (†) | ||||
| Non-Captive Diversified — continued | ||||||
| $ | 1,842,000 | GMAC, Inc., 144A, 6.625%, 5/15/2012 |
$ | 1,694,640 | ||
| 571,000 | GMAC, Inc., 144A, 8.000%, 11/01/2031 |
459,655 | ||||
| 465,000 | International Lease Finance Corp., 5.000%, 4/15/2010 |
451,595 | ||||
| 205,000 | International Lease Finance Corp., 6.375%, 3/25/2013 |
164,401 | ||||
| 120,000 | International Lease Finance Corp., Series R, MTN, 5.300%, 5/01/2012 |
100,859 | ||||
| 40,000 | International Lease Finance Corp., Series R, MTN, 5.550%, 9/05/2012 |
32,683 | ||||
| 200,000 | International Lease Finance Corp., Series R, MTN, 5.625%, 9/20/2013 |
152,378 | ||||
| 285,000 | International Lease Finance Corp., Series R, MTN, 5.650%, 6/01/2014 |
218,747 | ||||
| 5,152,973 | ||||||
| Oil Field Services — 0.4% | ||||||
| 190,000 | Nabors Industries, Inc., 6.150%, 2/15/2018 |
190,474 | ||||
| 730,000 | Nabors Industries, Inc., 9.250%, 1/15/2019 |
867,541 | ||||
| 1,058,015 | ||||||
| Paper — 1.7% | ||||||
| 565,000 | Georgia-Pacific Corp., 7.375%, 12/01/2025 |
508,500 | ||||
| 755,000 | Georgia-Pacific Corp., 7.750%, 11/15/2029 |
694,600 | ||||
| 735,000 | Georgia-Pacific Corp., 8.000%, 1/15/2024 |
727,650 | ||||
| 365,000 | Georgia-Pacific Corp., 8.875%, 5/15/2031 |
368,650 | ||||
| 1,730,000 | International Paper Co., 9.375%, 5/15/2019 |
2,025,650 | ||||
| 4,325,050 | ||||||
| Pipelines — 1.2% | ||||||
| 1,150,000 | NGPL Pipeco LLC, 144A, 6.514%, 12/15/2012 |
1,261,669 | ||||
| 705,000 | ONEOK Partners LP, 8.625%, 3/01/2019 |
841,593 | ||||
| 830,000 | TEPPCO Partners LP, 7.550%, 4/15/2038 |
979,038 | ||||
| 3,082,300 | ||||||
| Property & Casualty Insurance — 0.6% | ||||||
| 760,000 | Marsh & McLennan Cos., Inc., 9.250%, 4/15/2019 |
952,386 | ||||
| 475,000 | Willis North America, Inc., 6.200%, 3/28/2017 |
464,970 | ||||
| 245,000 | Willis North America, Inc., 7.000%, 9/29/2019 |
251,914 | ||||
| 1,669,270 | ||||||
| Refining — 0.4% | ||||||
| 965,000 | Valero Energy Corp., 9.375%, 3/15/2019 |
1,124,489 | ||||
| Sovereigns — 1.7% | ||||||
| 1,065,000 | Emirate of Abu Dhabi, 144A, 6.750%, 4/08/2019 |
1,189,377 | ||||
See accompanying notes to financial statements.
20
Table of Contents
LOOMIS SAYLES CORE PLUS BOND FUND — PORTFOLIO OF INVESTMENTS (continued)
Investments as of September 30, 2009
| Principal Amount |
Description | Value (†) | ||||
| Sovereigns — continued | ||||||
| $ | 1,155,000 | Indonesia Government International Bond, 144A, 7.750%, 1/17/2038 |
$ | 1,276,275 | ||
| 1,125,000 | Republic of Korea, 7.125%, 4/16/2019 |
1,319,483 | ||||
| 545,000 | Taqa Abu Dhabi National Energy, 144A, 6.250%, 9/16/2019 |
549,027 | ||||
| 4,334,162 | ||||||
| Technology — 2.1% | ||||||
| 745,000 | Corning, Inc., 7.250%, 8/15/2036 |
786,031 | ||||
| 440,000 | Equifax, Inc., 7.000%, 7/01/2037 |
432,276 | ||||
| 1,180,000 | Fiserv, Inc., 6.125%, 11/20/2012 |
1,278,928 | ||||
| 215,000 | Jabil Circuit, Inc., 7.750%, 7/15/2016 |
218,225 | ||||
| 85,000 | Motorola, Inc., 6.500%, 9/01/2025 |
71,832 | ||||
| 115,000 | Motorola, Inc., 6.500%, 11/15/2028 |
94,853 | ||||
| 185,000 | Motorola, Inc., 6.625%, 11/15/2037 |
154,937 | ||||
| 279,000 | Xerox Corp., 5.500%, 5/15/2012 |
292,549 | ||||
| 1,435,000 | Xerox Corp., 6.350%, 5/15/2018 |
1,491,835 | ||||
| 683,000 | Xerox Corp., 6.400%, 3/15/2016 |
715,610 | ||||
| 5,537,076 | ||||||
| Tobacco — 0.6% | ||||||
| 1,590,000 | Reynolds American, Inc., 7.250%, 6/15/2037 |
1,574,763 | ||||
| Treasuries — 26.1% | ||||||
| 6,555,000 | U.S. Treasury Bond, 3.500%, 2/15/2039 |
5,938,423 | ||||
| 5,617,000 | U.S. Treasury Note, 0.875%, 12/31/2010 |
5,641,136 | ||||
| 5,430,000 | U.S. Treasury Note, 0.875%, 5/31/2011 |
5,442,940 | ||||
| 2,325,000 | U.S. Treasury Note, 1.000%, 7/31/2011 |
2,331,631 | ||||
| 4,885,000 | U.S. Treasury Note, 2.375%, 8/31/2010 |
4,973,160 | ||||
| 1,000,000 | U.S. Treasury Note, 2.625%, 6/30/2014 |
1,017,812 | ||||
| 2,670,000 | U.S. Treasury Note, 2.625%, 7/31/2014 |
2,714,640 | ||||
| 3,810,000 | U.S. Treasury Note, 2.750%, 2/15/2019 |
3,635,871 | ||||
| 22,870,000 | U.S. Treasury Note, 3.125%, 5/15/2019 |
22,503,714 | ||||
| 3,545,000 | U.S. Treasury Note, 3.250%, 7/31/2016 |
3,628,088 | ||||
| 2,205,000 | U.S. Treasury Note, 3.625%, 1/15/2010 |
2,227,050 | ||||
| 3,105,000 | U.S. Treasury Note, 3.625%, 8/15/2019 |
3,186,991 | ||||
| Principal Amount |
Description | Value (†) | ||||
| Treasuries — continued | ||||||
| $ | 1,060,000 | U.S. Treasury Note, 3.750%, 11/15/2018 |
$ | 1,096,852 | ||
| 3,005,000 | U.S. Treasury Note, 4.625%, 2/15/2017 |
3,326,862 | ||||
| 67,665,170 | ||||||
| Wireless — 2.0% | ||||||
| 10,000 | Nextel Communications, Inc., Series D, 7.375%, 8/01/2015 |
8,975 | ||||
| 15,000 | Nextel Communications, Inc., Series F, 5.950%, 3/15/2014 |
13,275 | ||||
| 1,385,000 | SK Telecom Co., Ltd., 144A, 6.625%, 7/20/2027 |
1,467,921 | ||||
| 2,695,000 | Sprint Capital Corp., 6.875%, 11/15/2028 |
2,250,325 | ||||
| 1,420,000 | True Move Co. Ltd., 144A, 10.750%, 12/16/2013 |
1,363,200 | ||||
| 5,103,696 | ||||||
| Wirelines — 4.7% | ||||||
| 1,095,000 | Axtel SAB de CV, 144A, 9.000%, 9/22/2019 |
1,111,425 | ||||
| 3,428,000 | Embarq Corp., 7.995%, 6/01/2036 |
3,581,622 | ||||
| 1,275,000 | Frontier Communications Corp., 7.875%, 1/15/2027 |
1,163,437 | ||||
| 210,000 | Qwest Capital Funding, Inc., 6.500%, 11/15/2018 |
172,725 | ||||
| 460,000 | Qwest Corp., 6.875%, 9/15/2033 |
372,600 | ||||
| 850,000 | Qwest Corp., 7.250%, 9/15/2025 |
733,125 | ||||
| 255,000 | Qwest Corp., 7.250%, 10/15/2035 |
205,275 | ||||
| 1,790,000 | Qwest Corp., 7.500%, 6/15/2023 |
1,628,900 | ||||
| 590,000 | Telecom Italia Capital SA, 6.000%, 9/30/2034 |
575,173 | ||||
| 1,700,000 | Telecom Italia Capital SA, 7.200%, 7/18/2036 |
1,920,781 | ||||
| 600,000 | Telemar Norte Leste SA, 144A, 9.500%, 4/23/2019 |
717,000 | ||||
| 12,182,063 | ||||||
| Total Bonds and Notes (Identified Cost $235,840,892) | 249,607,477 | |||||
| Shares |
||||||
| Preferred Stocks — 0.3% | ||||||
| Diversified Financial Services — 0.1% | ||||||
| 532 | Preferred Blocker, Inc., 7.000%, 144A | 309,375 | ||||
| Thrifts & Mortgage Finance — 0.2% | ||||||
| 256,000 | Federal National Mortgage Association, 6.750%(e)(f) |
401,920 | ||||
| 4,200 | Federal National Mortgage Association, 8.250%(e)(f) |
6,762 | ||||
| 408,682 | ||||||
| Total Preferred Stocks (Identified Cost $1,717,444) | 718,057 | |||||
See accompanying notes to financial statements.
21
Table of Contents
LOOMIS SAYLES CORE PLUS BOND FUND — PORTFOLIO OF INVESTMENTS (continued)
Investments as of September 30, 2009
| Principal Amount (‡) |
Description | Value (†) | |||||
| Short-Term Investments — 4.5% | |||||||
| $ | 11,737,039 | Tri-Party Repurchase Agreement with Fixed Income Clearing Corporation, dated 9/30/2009 at 0.000% to be repurchased at $11,737,039 on 10/01/2009, collateralized by $11,870,000 Federal Home Loan Bank, 2.900% due 7/02/2013 valued at $11,973,863, including accrued interest (Note 2g of Notes to Financial Statements) (Identified Cost $11,737,039) | $ | 11,737,039 | |||
| Total Investments — 101.1% (Identified Cost $249,295,375)(a) |
262,062,573 | ||||||
| Other assets less liabilities — (1.1)% | (2,780,871 | ) | |||||
| Net Assets — 100.0% | $ | 259,281,702 | |||||
| (†) | See Note 2a of Notes to Financial Statements. | ||||||
| (a) | Federal Tax Information: At September 30, 2009, the net unrealized appreciation on investments based on a cost of $250,658,047 for federal income tax purposes was as follows: |
||||||
| Aggregate gross unrealized appreciation for all investments in which there is an excess of value over tax cost | $ | 14,511,656 | |||||
| Aggregate gross unrealized depreciation for all investments in which there is an excess of tax cost over value | (3,107,130 | ) | |||||
| Net unrealized appreciation | $ | 11,404,526 | |||||
| (b) | Variable rate security. Rate as of September 30, 2009 is disclosed. | ||||||
| (c) | Illiquid security. At September 30, 2009, the value of this security amounted to $1,177,523 or 0.5% of net assets. | ||||||
| (d) | The Fund’s investment in mortgage related securities of the Federal Home Loan Mortgage Corporation, Federal National Mortgage Association and Government National Mortgage Association are interests in separate pools of mortgages. All separate investments in securities of each issuer which have the same coupon rate have been aggregated for the purpose of presentation in the Portfolio of Investments. | ||||||
| (e) | Non-income producing security. | ||||||
| (f) | Future dividend payments have been eliminated as the issuer has been placed in conservatorship. | ||||||
| 144A | Securities exempt from registration under Rule 144A of the Securities Act of 1933. These securities may be resold in transactions exempt from registration, normally to qualified institutional buyers. At September 30, 2009, the value of these securities amounted to $24,479,902 or 9.4% of net assets. | ||||||
| ABS | Asset-Backed Securities | ||||||
| ARM | Adjustable Rate Mortgage | ||||||
| FDIC | Federal Deposit Insurance Corporation | ||||||
| FHLMC | Federal Home Loan Mortgage Corporation | ||||||
| FNMA | Federal National Mortgage Association | ||||||
| GMTN | Global Medium Term Note | ||||||
| GNMA | Government National Mortgage Association | ||||||
| MTN | Medium Term Note | ||||||
Industry Summary at September 30, 2009 (Unaudited)
| Treasuries | 26.1 | % | |
| Mortgage Related | 16.9 | ||
| Commercial Mortgage-Backed Securities | 7.2 | ||
| Banking | 6.1 | ||
| Wirelines | 4.7 | ||
| Diversified Manufacturing | 2.7 | ||
| Food & Beverage | 2.6 | ||
| Electric | 2.4 | ||
| Technology | 2.1 | ||
| Media Cable | 2.1 | ||
| Non-Captive Diversified | 2.0 | ||
| Wireless | 2.0 | ||
| Other Investments, less than 2% each | 19.7 | ||
| Short-Term Investments | 4.5 | ||
| Total Investments | 101.1 | ||
| Other assets less liabilities | (1.1 | ) | |
| Net Assets | 100.0 | % | |
See accompanying notes to financial statements.
22
Table of Contents
LOOMIS SAYLES HIGH INCOME FUND — PORTFOLIO OF INVESTMENTS
Investments as of September 30, 2009
| Principal Amount (‡) |
Description | Value (†) | ||||
| Bonds and Notes — 89.9% of Net Assets | ||||||
| ABS Car Loan — 0.1% | ||||||
| $ | 85,000 | Capital One Auto Finance Trust, Series 2006-C, Class A4, 0.273%, 5/15/2013(b) |
$ | 83,382 | ||
| 100,000 | Capital One Auto Finance Trust, Series 2007-C, Class A4, 5.230%, 7/15/2014 |
97,803 | ||||
| 181,185 | ||||||
| ABS Credit Card — 0.1% | ||||||
| 100,000 | HSBC Private Label Credit Card Master Note Trust, Series 2007-1, Class B, 0.353%, 12/16/2013(b) |
96,345 | ||||
| ABS Home Equity — 1.3% | ||||||
| 117,055 | Citigroup Mortgage Loan Trust, Inc., Series 2006-NC1, Class A2B, 0.356%, 8/25/2036(b) |
96,860 | ||||
| 606,666 | Citigroup Mortgage Loan Trust, Inc., Series 2006-WFH2, Class A2A, 0.396%, 8/25/2036(b) |
398,231 | ||||
| 351,975 | HSI Asset Securitization Corp. Trust, Series 2006-HE2, Class 2A1, 0.296%, 12/25/2036(b) |
237,652 | ||||
| 528,673 | Long Beach Mortgage Loan Trust, Series 2006-WL2, Class 2A3, 0.446%, 1/25/2036(b) |
353,210 | ||||
| 188,570 | Residential Asset Mortgage Products, Inc. Series 2006-RZ3, Class A2, 0.406%, 8/25/2036(b) |
149,117 | ||||
| 2,000,000 | Residential Asset Mortgage Products, Inc., Series 2006-RZ5, Class A2, 0.426%, 8/25/2046(b) |
1,195,356 | ||||
| 2,430,426 | ||||||
| Aerospace & Defense — 2.6% | ||||||
| 1,590,000 | BE Aerospace, Inc., 8.500%, 7/01/2018 |
1,629,750 | ||||
| 600,000 | Bombardier, Inc., 144A, 6.300%, 5/01/2014 |
579,000 | ||||
| 2,900,000 | Bombardier, Inc., 144A, 7.450%, 5/01/2034 |
2,530,250 | ||||
| 4,739,000 | ||||||
| Airlines — 0.3% | ||||||
| 49,894 | Continental Airlines, Inc., Series 1997-4, Class 4B, 6.900%, 7/02/2018 |
43,907 | ||||
| 310,216 | Continental Airlines, Inc., Series 2000-2, Class A-1, 7.707%, 10/02/2022 |
288,501 | ||||
| 180,000 | Continental Airlines, Inc., Series 2007-1, Class B, 6.903%, 4/19/2022 |
154,800 | ||||
| 487,208 | ||||||
| Automotive — 2.5% | ||||||
| 450,000 | FCE Bank PLC, EMTN, 7.875%, 2/15/2011 (GBP) |
704,784 | ||||
| 420,000 | Ford Motor Co., 6.375%, 2/01/2029 |
302,400 | ||||
| 65,000 | Ford Motor Co., 6.625%, 2/15/2028 |
46,800 | ||||
| 1,220,000 | Ford Motor Co., 6.625%, 10/01/2028 |
878,400 | ||||
| 40,000 | Ford Motor Co., 7.500%, 8/01/2026 |
29,200 | ||||
| 130,000 | Ford Motor Credit Co. LLC, 7.000%, 10/01/2013 |
122,020 | ||||
| 105,000 | Ford Motor Credit Co. LLC, 7.250%, 10/25/2011 |
101,977 | ||||
| Principal Amount (‡) |
Description | Value (†) | ||||
| Automotive — continued | ||||||
| $ | 310,000 | Ford Motor Credit Co. LLC, 7.500%, 8/01/2012 |
$ | 297,652 | ||
| 1,320,000 | Ford Motor Credit Co. LLC, 8.000%, 6/01/2014 |
1,268,516 | ||||
| 150,000 | Ford Motor Credit Co. LLC, 8.000%, 12/15/2016 |
139,165 | ||||
| 635,000 | Goodyear Tire & Rubber Co. (The), 7.000%, 3/15/2028 |
552,450 | ||||
| 225,000 | Goodyear Tire & Rubber Co. (The), 10.500%, 5/15/2016 |
244,125 | ||||
| 4,687,489 | ||||||
| Banking — 0.3% | ||||||
| 290,000 | Citigroup, Inc., 5.000%, 9/15/2014 |
275,959 | ||||
| 200,000 | Merrill Lynch & Co., Inc., 7.750%, 5/14/2038 |
225,384 | ||||
| 501,343 | ||||||
| Building Materials — 0.9% | ||||||
| 750,000 | Masco Corp., 4.800%, 6/15/2015 |
688,259 | ||||
| 50,000 | Masco Corp., 6.500%, 8/15/2032 |
40,456 | ||||
| 345,000 | Masco Corp., 7.750%, 8/01/2029 |
311,932 | ||||
| 625,000 | USG Corp., 6.300%, 11/15/2016 |
531,250 | ||||
| 65,000 | USG Corp., 144A, 9.750%, 8/01/2014 |
67,925 | ||||
| 1,639,822 | ||||||
| Chemicals — 0.3% | ||||||
| 855,000 | Hercules, Inc., Subordinated Note, 6.500%, 6/30/2029 |
475,594 | ||||
| Collateralized Mortgage Obligations — 0.6% | ||||||
| 636,066 | Lehman Mortgage Trust, Series 2006-6, Class 5A1, 0.746%, 12/25/2036(b) |
458,308 | ||||
| 561,254 | Residential Accredit Loans, Inc., Series 2005-QA13, Class 2A1, 5.813%, 12/25/2035(b) |
249,690 | ||||
| 226,043 | Structured Adjustable Rate Mortgage Loan Trust, Series 2007-7, Class 1A1, 0.546%, 8/25/2037(b) |
125,726 | ||||
| 498,224 | WaMu Mortgage Pass Through Certificates, Series 2006-AR10, Class 1A1, 5.922%, 9/25/2036(b) |
371,967 | ||||
| 1,205,691 | ||||||
| Commercial Mortgage-Backed Securities — 3.1% | ||||||
| 100,000 | Bear Stearns Commercial Mortgage Securities, Series 2006-PW13, Class A4, 5.540%, 9/11/2041 |
95,450 | ||||
| 100,000 | Bear Stearns Commercial Mortgage Securities, Series 2007-PW15, Class A4, 5.331%, 2/11/2044 |
90,018 | ||||
| 550,000 | Citigroup Commercial Mortgage Trust, Series 2006-C5, Class A4, 5.431%, 10/15/2049 |
497,045 | ||||
| 800,000 | Commercial Mortgage Pass Through Certificates, Series 2007-C9, Class A4, 5.816%, 12/10/2049(b) |
720,892 | ||||
See accompanying notes to financial statements.
23
Table of Contents
LOOMIS SAYLES HIGH INCOME FUND — PORTFOLIO OF INVESTMENTS (continued)
Investments as of September 30, 2009
| Principal Amount (‡) |
Description | Value (†) | ||||
| Commercial Mortgage-Backed Securities — continued | ||||||
| $ | 100,000 | Credit Suisse Mortgage Capital Certificates, Series 2007-C4, Class A4, 5.809%, 9/15/2039(b) |
$ | 79,223 | ||
| 650,000 | Greenwich Capital Commercial Funding Corp., Series 2007-GG11, Class A4, 5.736%, 12/10/2049 |
585,283 | ||||
| 1,375,000 | Greenwich Capital Commercial Funding Corp., Series 2007-GG9, Class A4, 5.444%, 3/10/2039 |
1,218,543 | ||||
| 520,000 | JPMorgan Chase Commercial Mortgage Securities Corp., Series 2007-LD11, Class A4, 5.818%, 6/15/2049(b) |
454,517 | ||||
| 100,000 | JPMorgan Chase Commercial Mortgage Securities Corp., Series 2007-LDPX, Class A3, 5.420%, 1/15/2049 |
84,295 | ||||
| 866,149 | Lehman XS Trust, Series 2007-10H, Class 1A11, 0.366%, 7/25/2037(b) |
389,767 | ||||
| 300,000 | Morgan Stanley Capital I, Series 2007-T27, Class A4, 5.650%, 6/11/2042(b) |
283,105 | ||||
| 400,000 | Morgan Stanley Capital I, Series 2008-T29, Class A4, 6.280%, 1/11/2043(b) |
388,015 | ||||
| 300,000 | Wachovia Bank Commercial Mortgage Trust, Series 2006-C23, Class A4, 5.418%, 1/15/2045(b) |
273,121 | ||||
| 645,000 | Wachovia Bank Commercial Mortgage Trust, Series 2006-C29, Class A4, 5.308%, 11/15/2048 |
580,775 | ||||
| 5,740,049 | ||||||
| Construction Machinery — 1.4% | ||||||
| 40,000 | Joy Global, Inc., 6.625%, 11/15/2036 |
37,271 | ||||
| 350,000 | RSC Equipment Rental, Inc., 9.500%, 12/01/2014 |
337,750 | ||||
| 165,000 | United Rentals North America, Inc., Convertible, 1.875%, 10/15/2023 |
155,925 | ||||
| 2,245,000 | United Rentals North America, Inc., 7.000%, 2/15/2014 |
1,953,150 | ||||
| 15,000 | United Rentals North America, Inc., 7.750%, 11/15/2013 |
13,500 | ||||
| 150,000 | United Rentals North America, Inc., 144A, 10.875%, 6/15/2016 |
160,500 | ||||
| 2,658,096 | ||||||
| Consumer Products — 0.1% | ||||||
| 260,000 | Acco Brands Corp., 7.625%, 8/15/2015 |
215,800 | ||||
| Diversified Manufacturing — 0.1% | ||||||
| 150,000 | Trinity Industries, Inc., Convertible, 3.875%, 6/01/2036 |
110,625 | ||||
| Electric — 4.4% | ||||||
| 35,000 | AES Corp. (The), 8.000%, 10/15/2017 |
35,219 | ||||
| 2,740,000 | AES Corp. (The), 8.000%, 6/01/2020 |
2,719,450 | ||||
| 213,669 | AES Ironwood LLC, 8.857%, 11/30/2025 |
196,041 | ||||
| 23,517 | AES Red Oak LLC, Series A, 8.540%, 11/30/2019 |
22,165 | ||||
| Principal Amount (‡) |
Description | Value (†) | ||||
| Electric — continued | ||||||
| $ | 555,000 | CMS Energy Corp., Convertible, 5.500%, 6/15/2029 |
$ | 634,781 | ||
| 220,000 | CMS Energy Corp., 8.750%, 6/15/2019 |
239,314 | ||||
| 375,000 | Dynegy Holdings, Inc., 7.125%, 5/15/2018 |
288,750 | ||||
| 180,000 | Dynegy Holdings, Inc., 7.625%, 10/15/2026 |
123,300 | ||||
| 815,000 | Dynegy Holdings, Inc., 7.750%, 6/01/2019 |
694,788 | ||||
| 2,230,000 | Edison Mission Energy, 7.625%, 5/15/2027 |
1,594,450 | ||||
| 140,000 | NGC Corp. Capital Trust I, Series B, 8.316%, 6/01/2027 |
63,000 | ||||
| 775,000 | NRG Energy, Inc., 7.375%, 1/15/2017 |
749,812 | ||||
| 195,000 | TXU Corp., Series P, 5.550%, 11/15/2014 |
133,077 | ||||
| 1,015,000 | TXU Corp., Series Q, 6.500%, 11/15/2024 |
469,458 | ||||
| 370,000 | TXU Corp., Series R, 6.550%, 11/15/2034 |
166,430 | ||||
| 8,130,035 | ||||||
| Food & Beverage — 1.5% | ||||||
| 845,000 | ARAMARK Corp., 8.500%, 2/01/2015 |
852,394 | ||||
| 710,000 | Aramark Services, Inc., 5.000%, 6/01/2012 |
670,950 | ||||
| 600,000 | CCL Finance Ltd., 144A, 9.500%, 8/15/2014 |
637,500 | ||||
| 570,000 | Tyson Foods, Inc., 7.850%, 4/01/2016 |
581,400 | ||||
| 2,742,244 | ||||||
| Government Guaranteed — 0.1% | ||||||
| 275,000 | Canada Housing Trust, 3.550%, 9/15/2013 (CAD) |
267,127 | ||||
| Government Owned — No Guarantee — 0.1% | ||||||
| 160,000 | Federal Home Loan Mortgage Corp., 4.625%, 10/25/2012(g) |
173,888 | ||||
| Healthcare — 6.4% | ||||||
| 660,000 | Affymetrix, Inc., Convertible, 3.500%, 1/15/2038 |
531,300 | ||||
| 105,000 | Boston Scientific Corp., 6.400%, 6/15/2016 |
106,444 | ||||
| 95,000 | Boston Scientific Corp., 7.000%, 11/15/2035 |
87,044 | ||||
| 385,000 | CHS/Community Health Systems, Inc., 8.875%, 7/15/2015 |
394,625 | ||||
| 495,000 | HCA, Inc., 5.750%, 3/15/2014 |
436,837 | ||||
| 155,000 | HCA, Inc., 6.250%, 2/15/2013 |
148,025 | ||||
| 10,000 | HCA, Inc., 6.300%, 10/01/2012 |
9,600 | ||||
| 50,000 | HCA, Inc., 6.375%, 1/15/2015 |
44,500 | ||||
| 205,000 | HCA, Inc., 6.500%, 2/15/2016 |
181,937 | ||||
See accompanying notes to financial statements.
24
Table of Contents
LOOMIS SAYLES HIGH INCOME FUND — PORTFOLIO OF INVESTMENTS (continued)
Investments as of September 30, 2009
| Principal Amount (‡) |
Description | Value (†) | ||||
| Healthcare — continued | ||||||
| $ | 35,000 | HCA, Inc., 7.050%, 12/01/2027 |
$ | 26,545 | ||
| 1,070,000 | HCA, Inc., 7.190%, 11/15/2015 |
991,080 | ||||
| 630,000 | HCA, Inc., 7.500%, 12/15/2023 |
508,579 | ||||
| 700,000 | HCA, Inc., 7.500%, 11/06/2033 |
541,644 | ||||
| 40,000 | HCA, Inc., 7.690%, 6/15/2025 |
32,482 | ||||
| 480,000 | HCA, Inc., 8.360%, 4/15/2024 |
390,594 | ||||
| 670,000 | HCA, Inc., MTN, 7.580%, 9/15/2025 |
542,057 | ||||
| 1,685,000 | HCA, Inc., MTN, 7.750%, 7/15/2036 |
1,320,695 | ||||
| 1,520,000 | Hologic, Inc., Convertible, (Step to Zero Coupon on 12/15/2013), 2.000%, 12/15/2037(c) |
1,242,600 | ||||
| 40,000 | Life Technologies Corp., Convertible, 1.500%, 2/15/2024 |
43,700 | ||||
| 1,368,000 | Omnicare, Inc., Convertible, 3.250%, 12/15/2035 |
1,049,940 | ||||
| 380,000 | Psychiatric Solutions, Inc., 144A, 7.750%, 7/15/2015 |
357,200 | ||||
| 435,000 | Psychiatric Solutions, Inc., 7.750%, 7/15/2015 |
419,775 | ||||
| 255,000 | Tenet Healthcare Corp., 6.875%, 11/15/2031 |
198,900 | ||||
| 190,000 | Tenet Healthcare Corp., 7.375%, 2/01/2013 |
188,100 | ||||
| 1,833,000 | Tenet Healthcare Corp., 9.250%, 2/01/2015 |
1,913,194 | ||||
| 60,000 | Tenet Healthcare Corp., 9.875%, 7/01/2014 |
61,650 | ||||
| 11,769,047 | ||||||
| Home Construction — 3.9% | ||||||
| 755,000 | D.R. Horton, Inc., 6.500%, 4/15/2016 |
742,731 | ||||
| 620,000 | D.R. Horton, Inc., Guaranteed Note, 5.625%, 1/15/2016 |
579,700 | ||||
| 410,000 | Desarrolladora Homex SAB de CV, 7.500%, 9/28/2015 |
402,825 | ||||
| 315,000 | KB Home, 5.750%, 2/01/2014 |
302,400 | ||||
| 360,000 | KB Home, Guaranteed Note, 5.875%, 1/15/2015 |
339,300 | ||||
| 1,790,000 | KB Home, Guaranteed Note, 7.250%, 6/15/2018 |
1,745,250 | ||||
| 580,000 | Lennar Corp., Series B, 5.600%, 5/31/2015 |
535,050 | ||||
| 830,000 | Lennar Corp., Series B, 6.500%, 4/15/2016 |
780,200 | ||||
| 1,325,000 | Pulte Homes, Inc., 6.000%, 2/15/2035 |
1,000,375 | ||||
| 495,000 | Pulte Homes, Inc., 6.375%, 5/15/2033 |
381,150 | ||||
| 380,000 | Pulte Homes, Inc., 7.875%, 6/15/2032 |
334,400 | ||||
| 7,143,381 | ||||||
| Principal Amount (‡) |
Description | Value (†) | ||||
| Independent Energy — 6.7% | ||||||
| $ | 475,000 | Chesapeake Energy Corp., Convertible, 2.250%, 12/15/2038 |
$ | 355,063 | ||
| 40,000 | Chesapeake Energy Corp., 6.375%, 6/15/2015 |
37,150 | ||||
| 3,295,000 | Chesapeake Energy Corp., 6.500%, 8/15/2017 |
3,023,162 | ||||
| 790,000 | Chesapeake Energy Corp., 6.875%, 11/15/2020 |
703,100 | ||||
| 620,000 | Connacher Oil and Gas Ltd., 144A, 10.250%, 12/15/2015 |
505,300 | ||||
| 500,000 | Connacher Oil and Gas Ltd., 144A, 11.750%, 7/15/2014 |
532,500 | ||||
| 825,000 | Hilcorp Energy I LP, 144A, 7.750%, 11/01/2015 |
779,625 | ||||
| 435,000 | Penn Virginia Corp., Convertible, 4.500%, 11/15/2012 |
391,500 | ||||
| 790,000 | PetroHawk Energy Corp., 7.875%, 6/01/2015 |
778,150 | ||||
| 355,000 | Pioneer Natural Resources Co., 5.875%, 7/15/2016 |
328,121 | ||||
| 200,000 | Pioneer Natural Resources Co., 6.875%, 5/01/2018 |
190,863 | ||||
| 3,127,000 | Pioneer Natural Resources Co., 7.200%, 1/15/2028 |
2,713,992 | ||||
| 1,260,000 | SandRidge Energy, Inc., 144A, 8.000%, 6/01/2018 |
1,212,750 | ||||
| 1,065,000 | Swift Energy Co., 7.125%, 6/01/2017 |
926,550 | ||||
| 12,477,826 | ||||||
| Industrial Other — 0.2% | ||||||
| 245,000 | Incyte Corp., Convertible, 3.500%, 2/15/2011 |
238,875 | ||||
| 140,000 | Ranhill Labuan Ltd., 144A, 12.500%, 10/26/2011 |
112,000 | ||||
| 350,875 | ||||||
| Lodging — 4.1% | ||||||
| 170,000 | Felcor Lodging Trust, Inc., 144A, 10.000%, 10/01/2014 |
164,475 | ||||
| 615,000 | Host Hotels & Resorts LP, 6.375%, 3/15/2015 |
582,713 | ||||
| 55,000 | Host Hotels & Resorts LP, 6.750%, 6/01/2016 |
52,250 | ||||
| 80,000 | Host Hotels & Resorts LP, 6.875%, 11/01/2014 |
78,200 | ||||
| 105,000 | Host Hotels & Resorts LP, Convertible, 144A, 3.250%, 4/15/2024 |
105,000 | ||||
| 1,690,000 | Host Hotels & Resorts, Inc., Convertible, 144A, 2.625%, 4/15/2027 |
1,552,687 | ||||
| 135,000 | Royal Caribbean Cruises Ltd., 6.875%, 12/01/2013 |
125,888 | ||||
| 2,000,000 | Royal Caribbean Cruises Ltd., 7.000%, 6/15/2013 |
1,905,000 | ||||
| 670,000 | Royal Caribbean Cruises Ltd., 7.250%, 6/15/2016 |
619,750 | ||||
| 2,590,000 | Starwood Hotels & Resorts Worldwide, Inc., 6.750%, 5/15/2018 |
2,444,312 | ||||
| 7,630,275 | ||||||
See accompanying notes to financial statements.
25
Table of Contents
LOOMIS SAYLES HIGH INCOME FUND — PORTFOLIO OF INVESTMENTS (continued)
Investments as of September 30, 2009
| Principal Amount (‡) |
Description | Value (†) | ||||
| Media Cable — 2.1% | ||||||
| $ | 1,114,000 | CSC Holdings, Inc., Senior Note, 7.625%, 7/15/2018 |
$ | 1,130,710 | ||
| 250,000 | CSC Holdings, Inc., 7.875%, 2/15/2018 |
255,000 | ||||
| 180,000 | CSC Holdings, Inc., 144A, 8.625%, 2/15/2019 |
190,350 | ||||
| 1,570,000 | Virgin Media Finance PLC, 8.750%, 4/15/2014 |
1,601,400 | ||||
| 670,000 | Virgin Media Finance PLC, 9.500%, 8/15/2016 |
705,175 | ||||
| 3,882,635 | ||||||
| Media Non-Cable — 1.2% | ||||||
| 175,000 | Intelsat Corp., 6.875%, 1/15/2028 |
145,250 | ||||
| 1,765,000 | Intelsat Subsidiary Holding Co. Ltd., 8.500%, 1/15/2013 |
1,787,062 | ||||
| 160,000 | Intelsat Subsidiary Holding Co. Ltd., 144A, 8.875%, 1/15/2015 |
162,000 | ||||
| 85,000 | R.H. Donnelley Corp., 6.875%, 1/15/2013(d) |
4,888 | ||||
| 25,000 | R.H. Donnelley Corp., Series A-1, 6.875%, 1/15/2013(d) |
1,438 | ||||
| 160,000 | R.H. Donnelley Corp., Series A-2, 6.875%, 1/15/2013(d) |
9,200 | ||||
| 615,000 | R.H. Donnelley Corp., Series A-3, 8.875%, 1/15/2016(d) |
35,362 | ||||
| 155,000 | R.H. Donnelley Corp., Series A-4, 8.875%, 10/15/2017(d) |
8,913 | ||||
| 2,154,113 | ||||||
| Metals & Mining — 1.8% | ||||||
| 355,000 | ArcelorMittal, 9.850%, 6/01/2019 |
419,895 | ||||
| 245,000 | Steel Dynamics, Inc., Convertible, 5.125%, 6/15/2014 |
289,100 | ||||
| 410,000 | Steel Dynamics, Inc., 6.750%, 4/01/2015 |
392,575 | ||||
| 580,000 | Steel Dynamics, Inc., 7.375%, 11/01/2012 |
585,800 | ||||
| 1,145,000 | Steel Dynamics, Inc., 144A, 8.250%, 4/15/2016 |
1,150,725 | ||||
| 355,000 | United States Steel Corp., 6.050%, 6/01/2017 |
331,567 | ||||
| 125,000 | United States Steel Corp., 7.000%, 2/01/2018 |
120,047 | ||||
| 3,289,709 | ||||||
| Non-Captive Consumer — 2.2% | ||||||
| 60,000 | SLM Corp., MTN, 5.050%, 11/14/2014 |
44,106 | ||||
| 40,000 | SLM Corp., Series A, MTN, 4.500%, 7/26/2010 |
38,867 | ||||
| 20,000 | SLM Corp., Series A, MTN, 5.000%, 10/01/2013 |
15,921 | ||||
| 10,000 | SLM Corp., Series A, MTN, 5.000%, 6/15/2018 |
6,271 | ||||
| 4,260,000 | SLM Corp., Series A, MTN, 5.375%, 5/15/2014 |
3,260,510 | ||||
| 5,000 | SLM Corp., Series A, MTN, 5.625%, 8/01/2033 |
3,138 | ||||
| Principal Amount (‡) |
Description | Value (†) | |||
| Non-Captive Consumer — continued | |||||
| 735,000 | SLM Corp., Series A, MTN, 6.500%, 6/15/2010 (NZD)(e)(f) |
$ | 497,545 | ||
| 245,000 | SLM Corp., Series A, MTN, 8.450%, 6/15/2018 |
195,387 | |||
| 4,061,745 | |||||
| Non-Captive Diversified — 2.3% | |||||
| 1,300,000 | General Electric Capital Corp., Series A, GMTN, 2.960%, 5/18/2012 (SGD) |
877,120 | |||
| 66,000 | GMAC, Inc., 144A, 5.375%, 6/06/2011 |
60,885 | |||
| 172,000 | GMAC, Inc., 144A, 5.750%, 9/27/2010 |
165,980 | |||
| 412,000 | GMAC, Inc., 144A, 6.000%, 4/01/2011 |
386,250 | |||
| 398,000 | GMAC, Inc., 144A, 6.000%, 12/15/2011 |
368,150 | |||
| 208,000 | GMAC, Inc., 144A, 6.625%, 5/15/2012 |
191,360 | |||
| 2,041,000 | GMAC, Inc., 144A, 6.750%, 12/01/2014 |
1,734,850 | |||
| 24,000 | GMAC, Inc., 144A, 8.000%, 11/01/2031 |
19,320 | |||
| 590,000 | General Motors Acceptance Corp. of Canada, EMTN, 7.125%, 9/13/2011 (AUD) |
478,858 | |||
| 80,000 | iStar Financial, Inc., 5.850%, 3/15/2017 |
41,800 | |||
| 10,000 | iStar Financial, Inc., 5.875%, 3/15/2016 |
5,500 | |||
| 15,000 | iStar Financial, Inc., Series B, 5.950%, 10/15/2013 |
8,550 | |||
| 4,338,623 | |||||
| Oil Field Services — 1.3% | |||||
| 490,000 | Basic Energy Services, Inc., 7.125%, 4/15/2016 |
384,650 | |||
| 380,000 | Basic Energy Services, Inc., 144A, 11.625%, 8/01/2014 |
402,800 | |||
| 350,000 | Compagnie Generale de Geophysique-Veritas, 144A, 9.500%, 5/15/2016 |
370,125 | |||
| 170,000 | Complete Production Services, Inc., 8.000%, 12/15/2016 |
154,700 | |||
| 30,000 | Key Energy Services, Inc., 8.375%, 12/01/2014 |
28,500 | |||
| 1,052,000 | North American Energy Partners, Inc., 8.750%, 12/01/2011 |
1,030,960 | |||
| 2,371,735 | |||||
| Packaging — 0.1% | |||||
| 175,000 | Owens-Illinois, Inc., Senior Note, 7.800%, 5/15/2018 |
175,438 | |||
| Paper — 2.9% | |||||
| 340,000 | Georgia-Pacific Corp., 7.250%, 6/01/2028 |
302,600 | |||
| 160,000 | Georgia-Pacific Corp., 7.375%, 12/01/2025 |
144,000 | |||
| 1,071,000 | Georgia-Pacific Corp., 7.750%, 11/15/2029 |
985,320 | |||
| 815,000 | Georgia-Pacific Corp., 8.000%, 1/15/2024 |
806,850 | |||
See accompanying notes to financial statements.
26
Table of Contents
LOOMIS SAYLES HIGH INCOME FUND — PORTFOLIO OF INVESTMENTS (continued)
Investments as of September 30, 2009
| Principal Amount (‡) |
Description | Value (†) | ||||
| Paper — continued | ||||||
| $ | 2,305,000 | Georgia-Pacific Corp., 8.875%, 5/15/2031 |
$ | 2,328,050 | ||
| 35,000 | Georgia-Pacific LLC, 144A, 7.125%, 1/15/2017 |
34,212 | ||||
| 200,000 | Georgia-Pacific LLC, 9.500%, 12/01/2011 |
213,000 | ||||
| 485,000 | International Paper Co., 5.250%, 4/01/2016 |
485,239 | ||||
| 5,299,271 | ||||||
| Pharmaceuticals — 5.0% | ||||||
| 2,340,000 | Elan Finance PLC, 8.875%, 12/01/2013 |
2,357,550 | ||||
| 1,865,000 | Elan Finance PLC, Senior Note, 7.750%, 11/15/2011 |
1,899,969 | ||||
| 950,000 | Human Genome Sciences, Inc., Convertible, 2.250%, 10/15/2011 |
1,314,563 | ||||
| 840,000 | Human Genome Sciences, Inc., Convertible, 2.250%, 8/15/2012 |
1,046,850 | ||||
| 785,000 | Kendle International, Inc., Convertible, 3.375%, 7/15/2012 |
692,763 | ||||
| 1,521,000 | Nektar Therapeutics, Convertible, 3.250%, 9/28/2012 |
1,380,307 | ||||
| 505,000 | Valeant Pharmaceuticals International, Subordinated Note, Convertible, 4.000%, 11/15/2013 |
543,506 | ||||
| 9,235,508 | ||||||
| Pipelines — 1.7% | ||||||
| 2,285,000 | El Paso Corp., 6.950%, 6/01/2028 |
1,900,791 | ||||
| 225,000 | El Paso Corp., 7.000%, 6/15/2017 |
220,500 | ||||
| 405,000 | El Paso Corp., 7.420%, 2/15/2037 |
347,818 | ||||
| 110,000 | El Paso Corp., GMTN, 7.800%, 8/01/2031 |
100,883 | ||||
| 235,000 | El Paso Corp., GMTN, 8.050%, 10/15/2030 |
217,206 | ||||
| 130,000 | El Paso Natural Gas Co., 8.375%, 6/15/2032 |
156,077 | ||||
| 175,000 | Kinder Morgan, Inc., 6.500%, 9/01/2012 |
179,813 | ||||
| 3,123,088 | ||||||
| Refining — 0.4% | ||||||
| 150,000 | Petroplus Finance Ltd., 144A, 6.750%, 5/01/2014 |
140,438 | ||||
| 745,000 | Petroplus Finance Ltd., 144A, 7.000%, 5/01/2017 |
677,950 | ||||
| 818,388 | ||||||
| REITs — 0.3% | ||||||
| 195,000 | ProLogis, Convertible, 1.875%, 11/15/2037 |
166,481 | ||||
| 170,000 | ProLogis, Convertible, 2.250%, 4/01/2037 |
153,213 | ||||
| 100,000 | ProLogis, 5.625%, 11/15/2015 |
90,871 | ||||
| 45,000 | ProLogis, 5.750%, 4/01/2016 |
40,252 | ||||
| Principal Amount (‡) |
Description | Value (†) | ||||
| REITs — continued | ||||||
| $ | 80,000 | ProLogis, 6.625%, 5/15/2018 |
$ | 73,871 | ||
| 524,688 | ||||||
| Retailers — 2.5% | ||||||
| 250,000 | Dillard’s, Inc., 6.625%, 1/15/2018 |
190,000 | ||||
| 105,000 | Dillard’s, Inc., 7.130%, 8/01/2018 |
81,637 | ||||
| 545,000 | J.C. Penney Corp., Inc., Senior Note, 6.375%, 10/15/2036 |
449,625 | ||||
| 765,000 | Macy’s Retail Holdings, Inc., 5.900%, 12/01/2016 |
700,887 | ||||
| 510,000 | Macy’s Retail Holdings, Inc., 6.375%, 3/15/2037 |
401,800 | ||||
| 30,000 | Macy’s Retail Holdings, Inc., 6.790%, 7/15/2027 |
21,870 | ||||
| 210,000 | Macy’s Retail Holdings, Inc., 6.900%, 4/01/2029 |
165,662 | ||||
| 1,115,000 | Toys R Us Property Co. I LLC, 144A, 10.750%, 7/15/2017 |
1,198,625 | ||||
| 1,600,000 | Toys R Us, Inc., 7.375%, 10/15/2018 |
1,392,000 | ||||
| 20,000 | Toys R Us, Inc., 7.875%, 4/15/2013 |
19,200 | ||||
| 4,621,306 | ||||||
| Sovereigns — 1.9% | ||||||
| 423,500(††) | Mexican Fixed Rate Bonds, Series M-20, 8.000%, 12/07/2023 (MXN) |
3,076,862 | ||||
| 350,000 | New South Wales Treasury Corp., Series 10RG, 7.000%, 12/01/2010 (AUD)(g) |
318,070 | ||||
| 4,504,661 | Republic of Uruguay, 4.250%, 4/05/2027 (UYU) |
193,324 | ||||
| 3,588,256 | ||||||
| Supermarkets — 0.9% | ||||||
| 300,000 | American Stores Co., 8.000%, 6/01/2026 |
270,000 | ||||
| 750,000 | New Albertson’s, Inc., 7.450%, 8/01/2029 |
645,000 | ||||
| 190,000 | New Albertson’s, Inc., 7.750%, 6/15/2026 |
169,100 | ||||
| 130,000 | New Albertson’s, Inc., 8.000%, 5/01/2031 |
116,675 | ||||
| 735,000 | New Albertson’s, Inc., Series C, MTN, 6.625%, 6/01/2028 |
567,788 | ||||
| 1,768,563 | ||||||
| Supranational — 0.4% | ||||||
| 9,210,000,000 | European Investment Bank, EMTN, 144A, Zero Coupon, 4/24/2013 (IDR) |
678,290 | ||||
| 13,400,000 | International Bank for Reconstruction & Development, 9.500%, 5/27/2010 (ISK) |
87,375 | ||||
| 765,665 | ||||||
| Technology — 8.3% | ||||||
| 300,000 | Affiliated Computer Services, Inc., 5.200%, 6/01/2015 |
294,750 | ||||
| 1,090,000 | Alcatel-Lucent USA, Inc., 6.450%, 3/15/2029 |
829,763 | ||||
See accompanying notes to financial statements.
27
Table of Contents
LOOMIS SAYLES HIGH INCOME FUND — PORTFOLIO OF INVESTMENTS (continued)
Investments as of September 30, 2009
| Principal Amount (‡) |
Description | Value (†) | ||||
| Technology — continued | ||||||
| $ | 1,930,000 | Alcatel-Lucent USA, Inc., 6.500%, 1/15/2028 |
$ | 1,469,212 | ||
| 50,000 | Alcatel-Lucent USA, Inc., Series A, Convertible, 2.875%, 6/15/2023 |
49,188 | ||||
| 1,580,000 | Alcatel-Lucent USA, Inc., Series B, Convertible, 2.875%, 6/15/2025 |
1,319,300 | ||||
| 2,165,000 | Amkor Technology, Inc., 7.750%, 5/15/2013 |
2,165,000 | ||||
| 290,000 | Amkor Technology, Inc., 9.250%, 6/01/2016 |
298,700 | ||||
| 15,000 | Ciena Corp., Convertible, 0.250%, 5/01/2013 |
11,981 | ||||
| 535,000 | Ciena Corp., Convertible, 0.875%, 6/15/2017 |
368,481 | ||||
| 30,000 | Intel Corp., Convertible, 2.950%, 12/15/2035 |
26,775 | ||||
| 1,220,000 | Jabil Circuit, Inc., 8.250%, 3/15/2018 |
1,238,300 | ||||
| 345,000 | JDS Uniphase Corp., Convertible, 1.000%, 5/15/2026 |
289,800 | ||||
| 1,330,000 | Kulicke & Soffa Industries, Inc., Convertible, 0.875%, 6/01/2012 |
1,088,938 | ||||
| 285,000 | Kulicke & Soffa Industries, Inc., Convertible, 1.000%, 6/30/2010 |
270,394 | ||||
| 216,000 | Maxtor Corp., Subordinated Note, Convertible, 5.750%, 3/01/2012(f) |
196,560 | ||||
| 580,000 | Motorola, Inc., 6.500%, 9/01/2025 |
490,149 | ||||
| 1,000,000 | Motorola, Inc., 7.500%, 5/15/2025 |
900,000 | ||||
| 340,000 | Nortel Networks Capital Corp., 7.875%, 6/15/2026(d) |
190,400 | ||||
| 280,000 | Nortel Networks Corp., Convertible, 2.125%, 4/15/2014(d) |
154,000 | ||||
| 560,000 | Nortel Networks Ltd., 6.875%, 9/01/2023(d) |
156,800 | ||||
| 255,000 | Seagate Technology HDD Holdings, 6.375%, 10/01/2011 |
255,000 | ||||
| 1,805,000 | Seagate Technology HDD Holdings, 6.800%, 10/01/2016 |
1,656,087 | ||||
| 390,000 | Seagate Technology International, 144A, 10.000%, 5/01/2014 |
426,075 | ||||
| 820,000 | SunGard Data Systems, Inc., 9.125%, 8/15/2013 |
828,200 | ||||
| 355,000 | Xerox Capital Trust I, 8.000%, 2/01/2027 |
347,013 | ||||
| 15,320,866 | ||||||
| Textile — 0.1% | ||||||
| 375,000 | Jones Apparel Group, Inc., 6.125%, 11/15/2034 |
277,500 | ||||
| Transportation Services — 0.4% | ||||||
| 275,000 | APL Ltd., Senior Note, 8.000%, 1/15/2024(f) |
224,813 | ||||
| 640,000 | Overseas Shipholding Group, Senior Note, 7.500%, 2/15/2024 |
536,000 | ||||
| 760,813 | ||||||
| Treasuries — 1.9% | ||||||
| 3,360,000 | Canadian Government, 4.500%, 6/01/2015 (CAD) |
3,440,277 | ||||
| Principal Amount (‡) |
Description | Value (†) | ||||
| Wireless — 3.7% | ||||||
| $ | 130,000 | Crown Castle International Corp., 9.000%, 1/15/2015 |
$ | 136,175 | ||
| 1,443,000 | Nextel Communications, Inc., Series D, 7.375%, 8/01/2015 |
1,295,092 | ||||
| 944,000 | Nextel Communications, Inc., Series E, 6.875%, 10/31/2013 |
875,560 | ||||
| 1,080,000 | Nextel Communications, Inc., Series F, 5.950%, 3/15/2014 |
955,800 | ||||
| 80,000 | NII Holdings, Inc., 2.750%, 8/15/2025 |
78,500 | ||||
| 850,000 | NII Holdings, Inc., 3.125%, 6/15/2012 |
742,688 | ||||
| 2,061,000 | Sprint Capital Corp., 6.875%, 11/15/2028 |
1,720,935 | ||||
| 55,000 | Sprint Capital Corp., 6.900%, 5/01/2019 |
49,225 | ||||
| 20,000 | Sprint Capital Corp., 8.750%, 3/15/2032 |
18,900 | ||||
| 500,000 | True Move Co. Ltd., 144A, 10.375%, 8/01/2014 |
467,500 | ||||
| 600,000 | True Move Co. Ltd., 144A, 10.750%, 12/16/2013 |
576,000 | ||||
| 6,916,375 | ||||||
| Wirelines — 7.4% | ||||||
| 255,000 | Bell Canada, Series M-17, 6.100%, 3/16/2035 (CAD) |
222,420 | ||||
| 65,000 | Cincinnati Bell Telephone Co., 6.300%, 12/01/2028 |
48,425 | ||||
| 530,000 | Cincinnati Bell, Inc., 7.000%, 2/15/2015 |
514,100 | ||||
| 955,000 | Cincinnati Bell, Inc., 8.375%, 1/15/2014 |
959,775 | ||||
| 460,000 | Embarq Corp., 7.995%, 6/01/2036 |
480,614 | ||||
| 1,611,153 | FairPoint Communications, Inc., 13.125%, 4/02/2018(j) |
197,366 | ||||
| 95,000 | Frontier Communications Corp., 7.000%, 11/01/2025 |
80,988 | ||||
| 30,000 | Frontier Communications Corp., 7.125%, 3/15/2019 |
28,275 | ||||
| 1,245,000 | Frontier Communications Corp., 7.875%, 1/15/2027 |
1,136,062 | ||||
| 605,000 | Frontier Communications Corp., 9.000%, 8/15/2031 |
592,900 | ||||
| 80,000 | Hawaiian Telcom Communications, Inc., Series B, 12.500%, 5/01/2015(d) |
100 | ||||
| 2,235,000 | Level 3 Communications, Inc., Convertible, 3.500%, 6/15/2012 |
1,776,825 | ||||
| 459,000 | Level 3 Communications, Inc., Convertible, 5.250%, 12/15/2011 |
408,510 | ||||
| 815,000 | Level 3 Communications, Inc., Convertible, 144A 7.000%, 3/15/2015(f) |
863,900 | ||||
| 400,000 | Level 3 Communications, Inc., Convertible, 10.000%, 5/01/2011 |
395,000 | ||||
| 770,000 | Level 3 Financing, Inc., 8.750%, 2/15/2017 |
639,100 | ||||
| 495,000 | Level 3 Financing, Inc., 9.250%, 11/01/2014 |
436,219 | ||||
See accompanying notes to financial statements.
28
Table of Contents
LOOMIS SAYLES HIGH INCOME FUND — PORTFOLIO OF INVESTMENTS (continued)
Investments as of September 30, 2009
| Principal Amount (‡) |
Description | Value (†) | ||||
| Wirelines — continued | ||||||
| $ | 425,000 | Qwest Capital Funding, Inc., 6.500%, 11/15/2018 |
$ | 349,563 | ||
| 2,860,000 | Qwest Capital Funding, Inc., 7.750%, 2/15/2031 |
2,280,850 | ||||
| 1,445,000 | Qwest Capital Funding, Inc., Guaranteed Note, 6.875%, 7/15/2028 |
1,090,975 | ||||
| 275,000 | Qwest Capital Funding, Inc., Guaranteed Note, 7.625%, 8/03/2021 |
232,375 | ||||
| 10,000 | Qwest Corp., 6.875%, 9/15/2033 |
8,100 | ||||
| 975,000 | Windstream Corp., 144A, 7.875%, 11/01/2017 |
970,125 | ||||
| 13,712,567 | ||||||
| Total Bonds and Notes (Identified Cost $151,485,604) | 166,300,500 | |||||
| Bank Loans — 1.5% | ||||||
| Chemicals — 0.1% | ||||||
| 140,441 | Ashland Chemicals, Term Loan B, 7.650%, 5/13/2014(h) |
143,338 | ||||
| Diversified Manufacturing — 0.2% | ||||||
| 325,057 | CommScope, Inc., Term Loan B, 2.783%, 12/26/2014(h) |
317,437 | ||||
| Food & Beverage — 0.0% | ||||||
| 1,306 | Dole Food Co., Inc., Credit Link Deposit, 7.495%, 4/12/2013(h) |
1,320 | ||||
| 838 | Dole Food Co., Inc., Tranche B Term Loan, 8.000%, 4/12/2013(h) |
847 | ||||
| 4,108 | Dole Food Co., Inc., Tranche C Term Loan, 8.000%, 4/12/2013(h) |
4,153 | ||||
| 6,320 | ||||||
| Media Non-Cable — 0.3% | ||||||
| 975,889 | Idearc, Inc., Term Loan B, 6.250%, 11/17/2014(d)(h) |
412,723 | ||||
| 224,012 | Tribune Co., Term Loan X, 5.000%, 6/04/2009(d)(h)(l) |
108,787 | ||||
| 521,510 | ||||||
| Technology — 0.2% | ||||||
| 417,835 | Nuance Communications, Inc., Term Loan, 2.250%, 3/31/2013(h) |
399,158 | ||||
| 2,419 | Sungard Data Systems, Inc., Tranche A, 2.004%, 2/28/2014(h) |
2,261 | ||||
| 67,045 | Sungard Data Systems, Inc., Tranche B, 4.079%, 2/26/2016(h) |
65,268 | ||||
| 466,687 | ||||||
| Wirelines — 0.7% | ||||||
| 763,371 | Fairpoint Communications, Inc., Initial Term Loan B, 5.000%, 3/31/2015(h) |
573,719 | ||||
| 35,482 | Hawaiian Telcom Communications, Inc., Tranche C Term Loan, 4.750%, 6/01/2014(h)(i) |
21,892 | ||||
| 250,000 | Level 3 Financing, Inc., Add on Term Loan, 11.500%, 3/13/2014(h) |
264,610 | ||||
| 25,000 | Level 3 Financing, Inc., Tranche A Term Loan, 2.683%, 3/13/2014(h) |
22,094 | ||||
| 365,343 | Transaction Network Services, Inc., Term Loan A, 9.500%, 3/28/2014(h) |
368,540 | ||||
| 1,250,855 | ||||||
| Total Bank Loans (Identified Cost $2,613,743) | 2,706,147 | |||||
| Shares | Description | Value (†) | |||
| Preferred Stocks — 1.3% | |||||
| Convertible Preferred Stocks — 1.2% | |||||
| Capital Markets — 0.5% | |||||
| 24,190 | Newell Financial Trust I, 5.250% |
$ | 855,721 | ||
| Diversified Financial Services — 0.1% | |||||
| 3,732 | Sovereign Capital Trust IV, 4.375% |
112,893 | |||
| Electric Utilities — 0.1% | |||||
| 6,475 | AES Trust III, 6.750% |
285,305 | |||
| Machinery — 0.0% | |||||
| 2,550 | United Rentals Trust I, 6.500% |
63,431 | |||
| Oil, Gas & Consumable Fuels — 0.2% | |||||
| 9,500 | El Paso Energy Capital Trust I, 4.750% |
317,656 | |||
| Semiconductors & Semiconductor Equipment — 0.3% | |||||
| 799 | Lucent Technologies Capital Trust I, 7.750% |
611,235 | |||
| Total Convertible Preferred Stocks (Identified Cost $2,078,890) | 2,246,241 | ||||
| Non-Convertible Preferred Stocks — 0.1% | |||||
| Diversified Financial Services — 0.1% | |||||
| 274 | Preferred Blocker, Inc., 144A, 7.000% |
159,340 | |||
| Thrifts & Mortgage Finance — 0.0% | |||||
| 300 | Federal Home Loan Mortgage Corp., 5.000%(j)(k) |
795 | |||
| 7,900 | Federal Home Loan Mortgage Corp., 5.570%(j)(k) |
12,640 | |||
| 2,850 | Federal Home Loan Mortgage Corp., 5.660%(j)(k) |
4,702 | |||
| 1,000 | Federal Home Loan Mortgage Corp., 5.700%(j)(k) |
2,570 | |||
| 1,800 | Federal Home Loan Mortgage Corp., 5.790%(j)(k) |
4,788 | |||
| 650 | Federal Home Loan Mortgage Corp., 5.810%(j)(k) |
1,774 | |||
| 1,400 | Federal Home Loan Mortgage Corp., 5.900%(j)(k) |
2,380 | |||
| 350 | Federal Home Loan Mortgage Corp., 6.000%(j)(k) |
1,033 | |||
| 600 | Federal Home Loan Mortgage Corp., 6.420%(j)(k) |
1,800 | |||
| 1,350 | Federal Home Loan Mortgage Corp., 6.550%(j)(k) |
2,457 | |||
| 7,400 | Federal Home Loan Mortgage Corp., 8.375%(j)(k) |
13,394 | |||
| 1,200 | Federal National Mortgage Association, 4.750%(j)(k) |
3,060 | |||
| 200 | Federal National Mortgage Association, 5.125%(j)(k) |
532 | |||
| 400 | Federal National Mortgage Association, 5.375%(j)(k) |
1,136 | |||
| 350 | Federal National Mortgage Association, 5.810%(j)(k) |
977 | |||
| 550 | Federal National Mortgage Association, 6.750%(j)(k) |
864 | |||
See accompanying notes to financial statements.
29
Table of Contents
LOOMIS SAYLES HIGH INCOME FUND — PORTFOLIO OF INVESTMENTS (continued)
Investments as of September 30, 2009
| Shares |
Description | Value (†) | ||||
| Thrifts & Mortgage Finance — continued | ||||||
| 10,250 | Federal National Mortgage Association, 8.250%(j)(k) |
$ | 16,502 | |||
| 71,404 | ||||||
| Total Non-Convertible Preferred Stocks (Identified Cost $634,132) |
230,744 | |||||
| Total Preferred Stocks (Identified Cost $2,713,022) | 2,476,985 | |||||
| Common Stocks — 0.3% | ||||||
| Biotechnology — 0.2% | ||||||
| 43,053 | EPIX Pharmaceuticals, Inc.(j) | 603 | ||||
| 127 | EPIX Pharmaceuticals, Inc., Contingent Value Rights(j) | — | ||||
| 8,147 | Vertex Pharmaceuticals, Inc.(j) | 308,771 | ||||
| 309,374 | ||||||
| Chemicals — 0.0% | ||||||
| 1,087 | Ashland, Inc. | 46,980 | ||||
| Household Durables — 0.0% | ||||||
| 1,775 | KB Home | 29,483 | ||||
| Pharmaceuticals — 0.1% | ||||||
| 6,875 | Merck & Co., Inc. | 217,456 | ||||
| Thrifts & Mortgage Finance — 0.0% | ||||||
| 5,500 | Federal Home Loan Mortgage Corp.(j)(k) | 9,900 | ||||
| Total Common Stocks (Identified Cost $670,137) | 613,193 | |||||
| Closed-End Investment Companies — 0.0% | ||||||
| 3,835 | Morgan Stanley Emerging Markets Debt Fund, Inc. | 36,701 | ||||
| 2,175 | Western Asset High Income Opportunity Fund, Inc. | 12,659 | ||||
| Total Closed-End Investment Companies (Identified Cost $45,443) |
49,360 | |||||
| Principal Amount (‡) |
||||||
| Short-Term Investments — 6.9% | ||||||
| $ | 15,199 | Repurchase Agreement with State Street Corporation, dated 9/30/2009 at 0.000% to be repurchased at $15,199 on 10/01/2009, collateralized by $20,000 U.S. Treasury Bill, due 11/05/2009 valued at $19,999 including accrued interest (Note 2g of Notes to Financial Statements) | 15,199 | |||
| 12,654,163 | Tri-Party Repurchase Agreement with Fixed Income Clearing Corporation, dated 9/30/2009 at 0.000% to be repurchased at $12,654,163 on 10/01/2009, collateralized by $12,915,000 Federal Home Loan Mortgage Corp. Discount Note, due 12/31/2009 valued at $12,908,543 including accrued interest (Note 2g of Notes to Financial Statements) | 12,654,163 | ||||
| Total Short-Term Investments (Identified Cost $12,669,362) | 12,669,362 | |||||
| Total Investments — 99.9% (Identified Cost $170,197,311)(a) |
184,815,547 | |||||
| Other assets less liabilities — 0.1% | 237,077 | |||||
| Net Assets — 100.0% | $ | 185,052,624 | ||||
| (‡) | Principal amount stated in U.S. dollars unless otherwise noted. | |||||
| (†) | See Note 2a of Notes to Financial Statements. | |||||
| (††) | Amount shown represents units. One unit represents a principal amount of 100. | |||||
| (a) | Federal Tax Information: At September 30, 2009, the net unrealized appreciation on investments based on a cost of $170,660,593 for federal income tax purposes was as follows: |
|||||
| Aggregate gross unrealized appreciation for all investments in which there is an excess of value over tax cost | $ | 18,505,499 | ||||
| Aggregate gross unrealized depreciation for all investments in which there is an excess of tax cost over value | (4,350,545 | ) | ||||
| Net unrealized appreciation | $ | 14,154,954 | ||||
| (b) | Variable rate security. Rate as of September 30, 2009 is disclosed. | |||||
| (c) | Step Bond: Coupon rate is a fixed rate for an initial period then resets at a specified date and rate. | |||||
| (d) | The issuer is in default with respect to interest and/or principal payments. Income is not being accrued. | |||||
| (e) | Fair valued security by the Fund’s investment adviser. At September 30, 2009, the value of this security amounted to $497,545 or 0.3% of net assets. | |||||
| (f) | Illiquid security. At September 30, 2009, the value of these securities amounted to $1,782,818 or 1.0% of net assets. | |||||
| (g) | All or a portion of this security is held as collateral for open forward foreign currency contracts. | |||||
| (h) | Variable rate security. Rate shown represents the weighted average rate at September 30, 2009. | |||||
| (i) | All or a portion of interest payment is paid-in-kind. | |||||
| (j) | Non-income producing security. | |||||
| (k) | Future dividend payments have been eliminated as the issuer has been placed in conservatorship. | |||||
| (l) | Issuer has filed for bankruptcy. | |||||
| 144A | Securities exempt from registration under Rule 144A of the Securities Act of 1933. These securities may be resold in transactions exempt from registration, normally to qualified institutional buyers. At September 30, 2009, the value of these securities amounted to $20,691,962 or 11.2% of net assets. | |||||
| ABS | Asset-Backed Securities | |||||
| EMTN | Euro Medium Term Note | |||||
| GMTN | Global Medium Term Note | |||||
| MTN | Medium Term Note | |||||
| REITs | Real Estate Investment Trusts | |||||
| AUD | Australian Dollar | |||||
| CAD | Canadian Dollar | |||||
| GBP | British Pound | |||||
| IDR | Indonesian Rupiah | |||||
| ISK | Icelandic Krona | |||||
| MXN | Mexican Peso | |||||
| NZD | New Zealand Dollar | |||||
| SGD | Singapore Dollar | |||||
| UYU | Uruguayan Peso | |||||
At September 30, 2009, the Fund had the following open forward foreign currency contracts:
| Contract to Buy/Sell |
Delivery Date |
Currency | Units | Notional Value |
Unrealized Appreciation (Depreciation) |
||||||||
| Buy1 |
10/30/2009 | Singapore Dollar | 1,140,000 | $ | 809,109 | $ | 4,791 | ||||||
| Sell1 |
10/30/2009 | Singapore Dollar | 1,140,000 | 809,109 | (17,552 | ) | |||||||
| Total |
$ | (12,761 | ) | ||||||||||
| 1 | Counterparty is Barclays Bank PLC. |
See accompanying notes to financial statements.
30
Table of Contents
LOOMIS SAYLES HIGH INCOME FUND — PORTFOLIO OF INVESTMENTS (continued)
Investments as of September 30, 2009
Industry Summary at September 30, 2009 (Unaudited)
| Technology | 8.5 | % | |
| Wirelines | 8.1 | ||
| Independent Energy | 6.7 | ||
| Healthcare | 6.4 | ||
| Pharmaceuticals | 5.1 | ||
| Electric | 4.4 | ||
| Lodging | 4.1 | ||
| Home Construction | 3.9 | ||
| Wireless | 3.7 | ||
| Commercial Mortgage-Backed Securities | 3.1 | ||
| Paper | 2.9 | ||
| Aerospace & Defense | 2.6 | ||
| Automotive | 2.5 | ||
| Retailers | 2.5 | ||
| Non-Captive Diversified | 2.3 | ||
| Non-Captive Consumer | 2.2 | ||
| Media Cable | 2.1 | ||
| Other Investments, less than 2% each | 21.9 | ||
| Short-Term Investments | 6.9 | ||
| Total Investments | 99.9 | ||
| Other assets less liabilities (including open Forward Foreign Currency Contracts) | 0.1 | ||
| Net Assets | 100.0 | % | |
See accompanying notes to financial statements.
31
Table of Contents
LOOMIS SAYLES INTERNATIONAL BOND FUND — PORTFOLIO OF INVESTMENTS
Investments as of September 30, 2009
| Principal Amount (‡) |
Description | Value (†) | |||
| Bonds and Notes — 84.8% of Net Assets | |||||
| Non-Convertible Bonds — 84.7% | |||||
| Australia — 1.2% | |||||
| 100,000 | National Australia Bank Ltd., GMTN, 4.750%, 7/15/2016, (EUR) |
$ | 151,476 | ||
| 165,000 | New South Wales Treasury Corp., Series 10RG, 7.000%, 12/01/2010, (AUD) |
149,947 | |||
| 301,423 | |||||
| Austria — 0.8% | |||||
| 17,000,000 | Oesterreichische Kontrollbank AG, 1.800%, 3/22/2010, (JPY) |
190,037 | |||
| Belgium — 7.6% | |||||
| 100,000 | Anheuser-Busch InBev NV, EMTN, 6.500%, 6/23/2017, (GBP) |
172,466 | |||
| 625,000 | Kingdom of Belgium, 5.500%, 9/28/2017, (EUR) |
1,046,981 | |||
| 415,000 | Kingdom of Belgium, Series 50, 4.000%, 3/28/2013, (EUR) |
643,551 | |||
| 1,862,998 | |||||
| Brazil — 0.4% | |||||
| 200(†††) | Brazil Notas do Tesouro Nacional, Series F, 10.000%, 1/01/2017, (BRL) |
98,999 | |||
| 5,000 | Republic of Brazil, 7.125%, 1/20/2037 |
5,962 | |||
| 104,961 | |||||
| Canada — 4.4% | |||||
| 110,000 | Bell Canada, Series M-17, 6.100%, 3/16/2035, (CAD) |
95,946 | |||
| 255,000 | Canadian Government, 2.000%, 9/01/2012, (CAD) |
238,818 | |||
| 715,000 | Canadian Government, 4.500%, 6/01/2015, (CAD)(b) |
732,083 | |||
| 1,066,847 | |||||
| Cayman Islands — 1.2% | |||||
| 60,000 | DASA Finance Corp., 144A, 8.750%, 5/29/2018 |
63,600 | |||
| 75,000 | DASA Finance Corp., 8.750%, 5/29/2018 |
79,500 | |||
| 100,000 | Hutchison Whampoa Finance Ltd., 4.625%, 9/21/2016, (EUR) |
143,847 | |||
| 286,947 | |||||
| France — 3.2% | |||||
| 50,000 | Credit Agricole SA, EMTN, 5.971%, 2/01/2018, (EUR) |
80,960 | |||
| 100,000 | Electricite de France, EMTN, 5.875%, 7/18/2031, (GBP) |
173,062 | |||
| 40,000 | Lafarge SA, EMTN, 4.750%, 3/23/2020, (EUR) |
51,556 | |||
| 50,000 | Lafarge SA, EMTN, 5.375%, 6/26/2017, (EUR) |
70,889 | |||
| 85,000 | PPR, EMTN, 4.000%, 1/29/2013, (EUR) |
124,277 | |||
| 35,000 | Veolia Environnement, EMTN, 5.125%, 5/24/2022, (EUR) |
51,124 | |||
| 70,000 | Veolia Environnement, EMTN, 6.125%, 11/25/2033, (EUR) |
106,952 | |||
| Principal Amount (‡) |
Description | Value (†) | |||
| France — continued | |||||
| 50,000 | Vivendi, 4.500%, 10/03/2013, (EUR) |
$ | 74,760 | ||
| 50,000 | Wendel, 4.875%, 5/26/2016, (EUR) |
56,705 | |||
| 790,285 | |||||
| Germany — 21.9% | |||||
| 50,000 | Bertelsmann AG, EMTN, 3.625%, 10/06/2015, (EUR) |
66,407 | |||
| 21,000,000 | Kreditanstalt fuer Wiederaufbau, 1.350%, 1/20/2014, (JPY) |
238,015 | |||
| 16,000,000 | Kreditanstalt fuer Wiederaufbau, 1.750%, 3/23/2010, (JPY) |
179,396 | |||
| 36,000,000 | Kreditanstalt fuer Wiederaufbau, 2.050%, 2/16/2026, (JPY) |
391,559 | |||
| 185,000 | Kreditanstalt fuer Wiederaufbau, 2.500%, 10/11/2010, (EUR) |
275,848 | |||
| 5,000,000 | Kreditanstalt fuer Wiederaufbau, 2.600%, 6/20/2037, (JPY) |
55,727 | |||
| 105,000 | Muenchener Hypothekenbank eG, 5.000%, 1/16/2012, (EUR) |
164,369 | |||
| 130,000 | Republic of Germany, 1.250%, 9/16/2011, (EUR) |
190,176 | |||
| 540,000 | Republic of Germany, 3.750%, 7/04/2013, (EUR) |
836,309 | |||
| 665,000 | Republic of Germany, 3.750%, 1/04/2017, (EUR) |
1,027,087 | |||
| 400,000 | Republic of Germany, 4.000%, 12/11/2009, (EUR) |
589,162 | |||
| 330,000 | Republic of Germany, 4.000%, 4/13/2012, (EUR) |
512,020 | |||
| 100,000 | Republic of Germany, 4.000%, 1/04/2037, (EUR) |
146,901 | |||
| 100,000 | Republic of Germany, 4.500%, 1/04/2013, (EUR) |
158,021 | |||
| 280,000 | Republic of Germany, 6.500%, 7/04/2027, (EUR) |
541,034 | |||
| 5,372,031 | |||||
| India — 0.7% | |||||
| 100,000 | Canara Bank Ltd., (fixed rate to 11/28/2016, variable rate thereafter), 6.365%, 11/28/2021 |
92,273 | |||
| 100,000 | ICICI Bank Ltd., (fixed rate to 4/30/2017, variable rate thereafter), 144A, 6.375%, 4/30/2022 |
81,801 | |||
| 174,074 | |||||
| Ireland — 1.5% | |||||
| 30,000,000 | Depfa ACS Bank, Series 686, EMTN, 1.650%, 12/20/2016, (JPY) |
270,956 | |||
| 100,000 | Elan Corp. PLC, 144A, 8.750%, 10/15/2016 |
98,563 | |||
| 369,519 | |||||
| Italy — 0.8% | |||||
| 150,000 | Finmeccanica SpA, EMTN, 4.875%, 3/24/2025, (EUR) |
207,457 | |||
| Japan — 8.4% | |||||
| 18,000,000 | Development Bank of Japan, 1.750%, 6/21/2010, (JPY) |
202,476 | |||
See accompanying notes to financial statements.
32
Table of Contents
LOOMIS SAYLES INTERNATIONAL BOND FUND — PORTFOLIO OF INVESTMENTS (continued)
Investments as of September 30, 2009
| Principal Amount (‡) |
Description | Value (†) | |||
| Japan — continued | |||||
| 63,000,000 | Japan Finance Organization for Municipal Enterprises, 1.350%, 11/26/2013, (JPY) |
$ | 721,499 | ||
| 39,000,000 | Japan Government , 0.700%, 6/20/2014, (JPY) |
437,308 | |||
| 20,000,000 | Japan Government, 1.300%, 3/20/2019, (JPY) |
224,783 | |||
| 41,000,000 | Japan Government, 1.400%, 6/20/2011, (JPY) |
465,962 | |||
| 2,052,028 | |||||
| Jersey — 0.3% | |||||
| 50,000 | WPP PLC, 6.000%, 4/04/2017, (GBP) |
76,530 | |||
| Luxembourg — 0.5% | |||||
| 50,000 | Enel Finance International SA, EMTN, 5.625%, 8/14/2024, (GBP) |
79,972 | |||
| 25,000 | Telecom Italia Finance SA, EMTN, 7.750%, 1/24/2033, (EUR) |
41,051 | |||
| 121,023 | |||||
| Mexico — 1.2% | |||||
| 85,000 | Desarrolladora Homex SAB de CV, 7.500%, 9/28/2015 |
83,512 | |||
| 17,000(††) | Mexican Fixed Rate Bonds, Series M-10, 8.500%, 12/13/2018, (MXN) |
130,471 | |||
| 10,000(††) | Mexican Fixed Rate Bonds, Series M-20, 8.000%, 12/07/2023, (MXN) |
72,653 | |||
| 286,636 | |||||
| Netherlands — 3.6% | |||||
| 245,000 | Kingdom of Netherlands, 5.000%, 7/15/2011, (EUR)(b) |
382,394 | |||
| 50,000 | Koninklijke (Royal) KPN NV, GMTN, 4.750%, 1/17/2017, (EUR) |
74,580 | |||
| 100,000 | Linde Finance BV, EMTN, 4.750%, 4/24/2017, (EUR) |
151,712 | |||
| 100,000 | RWE Finance BV, EMTN, 5.500%, 7/06/2022, (GBP) |
164,170 | |||
| 10,000 | Wolters Kluwer NV, 5.125%, 1/27/2014, (EUR) |
15,325 | |||
| 50,000 | Wolters Kluwer NV, 6.375%, 4/10/2018, (EUR) |
80,613 | |||
| 868,794 | |||||
| Norway — 3.3% | |||||
| 275,000 | Norwegian Government, 4.250%, 5/19/2017, (NOK) |
48,404 | |||
| 2,125,000 | Norwegian Government, 5.000%, 5/15/2015, (NOK) |
390,960 | |||
| 775,000 | Norwegian Government, 6.000%, 5/16/2011, (NOK) |
140,992 | |||
| 1,235,000 | Norwegian Government, 6.500%, 5/15/2013, (NOK) |
235,518 | |||
| 815,874 | |||||
| Singapore — 0.8% | |||||
| 265,000 | Republic of Singapore, 2.250%, 7/01/2013, (SGD) |
196,434 | |||
| South Africa — 0.4% | |||||
| 100,000 | Edcon Proprietary Ltd., 144A, 4.023%, 6/15/2014, (EUR)(c) |
104,629 | |||
| Principal Amount (‡) |
Description | Value (†) | |||
| Spain — 0.6% | |||||
| 100,000 | Santander Issurance SA, EMTN, (fixed rate to 5/29/2014, variable rate thereafter), 4.750%, 5/29/2019, (EUR) |
$ | 146,016 | ||
| Supranational — 4.9% | |||||
| 40,000,000 | Asian Development Bank, EMTN, 2.350%, 6/21/2027, (JPY) |
457,635 | |||
| 25,000,000 | European Investment Bank, 1.250%, 9/20/2012, (JPY) |
284,895 | |||
| 4,000,000 | European Investment Bank, 1.400%, 6/20/2017, (JPY) |
45,250 | |||
| 921,000,000 | European Investment Bank, EMTN, 144A, Zero Coupon, 4/24/2013, (IDR) |
67,829 | |||
| 30,000,000 | Nordic Investment Bank, Series C, GMTN, 1.700%, 4/27/2017, (JPY) |
347,197 | |||
| 1,202,806 | |||||
| Sweden — 2.2% | |||||
| 2,490,000 | Sweden Government Bond, 5.500%, 10/08/2012, (SEK) |
392,501 | |||
| 100,000 | Telefonaktiebolaget LM Ericsson, EMTN, 5.375%, 6/27/2017, (EUR) |
150,380 | |||
| 542,881 | |||||
| United Arab Emirates — 0.8% | |||||
| 100,000 | Abu Dhabi National Energy Co., 144A, 6.500%, 10/27/2036 |
96,556 | |||
| 100,000 | DP World Ltd., 144A, 6.850%, 7/02/2037 |
87,949 | |||
| 184,505 | |||||
| United Kingdom — 5.7% | |||||
| 50,000 | BAT International Finance PLC, EMTN, 5.375%, 6/29/2017, (EUR) |
76,797 | |||
| 50,000 | British Sky Broadcasting Group PLC, EMTN, 6.000%, 5/21/2027, (GBP) |
81,066 | |||
| 50,000 | BSKYB Finance UK PLC, 5.750%, 10/20/2017, (GBP) |
84,457 | |||
| 94,000 | Lloyds TSB Group PLC, 5.875%, 7/08/2014, (EUR) |
140,466 | |||
| 50,000 | Standard Chartered Bank, Series 17, EMTN, 5.875%, 9/26/2017, (EUR) |
75,663 | |||
| 70,000 | United Kingdom Gilt, 4.250%, 6/07/2032, (GBP) |
115,646 | |||
| 30,000 | United Kingdom Treasury, 4.000%, 9/07/2016, (GBP) |
50,872 | |||
| 350,000 | United Kingdom Treasury, 5.250%, 6/07/2012, (GBP) |
608,889 | |||
| 100,000 | Vodafone Group PLC, EMTN, 5.375%, 6/06/2022, (EUR) |
151,530 | |||
| 1,385,386 | |||||
| United States — 8.3% | |||||
| 25,000 | Ahold Finance USA, Inc., EMTN, 6.500%, 3/14/2017, (GBP) |
42,351 | |||
| 50,000 | Alcoa, Inc., 6.750%, 1/15/2028 |
43,611 | |||
| 100,000 | Bristol-Myers Squibb Co., 4.625%, 11/15/2021, (EUR) |
150,738 | |||
| 50,000 | Cargill, Inc., EMTN, 5.375%, 3/02/2037, (GBP) |
69,846 | |||
See accompanying notes to financial statements.
33
Table of Contents
LOOMIS SAYLES INTERNATIONAL BOND FUND — PORTFOLIO OF INVESTMENTS (continued)
Investments as of September 30, 2009
| Principal Amount (‡) |
Description | Value (†) | ||||
| United States — continued | ||||||
| $ | 20,000 | Chesapeake Energy Corp., 6.375%, 6/15/2015 |
$ | 18,575 | ||
| 60,000 | Chesapeake Energy Corp., 6.500%, 8/15/2017 |
55,050 | ||||
| 50,000 | Couche-Tard US/Finance, 7.500%, 12/15/2013 |
50,563 | ||||
| 50,000 | Countrywide Financial Corp., EMTN, 5.125%, 2/17/2011, (GBP) |
80,144 | ||||
| 60,000 | Frontier Communications Corp., 6.250%, 1/15/2013 |
58,800 | ||||
| 100,000 | Georgia-Pacific Corp., 8.000%, 1/15/2024 |
99,000 | ||||
| 50,000 | Goldman Sachs Group, Inc. (The), 6.875%, 1/18/2038, (GBP) |
79,526 | ||||
| 50,000 | Goldman Sachs Group, Inc. (The), 7.125%, 8/07/2025, (GBP) |
92,141 | ||||
| 55,000 | HCA, Inc., 5.750%, 3/15/2014 |
48,538 | ||||
| 45,000 | HCA, Inc., 8.360%, 4/15/2024 |
36,618 | ||||
| 90,000 | International Paper Co., 8.700%, 6/15/2038 |
99,770 | ||||
| 50,000 | Kraft Foods, Inc., 6.250%, 3/20/2015, (EUR) |
79,059 | ||||
| 100,000 | Merrill Lynch & Co., Inc., EMTN, 4.625%, 9/14/2018, (EUR) |
126,510 | ||||
| 25,000 | Morgan Stanley, 5.375%, 11/14/2013, (GBP) |
40,475 | ||||
| 50,000 | Morgan Stanley, EMTN, 3.750%, 3/01/2013, (EUR) |
72,484 | ||||
| 75,000 | Motorola, Inc., 6.625%, 11/15/2037 |
62,813 | ||||
| 5,000 | New Albertson’s, Inc., 7.450%, 8/01/2029 |
4,300 | ||||
| 5,000 | New Albertson’s, Inc., 7.750%, 6/15/2026 |
4,450 | ||||
| 95,000 | New Albertson’s, Inc., 8.000%, 5/01/2031 |
85,262 | ||||
| 5,000 | New Albertson’s, Inc., 8.700%, 5/01/2030 |
4,550 | ||||
| 50,000 | Owens Brockway Glass Container, Inc., 6.750%, 12/01/2014, (EUR) |
72,436 | ||||
| 95,000 | Qwest Corp., 6.875%, 9/15/2033 |
76,950 | ||||
| 70,000 | SLM Corp., Series A, MTN, 4.500%, 7/26/2010 |
68,016 | ||||
| 100,000 | Sprint Nextel Corp., 6.000%, 12/01/2016 |
89,250 | ||||
| 100,000 | Textron, Inc., 3.875%, 3/11/2013, (EUR) |
135,121 | ||||
| 50,000 | Wells Fargo & Co., 4.625%, 11/02/2035, (GBP) |
72,356 | ||||
| 2,019,303 | ||||||
| Total Non-Convertible Bonds (Identified Cost $19,471,627) | 20,729,424 | |||||
| Principal Amount (‡) |
Description | Value (†) | |||||
| Convertible Bonds — 0.1% | |||||||
| United States — 0.1% | |||||||
| $ | 50,000 | Hologic, Inc., (Step to Zero Coupon on 12/15/2013), 2.000%, 12/15/2037(d) (Identified Cost $34,778) |
$ | 40,875 | |||
| Total Bonds and Notes (Identified Cost $19,506,405) | 20,770,299 | ||||||
| Short-Term Investments — 7.3% | |||||||
| 1,782,795 | Tri-Party Repurchase Agreement with Fixed Income Clearing Corporation, dated 9/30/2009 at 0.000% to be repurchased at $1,782,795 on 10/01/2009, collateralized by $1,740,000 Federal Home Loan Mortgage Corp., 5.625% due 11/23/2035 valued at $1,818,474 including accrued interest (Note 2g of Notes to Financial Statements) (Identified Cost $1,782,795) | 1,782,795 | |||||
| Total Investments — 92.1% (Identified Cost $21,289,200)(a) |
22,553,094 | ||||||
| Other assets less liabilities—7.9% | 1,929,839 | ||||||
| Net Assets — 100.0% | $ | 24,482,933 | |||||
| (‡) | Principal amount stated in U.S. dollars unless otherwise noted. | ||||||
| (†) | See Note 2a of Notes to Financial Statements. | ||||||
| (††) | Amount shown represents units. One unit represents a principal amount of 100. | ||||||
| (†††) | Amount shown represents units. One unit represents a principal amount of 1,000. | ||||||
| (a) | Federal Tax Information: | ||||||
| At September 30, 2009, the net unrealized appreciation on investments based on a cost of $21,335,124 for federal income tax purposes was as follows: | |||||||
| Aggregate gross unrealized appreciation for all investments in which there is an excess of value over tax cost | $ | 1,346,393 | |||||
| Aggregate gross unrealized depreciation for all investments in which there is an excess of tax cost over value | (128,423 | ) | |||||
| Net unrealized appreciation | $ | 1,217,970 | |||||
| (b) | All or a portion of this security is held as collateral for open forward foreign currency contracts. | ||||||
| (c) | Variable rate security. Rate as of September 30, 2009 is disclosed. | ||||||
| (d) | Step Bond: Coupon rate is a fixed rate for an initial period then resets at a specified date and rate. | ||||||
| 144A | Securities exempt from registration under Rule 144A of the Securities Act of 1933. These securities may be resold in transactions exempt from registration, normally to qualified institutional buyers. At September 30, 2009, the value of these securities amounted to $600,927 or 2.5% of net assets. | ||||||
| EMTN | Euro Medium Term Note | ||||||
| GMTN | Global Medium Term Note | ||||||
| MTN | Medium Term Note | ||||||
| AUD | Australian Dollar | ||||||
| BRL | Brazilian Real | ||||||
| CAD | Canadian Dollar | ||||||
| EUR | Euro | ||||||
| GBP | British Pound | ||||||
| IDR | Indonesian Rupiah | ||||||
| JPY | Japanese Yen | ||||||
| MXN | Mexican Peso | ||||||
| NOK | Norwegian Krone | ||||||
| SEK | Swedish Krona | ||||||
| SGD | Singapore Dollar | ||||||
See accompanying notes to financial statements.
34
Table of Contents
LOOMIS SAYLES INTERNATIONAL BOND FUND — PORTFOLIO OF INVESTMENTS (continued)
Investments as of September 30, 2009
At September 30, 2009, the Fund had the following open forward foreign currency contracts:
| Contract to Buy/Sell |
Delivery Date |
Currency | Units | Notional Value |
Unrealized Appreciation | |||||||
| Buy1 |
12/16/2009 | Euro | 372,000 | $ | 544,322 | $ | 15,156 | |||||
| Buy2 |
12/16/2009 | Japanese Yen | 94,250,000 | 1,050,483 | 23,591 | |||||||
| Sell2 |
12/16/2009 | Japanese Yen | 36,300,000 | 404,589 | 1,790 | |||||||
| Buy3 |
12/14/2009 | South Korean Won | 248,000,000 | 210,288 | 7,508 | |||||||
| Buy4 |
12/14/2009 | South Korean Won | 600,000,000 | 508,762 | 17,161 | |||||||
| Total |
$ | 65,206 | ||||||||||
| 1 | Counterparty is Credit Suisse. |
| 2 | Counterparty is JP Morgan Chase. |
| 3 | Counterparty is UBS. |
| 4 | Counterparty is Barclays Bank PLC. |
Industry Summary at September 30, 2009 (Unaudited)
| Treasuries | 41.5 | % | |
| Banking | 7.2 | ||
| Government Guaranteed | 5.5 | ||
| Supranational | 4.9 | ||
| Government Agencies | 2.9 | ||
| Sovereigns | 2.7 | ||
| Other Investments, less than 2% each | 20.1 | ||
| Short-Term Investments | 7.3 | ||
| Total Investments | 92.1 | ||
| Other assets less liabilities (including open Forward Foreign Currency Contracts) | 7.9 | ||
| Net Assets | 100.0 | % | |
Currency Exposure at September 30, 2009 as a Percentage of Net Assets (Unaudited)
| Euro | 39.0 | % | |
| Japanese Yen | 18.4 | ||
| United States Dollar | 14.0 | ||
| British Pound | 8.5 | ||
| Canadian Dollar | 4.4 | ||
| Norwegian Krone | 3.3 | ||
| Other, less than 2% each | 4.5 | ||
| Total Investments | 92.1 | ||
| Other assets less liabilities (including open Forward Foreign Currency Contracts) | 7.9 | ||
| Net Assets | 100.0 | % | |
See accompanying notes to financial statements.
35
Table of Contents
LOOMIS SAYLES LIMITED TERM GOVERNMENT AND AGENCY FUND
PORTFOLIO OF INVESTMENTS
Investments as of September 30, 2009
| Principal Amount |
Description | Value (†) | ||||
| Bonds and Notes — 99.1% of Net Assets | ||||||
| ABS Car Loan — 2.1% | ||||||
| $ | 91,578 | Honda Auto Receivables Owner Trust, Series 2008-1, Class A2, 3.770%, 9/20/2010 |
$ | 91,928 | ||
| 1,025,000 | Honda Auto Receivables Owner Trust, Series 2009-2, Class A3, 2.790%, 1/15/2013 |
1,048,989 | ||||
| 785,000 | Honda Auto Receivables Owner Trust, Series 2009-3, Class A3, 2.310%, 5/15/2013 |
797,050 | ||||
| 565,000 | Merrill Auto Trust Securitization, Series 2008-1, Class 3A3, 5.500%, 3/15/2012 |
585,507 | ||||
| 425,000 | Nissan Auto Receivables Owner Trust, Series 2008-B, Class A3, 4.460%, 4/16/2012 |
439,341 | ||||
| 915,000 | Nissan Master Owner Trust Receivables, Series 2007-A, Class A, 0.243%, 5/15/2012(b) |
908,862 | ||||
| 429,000 | USAA Auto Owner Trust, Series 2008-3, Class A3, 4.280%, 10/15/2012 |
443,936 | ||||
| 4,315,613 | ||||||
| ABS Credit Card — 3.4% | ||||||
| 985,000 | American Express Credit Account Master Trust, Series 2004-2 Class A, 0.413%, 12/15/2016(b) |
947,809 | ||||
| 1,150,000 | Capital One Multi-Asset Execution Trust, Series 2008-A6, Class A6, 1.343%, 3/17/2014(b) |
1,158,227 | ||||
| 3,000,000 | Citibank Credit Card Issuance Trust, Series 2006-A8, Class A8, 0.549%, 12/17/2018(b) |
2,767,474 | ||||
| 1,400,000 | Discover Card Master Trust I, Series 2007-3, Class A2, 0.293%, 10/16/2014(b) |
1,362,604 | ||||
| 600,000 | Discover Card Master Trust, Series 2008-A3, Class A3, 5.100%, 10/15/2013 |
630,348 | ||||
| 6,866,462 | ||||||
| ABS Home Equity — 1.2% | ||||||
| 962,163 | Countrywide Asset-Backed Certificates, Series 2004-S1, Class A3, 4.615%, 2/25/2035 |
723,448 | ||||
| 1,017,154 | Countrywide Asset-Backed Certificates, Series 2006-S1, Class A2, 5.549%, 8/25/2021 |
538,786 | ||||
| 669,276 | Residential Funding Mortgage Securities II, Series 2002-HI5, Class A7, 5.700%, 1/25/2028 |
547,966 | ||||
| 660,000 | Residential Funding Mortgage Securities II, Series 2005-HI3, Class A4, 5.490%, 9/25/2035 |
549,655 | ||||
| 2,359,855 | ||||||
| ABS Other — 0.3% | ||||||
| 700,000 | John Deere Owner Trust, Series 2009-A, Class A3, 2.590%, 10/15/2013 |
711,857 | ||||
| Collateralized Mortgage Obligations — 0.4% | ||||||
| 87,991 | Federal Home Loan Mortgage Corp., Series 3145, Class KA, 5.000%, 8/15/2024 |
91,409 | ||||
| 770,851 | Federal Home Loan Mortgage Corp., Series 2901, Class UA, 5.000%, 1/15/2030 |
808,517 | ||||
| 899,926 | ||||||
| Commercial Mortgage-Backed Securities — 10.9% | ||||||
| 1,005,000 | Banc of America Commercial Mortgage, Inc., Series 2007-2, Class A2, 5.634%, 4/10/2049 |
997,671 | ||||
| 1,050,000 | Bear Stearns Commercial Mortgage Securities, Inc., 5.667%, 6/11/2040(b) |
1,035,264 | ||||
| Principal Amount |
Description | Value (†) | ||||
| Commercial Mortgage-Backed Securities — continued | ||||||
| $ | 360,000 | Citigroup Commercial Mortgage Trust, Series 2006-C5, Class A4, 5.431%, 10/15/2049 |
$ | 325,339 | ||
| 790,000 | Citigroup/Deutsche Bank Commercial Mortgage Trust, Series 2007-CD4, Class A2B, 5.205%, 12/11/2049 |
786,282 | ||||
| 1,400,000 | Commercial Mortgage Pass Through Certificates, Series 2006-C7, Class A4, 5.768%, 6/10/2046(b) |
1,339,263 | ||||
| 2,670,000 | Credit Suisse Mortgage Capital Certificates, Series 2006-C3, Class A3, 5.826%, 6/15/2038(b) |
2,264,532 | ||||
| 1,610,000 | Credit Suisse Mortgage Capital Certificates, Series 2007-C3, Class A4, 5.773%, 6/15/2039(b) |
1,271,035 | ||||
| 2,000,000 | Credit Suisse Mortgage Capital Certificates, Series 2007-C4, Class A4, 5.809%, 9/15/2039(b) |
1,584,465 | ||||
| 1,500,000 | Greenwich Capital Commercial Funding Corp., Series 2006-GG7, Class A4, 5.918%, 7/10/2038(b) |
1,372,349 | ||||
| 1,850,000 | Greenwich Capital Commercial Funding Corp., Series 2007-GG9, Class A2, 5.381%, 3/10/2039 |
1,837,215 | ||||
| 1,860,000 | GS Mortgage Securities Corp. II, Series 2006-GG6, Class A4, 5.553%, 4/10/2038 |
1,679,809 | ||||
| 500,000 | GS Mortgage Securities Corp. II, Series 2006-GG8, Class A4, 5.560%, 11/10/2039 |
439,425 | ||||
| 1,720,000 | Morgan Stanley Capital I, Series 2007-IQ14, Class A4, 5.692%, 4/15/2049 |
1,406,798 | ||||
| 905,000 | Morgan Stanley Capital I, Series 2006-T23, Series A2, 5.741%, 8/12/2041(b) |
915,228 | ||||
| 530,000 | Wachovia Bank Commercial Mortgage Trust, Series 2006-C28, Class A4, 5.572%, 10/15/2048 |
464,579 | ||||
| 4,675,000 | Wachovia Bank Commercial Mortgage Trust, Series 2006-C29, Class A4, 5.308%, 11/15/2048 |
4,209,497 | ||||
| 21,928,751 | ||||||
| Government Guaranteed — 3.5% | ||||||
| 7,000,000 | Citigroup Funding, Inc., 0.730%, 7/12/2012 (FDIC insured)(b) |
7,012,005 | ||||
| Government Owned — No Guarantee — 10.0% | ||||||
| 6,000,000 | Federal Home Loan Mortgage Corp., 2.125%, 3/23/2012 |
6,111,132 | ||||
| 1,600,000 | Federal Home Loan Mortgage Corp., 4.125%, 10/18/2010 |
1,659,171 | ||||
| 5,000,000 | Federal National Mortgage Association, 1.750%, 3/23/2011 |
5,074,620 | ||||
| 3,420,000 | Federal National Mortgage Association, 2.000%, 1/09/2012 |
3,478,793 | ||||
| 3,500,000 | Federal National Mortgage Association, 5.000%, 10/15/2011 |
3,791,351 | ||||
| 20,115,067 | ||||||
| Government Sponsored — 8.3% | ||||||
| 6,800,000 | Federal Home Loan Bank, 1.125%, 6/03/2011 |
6,835,584 | ||||
| 5,000,000 | Federal Home Loan Bank, 1.625%, 7/27/2011 |
5,057,330 | ||||
See accompanying notes to financial statements.
36
Table of Contents
LOOMIS SAYLES LIMITED TERM GOVERNMENT AND AGENCY FUND
PORTFOLIO OF INVESTMENTS (continued)
Investments as of September 30, 2009
| Principal Amount |
Description | Value (†) | ||||
| Government Sponsored — continued | ||||||
| $ | 3,000,000 | Federal Home Loan Bank, 3.375%, 10/20/2010 |
$ | 3,087,903 | ||
| 1,700,000 | Federal Home Loan Bank, 3.625%, 9/16/2011 |
1,789,580 | ||||
| 16,770,397 | ||||||
| Hybrid ARMs — 2.0% | ||||||
| 2,520,438 | FNMA, 6.026%, 2/01/2037(b) |
2,680,158 | ||||
| 155,447 | JPMorgan Mortgage Trust, Series 2006-A7, Class 1A3, 4.552%, 1/25/2037(b) |
144,977 | ||||
| 1,635,729 | Morgan Stanley Mortgage Loan Trust, Series 2005-3AR, Class 5A, 5.585%, 7/25/2035(b) |
1,295,131 | ||||
| 4,120,266 | ||||||
| Mortgage Related — 42.4% | ||||||
| 7,641,202 | FHLMC 4.500%, with various maturities from 2024 to 2034(c) |
7,905,107 | ||||
| 4,963,789 | FHLMC 5.000%, with various maturities from 2022 to 2023(c) |
5,219,169 | ||||
| 16,554,608 | FHLMC 5.500%, with various maturities from 2011 to 2023(c) |
17,657,952 | ||||
| 4,567,515 | FHLMC 6.000%, with various maturities from 2019 to 2021(c) |
4,875,793 | ||||
| 6,823,443 | FHLMC 6.500%, with various maturities from 2014 to 2034(c) |
7,305,738 | ||||
| 170,340 | FHLMC, 7.000%, 2/01/2016 |
183,190 | ||||
| 18,922 | FHLMC 7.500%, with various maturities from 2012 to 2026(c) |
20,195 | ||||
| 12,106 | FHLMC, 8.000%, 9/01/2015 |
13,126 | ||||
| 4,458 | FHLMC, 10.000%, 7/01/2019 |
5,008 | ||||
| 135,785 | FHLMC 11.500%, with various maturities from 2015 to 2020(c) |
147,665 | ||||
| 9,529,069 | FNMA 4.000%, with various maturities from 2018 to 2019(c) |
9,920,956 | ||||
| 852,857 | FNMA, 4.500%, 9/01/2019 |
898,257 | ||||
| 2,022,877 | FNMA 5.500%, with various maturities from 2017 to 2036(c) |
2,135,215 | ||||
| 20,858,677 | FNMA 6.000%, with various maturities from 2017 to 2034(c) |
22,278,823 | ||||
| 5,110,573 | FNMA 6.500%, with various maturities from 2017 to 2037(c) |
5,482,237 | ||||
| 190,599 | FNMA, 7.000%, 12/01/2022 |
206,674 | ||||
| 408,201 | FNMA 7.500%, with various maturities from 2015 to 2032(c) |
453,493 | ||||
| 59,846 | FNMA 8.000%, with various maturities from 2015 to 2016(c) |
65,044 | ||||
| 94,838 | GNMA, 6.000%, 12/15/2031 |
101,209 | ||||
| 335,525 | GNMA, 6.500%, 5/15/2031 |
362,574 | ||||
| 289,911 | GNMA, 7.000%, 10/15/2028 |
319,625 | ||||
| 2,384 | GNMA, 12.500%, 6/15/2014 |
2,707 | ||||
| Principal Amount |
Description | Value (†) | |||||
| Mortgage Related — continued | |||||||
| $ | 43,467 | GNMA 16.000%, with various maturities from 2011 to 2012(c) |
$ | 48,854 | |||
| 18,611 | GNMA 17.000%, with various maturities in 2011(c) |
20,765 | |||||
| 85,629,376 | |||||||
| Treasuries — 14.6% | |||||||
| 4,693,937 | U.S. Treasury Inflation Indexed Bond, 1.375%, 7/15/2018 |
4,646,998 | |||||
| 15,782,916 | U.S. Treasury Inflation Indexed Note, 0.625%, 4/15/2013 |
15,748,383 | |||||
| 8,600,000 | U.S. Treasury Note, 3.625%, 12/31/2012 |
9,172,433 | |||||
| 29,567,814 | |||||||
| Total Bonds and Notes (Identified Cost $193,186,431) | 200,297,389 | ||||||
| Principal Amount |
|||||||
| Short-Term Investments — 0.5% | |||||||
| 998,373 | Tri-Party Repurchase Agreement with Fixed Income Clearing Corporation, dated 9/30/2009 at 0.000% to be repurchased at $998,373 on 10/01/2009, collateralized by $1,010,000 Federal Home Loan Bank, 2.900% due 7/02/2013 valued at $1,018,838 including accrued interest (Note 2g of Notes to Financial Statements) (Identified Cost $998,373) | 998,373 | |||||
| Total Investments — 99.6% (Identified Cost $194,184,804)(a) |
201,295,762 | ||||||
| Other assets less liabilities—0.4% | 742,177 | ||||||
| Net Assets — 100.0% | $ | 202,037,939 | |||||
| (†) | See Note 2a Notes to Financial Statements. | ||||||
| (a) | Federal Tax Information: | ||||||
| At September 30, 2009, the net unrealized appreciation on investments based on a cost of $194,375,623 for federal income tax purposes was as follows: | |||||||
| Aggregate gross unrealized appreciation for all investments in which there is an excess of value over tax cost | $ | 8,255,713 | |||||
| Aggregate gross unrealized depreciation for all investments in which there is an excess of tax cost over value | (1,335,574 | ) | |||||
| Net unrealized appreciation | $ | 6,920,139 | |||||
| (b) | Variable rate security. Rate as of September 30, 2009 is disclosed. | ||||||
| (c) | The Fund’s investment in mortgage related securities of the Federal Home Loan Mortgage Corporation, Federal National Mortgage Association and Government National Mortgage Association are interests in separate pools of mortgages. All separate investments in securities of each issuer which have the same coupon rate have been aggregated for the purpose of presentation in the Portfolio of Investments. | ||||||
| ABS | Asset-Backed Securities | ||||||
| ARM | Adjustable Rate Mortgage | ||||||
| FDIC | Federal Deposit Insurance Corporation | ||||||
| FHLMC | Federal Home Loan Mortgage Corporation | ||||||
| FNMA | Federal National Mortgage Association | ||||||
| GNMA | Government National Mortgage Association | ||||||
See accompanying notes to financial statements.
37
Table of Contents
LOOMIS SAYLES LIMITED TERM GOVERNMENT AND AGENCY FUND
PORTFOLIO OF INVESTMENTS (continued)
Investments as of September 30, 2009
Industry Summary at September 30, 2009 (Unaudited)
| Mortgage Related | 42.4 | % | |
| Treasuries | 14.6 | ||
| Commercial Mortgage-Backed Securities | 10.9 | ||
| Government Owned — No Guarantee | 10.0 | ||
| Government Sponsored | 8.3 | ||
| Government Guaranteed | 3.5 | ||
| ABS Credit Card | 3.4 | ||
| ABS Car Loan | 2.1 | ||
| Hybrid ARMs | 2.0 | ||
| Other Investments, less than 2% each | 1.9 | ||
| Short-Term Investments | 0.5 | ||
| Total Investments | 99.6 | ||
| Other assets less liabilities | 0.4 | ||
| Net Assets | 100.0 | % | |
See accompanying notes to financial statements.
38
Table of Contents
LOOMIS SAYLES STRATEGIC INCOME FUND — PORTFOLIO OF INVESTMENTS
Investments as of September 30, 2009
| Principal Amount (‡) |
Description | Value (†) | ||||
| Bonds and Notes — 89.2% of Net Assets | ||||||
| Non-Convertible Bonds — 83.3% | ||||||
| ABS Credit Card — 0.7% | ||||||
| $ | 80,700,000 | Citibank Credit Card Issuance Trust, Series 2008-C6, Class C6, 6.300%, 6/20/2014 |
$ | 83,481,495 | ||
| Aerospace & Defense — 0.1% | ||||||
| 1,380,000 | Bombardier, Inc., 144A, 6.300%, 5/01/2014 |
1,331,700 | ||||
| 2,795,000 | Bombardier, Inc., 7.350%, 12/22/2026, (CAD) |
2,346,140 | ||||
| 11,700,000 | Bombardier, Inc., 144A, 7.450%, 5/01/2034 |
10,208,250 | ||||
| 13,886,090 | ||||||
| Airlines — 1.5% | ||||||
| 825,000 | American Airlines Pass Through Trust, Series 1999-1, Class B, 7.324%, 4/15/2011 |
822,938 | ||||
| 3,245,000 | American Airlines Pass Through Trust, Series 2009-1A, 10.375%, 7/02/2019 |
3,431,360 | ||||
| 432,651 | American Airlines Pass Through Trust, Series 93A6, 8.040%, 9/16/2011 |
283,927 | ||||
| 20,000,000 | Continental Airlines, Inc., 9.000%, 7/08/2016 |
21,177,200 | ||||
| 178,186 | Continental Airlines, Inc., Series 1996-1, Class A, 6.940%, 4/15/2015 |
167,494 | ||||
| 4,470,543 | Continental Airlines, Inc., Series 1997-4, Class 4B, 6.900%, 7/02/2018 |
3,934,078 | ||||
| 4,100,843 | Continental Airlines, Inc., Series 1998-1, Class 1B, 6.748%, 9/15/2018 |
3,526,725 | ||||
| 6,639,043 | Continental Airlines, Inc., Series 1999-1, Class B, 6.795%, 2/02/2020 |
5,742,772 | ||||
| 2,928,724 | Continental Airlines, Inc., Series 1999-2, Class B, 7.566%, 9/15/2021 |
2,547,990 | ||||
| 1,577,483 | Continental Airlines, Inc., Series 2000-2, Class A-1, 7.707%, 10/02/2022 |
1,467,060 | ||||
| 7,140,073 | Continental Airlines, Inc., Series 2000-2, Class B, 8.307%, 10/02/2019 |
6,283,264 | ||||
| 1,800,933 | Continental Airlines, Inc., Series 2001-1, Class A-1, 6.703%, 12/15/2022 |
1,663,360 | ||||
| 2,336,738 | Continental Airlines, Inc., Series 2001-1, Class B, 7.373%, 6/15/2017 |
1,939,492 | ||||
| 11,915,000 | Continental Airlines, Inc., Series 2007-1, Class A, 5.983%, 4/19/2022 |
11,259,675 | ||||
| 16,802,000 | Continental Airlines, Inc., Series 2007-1, Class B, 6.903%, 4/19/2022 |
14,449,720 | ||||
| 7,230,366 | Continental Airlines, Inc., Series 971A, 7.461%, 10/01/2016 |
6,742,316 | ||||
| 3,145,000 | Delta Air Lines, Inc., 144A, 9.500%, 9/15/2014 |
3,145,000 | ||||
| 1,586,138 | Delta Air Lines, Inc., Series 2007-1, Class A, 6.821%, 2/10/2024 |
1,467,177 | ||||
| 8,785,889 | Delta Air Lines, Inc., Series 2007-1, Class B, 8.021%, 2/10/2024 |
6,940,852 | ||||
| 29,025,486 | Delta Air Lines, Inc., Series 2007-1, Class C, 8.954%, 8/10/2014 |
23,641,258 | ||||
| 25,391,757 | Northwest Airlines, Inc., Series 07-1, Class B, 8.028%, 11/01/2017 |
18,838,398 | ||||
| 1,500,000 | Qantas Airways Ltd., 144A, 5.125%, 6/20/2013 |
1,499,738 | ||||
| Principal Amount (‡) |
Description | Value (†) | ||||
| Airlines — continued | ||||||
| $ | 32,710,000 | Qantas Airways Ltd., 144A, 6.050%, 4/15/2016 |
$ | 32,167,734 | ||
| 18,286,946 | United Air Lines, Inc., Series 2007-1, Class A, 6.636%, 1/02/2024 |
15,178,165 | ||||
| 188,317,693 | ||||||
| Automotive — 2.8% | ||||||
| 1,853,000 | Cummins, Inc., 6.750%, 2/15/2027 |
1,637,400 | ||||
| 2,145,000 | Cummins, Inc., 7.125%, 3/01/2028 |
2,032,387 | ||||
| 3,100,000 | FCE Bank PLC, EMTN, 4.625%, 10/25/2010, (NOK) |
493,759 | ||||
| 6,500,000 | FCE Bank PLC, EMTN, 7.125%, 1/16/2012, (EUR) |
9,036,180 | ||||
| 4,500,000 | FCE Bank PLC, EMTN, 7.125%, 1/15/2013, (EUR) |
6,091,190 | ||||
| 5,700,000 | FCE Bank PLC, EMTN, 7.875%, 2/15/2011, (GBP) |
8,927,273 | ||||
| 17,816,000 | Ford Motor Co., 6.375%, 2/01/2029 |
12,827,520 | ||||
| 1,705,000 | Ford Motor Co., 6.500%, 8/01/2018 |
1,357,606 | ||||
| 500,000 | Ford Motor Co., 6.625%, 2/15/2028 |
360,000 | ||||
| 73,114,000 | Ford Motor Co., 6.625%, 10/01/2028 |
52,642,080 | ||||
| 1,940,000 | Ford Motor Co., 7.125%, 11/15/2025 |
1,455,000 | ||||
| 86,090,000 | Ford Motor Co., 7.450%, 7/16/2031 |
69,732,900 | ||||
| 800,000 | Ford Motor Co., 7.500%, 8/01/2026 |
584,000 | ||||
| 10,685,000 | Ford Motor Credit Co. LLC, 7.000%, 10/01/2013 |
10,029,091 | ||||
| 24,235,000 | Ford Motor Credit Co. LLC, 7.250%, 10/25/2011 |
23,537,250 | ||||
| 5,940,000 | Ford Motor Credit Co. LLC, 7.500%, 8/01/2012 |
5,703,392 | ||||
| 1,030,000 | Ford Motor Credit Co. LLC, 7.875%, 6/15/2010 |
1,034,513 | ||||
| 47,810,000 | Ford Motor Credit Co. LLC, 8.000%, 6/01/2014 |
45,945,267 | ||||
| 14,595,000 | Ford Motor Credit Co. LLC, 8.000%, 12/15/2016 |
13,540,745 | ||||
| 10,625,000 | Ford Motor Credit Co. LLC, 8.625%, 11/01/2010 |
10,748,144 | ||||
| 50,000,000 | Ford Motor Credit Co. LLC, 8.700%, 10/01/2014 |
48,977,550 | ||||
| 1,645,000 | Ford Motor Credit Co. LLC, 9.750%, 9/15/2010 |
1,681,007 | ||||
| 7,640,000 | Ford Motor Credit Co. LLC, EMTN, 4.875%, 1/15/2010, (EUR) |
11,096,136 | ||||
| 4,977,000 | Goodyear Tire & Rubber Co. (The), 7.000%, 3/15/2028 |
4,329,990 | ||||
| 9,635,000 | Goodyear Tire & Rubber Co. (The), 10.500%, 5/15/2016 |
10,453,975 | ||||
| 354,254,355 | ||||||
See accompanying notes to financial statements.
39
Table of Contents
LOOMIS SAYLES STRATEGIC INCOME FUND — PORTFOLIO OF INVESTMENTS (continued)
Investments as of September 30, 2009
| Principal Amount (‡) |
Description | Value (†) | ||||
| Banking — 6.7% | ||||||
| $ | 67,925,000 | AgriBank FCB, 9.125%, 7/15/2019(b) |
$ | 73,461,839 | ||
| 20,565,000 | Associates Corp. of North America, 6.950%, 11/01/2018 |
20,120,220 | ||||
| 22,125,000 | BAC Capital Trust VI, 5.625%, 3/08/2035 |
17,155,504 | ||||
| 11,685,000 | Bank of America Corp., 5.750%, 12/01/2017 |
11,663,698 | ||||
| 4,560,000 | Bank of America Corp., 6.000%, 9/01/2017 |
4,613,503 | ||||
| 1,006,000,000 | Barclays Financial LLC, 144A, 4.160%, 2/22/2010, (THB) |
30,547,351 | ||||
| 56,650,000,000 | Barclays Financial LLC, 144A, 4.470%, 12/04/2011, (KRW) |
48,079,779 | ||||
| 17,310,000,000 | Barclays Financial LLC, EMTN, 144A, 4.060%, 9/16/2010, (KRW) |
14,832,316 | ||||
| 135,000,000 | Barclays Financial LLC, EMTN, 144A, 4.100%, 3/22/2010, (THB) |
4,107,782 | ||||
| 21,340,000,000 | Barclays Financial LLC, EMTN, 144A, 4.460%, 9/23/2010, (KRW) |
18,350,679 | ||||
| 224,520,000,000 | BNP Paribas SA, EMTN, 144A, Zero Coupon, 6/13/2011, (IDR) |
19,592,361 | ||||
| 2,165,000 | Capital One Financial Corp., 6.150%, 9/01/2016 |
2,126,017 | ||||
| 18,650,000 | Citibank NA, 144A, 15.000%, 7/02/2010, (BRL) |
10,966,613 | ||||
| 47,120,000 | Citigroup, Inc., 5.000%, 9/15/2014 |
44,838,685 | ||||
| 3,060,000 | Citigroup, Inc., 5.850%, 12/11/2034 |
2,626,576 | ||||
| 20,715,000 | Citigroup, Inc., 5.875%, 2/22/2033 |
17,169,193 | ||||
| 4,210,000 | Citigroup, Inc., 5.875%, 5/29/2037 |
3,670,712 | ||||
| 10,819,000 | Citigroup, Inc., 6.000%, 10/31/2033 |
9,053,631 | ||||
| 1,850,000 | Citigroup, Inc., 6.125%, 8/25/2036 |
1,587,674 | ||||
| 45,862,000 | Citigroup, Inc., 6.375%, 8/12/2014 |
47,416,263 | ||||
| 64,000,000 | Citigroup, Inc., MTN, 5.500%, 10/15/2014 |
63,907,520 | ||||
| 1,285,000 | Goldman Sachs Group, Inc. (The), 6.150%, 4/01/2018 |
1,351,708 | ||||
| 30,775,000 | Goldman Sachs Group, Inc. (The), 6.750%, 10/01/2037 |
31,760,754 | ||||
| 119,806,078 | HSBC Bank USA, 144A, Zero Coupon, 11/28/2011 |
93,532,605 | ||||
| 9,090,000 | ICICI Bank Ltd., (fixed rate to 4/30/2017, variable rate thereafter), 144A, 6.375%, 4/30/2022 |
7,435,720 | ||||
| 109,312,000,000 | JPMorgan Chase & Co., 144A, Zero Coupon, 3/28/2011, (IDR) |
9,820,549 | ||||
| 229,157,783,660 | JPMorgan Chase & Co., 144A, Zero Coupon, 4/12/2012, (IDR) |
18,538,900 | ||||
| 599,726,100,000 | JPMorgan Chase & Co., EMTN, Zero Coupon, 3/28/2011, (IDR) |
53,879,169 | ||||
| 92,000,000 | JPMorgan Chase Bank, 144A, Zero Coupon, 5/17/2010, (BRL) |
48,908,106 | ||||
| Principal Amount (‡) |
Description | Value (†) | |||
| Banking — continued | |||||
| 76,496,404,750 | JPMorgan Chase Bank, EMTN, 144A, Zero Coupon, 10/21/2010, (IDR) |
$ | 7,272,105 | ||
| 60,000,000 | Kreditanstalt fuer Wiederaufbau, EMTN, 10.750%, 2/01/2010, (ISK) |
394,065 | |||
| 800,000 | Merrill Lynch & Co., Inc., Series C, 6.050%, 6/01/2034 |
747,001 | |||
| 1,400,000 | Merrill Lynch & Co., Inc., 6.110%, 1/29/2037 |
1,331,621 | |||
| 51,500,000 | Merrill Lynch & Co., Inc., 10.710%, 3/08/2017, (BRL) |
28,398,256 | |||
| 3,450,000 | Merrill Lynch & Co., Inc., EMTN, 4.625%, 9/14/2018, (EUR) |
4,364,596 | |||
| 5,410,000 | Merrill Lynch & Co., Inc., MTN, 6.875%, 4/25/2018 |
5,689,681 | |||
| 2,255,000 | Merrill Lynch & Co., Inc., Series C, MTN, 6.400%, 8/28/2017 |
2,283,783 | |||
| 26,665,000 | Morgan Stanley, 4.750%, 4/01/2014 |
26,468,212 | |||
| 5,050,000 | Morgan Stanley, 5.125%, 11/30/2015, (GBP) |
7,944,834 | |||
| 6,600,000 | Morgan Stanley, 7.300%, 5/13/2019 |
7,261,808 | |||
| 7,900,000 | Morgan Stanley, Series F, GMTN, 6.625%, 4/01/2018 |
8,353,642 | |||
| 2,900,000 | Morgan Stanley, Series F, MTN, 5.550%, 4/27/2017 |
2,889,003 | |||
| 5,210,000 | Morgan Stanley, Series F, MTN, 5.950%, 12/28/2017 |
5,304,530 | |||
| 839,818,564 | |||||
| Brokerage — 0.0% | |||||
| 4,000,000 | Jefferies Group, Inc., 8.500%, 7/15/2019 |
4,233,472 | |||
| Building Materials — 1.0% | |||||
| 6,345,000 | Masco Corp., 0.600%, 3/12/2010(c) |
6,244,210 | |||
| 3,255,000 | Masco Corp., 4.800%, 6/15/2015 |
2,987,045 | |||
| 2,220,000 | Masco Corp., 5.850%, 3/15/2017 |
2,047,389 | |||
| 13,440,000 | Masco Corp., 6.125%, 10/03/2016 |
12,739,628 | |||
| 1,795,000 | Masco Corp., 6.500%, 8/15/2032 |
1,452,365 | |||
| 18,935,000 | Owens Corning, Inc., 6.500%, 12/01/2016 |
18,474,728 | |||
| 35,980,000 | Owens Corning, Inc., 7.000%, 12/01/2036 |
29,481,436 | |||
| 44,212,000 | USG Corp., 6.300%, 11/15/2016 |
37,580,200 | |||
| 14,155,000 | USG Corp., 9.500%, 1/15/2018 |
13,659,575 | |||
| 124,666,576 | |||||
| Chemicals — 0.8% | |||||
| 23,584,000 | Borden, Inc., 7.875%, 2/15/2023 |
13,207,040 | |||
| 6,920,000 | Borden, Inc., 8.375%, 4/15/2016 |
4,567,200 | |||
| 8,757,000 | Borden, Inc., 9.200%, 3/15/2021 |
5,429,340 | |||
See accompanying notes to financial statements.
40
Table of Contents
LOOMIS SAYLES STRATEGIC INCOME FUND — PORTFOLIO OF INVESTMENTS (continued)
Investments as of September 30, 2009
| Principal Amount (‡) |
Description | Value (†) | ||||
| Chemicals — continued | ||||||
| $ | 38,140,000 | Chevron Phillips Chemical Co. LLC, 144A, 8.250%, 6/15/2019 |
$ | 46,062,174 | ||
| 14,550,000 | Hercules, Inc., Subordinated Note, 6.500%, 6/30/2029 |
8,093,437 | ||||
| 1,575,000 | Hexion US Finance Corp./Hexion Nova Scotia Finance ULC, 9.750%, 11/15/2014 |
1,354,500 | ||||
| 1,650,000 | Koppers Holdings, Inc., (Step to 9.875% on 11/15/2009), Zero Coupon, 11/15/2014(d) |
1,654,125 | ||||
| 5,350,000 | Methanex Corp., Senior Note, 6.000%, 8/15/2015 |
4,546,018 | ||||
| 6,465,000 | Mosaic Global Holdings, Inc., 7.300%, 1/15/2028 |
6,465,899 | ||||
| 5,820,000 | Mosaic Global Holdings, Inc., 7.375%, 8/01/2018 |
6,274,926 | ||||
| 97,654,659 | ||||||
| Construction Machinery — 0.9% | ||||||
| 50,000,000 | Case New Holland, Inc., 144A, 7.750%, 9/01/2013 |
49,750,000 | ||||
| 7,965,000 | Caterpillar Financial Services Corp., MTN, 6.125%, 2/17/2014 |
8,732,165 | ||||
| 1,425,000 | Joy Global, Inc., 6.625%, 11/15/2036 |
1,327,777 | ||||
| 1,645,000 | RSC Equipment Rental, Inc., 9.500%, 12/01/2014 |
1,587,425 | ||||
| 3,225,000 | Terex Corp., 8.000%, 11/15/2017 |
2,958,937 | ||||
| 18,243,000 | United Rentals North America, Inc., 7.000%, 2/15/2014 |
15,871,410 | ||||
| 1,630,000 | United Rentals North America, Inc., 7.750%, 11/15/2013 |
1,467,000 | ||||
| 26,935,000 | United Rentals North America, Inc., 144A, 10.875%, 6/15/2016 |
28,820,450 | ||||
| 110,515,164 | ||||||
| Consumer Cyclical Services — 0.8% | ||||||
| 101,985,000 | Western Union Co. (The), 6.200%, 11/17/2036 |
102,376,826 | ||||
| Consumer Products — 0.1% | ||||||
| 9,860,000 | Whirlpool Corp., 8.000%, 5/01/2012 |
10,642,904 | ||||
| 5,915,000 | Whirlpool Corp., MTN, 8.600%, 5/01/2014 |
6,616,667 | ||||
| 17,259,571 | ||||||
| Distributors — 0.0% | ||||||
| 1,500,000 | EQT Corp., 8.125%, 6/01/2019 |
1,712,055 | ||||
| Diversified Manufacturing — 0.7% | ||||||
| 1,441,000 | Textron Financial Corp., 5.400%, 4/28/2013 |
1,414,915 | ||||
| 550,000 | Textron Financial Corp., Series E, MTN, 5.125%, 8/15/2014 |
512,143 | ||||
| 9,950,000 | Textron, Inc., 3.875%, 3/11/2013, (EUR) |
13,444,565 | ||||
| 4,250,000 | Textron, Inc., 5.600%, 12/01/2017 |
3,957,370 | ||||
| 30,350,000 | Textron, Inc., 6.200%, 3/15/2015 |
30,470,156 | ||||
| 20,485,000 | Textron, Inc., 7.250%, 10/01/2019 |
20,758,229 | ||||
| Principal Amount (‡) |
Description | Value (†) | |||
| Diversified Manufacturing — continued | |||||
| 15,630,000 | Textron, Inc., EMTN, 6.625%, 4/07/2020, (GBP) |
$ | 20,732,656 | ||
| 91,290,034 | |||||
| Electric — 3.5% | |||||
| 4,020,000 | AES Corp. (The), 7.750%, 3/01/2014 |
4,050,150 | |||
| 5,565,000 | AES Corp. (The), 8.375%, 3/01/2011, (GBP)(b) |
8,982,649 | |||
| 8,752,194 | AES Ironwood LLC, 8.857%, 11/30/2025 |
8,030,138 | |||
| 1,113,141 | AES Red Oak LLC, Series A, 8.540%, 11/30/2019 |
1,049,135 | |||
| 70,811,970 | Bruce Mansfield Unit, 6.850%, 6/01/2034(b) |
69,153,554 | |||
| 3,552,768 | CE Generation LLC, 7.416%, 12/15/2018 |
3,453,756 | |||
| 32,125,000 | Cleveland Electric Illuminating Co., 5.950%, 12/15/2036 |
31,076,440 | |||
| 11,275,000 | Dynegy Holdings, Inc., 7.125%, 5/15/2018 |
8,681,750 | |||
| 1,000,000 | Dynegy Holdings, Inc., 7.500%, 6/01/2015 |
925,000 | |||
| 10,185,000 | Dynegy Holdings, Inc., 7.625%, 10/15/2026 |
6,976,725 | |||
| 500,000 | Dynegy Holdings, Inc., 7.750%, 6/01/2019 |
426,250 | |||
| 7,455,000 | Dynegy Holdings, Inc., 8.375%, 5/01/2016 |
6,970,425 | |||
| 4,744,113 | Dynegy Roseton/Danskammer Pass Through Trust, Series A, 7.270%, 11/08/2010 |
4,708,532 | |||
| 95,200,000 | Edison Mission Energy, 7.625%, 5/15/2027 |
68,068,000 | |||
| 250,000 | Empresa Nacional de Electricidad SA, (Endesa-Chile), 8.350%, 8/01/2013 |
288,553 | |||
| 4,875,000 | Empresa-Chile Overseas Co., 7.875%, 2/01/2027 |
5,403,474 | |||
| 555,000 | Enersis SA, Cayman Islands, 7.400%, 12/01/2016 |
619,791 | |||
| 5,310,000 | ITC Holdings Corp., 144A, 6.375%, 9/30/2036 |
5,064,736 | |||
| 31,735,000 | NGC Corp. Capital Trust I, Series B, 8.316%, 6/01/2027 |
14,280,750 | |||
| 955,000 | NiSource Finance Corp., 5.400%, 7/15/2014 |
970,488 | |||
| 43,450,000 | NiSource Finance Corp., 6.400%, 3/15/2018 |
43,369,009 | |||
| 2,500,000 | NRG Energy, Inc., 7.250%, 2/01/2014 |
2,456,250 | |||
| 5,000,000 | NRG Energy, Inc., 7.375%, 2/01/2016 |
4,837,500 | |||
| 1,442,125 | Quezon Power (Philippines) Ltd., Senior Secured Note, 8.860%, 6/15/2017 |
1,348,387 | |||
| 25,230,000 | RRI Energy, Inc., 7.875%, 6/15/2017 |
24,630,787 | |||
| 1,050,000 | SP PowerAssets Ltd., EMTN, 3.730%, 10/22/2010, (SGD) |
757,756 | |||
| 655,000 | Texas Competitive Electric Holdings Co. LLC, Series A, 10.250%, 11/01/2015 |
471,600 | |||
See accompanying notes to financial statements.
41
Table of Contents
LOOMIS SAYLES STRATEGIC INCOME FUND — PORTFOLIO OF INVESTMENTS (continued)
Investments as of September 30, 2009
| Principal Amount (‡) |
Description | Value (†) | ||||
| Electric — continued | ||||||
| $ | 8,785,000 | Toledo Edison Co., 6.150%, 5/15/2037 |
$ | 9,169,107 | ||
| 46,215,000 | TXU Corp., Series P, 5.550%, 11/15/2014 |
31,539,288 | ||||
| 101,030,000 | TXU Corp., Series Q, 6.500%, 11/15/2024 |
46,728,396 | ||||
| 6,245,000 | TXU Corp., Series R, 6.550%, 11/15/2034 |
2,809,076 | ||||
| 7,300,000 | White Pine Hydro LLC, 6.310%, 7/10/2017(b) |
6,295,688 | ||||
| 10,935,000 | White Pine Hydro LLC, 6.960%, 7/10/2037(b) |
7,979,138 | ||||
| 4,000,000 | White Pine Hydro LLC, 7.260%, 7/20/2015(b) |
3,522,932 | ||||
| 435,095,210 | ||||||
| Entertainment — 0.2% | ||||||
| 25,544,000 | Viacom, Inc., Class B, 6.875%, 4/30/2036 |
26,984,554 | ||||
| Financial Other — 0.2% | ||||||
| 20,000,000 | National Life Insurance Co., 144A, 10.500%, 9/15/2039 |
20,368,400 | ||||
| Food & Beverage — 1.1% | ||||||
| 48,729,000 | Anheuser-Busch Inbev Worldwide, Inc., 144A, 5.375%, 11/15/2014 |
51,993,356 | ||||
| 2,085,000 | Aramark Services, Inc., 5.000%, 6/01/2012 |
1,970,325 | ||||
| 23,710,000 | Corn Products International, Inc., 6.625%, 4/15/2037 |
23,934,771 | ||||
| 9,916,000 | Kraft Foods, Inc., 6.500%, 8/11/2017 |
10,726,613 | ||||
| 27,245,000 | Kraft Foods, Inc., 7.000%, 8/11/2037 |
30,349,867 | ||||
| 14,120,000 | Sara Lee Corp., 6.125%, 11/01/2032 |
14,373,666 | ||||
| 965,000 | Smithfield Foods, Inc., 7.750%, 7/01/2017 |
793,712 | ||||
| 134,142,310 | ||||||
| Government Owned — No Guarantee — 0.3% | ||||||
| 26,435,000 | Abu Dhabi National Energy Co., 144A, 7.250%, 8/01/2018 |
28,316,564 | ||||
| 12,100,000 | DP World Ltd., 144A, 6.850%, 7/02/2037 |
10,641,817 | ||||
| 38,958,381 | ||||||
| Government Sponsored — 0.4% | ||||||
| 66,595,000 | Queensland Treasury Corp., 144A, 7.125%, 9/18/2017, (NZD) |
49,644,479 | ||||
| Health Insurance — 0.6% | ||||||
| 15,325,000 | CIGNA Corp., 6.150%, 11/15/2036 |
13,580,249 | ||||
| 2,000,000 | CIGNA Corp., 6.350%, 3/15/2018 |
2,005,432 | ||||
| 6,700,000 | Unum Group, 7.125%, 9/30/2016 |
6,779,033 | ||||
| 50,000,000 | WellPoint, Inc., 6.375%, 6/15/2037 |
54,298,700 | ||||
| 76,663,414 | ||||||
| Principal Amount (‡) |
Description | Value (†) | ||||
| Healthcare — 3.8% | ||||||
| $ | 2,765,000 | Boston Scientific Corp., 5.450%, 6/15/2014 |
$ | 2,771,913 | ||
| 8,230,000 | Boston Scientific Corp., 6.400%, 6/15/2016 |
8,343,163 | ||||
| 16,510,000 | Boston Scientific Corp., 7.000%, 11/15/2035 |
15,127,287 | ||||
| 17,785,000 | HCA, Inc., 5.750%, 3/15/2014 |
15,695,262 | ||||
| 3,800,000 | HCA, Inc., 6.250%, 2/15/2013 |
3,629,000 | ||||
| 17,035,000 | HCA, Inc., 6.375%, 1/15/2015 |
15,161,150 | ||||
| 49,350,000 | HCA, Inc., 6.500%, 2/15/2016 |
43,798,125 | ||||
| 2,074,000 | HCA, Inc., 6.750%, 7/15/2013 |
1,985,855 | ||||
| 14,405,000 | HCA, Inc., 7.050%, 12/01/2027 |
10,925,055 | ||||
| 10,944,000 | HCA, Inc., 7.190%, 11/15/2015 |
10,136,803 | ||||
| 20,077,000 | HCA, Inc., 7.500%, 12/15/2023 |
16,207,520 | ||||
| 18,780,000 | HCA, Inc., 7.500%, 11/06/2033 |
14,531,532 | ||||
| 43,278,000 | HCA, Inc., 7.690%, 6/15/2025 |
35,144,116 | ||||
| 30,985,000 | HCA, Inc., 8.360%, 4/15/2024 |
25,213,672 | ||||
| 13,545,000 | HCA, Inc., MTN, 7.580%, 9/15/2025 |
10,958,460 | ||||
| 9,277,000 | HCA, Inc., MTN, 7.750%, 7/15/2036 |
7,271,266 | ||||
| 11,370,000 | Hospira, Inc., 6.050%, 3/30/2017 |
11,906,380 | ||||
| 176,070,000 | Medco Health Solutions, Inc., 7.125%, 3/15/2018 |
199,504,565 | ||||
| 3,260,000 | Owens & Minor, Inc., 6.350%, 4/15/2016(b) |
2,939,271 | ||||
| 31,009,000 | Tenet Healthcare Corp., 6.875%, 11/15/2031 |
24,187,020 | ||||
| 1,570,000 | Tenet Healthcare Corp., 7.375%, 2/01/2013 |
1,554,300 | ||||
| 4,765,000 | Tenet Healthcare Corp., 9.250%, 2/01/2015 |
4,973,469 | ||||
| 481,965,184 | ||||||
| Home Construction — 1.8% | ||||||
| 2,840,000 | Centex Corp., 5.250%, 6/15/2015 |
2,804,500 | ||||
| 43,470,000 | D.R. Horton, Inc., 5.250%, 2/15/2015 |
40,535,775 | ||||
| 4,335,000 | D.R. Horton, Inc., 5.625%, 9/15/2014 |
4,183,275 | ||||
| 1,625,000 | D.R. Horton, Inc., 6.500%, 4/15/2016 |
1,598,594 | ||||
| 16,160,000 | D.R. Horton, Inc., Guaranteed Note, 5.625%, 1/15/2016 |
15,109,600 | ||||
| 11,265,000 | Desarrolladora Homex SAB de CV, 7.500%, 9/28/2015 |
11,067,862 | ||||
See accompanying notes to financial statements.
42
Table of Contents
LOOMIS SAYLES STRATEGIC INCOME FUND — PORTFOLIO OF INVESTMENTS (continued)
Investments as of September 30, 2009
| Principal Amount (‡) |
Description | Value (†) | ||||
| Home Construction — continued | ||||||
| $ | 6,290,000 | K. Hovnanian Enterprises, Inc., 7.500%, 5/15/2016 |
$ | 4,780,400 | ||
| 1,935,000 | K. Hovnanian Enterprises, Inc., 7.750%, 5/15/2013 |
1,489,950 | ||||
| 1,235,000 | K. Hovnanian Enterprises, Inc., 8.875%, 4/01/2012 |
1,037,400 | ||||
| 4,830,000 | K. Hovnanian Enterprises, Inc., Guaranteed Note, 6.250%, 1/15/2015 |
3,670,800 | ||||
| 16,075,000 | K. Hovnanian Enterprises, Inc., Guaranteed Note, 6.250%, 1/15/2016 |
12,056,250 | ||||
| 6,040,000 | K. Hovnanian Enterprises, Inc., Guaranteed Note, 6.375%, 12/15/2014 |
4,590,400 | ||||
| 2,490,000 | K. Hovnanian Enterprises, Inc., Guaranteed Note, 6.500%, 1/15/2014 |
1,942,200 | ||||
| 1,685,000 | KB Home, 5.750%, 2/01/2014 |
1,617,600 | ||||
| 8,340,000 | KB Home, Guaranteed Note, 5.875%, 1/15/2015 |
7,860,450 | ||||
| 5,805,000 | KB Home, Guaranteed Note, 6.250%, 6/15/2015 |
5,543,775 | ||||
| 11,315,000 | KB Home, Guaranteed Note, 7.250%, 6/15/2018 |
11,032,125 | ||||
| 2,720,000 | Lennar Corp., Series B, 5.125%, 10/01/2010 |
2,713,200 | ||||
| 16,755,000 | Lennar Corp., Series B, 5.500%, 9/01/2014 |
15,665,925 | ||||
| 5,970,000 | Lennar Corp., Series B, 5.600%, 5/31/2015 |
5,507,325 | ||||
| 23,885,000 | Lennar Corp., Series B, 6.500%, 4/15/2016 |
22,451,900 | ||||
| 4,240,000 | Pulte Homes, Inc., 5.200%, 2/15/2015 |
4,028,000 | ||||
| 46,260,000 | Pulte Homes, Inc., 6.000%, 2/15/2035 |
34,926,300 | ||||
| 13,190,000 | Pulte Homes, Inc., 6.375%, 5/15/2033 |
10,156,300 | ||||
| 4,245,000 | Toll Brothers Financial Corp., 5.150%, 5/15/2015 |
4,082,009 | ||||
| 1,749,000 | Toll Corp., 8.250%, 12/01/2011 |
1,783,980 | ||||
| 232,235,895 | ||||||
| Independent Energy — 1.3% | ||||||
| 48,410,000 | Anadarko Petroleum Corp., 6.450%, 9/15/2036 |
49,982,986 | ||||
| 4,185,000 | Chesapeake Energy Corp., 6.250%, 1/15/2017, (EUR) |
5,634,186 | ||||
| 14,650,000 | Chesapeake Energy Corp., 6.500%, 8/15/2017 |
13,441,375 | ||||
| 22,690,000 | Chesapeake Energy Corp., 6.875%, 11/15/2020 |
20,194,100 | ||||
| 15,054,000 | Connacher Oil and Gas Ltd., 144A, 10.250%, 12/15/2015 |
12,269,010 | ||||
| 3,000,000 | Connacher Oil and Gas Ltd., 144A, 11.750%, 7/15/2014 |
3,195,000 | ||||
| 6,495,000 | Hilcorp Energy I LP, 144A, 7.750%, 11/01/2015 |
6,137,775 | ||||
| 1,805,000 | Penn Virginia Corp., 10.375%, 6/15/2016 |
1,949,400 | ||||
| Principal Amount (‡) |
Description | Value (†) | ||||
| Independent Energy — continued | ||||||
| $ | 7,175,000 | Pioneer Natural Resources Co., 5.875%, 7/15/2016 |
$ | 6,631,738 | ||
| 1,760,000 | Pioneer Natural Resources Co., 6.875%, 5/01/2018 |
1,679,591 | ||||
| 4,798,000 | Pioneer Natural Resources Co., 7.200%, 1/15/2028 |
4,164,290 | ||||
| 2,499,000 | Swift Energy Co., 7.125%, 6/01/2017 |
2,174,130 | ||||
| 9,170,000 | Talisman Energy, Inc., 5.850%, 2/01/2037 |
8,820,118 | ||||
| 24,260,000 | Talisman Energy, Inc., 6.250%, 2/01/2038 |
24,748,475 | ||||
| 161,022,174 | ||||||
| Industrial Other — 0.2% | ||||||
| 2,590,000 | Great Lakes Dredge & Dock Corp., Senior Subordinated Note, 7.750%, 12/15/2013 |
2,541,438 | ||||
| 20,000,000 | Ranhill Labuan Ltd., 144A, 12.500%, 10/26/2011 |
16,000,000 | ||||
| 18,541,438 | ||||||
| Life Insurance — 0.2% | ||||||
| 2,455,000 | American International Group, Inc., MTN, 5.450%, 5/18/2017 |
1,779,605 | ||||
| 2,185,000 | American International Group, Inc., Series G, MTN, 5.600%, 10/18/2016 |
1,603,228 | ||||
| 13,750,000 | American International Group, Inc., Series G, MTN, 5.850%, 1/16/2018 |
9,955,110 | ||||
| 1,500,000 | MetLife, Inc., 6.400%, 12/15/2066 |
1,267,500 | ||||
| 9,620,000 | MetLife, Inc., 10.750%, 8/01/2069 |
11,592,100 | ||||
| 26,197,543 | ||||||
| Local Authorities — 0.7% | ||||||
| 128,820,000 | Virginia Tobacco Settlement Financing Corp., Series A-1, 6.706%, 6/01/2046(b) |
92,012,261 | ||||
| Media Cable — 2.4% | ||||||
| 47,035,000 | Comcast Corp., 5.650%, 6/15/2035 |
45,490,794 | ||||
| 12,560,000 | Comcast Corp., 6.500%, 11/15/2035 |
13,383,773 | ||||
| 161,264,000 | Comcast Corp., 6.950%, 8/15/2037 |
179,996,749 | ||||
| 400,000 | CSC Holdings, Inc., 7.875%, 2/15/2018 |
408,000 | ||||
| 2,540,000 | CSC Holdings, Inc., 144A, 8.500%, 4/15/2014 |
2,667,000 | ||||
| 25,270,000 | Shaw Communications, Inc., 5.650%, 10/01/2019, (CAD) |
23,969,503 | ||||
| 10,000,000 | Shaw Communications, Inc., 5.700%, 3/02/2017, (CAD) |
9,743,800 | ||||
| 17,959,000 | Time Warner Cable, Inc., 6.750%, 7/01/2018 |
19,840,385 | ||||
| 2,720,000 | Virgin Media Finance PLC, 9.125%, 8/15/2016 |
2,794,800 | ||||
| 5,070,000 | Virgin Media Finance PLC, 9.750%, 4/15/2014, (GBP) |
8,386,219 | ||||
| 306,681,023 | ||||||
See accompanying notes to financial statements.
43
Table of Contents
LOOMIS SAYLES STRATEGIC INCOME FUND — PORTFOLIO OF INVESTMENTS (continued)
Investments as of September 30, 2009
| Principal Amount (‡) |
Description | Value (†) | ||||
| Media Non-Cable — 0.6% | ||||||
| $ | 225,000 | Intelsat Corp., 6.875%, 1/15/2028 |
$ | 186,750 | ||
| 46,000,000 | News America, Inc., 6.150%, 3/01/2037 |
45,008,562 | ||||
| 11,140,000 | News America, Inc., 6.200%, 12/15/2034 |
10,960,390 | ||||
| 14,360,000 | News America, Inc., 6.400%, 12/15/2035 |
14,486,052 | ||||
| 4,335,000 | R.H. Donnelley Corp., Series A-1, 6.875%, 1/15/2013(e) |
249,263 | ||||
| 1,910,000 | R.H. Donnelley Corp., Series A-2, 6.875%, 1/15/2013(e) |
109,825 | ||||
| 470,000 | R.H. Donnelley Corp., Series A-3, 8.875%, 1/15/2016(e) |
27,025 | ||||
| 4,845,000 | R.H. Donnelley Corp., Series A-4, 8.875%, 10/15/2017(e) |
278,587 | ||||
| 71,306,454 | ||||||
| Metals & Mining — 0.8% | ||||||
| 400,000 | Alcoa, Inc., 5.550%, 2/01/2017 |
388,297 | ||||
| 10,000,000 | Alcoa, Inc., 5.720%, 2/23/2019 |
9,052,680 | ||||
| 3,949,000 | Alcoa, Inc., 5.870%, 2/23/2022 |
3,423,743 | ||||
| 4,330,000 | Alcoa, Inc., 6.750%, 1/15/2028 |
3,776,678 | ||||
| 9,785,000 | Algoma Acquistion Corp., 144A, 9.875%, 6/15/2015 |
8,219,400 | ||||
| 65,000 | ArcelorMittal, 6.125%, 6/01/2018 |
64,035 | ||||
| 10,850,000 | ArcelorMittal USA Partnership, 9.750%, 4/01/2014 |
11,365,375 | ||||
| 1,840,000 | Rio Tinto Alcan, Inc., 5.750%, 6/01/2035 |
1,773,000 | ||||
| 29,436,000 | Rio Tinto Finance (USA) Ltd., 8.950%, 5/01/2014 |
34,739,985 | ||||
| 1,730,000 | Teck Resources Ltd., 10.250%, 5/15/2016 |
1,954,900 | ||||
| 1,000,000 | Teck Resources Ltd., 10.750%, 5/15/2019 |
1,162,500 | ||||
| 7,000,000 | United States Steel Corp., 6.050%, 6/01/2017 |
6,537,944 | ||||
| 6,779,000 | United States Steel Corp., 6.650%, 6/01/2037 |
5,529,210 | ||||
| 16,435,000 | United States Steel Corp., 7.000%, 2/01/2018 |
15,783,714 | ||||
| 103,771,461 | ||||||
| Non-Captive Consumer — 3.2% | ||||||
| 4,900,000 | American General Finance Corp., MTN, 5.750%, 9/15/2016 |
3,401,712 | ||||
| 229,130,000 | American General Finance Corp., Series J, MTN, 6.900%, 12/15/2017 |
160,249,168 | ||||
| 109,950(†††) | SLM Corp., 6.000%, 12/15/2043 |
1,553,318 | ||||
| 20,590,000 | SLM Corp., MTN, 5.050%, 11/14/2014 |
15,135,565 | ||||
| 2,160,000 | SLM Corp., MTN, 5.125%, 8/27/2012 |
1,848,256 | ||||
| Principal Amount (‡) |
Description | Value (†) | |||
| Non-Captive Consumer — continued | |||||
| 4,700,000 | SLM Corp., Series 7, EMTN, 4.750%, 3/17/2014, (EUR) |
$ | 5,055,139 | ||
| 7,160,000 | SLM Corp., Series A, MTN, 4.500%, 7/26/2010 |
6,957,114 | |||
| 52,268,000 | SLM Corp., Series A, MTN, 5.000%, 10/01/2013 |
41,608,412 | |||
| 37,670,000 | SLM Corp., Series A, MTN, 5.000%, 4/15/2015 |
28,068,407 | |||
| 14,075,000 | SLM Corp., Series A, MTN, 5.000%, 6/15/2018 |
8,826,784 | |||
| 19,605,000 | SLM Corp., Series A, MTN, 5.375%, 1/15/2013 |
16,345,826 | |||
| 23,420,000 | SLM Corp., Series A, MTN, 5.375%, 5/15/2014 |
17,925,153 | |||
| 1,390,000 | SLM Corp., Series A, MTN, 5.400%, 10/25/2011 |
1,282,581 | |||
| 28,150,000 | SLM Corp., Series A, MTN, 5.625%, 8/01/2033 |
17,667,869 | |||
| 6,100,000 | SLM Corp., Series A, MTN, 6.500%, 6/15/2010, (NZD)(b)(f) |
4,129,285 | |||
| 95,060,000 | SLM Corp., Series A, MTN, 8.450%, 6/15/2018 |
75,810,350 | |||
| 405,864,939 | |||||
| Non-Captive Diversified — 6.7% | |||||
| 90,000 | CIT Group, Inc., 4.750%, 12/15/2010 |
62,174 | |||
| 599,000 | CIT Group, Inc., 5.400%, 2/13/2012 |
393,140 | |||
| 365,000 | CIT Group, Inc., 5.400%, 1/30/2016 |
230,098 | |||
| 1,381,000 | CIT Group, Inc., 5.600%, 4/27/2011 |
940,322 | |||
| 3,581,000 | CIT Group, Inc., 5.800%, 10/01/2036 |
2,147,490 | |||
| 7,000 | CIT Group, Inc., 5.850%, 9/15/2016 |
4,412 | |||
| 15,060,000 | CIT Group, Inc., EMTN, 3.800%, 11/14/2012, (EUR) |
13,773,772 | |||
| 15,150,000 | CIT Group, Inc., EMTN, 4.650%, 9/19/2016, (EUR) |
12,747,599 | |||
| 10,500,000 | CIT Group, Inc., EMTN, 5.500%, 12/20/2016, (GBP) |
9,564,935 | |||
| 60,000 | CIT Group, Inc., GMTN, 4.250%, 2/01/2010 |
43,258 | |||
| 18,360,000 | CIT Group, Inc., GMTN, 4.250%, 9/22/2011, (EUR) |
17,060,600 | |||
| 2,533,000 | CIT Group, Inc., GMTN, 5.000%, 2/13/2014 |
1,618,025 | |||
| 4,855,000 | CIT Group, Inc., GMTN, 5.000%, 5/13/2014, (EUR) |
4,191,690 | |||
| 341,000 | CIT Group, Inc., GMTN, 5.000%, 2/01/2015 |
218,397 | |||
| 20,730,000 | CIT Group, Inc., MTN, 4.250%, 3/17/2015, (EUR) |
17,594,430 | |||
| 3,065,000 | CIT Group, Inc., MTN, 5.125%, 9/30/2014 |
1,963,491 | |||
| 20,350,000 | CIT Group, Inc., MTN, 5.500%, 12/01/2014, (GBP) |
19,188,203 | |||
| 934,000 | CIT Group, Inc., Series A, GMTN, 6.000%, 4/01/2036 |
539,609 | |||
See accompanying notes to financial statements.
44
Table of Contents
LOOMIS SAYLES STRATEGIC INCOME FUND — PORTFOLIO OF INVESTMENTS (continued)
Investments as of September 30, 2009
| Principal Amount (‡) |
Description | Value (†) | ||||
| Non-Captive Diversified — continued | ||||||
| $ | 586,000 | CIT Group, Inc., Series A, MTN, 5.650%, 2/13/2017 |
$ | 366,430 | ||
| 75,990,000 | CIT Group, Inc., Series A, MTN, 7.625%, 11/30/2012 |
49,493,123 | ||||
| 12,860,000 | GATX Corp., 8.750%, 5/15/2014 |
14,470,779 | ||||
| 3,100,000 | General Electric Capital Corp., EMTN, 6.125%, 5/17/2012, (GBP) |
5,204,489 | ||||
| 79,035,000 | General Electric Capital Corp., Series A, EMTN, 6.750%, 9/26/2016, (NZD) |
54,759,040 | ||||
| 65,300,000 | General Electric Capital Corp., Series A, GMTN, 2.960%, 5/18/2012, (SGD) |
44,058,413 | ||||
| 30,350,000 | General Electric Capital Corp., Series A, GMTN, 6.625%, 2/04/2010, (NZD) |
22,042,764 | ||||
| 2,000,000 | General Electric Capital Corp., Series A, GMTN, 7.625%, 12/10/2014, (NZD) |
1,465,160 | ||||
| 15,305,000 | General Electric Capital Corp., Series A, MTN, 0.809%, 5/13/2024(c) |
10,674,136 | ||||
| 115,000,000 | General Electric Capital Corp., Series A, MTN, 3.485%, 3/08/2012, (SGD) |
78,965,605 | ||||
| 243,057,000 | General Electric Capital Corp., Series A, MTN, 6.500%, 9/28/2015, (NZD) |
167,851,159 | ||||
| 43,074,000 | GMAC, Inc., 144A, 5.375%, 6/06/2011 |
39,735,765 | ||||
| 3,390,000 | GMAC, Inc., 144A, 5.750%, 9/27/2010 |
3,271,350 | ||||
| 34,490,000 | GMAC, Inc., 144A, 6.000%, 12/15/2011 |
31,903,250 | ||||
| 311,000 | GMAC, Inc., 144A, 6.625%, 12/17/2010 |
298,560 | ||||
| 15,206,000 | GMAC, Inc., 144A, 6.625%, 5/15/2012 |
13,989,520 | ||||
| 22,211,000 | GMAC, Inc., 144A, 6.750%, 12/01/2014 |
18,879,350 | ||||
| 4,169,000 | GMAC, Inc., 144A, 6.875%, 9/15/2011 |
3,939,705 | ||||
| 2,947,000 | GMAC, Inc., 144A, 6.875%, 8/28/2012 |
2,711,240 | ||||
| 7,702,000 | GMAC, Inc., 144A, 7.000%, 2/01/2012 |
7,162,860 | ||||
| 17,038,000 | GMAC, Inc., 144A, 7.500%, 12/31/2013 |
14,908,250 | ||||
| 32,711,000 | GMAC, Inc., 144A, 8.000%, 12/31/2018 |
24,696,805 | ||||
| 25,955,000 | GMAC, Inc., 144A, 8.000%, 11/01/2031 |
20,893,775 | ||||
| 4,950,000 | General Motors Acceptance Corp. of Canada Ltd., EMTN, 7.125%, 9/13/2011, (AUD) |
4,017,538 | ||||
| 34,782,000 | iStar Financial, Inc., 5.150%, 3/01/2012 |
20,695,290 | ||||
| 5,255,000 | iStar Financial, Inc., 5.375%, 4/15/2010 |
4,841,169 | ||||
| 3,010,000 | iStar Financial, Inc., 5.500%, 6/15/2012 |
1,836,100 | ||||
| 19,110,000 | iStar Financial, Inc., 5.650%, 9/15/2011 |
13,185,900 | ||||
| 1,530,000 | iStar Financial, Inc., 5.700%, 3/01/2014 |
826,200 | ||||
| 4,040,000 | iStar Financial, Inc., 5.800%, 3/15/2011 |
2,868,400 | ||||
| Principal Amount (‡) |
Description | Value (†) | ||||
| Non-Captive Diversified — continued | ||||||
| $ | 4,815,000 | iStar Financial, Inc., 5.850%, 3/15/2017 |
$ | 2,515,838 | ||
| 8,815,000 | iStar Financial, Inc., 5.875%, 3/15/2016 |
4,848,250 | ||||
| 4,300,000 | iStar Financial, Inc., 6.050%, 4/15/2015 |
2,246,750 | ||||
| 35,130,000 | iStar Financial, Inc., 8.625%, 6/01/2013 |
22,131,900 | ||||
| 1,780,000 | iStar Financial, Inc., Series B, 5.125%, 4/01/2011 |
1,210,400 | ||||
| 44,610,000 | iStar Financial, Inc., Series B, 5.950%, 10/15/2013 |
25,427,700 | ||||
| 840,674,608 | ||||||
| Oil Field Services — 2.4% | ||||||
| 10,860,000 | Nabors Industries, Inc., 6.150%, 2/15/2018 |
10,887,107 | ||||
| 127,565,000 | Nabors Industries, Inc., 9.250%, 1/15/2019 |
151,599,777 | ||||
| 22,930,000 | North American Energy Partners, Inc., 8.750%, 12/01/2011 |
22,471,400 | ||||
| 3,003,000 | Rowan Cos., Inc., 7.875%, 8/01/2019 |
3,228,765 | ||||
| 15,520,000 | Weatherford International Ltd., 6.500%, 8/01/2036 |
15,816,261 | ||||
| 2,975,000 | Weatherford International Ltd., 6.800%, 6/15/2037 |
3,128,076 | ||||
| 9,580,000 | Weatherford International Ltd., 7.000%, 3/15/2038 |
10,327,939 | ||||
| 71,937,000 | Weatherford International Ltd., 9.625%, 3/01/2019 |
90,052,823 | ||||
| 307,512,148 | ||||||
| Packaging — 0.3% | ||||||
| 2,450,000 | OI European Group BV, 144A, 6.875%, 3/31/2017, (EUR) |
3,477,649 | ||||
| 1,750,000 | Owens Brockway Glass Container, Inc., 6.750%, 12/01/2014, (EUR) |
2,535,252 | ||||
| 33,261,000 | Owens-Illinois, Inc., Senior Note, 7.800%, 5/15/2018 |
33,344,152 | ||||
| 39,357,053 | ||||||
| Packaging & Containers — 0.0% | ||||||
| 4,445,000 | XL Capital Ltd., 6.250%, 5/15/2027 |
3,929,993 | ||||
| 1,425,000 | XL Capital Ltd., 6.375%, 11/15/2024 |
1,150,706 | ||||
| 5,080,699 | ||||||
| Paper — 2.4% | ||||||
| 7,955,000 | Domtar Corp., 5.375%, 12/01/2013 |
7,656,687 | ||||
| 12,430,000 | Georgia-Pacific Corp., 7.250%, 6/01/2028 |
11,062,700 | ||||
| 11,605,000 | Georgia-Pacific Corp., 7.375%, 12/01/2025 |
10,444,500 | ||||
| 120,000 | Georgia-Pacific Corp., 7.700%, 6/15/2015 |
121,200 | ||||
| 42,425,000 | Georgia-Pacific Corp., 7.750%, 11/15/2029 |
39,031,000 | ||||
See accompanying notes to financial statements.
45
Table of Contents
LOOMIS SAYLES STRATEGIC INCOME FUND — PORTFOLIO OF INVESTMENTS (continued)
Investments as of September 30, 2009
| Principal Amount (‡) |
Description | Value (†) | ||||
| Paper — continued | ||||||
| $ | 16,475,000 | Georgia-Pacific Corp., 8.000%, 1/15/2024 |
$ | 16,310,250 | ||
| 18,378,000 | Georgia-Pacific Corp., 8.875%, 5/15/2031 |
18,561,780 | ||||
| 154,533,000 | International Paper Co., 7.950%, 6/15/2018 |
167,507,282 | ||||
| 3,100,000 | International Paper Co., 9.375%, 5/15/2019 |
3,629,778 | ||||
| 3,995,000 | Jefferson Smurfit Corp., 7.500%, 6/01/2013(e) |
2,831,456 | ||||
| 100,000 | Smurfit-Stone Container Enterprises, Inc., 8.000%, 3/15/2017(e) |
71,000 | ||||
| 14,520,000 | Westvaco Corp., 7.950%, 2/15/2031 |
14,220,641 | ||||
| 17,355,000 | Westvaco Corp., 8.200%, 1/15/2030 |
17,022,912 | ||||
| 308,471,186 | ||||||
| Pharmaceuticals — 0.7% | ||||||
| 41,300,000 | Elan Finance PLC, 8.875%, 12/01/2013 |
41,609,750 | ||||
| 50,820,000 | Elan Finance PLC, Senior Note, 7.750%, 11/15/2011 |
51,772,875 | ||||
| 93,382,625 | ||||||
| Pipelines — 2.3% | ||||||
| 19,745,000 | DCP Midstream LP, 144A, 6.450%, 11/03/2036 |
17,883,659 | ||||
| 15,685,000 | El Paso Corp., 6.950%, 6/01/2028 |
13,047,661 | ||||
| 1,500,000 | El Paso Corp., 7.420%, 2/15/2037 |
1,288,215 | ||||
| 750,000 | El Paso Corp., GMTN, 7.800%, 8/01/2031 |
687,839 | ||||
| 1,000,000 | El Paso Energy Corp., GMTN, 7.750%, 1/15/2032 |
916,198 | ||||
| 5,255,000 | Energy Transfer Partners LP, 6.125%, 2/15/2017 |
5,470,176 | ||||
| 9,115,000 | Energy Transfer Partners LP, 6.625%, 10/15/2036 |
9,460,714 | ||||
| 13,175,000 | Enterprise Products Operating LLP, 6.300%, 9/15/2017 |
14,190,568 | ||||
| 5,100,000 | Florida Gas Transmission Co., 144A, 7.900%, 5/15/2019 |
6,083,887 | ||||
| 500,000 | Kinder Morgan Energy Partners LP, 5.800%, 3/15/2035 |
471,498 | ||||
| 47,310,000 | Maritimes & Northeast Pipeline LLC, 144A 7.500%, 5/31/2014(b) |
49,759,712 | ||||
| 81,710,000 | NGPL Pipeco LLC, 144A, 7.119%, 12/15/2017 |
91,425,401 | ||||
| 3,425,000 | ONEOK Partners LP, 6.650%, 10/01/2036 |
3,649,591 | ||||
| 20,770,000 | Plains All American Pipeline LP, 6.125%, 1/15/2017 |
21,558,076 | ||||
| 44,730,000 | Plains All American Pipeline LP, 6.650%, 1/15/2037 |
47,113,483 | ||||
| 250,000 | Transportadora de Gas del Sur SA, 144A, 7.875%, 5/14/2017 |
215,000 | ||||
| 600,000 | Williams Cos., Inc., 7.875%, 9/01/2021 |
648,997 | ||||
| 965,000 | Williams Cos., Inc., Senior Note, 7.750%, 6/15/2031 |
1,011,878 | ||||
| Principal Amount (‡) |
Description | Value (†) | ||||
| Pipelines — continued | ||||||
| $ | 4,030,000 | Williams Cos., Inc., Series A, 7.500%, 1/15/2031 |
$ | 4,116,169 | ||
| 288,998,722 | ||||||
| Property & Casualty Insurance — 0.4% | ||||||
| 4,785,000 | Allstate Corp., 5.950%, 4/01/2036 |
5,076,478 | ||||
| 2,660,000 | Marsh & McLennan Cos., Inc., 5.375%, 7/15/2014 |
2,768,148 | ||||
| 11,710,000 | Marsh & McLennan Cos., Inc., 5.750%, 9/15/2015 |
12,348,265 | ||||
| 11,075,000 | Marsh & McLennan Cos., Inc., 5.875%, 8/01/2033 |
10,178,302 | ||||
| 666,000 | Marsh & McLennan Cos., Inc., 9.250%, 4/15/2019 |
834,591 | ||||
| 6,080,000 | MBIA Insurance Corp., (fixed rate to 1/15/2013, variable rate thereafter), 144A, 14.000%, 1/15/2033 |
2,675,200 | ||||
| 11,205,000 | Willis North America, Inc., 6.200%, 3/28/2017 |
10,968,395 | ||||
| 44,849,379 | ||||||
| Railroads — 0.4% | ||||||
| 2,700,000 | Canadian Pacific Railway Co., 5.750%, 3/15/2033 |
2,599,431 | ||||
| 16,410,000 | Canadian Pacific Railway Co., 5.950%, 5/15/2037 |
16,191,977 | ||||
| 25,430,000 | CSX Corp., MTN, 6.000%, 10/01/2036 |
26,225,094 | ||||
| 1,153,000 | Missouri Pacific Railroad Co., 5.000%, 1/01/2045(b) |
784,040 | ||||
| 45,800,542 | ||||||
| Refining — 0.0% | ||||||
| 1,335,000 | Valero Energy Corp., 6.625%, 6/15/2037 |
1,192,250 | ||||
| REITs — 1.1% | ||||||
| 2,025,000 | Camden Property Trust, 5.000%, 6/15/2015 |
1,927,203 | ||||
| 27,950,000 | Camden Property Trust, 5.700%, 5/15/2017 |
26,444,836 | ||||
| 4,030,000 | Duke Realty LP, 5.950%, 2/15/2017 |
3,714,737 | ||||
| 3,300,000 | ERP Operating LP, 5.125%, 3/15/2016 |
3,220,051 | ||||
| 47,305,000 | Highwoods Properties, Inc., 5.850%, 3/15/2017 |
41,663,122 | ||||
| 4,135,000 | ProLogis, 5.625%, 11/15/2015 |
3,757,520 | ||||
| 1,000,000 | ProLogis, 5.625%, 11/15/2016 |
897,268 | ||||
| 1,967,000 | ProLogis, 5.750%, 4/01/2016 |
1,759,440 | ||||
| 1,002,000 | ProLogis, 6.625%, 5/15/2018 |
925,239 | ||||
| 1,500,000 | Simon Property Group LP, 5.250%, 12/01/2016 |
1,478,551 | ||||
| 4,900,000 | Simon Property Group LP, 5.750%, 12/01/2015 |
5,012,269 | ||||
| 550,000 | Simon Property Group LP, 5.875%, 3/01/2017 |
560,894 | ||||
See accompanying notes to financial statements.
46
Table of Contents
LOOMIS SAYLES STRATEGIC INCOME FUND — PORTFOLIO OF INVESTMENTS (continued)
Investments as of September 30, 2009
| Principal Amount (‡) |
Description | Value (†) | ||||
| REITs — continued | ||||||
| $ | 1,890,000 | Simon Property Group LP, 6.100%, 5/01/2016 |
$ | 1,942,446 | ||
| 450,000 | Simon Property Group LP, 6.125%, 5/30/2018 |
453,409 | ||||
| 46,015,000 | WEA Finance LLC/WT Finance Australia Pty Ltd., 144A, 6.750%, 9/02/2019 |
46,544,126 | ||||
| 140,301,111 | ||||||
| Restaurants — 0.0% | ||||||
| 1,250,000 | McDonald’s Corp., EMTN, 3.628%, 10/10/2010, (SGD) |
902,678 | ||||
| Retailers — 2.6% | ||||||
| 8,758,000 | Dillard’s, Inc., 6.625%, 1/15/2018 |
6,656,080 | ||||
| 4,187,000 | Dillard’s, Inc., 7.130%, 8/01/2018 |
3,255,392 | ||||
| 1,500,000 | Dillard’s, Inc., 7.750%, 7/15/2026 |
1,057,500 | ||||
| 425,000 | Dillard’s, Inc., 7.875%, 1/01/2023 |
310,250 | ||||
| 3,325,000 | Dillard’s, Inc., Class A, 7.000%, 12/01/2028 |
2,211,125 | ||||
| 123,940,000 | Home Depot, Inc., 5.875%, 12/16/2036 |
120,247,332 | ||||
| 3,685,000 | J.C. Penney Corp., Inc., 5.750%, 2/15/2018 |
3,427,050 | ||||
| 635,000 | J.C. Penney Corp., Inc., 7.125%, 11/15/2023 |
584,200 | ||||
| 3,330,000 | J.C. Penney Corp., Inc., 7.400%, 4/01/2037 |
2,963,700 | ||||
| 3,985,000 | J.C. Penney Corp., Inc., 7.625%, 3/01/2097 |
3,188,000 | ||||
| 72,470,000 | J.C. Penney Corp., Inc., Senior Note, 6.375%, 10/15/2036 |
59,787,750 | ||||
| 13,935,000 | Lowe’s Cos., Inc., 6.650%, 9/15/2037 |
16,186,227 | ||||
| 20,564,000 | Macy’s Retail Holdings, Inc., 6.375%, 3/15/2037 |
16,201,224 | ||||
| 12,275,000 | Macy’s Retail Holdings, Inc., 6.790%, 7/15/2027 |
8,948,340 | ||||
| 2,365,000 | Macy’s Retail Holdings, Inc., 6.900%, 4/01/2029 |
1,865,666 | ||||
| 6,365,000 | Marks & Spencer PLC, 144A, 7.125%, 12/01/2037 |
5,946,100 | ||||
| 25,856,000 | Target Corp., 7.000%, 1/15/2038 |
30,261,242 | ||||
| 32,675,000 | Toys R Us, Inc., 7.375%, 10/15/2018 |
28,427,250 | ||||
| 8,355,000 | Toys R Us, Inc., 7.875%, 4/15/2013 |
8,020,800 | ||||
| 10,270,000 | Woolworth Corp., 8.500%, 1/15/2022 |
9,705,150 | ||||
| 329,250,378 | ||||||
| Sovereigns — 4.8% | ||||||
| 104,626,000,000 | Indonesia Treasury Bond, Series FR43, 10.250%, 7/15/2022, (IDR) |
10,668,096 | ||||
| 10,000,000,000 | Indonesia Treasury Bond, Series FR47, 10.000%, 2/15/2028, (IDR) |
968,368 | ||||
| Principal Amount (‡) |
Description | Value (†) | |||
| Sovereigns — continued | |||||
| 272,460,000,000 | Indonesia Treasury Bond, Series ZC3, Zero Coupon, 11/20/2012, (IDR) |
$ | 21,692,777 | ||
| 2,350,305(††) | Mexican Fixed Rate Bonds, Series M-10, 7.250%, 12/15/2016, (MXN) |
16,941,629 | |||
| 2,037,000(††) | Mexican Fixed Rate Bonds, Series M-10, 9.000%, 12/20/2012, (MXN) |
16,086,822 | |||
| 18,686,981(††) | Mexican Fixed Rate Bonds, Series M-20, 8.000%, 12/07/2023, (MXN) |
135,766,863 | |||
| 79,755,000 | New South Wales Treasury Corp., Series 10RG, 7.000%, 12/01/2010, (AUD) |
72,479,088 | |||
| 10,530,000 | New South Wales Treasury Corp., Series 12RG, 6.000%, 5/01/2012, (AUD) |
9,472,392 | |||
| 66,305,000 | New South Wales Treasury Corp., Series 17RG, 5.500%, 3/01/2017, (AUD) |
57,282,904 | |||
| 56,700,000 | Republic of Brazil, 10.250%, 1/10/2028, (BRL) |
30,724,769 | |||
| 140,235,000 | Republic of Brazil, 12.500%, 1/05/2016, (BRL) |
86,954,249 | |||
| 107,840,000 | Republic of Brazil, 12.500%, 1/05/2022, (BRL) |
66,958,681 | |||
| 1,400,000,000 | Republic of Iceland, Zero Coupon, 11/16/2009, (ISK) |
8,948,981 | |||
| 2,981,242,000 | Republic of Iceland, 7.000%, 3/17/2010, (ISK) |
19,220,356 | |||
| 3,178,700,000 | Republic of Iceland, 7.250%, 5/17/2013, (ISK) |
20,374,442 | |||
| 1,700,700,000 | Republic of Iceland, 8.000%, 7/22/2011, (ISK) |
11,108,753 | |||
| 3,090,910,000 | Republic of Iceland, 13.750%, 12/10/2010, (ISK) |
21,417,015 | |||
| 4,020,000 | Republic of Venezuela, 7.000%, 3/16/2015, (EUR) |
4,967,203 | |||
| 612,033,388 | |||||
| Supermarkets — 0.8% | |||||
| 2,000,000 | American Stores Co., 7.900%, 5/01/2017 |
1,880,000 | |||
| 72,681,000 | New Albertson’s, Inc., 7.450%, 8/01/2029 |
62,505,660 | |||
| 19,060,000 | New Albertson’s, Inc., 7.750%, 6/15/2026 |
16,963,400 | |||
| 4,895,000 | New Albertson’s, Inc., 8.000%, 5/01/2031 |
4,393,263 | |||
| 1,510,000 | New Albertson’s, Inc., 8.700%, 5/01/2030 |
1,374,100 | |||
| 13,242,000 | New Albertson’s, Inc., Series C, MTN, 6.625%, 6/01/2028 |
10,229,445 | |||
| 97,345,868 | |||||
| Supranational — 2.1% | |||||
| 175,000,000 | Eurofima, EMTN, 11.000%, 2/05/2010, (ISK) |
1,143,981 | |||
| 128,250,000 | European Investment Bank, Zero Coupon, 3/10/2021, (AUD) |
57,324,818 | |||
| 16,375,000 | European Investment Bank, 11.250%, 2/14/2013, (BRL) |
9,683,951 | |||
| 413,529,000,000 | European Investment Bank, EMTN, 144A, Zero Coupon, 4/24/2013, (IDR) |
30,455,245 | |||
| 134,330,000 | European Investment Bank, EMTN, 144A, 4.600%, 1/30/2037, (CAD) |
110,510,311 | |||
See accompanying notes to financial statements.
47
Table of Contents
LOOMIS SAYLES STRATEGIC INCOME FUND — PORTFOLIO OF INVESTMENTS (continued)
Investments as of September 30, 2009
| Principal Amount (‡) |
Description | Value (†) | |||
| Supranational — continued | |||||
| 11,330,000 | European Investment Bank, EMTN, 7.000%, 1/18/2012, (NZD) |
$ | 8,568,406 | ||
| 244,840,000,000 | Inter-American Development Bank, EMTN, Zero Coupon, 5/20/2013, (IDR) |
17,459,258 | |||
| 24,450,000 | Inter-American Development Bank, EMTN, 6.000%, 12/15/2017, (NZD) |
17,580,802 | |||
| 8,300,000 | International Bank for Reconstruction & Development, 1.430%, 3/05/2014, (SGD) |
5,662,242 | |||
| 1,385,900,000 | International Bank for Reconstruction & Development, 9.500%, 5/27/2010, (ISK) |
9,036,783 | |||
| 267,425,797 | |||||
| Technology — 2.4% | |||||
| 41,705,000 | Agilent Technologies, Inc., 6.500%, 11/01/2017 |
43,399,891 | |||
| 41,104,000 | Alcatel-Lucent USA, Inc., 6.450%, 3/15/2029 |
31,290,420 | |||
| 5,040,000 | Alcatel-Lucent USA, Inc., 6.500%, 1/15/2028 |
3,836,700 | |||
| 832,000 | Alcatel-Lucent, EMTN, 6.375%, 4/07/2014, (EUR) |
1,156,631 | |||
| 10,725,000 | Amkor Technology, Inc., 7.750%, 5/15/2013 |
10,725,000 | |||
| 1,225,000 | Amkor Technology, Inc., 9.250%, 6/01/2016 |
1,261,750 | |||
| 2,435,000 | Arrow Electronics, Inc., 6.875%, 6/01/2018 |
2,592,172 | |||
| 30,125,000 | Avnet, Inc., 5.875%, 3/15/2014 |
31,320,872 | |||
| 35,630,000 | Avnet, Inc., 6.000%, 9/01/2015 |
36,683,223 | |||
| 11,345,000 | Avnet, Inc., 6.625%, 9/15/2016 |
11,921,995 | |||
| 6,225,000 | Corning, Inc., 5.900%, 3/15/2014 |
6,644,615 | |||
| 6,220,000 | Corning, Inc., 6.200%, 3/15/2016 |
6,356,965 | |||
| 6,150,000 | Corning, Inc., 6.850%, 3/01/2029 |
6,275,712 | |||
| 4,725,000 | Corning, Inc., 7.250%, 8/15/2036 |
4,985,229 | |||
| 2,900,000 | Eastman Kodak Co., 7.250%, 11/15/2013 |
2,378,000 | |||
| 11,626,000 | Equifax, Inc., 7.000%, 7/01/2037 |
11,421,917 | |||
| 6,290,000 | Freescale Semiconductor, Inc., 10.125%, 12/15/2016 |
4,182,850 | |||
| 9,739,000 | Motorola, Inc., 5.220%, 10/01/2097 |
5,347,373 | |||
| 475,000 | Motorola, Inc., 6.000%, 11/15/2017 |
455,012 | |||
| 9,345,000 | Motorola, Inc., 6.500%, 9/01/2025 |
7,897,319 | |||
| 21,299,000 | Motorola, Inc., 6.500%, 11/15/2028 |
17,567,650 | |||
| 18,715,000 | Motorola, Inc., 6.625%, 11/15/2037 |
15,673,813 | |||
| 250,000 | Motorola, Inc., 7.500%, 5/15/2025 |
225,000 | |||
| 9,350,000 | Nortel Networks Capital Corp., 7.875%, 6/15/2026(e) |
5,236,000 | |||
| Principal Amount (‡) |
Description | Value (†) | ||||
| Technology — continued | ||||||
| $ | 11,770,000 | Nortel Networks Ltd., 6.875%, 9/01/2023(e) |
$ | 3,295,600 | ||
| 285,000 | Samsung Electronics Co. Ltd., 144A, 7.700%, 10/01/2027 |
316,156 | ||||
| 21,822,000 | Xerox Capital Trust I, 8.000%, 2/01/2027 |
21,331,005 | ||||
| 4,795,000 | Xerox Corp., 5.500%, 5/15/2012 |
5,027,850 | ||||
| 1,730,000 | Xerox Corp., MTN, 7.200%, 4/01/2016 |
1,877,977 | ||||
| 300,684,697 | ||||||
| Tobacco — 1.4% | ||||||
| 29,189,000 | Altria Group, Inc., 8.500%, 11/10/2013 |
33,854,570 | ||||
| 59,268,000 | Altria Group, Inc., 9.250%, 8/06/2019 |
72,422,888 | ||||
| 1,375,000 | Altria Group, Inc., 9.700%, 11/10/2018 |
1,707,828 | ||||
| 52,930,000 | Reynolds American, Inc., 6.750%, 6/15/2017 |
55,023,858 | ||||
| 13,400,000 | Reynolds American, Inc., 7.250%, 6/15/2037 |
13,271,588 | ||||
| 176,280,732 | ||||||
| Transportation Services — 0.4% | ||||||
| 10,503,000 | APL Ltd., Senior Note, 8.000%, 1/15/2024(b) |
8,586,202 | ||||
| 16,030,016 | Atlas Air, Inc., Series 1998-1, Class 1B, 7.680%, 1/02/2014 |
13,625,513 | ||||
| 8,904,345 | Atlas Air, Inc., Series 1999-1, Class A1, 7.200%, 7/02/2020 |
6,945,389 | ||||
| 265,928 | Atlas Air, Inc., Series 1999-1, Class A2, 6.880%, 1/02/2011 |
244,654 | ||||
| 11,454,101 | Atlas Air, Inc., Series 1999-1, Class B, 7.630%, 7/02/2016 |
8,590,576 | ||||
| 4,744,556 | Atlas Air, Inc., Series 1999-1, Class C, 8.770%, 7/02/2012(g) |
3,321,189 | ||||
| 4,917,945 | Atlas Air, Inc., Series 2000-1, Class B, 9.057%, 7/02/2017 |
4,376,971 | ||||
| 6,862,758 | Atlas Air, Inc., Series C, 8.010%, 1/02/2010(g) |
4,803,931 | ||||
| 3,970,000 | Erac USA Finance Co., 144A, 7.000%, 10/15/2037 |
3,716,357 | ||||
| 54,210,782 | ||||||
| Treasuries — 8.8% | ||||||
| 297,140,000 | Canadian Government, 2.000%, 9/01/2012, (CAD) |
278,284,453 | ||||
| 130,000,000 | Canadian Government, 2.750%, 12/01/2010, (CAD) |
124,378,182 | ||||
| 65,260,000 | Canadian Government, 3.500%, 6/01/2013, (CAD) |
63,766,636 | ||||
| 101,755,000 | Canadian Government, 3.750%, 6/01/2012, (CAD) |
100,015,761 | ||||
| 171,980,000 | Canadian Government, 3.750%, 6/01/2019, (CAD) |
166,444,642 | ||||
| 25,445,000 | Canadian Government, 4.250%, 6/01/2018, (CAD) |
25,728,290 | ||||
| 75,385,000 | Canadian Government, 5.250%, 6/01/2012, (CAD) |
76,842,497 | ||||
See accompanying notes to financial statements.
48
Table of Contents
LOOMIS SAYLES STRATEGIC INCOME FUND — PORTFOLIO OF INVESTMENTS (continued)
Investments as of September 30, 2009
| Principal Amount (‡) |
Description | Value (†) | |||
| Treasuries — continued | |||||
| 22,670,000 | New Zealand Government Bond, 6.000%, 12/15/2017, (NZD) |
$ | 16,764,390 | ||
| 457,420,000 | Norwegian Government, 4.250%, 5/19/2017, (NOK) |
80,513,554 | |||
| 221,050,000 | Norwegian Government, 5.000%, 5/15/2015, (NOK) |
40,669,013 | |||
| 366,200,000 | Norwegian Government, 6.000%, 5/16/2011, (NOK) |
66,620,872 | |||
| 262,545,000 | Norwegian Government, 6.500%, 5/15/2013, (NOK) |
50,068,092 | |||
| 25,000,000 | U.S. Treasury Note, 3.125%, 5/15/2019 |
24,599,600 | |||
| 1,114,695,982 | |||||
| Wireless — 1.6% | |||||
| 8,524,000 | ALLTEL Corp., 6.800%, 5/01/2029 |
9,355,721 | |||
| 29,102,000 | ALLTEL Corp., Senior Note, 7.875%, 7/01/2032 |
35,825,144 | |||
| 29,635,000 | Nextel Communications, Inc., Series D, 7.375%, 8/01/2015 |
26,597,412 | |||
| 15,931,000 | Nextel Communications, Inc., Series E, 6.875%, 10/31/2013 |
14,776,003 | |||
| 42,310,000 | Nextel Communications, Inc., Series F, 5.950%, 3/15/2014 |
37,444,350 | |||
| 2,085,000 | Rogers Wireless, Inc., 7.625%, 12/15/2011, (CAD) |
2,152,127 | |||
| 2,525,000 | Rogers Wireless, Inc., Senior Secured Note, 6.375%, 3/01/2014 |
2,787,438 | |||
| 21,186,000 | Sprint Capital Corp., 6.875%, 11/15/2028 |
17,690,310 | |||
| 18,070,000 | Sprint Capital Corp., 6.900%, 5/01/2019 |
16,172,650 | |||
| 6,260,000 | Sprint Capital Corp., 8.750%, 3/15/2032 |
5,915,700 | |||
| 11,309,000 | Sprint Nextel Corp., 6.000%, 12/01/2016 |
10,093,283 | |||
| 400,000 | True Move Co. Ltd., 144A, 10.375%, 8/01/2014 |
374,000 | |||
| 29,435,000 | True Move Co. Ltd., 144A, 10.750%, 12/16/2013 |
28,257,600 | |||
| 207,441,738 | |||||
| Wirelines — 4.3% | |||||
| 10,245,000 | AT&T Corp., 6.500%, 3/15/2029 |
10,649,186 | |||
| 101,060,000 | AT&T, Inc., 6.500%, 9/01/2037 |
108,589,677 | |||
| 5,650,000 | Axtel SAB de CV, 144A, 9.000%, 9/22/2019 |
5,734,750 | |||
| 4,370,000 | Bell Canada, MTN, 144A, 6.550%, 5/01/2029, (CAD) |
4,018,776 | |||
| 8,445,000 | Bell Canada, MTN, 7.300%, 2/23/2032, (CAD) |
8,439,636 | |||
| 33,640,000 | Bell Canada, Series M-17, 6.100%, 3/16/2035, (CAD) |
29,342,036 | |||
| 860,000 | BellSouth Corp., 6.550%, 6/15/2034 |
920,540 | |||
| 2,715,000 | BellSouth Telecommunications, Inc., 7.000%, 12/01/2095 |
2,695,821 | |||
| 155,000 | Cincinnati Bell, Inc., 7.000%, 2/15/2015 |
150,350 | |||
| Principal Amount (‡) |
Description | Value (†) | ||||
| Wirelines — continued | ||||||
| $ | 270,000 | Cincinnati Bell, Inc., 8.375%, 1/15/2014 |
$ | 271,350 | ||
| 5,330,000 | Embarq Corp., 7.995%, 6/01/2036 |
5,568,859 | ||||
| 35,260,000 | Frontier Communications Corp., 7.875%, 1/15/2027 |
32,174,750 | ||||
| 10,555,000 | GTE Corp., 6.940%, 4/15/2028 |
11,348,609 | ||||
| 525,000 | Hawaiian Telcom Communications, Inc., Series B, 12.500%, 5/01/2015(e) |
656 | ||||
| 1,120,000 | Koninklijke (Royal) KPN NV, EMTN, 5.750%, 3/18/2016, (GBP) |
1,874,110 | ||||
| 1,800,000 | Koninklijke (Royal) KPN NV, GMTN, 4.000%, 6/22/2015, (EUR) |
2,649,543 | ||||
| 32,435,000 | Level 3 Financing, Inc., 8.750%, 2/15/2017 |
26,921,050 | ||||
| 13,010,000 | Level 3 Financing, Inc., 9.250%, 11/01/2014 |
11,465,063 | ||||
| 3,346,000 | New England Telephone & Telegraph Co., 7.875%, 11/15/2029 |
3,797,024 | ||||
| 16,335,000 | Qwest Capital Funding, Inc., 6.500%, 11/15/2018 |
13,435,537 | ||||
| 32,395,000 | Qwest Capital Funding, Inc., 7.750%, 2/15/2031 |
25,835,012 | ||||
| 42,460,000 | Qwest Capital Funding, Inc., Guaranteed Note, 6.875%, 7/15/2028 |
32,057,300 | ||||
| 12,463,000 | Qwest Capital Funding, Inc., Guaranteed Note, 7.625%, 8/03/2021 |
10,531,235 | ||||
| 33,130,000 | Qwest Corp., 6.875%, 9/15/2033 |
26,835,300 | ||||
| 3,075,000 | Qwest Corp., 7.200%, 11/10/2026 |
2,567,625 | ||||
| 3,999,000 | Qwest Corp., 7.250%, 9/15/2025 |
3,449,138 | ||||
| 2,288,000 | Qwest Corp., 7.500%, 6/15/2023 |
2,082,080 | ||||
| 5,470,000 | SK Broadband Co. Ltd., 144A, 7.000%, 2/01/2012 |
5,634,100 | ||||
| 23,000,000 | Telecom Italia Capital SA, 6.000%, 9/30/2034 |
22,421,987 | ||||
| 19,635,000 | Telecom Italia Capital SA, 6.375%, 11/15/2033 |
20,062,886 | ||||
| 6,030,000 | Telefonica Emisiones SAU, 5.877%, 7/15/2019 |
6,551,691 | ||||
| 20,895,000 | Telefonica Emisiones SAU, Guaranteed Note, 7.045%, 6/20/2036 |
24,727,268 | ||||
| 31,690,000 | Telus Corp., 4.950%, 3/15/2017, (CAD) |
30,282,279 | ||||
| 37,101,000 | Verizon Global Funding Corp., Senior Note, 5.850%, 9/15/2035 |
37,351,729 | ||||
| 6,230,000 | Verizon Maryland, Inc., Series B, 5.125%, 6/15/2033 |
5,301,487 | ||||
| 6,835,000 | Verizon New York, Inc., Series A, 7.375%, 4/01/2032 |
7,494,605 | ||||
| 5,215,000 | Verizon Pennsylvania, Inc., 6.000%, 12/01/2028 |
4,861,501 | ||||
| 548,094,546 | ||||||
| Total Non-Convertible Bonds (Identified Cost $10,495,755,268) |
10,534,908,583 | |||||
See accompanying notes to financial statements.
49
Table of Contents
LOOMIS SAYLES STRATEGIC INCOME FUND — PORTFOLIO OF INVESTMENTS (continued)
Investments as of September 30, 2009
| Principal Amount (‡) |
Description | Value (†) | ||||
| Convertible Bonds — 5.4% | ||||||
| Airlines — 0.0% | ||||||
| $ | 2,800,000 | AMR Corp., 6.250%, 10/15/2014 |
$ | 2,957,500 | ||
| Diversified Manufacturing — 0.0% | ||||||
| 3,520,000 | Trinity Industries, Inc., 3.875%, 6/01/2036 |
2,596,000 | ||||
| Electric — 0.0% | ||||||
| 1,800,000 | CMS Energy Corp., 5.500%, 6/15/2029 |
2,058,750 | ||||
| Healthcare — 0.3% | ||||||
| 26,280,000 | Affymetrix, Inc., 3.500%, 1/15/2038 |
21,155,400 | ||||
| 1,135,000 | Hologic, Inc., (Step to Zero Coupon on 12/15/2013), 2.000%, 12/15/2037(d) |
927,862 | ||||
| 12,005,000 | Life Technologies Corp., 1.500%, 2/15/2024 |
13,115,462 | ||||
| 190,000 | LifePoint Hospitals, Inc., 3.250%, 8/15/2025 |
166,250 | ||||
| 250,000 | LifePoint Hospitals, Inc., 3.500%, 5/15/2014 |
212,188 | ||||
| 3,650,000 | Omnicare, Inc., 3.250%, 12/15/2035 |
2,801,375 | ||||
| 38,378,537 | ||||||
| Independent Energy — 0.0% | ||||||
| 860,000 | Chesapeake Energy Corp., 2.250%, 12/15/2038 |
642,850 | ||||
| 3,130,000 | Penn Virginia Corp., 4.500%, 11/15/2012 |
2,817,000 | ||||
| 3,459,850 | ||||||
| Industrial Other — 0.3% | ||||||
| 30,860,000 | Incyte Corp., 3.500%, 2/15/2011 |
30,088,500 | ||||
| Lodging — 0.2% | ||||||
| 30,418,000 | Host Hotels & Resorts, Inc., 144A, 2.625%, 4/15/2027 |
27,946,537 | ||||
| Media Non-Cable — 0.0% | ||||||
| 7,761,687 | Liberty Media LLC, 3.500%, 1/15/2031 |
4,763,735 | ||||
| Metals & Mining — 0.2% | ||||||
| 2,250,000 | ArcelorMittal, 5.000%, 5/15/2014 |
3,248,438 | ||||
| 1,000,000 | Steel Dynamics, Inc., 5.125%, 6/15/2014 |
1,180,000 | ||||
| 11,270,000 | United States Steel Corp., 4.000%, 5/15/2014 |
17,919,300 | ||||
| 22,347,738 | ||||||
| Non-Captive Diversified — 0.2% | ||||||
| 44,035,000 | iStar Financial, Inc., 1.097%, 10/01/2012(c) |
22,017,500 | ||||
| Oil Field Services — 0.0% | ||||||
| 1,300,000 | Transocean, Inc., Series B, 1.500%, 12/15/2037 |
1,254,500 | ||||
| 535,000 | Transocean, Inc., Series C, 1.500%, 12/15/2037 |
509,588 | ||||
| 1,764,088 | ||||||
| Principal Amount (‡) |
Description | Value (†) | ||||
| Pharmaceuticals — 0.9% | ||||||
| $ | 635,000 | Human Genome Sciences, Inc., 2.250%, 10/15/2011 |
$ | 878,681 | ||
| 41,680,000 | Human Genome Sciences, Inc., 2.250%, 8/15/2012 |
51,943,700 | ||||
| 1,600,000 | Kendle International, Inc., 3.375%, 7/15/2012 |
1,412,000 | ||||
| 24,461,000 | Nektar Therapeutics, 3.250%, 9/28/2012 |
22,198,358 | ||||
| 28,222,000 | Valeant Pharmaceuticals International, Subordinated Note, 4.000%, 11/15/2013 |
30,373,927 | ||||
| 106,806,666 | ||||||
| REITs — 0.1% | ||||||
| 6,469,000 | ProLogis, 1.875%, 11/15/2037 |
5,522,909 | ||||
| 5,920,000 | ProLogis, 2.250%, 4/01/2037 |
5,335,400 | ||||
| 10,858,309 | ||||||
| Technology — 2.3% | ||||||
| 14,075,000 | Advanced Micro Devices, Inc., 5.750%, 8/15/2012 |
11,805,406 | ||||
| 850,000 | Advanced Micro Devices, Inc., 6.000%, 5/01/2015 |
636,438 | ||||
| 1,100,000 | Alcatel-Lucent USA, Inc., Series B, 2.875%, 6/15/2025 |
918,500 | ||||
| 220,000 | Ciena Corp., 0.250%, 5/01/2013 |
175,725 | ||||
| 8,970,000 | Ciena Corp., 0.875%, 6/15/2017 |
6,178,087 | ||||
| 2,050,000 | Intel Corp., 2.950%, 12/15/2035 |
1,829,625 | ||||
| 220,000,000 | Intel Corp., 144A, 3.250%, 8/01/2039 |
235,125,000 | ||||
| 9,197,000 | Kulicke & Soffa Industries, Inc., 0.875%, 6/01/2012 |
7,530,044 | ||||
| 3,880,000 | Kulicke & Soffa Industries, Inc., 1.000%, 6/30/2010 |
3,681,150 | ||||
| 3,730,000 | Maxtor Corp., Subordinated Note, 5.750%, 3/01/2012(b) |
3,394,300 | ||||
| 745,000 | Nortel Networks Corp., 1.750%, 4/15/2012(e) |
409,750 | ||||
| 30,767,000 | Nortel Networks Corp., 2.125%, 4/15/2014(e) |
16,921,850 | ||||
| 311,000 | Richardson Electronics Ltd., 7.750%, 12/15/2011 |
276,790 | ||||
| 288,882,665 | ||||||
| Textile — 0.0% | ||||||
| 103,000 | Dixie Group, Inc., Subordinated Note, 7.000%, 5/15/2012 |
84,460 | ||||
| Wireless — 0.1% | ||||||
| 16,157,000 | NII Holdings, Inc., 3.125%, 6/15/2012 |
14,117,179 | ||||
| Wirelines — 0.8% | ||||||
| 34,645,000 | Level 3 Communications, Inc., 3.500%, 6/15/2012 |
27,542,775 | ||||
| 13,484,000 | Level 3 Communications, Inc., 5.250%, 12/15/2011 |
12,000,760 | ||||
See accompanying notes to financial statements.
50
Table of Contents
LOOMIS SAYLES STRATEGIC INCOME FUND — PORTFOLIO OF INVESTMENTS (continued)
Investments as of September 30, 2009
| Principal Amount (‡) |
Description | Value (†) | ||||
| Wirelines — continued | ||||||
| $ | 54,075,000 | Level 3 Communications, Inc., 144A 7.000%, 3/15/2015(b) |
$ | 57,319,500 | ||
| 2,470,000 | Level 3 Communications, Inc., 10.000%, 5/01/2011 |
2,439,125 | ||||
| 1,000,000 | Qwest Communications International, Inc., 3.500%, 11/15/2025 |
1,008,750 | ||||
| 100,310,910 | ||||||
| Total Convertible Bonds (Identified Cost $661,125,834) | 679,438,924 | |||||
| Municipals — 0.5% | ||||||
| California — 0.3% | ||||||
| 1,530,000 | San Jose California Redevelopment Agency Tax Allocation (Merged Area), Series C, (Registered), (MBIA insured), 3.750%, 8/01/2028 |
1,358,456 | ||||
| 4,170,000 | San Jose California Redevelopment Agency Tax Allocation (Merged Area Redevelopment), Series C, 3.750%, 8/01/2028 |
3,489,831 | ||||
| 5,175,000 | State of California, (AMBAC insured), 4.500%, 8/01/2027 |
5,038,484 | ||||
| 14,415,000 | State of California, 4.500%, 10/01/2029 |
13,720,629 | ||||
| 4,190,000 | State of California, (AMBAC insured), 4.500%, 8/01/2030 |
3,967,302 | ||||
| 3,620,000 | State of California, 4.500%, 8/01/2030 |
3,427,597 | ||||
| 2,680,000 | State of California (Various Purpose), (MBIA insured), 3.250%, 12/01/2027 |
2,183,101 | ||||
| 12,645,000 | State of California (Various Purpose), (AMBAC insured), 4.500%, 12/01/2033 |
11,540,839 | ||||
| 44,726,239 | ||||||
| Illinois — 0.0% | ||||||
| 1,725,000 | Chicago O’Hare International Airport, Series A, (FSA insured), 4.500%, 1/01/2038 |
1,711,252 | ||||
| Michigan — 0.1% | ||||||
| 12,850,000 | Michigan Tobacco Settlement Finance Authority, Taxable Turbo Series A, 7.309%, 6/01/2034(b) |
10,273,061 | ||||
| Nebraska — 0.1% | ||||||
| 6,230,000 | Omaha Public Power District, Series AA, (FGIC insured), 4.500%, 2/01/2034 |
6,341,766 | ||||
| Wisconsin — 0.0% | ||||||
| 835,000 | Wisconsin Housing & Economic Development Authority, Series E, 4.900%, 11/01/2035 |
835,376 | ||||
| Total Municipals (Identified Cost $63,889,351) | 63,887,694 | |||||
| Total Bonds and Notes (Identified Cost $11,220,770,453) | 11,278,235,201 | |||||
| Bank Loans — 0.7% | ||||||
| Airlines — 0.1% | ||||||
| 5,645,000 | Delta Air Lines, Inc., Secured Term Loan, 9/27/2013(h) |
5,602,662 | ||||
| Energy — 0.1% | ||||||
| 12,839,630 | ATP Oil & Gas Corp., Tranche B-1 Term Loan, 8.500%, 7/15/2014(i) |
11,767,521 | ||||
| Principal Amount (‡) |
Description | Value (†) | ||||
| Energy — continued | ||||||
| $ | 3,384,895 | ATP Oil & Gas Corp., Tranche B2 Term Loan, 9.000%, 1/15/2011(i) |
$ | 3,102,256 | ||
| 14,869,777 | ||||||
| Media Non-Cable — 0.1% | ||||||
| 30,120,849 | Idearc, Inc., Term Loan B, 6.250%, 11/17/2014(e)(i) |
12,738,710 | ||||
| 2,797,946 | Tribune Co., Term Loan X, 5.000%, 6/04/2009(e)(i)(l) |
1,358,766 | ||||
| 14,097,476 | ||||||
| Oil Field Services — 0.0% | ||||||
| 2,485,000 | Dresser, Inc., Second Lien Term Loan, 5.994%, 5/04/2015(i) |
2,149,525 | ||||
| 1,230,373 | Dresser, Inc., Term Loan, 2.679%, 5/04/2014(i) |
1,150,399 | ||||
| 3,299,924 | ||||||
| Retailers — 0.0% | ||||||
| 1,520,647 | Harbor Freight Tools USA, Inc., Tranche C Term Loan, 9.750%, 2/12/2013(i) |
1,528,250 | ||||
| Technology — 0.2% | ||||||
| 6,799,473 | Nuance Communications, Inc., Incremental Term Loan, 2.250%, 3/29/2013(i) |
6,495,536 | ||||
| 512,748 | Nuance Communications, Inc., Term Loan, 2.250%, 3/31/2013(i) |
489,829 | ||||
| 433,064 | Sungard Data Systems, Inc., Tranche A, 2.004%, 2/28/2014(i) |
404,806 | ||||
| 12,001,044 | Sungard Data Systems, Inc., Tranche B, 4.079%, 2/26/2016(i) |
11,683,016 | ||||
| 19,073,187 | ||||||
| Wirelines — 0.2% | ||||||
| 1,985,000 | Fairpoint Communications, Inc., Initial Term Loan A, 3/31/2014(h) |
1,493,713 | ||||
| 1,990,879 | Fairpoint Communications, Inc., Initial Term Loan A, 4.750%, 3/31/2014(i) |
1,498,136 | ||||
| 3,970,000 | Fairpoint Communications, Inc., Initial Term Loan B, 3/31/2015(h) |
2,983,693 | ||||
| 8,087,742 | Fairpoint Communications, Inc., Initial Term Loan B, 5.000%, 3/31/2015(i) |
6,078,423 | ||||
| 16,952,315 | Hawaiian Telcom Communications, Inc., Tranche C Term Loan, 4.750%, 6/01/2014(i)(j) |
10,459,579 | ||||
| 5,395,000 | Level 3 Financing, Inc., Tranche A Term Loan, 2.683%, 3/13/2014(i) |
4,767,831 | ||||
| 27,281,375 | ||||||
| Total Bank Loans (Identified Cost $97,112,789) | 85,752,651 | |||||
| Shares |
||||||
| Common Stocks — 2.8% | ||||||
| Biotechnology — 0.3% | ||||||
| 1,732,629 | EPIX Pharmaceuticals, Inc.(g) | 24,257 | ||||
| 5,111 | EPIX Pharmaceuticals, Inc., Contingent Value Rights(g) | — | ||||
| 867,059 | Vertex Pharmaceuticals, Inc.(g) | 32,861,536 | ||||
| 32,885,793 | ||||||
| Containers & Packaging — 0.1% | ||||||
| 460,656 | Owens-Illinois, Inc.(g) | 16,998,207 | ||||
| Electric Utilities — 0.0% | ||||||
| 282,500 | Duke Energy Corp. | 4,446,550 | ||||
See accompanying notes to financial statements.
51
Table of Contents
LOOMIS SAYLES STRATEGIC INCOME FUND — PORTFOLIO OF INVESTMENTS (continued)
Investments as of September 30, 2009
| Shares |
Description | Value (†) | |||
| Electronic Equipment, Instruments & Components — 0.0% | |||||
| 41,343 | Corning, Inc. | $ | 632,961 | ||
| Food Products — 0.4% | |||||
| 2,309,175 | ConAgra Foods, Inc. | 50,062,914 | |||
| Household Durables — 0.1% | |||||
| 477,725 | KB Home | 7,935,012 | |||
| 549,450 | Lennar Corp., Class A | 7,829,663 | |||
| 15,764,675 | |||||
| Oil, Gas & Consumable Fuels — 0.2% | |||||
| 846,398 | Chesapeake Energy Corp. | 24,037,703 | |||
| 141,249 | Spectra Energy Corp. | 2,675,256 | |||
| 26,712,959 | |||||
| Pharmaceuticals — 1.3% | |||||
| 7,238,800 | Bristol-Myers Squibb Co. | 163,017,776 | |||
| 2,288 | Teva Pharmaceutical Industries Ltd., Sponsored ADR | 115,681 | |||
| 163,133,457 | |||||
| REITs — 0.3% | |||||
| 290,904 | Apartment Investment & Management Co., Class A | 4,290,834 | |||
| 889,730 | Associated Estates Realty Corp. | 8,559,202 | |||
| 201,557 | Developers Diversified Realty Corp. | 1,862,387 | |||
| 460,000 | Equity Residential | 14,122,000 | |||
| 122,402 | Simon Property Group, Inc. | 8,498,371 | |||
| 37,332,794 | |||||
| Thrifts & Mortgage Finance — 0.1% | |||||
| 4,794,025 | Federal Home Loan Mortgage Corp.(g)(k) | 8,629,245 | |||
| Total Common Stocks (Identified Cost $448,488,257) | 356,599,555 | ||||
| Preferred Stocks — 1.5% | |||||
| Convertible Preferred Stocks — 1.1% | |||||
| Automotive — 0.3% | |||||
| 1,458,359 | Ford Motor Co. Capital Trust II, 6.500% |
43,925,773 | |||
| Capital Markets — 0.1% | |||||
| 183,851 | Newell Financial Trust I, 5.250% |
6,503,729 | |||
| Commercial Banks — 0.0% | |||||
| 5,933 | Wells Fargo & Co., Series L, Class A, 7.500% |
5,298,169 | |||
| Diversified Consumer Services — 0.0% | |||||
| 6 | Six Flags, Inc., 7.250%(g) |
3 | |||
| Diversified Financial Services — 0.2% | |||||
| 16,622 | Bank of America Corp., Series L, 7.250% |
14,128,700 | |||
| 2,144 | CIT Group, Inc., 8.750% |
13,272 | |||
| 161,133 | Sovereign Capital Trust IV, 4.375% |
4,874,273 | |||
| 19,016,245 | |||||
| Electric Utilities — 0.2% | |||||
| 380,577 | AES Trust III, 6.750% |
16,769,174 | |||
| Shares |
Description | Value (†) | |||
| Electric Utilities — continued | |||||
| 107,725 | CMS Energy Trust I, 7.750%(b)(f) |
$ | 3,770,375 | ||
| 20,539,549 | |||||
| Machinery — 0.0% | |||||
| 171,240 | United Rentals Trust I, 6.500% |
4,259,595 | |||
| Oil, Gas & Consumable Fuels — 0.1% | |||||
| 52,020 | Chesapeake Energy Corp., 4.500% |
4,333,266 | |||
| 158,777 | El Paso Energy Capital Trust I, 4.750% |
5,309,106 | |||
| 9,642,372 | |||||
| REITs — 0.0% | |||||
| 42,700 | FelCor Lodging Trust, Inc., Series A, 7.800% |
491,050 | |||
| Semiconductors & Semiconductor Equipment — 0.2% | |||||
| 32,320 | Lucent Technologies Capital Trust I, 7.750% |
24,724,800 | |||
| Total Convertible Preferred Stocks (Identified Cost $149,943,789) |
134,401,285 | ||||
| Non-Convertible Preferred Stocks — 0.4% | |||||
| Diversified Financial Services — 0.2% | |||||
| 35,000 | Bank of America Corp., 6.375% |
628,250 | |||
| 250,146 | CIT Group, Inc., 6.350% |
637,872 | |||
| 36,916 | Preferred Blocker, Inc., 144A, 7.000% |
21,467,810 | |||
| 22,733,932 | |||||
| Electric Utilities — 0.0% | |||||
| 393 | Entergy New Orleans, Inc., 4.750% |
28,357 | |||
| Thrifts & Mortgage Finance — 0.2% | |||||
| 389,800 | Countrywide Capital IV, 6.750% |
7,862,266 | |||
| 75,100 | Federal Home Loan Mortgage Corp., 5.000%(g)(k) |
199,015 | |||
| 1,741,500 | Federal Home Loan Mortgage Corp., 5.570%(g)(k) |
2,786,400 | |||
| 444,350 | Federal Home Loan Mortgage Corp., 5.660%(g)(k) |
733,178 | |||
| 120,695 | Federal Home Loan Mortgage Corp., 5.700%(g)(k) |
310,186 | |||
| 283,000 | Federal Home Loan Mortgage Corp., 5.790%(g)(k) |
752,780 | |||
| 81,450 | Federal Home Loan Mortgage Corp., 5.810%(g)(k) |
222,359 | |||
| 219,750 | Federal Home Loan Mortgage Corp., 5.900%(g)(k) |
373,575 | |||
| 96,600 | Federal Home Loan Mortgage Corp., 6.000%(g)(k) |
284,970 | |||
| 89,300 | Federal Home Loan Mortgage Corp., 6.420%(g)(k) |
267,900 | |||
| 392,116 | Federal Home Loan Mortgage Corp., 6.550%(g)(k) |
713,651 | |||
See accompanying notes to financial statements.
52
Table of Contents
LOOMIS SAYLES STRATEGIC INCOME FUND — PORTFOLIO OF INVESTMENTS (continued)
Investments as of September 30, 2009
| Shares |
Description | Value (†) | ||||
| Thrifts & Mortgage Finance — continued | ||||||
| 3,856,103 | Federal Home Loan Mortgage Corp., (fixed rate to 12/31/2012, variable rate thereafter), 8.375%(g)(k) |
$ | 6,979,546 | |||
| 192,100 | Federal National Mortgage Association, 4.750%(g)(k) |
489,855 | ||||
| 144,900 | Federal National Mortgage Association, 5.125%(g)(k) |
385,434 | ||||
| 104,850 | Federal National Mortgage Association, 5.375%(g)(k) |
297,774 | ||||
| 56,600 | Federal National Mortgage Association, 5.810%(g)(k) |
157,914 | ||||
| 87,300 | Federal National Mortgage Association, 6.750%(g)(k) |
137,061 | ||||
| 250,000 | Federal National Mortgage Association, 8.250%(g)(k) |
395,000 | ||||
| 6,747,525 | Federal National Mortgage Association, (fixed rate to 12/13/2010, variable rate thereafter), 8.250%(g)(k) |
10,863,515 | ||||
| 34,212,379 | ||||||
| Total Non-Convertible Preferred Stocks (Identified Cost $304,384,624) |
56,974,668 | |||||
| Total Preferred Stocks (Identified Cost $454,328,413) | 191,375,953 | |||||
| Closed-End Investment Companies — 0.2% | ||||||
| 191,930 | BlackRock Senior High Income Fund, Inc. | 658,320 | ||||
| 1,033,275 | Dreyfus High Yield Strategies | 3,668,126 | ||||
| 88,955 | DWS High Income Trust | 730,321 | ||||
| 860,000 | Highland Credit Strategies Fund | 5,461,000 | ||||
| 110,211 | Morgan Stanley Emerging Markets Debt Fund, Inc. | 1,054,719 | ||||
| 28,322 | Van Kampen High Income Trust II | 391,693 | ||||
| 2,055,800 | Western Asset High Income Opportunity Fund, Inc. | 11,964,756 | ||||
| 1,217,820 | Western Asset Managed High Income Fund, Inc. | 7,355,633 | ||||
| Total Closed-End Investment Companies (Identified Cost $40,372,606) |
31,284,568 | |||||
| Exchange Traded Funds — 0.5% | ||||||
| 292,043 | iShares iBoxx $ High Yield Corporate Bond Fund | 25,217,913 | ||||
| 837,667 | SPDR Barclays Capital High Yield Bond Fund | 32,241,803 | ||||
| Total Exchange Traded Funds (Identified Cost $53,154,775) | 57,459,716 | |||||
| Warrants — 0.0% | ||||||
| Pharmaceuticals — 0.0% | ||||||
| 574,624 | Valeant Pharmaceuticals International(f)(g) (Identified Cost $0) |
— | ||||
| Principal Amount (‡) |
||||||
| Short-Term Investments — 4.1% | ||||||
| $ | 84,269 | Repurchase Agreement with State Street Corporation, dated 9/30/2009 at 0.000% to be repurchased at $84,269 on 10/01/2009, collateralized by $90,000 U.S. Treasury Bill, due 11/05/2009 valued at $89,996 including accrued interest (Note 2g of Notes to Financial Statements) | 84,269 | |||
| Principal Amount (‡) |
Description | Value (†) | |||||
| $ | 514,789,236 | Tri-Party Repurchase Agreement with Fixed Income Clearing Corporation, dated 9/30/2009 at 0.000% to be repurchased at $514,789,236 on 10/01/2009, collateralized by $36,475,000 Federal Home Loan Mortgage Corp. Discount Note, due 12/31/2009 valued at $36,456,763; $300,000,000 Federal Home Loan Bank, 1.620% due 12/30/2009 valued at $304,590,000; $100,000,000 Federal National Mortgage Association Discount Note, due 12/30/2009 valued at $100,000,000; $82,495,000 Federal National Mortgage Association, 3.875% due 12/10/2009 valued at $84,041,781 including accrued interest (Note 2g of Notes to Financial Statements) | $ | 514,789,236 | |||
| Total Short-Term Investments (Identified Cost $514,873,505) |
514,873,505 | ||||||
| Total Investments — 99.0% (Identified Cost $12,829,100,798)(a) |
12,515,581,149 | ||||||
| Other assets less liabilities — 1.0% | 129,768,801 | ||||||
| Net Assets — 100.0% | $ | 12,645,349,950 | |||||
| (‡) | Principal amount stated in U.S. dollars unless otherwise noted. | ||||||
| (†) | See Note 2a of Notes to Financial Statements. | ||||||
| (††) | Amount shown represents units. One unit represents a principal amount of 100. | ||||||
| (†††) | Amount shown represents units. One unit represents a principal amount of 25. | ||||||
| (a) | Federal Tax Information: | ||||||
| At September 30, 2009, the net unrealized depreciation on investments based on a cost of $12,884,137,592 for federal income tax purposes was as follows: | |||||||
| Aggregate gross unrealized appreciation for all investments in which there is an excess of value over tax cost | $ | 763,092,378 | |||||
| Aggregate gross unrealized depreciation for all investments in which there is an excess of tax cost over value | (1,131,648,821 | ) | |||||
| Net unrealized depreciation | $ | (368,556,443 | ) | ||||
| (b) | Illiquid security. At September 30, 2009, the value of these securities amounted to $402,363,807 or 3.2% of net assets. | ||||||
| (c) | Variable rate security. Rate as of September 30, 2009 is disclosed. | ||||||
| (d) | Step Bond: Coupon rate is a fixed rate for an initial period then resets at a specified date and rate. | ||||||
| (e) | The issuer is in default with respect to interest and/or principal payments. Income is not being accrued. | ||||||
| (f) | Fair valued security by the Fund’s investment adviser. At September 30, 2009 the value of these securities amounted to $7,899,660 or 0.1% of net assets. | ||||||
| (g) | Non-income producing security. | ||||||
| (h) | All or a portion of this security has not settled. Contract rates are not determined and do not take effect until settlement date. | ||||||
| (i) | Variable rate security. Rate shown represents the weighted average rate at September 30, 2009. | ||||||
| (j) | All or a portion of interest payment is paid-in-kind. | ||||||
| (k) | Future dividend payments have been eliminated as the issuer has been placed in conservatorship. | ||||||
| (l) | Issuer has filed for bankruptcy. | ||||||
See accompanying notes to financial statements.
53
Table of Contents
LOOMIS SAYLES STRATEGIC INCOME FUND — PORTFOLIO OF INVESTMENTS (continued)
Investments as of September 30, 2009
| 144A | Securities exempt from registration under Rule 144A of the Securities Act of 1933. These securities may be resold in transactions exempt from registration, normally to qualified institutional buyers. At September 30, 2009, the value of these securities amounted to $1,656,764,755 or 13.1% of net assets. | |||
| ADR | An American Depositary Receipt is a certificate issued by a custodian bank representing the right to receive securities of the foreign issuer described. The values of ADRs are significantly influenced by trading on exchanges not located in the United States. | |||
| ABS | Asset-Backed Securities | |||
| AMBAC | American Municipal Bond Assurance Corp. | |||
| EMTN | Euro Medium Term Note | |||
| FGIC | Financial Guaranty Insurance Company | |||
| FSA | Financial Security Assurance, Inc. | |||
| GMTN | Global Medium Term Note | |||
| MBIA | Municipal Bond Investors Assurance Corp. | |||
| MTN | Medium Term Note | |||
| REITs | Real Estate Investment Trusts | |||
| AUD | Australian Dollar | |||
| BRL | Brazilian Real | |||
| CAD | Canadian Dollar | |||
| EUR | Euro | |||
| GBP | British Pound | |||
| IDR | Indonesian Rupiah | |||
| ISK | Icelandic Krona | |||
| KRW | South Korean Won | |||
| MXN | Mexican Peso | |||
| NOK | Norwegian Krone | |||
| NZD | New Zealand Dollar | |||
| SGD | Singapore Dollar | |||
| THB | Thai Baht | |||
Industry Summary at September 30, 2009 (Unaudited)
| Treasuries | 8.8 | % | |
| Non-Captive Diversified | 6.9 | ||
| Banking | 6.7 | ||
| Wirelines | 5.3 | ||
| Technology | 4.9 | ||
| Sovereigns | 4.8 | ||
| Healthcare | 4.1 | ||
| Electric | 3.5 | ||
| Non-Captive Consumer | 3.2 | ||
| Automotive | 3.1 | ||
| Pharmaceuticals | 2.9 | ||
| Retailers | 2.6 | ||
| Oil Field Services | 2.4 | ||
| Paper | 2.4 | ||
| Media Cable | 2.4 | ||
| Pipelines | 2.3 | ||
| Supranational | 2.1 | ||
| Other Investments, less than 2% each | 26.5 | ||
| Short-Term Investments | 4.1 | ||
| Total Investments | 99.0 | ||
| Other assets less liabilities | 1.0 | ||
| Net Assets | 100.0 | % | |
Currency Exposure at September 30, 2009 as a Percentage of Net Assets (Unaudited)
| United States Dollar | 74.9 | % | |
| Canadian Dollar | 8.3 | ||
| New Zealand Dollar | 2.6 | ||
| Brazilian Real | 2.2 | ||
| Other, less than 2% each | 11.0 | ||
| Total Investments | 99.0 | ||
| Other assets less liabilities | 1.0 | ||
| Net Assets | 100.0 | % | |
See accompanying notes to financial statements.
54
Table of Contents
STATEMENTS OF ASSETS AND LIABILITIES
September 30, 2009
| Core Plus Bond Fund | High Income Fund | International Bond Fund | |||||||||
| ASSETS |
|||||||||||
| Investments at cost |
$ | 249,295,375 | $ | 170,197,311 | $ | 21,289,200 | |||||
| Net unrealized appreciation (depreciation) |
12,767,198 | 14,618,236 | 1,263,894 | ||||||||
| Investments at value |
262,062,573 | 184,815,547 | 22,553,094 | ||||||||
| Cash |
— | 6,106 | — | ||||||||
| Foreign currency at value (identified cost $0, $7,780, $874,981, $0 and $8,799,207) |
— | 8,213 | 880,281 | ||||||||
| Receivable for Fund shares sold |
2,547,574 | 744,136 | 512,878 | ||||||||
| Receivable for securities sold |
8,288,869 | — | 1,721,244 | ||||||||
| Receivable from investment advisor (Note 6) |
21,692 | 12,111 | 13,486 | ||||||||
| Dividends and interest receivable |
2,914,685 | 3,335,736 | 318,442 | ||||||||
| Unrealized appreciation on forward foreign currency contracts (Note 2) |
— | 4,791 | 65,206 | ||||||||
| Tax reclaims receivable |
10,183 | — | 439 | ||||||||
| Due from broker |
— | 5,028 | — | ||||||||
| TOTAL ASSETS |
275,845,576 | 188,931,668 | 26,065,070 | ||||||||
| LIABILITIES |
|||||||||||
| Payable for securities purchased |
15,890,070 | 3,216,971 | 1,517,811 | ||||||||
| Payable for Fund shares redeemed |
287,373 | 402,363 | — | ||||||||
| Unrealized depreciation on forward foreign currency contracts (Note 2) |
— | 17,552 | — | ||||||||
| Dividends payable |
— | — | — | ||||||||
| Foreign taxes payable (Note 2) |
— | 184 | — | ||||||||
| Management fees payable (Note 6) |
86,710 | 88,560 | 10,657 | ||||||||
| Deferred Trustees’ fees (Note 6) |
212,359 | 80,543 | 16,727 | ||||||||
| Administrative fees payable (Note 6) |
9,956 | 7,209 | 868 | ||||||||
| Other accounts payable and accrued expenses |
77,406 | 65,662 | 36,074 | ||||||||
| TOTAL LIABILITIES |
16,563,874 | 3,879,044 | 1,582,137 | ||||||||
| NET ASSETS |
$ | 259,281,702 | $ | 185,052,624 | $ | 24,482,933 | |||||
| NET ASSETS CONSIST OF: |
|||||||||||
| Paid-in capital |
$ | 266,419,164 | $ | 200,080,520 | $ | 22,832,559 | |||||
| Undistributed net investment income (Distributions in excess of net investment income) |
1,162,716 | 8,540 | 180,612 | ||||||||
| Accumulated net realized gain (loss) on investments and foreign currency transactions |
(21,067,376 | ) | (29,645,136 | ) | 126,236 | ||||||
| Net unrealized appreciation (depreciation) on investments and foreign currency translations |
12,767,198 | 14,608,700 | 1,343,526 | ||||||||
| NET ASSETS |
$ | 259,281,702 | $ | 185,052,624 | $ | 24,482,933 | |||||
| COMPUTATION OF NET ASSET VALUE AND OFFERING PRICE: |
|||||||||||
| Class A shares: |
|||||||||||
| Net assets |
$ | 140,779,380 | $ | 59,944,387 | $ | 8,478,817 | |||||
| Shares of beneficial interest |
11,820,281 | 13,338,029 | 782,082 | ||||||||
| Net asset value and redemption price per share |
$ | 11.91 | $ | 4.49 | $ | 10.84 | |||||
| Offering price per share (100/[100-maximum sales charge] of net asset value) (Note 1) |
$ | 12.47 | $ | 4.70 | $ | 11.35 | |||||
| Class B shares: (redemption price per share is equal to net asset value less any applicable contingent deferred sales charge) (Note 1) |
|||||||||||
| Net assets |
$ | 7,027,907 | $ | 1,568,722 | $ | — | |||||
| Shares of beneficial interest |
588,239 | 348,469 | — | ||||||||
| Net asset value and offering price per share |
$ | 11.95 | $ | 4.50 | $ | — | |||||
| Class C shares: (redemption price per share is equal to net asset value less any applicable contingent deferred sales charge) (Note 1) |
|||||||||||
| Net assets |
$ | 77,080,859 | $ | 17,826,637 | $ | 2,954,887 | |||||
| Shares of beneficial interest |
6,467,699 | 3,960,598 | 273,099 | ||||||||
| Net asset value and offering price per share |
$ | 11.92 | $ | 4.50 | $ | 10.82 | |||||
| Class Y shares: |
|||||||||||
| Net assets |
$ | 34,393,556 | $ | 105,712,878 | $ | 13,049,229 | |||||
| Shares of beneficial interest |
2,872,316 | 23,545,501 | 1,205,606 | ||||||||
| Net asset value, offering and redemption price per share |
$ | 11.97 | $ | 4.49 | $ | 10.82 | |||||
See accompanying notes to financial statements.
55
Table of Contents
| Limited Term Government and Agency Fund |
Strategic Income Fund |
|||||
| $ | 194,184,804 | $ | 12,829,100,798 | |||
| 7,110,958 | (313,519,649 | ) | ||||
| 201,295,762 | 12,515,581,149 | |||||
| — | 28,329 | |||||
| — | 8,687,510 | |||||
| 1,426,211 | 37,774,087 | |||||
| — | 32,240,848 | |||||
| 42,507 | — | |||||
| 902,024 | 193,384,207 | |||||
| — | — | |||||
| — | 52,563 | |||||
| — | — | |||||
| 203,666,504 | 12,787,748,693 | |||||
| 446,484 | 101,755,128 | |||||
| 635,633 | 32,506,294 | |||||
| — | — | |||||
| 185,399 | — | |||||
| — | 339,912 | |||||
| 80,898 | 5,667,057 | |||||
| 201,782 | 489,310 | |||||
| 7,903 | 495,206 | |||||
| 70,466 | 1,145,836 | |||||
| 1,628,565 | 142,398,743 | |||||
| $ | 202,037,939 | $ | 12,645,349,950 | |||
| $ | 201,023,381 | $ | 13,614,150,354 | |||
| 40,900 | (3,333,964 | ) | ||||
| (6,137,300 | ) | (653,562,540 | ) | |||
| 7,110,958 | (311,903,900 | ) | ||||
| $ | 202,037,939 | $ | 12,645,349,950 | |||
| $ | 118,619,186 | $ | 5,544,029,232 | |||
| 10,224,857 | 414,142,440 | |||||
| $ | 11.60 | $ | 13.39 | |||
| $ | 11.95 | $ | 14.02 | |||
| $ | 4,441,690 | $ | 148,886,834 | |||
| 383,269 | 11,059,473 | |||||
| $ | 11.59 | $ | 13.46 | |||
| $ | 50,972,980 | $ | 4,894,545,621 | |||
| 4,390,564 | 363,833,272 | |||||
| $ | 11.61 | $ | 13.45 | |||
| $ | 28,004,083 | $ | 2,057,888,263 | |||
| 2,406,845 | 153,823,270 | |||||
| $ | 11.64 | $ | 13.38 | |||
56
Table of Contents
STATEMENTS OF OPERATIONS
For the Year Ended September 30, 2009
| Core Plus Bond Fund | High Income Fund | International Bond Fund |
||||||||||
| INVESTMENT INCOME |
||||||||||||
| Dividends |
$ | 23,956 | $ | 162,845 | $ | — | ||||||
| Interest |
12,954,595 | 8,858,726 | 644,915 | |||||||||
| Securities lending income (Note 2) |
3,323 | 648 | — | |||||||||
| Less net foreign taxes withheld |
(11,979 | ) | (13,149 | ) | — | |||||||
| 12,969,895 | 9,009,070 | 644,915 | ||||||||||
| Expenses |
||||||||||||
| Management fees (Note 6) |
893,730 | 558,817 | 88,309 | |||||||||
| Service fees - Class A (Note 6) |
310,233 | 104,938 | 8,741 | |||||||||
| Service and distribution fees - Class B (Note 6) |
82,185 | 15,269 | — | |||||||||
| Service and distribution fees - Class C (Note 6) |
518,988 | 120,884 | 9,880 | |||||||||
| Trustees’ fees and expenses (Note 6) |
15,673 | 13,412 | 12,992 | |||||||||
| Administrative fees (Note 6) |
101,792 | 46,013 | 38,718 | |||||||||
| Custodian fees and expenses |
27,123 | 47,382 | 31,393 | |||||||||
| Transfer agent fees and expenses - Class A (Note 6) |
177,912 | 51,925 | 2,294 | |||||||||
| Transfer agent fees and expenses - Class B (Note 6) |
11,813 | 1,923 | — | |||||||||
| Transfer agent fees and expenses - Class C (Note 6) |
74,201 | 14,979 | 720 | |||||||||
| Transfer agent fees and expenses - Class Y (Note 6) |
20,708 | 29,083 | 477 | |||||||||
| Audit and tax services fees |
46,320 | 47,344 | 48,521 | |||||||||
| Legal fees |
6,893 | 3,769 | 481 | |||||||||
| Shareholder reporting expenses |
46,257 | 23,342 | 4,683 | |||||||||
| Registration fees |
66,531 | 84,690 | 47,360 | |||||||||
| Miscellaneous expenses (Note 6) |
(22,662 | ) | (3,631 | ) | 4,103 | |||||||
| Total expenses |
2,377,697 | 1,160,139 | 298,672 | |||||||||
| Less fee reduction and/or expense reimbursement (Note 6) |
(133,826 | ) | (80,823 | ) | (154,948 | ) | ||||||
| Net expenses |
2,243,871 | 1,079,316 | 143,724 | |||||||||
| Net investment income |
10,726,024 | 7,929,754 | 501,191 | |||||||||
| NET REALIZED AND UNREALIZED GAIN (LOSS) ON INVESTMENTS |
||||||||||||
| Net realized gain (loss) on: |
||||||||||||
| Investments |
1,026,647 | (2,866,469 | ) | 191,068 | ||||||||
| Foreign currency transactions |
20,938 | (76,605 | ) | 55,057 | ||||||||
| Net change in unrealized appreciation (depreciation) on: |
||||||||||||
| Investments |
27,447,282 | 23,851,440 | 2,269,558 | |||||||||
| Foreign currency translations |
(71 | ) | (4,640 | ) | 126,700 | |||||||
| Net realized and unrealized gain on investments and foreign currency transactions |
28,494,796 | 20,903,726 | 2,642,383 | |||||||||
| NET INCREASE IN NET ASSETS RESULTING FROM OPERATIONS |
$ | 39,220,820 | $ | 28,833,480 | $ | 3,143,574 | ||||||
See accompanying notes to financial statements.
57
Table of Contents
| Limited Term Government and Agency Fund |
Strategic Income Fund |
|||||
| $ | — | $ | 33,603,271 | |||
| 7,756,448 | 820,316,083 | |||||
| 291 | 107,283 | |||||
| — | (1,165,114 | ) | ||||
| 7,756,739 | 852,861,523 | |||||
| 970,393 | 55,117,195 | |||||
| 306,180 | 11,730,368 | |||||
| 46,672 | 1,343,664 | |||||
| 535,208 | 38,124,862 | |||||
| 15,612 | 182,149 | |||||
| 97,102 | 4,879,685 | |||||
| 25,247 | 439,790 | |||||
| 116,220 | 4,738,807 | |||||
| 4,499 | 135,666 | |||||
| 51,317 | 3,829,237 | |||||
| 8,372 | 965,876 | |||||
| 48,112 | 61,539 | |||||
| 6,622 | 329,555 | |||||
| 18,186 | 1,099,511 | |||||
| 92,483 | 276,658 | |||||
| (21,652 | ) | 331,949 | ||||
| 2,320,573 | 123,586,511 | |||||
| (171,005 | ) | — | ||||
| 2,149,568 | 123,586,511 | |||||
| 5,607,171 | 729,275,012 | |||||
| 2,955,994 | (769,749,888 | ) | ||||
| — | 4,460,417 | |||||
| 8,456,894 | 2,047,826,732 | |||||
| — | 8,819,350 | |||||
| 11,412,888 | 1,291,356,611 | |||||
| $ | 17,020,059 | $ | 2,020,631,623 | |||
58
Table of Contents
STATEMENTS OF CHANGES IN NET ASSETS
| Core Plus Bond Fund | High Income Fund | International Bond Fund | ||||||||||||||||||||||
| Year Ended September 30, 2009 |
Year Ended September 30, 2008 |
Year Ended September 30, 2009 |
Year Ended September 30, 2008 |
Year Ended September 30, 2009 |
Period Ended September 30, 2008 (a) |
|||||||||||||||||||
| FROM OPERATIONS: |
||||||||||||||||||||||||
| Net investment income |
$ | 10,726,024 | $ | 7,889,395 | $ | 7,929,754 | $ | 3,149,292 | $ | 501,191 | $ | 212,713 | ||||||||||||
| Net realized gain (loss) on investments and foreign currency transactions |
1,047,585 | 1,986,851 | (2,943,074 | ) | 555,245 | 246,125 | (76,409 | ) | ||||||||||||||||
| Net change in unrealized appreciation (depreciation) on investments and foreign currency translations |
27,447,211 | (13,469,246 | ) | 23,846,800 | (10,381,633 | ) | 2,396,258 | (1,052,732 | ) | |||||||||||||||
| Net increase (decrease) in net assets resulting from operations |
39,220,820 | (3,593,000 | ) | 28,833,480 | (6,677,096 | ) | 3,143,574 | (916,428 | ) | |||||||||||||||
| FROM DISTRIBUTIONS TO SHAREHOLDERS: |
||||||||||||||||||||||||
| Net investment income |
||||||||||||||||||||||||
| Class A |
(7,509,410 | ) | (6,214,311 | ) | (3,638,806 | ) | (2,552,225 | ) | (80,043 | ) | (20,706 | ) | ||||||||||||
| Class B |
(436,844 | ) | (690,101 | ) | (124,178 | ) | (205,884 | ) | — | — | ||||||||||||||
| Class C |
(2,761,267 | ) | (812,461 | ) | (969,430 | ) | (471,489 | ) | (13,441 | ) | (5,728 | ) | ||||||||||||
| Class Y |
(1,308,176 | ) | (1,030,857 | ) | (3,008,116 | ) | (54,867 | ) | (240,546 | ) | (217,001 | ) | ||||||||||||
| Net realized capital gain |
||||||||||||||||||||||||
| Class A |
— | — | — | — | — | — | ||||||||||||||||||
| Class B |
— | — | — | — | — | — | ||||||||||||||||||
| Class C |
— | — | — | — | — | — | ||||||||||||||||||
| Class Y |
— | — | — | — | — | — | ||||||||||||||||||
| Total distributions |
(12,015,697 | ) | (8,747,730 | ) | (7,740,530 | ) | (3,284,465 | ) | (334,030 | ) | (243,435 | ) | ||||||||||||
| NET INCREASE (DECREASE) IN NET ASSETS FROM CAPITAL SHARE TRANSACTIONS (NOTE 10) |
58,618,493 | (35,735,068 | ) | 109,311,312 | 22,486,017 | 9,056,042 | 13,763,336 | |||||||||||||||||
| Redemption fees |
||||||||||||||||||||||||
| Class A |
— | 10,657 | 17,604 | 12,665 | — | 259 | ||||||||||||||||||
| Class B |
— | 1,520 | 697 | 782 | — | — | ||||||||||||||||||
| Class C |
— | 1,489 | 4,945 | 3,312 | — | 275 | ||||||||||||||||||
| Class Y |
— | 1,652 | 3,996 | 1,025 | — | 13,340 | ||||||||||||||||||
| Total redemption fees |
— | 15,318 | 27,242 | 17,784 | — | 13,874 | ||||||||||||||||||
| Net increase (decrease) in net assets |
85,823,616 | (48,060,480 | ) | 130,431,504 | 12,542,240 | 11,865,586 | 12,617,347 | |||||||||||||||||
| NET ASSETS |
||||||||||||||||||||||||
| Beginning of the year |
173,458,086 | 221,518,566 | 54,621,120 | 42,078,880 | 12,617,347 | — | ||||||||||||||||||
| End of the year |
$ | 259,281,702 | $ | 173,458,086 | $ | 185,052,624 | $ | 54,621,120 | $ | 24,482,933 | $ | 12,617,347 | ||||||||||||
| UNDISTRIBUTED NET INVESTMENT INCOME (DISTRIBUTIONS IN EXCESS OF NET INVESTMENT INCOME) |
$ | 1,162,716 | $ | 371,177 | $ | 8,540 | $ | (14,090 | ) | $ | 180,612 | $ | (22,126 | ) | ||||||||||
| (a) | From commencement of operations on February 1, 2008 through September 30, 2008. |
See accompanying notes to financial statements.
59
Table of Contents
| Limited Term Government and Agency Fund | Strategic Income Fund | |||||||||||||
| Year Ended September 30, 2009 |
Year Ended September 30, 2008 |
Year Ended September 30, 2009 |
Year Ended September 30, 2008 |
|||||||||||
| $ | 5,607,171 | $ | 4,755,700 | $ | 729,275,012 | $ | 754,292,599 | |||||||
| 2,955,994 | 498,940 | (765,289,471 | ) | 183,690,261 | ||||||||||
| 8,456,894 | (407,128 | ) | 2,056,646,082 | (2,817,298,752 | ) | |||||||||
| 17,020,059 | 4,847,512 | 2,020,631,623 | (1,879,315,892 | ) | ||||||||||
| (3,913,002 | ) | (4,474,145 | ) | (356,540,265 | ) | (448,782,373 | ) | |||||||
| (112,841 | ) | (205,652 | ) | (9,240,752 | ) | (12,700,249 | ) | |||||||
| (1,292,557 | ) | (262,151 | ) | (258,397,380 | ) | (272,297,986 | ) | |||||||
| (471,487 | ) | (244,165 | ) | (89,955,755 | ) | (61,058,261 | ) | |||||||
| — | — | (33,148,981 | ) | (5,233,811 | ) | |||||||||
| — | — | (1,003,570 | ) | (183,665 | ) | |||||||||
| — | — | (25,254,965 | ) | (3,481,864 | ) | |||||||||
| — | — | (5,262,204 | ) | (634,289 | ) | |||||||||
| (5,789,887 | ) | (5,186,113 | ) | (778,803,872 | ) | (804,372,498 | ) | |||||||
| 51,940,484 | 14,420,990 | 923,443,021 | 2,697,961,138 | |||||||||||
| — | — | — | 209,238 | |||||||||||
| — | — | — | 7,216 | |||||||||||
| — | — | — | 140,777 | |||||||||||
| — | — | — | 25,844 | |||||||||||
| — | — | — | 383,075 | |||||||||||
| 63,170,656 | 14,082,389 | 2,165,270,772 | 14,655,823 | |||||||||||
| 138,867,283 | 124,784,894 | 10,480,079,178 | 10,465,423,355 | |||||||||||
| $ | 202,037,939 | $ | 138,867,283 | $ | 12,645,349,950 | $ | 10,480,079,178 | |||||||
| $ | 40,900 | $ | (287,351 | ) | $ | (3,333,964 | ) | $ | 97,385,788 | |||||
60
Table of Contents
FINANCIAL HIGHLIGHTS
For a share outstanding throughout each period.
| Income (Loss) from Investment Operations: | Less Distributions: | ||||||||||||||||||||||||
| Net asset value, beginning of the period |
Net investment income (a) |
Net realized and unrealized gain (loss) |
Total from investment operations |
Dividends from net investment income |
Total distributions |
Redemption fees (b)(c) | |||||||||||||||||||
| CORE PLUS BOND FUND |
|||||||||||||||||||||||||
| Class A |
|||||||||||||||||||||||||
| 9/30/2009 |
$ | 10.54 | $ | 0.59 | $ | 1.44 | $ | 2.03 | $ | (0.66 | ) | $ | (0.66 | ) | $ | — | |||||||||
| 9/30/2008 |
11.31 | 0.55 | (0.71 | ) | (0.16 | ) | (0.61 | ) | (0.61 | ) | 0.00 | ||||||||||||||
| 9/30/2007 |
11.23 | 0.50 | 0.14 | 0.64 | (0.56 | ) | (0.56 | ) | 0.00 | ||||||||||||||||
| 9/30/2006 |
11.41 | 0.50 | (0.07 | ) | 0.43 | (0.61 | ) | (0.61 | ) | 0.00 | |||||||||||||||
| 9/30/2005 |
11.69 | 0.46 | (0.18 | ) | 0.28 | (0.56 | ) | (0.56 | ) | 0.00 | |||||||||||||||
| Class B |
|||||||||||||||||||||||||
| 9/30/2009 |
10.57 | 0.50 | 1.45 | 1.95 | (0.57 | ) | (0.57 | ) | — | ||||||||||||||||
| 9/30/2008 |
11.31 | 0.44 | (0.67 | ) | (0.23 | ) | (0.51 | ) | (0.51 | ) | 0.00 | ||||||||||||||
| 9/30/2007 |
11.24 | 0.41 | 0.13 | 0.54 | (0.47 | ) | (0.47 | ) | 0.00 | ||||||||||||||||
| 9/30/2006 |
11.41 | 0.41 | (0.05 | ) | 0.36 | (0.53 | ) | (0.53 | ) | 0.00 | |||||||||||||||
| 9/30/2005 |
11.70 | 0.37 | (0.18 | ) | 0.19 | (0.48 | ) | (0.48 | ) | 0.00 | |||||||||||||||
| Class C |
|||||||||||||||||||||||||
| 9/30/2009 |
10.55 | 0.51 | 1.44 | 1.95 | (0.58 | ) | (0.58 | ) | — | ||||||||||||||||
| 9/30/2008 |
11.32 | 0.47 | (0.71 | ) | (0.24 | ) | (0.53 | ) | (0.53 | ) | 0.00 | ||||||||||||||
| 9/30/2007 |
11.25 | 0.41 | 0.13 | 0.54 | (0.47 | ) | (0.47 | ) | 0.00 | ||||||||||||||||
| 9/30/2006 |
11.42 | 0.41 | (0.05 | ) | 0.36 | (0.53 | ) | (0.53 | ) | 0.00 | |||||||||||||||
| 9/30/2005 |
11.71 | 0.37 | (0.18 | ) | 0.19 | (0.48 | ) | (0.48 | ) | 0.00 | |||||||||||||||
| Class Y |
|||||||||||||||||||||||||
| 9/30/2009 |
10.60 | 0.62 | 1.44 | 2.06 | (0.69 | ) | (0.69 | ) | — | ||||||||||||||||
| 9/30/2008 |
11.36 | 0.58 | (0.70 | ) | (0.12 | ) | (0.64 | ) | (0.64 | ) | 0.00 | ||||||||||||||
| 9/30/2007 |
11.29 | 0.54 | 0.13 | 0.67 | (0.60 | ) | (0.60 | ) | 0.00 | ||||||||||||||||
| 9/30/2006 |
11.46 | 0.51 | (0.04 | ) | 0.47 | (0.64 | ) | (0.64 | ) | 0.00 | |||||||||||||||
| 9/30/2005 |
11.74 | 0.49 | (0.18 | ) | 0.31 | (0.59 | ) | (0.59 | ) | 0.00 | |||||||||||||||
| (a) | Per share net investment income has been calculated using the average shares outstanding during the period. |
| (b) | Amount rounds to less than $0.01 per share, if applicable. |
| (c) | Effective June 2, 2008, redemption fees were eliminated. |
| (d) | A sales charge for Class A shares and a contingent deferred sales charge for Class B and Class C shares are not reflected in total return calculations. Periods less than one year, if applicable, are not annualized. |
See accompanying notes to financial statements.
61
Table of Contents
| Ratios to Average Net Assets: | |||||||||||||||||
| Net asset value, end of the period |
Total return (%) (d)(e) |
Net assets, end of the period (000’s) |
Net expenses (%) (f)(g) |
Gross expenses (%) (g) |
Net investment income (loss) (%) (g) |
Portfolio turnover rate (%) | |||||||||||
| $ | 11.91 | 20.07 | $ | 140,779 | 0.90 | 0.97 | 5.43 | 102 | |||||||||
| 10.54 | (1.61 | ) | 115,873 | 0.93 | 1.04 | 4.86 | 82 | ||||||||||
| 11.31 | 5.70 | 105,780 | 1.04 | 1.09 | 4.41 | 69 | |||||||||||
| 11.23 | 4.03 | 91,464 | 1.05 | 1.08 | 4.46 | 91 | |||||||||||
| 11.41 | 2.43 | 105,111 | 1.13 | 1.18 | 3.93 | 64 | |||||||||||
| 11.95 | 19.19 | 7,028 | 1.65 | 1.72 | 4.66 | 102 | |||||||||||
| 10.57 | (2.21 | ) | 10,481 | 1.70 | 1.80 | 3.92 | 82 | ||||||||||
| 11.31 | 4.90 | 87,101 | 1.79 | 1.85 | 3.64 | 69 | |||||||||||
| 11.24 | 3.26 | 109,782 | 1.80 | 1.83 | 3.72 | 91 | |||||||||||
| 11.41 | 1.58 | 132,221 | 1.88 | 1.93 | 3.18 | 64 | |||||||||||
| 11.92 | 19.20 | 77,081 | 1.65 | 1.72 | 4.69 | 102 | |||||||||||
| 10.55 | (2.32 | ) | 26,698 | 1.68 | 1.79 | 4.17 | 82 | ||||||||||
| 11.32 | 4.91 | 12,690 | 1.78 | 1.82 | 3.66 | 69 | |||||||||||
| 11.25 | 3.26 | 6,983 | 1.80 | 1.82 | 3.63 | 91 | |||||||||||
| 11.42 | 1.59 | 6,065 | 1.88 | 1.93 | 3.17 | 64 | |||||||||||
| 11.97 | 20.37 | 34,394 | 0.65 | 0.68 | 5.67 | 102 | |||||||||||
| 10.60 | (1.36 | ) | 20,407 | 0.68 | 0.75 | 5.14 | 82 | ||||||||||
| 11.36 | 6.06 | 15,946 | 0.70 | 0.75 | 4.75 | 69 | |||||||||||
| 11.29 | 4.28 | 11,986 | 0.80 | (h) | 0.80 | (h) | 4.58 | 91 | |||||||||
| 11.46 | 2.68 | 9,060 | 0.88 | 0.99 | 4.18 | 64 | |||||||||||
| (e) | Had certain expenses not been reduced during the period, if applicable, total return would have been lower. |
| (f) | The investment adviser and/or administrator agreed to reimburse a portion of the Fund’s expenses and/or reduce its fee during the period. Without this reimbursement/fee reduction, if applicable, expenses would have been higher. |
| (g) | Computed on an annualized basis for periods less than one year, if applicable. |
| (h) | Includes fee/expense recovery of 0.06%. |
62
Table of Contents
FINANCIAL HIGHLIGHTS (continued)
For a share outstanding throughout each period.
| Income (Loss) from Investment Operations: | Less Distributions: | |||||||||||||||||||||
| Net asset value, beginning of the period |
Net investment income (a) |
Net realized and unrealized gain (loss) |
Total from investment operations |
Dividends from net investment income |
Total distributions |
|||||||||||||||||
| HIGH INCOME FUND |
||||||||||||||||||||||
| Class A |
||||||||||||||||||||||
| 9/30/2009 |
$ | 4.24 | $ | 0.34 | $ | 0.24 | $ | 0.58 | $ | (0.33 | ) | $ | (0.33 | ) | ||||||||
| 9/30/2008 |
5.12 | 0.34 | (0.87 | ) | (0.53 | ) | (0.35 | ) | (0.35 | ) | ||||||||||||
| 9/30/2007 |
5.09 | 0.33 | 0.08 | 0.41 | (0.38 | ) | (0.38 | ) | ||||||||||||||
| 9/30/2006 |
4.98 | 0.34 | 0.11 | 0.45 | (0.34 | ) | (0.34 | ) | ||||||||||||||
| 9/30/2005 |
4.82 | 0.33 | 0.16 | 0.49 | (0.33 | ) | (0.33 | ) | ||||||||||||||
| Class B |
||||||||||||||||||||||
| 9/30/2009 |
4.25 | 0.31 | 0.25 | 0.56 | (0.31 | ) | (0.31 | ) | ||||||||||||||
| 9/30/2008 |
5.13 | 0.30 | (0.87 | ) | (0.57 | ) | (0.31 | ) | (0.31 | ) | ||||||||||||
| 9/30/2007 |
5.10 | 0.29 | 0.07 | 0.36 | (0.33 | ) | (0.33 | ) | ||||||||||||||
| 9/30/2006 |
4.98 | 0.30 | 0.12 | 0.42 | (0.30 | ) | (0.30 | ) | ||||||||||||||
| 9/30/2005 |
4.83 | 0.29 | 0.15 | 0.44 | (0.29 | ) | (0.29 | ) | ||||||||||||||
| Class C |
||||||||||||||||||||||
| 9/30/2009 |
4.24 | 0.31 | 0.26 | 0.57 | (0.31 | ) | (0.31 | ) | ||||||||||||||
| 9/30/2008 |
5.12 | 0.31 | (0.87 | ) | (0.56 | ) | (0.32 | ) | (0.32 | ) | ||||||||||||
| 9/30/2007 |
5.09 | 0.29 | 0.07 | 0.36 | (0.33 | ) | (0.33 | ) | ||||||||||||||
| 9/30/2006 |
4.98 | 0.30 | 0.11 | 0.41 | (0.30 | ) | (0.30 | ) | ||||||||||||||
| 9/30/2005 |
4.83 | 0.29 | 0.15 | 0.44 | (0.29 | ) | (0.29 | ) | ||||||||||||||
| Class Y |
||||||||||||||||||||||
| 9/30/2009 |
4.24 | 0.34 | 0.25 | 0.59 | (0.34 | ) | (0.34 | ) | ||||||||||||||
| 9/30/2008(h) |
4.87 | 0.22 | (0.65 | ) | (0.43 | ) | (0.21 | ) | (0.21 | ) | ||||||||||||
| INTERNATIONAL BOND FUND |
||||||||||||||||||||||
| Class A |
||||||||||||||||||||||
| 9/30/2009 |
$ | 9.19 | $ | 0.32 | $ | 1.53 | $ | 1.85 | $ | (0.20 | ) | $ | (0.20 | ) | ||||||||
| 9/30/2008(j) |
10.00 | 0.17 | (0.79 | ) | (0.62 | ) | (0.19 | ) | (0.19 | ) | ||||||||||||
| Class C |
||||||||||||||||||||||
| 9/30/2009 |
9.18 | 0.24 | 1.53 | 1.77 | (0.13 | ) | (0.13 | ) | ||||||||||||||
| 9/30/2008(j) |
10.00 | 0.13 | (0.81 | ) | (0.68 | ) | (0.15 | ) | (0.15 | ) | ||||||||||||
| Class Y |
||||||||||||||||||||||
| 9/30/2009 |
9.18 | 0.33 | 1.53 | 1.86 | (0.22 | ) | (0.22 | ) | ||||||||||||||
| 9/30/2008(j) |
10.00 | 0.18 | (0.81 | ) | (0.63 | ) | (0.20 | ) | (0.20 | ) | ||||||||||||
| (a) | Per share net investment income has been calculated using the average shares outstanding during the period. |
| (b) | Amount rounds to less than $0.01 per share, if applicable. |
| (c) | A sales charge for Class A shares and a contingent deferred sales charge for Class B and Class C shares are not reflected in total return calculations. Periods less than one year, if applicable, are not annualized. |
| (d) | Had certain expenses not been reduced during the period, if applicable, total returns would have been lower. |
See accompanying notes to financial statements.
63
Table of Contents
| Ratios to Average Net Assets: | |||||||||||||||||||
| Redemption fees (b) |
Net asset value, end of the period |
Total return (%) (c)(d) |
Net assets, end of the period (000’s) |
Net expenses (%) (e)(f) |
Gross expenses (%) (f) |
Net investment income (loss) (%) (f) |
Portfolio turnover rate (%) | ||||||||||||
| $ | 0.00 | (g) | $ | 4.49 | 15.97 | $ | 59,944 | 1.15 | 1.28 | 8.82 | 30 | ||||||||
| 0.00 | 4.24 | (10.98 | ) | 38,577 | 1.15 | 1.40 | 7.01 | 27 | |||||||||||
| 0.00 | 5.12 | 8.10 | 32,603 | 1.18 | 1.43 | 6.40 | 41 | ||||||||||||
| 0.00 | 5.09 | 9.39 | 29,069 | 1.31 | 1.48 | 6.70 | 41 | ||||||||||||
| 0.00 | 4.98 | 10.34 | 25,817 | 1.58 | 1.72 | 6.60 | 42 | ||||||||||||
| 0.00 | (g) | 4.50 | 15.06 | 1,569 | 1.90 | 2.06 | 8.32 | 30 | |||||||||||
| 0.00 | 4.25 | (11.64 | ) | 2,267 | 1.90 | 2.15 | 6.15 | 27 | |||||||||||
| 0.00 | 5.13 | 7.21 | 4,201 | 1.94 | 2.18 | 5.63 | 41 | ||||||||||||
| 0.00 | 5.10 | 8.79 | 7,283 | 2.08 | 2.25 | 6.00 | 41 | ||||||||||||
| 0.00 | 4.98 | 9.29 | 12,034 | 2.33 | 2.47 | 5.85 | 42 | ||||||||||||
| 0.00 | (g) | 4.50 | 15.37 | 17,827 | 1.90 | 2.03 | 8.09 | 30 | |||||||||||
| 0.00 | 4.24 | (11.62 | ) | 9,945 | 1.90 | 2.15 | 6.32 | 27 | |||||||||||
| 0.00 | 5.12 | 7.22 | 5,275 | 1.93 | 2.17 | 5.63 | 41 | ||||||||||||
| 0.00 | 5.09 | 8.58 | 3,457 | 2.07 | 2.23 | 5.96 | 41 | ||||||||||||
| 0.00 | 4.98 | 9.29 | 3,554 | 2.33 | 2.47 | 5.82 | 42 | ||||||||||||
| 0.00 | (g) | 4.49 | 16.29 | 105,713 | 0.90 | 0.92 | 8.32 | 30 | |||||||||||
| 0.01 | 4.24 | (9.10 | ) | 3,833 | 0.90 | 1.15 | 8.03 | 27 | |||||||||||
| $ | — | $ | 10.84 | 20.41 | $ | 8,479 | 1.10 | 2.11 | 3.29 | 91 | |||||||||
| 0.00 | (i) | 9.19 | (6.37 | ) | 1,953 | 1.10 | 2.95 | 2.66 | 60 | ||||||||||
| — | 10.82 | 19.58 | 2,955 | 1.85 | 2.93 | 2.56 | 91 | ||||||||||||
| 0.01 | (i) | 9.18 | (6.95 | ) | 683 | 1.85 | 3.70 | 1.92 | 60 | ||||||||||
| — | 10.82 | 20.73 | 13,049 | 0.85 | 1.92 | 3.53 | 91 | ||||||||||||
| 0.01 | (i) | 9.18 | (6.39 | ) | 9,981 | 0.85 | 2.48 | 2.74 | 60 | ||||||||||
| (e) | The investment adviser and/or administrator agreed to reimburse a portion of the Fund’s expenses and/or reduce its fee during the period. Without this reimbursement/fee reduction, if applicable, expenses would have been higher. |
| (f) | Computed on an annualized basis for periods less than one year, if applicable. |
| (g) | Effective June 1, 2009, redemption fees were eliminated. |
| (h) | From commencement of class operations on February 29, 2008 through September 30, 2008. |
| (i) | Effective June 2, 2008, redemption fees were eliminated. |
| (j) | For the period February 1, 2008 (inception) through September 30, 2008. |
64
Table of Contents
FINANCIAL HIGHLIGHTS (continued)
For a share outstanding throughout each period.
| Income (Loss) from Investment Operations: | Less Distributions: | ||||||||||||||||||||
| Net asset value, beginning of the period |
Net investment income (a) |
Net realized and unrealized gain (loss) |
Total from investment operations |
Dividends from net investment income |
Total distributions |
||||||||||||||||
| LIMITED TERM GOVERNMENT AND AGENCY FUND |
|||||||||||||||||||||
| Class A |
|||||||||||||||||||||
| 9/30/2009 |
$ | 10.98 | $ | 0.35 | $ | 0.63 | $ | 0.98 | $ | (0.36 | ) | $ | (0.36 | ) | |||||||
| 9/30/2008 |
11.00 | 0.45 | 0.02 | 0.47 | (0.49 | ) | (0.49 | ) | |||||||||||||
| 9/30/2007 |
11.00 | 0.45 | 0.03 | 0.48 | (0.48 | ) | (0.48 | ) | |||||||||||||
| 9/30/2006 |
11.09 | 0.39 | (0.05 | ) | 0.34 | (0.43 | ) | (0.43 | ) | ||||||||||||
| 9/30/2005 |
11.30 | 0.28 | (0.16 | ) | 0.12 | (0.33 | ) | (0.33 | ) | ||||||||||||
| Class B |
|||||||||||||||||||||
| 9/30/2009 |
10.97 | 0.26 | 0.63 | 0.89 | (0.27 | ) | (0.27 | ) | |||||||||||||
| 9/30/2008 |
10.99 | 0.36 | 0.02 | 0.38 | (0.40 | ) | (0.40 | ) | |||||||||||||
| 9/30/2007 |
10.98 | 0.37 | 0.03 | 0.40 | (0.39 | ) | (0.39 | ) | |||||||||||||
| 9/30/2006 |
11.07 | 0.31 | (0.05 | ) | 0.26 | (0.35 | ) | (0.35 | ) | ||||||||||||
| 9/30/2005 |
11.28 | 0.20 | (0.17 | ) | 0.03 | (0.24 | ) | (0.24 | ) | ||||||||||||
| Class C |
|||||||||||||||||||||
| 9/30/2009 |
10.99 | 0.26 | 0.63 | 0.89 | (0.27 | ) | (0.27 | ) | |||||||||||||
| 9/30/2008 |
11.00 | 0.36 | 0.03 | 0.39 | (0.40 | ) | (0.40 | ) | |||||||||||||
| 9/30/2007 |
10.99 | 0.37 | 0.03 | 0.40 | (0.39 | ) | (0.39 | ) | |||||||||||||
| 9/30/2006 |
11.08 | 0.31 | (0.05 | ) | 0.26 | (0.35 | ) | (0.35 | ) | ||||||||||||
| 9/30/2005 |
11.30 | 0.20 | (0.18 | ) | 0.02 | (0.24 | ) | (0.24 | ) | ||||||||||||
| Class Y |
|||||||||||||||||||||
| 9/30/2009 |
11.01 | 0.39 | 0.63 | 1.02 | (0.39 | ) | (0.39 | ) | |||||||||||||
| 9/30/2008 |
11.03 | 0.47 | 0.02 | 0.49 | (0.51 | ) | (0.51 | ) | |||||||||||||
| 9/30/2007 |
11.03 | 0.49 | 0.03 | 0.52 | (0.52 | ) | (0.52 | ) | |||||||||||||
| 9/30/2006 |
11.13 | 0.43 | (0.06 | ) | 0.37 | (0.47 | ) | (0.47 | ) | ||||||||||||
| 9/30/2005 |
11.34 | 0.31 | (0.17 | ) | 0.14 | (0.35 | ) | (0.35 | ) | ||||||||||||
| (a) | Per share net investment income has been calculated using the average shares outstanding during the period. |
| (b) | A sales charge for Class A shares and a contingent deferred sales charge for Class B and Class C shares are not reflected in total return calculations. Periods less than one year, if applicable, are not annualized. |
| (c) | Had certain expenses not been reduced during the period, if applicable, total returns would have been lower. |
See accompanying notes to financial statements.
65
Table of Contents
| Ratios to Average Net Assets: | |||||||||||||||
| Net asset value, end of the period |
Total return (%) (b)(c) |
Net assets, end of the period (000’s) |
Net expenses (%) (d)(e) |
Gross expenses (%) (d) |
Net investment income (loss) (%) (d) |
Portfolio turnover rate (%) | |||||||||
| $ | 11.60 | 9.05 | $ | 118,619 | 0.90 | 0.99 | 3.10 | 77 | |||||||
| 10.98 | 4.29 | 105,047 | 0.92 | 1.07 | 4.04 | 52 | |||||||||
| 11.00 | 4.46 | 108,536 | 0.99 | 1.10 | 4.13 | 45 | |||||||||
| 11.00 | 3.20 | 114,180 | 1.04 | 1.09 | 3.57 | 50 | |||||||||
| 11.09 | 1.05 | 141,417 | 1.24 | 1.24 | 2.50 | 93 | |||||||||
| 11.59 | 8.24 | 4,442 | 1.65 | 1.74 | 2.32 | 77 | |||||||||
| 10.97 | 3.52 | 4,532 | 1.67 | 1.82 | 3.29 | 52 | |||||||||
| 10.99 | 3.72 | 6,787 | 1.74 | 1.85 | 3.37 | 45 | |||||||||
| 10.98 | 2.36 | 9,952 | 1.79 | 1.84 | 2.79 | 50 | |||||||||
| 11.07 | 0.29 | 15,114 | 1.99 | 1.99 | 1.75 | 93 | |||||||||
| 11.61 | 8.24 | 50,973 | 1.65 | 1.74 | 2.32 | 77 | |||||||||
| 10.99 | 3.62 | 22,711 | 1.66 | 1.83 | 3.29 | 52 | |||||||||
| 11.00 | 3.62 | 5,261 | 1.74 | 1.85 | 3.38 | 45 | |||||||||
| 10.99 | 2.46 | 4,230 | 1.79 | 1.84 | 2.81 | 50 | |||||||||
| 11.08 | 0.21 | 5,715 | 1.99 | 1.99 | 1.75 | 93 | |||||||||
| 11.64 | 9.40 | 28,004 | 0.65 | 0.72 | 3.42 | 77 | |||||||||
| 11.01 | 4.55 | 6,577 | 0.67 | 0.72 | 4.28 | 52 | |||||||||
| 11.03 | 4.79 | 4,201 | 0.71 | 0.75 | 4.43 | 45 | |||||||||
| 11.03 | 3.43 | 2,461 | 0.74 | 0.74 | 3.89 | 50 | |||||||||
| 11.13 | 1.24 | 2,533 | 1.02 | 1.59 | (f) | 2.77 | 93 | ||||||||
| (d) | Computed on an annualized basis for periods less than one year, if applicable. |
| (e) | The investment adviser and/or administrator agreed to reimburse a portion of the Fund’s expenses and/or reduce its fee during the period. Without this reimbursement/fee reduction, if applicable, expenses would have been higher. |
| (f) | Represents the total expenses prior to reduction of a portion of the class’s transfer agent expenses. |
66
Table of Contents
FINANCIAL HIGHLIGHTS (continued)
For a share outstanding throughout each period.
| Income (Loss) from Investment Operations: | Less Distributions: | |||||||||||||||||||||||||
| Net asset value, beginning of the period |
Net investment income (a) |
Net realized and unrealized gain (loss) |
Total from investment operations |
Dividends from net investment income |
Distributions from net realized capital gains |
Total distributions |
||||||||||||||||||||
| STRATEGIC INCOME FUND |
||||||||||||||||||||||||||
| Class A |
||||||||||||||||||||||||||
| 9/30/2009 |
$ | 12.10 | $ | 0.87 | $ | 1.36 | $ | 2.23 | $ | (0.86 | ) | $ | (0.08 | ) | $ | (0.94 | ) | |||||||||
| 9/30/2008 |
15.18 | 0.96 | (3.02 | ) | (2.06 | ) | (1.01 | ) | (0.01 | ) | (1.02 | ) | ||||||||||||||
| 9/30/2007 |
14.60 | 0.80 | 0.60 | 1.40 | (0.82 | ) | — | (0.82 | ) | |||||||||||||||||
| 9/30/2006 |
14.17 | 0.71 | 0.53 | 1.24 | (0.81 | ) | — | (0.81 | ) | |||||||||||||||||
| 9/30/2005 |
13.57 | 0.66 | 0.70 | 1.36 | (0.76 | ) | — | (0.76 | ) | |||||||||||||||||
| Class B |
||||||||||||||||||||||||||
| 9/30/2009 |
12.16 | 0.79 | 1.36 | 2.15 | (0.77 | ) | (0.08 | ) | (0.85 | ) | ||||||||||||||||
| 9/30/2008 |
15.25 | 0.85 | (3.04 | ) | (2.19 | ) | (0.89 | ) | (0.01 | ) | (0.90 | ) | ||||||||||||||
| 9/30/2007 |
14.66 | 0.69 | 0.60 | 1.29 | (0.70 | ) | — | (0.70 | ) | |||||||||||||||||
| 9/30/2006 |
14.22 | 0.61 | 0.52 | 1.13 | (0.69 | ) | — | (0.69 | ) | |||||||||||||||||
| 9/30/2005 |
13.60 | 0.56 | 0.71 | 1.27 | (0.65 | ) | — | (0.65 | ) | |||||||||||||||||
| Class C |
||||||||||||||||||||||||||
| 9/30/2009 |
12.15 | 0.79 | 1.37 | 2.16 | (0.78 | ) | (0.08 | ) | (0.86 | ) | ||||||||||||||||
| 9/30/2008 |
15.24 | 0.85 | (3.03 | ) | (2.18 | ) | (0.90 | ) | (0.01 | ) | (0.91 | ) | ||||||||||||||
| 9/30/2007 |
14.65 | 0.69 | 0.60 | 1.29 | (0.70 | ) | — | (0.70 | ) | |||||||||||||||||
| 9/30/2006 |
14.22 | 0.61 | 0.51 | 1.12 | (0.69 | ) | — | (0.69 | ) | |||||||||||||||||
| 9/30/2005 |
13.60 | 0.55 | 0.72 | 1.27 | (0.65 | ) | — | (0.65 | ) | |||||||||||||||||
| Class Y |
||||||||||||||||||||||||||
| 9/30/2009 |
12.09 | 0.90 | 1.36 | 2.26 | (0.89 | ) | (0.08 | ) | (0.97 | ) | ||||||||||||||||
| 9/30/2008 |
15.17 | 1.00 | (3.03 | ) | (2.03 | ) | (1.04 | ) | (0.01 | ) | (1.05 | ) | ||||||||||||||
| 9/30/2007 |
14.59 | 0.85 | 0.59 | 1.44 | (0.86 | ) | — | (0.86 | ) | |||||||||||||||||
| 9/30/2006 |
14.17 | 0.76 | 0.51 | 1.27 | (0.85 | ) | — | (0.85 | ) | |||||||||||||||||
| 9/30/2005 |
13.57 | 0.70 | 0.70 | 1.40 | (0.80 | ) | — | (0.80 | ) | |||||||||||||||||
| (a) | Per share net investment income has been calculated using the average shares outstanding during the period. |
| (b) | Amount rounds to less than $0.01 per share, if applicable. |
| (c) | Effective June 2, 2008, redemption fees were eliminated. |
| (d) | A sales charge for Class A shares and a contingent deferred sales charge for Class B and Class C shares are not reflected in total return calculations. Periods less than one year, if applicable, are not annualized. |
See accompanying notes to financial statements.
67
Table of Contents
| Ratios to Average Net Assets: | ||||||||||||||||||
| Redemption fees (b)(c) |
Net asset value, end of the period |
Total return (%) (d)(e) |
Net assets, end of the period (000’s) |
Net expenses (%) (f)(g) |
Gross expenses (%) (f) |
Net investment income (%) (f) |
Portfolio turnover rate (%) | |||||||||||
| $ | — | $ | 13.39 | 20.56 | $ | 5,544,029 | 0.99 | 0.99 | 7.74 | 39 | ||||||||
| 0.00 | 12.10 | (14.54 | ) | 5,551,066 | 0.97 | 0.98 | 6.59 | 24 | ||||||||||
| 0.00 | 15.18 | 9.90 | 5,749,315 | 1.00 | 1.00 | 5.39 | 22 | |||||||||||
| 0.00 | 14.60 | 9.04 | 2,782,887 | 1.05 | 1.05 | 5.01 | 21 | |||||||||||
| 0.00 | 14.17 | 10.20 | 977,198 | 1.18 | 1.18 | 4.71 | 14 | |||||||||||
| — | 13.46 | 19.62 | 148,887 | 1.74 | 1.74 | 7.02 | 39 | |||||||||||
| 0.00 | 12.16 | (15.19 | ) | 161,751 | 1.72 | 1.73 | 5.78 | 24 | ||||||||||
| 0.00 | 15.25 | 9.08 | 233,418 | 1.76 | 1.76 | 4.61 | 22 | |||||||||||
| 0.00 | 14.66 | 8.22 | 179,927 | 1.79 | 1.79 | 4.26 | 21 | |||||||||||
| 0.00 | 14.22 | 9.46 | 144,081 | 1.93 | 1.93 | 3.98 | 14 | |||||||||||
| — | 13.45 | 19.66 | 4,894,546 | 1.74 | 1.74 | 6.95 | 39 | |||||||||||
| 0.00 | 12.15 | (15.19 | ) | 3,984,204 | 1.72 | 1.73 | 5.85 | 24 | ||||||||||
| 0.00 | 15.24 | 9.08 | 3,843,823 | 1.75 | 1.75 | 4.63 | 22 | |||||||||||
| 0.00 | 14.65 | 8.14 | 1,812,278 | 1.79 | 1.79 | 4.24 | 21 | |||||||||||
| 0.00 | 14.22 | 9.45 | 765,200 | 1.93 | 1.93 | 3.93 | 14 | |||||||||||
| — | 13.38 | 20.91 | 2,057,888 | 0.72 | 0.72 | 7.76 | 39 | |||||||||||
| 0.00 | 12.09 | (14.34 | ) | 783,058 | 0.72 | 0.72 | 6.88 | 24 | ||||||||||
| 0.00 | 15.17 | 10.22 | 638,868 | 0.74 | 0.74 | 5.67 | 22 | |||||||||||
| 0.00 | 14.59 | 9.28 | 271,065 | 0.78 | 0.78 | 5.30 | 21 | |||||||||||
| 0.00 | 14.17 | 10.51 | 50,369 | 0.91 | 0.91 | 4.98 | 14 | |||||||||||
| (e) | Had certain expenses not been reduced during the period, if applicable, total returns would have been lower. |
| (f) | Computed on an annualized basis for periods less than one year, if applicable. |
| (g) | The investment adviser and/or administrator agreed to reimburse a portion of the Fund’s expenses and/or reduce its fee during the period. Without this reimbursement/fee reduction, if applicable, expenses would have been higher. |
68
Table of Contents
NOTES TO FINANCIAL STATEMENTS
September 30, 2009
1. Organization. Natixis Funds Trust I and Loomis Sayles Funds II (the “Trusts” and each a “Trust”) are each organized as a Massachusetts business trust. Each Trust is registered under the Investment Company Act of 1940, as amended (“1940 Act”), as an open-end management investment company. Each Declaration of Trust permits the Board of Trustees to authorize the issuance of an unlimited number of shares of the Trust in multiple series. The financial statements for certain funds of the Trust are presented in separate reports. The following funds (individually, a “Fund” and collectively, the “Funds”) are included in this report:
Natixis Funds Trust I:
Loomis Sayles Core Plus Bond Fund (the “Core Plus Bond Fund”)
Loomis Sayles Funds II:
Loomis Sayles High Income Fund (the “High Income Fund”)
Loomis Sayles International Bond Fund (the “International Bond Fund”)
Loomis Sayles Limited Term Government and Agency Fund (the “Limited Term Government and Agency Fund”)
Loomis Sayles Strategic Income Fund (the “Strategic Income Fund”)
The Funds each offer Class A, Class C and Class Y shares. Effective October 12, 2007, Class B shares are no longer offered. Existing Class B shareholders may continue to reinvest dividends into Class B shares and exchange their Class B shares for Class B shares of other Natixis Funds subject to existing exchange privileges as described in the Prospectus.
Class A shares of all Funds except Limited Term Government and Agency Fund are sold with a maximum front-end sales charge of 4.50%. Class A shares of Limited Term Government and Agency Fund are sold with a maximum front-end sales charge of 3.00%. Class B shares do not pay a front-end sales charge, but pay higher Rule 12b-1 fees than Class A shares for eight years (at which point they automatically convert to Class A shares), and are subject to a contingent deferred sales charge (“CDSC”) if those shares are redeemed within six years of purchase. Class C shares do not pay a front-end sales charge, do not convert to any other Class of shares and pay higher Rule 12b-1 fees than Class A shares and may be subject to a CDSC of 1.00% if those shares are redeemed within one year of acquisition except for reinvested distributions. Class Y shares do not pay a front-end sales charge, a CDSC or Rule 12b-1 fees. Class Y shares are generally intended for institutional investors with a minimum initial investment of $100,000, though some categories of investors are excepted from the minimum investment amount as outlined in the Fund’s Prospectus.
Most expenses of the Trusts can be directly attributed to a Fund. Expenses which cannot be directly attributed to a Fund are generally apportioned based on the relative net assets of each of the Funds in the Trusts. Expenses of a Fund are borne pro rata by the holders of each class of shares, except that each class bears expenses unique to that class (including the Rule 12b-1 service and distribution fees and transfer agent fees applicable to such class). In addition, each class votes as a class only with respect to its own Rule 12b-1 Plan. Shares of each class would receive their pro rata share of the net assets of a Fund if the Fund were liquidated. The Trustees approve separate dividends from net investment income on each class of shares.
2. Significant Accounting Policies. The following is a summary of significant accounting policies consistently followed by each Fund in the preparation of its financial statements. The Funds’ financial statements are prepared in accordance with accounting principles generally accepted in the United States of America which require the use of management estimates that affect the reported amounts and disclosures in the financial statements. Actual results could differ from those estimates. Management has evaluated the events and transactions that have occurred through November 23, 2009, the date the financial statements were issued, and noted no items requiring recognition in the financial statements or additional disclosure in the Notes to Financial Statements.
a. Valuation. Debt securities (other than short-term obligations purchased with an original or remaining maturity of sixty days or less) are generally valued on the basis of evaluated bids furnished to the Funds by a pricing service recommended by the investment adviser and approved by the Board of Trustees, which service determines valuations for normal, institutional-size trading units of such securities using market information, transactions for comparable securities and various relationships between securities which are generally recognized by institutional traders. Equity securities, including closed-end investment companies and exchange-traded funds, for which market quotations are readily available are valued at market value, as reported by pricing services recommended by the investment adviser and approved by the Board of Trustees. Such pricing services generally use the security’s last sale price on the exchange or market where the security is primarily traded or, if there is no reported sale during the day, the closing bid price. Securities traded on the NASDAQ Global Select Market, NASDAQ Global Market and NASDAQ Capital Market are valued at the NASDAQ Official Closing Price (“NOCP”), or if lacking a NOCP, at the most recent bid quotation on the applicable NASDAQ market. Broker-dealer bid quotations may also be used to value debt and equity securities where a pricing service does not price a security or where a pricing service does not provide a reliable price for the security. In instances where broker-dealer bid quotations are not available, certain securities held by the Funds may be valued on the basis of a price provided by a principal market maker. Forward foreign currency contracts are valued using interpolated prices determined from information provided by an independent pricing service. Short-term obligations purchased with an original or remaining maturity of sixty days or less are valued at amortized cost, which approximates market value. Securities for which market quotations are not readily available are valued at fair value as determined in good faith by the Funds’ investment adviser using consistently applied procedures under the general supervision of the Board of Trustees. Investments in other open-end investment companies are valued at their net asset value each day.
Certain Funds may hold securities traded in foreign markets. Foreign securities are valued at the market price in the foreign market. However, if events occurring after the close of the foreign market (but before the close of regular trading on the New York Stock Exchange) are believed to materially affect the value of those securities, such securities
69
Table of Contents
NOTES TO FINANCIAL STATEMENTS (continued)
September 30, 2009
are fair valued pursuant to procedures approved by the Board of Trustees. When fair valuing securities, the Funds may, among other things, use modeling tools or other processes that may take into account factors such as securities market activity and/or significant events that occur after the close of the foreign market and before the Funds calculate their net asset values.
b. Security Transactions and Related Investment Income. Security transactions are accounted for on trade date. Dividend income is recorded on ex-dividend date, or in the case of certain foreign securities, as soon as a Fund is notified, and interest income is recorded on an accrual basis. Interest income is increased by the accretion of discount and decreased by the amortization of premium. Periodic principal adjustments for inflation-protected securities are recorded to interest income. Negative principal adjustments (in the event of deflation) are recorded as reductions of interest income to the extent of interest income earned. The amount by which negative principal adjustments exceed interest income earned or positive principal adjustments on a cumulative basis is recorded as an increase to the cost basis of the security. Distributions received from investments in securities that represent a return of capital or capital gain are recorded as a reduction of cost of investments or as a realized gain, respectively. The calendar year-end amounts of ordinary income, capital gains, and return of capital included in distributions received from the Funds’ investments in real estate investment trusts (“REITs”) are reported to the Funds after the end of the fiscal year; accordingly, the Funds estimate these amounts for accounting purposes until the characterization of REIT distributions is reported to the Funds after the end of the fiscal year. Estimates are based on the most recent REIT distribution information available. Investment income is recorded net of foreign taxes withheld when applicable. In determining net gain or loss on securities sold, the cost of securities has been determined on an identified cost basis. Investment income, non-class specific expenses and realized and unrealized gains and losses are allocated on a pro rata basis to each class based on the relative net assets of each class to the total net assets of the Fund.
c. Foreign Currency Translation. The books and records of the Funds are maintained in U.S. dollars. The value of securities, currencies and other assets and liabilities denominated in currencies other than U.S. dollars are translated into U.S. dollars based upon foreign exchange rates prevailing at the end of the period. Purchases and sales of investment securities, income and expenses are translated on the respective dates of such transactions.
Since the values of investment securities are presented at the foreign exchange rates prevailing at the end of the period, it is not practical to isolate that portion of the results of operations arising from changes in exchange rates from fluctuations which arise due to changes in market prices of investment securities. Such changes are included with the net realized and unrealized gain or loss on investments.
Net realized foreign exchange gains or losses arise from sales of foreign currency, currency gains or losses realized between the trade and settlement dates on securities transactions, and the difference between the amounts of dividends, interest and foreign withholding taxes recorded on the Funds’ books and the U.S. dollar equivalent of the amounts actually received or paid. Net unrealized foreign exchange gains and losses arise from changes in the value of assets and liabilities, other than investment securities, at the end of the fiscal period, resulting from changes in exchange rates.
Each Fund may use foreign currency exchange contracts to facilitate transactions in foreign-denominated investments. Losses may arise from changes in the value of the foreign currency or if the counterparties do not perform under the contracts’ terms.
d. Forward Foreign Currency Contracts. Each Fund may enter into forward foreign currency contracts. Contracts to buy generally are used to acquire exposure to foreign currencies, while contracts to sell generally are used to hedge a Fund’s investments against currency fluctuation. Also, a contract to buy or sell can offset a previous contract. These contracts involve market risk in excess of the unrealized gain or loss reflected in the Funds’ Statements of Assets and Liabilities. The U.S. dollar value of the currencies a Fund has committed to buy or sell represents the aggregate exposure to each currency the Fund has acquired or hedged through currency contracts outstanding at period end. Gains or losses are recorded for financial statement purposes as unrealized until settlement date. Risks may arise upon entering into these contracts from the potential inability of counterparties to meet the terms of their contracts and from unanticipated movements in the value of a foreign currency relative to the U.S. dollar.
e. Federal and Foreign Income Taxes. Each Trust treats each Fund as a separate entity for federal income tax purposes. Each Fund intends to meet the requirements of the Internal Revenue Code applicable to regulated investment companies, and to distribute to its shareholders substantially all of its net investment income and any net realized capital gains at least annually. Management has performed an analysis of each Fund’s tax positions for the open tax years as of September 30, 2009 and has concluded that no provisions for income tax are required. The Funds’ federal tax returns for the prior three fiscal years, where applicable, remain subject to examination by the Internal Revenue Service. Management is not aware of any events that are reasonably possible to occur in the next twelve months that would result in the amounts of any unrecognized tax benefits significantly increasing or decreasing for the Funds. However, management’s conclusions regarding tax positions taken may be subject to review and adjustment at a later date based on factors including, but not limited to, new tax laws and accounting regulations and interpretations thereof.
A Fund may be subject to foreign taxes on income and gains on investments that are accrued based upon the Fund’s understanding of the tax rules and regulations that exist in the countries in which the Fund invests. Foreign governments may also impose taxes or other payments on investments with respect to foreign securities. Such taxes are accrued as applicable, and are reflected as foreign taxes payable on the Statements of Assets and Liabilities.
f. Dividends and Distributions to Shareholders. Dividends and distributions are recorded on ex-dividend date. The timing and characterization of certain income and capital gain distributions are determined annually in accordance with federal tax regulations, which may differ from accounting principles generally accepted in the United
70
Table of Contents
NOTES TO FINANCIAL STATEMENTS (continued)
September 30, 2009
States of America. Permanent differences are primarily due to differing treatments for book and tax purposes for items such as foreign currency transactions, treasury inflation protected bond adjustments, premium amortization, defaulted bond adjustments, paydown gains and losses, distribution redesignations, expired capital loss carryforwards and return of capital and capital gains distributions from REITS. Permanent book and tax basis differences relating to shareholder distributions will result in reclassifications to capital accounts. Temporary differences between book and tax distributable earnings are primarily due to deferred Trustees’ fees, wash sales, premium amortization accruals, forward contracts mark to market, dividends payable, securities lending collateral gain/loss adjustment, REIT basis adjustments, discount accretion on inflation-protected securities and defaulted bond interest. Distributions from net investment income and short-term capital gains are considered to be distributed from ordinary income for tax purposes.
The tax characterization of distributions is determined on an annual basis. The tax character of distributions paid to shareholders during the years ended September 30, 2009 and 2008 was as follows:
| 2009 Distributions Paid From: | 2008 Distributions Paid From: | |||||||||||||||||
| Fund |
Ordinary Income |
Long-Term Capital Gains |
Total |
Ordinary Income |
Long-Term Capital Gains |
Total | ||||||||||||
| Core Plus Bond Fund |
$ | 12,015,697 | $ | — | $ | 12,015,697 | $ | 8,747,730 | $ | — | $ | 8,747,730 | ||||||
| High Income Fund |
7,740,530 | — | 7,740,530 | 3,284,465 | — | 3,284,465 | ||||||||||||
| International Bond Fund |
334,030 | — | 334,030 | 243,435 | — | 243,435 | ||||||||||||
| Limited Term Government and Agency Fund |
5,789,887 | — | 5,789,887 | 5,186,113 | — | 5,186,113 | ||||||||||||
| Strategic Income Fund |
725,851,869 | 52,952,003 | 778,803,872 | 794,838,869 | 9,533,629 | 804,372,498 | ||||||||||||
Differences between these amounts and those reported in the Statements of Changes in Net Assets, if any, are primarily attributable to different book and tax treatment for short-term capital gains.
As of September 30, 2009, the components of distributable earnings on a tax basis were as follows:
| Core Plus Bond Fund |
High Income Fund |
International Bond Fund |
Limited Term Government and Agency Fund |
Strategic Income Fund |
||||||||||||||||
| Undistributed ordinary income |
$ | 1,375,074 | $ | 143,101 | $ | 416,092 | $ | 428,081 | $ | 3,010,647 | ||||||||||
| Undistributed long-term capital gains |
— | — | — | — | — | |||||||||||||||
| Total undistributed earnings |
1,375,074 | 143,101 | 416,092 | 428,081 | 3,010,647 | |||||||||||||||
| Capital loss carryforward: |
||||||||||||||||||||
| Expires September 30, 2010 |
(19,393,733 | ) | (26,826,634 | ) | — | — | — | |||||||||||||
| Expires September 30, 2014 |
(181,728 | ) | — | — | (1,425,832 | ) | — | |||||||||||||
| Expires September 30, 2015 |
— | — | — | (4,336,746 | ) | — | ||||||||||||||
| Expires September 30, 2016 |
— | — | — | (100,316 | ) | — | ||||||||||||||
| Expires September 30, 2017 |
— | (33,112 | ) | — | — | (45,672,245 | ) | |||||||||||||
| Total capital loss carryforward |
(19,575,461 | ) | (26,859,746 | ) | — | (5,862,894 | ) | (45,672,245 | ) | |||||||||||
| Deferred net capital losses (post-October 2008) |
(129,243 | ) | (2,276,152 | ) | (45,041 | ) | (83,587 | ) | (552,853,501 | ) | ||||||||||
| Unrealized appreciation (depreciation) |
11,404,526 | 14,099,463 | 1,297,602 | 6,920,139 | (366,940,694 | ) | ||||||||||||||
| Total accumulated earnings (losses) |
(6,925,104 | ) | (14,893,334 | ) | 1,668,653 | 1,401,739 | (962,455,793 | ) | ||||||||||||
| Capital loss carryforward utilized in the current year |
$ | 123,810 | $ | — | $ | — | $ | 2,626,828 | $ | — | ||||||||||
The High Income Fund had carry forward losses expire in the current year in the amount of $43,374,722.
The Limited Term Government and Agency Fund had carry forward losses expire in the current year in the amount of $4,128,091.
g. Repurchase Agreements. It is each Fund’s policy that the market value of the collateral for repurchase agreements be at least equal to 100% of the repurchase price, including interest. Certain repurchase agreements are tri-party arrangements whereby the collateral is held in a segregated account for the benefit of the Fund and on behalf of the counterparty. It is each Fund’s policy, regarding tri-party arrangements, that the market value of the collateral be at least equal to 102% of the repurchase price, including interest. Repurchase agreements could involve certain risks in the event of default or insolvency of the counterparty including possible delays or restrictions upon a Fund’s ability to dispose of the underlying securities.
71
Table of Contents
NOTES TO FINANCIAL STATEMENTS (continued)
September 30, 2009
h. Securities Lending. The Funds have entered into an agreement with State Street Bank and Trust Company (“State Street Bank”), as agent of the Funds, to lend securities to certain designated borrowers. The loans are collateralized with cash or securities in an amount equal to at least 105% or 102% of the market value (including accrued interest) of the loaned international or domestic securities, respectively, when the loan is initiated. Thereafter, the value of the collateral must remain at least 102% of the market value (including accrued interest) of loaned securities for U.S. equities and U.S. corporate debt; at least 105% of the market value (including accrued interest) of loaned securities for non-U.S. equities; and at least 100% of the market value (including accrued interest) of loaned securities for U.S. government securities, sovereign debt issued by non-U.S. governments and non-U.S. corporate debt. In the event that the market value of the collateral falls below the required percentages described above, the borrower will deliver additional collateral on the next business day. As with other extensions of credit, the Funds bear the risk of loss with respect to the investment of the collateral. The Funds invest cash collateral in short-term investments, a portion of the income from which is remitted to the borrowers and the remainder allocated between the Funds and State Street Bank as lending agent.
As of September 30, 2009, there were no securities on loan.
i. Delayed Delivery Commitments. Purchases of when-issued or delayed delivery instruments (identified in the Portfolio of Investments as TBA investments) may have a similar effect on a Fund’s net asset value as if the Fund had created a degree of leverage in its portfolio. The price of the underlying instruments and the date when they will be paid for are fixed at the time the transaction is negotiated. If a Fund enters into such a transaction, collateral consisting of liquid securities or cash and cash equivalents will be maintained in an amount at least equal to the commitment with the custodian and/ or broker. Losses may arise due to changes in the market value of the underlying instruments or if the counterparty does not perform under the contract.
j. Indemnifications. Under the Trusts’ organizational documents, their officers and Trustees are indemnified against certain liabilities arising out of the performance of their duties to the Funds. Additionally, in the normal course of business, the Funds enter into contracts with service providers that contain general indemnification clauses. The Funds’ maximum exposure under these arrangements is unknown as this would involve future claims that may be made against the Funds that have not yet occurred. However, based on experience, the Funds expect the risk of loss to be remote.
3. Fair Value Measurements. Effective October 1, 2008, the Funds adopted accounting standards related to fair value measurements and disclosures which establish a hierarchy for which various inputs are used in determining the value of each Fund’s assets or liabilities. These inputs are summarized in the three broad levels listed below:
| • | Level 1 – quoted prices in active markets for identical assets or liabilities; |
| • | Level 2 – prices determined using other significant inputs that are observable either directly, or indirectly through corroboration with observable market data (which could include quoted prices for similar assets or liabilities, interest rates, credit risk, etc.); |
| • | Level 3 – prices determined using significant unobservable inputs for situations where quoted prices or observable inputs are unavailable such as when there is little or no market activity for an asset or liability (unobservable inputs reflect each Fund’s own assumptions in determining the fair value of assets or liabilities and would be based on the best information available). |
The inputs or methodology used for valuing securities are not necessarily an indication of the risk associated with investing in those securities.
The following is a summary of the inputs used to value the Funds’ investments as of September 30, 2009, at value:
Core Plus Bond Fund
Asset Valuation Inputs
| Description |
Level 1 |
Level 2 |
Level 3 |
Total | ||||||||
| Bonds and Notes (a) |
$ | — | $ | 249,607,477 | $ | — | $ | 249,607,477 | ||||
| Preferred Stocks |
||||||||||||
| Diversified Financial Services |
— | 309,375 | — | 309,375 | ||||||||
| Thrifts & Mortgage Finance |
401,920 | 6,762 | — | 408,682 | ||||||||
| Total Preferred Stocks |
401,920 | 316,137 | — | 718,057 | ||||||||
| Short-Term Investments |
11,737,039 | — | — | 11,737,039 | ||||||||
| Total |
$ | 12,138,959 | $ | 249,923,614 | $ | — | $ | 262,062,573 | ||||
(a) Major categories of the Fund’s investments are included in the Portfolio of Investments.
72
Table of Contents
NOTES TO FINANCIAL STATEMENTS (continued)
September 30, 2009
High Income Fund
Asset Valuation Inputs
| Description |
Level 1 |
Level 2 |
Level 3 |
Total | ||||||||
| Bonds and Notes |
||||||||||||
| ABS Car Loan |
$ | — | $ | 181,185 | $ | — | $ | 181,185 | ||||
| ABS Credit Card |
— | 96,345 | — | 96,345 | ||||||||
| ABS Home Equity |
— | 2,430,426 | — | 2,430,426 | ||||||||
| Aerospace & Defense |
— | 4,739,000 | — | 4,739,000 | ||||||||
| Airlines |
— | 487,208 | — | 487,208 | ||||||||
| Automotive |
— | 4,687,489 | — | 4,687,489 | ||||||||
| Banking |
— | 501,343 | — | 501,343 | ||||||||
| Building Materials |
— | 1,639,822 | — | 1,639,822 | ||||||||
| Chemicals |
— | 475,594 | — | 475,594 | ||||||||
| Collateralized Mortgage Obligations |
— | 1,205,691 | — | 1,205,691 | ||||||||
| Commercial Mortgage-Backed Securities |
— | 5,350,282 | 389,767 | 5,740,049 | ||||||||
| Construction Machinery |
— | 2,658,096 | — | 2,658,096 | ||||||||
| Consumer Products |
— | 215,800 | — | 215,800 | ||||||||
| Diversified Manufacturing |
— | 110,625 | — | 110,625 | ||||||||
| Electric |
— | 8,130,035 | — | 8,130,035 | ||||||||
| Food & Beverage |
— | 2,742,244 | — | 2,742,244 | ||||||||
| Government Guaranteed |
— | 267,127 | — | 267,127 | ||||||||
| Government Owned - No Guarantee |
— | 173,888 | — | 173,888 | ||||||||
| Healthcare |
— | 11,769,047 | — | 11,769,047 | ||||||||
| Home Construction |
— | 7,143,381 | — | 7,143,381 | ||||||||
| Independent Energy |
— | 12,477,826 | — | 12,477,826 | ||||||||
| Industrial Other |
— | 350,875 | — | 350,875 | ||||||||
| Lodging |
— | 7,630,275 | — | 7,630,275 | ||||||||
| Media Cable |
— | 3,882,635 | — | 3,882,635 | ||||||||
| Media Non-Cable |
— | 2,154,113 | — | 2,154,113 | ||||||||
| Metals & Mining |
— | 3,289,709 | — | 3,289,709 | ||||||||
| Non-Captive Consumer |
— | 3,564,200 | 497,545 | 4,061,745 | ||||||||
| Non-Captive Diversified |
— | 3,859,765 | 478,858 | 4,338,623 | ||||||||
| Oil Field Services |
— | 2,371,735 | — | 2,371,735 | ||||||||
| Packaging |
— | 175,438 | — | 175,438 | ||||||||
| Paper |
— | 5,299,271 | — | 5,299,271 | ||||||||
| Pharmaceuticals |
— | 9,235,508 | — | 9,235,508 | ||||||||
| Pipelines |
— | 3,123,088 | — | 3,123,088 | ||||||||
| Refining |
— | 818,388 | — | 818,388 | ||||||||
| REITs |
— | 524,688 | — | 524,688 | ||||||||
| Retailers |
— | 4,621,306 | — | 4,621,306 | ||||||||
| Sovereigns |
— | 3,588,256 | — | 3,588,256 | ||||||||
| Supermarkets |
— | 1,768,563 | — | 1,768,563 | ||||||||
| Supranational |
— | 87,375 | 678,290 | 765,665 | ||||||||
| Technology |
— | 14,224,306 | 1,096,560 | 15,320,866 | ||||||||
| Textile |
— | 277,500 | — | 277,500 | ||||||||
| Transportation Services |
— | 760,813 | — | 760,813 | ||||||||
| Treasuries |
— | 3,440,277 | — | 3,440,277 | ||||||||
| Wireless |
— | 6,916,375 | — | 6,916,375 | ||||||||
| Wirelines |
— | 11,878,542 | 1,834,025 | 13,712,567 | ||||||||
| Total Bonds and Notes |
— | 161,325,455 | 4,975,045 | 166,300,500 | ||||||||
| Bank Loans (a) |
— | 2,706,147 | — | 2,706,147 | ||||||||
73
Table of Contents
NOTES TO FINANCIAL STATEMENTS (continued)
September 30, 2009
High Income Fund
Asset Valuation Inputs (continued)
| Description |
Level 1 |
Level 2 |
Level 3 |
Total | ||||||||
| Preferred Stocks |
$ | — | $ | 2,246,241 | $ | — | $ | 2,246,241 | ||||
| Non-Convertible Preferred Stocks |
||||||||||||
| Diversified Financial Services |
— | 159,340 | — | 159,340 | ||||||||
| Thrifts & Mortgage Finance |
32,723 | 38,681 | — | 71,404 | ||||||||
| Total Non-Convertible Preferred Stocks |
32,723 | 198,021 | — | 230,744 | ||||||||
| Total Preferred Stocks |
32,723 | 2,444,262 | — | 2,476,985 | ||||||||
| Common Stocks (a) |
613,193 | — | — | 613,193 | ||||||||
| Closed-End Investment Companies |
49,360 | — | — | 49,360 | ||||||||
| Short-Term Investments |
12,669,362 | — | — | 12,669,362 | ||||||||
| Total Investments |
13,364,638 | 166,475,864 | 4,975,045 | 184,815,547 | ||||||||
| Forward Foreign Currency Contracts (unrealized appreciation) |
— | 4,791 | — | 4,791 | ||||||||
| Total |
$ | 13,364,638 | $ | 166,480,655 | $ | 4,975,045 | $ | 184,820,338 | ||||
(a) Major categories of the Fund’s investments are included in the Portfolio of Investments.
Liability Valuation Inputs
| Description |
Level 1 |
Level 2 |
Level 3 |
Total |
||||||||||
| Forward Foreign Currency Contracts (unrealized depreciation) |
$ | — | $ | (17,552 | ) | $ | — | $ | (17,552 | ) | ||||
International Bond Fund
Asset Valuation Inputs
| Description |
Level 1 |
Level 2 |
Level 3 |
Total | ||||||||
| Bonds and Notes |
||||||||||||
| Non-Convertible Bonds |
||||||||||||
| Australia |
$ | — | $ | 301,423 | $ | — | $ | 301,423 | ||||
| Austria |
— | 190,037 | — | 190,037 | ||||||||
| Belgium |
— | 1,862,998 | — | 1,862,998 | ||||||||
| Brazil |
— | 104,961 | — | 104,961 | ||||||||
| Canada |
— | 1,066,847 | — | 1,066,847 | ||||||||
| Cayman Islands |
— | 286,947 | — | 286,947 | ||||||||
| France |
— | 790,285 | — | 790,285 | ||||||||
| Germany |
— | 5,372,031 | — | 5,372,031 | ||||||||
| India |
— | 174,074 | — | 174,074 | ||||||||
| Ireland |
— | 270,956 | 98,563 | 369,519 | ||||||||
| Italy |
— | 207,457 | — | 207,457 | ||||||||
| Japan |
— | 2,052,028 | — | 2,052,028 | ||||||||
| Jersey |
— | 76,530 | — | 76,530 | ||||||||
| Luxembourg |
— | 121,023 | — | 121,023 | ||||||||
| Mexico |
— | 286,636 | — | 286,636 | ||||||||
| Netherlands |
— | 868,794 | — | 868,794 | ||||||||
| Norway |
— | 815,874 | — | 815,874 | ||||||||
| Singapore |
— | 196,434 | — | 196,434 | ||||||||
| South Africa |
— | 104,629 | — | 104,629 | ||||||||
74
Table of Contents
NOTES TO FINANCIAL STATEMENTS (continued)
September 30, 2009
International Bond Fund
Asset Valuation Inputs (continued)
| Description |
Level 1 |
Level 2 |
Level 3 |
Total | ||||||||
| Bonds and Notes (continued) |
||||||||||||
| Non-Convertible Bonds (continued) |
||||||||||||
| Spain |
$ | — | $ | 146,016 | $ | — | $ | 146,016 | ||||
| Supranational |
— | 1,134,977 | 67,829 | 1,202,806 | ||||||||
| Sweden |
— | 542,881 | — | 542,881 | ||||||||
| United Arab Emirates |
— | 184,505 | — | 184,505 | ||||||||
| United Kingdom |
— | 1,385,386 | — | 1,385,386 | ||||||||
| United States |
— | 2,019,303 | — | 2,019,303 | ||||||||
| Total Non-Convertible Bonds |
— | 20,563,032 | 166,392 | 20,729,424 | ||||||||
| Convertible Bonds (a) |
— | 40,875 | — | 40,875 | ||||||||
| Total Bonds and Notes |
— | 20,603,907 | 166,392 | 20,770,299 | ||||||||
| Short-Term Investments |
1,782,795 | — | — | 1,782,795 | ||||||||
| Total Investments |
1,782,795 | 20,603,907 | 166,392 | 22,553,094 | ||||||||
| Forward Foreign Currency Contracts (unrealized appreciation) |
— | 65,206 | — | 65,206 | ||||||||
| Total |
$ | 1,782,795 | $ | 20,669,113 | $ | 166,392 | $ | 22,618,300 | ||||
(a) Major categories of the Fund’s investments are included in the Portfolio of Investments.
Limited Term Government and Agency Fund
Asset Valuation Inputs
| Description |
Level 1 |
Level 2 |
Level 3 |
Total | ||||||||
| Bonds and Notes |
||||||||||||
| ABS Car Loan |
$ | — | $ | 4,315,613 | $ | — | $ | 4,315,613 | ||||
| ABS Credit Card |
— | 6,866,462 | — | 6,866,462 | ||||||||
| ABS Home Equity |
— | 1,821,069 | 538,786 | 2,359,855 | ||||||||
| ABS Other |
— | 711,857 | — | 711,857 | ||||||||
| Collateralized Mortgage Obligations |
— | 899,926 | — | 899,926 | ||||||||
| Commercial Mortgage-Backed Securities |
— | 21,928,751 | — | 21,928,751 | ||||||||
| Government Guaranteed |
— | 7,012,005 | — | 7,012,005 | ||||||||
| Government Owned — No Guarantee |
— | 20,115,067 | — | 20,115,067 | ||||||||
| Government Sponsored |
— | 16,770,397 | — | 16,770,397 | ||||||||
| Hybrid ARMs |
— | 4,120,266 | — | 4,120,266 | ||||||||
| Mortgage Related |
— | 85,629,376 | — | 85,629,376 | ||||||||
| Treasuries |
— | 29,567,814 | — | 29,567,814 | ||||||||
| Total Bonds and Notes |
— | 199,758,603 | 538,786 | 200,297,389 | ||||||||
| Short-Term Investments |
998,373 | — | — | 998,373 | ||||||||
| Total |
$ | 998,373 | $ | 199,758,603 | $ | 538,786 | $ | 201,295,762 | ||||
75
Table of Contents
NOTES TO FINANCIAL STATEMENTS (continued)
September 30, 2009
Strategic Income Fund
Asset Valuation Inputs
| Description |
Level 1 |
Level 2 |
Level 3 |
Total | ||||||||
| Bonds and Notes |
||||||||||||
| Non-Convertible Bonds |
||||||||||||
| ABS Credit Card |
$ | — | $ | 83,481,495 | $ | — | $ | 83,481,495 | ||||
| Aerospace & Defense |
— | 13,886,090 | — | 13,886,090 | ||||||||
| Airlines |
— | 181,376,841 | 6,940,852 | 188,317,693 | ||||||||
| Automotive |
— | 351,728,209 | 2,526,146 | 354,254,355 | ||||||||
| Banking |
— | 839,818,564 | — | 839,818,564 | ||||||||
| Brokerage |
— | 4,233,472 | — | 4,233,472 | ||||||||
| Building Materials |
— | 124,666,576 | — | 124,666,576 | ||||||||
| Chemicals |
— | 74,451,079 | 23,203,580 | 97,654,659 | ||||||||
| Construction Machinery |
— | 110,515,164 | — | 110,515,164 | ||||||||
| Consumer Cyclical Services |
— | 102,376,826 | — | 102,376,826 | ||||||||
| Consumer Products |
— | 17,259,571 | — | 17,259,571 | ||||||||
| Distributors |
— | 1,712,055 | — | 1,712,055 | ||||||||
| Diversified Manufacturing |
— | 70,557,378 | 20,732,656 | 91,290,034 | ||||||||
| Electric |
— | 430,386,678 | 4,708,532 | 435,095,210 | ||||||||
| Entertainment |
— | 26,984,554 | — | 26,984,554 | ||||||||
| Financial Other |
— | 20,368,400 | — | 20,368,400 | ||||||||
| Food & Beverage |
— | 134,142,310 | — | 134,142,310 | ||||||||
| Government Owned - No Guarantee |
— | 38,958,381 | — | 38,958,381 | ||||||||
| Government Sponsored |
— | 49,644,479 | — | 49,644,479 | ||||||||
| Health Insurance |
— | 76,663,414 | — | 76,663,414 | ||||||||
| Healthcare |
— | 481,965,184 | — | 481,965,184 | ||||||||
| Home Construction |
— | 232,235,895 | — | 232,235,895 | ||||||||
| Independent Energy |
— | 161,022,174 | — | 161,022,174 | ||||||||
| Industrial Other |
— | 18,541,438 | — | 18,541,438 | ||||||||
| Life Insurance |
— | 26,197,543 | — | 26,197,543 | ||||||||
| Local Authorities |
— | 92,012,261 | — | 92,012,261 | ||||||||
| Media Cable |
— | 306,681,023 | — | 306,681,023 | ||||||||
| Media Non-Cable |
— | 71,306,454 | — | 71,306,454 | ||||||||
| Metals & Mining |
— | 103,771,461 | — | 103,771,461 | ||||||||
| Non-Captive Consumer |
— | 401,735,654 | 4,129,285 | 405,864,939 | ||||||||
| Non-Captive Diversified |
— | 836,657,070 | 4,017,538 | 840,674,608 | ||||||||
| Oil Field Services |
— | 307,512,148 | — | 307,512,148 | ||||||||
| Packaging |
— | 39,357,053 | — | 39,357,053 | ||||||||
| Packaging & Containers |
— | 5,080,699 | — | 5,080,699 | ||||||||
| Paper |
— | 308,471,186 | — | 308,471,186 | ||||||||
| Pharmaceuticals |
— | 93,382,625 | — | 93,382,625 | ||||||||
| Pipelines |
— | 288,998,722 | — | 288,998,722 | ||||||||
| Property & Casualty Insurance |
— | 44,849,379 | — | 44,849,379 | ||||||||
| Railroads |
— | 45,800,542 | — | 45,800,542 | ||||||||
| Refining |
— | 1,192,250 | — | 1,192,250 | ||||||||
| REITs |
— | 140,301,111 | — | 140,301,111 | ||||||||
| Restaurants |
— | 902,678 | — | 902,678 | ||||||||
| Retailers |
— | 329,250,378 | — | 329,250,378 | ||||||||
| Sovereigns |
— | 612,033,388 | — | 612,033,388 | ||||||||
| Supermarkets |
— | 97,345,868 | — | 97,345,868 | ||||||||
| Supranational |
— | 236,970,552 | 30,455,245 | 267,425,797 | ||||||||
| Technology |
— | 300,459,697 | 225,000 | 300,684,697 | ||||||||
76
Table of Contents
NOTES TO FINANCIAL STATEMENTS (continued)
September 30, 2009
Strategic Income Fund
Asset Valuation Inputs (continued)
| Description |
Level 1 |
Level 2 |
Level 3 |
Total | ||||||||
| Bonds and Notes (continued) |
||||||||||||
| Non-Convertible Bonds (continued) |
||||||||||||
| Tobacco |
$ | — | $ | 176,280,732 | $ | — | $ | 176,280,732 | ||||
| Transportation Services |
— | 54,210,782 | — | 54,210,782 | ||||||||
| Treasuries |
— | 1,114,695,982 | — | 1,114,695,982 | ||||||||
| Wireless |
— | 207,441,738 | — | 207,441,738 | ||||||||
| Wirelines |
— | 548,094,546 | — | 548,094,546 | ||||||||
| Total Non-Convertible Bonds |
— | 10,437,969,749 | 96,938,834 | 10,534,908,583 | ||||||||
| Convertible Bonds |
||||||||||||
| Airlines |
— | 2,957,500 | — | 2,957,500 | ||||||||
| Diversified Manufacturing |
— | 2,596,000 | — | 2,596,000 | ||||||||
| Electric |
— | 2,058,750 | — | 2,058,750 | ||||||||
| Healthcare |
— | 38,378,537 | — | 38,378,537 | ||||||||
| Independent Energy |
— | 3,459,850 | — | 3,459,850 | ||||||||
| Industrial Other |
— | 30,088,500 | — | 30,088,500 | ||||||||
| Lodging |
— | 27,946,537 | — | 27,946,537 | ||||||||
| Media Non-Cable |
— | 4,763,735 | — | 4,763,735 | ||||||||
| Metals & Mining |
— | 22,347,738 | — | 22,347,738 | ||||||||
| Non-Captive Diversified |
— | 22,017,500 | — | 22,017,500 | ||||||||
| Oil Field Services |
— | 1,764,088 | — | 1,764,088 | ||||||||
| Pharmaceuticals |
— | 106,806,666 | — | 106,806,666 | ||||||||
| REITs |
— | 10,858,309 | — | 10,858,309 | ||||||||
| Technology |
— | 285,488,365 | 3,394,300 | 288,882,665 | ||||||||
| Textile |
— | 84,460 | — | 84,460 | ||||||||
| Wireless |
— | 14,117,179 | — | 14,117,179 | ||||||||
| Wirelines |
— | 42,991,410 | 57,319,500 | 100,310,910 | ||||||||
| Total Convertible Bonds |
— | 618,725,124 | 60,713,800 | 679,438,924 | ||||||||
| Municipals (a) |
— | 63,887,694 | — | 63,887,694 | ||||||||
| Total Bonds and Notes |
— | 11,120,582,567 | 157,652,634 | 11,278,235,201 | ||||||||
| Bank Loans (a) |
— | 85,752,651 | — | 85,752,651 | ||||||||
| Common Stocks (a) |
356,599,555 | — | — | 356,599,555 | ||||||||
| Preferred Stocks |
||||||||||||
| Convertible Preferred Stocks |
||||||||||||
| Automotive |
43,925,773 | — | — | 43,925,773 | ||||||||
| Capital Markets |
— | 6,503,729 | — | 6,503,729 | ||||||||
| Commercial Banks |
5,298,169 | — | — | 5,298,169 | ||||||||
| Diversified Consumer Services |
3 | — | — | 3 | ||||||||
| Diversified Financial Services |
— | 19,016,245 | — | 19,016,245 | ||||||||
| Electric Utilities |
— | 16,769,174 | 3,770,375 | 20,539,549 | ||||||||
| Machinery |
— | 4,259,595 | — | 4,259,595 | ||||||||
| Oil, Gas & Consumable Fuels |
4,333,266 | 5,309,106 | — | 9,642,372 | ||||||||
| REITs |
— | — | 491,050 | 491,050 | ||||||||
| Semiconductors & Semiconductor Equipment |
— | 24,724,800 | — | 24,724,800 | ||||||||
| Total Convertible Preferred Stocks |
53,557,211 | 76,582,649 | 4,261,425 | 134,401,285 | ||||||||
77
Table of Contents
NOTES TO FINANCIAL STATEMENTS (continued)
September 30, 2009
Strategic Income Fund
Asset Valuation Inputs (continued)
| Description |
Level 1 |
Level 2 |
Level 3 |
Total | ||||||||
| Preferred Stocks (continued) |
||||||||||||
| Non-Convertible Preferred Stocks |
||||||||||||
| Diversified Financial Services |
$ | 1,266,122 | $ | 21,467,810 | $ | — | $ | 22,733,932 | ||||
| Electric Utilities |
— | 28,357 | — | 28,357 | ||||||||
| Thrifts & Mortgage Finance |
18,347,060 | 15,865,319 | — | 34,212,379 | ||||||||
| Total Non-Convertible Preferred Stocks |
19,613,182 | 37,361,486 | — | 56,974,668 | ||||||||
| Total Preferred Stocks |
73,170,393 | 113,944,135 | 4,261,425 | 191,375,953 | ||||||||
| Closed-End Investment Companies |
31,284,568 | — | — | 31,284,568 | ||||||||
| Exchange Traded Funds |
57,459,716 | — | — | 57,459,716 | ||||||||
| Short-Term Investments |
514,873,505 | — | — | 514,873,505 | ||||||||
| Total |
$ | 1,033,387,737 | $ | 11,320,279,353 | $ | 161,914,059 | $ | 12,515,581,149 | ||||
(a) Major categories of the Fund’s investments are included in the Portfolio of Investments.
The following is a reconciliation of Level 3 investments for which significant unobservable inputs were used to determine fair value as of September 30, 2009:
Core Plus Bond Fund
Asset Valuation Inputs
| Investments in |
Balance September 30, 2008 |
Accrued Discounts (Premiums) |
Realized Gain |
Change in Unrealized Appreciation (Depreciation) |
Net Purchases (Sales) |
Net in/(out) |
Balance September 30, 2009 | |||||||||||||||||
| Bonds and Notes |
||||||||||||||||||||||||
| ABS Home Equity |
$ | 2,940,801 | $ | — | $ | (1,585,344 | ) | $ | 811,247 | $ | (1,401,317 | ) | $ | (765,387 | ) | $ | — | |||||||
| Financial Other |
1,406,692 | 730 | — | 162,945 | — | (1,570,367 | ) | — | ||||||||||||||||
| Technology |
522,800 | 786 | (1,029,551 | ) | 605,240 | (99,275 | ) | — | — | |||||||||||||||
| Wireless |
2,216,254 | 2,538 | — | 612,329 | — | (2,831,121 | ) | — | ||||||||||||||||
| Total |
$ | 7,086,547 | $ | 4,054 | $ | (2,614,895 | ) | $ | 2,191,761 | $ | (1,500,592 | ) | $ | (5,166,875 | ) | $ | — | |||||||
High Income Fund
Asset Valuation Inputs
| Investments in |
Balance September 30, 2008 |
Accrued Discounts (Premiums) |
Realized Gain |
Change in Unrealized Appreciation (Depreciation) |
Net Purchases (Sales) |
Net in/(out) |
Balance September 30, 2009 | ||||||||||||||||||
| Bonds and Notes |
|||||||||||||||||||||||||
| Banking |
$ | 320,000 | $ | 4,358 | $ | (406,726 | ) | $ | 118,618 | $ | (36,250 | ) | $ | — | $ | — | |||||||||
| Chemicals |
254,600 | 1,994 | — | (42,187 | ) | 261,187 | (475,594 | ) | — | ||||||||||||||||
| Commercial Mortgage-Backed Securities |
— | — | 44,500 | 21,654 | 323,613 | — | 389,767 | ||||||||||||||||||
| Healthcare |
63,500 | 668 | — | 37,624 | (101,792 | ) | — | — | |||||||||||||||||
| Industrial Other |
67,200 | — | — | 44,800 | — | (112,000 | ) | — | |||||||||||||||||
| Media Non-Cable |
159,375 | 6,496 | (266,237 | ) | 180,741 | (80,375 | ) | — | — | ||||||||||||||||
| Non-Captive Consumer |
408,215 | 9,753 | — | 79,577 | — | — | 497,545 | ||||||||||||||||||
| Non-Captive Diversified |
— | 125 | — | 7,244 | 471,489 | — | 478,858 | ||||||||||||||||||
78
Table of Contents
NOTES TO FINANCIAL STATEMENTS (continued)
September 30, 2009
High Income Fund
Asset Valuation Inputs (continued)
| Investments in Securities |
Balance September 30, 2008 |
Accrued Discounts (Premiums) |
Realized Gain |
Change in Unrealized Appreciation (Depreciation) |
Net Purchases (Sales) |
Net in/(out) |
Balance as of September 30, 2009 | |||||||||||||||||
| Bonds and Notes (continued) |
||||||||||||||||||||||||
| Property & Casualty Insurance |
$ | 15,900 | $ | — | $ | (1,302 | ) | $ | 402 | $ | (15,000 | ) | $ | — | $ | — | ||||||||
| Supranational |
583,267 | 50,343 | — | 44,680 | — | — | 678,290 | |||||||||||||||||
| Technology |
381,600 | 12,433 | (8,795 | ) | 106,662 | 728,300 | (123,640 | ) | 1,096,560 | |||||||||||||||
| Wireless |
133,460 | 860 | — | 57,305 | 275,875 | (467,500 | ) | — | ||||||||||||||||
| Wirelines |
— | 619 | — | 74,029 | 1,759,377 | — | 1,834,025 | |||||||||||||||||
| Preferred Stocks |
— | — | — | — | — | — | — | |||||||||||||||||
| Convertible Preferred Stocks |
371,256 | — | — | 239,979 | — | (611,235 | ) | — | ||||||||||||||||
| Total |
$ | 2,758,373 | $ | 87,649 | $ | (638,560 | ) | $ | 971,128 | $ | 3,586,424 | $ | (1,789,969 | ) | $ | 4,975,045 | ||||||||
International Bond Fund
Asset Valuation Inputs
| Investments in Securities |
Balance September 30, 2008 |
Accrued Discounts (Premiums) |
Realized Gain |
Change in Unrealized Appreciation (Depreciation) |
Net Purchases (Sales) |
Net in/(out) |
Balance as of September 30, 2009 | ||||||||||||||||
| Bonds and Notes |
|||||||||||||||||||||||
| Non-Convertible Bonds |
|||||||||||||||||||||||
| Ireland |
$ | — | $ | — | $ | — | $ | (147 | ) | $ | 98,710 | $ | — | $ | 98,563 | ||||||||
| Supranational |
58,327 | 5,034 | — | 4,468 | — | — | 67,829 | ||||||||||||||||
| United States |
68,665 | 48 | 4,952 | 4,322 | (77,987 | ) | — | — | |||||||||||||||
| Total |
$ | 126,992 | $ | 5,082 | $ | 4,952 | $ | 8,643 | $ | 20,723 | $ | — | $ | 166,392 | |||||||||
Limited Term Government and Agency Fund
Asset Valuation Inputs
| Investments in Securities |
Balance September 30, 2008 |
Accrued Discounts (Premiums) |
Realized Gain |
Change in Unrealized Appreciation (Depreciation) |
Net Purchases (Sales) |
Net in/(out) |
Balance as of September 30, 2009 | ||||||||||||||||
| Bonds and Notes |
|||||||||||||||||||||||
| ABS Home Equity |
$ | 743,234 | $ | — | $ | 13,224 | $ | (287,671 | ) | $ | (707,002 | ) | $ | 777,001 | $ | 538,786 | |||||||
| Total |
$ | 743,234 | $ | — | $ | 13,224 | $ | (287,671 | ) | $ | (707,002 | ) | $ | 777,001 | $ | 538,786 | |||||||
79
Table of Contents
NOTES TO FINANCIAL STATEMENTS (continued)
September 30, 2009
Strategic Income Fund
Asset Valuation Inputs
| Investments in Securities |
Balance as of |
Accrued |
Realized |
Change
in |
Net |
Net Transfers |
Balance as of | ||||||||||||||||||
| Bonds and Notes |
|||||||||||||||||||||||||
| Non-Convertible Bonds |
|||||||||||||||||||||||||
| Airlines |
$ | 16,733,800 | $ | — | $ | 128,579 | $ | 4,797,869 | $ | (2,401,865 | ) | $ | (12,317,531 | ) | $ | 6,940,852 | |||||||||
| Automotive |
— | 3,949 | — | (24,731 | ) | 494,230 | 2,052,698 | 2,526,146 | |||||||||||||||||
| Banking |
49,326,408 | 1,800,522 | (34,140,022 | ) | 20,069,348 | (8,658,000 | ) | (28,398,256 | ) | — | |||||||||||||||
| Chemicals |
9,748,500 | 220,718 | — | 3,747,860 | — | 9,486,502 | 23,203,580 | ||||||||||||||||||
| Diversified Manufacturing |
— | 98,826 | — | 1,626,310 | 19,007,520 | — | 20,732,656 | ||||||||||||||||||
| Electric |
— | 82,267 | — | 71,916 | 4,554,349 | — | 4,708,532 | ||||||||||||||||||
| Independent Energy |
4,890,065 | 56,028 | — | 688,093 | — | (5,634,186 | ) | — | |||||||||||||||||
| Industrial Other |
9,600,000 | — | — | 6,400,000 | — | (16,000,000 | ) | — | |||||||||||||||||
| Life Insurance |
2,828,966 | — | 403,808 | 1,967,772 | (5,200,546 | ) | — | — | |||||||||||||||||
| Media Non-Cable |
5,251,125 | 246,750 | (10,728,408 | ) | 8,055,958 | (2,825,425 | ) | — | — | ||||||||||||||||
| Non-Captive Consumer |
7,027,071 | 186,834 | — | 1,970,519 | — | (5,055,139 | ) | 4,129,285 | |||||||||||||||||
| Non-Captive Diversified |
17,213,700 | 38,142 | — | 4,942,232 | 3,955,364 | (22,131,900 | ) | 4,017,538 | |||||||||||||||||
| Property & Casualty Insurance |
3,662,300 | 2,971 | (120,488 | ) | (446,283 | ) | (423,300 | ) | (2,675,200 | ) | — | ||||||||||||||
| Supranational |
40,912,861 | — | — | 7,001,642 | — | (17,459,258 | ) | 30,455,245 | |||||||||||||||||
| Technology |
8,828,600 | 64,549 | (6,933 | ) | (314,266 | ) | 184,650 | (8,531,600 | ) | 225,000 | |||||||||||||||
| Wireless |
19,281,400 | 55,587 | — | 8,147,063 | 773,550 | (28,257,600 | ) | — | |||||||||||||||||
| Convertible Bonds |
|||||||||||||||||||||||||
| Healthcare |
2,555,500 | 27,551 | — | 1,480,595 | (4,063,646 | ) | — | — | |||||||||||||||||
| Technology |
— | 73,071 | 39,962 | (113,053 | ) | (466,000 | ) | 3,860,320 | 3,394,300 | ||||||||||||||||
| Transportation Services |
358,670 | 4,616 | 27,920 | 11,794 | (403,000 | ) | — | — | |||||||||||||||||
| Wirelines |
— | 41,099 | — | 4,284,901 | 52,993,500 | — | 57,319,500 | ||||||||||||||||||
| Preferred Stocks |
|||||||||||||||||||||||||
| Convertible Preferred Stocks |
|||||||||||||||||||||||||
| Electric Utilities |
4,309,000 | — | — | (538,625 | ) | — | — | 3,770,375 | |||||||||||||||||
| REITs |
— | — | — | (32,025 | ) | — | 523,075 | 491,050 | |||||||||||||||||
| Semiconductors & Semiconductor Equipment |
15,017,488 | — | — | 9,707,312 | — | (24,724,800 | ) | — | |||||||||||||||||
| Total |
$ | 217,545,454 | $ | 3,003,480 | $ | (44,395,582 | ) | $ | 83,502,201 | $ | 57,521,381 | $ | (155,262,875 | ) | $ | 161,914,059 | |||||||||
4. Derivatives. Effective April 1, 2009, the Funds adopted accounting standards related to derivative instruments and hedging activities which require enhanced disclosures. Derivative instruments are defined as financial instruments whose value and performance are based on the value and performance of another security or financial instrument. Derivative instruments that the Funds currently use are forward foreign currency contracts.
The Funds are subject to the risk that changes in foreign currency exchange rates will have an unfavorable effect on the value of Fund assets denominated in foreign currencies. The Funds may enter into forward foreign currency contracts for hedging purposes to protect the value of the Funds’ holdings of foreign securities. The Funds may also use forward foreign currency contracts to gain exposure to foreign currencies, regardless of whether securities denominated in such currencies are held in the funds. High Income Fund and International Bond Fund engaged in forward foreign currency contract transactions during the year ended September 30, 2009.
The following is a summary of derivative instruments for High Income Fund, as of September 30, 2009:
| Asset Derivatives |
Forwards | |
| Foreign exchange contracts |
$ 4,791 | |
| Statement of Assets and Liabilities Location |
Unrealized appreciation on forward foreign currency contracts |
80
Table of Contents
NOTES TO FINANCIAL STATEMENTS (continued)
September 30, 2009
| Liability Derivatives |
Forwards | |
| Foreign exchange contracts |
$ (17,552) | |
| Statement of Assets and Liabilities Location |
Unrealized depreciation on forward foreign currency contracts |
Transactions in derivative instruments during the period April 1, 2009 to September 30, 2009, were as follows:
| Realized Gain (Loss) |
Forwards | |
| Foreign exchange contracts |
$ (36,465) | |
| Statement of Operations Location |
Net realized gain (loss) on foreign currency transactions | |
| Change in Unrealized Appreciation (Depreciation) |
Forwards | |
| Foreign exchange contracts |
$ (19,476) | |
| Statement of Operations Location |
Net change in unrealized appreciation/(depreciation) on foreign currency translations |
The following is a summary of derivative instruments for International Bond Fund, as of September 30, 2009:
| Asset Derivatives |
Forwards | |
| Foreign exchange contracts |
$ 65,206 | |
| Statement of Assets and Liabilities Location |
Unrealized appreciation on forward foreign currency contracts |
Transactions in derivative instruments during the period April 1, 2009 to September 30, 2009, were as follows:
| Realized Gain (Loss) |
Forwards | |
| Foreign exchange contracts |
$ 195,162 | |
| Statement of Operations Location |
Net realized gain (loss) on foreign currency transactions | |
| Change in Unrealized Appreciation (Depreciation) |
Forwards | |
| Foreign exchange contracts |
$ 22,227 | |
| Statement of Operations Location |
Net change in unrealized appreciation/(depreciation) on foreign currency translations |
Volume of derivative activity for High Income Fund and International Bond Fund, based on month-end notional amounts outstanding during the period April 1, 2009 to September 30, 2009, were as follows:
| Percentage of Net Assets | ||
| High Income Fund |
Forwards | |
| Average Notional Amount Outstanding |
0.44% | |
| Highest Notional Amount Outstanding |
0.79% | |
| Lowest Notional Amount Outstanding |
0.00% | |
| Notional Amount Outstanding as of September 30, 2009 |
0.00% | |
| International Bond Fund |
Forwards | |
| Average Notional Amount Outstanding |
10.93% | |
| Highest Notional Amount Outstanding |
15.51% | |
| Lowest Notional Amount Outstanding |
6.87% | |
| Notional Amount Outstanding as of September 30, 2009 |
7.80% | |
Notional amounts outstanding are at absolute value and are determined, when applicable, by netting notional amounts of contracts to buy and sell the same underlying instrument.
81
Table of Contents
NOTES TO FINANCIAL STATEMENTS (continued)
September 30, 2009
5. Purchases and Sales of Securities. For the year ended September 30, 2009, purchases and sales of securities (excluding short-term investments and including paydowns) were as follows:
| U.S. Government and Agency Securities |
Other Securities | |||||||||||
| Fund |
Purchases |
Sales |
Purchases |
Sales | ||||||||
| Core Plus Bond Fund |
$ | 146,443,561 | $ | 114,266,435 | $ | 112,488,661 | $ | 91,084,725 | ||||
| High Income Fund |
— | — | 127,878,005 | 25,832,335 | ||||||||
| International Bond Fund |
1,169,577 | 1,171,276 | 17,667,867 | 11,600,919 | ||||||||
| Limited Term Government and Agency Fund |
164,053,899 | 121,528,615 | 43,725,944 | 17,645,403 | ||||||||
| Strategic Income Fund |
163,575,904 | 191,548,045 | 3,870,713,357 | 3,499,805,852 | ||||||||
6. Management Fees and Other Transactions with Affiliates.
a. Management Fees. Loomis, Sayles & Company, L.P. (“Loomis Sayles”) serves as investment adviser to each Fund. Under the terms of the management agreements, each Fund pays a management fee at the following annual rates, calculated daily and payable monthly, based on each Fund’s average daily net assets:
| Percentage of Average Daily Net Assets | |||||||||||||||
| Fund |
First $100 million |
Next $100 million |
Next $1.8 billion |
Next $13 billion |
Over $15 billion |
||||||||||
| Core Plus Bond Fund |
0.2500 | % | 0.1875 | % | 0.1875 | % | 0.1875 | % | 0.1875 | % | |||||
| High Income Fund |
0.6000 | % | 0.6000 | % | 0.6000 | % | 0.6000 | % | 0.6000 | % | |||||
| International Bond Fund |
0.6000 | % | 0.6000 | % | 0.6000 | % | 0.6000 | % | 0.6000 | % | |||||
| Limited Term Government and Agency Fund |
0.5000 | % | 0.5000 | % | 0.5000 | % | 0.5000 | % | 0.5000 | % | |||||
| Strategic Income Fund |
0.6500 | % | 0.6500 | % | 0.6000 | % | 0.5500 | % | 0.5400 | % | |||||
Natixis Asset Management Advisors, L.P. (“Natixis Advisors”), serves as the advisory administrator to Core Plus Bond Fund. Under the terms of the advisory administration agreement, the Fund pays an advisory administration fee at the following annual rates, calculated daily and payable monthly, based on its average daily net assets:
| Percentage of Average Daily Net Assets | ||||||
| Fund |
First $100 million |
Over $100 million |
||||
| Core Plus Bond Fund |
0.2500 | % | 0.1875 | % | ||
Management and advisory administration fees are presented in the Statements of Operations as management fees.
Loomis Sayles has given binding undertakings to the Funds to reduce management fees and/or reimburse certain expenses associated with these Funds to limit their operating expenses, exclusive of acquired fund fees and expenses, brokerage expenses, interest expense, taxes and extraordinary expenses. These undertakings are in effect until January 31, 2010 and will be reevaluated on an annual basis. For the year ended September 30, 2009, the expense limits as a percentage of average daily net assets under the expense limitation agreements were as follows:
| Expense Limit as a Percentage of Average Daily Net Assets | ||||||||
| Fund |
Class A |
Class B |
Class C |
Class Y | ||||
| Core Plus Bond Fund |
0.90% | 1.65% | 1.65% | 0.65% | ||||
| High Income Fund |
1.15% | 1.90% | 1.90% | 0.90% | ||||
| International Bond Fund |
1.10% | — | 1.85% | 0.85% | ||||
| Limited Term Government and Agency Fund |
0.90% | 1.65% | 1.65% | 0.65% | ||||
| Strategic Income Fund |
1.25% | 2.00% | 2.00% | 1.00% | ||||
Loomis Sayles and Natixis Advisors have agreed to equally bear the fee reductions and/or expense reimbursements for the Core Plus Bond Fund.
82
Table of Contents
NOTES TO FINANCIAL STATEMENTS (continued)
September 30, 2009
Loomis Sayles (and Natixis Advisors for Core Plus Bond Fund) shall be permitted to recover expenses borne under the expense limitation agreement (whether through reduction of its management fees or otherwise) on a class by class basis in later periods to the extent the expenses of a class fall below a class’ expense limits, provided, however, that a class is not obligated to pay such reduced fees/expenses more than one year after the end of the fiscal year in which the fee/expense was reduced.
For the year ended September 30, 2009, the management fees and reductions of management fees for each Fund were as follows:
| Fund |
Gross |
Reduction of |
Net |
Percentage of | |||||||||
| Gross |
Net | ||||||||||||
| Core Plus Bond Fund |
$ | 446,865 | $ | — | $ | 446,865 | 0.218% | 0.218% | |||||
| High Income Fund |
558,817 | 16,356 | 542,461 | 0.600% | 0.580% | ||||||||
| International Bond Fund |
88,309 | 88,309 | — | 0.600% | — | ||||||||
| Limited Term Government and Agency Fund |
970,393 | 12,931 | 957,462 | 0.500% | 0.493% | ||||||||
| Strategic Income Fund |
55,117,195 | — | 55,117,195 | 0.561% | 0.561% | ||||||||
1 Management fee reductions are subject to possible recovery until September 30, 2010.
For the year ended September 30, 2009, the advisory administration fees for Core Plus Bond Fund were as follows:
| Advisory |
Percentage of | |
| $446,865 |
0.218% |
For the year ended September 30, 2009, expenses have been reimbursed as follows:
| Reimbursement2 | |||||||||||||||
| Fund |
Class A |
Class B |
Class C |
Class Y |
Total | ||||||||||
| Core Plus Bond Fund |
$ | 86,191 | $ | 5,790 | $ | 35,428 | $ | 6,417 | $ | 133,826 | |||||
| High Income Fund |
48,409 | 1,923 | 14,135 | — | 64,467 | ||||||||||
| International Bond Fund |
14,225 | — | 4,716 | 47,698 | 66,639 | ||||||||||
| Limited Term Government and Agency Fund |
100,205 | 3,973 | 45,524 | 8,372 | 158,074 | ||||||||||
2 Expense reimbursements are subject to possible recovery until September 30, 2010.
There were no expenses recovered during the year ended September 30, 2009 as permitted under the expense limitation agreement.
Certain officers and directors of Loomis Sayles and Natixis Advisors are also Trustees of the Funds. Loomis Sayles and Natixis Advisors are both limited partnerships indirectly owned by Natixis Global Asset Management, L.P. (“Natixis US”), which is part of Natixis Global Asset Management, an international asset management group based in Paris, France.
b. Administrative Fees. Natixis Advisors provides certain administrative services for the Funds and contracts with State Street Bank to serve as sub-administrator. Natixis Advisors is a wholly-owned subsidiary of Natixis US. Pursuant to an agreement among Natixis Funds Trust I, Natixis Funds Trust II, Natixis Funds Trust III, Natixis Funds Trust IV, Natixis Cash Management Trust, Gateway Trust (“Natixis Funds Trusts”), Loomis Sayles Funds I, Loomis Sayles Funds II (“Loomis Sayles Funds Trusts”), Hansberger International Series and Natixis Advisors, each Fund pays Natixis Advisors monthly its pro rata portion of fees equal to an annual rate of 0.0575% of the first $15 billion of the average daily net assets of the Natixis Funds Trusts, Loomis Sayles Funds Trusts and the Hansberger International Series, 0.0500% of the next $15 billion, 0.0425% of the next $30 billion and 0.0375% of such assets in excess of $60 billion, subject to an annual aggregate minimum fee for the Natixis Funds Trusts, Loomis Sayles Funds Trusts and the Hansberger International Series of $10 million, which is reevaluated on an annual basis. New funds are subject to a fee for the first twelve months of operations of $75,000 plus $12,500 per class and an additional $75,000 if managed by multiple subadvisors.
83
Table of Contents
NOTES TO FINANCIAL STATEMENTS (continued)
September 30, 2009
For the year ended September 30, 2009, each Fund paid the following for administrative fees to Natixis Advisors:
| Fund |
Administrative | ||
| Core Plus Bond Fund |
$ | 101,792 | |
| High Income Fund |
46,013 | ||
| International Bond Fund |
38,718 | ||
| Limited Term Government and Agency Fund |
97,102 | ||
| Strategic Income Fund |
4,879,685 | ||
c. Service and Distribution Fees. Natixis Distributors, L.P. (“Natixis Distributors”), a wholly-owned subsidiary of Natixis US, has entered into a distribution agreement with the Trusts. Pursuant to this agreement, Natixis Distributors serves as principal underwriter of each Fund.
Pursuant to Rule 12b-1 under the 1940 Act, the Trusts have adopted a Service Plan relating to each Fund’s Class A shares (the “Class A Plans”) and a Distribution and Service Plan relating to each Fund’s Class B and Class C shares (the “Class B and Class C Plans”).
Under the Class A Plans, each Fund pays Natixis Distributors a monthly service fee at an annual rate not to exceed 0.25% of the average daily net assets attributable to the Fund’s Class A shares, as reimbursement for expenses incurred by Natixis Distributors in providing personal services to investors in Class A shares and/or the maintenance of shareholder accounts.
Under the Class B, if applicable, and Class C Plans, each Fund pays Natixis Distributors a monthly service fee at an annual rate not to exceed 0.25% of the average daily net assets attributable to the Fund’s Class B and Class C shares, as compensation for services provided and expenses incurred by Natixis Distributors in providing personal services to investors in Class B and Class C shares and/or the maintenance of shareholder accounts.
Also under the Class B, if applicable, and Class C Plans, each Fund pays Natixis Distributors a monthly distribution fee at the annual rate of 0.75% of the average daily net assets attributable to the Fund’s Class B and Class C shares, as compensation for services provided and expenses incurred by Natixis Distributors in connection with the marketing or sale of Class B and Class C shares.
For the year ended September 30, 2009, the Funds paid the following service and distribution fees:
| Service Fee | Distribution Fee | ||||||||||||||
| Fund |
Class A |
Class B |
Class C |
Class B |
Class C | ||||||||||
| Core Plus Bond Fund |
$ | 310,233 | $ | 20,546 | $ | 129,747 | $ | 61,639 | $ | 389,241 | |||||
| High Income Fund |
104,938 | 3,817 | 30,221 | 11,452 | 90,663 | ||||||||||
| International Bond Fund |
8,741 | — | 2,470 | — | 7,410 | ||||||||||
| Limited Term Government and Agency Fund |
306,180 | 11,668 | 133,802 | 35,004 | 401,406 | ||||||||||
| Strategic Income Fund |
11,730,368 | 335,916 | 9,531,216 | 1,007,748 | 28,593,646 | ||||||||||
d. Sub-Transfer Agent Fees. Natixis Distributors has entered into agreements with financial intermediaries to provide certain recordkeeping, processing, shareholder communications and other services to customers of the intermediaries and has agreed to compensate the intermediaries for providing those services. Certain services would be provided by the Funds if the shares of those customers were registered directly with the Funds’ transfer agent. Accordingly, the Funds agreed to pay a portion of the intermediary fees attributable to shares of the Fund held by the intermediaries (which generally are a percentage of the value of shares held) not exceeding what the Funds would have paid its transfer agent had each customer’s shares been registered directly with the transfer agent instead of held through the intermediaries. Natixis Distributors pays the remainder of the fees.
84
Table of Contents
NOTES TO FINANCIAL STATEMENTS (continued)
September 30, 2009
For the year ended September 30, 2009, the Funds paid the following sub-transfer agent fees, which are reflected in transfer agent fees and expenses in the Statements of Operations.
| Sub-Transfer Agent Fees | ||||||||||||
| Fund |
Class A |
Class B |
Class C |
Class Y | ||||||||
| Core Plus Bond Fund |
$ | 93,297 | $ | 6,378 | $ | 37,859 | $ | 18,255 | ||||
| High Income Fund |
21,685 | 851 | 3,099 | 23,847 | ||||||||
| International Bond Fund |
1,475 | — | 172 | 187 | ||||||||
| Limited Term Government and Agency Fund |
50,842 | 1,944 | 11,911 | 7,994 | ||||||||
| Strategic Income Fund |
3,503,843 | 100,896 | 1,259,866 | 861,698 | ||||||||
e. Commissions. The Funds have been informed that commissions (including CDSCs) on Fund shares retained by Natixis Distributors during the year ended September 30, 2009 were as follows:
| Fund |
Commission | ||
| Core Plus Bond Fund |
$ | 298,698 | |
| High Income Fund |
104,449 | ||
| International Bond Fund |
25,048 | ||
| Limited Term Government and Agency Fund |
184,190 | ||
| Strategic Income Fund |
8,326,656 | ||
f. Trustees Fees and Expenses. The Funds do not pay any compensation directly to their officers or Trustees who are directors, officers or employees of Natixis Advisors, Natixis Distributors, Natixis US, or their affiliates. The Chairperson of the Board receives a retainer fee at the annual rate of $200,000. The Chairperson does not receive any meeting attendance fees for Board of Trustees meetings or committee meetings that she attends. Each Independent Trustee (other than the Chairperson) receives, in the aggregate, a retainer fee at the annual rate of $65,000. Each Independent Trustee also receives a meeting attendance fee of $7,500 for each meeting of the Board of Trustees that he or she attends in person and $3,750 for each meeting of the Board of Trustees that he or she attends telephonically. In addition, each committee chair receives an additional retainer fee at the annual rate of $10,000. Each Contract Review and Governance Committee member is compensated $5,000 for each Committee meeting that he or she attends in person and $2,500 for each meeting that he or she attends telephonically. Each Audit Committee member is compensated $6,250 for each Committee meeting that he or she attends in person and $3,125 for each meeting that he or she attends telephonically. These fees are allocated among the funds in the Natixis Funds Trusts, Loomis Sayles Funds Trusts and the Hansberger International Series based on a formula that takes into account, among other factors, the relative net assets of each Fund. Trustees are reimbursed for travel expenses in connection with attendance at meetings.
A deferred compensation plan (the “Plan”) is available to the Trustees on a voluntary basis. Deferred amounts remain in the Funds until distributed in accordance with the provisions of the Plan. The value of a participating Trustee’s deferral account is based on theoretical investments of deferred amounts, on the normal payment dates, in certain funds of the Natixis Funds Trusts, Loomis Sayles Funds Trusts and Hansberger International Series as designated by the participating Trustees. Changes in the value of participants’ deferral accounts are allocated pro rata among the funds in the Natixis Funds Trusts, Loomis Sayles Funds Trusts, and Hansberger International Series, and are normally reflected as Trustees’ fees and expenses in the Statements of Operations. The portions of the accrued obligations allocated to the Funds under the Plan are reflected as Deferred Trustees’ fees on the Statements of Assets and Liabilities.
For the year ended September 30, 2009, net depreciation in the value of participants’ deferral accounts has been included as a reduction of miscellaneous expenses on the Statements of Operations, as follows:
| Fund |
Amount | ||
| Core Plus Bond Fund |
$ | 33,926 | |
| High Income Fund |
8,622 | ||
| Limited Term Government and Agency Fund |
32,163 | ||
| Strategic Income Fund |
49,800 | ||
g. Redemption Fees. Effective June 1, 2009, the redemption fee imposed on Class A shares of High Income Fund was eliminated. Prior to June 1, 2009, shareholders of Class A shares of High Income Fund were charged a 2% redemption fee if they redeemed, including redeeming by exchange within 60 days of acquisition (including acquisition by exchange). The redemption fee was deducted from the shareholder’s redemption or exchange proceeds and was paid to the Fund. These fees were accounted for as an addition to paid-in capital and are presented on the Statements of Changes in Net Assets.
85
Table of Contents
NOTES TO FINANCIAL STATEMENTS (continued)
September 30, 2009
7. Line of Credit. Each Fund, together with certain other funds of Natixis Funds Trusts, Loomis Sayles Funds Trusts and the Hansberger International Series, participates in a $200,000,000 committed unsecured line of credit provided by State Street Bank, with an individual limit of $125,000,000 for each Fund that participates in the line of credit. Interest is charged to each participating fund based on its borrowings at a rate per annum equal to the greater of the Federal Funds rate or overnight LIBOR, plus 0.75%. In addition, a commitment fee of 0.125% per annum, payable at the end of each calendar quarter, is accrued and apportioned among the participating funds based on their average daily unused portion of the line of credit.
Prior to March 11, 2009, each Fund, together with certain other funds of Natixis Funds Trusts, Loomis Sayles Funds Trusts and Hansberger International Series, participated in a $200,000,000 committed unsecured line of credit provided by State Street Bank, with an individual limit of $125,000,000 for each Fund that participated in the line of credit. Interest was charged to each participating fund based on its borrowings at a rate per annum equal to the greater of the Federal Funds rate plus 0.50%. In addition, a commitment fee of 0.09% per annum, payable at the end of each calendar quarter, was accrued and apportioned among the participating funds based on their average daily unused portion of the line of credit.
For the year ended September 30, 2009, the Funds had no borrowings under these agreements.
8. Concentration of Risk. International Bond Fund is a non-diversified fund. Compared with diversified mutual funds, the International Bond Fund may invest a greater percentage of its assets in a particular country. Therefore, the International Bond Fund’s returns could be significantly affected by the performance of any one of the small number of countries in its portfolio.
Each Fund may purchase investments of foreign issuers. Investing in securities of foreign issuers involves special risks and considerations not typically associated with investing in U.S. companies and securities of the U.S. government. These risks include revaluation of currencies and the risk of expropriation. Moreover, the markets for securities of many foreign issuers may be less liquid and the prices of such securities may be more volatile than those of comparable U.S. companies and the U.S. government.
9. Shareholders. At September 30, 2009, the Loomis Sayles Employees’ Profit Sharing Retirement Plan held 19,053 shares of beneficial interest of Limited Term Government and Agency Fund. At September 30, 2009, Natixis US owned shares equating to 46.46% of International Bond Fund’s net assets. At September 30, 2009, three shareholders individually owned more than 5% of the High Income Fund’s total outstanding shares, representing in aggregate, 21.90% of the Fund.
10. Capital Shares. Each Fund may issue an unlimited number of shares of beneficial interest, without par value. Transactions in capital shares were as follows:
| Year Ended September 30, 2009 |
Year Ended September 30, 2008 |
|||||||||||||
| Core Plus Bond Fund |
Shares | Amount | Shares | Amount | ||||||||||
| Class A | ||||||||||||||
| Issued from the sale of shares |
5,053,473 | $ | 54,649,921 | 3,961,377 | $ | 44,610,104 | ||||||||
| Issued in connection with the reinvestment of distributions |
515,393 | 5,579,642 | 416,060 | 4,674,418 | ||||||||||
| Redeemed |
(4,737,622 | ) | (51,103,206 | ) | (2,742,021 | ) | (30,840,053 | ) | ||||||
| Net change |
831,244 | $ | 9,126,357 | 1,635,416 | $ | 18,444,469 | ||||||||
| Class B | ||||||||||||||
| Issued from the sale of shares |
72,713 | $ | 778,608 | 81,830 | $ | 928,726 | ||||||||
| Issued in connection with the reinvestment of distributions |
28,331 | 305,872 | 43,582 | 492,099 | ||||||||||
| Redeemed |
(504,102 | ) | (5,425,057 | ) | (6,832,567 | ) | (77,200,182 | ) | ||||||
| Net change |
(403,058 | ) | $ | (4,340,577 | ) | (6,707,155 | ) | $ | (75,779,357 | ) | ||||
| Class C | ||||||||||||||
| Issued from the sale of shares |
5,539,383 | $ | 59,909,721 | 1,866,796 | $ | 20,868,873 | ||||||||
| Issued in connection with the reinvestment of distributions |
82,284 | 901,682 | 25,095 | 281,730 | ||||||||||
| Redeemed |
(1,683,762 | ) | (18,156,728 | ) | (483,069 | ) | (5,447,710 | ) | ||||||
| Net change |
3,937,905 | $ | 42,654,675 | 1,408,822 | $ | 15,702,893 | ||||||||
| Class Y | ||||||||||||||
| Issued from the sale of shares |
2,459,788 | $ | 27,430,717 | 1,132,575 | $ | 12,755,055 | ||||||||
| Issued in connection with the reinvestment of distributions |
63,520 | 692,382 | 44,572 | 502,262 | ||||||||||
| Redeemed |
(1,576,971 | ) | (16,945,061 | ) | (654,873 | ) | (7,360,390 | ) | ||||||
| Net change |
946,337 | $ | 11,178,038 | 522,274 | $ | 5,896,927 | ||||||||
| Increase (decrease) from capital share transactions |
5,312,428 | $ | 58,618,493 | (3,140,643 | ) | $ | (35,735,068 | ) | ||||||
86
Table of Contents
NOTES TO FINANCIAL STATEMENTS (continued)
September 30, 2009
10. Capital Shares (continued).
| Year Ended September 30, 2009 | Period Ended September 30, 2008* | |||||||||||||
| High Income Fund |
Shares | Amount | Shares | Amount | ||||||||||
| Class A | ||||||||||||||
| Issued from the sale of shares |
9,902,651 | $ | 37,553,280 | 4,904,752 | $ | 23,822,307 | ||||||||
| Issued in connection with the reinvestment of distributions |
702,667 | 2,621,142 | 378,438 | 1,831,932 | ||||||||||
| Redeemed |
(6,362,694 | ) | (24,378,951 | ) | (2,555,411 | ) | (12,401,358 | ) | ||||||
| Net change |
4,242,624 | $ | 15,795,471 | 2,727,779 | $ | 13,252,881 | ||||||||
| Class B | ||||||||||||||
| Issued from the sale of shares |
22,526 | $ | 84,592 | 44,248 | $ | 206,339 | ||||||||
| Issued in connection with the reinvestment of distributions |
21,555 | 78,355 | 26,234 | 128,112 | ||||||||||
| Redeemed |
(229,184 | ) | (845,267 | ) | (356,172 | ) | (1,746,563 | ) | ||||||
| Net change |
(185,103 | ) | $ | (682,320 | ) | (285,690 | ) | $ | (1,412,112 | ) | ||||
| Class C | ||||||||||||||
| Issued from the sale of shares |
2,411,038 | $ | 9,092,790 | 1,607,159 | $ | 7,812,971 | ||||||||
| Issued in connection with the reinvestment of distributions |
155,802 | 577,576 | 53,048 | 255,350 | ||||||||||
| Redeemed |
(949,303 | ) | (3,508,124 | ) | (346,620 | ) | (1,670,004 | ) | ||||||
| Net change |
1,617,537 | $ | 6,162,242 | 1,313,587 | $ | 6,398,317 | ||||||||
| Class Y | ||||||||||||||
| Issued from the sale of shares |
22,731,680 | $ | 88,407,570 | 922,271 | $ | 4,329,547 | ||||||||
| Issued in connection with the reinvestment of distributions |
650,415 | 2,696,934 | 9,401 | 42,724 | ||||||||||
| Redeemed |
(740,730 | ) | (3,068,585 | ) | (27,536 | ) | (125,340 | ) | ||||||
| Net change |
22,641,365 | $ | 88,035,919 | 904,136 | $ | 4,246,931 | ||||||||
| Increase (decrease) from capital share transactions |
28,316,423 | $ | 109,311,312 | 4,659,812 | $ | 22,486,017 | ||||||||
| * | From February 29, 2008 (commencement of operations) through September 30, 2008 for Class Y shares. |
| Year Ended September 30, 2009 | Period Ended September 30, 2008** | |||||||||||||
| International Bond Fund |
Shares | Amount | Shares | Amount | ||||||||||
| Class A | ||||||||||||||
| Issued from the sale of shares |
672,013 | $ | 6,666,998 | 327,200 | $ | 3,256,979 | ||||||||
| Issued in connection with the reinvestment of distributions |
5,103 | 49,865 | 1,505 | 14,727 | ||||||||||
| Redeemed |
(107,505 | ) | (999,973 | ) | (116,234 | ) | (1,149,151 | ) | ||||||
| Net change |
569,611 | $ | 5,716,890 | 212,471 | $ | 2,122,555 | ||||||||
| Class C | ||||||||||||||
| Issued from the sale of shares |
238,418 | $ | 2,461,614 | 101,736 | $ | 1,017,705 | ||||||||
| Issued in connection with the reinvestment of distributions |
670 | 6,563 | 284 | 2,804 | ||||||||||
| Redeemed |
(40,421 | ) | (390,729 | ) | (27,588 | ) | (272,845 | ) | ||||||
| Net change |
198,667 | $ | 2,077,448 | 74,432 | $ | 747,664 | ||||||||
| Class Y | ||||||||||||||
| Issued from the sale of shares |
148,246 | $ | 1,536,076 | 1,079,358 | $ | 10,809,876 | ||||||||
| Issued in connection with the reinvestment of distributions |
24,645 | 234,656 | 21,719 | 215,650 | ||||||||||
| Redeemed |
(54,815 | ) | (509,028 | ) | (13,547 | ) | (132,409 | ) | ||||||
| Net change |
118,076 | $ | 1,261,704 | 1,087,530 | $ | 10,893,117 | ||||||||
| Increase (decrease) from capital share transactions |
886,354 | $ | 9,056,042 | 1,374,433 | $ | 13,763,336 | ||||||||
| ** From February 1, 2008 (commencement of operations) through September 30, 2008. |
||||||||||||||
87
Table of Contents
NOTES TO FINANCIAL STATEMENTS (continued)
September 30, 2009
10. Capital Shares (continued).
| Year Ended September 30, 2009 | Year Ended September 30, 2008 | |||||||||||||
| Limited Term Government and Agency Fund |
Shares | Amount | Shares | Amount | ||||||||||
| Class A | ||||||||||||||
| Issued from the sale of shares |
8,687,955 | $ | 97,183,574 | 2,035,015 | $ | 22,451,140 | ||||||||
| Issued in connection with the reinvestment of distributions |
242,614 | 2,733,365 | 269,896 | 2,982,151 | ||||||||||
| Redeemed |
(8,273,983 | ) | (93,400,549 | ) | (2,604,784 | ) | (28,704,540 | ) | ||||||
| Net change |
656,586 | $ | 6,516,390 | (299,873 | ) | $ | (3,271,249 | ) | ||||||
| Class B | ||||||||||||||
| Issued from the sale of shares |
130,399 | $ | 1,438,679 | 67,405 | $ | 747,264 | ||||||||
| Issued in connection with the reinvestment of distributions |
7,515 | 84,528 | 16,247 | 179,371 | ||||||||||
| Redeemed |
(167,898 | ) | (1,871,502 | ) | (288,166 | ) | (3,175,026 | ) | ||||||
| Net change |
(29,984 | ) | $ | (348,295 | ) | (204,514 | ) | $ | (2,248,391 | ) | ||||
| Class C | ||||||||||||||
| Issued from the sale of shares |
6,162,236 | $ | 68,267,485 | 1,833,502 | $ | 20,260,185 | ||||||||
| Issued in connection with the reinvestment of distributions |
42,444 | 479,083 | 13,505 | 149,095 | ||||||||||
| Redeemed |
(3,881,272 | ) | (43,578,196 | ) | (257,963 | ) | (2,855,031 | ) | ||||||
| Net change |
2,323,408 | $ | 25,168,372 | 1,589,044 | $ | 17,554,249 | ||||||||
| Class Y | ||||||||||||||
| Issued from the sale of shares |
2,463,987 | $ | 28,003,881 | 367,309 | $ | 4,065,238 | ||||||||
| Issued in connection with the reinvestment of distributions |
14,127 | 160,181 | 13,550 | 150,194 | ||||||||||
| Redeemed |
(668,533 | ) | (7,560,045 | ) | (164,425 | ) | (1,829,051 | ) | ||||||
| Net change |
1,809,581 | $ | 20,604,017 | 216,434 | $ | 2,386,381 | ||||||||
| Increase (decrease) from capital share transactions |
4,759,591 | $ | 51,940,484 | 1,301,091 | $ | 14,420,990 | ||||||||
| Year Ended September 30, 2009 | Year Ended September 30, 2008 | |||||||||||||
| Strategic Income Fund |
Shares | Amount | Shares | Amount | ||||||||||
| Class A | ||||||||||||||
| Issued from the sale of shares |
197,022,094 | $ | 2,182,492,582 | 197,552,720 | $ | 2,901,194,415 | ||||||||
| Issued in connection with the reinvestment of distributions |
27,449,011 | 301,119,073 | 22,956,546 | 331,016,205 | ||||||||||
| Redeemed |
(269,140,105 | ) | (2,956,389,363 | ) | (140,438,578 | ) | (1,990,731,186 | ) | ||||||
| Net change |
(44,669,000 | ) | $ | (472,777,708 | ) | 80,070,688 | $ | 1,241,479,434 | ||||||
| Class B | ||||||||||||||
| Issued from the sale of shares |
498,498 | $ | 5,392,143 | 410,099 | $ | 6,009,632 | ||||||||
| Issued in connection with the reinvestment of distributions |
443,741 | 4,856,521 | 401,421 | 5,839,477 | ||||||||||
| Redeemed |
(3,184,682 | ) | (35,016,126 | ) | (2,816,244 | ) | (41,124,244 | ) | ||||||
| Net change |
(2,242,443 | ) | $ | (24,767,462 | ) | (2,004,724 | ) | $ | (29,275,135 | ) | ||||
| Class C | ||||||||||||||
| Issued from the sale of shares |
123,246,746 | $ | 1,377,861,744 | 118,265,590 | $ | 1,746,293,697 | ||||||||
| Issued in connection with the reinvestment of distributions |
11,167,692 | 123,558,637 | 7,195,646 | 104,006,617 | ||||||||||
| Redeemed |
(98,406,847 | ) | (1,085,168,243 | ) | (49,785,407 | ) | (709,035,285 | ) | ||||||
| Net change |
36,007,591 | $ | 416,252,138 | 75,675,829 | $ | 1,141,265,029 | ||||||||
| Class Y | ||||||||||||||
| Issued from the sale of shares |
132,053,741 | $ | 1,485,053,461 | 47,274,736 | $ | 690,204,820 | ||||||||
| Issued in connection with the reinvestment of distributions |
2,940,277 | 33,107,757 | 1,084,519 | 15,512,730 | ||||||||||
| Redeemed |
(45,930,609 | ) | (513,425,165 | ) | (25,704,216 | ) | (361,225,740 | ) | ||||||
| Net change |
89,063,409 | $ | 1,004,736,053 | 22,655,039 | $ | 344,491,810 | ||||||||
| Increase (decrease) from capital share transactions |
78,159,557 | $ | 923,443,021 | 176,396,832 | $ | 2,697,961,138 | ||||||||
88
Table of Contents
REPORT OF INDEPENDENT REGISTERED PUBLIC ACCOUNTING FIRM
To the Trustees of Natixis Funds Trust I and Loomis Sayles Funds II and Shareholders of Loomis Sayles Core Plus Bond Fund, Loomis Sayles High Income Fund, Loomis Sayles International Bond Fund, Loomis Sayles Limited Term Government and Agency Fund, and Loomis Sayles Strategic Income Fund:
In our opinion, the accompanying statements of assets and liabilities, including the portfolios of investments, and the related statements of operations and of changes in net assets and the financial highlights present fairly, in all material respects, the financial position of Loomis Sayles Core Plus Bond Fund, a series of Natixis Funds Trust I, and Loomis Sayles High Income Fund, Loomis Sayles International Bond Fund, Loomis Sayles Limited Term Government and Agency Fund and Loomis Sayles Strategic Income Fund, each a series of Loomis Sayles Funds II (collectively, the “Funds”), at September 30, 2009, and the results of each of their operations, the changes in each of their net assets and the financial highlights for each of the periods indicated, in conformity with accounting principles generally accepted in the United States of America. These financial statements and financial highlights (hereafter referred to as “financial statements”) are the responsibility of the Funds’ management; our responsibility is to express an opinion on these financial statements based on our audits. We conducted our audits of these financial statements in accordance with the standards of the Public Company Accounting Oversight Board (United States). Those standards require that we plan and perform the audits to obtain reasonable assurance about whether the financial statements are free of material misstatement. An audit includes examining, on a test basis, evidence supporting the amounts and disclosures in the financial statements, assessing the accounting principles used and significant estimates made by management, and evaluating the overall financial statement presentation. We believe that our audits, which included confirmation of securities at September 30, 2009 by correspondence with the custodian and brokers, provide a reasonable basis for our opinion.
PricewaterhouseCoopers LLP
Boston, Massachusetts
November 23, 2009
89
Table of Contents
2009 U.S. TAX DISTRIBUTION INFORMATION TO SHAREHOLDERS (unaudited)
Corporate Dividends Received Deduction. For the fiscal year ended September 30, 2009, a percentage of dividends distributed by the Funds listed below qualify for the dividends received deduction for corporate shareholders. These percentages are as follows:
| Fund |
Qualifying Percentage |
||
| Core Plus Bond |
0.18 | % | |
| High Income |
2.08 | % | |
| Strategic Income |
4.62 | % |
Capital Gains Distributions. Pursuant to Internal Revenue Section 852(b), the following Fund paid distributions, which have been designated as capital gains distributions for the fiscal year ended September 30, 2009, unless subsequently determined to be different.
| Fund |
Amount | ||
| Strategic Income |
$ | 52,952,003 | |
Qualified Dividend Income. For the fiscal year ended September 30, 2009, the Funds below will designate up to the maximum amount allowable pursuant to the Internal Revenue Code as qualified dividend income eligible for reduced tax rates. These lower rates range from 0% to 15% depending on an individual’s tax bracket. If the Funds pay a distribution during calendar year 2009, complete information will be reported in conjunction with Form 1099-DIV.
| Fund |
||
| Core Plus Bond |
||
| High Income |
||
| Strategic Income |
90
Table of Contents
TRUSTEE AND OFFICER INFORMATION
The tables below provide certain information regarding the Trustees and officers of Natixis Funds Trust I and Loomis Sayles Funds II (the “Trusts”). Unless otherwise indicated, the address of all persons below is 399 Boylston Street, Boston, MA 02116. The Trusts’ Statements of Additional Information include additional information about the Trustees of the Trusts and are available by calling Natixis Funds at 800-225-5478.
| Name and Year of Birth |
Position(s) Held with the |
Principal Occupation(s) |
Number of Portfolios in and Other Directorships Held | |||
| INDEPENDENT TRUSTEES | ||||||
| Graham T. Allison, Jr. (1940) |
Trustee Since 1984 for Natixis Funds Trust I (including its predecessors) and since 2003 for Loomis Sayles Funds II Contract Review and Governance Committee Member |
Douglas Dillon Professor and Director of the Belfer Center for Science and International Affairs, John F. Kennedy School of Government, Harvard University | 39 Director, Taubman Centers, Inc. (real estate investment trust) | |||
| Charles D. Baker (1956) |
Trustee Since 2005 Contract Review and Governance Committee Member |
Formerly, President and Chief Executive Officer, Harvard Pilgrim Health Care (health plan) | 39 None | |||
| Edward A. Benjamin (1938) |
Trustee Since 2003 for Natixis Funds Trust I and since 2002 for Loomis Sayles Funds II Chairman of the Contract Review and Governance Committee |
Retired | 39 None | |||
| Daniel M. Cain (1945) |
Trustee Since 1996 for Natixis Funds Trust I and since 2003 for Loomis Sayles Funds II Chairman of the Audit Committee |
Chairman (formerly, President and Chief Executive Officer), Cain Brothers & Company, Incorporated (investment banking) | 39 Director, Sheridan Healthcare Inc. (physician practice management) | |||
| Kenneth A. Drucker (1945) |
Trustee Since 2008 Audit Committee Member |
Formerly, Treasurer, Sequa Corp. (manufacturing) | 39 None | |||
| Wendell J. Knox**** (1948) |
Trustee Since 2009 Contract Review and Governance Committee Member |
Director (formerly, President and Chief Executive Officer) of Abt Associates Inc. (research and consulting) | 39 Director, Eastern Bank (commercial bank); Director, The Hanover Insurance Group (property and casualty insurance) | |||
91
Table of Contents
TRUSTEE AND OFFICER INFORMATION
| Name and Year of Birth |
Position(s) Held with the |
Principal Occupation(s) |
Number of Portfolios in and Other Directorships Held | |||
| INDEPENDENT TRUSTEES continued |
||||||
| Sandra O. Moose (1942) |
Chairperson of the Board of Trustees since November 2005 Trustee since 1982 for Natixis Funds Trust I (including its predecessors) and since 2003 for Loomis Sayles Funds II Ex officio member of the Audit Committee and Contract Review and Governance Committee |
President, Strategic Advisory Services (management consulting); formerly, Senior Vice President and Director, The Boston Consulting Group, Inc. (management consulting) | 39 Director, Verizon Communications; Director, AES Corporation (international power company) | |||
| Cynthia L. Walker (1956) |
Trustee Since 2005 Audit Committee Member |
Deputy Dean for Finance and Administration, Yale University School of Medicine; formerly, Executive Dean for Administration, Harvard Medical School; and formerly, Dean for Finance and Chief Financial Officer, Harvard Medical School | 39 None | |||
92
Table of Contents
TRUSTEE AND OFFICER INFORMATION
| Name and Year of Birth |
Position(s) Held with the |
Principal Occupation(s) |
Number of Portfolios in and Other Directorships Held | |||
| INTERESTED TRUSTEES | ||||||
| Robert J. Blanding1 (1947) 555 California Street San Francisco, CA 94104 |
Trustee Since 2003 for Natixis Funds Trust I and since 2002 for Loomis Sayles Funds II Chief Executive Officer of Loomis Sayles Funds II since 2002 |
President, Chairman, Director and Chief Executive Officer, Loomis, Sayles & Company, L.P. | 39 None | |||
| John T. Hailer2 (1960) |
Trustee Since 2000 for Natixis Funds Trust I and since 2003 for Loomis Sayles Funds II |
President and Chief Executive Officer-U.S. and Asia, Natixis Global Asset Management, L.P.; formerly, President and Chief Executive Officer, Natixis Distribution Corporation, Natixis Asset Management Advisors, L.P., Natixis Distributors, L.P. and Natixis Global Associates, Inc. | 39 None | |||
| * | Each Trustee serves until retirement, resignation or removal from the Board of Trustees. The current retirement age is 72. The position of Chairperson of the Board is appointed for a two-year term. Ms. Moose was appointed to serve an additional two-year term as the Chairperson of the Board of Trustees on September 14, 2007. |
| ** | Each person listed above, except as noted, holds the same position(s) with the Natixis Funds Trust I, Natixis Funds Trust II, Natixis Funds Trust III, Natixis Funds Trust IV, Gateway Trust and the Natixis Cash Management Trust (collectively, the “Natixis Funds Trusts”), Loomis Sayles Funds I and Loomis Sayles Funds II (collectively, the “Loomis Sayles Funds Trusts”), and Hansberger International Series. Previous positions during the past five years with Natixis Distributors, L.P. (the “Distributor”), Natixis Asset Management Advisors, L.P. (“Natixis Advisors”), or Loomis, Sayles & Company, L.P. (“Loomis Sayles”) are omitted if not materially different from a Trustee’s or officer’s current position with such entity. |
| *** | The Trustees of the Trusts serve as trustees of a fund complex that includes all series of the Natixis Funds Trusts, the Loomis Sayles Funds Trusts and Hansberger International Series (collectively, the “Fund Complex”). |
| **** | Mr. Knox was appointed as trustee effective July 1, 2009. |
| 1 | Mr. Blanding is deemed an “interested person” of the Trusts because he holds the following positions with an affiliated person of the Trusts: President, Chairman, Director and Chief Executive Officer of Loomis Sayles. |
| 2 | Mr. Hailer is deemed an “interested person” of the Trusts because he holds the following positions with an affiliated person of the Trusts: President and Chief Executive Officer-U.S. and Asia, Natixis Global Asset Management, L.P. |
93
Table of Contents
TRUSTEE AND OFFICER INFORMATION
| Name and Year of Birth |
Position(s) Held |
Term of Office* and |
Principal Occupation | |||
| OFFICERS OF THE TRUSTS | ||||||
| Coleen Downs Dinneen (1960) |
Secretary, Clerk and Chief Legal Officer | Since September 2004 | Executive Vice President, General Counsel, Secretary and Clerk (formerly, Senior Vice President, Deputy General Counsel, Assistant Secretary and Assistant Clerk), Natixis Distribution Corporation, Natixis Asset Management Advisors, L.P. and Natixis Distributors, L.P. | |||
| Daniel J. Fuss One Financial Center Boston, MA 02111 |
Executive Vice President of Loomis Sayles Funds II | Since June 2003 | Vice Chairman and Director, Loomis, Sayles & Company, L.P. | |||
| David Giunta (1965) |
President and Chief Executive Officer of Natixis Funds Trust I and President of Loomis Sayles Funds II | Since March 2008 | President and Chief Executive Officer, Natixis Distribution Corporation, Natixis Asset Management Advisors, L.P. and Natixis Distributors, L.P.; formerly, President, Fidelity Charitable Gift Fund; and formerly, Senior Vice President, Fidelity Brokerage Company | |||
| Russell L. Kane (1969) |
Chief Compliance Officer, Assistant Secretary and Anti-Money Laundering Officer | Chief Compliance Officer since May 2006; Assistant Secretary since June 2004; and Anti-Money Laundering Officer since April 2007 | Chief Compliance Officer for Mutual Funds, Senior Vice President, Deputy General Counsel, Assistant Secretary and Assistant Clerk, Natixis Distribution Corporation, Natixis Asset Management Advisors, L.P. and Natixis Distributors, L.P. | |||
94
Table of Contents
TRUSTEE AND OFFICER INFORMATION
| Name and Year of Birth |
Position(s) Held |
Term of Office* and |
Principal Occupation | |||
| OFFICERS OF THE TRUSTS continued | ||||||
| Michael C. Kardok (1959) |
Treasurer, Principal Financial and Accounting Officer | Since October 2004 | Senior Vice President, Natixis Asset Management Advisors, L.P. and Natixis Distributors, L.P. | |||
| * | Each officer of the Trusts serves for an indefinite term in accordance with the Trusts’ current By-laws until the date his or her successor is elected and qualified, or until he or she sooner dies, retires, is removed or becomes disqualified. |
| ** | Each person listed above, except as noted, holds the same position(s) with the Fund Complex. Mr. Fuss is not an officer of the Natixis Funds Trusts or the Hansberger International Series. Previous positions during the past five years with the Distributor, Natixis Advisors or Loomis Sayles are omitted if not materially different from a Trustee’s or officer’s current position with such entity. |
95
Table of Contents
| Item 2. | Code of Ethics. |
The Registrant has adopted a code of ethics that applies to the Registrant’s principal executive officer, principal financial officer and persons performing similar functions.
| Item 3. | Audit Committee Financial Expert. |
The Board of Trustees of the Registrant has established an audit committee. Ms. Cynthia L. Walker, Mr. Daniel M. Cain and Mr. Kenneth A. Drucker are members of the audit committee and have been designated as “audit committee financial experts” by the Board of Trustees. Each of these individuals is also an Independent Trustee of the Registrant.
| Item 4. | Principal Accountant Fees and Services. |
Fees billed by the Principal Accountant for services rendered to the Registrant.
The table below sets forth fees billed by the principal accountant, PricewaterhouseCoopers LLP, for the past two fiscal years for professional services rendered in connection with a) the audit of the Registrant’s annual financial statements and services provided in connection with regulatory filings; b) audit-related services (including services that are reasonably related to the performance of the audit of the Registrant’s financial statements and but not reported under “Audit Fees”); c) tax compliance, tax advice and tax planning and d) all other fees billed for professional services rendered by the principal accountant to the Registrant, other than the services reported as a part of (a) through (c) of this Item.
| Audit fees | Audit-related fees1 |
Tax fees2 | All other fees | |||||||||||||||||||||
| 2008 | 2009 | 2008 | 2009 | 2008 | 2009 | 2008 | 2009 | |||||||||||||||||
| Loomis Sayles Core Plus Bond Fund |
$ | 40,113 | $ | 40,127 | $ | 831 | $ | 58 | $ | 12,260 | $ | 6,566 | $ | — | $ | — | ||||||||
| 1. | Audit-related fees consist of: |
2008 - performance of agreed-upon procedures related to the Registrant’s deferred compensation plan and services related to the implementation of a new accounting standard.
2009 - performance of agreed-upon procedures related to the Registrant’s deferred compensation plan.
| 2. | Tax fees consist of: |
2008 - review of year-end shareholder reporting and the Registrant’s tax returns.
2009 - review of Registrant’s tax returns and consulting services with respect to new security types.
Aggregate fees billed to the Registrant for non-audit services during 2008 and 2009 were $13,091 and $6,624, respectively.
Fees billed by the Principal Accountant for services rendered to the Adviser and Control Affiliates.
The following table sets forth the non-audit services provided by the Registrant’s principal accountant to Loomis, Sayles & Company, L.P. and entities controlling, controlled by or under common control with Loomis, Sayles & Company, L.P. that provide ongoing services to the Registrant (“Control Affiliates”) for the last two fiscal years.
| Audit-related fees | Tax fees | All other fees | ||||||||||||||||
| 2008 | 2009 | 2008 | 2009 | 2008 | 2009 | |||||||||||||
| Control Affiliates |
$ | 12,000 | $ | 12,000 | $ | — | $ | 6,500 | $ | — | $ | — | ||||||
Table of Contents
Aggregate fees billed to Control Affiliates for non-audit services during 2008 and 2009 were $12,000 and $18,500, respectively.
None of the audit-related, tax and other services provided by the Registrant’s principal accountant were approved by the Audit Committee pursuant to paragraph (c)(7)(i)(C) of Rule 2-01 of Regulation S-X.
Audit Committee Pre Approval Policies.
Annually, the Registrant’s Audit Committee reviews the audit, audit-related, tax and other non-audit services together with the projected fees, for services proposed to be rendered to the Trust and/or other entities for which pre-approval is required during the upcoming year. Any subsequent revisions to already pre-approved services or fees (including fee increases) and requests for pre-approval of new services would be presented for consideration quarterly as needed.
If, in the opinion of management, a proposed engagement by the Registrant’s independent accountants needs to commence before the next regularly scheduled Audit Committee meeting, any member of the Audit Committee who is an independent Board member is authorized to pre-approve the engagement, but only for engagements to provide audit, audit related and tax services. This approval is subject to review of the full Audit Committee at its next quarterly meeting. All other engagements require the approval of all the members of the Audit Committee.
| Item 5. | Audit Committee of Listed Registrants. |
Not applicable.
| Item 6. | Schedule of Investments. |
Included as part of the Report to Shareholders filed as Item 1 herewith.
| Item 7. | Disclosure of Proxy Voting Policies and Procedures for Closed-End Management Investment Companies. |
Not applicable.
| Item 8. | Portfolio Managers of Closed-End Management Investment Companies |
Not applicable.
| Item 9. | Purchases of Equity Securities by Closed-End Management Investment Companies and Affiliated Purchasers. |
Not applicable.
| Item 10. | Submission of Matters to a Vote of Securities Holders. |
There were no material changes to the procedures by which shareholders may recommend nominees to the Registrant’s Board of Trustees.
| Item 11. | Controls and Procedures. |
The Registrant’s principal executive officer and principal financial officer have concluded that the Registrant’s disclosure controls and procedures are sufficient to ensure that information required to be disclosed by the Registrant in this Form N-CSR was recorded, processed, summarized and reported within the time periods specified in the Securities and Exchange Commission’s rules and forms, based upon such officers’ evaluation of these controls and procedures as of a date within 90 days of the filing date of the report.
There were no changes in the Registrant’s internal control over financial reporting that occurred during the Registrant’s last fiscal quarter of the period covered by the report that has materially affected, or is reasonably likely to materially affect, the Registrant’s internal control over financial reporting.
Table of Contents
| Item 12. | Exhibits. |
| (a) | (1) | Code of Ethics required by Item 2 hereof, filed herewith as Exhibit (a)(1). | ||
| (a) | (2) | Certifications of Principal Executive Officer and Principal Financial Officer pursuant to Rule 30a-2(a) under the Investment Company Act of 1940 (17 CFR 270.30a-2(a)), filed herewith as Exhibits (a)(2)(1) and (a)(2)(2), respectively. | ||
| (a) | (3) | Not applicable. | ||
| (b) | Certification of Principal Executive Officer and Principal Financial Officer pursuant to Section 906 of Sarbanes-Oxley Act of 2002 are filed herewith as Exhibit (b). | |||
Table of Contents
SIGNATURES
Pursuant to the requirements of the Securities Exchange Act of 1934 and the Investment Company Act of 1940, the Registrant has duly caused this report to be signed on its behalf by the undersigned, thereunto duly authorized.
| Natixis Funds Trust I | ||
| By: | /s/ DAVID L. GIUNTA | |
| Name: | David L. Giunta | |
| Title: | President and Chief Executive Officer | |
| Date: | November 23, 2009 | |
Pursuant to the requirements of the Securities Exchange Act of 1934 and the Investment Company Act of 1940, this report has been signed by the following persons on behalf of the Registrant and in the capacities and on the dates indicated.
| By: | /s/ DAVID L. GIUNTA | |
| Name: | David L. Giunta | |
| Title: | President and Chief Executive Officer | |
| Date: | November 23, 2009 | |
| By: | /s/ MICHAEL C. KARDOK | |
| Name: | Michael C. Kardok | |
| Title: | Treasurer | |
| Date: | November 23, 2009 | |