UNITED STATES
SECURITIES AND EXCHANGE COMMISSION
Washington, D.C. 20549
FORM N-CSR
Certified Shareholder Report of
Registered Management Investment Companies
Investment Company Act File Number: 811-04318
The American Funds Income Series
(Exact Name of Registrant as Specified in Charter)
333 South Hope Street
Los Angeles, California 90071
(Address of Principal Executive Offices)
Registrant's telephone number, including area code: (213) 486-9200
Date of fiscal year end: August 31
Date of reporting period: August 31, 2013
Courtney R. Taylor
The American Funds Income Series
333 South Hope Street
Los Angeles, California 90071
(Name and Address of Agent for Service)
Copies to:
Michael Glazer
Bingham McCutchen LLP
355 South Grand Avenue, Suite 4400
Los Angeles, California 90071
(Counsel for the Registrant)
ITEM 1 – Reports to Stockholders
![]()
Rising interest
rates can create
opportunities for
government
bond
investors.
Special feature page 4
| |
U.S.
Government Securities Fund® Annual report for the year ended August 31, 2013 |
U.S. Government Securities Fund seeks a high level of current income, as well as preservation of capital, by investing primarily in securities guaranteed or sponsored by the United States government.
This fund is one of more than 40 offered by one of the nation’s largest mutual fund families, American Funds, from Capital Group. For more than 80 years, Capital has invested with a long-term focus based on thorough research and attention to risk.
Fund results shown in this report, unless otherwise indicated, are for Class A shares at net asset value. If a sales charge (maximum 3.75%) had been deducted, the results would have been lower. Results are for past periods and are not predictive of results for future periods. Current and future results may be lower or higher than those shown. Share prices and returns will vary, so investors may lose money. Investing for short periods makes losses more likely. Investments are not FDIC-insured, nor are they deposits of or guaranteed by a bank or any other entity, so they may lose value. For current information and month-end results, visit americanfunds.com.
Here are the average annual total returns on a $1,000 investment with all distributions reinvested for periods ended September 30, 2013 (the most recent calendar quarter-end):
| Class A shares | 1 year | 5 years | 10 years | |||||||||
| Reflecting 3.75% maximum sales charge | -6.04% | 3.34% | 3.38% |
For other share class results, visit americanfunds.com and americanfundsretirement.com.
The total annual fund operating expense ratio is 0.61% for Class A shares as of the prospectus dated November 1, 2013 (unaudited).
Investment results assume all distributions are reinvested and reflect applicable fees and expenses. When applicable, investment results reflect fee waivers, without which results would have been lower. Visit americanfunds.com for more information.
The fund’s 30-day yield for Class A shares as of September 30, 2013, calculated in accordance with the U.S. Securities and Exchange Commission (SEC) formula, was 0.89%. The fund’s 12-month distribution rate for Class A shares as of that date was 0.80%. Both reflect the 3.75% maximum sales charge. The SEC yield reflects the rate at which the fund is earning income on its current portfolio of securities while the distribution rate reflects the fund’s past dividends paid to shareholders. Accordingly, the fund’s SEC yield and distribution rate may differ.
The return of principal for bond funds and for funds with significant underlying bond holdings is not guaranteed. Fund shares are subject to the same interest rate, inflation and credit risks associated with the underlying bond holdings. Bond ratings, which typically range from Aaa/AAA (highest) to D (lowest), are assigned by credit rating agencies such as Moody’s, Standard & Poor’s and/or Fitch as an indication of an issuer’s creditworthiness. Refer to the fund prospectus and the Risk Factors section of this report for more information on these and other risks associated with investing in the fund.

| Special feature | |
| 4 | Rising interest rates can create opportunities for government bond investors |
| Contents | |
| 1 | Letter to investors |
| 3 | The value of a long-term perspective |
| 10 | Summary investment portfolio |
| 13 | Financial statements |
| 29 | Board of trustees and other officers |
For the 12 months ended August 31, 2013, U.S. Government Securities Fund declined 3.4%. In comparison, the unmanaged Barclays U.S. Government/Mortgage-Backed Securities Index, the fund’s benchmark, was down 2.7%. The Lipper General U.S. Government Funds Average (a peer group of funds) fell 4.2%.
Income is a key element of the fund’s total return. The fund provides income in the form of monthly dividends, which totaled about 12 cents a share for the 12-month period. This amounts to an income return of 0.84% for investors who reinvested dividends. A capital gain distribution of 35.1 cents a share was paid in December.
Bond market overview
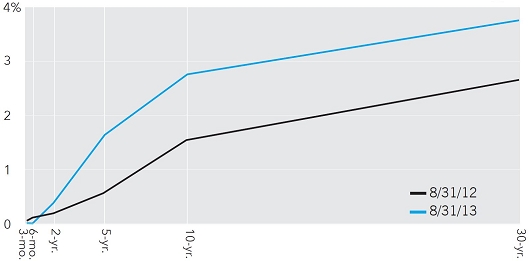
The past 12 months represented a challenging period for bond investors. Signs of an improving U.S. economy and subsequent concerns that the Federal Reserve would begin reducing its bond buying policies caused a selloff in U.S. Treasuries. Yields on 10-year Treasuries rose from 1.6% to 2.8% between August 31, 2012, and August 31, 2013. During the same period, yields on 30-year Treasuries rose from 2.7% to 3.7%. As bond yields rose, prices fell.
Although it was one of the most difficult bond markets since 1994, it bore many differences from the 1994 bond bear market, which was caused by a synchronized global economic recovery combined with the Fed raising rates. This time, there was not a strong global recovery, and the Fed, rather than raising rates, merely suggested that it would begin reducing its large-scale asset purchases. Nevertheless, bond investors sold U.S. Treasuries and government-sponsored securities, causing a pullback in prices.
While Treasuries had a tough time because of rising rates, other asset classes that were more prone to risk, like emerging-markets bonds, went through a much more pronounced repricing, which helps illustrate the relative stability of U.S. government bonds.
The fund’s 12-month negative returns were naturally disappointing to investors, but they were relatively modest compared to the decline in values that other, more volatile asset classes experience from time to time. Investors for whom the fund serves as part of a broad, diversified portfolio likely experienced gains in other portions of their portfolios, like U.S. equities. U.S. government bonds historically have acted as a stabilizing
Results at a glance
For periods ended August 31, 2013, with all distributions reinvested
| Cumulative
total returns |
Average annual total returns | |||||||||||||||
| 1 year | 5 years | 10 years | Lifetime (since 10/17/85) | |||||||||||||
| U.S. Government Securities Fund (Class A shares) | -3.37 | % | 3.94 | % | 3.88 | % | 6.11 | % | ||||||||
| Barclays U.S. Government/ Mortgage-Backed Securities Index* | -2.69 | 4.25 | 4.59 | 7.05 | ||||||||||||
| Lipper General U.S. Government Funds Average | -4.18 | 3.90 | 3.80 | 6.02 | ||||||||||||
| * | The index is unmanaged and, therefore, has no expenses. |
| U.S. Government Securities Fund | 1 |
Treasury yield curves at the beginning and end of the fiscal year
Source: Treasury.gov
element in a broader portfolio. The fund gained ground after the fiscal year-end, as government securities added value due to investor concerns over the political impasse in Congress.
Inside the portfolio
While the portfolio managers expected bond yields to rise and had positioned the fund for an increase in yields, the timing and speed of the increase was, in some ways, surprising. The economy is still showing signs of fragility, with fiscal policy dampening domestic demand and investment spending weak. The Federal Reserve’s discussion of the desirability of reducing its Treasury and mortgage-backed bond purchases may have caused the market to overreact. The market swung from one extreme — being bullish on low interest rates in April — to expecting high and rising rates in August.
Inflation-linked bonds, which historically have done well when expectations for inflation pick up, fared poorly in 2013, disappointing many investors who see them as protecting against periods of rising rates. Although the fund did not have substantial holdings in inflation-linked bonds, the ones the fund held did not add value.
The fund was heavily invested in 15-year agency mortgage-backed securities, which are typically less sensitive to rising rates than 30-year mortgages, but in this period they had weaker results. The fund’s large holdings in mortgages, along with its conservative positioning in this asset class, contributed to losses, as overall results for mortgages trailed those of Treasuries. The portfolio managers had reduced the fund’s holdings in mortgages early in the year, and as prices became more attractive over the summer they began adding them back.
The summary investment portfolio, beginning on page 10, offers more complete details of the various government securities and sectors held by the fund as of August 31, 2013.
Looking ahead
With higher rates and lower prices for government-sponsored securities, the fund has the potential to produce a higher yield and return going forward. Even if rates continue to move higher from here, bond investors have absorbed a lot of the likely repricing that may occur as the Fed normalizes policy in coming years. A potential further rise in yields is therefore likely to be more gradual, with investors benefiting from a higher yield to cushion price fluctuations. We believe there is much better value now in Treasuries and mortgages than there has been in some time, particularly along the intermediate part of the yield curve.
Although the U.S. economy has been improving, there is still relatively high unemployment, low GDP growth and fiscal tightening. Government budget cutting, along with relatively moderate investment spending in the economy, are also likely to dampen growth. In this environment, risk of rising interest rates may not pose as substantial a threat. To learn more about our views on rates, we invite you to read our feature article, “Rising interest rates can create opportunities for government bond investors,” beginning on page 4.
A fundamental component of our investment strategy in U.S. Government Securities Fund has always been to maintain a very high-quality portfolio to serve as a hedge against economic uncertainties that could impact other portions of our fund investors’ individual portfolios. We believe that government securities will retain their valued status as part of a balanced portfolio even if interest rates do eventually trend higher.
We thank you for your continued support and look forward to reporting to you again in six months.
Cordially,

Thomas H. Høgh
President
October 14, 2013
For current information about the fund, visit americanfunds.com.
| 2 | U.S. Government Securities Fund |
The value of a long-term perspective
How a $10,000 investment has grown (for the period October 17, 1985, to August 31, 2013, with distributions reinvested) Fund results shown reflect deduction of the maximum sales charge of 3.75% on the $10,000 investment. 1 Thus, the net amount invested was $9,625.2
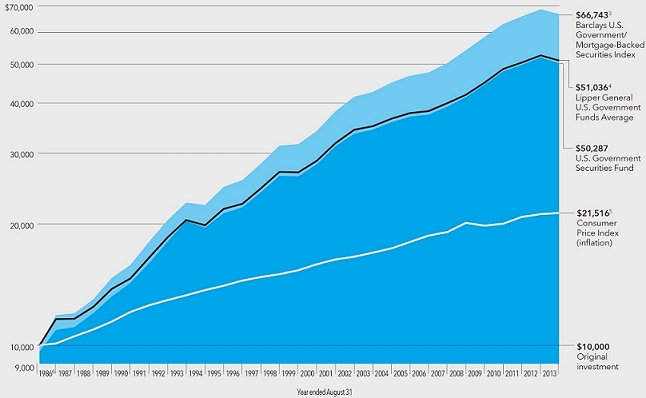
| 1 | As outlined in the prospectus, the sales charge is reduced for accounts (and aggregated investments) of $100,000 or more and is eliminated for purchases of $1 million or more. There is no sales charge on dividends or capital gain distributions that are reinvested in additional shares. |
| 2 | The maximum initial sales charge was 4.75% prior to January 10, 2000. |
| 3 | The index is unmanaged and, therefore, has no expenses. |
| 4 | Results of the Lipper General U.S. Government Funds Average do not reflect any sales charges. |
| 5 | Computed from data supplied by the U.S. Department of Labor, Bureau of Labor Statistics. |
| 6 | For the period October 17, 1985 (when the fund began operations), though August 31, 1986. |
Past results are not predictive of results for future periods. The results shown are before taxes on fund distributions and sale of fund shares.
Average annual total returns based on a $1,000 investment (for periods ended August 31, 2013)*
| 1 year | 5 years | 10 years | ||||||||||
| Class A shares | -6.99 | % | 3.15 | % | 3.49 | % | ||||||
*Assumes reinvestment of all distributions and payment of the maximum 3.75% sales charge.
Investment results assume all distributions are reinvested and reflect applicable fees and expenses. When applicable, investment results reflect fee waivers, without which results would have been lower. Visit americanfunds.com for more information.
| U.S. Government Securities Fund | 3 |
Rising interest rates can create opportunities for government bond investors

The 2007–2008 financial crisis ushered in a period of unprecedented monetary policy, as the Federal Reserve pumped liquidity into the system, purchasing bonds at extremely low yields and maintaining a target federal funds rate close to zero. Five years later, the Fed is still practicing quantitative easing, though it has sent signals to the market that it may begin reducing its support.
In response to these signals, and in recognition of improving economic conditions in the U.S., yields for U.S. government bonds have risen steeply, causing bond prices to deteriorate. Many investors may be concerned about the prospect of rising interest rates and their potential negative impact on bond holdings. But despite the challenges that rising rates may create, they can provide
| 4 | U.S. Government Securities Fund |
 |
Anne Vandenabeele investment analyst
“The Fed has said it will reduce asset purchases, which has contributed to a rise in bond yields at the longer end of the curve.” |

potential opportunities for bond investors and for U.S. Government Securities Fund.
In these pages, we’ll look at some of the ways the fund’s portfolio managers can use a rising rate environment to potentially benefit fund investors. In addition, we’ll consider reasons why bond yields may not rise as much as they have in previous cycles.
Bond yields are up
The past 12 months have generated a steep rise in the Treasury yield curve, with yields increasing especially along the middle to long end of the curve (see chart on page 2). According to investment analyst Anne Vandenabeele, the rise in rates can be attributed to three factors. First, the U.S. economy is gathering steam, and there is an expectation that growth is improving.
Second, there is an expectation that the Fed will reduce its bond purchases. “While there’s clearly an ongoing commitment to keeping the federal funds rate near zero, anchoring the short end of the curve, the Fed has said it will reduce asset purchases, which has contributed to a rise in bond yields at the longer end of the curve,” Anne says.
Finally, many investments among various markets were based on a reach for yield in a world of low Treasury yields. “As it became clearer to many investors that Treasury yields may not stay at these levels forever, some of these investments started unwinding, which has contributed to falling prices,” Anne adds.
While an improving U.S. economy is generally considered a positive development, it also means that the Fed is more likely to reduce its efforts to keep yields low, and that interest rates are more likely to rise.
“The U.S. economy is gradually rebalancing, and U.S. consumers have substantially reduced their debts,” says Thomas Høgh, portfolio manager. “The banking system is healing. Unemployment rates are still high but are coming down. Federal, state and local budget deficits are also returning to more normal levels. All of the gauges of the economy are showing things looking more healthy, balanced and solid.”
Rising rates often mean lower prices
Interest rates have an inverse relationship to the value of bonds. In general, when rates rise, bond prices decline. The effects vary depending on the bond’s credit rating, coupon, maturity and the provisions of its loan agreements. The different types of securities in which the fund invests may be affected differently by a change in rates.
Treasury securities, which make up about 39% of the fund, are the barometer of the bond market. Because these securities are backed by the full faith and credit of the U.S. government, they have minimal credit risk. But, like all bonds, they are highly sensitive to economic currents, inflation data and market forces that can influence interest rate trends.
Agency mortgage-backed securities, which make up about 42% of the fund, are also high-quality bonds, but their sensitivity to rate movements may be
| U.S. Government Securities Fund | 5 |
|
Thomas Høgh portfolio manager
“We have a longer term view that rates are likely to rise gradually — a gradual rise may help generate positive returns.”
|
 |
more complicated. While interest and principal payments on Treasuries are highly predictable, that is not the case with cash payments made on mortgage-backed securities. Falling interest rates tend to accelerate mortgage prepayments, which then shortens the average maturity and duration of these securities; however, the opposite is true when interest rates are rising. It’s worth noting that credit quality is not the only indicator of how bonds may fare. The timing of a mortgage-backed security’s cash flow also affects its value.
Now for the good news
Many bond investors are well aware that when rates fall, the value of their bond holdings tends to increase. This was exemplified by the multiyear rally in Treasuries and other bonds that came to an end in the past year. But as with falling rates, rising rates can also create opportunities for long-term investors.
While the value of existing bonds may fall, the fund can reinvest proceeds from maturing bonds and interest income at higher yields. This can translate to gains for those who remain invested over time. “The bond math of a gradual increase in yields which we reinvest, taking into account the income, makes it rarer for a negative return to be generated over the long term,” Anne explains.
In addition, if rates rise slowly, returns are more likely to stay positive. “We have a longer term view that rates are likely to rise gradually — a gradual rise may help generate positive returns,” Thomas says.
Even if returns are negative, losses during periods of rising rates historically have not been severe. The chart on page 7 shows how the fund and its peer group have fared during previous periods of rising rates. In many cases, losses were not substantial, especially when compared with weak periods in equity markets.
In addition, both the fund and its peer group experienced gains in the 12 months following the periods of rising rates. This illustrates how reinvesting at higher yields and holding investments for a longer term can benefit the fund and its investors. Reinvesting income and compounding at a higher rate can have a significant positive impact on returns over time.
Arguably, bond funds may be better investments than individual bond holdings when it comes to reinvesting interest income. While individual bondholders may find it challenging to reinvest interest income or principal repayments, an actively managed fund can readily replace maturing bonds with higher yielding ones, often for a fraction of the transaction costs that individuals would pay.
The right strategy can help
The fund’s portfolio managers have several strategies they can employ to help reduce the impact of rising yields on the fund’s total return. “There’s no getting away from the fact that higher yields mean lower prices, but what you’re trying to do as you invest is minimize the impact to the fund,” says Fergus MacDonald, portfolio manager.
Rising rates have often preceded long-term gains.
This table shows the cumulative total returns for the fund during rising rate periods and for the 12 months immediately following the rising rate period. As you can see, in most cases, returns improved significantly during the one-year-later periods. This is one reason we encourage investors to take a long-term view.
| 6 | U.S. Government Securities Fund |
 |
Fergus MacDonald portfolio manager
“There’s no getting away from the fact that higher yields mean lower prices, but what you’re trying to do as you invest is minimize the impact to the fund.”
|
One technique is to maintain a “barbell” position along the yield curve. “You hold a large number of short-dated bonds, which are not very sensitive to interest rate changes, and balance that by holding some long-dated bonds,” Fergus says. “The expectation is that the two ends of the curve remain relatively stable in terms of price. Bonds in the middle of the curve will likely see the sharpest relative move up in yields, so you try to avoid those.”
Another strategy is to stay short on duration (the fund’s sensitivity to interest rate change). “A short-duration strategy can be helpful, because when rates rise there will be more negative returns in the portfolio the longer duration the manager has,” Anne says.
However, a short-duration strategy has its limits. “Things never move in a straight line, and there will be periods
Fund results shown are for Class A shares at net asset value. If a sales charge (maximum 3.75%) had been deducted, the results would have been lower. Results are for past periods and are not predictive of results for future periods. Current and future results may be lower or higher than those shown. Share prices and returns will vary, so investors may lose money. For current information and month-end results, visit americanfunds.com.
| Seven rising rate periods | U.S. Government Securities Fund |
Lipper General U.S. Government Funds Average | ||||||
| 8/31/86–9/30/87 | -1.21 | % | -0.95 | % | ||||
| 1 year later (9/30/87–9/30/88) | 13.21 | 12.19 | ||||||
| 10/31/93–11/30/94 | -6.07 | -4.50 | ||||||
| 1 year later (11/30/94–11/30/95) | 14.67 | 16.88 | ||||||
| 12/31/95–3/31/97 | 2.26 | 1.24 | ||||||
| 1 year later (3/31/97–3/31/98) | 10.38 | 12.05 | ||||||
| 9/30/98–1/31/00 | -2.01 | -3.15 | ||||||
| 1 year later (1/31/00–1/31/01) | 13.52 | 13.52 | ||||||
| 5/31/03–6/30/04 | -0.58 | -1.61 | ||||||
| 1 year later (6/30/04–6/30/05) | 5.45 | 5.87 | ||||||
| 6/30/05–6/30/06* | -1.35 | -1.73 | ||||||
| 1 year later (6/30/06–6/30/07) | 5.17 | 4.84 | ||||||
| 12/31/08–3/31/10 | 3.40 | 5.07 | ||||||
| 1 year later (3/31/10–3/31/11) | 4.37 | 4.14 | ||||||
Dates shown represent periods when 30-year U.S. Treasury yields grew at least 15% for periods of at least 12 months, as of December 31, 2012. All returns are cumulative. Yields for the last business day of the month were used to determine the rising rate periods.
*The peak for this period was May 2006.
| U.S. Government Securities Fund | 7 |
when market information — like weak economic data — causes yields to move lower,” Fergus adds. “In this case, a short-duration strategy would only benefit partially from the fall in yields.”
Be flexible when following a thesis
“Just as diversification is important across asset classes and funds, it is also important to diversify across ways to implement a view, so as to achieve the maximum benefit while minimizing interference from unintended consequences,” says Wesley Phoa, portfolio manager. “We hope to have good results in the scenario we
Why rates may rise more moderately than in past cycles
Portfolio manager and quantitative analyst Wesley Phoa offers five reasons he believes any impending rise in rates — and the corresponding drop in bond values — will be more moderate than in previous economic cycles:
| 1 | Demographics are different: We have an older population in the U.S. and in almost all developed countries than we did before. That may mean proportionately greater demand for retirement income today, more risk aversion among investors, and possibly lower GDP growth because fewer young people are ramping up their skills and preparing to enter the workforce. This is all consistent with lower interest rates/lower bond yields. |
| 2 | Higher unemployment and a changing global economy: With higher structural unemployment, a deterioration of skills among workers, and a shift in productive capacity and growth away from developed countries like the U.S. into other parts of the world, potential GDP growth may have slowed. This affects long-term average real interest rates. |
| 3 | Regulation: Changes in financial regulations mean large financial firms are being forced to increase significantly their holdings in liquid bonds, especially government bonds. As a result, there’s a structural demand that didn’t exist before. This is likely to remain a source of downward pressure on bond yields over the medium term. |
| 4 | Large retirement (defined benefit) plans: Many plans that had substantial equity holdings are in the process of shifting from equities to long-term bonds over the next few years. While a typical plan today holds half its assets in equities, surveys indicate that many plans are targeting 80%–90% or more of their portfolios to be placed in long-term bonds — a closer match to pension plan liabilities — reducing plans’ exposure to market risk. The financial position of most plans has improved greatly this year, making it more feasible for them to reallocate assets in this way. |
| 5 | Inflation: Inflation is structurally lower than it used to be, and inflation risk — the risk that inflation might substantially eat into income generated from bonds — is more contained than it used to be. Our outlook for inflation right now is low. It’s probably not lower than it was in the 2000s, but lower than it was in the ’80s and ’90s. There’s definitely some risk around that forecast of inflation becoming high and variable, but we’re very unlikely to see the extremely high and volatile inflation that we experienced in the late ’70s and early ’80s. |
| 8 | U.S. Government Securities Fund |
|
Wesley Phoa portfolio manager
“We understand that this fund is one ingredient in our fund investors’ broader asset allocation, and we want to make sure it serves its intended purpose in mitigating risk under a range of different scenarios.” |
expect, but also that our results will be acceptable in scenarios we don’t expect.”
As Wesley explains, if the portfolio managers have a view that Treasury yields are likely to rise, they have a number of ways to position the portfolio, including some of the strategies detailed above. In addition, they can adjust the fund’s holdings to try to avoid maturities that are likely to be more affected by yield increases. They can own fewer mortgages, because when bond yields go up mortgages tend to extend duration and underperform, though reducing mortgages means giving up some income.
The portfolio managers can also change the allocation within mortgages to own more low-coupon mortgages, which may have the potential to do better. “We can also change the specific mortgage pools we hold, so we could own pools of mortgages that were recently refinanced or pools of mortgages with low loan balances — ones that will have more stable durations as interest rates fluctuate,” Wesley says.
“Additionally, we can focus our investments on different kinds of securities like multifamily government-sponsored mortgage securities, which may have more stable cash flows, higher yields and more income, but require ceding some liquidity,” Wesley adds.
One asset class that can be utilized is inflation-linked bonds, such as Treasury inflation-protected securities (TIPS), which are designed to protect value when inflation increases. However, these securities recently have fared poorly, as inflation did not increase substantially when yields rose. “We are cautious on inflation-linked bonds, because there is still not a lot of inflationary pressure,” Thomas says. “But if we start to see the risk of inflation picking up, we can purchase these securities to help offset the effects of rising inflation.”
Experience and resources can contribute to success
Experience and knowledge can play a crucial role in the fund’s ability to adapt to interest rate fluctuations. The investment professionals who manage the fund average 23 years of investment experience.* They understand the vital role of research and are aided by an extensive network of talented investment professionals.
Resources include fixed-income and equity analysts who cover a wide range of companies and industries and who help the fund’s managers gain a detailed view of economic activity. A team of economists and dedicated groups that study rates and duration strategy, along with a staff of experienced traders, all contribute to the search for attractive investment opportunities in any market conditions.
Maintain a long-term view
Although the current environment suggests that rates are likely to rise over the next few years, there are no guarantees that this will happen. In fact, many factors could cause the outlook to reverse. If, for example, the U.S. economy enters another recession, yields are likely to move lower again. That, and the tendency for bonds to hold up better than equities during equity declines, are among the reasons investors should maintain a diversified strategy for long-term investing.
Despite the potential for a shift toward higher interest rates, the fund may be a good option for conservative investors seeking a bond portfolio that is largely supported by the credit strength of the U.S. government.
For investors with a long-term perspective, the fund can serve as an important part of a diversified portfolio. “We understand that this fund is one ingredient in our fund investors’ broader asset allocation, and we want to make sure it serves its intended purpose in mitigating risk under a range of different scenarios,” Wesley concludes. ¢
*As of the prospectus dated November 1, 2013 (unaudited).
| U.S. Government Securities Fund | 9 |
Summary investment portfolio August 31, 2013
| Investment mix by security type | Percent of net assets |
![]()
| Breakdown of mortgage-backed obligations | Percent of net assets |
|||||||
| 30-year pass-throughs: | ||||||||
| Fannie Mae | 25.9 | % | ||||||
| Freddie Mac | 4.5 | |||||||
| Ginnie Mae | 3.8 | 34.2 | % | |||||
| 15-year pass-throughs | 3.0 | |||||||
| Other | 4.7 | |||||||
| Total | 41.9 | % | ||||||
| Quality breakdown* | Percent of net assets |
|||
| U.S. Treasury and agency bonds & notes† | 51.4 | % | ||
| Aaa/AAA | 41.9 | |||
| Short-term securities & other assets less liabilities | 6.7 | |||
Long-term obligations of the U.S. government and federal agencies are currently rated AAA by at least one rating agency. These obligations are currently rated AA+ by Standard & Poor’s.
| * | Bond ratings, which typically range from Aaa/AAA (highest) to D (lowest), are assigned by credit rating agencies such as Moody’s, Standard & Poor’s and/or Fitch as an indication of an issuer’s creditworthiness. If agency ratings differ, the security will be considered to have received the highest of those ratings, consistent with the fund’s investment policies. The ratings are not covered by the Report of Independent Registered Public Accounting Firm. |
| † | These securities are guaranteed by the full faith and credit of the United States government. |
| Bonds, notes & other debt instruments 93.30% | Principal amount (000) |
Value (000) |
Percent of net assets |
|||||||||
| Federal agency mortgage-backed obligations1 41.94% | ||||||||||||
| Fannie Mae: | ||||||||||||
| 6.00% 2039 | $ | 35,402 | $ | 38,732 | ||||||||
| 4.50% 2041 | 51,250 | 54,212 | ||||||||||
| 4.00% 2042 | 55,135 | 57,006 | ||||||||||
| 3.00% 2043 | 177,877 | 170,150 | ||||||||||
| 3.50% 2043 | 318,550 | 317,803 | 28.80 | % | ||||||||
| 4.00% 2043 | 255,867 | 263,183 | ||||||||||
| 5.00% 2043 | 37,605 | 40,425 | ||||||||||
| 0%–10.851% 2017–20472 | 843,137 | 868,260 | ||||||||||
| Government National Mortgage Assn. | ||||||||||||
| 2.50%–10.00% 2019–20582 | 383,215 | 401,112 | 6.38 | |||||||||
| Freddie Mac: | ||||||||||||
| 5.50% 2038 | 39,019 | 42,130 | ||||||||||
| 3.50% 2043 | 57,000 | 56,706 | 5.69 | |||||||||
| 0%–10.735% 2016–20432 | 246,093 | 258,496 | ||||||||||
| Other securities | 67,005 | 1.07 | ||||||||||
| 2,635,220 | 41.94 | |||||||||||
| 10 | U.S. Government Securities Fund |
| Principal amount (000) |
Value (000) |
Percent of net assets |
||||||||||
| U.S. Treasury bonds & notes 39.03% | ||||||||||||
| U.S. Treasury 30.74% | ||||||||||||
| 2.625% 2014 | $ | 110,445 | $ | 112,920 | ||||||||
| 0.25% 2015 | 65,700 | 65,533 | ||||||||||
| 0.25% 2015 | 56,400 | 56,296 | ||||||||||
| 11.25% 2015 | 90,530 | 104,865 | ||||||||||
| 0.25% 2016 | 46,150 | 45,621 | ||||||||||
| 1.50% 2016 | 122,675 | 125,234 | ||||||||||
| 1.50% 2016 | 76,675 | 78,307 | ||||||||||
| 2.125% 2016 | 58,100 | 60,308 | ||||||||||
| 2.375% 2016 | 40,200 | 41,999 | ||||||||||
| 4.625% 2016 | 49,450 | 55,241 | ||||||||||
| 5.125% 2016 | 42,775 | 47,858 | ||||||||||
| 2.75% 2017 | 94,175 | 99,729 | 30.74 | % | ||||||||
| 4.625% 2017 | 79,325 | 89,011 | ||||||||||
| 1.00% 2018 | 60,900 | 59,365 | ||||||||||
| 1.375% 2018 | 52,925 | 52,348 | ||||||||||
| 1.375% 2018 | 44,980 | 44,542 | ||||||||||
| 3.50% 2018 | 103,920 | 113,211 | ||||||||||
| 1.375% 2020 | 62,525 | 59,340 | ||||||||||
| 1.625% 2022 | 61,560 | 56,068 | ||||||||||
| 5.50% 2028 | 36,200 | 45,787 | ||||||||||
| 2.875% 2043 | 87,459 | 73,978 | ||||||||||
| 3.125% 2043 | 69,820 | 62,342 | ||||||||||
| 0.375%–8.875% 2014–2043 | 350,875 | 381,677 | ||||||||||
| 1,931,580 | 30.74 | |||||||||||
| U.S. Treasury inflation-protected securities3 8.29% | ||||||||||||
| 2.00% 2014 | 84,230 | 86,673 | ||||||||||
| 2.00% 2014 | 112,969 | 114,115 | ||||||||||
| 0.50% 2015 | 84,037 | 86,058 | ||||||||||
| 0.125% 2018 | 74,881 | 76,258 | 8.29 | |||||||||
| 0.625% 2043 | 105,617 | 84,618 | ||||||||||
| 0.125%–2.125% 2016–2041 | 71,568 | 72,843 | ||||||||||
| 520,565 | 8.29 | |||||||||||
| Total U.S. Treasury bonds & notes | 2,452,145 | 39.03 | ||||||||||
| Federal agency bonds & notes 12.32% | ||||||||||||
| Freddie Mac: | ||||||||||||
| 0.375% 2014 | 75,250 | 75,364 | ||||||||||
| 1.25% 2019 | 51,820 | 48,689 | 5.59 | |||||||||
| 1.00%–3.607% 2014–20461,2 | 232,834 | 226,820 | ||||||||||
| Federal Home Loan Bank: | ||||||||||||
| 0.375% 2015 | 61,000 | 60,893 | ||||||||||
| Series 2816, 1.00% 2017 | 43,705 | 43,275 | 1.96 | |||||||||
| 2.75%–3.625% 2013–2015 | 18,500 | 18,845 | ||||||||||
| Federal Farm Credit Banks: | ||||||||||||
| 1.625% 2014 | 33,225 | 33,783 | ||||||||||
| 0.60% 2017 | 74,292 | 72,476 | 1.69 | |||||||||
| Fannie Mae: | ||||||||||||
| 0.75% 2013 | 67,575 | 67,709 | ||||||||||
| 1.787%–7.125% 2014–20331,2 | 27,429 | 28,487 | 1.53 | |||||||||
| Other securities | 97,582 | 1.55 | ||||||||||
| 773,923 | 12.32 | |||||||||||
| U.S. Government Securities Fund | 11 |
| Bonds, notes & other debt instruments (continued) | Principal amount (000) |
Value (000) |
Percent of net assets |
|||||||||
| Asset-backed obligations 0.01% | ||||||||||||
| Other securities | $ | 342 | .01 | % | ||||||||
| Total bonds, notes & other debt instruments (cost: $5,889,694,000) | 5,861,630 | 93.30 | ||||||||||
| Short-term securities 21.61% | ||||||||||||
| Freddie Mac 0.085%–0.16% due 10/15/2013–4/25/2014 | $ | 532,800 | 532,587 | 8.48 | ||||||||
| Federal Home Loan Bank 0.08%–0.165% due 9/6/2013–7/1/2014 | 459,510 | 459,415 | 7.31 | |||||||||
| Fannie Mae 0.09%–0.12% due 11/18/2013–1/27/2014 | 80,385 | 80,373 | 1.28 | |||||||||
| Paccar Financial Corp. 0.04%–0.06% due 9/3–9/12/2013 | 50,900 | 50,899 | .81 | |||||||||
| John Deere Capital Corp. 0.06% due 9/9/20134 | 50,000 | 49,999 | .79 | |||||||||
| Wal-Mart Stores, Inc. 0.05% due 9/11/20134 | 47,500 | 47,499 | .76 | |||||||||
| U.S. Treasury Bills 0.031%–0.054% due 9/5–10/10/2013 | 39,200 | 39,199 | .62 | |||||||||
| NetJets Inc. 0.05% due 9/17/20134 | 38,200 | 38,199 | .61 | |||||||||
| Other securities | 59,699 | .95 | ||||||||||
| Total short-term securities (cost: $1,357,739,000) | 1,357,869 | 21.61 | ||||||||||
| Total investment securities (cost: $7,247,433,000) | 7,219,499 | 114.91 | ||||||||||
| Other assets less liabilities | (936,562 | ) | (14.91 | ) | ||||||||
| Net assets | $ | 6,282,937 | 100.00 | % | ||||||||
This summary investment portfolio is designed to streamline the report and help investors better focus on the fund’s principal holdings. See page 32 for details on how to obtain a complete schedule of portfolio holdings.
“Other securities” includes all issues that are not disclosed separately in the summary investment portfolio.
The following footnotes apply to either the individual securities noted or one or more of the securities aggregated and listed as a single line item.
| 1 | Principal payments may be made periodically. Therefore, the effective maturity date may be earlier than the stated maturity date. |
| 2 | Coupon rate may change periodically. |
| 3 | Index-linked bond whose principal amount moves with a government price index. |
| 4 | Acquired in a transaction exempt from registration under Rule 144A or section 4(2) of the Securities Act of 1933. May be resold in the U.S. in transactions exempt from registration, normally to qualified institutional buyers. The total value of all such securities, including those in “Other securities,” was $155,270,000, which represented 2.47% of the net assets of the fund. |
See Notes to Financial Statements
| 12 | U.S. Government Securities Fund |
| Statement of assets and liabilities | ||||||||
| at August 31, 2013 | (dollars in thousands) | |||||||
| Assets: | ||||||||
| Investment securities, at value (cost: $7,247,433) | $ | 7,219,499 | ||||||
| Cash | 102 | |||||||
| Receivables for: | ||||||||
| Sales of investments | $ | 684,684 | ||||||
| Sales of fund’s shares | 5,132 | |||||||
| Interest | 21,260 | 711,076 | ||||||
| 7,930,677 | ||||||||
| Liabilities: | ||||||||
| Payables for: | ||||||||
| Purchases of investments | 1,625,258 | |||||||
| Repurchases of fund’s shares | 16,576 | |||||||
| Dividends on fund’s shares | 511 | |||||||
| Investment advisory services | 1,106 | |||||||
| Services provided by related parties | 4,006 | |||||||
| Trustees’ deferred compensation | 220 | |||||||
| Other | 63 | 1,647,740 | ||||||
| Net assets at August 31, 2013 | $ | 6,282,937 | ||||||
| Net assets consist of: | ||||||||
| Capital paid in on shares of beneficial interest | $ | 6,375,781 | ||||||
| Distributions in excess of net investment income | (380 | ) | ||||||
| Accumulated net realized loss | (64,530 | ) | ||||||
| Net unrealized depreciation | (27,934 | ) | ||||||
| Net assets at August 31, 2013 | $ | 6,282,937 | ||||||
(dollars and shares in thousands, except per-share amounts)
Shares of beneficial interest issued and outstanding (no stated
par value) —
unlimited shares authorized (459,433 total shares outstanding)
| Net assets | Shares outstanding |
Net asset value per share |
||||||||||
| Class A | $ | 3,141,466 | 229,693 | $ | 13.68 | |||||||
| Class B | 60,466 | 4,424 | 13.67 | |||||||||
| Class C | 361,724 | 26,470 | 13.67 | |||||||||
| Class F-1 | 171,338 | 12,528 | 13.68 | |||||||||
| Class F-2 | 61,370 | 4,487 | 13.68 | |||||||||
| Class 529-A | 163,106 | 11,926 | 13.68 | |||||||||
| Class 529-B | 5,952 | 436 | 13.66 | |||||||||
| Class 529-C | 76,845 | 5,625 | 13.66 | |||||||||
| Class 529-E | 10,155 | 743 | 13.68 | |||||||||
| Class 529-F-1 | 11,134 | 814 | 13.68 | |||||||||
| Class R-1 | 15,476 | 1,132 | 13.67 | |||||||||
| Class R-2 | 173,807 | 12,718 | 13.67 | |||||||||
| Class R-3 | 167,520 | 12,249 | 13.68 | |||||||||
| Class R-4 | 133,655 | 9,772 | 13.68 | |||||||||
| Class R-5 | 132,505 | 9,688 | 13.68 | |||||||||
| Class R-6 | 1,596,418 | 116,728 | 13.68 | |||||||||
See Notes to Financial Statements
| U. S. Government Securities Fund | 13 |
| Statement of operations | ||||||||
| for the year ended August 31, 2013 | (dollars in thousands) | |||||||
| Investment income: | ||||||||
| Income: | ||||||||
| Interest | $ | 67,994 | ||||||
| Fees and expenses*: | ||||||||
| Investment advisory services | $ | 13,657 | ||||||
| Distribution services | 19,633 | |||||||
| Transfer agent services | 8,900 | |||||||
| Administrative services | 1,937 | |||||||
| Reports to shareholders | 357 | |||||||
| Registration statement and prospectus | 255 | |||||||
| Trustees’ compensation | 88 | |||||||
| Auditing and legal | 110 | |||||||
| Custodian | 17 | |||||||
| State and local taxes | 16 | |||||||
| Other | 370 | 45,340 | ||||||
| Net investment income | 22,654 | |||||||
| Net realized loss and unrealized depreciation on investments: | ||||||||
| Net realized loss on investments | (655 | ) | ||||||
| Net unrealized depreciation on investments | (259,367 | ) | ||||||
| Net realized loss and unrealized depreciation on investments | (260,022 | ) | ||||||
| Net decrease in net assets resulting from operations | $ | (237,368 | ) | |||||
*Additional information related to class-specific fees and expenses is included in the Notes to Financial Statements.
Statements of changes in net assets
(dollars in thousands)
| Year ended August 31 | ||||||||
| 2013 | 2012 | |||||||
| Operations: | ||||||||
| Net investment income | $ | 22,654 | $ | 52,185 | ||||
| Net realized (loss) gain on investments | (655 | ) | 270,246 | |||||
| Net unrealized depreciation on investments | (259,367 | ) | (23,312 | ) | ||||
| Net (decrease) increase in net assets resulting from operations | (237,368 | ) | 299,119 | |||||
| Dividends and distributions paid or accrued to shareholders: | ||||||||
| Dividends from net investment income | (57,650 | ) | (80,850 | ) | ||||
| Distributions from net realized gain on investments | (176,821 | ) | (150,544 | ) | ||||
| Total dividends and distributions paid or accrued to shareholders | (234,471 | ) | (231,394 | ) | ||||
| Net capital share transactions | (581,810 | ) | 669,723 | |||||
| Total (decrease) increase in net assets | (1,053,649 | ) | 737,448 | |||||
| Net assets: | ||||||||
| Beginning of year | 7,336,586 | 6,599,138 | ||||||
| End of year (including distributions in excess of net investment income of $(380) and undistributed net investment income of less than $1, respectively) | $ | 6,282,937 | $ | 7,336,586 | ||||
See Notes to Financial Statements
| 14 | U.S. Government Securities Fund |
Notes to financial statements
1. Organization
The American Funds Income Series (the “trust”) is registered under the Investment Company Act of 1940 as an open-end, diversified management investment company and has initially issued one series of shares, U.S. Government Securities Fund (the “fund”). The fund seeks a high level of current income, as well as preservation of capital, by investing primarily in securities guaranteed or sponsored by the United States government.
The fund has 16 share classes consisting of five retail share classes (Classes A, B and C, as well as two F share classes, F-1 and F-2), five 529 college savings plan share classes (Classes 529-A, 529-B, 529-C, 529-E and 529-F-1) and six retirement plan share classes (Classes R-1, R-2, R-3, R-4, R-5 and R-6). The 529 college savings plan share classes can be used to save for college education. The retirement plan share classes are generally offered only through eligible employer-sponsored retirement plans. The fund’s share classes are further described below:
| Share class | Initial sales charge | Contingent deferred sales charge upon redemption |
Conversion feature | ||||
| Classes A and 529-A | Up to 3.75% | None (except 1% for certain redemptions within one year of purchase without an initial sales charge) | None | ||||
| Classes B and 529-B* | None | Declines from 5% to 0% for redemptions within six years of purchase | Classes B and 529-B convert to Classes A and 529-A, respectively, after eight years | ||||
| Class C | None | 1% for redemptions within one year of purchase | Class C converts to Class F-1 after 10 years | ||||
| Class 529-C | None | 1% for redemptions within one year of purchase | None | ||||
| Class 529-E | None | None | None | ||||
| Classes F-1, F-2 and 529-F-1 | None | None | None | ||||
| Classes R-1, R-2, R-3, R-4, R-5 and R-6 | None | None | None |
* Class B and 529-B shares of the fund are not available for purchase.
Holders of all share classes have equal pro rata rights to assets, dividends and liquidation proceeds. Each share class has identical voting rights, except for the exclusive right to vote on matters affecting only its class. Share classes have different fees and expenses (“class-specific fees and expenses”), primarily due to different arrangements for distribution, administrative and shareholder services. Differences in class-specific fees and expenses will result in differences in net investment income and, therefore, the payment of different per-share dividends by each share class.
2. Significant accounting policies
The financial statements have been prepared to comply with accounting principles generally accepted in the United States of America. These principles require management to make estimates and assumptions that affect reported amounts and disclosures. Actual results could differ from those estimates. The fund follows the significant accounting policies described below, as well as the valuation policies described in the next section on valuation.
Security transactions and related investment income — Security transactions are recorded by the fund as of the date the trades are executed with brokers. Realized gains and losses from security transactions are determined based on the specific identified cost of the securities. In the event a security is purchased with a delayed payment date, the fund will segregate liquid assets sufficient to meet its payment obligations. Interest income is recognized on an accrual basis. Market discounts, premiums and original issue discounts on fixed-income securities are amortized daily over the expected life of the security.
| U. S. Government Securities Fund | 15 |
Class allocations — Income, fees and expenses (other than class-specific fees and expenses) are allocated daily among the various share classes based on the relative value of their settled shares. Realized and unrealized gains and losses are allocated daily among the various share classes based on their relative net assets. Class-specific fees and expenses, such as distribution, administrative and shareholder services, are charged directly to the respective share class.
Dividends and distributions to shareholders — Dividends to shareholders are declared daily after the determination of the fund’s net investment income and are paid to shareholders monthly. Distributions to shareholders are recorded on the ex-dividend date.
3. Valuation
Capital Research and Management Company (“CRMC”), the fund’s investment adviser, values the fund’s investments at fair value as defined by accounting principles generally accepted in the United States of America. The net asset value of each share class of the fund is generally determined as of approximately 4:00 p.m. New York time each day the New York Stock Exchange is open.
Methods and inputs — The fund’s investment adviser uses the following methods and inputs to establish the fair value of the fund’s assets and liabilities. Use of particular methods and inputs may vary over time based on availability and relevance as market and economic conditions evolve.
Fixed-income securities, including short-term securities purchased with more than 60 days left to maturity, are generally valued at prices obtained from one or more pricing vendors. Vendors value such securities based on one or more of the inputs described in the following table. The table provides examples of inputs that are commonly relevant for valuing particular classes of fixed-income securities in which the fund is authorized to invest. However, these classifications are not exclusive, and any of the inputs may be used to value any other class of fixed-income security.
| Fixed-income class | Examples of standard inputs | |
| All | Benchmark yields, transactions, bids, offers, quotations from dealers and trading systems, new issues, spreads and other relationships observed in the markets among comparable securities; and proprietary pricing models such as yield measures calculated using factors such as cash flows, financial or collateral performance and other reference data (collectively referred to as “standard inputs”) | |
| Bonds & notes of governments & government agencies | Standard inputs and interest rate volatilities | |
| Mortgage-backed; asset-backed obligations | Standard inputs and cash flows, prepayment information, default rates, delinquency and loss assumptions, collateral characteristics, credit enhancements and specific deal information |
When the fund’s investment adviser deems it appropriate to do so (such as when vendor prices are unavailable or not deemed to be representative), fixed-income securities will be valued in good faith at the mean quoted bid and ask prices that are reasonably and timely available (or bid prices, if ask prices are not available) or at prices for securities of comparable maturity, quality and type.
Short-term securities purchased within 60 days to maturity are valued at amortized cost, which approximates fair value. The value of short-term securities originally purchased with maturities greater than 60 days is determined based on an amortized value to par when they reach 60 days.
Securities and other assets for which representative market quotations are not readily available or are considered unreliable by the fund’s investment adviser are fair valued as determined in good faith under fair valuation guidelines adopted by authority of the fund’s board of trustees as further described below. The investment adviser follows fair valuation guidelines, consistent with U.S. Securities and Exchange Commission rules and guidance, to consider relevant principles and factors when making fair value determinations. The investment adviser considers relevant indications of value that are reasonably and timely available to it in determining the fair value to be assigned to a particular security, such as the type and cost of the security; contractual or legal restrictions on resale of the security; relevant financial or business developments of the issuer; actively traded similar or related securities; conversion or exchange rights on the security; related corporate actions; significant events occurring after the close of trading in the security; and changes in overall market conditions. Fair valuations and valuations of investments that are not actively trading involve judgment and may differ materially from valuations that would have been used had greater market activity occurred.
| 16 | U.S. Government Securities Fund |
Processes and structure — The fund’s board of trustees has delegated authority to the fund’s investment adviser to make fair value determinations, subject to board oversight. The investment adviser has established a Joint Fair Valuation Committee (the “Fair Valuation Committee”) to administer, implement and oversee the fair valuation process, and to make fair value decisions. The Fair Valuation Committee regularly reviews its own fair value decisions, as well as decisions made under its standing instructions to the investment adviser’s valuation teams. The Fair Valuation Committee reviews changes in fair value measurements from period to period and may, as deemed appropriate, update the fair valuation guidelines to better reflect the results of back testing and address new or evolving issues. The Fair Valuation Committee reports any changes to the fair valuation guidelines to the board of trustees with supplemental information to support the changes. The fund’s board and audit committee also regularly review reports that describe fair value determinations and methods.
The fund’s investment adviser has also established a Fixed-Income Pricing Review Group to administer and oversee the fixed-income valuation process, including the use of fixed-income pricing vendors. This group regularly reviews pricing vendor information and market data. Pricing decisions, processes and controls over security valuation are also subject to additional internal reviews, including an annual control self-evaluation program facilitated by the investment adviser’s compliance group.
Classifications —The fund’s investment adviser classifies the fund’s assets and liabilities into three levels based on the inputs used to value the assets or liabilities. Level 1 values are based on quoted prices in active markets for identical securities. Level 2 values are based on significant observable market inputs, such as quoted prices for similar securities and quoted prices in inactive markets. Level 3 values are based on significant unobservable inputs that reflect the investment adviser’s determination of assumptions that market participants might reasonably use in valuing the securities. The valuation levels are not necessarily an indication of the risk or liquidity associated with the underlying investment. For example, U.S. government securities are reflected as Level 2 because the inputs used to determine fair value may not always be quoted prices in an active market. At August 31, 2013, all of the fund’s investment securities were classified as Level 2.
4. Risk factors
Investing in the fund may involve certain risks including, but not limited to, those described below.
Market conditions — The prices of, and the income generated by, the securities held by the fund may decline due to market conditions and other factors, including those directly involving the issuers of securities held by the fund.
Investing in bonds — Rising interest rates will generally cause the prices of bonds and other debt securities to fall. Longer maturity debt securities may be subject to greater price fluctuations than shorter maturity debt securities.
Investing in securities backed by the U.S. government — Securities backed by the U.S. Treasury or the full faith and credit of the U.S. government are guaranteed only as to the timely payment of interest and principal when held to maturity. Accordingly, the current market values for these securities will fluctuate with changes in interest rates. Securities issued by government-sponsored entities and federal agencies and instrumentalities that are not backed by the full faith and credit of the U.S. government are neither issued nor guaranteed by the U.S. government.
Investing in mortgage-related securities — Mortgage-related securities are subject to prepayment risk as well as the risks associated with investing in debt securities in general. If interest rates fall and the loans underlying these securities are prepaid faster than expected, the fund may have to reinvest the prepaid principal in lower yielding securities, thus reducing the fund’s income. Conversely, if interest rates increase and the loans underlying the securities are prepaid more slowly than expected, the time in which the securities are expected to be paid off could be extended. This may reduce the fund’s cash for potential reinvestment in higher yielding securities.
Management — The investment adviser to the fund actively manages the fund’s investments. Consequently, the fund is subject to the risk that the methods and analyses employed by the investment adviser in this process may not produce the desired results. This could cause the fund to lose value or its investment results to lag relevant benchmarks or other funds with similar objectives.
| U.S. Government Securities Fund | 17 |
5. Certain investment techniques
Mortgage dollar rolls — The fund has entered into mortgage dollar roll transactions in which the fund sells a mortgage-backed security to a counterparty and simultaneously enters into an agreement with the same counterparty to buy back a similar security on a specific future date at a predetermined price. Mortgage dollar rolls are accounted for as purchase and sale transactions, which may increase the fund’s portfolio turnover rate.
6. Taxation and distributions
Federal income taxation — The fund complies with the requirements under Subchapter M of the Internal Revenue Code applicable to mutual funds and intends to distribute substantially all of its net taxable income and net capital gains each year. The fund is not subject to income taxes to the extent such distributions are made. Therefore, no federal income tax provision is required.
As of and during the period ended August 31, 2013, the fund did not have a liability for any unrecognized tax benefits. The fund recognizes interest and penalties, if any, related to unrecognized tax benefits as income tax expense in the statement of operations. During the period, the fund did not incur any interest or penalties.
The fund is not subject to examination by U.S. federal tax authorities for tax years before 2009 and by state tax authorities for tax years before 2008.
Distributions — Distributions paid to shareholders are based on net investment income and net realized gains determined on a tax basis, which may differ from net investment income and net realized gains for financial reporting purposes. These differences are due primarily to different treatment for items such as short-term capital gains and losses; capital losses related to sales of certain securities within 30 days of purchase; cost of investments sold; and paydowns on fixed-income securities. The fiscal year in which amounts are distributed may differ from the year in which the net investment income and net realized gains are recorded by the fund for financial reporting purposes. The fund may also designate a portion of the amount paid to redeeming shareholders as a distribution for tax purposes.
During the year ended August 31, 2013, the fund reclassified $34,623,000 from accumulated net realized loss to distributions in excess of net investment income; and $7,000 from distributions in excess of net investment income and $10,137,000 from accumulated net realized loss to capital paid in on shares of beneficial interest to align financial reporting with tax reporting.
As of August 31, 2013, the tax basis components of distributable earnings, unrealized appreciation (depreciation) and cost of investment securities were as follows (dollars in thousands):
| Undistributed ordinary income | $ | 476 | ||
| Undistributed long-term capital gains | 52,710 | |||
| Post-October capital loss deferral* | (102,560 | ) | ||
| Gross unrealized appreciation on investment securities | 33,910 | |||
| Gross unrealized depreciation on investment securities | (76,650 | ) | ||
| Net unrealized depreciation on investment securities | (42,740 | ) | ||
| Cost of investment securities | 7,262,239 |
*This deferral is considered incurred in the subsequent year.
| 18 | U.S. Government Securities Fund |
The tax character of distributions paid or accrued to shareholders was as follows (dollars in thousands):
| Year ended August 31, 2013 | Year ended August 31, 2012 | |||||||||||||||||||||||
| Share class | Ordinary income |
Long-term capital gains |
Total distributions paid or accrued |
Ordinary income |
Long-term capital gains |
Total distributions paid or accrued | ||||||||||||||||||
| Class A | $ | 89,191 | $ | 44,126 | $ | 133,317 | $ | 76,719 | $ | 64,018 | $ | 140,737 | ||||||||||||
| Class B | 1,437 | 1,013 | 2,450 | 1,562 | 2,193 | 3,755 | ||||||||||||||||||
| Class C | 7,578 | 5,459 | 13,037 | 5,543 | 8,088 | 13,631 | ||||||||||||||||||
| Class F-1 | 4,224 | 2,056 | 6,280 | 3,444 | 2,840 | 6,284 | ||||||||||||||||||
| Class F-2 | 1,691 | 758 | 2,449 | 1,279 | 964 | 2,243 | ||||||||||||||||||
| Class 529-A | 4,175 | 2,125 | 6,300 | 3,279 | 2,800 | 6,079 | ||||||||||||||||||
| Class 529-B | 129 | 94 | 223 | 123 | 192 | 315 | ||||||||||||||||||
| Class 529-C | 1,382 | 1,015 | 2,397 | 930 | 1,441 | 2,371 | ||||||||||||||||||
| Class 529-E | 234 | 134 | 368 | 168 | 165 | 333 | ||||||||||||||||||
| Class 529-F-1 | 289 | 134 | 423 | 222 | 165 | 387 | ||||||||||||||||||
| Class R-1 | 272 | 193 | 465 | 213 | 309 | 522 | ||||||||||||||||||
| Class R-2 | 3,284 | 2,302 | 5,586 | 2,383 | 3,415 | 5,798 | ||||||||||||||||||
| Class R-3 | 3,872 | 2,231 | 6,103 | 3,062 | 3,156 | 6,218 | ||||||||||||||||||
| Class R-4 | 3,672 | 1,777 | 5,449 | 3,624 | 2,988 | 6,612 | ||||||||||||||||||
| Class R-5 | 4,124 | 1,802 | 5,926 | 3,211 | 2,299 | 5,510 | ||||||||||||||||||
| Class R-6 | 31,337 | 12,361 | 43,698 | 18,376 | 12,223 | 30,599 | ||||||||||||||||||
| Total | $ | 156,891 | $ | 77,580 | $ | 234,471 | $ | 124,138 | $ | 107,256 | $ | 231,394 | ||||||||||||
7. Fees and transactions with related parties
CRMC, the fund’s investment adviser, is the parent company of American Funds Distributors,® Inc. (“AFD”), the principal underwriter of the fund’s shares, and American Funds Service Company® (“AFS”), the fund’s transfer agent. CRMC, AFD and AFS are considered related parties to the fund.
Investment advisory services — The fund has an investment advisory and service agreement with CRMC that provides for monthly fees accrued daily. These fees are based on a series of decreasing annual rates beginning with 0.300% on the first $60 million of daily net assets and decreasing to 0.140% on such assets in excess of $10 billion. The agreement also provides for monthly fees, accrued daily, based on a series of decreasing rates beginning with 3.00% on the first $3,333,333 of the fund’s monthly gross income and decreasing to 2.00% on such income in excess of $8,333,333. For the year ended August 31, 2013, the investment advisory services fee was $13,657,000, which was equivalent to an annualized rate of 0.194% of average daily net assets.
Class-specific fees and expenses — Expenses that are specific to individual share classes are accrued directly to the respective share class. The principal class-specific fees and expenses are described below:
Distribution services — The fund has plans of distribution for all share classes, except Class F-2, R-5 and R-6 shares. Under the plans, the board of trustees approves certain categories of expenses that are used to finance activities primarily intended to sell fund shares and service existing accounts. The plans provide for payments, based on an annualized percentage of average daily net assets, ranging from 0.30% to 1.00% as noted on the following page. In some cases, the board of trustees has limited the amounts that may be paid to less than the maximum allowed by the plans. All share classes with a plan may use up to 0.25% of average daily net assets to pay service fees, or to compensate AFD for paying service fees, to firms that have entered into agreements with AFD to provide certain shareholder services. The remaining amounts available to be paid under each plan are paid to dealers to compensate them for their sales activities.
For Class A and 529-A shares, distribution-related expenses include the reimbursement of dealer and wholesaler commissions paid by AFD for certain shares sold without a sales charge. These share classes reimburse AFD for amounts billed within the prior 15 months but only to the extent that the overall annual expense limit of 0.30% is not exceeded. As of August 31, 2013, there were no unreimbursed expenses subject to reimbursement for Class A or 529-A shares.
| U. S. Government Securities Fund | 19 |
| Share class | Currently approved limits | Plan limits | |||||||
| Class A | 0.30 | % | 0.30 | % | |||||
| Class 529-A | 0.30 | 0.50 | |||||||
| Classes B and 529-B | 1.00 | 1.00 | |||||||
| Classes C, 529-C and R-1 | 1.00 | 1.00 | |||||||
| Class R-2 | 0.75 | 1.00 | |||||||
| Classes 529-E and R-3 | 0.50 | 0.75 | |||||||
| Classes F-1, 529-F-1 and R-4 | 0.25 | 0.50 | |||||||
Transfer agent services — The fund has a shareholder services agreement with AFS under which the fund compensates AFS for providing transfer agent services to each of the fund’s share classes. These services include recordkeeping, shareholder communications and transaction processing. In addition, the fund reimburses AFS for amounts paid to third parties for performing transfer agent services on behalf of fund shareholders.
Administrative services — The fund has an administrative services agreement with CRMC under which the fund compensates CRMC for providing administrative services to Class A, C, F, 529 and R shares. These services include, but are not limited to, coordinating, monitoring, assisting and overseeing third parties that provide services to fund shareholders. Under the agreement, Class A shares pay an annual fee of 0.01% and Class C, F, 529 and R shares pay an annual fee of 0.05% of their respective average daily net assets.
529 plan services — Each 529 share class is subject to service fees to compensate the Commonwealth of Virginia for the maintenance of the 529 college savings plan. The quarterly fee is based on a series of decreasing annual rates beginning with 0.10% on the first $30 billion of the net assets invested in Class 529 shares of the American Funds and decreasing to 0.06% on such assets between $120 billion and $150 billion. The fee for any given calendar quarter is accrued and calculated on the basis of the average net assets of Class 529 shares of the American Funds for the last month of the prior calendar quarter. The fee is included in other expenses on the accompanying financial statements. The Commonwealth of Virginia is not considered a related party.
For the year ended August 31, 2013, class-specific expenses under the agreements were as follows (dollars in thousands):
| Share class | Distribution services |
Transfer agent services |
Administrative services |
529 plan services |
||||||||||||
| Class A | $9,048 | $5,982 | $386 | Not applicable | ||||||||||||
| Class B | 853 | 131 | Not applicable | Not applicable | ||||||||||||
| Class C | 4,698 | 711 | 236 | Not applicable | ||||||||||||
| Class F-1 | 477 | 210 | 95 | Not applicable | ||||||||||||
| Class F-2 | Not applicable | 80 | 34 | Not applicable | ||||||||||||
| Class 529-A | 423 | 229 | 96 | $189 | ||||||||||||
| Class 529-B | 80 | 11 | 4 | 8 | ||||||||||||
| Class 529-C | 908 | 115 | 46 | 90 | ||||||||||||
| Class 529-E | 59 | 11 | 6 | 12 | ||||||||||||
| Class 529-F-1 | — | 14 | 6 | 12 | ||||||||||||
| Class R-1 | 175 | 23 | 9 | Not applicable | ||||||||||||
| Class R-2 | 1,509 | 741 | 103 | Not applicable | ||||||||||||
| Class R-3 | 988 | 376 | 99 | Not applicable | ||||||||||||
| Class R-4 | 415 | 179 | 83 | Not applicable | ||||||||||||
| Class R-5 | Not applicable | 84 | 80 | Not applicable | ||||||||||||
| Class R-6 | Not applicable | 3 | 654 | Not applicable | ||||||||||||
| Total class-specific expenses | $19,633 | $8,900 | $1,937 | $311 | ||||||||||||
Trustees’ deferred compensation — Trustees who are unaffiliated with CRMC may elect to defer the cash payment of part or all of their compensation. These deferred amounts, which remain as liabilities of the fund, are treated as if invested in shares of the fund or other American Funds. These amounts represent general, unsecured liabilities of the fund and vary according to the total returns of the selected funds. Trustees’ compensation of $88,000, shown on the accompanying financial statements, includes $53,000 in current fees (either paid in cash or deferred) and a net increase of $35,000 in the value of the deferred amounts.
Affiliated officers and trustees — Officers and certain trustees of the fund are or may be considered to be affiliated with CRMC, AFD and AFS. No affiliated officers or trustees received any compensation directly from the fund.
| 20 | U.S. Government Securities Fund |
8. Capital share transactions
Capital share transactions in the fund were as follows (dollars and shares in thousands):
| Sales* | Reinvestments of dividends and distributions |
Repurchases* | Net (decrease) increase | |||||||||||||||||||||||||||||
| Share class | Amount | Shares | Amount | Shares | Amount | Shares | Amount | Shares | ||||||||||||||||||||||||
| Year ended August 31, 2013 | ||||||||||||||||||||||||||||||||
| Class A | $ | 667,177 | 46,607 | $ | 130,263 | 9,170 | $ | (1,643,270 | ) | (116,315 | ) | $ | (845,830 | ) | (60,538 | ) | ||||||||||||||||
| Class B | 4,884 | 339 | 2,390 | 168 | (50,942 | ) | (3,590 | ) | (43,668 | ) | (3,083 | ) | ||||||||||||||||||||
| Class C | 81,040 | 5,664 | 12,648 | 890 | (236,212 | ) | (16,728 | ) | (142,524 | ) | (10,174 | ) | ||||||||||||||||||||
| Class F-1 | 114,181 | 8,116 | 6,118 | 431 | (135,866 | ) | (9,679 | ) | (15,567 | ) | (1,132 | ) | ||||||||||||||||||||
| Class F-2 | 36,223 | 2,542 | 2,313 | 163 | (35,602 | ) | (2,531 | ) | 2,934 | 174 | ||||||||||||||||||||||
| Class 529-A | 31,673 | 2,220 | 6,284 | 442 | (63,969 | ) | (4,543 | ) | (26,012 | ) | (1,881 | ) | ||||||||||||||||||||
| Class 529-B | 659 | 46 | 223 | 16 | (4,721 | ) | (332 | ) | (3,839 | ) | (270 | ) | ||||||||||||||||||||
| Class 529-C | 14,433 | 1,014 | 2,393 | 168 | (33,984 | ) | (2,408 | ) | (17,158 | ) | (1,226 | ) | ||||||||||||||||||||
| Class 529-E | 2,130 | 150 | 367 | 26 | (4,262 | ) | (303 | ) | (1,765 | ) | (127 | ) | ||||||||||||||||||||
| Class 529-F-1 | 2,888 | 203 | 417 | 29 | (3,951 | ) | (279 | ) | (646 | ) | (47 | ) | ||||||||||||||||||||
| Class R-1 | 4,073 | 286 | 462 | 33 | (7,274 | ) | (513 | ) | (2,739 | ) | (194 | ) | ||||||||||||||||||||
| Class R-2 | 67,143 | 4,706 | 5,570 | 392 | (108,941 | ) | (7,684 | ) | (36,228 | ) | (2,586 | ) | ||||||||||||||||||||
| Class R-3 | 81,114 | 5,694 | 6,068 | 427 | (120,051 | ) | (8,479 | ) | (32,869 | ) | (2,358 | ) | ||||||||||||||||||||
| Class R-4 | 66,797 | 4,677 | 5,441 | 383 | (133,760 | ) | (9,378 | ) | (61,522 | ) | (4,318 | ) | ||||||||||||||||||||
| Class R-5 | 47,999 | 3,363 | 5,920 | 417 | (81,246 | ) | (5,748 | ) | (27,327 | ) | (1,968 | ) | ||||||||||||||||||||
| Class R-6 | 725,526 | 51,222 | 43,601 | 3,075 | (96,177 | ) | (6,773 | ) | 672,950 | 47,524 | ||||||||||||||||||||||
| Total net increase (decrease) | $ | 1,947,940 | 136,849 | $ | 230,478 | 16,230 | $ | (2,760,228 | ) | (195,283 | ) | $ | (581,810 | ) | (42,204 | ) | ||||||||||||||||
| Year ended August 31, 2012 | ||||||||||||||||||||||||||||||||
| Class A | $ | 1,329,048 | 91,421 | $ | 137,062 | 9,501 | $ | (1,174,376 | ) | (80,982 | ) | $ | 291,734 | 19,940 | ||||||||||||||||||
| Class B | 20,160 | 1,383 | 3,663 | 255 | (69,207 | ) | (4,769 | ) | (45,384 | ) | (3,131 | ) | ||||||||||||||||||||
| Class C | 179,685 | 12,366 | 13,109 | 910 | (158,492 | ) | (10,925 | ) | 34,302 | 2,351 | ||||||||||||||||||||||
| Class F-1 | 158,461 | 10,898 | 6,224 | 431 | (139,038 | ) | (9,559 | ) | 25,647 | 1,770 | ||||||||||||||||||||||
| Class F-2 | 36,512 | 2,513 | 2,050 | 142 | (27,163 | ) | (1,876 | ) | 11,399 | 779 | ||||||||||||||||||||||
| Class 529-A | 60,858 | 4,193 | 6,087 | 422 | (39,179 | ) | (2,697 | ) | 27,766 | 1,918 | ||||||||||||||||||||||
| Class 529-B | 2,283 | 157 | 315 | 22 | (6,252 | ) | (431 | ) | (3,654 | ) | (252 | ) | ||||||||||||||||||||
| Class 529-C | 28,866 | 1,989 | 2,378 | 165 | (22,107 | ) | (1,521 | ) | 9,137 | 633 | ||||||||||||||||||||||
| Class 529-E | 5,090 | 351 | 333 | 23 | (2,903 | ) | (200 | ) | 2,520 | 174 | ||||||||||||||||||||||
| Class 529-F-1 | 5,420 | 374 | 387 | 27 | (3,523 | ) | (243 | ) | 2,284 | 158 | ||||||||||||||||||||||
| Class R-1 | 8,392 | 577 | 521 | 36 | (6,993 | ) | (482 | ) | 1,920 | 131 | ||||||||||||||||||||||
| Class R-2 | 92,869 | 6,391 | 5,799 | 403 | (87,675 | ) | (6,044 | ) | 10,993 | 750 | ||||||||||||||||||||||
| Class R-3 | 101,016 | 6,953 | 6,214 | 431 | (87,056 | ) | (6,001 | ) | 20,174 | 1,383 | ||||||||||||||||||||||
| Class R-4 | 78,940 | 5,443 | 6,625 | 460 | (62,333 | ) | (4,297 | ) | 23,232 | 1,606 | ||||||||||||||||||||||
| Class R-5 | 90,978 | 6,255 | 5,521 | 382 | (54,981 | ) | (3,794 | ) | 41,518 | 2,843 | ||||||||||||||||||||||
| Class R-6 | 289,437 | 19,981 | 30,698 | 2,127 | (104,000 | ) | (7,151 | ) | 216,135 | 14,957 | ||||||||||||||||||||||
| Total net increase (decrease) | $ | 2,488,015 | 171,245 | $ | 226,986 | 15,737 | $ | (2,045,278 | ) | (140,972 | ) | $ | 669,723 | 46,010 | ||||||||||||||||||
* Includes exchanges between share classes of the fund.
9. Investment transactions
The fund made purchases and sales of investment securities, excluding short-term securities and U.S. government obligations, if any, of $25,278,041,000 and $26,251,746,000, respectively, during the year ended August 31, 2013.
| U.S. Government Securities Fund | 21 |
Financial highlights
| (Loss) income
investment operations1 |
Dividends and distributions |
||||||||||||||||||||||||||||||||||||||||||||||||
| Net asset value, beginning of period |
Net investment income (loss) |
Net (losses) gains on securities (both realized and unrealized) |
Total
from investment operations |
Dividends (from net investment income) |
Distributions (from capital gains) |
Total
dividends and distributions |
Net asset value, end of period |
Total return2,3 |
Net assets,
end of period (in millions) |
Ratio
of expenses to average net assets before reimbursements/ waivers |
Ratio
of expenses to average net assets after reimbursements/ waivers3 |
Ratio
of net income (loss) to average net assets3 |
|||||||||||||||||||||||||||||||||||||
| Class A: | |||||||||||||||||||||||||||||||||||||||||||||||||
| Year ended 8/31/2013 | $ | 14.63 | $ | .05 | $ | (.53 | ) | $ | (.48 | ) | $ | (.12 | ) | $ | (.35 | ) | $ | (.47 | ) | $ | 13.68 | (3.37 | )% | $ | 3,141 | .61 | % | .61 | % | .36 | % | ||||||||||||||||||
| Year ended 8/31/2012 | 14.48 | .12 | .52 | .64 | (.18 | ) | (.31 | ) | (.49 | ) | 14.63 | 4.50 | 4,245 | .60 | .60 | .82 | |||||||||||||||||||||||||||||||||
| Year ended 8/31/2011 | 14.76 | .28 | .23 | .51 | (.30 | ) | (.49 | ) | (.79 | ) | 14.48 | 3.73 | 3,915 | .61 | .61 | 1.92 | |||||||||||||||||||||||||||||||||
| Year ended 8/31/2010 | 14.11 | .38 | .70 | 1.08 | (.39 | ) | (.04 | ) | (.43 | ) | 14.76 | 7.81 | 4,891 | .62 | .62 | 2.66 | |||||||||||||||||||||||||||||||||
| Year ended 8/31/2009 | 13.56 | .42 | .57 | .99 | (.44 | ) | — | (.44 | ) | 14.11 | 7.43 | 4,745 | .64 | .63 | 3.05 | ||||||||||||||||||||||||||||||||||
| Class B: | |||||||||||||||||||||||||||||||||||||||||||||||||
| Year ended 8/31/2013 | 14.63 | (.06 | ) | (.53 | ) | (.59 | ) | (.02 | ) | (.35 | ) | (.37 | ) | 13.67 | (4.10 | ) | 60 | 1.35 | 1.35 | (.40 | ) | ||||||||||||||||||||||||||||
| Year ended 8/31/2012 | 14.48 | .01 | .52 | .53 | (.07 | ) | (.31 | ) | (.38 | ) | 14.63 | 3.73 | 110 | 1.35 | 1.35 | .10 | |||||||||||||||||||||||||||||||||
| Year ended 8/31/2011 | 14.76 | .17 | .23 | .40 | (.19 | ) | (.49 | ) | (.68 | ) | 14.48 | 2.95 | 154 | 1.37 | 1.37 | 1.16 | |||||||||||||||||||||||||||||||||
| Year ended 8/31/2010 | 14.11 | .27 | .70 | .97 | (.28 | ) | (.04 | ) | (.32 | ) | 14.76 | 7.00 | 267 | 1.38 | 1.38 | 1.92 | |||||||||||||||||||||||||||||||||
| Year ended 8/31/2009 | 13.56 | .32 | .57 | .89 | (.34 | ) | — | (.34 | ) | 14.11 | 6.64 | 356 | 1.39 | 1.38 | 2.31 | ||||||||||||||||||||||||||||||||||
| Class C: | |||||||||||||||||||||||||||||||||||||||||||||||||
| Year ended 8/31/2013 | 14.63 | (.06 | ) | (.53 | ) | (.59 | ) | (.02 | ) | (.35 | ) | (.37 | ) | 13.67 | (4.13 | ) | 362 | 1.40 | 1.40 | (.45 | ) | ||||||||||||||||||||||||||||
| Year ended 8/31/2012 | 14.48 | — | 4 | .52 | .52 | (.06 | ) | (.31 | ) | (.37 | ) | 14.63 | 3.68 | 536 | 1.40 | 1.40 | .02 | ||||||||||||||||||||||||||||||||
| Year ended 8/31/2011 | 14.76 | .16 | .23 | .39 | (.18 | ) | (.49 | ) | (.67 | ) | 14.48 | 2.90 | 497 | 1.42 | 1.42 | 1.12 | |||||||||||||||||||||||||||||||||
| Year ended 8/31/2010 | 14.11 | .26 | .70 | .96 | (.27 | ) | (.04 | ) | (.31 | ) | 14.76 | 6.95 | 669 | 1.43 | 1.43 | 1.85 | |||||||||||||||||||||||||||||||||
| Year ended 8/31/2009 | 13.56 | .31 | .57 | .88 | (.33 | ) | — | (.33 | ) | 14.11 | 6.59 | 686 | 1.43 | 1.42 | 2.24 | ||||||||||||||||||||||||||||||||||
| Class F-1: | |||||||||||||||||||||||||||||||||||||||||||||||||
| Year ended 8/31/2013 | 14.63 | .05 | (.53 | ) | (.48 | ) | (.12 | ) | (.35 | ) | (.47 | ) | 13.68 | (3.38 | ) | 171 | .62 | .62 | .35 | ||||||||||||||||||||||||||||||
| Year ended 8/31/2012 | 14.48 | .12 | .52 | .64 | (.18 | ) | (.31 | ) | (.49 | ) | 14.63 | 4.51 | 200 | .61 | .61 | .81 | |||||||||||||||||||||||||||||||||
| Year ended 8/31/2011 | 14.76 | .27 | .23 | .50 | (.29 | ) | (.49 | ) | (.78 | ) | 14.48 | 3.70 | 172 | .63 | .63 | 1.90 | |||||||||||||||||||||||||||||||||
| Year ended 8/31/2010 | 14.11 | .37 | .70 | 1.07 | (.38 | ) | (.04 | ) | (.42 | ) | 14.76 | 7.78 | 206 | .65 | .65 | 2.62 | |||||||||||||||||||||||||||||||||
| Year ended 8/31/2009 | 13.56 | .42 | .57 | .99 | (.44 | ) | — | (.44 | ) | 14.11 | 7.42 | 185 | .65 | .65 | 3.05 | ||||||||||||||||||||||||||||||||||
| Class F-2: | |||||||||||||||||||||||||||||||||||||||||||||||||
| Year ended 8/31/2013 | 14.63 | .08 | (.53 | ) | (.45 | ) | (.15 | ) | (.35 | ) | (.50 | ) | 13.68 | (3.15 | ) | 61 | .38 | .38 | .59 | ||||||||||||||||||||||||||||||
| Year ended 8/31/2012 | 14.48 | .15 | .52 | .67 | (.21 | ) | (.31 | ) | (.52 | ) | 14.63 | 4.76 | 63 | .37 | .37 | 1.04 | |||||||||||||||||||||||||||||||||
| Year ended 8/31/2011 | 14.76 | .31 | .23 | .54 | (.33 | ) | (.49 | ) | (.82 | ) | 14.48 | 3.96 | 51 | .38 | .38 | 2.13 | |||||||||||||||||||||||||||||||||
| Year ended 8/31/2010 | 14.11 | .41 | .70 | 1.11 | (.42 | ) | (.04 | ) | (.46 | ) | 14.76 | 8.06 | 66 | .39 | .39 | 2.86 | |||||||||||||||||||||||||||||||||
| Year ended 8/31/2009 | 13.56 | .46 | .57 | 1.03 | (.48 | ) | — | (.48 | ) | 14.11 | 7.67 | 57 | .41 | .41 | 3.24 | ||||||||||||||||||||||||||||||||||
| Class 529-A: | |||||||||||||||||||||||||||||||||||||||||||||||||
| Year ended 8/31/2013 | 14.63 | .04 | (.53 | ) | (.49 | ) | (.11 | ) | (.35 | ) | (.46 | ) | 13.68 | (3.46 | ) | 163 | .69 | .69 | .27 | ||||||||||||||||||||||||||||||
| Year ended 8/31/2012 | 14.48 | .11 | .52 | .63 | (.17 | ) | (.31 | ) | (.48 | ) | 14.63 | 4.42 | 202 | .69 | .69 | .72 | |||||||||||||||||||||||||||||||||
| Year ended 8/31/2011 | 14.76 | .27 | .23 | .50 | (.29 | ) | (.49 | ) | (.78 | ) | 14.48 | 3.64 | 172 | .69 | .69 | 1.84 | |||||||||||||||||||||||||||||||||
| Year ended 8/31/2010 | 14.11 | .37 | .70 | 1.07 | (.38 | ) | (.04 | ) | (.42 | ) | 14.76 | 7.73 | 175 | .70 | .70 | 2.57 | |||||||||||||||||||||||||||||||||
| Year ended 8/31/2009 | 13.56 | .42 | .57 | .99 | (.44 | ) | — | (.44 | ) | 14.11 | 7.37 | 145 | .70 | .69 | 2.99 | ||||||||||||||||||||||||||||||||||
| Class 529-B: | |||||||||||||||||||||||||||||||||||||||||||||||||
| Year ended 8/31/2013 | 14.63 | (.08 | ) | (.53 | ) | (.61 | ) | (.01 | ) | (.35 | ) | (.36 | ) | 13.66 | (4.23 | ) | 6 | 1.47 | 1.47 | (.52 | ) | ||||||||||||||||||||||||||||
| Year ended 8/31/2012 | 14.48 | (.01 | ) | .52 | .51 | (.05 | ) | (.31 | ) | (.36 | ) | 14.63 | 3.60 | 10 | 1.48 | 1.48 | (.03 | ) | |||||||||||||||||||||||||||||||
| Year ended 8/31/2011 | 14.76 | .15 | .23 | .38 | (.17 | ) | (.49 | ) | (.66 | ) | 14.48 | 2.83 | 14 | 1.48 | 1.48 | 1.04 | |||||||||||||||||||||||||||||||||
| Year ended 8/31/2010 | 14.11 | .25 | .70 | .95 | (.26 | ) | (.04 | ) | (.30 | ) | 14.76 | 6.87 | 23 | 1.50 | 1.50 | 1.79 | |||||||||||||||||||||||||||||||||
| Year ended 8/31/2009 | 13.56 | .30 | .57 | .87 | (.32 | ) | — | (.32 | ) | 14.11 | 6.51 | 25 | 1.51 | 1.50 | 2.19 | ||||||||||||||||||||||||||||||||||
| Class 529-C: | |||||||||||||||||||||||||||||||||||||||||||||||||
| Year ended 8/31/2013 | 14.63 | (.08 | ) | (.53 | ) | (.61 | ) | (.01 | ) | (.35 | ) | (.36 | ) | 13.66 | (4.23 | ) | 77 | 1.47 | 1.47 | (.51 | ) | ||||||||||||||||||||||||||||
| Year ended 8/31/2012 | 14.48 | (.01 | ) | .52 | .51 | (.05 | ) | (.31 | ) | (.36 | ) | 14.63 | 3.62 | 100 | 1.47 | 1.47 | (.05 | ) | |||||||||||||||||||||||||||||||
| Year ended 8/31/2011 | 14.76 | .15 | .23 | .38 | (.17 | ) | (.49 | ) | (.66 | ) | 14.48 | 2.83 | 90 | 1.48 | 1.48 | 1.06 | |||||||||||||||||||||||||||||||||
| Year ended 8/31/2010 | 14.11 | .25 | .70 | .95 | (.26 | ) | (.04 | ) | (.30 | ) | 14.76 | 6.87 | 95 | 1.49 | 1.49 | 1.78 | |||||||||||||||||||||||||||||||||
| Year ended 8/31/2009 | 13.56 | .31 | .57 | .88 | (.33 | ) | — | (.33 | ) | 14.11 | 6.52 | 78 | 1.50 | 1.49 | 2.19 | ||||||||||||||||||||||||||||||||||
| Class 529-E: | |||||||||||||||||||||||||||||||||||||||||||||||||
| Year ended 8/31/2013 | 14.63 | — | 4 | (.53 | ) | (.53 | ) | (.07 | ) | (.35 | ) | (.42 | ) | 13.68 | (3.69 | ) | 10 | .94 | .94 | .03 | |||||||||||||||||||||||||||||
| Year ended 8/31/2012 | 14.48 | .07 | .52 | .59 | (.13 | ) | (.31 | ) | (.44 | ) | 14.63 | 4.16 | 13 | .94 | .94 | .46 | |||||||||||||||||||||||||||||||||
| Year ended 8/31/2011 | 14.76 | .23 | .23 | .46 | (.25 | ) | (.49 | ) | (.74 | ) | 14.48 | 3.36 | 10 | .97 | .97 | 1.57 | |||||||||||||||||||||||||||||||||
| Year ended 8/31/2010 | 14.11 | .33 | .70 | 1.03 | (.34 | ) | (.04 | ) | (.38 | ) | 14.76 | 7.42 | 12 | .98 | .98 | 2.28 | |||||||||||||||||||||||||||||||||
| Year ended 8/31/2009 | 13.56 | .38 | .57 | .95 | (.40 | ) | — | (.40 | ) | 14.11 | 7.07 | 9 | .99 | .98 | 2.71 | ||||||||||||||||||||||||||||||||||
| 22 | U.S. Government Securities Fund |
| (Loss)
income investment operations1 |
Dividends and distributions |
||||||||||||||||||||||||||||||||||||||||||||||||
| Net
asset value, beginning of period |
Net investment income (loss) |
Net
(losses) gains on securities (both realized and unrealized) |
Total
from investment operations |
Dividends (from net investment income) |
Distributions (from capital gains) |
Total
dividends and distributions |
Net
asset value, end of period |
Total return3 |
Net
assets, end of period (in millions) |
Ratio
of expenses to average net assets before reimbursements/ waivers |
Ratio
of expenses to average net assets after reimbursements/ waivers3 |
Ratio
of net income (loss) to average net assets3 |
|||||||||||||||||||||||||||||||||||||
| Class 529-F-1: | |||||||||||||||||||||||||||||||||||||||||||||||||
| Year ended 8/31/2013 | $ | 14.63 | $ | .07 | $ | (.53 | ) | $ | (.46 | ) | $ | (.14 | ) | $ | (.35 | ) | $ | (.49 | ) | $ | 13.68 | (3.24 | )% | $ | 11 | .47 | % | .47 | % | .49 | % | ||||||||||||||||||
| Year ended 8/31/2012 | 14.48 | .14 | .52 | .66 | (.20 | ) | (.31 | ) | (.51 | ) | 14.63 | 4.65 | 13 | .47 | .47 | .94 | |||||||||||||||||||||||||||||||||
| Year ended 8/31/2011 | 14.76 | .30 | .23 | .53 | (.32 | ) | (.49 | ) | (.81 | ) | 14.48 | 3.87 | 10 | .48 | .48 | 2.06 | |||||||||||||||||||||||||||||||||
| Year ended 8/31/2010 | 14.11 | .40 | .70 | 1.10 | (.41 | ) | (.04 | ) | (.45 | ) | 14.76 | 7.95 | 12 | .49 | .49 | 2.78 | |||||||||||||||||||||||||||||||||
| Year ended 8/31/2009 | 13.56 | .45 | .57 | 1.02 | (.47 | ) | — | (.47 | ) | 14.11 | 7.59 | 9 | .50 | .49 | 3.21 | ||||||||||||||||||||||||||||||||||
| Class R-1: | |||||||||||||||||||||||||||||||||||||||||||||||||
| Year ended 8/31/2013 | 14.63 | (.06 | ) | (.53 | ) | (.59 | ) | (.02 | ) | (.35 | ) | (.37 | ) | 13.67 | (4.12 | ) | 16 | 1.38 | 1.38 | (.41 | ) | ||||||||||||||||||||||||||||
| Year ended 8/31/2012 | 14.48 | .01 | .52 | .53 | (.07 | ) | (.31 | ) | (.38 | ) | 14.63 | 3.70 | 19 | 1.38 | 1.38 | .04 | |||||||||||||||||||||||||||||||||
| Year ended 8/31/2011 | 14.76 | .16 | .23 | .39 | (.18 | ) | (.49 | ) | (.67 | ) | 14.48 | 2.91 | 17 | 1.41 | 1.41 | 1.13 | |||||||||||||||||||||||||||||||||
| Year ended 8/31/2010 | 14.11 | .26 | .70 | .96 | (.27 | ) | (.04 | ) | (.31 | ) | 14.76 | 6.94 | 21 | 1.44 | 1.44 | 1.81 | |||||||||||||||||||||||||||||||||
| Year ended 8/31/2009 | 13.56 | .31 | .57 | .88 | (.33 | ) | — | (.33 | ) | 14.11 | 6.57 | 14 | 1.45 | 1.45 | 2.24 | ||||||||||||||||||||||||||||||||||
| Class R-2: | |||||||||||||||||||||||||||||||||||||||||||||||||
| Year ended 8/31/2013 | 14.63 | (.06 | ) | (.53 | ) | (.59 | ) | (.02 | ) | (.35 | ) | (.37 | ) | 13.67 | (4.09 | ) | 174 | 1.35 | 1.35 | (.39 | ) | ||||||||||||||||||||||||||||
| Year ended 8/31/2012 | 14.48 | .01 | .52 | .53 | (.07 | ) | (.31 | ) | (.38 | ) | 14.63 | 3.71 | 224 | 1.37 | 1.37 | .05 | |||||||||||||||||||||||||||||||||
| Year ended 8/31/2011 | 14.76 | .16 | .23 | .39 | (.18 | ) | (.49 | ) | (.67 | ) | 14.48 | 2.91 | 211 | 1.41 | 1.40 | 1.13 | |||||||||||||||||||||||||||||||||
| Year ended 8/31/2010 | 14.11 | .26 | .70 | .96 | (.27 | ) | (.04 | ) | (.31 | ) | 14.76 | 6.95 | 241 | 1.45 | 1.43 | 1.85 | |||||||||||||||||||||||||||||||||
| Year ended 8/31/2009 | 13.56 | .31 | .57 | .88 | (.33 | ) | — | (.33 | ) | 14.11 | 6.58 | 204 | 1.49 | 1.44 | 2.26 | ||||||||||||||||||||||||||||||||||
| Class R-3: | |||||||||||||||||||||||||||||||||||||||||||||||||
| Year ended 8/31/2013 | 14.63 | — | 4 | (.53 | ) | (.53 | ) | (.07 | ) | (.35 | ) | (.42 | ) | 13.68 | (3.69 | ) | 168 | .94 | .94 | .02 | |||||||||||||||||||||||||||||
| Year ended 8/31/2012 | 14.48 | .07 | .52 | .59 | (.13 | ) | (.31 | ) | (.44 | ) | 14.63 | 4.14 | 214 | .95 | .95 | .47 | |||||||||||||||||||||||||||||||||
| Year ended 8/31/2011 | 14.76 | .22 | .23 | .45 | (.24 | ) | (.49 | ) | (.73 | ) | 14.48 | 3.34 | 191 | .98 | .98 | 1.55 | |||||||||||||||||||||||||||||||||
| Year ended 8/31/2010 | 14.11 | .32 | .70 | 1.02 | (.33 | ) | (.04 | ) | (.37 | ) | 14.76 | 7.39 | 201 | 1.01 | 1.01 | 2.26 | |||||||||||||||||||||||||||||||||
| Year ended 8/31/2009 | 13.56 | .37 | .57 | .94 | (.39 | ) | — | (.39 | ) | 14.11 | 7.02 | 174 | 1.03 | 1.02 | 2.68 | ||||||||||||||||||||||||||||||||||
| Class R-4: | |||||||||||||||||||||||||||||||||||||||||||||||||
| Year ended 8/31/2013 | 14.63 | .05 | (.53 | ) | (.48 | ) | (.12 | ) | (.35 | ) | (.47 | ) | 13.68 | (3.38 | ) | 134 | .61 | .61 | .34 | ||||||||||||||||||||||||||||||
| Year ended 8/31/2012 | 14.48 | .12 | .52 | .64 | (.18 | ) | (.31 | ) | (.49 | ) | 14.63 | 4.50 | 206 | .61 | .61 | .80 | |||||||||||||||||||||||||||||||||
| Year ended 8/31/2011 | 14.76 | .27 | .23 | .50 | (.29 | ) | (.49 | ) | (.78 | ) | 14.48 | 3.69 | 181 | .64 | .64 | 1.89 | |||||||||||||||||||||||||||||||||
| Year ended 8/31/2010 | 14.11 | .37 | .70 | 1.07 | (.38 | ) | (.04 | ) | (.42 | ) | 14.76 | 7.76 | 167 | .67 | .67 | 2.61 | |||||||||||||||||||||||||||||||||
| Year ended 8/31/2009 | 13.56 | .42 | .57 | .99 | (.44 | ) | — | (.44 | ) | 14.11 | 7.39 | 159 | .69 | .68 | 3.02 | ||||||||||||||||||||||||||||||||||
| Class R-5: | |||||||||||||||||||||||||||||||||||||||||||||||||
| Year ended 8/31/2013 | 14.63 | .09 | (.53 | ) | (.44 | ) | (.16 | ) | (.35 | ) | (.51 | ) | 13.68 | (3.08 | ) | 133 | .31 | .31 | .65 | ||||||||||||||||||||||||||||||
| Year ended 8/31/2012 | 14.48 | .16 | .52 | .68 | (.22 | ) | (.31 | ) | (.53 | ) | 14.63 | 4.80 | 170 | .32 | .32 | 1.09 | |||||||||||||||||||||||||||||||||
| Year ended 8/31/2011 | 14.76 | .31 | .23 | .54 | (.33 | ) | (.49 | ) | (.82 | ) | 14.48 | 4.01 | 128 | .34 | .34 | 2.19 | |||||||||||||||||||||||||||||||||
| Year ended 8/31/2010 | 14.11 | .41 | .70 | 1.11 | (.42 | ) | (.04 | ) | (.46 | ) | 14.76 | 8.09 | 134 | .36 | .36 | 2.86 | |||||||||||||||||||||||||||||||||
| Year ended 8/31/2009 | 13.56 | .46 | .57 | 1.03 | (.48 | ) | — | (.48 | ) | 14.11 | 7.71 | 51 | .38 | .37 | 3.37 | ||||||||||||||||||||||||||||||||||
| Class R-6: | |||||||||||||||||||||||||||||||||||||||||||||||||
| Year ended 8/31/2013 | 14.63 | .10 | (.53 | ) | (.43 | ) | (.17 | ) | (.35 | ) | (.52 | ) | 13.68 | (3.03 | ) | 1,596 | .26 | .26 | .72 | ||||||||||||||||||||||||||||||
| Year ended 8/31/2012 | 14.48 | .17 | .52 | .69 | (.23 | ) | (.31 | ) | (.54 | ) | 14.63 | 4.86 | 1,012 | .27 | .27 | 1.14 | |||||||||||||||||||||||||||||||||
| Year ended 8/31/2011 | 14.76 | .32 | .23 | .55 | (.34 | ) | (.49 | ) | (.83 | ) | 14.48 | 4.06 | 786 | .29 | .29 | 2.25 | |||||||||||||||||||||||||||||||||
| Year ended 8/31/2010 | 14.11 | .42 | .70 | 1.12 | (.43 | ) | (.04 | ) | (.47 | ) | 14.76 | 8.14 | 645 | .31 | .31 | 2.94 | |||||||||||||||||||||||||||||||||
| Period from 5/1/2009 to 8/31/20095 | 14.07 | .15 | .05 | .20 | (.16 | ) | — | (.16 | ) | 14.11 | 1.41 | 404 | .11 | .11 | 1.10 | ||||||||||||||||||||||||||||||||||
| Year ended August 31 | |||||
| 2013 | 2012 | 2011 | 2010 | 2009 | |
| Portfolio turnover rate for all share classes | 488% | 353% | 212% | 95% | 166% |
| 1 | Based on average shares outstanding. |
| 2 | Total returns exclude any applicable sales charges, including contingent deferred sales charges. |
| 3 | This column reflects the impact, if any, of certain reimbursements/waivers from CRMC. During one of the periods shown, CRMC reduced fees for investment advisory services. In addition, during some of the periods shown, CRMC paid a portion of the fund’s transfer agent fees for certain retirement plan share classes. |
| 4 | Amount less than $.01. |
| 5 | Based on operations for the period shown and, accordingly, is not representative of a full year. |
See Notes to Financial Statements
| U.S. Government Securities Fund | 23 |
Report of Independent Registered Public Accounting Firm
To the Shareholders and Board of Trustees of The American Funds Income Series – U.S. Government Securities Fund:
We have audited the accompanying statement of assets and liabilities of The American Funds Income Series – U.S. Government Securities Fund (the “Fund”), including the summary investment portfolio, as of August 31, 2013, and the related statement of operations for the year then ended, the statements of changes in net assets for each of the two years in the period then ended, and the financial highlights for each of the periods presented. These financial statements and financial highlights are the responsibility of the Fund’s management. Our responsibility is to express an opinion on these financial statements and financial highlights based on our audits.
We conducted our audits in accordance with the standards of the Public Company Accounting Oversight Board (United States). Those standards require that we plan and perform the audit to obtain reasonable assurance about whether the financial statements and financial highlights are free of material misstatement. The Fund is not required to have, nor were we engaged to perform, an audit of its internal control over financial reporting. Our audits included consideration of internal control over financial reporting as a basis for designing audit procedures that are appropriate in the circumstances, but not for the purpose of expressing an opinion on the effectiveness of the Fund’s internal control over financial reporting. Accordingly, we express no such opinion. An audit also includes examining, on a test basis, evidence supporting the amounts and disclosures in the financial statements, assessing the accounting principles used and significant estimates made by management, as well as evaluating the overall financial statement presentation. Our procedures included confirmation of securities owned as of August 31, 2013, by correspondence with the custodian and brokers; where replies were not received from brokers, we performed other auditing procedures. We believe that our audits provide a reasonable basis for our opinion.
In our opinion, such financial statements and financial highlights referred to above present fairly, in all material respects, the financial position of The American Funds Income Series – U.S. Government Securities Fund as of August 31, 2013, the results of its operations for the year then ended, the changes in its net assets for each of the two years in the period then ended, and the financial highlights for each of the periods presented, in conformity with accounting principles generally accepted in the United States of America.
Deloitte & Touche LLP
Costa Mesa, California
October 14, 2013
| 24 | U.S. Government Securities Fund |
| Expense example | unaudited |
As a fund shareholder, you incur two types of costs: (1) transaction costs, such as initial sales charges on purchase payments and contingent deferred sales charges on redemptions (loads), and (2) ongoing costs, including management fees, distribution and service (12b-1) fees, and other expenses. This example is intended to help you understand your ongoing costs (in dollars) of investing in the fund so you can compare these costs with the ongoing costs of investing in other mutual funds. The example is based on an investment of $1,000 invested at the beginning of the period and held for the entire six-month period (March 1, 2013, through August 31, 2013).
Actual expenses:
The first line of each share class in the table on the following page provides information about actual account values and actual expenses. You may use the information in this line, together with the amount you invested, to estimate the expenses that you paid over the period. Simply divide your account value by $1,000 (for example, an $8,600 account value divided by $1,000 = 8.6), then multiply the result by the number in the first line under the heading entitled “Expenses paid during period” to estimate the expenses you paid on your account during this period.
Hypothetical example for comparison purposes:
The second line of each share class in the table on the following page provides information about hypothetical account values and hypothetical expenses based on the actual expense ratio for the share class and an assumed rate of return of 5.00% per year before expenses, which is not the actual return of the share class. The hypothetical account values and expenses may not be used to estimate the actual ending account balance or expenses you paid for the period. You may use this information to compare the ongoing costs of investing in the fund and other funds. To do so, compare this 5.00% hypothetical example with the 5.00% hypothetical examples that appear in the shareholder reports of the other funds.
Notes:
There are some account fees that are charged to certain types of accounts, such as individual retirement accounts and 529 college savings plan accounts (generally, a $10 fee is charged to set up the account and an additional $10 fee is charged to the account annually), that would increase the amount of expenses paid on your account. In addition, retirement plan participants may be subject to certain fees charged by the plan sponsor, and Class F-1, F-2 and 529-F-1 shareholders may be subject to fees charged by financial intermediaries, typically ranging from 0.75% to 1.50% of assets annually depending on services offered. You can estimate the impact of these fees by adding the amount of the fees to the total estimated expenses you paid on your account during the period as calculated above. In addition, your ending account value would be lower by the amount of these fees.
Note that the expenses shown in the table on the following page are meant to highlight your ongoing costs only and do not reflect any transactional costs, such as sales charges (loads). Therefore, the second line of each share class in the table is useful in comparing ongoing costs only and will not help you determine the relative total costs of owning different funds. In addition, if these transactional costs were included, your costs would have been higher.
| U.S. Government Securities Fund | 25 |
| Beginning account value 3/1/2013 |
Ending account value 8/31/2013 |
Expenses
paid during period* |
Annualized expense ratio |
|||||||||||||
| Class A — actual return | $ | 1,000.00 | $ | 970.60 | $ | 2.98 | .60 | % | ||||||||
| Class A — assumed 5% return | 1,000.00 | 1,022.18 | 3.06 | .60 | ||||||||||||
| Class B — actual return | 1,000.00 | 967.35 | 6.74 | 1.36 | ||||||||||||
| Class B — assumed 5% return | 1,000.00 | 1,018.35 | 6.92 | 1.36 | ||||||||||||
| Class C — actual return | 1,000.00 | 967.18 | 6.99 | 1.41 | ||||||||||||
| Class C — assumed 5% return | 1,000.00 | 1,018.10 | 7.17 | 1.41 | ||||||||||||
| Class F-1 — actual return | 1,000.00 | 970.60 | 3.03 | .61 | ||||||||||||
| Class F-1 — assumed 5% return | 1,000.00 | 1,022.13 | 3.11 | .61 | ||||||||||||
| Class F-2 — actual return | 1,000.00 | 971.76 | 1.84 | .37 | ||||||||||||
| Class F-2 — assumed 5% return | 1,000.00 | 1,023.34 | 1.89 | .37 | ||||||||||||
| Class 529-A — actual return | 1,000.00 | 970.12 | 3.53 | .71 | ||||||||||||
| Class 529-A — assumed 5% return | 1,000.00 | 1,021.63 | 3.62 | .71 | ||||||||||||
| Class 529-B — actual return | 1,000.00 | 966.45 | 7.34 | 1.48 | ||||||||||||
| Class 529-B — assumed 5% return | 1,000.00 | 1,017.74 | 7.53 | 1.48 | ||||||||||||
| Class 529-C — actual return | 1,000.00 | 966.39 | 7.29 | 1.47 | ||||||||||||
| Class 529-C — assumed 5% return | 1,000.00 | 1,017.80 | 7.48 | 1.47 | ||||||||||||
| Class 529-E — actual return | 1,000.00 | 969.69 | 4.67 | .94 | ||||||||||||
| Class 529-E — assumed 5% return | 1,000.00 | 1,020.47 | 4.79 | .94 | ||||||||||||
| Class 529-F-1 — actual return | 1,000.00 | 971.23 | 2.38 | .48 | ||||||||||||
| Class 529-F-1 — assumed 5% return | 1,000.00 | 1,022.79 | 2.45 | .48 | ||||||||||||
| Class R-1 — actual return | 1,000.00 | 967.28 | 6.84 | 1.38 | ||||||||||||
| Class R-1 — assumed 5% return | 1,000.00 | 1,018.25 | 7.02 | 1.38 | ||||||||||||
| Class R-2 — actual return | 1,000.00 | 967.39 | 6.74 | 1.36 | ||||||||||||
| Class R-2 — assumed 5% return | 1,000.00 | 1,018.35 | 6.92 | 1.36 | ||||||||||||
| Class R-3 — actual return | 1,000.00 | 969.67 | 4.72 | .95 | ||||||||||||
| Class R-3 — assumed 5% return | 1,000.00 | 1,020.42 | 4.84 | .95 | ||||||||||||
| Class R-4 — actual return | 1,000.00 | 970.56 | 3.03 | .61 | ||||||||||||
| Class R-4 — assumed 5% return | 1,000.00 | 1,022.13 | 3.11 | .61 | ||||||||||||
| Class R-5 — actual return | 1,000.00 | 972.05 | 1.54 | .31 | ||||||||||||
| Class R-5 — assumed 5% return | 1,000.00 | 1,023.64 | 1.58 | .31 | ||||||||||||
| Class R-6 — actual return | 1,000.00 | 972.33 | 1.29 | .26 | ||||||||||||
| Class R-6 — assumed 5% return | 1,000.00 | 1,023.89 | 1.33 | .26 | ||||||||||||
| * | The “expenses paid during period” are equal to the “annualized expense ratio,” multiplied by the average account value over the period, multiplied by the number of days in the period,and divided by 365 (to reflect the one-half year period). |
| Tax information | unaudited |
We are required to advise you of the federal tax status of certain distributions received by shareholders during the fiscal year. The fund hereby designates the following amounts for the fund’s fiscal year ended August 31, 2013:
| Long-term capital gains | $ | 87,716,000 | ||
| U.S. government income that may be exempt from state taxation | $ | 17,976,000 |
Individual shareholders should refer to their Form 1099 or other tax information, which will be mailed in January 2014, to determine the calendar year amounts to be included on their 2013 tax returns. Shareholders should consult their tax advisors.
| 26 | U.S. Government Securities Fund |
Approval of Investment Advisory and Service Agreement
The fund’s board has approved the fund’s Investment Advisory and Service Agreement (the “agreement”) with Capital Research and Management Company (“CRMC”) for an additional one-year term through March 31, 2014. The board approved the agreement following the recommendation of the fund’s Contracts Committee (the “committee”), which is composed of all of the fund’s independent board members. The board and the committee determined that the fund’s advisory fee structure was fair and reasonable in relation to the services provided and that approving the agreement was in the best interests of the fund and its shareholders.
In reaching this decision, the board and the committee took into account information furnished to them throughout the year, as well as information prepared specifically in connection with their review of the agreement, and were advised by their independent counsel. They considered the following factors, among others, but did not identify any single issue or particular piece of information that, in isolation, was the controlling factor, and each board and committee member did not necessarily attribute the same weight to each factor.
1. Nature, extent and quality of services
The board and the committee considered the depth and quality of CRMC’s investment management process, including its global research capabilities; the experience, capability and integrity of its senior management and other personnel; the low turnover rates of its key personnel; the overall financial strength and stability of its organization; and the ongoing evolution of CRMC’s organizational structure designed to maintain and strengthen these qualities. The board and the committee also considered the nature, extent and quality of administrative, compliance and shareholder services provided by CRMC to the fund under the agreement and other agreements, as well as the benefits to fund shareholders from investing in a fund that is part of a large family of funds. The board and the committee concluded that the nature, extent and quality of the services provided by CRMC have benefited and should continue to benefit the fund and its shareholders.
2. Investment results
The board and the committee considered the investment results of the fund in light of its objective of providing a high level of current income consistent with prudent investment risk and preservation of capital. They compared the fund’s investment results with those of other relevant funds (including funds that form the basis of the Lipper index for the category in which the fund is included), and a relevant market index, over various periods through October 31, 2012. This report, including the letter to shareholders and related disclosures, contains certain information about the fund’s investment results. Among other things, the board and the committee reviewed the fund’s investment results measured against the Lipper General U.S. Government Funds Average and the Barclays U.S. Government/Mortgage-Backed Securities Index. They noted that the investment results of the fund were above the results of the Lipper average for the five-year, 10-year and lifetime periods (although below the results of the average for the 10-month, one-year and three-year periods), and were above the results of the Barclays index for the three-year period (although below the results of the index for all other periods considered). They also noted that the standard deviation of the fund’s returns, a measure of risk, was below the Lipper average for all periods. The board and the committee concluded that the fund’s investment results have been satisfactory and that CRMC’s record in managing the fund indicated that its continued management should benefit the fund and its shareholders.
3. Advisory fees and total expenses
The board and the committee compared the advisory fees and total expense levels of the fund to those of other relevant funds. They observed that the fund’s advisory fees and expenses were below the median fees and expenses of the other funds included in the Lipper General U.S. Government Funds category. The board and the committee also considered the breakpoint discounts in the fund’s advisory fee structure that reduce the level of fees charged by CRMC to the fund as fund assets increase. In addition, they reviewed information regarding the effective advisory fees charged to non–mutual fund clients by CRMC and its affiliates. They noted that, to the extent there were differences between the advisory fees paid by the fund and the advisory fees paid by those clients, the differences appropriately reflected the investment, operational and regulatory differences between advising the fund and the other clients. The board and the committee concluded that the fund’s cost structure was fair and reasonable in relation to the services provided, and that the fund’s shareholders receive reasonable value in return for the advisory fees and other amounts paid to CRMC by the fund.
| U.S. Government Securities Fund | 27 |
4. Ancillary benefits
The board and the committee considered a variety of other benefits that CRMC and its affiliates receive as a result of CRMC’s relationship with the fund and the other American Funds, including fees for administrative services provided to certain share classes; fees paid to CRMC’s affiliated transfer agent; sales charges and distribution fees received and retained by the fund’s principal underwriter, an affiliate of CRMC; and possible ancillary benefits to CRMC and its institutional management affiliates in managing other investment vehicles. The board and the committee reviewed CRMC’s portfolio trading practices, noting that while CRMC receives the benefit of research provided by broker-dealers executing portfolio transactions on behalf of the fund, it does not obtain third-party research or other services in return for allocating brokerage to such broker-dealers. The board and the committee took these ancillary benefits into account in evaluating the reasonableness of the advisory fees and other amounts paid to CRMC by the fund.
5. Adviser financial information
The board and the committee reviewed information regarding CRMC’s costs of providing services to the American Funds, including personnel, systems and resources of investment, compliance, trading, accounting and other administrative operations. They considered CRMC’s costs and willingness to invest in technology, infrastructure and staff to maintain and expand services and capabilities, respond to industry and regulatory developments, and attract and retain qualified personnel. They noted information regarding the compensation structure for CRMC’s investment professionals. The board and the committee also compared CRMC’s profitability and compensation data to the reported results and data of several large, publicly held investment management companies. The board and the committee noted the competitiveness and cyclicality of both the mutual fund industry and the capital markets, and the importance in that environment of CRMC’s long-term profitability for maintaining its independence, company culture and management continuity. They further considered the breakpoint discounts in the fund’s advisory fee structure. The board and the committee concluded that the fund’s advisory fee structure reflected a reasonable sharing of benefits between CRMC and the fund’s shareholders.
| 28 | U.S. Government Securities Fund |
Board of trustees and other officers
“Independent” trustees1
| Name and age | Year
first elected a trustee of the fund2 |
Principal occupation(s) during past five years | Number
of portfolios in fund complex3 overseen by trustee |
Other
directorships4 held by trustee | ||||
| William H. Baribault, 68 | 2010 | Chairman of the Board and CEO, Oakwood Enterprises (private investment and consulting) | 69 | None | ||||
| James G. Ellis, 66 | 2006 | Dean and Professor of Marketing, Marshall School of Business, University of Southern California | 69 | Quiksilver, Inc. | ||||
| Leonard R. Fuller, 67 | 1994 | President and CEO,Fuller Consulting (financial management consulting firm) | 69 | None | ||||
| W. Scott Hedrick, 68 | 2010 | Founding General Partner, InterWest Partners (venture capital firm) | 65 | Hot
Topic, Inc.; Office Depot, Inc. | ||||
| R.
Clark Hooper, 67 Chairman of the Board (Independent and Non-Executive) |
2005 | Private investor | 71 | JPMorgan Value Opportunities Fund, Inc.; The Swiss Helvetia Fund, Inc. | ||||
| Merit E. Janow, 55 | 2010 | Dean and Professor, Columbia University, School of International and Public Affairs; former Member, World Trade Organization Appellate Body (2003–2007) | 68 | The NASDAQ Stock Market LLC; Trimble Navigation Limited | ||||
| Laurel B. Mitchell, Ph.D., 58 | 2010 | Clinical Professor and Director, Accounting Program, University of Redlands | 65 | None | ||||
| Frank M. Sanchez, 70 | 1999 | Principal, The Sanchez Family Corporation dba McDonald’s Restaurants (McDonald’s licensee) | 65 | None | ||||
| Margaret Spellings, 55 | 2010 | President, George W. Bush Foundation; former President and CEO, Margaret Spellings & Company (public policy and strategic consulting); former President, U.S. Chamber Foundation and Senior Advisor to the President and CEO, U.S. Chamber of Commerce; former U.S. Secretary of Education, U.S. Department of Education | 69 | None | ||||
| Steadman Upham, Ph.D., 64 | 2007 | President and University Professor, The University of Tulsa | 68 | None |
“Interested” trustee5,6
| Name,
age and position with fund |
Year
first elected a trustee or officer of the fund2 |
Principal
occupation(s) during past five years and positions held with affiliated entities or the principal underwriter of the fund |
Number
of portfolios in fund complex3 overseen by trustee |
Other
directorships4 held by trustee | ||||
| John H. Smet, 57 | 1993 | Director, Capital Research and Management Company; Senior Vice President — Capital Fixed Income Investors, Capital Research and Management Company; Director, The Capital Group Companies, Inc.7 | 20 | None |
The fund’s statement of additional information includes further details about fund trustees and is available without charge upon request by calling American Funds Service Company at (800) 421-4225 or by visiting the American Funds website at americanfunds.com. The address for all trustees and officers of the fund is 333 South Hope Street, Los Angeles, CA 90071, Attention: Secretary.
See page 30 for footnotes.
| U.S. Government Securities Fund | 29 |
Other officers6
| Name, age and position with fund |
Year first elected an officer of the fund2 |
Principal
occupation(s) during past five years and positions held with affiliated entities or the principal underwriter of the fund | ||
| Thomas H. Høgh,
50 President |
2004 | Senior Vice President — Capital Fixed Income Investors, Capital Research Company7 | ||
| Kristine M. Nishiyama,
43 Senior Vice President |
2003 | Senior Vice President and Senior Counsel — Fund Business Management Group, Capital Research and Management Company; Senior Vice President and General Counsel, Capital Bank and Trust Company7 | ||
| Fergus N. MacDonald,
43 Vice President |
2011 | Senior Vice President — Capital Fixed Income Investors, Capital Research Company;7 Director, Capital International Research, Inc.7 | ||
| Wesley K.-S. Phoa,
47 Vice President |
2011 | Senior Vice President — Capital Fixed Income Investors, Capital Research Company;7 Senior Vice President, Capital International Research, Inc.;7 Vice President, Capital Strategy Research, Inc.;7 Senior Vice President — Capital Fixed Income Investors, Capital Bank and Trust Company7 | ||
| Courtney R. Taylor, 38 Secretary | 2006 | Assistant Vice President — Fund Business Management Group, Capital Research and Management Company | ||
| Karl C. Grauman, 45 Treasurer |
2012 | Vice President — Fund Business Management Group, Capital Research and Management Company | ||
| Steven I. Koszalka, 49 Assistant Secretary | 2010 | Vice President — Fund Business Management Group, Capital Research and Management Company | ||
| Dori Laskin, 62 Assistant Treasurer |
2010 | Vice President — Fund Business Management Group, Capital Research and Management Company | ||
| Ari M. Vinocor, 38 Assistant Treasurer |
2007 | Vice President — Fund Business Management Group, Capital Research and Management Company |
| 1 | The term “independent” trustee refers to a trustee who is not an “interested person” of the fund within the meaning of the Investment Company Act of 1940. |
| 2 | Trustees and officers of the fund serve until their resignation,removal or retirement. |
| 3 | Reflects funds managed by Capital Research and Management Company,including the American Funds; American Funds Insurance Series,® which serves as the underlying investment vehicle for certain variable insurance contracts; American Funds Target Date Retirement Series,® which is available through tax-favored retirement plans and IRAs; American Funds Portfolio Series;SM and American Funds College Target Date Series.SM |
| 4 | This includes all directorships (other than those in the American Funds or other funds managed by Capital Research and Management Company) that are held by each trustee as a trustee or director of a public company or a registered investment company. |
| 5 | “Interested persons” within the meaning of the Investment Company Act of 1940, on the basis of their affiliation with the fund’s investment adviser, Capital Research and Management Company, or affiliated entities (including the fund’s principal underwriter). |
| 6 | All of the officers listed are officers and/or directors/trustees of one or more of the other funds for which Capital Research and Management Company serves as investment adviser. |
| 7 | Company affiliated with Capital Research and Management Company. |
| 30 | U.S. Government Securities Fund |
Offices of the fund and of the investment adviser
Capital Research and Management Company
333 South Hope Street
Los Angeles, CA 90071-1406
6455 Irvine Center Drive
Irvine, CA 92618
Transfer agent for shareholder accounts
American Funds Service Company
(Write to the address near you.)
P.O. Box 6007
Indianapolis, IN 46206-6007
P.O. Box 2280
Norfolk, VA 23501-2280
Custodian of assets
JPMorgan Chase Bank
270 Park Avenue
New York, NY 10017-2070
Counsel
Bingham McCutchen LLP
355 South Grand Avenue, Suite 4400
Los Angeles, CA 90071-3106
Independent registered public accounting firm
Deloitte & Touche LLP
695 Town Center Drive
Suite 1200
Costa Mesa, CA 92626-7188
Principal underwriter
American Funds Distributors, Inc.
333 South Hope Street
Los Angeles, CA 90071-1406
| U.S. Government Securities Fund | 31 |
Investors should carefully consider investment objectives, risks, charges and expenses. This and other important information is contained in the fund prospectus and summary prospectus, which can be obtained from your financial professional and should be read carefully before investing. You may also call American Funds Service Company (AFS) at (800) 421-4225 or visit the American Funds website at americanfunds.com.
“American Funds Proxy Voting Procedures and Principles” — which describes how we vote proxies relating to portfolio securities — is available on the American Funds website or upon request by calling AFS. The fund files its proxy voting record with the U.S. Securities and Exchange Commission (SEC) for the 12 months ended June 30 by August 31. The proxy voting record is available free of charge on the SEC website at sec.gov and on the American Funds website.
A complete August 31, 2013, portfolio of U.S. Government Securities Fund’s investments is available free of charge by calling AFS or visiting the SEC website (where it is part of Form N-CSR).
U.S. Government Securities Fund files a complete list of its portfolio holdings with the SEC for the first and third quarters of each fiscal year on Form N-Q. This filing is available free of charge on the SEC website. You may also review or, for a fee, copy this filing at the SEC’s Public Reference Room in Washington, D.C. Additional information regarding the operation of the Public Reference Room may be obtained by calling the SEC’s Office of Investor Education and Advocacy at (800) SEC-0330. Additionally, the list of portfolio holdings is available by calling AFS.
This report is for the information of shareholders of U.S. Government Securities Fund, but it also may be used as sales literature when preceded or accompanied by the current prospectus or summary prospectus, which gives details about charges, expenses, investment objectives and operating policies of the fund. If used as sales material after December 31, 2013, this report must be accompanied by an American Funds statistical update for the most recently completed calendar quarter.
| 32 | U.S. Government Securities Fund |
The American Funds Advantage
Since 1931, American Funds, part of Capital Group, has helped investors pursue long-term investment success. Our consistent approach — in combination with The Capital SystemSM — has resulted in a superior long-term track record.
| Aligned with investor success | ||
| We base our decisions on a long-term perspective, which we believe aligns our goals with the interests of our clients. Our portfolio managers average 25 years of investment experience, including 20 years at our company, reflecting a career commitment to our long-term approach.1 | ||
| The Capital SystemSM | ||
| Our investment process, The Capital System, combines individual accountability with teamwork. Each fund is divided into portions that are managed independently by investment professionals with diverse backgrounds, ages and investment approaches. An extensive global research effort is the backbone of our system. | ||
| Superior long-term track record | ||
| Our equity funds have beaten their Lipper peer indexes in 90% of 10-year periods and 96% of 20-year periods. Our fixed-income funds have beaten their Lipper indexes in 58% of 10-year periods and 63% of 20-year periods.2 Our fund management fees have been among the lowest in the industry.3 | ||
| 1 | Portfolio manager experience as of December 31, 2012. | |
| 2 | Based on Class A share results for periods through December 31, 2012. Periods covered are the shorter of the fund’s lifetime or since the comparable Lipper index inception date. | |
| 3 | Based on management fees for the 20-year period ended December 31, 2012, versus comparable Lipper categories, excluding funds of funds. | |

ITEM 2 – Code of Ethics
The Registrant has adopted a Code of Ethics that applies to its Principal Executive Officer and Principal Financial Officer. The Registrant undertakes to provide to any person without charge, upon request, a copy of the Code of Ethics. Such request can be made to American Funds Service Company at 800/421-9225 or to the Secretary of the Registrant, 333 South Hope Street, Los Angeles, California 90071.
ITEM 3 – Audit Committee Financial Expert
The Registrant’s board has determined that Laurel B. Mitchell, a member of the Registrant’s audit committee, is an “audit committee financial expert” and "independent," as such terms are defined in this Item. This designation will not increase the designee’s duties, obligations or liability as compared to his or her duties, obligations and liability as a member of the audit committee and of the board, nor will it reduce the responsibility of the other audit committee members. There may be other individuals who, through education or experience, would qualify as "audit committee financial experts" if the board had designated them as such. Most importantly, the board believes each member of the audit committee contributes significantly to the effective oversight of the Registrant’s financial statements and condition.
ITEM 4 – Principal Accountant Fees and Services
| Registrant: | ||||
| a) Audit Fees: | ||||
| 2012 | $94,000 | |||
| 2013 | $95,000 | |||
| b) Audit-Related Fees: | ||||
| 2012 | $2,000 | |||
| 2013 | $2,000 | |||
| The audit-related fees consist of assurance and related services relating to the examination of the Registrant’s investment adviser conducted in accordance with Statement on Standards for Attestation Engagements Number 16 issued by the American Institute of Certified Public Accountants. | ||||
| c) Tax Fees: | ||||
| 2012 | $7,000 | |||
| 2013 | $7,000 | |||
| The tax fees consist of professional services relating to the preparation of the Registrant’s tax returns. | ||||
| d) All Other Fees: | ||||
| 2012 | None | |||
| 2013 | None | |||
| Adviser and affiliates (includes only fees for non-audit services billed to the adviser and affiliates for engagements that relate directly to the operations and financial reporting of the Registrant and were subject to the pre-approval policies described below): | ||||
| a) Audit Fees: | ||||
| Not Applicable | ||||
| b) Audit-Related Fees: | ||||
| 2012 | $1,151,000 | |||
| 2013 | $1,011,000 | |||
| The audit-related fees consist of assurance and related services relating to the examination of the Registrant’s transfer agent, principal underwriter and investment adviser conducted in accordance with Statement on Standards for Attestation Engagements Number 16 issued by the American Institute of Certified Public Accountants. | ||||
| c) Tax Fees: | ||||
| 2012 | $39,000 | |||
| 2013 | $28,000 | |||
| The tax fees consist of consulting services relating to the Registrant’s investments. | ||||
| d) All Other Fees: | ||||
| 2012 | $2,000 | |||
| 2013 | $2,000 | |||
| The other fees consist of subscription services related to an accounting research tool. | ||||
All audit and permissible non-audit services that the Registrant’s audit committee considers compatible with maintaining the independent registered public accounting firm’s independence are required to be pre-approved by the committee. The pre-approval requirement will extend to all non-audit services provided to the Registrant, the investment adviser, and any entity controlling, controlled by, or under common control with the investment adviser that provides ongoing services to the Registrant, if the engagement relates directly to the operations and financial reporting of the Registrant. The committee will not delegate its responsibility to pre-approve these services to the investment adviser. The committee may delegate to one or more committee members the authority to review and pre-approve audit and permissible non-audit services. Actions taken under any such delegation will be reported to the full committee at its next meeting. The pre-approval requirement is waived with respect to non-audit services if certain conditions are met. The pre-approval requirement was not waived for any of the non-audit services listed above provided to the Registrant, adviser and affiliates.
Aggregate non-audit fees paid to the Registrant’s auditors, including fees for all services billed to the Registrant, adviser and affiliates that provide ongoing services to the Registrant, were $1,704,000 for fiscal year 2012 and $1,449,000 for fiscal year 2013. The non-audit services represented by these amounts were brought to the attention of the committee and considered to be compatible with maintaining the auditors’ independence.
ITEM 5 – Audit Committee of Listed Registrants
Not applicable to this Registrant, insofar as the Registrant is not a listed issuer as defined in Rule 10A-3 under the Securities Exchange Act of 1934.
ITEM 6 – Schedule of Investments
 |
The American Funds Income Series® Investment portfolio August 31, 2013 |
| Bonds, notes & other debt instruments 93.30% | ||
| Principal amount | Value | |
| Federal agency mortgage-backed obligations1 41.94% | (000) | (000) |
| Fannie Mae 3.417% 20172 | $ 4,029 | $ 4,263 |
| Fannie Mae 10.50% 2018 | 463 | 518 |
| Fannie Mae 5.50% 2023 | 10,717 | 11,540 |
| Fannie Mae 6.00% 2024 | 969 | 1,063 |
| Fannie Mae 3.50% 2025 | 1,910 | 1,999 |
| Fannie Mae 3.50% 2025 | 444 | 464 |
| Fannie Mae 10.618% 20252 | 732 | 815 |
| Fannie Mae 6.00% 2026 | 57 | 63 |
| Fannie Mae 2.50% 2027 | 18,204 | 18,063 |
| Fannie Mae 2.50% 2027 | 4,838 | 4,799 |
| Fannie Mae 2.50% 2027 | 2,300 | 2,281 |
| Fannie Mae 2.50% 2027 | 1,953 | 1,938 |
| Fannie Mae 2.50% 2027 | 1,319 | 1,308 |
| Fannie Mae 6.50% 2027 | 1,907 | 2,104 |
| Fannie Mae 6.50% 2027 | 1,720 | 1,897 |
| Fannie Mae 2.50% 2028 | 12,487 | 12,381 |
| Fannie Mae 2.50% 2028 | 2,984 | 2,959 |
| Fannie Mae 4.50% 2028 | 7,240 | 7,658 |
| Fannie Mae 5.00% 2028 | 1,074 | 1,154 |
| Fannie Mae 6.00% 2028 | 2,020 | 2,215 |
| Fannie Mae 6.00% 2028 | 1,127 | 1,237 |
| Fannie Mae 6.00% 2028 | 193 | 212 |
| Fannie Mae 8.00% 2031 | 1,027 | 1,206 |
| Fannie Mae 2.582% 20332 | 924 | 976 |
| Fannie Mae 2.50% 20352 | 474 | 499 |
| Fannie Mae 2.767% 20362 | 1,641 | 1,757 |
| Fannie Mae 5.50% 2036 | 53 | 57 |
| Fannie Mae 2.586% 20372 | 653 | 694 |
| Fannie Mae 6.00% 2037 | 1,846 | 2,021 |
| Fannie Mae 6.00% 2037 | 458 | 502 |
| Fannie Mae 6.00% 2037 | 296 | 324 |
| Fannie Mae 6.50% 2037 | 920 | 995 |
| Fannie Mae 6.50% 2037 | 767 | 830 |
| Fannie Mae 6.50% 2037 | 348 | 376 |
| Fannie Mae 7.00% 2037 | 1,027 | 1,155 |
| Fannie Mae 7.00% 2037 | 565 | 635 |
| Fannie Mae 7.00% 2037 | 26 | 29 |
| Fannie Mae 7.50% 2037 | 140 | 159 |
| Fannie Mae 2.596% 20382 | 3,301 | 3,505 |
| Fannie Mae 3.00% 2038 | 13,291 | 12,819 |
| Fannie Mae 3.00% 2038 | 8,981 | 8,662 |
| Fannie Mae 5.50% 2038 | 13,436 | 14,602 |
| Fannie Mae 6.00% 2038 | 766 | 814 |
| Fannie Mae 6.00% 2038 | 719 | 787 |
| Fannie Mae 7.00% 2038 | 1,968 | 2,211 |
| Bonds, notes & other debt instruments | ||
| Principal amount | Value | |
| Federal agency mortgage-backed obligations1 (continued) | (000) | (000) |
| Fannie Mae 6.00% 2039 | $ 35,402 | $ 38,732 |
| Fannie Mae 3.246% 20402 | 8,240 | 8,697 |
| Fannie Mae 3.552% 20402 | 970 | 1,027 |
| Fannie Mae 4.00% 2040 | 28,903 | 29,870 |
| Fannie Mae 4.00% 2040 | 14,139 | 14,607 |
| Fannie Mae 4.00% 2040 | 10,001 | 10,337 |
| Fannie Mae 4.195% 20402 | 2,645 | 2,786 |
| Fannie Mae 4.406% 20402 | 4,650 | 4,921 |
| Fannie Mae 4.50% 2040 | 35,168 | 37,195 |
| Fannie Mae 4.50% 2040 | 1,697 | 1,798 |
| Fannie Mae 5.00% 2040 | 24,307 | 26,317 |
| Fannie Mae 5.00% 2040 | 1,152 | 1,263 |
| Fannie Mae 3.226% 20412 | 6,982 | 7,283 |
| Fannie Mae 3.439% 20412 | 3,769 | 3,932 |
| Fannie Mae 3.528% 20412 | 5,271 | 5,468 |
| Fannie Mae 3.774% 20412 | 6,174 | 6,570 |
| Fannie Mae 4.00% 2041 | 33,796 | 34,930 |
| Fannie Mae 4.00% 2041 | 26,736 | 27,633 |
| Fannie Mae 4.00% 2041 | 13,277 | 13,768 |
| Fannie Mae 4.00% 2041 | 13,003 | 13,497 |
| Fannie Mae 4.00% 2041 | 11,506 | 11,875 |
| Fannie Mae 4.50% 2041 | 51,250 | 54,212 |
| Fannie Mae 4.50% 2041 | 32,190 | 34,070 |
| Fannie Mae 4.50% 2041 | 12,064 | 12,772 |
| Fannie Mae 4.50% 2041 | 9,398 | 9,969 |
| Fannie Mae 4.50% 2041 | 5,294 | 5,610 |
| Fannie Mae 5.00% 2041 | 3,400 | 3,734 |
| Fannie Mae 5.00% 2041 | 2,618 | 2,874 |
| Fannie Mae 5.00% 2041 | 1,694 | 1,860 |
| Fannie Mae 5.00% 2041 | 1,157 | 1,270 |
| Fannie Mae 5.00% 2041 | 1,087 | 1,194 |
| Fannie Mae 5.00% 2041 | 908 | 996 |
| Fannie Mae 2.951% 20422 | 5,620 | 5,670 |
| Fannie Mae 3.50% 2042 | 37,582 | 37,544 |
| Fannie Mae 3.50% 2042 | 15,533 | 15,517 |
| Fannie Mae 3.50% 2042 | 14,756 | 14,736 |
| Fannie Mae 3.50% 2042 | 13,847 | 13,831 |
| Fannie Mae 3.50% 2042 | 9,563 | 9,598 |
| Fannie Mae 3.50% 2042 | 8,985 | 9,018 |
| Fannie Mae 3.50% 2042 | 7,530 | 7,532 |
| Fannie Mae 3.50% 2042 | 7,306 | 7,298 |
| Fannie Mae 3.50% 2042 | 1,341 | 1,323 |
| Fannie Mae 3.50% 2042 | 759 | 749 |
| Fannie Mae 3.50% 2042 | 185 | 183 |
| Fannie Mae 3.50% 2042 | 23 | 22 |
| Fannie Mae 4.00% 2042 | 55,135 | 57,006 |
| Fannie Mae 2.515% 20432 | 4,415 | 4,321 |
| Fannie Mae 3.00% 2043 | 177,877 | 170,150 |
| Fannie Mae 3.00% 2043 | 11,455 | 10,973 |
| Fannie Mae 3.00% 2043 | 8,959 | 8,467 |
| Fannie Mae 3.00% 2043 | 4,238 | 4,060 |
| Fannie Mae 3.00% 2043 | 3,954 | 3,737 |
| Fannie Mae 3.50% 2043 | 318,550 | 317,803 |
| Fannie Mae 3.50% 2043 | 34,849 | 34,814 |
| Bonds, notes & other debt instruments | ||
| Principal amount | Value | |
| Federal agency mortgage-backed obligations1 (continued) | (000) | (000) |
| Fannie Mae 3.50% 2043 | $ 26,305 | $ 26,278 |
| Fannie Mae 3.50% 2043 | 22,789 | 22,766 |
| Fannie Mae 3.50% 2043 | 19,573 | 19,554 |
| Fannie Mae 3.50% 2043 | 5,821 | 5,732 |
| Fannie Mae 3.50% 2043 | 2,178 | 2,148 |
| Fannie Mae 3.50% 2043 | 1,276 | 1,259 |
| Fannie Mae 3.50% 2043 | 708 | 698 |
| Fannie Mae 3.50% 2043 | 630 | 621 |
| Fannie Mae 3.50% 2043 | 611 | 602 |
| Fannie Mae 3.50% 2043 | 523 | 516 |
| Fannie Mae 3.50% 2043 | 432 | 426 |
| Fannie Mae 3.50% 2043 | 104 | 102 |
| Fannie Mae 4.00% 2043 | 255,867 | 263,183 |
| Fannie Mae 4.00% 2043 | 20,610 | 21,260 |
| Fannie Mae 4.00% 2043 | 15,897 | 16,433 |
| Fannie Mae 4.50% 2043 | 14,870 | 15,692 |
| Fannie Mae 5.00% 2043 | 37,605 | 40,425 |
| Fannie Mae 5.50% 2043 | 30,871 | 33,529 |
| Fannie Mae 6.00% 2043 | 10,730 | 11,746 |
| Fannie Mae 6.587% 20472 | 1,265 | 1,359 |
| Fannie Mae, Series 2001-4, Class NA, 10.851% 20252 | 238 | 264 |
| Fannie Mae, Series 2001-25, Class ZA, 6.50% 2031 | 515 | 568 |
| Fannie Mae, Series 2001-20, Class E, 9.569% 20312 | 25 | 29 |
| Fannie Mae, Series 2005-29, Class AK, 4.50% 2035 | 2,832 | 2,872 |
| Fannie Mae, Series 2005-68, Class PG, 5.50% 2035 | 7,403 | 8,148 |
| Fannie Mae, Series 2006-83, Class AO, principal only, 0% 2036 | 2,355 | 2,121 |
| Fannie Mae, Series 2006-56, Class OG, principal only, 0% 2036 | 1,849 | 1,677 |
| Fannie Mae, Series 2006-65, Class PF, 0.464% 20362 | 2,298 | 2,300 |
| Fannie Mae, Series 2006-49, Class PA, 6.00% 2036 | 360 | 399 |
| Fannie Mae, Series 2007-33, Class HE, 5.50% 2037 | 2,758 | 2,989 |
| Fannie Mae, Series 2007-40, Class PT, 5.50% 2037 | 1,415 | 1,562 |
| Fannie Mae, Series 1999-T2, Class A-1, 7.50% 20392 | 486 | 548 |
| Government National Mortgage Assn. 10.00% 2019 | 257 | 294 |
| Government National Mortgage Assn. 10.00% 2021 | 107 | 121 |
| Government National Mortgage Assn. 3.00% 2026 | 24,448 | 25,022 |
| Government National Mortgage Assn. 2.50% 2027 | 1,596 | 1,582 |
| Government National Mortgage Assn. 2.50% 2027 | 1,587 | 1,576 |
| Government National Mortgage Assn. 3.00% 2027 | 7,056 | 7,230 |
| Government National Mortgage Assn. 3.00% 2027 | 6,483 | 6,636 |
| Government National Mortgage Assn. 2.50% 2028 | 30,830 | 30,660 |
| Government National Mortgage Assn. 2.50% 2028 | 12,883 | 12,771 |
| Government National Mortgage Assn. 2.50% 2028 | 8,030 | 7,976 |
| Government National Mortgage Assn. 2.50% 2028 | 7,998 | 7,944 |
| Government National Mortgage Assn. 2.50% 2028 | 7,988 | 7,919 |
| Government National Mortgage Assn. 2.50% 2028 | 7,695 | 7,643 |
| Government National Mortgage Assn. 2.50% 2028 | 2,423 | 2,411 |
| Government National Mortgage Assn. 2.50% 2028 | 2,370 | 2,349 |
| Government National Mortgage Assn. 6.50% 2029 | 1,107 | 1,248 |
| Government National Mortgage Assn. 6.50% 2032 | 1,204 | 1,354 |
| Government National Mortgage Assn. 6.50% 2037 | 721 | 810 |
| Government National Mortgage Assn. 5.50% 2038 | 1,680 | 1,832 |
| Government National Mortgage Assn. 5.50% 2038 | 164 | 174 |
| Government National Mortgage Assn. 6.00% 2038 | 1,593 | 1,756 |
| Government National Mortgage Assn. 6.50% 2038 | 837 | 935 |
| Bonds, notes & other debt instruments | ||
| Principal amount | Value | |
| Federal agency mortgage-backed obligations1 (continued) | (000) | (000) |
| Government National Mortgage Assn. 6.50% 2038 | $ 753 | $ 850 |
| Government National Mortgage Assn. 6.50% 2038 | 678 | 763 |
| Government National Mortgage Assn. 6.50% 2038 | 504 | 569 |
| Government National Mortgage Assn. 3.50% 20392 | 4,657 | 4,930 |
| Government National Mortgage Assn. 4.00% 2039 | 1,087 | 1,134 |
| Government National Mortgage Assn. 5.00% 2039 | 3,911 | 4,231 |
| Government National Mortgage Assn. 6.00% 2039 | 9,901 | 10,894 |
| Government National Mortgage Assn. 6.50% 2039 | 1,092 | 1,266 |
| Government National Mortgage Assn. 4.50% 2040 | 2,835 | 3,028 |
| Government National Mortgage Assn. 5.00% 2040 | 2,944 | 3,206 |
| Government National Mortgage Assn. 5.00% 2040 | 1,085 | 1,181 |
| Government National Mortgage Assn. 5.50% 2040 | 13,302 | 14,805 |
| Government National Mortgage Assn. 3.50% 2041 | 1,411 | 1,405 |
| Government National Mortgage Assn. 4.00% 2041 | 366 | 370 |
| Government National Mortgage Assn. 4.50% 2041 | 35,682 | 38,099 |
| Government National Mortgage Assn. 4.50% 2041 | 13,942 | 14,825 |
| Government National Mortgage Assn. 5.00% 2041 | 21,177 | 22,934 |
| Government National Mortgage Assn. 5.00% 2041 | 330 | 346 |
| Government National Mortgage Assn. 5.50% 2041 | 1,110 | 1,172 |
| Government National Mortgage Assn. 5.50% 2041 | 549 | 580 |
| Government National Mortgage Assn. 5.50% 2041 | 357 | 378 |
| Government National Mortgage Assn. 6.00% 2041 | 211 | 226 |
| Government National Mortgage Assn. 6.50% 2041 | 8,330 | 9,062 |
| Government National Mortgage Assn. 3.50% 2042 | 1,080 | 1,075 |
| Government National Mortgage Assn. 4.00% 2042 | 6,356 | 6,549 |
| Government National Mortgage Assn. 4.00% 2042 | 3,423 | 3,528 |
| Government National Mortgage Assn. 3.50% 2043 | 7,866 | 7,946 |
| Government National Mortgage Assn. 3.50% 2043 | 4,951 | 5,002 |
| Government National Mortgage Assn. 4.00% 2043 | 36,509 | 38,004 |
| Government National Mortgage Assn. 4.50% 2043 | 35,000 | 37,220 |
| Government National Mortgage Assn. 5.922% 2058 | 13,735 | 14,913 |
| Government National Mortgage Assn. 6.172% 2058 | 260 | 282 |
| Government National Mortgage Assn. 6.22% 2058 | 4,255 | 4,557 |
| Government National Mortgage Assn., Series 2003-116, Class JD, 5.00% 2032 | 4,592 | 4,788 |
| Government National Mortgage Assn., Series 2003-46, 5.00% 2033 | 6,584 | 7,129 |
| Government National Mortgage Assn., Series 2003, 6.116% 2058 | 3,333 | 3,622 |
| Freddie Mac 10.00% 2025 | 327 | 363 |
| Freddie Mac 6.00% 2026 | 1,818 | 1,993 |
| Freddie Mac 6.00% 2027 | 3,884 | 4,246 |
| Freddie Mac 4.50% 2029 | 2,154 | 2,290 |
| Freddie Mac 4.50% 2029 | 280 | 296 |
| Freddie Mac 4.50% 2029 | 153 | 162 |
| Freddie Mac 4.50% 2030 | 295 | 312 |
| Freddie Mac 5.50% 2033 | 160 | 174 |
| Freddie Mac 2.476% 20352 | 2,923 | 3,085 |
| Freddie Mac 4.50% 2035 | 629 | 662 |
| Freddie Mac 4.50% 2036 | 3,662 | 3,855 |
| Freddie Mac 5.135% 20362 | 1,940 | 2,038 |
| Freddie Mac 2.181% 20372 | 386 | 407 |
| Freddie Mac 5.50% 2037 | 158 | 170 |
| Freddie Mac 5.50% 2037 | 117 | 126 |
| Freddie Mac 6.50% 2037 | 649 | 703 |
| Freddie Mac 6.50% 2037 | 66 | 71 |
| Freddie Mac 4.852% 20382 | 1,166 | 1,234 |
| Bonds, notes & other debt instruments | ||
| Principal amount | Value | |
| Federal agency mortgage-backed obligations1 (continued) | (000) | (000) |
| Freddie Mac 5.50% 2038 | $39,019 | $42,130 |
| Freddie Mac 5.50% 2038 | 23,880 | 25,730 |
| Freddie Mac 5.50% 2038 | 15,268 | 16,451 |
| Freddie Mac 5.50% 2038 | 11,549 | 12,443 |
| Freddie Mac 5.50% 2038 | 537 | 578 |
| Freddie Mac 5.50% 2038 | 402 | 433 |
| Freddie Mac 5.50% 2038 | 195 | 210 |
| Freddie Mac 4.50% 2039 | 3,542 | 3,724 |
| Freddie Mac 4.50% 2039 | 2,744 | 2,886 |
| Freddie Mac 4.50% 2039 | 1,684 | 1,770 |
| Freddie Mac 4.50% 2039 | 176 | 185 |
| Freddie Mac 4.50% 2039 | 97 | 102 |
| Freddie Mac 5.50% 2039 | 15,839 | 17,066 |
| Freddie Mac 5.50% 2039 | 1,413 | 1,522 |
| Freddie Mac 4.50% 2040 | 7,995 | 8,416 |
| Freddie Mac 4.50% 2040 | 4,196 | 4,416 |
| Freddie Mac 4.50% 2040 | 2,701 | 2,840 |
| Freddie Mac 4.50% 2040 | 321 | 340 |
| Freddie Mac 5.50% 2040 | 7,508 | 8,110 |
| Freddie Mac 3.233% 20412 | 5,902 | 6,157 |
| Freddie Mac 3.404% 20412 | 6,867 | 7,150 |
| Freddie Mac 4.50% 2041 | 8,279 | 8,727 |
| Freddie Mac 4.50% 2041 | 6,588 | 6,945 |
| Freddie Mac 4.50% 2041 | 3,444 | 3,631 |
| Freddie Mac 4.50% 2041 | 2,782 | 2,933 |
| Freddie Mac 4.50% 2041 | 2,103 | 2,217 |
| Freddie Mac 4.50% 2041 | 910 | 959 |
| Freddie Mac 4.50% 2041 | 645 | 680 |
| Freddie Mac 4.50% 2041 | 546 | 574 |
| Freddie Mac 4.50% 2041 | 204 | 215 |
| Freddie Mac 4.50% 2041 | 181 | 190 |
| Freddie Mac 4.50% 2041 | 12 | 12 |
| Freddie Mac 4.50% 2041 | 11 | 11 |
| Freddie Mac 5.00% 2041 | 8,191 | 8,951 |
| Freddie Mac 2.563% 20422 | 7,138 | 7,029 |
| Freddie Mac 2.584% 20422 | 3,241 | 3,278 |
| Freddie Mac 3.50% 2042 | 991 | 978 |
| Freddie Mac 4.50% 2042 | 23,556 | 24,760 |
| Freddie Mac 2.134% 20432 | 3,305 | 3,348 |
| Freddie Mac 2.355% 20432 | 13,246 | 12,861 |
| Freddie Mac 2.444% 20432 | 5,226 | 5,112 |
| Freddie Mac 3.50% 2043 | 57,000 | 56,706 |
| Freddie Mac 3.50% 2043 | 667 | 658 |
| Freddie Mac 3.50% 2043 | 480 | 474 |
| Freddie Mac 3.50% 2043 | 451 | 445 |
| Freddie Mac, Series 2356, Class GD, 6.00% 2016 | 766 | 808 |
| Freddie Mac, Series 2289, Class NA, 10.735% 20202 | 110 | 117 |
| Freddie Mac, Series 2289, Class NB, 10.301% 20222 | 47 | 52 |
| Freddie Mac, Series 1567, Class A, 0.584% 20232 | 21 | 21 |
| Freddie Mac, Series 2626, Class NG, 3.50% 2023 | 126 | 131 |
| Freddie Mac, Series 1617, Class PM, 6.50% 2023 | 525 | 582 |
| Freddie Mac, Series 2153, Class GG, 6.00% 2029 | 958 | 1,054 |
| Freddie Mac, Series 3061, Class PN, 5.50% 2035 | 1,180 | 1,288 |
| Freddie Mac, Series 3156, Class PO, principal only, 0% 2036 | 3,197 | 2,945 |
| Bonds, notes & other debt instruments | ||
| Principal amount | Value | |
| Federal agency mortgage-backed obligations1 (continued) | (000) | (000) |
| Freddie Mac, Series 3146, Class PO, principal only, 0% 2036 | $ 1,451 | $ 1,328 |
| Freddie Mac, Series 3213, Class OG, principal only, 0% 2036 | 1,229 | 1,106 |
| Freddie Mac, Series 3156, Class PF, 0.434% 20362 | 3,796 | 3,792 |
| Freddie Mac, Series 3257, Class PA, 5.50% 2036 | 1,969 | 2,142 |
| Freddie Mac, Series 3233, Class PA, 6.00% 2036 | 2,479 | 2,729 |
| Freddie Mac, Series 3272, Class PA, 6.00% 2037 | 2,459 | 2,697 |
| Vendee Mortgage Trust, Series 2011-2, Class V, 3.75% 2028 | 14,592 | 15,196 |
| Vendee Mortgage Trust, Series 2008-1, Class GD, 5.25% 2032 | 20,686 | 23,209 |
| Vendee Mortgage Trust, Series 2011-2, Class DA, 3.75% 2033 | 16,769 | 17,547 |
| Vendee Mortgage Trust, Series 2010-1, Class DA, 4.25% 2035 | 6,322 | 6,527 |
| National Credit Union Administration, Series 2010-R2, Class 1A, 0.556% 20172 | 852 | 855 |
| National Credit Union Administration, Series 2011-R3, Class 1A, 0.585% 20202 | 1,765 | 1,772 |
| National Credit Union Administration, Series 2011-R1, Class 1A, 0.636% 20202 | 1,019 | 1,026 |
| FDIC Structured Sale Guaranteed Notes, Series 2010-S1, Class 1-A, 0.732% 20482,3 | 871 | 873 |
| 2,635,220 | ||
| U.S. Treasury bonds & notes 39.03% | ||
| U.S. Treasury 30.74% | ||
| U.S. Treasury 2.375% 2014 | 15,000 | 15,354 |
| U.S. Treasury 2.625% 2014 | 110,445 | 112,920 |
| U.S. Treasury 0.25% 2015 | 65,700 | 65,533 |
| U.S. Treasury 0.25% 2015 | 56,400 | 56,296 |
| U.S. Treasury 0.375% 2015 | 7,200 | 7,197 |
| U.S. Treasury 1.875% 2015 | 22,870 | 23,492 |
| U.S. Treasury 4.00% 2015 | 22,300 | 23,499 |
| U.S. Treasury 11.25% 2015 | 90,530 | 104,865 |
| U.S. Treasury 0.25% 2016 | 46,150 | 45,621 |
| U.S. Treasury 0.625% 2016 | 8,000 | 7,965 |
| U.S. Treasury 1.50% 2016 | 122,675 | 125,234 |
| U.S. Treasury 1.50% 2016 | 76,675 | 78,307 |
| U.S. Treasury 2.125% 2016 | 58,100 | 60,308 |
| U.S. Treasury 2.375% 2016 | 40,200 | 41,999 |
| U.S. Treasury 4.50% 2016 | 14,950 | 16,369 |
| U.S. Treasury 4.625% 2016 | 49,450 | 55,241 |
| U.S. Treasury 5.125% 2016 | 42,775 | 47,858 |
| U.S. Treasury 7.50% 2016 | 24,675 | 29,809 |
| U.S. Treasury 0.75% 2017 | 24,840 | 24,444 |
| U.S. Treasury 2.75% 2017 | 94,175 | 99,729 |
| U.S. Treasury 3.25% 2017 | 30,280 | 32,620 |
| U.S. Treasury 4.625% 2017 | 79,325 | 89,011 |
| U.S. Treasury 8.875% 2017 | 23,250 | 30,142 |
| U.S. Treasury 0.75% 2018 | 7,300 | 7,068 |
| U.S. Treasury 1.00% 2018 | 60,900 | 59,365 |
| U.S. Treasury 1.375% 2018 | 52,925 | 52,348 |
| U.S. Treasury 1.375% 2018 | 44,980 | 44,542 |
| U.S. Treasury 1.50% 2018 | 9,000 | 8,944 |
| U.S. Treasury 3.50% 2018 | 103,920 | 113,211 |
| U.S. Treasury 1.125% 2020 | 3,000 | 2,813 |
| U.S. Treasury 1.375% 2020 | 62,525 | 59,340 |
| U.S. Treasury 2.00% 2020 | 100 | 99 |
| U.S. Treasury 8.75% 2020 | 10,510 | 15,014 |
| U.S. Treasury 8.00% 2021 | 7,900 | 11,180 |
| U.S. Treasury 1.625% 2022 | 61,560 | 56,068 |
| U.S. Treasury 1.75% 2023 | 5,425 | 4,948 |
| U.S. Treasury 2.50% 2023 | 30,275 | 29,544 |
| Bonds, notes & other debt instruments | ||
| Principal amount | Value | |
| U.S. Treasury bonds & notes — U.S. Treasury (continued) | (000) | (000) |
| U.S. Treasury 6.00% 2026 | $ 8,000 | $ 10,458 |
| U.S. Treasury 6.50% 2026 | 5,500 | 7,526 |
| U.S. Treasury 5.50% 2028 | 36,200 | 45,787 |
| U.S. Treasury 6.25% 2030 | 10,500 | 14,428 |
| U.S. Treasury 3.875% 2040 | 34,900 | 36,222 |
| U.S. Treasury 2.75% 2042 | 13,600 | 11,215 |
| U.S. Treasury 2.875% 2043 | 87,459 | 73,978 |
| U.S. Treasury 3.125% 2043 | 69,820 | 62,342 |
| U.S. Treasury 3.625% 2043 | 11,500 | 11,327 |
| 1,931,580 | ||
| U.S. Treasury inflation-protected securities4 8.29% | ||
| U.S. Treasury Inflation-Protected Security 2.00% 2014 | 84,230 | 86,673 |
| U.S. Treasury Inflation-Protected Security 2.00% 2014 | 112,969 | 114,115 |
| U.S. Treasury Inflation-Protected Security 0.50% 2015 | 84,037 | 86,058 |
| U.S. Treasury Inflation-Protected Security 0.125% 2016 | 12,799 | 13,116 |
| U.S. Treasury Inflation-Protected Security 0.125% 2018 | 74,881 | 76,258 |
| U.S. Treasury Inflation-Protected Security 0.125% 2022 | 15,372 | 14,803 |
| U.S. Treasury Inflation-Protected Security 0.375% 2023 | 12,566 | 12,212 |
| U.S. Treasury Inflation-Protected Security 0.125% 2023 | 14,971 | 14,235 |
| U.S. Treasury Inflation-Protected Security 2.125% 2041 | 15,860 | 18,477 |
| U.S. Treasury Inflation-Protected Security 0.625% 2043 | 105,617 | 84,618 |
| 520,565 | ||
| Total U.S. Treasury bonds & notes | 2,452,145 | |
| Federal agency bonds & notes 12.32% | ||
| Freddie Mac 0.375% 2014 | 75,250 | 75,364 |
| Freddie Mac 1.75% 2015 | 33,375 | 34,227 |
| Freddie Mac 1.00% 2017 | 18,525 | 18,307 |
| Freddie Mac 1.25% 2019 | 51,820 | 48,689 |
| Freddie Mac 1.375% 2020 | 20,475 | 19,097 |
| Freddie Mac, Series K003, Class A2, multifamily 3.607% 20141 | 4,855 | 4,885 |
| Freddie Mac, Series K501, Class A1, multifamily 1.337% 20161 | 3,957 | 3,970 |
| Freddie Mac, Series K705, Class A2, multifamily 2.303% 20181 | 2,112 | 2,118 |
| Freddie Mac, Series K706, Class A2, multifamily 2.323% 20181 | 3,300 | 3,308 |
| Freddie Mac, Series K704, Class A2, multifamily 2.412% 20181 | 3,225 | 3,253 |
| Freddie Mac, Series K711, Class A2, multifamily 1.73% 20191 | 4,425 | 4,235 |
| Freddie Mac, Series K712, Class A2, multifamily 1.869% 20191 | 3,250 | 3,097 |
| Freddie Mac, Series K710, Class A2, multifamily 1.883% 20191 | 2,480 | 2,409 |
| Freddie Mac, Series K709, Class A2, multifamily 2.086% 20191 | 1,870 | 1,842 |
| Freddie Mac, Series K015, Class A1, multifamily 2.257% 20201 | 3,294 | 3,331 |
| Freddie Mac, Series K009, Class A1, multifamily 2.757% 20201 | 1,766 | 1,826 |
| Freddie Mac, Series K014, Class A1, multifamily 2.788% 20201 | 3,514 | 3,637 |
| Freddie Mac, Series K013, Class A1, multifamily 2.902% 20201 | 3,801 | 3,941 |
| Freddie Mac, Series K010, Class A1, multifamily 3.32% 20201 | 3,422 | 3,607 |
| Freddie Mac, Series K019, Class A1, multifamily 1.459% 20211 | 2,143 | 2,074 |
| Freddie Mac, Series K017, Class A2, multifamily 2.873% 20211 | 4,300 | 4,190 |
| Freddie Mac, Series KS01, Class A1, multifamily 1.693% 20221 | 911 | 891 |
| Freddie Mac, Series K023, Class A2, multifamily 2.307% 20221 | 15,140 | 13,907 |
| Freddie Mac, Series K022, Class A2, multifamily 2.355% 20221 | 4,425 | 4,095 |
| Freddie Mac, Series K020, Class A2, multifamily 2.373% 20221 | 21,325 | 19,861 |
| Freddie Mac, Series K021, Class A2, multifamily 2.396% 20221 | 15,580 | 14,485 |
| Freddie Mac, Series K024, Class A2, multifamily 2.573% 20221 | 5,000 | 4,690 |
| Freddie Mac, Series K030, Class A1, multifamily 2.779% 20221 | 3,400 | 3,444 |
| Bonds, notes & other debt instruments | ||
| Principal amount | Value | |
| Federal agency bonds & notes (continued) | (000) | (000) |
| Freddie Mac, Series KS01, Class A2, multifamily 2.522% 20231 | $ 6,200 | $ 5,802 |
| Freddie Mac, Series K028, Class A2, multifamily 3.111% 20231 | 4,000 | 3,892 |
| Freddie Mac, Series K030, Class A2, multifamily 3.25% 20231,2 | 7,305 | 7,187 |
| Freddie Mac, Series K031, Class A2, multifamily 3.30% 20231,2 | 15,487 | 15,270 |
| Freddie Mac, Series K029, Class A2, multifamily 3.32% 20231,2 | 7,200 | 7,130 |
| Freddie Mac, Series K031, Class A1, multifamily 2.778% 20461 | 2,772 | 2,812 |
| Federal Home Loan Bank 3.625% 2013 | 10,000 | 10,046 |
| Federal Home Loan Bank 0.375% 2015 | 61,000 | 60,893 |
| Federal Home Loan Bank 2.75% 2015 | 8,500 | 8,799 |
| Federal Home Loan Bank, Series 2816, 1.00% 2017 | 43,705 | 43,275 |
| Federal Farm Credit Banks, Consolidated Systemwide Designated Bonds, 1.625% 2014 | 33,225 | 33,783 |
| Federal Farm Credit Banks, Consolidated Systemwide Designated Bonds, 0.60% 2017 | 74,292 | 72,476 |
| Fannie Mae 0.75% 2013 | 67,575 | 67,709 |
| Fannie Mae 3.00% 2014 | 4,500 | 4,628 |
| Fannie Mae 7.125% 2030 | 3,000 | 4,132 |
| Fannie Mae, Series 2012-M5, Class A1, multifamily 1.787% 20221 | 1,763 | 1,747 |
| Fannie Mae, Series 2013-M4, multifamily 2.608% 20221 | 4,225 | 4,035 |
| Fannie Mae, Series 2012-M2, Class A2, multifamily 2.717% 20221 | 4,325 | 4,130 |
| Fannie Mae, Series 2012-M3, Class 1-A2, multifamily 3.044% 20221 | 3,500 | 3,441 |
| Fannie Mae, Series 2003-M2, Class D, multifamily 4.68% 20331,2 | 6,116 | 6,374 |
| Tennessee Valley Authority, Series A, 3.875% 2021 | 4,200 | 4,419 |
| Tennessee Valley Authority 1.875% 2022 | 18,350 | 16,277 |
| TVA Southaven 3.846% 20331 | 3,125 | 3,106 |
| Tennessee Valley Authority 4.65% 2035 | 3,930 | 4,130 |
| Tennessee Valley Authority 5.88% 2036 | 2,750 | 3,254 |
| Tennessee Valley Authority 5.25% 2039 | 11,000 | 11,997 |
| Tennessee Valley Authority, Series B, 3.50% 2042 | 11,570 | 9,306 |
| Tennessee Valley Authority, Series 2008, Class A, 4.875% 2048 | 3,300 | 3,350 |
| United States Agency for International Development, Republic of Egypt 4.45% 2015 | 19,000 | 20,474 |
| United States Agency for International Development, State of Israel, Class 1-A, 5.50% 2023 | 5,000 | 5,859 |
| Private Export Funding Corp. 1.375% 2017 | 3,750 | 3,774 |
| Private Export Funding Corp. 1.45% 2019 | 5,250 | 4,979 |
| Small Business Administration, Series SBIC-PS 2006-10A, Participating Securities, 5.408% 20161 | 1,291 | 1,360 |
| Small Business Administration, Series 2001-20K, 5.34% 20211 | 712 | 773 |
| Small Business Administration, Series 2001-20J, 5.76% 20211 | 282 | 307 |
| Small Business Administration, Series 2001-20F, 6.44% 20211 | 1,030 | 1,142 |
| Small Business Administration, Series 2003-20B, 4.84% 20231 | 2,839 | 3,075 |
| 773,923 | ||
| Asset-backed obligations1 0.01% | ||
| PE Environmental Funding LLC, Series 2007-A, Class A-1, 4.982% 2016 | 337 | 342 |
| Total bonds, notes & other debt instruments (cost: $5,889,694,000) | 5,861,630 | |
| Short-term securities 21.61% | ||
| Freddie Mac 0.085%–0.16% due 10/15/2013–4/25/2014 | 532,800 | 532,587 |
| Federal Home Loan Bank 0.08%–0.165% due 9/6/2013–7/1/2014 | 459,510 | 459,415 |
| Fannie Mae 0.09%–0.12% due 11/18/2013–1/27/2014 | 80,385 | 80,373 |
| Paccar Financial Corp. 0.04%–0.06% due 9/3–9/12/2013 | 50,900 | 50,899 |
| John Deere Capital Corp. 0.06% due 9/9/20133 | 50,000 | 49,999 |
| Wal-Mart Stores, Inc. 0.05% due 9/11/20133 | 47,500 | 47,499 |
| U.S. Treasury Bills 0.031%–0.054% due 9/5–10/10/2013 | 39,200 | 39,199 |
| NetJets Inc. 0.05% due 9/17/20133 | 38,200 | 38,199 |
| Principal amount | Value | |
| Short-term securities | (000) | (000) |
| U.S. Bank, N.A. 0.04% due 9/3/2013 | $27,000 | $ 27,000 |
| Kimberly-Clark Worldwide Inc. 0.05% due 9/4/20133 | 18,700 | 18,700 |
| National Rural Utilities Cooperative Finance Corp. 0.09% due 9/26/2013 | 14,000 | 13,999 |
| Total short-term securities (cost: $1,357,739,000) | 1,357,869 | |
| Total investment securities (cost: $7,247,433,000) | 7,219,499 | |
| Other assets less liabilities | (936,562) | |
| Net assets | $6,282,937 |
1 Principal payments may be made periodically. Therefore, the effective maturity date may be earlier than the stated maturity date.
2 Coupon rate may change periodically.
3 Acquired in a transaction exempt from registration under Rule 144A or section 4(2) of the Securities Act of 1933. May be resold in the U.S. in transactions exempt from registration, normally to qualified institutional buyers. The total value of all such securities was $155,270,000, which represented 2.47% of the net assets of the fund.
4 Index-linked bond whose principal amount moves with a government price index.
Investments are not FDIC-insured, nor are they deposits of or guaranteed by a bank or any other entity, so they may lose value.
Investors should carefully consider investment objectives, risks, charges and expenses. This and other important information is contained in the fund prospectus and summary prospectus, which can be obtained from your financial professional and should be read carefully before investing. You may also call American Funds Service Company (AFS) at (800) 421-4225 or visit the American Funds website at americanfunds.com.
MFGEFPX-022-1013O-S37706
REPORT OF INDEPENDENT REGISTERED PUBLIC ACCOUNTING FIRM ON INVESTMENT PORTFOLIO
To the Shareholders and Board of Trustees of
The American Funds Income Series – U.S. Government Securities Fund:
We have audited, in accordance with the standards of the Public Company Accounting Oversight Board (United States), the financial statements of The American Funds Income Series – U.S. Government Securities Fund (the “Fund”) as of August 31, 2013, and for the year then ended and have issued our report thereon dated October 14, 2013, which report and financial statements are included in Item 1 of this Certified Shareholder Report on Form N-CSR. Our audit also included the Fund’s investment portfolio (the “Schedule”) as of August 31, 2013, appearing in Item 6 of this Form N-CSR. This Schedule is the responsibility of the Fund’s management. Our responsibility is to express an opinion based on our audit. In our opinion, the Schedule referred to above, when considered in relation to the basic financial statements taken as a whole of the Fund referred to above, presents fairly, in all material respects, the information set forth therein.
DELOITTE & TOUCHE LLP
Costa Mesa, California
October 14, 2013
ITEM 7 – Disclosure of Proxy Voting Policies and Procedures for Closed-End Management Investment Companies
Not applicable to this Registrant, insofar as the Registrant is not a closed-end management investment company.
ITEM 8 – Portfolio Managers of Closed-End Management Investment Companies
Not applicable to this Registrant, insofar as the Registrant is not a closed-end management investment company.
ITEM 9 – Purchases of Equity Securities by Closed-End Management Investment Company and Affiliated Purchasers
Not applicable to this Registrant, insofar as the Registrant is not a closed-end management investment company.
ITEM 10 – Submission of Matters to a Vote of Security Holders
There have been no material changes to the procedures by which shareholders may recommend nominees to the Registrant’s board of trustees since the Registrant last submitted a proxy statement to its shareholders. The procedures are as follows. The Registrant has a nominating and governance committee comprised solely of persons who are not considered ‘‘interested persons’’ of the Registrant within the meaning of the Investment Company Act of 1940, as amended. The committee periodically reviews such issues as the board’s composition, responsibilities, committees, compensation and other relevant issues, and recommends any appropriate changes to the full board of trustees. While the committee normally is able to identify from its own resources an ample number of qualified candidates, it will consider shareholder suggestions of persons to be considered as nominees to fill future vacancies on the board. Such suggestions must be sent in writing to the nominating and governance committee of the Registrant, c/o the Registrant’s Secretary, and must be accompanied by complete biographical and occupational data on the prospective nominee, along with a written consent of the prospective nominee for consideration of his or her name by the nominating and governance committee.
ITEM 11 – Controls and Procedures
| (a) | The Registrant’s Principal Executive Officer and Principal Financial Officer have concluded, based on their evaluation of the Registrant’s disclosure controls and procedures (as such term is defined in Rule 30a-3 under the Investment Company Act of 1940), that such controls and procedures are adequate and reasonably designed to achieve the purposes described in paragraph (c) of such rule. |
| (b) | There were no changes in the Registrant’s internal controls over financial reporting (as defined in Rule 30a-3(d) under the Investment Company Act of 1940) that occurred during the Registrant’s second fiscal quarter of the period covered by this report that has materially affected, or is reasonably likely to materially affect, the Registrant’s internal control over financial reporting. |
ITEM 12 – Exhibits
| (a)(1) | The Code of Ethics that is the subject of the disclosure required by Item 2 is attached as an exhibit hereto. |
| (a)(2) | The certifications required by Rule 30a-2 of the Investment Company Act of 1940 and Sections 302 and 906 of the Sarbanes-Oxley Act of 2002 are attached as exhibits hereto. |
SIGNATURES
Pursuant to the requirements of the Securities Exchange Act of 1934 and the Investment Company Act of 1940, the Registrant has duly caused this report to be signed on its behalf by the undersigned, thereunto duly authorized.
| THE AMERICAN FUNDS INCOME SERIES | |
| By /s/ Thomas H. Høgh | |
Thomas H. Høgh, President and Principal Executive Officer | |
| Date: October 31, 2013 |
Pursuant to the requirements of the Securities Exchange Act of 1934 and the Investment Company Act of 1940, this report has been signed below by the following persons on behalf of the Registrant and in the capacities and on the dates indicated.
| By /s/ Thomas H. Høgh |
Thomas H. Høgh, President and Principal Executive Officer |
| Date: October 31, 2013 |
| By /s/ Karl C. Grauman |
Karl C. Grauman, Treasurer and Principal Financial Officer |
| Date: October 31, 2013 |