00007693972024FYFALSEP1MP3YP01Y0.33330.33330.3333http://fasb.org/us-gaap/2023#PrepaidExpenseAndOtherAssetsCurrenthttp://fasb.org/us-gaap/2023#PrepaidExpenseAndOtherAssetsCurrenthttp://fasb.org/us-gaap/2023#OtherAccruedLiabilitiesCurrenthttp://fasb.org/us-gaap/2023#OtherAccruedLiabilitiesCurrent346iso4217:USDxbrli:sharesiso4217:USDxbrli:sharesadsk:segmentadsk:categoryxbrli:pureadsk:periodadsk:businessCombinationutr:Qadsk:performance_indicator_metric00007693972023-02-012024-01-3100007693972023-07-3100007693972024-03-310000769397us-gaap:SubscriptionAndCirculationMember2023-02-012024-01-310000769397us-gaap:SubscriptionAndCirculationMember2022-02-012023-01-310000769397us-gaap:SubscriptionAndCirculationMember2021-02-012022-01-310000769397us-gaap:MaintenanceMember2023-02-012024-01-310000769397us-gaap:MaintenanceMember2022-02-012023-01-310000769397us-gaap:MaintenanceMember2021-02-012022-01-310000769397adsk:SubscriptionandMaintenanceMember2023-02-012024-01-310000769397adsk:SubscriptionandMaintenanceMember2022-02-012023-01-310000769397adsk:SubscriptionandMaintenanceMember2021-02-012022-01-310000769397us-gaap:ProductAndServiceOtherMember2023-02-012024-01-310000769397us-gaap:ProductAndServiceOtherMember2022-02-012023-01-310000769397us-gaap:ProductAndServiceOtherMember2021-02-012022-01-3100007693972022-02-012023-01-3100007693972021-02-012022-01-3100007693972024-01-3100007693972023-01-3100007693972022-01-3100007693972021-01-310000769397us-gaap:CommonStockIncludingAdditionalPaidInCapitalMember2021-01-310000769397us-gaap:AccumulatedOtherComprehensiveIncomeMember2021-01-310000769397us-gaap:RetainedEarningsMember2021-01-310000769397us-gaap:CommonStockIncludingAdditionalPaidInCapitalMember2021-02-012022-01-310000769397us-gaap:RetainedEarningsMember2021-02-012022-01-310000769397us-gaap:AccumulatedOtherComprehensiveIncomeMember2021-02-012022-01-310000769397us-gaap:CommonStockIncludingAdditionalPaidInCapitalMember2022-01-310000769397us-gaap:AccumulatedOtherComprehensiveIncomeMember2022-01-310000769397us-gaap:RetainedEarningsMember2022-01-310000769397us-gaap:CommonStockIncludingAdditionalPaidInCapitalMember2022-02-012023-01-310000769397us-gaap:RetainedEarningsMember2022-02-012023-01-310000769397us-gaap:AccumulatedOtherComprehensiveIncomeMember2022-02-012023-01-310000769397us-gaap:CommonStockIncludingAdditionalPaidInCapitalMember2023-01-310000769397us-gaap:AccumulatedOtherComprehensiveIncomeMember2023-01-310000769397us-gaap:RetainedEarningsMember2023-01-310000769397us-gaap:CommonStockIncludingAdditionalPaidInCapitalMember2023-02-012024-01-310000769397us-gaap:RetainedEarningsMember2023-02-012024-01-310000769397us-gaap:AccumulatedOtherComprehensiveIncomeMember2023-02-012024-01-310000769397us-gaap:CommonStockIncludingAdditionalPaidInCapitalMember2024-01-310000769397us-gaap:AccumulatedOtherComprehensiveIncomeMember2024-01-310000769397us-gaap:RetainedEarningsMember2024-01-310000769397country:US2024-01-310000769397country:US2023-01-310000769397adsk:OtherAmericasMember2024-01-310000769397adsk:OtherAmericasMember2023-01-310000769397srt:AmericasMember2024-01-310000769397srt:AmericasMember2023-01-310000769397us-gaap:EMEAMember2024-01-310000769397us-gaap:EMEAMember2023-01-310000769397srt:AsiaMember2024-01-310000769397srt:AsiaMember2023-01-310000769397srt:MinimumMemberus-gaap:ForeignExchangeContractMember2023-02-012024-01-310000769397srt:MaximumMemberus-gaap:ForeignExchangeContractMember2023-02-012024-01-310000769397us-gaap:RevolvingCreditFacilityMemberadsk:TheCreditAgreementMember2022-11-300000769397us-gaap:CustomerConcentrationRiskMemberus-gaap:SalesRevenueNetMemberadsk:TDSynnexMember2023-02-012024-01-310000769397us-gaap:CustomerConcentrationRiskMemberus-gaap:SalesRevenueNetMemberadsk:TDSynnexMember2022-02-012023-01-310000769397us-gaap:CustomerConcentrationRiskMemberus-gaap:SalesRevenueNetMemberadsk:TDSynnexMember2021-02-012022-01-310000769397us-gaap:CustomerConcentrationRiskMemberadsk:TDSynnexMemberus-gaap:AccountsReceivableMember2023-02-012024-01-310000769397us-gaap:CustomerConcentrationRiskMemberadsk:TDSynnexMemberus-gaap:AccountsReceivableMember2022-02-012023-01-310000769397adsk:CustomerRelationshipsTradeNamesPatentsandUserListMembersrt:MinimumMember2024-01-310000769397srt:MaximumMemberadsk:CustomerRelationshipsTradeNamesPatentsandUserListMember2024-01-310000769397adsk:CustomerRelationshipsTradeNamesPatentsandUserListMember2023-02-012024-01-310000769397adsk:CustomerRelationshipsTradeNamesPatentsandUserListMember2022-02-012023-01-310000769397adsk:CustomerRelationshipsTradeNamesPatentsandUserListMember2021-02-012022-01-310000769397us-gaap:CustomerRelationshipsMember2024-01-310000769397us-gaap:DevelopedTechnologyRightsMember2024-01-310000769397us-gaap:IntellectualPropertyMember2024-01-310000769397us-gaap:OtherIntangibleAssetsMember2024-01-310000769397us-gaap:CustomerRelationshipsMember2023-01-310000769397us-gaap:DevelopedTechnologyRightsMember2023-01-310000769397us-gaap:IntellectualPropertyMember2023-01-310000769397srt:MinimumMember2024-01-310000769397srt:MaximumMember2024-01-310000769397us-gaap:ComputerEquipmentMember2024-01-310000769397us-gaap:ComputerEquipmentMember2023-01-310000769397us-gaap:SoftwareDevelopmentMember2024-01-310000769397us-gaap:SoftwareDevelopmentMember2023-01-310000769397adsk:FurnitureAndEquipmentMember2024-01-310000769397adsk:FurnitureAndEquipmentMember2023-01-310000769397us-gaap:LandBuildingsAndImprovementsMember2024-01-310000769397us-gaap:LandBuildingsAndImprovementsMember2023-01-310000769397us-gaap:SoftwareAndSoftwareDevelopmentCostsMember2024-01-310000769397adsk:CloudbasedSoftwareHostingArrangementsMember2024-01-310000769397adsk:CloudbasedSoftwareHostingArrangementsMember2023-01-310000769397adsk:SubscriptionandMaintenanceMemberus-gaap:CostOfSalesMember2023-02-012024-01-310000769397adsk:SubscriptionandMaintenanceMemberus-gaap:CostOfSalesMember2022-02-012023-01-310000769397adsk:SubscriptionandMaintenanceMemberus-gaap:CostOfSalesMember2021-02-012022-01-310000769397us-gaap:CostOfSalesMemberus-gaap:ProductAndServiceOtherMember2023-02-012024-01-310000769397us-gaap:CostOfSalesMemberus-gaap:ProductAndServiceOtherMember2022-02-012023-01-310000769397us-gaap:CostOfSalesMemberus-gaap:ProductAndServiceOtherMember2021-02-012022-01-310000769397us-gaap:SellingAndMarketingExpenseMember2023-02-012024-01-310000769397us-gaap:SellingAndMarketingExpenseMember2022-02-012023-01-310000769397us-gaap:SellingAndMarketingExpenseMember2021-02-012022-01-310000769397us-gaap:ResearchAndDevelopmentExpenseMember2023-02-012024-01-310000769397us-gaap:ResearchAndDevelopmentExpenseMember2022-02-012023-01-310000769397us-gaap:ResearchAndDevelopmentExpenseMember2021-02-012022-01-310000769397us-gaap:GeneralAndAdministrativeExpenseMember2023-02-012024-01-310000769397us-gaap:GeneralAndAdministrativeExpenseMember2022-02-012023-01-310000769397us-gaap:GeneralAndAdministrativeExpenseMember2021-02-012022-01-310000769397us-gaap:PerformanceSharesMember2023-02-012024-01-310000769397us-gaap:EmployeeStockMember2023-02-012024-01-310000769397us-gaap:PerformanceSharesMember2022-02-012023-01-310000769397us-gaap:EmployeeStockMember2022-02-012023-01-310000769397us-gaap:PerformanceSharesMember2021-02-012022-01-310000769397us-gaap:EmployeeStockMember2021-02-012022-01-310000769397us-gaap:EmployeeStockMembersrt:MinimumMember2023-02-012024-01-310000769397srt:MaximumMemberus-gaap:EmployeeStockMember2023-02-012024-01-310000769397us-gaap:EmployeeStockMembersrt:MinimumMember2022-02-012023-01-310000769397srt:MaximumMemberus-gaap:EmployeeStockMember2022-02-012023-01-310000769397us-gaap:EmployeeStockMembersrt:MinimumMember2021-02-012022-01-310000769397srt:MaximumMemberus-gaap:EmployeeStockMember2021-02-012022-01-310000769397adsk:ArchitectureEngineeringAndConstructionMember2023-02-012024-01-310000769397adsk:ArchitectureEngineeringAndConstructionMember2022-02-012023-01-310000769397adsk:ArchitectureEngineeringAndConstructionMember2021-02-012022-01-310000769397adsk:AutoCADandAutoCADLTFamilyMember2023-02-012024-01-310000769397adsk:AutoCADandAutoCADLTFamilyMember2022-02-012023-01-310000769397adsk:AutoCADandAutoCADLTFamilyMember2021-02-012022-01-310000769397adsk:ManufacturingMember2023-02-012024-01-310000769397adsk:ManufacturingMember2022-02-012023-01-310000769397adsk:ManufacturingMember2021-02-012022-01-310000769397adsk:MediaAndEntertainmentMember2023-02-012024-01-310000769397adsk:MediaAndEntertainmentMember2022-02-012023-01-310000769397adsk:MediaAndEntertainmentMember2021-02-012022-01-310000769397adsk:OtherMember2023-02-012024-01-310000769397adsk:OtherMember2022-02-012023-01-310000769397adsk:OtherMember2021-02-012022-01-310000769397country:US2023-02-012024-01-310000769397country:US2022-02-012023-01-310000769397country:US2021-02-012022-01-310000769397adsk:OtherAmericasMember2023-02-012024-01-310000769397adsk:OtherAmericasMember2022-02-012023-01-310000769397adsk:OtherAmericasMember2021-02-012022-01-310000769397srt:AmericasMember2023-02-012024-01-310000769397srt:AmericasMember2022-02-012023-01-310000769397srt:AmericasMember2021-02-012022-01-310000769397us-gaap:EMEAMember2023-02-012024-01-310000769397us-gaap:EMEAMember2022-02-012023-01-310000769397us-gaap:EMEAMember2021-02-012022-01-310000769397srt:AsiaPacificMember2023-02-012024-01-310000769397srt:AsiaPacificMember2022-02-012023-01-310000769397srt:AsiaPacificMember2021-02-012022-01-310000769397us-gaap:SalesChannelThroughIntermediaryMember2023-02-012024-01-310000769397us-gaap:SalesChannelThroughIntermediaryMember2022-02-012023-01-310000769397us-gaap:SalesChannelThroughIntermediaryMember2021-02-012022-01-310000769397us-gaap:SalesChannelDirectlyToConsumerMember2023-02-012024-01-310000769397us-gaap:SalesChannelDirectlyToConsumerMember2022-02-012023-01-310000769397us-gaap:SalesChannelDirectlyToConsumerMember2021-02-012022-01-310000769397adsk:DesignMember2023-02-012024-01-310000769397adsk:DesignMember2022-02-012023-01-310000769397adsk:DesignMember2021-02-012022-01-310000769397adsk:MakeMember2023-02-012024-01-310000769397adsk:MakeMember2022-02-012023-01-310000769397adsk:MakeMember2021-02-012022-01-310000769397adsk:OtherResearchAndDevelopmentMember2023-02-012024-01-310000769397adsk:OtherResearchAndDevelopmentMember2022-02-012023-01-310000769397adsk:OtherResearchAndDevelopmentMember2021-02-012022-01-310000769397srt:MinimumMember2023-02-012024-01-310000769397srt:MaximumMember2023-02-012024-01-310000769397adsk:PeriodOneMember2024-02-012024-01-310000769397adsk:PeriodTwoMember2024-02-012024-01-3100007693972025-02-012024-01-310000769397us-gaap:MoneyMarketFundsMember2024-01-310000769397us-gaap:CommercialPaperMember2024-01-310000769397us-gaap:USGovernmentDebtSecuritiesMember2024-01-310000769397us-gaap:CertificatesOfDepositMember2024-01-310000769397adsk:OtherCashEquivalentsMember2024-01-310000769397us-gaap:CommercialPaperMember2024-01-310000769397us-gaap:CorporateDebtSecuritiesMember2024-01-310000769397us-gaap:USGovernmentDebtSecuritiesMember2024-01-310000769397us-gaap:AssetBackedSecuritiesMember2024-01-310000769397adsk:OtherMarketableSecuritiesMember2024-01-310000769397us-gaap:AgencySecuritiesMember2024-01-310000769397us-gaap:MutualFundMember2024-01-310000769397us-gaap:MoneyMarketFundsMember2023-01-310000769397us-gaap:CommercialPaperMember2023-01-310000769397us-gaap:CertificatesOfDepositMember2023-01-310000769397us-gaap:USGovernmentDebtSecuritiesMember2023-01-310000769397adsk:OtherCashEquivalentsMember2023-01-310000769397us-gaap:CorporateDebtSecuritiesMember2023-01-310000769397us-gaap:CommercialPaperMember2023-01-310000769397us-gaap:AssetBackedSecuritiesMember2023-01-310000769397us-gaap:USGovernmentDebtSecuritiesMember2023-01-310000769397adsk:OtherMarketableSecuritiesMember2023-01-310000769397us-gaap:MutualFundMember2023-01-310000769397us-gaap:ConvertibleDebtSecuritiesMember2023-01-310000769397adsk:InvestmentsDerivativeAssetMember2023-01-310000769397us-gaap:FairValueInputsLevel1Memberus-gaap:MoneyMarketFundsMember2024-01-310000769397us-gaap:FairValueInputsLevel2Memberus-gaap:MoneyMarketFundsMember2024-01-310000769397us-gaap:FairValueInputsLevel3Memberus-gaap:MoneyMarketFundsMember2024-01-310000769397us-gaap:FairValueInputsLevel1Memberus-gaap:CommercialPaperMember2024-01-310000769397us-gaap:FairValueInputsLevel2Memberus-gaap:CommercialPaperMember2024-01-310000769397us-gaap:FairValueInputsLevel3Memberus-gaap:CommercialPaperMember2024-01-310000769397us-gaap:FairValueInputsLevel1Memberus-gaap:USGovernmentDebtSecuritiesMember2024-01-310000769397us-gaap:FairValueInputsLevel2Memberus-gaap:USGovernmentDebtSecuritiesMember2024-01-310000769397us-gaap:FairValueInputsLevel3Memberus-gaap:USGovernmentDebtSecuritiesMember2024-01-310000769397us-gaap:FairValueInputsLevel1Memberus-gaap:CertificatesOfDepositMember2024-01-310000769397us-gaap:FairValueInputsLevel2Memberus-gaap:CertificatesOfDepositMember2024-01-310000769397us-gaap:FairValueInputsLevel3Memberus-gaap:CertificatesOfDepositMember2024-01-310000769397adsk:OtherCashEquivalentsMemberus-gaap:FairValueInputsLevel1Member2024-01-310000769397adsk:OtherCashEquivalentsMemberus-gaap:FairValueInputsLevel2Member2024-01-310000769397adsk:OtherCashEquivalentsMemberus-gaap:FairValueInputsLevel3Member2024-01-310000769397us-gaap:FairValueInputsLevel1Memberus-gaap:CommercialPaperMember2024-01-310000769397us-gaap:FairValueInputsLevel2Memberus-gaap:CommercialPaperMember2024-01-310000769397us-gaap:FairValueInputsLevel3Memberus-gaap:CommercialPaperMember2024-01-310000769397us-gaap:CorporateDebtSecuritiesMemberus-gaap:FairValueInputsLevel1Member2024-01-310000769397us-gaap:CorporateDebtSecuritiesMemberus-gaap:FairValueInputsLevel2Member2024-01-310000769397us-gaap:FairValueInputsLevel3Memberus-gaap:CorporateDebtSecuritiesMember2024-01-310000769397us-gaap:FairValueInputsLevel1Memberus-gaap:USGovernmentDebtSecuritiesMember2024-01-310000769397us-gaap:FairValueInputsLevel2Memberus-gaap:USGovernmentDebtSecuritiesMember2024-01-310000769397us-gaap:FairValueInputsLevel3Memberus-gaap:USGovernmentDebtSecuritiesMember2024-01-310000769397us-gaap:FairValueInputsLevel1Memberus-gaap:AssetBackedSecuritiesMember2024-01-310000769397us-gaap:FairValueInputsLevel2Memberus-gaap:AssetBackedSecuritiesMember2024-01-310000769397us-gaap:FairValueInputsLevel3Memberus-gaap:AssetBackedSecuritiesMember2024-01-310000769397us-gaap:FairValueInputsLevel1Memberadsk:OtherMarketableSecuritiesMember2024-01-310000769397us-gaap:FairValueInputsLevel2Memberadsk:OtherMarketableSecuritiesMember2024-01-310000769397us-gaap:FairValueInputsLevel3Memberadsk:OtherMarketableSecuritiesMember2024-01-310000769397us-gaap:FairValueInputsLevel1Memberus-gaap:AgencySecuritiesMember2024-01-310000769397us-gaap:FairValueInputsLevel2Memberus-gaap:AgencySecuritiesMember2024-01-310000769397us-gaap:FairValueInputsLevel3Memberus-gaap:AgencySecuritiesMember2024-01-310000769397us-gaap:FairValueInputsLevel1Memberus-gaap:MutualFundMember2024-01-310000769397us-gaap:FairValueInputsLevel2Memberus-gaap:MutualFundMember2024-01-310000769397us-gaap:FairValueInputsLevel3Memberus-gaap:MutualFundMember2024-01-310000769397us-gaap:FairValueInputsLevel1Member2024-01-310000769397us-gaap:FairValueInputsLevel2Member2024-01-310000769397us-gaap:FairValueInputsLevel3Member2024-01-310000769397us-gaap:FairValueInputsLevel1Memberus-gaap:MoneyMarketFundsMember2023-01-310000769397us-gaap:FairValueInputsLevel2Memberus-gaap:MoneyMarketFundsMember2023-01-310000769397us-gaap:FairValueInputsLevel3Memberus-gaap:MoneyMarketFundsMember2023-01-310000769397us-gaap:FairValueInputsLevel1Memberus-gaap:CommercialPaperMember2023-01-310000769397us-gaap:FairValueInputsLevel2Memberus-gaap:CommercialPaperMember2023-01-310000769397us-gaap:FairValueInputsLevel3Memberus-gaap:CommercialPaperMember2023-01-310000769397us-gaap:FairValueInputsLevel1Memberus-gaap:CertificatesOfDepositMember2023-01-310000769397us-gaap:FairValueInputsLevel2Memberus-gaap:CertificatesOfDepositMember2023-01-310000769397us-gaap:FairValueInputsLevel3Memberus-gaap:CertificatesOfDepositMember2023-01-310000769397us-gaap:FairValueInputsLevel1Memberus-gaap:USGovernmentDebtSecuritiesMember2023-01-310000769397us-gaap:FairValueInputsLevel2Memberus-gaap:USGovernmentDebtSecuritiesMember2023-01-310000769397us-gaap:FairValueInputsLevel3Memberus-gaap:USGovernmentDebtSecuritiesMember2023-01-310000769397adsk:OtherCashEquivalentsMemberus-gaap:FairValueInputsLevel1Member2023-01-310000769397adsk:OtherCashEquivalentsMemberus-gaap:FairValueInputsLevel2Member2023-01-310000769397adsk:OtherCashEquivalentsMemberus-gaap:FairValueInputsLevel3Member2023-01-310000769397us-gaap:CorporateDebtSecuritiesMemberus-gaap:FairValueInputsLevel1Member2023-01-310000769397us-gaap:CorporateDebtSecuritiesMemberus-gaap:FairValueInputsLevel2Member2023-01-310000769397us-gaap:FairValueInputsLevel3Memberus-gaap:CorporateDebtSecuritiesMember2023-01-310000769397us-gaap:FairValueInputsLevel1Memberus-gaap:CommercialPaperMember2023-01-310000769397us-gaap:FairValueInputsLevel2Memberus-gaap:CommercialPaperMember2023-01-310000769397us-gaap:FairValueInputsLevel3Memberus-gaap:CommercialPaperMember2023-01-310000769397us-gaap:FairValueInputsLevel1Memberus-gaap:AssetBackedSecuritiesMember2023-01-310000769397us-gaap:FairValueInputsLevel2Memberus-gaap:AssetBackedSecuritiesMember2023-01-310000769397us-gaap:FairValueInputsLevel3Memberus-gaap:AssetBackedSecuritiesMember2023-01-310000769397us-gaap:FairValueInputsLevel1Memberus-gaap:USGovernmentDebtSecuritiesMember2023-01-310000769397us-gaap:FairValueInputsLevel2Memberus-gaap:USGovernmentDebtSecuritiesMember2023-01-310000769397us-gaap:FairValueInputsLevel3Memberus-gaap:USGovernmentDebtSecuritiesMember2023-01-310000769397us-gaap:FairValueInputsLevel1Memberadsk:OtherMarketableSecuritiesMember2023-01-310000769397us-gaap:FairValueInputsLevel2Memberadsk:OtherMarketableSecuritiesMember2023-01-310000769397us-gaap:FairValueInputsLevel3Memberadsk:OtherMarketableSecuritiesMember2023-01-310000769397us-gaap:FairValueInputsLevel1Memberus-gaap:MutualFundMember2023-01-310000769397us-gaap:FairValueInputsLevel2Memberus-gaap:MutualFundMember2023-01-310000769397us-gaap:FairValueInputsLevel3Memberus-gaap:MutualFundMember2023-01-310000769397us-gaap:FairValueInputsLevel1Memberus-gaap:ConvertibleDebtSecuritiesMember2023-01-310000769397us-gaap:FairValueInputsLevel2Memberus-gaap:ConvertibleDebtSecuritiesMember2023-01-310000769397us-gaap:FairValueInputsLevel3Memberus-gaap:ConvertibleDebtSecuritiesMember2023-01-310000769397us-gaap:FairValueInputsLevel1Member2023-01-310000769397us-gaap:FairValueInputsLevel2Member2023-01-310000769397us-gaap:FairValueInputsLevel3Member2023-01-310000769397adsk:EquityIncentivePlan2022Member2024-01-310000769397adsk:EquityIncentivePlan2022Member2023-02-012024-01-310000769397adsk:RestrictedStockUnitsAndRestrictedStockAwardsMemberadsk:EquityIncentivePlan2022Member2023-02-012024-01-310000769397srt:MinimumMemberus-gaap:RestrictedStockUnitsRSUMemberadsk:EquityIncentivePlan2022Member2023-02-012024-01-310000769397srt:MaximumMemberus-gaap:RestrictedStockUnitsRSUMemberadsk:EquityIncentivePlan2022Member2023-02-012024-01-310000769397adsk:RestrictedStockUnitsRSUsandPerformanceSharesMember2023-01-310000769397adsk:RestrictedStockUnitsRSUsandPerformanceSharesMember2023-02-012024-01-310000769397adsk:RestrictedStockUnitsRSUsandPerformanceSharesMember2024-01-310000769397srt:MinimumMemberadsk:RestrictedStockUnitsRSUsandPerformanceSharesMember2023-01-310000769397srt:MaximumMemberadsk:RestrictedStockUnitsRSUsandPerformanceSharesMember2023-01-310000769397adsk:RestrictedStockUnitsRSUsandPerformanceSharesMember2022-02-012023-01-310000769397adsk:RestrictedStockUnitsRSUsandPerformanceSharesMember2021-02-012022-01-310000769397us-gaap:RestrictedStockUnitsRSUMember2023-02-012024-01-310000769397srt:MaximumMemberus-gaap:RestrictedStockUnitsRSUMember2023-02-012024-01-310000769397us-gaap:RestrictedStockUnitsRSUMember2022-02-012023-01-310000769397us-gaap:RestrictedStockUnitsRSUMember2021-02-012022-01-310000769397us-gaap:RestrictedStockUnitsRSUMember2024-01-310000769397us-gaap:PerformanceSharesMember2024-01-310000769397us-gaap:CommonStockMember2023-02-012024-01-310000769397us-gaap:CommonStockMember2022-02-012023-01-310000769397us-gaap:CommonStockMember2021-02-012022-01-310000769397adsk:EmployeeQualifiedStockPurchasePlan1998Member2023-02-012024-01-310000769397adsk:EmployeeQualifiedStockPurchasePlan1998Member2024-01-310000769397adsk:EmployeeQualifiedStockPurchasePlan1998Memberus-gaap:EmployeeStockMember2023-02-012024-01-310000769397adsk:EmployeeQualifiedStockPurchasePlan1998Memberus-gaap:EmployeeStockMember2022-02-012023-01-310000769397adsk:EmployeeQualifiedStockPurchasePlan1998Memberus-gaap:EmployeeStockMember2021-02-012022-01-310000769397adsk:EmployeeQualifiedStockPurchasePlan1998Member2022-02-012023-01-310000769397adsk:EmployeeQualifiedStockPurchasePlan1998Member2021-02-012022-01-310000769397adsk:EquityCompensationPlansApprovedBySecurityHoldersMember2024-01-310000769397us-gaap:ShareBasedCompensationAwardTrancheOneMemberus-gaap:PerformanceSharesMember2023-02-012024-01-310000769397us-gaap:PerformanceSharesMemberus-gaap:ShareBasedCompensationAwardTrancheTwoMember2023-02-012024-01-310000769397us-gaap:PerformanceSharesMemberus-gaap:ShareBasedCompensationAwardTrancheThreeMember2023-02-012024-01-310000769397us-gaap:ForeignCountryMembercountry:CA2022-02-012023-01-310000769397us-gaap:DomesticCountryMember2024-01-310000769397us-gaap:StateAndLocalJurisdictionMember2024-01-310000769397us-gaap:ForeignCountryMember2024-01-310000769397country:PTus-gaap:ForeignCountryMember2024-01-310000769397country:NOus-gaap:ForeignCountryMember2024-01-310000769397country:NZus-gaap:ForeignCountryMember2024-01-310000769397us-gaap:ResearchMemberstpr:CAus-gaap:StateAndLocalJurisdictionMember2024-01-310000769397us-gaap:ResearchMemberstpr:MAus-gaap:StateAndLocalJurisdictionMember2024-01-310000769397us-gaap:ResearchMemberus-gaap:ForeignCountryMembercountry:CA2024-01-310000769397adsk:Fiscal2024AcquisitionMember2023-02-012024-01-310000769397adsk:Fiscal2024AcquisitionMember2024-01-310000769397us-gaap:DevelopedTechnologyRightsMemberadsk:Fiscal2024AcquisitionMember2024-01-310000769397adsk:Fiscal2024AcquisitionMemberus-gaap:CustomerRelationshipsMember2024-01-310000769397adsk:Fiscal2023AcquisitionMember2022-02-012023-01-310000769397adsk:Fiscal2023AcquisitionMemberus-gaap:RestrictedStockMember2022-02-012023-01-310000769397adsk:Fiscal2023AcquisitionMemberadsk:CertainEmployeesOfAcquireeMember2022-02-012023-01-310000769397adsk:Fiscal2023AcquisitionMemberus-gaap:PrepaidExpensesAndOtherCurrentAssetsMember2022-02-012023-01-310000769397us-gaap:ShareBasedCompensationAwardTrancheOneMemberadsk:Fiscal2023AcquisitionMember2022-02-012023-01-310000769397adsk:Fiscal2023AcquisitionMemberus-gaap:ShareBasedCompensationAwardTrancheTwoMember2022-02-012023-01-310000769397adsk:Fiscal2023AcquisitionMember2023-01-310000769397adsk:UpchainMember2021-05-110000769397adsk:UpchainMember2021-05-112021-05-110000769397adsk:UpchainMember2021-02-012022-01-310000769397adsk:StormUKHoldcoLimitedMember2021-03-312021-03-310000769397adsk:StormUKHoldcoLimitedMemberus-gaap:RestrictedStockMember2021-03-312021-03-310000769397adsk:StormUKHoldcoLimitedMember2021-03-310000769397us-gaap:SeriesOfIndividuallyImmaterialBusinessAcquisitionsMember2021-02-012022-01-310000769397us-gaap:RestrictedStockMemberus-gaap:SeriesOfIndividuallyImmaterialBusinessAcquisitionsMember2021-02-012022-01-310000769397us-gaap:SeriesOfIndividuallyImmaterialBusinessAcquisitionsMember2022-01-310000769397adsk:RabbiTrustMember2024-01-310000769397adsk:RabbiTrustMember2023-01-310000769397us-gaap:RevolvingCreditFacilityMemberadsk:TheCreditAgreementMember2022-11-012022-11-300000769397us-gaap:BaseRateMembersrt:MinimumMemberus-gaap:RevolvingCreditFacilityMemberadsk:TheCreditAgreementMember2022-11-012022-11-300000769397us-gaap:BaseRateMembersrt:MaximumMemberus-gaap:RevolvingCreditFacilityMemberadsk:TheCreditAgreementMember2022-11-012022-11-300000769397adsk:SecuredOvernightFinancingRateSOFRMembersrt:MinimumMemberus-gaap:RevolvingCreditFacilityMemberadsk:TheCreditAgreementMember2022-11-012022-11-300000769397srt:MaximumMemberadsk:SecuredOvernightFinancingRateSOFRMemberus-gaap:RevolvingCreditFacilityMemberadsk:TheCreditAgreementMember2022-11-012022-11-300000769397us-gaap:RevolvingCreditFacilityMemberadsk:TheCreditAgreementMember2024-01-310000769397adsk:A24NotesDueDecember152031Memberus-gaap:SeniorNotesMember2021-10-310000769397adsk:A24NotesDueDecember152031Memberus-gaap:SeniorNotesMember2021-10-012021-10-310000769397us-gaap:SeniorNotesMemberadsk:A285NotesDueJanuary152030Member2020-01-310000769397us-gaap:SeniorNotesMemberadsk:A285NotesDueJanuary152030Member2020-01-012020-01-310000769397us-gaap:SeniorNotesMemberadsk:DebtDueJune152020Member2020-01-012020-01-310000769397us-gaap:SeniorNotesMemberadsk:A3.5NotesdueJune152027Member2017-06-300000769397us-gaap:SeniorNotesMemberadsk:A3.5NotesdueJune152027Member2017-06-012017-06-300000769397adsk:SeniorNotesDueDecember152017Memberus-gaap:SeniorNotesMember2017-06-012017-06-300000769397us-gaap:SeniorNotesMemberadsk:A4375SeniorNotesDue2025Member2015-06-300000769397us-gaap:SeniorNotesMemberadsk:A4375SeniorNotesDue2025Member2015-06-012015-06-300000769397us-gaap:SeniorNotesMember2015-06-012015-06-300000769397us-gaap:SeniorNotesMemberadsk:A4375SeniorNotesDue2025Member2024-01-310000769397us-gaap:SeniorNotesMemberadsk:A3.5NotesdueJune152027Member2024-01-310000769397us-gaap:SeniorNotesMemberadsk:A285NotesDueJanuary152030Member2024-01-310000769397adsk:A24NotesDueDecember152031Memberus-gaap:SeniorNotesMember2024-01-310000769397adsk:CostofSubscriptionandMaintenanceRevenueMember2023-02-012024-01-310000769397adsk:Adsk_CostofOtherRevenueMemberMember2023-02-012024-01-310000769397adsk:CostofSubscriptionandMaintenanceRevenueMember2022-02-012023-01-310000769397adsk:Adsk_CostofOtherRevenueMemberMember2022-02-012023-01-310000769397adsk:CostofSubscriptionandMaintenanceRevenueMember2021-02-012022-01-310000769397adsk:Adsk_CostofOtherRevenueMemberMember2021-02-012022-01-310000769397us-gaap:DesignatedAsHedgingInstrumentMemberus-gaap:PrepaidExpensesAndOtherCurrentAssetsMemberus-gaap:ForeignExchangeContractMember2024-01-310000769397us-gaap:DesignatedAsHedgingInstrumentMemberus-gaap:PrepaidExpensesAndOtherCurrentAssetsMemberus-gaap:ForeignExchangeContractMember2023-01-310000769397us-gaap:OtherNoncurrentAssetsMemberus-gaap:NondesignatedMemberus-gaap:ForeignExchangeContractMember2024-01-310000769397us-gaap:OtherNoncurrentAssetsMemberus-gaap:NondesignatedMemberus-gaap:ForeignExchangeContractMember2023-01-310000769397adsk:OtherAccruedLiabilitiesMemberus-gaap:DesignatedAsHedgingInstrumentMemberus-gaap:ForeignExchangeContractMember2024-01-310000769397adsk:OtherAccruedLiabilitiesMemberus-gaap:DesignatedAsHedgingInstrumentMemberus-gaap:ForeignExchangeContractMember2023-01-310000769397adsk:OtherAccruedLiabilitiesMemberus-gaap:NondesignatedMemberus-gaap:ForeignExchangeContractMember2024-01-310000769397adsk:OtherAccruedLiabilitiesMemberus-gaap:NondesignatedMemberus-gaap:ForeignExchangeContractMember2023-01-310000769397us-gaap:SalesMember2023-02-012024-01-310000769397us-gaap:SalesMember2022-02-012023-01-310000769397us-gaap:SalesMember2021-02-012022-01-310000769397us-gaap:CostOfSalesMember2023-02-012024-01-310000769397us-gaap:CostOfSalesMember2022-02-012023-01-310000769397us-gaap:CostOfSalesMember2021-02-012022-01-310000769397us-gaap:OperatingExpenseMember2023-02-012024-01-310000769397us-gaap:OperatingExpenseMember2022-02-012023-01-310000769397us-gaap:OperatingExpenseMember2021-02-012022-01-310000769397us-gaap:DesignatedAsHedgingInstrumentMember2024-01-310000769397us-gaap:DesignatedAsHedgingInstrumentMember2023-01-310000769397adsk:SubscriptionRevenueMemberus-gaap:DesignatedAsHedgingInstrumentMemberus-gaap:ForeignExchangeContractMember2023-02-012024-01-310000769397us-gaap:DesignatedAsHedgingInstrumentMemberadsk:MaintenanceRevenueMemberus-gaap:ForeignExchangeContractMember2023-02-012024-01-310000769397adsk:CostofSubscriptionandMaintenanceRevenueMemberus-gaap:DesignatedAsHedgingInstrumentMemberus-gaap:ForeignExchangeContractMember2023-02-012024-01-310000769397us-gaap:DesignatedAsHedgingInstrumentMemberus-gaap:SellingAndMarketingExpenseMemberus-gaap:ForeignExchangeContractMember2023-02-012024-01-310000769397us-gaap:DesignatedAsHedgingInstrumentMemberus-gaap:ResearchAndDevelopmentExpenseMemberus-gaap:ForeignExchangeContractMember2023-02-012024-01-310000769397us-gaap:DesignatedAsHedgingInstrumentMemberus-gaap:GeneralAndAdministrativeExpenseMemberus-gaap:ForeignExchangeContractMember2023-02-012024-01-310000769397adsk:SubscriptionRevenueMemberus-gaap:DesignatedAsHedgingInstrumentMemberus-gaap:ForeignExchangeContractMember2022-02-012023-01-310000769397us-gaap:DesignatedAsHedgingInstrumentMemberadsk:MaintenanceRevenueMemberus-gaap:ForeignExchangeContractMember2022-02-012023-01-310000769397adsk:CostofSubscriptionandMaintenanceRevenueMemberus-gaap:DesignatedAsHedgingInstrumentMemberus-gaap:ForeignExchangeContractMember2022-02-012023-01-310000769397us-gaap:DesignatedAsHedgingInstrumentMemberus-gaap:SellingAndMarketingExpenseMemberus-gaap:ForeignExchangeContractMember2022-02-012023-01-310000769397us-gaap:DesignatedAsHedgingInstrumentMemberus-gaap:ResearchAndDevelopmentExpenseMemberus-gaap:ForeignExchangeContractMember2022-02-012023-01-310000769397us-gaap:DesignatedAsHedgingInstrumentMemberus-gaap:GeneralAndAdministrativeExpenseMemberus-gaap:ForeignExchangeContractMember2022-02-012023-01-310000769397us-gaap:NondesignatedMemberus-gaap:ForeignExchangeContractMember2024-01-310000769397us-gaap:NondesignatedMemberus-gaap:ForeignExchangeContractMember2023-01-310000769397us-gaap:AccumulatedGainLossNetCashFlowHedgeParentMember2022-01-310000769397us-gaap:AccumulatedNetUnrealizedInvestmentGainLossMember2022-01-310000769397us-gaap:AccumulatedDefinedBenefitPlansAdjustmentMember2022-01-310000769397us-gaap:AccumulatedTranslationAdjustmentMember2022-01-310000769397us-gaap:AccumulatedGainLossNetCashFlowHedgeParentMember2022-02-012023-01-310000769397us-gaap:AccumulatedNetUnrealizedInvestmentGainLossMember2022-02-012023-01-310000769397us-gaap:AccumulatedDefinedBenefitPlansAdjustmentMember2022-02-012023-01-310000769397us-gaap:AccumulatedTranslationAdjustmentMember2022-02-012023-01-310000769397us-gaap:AccumulatedGainLossNetCashFlowHedgeParentMember2023-01-310000769397us-gaap:AccumulatedNetUnrealizedInvestmentGainLossMember2023-01-310000769397us-gaap:AccumulatedDefinedBenefitPlansAdjustmentMember2023-01-310000769397us-gaap:AccumulatedTranslationAdjustmentMember2023-01-310000769397us-gaap:AccumulatedGainLossNetCashFlowHedgeParentMember2023-02-012024-01-310000769397us-gaap:AccumulatedNetUnrealizedInvestmentGainLossMember2023-02-012024-01-310000769397us-gaap:AccumulatedDefinedBenefitPlansAdjustmentMember2023-02-012024-01-310000769397us-gaap:AccumulatedTranslationAdjustmentMember2023-02-012024-01-310000769397us-gaap:AccumulatedGainLossNetCashFlowHedgeParentMember2024-01-310000769397us-gaap:AccumulatedNetUnrealizedInvestmentGainLossMember2024-01-310000769397us-gaap:AccumulatedDefinedBenefitPlansAdjustmentMember2024-01-310000769397us-gaap:AccumulatedTranslationAdjustmentMember2024-01-310000769397country:US2023-02-012024-01-310000769397country:US2022-02-012023-01-310000769397country:US2021-02-012022-01-310000769397us-gaap:ForeignPlanMember2023-02-012024-01-310000769397us-gaap:ForeignPlanMember2022-02-012023-01-310000769397us-gaap:ForeignPlanMember2021-02-012022-01-310000769397adsk:MandatoryRetirementSavingsCashBalancePlanMember2023-02-012024-01-310000769397adsk:MandatoryRetirementSavingsCashBalancePlanMember2022-02-012023-01-310000769397adsk:MandatoryRetirementSavingsCashBalancePlanMember2021-02-012022-01-310000769397adsk:SupplementaryRetirementSavingsCashBalancePlanMember2023-02-012024-01-310000769397adsk:SupplementaryRetirementSavingsCashBalancePlanMember2022-02-012023-01-310000769397adsk:SupplementaryRetirementSavingsCashBalancePlanMember2021-02-012022-01-310000769397adsk:PayappsMemberus-gaap:SubsequentEventMember2024-02-200000769397adsk:PayappsMemberus-gaap:SubsequentEventMember2024-02-202024-02-200000769397adsk:PayappsLimitedMemberus-gaap:SubsequentEventMember2024-02-202024-02-200000769397adsk:PrepaidExpensesAndOtherCurrentAssetsAndLongTermOtherAssetsMemberadsk:PayappsMemberus-gaap:SubsequentEventMember2024-02-202024-02-200000769397adsk:PIXMemberus-gaap:SubsequentEventMember2024-03-150000769397adsk:PIXMemberus-gaap:SubsequentEventMember2024-03-152024-03-150000769397srt:MinimumMemberadsk:PayappsMemberus-gaap:SubsequentEventMember2024-02-200000769397srt:MaximumMemberadsk:PayappsMemberus-gaap:SubsequentEventMember2024-02-200000769397us-gaap:DevelopedTechnologyRightsMemberadsk:PayappsMemberus-gaap:SubsequentEventMember2024-02-200000769397us-gaap:DevelopedTechnologyRightsMemberadsk:PIXMemberus-gaap:SubsequentEventMember2024-03-150000769397us-gaap:DevelopedTechnologyRightsMemberus-gaap:SubsequentEventMember2024-03-150000769397adsk:PayappsMemberus-gaap:SubsequentEventMemberus-gaap:CustomerRelationshipsMember2024-02-200000769397adsk:PIXMemberus-gaap:SubsequentEventMemberus-gaap:CustomerRelationshipsMember2024-03-150000769397us-gaap:SubsequentEventMemberus-gaap:CustomerRelationshipsMember2024-03-150000769397adsk:PayappsMemberus-gaap:SubsequentEventMemberus-gaap:TradeNamesMember2024-02-200000769397adsk:PIXMemberus-gaap:SubsequentEventMemberus-gaap:TradeNamesMember2024-03-150000769397us-gaap:SubsequentEventMemberus-gaap:TradeNamesMember2024-03-150000769397us-gaap:SubsequentEventMember2024-03-150000769397adsk:AetherMediaIncMemberus-gaap:SubsequentEventMember2024-05-202024-05-200000769397adsk:SteveBlumMember2023-02-012024-01-310000769397adsk:SteveBlumMember2023-11-012024-01-310000769397adsk:SteveBlumMember2024-01-3100007693972023-11-012024-01-310000769397adsk:PartnerProgramReservesMember2023-01-310000769397adsk:PartnerProgramReservesMember2023-02-012024-01-310000769397adsk:PartnerProgramReservesMember2024-01-310000769397adsk:PartnerProgramReservesMember2022-01-310000769397adsk:PartnerProgramReservesMember2022-02-012023-01-310000769397adsk:PartnerProgramReservesMember2021-01-310000769397adsk:PartnerProgramReservesMember2021-02-012022-01-31
UNITED STATES
SECURITIES AND EXCHANGE COMMISSION
Washington, D.C. 20549
_____________________________________________________________
FORM 10-K
| | | | | |
| ☒ | ANNUAL REPORT PURSUANT TO SECTION 13 OR 15(D) OF THE SECURITIES EXCHANGE ACT OF 1934 |
For the fiscal year ended January 31, 2024
or
| | | | | |
| ☐ | TRANSITION REPORT PURSUANT TO SECTION 13 OR 15(D) OF THE SECURITIES EXCHANGE ACT OF 1934 |
For the transition period from to
Commission File Number: 0-14338
_____________________________________________________________
AUTODESK, INC.
(Exact name of registrant as specified in its charter) | | | | | | | | | | | |
| Delaware | | | 94-2819853 |
(State or other jurisdiction
of incorporation or organization) | | | (I.R.S. employer
Identification No.) |
| | | |
| One Market Street, Ste. 400 | | | |
| San Francisco, | California | | 94105 |
| (Address of principal executive offices) | | | (Zip Code) |
Registrant’s telephone number, including area code: (415) 507-5000
_____________________________________________________________
Securities registered pursuant to Section 12(b) of the Act:
| | | | | | | | | | | | | | |
| Title of each class | | Trading Symbol(s) | | Name of each exchange
on which registered |
| Common Stock, $0.01 Par Value | | ADSK | | The Nasdaq Global Select Market |
Securities registered pursuant to Section 12(g) of the Act: None
_____________________________________________________________
Indicate by check mark if the registrant is a well-known seasoned issuer, as defined in Rule 405 of the Securities Act. Yes ☐ No ☒
Indicate by check mark if the registrant is not required to file reports pursuant to Section 13 or Section 15(d) of the Securities Exchange Act of 1934 (“Exchange Act”). Yes ☐ No ☒
Indicate by check mark whether the registrant (1) has filed all reports required to be filed by Section 13 or 15(d) of the Exchange Act during the preceding 12 months (or for such shorter period that the registrant was required to file such reports), and (2) has been subject to such filing requirements for the past 90 days. Yes ☒ No ☐
Indicate by check mark whether the registrant has submitted electronically every Interactive Data File required to be submitted pursuant to Rule 405 of Regulation S-T (§232.405 of this chapter) during the preceding 12 months (or for such shorter period that the registrant was required to submit and post such files). Yes ☒ No ☐
Indicate by check mark whether the registrant is a large accelerated filer, an accelerated filer, a non-accelerated filer, a smaller reporting company or an emerging growth company. See the definitions of “large accelerated filer,” “accelerated filer,” “smaller reporting company” and “emerging growth company” in Rule 12b-2 of the Exchange Act. | | | | | | | | | | | | | | | | | | | | | | | | | | | | | |
| Large accelerated filer | x | Accelerated filer | ☐ | Non-accelerated filer | ☐ | Smaller reporting company | ☐ | Emerging growth company | ☐ |
If an emerging growth company, indicate by check mark if the registrant has elected not to use the extended transition period for complying with any new or revised financial accounting standards provided pursuant to Section 13(a) of the Exchange Act. ☐
Indicate by check mark whether the registrant has filed a report on and attestation to its management’s assessment of the effectiveness of its internal control over financial reporting under Section 404(b) of the Sarbanes-Oxley Act (15 U.S.C. 7262(b)) by the registered public accounting firm that prepared or issued its audit report. ☒
If securities are registered pursuant to Section 12(b) of the Act, indicate by check mark whether the financial statements of the registrant included in the filing reflect the correction of an error to previously issued financial statements. ☐
Indicate by check mark whether any of those error corrections are restatements that required a recovery analysis of incentive-based compensation received by any of the registrant’s executive officers during the relevant recovery period pursuant to §240.10D-1(b). ☐
Indicate by check mark whether the registrant is a shell company (as defined by Rule 12b-2 of the Exchange Act). Yes ☐ No ☒
As of July 31, 2023, the last business day of the registrant’s most recently completed second fiscal quarter, there were approximately 213.5 million shares of the registrant’s common stock outstanding that were held by non-affiliates, and the aggregate market value of such shares held by non-affiliates of the registrant (based on the closing sale price of such shares on the Nasdaq Global Select Market on July 31, 2023) was approximately $45.3 billion. Shares of the registrant’s
common stock held by each executive officer and director have been excluded in that such persons may be deemed to be affiliates. This determination of affiliate status is not necessarily a conclusive determination for other purposes.
As of March 31, 2024, the registrant had outstanding 215,446,979 shares of common stock.
EXPLANATORY NOTE
As previously announced on April 1, 2024, the Audit Committee of the Board of Directors (the “Committee”), assisted by outside counsel and advisors, initiated an internal investigation regarding the Company’s free cash flow and non-GAAP operating margin practices (the “Investigation”). The Committee has completed its planned procedures with respect to the Investigation.
The Company’s management has determined that there will be no restatement or adjustment of any audited or unaudited, filed or previously announced, GAAP or non-GAAP financial statements, or any change to the information in the Company’s earnings release on February 29, 2024 or the Company’s previously issued guidance.
The relevant time period for the Investigation was fiscal years 2022, 2023, and 2024. A summary of the principal findings of the Committee are set forth below:
•The Company has historically relied on multiyear contracts with its enterprise and product subscription customers, billed upfront, to help meet its free cash flow targets. During the relevant period, the Company engaged in programs designed to incentivize customers to accept multiyear upfront billing, renew early, and/or pay before the end of the fiscal year.
•The Company has disclosed its practice of incentivizing customers to adopt multiyear upfront billing arrangements. It has also acknowledged that discounted multiyear upfront contracts reduce revenue and lower billings in out years. Though prior to fiscal year 2024, the Company did not quantify free cash flow attributable to multiyear upfront billings, it has noted the contribution of upfront collections to fluctuations in the Company’s quarterly reported long-term deferred revenue.
•During fiscal year 2022, the Company announced that it had begun to shift enterprise customers to contracts billed annually, and that it had assumed fiscal 2023 enterprise contracts would be billed annually. The Company subsequently determined, however, to pursue multiyear upfront contracts with enterprise customers to help meet its fiscal year 2023 free cash flow goal. Upfront billings of enterprise customers in fiscal year 2023 substantially exceeded historical levels, helping the Company to meet its lowered annual free cash flow target.
•In addition, during the relevant period, certain decisions regarding discretionary spending, collections, and accounts payable were informed by their anticipated effects on the Company’s external free cash flow and/or non-GAAP operating margin targets. The resulting actions generally served to reduce reported free cash flow and/or lower reported margin in the current period. Though free cash flow was one factor in the Company’s executive compensation program, these decisions were not calculated to influence compensation outcomes.
The Committee proposed certain remedial measures including: reviewing certain processes around financial communications and disclosures; assessing certain Company organizational functions and responsibilities; and adopting and enhancing policies, processes, and controls related to the matters investigated.
The Company separately notes that multiyear upfront billings of enterprise customers in fiscal year 2024 was substantially lower than fiscal years 2022 and 2023.
Elizabeth (Betsy) Rafael has been appointed by the Board as Interim Chief Financial Officer (Principal Financial Officer), effective May 31, 2024. As Interim Chief Financial Officer, she is not currently an “independent director” for purposes of the Nasdaq Stock Market and has stepped down from the Committee. She remains a director of the Company.
Deborah L. Clifford has been appointed as the Company’s Chief Strategy Officer, reporting to the Chief Executive Officer, effective May 31, 2024. Her responsibilities will include, among other things, corporate development, new vertical businesses that are outside our existing product groups, and the company’s Social Impact and Sustainability efforts.
AUTODESK, INC. FORM 10-K
TABLE OF CONTENTS
| | | | | | | | |
| | | Page |
| | |
| | |
| Item 1. | | |
| | |
| Item 1A. | | |
| | |
| Item 1B. | | |
| | |
| Item 1C. | | |
| | |
| Item 2. | | |
| | |
| Item 3. | | |
| | |
| Item 4. | | |
| | |
| | |
| | |
| Item 5. | | |
| | |
| Item 6. | | |
| | |
| Item 7. | | |
| | |
| Item 7A. | | |
| | |
| Item 8. | | |
| | |
| Item 9. | | |
| | |
| Item 9A. | | |
| | |
| Item 9B. | | |
| | |
| Item 9C. | | |
| | |
| | |
| | |
| Item 10. | | |
| | |
| Item 11. | | |
| | |
| Item 12. | | |
| | |
| Item 13. | | |
| | |
| Item 14. | | |
| | |
| | |
| | |
| Item 15. | | |
| | |
| Item 16. | | |
| | |
| | |
FORWARD-LOOKING INFORMATION
The discussion in this Annual Report on Form 10-K contains trend analyses and other forward-looking statements within the meaning of Section 27A of the Securities Act of 1933 and Section 21E of the Securities Exchange Act of 1934. Forward-looking statements may appear throughout this Annual Report on Form 10-K, including the following sections: “Business” (Part I, Item 1), “Risk Factors” (Part I, Item 1A), and “Management’s Discussion and Analysis of Financial Condition and Results of Operations” (Part II, Item 7). Forward-looking statements are any statements that look to future events and consist of, among other things, our business strategies; future financial results (by product type and geography), operational and key metrics and subscriptions; the effects of global economic and political conditions, including the impact of economic volatility and geopolitical activities in certain countries such as the Russian invasion of Ukraine; the impact of past and planned acquisitions and investment activities; expected market trends and market opportunities; our ability to successfully expand adoption of our products; our ability to gain market acceptance of new businesses and sales initiatives; cybersecurity and privacy issues or incidents; the effect of competition; the effect of unemployment; the availability of credit; the effects of revenue recognition; the effects of newly recently issued accounting standards; expected trends in certain financial metrics, including expenses; expectations regarding our cash needs and expenditures; the effects of fluctuations in exchange rates and our hedging activities on our financial results; the effect of laws and regulations that we are subject to; the timing and amount of purchases under our stock repurchase plan; and the effects of potential non-cash charges on our financial results and the resulting effect on our financial results. In addition, forward-looking statements also consist of statements involving expectations regarding product capability and acceptance, statements regarding our liquidity and short-term and long-term cash requirements, as well as statements involving trend analyses and statements including such words as “may,” “believe,” “could,” “anticipate,” “would,” “might,” “plan,” “expect,” and similar expressions or the negative of these terms or other comparable terminology. These forward-looking statements speak only as of the date of this Annual Report on Form 10-K and are subject to business and economic risks. As such, our actual results could differ materially from those set forth in the forward-looking statements as a result of a number of factors, including those set forth below in Item 1A, “Risk Factors,” and in our other reports filed with the U.S. Securities and Exchange Commission. We assume no obligation to update the forward-looking statements to reflect events that occur or circumstances that exist after the date on which they were made, except as required by law.
PART I
ITEM 1.BUSINESS
Note: A glossary of terms used in this Form 10-K appears at the end of this Item 1.
GENERAL
We are a global leader in 3D design, engineering and entertainment technology solutions, spanning architecture, engineering, construction, product design, manufacturing, media, and entertainment. Our customers design, fabricate, manufacture, and build anything by visualizing, simulating, and analyzing real-world performance early in the design process. These capabilities allow our customers to foster innovation, optimize their designs, streamline their manufacturing and construction processes, save time and money, improve quality, deliver more sustainable outcomes, communicate plans, and collaborate with others. Our professional software products are sold globally through a combination of indirect and direct channels.
Corporate Information
Our internet address is www.autodesk.com. The information posted on our website is not incorporated into this Annual Report on Form 10-K. Our Annual Report on Form 10-K, Quarterly Reports on Form 10-Q, Current Reports on Form 8-K, and amendments to reports filed or furnished pursuant to Sections 13(a) and 15(d) of the Securities Exchange Act of 1934, as amended, are available free of charge on the Investor Relations portion of our website at www.autodesk.com as soon as reasonably practicable after we electronically file such material with, or furnish it to, the SEC.
PRODUCTS
Our architecture, engineering, and construction products improve the way building, infrastructure, and industrial projects are designed, built, and operated. Our product development and manufacturing software provides manufacturers in automotive, transportation, industrial machinery, consumer products, and building product industries with comprehensive digital design, engineering, manufacturing, and production solutions. These technologies bring together data from all phases of the product development and production life cycle, creating a digital pipeline that supports greater productivity, accuracy through process automation, and insights that enable more sustainable outcomes. Our digital media and entertainment products provide tools for digital sculpting, modeling, animation, effects, rendering, and compositing for design visualization, visual effects, games production, and enables connection of workflows and data from pre-production to post-production. Our portfolio of products and services enables our customers to foster innovation, optimize and improve their designs, save time and money, improve quality, communicate plans, and collaborate with others. A summary of our revenue by geographic area and product family is found in Part II, Item 8, Note 2, “Revenue Recognition,” in the Notes to Consolidated Financial Statements.
Autodesk’s product offerings include:
Architecture, Engineering and Construction (“AEC”)
•Architecture, Engineering & Construction Collection
The AEC Collection, including AutoCAD, AutoCAD Civil3D, and Revit, aims to help our customers design, engineer, and construct higher quality, more predictable building and civil infrastructure projects, commonly used by AEC industry experts.
•AutoCAD Civil 3D
AutoCAD Civil 3D solution provides a surveying, design, analysis, and documentation solution for civil engineering, including land development, transportation, and environmental projects. Using a model-centric approach that automatically updates documentation as design changes are made, AutoCAD Civil 3D enables civil engineers, designers, drafters, and surveyors to significantly boost productivity and deliver higher-quality designs and construction documentation faster. With AutoCAD Civil 3D, the entire project team works from the same consistent, up-to-date model so they stay coordinated throughout all project phases.
•Autodesk Build
Autodesk Build delivers a connected set of project management and collaboration tools for the construction industry. Autodesk Build provides a toolset for managing, sharing, and accessing project documents that results in streamlined workflows between the office, trailer, and jobsite. In addition, Autodesk Build can be used to track the quality and safety of the project with issues and forms. Team members can use Autodesk Build for requests for information (RFIs), submittals, and meetings to manage the flow of information and track project progress across the construction timeline. The PlanGrid Build mobile app delivers field critical project information and collaboration from Autodesk Build to the jobsite. As part of Autodesk Construction Cloud, Build connects data originating in design and preconstruction to the construction and operations phase, allowing users to identify, manage and de-risk project decisions.
•BIM Collaborate Pro
Autodesk BIM Collaborate Pro is cloud-based design collaboration and design management software that enables teams to: organize project data, democratize access, and connect; improve project visibility to deliver on time; and work together on increasingly complex projects.
•Building Connected
BuildingConnected is a SaaS preconstruction solution that combines the largest real-time, construction network with an easy-to-use tool that helps general contractors and owners streamline subcontractor qualification, and the bid and risk management process.
•Revit
Revit software is built for Building Information Modeling (“BIM”) to help professionals design, build, and maintain higher-quality, more energy-efficient buildings. Using the information-rich models created with Revit, architects, engineers, and construction firms can collaborate to make better-informed decisions earlier in the design process to deliver projects with greater efficiency. Revit includes features for architectural, mechanical, electrical, and plumbing design as well as structural engineering and construction, providing a comprehensive solution for the entire building project team.
AutoCAD and AutoCAD LT
•AutoCAD
AutoCAD software is a customizable and extensible CAD application for professional design, drafting, detailing, and visualization. AutoCAD software provides digital tools that can be used independently and in conjunction with other specific applications in fields ranging from construction and civil engineering to manufacturing and plant design.
•AutoCAD LT
AutoCAD LT software is purpose built for professional drafting and detailing. AutoCAD LT includes document sharing capability without the need for software customization or certain advanced functionality found in AutoCAD. Users can share all design data with team members who use AutoCAD or other Autodesk products built on AutoCAD.
Manufacturing (“MFG”)
•Fusion (Formerly Fusion 360)
Fusion is the first 3D CAD, CAM, and computer-aided engineering (“CAE”) tool of its kind. It connects the entire product development process on a single cloud-based platform.
•Inventor
Inventor enables manufacturers to go beyond 3D design to digital prototyping by giving engineers a comprehensive and flexible set of tools for 3D mechanical design, simulation, analysis, tooling, visualization, and documentation. Engineers can integrate AutoCAD drawings and model-based design data into a single digital model, creating a virtual representation of a final product that enables them to validate the form, fit, and function of the product before it is ever built.
•Product Design & Manufacturing Collection
The Product Design & Manufacturing Collection offers connected, professional-grade tools that help our customers make great products today and compete in the changing manufacturing landscape of the future. The collection offers access to a wide range of our products, including AutoCAD, Fusion, Vault, and Inventor.
•Vault
Vault data management software makes it easier to manage data in one central location, accelerate design processes, and streamline internal/external collaboration. Vault integrates with more than 30 Autodesk design applications, provides powerful revisioning and access control capabilities, and enables customers to share product data securely to improve engineering cycle time and reduce manufacturing errors.
Media and Entertainment (“M&E”)
•Flow Production Tracking (currently ShotGrid)
Flow Production Tracking is cloud-based software for review and production tracking in the M&E industry. Creative companies use the Flow Production Tracking platform to provide essential business tools for managers and visual collaboration tools for artists and supervisors, who often work globally with distributed teams.
•Maya
Maya software provides 3D modeling, animation, effects, rendering, and compositing solutions that enable film and video artists, game developers, and design visualization professionals to digitally create engaging, lifelike images, realistic animations and simulations, extraordinary visual effects, and full-length animated feature films.
•Media & Entertainment Collection
The M&E Collection provides end-to-end creative tools for entertainment creation. This collection enables animators, modelers, and visual effects artists to access the tools they need, including Maya and 3ds Max, to create compelling effects, 3D characters, and digital worlds.
•3ds Max
3ds Max software provides 3D modeling, animation, and rendering solutions that enable game developers, design visualization professionals, and visual effects artists to digitally create realistic images, animations, and complex scenes and to digitally communicate abstract or complex mechanical, architectural, engineering, and construction concepts.
PRODUCT DEVELOPMENT AND INTRODUCTION
The technology industry is characterized by rapid technological change in computer hardware, operating systems, and software. In addition, our customers’ requirements and preferences rapidly evolve, as do their expectations of the performance of our software and services. To keep pace with these changes, we maintain a vigorous program of new product development to address demands in the marketplace for our products, such as enabling more flexibility and sustainable outcomes.
With the new transaction model, we are approaching the final phase of modernizing our go-to-market motion, which includes building more durable and direct relationships with our customers, updating our data infrastructure, and retiring old
information systems and business models. We are undertaking a multi-year process to develop lifecycle solutions within and between our industry clouds, powered by shared platform services, and with our data model at its core. Together, these will help enable Autodesk, its customers, and partners, to create more valuable, data-driven, and connected products and services.
Subscription plan offerings are designed to give our customers increased flexibility with how they use our products and service offerings and to attract a broader range of customers such as project-based users and small businesses. Subscription plans represent a combined hybrid offering of desktop software and cloud functionality which provides a device-independent, collaborative design workflow for designers and their stakeholders.
We dedicate considerable technical and financial resources to research and development to deliver additional automation and insights to our customers through artificial intelligence (“AI”), machine learning, and generative design, which increase efficiency and sustainability and reduce waste. These investments further enhance our existing products and create new solutions and technologies which connect the workflows and data of our customers across the ecosystem of their projects and expand our market opportunity. Our tools connect and automate the phases of design and creation, enabling greater collaboration and the seamless flow of data for individuals and teams across all phases.
Our software is primarily developed internally; however, we also use independent firms and contractors to perform some of our product development activities. Additionally, we acquire or license products and technologies developed by third parties. We continually review these investments to ensure that we are generating sufficient revenue or gaining a competitive advantage to justify their costs.
The majority of our research and product development is performed in the United States, Canada, China, India, Singapore, and the United Kingdom. However, we employ experienced software developers in many of our other locations. Translation and localization of our products are performed in several local markets, principally Singapore and Ireland. We generally localize and translate our products into German, French, Italian, Spanish, Japanese, Korean, and simplified and traditional Chinese.
We plan to continue managing significant product development operations internationally over the next several years. We believe that our ability to conduct research and development at various locations throughout the world allows us to tap into a diverse global talent pool, optimize costs, and integrate local market knowledge into our development activities. We continually assess costs, hiring challenges, and intellectual property protection, against the benefits of our international development activities.
For further discussion regarding risks from our product development and introduction efforts, see Item 1A, “Risk Factors.”
MARKETING AND SALES
We sell our products and services globally, through a combination of direct and indirect channels. We transact directly with our enterprise and named account customers, with customers through our online Autodesk branded store, and with certain customers through our new transaction model whereby channel partners provide a quote to customers but the actual transaction occurs directly between Autodesk and the customer. We introduced this new transaction model for our token-based Flex offering in certain countries globally, and for most of our subscription offerings in Australia during fiscal 2024. Dependent upon successful implementation in Australia, we intend to transition our indirect business to the new transaction model more broadly for most of our subscription offerings in North America and certain countries in Europe, Middle East, and Africa (“EMEA”) and Asia Pacific (“APAC”) during fiscal 2025 and fiscal 2026. The new transaction model is anticipated to help customers with enhanced control and time savings through self-service, consistent pricing, and a more personalized buying experience. Also, it will give partners and Autodesk access to essential data to improve our offerings and the customers’ buying experience. Our indirect channel model includes both a two-tiered distribution structure, where distributors sell to resellers, and a one-tiered structure, where Autodesk sells directly to resellers. We have a network of approximately 1,450 resellers and distributors worldwide. For fiscal 2024, approximately 63% of our revenue was derived from indirect channel sales through distributors and resellers. We employ a variety of incentive programs and promotions to align our direct and indirect channels with our business strategies.
We anticipate that our channel mix will continue to change as we scale our business. With the continued growth of our online Autodesk branded store, the transition to annual billings for multi-year contracts and the introduction of our new transaction model, we will be decreasing our sales through value-added resellers and distributors and transacting directly with more end customers without substantial disruption to our revenue. We expect our indirect channel will continue to transact and support a considerable portion of our customers, particularly in emerging regions and with federal governments. Our ability to
effectively distribute our products depends in part upon the financial and business condition of our distributor, reseller and Solution Provider networks. The loss of, or a significant reduction in, business with any one of our major distributors, large resellers or Solution Providers could harm our business. See Item 1A, “Risk Factors,” for further discussion. The transition to annual billings for multi-year contracts impacted the timing of our billings and cash collections in fiscal year 2024 and we expect this impact to continue into fiscal year 2025. See Part II, Item 7, “Management's Discussion and Analysis of Financial Condition and Results of Operations,” for further discussion.
Revenue through our largest distributor, TD Synnex Corporation and its global affiliates (collectively, “TD Synnex”), accounted for 39%, 37%, and 36% of our net revenue for the fiscal years ended January 31, 2024, 2023 and 2022, respectively. Ingram Micro Inc. (“Ingram Micro”), our second-largest distributor, accounted for 7%, 9%, and 9% of Autodesk's total net revenue for the fiscal years ended January 31, 2024, 2023 and 2022, respectively. During fiscal 2023, we entered into transition agreements with certain of our distributors, including TD Synnex and Ingram Micro, to provide transition distribution activities for a one-to-two-year period, with potential extensions. In connection with the transition agreements, we intend to increase our selling efforts with value-added resellers and Solution Providers in connection with our new transaction model. Consequently, we believe our business is not substantially dependent on TD Synnex or Ingram Micro. No other distributor, reseller, or direct customer accounted for 10% or more of our revenue.
Our customer-related operations are divided into three geographic regions: the Americas; EMEA; and APAC. Each geographic region is supported by global marketing and sales organizations. These organizations develop and manage overall marketing and sales programs and work closely with a network of domestic and international sales offices. We believe that international sales will continue to comprise the majority of our total net revenue. Adverse economic conditions and currency exchange rates in the countries that contribute a significant portion of our net revenue, including emerging economies, may have an adverse effect on our business in those countries and our overall financial performance. Our international operations and sales subject us to a variety of risks. See Item 1A, “Risk Factors,” for further discussion.
We also work directly with reseller, distributor, and Solution Provider partner organizations, computer manufacturers, other software developers, and peripherals manufacturers in cooperative advertising, promotions, and trade-show presentations. We employ mass-marketing techniques such as webcasts, seminars, telemarketing, direct mailings, sponsorships, advertising in business and trade journals, and social media. We have a worldwide user group organization and we have created online user communities dedicated to the exchange of information related to the use of our products and services.
We generate revenue primarily through various offerings that provide recurring revenue. Under our subscription plan, customers can use our software anytime, anywhere, and get access to the latest updates to previous versions through term-based product subscriptions, cloud service offerings, and enterprise business agreements (“EBA”). Historically, we have had increased EBA sale activity in our fourth fiscal quarter. This seasonality may not have an immediate impact on our revenue as we recognize subscription revenue over the term of the contract. This seasonality may also affect the relative value of our billings, Remaining Performance Obligations (“RPO”), and collections in the fourth and first fiscal quarters.
CUSTOMER AND RESELLER SUPPORT
We provide technical support and training to customers through a multi-tiered support model, augmented by direct programs designed to address certain specific customer needs. Most of our customers receive support and training from the resellers and distributors from which they purchased subscriptions or licenses for our products or services, with Autodesk in turn providing second-tier support to the resellers and distributors. Other customers are supported directly via self-service using the Autodesk Knowledge Network, which guides customers to answers in our online support assets, support forums, or webinars, or to support representatives using different modalities such as social media, phone, email, and webchat. We also support our resellers and distributors through technical product training, sales training classes, webinars, and other knowledge-sharing programs.
ENVIRONMENTAL, SOCIAL, AND GOVERNANCE PROGRAMS
Impact at Autodesk
Autodesk is committed to advancing a more sustainable, resilient, and equitable world. We don’t believe in waiting for progress, we believe in making it. We take action as a business to support our employees, customers, and communities in our collective opportunity to design and make a better world for all.
We focus our efforts to advance positive outcomes across three primary areas: energy and materials, health and resilience, and work and prosperity. These impact opportunity areas are derived from the UN Sustainable Development Goals (“SDGs”) and have been identified through a multi-pronged process to align the top needs of our stakeholders, the issues that are most important to our business, and the areas we are best placed to accelerate positive impact at scale.
These opportunities primarily manifest as outcomes through how our customers leverage our technology to design and make net-zero carbon buildings, resilient infrastructure, more sustainable products, and a thriving workforce. We support and amplify these opportunities through powering our business with 100% renewable energy, neutralizing greenhouse gas emissions associated with our operations, developing an inclusive culture and supporting students and educators with tools and training to equip the next generation of innovators. We advance these opportunities with industry innovators through collaboration with our customers and partners, deploying philanthropic capital to changemakers, and providing software donations, and training to our wider ecosystem. Autodesk committed to target 1% of annual operating profit for the long-term support of our impact programs, which includes our philanthropic work and our climate commitments.
Education
Autodesk is committed to helping students gain the in-demand skills and certifications needed to demonstrate they are prepared for current and emerging roles in the industries we serve. We offer free educational licenses of Autodesk’s complete portfolio of professional software to verified students, educators, and accredited educational institutions worldwide. Additionally, we offer self-paced, modular learning and curriculum for K-12, post-secondary students, and educators. Our intention is to make Autodesk software the preferred choice for those poised to become the next generation of design, engineering, and construction professionals.
Sustainability
Climate Change
In addressing the global challenges posed by climate change, we make it possible for our customers to innovate and respond to associated changes in regulation, building code, physical climate parameters, and other climate-related developments. This effort can directly and indirectly create more demand for existing and new Autodesk products and services in the short and long-term. Furthermore, our leadership is committed to taking climate action and that commitment goes hand in hand with our values and reputation in the marketplace.
Climate Change Management Actions
To drive continued progress and meet growing demand, we continue to expand the solutions, education, and support we offer, helping customers secure a competitive advantage for a low-carbon future by designing high-performance buildings, resilient cities and infrastructure, and more efficient transportation and products. To continue to grow this market, we invest in our tools to meet customer’s demand as well as provide software and support to early-stage entrepreneurs, nonprofit organizations, and start-up companies who are designing clean technologies. We are expanding these offerings based upon demand and opportunity in response to challenges posed by climate change.
Internally, we are investing in best practices to mitigate our greenhouse gas emissions (“GHGs”) and climate change risk through investments in renewable energy, energy efficiency, and disaster management and recovery strategies. Our Enterprise Risk Management process considered how climate impacts could affect and potentially amplify the overall significance of each identified risk and opportunity. We regularly assess the evolving issues around climate and inequality and respond accordingly. In fiscal year 2022, we deployed a new sustainability financing framework to accelerate new and existing efforts in these areas, including issuing a $1 billion sustainability bond to support eligible projects and initiatives.
Emissions Performance & Other Key Performance Indicators
In fiscal year 2023, we made progress on our science-based GHG reduction target, to reduce Scope 1 and Scope 2 GHGs 50%, and reduce Scope 3 GHGs per dollar of gross profit 55%, by fiscal year 2031, compared to fiscal year 2020. Additionally, in fiscal 2023, we were responsible for 115,000 metric tons of carbon dioxide equivalent emissions across our market-based operational boundary. This represents a 50% reduction compared to our fiscal year 2020 base line. In addition, our residual 115,000 metric tons of CO2e emissions were neutralized through the procurement of high quality carbon offsets and removals.
Impact Reports
More information about our sustainability financing and commitment can be found in our annual Impact Reports, which we have published on our website since 2008. Our fiscal 2024 Impact Report will be published in the second quarter of fiscal 2025. Information contained on or accessible through our website is not part of or incorporated by reference into this report.
Philanthropy
The Autodesk Foundation (the “Foundation”), a privately funded 501(c)(3) charity organization established and solely funded by us, leads our philanthropic efforts. The purpose of the Foundation is twofold: to support employees to create a better world at work, at home, and in the community by matching employees’ volunteer time and donations to nonprofit organizations; and to support organizations using design and make solutions to drive positive social and environmental impact. In the latter case, we use philanthropic capital, software donations, and training to accomplish this goal, selecting the most impactful and innovative organizations around the world who are innovating to create a better future for our planet. On our behalf, the Foundation also administers a discounted software donation program to nonprofit organizations, social and environmental entrepreneurs, and others who are developing design solutions that will shape a more sustainable future.
DEVELOPER PROGRAMS
Our business and our customers benefit from our relationships with an extensive developer network. These developers create and sell their own interoperable products that further enhance the range of integrated solutions available to our customers. One of our key strategies is to maintain an API based architecture of our software products to facilitate third-party development of complementary products and industry-specific software solutions. This approach enables customers and third parties to customize solutions for a wide variety of highly specific uses. We offer several programs that provide strategic investment funding, technological platforms, user communities, technical support, forums, and events to developers who develop add-on applications for our products. For example, we have established the Autodesk Platform Services to support innovators that build solutions to facilitate the development of a single connected ecosystem for the future of how things are designed, made, and used. Autodesk Platform Services facilitates the development of a single connected ecosystem for integrating Autodesk applications with other enterprise, web, and mobile solutions.
COMPETITION
The markets for our products are highly competitive, are subject to rapid change, and can have complex interdependencies between many of the larger businesses. We strive to increase our competitive separation by investing in research and development, allowing us to bring new products to market and create exciting new versions of existing products that offer compelling efficiencies for our customers. We also compete through investments in marketing and sales to more effectively reach new customers and better serve existing customers.
Our competitors include large, global, publicly traded companies; small, geographically focused firms; startup firms; and solutions produced in-house by their users. Our primary global competitors include Adobe Systems Incorporated, Bentley Systems, Inc., Dassault Systèmes S.A. and its subsidiary Dassault Systèmes SolidWorks Corp., Intergraph Corporation, a wholly owned subsidiary of Hexagon AB, MSC Software Corporation, Nemetschek AG, Oracle Corporation, Procore Technologies, Inc., PTC Inc., 3D Systems Corporation, Siemens PLM, and Trimble Navigation Limited, among others.
The software industry has limited barriers to entry, and the availability of computing power with continually expanding performance at progressively lower prices contributes to the ease of market entry. The industry continues to undergo a platform shift from the personal computer to cloud and mobile computing. This shift further lowers barriers to entry and poses a disruptive challenge to established software companies. The design software market is characterized by vigorous competition in each of the vertical markets in which we compete, both from existing competitors and by entry of new competitors with innovative technologies. Competition is increasingly enhanced by consolidation of companies with complementary products
and technologies and the possibility that competitors in one vertical segment may enter other vertical segments that we serve. In addition, some of our competitors in certain markets have greater financial, technical, sales and marketing, and other resources than we do. Because of these and other factors, competitive conditions in these industries are likely to continue to intensify in the future. Increased competition could result in price reductions, reduced net revenue and profit margins, and loss of market share, any of which could harm our business. See Item 1A, “Risk Factors,” for further discussion of risks regarding competition.
We believe that our future results depend largely upon our ability to better serve customers by offering new products, including cloud and mobile computing products, whether by internal development or acquisition, and to continue to provide existing product offerings that compete favorably with respect to ease of use, reliability, performance, range of useful features, continuing product enhancements, reputation, price, and training.
INTELLECTUAL PROPERTY AND LICENSES
We maintain an active program to legally protect our investment in technology through intellectual property rights. We protect our intellectual property through a combination of patent, copyright, trademark, and trade secret protections, confidentiality procedures, and contractual provisions. The nature and extent of legal protection associated with each such intellectual property right depends on, among other things, the type of intellectual property right and the given jurisdiction in which such right arises. We believe that our intellectual property rights are valuable and important to our business.
Nonetheless, our intellectual property rights may not be successfully asserted in the future or may be invalidated, circumvented, or challenged. In addition, the laws and enforcement of the laws of various foreign countries where our products are distributed do not protect our intellectual property rights to the same extent as U.S. laws. Enforcement of intellectual property rights against alleged infringers can sometimes lead to costly litigation and counterclaims. Our inability to protect our proprietary information could harm our business.
From time to time, we receive claims alleging infringement of a third party’s intellectual property rights, including patents. Disputes involving our intellectual property rights or those of another party have in the past and may in the future lead to, among other things, costly litigation or product shipment delays, which could harm our business.
We retain ownership of software we develop. Our combined hybrid offerings include both desktop software and cloud functionality. Desktop software is licensed to users pursuant to ‘click through’ or signed license agreements containing restrictions on duplication, disclosure, and transfer. Cloud software and associated services are provided to users pursuant to online or signed terms of service agreements containing restrictions on access and use.
We believe that because of the limitations of laws protecting our intellectual property and the rapid, ongoing technological changes in both the computer hardware and software industries, we must rely principally upon software engineering and marketing skills to continually maintain and enhance our competitive market position.
While we have recovered some revenue resulting from the unauthorized use of our software solutions, we are unable to measure the full extent to which unauthorized use of our software products exists. We believe, however, that unauthorized use of our software is and can be expected to be a persistent problem that negatively impacts our revenue and financial results. We believe that our transition from perpetual use software licenses to a subscription-based business model combined with the change from desktop to cloud-based computing will shift the incentives and means by which software is used without authorization.
In addition, through various licensing arrangements, we receive certain rights to intellectual property of others. We expect to maintain current licensing arrangements and to secure licensing arrangements in the future, as needed and to the extent available on reasonable terms and conditions, to support continued development and sales of our products and services. Some of these licensing arrangements require or may require royalty payments and other licensing fees. The amount of these payments and fees may depend on various factors, including but not limited to: the structure of royalty payments, offsetting considerations, if any, and the degree of use of the licensed technology.
See Item 1A, “Risk Factors,” for further discussion of risks related to protecting our intellectual property.
PRODUCTION AND SUPPLIERS
The production of our software products and services involves duplication or hosting of software media. The way that we deliver software has evolved during our business model transition. For certain cloud-based products, we use a combination of co-located hosting facilities and increasingly Amazon Web Services and to a lesser degree other infrastructure-as-a-service providers. We offer customers an electronic software download option for both initial product fulfillment and subsequent product updates. Customers who choose electronic fulfillment receive the latest version of the software from our vendor’s secure servers. Customers may also obtain our software through media such as DVDs and USB flash drives available from multiple sources.
TALENT AND HUMAN CAPITAL MANAGEMENT
Our employees play a central role in the success of our long-term strategy. Autodesk’s Culture Code defines values and behaviors that support our commitment to being a customer company, where each employee takes responsibility for understanding our customers’ needs, expectations, and experiences. As of January 31, 2024, we employed approximately 14,100 people, an increase from approximately 13,700 employees as of the end of fiscal year 2023. None of our employees in the United States are represented by a labor union. In certain foreign countries, our employees are represented by trade unions or works councils. We have never experienced any work stoppages and believe our employee relations are strong. Reliance upon employees in other countries entails various risks and changes in these foreign countries, such as government instability or regulation unfavorable to foreign-owned businesses, which could negatively impact our business in the future.
Diversity and Belonging
Autodesk is committed to building and maintaining a diverse workforce and a culture of belonging where all employees have equitable opportunities to succeed and contribute. We have developed and embedded a holistic global Diversity and Belonging (“D&B”) strategy into all that we do. Our D&B strategy includes a variety of activities, such as inclusive leadership training for all people managers and senior employees, and hiring manager and interview classes that include training on mitigating bias and inclusive practices.
To help us build a more diverse workforce, we have continued to invest in our diversity partnerships. We partner with educational institutions such as Hispanic-Serving Institutions and Historically Black Colleges and Universities, and professional organizations around the globe supporting underrepresented groups in technology. We provide a variety of scholarships, internship programs, sponsorship agreements, mentoring and development partnerships, and program support to organizations focused on women and underrepresented groups.
We provide ongoing development opportunities, such as the Autodesk Mentorship Program, which provides one-on-one mentorship relationships. Autodesk has nine employee resource groups (“ERGs”), which are volunteer-led groups that bring employees together based on common interests, backgrounds or diversity characteristics, to foster a sense of belonging and connection.
Additional information on our D&B program, initiatives, and metrics can be found on our website at https://www.autodesk.com/company/diversity-and-inclusion. Information contained on or accessible through our website is not part of or incorporated by reference into this report.
Professional Development and Employee Impact
We believe career development plays an important role in keeping our employees engaged and in providing additional opportunities for them to grow and build their careers. Autodesk offers extensive professional and technical development opportunities for our employees. These include self-service online modules and personalized learning paths, professional and management development programs, and a tuition reimbursement program.
We also encourage our employees to advance our vision for a better world and support their professional development by participating in our pro bono consulting program, using paid time to volunteer, and have their charitable giving matched by the Autodesk Foundation.
Total Rewards
To attract, retain, and support our employees, we offer competitive compensation and benefits programs, several of which include an element of choice to meet the needs of our diverse and global population. In addition to competitive base pay
and opportunities to receive short-term incentives, all our employees are eligible to participate in our long-term plans. We also have comprehensive health and wellness benefits, a generous time off program, an employee stock purchase plan, sabbaticals, retirement plans, financial support programs, financial tools and education, and an employee assistance program.
ACQUISITIONS
We acquired new technology or supplemented our existing technology by purchasing businesses or technology related assets focused in specific markets or industries. For the fiscal years ended January 31, 2024, 2023 and 2022, we acquired companies accounted for as business combinations. The acquisitions during fiscal 2024 and 2023 were not individually significant. The following were significant acquisitions for fiscal year 2022.
| | | | | | | | | | | | | | |
| Date of closing | | Company | | Details |
| May 2021 | | Upchain Inc. (“Upchain”) | | Autodesk integrated Upchain’s unified cloud platform in Autodesk solutions to centralize data management and process management. |
| March 2021 | | Storm UK Holdco Limited, the parent of Innovyze, Inc. (“Innovyze”) | | Innovyze provided comprehensive water modeling solutions that augment Autodesk’s BIM offerings in civil engineering, and extended Autodesk’s presence into operations and maintenance of water infrastructure assets. |
We acquire technology-related assets that are complementary to or otherwise enhance our existing technologies. We also make investments in privately held companies that develop technology that is complementary to or provide strategic value and expand opportunities for our technologies.
REGULATION
We are subject to various regulations, particularly those involving privacy and import/export controls. See Item 1A, “Risk Factors—Risks Relating to Laws and Regulations,” for further discussion.
GLOSSARY OF TERMS
Billings: Total revenue plus the net change in deferred revenue from the beginning to the end of the period.
Cloud Service Offerings: Represents individual term-based offerings deployed through web browser technologies or in a hybrid software and cloud configuration. Cloud service offerings that are bundled with other product offerings are not captured as a separate cloud service offering.
Constant Currency (CC) Growth Rates: We attempt to represent the changes in the underlying business operations by eliminating fluctuations caused by changes in foreign currency exchange rates as well as eliminating hedge gains or losses recorded within the current and comparative periods. We calculate constant currency growth rates by (i) applying the applicable prior period exchange rates to current period results and (ii) excluding any gains or losses from foreign currency hedge contracts that are reported in the current and comparative periods.
Design Business: Represents the combination of maintenance, product subscriptions, and all EBAs. Main products include, but are not limited to, AutoCAD, AutoCAD LT, Industry Collections, Revit, Inventor, Maya, and 3ds Max. Certain products, such as our computer aided manufacturing solutions, incorporate both Design and Make functionality and are classified as Design.
Enterprise Business Agreements (EBAs): Represents programs providing enterprise customers with token-based access to a broad pool of Autodesk products over a defined contract term.
Flex: A pay-as-you-go consumption option to pre-purchase tokens to access any product available with Flex for a daily rate.
Free Cash Flow: Cash flow from operating activities minus capital expenditures.
Industry Collections: Autodesk Industry Collections are a combination of products and services that target a specific user objective and support a set of workflows for that objective. Our Industry Collections consist of: Autodesk Architecture, Engineering and Construction Collection, Autodesk Product Design and Manufacturing Collection, and Autodesk Media and Entertainment Collection.
Maintenance Plan: Our maintenance plans provide our customers with a cost effective and predictable budgetary option to obtain the productivity benefits of our new releases and enhancements when and if released during the term of their contracts. Under our maintenance plans, customers are eligible to receive unspecified upgrades when and if available, and technical support. We recognize maintenance revenue over the term of the agreements, generally one year.
Make Business: Represents certain cloud-based product subscriptions. Main products include, but are not limited to, Assemble, Autodesk Build, BIM Collaborate Pro, BuildingConnected, Fusion, and Flow Production Tracking. Certain products, such as Fusion, incorporate both Design and Make functionality and are classified as Make.
Net Revenue Retention Rate (NR3): Measures the year-over-year change in Recurring Revenue for the population of customers that existed one year ago (“base customers”). Net revenue retention rate is calculated by dividing the current quarter Recurring Revenue related to base customers by the total corresponding quarter Recurring Revenue from one year ago. Recurring Revenue is based on USD reported revenue, and fluctuations caused by changes in foreign currency exchange rates and hedge gains or losses have not been eliminated. Recurring Revenue related to acquired companies, one year after acquisition, has been captured as existing customers until such data conforms to the calculation methodology. This may cause variability in the comparison.
Other Revenue: Consists of revenue from consulting and other products and services, and is recognized as the products are delivered and services are performed.
Product Subscription: Provides customers a flexible, cost-effective way to access and manage 3D design, engineering, and entertainment software tools. Our product subscriptions currently represent a hybrid of desktop and cloud functionality, which provides a device-independent, collaborative design workflow for designers and their stakeholders.
Recurring Revenue: Consists of the revenue for the period from our traditional maintenance plans, our subscription plan offerings, and certain Other revenue. It excludes subscription revenue related to third-party products. Recurring revenue acquired with the acquisition of a business is captured when total subscriptions are captured in our systems and may cause variability in the comparison of this calculation.
Remaining Performance Obligations (RPO): The sum of total short-term, long-term, and unbilled deferred revenue. Current remaining performance obligations is the amount of revenue we expect to recognize in the next twelve months.
Solution Provider: Solution Provider is the name of our channel partners who primarily serve our new transaction model customers worldwide. Solution Providers may also be resellers in relation to Autodesk solutions.
Spend: The sum of cost of revenue and operating expenses.
Subscription Plan: Comprises our term-based product subscriptions, cloud service offerings, and EBAs. Subscriptions represent a combined hybrid offering of desktop software and cloud functionality which provides a device-independent, collaborative design workflow for designers and their stakeholders. With subscription, customers can use our software anytime, anywhere, and get access to the latest updates to previous versions.
Subscription Revenue: Includes our cloud-enabled term-based product subscriptions, cloud service offerings, and flexible EBAs.
Unbilled Deferred Revenue: Unbilled deferred revenue represents contractually stated or committed orders under early renewal and multi-year billing plans for subscription, services, and maintenance for which the associated deferred revenue has not been recognized. Under FASB Accounting Standards Codification ("ASC") Topic 606, unbilled deferred revenue is not included as a receivable or deferred revenue on our Consolidated Balance Sheet.
ITEM 1A. RISK FACTORS
We operate in a rapidly changing environment that involves significant risks, a number of which are beyond our control. In addition to the other information contained in this Annual Report on Form 10-K, the following discussion highlights some of these risks and the possible impact of these factors on our business, financial condition, and future results of operations. If any of the following risks actually occur, our business, financial condition, or results of operations may be adversely impacted, causing the trading price of our common stock to decline. In addition, these risks and uncertainties may impact the forward-looking statements described elsewhere in this Annual Report on Form 10-K and in the documents incorporated herein by reference. They could affect our actual results of operations, causing them to differ materially from those expressed in forward-looking statements.
Summary of Risk Factors
Our business is subject to numerous risks and uncertainties that you should consider before investing in our securities. These risks are described more fully below and include, but are not limited to, risks relating to the following:
•Our strategy to develop and introduce new products and services, exposing us to risks such as limited customer acceptance (both with new and existing customers), costs related to product defects, and large expenditures.
•Global economic and political conditions.
•Costs and challenges associated with strategic acquisitions and investments.
•Dependency on international revenue and operations, exposing us to significant international regulatory, economic, intellectual property, collections, currency exchange rate, taxation, political, and other risks.
•Inability to predict subscription renewal rates and their impact on our future revenue and operating results.
•Existing and increased competition and rapidly evolving technological changes.
•Fluctuation of our financial results, key metrics and other operating metrics.
•Deriving a substantial portion of our net revenue from a small number of solutions, including our AutoCAD-based software products and collections.
•Any failure to successfully execute and manage initiatives to realign or introduce new business and sales initiatives.
•Net revenue, billings, earnings, cash flow, or subscriptions shortfalls or volatility of the market causing the market price of our stock to decline.
•Challenges relating to the proper management and governance of our use of AI in our offerings.
•Security incidents compromising the integrity of our or our customers’ offerings, services, data, or intellectual property.
•Reliance on third parties to provide us with a number of operational and technical services as well as software.
•Our highly complex software, which may contain undetected errors, defects, or vulnerabilities, and is subject to service disruptions, degradations, outages or other performance problems.
•Increasing regulatory focus on privacy, data protection, and information security issues and expanding laws.
•Governmental export and import controls that could impair our ability to compete in international markets or subject us to liability if we violate the controls.
•Protection of our intellectual property rights and intellectual property infringement claims from others.
•The government procurement process.
•Fluctuations in currency exchange rates.
•Our debt service obligations.
•Our investment portfolio consisting of a variety of investment vehicles that are subject to interest rate trends, market volatility, and other economic factors.
Risks Relating to Our Business and Strategy
Our strategy to develop and introduce new products and services exposes us to risks such as limited customer acceptance (both with new and existing customers), costs related to product defects, and large expenditures, each of which may result in no additional net revenue or decreased net revenue.
The software industry is characterized by rapid technological changes as well as changes in customer requirements and preferences. In recent years, the industry has undergone a transition from developing and selling perpetual licenses and on-premises products to subscriptions and cloud-enabled technologies. Both new and existing customers are also reconsidering how they purchase software products, which requires us to constantly evaluate our business model and strategy. In response, we are focused on providing solutions to enable our customers to be more agile and collaborative on their projects. We devote significant resources to the development of new technologies. If we are unable to provide new features, enhancements to user experience, and modifications in a timely and cost-effective manner that achieve market acceptance, align with customer expectations, and that keep pace with rapid technological developments and changing regulatory landscapes, our business and operating results could be adversely affected. For example, AI and machine learning are propelling advancements in technology, but if they are not widely adopted and accepted or fail to operate as expected, our business and reputation may be harmed.
In addition, we frequently introduce new business models or methods that require a considerable investment of technical and financial resources, such as our introduction of flexible subscription and service offerings and our transition of multi-subscription plans to named-user plans. It is uncertain whether these strategies, including our product and pricing changes, will accurately reflect customer demand or be successful, or whether we will be able to develop the necessary infrastructure and business models more quickly than our competitors. We make such investments through further development and enhancement of our existing products and services, as well as through acquisitions. Such investments may not result in sufficient revenue generation to justify their costs and could result in decreased net revenue or profitability. If we are not able to meet customer requirements, either with respect to new customers or existing customers, and either with respect to our software or the manner in which we provide such products, or if we are not able to adapt our business model to meet our customers’ requirements, our business, financial condition, or results of operations may be adversely impacted.
In particular, a critical component of our growth strategy is to have customers of our AutoCAD and AutoCAD LT products, as well as other individual Autodesk products, expand their portfolios to include our other offerings and cloud-based functionality, and we are taking steps to accelerate this migration. At times, sales of our AutoCAD and AutoCAD LT or individual Autodesk flagship products have decreased without a corresponding increase in Industry Collections or cloud-based functionality revenue, or without purchases of customer seats to our Industry Collections. Should this continue, our results of operations will be adversely affected.
Our executive management team must continuously act quickly and with vision, given the rapidly changing customer expectations and technology advancements inherent in the software industry, the extensive and complex efforts required to create useful and widely accepted products, and the rapid evolution of cloud computing, mobile devices, new computing platforms, and other technologies, such as consumer products. Although we have articulated a strategy that we believe will fulfill these challenges, if we fail to execute properly on that strategy or adapt the strategy as market conditions evolve, we may fail to meet our customers’ expectations, be unable to compete with our competitors' products and technology, and lose the confidence of our channel partners and employees. This in turn could adversely affect our business and financial performance.
Global economic and political conditions may further impact our industries, business, and financial results.
Our overall performance depends largely upon domestic and worldwide economic and political conditions. The United States and other countries’ economies have experienced cyclical downturns, in which economic activity was impacted by falling demand for a variety of goods and services, restricted credit, poor liquidity, decreased government spending, reduced corporate profitability, volatility in credit, equity, and foreign exchange markets, inflationary pressures and higher interest rates, bankruptcies, and overall uncertainty. These economic conditions can occur abruptly. For example, current geopolitical and global macro-economic challenges have caused uncertainty in the global economy, and an economic downturn or recession in the United States or in other countries may occur or has already occurred and may continue. The extent to which these challenges will impact our financial condition or results of operations is still uncertain and will continue to depend on developments such as the impact of these challenges on our customers, vendors, distributors, and resellers, such as the supply chain disruption and resulting inflationary pressures and global labor shortage that we have seen recently, material scarcity, as well as other factors; actions taken by governments, businesses, and consumers in response to these challenges; speed and timing of economic recovery, including in specific geographies; our billings and renewal rates, including new business close rates, rate of multi-year contracts, pace of closing larger transactions, and new unit volume growth; wars and armed conflicts, including the ongoing wars between the Ukraine and Russia and between Israel and Hamas; foreign exchange rate fluctuations; and the effect of these challenges on margins and cash flow. All of these factors continue to evolve and remain uncertain at this time, and some of these factors are not within our control. If economic growth in countries where we do business slows or if such countries experience further economic recessions, customers may delay or reduce technology purchases, which we have seen recently in certain countries including China. Our customers include government entities, including the U.S. federal
government, and if spending cuts impede the ability of governments to purchase our products and services, our revenue could decline. In addition, a number of our customers rely, directly and indirectly, on government spending.
As described elsewhere in these risk factors, we are dependent on international revenue and operations and are subject to related risks of conducting business globally. Trends toward nationalism and protectionism and the weakening or dissolution of international trade pacts may increase the cost of, or otherwise interfere with, conducting business. These trends have increased political and economic unpredictability globally and may increase the volatility of global financial markets, and the impact of such developments on the global economy remains uncertain. Political instability or adverse political developments in any of the countries in which we do business could harm our business, results of operations, and financial condition. A financial sector credit crisis could impair credit availability and the financial stability of our customers, including our distribution partners and channels. A disruption in the financial markets may also have an effect on our derivative counter-parties and could also impair our banking partners, on which we rely for operating cash management. War, including the ongoing wars between the Ukraine and Russia and between Israel and Hamas, and any related political or economic responses and counter-responses or otherwise by various global actors or the general effect on the global economy, could also affect our business. Any of these events could harm our business, results of operations, and financial condition.
Our business could be adversely impacted by the costs and challenges associated with strategic acquisitions and investments.
We regularly acquire or invest in businesses, software solutions, and technologies that are complementary to our business through acquisitions, strategic alliances, or equity or debt investments, including several transactions in fiscal 2023 and 2024. The risks associated with such acquisitions include the difficulty of integrating solutions, operations, and personnel; inheriting liabilities such as intellectual property infringement claims; failure to realize anticipated revenue and cost projections and expected synergies; the requirement to test and assimilate the internal control processes of the acquired business in accordance with the requirements of Section 404 of the Sarbanes-Oxley Act of 2002; and diversion of management's time and attention. In addition, such acquisitions and investments involve other risks such as:
•the inability to retain customers, key employees, vendors, distributors, business partners, and other entities associated with the acquired business;
•the potential that due diligence of the acquired business or solution does not identify significant problems;
•exposure to litigation or other claims in connection with, or inheritance of claims or litigation risk as a result of, an acquisition, including claims from terminated employees, customers, or other third parties;
•the potential for incompatible business cultures;
•significantly higher than anticipated transaction or integration-related costs;
•the potential that acquired businesses or businesses that we invest in may not have adequate controls, processes, and procedures to ensure compliance with laws and regulations, including with respect to data privacy, data protection, and data security, as well as anti-bribery and anti-corruption laws, export controls, sanctions and industry-specific-regulation;
•potential additional exposure to economic, tax, currency, political, legal, and regulatory risks and liabilities, including risks associated with specific countries; and
•the potential impact on relationships with existing customers, vendors, and distributors as business partners as a result of acquiring another business.
We may not be successful in overcoming such risks, and such acquisitions and investments may negatively impact our business. In addition, if we do not complete an announced acquisition transaction or integrate an acquired business successfully and in a timely manner, we may not realize the benefits of the acquisition to the extent anticipated. Acquisitions and investments have in the past and may in the future contribute to fluctuations in our quarterly financial results. These fluctuations could arise from transaction-related costs and charges associated with eliminating redundant expenses or write-offs of impaired assets recorded in connection with acquisitions and investments, and could negatively impact our financial results.
We are dependent on international revenue and operations, exposing us to significant international regulatory, economic, intellectual property, collections, currency exchange rate, taxation, political, and other risks, which could adversely impact our financial results.
International net revenue represented 64% and 66% of our net revenue for fiscal 2024 and 2023, respectively. Our international revenue, some of which comes from emerging economies, is subject to economic and political conditions in foreign markets, including those resulting from economic and political conditions in the United States. For example, we have
recently seen a deceleration in growth in certain geographies including China. Our total revenue is also impacted by the relative geographical and country mix of our revenue over time. Our dependency on international revenue makes us much more exposed to global economic and political trends, which can negatively impact our financial results even if our results in the United States are strong for a particular period.
We anticipate that our international operations will continue to account for a significant portion of our net revenue and, as we expand our international development, sales, and marketing expertise, will provide significant support to our overall efforts in countries outside of the United States. Risks inherent in our international operations include:
•economic volatility;
•tariffs, quotas, and other trade barriers and restrictions, including any political or economic responses and counter-responses or otherwise by various global actors to the ongoing wars between the Ukraine and Russia and between Israel and Hamas;
•fluctuating currency exchange rates, including devaluations, currency controls, and inflation, and risks related to any hedging activities we undertake;
•changes in regulatory requirements and practices;
•delays resulting from difficulty in obtaining export licenses for certain technology;
•different purchase patterns as compared to the developed world;
•operating in locations with a higher incidence of corruption and fraudulent business practices, particularly in emerging economies;
•compliance with the U.S. Foreign Corrupt Practices Act, the U.K. Bribery Act, and other anti-corruption laws;
•difficulties in staffing and managing foreign sales and development operations;
•local competition;
•longer collection cycles for accounts receivable;
•U.S. and foreign tax law changes and the complexities of tax reporting;
•laws regarding the free flow of data across international borders and management of and access to data and public networks;
•possible future limitations upon foreign-owned businesses;
•increased financial accounting and reporting burdens and complexities;
•inadequate local infrastructure;
•greater difficulty in protecting intellectual property;
•software piracy; and
•other factors beyond our control, including popular uprisings, terrorism, war (including the ongoing wars between the Ukraine and Russia and between Israel and Hamas, and any related political or economic responses and counter-responses or otherwise by various global actors or the general effect on the global economy), natural disasters, and diseases and pandemics, such as COVID-19.
Some of our business partners also have international operations and are subject to the risks described above.
The application of the Trade and Cooperation Agreement between the European Union, the European Atomic Energy Community, and the United Kingdom signed in December 2020 (the “TCA”), which took effect January 1, 2021, could have adverse tax, tax treaty, banking, operational, legal, regulatory, or other impacts on our businesses in the region. The withdrawal could also, among other potential outcomes, create currency volatility; disrupt the free movement of goods, services, and people between the United Kingdom and the European Union; and significantly disrupt trade between the United Kingdom and the European Union and other parties. Uncertainty around these and related issues could lead to adverse effects on the United Kingdom economy, the European Union economies, and the other economies in which we operate.
In addition, in recent years, the United States has instituted or proposed changes to foreign trade policy, including the negotiation or termination of trade agreements, the imposition of tariffs on products imported from certain countries, economic sanctions on individuals, corporations, or countries, and other government regulations affecting trade between the United States and other countries in which we do business. More recently, the United States and other global actors have imposed sanctions as a result of the war against Ukraine launched by Russia, and the ongoing war between Israel and Hamas. New or increased tariffs and other changes in U.S. trade policy, including new sanctions, could trigger retaliatory actions by affected countries, including Russia. In addition, certain foreign governments, including the Chinese government, have instituted or considered imposing trade sanctions on certain U.S.-manufactured goods. The escalation of protectionist or retaliatory trade measures in either the United States or any other countries in which we do business, such as announcing sanctions, a change in tariff
structures, export compliance, or other trade policies, may increase the cost of, or otherwise interfere with, the conduct of our business, and could have a material adverse effect on our operations and business outlook.
Even if we are able to successfully manage the risks of international operations, our business may be adversely affected if our business partners are not able to successfully manage these risks.
We may not be able to predict subscription renewal rates and their impact on our future revenue and operating results.
We are dependent on attracting new customers as well as renewing and expanding our business with existing customers. Our customers are not obligated to renew their subscriptions for our offerings, and they may elect not to renew, upgrade, or expand their subscriptions. We cannot assure renewal rates or the mix of subscriptions renewals. Customer renewal rates may decline or fluctuate due to a number of factors, including offering pricing; competitive offerings; customer satisfaction; and reductions in customer spending levels, customer activity, or number of users due to economic downturns or financial markets uncertainty. If our customers do not renew their subscriptions or if they renew on less favorable terms, our revenues may decline.
Existing and increased competition and rapidly evolving technological changes may reduce our revenue and profits.
The software industry has limited barriers to entry, and the availability of computing devices with continually expanding performance at progressively lower prices contributes to the ease of market entry. The industry has undergone a transition from developing and selling perpetual licenses and on-premises products to subscriptions and cloud-enabled technologies. This shift further lowers barriers to entry and poses a disruptive challenge to established software companies. The markets in which we operate are characterized by vigorous competition, both by entrants with innovative technologies and by consolidation of companies with complementary offerings and technologies. Some of our competitors have greater financial, technical, sales and marketing, and other resources. Our competitors may also be able to develop and market new technologies that render our existing or future products less competitive. For example, disruptive technologies such as machine learning and other AI technologies may significantly alter the market for our products in unpredictable ways and reduce customer demand. Furthermore, a reduction in the number and availability of compatible third-party applications or our inability to rapidly adapt to technological and customer preference changes, including those related to cloud computing, mobile devices, and new computing platforms, may adversely affect the sale of our solutions. Because of these and other factors, competitive conditions in the industry are likely to intensify in the future. Increased competition could result in price reductions, reduced net revenue and profit margins, and loss of market share, any of which would likely harm our business.
Our financial results, key metrics, and other operating metrics fluctuate within each quarter and from quarter to quarter, making our future revenue and financial results difficult to predict.
Our quarterly financial results, key metrics, and other operating metrics have fluctuated in the past and will continue to do so in the future. These fluctuations could cause our stock price to change significantly or experience declines. We also provide investors with quarterly and annual financial forward-looking guidance that could prove to be inaccurate as a result of these fluctuations. In addition to the other risks described in these risk factors, some of the factors that could cause our financial results, key metrics, and other operating metrics to fluctuate include:
•general market, economic, business, and political conditions in Europe, APAC, and emerging economies, including from an economic downturn or recession in the United States or other countries;
•failure to produce sufficient revenue, billings, subscription, profitability, and cash flow growth;
•failure to accurately predict the impact of acquired businesses or to identify and realize the anticipated benefits of acquisitions, and successfully integrate such acquired businesses and technologies;
•shift to named-user plans and annual billing of multi-year contracts, which impacted the timing of our billings and cash collections in fiscal year 2024 and which is expected to continue into fiscal year 2025;
•our ability to successfully introduce and expand new transaction models such as FLEX;
•potential goodwill impairment charges related to prior acquisitions;
•failure to manage spend;
•changes in billings linearity;
•changes in subscription mix, pricing pressure, or changes in subscription pricing;
•weak or negative growth in one or more of the industries we serve, including AEC, manufacturing, and digital media and entertainment markets;
•the success of new business or sales initiatives;
•security breaches, related reputational harm, and potential financial penalties to customers and government entities;
•restructuring or other accounting charges and unexpected costs or other operating expenses;
•timing of additional investments in our technologies or deployment of our services;
•changes in revenue recognition or other accounting guidelines employed by us and/or established by the Financial Accounting Standards Board, Securities and Exchange Commission, or other rulemaking bodies;
•fluctuations in foreign currency exchange rates and the effectiveness of our hedging activity;
•dependence on and timing of large transactions;
•adjustments arising from ongoing or future tax examinations;
•the ability of governments around the world to adopt fiscal policies, meet their financial and debt obligations, and finance infrastructure projects;
•failure to expand our AutoCAD and AutoCAD LT customer base to related design products and services;
•our ability to rapidly adapt to technological and customer preference changes, including those related to cloud computing, mobile devices, and new computing platforms;
•timing of the introduction of new products by us or our competitors;
•the financial and business condition of our reseller and distribution channels;
•perceived or actual technical or other problems with a product or combination of subscriptions;
•unexpected or negative outcomes of matters and expenses relating to litigation or regulatory inquiries;
•increases in cloud functionality-related expenses;
•timing of releases and retirements of offerings;
•changes in tax laws or tax or accounting rules and regulations, such as increased use of fair value measures;
•changes in sales compensation practices;
•failure to effectively implement and maintain our copyright legalization programs, especially in developing countries;
•renegotiation or termination of royalty or intellectual property arrangements;
•interruptions or terminations in the business of our consultants or third-party developers;
•timing and degree of expected investments in growth and efficiency opportunities;
•failure to achieve continued success in technology advancements;
•catastrophic events, natural disasters, or public health events, such as pandemics and epidemics, including COVID-19;
•regulatory compliance costs; and
•failure to appropriately estimate the scope of services under consulting arrangements.
We have also experienced fluctuations in financial results in interim periods in certain geographic regions due to seasonality or regional economic or political conditions. In particular, our financial results, key metrics, or other operating metrics in Europe during our third quarter are usually affected by a slower summer period, and our APAC operations typically experience seasonal slowing in our fourth quarter. War, including the ongoing wars between the Ukraine and Russia and between Israel and Hamas, and any related political or economic responses and counter-responses or otherwise by various global actors or the general effect on the global economy, could also affect our business.
Our operating expenses are based in part on our expectations for future revenue and are relatively fixed in the short term. Accordingly, any revenue shortfall below expectations has had, and in the future could have, an immediate and significant adverse effect on our profitability. Greater than anticipated expenses or a failure to maintain rigorous cost controls would also negatively affect profitability.
We derive a substantial portion of our net revenue from a small number of solutions, including our AutoCAD-based software products and collections, and if these offerings are not successful, our revenue would be adversely affected.
We derive a substantial portion of our net revenue from sales of subscriptions of a limited number of our offerings, including AutoCAD software, solutions based on AutoCAD, which include our collections that serve specific markets, and products that are interoperable with AutoCAD. Any factor adversely affecting sales of these subscriptions, including the product release cycle, market acceptance, product competition, performance and reliability, reputation, price competition, economic and market conditions, and the availability of third-party applications, would likely harm our financial results.
During fiscal 2024 and 2023, combined revenue from our AutoCAD and AutoCAD LT family products, not including collections having AutoCAD or AutoCAD LT as a component, represented 27% and 28% of our total net revenue, respectively.
From time to time we realign or introduce new business and sales initiatives; if we fail to successfully execute and manage these initiatives, our results of operations could be negatively impacted.
As part of our effort to accommodate our customers’ needs and demands and the rapid evolution of technology, from time to time we evolve our business and sales initiatives, such as shifting to annual billing of multi-year contracts, introducing and expanding new business models such as the new transaction model and FLEX, realigning our development and marketing organizations, offering software as a service, and realigning our internal resources in an effort to improve efficiency. We may take such actions without clear indications that they will prove successful and, at times, we have been met with short-term challenges in the execution of such initiatives. Market acceptance of any new business or sales initiative is dependent on our ability to match our customers’ needs at the right time and price. Often, we have limited prior experience and operating history in these new areas of emphasis. If any of our assumptions about expenses, revenue, or revenue recognition principles from these initiatives proves incorrect, or our attempts to improve efficiency are not successful, our actual results may vary materially from those anticipated, and our financial results will be negatively impacted.
Net revenue, billings, earnings, cash flow, or subscriptions shortfalls or volatility of the market generally may cause the market price of our stock to decline.
The market price for our common stock has experienced significant fluctuations and may continue to fluctuate significantly. The market price for our common stock may be affected by a number of factors, including the other risks described in these risk factors and the following:
•shortfalls in our expected financial results, including net revenue, billings, earnings, and cash flow or key performance metrics, such as subscriptions, and how those results compare to securities analyst expectations, including whether those results fail to meet, exceed, or significantly exceed securities analyst expectations;
•quarterly variations in our or our competitors’ results of operations;
•general socioeconomic, political, or market conditions, including from an economic downturn or recession in the United States or in other countries;
•changes in forward-looking estimates of future results, how those estimates compare to securities analyst expectations, or changes in recommendations or confusion on the part of analysts and investors about the short- and long-term impact to our business;
•uncertainty about certain governments’ abilities to repay debt or effect fiscal policy;
•announcements of new offerings or enhancements by us or our competitors;
•unusual events such as significant acquisitions, divestitures, regulatory actions, and litigation;
•changes in laws, rules, or regulations applicable to our business;
•outstanding debt service obligations; and
•other factors, including factors unrelated to our operating performance, such as instability affecting the economy or the operating performance of our competitors.
Significant changes in the price of our common stock could expose us to costly and time-consuming litigation. Historically, after periods of volatility in the market price of a company's securities, a company becomes more susceptible to securities class action litigation. This type of litigation is often expensive and diverts management’s attention and resources.
As a result of our strategy of partnering with other companies for product development, our product delivery schedules could be adversely affected if we experience difficulties with our product development partners.
We partner with certain independent firms and contractors to perform some of our product development activities. We believe our partnering strategy allows us to achieve efficiencies in developing new products and maintaining and enhancing existing product offerings. This strategy creates a dependency on independent developers. Independent developers, including those who currently develop solutions for us in the United States and throughout the world, may not be able or willing to provide development support to us in the future. In addition, use of development resources through consulting relationships, particularly in non-U.S. jurisdictions with developing legal systems, may be adversely impacted by, and expose us to risks relating to, evolving employment, export, and intellectual property laws. These risks could, among other things, expose our intellectual property to misappropriation and result in disruptions to product delivery schedules.
We incorporate AI into our offerings, and challenges with properly managing its use could result in competitive harm, reputational harm, or liability, and adversely affect our results of operations.
We are increasingly building AI into many of our offerings. We expect to rely on AI technologies to help drive future growth in our business, but there can be no assurance that we will realize the desired or anticipated benefits from AI or at all. We may also fail to properly implement or market our AI offerings. As with many innovations, AI presents risks and challenges that could affect its adoption, and therefore our business. Our competitors or other third parties may incorporate AI into their products more quickly or more successfully than us, which could impair our ability to compete effectively and adversely affect our results of operations. Additionally, our offerings based on AI may expose us to additional lawsuits and regulatory investigations and subject us to legal liability as well as brand and reputational harm. For example, if the content, analyses, or recommendations that AI applications assist in producing are or are alleged to be deficient, inaccurate, or biased, our business, financial condition, and results of operations may be adversely affected. The use of AI applications has resulted in, and may in the future result in, cybersecurity incidents that implicate the personal data of end users of such applications. Any such cybersecurity incidents related to our use of AI applications could adversely affect our reputation and results of operations.
Social and ethical issues relating to the use of new and evolving technologies such as AI in our offerings, may result in reputational harm and liability, and may cause us to incur additional research and development costs to resolve such issues. AI presents emerging ethical issues and if we enable or offer solutions that draw controversy due to their perceived or actual impact on society, we may experience brand or reputational harm, competitive harm, or legal liability. Potential government regulation in the space of AI ethics may also increase the burden and cost of research and development in this area, subjecting us to brand or reputational harm, competitive harm, or legal liability. Failure to address AI ethics issues by us or others in our industry could undermine public confidence in AI and slow adoption of AI in our products and services.
The Audit Committee internal investigation has been time-consuming and expensive, has resulted in the filing of a class action lawsuit, and may result in additional expense and/or litigation.
As previously disclosed on April 1, 2024, the Audit Committee commenced an internal investigation with the assistance of outside counsel and advisors, regarding Autodesk’s free cash flow and non-GAAP operating margin practices. The results of that investigation were announced on May 31, 2024.
We have incurred significant expenses, including audit, legal, consulting and other professional fees, in connection with the investigation, and we could be forced to incur additional time and expense as a result of the investigation. The incurrence of significant additional expense, or the requirement that management devote significant time that could reduce the time available to execute on our business strategies, could have an adverse effect on our business, results of operations and financial condition.
Autodesk voluntarily contacted the Securities and Exchange Commission (the “SEC”) to advise it that an internal investigation was ongoing. The Company intends to cooperate with the SEC’s investigation. Furthermore, if the SEC commences legal action, we could be required to pay significant penalties and become subject to injunctions, a cease and desist order and other equitable remedies. The completion of the Audit Committee investigation and filing of any delinquent periodic reports will not automatically resolve the SEC investigation. In addition, the United States Attorney’s Office for the Northern District of California contacted us regarding the Audit Committee investigation. We cannot guarantee that we will not receive inquiries from other regulatory authorities regarding the investigation, or that we will not be subject to future claims, investigations or proceedings. Any future inquiries from the SEC or other regulatory authorities, or future claims or proceedings or any related regulatory investigation will, regardless of the outcome, likely consume a significant amount of our internal resources and result in additional legal and accounting costs. We can provide no assurances as to the outcome of any governmental investigation.
In addition, we and certain of our officers and directors have been named in a purported shareholder class action arising out of our announcement of the investigation. For additional discussion, see Item 3. Legal Proceedings and Note 11 to our Consolidated Financial Statements. The pending litigation, and any future litigation, investigation or other actions that may be filed or initiated against us or our officers or directors, may be time consuming and expensive. We cannot predict what losses we may incur in these litigation matters, and contingencies related to our obligations under the federal and state securities laws, or in other legal proceedings or governmental investigations or proceedings related to these matters.
Any legal proceedings, if decided adversely to us, could result in significant monetary damages, penalties and reputational harm, and will likely involve significant defense and other costs. We have entered into indemnification agreements with each of our directors and certain of our officers, and our bylaws require us to indemnify each of our directors and officers. Further, our insurance may not cover all claims that have been or may be brought against us, and insurance coverage may not continue to be available to us at a reasonable cost. As a result, we may be exposed to substantial uninsured liabilities, including pursuant to our indemnification obligations, which could adversely affect our business, prospects, results of operations and financial condition.
Risks Relating to Our Operations
Security breaches or incidents may compromise the integrity of our or our customers’ systems, solutions, offerings, services, applications, data, or intellectual property, harm our reputation, damage our competitiveness, create additional liability, and adversely impact our financial results.
As we digitize Autodesk and use cloud- and web-based technologies to leverage customer data to deliver the total customer experience, we are exposed to increased security risks and the potential for unauthorized access to, or improper use, disclosure, or other processing of, our and our customers’ information. Like other software offerings and systems, ours are vulnerable to security breaches and incidents, including those from acquired companies. Also, our ability to mitigate the risk of security breaches and incidents may be impacted by our limited control over our customers or third-party technology providers and vendors, or the processing of data by third-party technology providers and vendors, which may not allow us to maintain the integrity or security of such transmissions or processing. We devote significant resources in an effort to maintain the security and integrity of our systems, offerings, services, and applications (online, mobile, and desktop). Despite these efforts, we may not prevent security breaches or incidents, and we may face delays or other difficulties in identifying, responding to, or remediating security breaches or incidents.
Hackers regularly have targeted our systems, offerings, services, and applications, and we expect them to do so in the future. To date, such identified security events have not been material or significant to us or our customers, including to our reputation or business operations, or had a material financial impact, but there can be no assurance that future cyberattacks will not be material or significant. Security breaches or incidents could disrupt the proper functioning of our systems, solutions, offerings, applications, or services; cause errors in the output of our customers’ work; allow unauthorized access to or unauthorized use, disclosure, modification, loss, unavailability, or destruction of, sensitive data or intellectual property, including proprietary or confidential information of ours or our customers; or cause other destructive or disruptive outcomes. The risk of a security incident, particularly through cyber-attack or cyber intrusion, including by computer hackers, foreign governments, and cyber terrorists, has increased as the number, intensity, and sophistication of attempted attacks and intrusions from around the world have increased. These threats include, among others, identity theft, unauthorized access, DNS attacks, wireless network attacks, viruses and worms, malware, bugs, vulnerabilities, advanced persistent threats, application-centric attacks, peer-to-peer attacks, social engineering, phishing, credential stuffing, malicious file uploads, backdoor trojans, supply chain attacks, ransomware attacks, and distributed denial of service attacks. In addition, third parties may attempt to fraudulently induce our employees, vendors, partners, customers, or users to disclose information to gain access to our data or our customers’ or users’ data and there is the risk of employee, contractor, or vendor error or malfeasance. These existing risks are compounded given the shift in recent years to work-from-home arrangements for a large population of employees and contractors, as well as employees and contractors of our third-party technology providers and vendors, and the risks could also be elevated in connection with the ongoing war between Ukraine and Russia as we and our third-party technology providers and vendors are vulnerable to a heightened risk of cyberattacks from or affiliated with nation-state actors, including retaliatory attacks from Russian actors against U.S.-based companies. Despite our significant efforts to create security barriers to such threats, we cannot entirely mitigate these risks, and there is no guarantee that inadvertent or unauthorized use or disclosure of such information will not occur or that third parties will not gain unauthorized access to such information.
Many governments have enacted laws requiring companies to provide notice of security breaches or incidents involving certain types of personal data and personal information. We are also contractually required to notify certain customers of certain security breaches or incidents. Any security breach or incident suffered, or believed to have been suffered, by us or by our technology providers or vendors could result in harm to our reputation and competitive position, difficulty attracting new customers, retaining existing customers, and securing payment from customers, our expenditure of significant capital and other resources to evaluate and alleviate the security incident and to try to prevent further or additional incidents, and regulatory inquiries, investigations, and other proceedings, private claims, demands, and lawsuits, and other potential liability. We could incur significant costs and liabilities, including due to litigation, indemnity obligations, damages for contract breach, penalties for violation of applicable laws or regulations, and costs for remediation and other incentives offered to customers or other business partners in an effort to maintain business relationships after a security breach or incident, and our financial performance could be negatively impacted.
We cannot assure you that any limitations of liability provisions in our contracts would be enforceable or adequate or would otherwise protect us from any liabilities or damages with respect to any particular claim relating to a security incident. We also cannot be sure that our existing insurance coverage will continue to be available on acceptable terms or will be available in sufficient amounts to cover one or more large claims related to a security incident, or that the insurer will not deny coverage as to any future claim. The successful assertion of one or more large claims against us that exceed available insurance coverage, or the occurrence of changes in our insurance policies, including premium increases or the imposition of large deductible or co-insurance requirements, could have a material adverse effect on our business, including our financial condition, operating results, and reputation.
Our use of third-party open source software could negatively affect our ability to sell subscriptions to access our products and subject us to possible litigation and greater security risks.
We use third-party open source software. From time to time, companies that use third-party open source software have faced claims challenging the use of such open source software and compliance with the open source software license terms. Accordingly, we may be subject to suits by parties claiming ownership of what we believe to be open source software or claiming non-compliance with the applicable open source licensing terms. Some open source software licenses require end-users, who distribute or make available across a network software and services that include open source software, to make publicly available or to license all or part of such software (which in some circumstances could include valuable proprietary code, such as modifications or derivative works created, based upon, incorporating, or using the open source software) under the terms of the particular open source license. While we employ practices designed to monitor our compliance with the licenses of third-party open source software and protect our valuable proprietary source code, we may inadvertently use third-party open source software in a manner that exposes us to claims of non-compliance with the terms of the applicable license, including claims of intellectual property rights infringement or for breach of contract. Furthermore, there exists today an increasing number of types of open source software licenses, almost none of which have been tested in courts of law to provide clarity on their proper legal interpretation. If we were to receive a claim of non-compliance with the terms of any of these open source licenses, we may be required to publicly release certain portions of our proprietary source code. We could also be required to expend substantial time and resources to re-engineer some or all of our software. Any of the foregoing could materially adversely affect our business, financial condition, results of operations, and prospects.
In addition, the use of third-party open source software typically exposes us to greater risks than the use of third-party commercial software because open source licensors generally do not provide warranties or controls on the functionality or origin of the software. Use of open source software may also present additional security risks because the public availability of such software may make it easier for hackers and other third parties to determine how to compromise our platform. Any of the foregoing could materially adversely affect our business, financial condition, results of operations, and prospects and could help our competitors develop products and services that are similar to or better than ours.
We rely on third parties to provide us with a number of operational and technical services; third-party security incidents could result in the loss of our or our customers’ data, expose us to liability, harm our reputation, damage our competitiveness, and adversely impact our financial results.
We rely on third parties, such as Amazon Web Services, to provide us with operational and technical services. These third parties may have access to our systems, provide hosting services, or otherwise process data about us or our customers, employees, or partners. Our ability to monitor such third parties’ security measures is limited. There have been and may continue to be significant supply chain attacks, and we cannot guarantee that our or our such third parties’ systems have not been breached or otherwise compromised or that they do not contain exploitable defects, bugs, or vulnerabilities that could result in an incident, breach, or other disruption to, our or these third parties’ systems. Any security breach or incident involving such third parties could compromise the integrity or availability of, or result in the theft or unauthorized use, modification, or other processing of, our and our customers’ data. In addition, our operations or the operations of our customers or partners could be negatively affected in the event of a security breach or incident and could be subject to the loss or theft of confidential or proprietary information, including source code. Unauthorized access to or other processing of data and other confidential or proprietary information may be obtained through break-ins, network breaches by unauthorized parties, employee theft or misuse, or other misconduct. If any of the foregoing were to occur or to be perceived to occur, our reputation may suffer, our competitive position may be diminished, customers may buy fewer of our offerings and services, we could face lawsuits, regulatory investigation, fines, and potential liability, and our financial results could be negatively impacted.
Delays in service from third-party service providers could expose us to liability, harm our reputation, damage our competitiveness, and adversely impact our financial results.
From time to time, we may rely on a single or limited number of suppliers, or upon suppliers in a single country, for the provision of services and materials that we use in the operation of our business and production of our solutions. Inability of such third parties to satisfy our requirements could disrupt our operations or make it more difficult for us to implement our strategy. If any of these situations were to occur, our reputation could be harmed, we could be subject to third-party liability, including under laws relating to privacy, data protection, and information security in certain jurisdictions, and our financial results could be negatively impacted.
We are investing in resources to update and improve our information technology systems to digitize Autodesk and support our customers. Should our investments not succeed, or if delays or other issues with new or existing information technology systems disrupt our operations, our business could be harmed.
We rely on our network and data center infrastructure, technology systems, and websites for our development, marketing, operational, support, sales, accounting, and financial reporting activities. We continually invest resources to update and improve these systems to meet the evolving requirements of our business and customers. In particular, our transition to cloud-based products and a subscription-only business model involves considerable investment in the development of technologies, as well as back-office systems for technical, financial, compliance, and sales resources. Such improvements are often complex, costly, and time consuming. In addition, such improvements can be challenging to integrate with our existing technology systems, or may uncover problems with those systems. Unsuccessful implementation of hardware or software updates and improvements could result in disruption in our business operations, loss of customers, loss of revenue, errors in our accounting and financial reporting, or damage to our reputation, all of which could harm our business.
Our software solutions are highly complex and may contain undetected errors, defects, or vulnerabilities, and are subject to service disruptions, degradations, outages or other performance problems, each of which could harm our business and financial performance.
The software solutions that we offer are complex and, despite extensive testing and quality control, may contain errors, defects, or vulnerabilities. Some errors, defects, or vulnerabilities in our software solutions may only be discovered after they have been released. In addition, we have experienced, and may in the future experience, service disruptions, degradations, outages, and other performance problems in connection with our software solutions.
Any errors, defects, vulnerabilities, service disruptions, degradations, outages or other performance problems could result in the need for corrective releases to our software solutions, damage to our reputation, damage to our customers’ businesses, loss of revenue, an increase in subscription cancellations, or lack of market acceptance of our offerings, any of which would likely harm our business and financial performance.
If we do not maintain good relationships with the members of our distribution channel, or if our distribution channel suffers financial losses, becomes financially unstable or insolvent, or is not provided the right mix of incentives to sell our subscriptions, our ability to generate revenue will be adversely affected.
We sell our software products both directly to end users and through a network of distributors and resellers. For fiscal 2024 and 2023, approximately 63% and 65%, respectively, of our revenue was derived from indirect channel sales through distributors and resellers, and we expect that the majority of our revenue will continue to be derived from indirect channel sales in the near future. Our ability to effectively distribute our solutions depends in part upon the financial and business condition of our distributor and reseller network. Computer software distributors and resellers typically are not highly capitalized, and have previously experienced difficulties during times of economic contraction as well as during the past several years. We have processes to ensure that we assess the creditworthiness of distributors and resellers prior to our sales to them. In the past we have taken steps to support them, and may take additional steps in the future, such as extending credit terms and adjusting our incentives. These steps, if taken, could harm our financial results. If our distributors and resellers were to become insolvent, they would not be able to maintain their business and sales or provide customer support services, which would negatively impact our business and revenue.
We rely significantly upon major distributors and resellers in both the U.S. and international regions. Of our distributors, TD Synnex accounted for 39% and 37% of our total net revenue for fiscal 2024 and 2023, respectively, and Ingram Micro accounted for 7% and 9% of our total net revenue for fiscal 2024 and 2023, respectively. During October 2022, we entered into
a transition agreements with each of TD Synnex and Ingram Micro to provide transition distribution activities for a one-to-two-year period, with potential extensions. In connection with such transition agreements, we intend to increase our selling efforts with value-added resellers and agents. During the transition period, we believe the resellers and end users who currently purchase our products through TD Synnex and Ingram Micro will be able to continue to do so, and following the transition period, we believe such end users will be able to continue to purchase our products from certain value-added resellers or directly from Autodesk, in each case under substantially the same terms and without substantial disruption to our revenue. However, if during the transition period, TD Synnex or Ingram Micro were to experience a significant business disruption or if our relationship with either were to significantly deteriorate, it is possible that our ability to sell to end users would, at least temporarily, be negatively impacted. Also, if any of our assumptions about our end users, value added resellers, distributors, or agents or our direct selling capabilities proves incorrect, these changes could harm our business. This could, in turn, negatively impact our financial results.
Over time, we have modified and especially during the transition process noted above, will continue to modify aspects of our relationship with our distributors and resellers, such as their incentive programs, pricing to them, and our distribution model to motivate and reward them for aligning their businesses with our strategy and business objectives. Changes in these relationships and underlying programs could negatively impact their business and harm our business. Further, our distributors and resellers may lose confidence in our business, move to competitive products, or not have the skills or ability to support customers. The loss of or a significant reduction in business with those distributors or resellers could harm our business. In particular, if one or more of such distributors or resellers were unable to meet their obligations with respect to accounts payable to us, we could be forced to write off such accounts and may be required to delay the recognition of revenue on future sales to these customers. These events could have a material adverse effect on our financial results.
We rely on software from third parties, and a failure to properly manage our use of third-party software could result in increased costs or loss of revenue.
Many of our products are designed to include software licensed from third parties. Such third-party software includes software licensed from commercial suppliers and under public open source licenses. While we have internal processes to manage our use of such third-party software, if such processes are inadequate, we may be subject to copyright infringement or other third-party claims. If we are non-compliant with a license for commercial software, we may be required to pay penalties or undergo costly audits pursuant to the license agreement. In the case of open-source software licensed under certain “copyleft” licenses, the license itself, or a court-imposed remedy for non-compliant use of the open source software, may require that proprietary portions of our own software be publicly disclosed or licensed. This could result in a loss of intellectual property rights, increased costs, re-engineering of our software, damage to our reputation, or loss of revenue.
In addition to risks related to license requirements, usage of open source software can lead to greater risks than use of third-party commercial software, as open source licensors generally do not provide warranties, support, indemnities, assurances of title or controls on origin of the software, or other contractual protections regarding infringement claims or the quality of the code. Likewise, some open source projects have known security and other vulnerabilities and architectural instabilities, or are otherwise subject to security attacks due to their wide availability, and are provided on an “as-is” basis.
Our business could be adversely affected if we are unable to attract and retain key personnel.
Our success and ability to invest and grow depend largely on our ability to attract and retain highly skilled technical, professional, managerial, sales, and marketing personnel. Historically, competition for these key personnel has been intense. The loss of services of any of our key personnel, including key personnel joining our company through acquisitions, inability to retain and attract qualified employees in the future, or delays in hiring required personnel, particularly engineering and sales personnel, could make it difficult to meet key objectives, such as timely and effective product introductions and financial goals.
We rely on third-party technologies and if we are unable to use or integrate these technologies, our solutions and service development may be delayed and our financial results negatively impacted.
We rely on certain software that we license from third parties, including software that is integrated with internally developed software and used in our offerings to perform key functions. These third-party software licenses may not continue to be available on commercially reasonable terms, and the software may not be appropriately supported, maintained, or enhanced by the licensors. The loss of licenses to, or inability to support, maintain, and enhance any such software could result in
increased costs or delays until equivalent software can be developed, identified, licensed, and integrated, which would likely harm our business.
Disruptions in licensing relationships and with third-party developers could adversely impact our business.
We license certain key technologies from third parties. Licenses may be restricted in the term or the use of such technology in ways that negatively affect our business. Similarly, we may not be able to obtain or renew license agreements for key technology on favorable terms, if at all, and any failure to do so could harm our business. Our business strategy has historically depended in part on our relationships with third-party developers who provide products that expand the functionality of our design software. Some developers may elect to support other products or may experience disruption in product development and delivery cycles or financial pressure during periods of economic downturn. In particular markets, such disruptions have in the past, and would likely in the future, negatively impact these third-party developers and end users, which could harm our business.
Technology created by outsourced product development, whether outsourced to third parties or developed externally and transferred to us through business or technology acquisitions, involves additional risks such as effective integration into existing products, adequate transfer of technology know-how, and ownership and protection of transferred intellectual property.
Risks Relating to Laws and Regulations
Increasing regulatory focus on privacy, data protection, and information security issues and new and expanding laws may impact our business and expose us to increased liability.
Our strategy to digitize Autodesk involves increasing our use of cloud- and web-based technologies and applications to leverage customer data to improve our offerings for the benefit of our customers. To accomplish this strategy, we must collect and otherwise process customer data, which may include personal data and personal information of users from different jurisdictions globally. We also collect and otherwise process personal data and personal information of our employees and contractors. As a result, federal, state, and global laws relating to privacy, data protection, and information security apply to Autodesk’s personal data and personal information processing activities. The scope of these laws and regulations is rapidly evolving, subject to differing interpretations, may be inconsistent among jurisdictions, or conflict with other rules and is likely to remain uncertain for the foreseeable future. We also expect that there will continue to be new laws, regulations, and industry standards concerning privacy, data protection, and information security proposed and enacted in various jurisdictions. Globally, laws such as the General Data Protection Regulation (EU) 2016/679 (“GDPR”) in the European Union (“EU”) and the Personal Information Protection Law (“PIPL”) in China have been enacted, and numerous other countries have proposed or have enacted laws concerning privacy, data protection, and information security. In addition, new and emerging state laws in the United States governing privacy, data protection, and information security, such as the California Consumer Privacy Act (“CCPA”), the California Privacy Rights Act (“CPRA”), and numerous laws in other states, many of which provide for obligations similar to the CCPA and CPRA, have been enacted. These laws and regulations, as well as industry self-regulatory codes, industry standards, and other actual and asserted obligations to which we are or may be asserted to be subject, create new compliance obligations and substantially expand the scope of potential liability and provide greater penalties for non-compliance. For example, the GDPR provides for penalties of up to €20 million or 4% of a company’s annual global revenue, whichever is greater, the PIPL provides for penalties of up to 50 million renminbi or 5% of a company's annual revenue and disgorgement of all illegal gains, whichever is greater, and the CCPA provides for penalties of up to $7,500 per violation. These laws, regulations, and codes may also impact our innovation and business drivers in developing new and emerging technologies (e.g., AI and machine learning). These requirements, among others, may impact demand for our offerings and force us to bear the burden of expanded obligations in our contracts.
In addition, there is continued instability of international personal data transfer legal mechanisms that are complex, uncertain, and subject to active litigation and enforcement actions in a number of jurisdictions around the world. For example, on June 4, 2021, the European Commission published a new set of modular standard contractual clause (“SCCs”), providing for an 18-month implementation period, which became effective on June 29, 2021, and imposes on companies obligations relating to personal data transfers, including the obligation to conduct a transfer impact assessment and, depending on a party’s role in the transfer, to implement additional security measures and to update internal privacy practices. We may, in addition to other impacts, be required to expend significant time and resources to update our contractual arrangements and to comply with new obligations, and we face exposure to regulatory actions, substantial fines and injunctions in connection with transfers of personal data from the EU.
In addition, the United Kingdom’s (“UK”) exit from the EU, and ongoing developments in the UK, have created uncertainty with regard to data protection regulation in the UK. Data processing in the UK is now governed by the UK General Data Protection Regulation and supplemented by other domestic data protection laws, such as the UK Data Protection Act 2018, which authorizes fines of up to £17.5 million or 4% of annual global revenue, whichever is higher. We are also exposed to potentially divergent enforcement actions for certain violations. Furthermore, the new SCCs apply only to the transfer of personal data outside the EU and not the UK. Although the European Commission adopted an adequacy decision for the UK on June 28, 2021, allowing the continued flow of personal data from the EU to the UK, this decision will be regularly reviewed going forward and may be revoked if the UK diverges from its current adequate data protection laws following its exit from the EU. On February 2, 2022, the UK’s Information Commissioner’s Office issued new standard contractual clauses to support personal data transfers out of the UK (“UK SCCs”), which became effective March 21, 2022. We may, in addition to other impacts, experience additional costs associated with increased compliance burdens and be required to engage in new contract negotiations with third parties that aid in processing personal data on our behalf or localize certain personal data. On March 25, 2022, the United States and EU announced an “agreement in principle” to replace the EU-U.S. Privacy Shield transfer framework with the Trans-Atlantic Data Privacy Framework (“EU-U.S. DPF”). On July 10, 2023, the European Commission adopted an adequacy decision in relation to the EU-U.S. DPF, allowing the EU-U.S. DPF to be utilized as a means of legitimizing EU-U.S. personal data transfers for participating entities. We are evaluating whether the EU-U.S. DPF will be appropriate for us to utilize. The EU-U.S. DPF may be subject to legal challenges from privacy advocacy groups or others, and the European Commission’s adequacy decision regarding the EU-U.S. DPF provides that the EU-U.S. DPF will be subject to future reviews and may be subject to suspension, amendment, repeal, or limitations to its scope by the European Commission.
Further, several European data protection authorities recently indicated that the use of Google Analytics by European website operators involves the unlawful transfer of personal data to the United States. As the enforcement landscape further develops, and depending on the impacts of these rulings and other developments with respect to cross-border data transfer, we could suffer additional costs, complaints and/or regulatory investigations or fines, have to stop using certain tools and vendors, and make other operational changes.
Several other countries, including China, Australia, New Zealand, Brazil, and Japan, have also established specific legal requirements for cross-border data transfers. There is also an increasing trend towards data localization policies. For example, in 2021, China introduced localization requirements for certain data. Other countries, such as India, also are considering data localization requirements. If this trend continues, and countries implement more restrictive regulations for cross-border personal data transfers (or do not permit personal data to leave the country of origin), it could affect the manner in which we provide our services, the geographical location or segregation of our relevant systems and operations, and our business, financial condition, and results of operations in those jurisdictions could be impacted.
In addition, the CPRA and many of the other new state laws addressing privacy and information security, including those that have become or will become effective in 2023, provide for additional obligations such as data minimization and storage limitations, granting additional rights to consumers such as correction of personal information and additional opt-out rights. The CPRA also created a new agency to implement and enforce the law. These new state laws have required us to modify our data processing practices and policies and may cause us to make additional modifications, and to incur substantial costs and expenses, in our efforts to comply. Laws in all 50 states, and some of our contracts, require us to provide notice under certain circumstances to customers whose personal information has been disclosed as a result of a data breach. Also, if third parties we work with, such as suppliers, violate applicable data protection laws or regulations, such violations may also put our users’ information at risk and could materially adversely affect our business, financial condition, results of operations, and prospects. Additionally, in addition to government activity, privacy advocacy groups and technology and other industries are considering various new, additional, or different self-regulatory standards that may place, or be asserted to place, additional burdens on us. Evolving legislation and the interplay of federal and state laws may be subject to varying interpretations by courts and government agencies, creating complex compliance issues and have and may cause variation in requirements, increase restrictions and potential legal risk and impact strategies and the availability of previously useful data, potentially exposing us to additional expense, adverse publicity, and liability.
In the EU and the UK, regulators are increasingly focusing on compliance with requirements in the online behavioral advertising ecosystem, and current national laws that implement the ePrivacy Directive are likely to be replaced by an EU regulation known as the ePrivacy Regulation, which is expected to significantly increase fines for non-compliance. While the text of the ePrivacy Regulation is under development, recent European case law and regulators’ recent guidance are driving increased attention to cookies and tracking technologies. This could lead to substantial costs, require significant system changes, limit the effectiveness of our marketing activities, divert the attention of our technology personnel, adversely affect our margins, increase costs, and subject us to additional liabilities. Regulation of cookies and similar technologies, and any decline of cookies or similar online tracking technologies as a means to identify and potentially target users, may lead to broader restrictions and impairments on our marketing and personalization activities and may negatively impact our efforts to understand our customers.
Governments, regulators, plaintiffs’ attorneys, privacy advocates have increased their focus on how companies collect, process, use, store, share, and transmit personal data and personal information. Any perception of our practices, products, offerings, or services as a violation of individual privacy or data protection rights may subject us to public criticism, lawsuits, reputational harm, or investigations, claims, demands, or other proceedings by regulators, industry groups or other third parties, all of which could disrupt or adversely impact our business and expose us to increased liability. Moreover, because the interpretation and application of many laws, regulations, and other actual and asserted obligations relating to privacy, data protection, and information security are uncertain, it is possible that these laws, regulations, and obligations may be interpreted and applied in a manner that is inconsistent with our existing data management practices or the features of our products, offerings, and services. We could be required to fundamentally change our business activities and practices or modify our offerings and services, any of which could require significant additional expense and adversely affect our business, including impacting our ability to innovate, delaying our development roadmap and adversely affecting our relationships with customers and our ability to compete. If we are obligated to fundamentally change our business activities and practices or modify our products, offerings, or services, we may be unable to make such changes and modifications in a commercially reasonable manner, or at all, and our ability to develop new products, offerings, and services could be limited.
We are subject to governmental export and import controls that could impair our ability to compete in international markets or subject us to liability if we violate the controls.
Our offerings are subject to export controls and economic sanctions laws and regulations that prohibit the delivery of certain solutions and services without the required export authorizations or export to locations, governments, and persons targeted by applicable sanctions. While we have processes to prevent our offerings from being exported in violation of these laws, including obtaining authorizations as appropriate and screening against U.S. government and international lists of restricted and prohibited persons, we cannot guarantee that these processes will prevent all violations of export control and sanctions laws.
If our channel partners fail to obtain appropriate import, export, or re-export licenses or permits, we may also be adversely affected, through reputational harm as well as other negative consequences including government investigations and penalties. We presently incorporate export control and sanctions compliance requirements in our channel partner agreements. Complying with export control and sanctions regulations for a particular sale may be time-consuming and may result in the delay or loss of sales opportunities. Violations of applicable sanctions or export control laws can result in fines or penalties.
For additional risks regarding sanctions and trade protectionism, please see the risk factor entitled “We are dependent on international revenue and operations . . .” earlier in this section.
If we are not able to adequately protect our proprietary rights, our business could be harmed.
We rely on a combination of patent, copyright, and trademark laws, trade secret protections, confidentiality procedures, and contractual provisions to protect our proprietary rights. However, the steps we take to protect our intellectual property rights may be inadequate. While we have patent applications pending in the United States and throughout the world, we may be unable to obtain patent protection for the technology covered in our patent applications. In addition, any patents issued to us in the future may not provide us with competitive advantages or may be successfully challenged by third parties. Furthermore, legal standards relating to the validity, enforceability, and scope of protection of intellectual property rights are uncertain. Despite our efforts to protect our proprietary rights, unauthorized parties from time to time have copied or reverse engineered aspects of our software or have obtained and used information that we regard as proprietary. Policing unauthorized use of our software is time-consuming and costly. We are unable to measure the extent to which unauthorized use of our software exists and we expect that unauthorized use of software will remain a persistent problem, particularly in emerging economies.
Additionally, we actively protect the secrecy of our confidential information and trade secrets, including our source code. If unauthorized disclosure of our source code occurs, we could potentially lose future trade secret protection for that source code. Unauthorized disclosure of our source code could make it easier for third parties to compete with our offerings by copying functionality, which could adversely affect our financial performance and our reputation. We also seek to protect our confidential information and trade secrets through the use of non-disclosure agreements with our employees, customers, contractors, vendors, and partners. However, it is possible that our confidential information and trade secrets may be disclosed or published without our authorization. If this were to occur, it may be difficult and/or costly for us to enforce our rights, and our financial performance and reputation could be negatively impacted.
We may face intellectual property infringement claims that could be costly to defend and result in the loss of significant rights.
Our competitors, as well as a number of other entities and individuals, may own or claim to own intellectual property relating to our business. Third parties may claim that we are infringing upon or misappropriating their intellectual property rights, and we may be found to be infringing upon such rights, even if we are unaware of the intellectual property rights claimed against us. As more software patents are granted worldwide, the number of offerings and competitors in our industries grows, and the functionality of products in different industries overlaps, we expect that software developers will be increasingly subject to infringement claims. Additionally, certain patent assertion entities have become more aggressive in threatening and pursuing litigation in attempts to obtain fees for licensing the right to use patents.
Any claims or threats of infringement or misappropriation, whether with or without merit, have been and could in the future be time-consuming to defend, result in costly litigation and diversion of resources, cause product delays, require us to change our products or business practices, prevent us from offering our software and services, or require us to enter into royalty or licensing agreements. In addition, such royalty or license agreements, if required, may not be available on acceptable terms, if at all, which would likely harm our business. We may also be obligated to indemnify our customers or business partners or pay substantial settlement costs, including royalty payments, in connection with any such claim or litigation and to obtain licenses, modify applications, or refund fees, which could be costly. Furthermore, from time to time we may introduce or acquire new products, including in areas where we historically have not competed, which could increase our exposure to patent and other intellectual property claims.
Contracting with government entities exposes us to additional risks inherent in the government procurement process.
We provide products and services, directly and indirectly, to a variety of government entities. Risks associated with licensing and selling products and services to government entities include extended sales and collection cycles, varying governmental budgeting processes, and adherence to complex procurement regulations and other government-specific contractual requirements. We may be subject to audits and investigations relating to our government contracts and any violations could result in civil and criminal penalties and administrative sanctions, including termination of contracts, payment of fines, and suspension or debarment from future government business, as well as harm to our reputation and financial results.
Risks Relating to Financial Developments
We are exposed to fluctuations in currency exchange rates that could negatively impact our financial results and cash flows.
Because we conduct a substantial portion of our business outside the United States, we face exposure to adverse movements in foreign currency exchange rates, which could have a material adverse impact on our financial results and cash flows. These exposures may change over time as business practices evolve and economic conditions change. We use derivative instruments to manage a portion of our cash flow, revenue and expense exposure to fluctuations in foreign currency exchange rates. As part of our risk management strategy, we use foreign currency contracts to manage a portion of our exposures of underlying assets, liabilities, and other obligations, which exist as part of our ongoing business operations. These foreign currency instruments may have maturities that extend for one to 18 months in the future and provide us with some protection against currency exposures. However, our attempts to hedge against these risks may not be completely successful, resulting in an adverse impact on our financial results.
The fluctuations of currencies in which we conduct business can both increase and decrease our overall revenue and expenses for any given period. Although our foreign currency cash flow hedge program extends beyond the current quarter in order to reduce our exposure to foreign currency volatility, we do not attempt to completely mitigate this risk, and in any case, will incur transaction fees in adopting such hedging programs. Such volatility, even when it increases our revenues or decreases our expenses, impacts our ability to accurately predict our future results and earnings.
In addition, global events, including the sudden and unexpected effects of the COVID-19 pandemic as well as geopolitical and economic developments, may contribute to volatility in foreign exchange markets, which we may not be able to effectively manage, and our financial results could be adversely impacted. Additionally, countries in which we operate may be classified as highly inflationary economies, requiring special accounting and financial reporting treatment for such operations, or such countries’ currencies may be devalued, or both, which may adversely impact our business operations and financial results.
Our debt service obligations may adversely affect our financial condition and cash flows from operations.
We have $2.30 billion of principal debt, consisting of notes due at various times from June 2025 to December 2031, as of January 31, 2024, as described in Part II, Item 8. We also entered into a credit agreement that provides for an unsecured revolving loan facility in the aggregate principal amount of $1.5 billion, with an option to be increased up to $2.0 billion, as described in Part II, Item 8. Maintenance of our indebtedness, contractual restrictions, and additional issuances of indebtedness could:
•cause us to dedicate a substantial portion of our cash flows from operations towards debt service obligations and principal repayments;
•increase our vulnerability to adverse changes in general economic, industry, and competitive conditions;
•limit our flexibility in planning for, or reacting to, changes in our business and our industry;
•impair our ability to obtain future financing for working capital, capital expenditures, acquisitions, general corporate, or other purposes; and
•due to limitations within the debt instruments, restrict our ability to grant liens on property, enter into certain mergers, dispose of all or substantially all of the assets of Autodesk and its subsidiaries, taken as a whole, materially change our business, and incur subsidiary indebtedness, subject to customary exceptions.
We are required to comply with the covenants set forth in our credit agreement. If we breach any of the covenants and do not obtain a waiver from the note holders or lenders, then, subject to applicable cure periods, we would not be able to incur additional indebtedness under the credit agreement described in Part II, Item 8, and any outstanding indebtedness under the credit agreement may be declared immediately due and payable. In addition, changes by any rating agency to our credit rating may negatively impact the value and liquidity of our securities. Under certain circumstances, if our credit ratings are downgraded or other negative action is taken, the interest rate payable by us under our credit agreement could increase. Downgrades in our credit ratings could also restrict our ability to obtain additional financing in the future and could affect the terms of any such financing.
Our investment portfolio consists of a variety of investment vehicles that are subject to interest rate trends, market volatility, and other economic factors. If general economic conditions decline, this could cause the credit ratings of our investments to deteriorate and illiquidity in the financial marketplace, and we may experience a decline in interest income and an inability to sell our investments, leading to impairment in the value of our investments.
It is our policy to invest our cash, cash equivalents, and marketable securities in highly liquid instruments with, and in the custody of, financial institutions with high credit ratings and to limit the amounts invested with any one institution, type of security, or issuer. However, we are subject to general economic conditions, interest rate trends, and volatility in the financial marketplace that can affect the income that we receive from our investments, the net realizable value of our investments (including our cash, cash equivalents, and marketable securities), and our ability to sell them. Any one of these factors could reduce our investment income or result in material charges, which in turn could impact our overall net income (loss) and earnings (loss) per share.
From time to time we make direct investments in privately held companies. Investments in privately held companies are considered inherently risky. The technologies and products these companies have under development are typically in the early stages and may never materialize, which could result in a loss of all or a substantial part of our initial investment in these companies. The evaluation of privately held companies is based on information that we request from these companies, which is not subject to the same disclosure regulations as U.S. publicly traded companies and, as such, the basis for these evaluations is subject to the timing and accuracy of the data received from these companies.
A loss on any of our investments may cause us to record an other-than-temporary impairment charge. The effect of this charge could impact our overall net income and earnings per share. In any of these scenarios, our liquidity may be negatively impacted, which in turn may prohibit us from making investments in our business, taking advantage of opportunities, and potentially meeting our financial obligations as they come due.
Changes in tax rules and regulations, and uncertainties in interpretation and application, could materially affect our tax obligations and effective tax rate.
We are a U.S.-based multinational company subject to tax in multiple U.S. and foreign tax jurisdictions. Our effective tax rate is primarily based on our geographic mix of earnings; statutory rates; stock-based compensation; intercompany arrangements, including the manner we develop, value, and license our intellectual property; and enacted tax rules. Significant judgment is required in determining our effective tax rate and in evaluating our tax positions on a worldwide basis. While we believe our tax positions, including intercompany transfer pricing policies, are consistent with the tax laws in the jurisdictions in which we conduct our business, it is possible that these positions may be challenged by tax authorities and may have a significant impact on our effective tax rate and cash taxes.
Tax laws in the United States and in foreign tax jurisdictions are dynamic and subject to change as new laws are passed and new interpretations of the law are issued or applied. For example, the U.S. government enacted significant tax law changes in December 2017, the Tax Act, which impacted our tax obligations and effective tax rate beginning in our fiscal 2018 tax year, and significant tax legislation was included in the March 2020 CARES Act and subsequent Consolidated Appropriations Act in December 2020. Due to the complexity and varying interpretations of the Tax Act and the CARES Act, the U.S. Department of Treasury and other standard-setting bodies have been issuing and will continue to issue regulations and interpretative guidance that could significantly impact how we will apply the law and the ultimate effect on our results of operations from both the Tax Act and the CARES Act, including for our prior tax years. In addition, increases in corporate tax rates, could increase our effective tax rate, cash taxes and have an adverse effect on our results from operations.
Signed into law on August 16, 2022, the Inflation Reduction Act contains many provisions that may impact Autodesk, including the corporate alternative minimum tax and excise tax on stock buybacks. We are monitoring these impacts on our consolidated financial statements.
For tax years beginning after December 31, 2021, the Tax Act required taxpayers to capitalize and amortize research and development costs pursuant to Internal Revenue Code Section 174. Section 174 required taxpayers to capitalize research and development costs and amortize them over 5 years for expenditures attributed to domestic research and 15 years for expenditures attributed to foreign research. Although Congress is considering legislation that would reinstate and extend Section 174 expensing for certain research and experimental expenditures, the possibility that this will happen is uncertain.
Increasingly, tax authorities are reviewing existing corporate tax regulatory and legal regimes. Many countries are actively considering or implementing new taxing regimes and changes to existing tax laws. This could include U.S. and foreign tax law developments related to changes to long-standing tax principles arising from proposals made by the Organization for Economic Co-operation and Development that seek to allocate greater taxing rights to countries where customers are located and establish a global minimum tax rate of 15%. If U.S. or foreign tax authorities change applicable tax laws or successfully challenge how or where our profits are currently recognized, our overall taxes could increase, and our business, financial condition, or results of operations may be adversely impacted.
If we were required to record an impairment charge related to the value of our long-lived assets or an additional valuation allowance against our deferred tax assets, our results of operations would be adversely affected.
Our long-lived assets are tested for impairment if indicators of impairment exist. If impairment testing shows that the carrying value of our long-lived assets exceeds their estimated fair values, we would be required to record a non-cash impairment charge, which would decrease the carrying value of our long-lived assets, adversely affecting our results of operations. Our deferred tax assets include net operating loss, amortizable tax assets, and tax credit carryforwards that can be used to offset taxable income and reduce income taxes payable in future periods. Each quarter, we assess the need for a valuation allowance, considering both positive and negative evidence to determine whether all or a portion of the deferred tax assets are more likely than not to be realized. We continue to have a valuation allowance against certain U.S. and foreign deferred tax assets. Changes in the amount of the U.S. and foreign jurisdictions valuation allowance could also result in a material non-cash expense or benefit in the period in which the valuation allowance is adjusted, and our results of operations could be materially affected. We will continue to perform these tests on our worldwide deferred tax assets, and any future adjustments to the realizability of our deferred tax assets may have a material effect on our financial condition and results of operations.
General Risk Factors
Our business may be significantly disrupted upon the occurrence of a catastrophic event.
Our business is highly automated and relies extensively on the availability of our network and data center infrastructure, our internal technology systems, and our websites. We also rely on hosted computer services from third parties for services that we provide to our customers and computer operations for our internal use. The failure of our systems or hosted computer services due to a catastrophic event, such as an earthquake, fire, flood, tsunami, weather event, telecommunications failure, power failure, cyber attack, terrorism or war (including the ongoing wars between the Ukraine and Russia and between Israel and Hamas, and any related political or economic responses and counter-responses or otherwise by various global actors or the general effect on the global economy), or business interruption from epidemics or pandemics, or the fear of such events, could adversely impact our business, financial results, and financial condition. For example, our corporate headquarters and executive offices are located near major seismic faults in the San Francisco Bay Area and face annual periods of wildfire danger, which increase the probability of power outages and may impact employees’ abilities to commute to work or to work from home. We have developed disaster recovery plans and maintain backup systems in order to reduce the potential impact of a catastrophic event; however, there can be no assurance that these plans and systems would enable us to return to normal business operations. In addition, any such event could negatively impact a country or region in which we sell our products. This could in turn decrease that country’s or region’s demand for our products, negatively impacting our financial results.
We are subject to legal proceedings and regulatory inquiries, and we may be named in additional legal proceedings or become involved in regulatory inquiries in the future, all of which are costly, distracting to our core business, and could result in an unfavorable outcome or a material adverse effect on our business, financial condition, results of operations, cash flows, or the trading prices for our securities.
We are involved in legal proceedings and receive inquiries from regulatory agencies. As the global economy has changed and our business has evolved, we have seen an increase in litigation activity and regulatory inquiries. Like many other technology companies, the number and frequency of inquiries from U.S. and foreign regulatory agencies we have received regarding our business and our business practices, as well as the business practices of others in our industry, have increased in recent years. In the event we are involved in significant disputes or are the subject of a formal action by a regulatory agency, we could be exposed to costly and time-consuming legal proceedings that could result in any number of outcomes. Any claims or regulatory actions initiated by or against us, whether successful or not, could result in high defense costs, damage awards, injunctive relief, increased costs of business, fines or orders to change certain business practices, significant dedication of management time, diversion of operational resources, or otherwise harm our business. In any such event, our financial results, results of operations, cash flows, or trading prices for our securities could be negatively impacted.
Changes in existing financial accounting standards or practices, or taxation rules or practices may adversely affect our results of operations.
Changes in existing accounting or taxation rules or practices, new accounting pronouncements or taxation rules, or varying interpretations of current accounting pronouncements or taxation practices could have a significant adverse effect on our results of operations or the way we conduct our business. Further, such changes could potentially affect our reporting of transactions completed before such changes are effective.
We are required to evaluate our internal control over financial reporting under Section 404 of the Sarbanes-Oxley Act of 2002 and any adverse results from such evaluation could result in a loss of investor confidence in our financial reports and have an adverse effect on our stock price.
Pursuant to Section 404 of the Sarbanes-Oxley Act of 2002, we are required to furnish a report by our management on our internal control over financial reporting, including an assessment of the effectiveness of our internal control over financial reporting as of the end of our fiscal year. This assessment must include a statement as to whether or not our internal control over financial reporting is effective and disclosure of any material weaknesses in our internal control over financial reporting identified by management. If our management or independent registered public accounting firm identifies one or more material weaknesses in our internal control over financial reporting, we are unable to assert that our internal control over financial reporting is effective, or our independent registered public accounting firm is unable to express an opinion that our internal controls are effective, investors could lose confidence in the accuracy and completeness of our financial reports, which could have an adverse effect on our business and stock price.
In preparing our financial statements we make certain assumptions, judgments, and estimates that affect amounts reported in our consolidated financial statements which, if not accurate, may significantly impact our financial results.
We make assumptions, judgments, and estimates for a number of items, including revenue recognition for product subscriptions and enterprise business arrangements (“EBAs”), the determination of the fair value of acquired assets and liabilities, goodwill, financial instruments including strategic investments, long-lived assets, and intangible assets, the realizability of deferred tax assets, and the fair value of stock awards. We also make assumptions, judgments, and estimates in determining the accruals for uncertain tax positions, variable compensation, partner incentive programs, allowances for credit losses, asset retirement obligations, legal contingencies, and operating lease liabilities. These assumptions, judgments, and estimates are drawn from historical experience and various other factors that we believe are reasonable under the circumstances as of the date of the consolidated financial statements. Actual results could differ materially from our estimates, and such differences could significantly impact our financial results.
ITEM 1B.UNRESOLVED STAFF COMMENTS
None.
ITEM 1C. CYBERSECURITY
Risk Management and Strategy
Autodesk has established policies and processes for assessing, treating, and managing material risk from cybersecurity threats based on relevant industry standards. These policies and processes are reviewed and updated at least annually. We have integrated these processes into our overall risk management systems and processes. We routinely assess material risks from cybersecurity threats, including any potential unauthorized occurrence on or conducted through our information systems that may adversely affect the confidentiality, integrity, or availability of our information systems or any information residing therein.
We conduct risk assessments, penetration tests, and other security assessments to identify cybersecurity threats regularly, and in the event of a material change in our business practices that may affect information systems potentially vulnerable to such cybersecurity threats. These assessments include the identification of reasonably foreseeable internal and external risks, the likelihood and potential damage that could result from such risks, and the sufficiency of existing policies, procedures, systems, and safeguards in place to manage such risks. Risks are then assigned to the appropriate owners for tracking and mitigation.
Following these assessments, we re-design, implement, and maintain reasonable safeguards, when appropriate, to minimize identified risks; reasonably address any identified gaps in existing safeguards; and continually monitor the effectiveness of our safeguards. We devote significant resources and designate high-level personnel, including our Chief Trust Officer, who reports to our Chief Technology Officer, to manage the risk assessment and mitigation processes.
As part of our overall risk management system, we monitor and test our safeguards. We train our workforce on these safeguards. Personnel at all levels and departments are made aware of our cybersecurity policies through required trainings. Cybersecurity tabletop exercises are regularly conducted for our executives and for incident response professionals. Improvements identified at these tabletop exercises are implemented into our processes.
We engage assessors, consultants, and auditors in connection with our risk assessment processes. These outside advisors assist us to design and implement our cybersecurity policies and procedures, as well as to monitor and test our safeguards.
We require Autodesk’s third-party service providers and suppliers to implement and maintain appropriate security measures consistent with applicable laws in connection with their work with us and to promptly report any suspected breach of their security measures that may affect our Company.
For additional information regarding whether any risks from cybersecurity threats, including as a result of any previous cybersecurity incidents, have materially affected or are reasonably likely to materially affect our Company, including our business strategy, results of operations, or financial condition, please refer to Item 1A, “Risk Factors,” in this Annual Report on Form 10-K, including the risk factors entitled “Risks Relating to Our Operations”.
Governance
One of the key functions of our board of directors is informed oversight of our risk management process, including risks from cybersecurity threats. Our board of directors is responsible for monitoring and assessing strategic risk exposure. The board’s Audit Committee oversees the management of cybersecurity risks relating to financial, accounting, and internal control matters. The full board receives regular updates from our senior management and outside advisors regarding cybersecurity risks Autodesk faces. Our Enterprise Risk Management function is responsible for identifying, prioritizing, and mitigating risks that could limit Autodesk's achievement of its strategic and operational priorities. Our executive officers are responsible for the day-to-day assessment and management of these risks.
Our Chief Trust Officer is responsible for assessing and managing material risks from cybersecurity threats. Our Chief Trust Officer has more than twenty years of cybersecurity leadership experience, including serving in similar roles leading cybersecurity programs at other public companies.
Our Chief Trust Officer oversees our cybersecurity policies and processes, including those described in “Risk Management and Strategy” above. The processes by which our Chief Trust Officer is informed about and monitors the prevention, detection, mitigation, and remediation of cybersecurity incidents include the following: leading Autodesk’s Trust program which implements data protection measures and processes across the organization; strategic planning of the company’s cybersecurity initiatives and objectives; cybersecurity risk mitigation efforts; managing tools and processes that support security incident monitoring and alerting; overseeing security incident response planning; managing exercises that test management’s response plans and procedures; and managing our response to suspected or actual security incidents.
Our Chief Trust Officer provides quarterly briefings to the Audit Committee regarding our cybersecurity risks and state of our Trust program, including recent cybersecurity incidents and related responses, cybersecurity systems testing, and data protection initiatives and metrics. Our Audit Committee regularly updates the board of directors on such reports. In addition, our Chief Trust Officer provides briefings on cybersecurity risks and activities to the board of directors at least annually. Our Chief Trust Officer may also brief the board of directors regarding significant cybersecurity incidents.
ITEM 2.PROPERTIES
We lease approximately 1,400,000 square feet of office space in 88 locations in the United States and internationally through our foreign subsidiaries. Our executive offices and corporate headquarters are in leased office space in San Francisco, California. Our San Francisco facilities consist of approximately 211,000 square feet under leases that have expiration dates ranging from June 2026 to December 2028. We and our foreign subsidiaries lease additional space in various locations throughout the world for local sales, product development, and technical support personnel.
All facilities are in good condition. We believe that our existing facilities and offices are adequate to meet our requirements for the foreseeable future. See Part II, Item 8, Note 9, “Leases,” in the Notes to Consolidated Financial Statements for more information.
ITEM 3.LEGAL PROCEEDINGS
We are involved in a variety of claims, suits, investigations, inquiries, and proceedings in the normal course of business activities including claims of alleged infringement of intellectual property rights, commercial, employment, tax, prosecution of unauthorized use, business practices, and other matters. In our opinion, resolution of pending matters is not expected to have a material adverse impact on our consolidated results of operations, cash flows, or financial position. Given the unpredictable nature of legal proceedings, there is a reasonable possibility that an unfavorable resolution of one or more such proceedings could in the future materially affect our results of operations, cash flows, or financial position in a particular period, however, based on the information known by us as of the date of this filing and the rules and regulations applicable to the preparation of our financial statements, any such amount is either immaterial or it is not possible to provide an estimated amount of any such potential loss.
In early March 2024, the Audit Committee of Autodesk’s Board of Directors commenced an internal investigation with the assistance of outside counsel and advisors regarding the Company’s free cash flow and non-GAAP operating margin practices (the “Internal Investigation”). On March 8, 2024, the Company voluntarily contacted the U.S. Securities and Exchange Commission (“SEC”) to inform it of the Internal Investigation. On April 3, 2024, the United States Attorney’s Office for the Northern District of California (“USAO”) contacted the Company regarding the Internal Investigation. The Company voluntarily provided the SEC and USAO with certain documents relating to the Internal Investigation and will continue to
cooperate with the SEC and USAO. At this stage, the Company cannot reasonably estimate the amount of any possible financial loss that could result from this matter.
On April 24, 2024, plaintiff Michael Barkasi filed a purported federal securities class action complaint in the Northern District of California against the Company, our Chief Executive Officer Andrew Anagnost, and our former Chief Financial Officer, Deborah L. Clifford. The action is captioned Michael Barkasi v. Autodesk, Inc. et al., 3:24-cv-02431. The complaint, which was filed shortly after the Company’s announcement of the Audit Committee of the Board of Directors’ internal investigation regarding the Company’s free cash flow and non-GAAP operating margin practices, generally alleges that the defendants made false and misleading statements in violation of Sections 10(b) and 20(a) of the Securities Exchange Act of 1934, and Rule 10b-5 promulgated thereunder. The action purports to be brought on behalf of those who purchased or otherwise acquired the Company’s publicly traded securities between June 1, 2023 and April 16, 2024, and seeks unspecified damages and other relief. The case is in its early stages and a lead plaintiff has yet to be appointed. At this stage, the Company cannot reasonably estimate the amount of any possible financial loss that could result from this matter.
In addition, on June 7, 2024, a purported stockholder derivative complaint was filed in the United States District Court for the Northern District of California, naming our current directors and our Chief Strategy Officer as defendants and our company as a nominal defendant. The complaint generally alleges violations of Section 14(a) of the Exchange Act and breach of fiduciary duties, aiding and abetting breach of fiduciary duties, unjust enrichment, abuse of control, and waste of corporate assets, based on similar underlying allegations contained in the purported federal securities class action complaint described above.
ITEM 4.MINE SAFETY DISCLOSURES
Not applicable.
PART II
ITEM 5.MARKET FOR REGISTRANT’S COMMON EQUITY, RELATED STOCKHOLDER MATTERS AND ISSUER PURCHASES OF EQUITY SECURITIES
MARKET INFORMATION FOR COMMON STOCK
Our common stock is traded on the Nasdaq Global Select Market under the symbol ADSK.
DIVIDEND POLICY
We anticipate that, for the foreseeable future, we will not pay any cash or stock dividends.
STOCKHOLDERS
As of January 31, 2024, the number of common stockholders of record was 286. Because many of our shares of common stock are held by brokers or other institutions on behalf of stockholders, we are unable to estimate the total number of stockholders represented by the record holders.
ISSUER PURCHASES OF EQUITY SECURITIES
Autodesk’s stock repurchase program provides Autodesk with the ability to offset the dilution from the issuance of stock under our employee stock plans and reduce shares outstanding over time, and has the effect of returning excess cash generated from our business to stockholders. Under the share repurchase program, Autodesk may repurchase shares from time to time in open market transactions, privately negotiated transactions, accelerated share repurchase programs, tender offers, or by other means. The share repurchase program does not have an expiration date and the pace and timing of repurchases will depend on factors such as cash generation from operations, available surplus, the volume of employee stock plan activity, remaining shares available in the authorized pool, cash requirements for acquisitions, economic and market conditions, stock price, and legal and regulatory requirements.
The following table provides information about the repurchase of common stock in open-market transactions during the quarter ended January 31, 2024: | | | | | | | | | | | | | | | | | | | | | | | | | |
| (Shares in thousands) | Total Number of Shares Purchased | | Average Price Paid per Share | | Total Number of Shares Purchased as Part of Publicly Announced Plans or Programs(1) | | | | Approximate Dollar Value of Shares that May Yet Be Purchased Under the Plans of Program (in millions) (2) |
| November 1 - November 30 | 156 | | | $ | 205.50 | | | 156 | | | | | $4,769 |
| December 1 - December 31 | 49 | | | 224.39 | | | 49 | | | | | 4,758 | |
| January 1 - January 31 | 84 | | | 232.59 | | | 84 | | | | | 4,739 | |
| Total | 289 | | | $ | 216.55 | | | 289 | | | | | |
____________________
(1)Represents shares purchased in open-market transactions under the stock repurchase program approved by the Board of Directors in November 2022.
(2)These amounts correspond to the plan publicly announced and approved by the Board of Directors in November 2022 that authorized the repurchase of $5 billion. At January 31, 2024, $4.74 billion remained available for repurchase under the November 2022 repurchase program. The plan does not have a fixed expiration date.
SALES OF UNREGISTERED SECURITIES
There were no sales of unregistered securities during the three months ended January 31, 2024.
COMPANY STOCK PERFORMANCE
The following graph shows a five-year comparison of cumulative total return (equal to dividends plus stock appreciation) for our common stock, the Standard & Poor’s 500 Stock Index, the Standard & Poor’s North American Technology Software Index, and the Dow Jones U.S. Software Index. The following graph and related information will not be deemed to be “soliciting material” or to be “filed” with the SEC, nor will such information be incorporated by reference into any filing pursuant to the Securities Act of 1933 or the Securities Exchange Act of 1934, except to the extent that we specifically incorporate it by reference into such filing.
Comparison of Five Year Cumulative Total Stockholder Return (1)
___________________
(1)Assumes $100 invested on January 31, 2019, in Autodesk’s stock, the Standard & Poor’s 500 Stock Index, Standard & Poor’s North American Technology Software Index, and the Dow Jones U.S. Software Index with reinvestment of all dividends. Total stockholder returns for prior periods are not an indication of future investment returns.
ITEM 6.[RESERVED]
ITEM 7.MANAGEMENT’S DISCUSSION AND ANALYSIS OF FINANCIAL CONDITION AND RESULTS OF OPERATIONS
The following discussion and analysis of our financial condition and results of operations should be read in conjunction with our consolidated financial statements and related notes appearing in Part II, Item 8 of this Annual Report on Form 10-K. This discussion contains forward-looking statements based upon current expectations that involve risks and uncertainties. Our actual results may differ materially from those anticipated in these forward-looking statements as a result of several factors, including those set forth above in Part I, Item 1A, "Risk Factors," and elsewhere in this report. See “Forward-Looking Information” immediately preceding Part I.
STRATEGY
Autodesk is changing how the world is designed and made. Our technology spans architecture, engineering, construction, product design, manufacturing, media and entertainment, empowering innovators everywhere to solve challenges big and small. From greener buildings to smarter products to more mesmerizing blockbusters, Autodesk technology helps our customers to design and make a better world for all.
Our strategy is to deliver a trusted design and make platform that connects people through automation, data, and insights to help them achieve better outcomes for their businesses and the world. To drive the execution of our strategy, we are focused on three strategic priorities: build the platform of choice for Design and Make, accelerate adoption of Fusion, Forma, and Flow, and transform how customers experience Autodesk.
We equip and inspire our users with the tailored tools, services, and access they need for success today and tomorrow. At every step, we help users harness the power of data to build upon their ideas and explore new ways of imagining, collaborating, and creating to achieve better outcomes for their customers, for society, and for the world. And because creativity can’t flourish in silos, we connect what matters - from steps in a project to collaborators on a unified platform.
Product Evolution
We offer subscriptions for individual products and Industry Collections, enterprise business arrangements (“EBAs”), and cloud service offerings (collectively referred to as “subscription plans”). Subscription plans are designed to give our customers more flexibility with how they use our offerings and to attract a broader range of customers, such as project-based users and small businesses.
Our subscription plans represent a hybrid of desktop software and cloud functionality, which provides a device-independent, collaborative design workflow for designers and their stakeholders. Our cloud offerings, for example, Autodesk Construction Cloud, Autodesk Build, Fusion, Flow Production Tracking, AutoCAD web app, and AutoCAD mobile app, provide tools, including mobile and collaboration capabilities, to streamline design, collaboration, building and manufacturing, and data management processes. We believe that customer adoption of these latest offerings will continue to grow as customers across a range of industries begin to take advantage of the scalable computing power and flexibility provided through these services.
Industry Collections provide our customers with access to a broader selection of Autodesk solutions and services, simplifying the customers’ ability to benefit from a complete set of tools for their industry.
To support our strategic priority of digital transformation in Architecture, Engineering, and Construction (“AEC”), we are strengthening our AEC solutions’ foundation with both organic and inorganic investments. In fiscal 2024, we launched the first set of capabilities in Autodesk Forma, an industry cloud that unifies workflows across the teams that design, build, and operate the built environment. Autodesk Forma’s initial capabilities enable the early-stage planning and design process with automation and AI-powered insights that simplify the exploration of design concepts, offload repetitive tasks, and help evaluate environmental qualities surrounding a building site. In fiscal 2023, we acquired a cloud-connected, extended reality (XR) platform enabling AEC professionals to present, collaborate and review projects in immersive and interactive experiences, from anywhere and at any time. This acquisition enables Autodesk to meet increasing needs for augmented reality (AR) and virtual reality (VR) technology advancements within the AEC industry and further support AEC customers throughout the project delivery lifecycle. In fiscal 2022, we acquired Storm UK Holdco Limited, the parent of Innovyze, Inc. (“Innovyze”), which provides water infrastructure software. Combining Innovyze’s hydraulic modeling, simulation, asset performance management and operational analytics solutions with Autodesk’s design and analysis solutions (including Autodesk Civil 3D, Autodesk InfraWorks, and the Autodesk Construction Cloud) enables us to deliver end-to-end, cloud-based solutions for our water infrastructure customers that drive efficiency and sustainability. Other acquisitions in fiscal 2022 include a cloud-based estimating solution that enables construction teams to create estimates, perform digital takeoffs, generate detailed reports and proposals and manage bid-day processes. Additionally, in fiscal 2022, we launched Autodesk Tandem, a cloud-based digital twin technology platform that extends digital project delivery by providing owner/operators with an easy to use, accurate, digital as-built model of a newly built or renovated facility. This accelerates operational readiness and extends the value of BIM downstream into the owner/operator segment.
In manufacturing, our strategy is to combine organic and acquired software in existing and adjacent verticals to create end-to-end, cloud-based solutions for our customers that drive efficiency and sustainability. We continue to attract global manufacturing leaders and disruptive startups with our generative design and cloud-based Fusion that converges the design process with manufacturing. In fiscal 2024, we acquired a provider of simulation technology that enables factory and logistics center operators to optimize their processes. In fiscal 2023, we acquired a maker of software for optimizing manufacturing processes with automation and digitization from the shop floor upward that provides a real-time system of record for data collection, management, and analysis. In fiscal 2022, we acquired Upchain, an instant-on, cloud-based data management technology that allows product design and manufacturing customers to collaborate in the cloud across their value chains and bring products to market faster.
Our strategy includes improving our product functionality and expanding our product offerings through internal development as well as through the acquisition of products, technology, and businesses. Acquisitions often increase the speed at which we can deliver product functionality to our customers; however, they entail cost and integration challenges and may, in certain instances, negatively impact our operating margins. We continually review these factors in making decisions regarding acquisitions. We anticipate that we will continue to acquire products, technology, and businesses as compelling opportunities become available.
Global Reach
We sell our products and services globally, through a combination of direct and indirect channels. Our direct channels include, but are not limited to, internal sales resources focused on selling our highly specialized solutions in our largest accounts, Solution Providers focused on serving certain Flex and subscription customers through our new transaction model, and business transacted through our online Autodesk branded store. Our indirect channels primarily include value added distributors, value added resellers, direct market resellers, volume channel partners, and product-specific resellers. During fiscal 2023, we entered into transition agreements with certain of our distributors, including TD Synnex and Ingram Micro, to provide transition distribution activities for a one-to-two-year period, with potential extensions. In connection with the transition agreements, Autodesk intends to increase its selling efforts with value-added resellers and Solution Providers. We introduced a new transaction model for our token-based Flex offering in North America, and certain countries in EMEA and APAC, and for most of our subscription offerings in Australia during fiscal 2024, whereby channel partners provide a quote to customers but the actual transaction occurs directly between Autodesk and the customer. Dependent upon successful implementation in Australia, we intend to transition our indirect business to the new transaction model in our major markets globally in fiscal 2025 and fiscal 2026. We expect the change in accounting recognition of sales incentives to indirect channels from contra revenue to operating expenses under the new transaction model to positively impact calculated revenue growth, while being broadly neutral to calculated operating profit and free cash flow dollars, and to result in a calculated negative impact to operating margin. See Part II, Item 8, Note 2, "Revenue Recognition" in the Notes to the Consolidated Financial Statements for further detail on the results of our indirect and direct channel sales for the fiscal years ended January 31, 2024, 2023, and 2022.
We anticipate that our channel mix will continue to change as we scale our business. With the continued growth of our online Autodesk branded store, the transition to annual billings for multi-year contracts and our new token-based Flex model, and the introduction of our new transaction model, we are transacting directly with more end customers, rather than through distributors, without substantial disruption to our revenue. We expect our indirect channel will continue to transact and support a considerable portion of our customers. We also expect our transition to annual billings for multi-year contracts to impact the timing of our billings and cash collections. We employ a variety of incentive programs and promotions to align our direct and indirect channels with our business strategies.
Platform Capabilities
We are building a trusted, outcome-focused platform for critical customer workflows that enables end-to-end digital transformation for our customers and partners within and between the industries we serve. We aim to accelerate these customer workloads by providing granular, interoperable and accessible data.
We plan to do this by focusing on building the next generation of technology and services as trusted, shared capabilities. We aim to centralize critical and duplicative capabilities across key offerings. These include foundational capabilities to make our offers safer, faster, easier, and globally scalable, as well as capabilities that can accelerate new sources of value for our customers.
One example of these shared capabilities is Autodesk AI. We have been investing in AI for over a decade. Our focus is on building AI capabilities that add value to our customers’ workloads through augmentation, automation and analysis.
One of our key strategies is to maintain an API based architecture of our software products to facilitate third-party development of complementary products and industry-specific software solutions. This approach enables customers and third parties to customize solutions for a wide variety of highly specific uses. We offer several programs that provide strategic investment funding, technological platforms, user communities, technical support, forums, and events to developers who develop add-on applications for our products. For example, we have established the Autodesk Platform Services to support innovators that build solutions to facilitate the development of a single connected ecosystem for the future of how things are designed, made, and used.
In addition to the competitive advantages afforded by our technology, our large global network of distributors, resellers, Solution Providers, third-party developers, customers, educators, educational institutions, learning partners, and students is a key competitive advantage that has been cultivated over an extensive period. This network of partners and relationships provides us with a broad and deep reach into volume markets worldwide. Our distributor, reseller and Solution Provider network is extensive and provides our customers with the resources to purchase, deploy, learn, and support our solutions quickly and easily. We have a significant number of registered third-party developers who create products that work well with our solutions and extend them to a variety of specialized applications.
Impact at Autodesk
Autodesk is committed to advancing a more sustainable, resilient, and equitable world. We don’t believe in waiting for progress, we believe in making it. We take action as a business and support our employees, customers, and communities in our collective opportunity to design and make a better world for all.
We focus our efforts to advance positive outcomes across three primary areas: energy and materials, health and resilience, and work and prosperity. These impact opportunity areas are derived from the UN Sustainable Development Goals (“SDGs”) and have been focused through a multi-pronged process to align the top needs of our stakeholders, the important issues of our business, and the areas we are best placed to accelerate positive impact at scale.
These opportunities manifest as outcomes through how our customers leverage our technology to design and make net-zero carbon buildings, resilient infrastructure, more sustainable products, and a thriving workforce. We realize these opportunities through powering our business with 100% renewable energy, neutralizing greenhouse gas emissions and developing an inclusive culture. We advance these opportunities with industry innovators through collaboration, philanthropic capital, software donations, and training.
The Autodesk Foundation (the “Foundation”), a privately funded 501(c)(3) charity organization established and solely funded by us, leads our philanthropic efforts. The purpose of the Foundation is twofold: to support employees to create a better world at work, at home, and in the community by matching employees’ volunteer time and donations to nonprofit organizations; and to support organizations using design and make solutions to drive positive social and environmental impact. On our behalf, the Foundation also administers a discounted software donation program to nonprofit organizations, social and environmental entrepreneurs, and others who are developing design solutions that will transform industries and help shape a better world for all.
Additional information about our environmental, social, and governance program is available in our annual impact report on our website at www.autodesk.com. Information contained on or accessible through our website is not part of or incorporated by reference into this report.
Assumptions Behind Our Strategy
Our strategy depends upon many assumptions, including: making our technology available to mainstream markets; leveraging our large global network of distributors, resellers, agents, third-party developers, customers, educators, educational institutions, learning partners, and students; improving the performance and functionality of our products and platform; and adequately protecting our intellectual property. If the outcome of any of these assumptions differs from our expectations, we may not be able to implement our strategy, which could potentially adversely affect our business. For further discussion regarding these and related risks, see Part I, Item 1A, “Risk Factors.”
Recent Developments
On February 20, 2024, Autodesk acquired Payapps Limited (“Payapps”), a leading cloud-based software platform for managing construction-related payments. This acquisition will deepen Autodesk Construction Cloud’s footprint and provide a robust payment management offering to serve the needs of general contractors and trade contractors. Through automating the application of the payment process, Payapps’ solution provides greater transparency, reduces risk and helps accelerate time-to-payment.
On March 15, 2024, Autodesk acquired the PIX business of X2X, LLC (“PIX”), a production management solution for secure review and content collaboration in the media and entertainment industry. The acquisition will help foster broader collaboration and communication, as well as help drive greater efficiencies in the production process.
See Part II, Item 8, Note 17, “Subsequent Events,” in the Notes to Consolidated Financial Statements for further discussion.
CRITICAL ACCOUNTING POLICIES AND ESTIMATES
Our Consolidated Financial Statements are prepared in accordance with U.S. generally accepted accounting principles. In preparing our Consolidated Financial Statements, we make assumptions, judgments, and estimates that can have a significant impact on amounts reported in our Consolidated Financial Statements. We evaluate our estimates and assumptions on an ongoing basis. We base our assumptions, judgments, and estimates on historical experience and various other factors that we believe to be reasonable under the circumstances. Actual results could differ materially from these estimates under different assumptions or conditions.
Our significant accounting policies are described in Part II, Item 8, “Financial Statements and Supplementary Data,” Note 1, “Business and Summary of Significant Accounting Policies,” in the Notes to Consolidated Financial Statements. An accounting policy is deemed to be critical if it requires an accounting estimate to be made based on assumptions about matters that are highly uncertain at the time the estimate is made, if different estimates reasonably could have been used, or if changes in the estimate that are reasonably possible could materially impact the financial statements. We believe that of all our significant accounting policies, the following accounting policies and specific estimates involve a greater degree of judgment and complexity. Accordingly, these are the accounting policies we believe are the most critical to aid in fully understanding and evaluating our financial condition and results of operations.
Revenue Recognition - Judgments with Multiple Performance Obligations. Our contracts with customers may include promises to transfer multiple products and services to a customer. A performance obligation is a promise in a contract with a customer to transfer products or services that are distinct. Determining whether products and services are distinct performance obligations that should be accounted for separately or combined as a single performance obligation may require significant judgment that requires us to assess the nature of the promise and value delivered to the customer and the interaction of the desktop applications and cloud functionalities.
For our product subscriptions, cloud service offerings, and flexible enterprise business arrangements, the functional nature of the promise, as well as the customers’ value expectations, led us to conclude desktop applications and cloud functionalities are not distinct in the context of the contract and should be accounted for as a single performance obligation. There is a high degree of interaction of the desktop applications and cloud functionalities, which is not available with the desktop applications alone or in conjunction with third-party cloud service providers. Furthermore, customers are not able to use the desktop applications for its intended purpose without our cloud functionalities.
For contracts with more than one performance obligation, the transaction price is allocated among the performance obligations in an amount that depicts the relative standalone selling price (“SSP”) of each obligation. Judgment is required to determine the SSP for each distinct performance obligation. We use a range of amounts to estimate SSP when we sell each of the products and services separately and need to determine whether there is a discount that should be allocated based on the relative SSP of the various products and services.
We establish SSP for most of our products and services based on observable prices when sold separately in similar circumstances to similar customers. In instances where SSP is not directly observable, such as when we do not sell the product or service separately, we determine the SSP using information that includes market conditions and other observable inputs. We typically have more than one SSP for individual products and services due to the stratification of those products and services by customer and circumstance. In these instances, we use relevant information such as the product type or sales channel to determine the SSP.
Strategic Investments. Strategic investment debt and equity securities are valued using significant unobservable inputs or data in an inactive market and the valuation requires our judgment due to the absence of market prices and inherent lack of liquidity. The carrying value is adjusted for our strategic investment equity securities if there are observable price changes in a same or similar security from the same issuer or if there are identified events or changes in circumstances that may indicate impairment, as discussed below. The determination of whether an orderly transaction is for a same or similar investment requires significant management judgment including the nature of rights and obligations of the investments, the extent to which differences in those rights and obligations would affect the fair values of those investments, and the impact of any differences based on the stage of operational development of the investee.
These assumptions are inherently subjective and involve significant management judgment. Whenever possible, we use observable market data and rely on unobservable inputs only when observable market data is not available when determining fair value.
We assess our strategic investment debt and equity securities portfolio quarterly for impairment. Strategic investment equity securities are assessed based on available information such as current cash positions, earnings and cash flow forecasts, recent operational performance, and any other readily available market data. For any available-for-sale debt securities, if Autodesk does not intend to sell and it is not more likely than not that Autodesk will be required to sell the available-for-sale debt security prior to recovery of its amortized cost basis, Autodesk will determine whether a decline in fair value below the amortized cost basis is due to credit-related factors. The credit loss is measured as the amount by which the debt security’s amortized cost basis exceeds the estimate of the present value of cash flows expected to be collected, up to the difference between the amortized cost basis and the fair value. Impairment will be assessed at the individual security level. Credit-related impairment is recognized as an allowance on the Consolidated Balance Sheets with a corresponding adjustment to “Interest and
other expense, net” on the Company’s Consolidated Statements of Operations. Any impairment that is not credit-related is recognized in “Accumulated other comprehensive loss” on the Consolidated Balance Sheets.
For our quarterly impairment assessment of privately held debt and equity securities, the analysis encompasses an assessment of the severity and duration of the impairment and qualitative and quantitative analysis of other key factors including: the investee’s financial metrics, the investee’s products and technologies meeting or exceeding predefined milestones, market acceptance of the product or technology, other competitive products or technology in the market, general market conditions, management and governance structure of the investee, the investee’s liquidity, debt ratios, and the rate at which the investee is using its cash.
Business Combinations. The assets acquired and liabilities assumed in a business combination are recorded based on their estimated fair values at the acquisition date, with the exception of contract assets and contract liabilities (i.e., deferred revenue) which are recognized and measured on the acquisition date in accordance with Autodesk’s “Revenue Recognition” policy in Part II, Item 8, “Financial Statements and Supplementary Data,” Note 1 “Business and Summary of Significant Accounting Policies”. Any residual purchase price is recorded as goodwill. Accounting for business combinations requires us to make significant estimates and assumptions, especially at the acquisition date with respect to intangible assets.
Although we believe the assumptions and estimates we have made are reasonable, they are based in part on historical experience and information obtained from the management of the acquired companies and are inherently uncertain and unpredictable. Unanticipated events and circumstances may occur which may affect the accuracy or validity of such assumptions, estimates, or actual results. Examples of critical estimates used in valuing certain of the intangible assets and in determining the assets’ useful lives for the assets we have acquired or may acquire in the future include but are not limited to:
•future expected cash flows from subscriptions and maintenance agreements, sales, and acquired developed technologies;
•the acquired company's trade name and patents, as well as assumptions about the period of time the acquired trade name and patents will continue to be used in our product portfolio;
•expected growth in revenue from the acquired company’s existing customer relationships;
•expected costs to develop the in-process research and development into commercially viable products and estimated cash flows from the projects when completed;
•uncertain tax positions and tax related valuation allowances assumed; and
•discount rates used to determine the present value of estimated future cash flows.
Realizability of Intangible Assets. We assess the realizability of our intangible assets, other than goodwill, quarterly, or sooner should events or changes in circumstances indicate the carrying values of such assets may not be recoverable. We consider the following factors important in determining when to perform an impairment review: significant under-performance of a business or product line relative to budget, shifts in business strategies which affect the continued uses of the assets, significant negative industry or economic trends, and the results of past impairment reviews. When such events or changes in circumstances occur, we assess recoverability of these assets.
We assess recoverability of these assets by comparing the carrying amounts to the future undiscounted cash flows the assets are expected to generate. If impairment indicators were present based on our undiscounted cash flow models, which include assumptions regarding projected cash flows, we would perform a discounted cash flow analysis to assess impairments on intangible assets.
The key assumptions that we use in our discounted cash flow model include the amount and timing of estimated future cash flows to be generated by the asset group over an extended period of time and a rate of return that considers the relative risk of achieving the cash flows and the time value of money. Significant judgment is required to estimate the amount and timing of future cash flows and the relative risk of achieving those cash flows. We also make judgments about the remaining useful lives of acquired intangible assets and other intangible assets that have finite lives.
Variances in these assumptions could have a significant impact on our conclusion as to whether an asset is impaired or the amount of any impairment charge. Impairment charges, if any, result in situations where any fair values of these assets are less than their carrying values.
Income Taxes. We account for income taxes under the asset and liability approach. Under this method, deferred tax assets, including those related to tax loss carryforwards and credits, and deferred tax liabilities are determined based on the
differences between the financial statement and tax bases of assets and liabilities using enacted tax rates in effect for the year in which the differences are expected to reverse. We recognize the tax benefit for an uncertain tax position when it meets the more likely than not threshold for recognition. We recognize potential accrued interest and penalties related to unrecognized tax benefits as income tax expense.
A valuation allowance is recorded to reduce deferred tax assets when management cannot conclude that it is more likely than not that the deferred tax asset will be recovered. The valuation allowance is determined by assessing both positive and negative evidence to determine whether it is more likely than not that deferred tax assets are recoverable; such assessment is required on a jurisdiction-by-jurisdiction basis. Significant judgment is required in determining whether the valuation allowance should be recorded against deferred tax assets. In assessing the need for or release of a valuation allowance, we consider all available evidence including past operating results and estimates of future taxable income.
As we continually strive to optimize our overall business model, tax planning strategies may become feasible and prudent whereby management may determine that it is more likely than not that the Portugal, New Zealand, California, Massachusetts, Michigan and Australia capital loss and U.S. capital loss deferred tax assets will be realized. Each quarter we will continue to evaluate the positive and negative evidence of our ability to utilize our global deferred tax assets.
Loss Contingencies. As described in Part I, Item 3, “Legal Proceedings” and Part II, Item 8, “Financial Statements and Supplementary Data, Note 11, “Commitments and Contingencies,” in the Notes to Consolidated Financial Statements, we are periodically involved in various legal claims and proceedings. We routinely review the status of each significant matter and assess our potential financial exposure. If the potential loss from any matter is considered probable and the amount can be reasonably estimated, we record a liability for the estimated loss. Significant judgment is required to determine both the likelihood of there being, and the estimated amount of, a loss related to such matters. Due to inherent uncertainties related to these matters, we base our loss accruals on the best information available at the time. Until the final resolution of such matters, there may be an exposure to loss in excess of the amount recorded. As additional information becomes available, we reassess our potential liability and may revise our estimates. Such revisions could have a material impact on future quarterly or annual results of operations.
RECENTLY ISSUED ACCOUNTING STANDARDS
See Part II, Item 8, “Financial Statements and Supplementary Data,” Note 1, “Business and Summary of Significant Accounting Policies,” in the Notes to Consolidated Financial Statements for a full description of recent accounting pronouncements, including the expected dates of adoption and estimated effects on results of operations and financial condition.
OVERVIEW OF FISCAL 2024
•Total net revenue was $5.50 billion during fiscal 2024, an increase of 10% compared to the prior fiscal year.
•Recurring revenue as a percentage of net revenue was 98% for both fiscal years ending January 31, 2024 and 2023.
•Net revenue retention rate (“NR3”) was within the range of 100% and 110%, on a constant currency basis, as of both January 31, 2024 and 2023.
•Deferred revenue was $4.26 billion, a decrease of 7% compared to the prior fiscal year.
•Remaining performance obligations (short-term and long-term deferred revenue plus unbilled deferred revenue) (“RPO”) was $6.11 billion, an increase of 9% compared to the fourth quarter in the prior fiscal year.
•Current remaining performance obligations were $3.98 billion, an increase of 13% compared to the prior fiscal year.
Revenue Analysis
During fiscal 2024, net revenue increased 10%, as compared to the prior fiscal year, primarily due to a 10% increase in subscription revenue.
Further discussion of the drivers of these results are discussed below under the heading “Results of Operations.”
We rely significantly upon major distributors and resellers in both the United States and international regions, including TD Synnex Corporation and its global affiliates (collectively, “TD Synnex”) and Ingram Micro Inc. (“Ingram Micro”). Total revenue from TD Synnex accounted for 39%, 37%, and 36% of Autodesk’s total net revenue during fiscal 2024, 2023 and 2022, respectively. Ingram Micro accounted for 7%, 9%, and 9% of Autodesk's total net revenue during fiscal 2024, 2023 and
2022, respectively. Our customers through TD Synnex and Ingram Micro are the resellers and end users who purchase our software subscriptions and services. During fiscal 2023, we entered into transition agreements with certain of our distributors, including TD Synnex and Ingram Micro, to provide transition distribution activities for a one-to-two-year period, with potential extensions. In connection with the transition agreements, we intend to increase our selling efforts with value-added resellers and Solution Providers in connection with our new transaction model. Consequently, we believe our business is not substantially dependent on TD Synnex or Ingram Micro.
Recurring Revenue and Net Revenue Retention Rate
In order to help better understand our financial performance we use several key performance metrics, including recurring revenue and NR3. These metrics are key performance metrics and should be viewed independently of revenue and deferred revenue as these metrics are not intended to be combined with those items. We use these metrics to monitor the strength of our recurring business. We believe these metrics are useful to investors because they can help in monitoring the long-term health of our business. Our determination and presentation of these metrics may differ from that of other companies. The presentation of these metrics is meant to be considered in addition to, not as a substitute for or in isolation from, our financial measures prepared in accordance with GAAP. Please refer to the “Glossary of Terms” for the definitions of these metrics in Part I, Item 1, “Business”.
The following table outlines our recurring revenue metric for the fiscal years ended January 31, 2024, 2023, and 2022:
| | | | | | | | | | | | | | | | | | | | | | | | | | | | | | | | | | | | | | | | | |
| Fiscal Year Ended January 31, 2024 | | Change compared to
prior fiscal year end | | Fiscal Year Ended January 31, 2023 | | Change compared to
prior fiscal year end | | Fiscal Year Ended January 31, 2022 |
| | $ | | % | | | $ | | % | |
Recurring Revenue (in millions) (1) | $ | 5,377 | | | $ | 470 | | | 10 | % | | $ | 4,907 | | | $ | 612 | | | 14 | % | | $ | 4,295 | |
| As a percentage of net revenue | 98 | % | | N/A | | N/A | | 98 | % | | N/A | | N/A | | 98 | % |
| | | | | | | | | | | | | |
________________
(1) The acquisition of a business may cause variability in the comparison of recurring revenue in this table above and recurring revenue derived from the revenue reported in the Consolidated Statements of Operations.
NR3 was within the range of 100% and 110%, on a constant currency basis, as of both January 31, 2024 and 2023.
Foreign Currency Analysis
We generate a significant amount of our revenue in the United States, Japan, Germany, the United Kingdom, and Canada.
The following table shows the impact of foreign exchange rate changes on our net revenue and total spend: | | | | | | | | | | | | | | | | | |
| Fiscal Year Ended January 31, 2024 |
| Percent change compared to
prior fiscal year (as reported) | | Constant currency percent change compared to
prior fiscal year (1) | | Positive/negative/neutral impact from foreign exchange rate changes |
| Net revenue | 10 | % | | 13 | % | | Negative |
| Total spend | 9 | % | | 10 | % | | Positive |
________________
(1)Please refer to the “Glossary of Terms” in Part I, Item 1, “Business” for the definitions of our constant currency growth rates.
Changes in the value of the U.S. dollar may have a significant effect on net revenue, total spend, income from operations, and cash flow in future periods. We use foreign currency contracts to reduce the exchange rate effect on a portion of the net revenue of certain anticipated transactions but do not attempt to completely mitigate the impact of fluctuations of such foreign currency against the U.S. dollar.
Remaining Performance Obligations
RPO represents deferred revenue and contractually stated or committed orders under early renewal and multi-year billing plans for subscription, services, license, and maintenance for which the associated deferred revenue has not yet been
recognized. Unbilled deferred revenue is not included as a receivable or deferred revenue on our Consolidated Balance Sheets. See Part II, Item 8, Note 2, “Revenue Recognition” for more details on Autodesk's performance obligations.
| | | | | | | | | | | |
| (in millions) | January 31, 2024 | | January 31, 2023 |
| Deferred revenue | $ | 4,264 | | | $ | 4,580 | |
| Unbilled deferred revenue | 1,844 | | | 1,043 | |
RPO | $ | 6,108 | | | $ | 5,623 | |
RPO consisted of the following:
| | | | | | | | | | | | | | | | | |
| (in millions) | | | | | January 31, 2024 | | January 31, 2023 |
| Current RPO | | | | | | | $ | 3,976 | | | $ | 3,518 | |
| Non-current RPO | | | | | | | 2,132 | | | 2,105 | |
RPO | | | | | | | $ | 6,108 | | | $ | 5,623 | |
We expect that the amount of RPO will change from quarter to quarter for several reasons, including the specific timing, duration, and size of customer subscription and support agreements, the specific timing of customer renewals, and foreign currency fluctuations. Historically, we have had increased EBA sales activity in our fourth fiscal quarter and this seasonality may affect the relative value of our billings, RPO, and cash collections in the fourth and first fiscal quarters. As customers transition from multi-year subscription contracts billed upfront to annual billing installments, some customers may choose annual contracts instead. If this were to occur, we would expect it to proportionately reduce the unbilled portion of our total remaining performance obligations and would expect it to impact total RPO growth rates negatively. Deferred revenue, billings, current RPO, revenue, Non-GAAP operating margin, and free cash flow would remain broadly unchanged in this scenario.
Balance Sheet and Cash Flow Items
At January 31, 2024, we had $2.48 billion in cash, cash equivalents, and marketable securities. Our cash flow from operations decreased to $1.31 billion for the fiscal year ended January 31, 2024, from $2.07 billion for the fiscal year ended January 31, 2023. We repurchased 4 million shares of our common stock for $795 million during fiscal 2024. Comparatively, we repurchased 5 million shares of our common stock for $1.08 billion during fiscal 2023. Further discussion regarding the balance sheet and cash flow activities are discussed below under the heading “Liquidity and Capital Resources.”
RESULTS OF OPERATIONS
Overview
We believe our investment in cloud products and a subscription business model, backed by a strong balance sheet, give us a robust foundation to successfully navigate complex geopolitical and global macro-economic challenges. However, material scarcity, supply chain disruption and resulting inflationary pressures, higher interest rates, a global labor shortage, the war in Ukraine, and foreign exchange rate fluctuations, may impact our outlook. We also expect our transition to annual billings for multi-year contracts to impact the timing of our billings and cash collections. The extent of the impact of these risks on our business in the remainder of fiscal 2024 and beyond will depend on several factors, some of which are out of our control. Further discussion of the potential impacts of these risks on our business can be found in Part I, Item 1A, “Risk Factors.”
We introduced a new transaction model for our token-based Flex offering in North America, and certain countries in EMEA, and APAC, and for most of our subscription offerings in Australia during fiscal 2024. In this new transaction model, solution providers provide customers with a quote, however, the actual transaction occurs directly between Autodesk and the customer. Dependent upon successful implementation in Australia, we intend to transition our indirect business to the new transaction model in our major markets globally in fiscal 2025 and fiscal 2026.
Our sales incentives to Solution Providers will be recorded as operating expense under the new transaction model as we will contract directly with end customers. Accordingly, we expect sales incentives paid to resellers recorded as a reduction of transaction price and subsequently recognized as a reduction to subscription revenue over the contract period will decrease as we transition to the new transaction model. Most of the sales incentives payments to Solution Providers in our new transaction model, will be considered incremental and recoverable costs of obtaining a contract with a customer and will be capitalized and included in “Prepaid expenses and other current assets” and “Long-term other assets” on the Consolidated Balance Sheets. The deferred costs will then be amortized over the period of benefit and recorded to “Sales and Marketing” on the Consolidated Statement of Operations. The sales incentives not qualifying for capitalization will be recorded to “Sales and Marketing” on the Consolidated Statement of Operations as the costs are incurred under the incentive program requirements. We expect the change in accounting recognition of sales incentives to indirect channels from contra revenue to operating expenses under the new transaction model to positively impact calculated revenue growth, while being broadly neutral to calculated operating profit and free cash flow dollars, and to result in a calculated negative impact to operating margin.
Net Revenue by Income Statement Presentation
Subscription revenue consists of our term-based product subscriptions, cloud service offerings, and flexible EBAs. Revenue from these arrangements is predominately recognized ratably over the contract term commencing with the date our service is made available to customers and when all other revenue recognition criteria have been satisfied.
Maintenance revenue consists of renewal fees for existing maintenance plan agreements that were initially purchased with a perpetual software license. Under our maintenance plan, customers are eligible to receive unspecified upgrades, when and if available, and technical support. We recognize maintenance revenue ratably over the term of the agreements, which is generally one year.
Other revenue consists of revenue from consulting, training, and other products and services, and is recognized as the products are delivered and services are performed.
| | | | | | | | | | | | | | | | | | | | | | | | | | | | | |
| | Fiscal Year Ended January 31, 2024 | | Change compared to prior fiscal year | | Fiscal Year Ended January 31, 2023 | | Management Comments |
| (in millions, except percentages) | $ | | % | | |
| Net revenue: | | | | | | | | | |
| Subscription | $ | 5,116 | | | $ | 465 | | | 10 | % | | $ | 4,651 | | | Increase due to growth in the subscriber base across subscription types, led by subscription renewal revenue with current-year subscription renewals reflecting new subscriptions sold in prior periods. Also contributing to the growth was an increase in revenue from EBA offerings and Cloud Service Offerings. |
| Maintenance | 54 | | | (11) | | | (17) | % | | 65 | | | |
Total subscription and maintenance revenue | 5,170 | | | 454 | | | 10 | % | | 4,716 | | | |
| Other | 327 | | | 38 | | | 13 | % | | 289 | | | |
| $ | 5,497 | | | $ | 492 | | | 10 | % | | $ | 5,005 | | | |
| | | | | | | | | | |
| | | | | | | | | |
| | | | | | | | | | | | | | | | | | | | | | | | | | |
| | Fiscal Year Ended January 31, 2023 | | Change compared to prior fiscal year | Fiscal Year Ended January 31, 2022 | | Management Comments |
| (in millions, except percentages) | $ | | % | |
| Net revenue: | | | | | | | | |
| Subscription | $ | 4,651 | | | $ | 591 | | | 15 | % | $ | 4,060 | | | Increase due to growth in the subscriber base across subscription types, led by subscription renewal revenue with current-year subscription renewals reflecting new subscriptions sold in prior periods. Also contributing to the growth was an increase in revenue from new subscriptions and EBA offerings. |
| Maintenance | 65 | | | (11) | | | (14) | % | 76 | | | |
Total subscription and maintenance revenue | 4,716 | | | 580 | | | 14 | % | 4,136 | | | |
| Other | 289 | | | 39 | | | 16 | % | 250 | | | |
| $ | 5,005 | | | $ | 619 | | | 14 | % | $ | 4,386 | | | |
| | | | | | | | |
| | | | | | | | |
Net Revenue by Product Family
Our product offerings are focused in four primary product families: Architecture, Engineering and Construction (“AEC”), AutoCAD and AutoCAD LT, Manufacturing (“MFG”), and Media and Entertainment (“M&E”).
| | | | | | | | | | | | | | | | | | | | | | | | | | | | | |
| | Fiscal Year Ended January 31, 2024 | | Change compared to prior fiscal year | | Fiscal Year Ended January 31, 2023 | | Management Comments |
| |
| (in millions, except percentages) | $ | | % | |
Net revenue by product family: | | | | | | | | | |
| AEC | $ | 2,580 | | | $ | 302 | | | 13 | % | | $ | 2,278 | | | Increase due to growth in revenue from AEC Collections, EBAs, Autodesk Build, and Revit. |
| AutoCAD and AutoCAD LT | 1,462 | | | 75 | | | 5 | % | | 1,387 | | | Increase due to growth in revenue from both AutoCAD and AutoCAD LT. |
| MFG | 1,063 | | | 85 | | | 9 | % | | 978 | | | Increase due to growth in revenue from Product Design & MFG Collections, EBAs, Fusion, and Inventor. |
M&E | 295 | | | 4 | | | 1 | % | | 291 | | | Increase primarily due to growth in revenue from EBAs. |
Other | 97 | | | 26 | | | 37 | % | | 71 | | | |
| $ | 5,497 | | | $ | 492 | | | 10 | % | | $ | 5,005 | | | |
| | | | | | | | | | | | | | | | | | | | | | | | | | | | | |
| | Fiscal Year Ended January 31, 2023 | | Change compared to prior fiscal year | | Fiscal Year Ended January 31, 2022 | | Management Comments |
| | |
| (in millions, except percentages) | $ | | % | | |
Net revenue by product family: | | | | | | | | | |
| AEC | $ | 2,278 | | | $ | 309 | | | 16 | % | | $ | 1,969 | | | Increase due to growth in revenue from AEC Collections, EBAs, Revit, and Autodesk Build. |
| AutoCAD and AutoCAD LT | 1,387 | | | 143 | | | 11 | % | | 1,244 | | | Increase due to growth in revenue from both AutoCAD and AutoCAD LT. |
| MFG | 978 | | | 102 | | | 12 | % | | 876 | | | Increase due to growth in revenue from Product Design & MFG Collections, Fusion, Vault, and EBAs. |
M&E | 291 | | | 32 | | | 12 | % | | 259 | | | Increase due to growth in revenue from Maya, 3DS Max, and M&E Collections. |
Other | 71 | | | 33 | | | 87 | % | | 38 | | | |
| $ | 5,005 | | | $ | 619 | | | 14 | % | | $ | 4,386 | | | |
Net Revenue by Geographic Area
| | | | | | | | | | | | | | | | | | | | | | | | | | | | | | | | | | | | | | | | | | | | | | | | | | | | | |
| | Fiscal Year Ended January 31, 2024 | | Change compared to prior fiscal year | | Constant currency change compared to prior fiscal year | | Fiscal Year Ended January 31, 2023 | | Change compared to prior fiscal year | | Constant currency change compared to prior fiscal year | | Fiscal Year Ended January 31, 2022 |
|
| (in millions, except percentages) | | $ | | % | % | | $ | | % | % | |
| |
Net revenue: | | | | | | | | | | | | | | | | | |
Americas | | | | | | | | | | | | | | | | | |
U.S. | $ | 1,978 | | | $ | 258 | | | 15 | % | | * | | $ | 1,720 | | | $ | 263 | | | 18 | % | | * | | $ | 1,457 | |
Other Americas | 460 | | | 88 | | | 24 | % | | * | | 372 | | | 64 | | | 21 | % | | * | | 308 | |
| Total Americas | 2,438 | | | 346 | | | 17 | % | | 17 | % | | 2,092 | | | 327 | | | 19 | % | | 18 | % | | 1,765 | |
| EMEA | 2,042 | | | 136 | | | 7 | % | | 12 | % | | 1,906 | | | 206 | | | 12 | % | | 13 | % | | 1,700 | |
| APAC | 1,017 | | | 10 | | | 1 | % | | 6 | % | | 1,007 | | | 86 | | | 9 | % | | 13 | % | | 921 | |
| Total net revenue | $ | 5,497 | | | $ | 492 | | | 10 | % | | 13 | % | | $ | 5,005 | | | $ | 619 | | | 14 | % | | 15 | % | | $ | 4,386 | |
____________________
* Constant currency data not provided at this level.
We believe that international revenue will continue to comprise a majority of our net revenue. Unfavorable economic conditions, including in connection with the significant military action against Ukraine launched by Russia (and any related political or economic responses and counter-responses or otherwise by various global actors or the general effect on the global economy), in the countries that contribute a significant portion of our net revenue, including in emerging economies such as Brazil, India, and China, has had and may continue to have an adverse effect on our business in those countries and our overall financial performance. Changes in the value of the U.S. dollar relative to other currencies have significantly affected, and could continue to significantly affect, our financial results for a given period even though we hedge a portion of our current and projected revenue. Increases to the levels of political and economic unpredictability or protectionism in the global market may impact our future financial results.
Net Revenue by Sales Channel
| | | | | | | | | | | | | | | | | | | | | | | | | | | | | | | | |
| | Fiscal Year Ended January 31, 2024 | | Change compared to prior fiscal year | | Fiscal Year Ended January 31, 2023 | | | | | | | |
| (in millions, except percentages) | $ | | % | | | | | | | |
| Net revenue by sales channel: | | | | | | | | | | | | | | | | |
| Indirect | $ | 3,444 | | | $ | 194 | | | 6 | % | | $ | 3,250 | | | | | | | | | | |
| Direct | 2,053 | | | 298 | | | 17 | % | | 1,755 | | | | | | | | | | |
| Total net revenue | $ | 5,497 | | | $ | 492 | | | 10 | % | | $ | 5,005 | | | | | | | | | | |
| | | | | | | | | | | | | | | | |
| | | | | | | | | | | | | | | | | | | | | | | | | | | | | | | | |
| | Fiscal Year Ended January 31, 2023 | | Change compared to prior fiscal year | | Fiscal Year Ended January 31, 2022 | | | | | | | |
| (in millions, except percentages) | $ | | % | | | | | | | |
Net revenue by sales channel: | | | | | | | | | | | | | | | | |
Indirect | $ | 3,250 | | | $ | 401 | | | 14 | % | | $ | 2,849 | | | | | | | | | | |
| Direct | 1,755 | | | 218 | | | 14 | % | | 1,537 | | | | | | | | | | |
| Total net revenue | $ | 5,005 | | | $ | 619 | | | 14 | % | | $ | 4,386 | | | | | | | | | | |
| | | | | | | | | | | | | | | | |
We anticipate that our revenue by direct sales channel will continue to increase as a percentage of total net revenue. With the continued growth of our online Autodesk branded store and the introduction of our new transaction model, we will be decreasing our sales through value-added resellers and distributors and transacting directly with more end customers. We expect our indirect channel will continue to transact and support a considerable portion of our customers, particularly in emerging regions. See further discussion regarding our new transaction model in the Overview to Results of Operations above.
Net Revenue by Product Type
| | | | | | | | | | | | | | | | | | | | | | | | | | | | | | | | | |
| Fiscal Year Ended January 31, 2024 | | Change compared to
prior fiscal year | | | | | | Fiscal Year Ended January 31, 2023 | | |
| (In millions, except percentages) | | $ | | % | | | | | | | Management Comments |
| Net Revenue by Product Type: | | | | | | | | | | | | | |
| Design | $ | 4,647 | | | $ | 383 | | | 9 | % | | | | | | $ | 4,264 | | | Increase primarily due to growth in AEC collections, EBA offerings, and AutoCAD Family. |
| Make | 523 | | | 71 | | | 16 | % | | | | | | 452 | | | Increase primarily due to growth in revenue from Autodesk Construction Cloud and Fusion. |
| Other | 327 | | | 38 | | | 13 | % | | | | | | 289 | | | |
| Total Net Revenue | $ | 5,497 | | | $ | 492 | | | 10 | % | | | | | | $ | 5,005 | | | |
| | | | | | | | | | | | | |
| Fiscal Year Ended January 31, 2023 | | Change compared to
prior fiscal year | | | | | | Fiscal Year Ended January 31, 2022 | | |
| (In millions, except percentages) | | $ | | % | | | | | | | Management Comments |
| Net Revenue by Product Type: | | | | | | | | | | | | | |
| Design | $ | 4,264 | | | $ | 492 | | | 13 | % | | | | | | $ | 3,772 | | | Increase due to growth in AEC & MFG collections, EBA offerings, AutoCAD LT and AutoCAD Family. |
| Make | 452 | | | 88 | | | 24 | % | | | | | | 364 | | | Increase primarily due to growth in revenue from Autodesk Construction Cloud and Fusion. |
| Other | 289 | | | 39 | | | 16 | % | | | | | | 250 | | | |
| Total Net Revenue | $ | 5,005 | | | $ | 619 | | | 14 | % | | | | | | $ | 4,386 | | | |
| | | | | | | | | | | | | |
Cost of Revenue and Operating Expenses
Cost of subscription and maintenance revenue includes the labor costs of providing product support to our subscription and maintenance customers, SaaS vendor costs and allocated IT costs, facilities costs, professional services fees related to operating our network and cloud infrastructure, royalties, depreciation expense and operating lease payments associated with computer equipment, data center costs, related expenses of network operations, stock-based compensation expense, and gains and losses on our operating expense cash flow hedges.
Cost of other revenue includes labor costs associated with product setup, costs of consulting and training services contracts, and collaborative project management services contracts. Cost of other revenue also includes stock-based compensation expense, overhead charges, allocated IT and facilities costs, professional services fees, and gains and losses on our operating expense cash flow hedges.
Cost of revenue, at least over the near term, is affected by labor costs, hosting costs for our cloud offerings, the volume and mix of product sales, fluctuations in consulting costs, amortization of developed technology, new customer support offerings, royalty rates for licensed technology embedded in our products, stock-based compensation expense, and gains and losses on our operating expense cash flow hedges.
Marketing and sales expenses include salaries, bonuses, benefits, and stock-based compensation expense for our marketing and sales employees, the expense of travel, entertainment, and training for such personnel, sales and dealer commissions, and the costs of programs aimed at increasing revenue, such as advertising, trade shows and expositions, and various sales and promotional programs. Marketing and sales expenses also include SaaS vendor costs and allocated IT costs, payment processing fees, the cost of supplies and equipment, gains and losses on our operating expense cash flow hedges, facilities costs, and labor costs associated with sales and order management.
Research and development expenses, which are expensed as incurred, consist primarily of salaries, bonuses, benefits, and stock-based compensation expense for research and development employees, the expense of travel, entertainment, and training for such personnel, professional services such as fees paid to software development firms and independent contractors, SaaS vendor costs and allocated IT costs, gains and losses on our operating expense cash flow hedges, and facilities costs.
General and administrative expenses include salaries, bonuses, benefits, and stock-based compensation expense for our CEO, finance, human resources, and legal employees, as well as professional fees for legal and accounting services, SaaS vendor costs and net IT costs, certain foreign business taxes, gains and losses on our operating expense cash flow hedges, expense of travel, entertainment, and training, facilities costs, acquisition-related costs, and the cost of supplies and equipment.
| | | | | | | | | | | | | | | | | | | | | | | | | | | | | |
| Fiscal Year Ended January 31, 2024 | | Change compared to prior fiscal year | | Fiscal Year Ended January 31, 2023 | | Management Comments |
| |
| (In millions, except percentages) | $ | | % |
| Cost of revenue: | | | | | | | | | |
Subscription and maintenance | $ | 381 | | | $ | 38 | | | 11 | % | | $ | 343 | | | Increase primarily due to employee-related costs, including stock-based compensation expense, driven by higher headcount and merit increases, as well as an increase in cloud hosting costs and professional fees. |
Other | 82 | | | 3 | | | 4 | % | | 79 | | | Increase primarily due to employee-related costs, including stock-based compensation expense, driven by higher headcount and merit increases. |
| Amortization of developed technologies | 48 | | | (10) | | | (17) | % | | 58 | | | The decrease is primarily due to previously acquired assets that continue to become fully amortized offset by amortization of acquired developed technologies as a result of acquisitions in fiscal 2024. |
| Total cost of revenue | $ | 511 | | | $ | 31 | | | 6 | % | | $ | 480 | | | |
| | | | | | | | | |
| Operating expenses: | | | | | | | | | |
Marketing and sales | $ | 1,823 | | | $ | 78 | | | 4 | % | | $ | 1,745 | | | Increase primarily due to employee-related costs driven by merit and benefit increases and an increase in cloud hosting costs partially offset by higher capitalized software costs. |
Research and development | 1,373 | | | 154 | | | 13 | % | | 1,219 | | | Increase primarily due to employee-related costs, including stock-based compensation, driven by higher headcount and merit increases, as well as an increase in cloud hosting costs partially offset by lower professional fees. |
General and administrative | 620 | | | 88 | | | 17 | % | | 532 | | | Increase primarily due to an increase in employee-related costs, including stock-based compensation expense, driven by higher headcount and merit increases, as well as an increase in cloud hosting costs and lower capitalized software costs. |
Amortization of purchased intangibles | 42 | | | 2 | | | 5 | % | | 40 | | | The increase is primarily due to amortization of acquired intangibles as a result of acquisitions in fiscal 2024 offset by previously acquired assets that continue to become fully amortized. |
| Total operating expenses | $ | 3,858 | | | $ | 322 | | | 9 | % | | $ | 3,536 | | | |
| | | | | | | | | |
| | | | | | | | | | | | | | | | | | | | | | | | | | | | | |
| Fiscal Year Ended January 31, 2023 | | Change compared to prior fiscal year | | Fiscal Year Ended January 31, 2022 | | Management comments |
| |
| (In millions, except percentages) | $ | | % |
| Cost of revenue: | | | | | | | | | |
Subscription and maintenance | $ | 343 | | | $ | 44 | | | 15 | % | | $ | 299 | | | Increase primarily due to cloud hosting costs, employee-related costs, including stock-based compensation expense, driven by higher headcount, and increase in travel and entertainment expense. |
Other | 79 | | | 12 | | | 18 | % | | 67 | | | Increase due to employee-related costs, including stock-based compensation expense, driven by higher headcount. |
| Amortization of developed technologies | 58 | | | 6 | | | 12 | % | | 52 | | | Increase due to growth in amortization expense from acquired developed technologies as a result of our acquisitions in the fourth quarter of fiscal 2022 and in fiscal 2023. |
| Total cost of revenue | $ | 480 | | | $ | 62 | | | 15 | % | | $ | 418 | | | |
| | | | | | | | | |
| Operating expenses: | | | | | | | | | |
Marketing and sales | $ | 1,745 | | | $ | 122 | | | 8 | % | | $ | 1,623 | | | Increase primarily due to employee-related costs, including stock-based compensation expense, driven by higher headcount, an increase in travel and entertainment expense, sales commission expense, and advertisement and promotion costs. |
Research and development | 1,219 | | | 104 | | | 9 | % | | 1,115 | | | Increase primarily due to employee-related costs, including stock-based compensation expense, driven by higher headcount, and increase in travel and entertainment expense, as well as an increase in cloud hosting costs, professional fees and lower capitalized software costs. |
General and administrative | 532 | | | (40) | | | (7) | % | | 572 | | | Decrease primarily due to lease-related asset impairment and other charges and acquisition-related costs partially offset by an increase in employee related costs, including stock-based compensation expense, driven by higher headcount, cloud hosting costs and lower capitalized software costs. |
Amortization of purchased intangibles | 40 | | | — | | | — | % | | 40 | | | |
| Total operating expenses | $ | 3,536 | | | $ | 186 | | | 6 | % | | $ | 3,350 | | | |
The following table highlights our expectation for the absolute dollar change and percent of revenue change for fiscal 2025 as compared to fiscal 2024:
| | | | | | | | | | | |
| Absolute dollar impact | | Percent of net revenue impact |
| Cost of revenue | Increase | | Flat |
| Marketing and sales | Increase | | Flat |
| Research and development | Increase | | Flat |
| General and administrative | Decrease | | Flat |
| Amortization of purchased intangibles | Decrease | | Flat |
| | | |
Interest and Other Expense, Net
The following table sets forth the components of interest and other expense, net:
| | | | | | | | | | | | | | | | | |
| | Fiscal year ended January 31, |
| | 2024 | | 2023 | | 2022 |
| | (in millions) |
| Interest and investment income (expense), net | $ | 26 | | | $ | (71) | | | $ | (65) | |
| Gain on foreign currency | 10 | | | 15 | | | 1 | |
| (Loss) gain on strategic investments | (32) | | | 1 | | | 3 | |
| Other income | 4 | | | 12 | | | 8 | |
| Interest and other income (expense), net | $ | 8 | | | $ | (43) | | | $ | (53) | |
Interest and other income (expense), net, positively changed by $51 million during fiscal 2024, as compared to fiscal 2023. The positive change in interest and other income(expense), net, was primarily due to an increase in interest income due to higher interest rates in the current period as compared to the prior period and gains in the current year for investments in debt and equity securities that are held in a rabbi trust under non-qualified deferred compensation plans compared to losses in the prior period. The increase in interest and other income (expense), net, was partially offset by an increase in losses on strategic investment equity securities in the current period compared to the prior period.
Interest and other expense, net, decreased by $10 million during fiscal 2023, as compared to fiscal 2022. The decrease was primarily due to an increase in gains on foreign currency in the current period compared to the prior fiscal year due to foreign currency exchange rate fluctuations and an increase in interest income, partially offset by an increase in interest expense as a result of the issuance of debt in fiscal year 2022 and losses in the current period as compared to gains in the prior year for investments in debt and equity securities that are held in a rabbi trust under non-qualified deferred compensation plans.
Interest expense and investment income fluctuates based on average cash, marketable securities, debt balances, average maturities, and interest rates.
Gains and losses on foreign currency are primarily due to the impact of re-measuring foreign currency transactions and net monetary assets into the functional currency of the corresponding entity. The amount of the gain or loss on foreign currency is driven by the volume of foreign currency transactions and the foreign currency exchange rates for the year.
Provision for Income Taxes
We account for income taxes and the related accounts under the liability method. Deferred tax liabilities and assets are determined based on the difference between the financial statement and tax bases of assets and liabilities, using enacted rates expected to be in effect during the year in which the basis differences reverse. Furthermore, on January 22, 2018, the FASB released guidance on the accounting for tax on the global intangible low-taxed income (“GILTI”) provisions of the Tax Act. The GILTI provisions impose a tax on foreign income in excess of a deemed return on tangible assets of foreign corporations. The Company has elected to recognize any potential GILTI obligations as an expense in the period it is incurred.
Income tax expense was $230 million and $123 million for fiscal 2024 and 2023, relative to pre-tax income of $1,136 million and $946 million, respectively, for the same periods. The tax expense for fiscal 2024 consists primarily of the U.S. and foreign tax expense, including withholding tax, an increase in tax expense relating to stock-based compensation, reduced by non-recurring integration net tax benefit and an income tax benefit arising from temporary relief provided by the Internal Revenue Service relating to U.S. foreign tax credit regulations. Tax expense for fiscal 2023 consisted primarily of the U.S. and foreign tax expense, including withholding tax, an increase in tax expense relating to stock-based compensation, final U.S. foreign tax credit regulations enacted in fiscal 2023, offset by the benefit from the Canada valuation allowance release and a U.S. foreign derived intangible income benefit driven by capitalization of research and development expenditures starting in fiscal 2023 as required by the Tax Act.
A valuation allowance is recorded to reduce deferred tax assets when management cannot conclude that it is more likely than not that the net deferred tax asset will be recovered. The valuation allowance is determined by assessing both positive and negative evidence to determine whether it is more likely than not that deferred tax assets are recoverable; such assessment is required on a jurisdiction-by-jurisdiction basis. Significant judgment is required in determining whether the valuation allowance
should be recorded against deferred tax assets. In assessing the need for a valuation allowance, we consider all available evidence including past operating results and estimates of future taxable income.
We released our Canada valuation allowance in fiscal 2023 due to positive evidence supporting the utilization of the R&D credits before they expire, resulting in a $38 million non-cash benefit to earnings.
Due to a cross-border merger effected in fiscal year 2024 resulting in the elimination of our deferred tax assets, we no longer require a valuation allowance in Netherlands.
We continue to retain a valuation allowance against California and Michigan deferred tax assets, as well as deferred tax assets that will convert into a capital loss upon reversal as we do not have sufficient income of the appropriate character to benefit these deferred tax assets. Also, the Company continues to retain a valuation allowance against foreign deferred tax assets in Portugal and New Zealand and capital losses in Australia. We have established a valuation allowance in Massachusetts in fiscal 2024 as it is more likely than not that we would not realize the deferred tax assets in this jurisdiction.
As we continually strive to optimize our overall business model, tax planning strategies may become feasible whereby management may determine, based on all available evidence, both positive and negative, that it is more likely than not that the Portugal, New Zealand, California, Massachusetts, Michigan, Australia capital loss and U.S. capital loss deferred tax assets will be realized.
As of January 31, 2024, we had $261 million of gross unrecognized tax benefits, of which $43 million would reduce our valuation allowance, if recognized. The remaining $218 million would impact the effective tax rate. The amount of unrecognized tax benefits will decrease in the next twelve months for statute lapse is nil.
Our future effective annual tax rate may be materially impacted by the amount of benefits and charges from tax amounts associated with our foreign earnings that are taxed at rates different from the federal statutory rate, changes in valuation allowances, level of profit before tax, accounting for uncertain tax positions, business combinations, closure of statute of limitations or settlement of tax audits, and changes in tax laws. A significant amount of our earnings are generated by our European and Asia Pacific subsidiaries. Our future effective tax rates may be adversely affected to the extent earnings are lower than anticipated in countries where we have lower statutory tax rates.
Signed into law on August 16, 2022, the Inflation Reduction Act contains many revisions to the Internal Revenue Code effective in taxable years beginning after December 31, 2022, including a 15% corporate alternative minimum tax. We continue to monitor the impact the Inflation Reduction Act on our consolidated financial statements.
OTHER FINANCIAL INFORMATION
In addition to our results determined under U.S. generally accepted accounting principles (“GAAP”) discussed above, we believe the following non-GAAP measures are useful to investors in evaluating our operating performance. For the fiscal years ended January 31, 2024, 2023, and 2022, our gross profit, income from operations, operating margin, net income, and diluted net income per share on a GAAP and non-GAAP basis were as follows (in millions except for operating margin and per share data):
| | | | | | | | | | | | | | | | | |
| Fiscal Year Ended January 31, |
| 2024 | | 2023 | | 2022 |
| (Unaudited) |
| Gross profit | $ | 4,986 | | | $ | 4,525 | | | $ | 3,968 | |
| Non-GAAP gross profit | $ | 5,080 | | | $ | 4,624 | | | $ | 4,054 | |
| Income from operations | $ | 1,128 | | | $ | 989 | | | $ | 618 | |
| Non-GAAP income from operations | $ | 1,962 | | | $ | 1,785 | | | $ | 1,397 | |
| Operating margin | 21 | % | | 20 | % | | 14 | % |
| Non-GAAP operating margin | 36 | % | | 36 | % | | 32 | % |
| Net income | $ | 906 | | | $ | 823 | | | $ | 497 | |
| Non-GAAP net income | $ | 1,642 | | | $ | 1,445 | | | $ | 1,126 | |
| Diluted net income per share | $ | 4.19 | | | $ | 3.78 | | | $ | 2.24 | |
| Non-GAAP diluted net income per share | $ | 7.60 | | | $ | 6.63 | | | $ | 5.07 | |
For our internal budgeting and resource allocation process and as a means to provide consistency in period-to-period comparisons, we use non-GAAP measures to supplement our consolidated financial statements presented on a GAAP basis. These non-GAAP measures do not include certain items that may have a material impact upon our reported financial results. We also use non-GAAP measures in making operating decisions because we believe those measures provide meaningful supplemental information regarding our earning potential and performance for management by excluding certain benefits, credits, expenses, and charges that may not be indicative of our core business operating results. For the reasons set forth below, we believe these non-GAAP financial measures are useful to investors both because (1) they allow for greater transparency with respect to key metrics used by management in its financial and operational decision-making and (2) they are used by our institutional investors and the analyst community to analyze the health of our business. This allows investors and others to better understand and evaluate our operating results and future prospects in the same manner as management, compare financial results across accounting periods and to those of peer companies, and to better understand the long-term performance of our core business. We also use some of these measures for purposes of determining company-wide incentive compensation.
There are limitations in using non-GAAP financial measures because non-GAAP financial measures are not prepared in accordance with GAAP and may be different from non-GAAP financial measures used by other companies. The non-GAAP financial measures included above are limited in value because they exclude certain items that may have a material impact upon our reported financial results. In addition, they are subject to inherent limitations as they reflect the exercise of judgments by management about which charges are excluded from the non-GAAP financial measures. We compensate for these limitations by analyzing current and future results on a GAAP basis as well as a non-GAAP basis and also by providing GAAP measures in our public disclosures. The presentation of non-GAAP financial information is meant to be considered in addition to, not as a substitute for or in isolation from, the directly comparable financial measures prepared in accordance with GAAP. We urge investors to review the reconciliation of our non-GAAP financial measures to the comparable GAAP financial measures included below, and not to rely on any single financial measure to evaluate our business.
RECONCILIATION OF GAAP FINANCIAL MEASURES TO NON-GAAP FINANCIAL MEASURES
(In millions except for operating margin, and per share data):
| | | | | | | | | | | | | | | | | |
| | Fiscal Year Ended January 31, |
| | 2024 | | 2023 | | 2022 |
| (Unaudited) |
| Gross profit | $ | 4,986 | | | $ | 4,525 | | | $ | 3,968 | |
| Stock-based compensation expense | 51 | | | 46 | | | 35 | |
| Amortization of developed technologies | 43 | | | 53 | | | 50 | |
| Acquisition-related costs | — | | | — | | | 1 | |
| Non-GAAP gross profit | $ | 5,080 | | | $ | 4,624 | | | $ | 4,054 | |
| | | | | |
| Income from operations | $ | 1,128 | | | $ | 989 | | | $ | 618 | |
| Stock-based compensation expense | 703 | | | 660 | | | 559 | |
| Amortization of developed technologies | 43 | | | 53 | | | 50 | |
| Amortization of purchased intangibles | 41 | | | 40 | | | 40 | |
| Acquisition-related costs | 33 | | | 10 | | | 26 | |
Lease-related asset impairments and other charges | 14 | | | 33 | | | 104 | |
| Non-GAAP income from operations | $ | 1,962 | | | $ | 1,785 | | | $ | 1,397 | |
| | | | | |
| Operating margin | 21 | % | | 20 | % | | 14 | % |
| Stock-based compensation expense | 13 | % | | 13 | % | | 13 | % |
| Amortization of developed technologies | 1 | % | | 1 | % | | 1 | % |
| Amortization of purchased intangibles | 1 | % | | 1 | % | | 1 | % |
| Acquisition-related costs | 1 | % | | — | % | | 1 | % |
Lease-related asset impairments and other charges | — | % | | 1 | % | | 2 | % |
| Non-GAAP operating margin (1) | 36 | % | | 36 | % | | 32 | % |
| | | | | |
| Net income | $ | 906 | | | $ | 823 | | | $ | 497 | |
| Stock-based compensation expense | 703 | | | 660 | | | 559 | |
| Amortization of developed technologies | 43 | | | 53 | | | 50 | |
| Amortization of purchased intangibles | 41 | | | 40 | | | 40 | |
| Acquisition-related costs | 33 | | | 10 | | | 26 | |
Lease-related asset impairments and other charges | 14 | | | 33 | | | 104 | |
| Loss (gain) on strategic investments and dispositions, net | 32 | | | (1) | | | (3) | |
| Establishment (release) of valuation allowance on deferred tax assets | 16 | | | (38) | | | — | |
| Discrete GAAP tax items | (34) | | | 28 | | | (72) | |
| Income tax effect of non-GAAP adjustments | (112) | | | (163) | | | (75) | |
| Non-GAAP net income | $ | 1,642 | | | $ | 1,445 | | | $ | 1,126 | |
| | | | | |
| Diluted net income per share | $ | 4.19 | | | $ | 3.78 | | | $ | 2.24 | |
| Stock-based compensation expense | 3.26 | | | 3.03 | | | 2.52 | |
| Amortization of developed technologies | 0.20 | | | 0.24 | | | 0.22 | |
| | | | | | | | | | | | | | | | | |
| | Fiscal Year Ended January 31, |
| | 2024 | | 2023 | | 2022 |
| (Unaudited) |
| Amortization of purchased intangibles | 0.19 | | | 0.18 | | | 0.18 | |
| | | | | |
| Acquisition-related costs | 0.15 | | | 0.05 | | | 0.11 | |
Lease-related asset impairments and other charges | 0.06 | | | 0.15 | | | 0.47 | |
| Loss (gain) on strategic investments and dispositions, net | 0.15 | | | — | | | (0.01) | |
| Establishment (release) of valuation allowance on deferred tax assets | 0.07 | | | (0.18) | | | — | |
| Discrete GAAP tax items | (0.15) | | | 0.13 | | | (0.32) | |
| Income tax effect of non-GAAP adjustments | (0.52) | | | (0.75) | | | (0.34) | |
| Non-GAAP diluted net income per share | $ | 7.60 | | | $ | 6.63 | | | $ | 5.07 | |
| | | | | |
| Net cash provided by operating activities | $ | 1,313 | | | $ | 2,071 | | | $ | 1,531 | |
| Capital expenditures | (31) | | | (40) | | | (56) | |
| Free cash flow | $ | 1,282 | | | $ | 2,031 | | | $ | 1,475 | |
_______________
(1)Totals may not sum due to rounding.
Our non-GAAP financial measures may exclude the following:
Stock-based compensation expenses. We exclude stock-based compensation expenses from non-GAAP measures primarily because they are non-cash expenses and management finds it useful to exclude certain non-cash charges to assess the appropriate level of various operating expenses to assist in budgeting, planning, and forecasting future periods. Moreover, because of varying available valuation methodologies, subjective assumptions, and the variety of award types that companies can use under FASB ASC Topic 718, we believe excluding stock-based compensation expenses allows investors to make meaningful comparisons between our recurring core business operating results and those of other companies.
Amortization of developed technologies and purchased intangibles. We incur amortization of acquisition-related developed technologies and purchased intangibles in connection with acquisitions of certain businesses and technologies. Amortization of developed technologies and purchased intangibles is inconsistent in amount and frequency and is significantly affected by both the timing and size of our acquisitions. Management finds it useful to exclude these variable charges from our cost of revenues to assist in budgeting, planning, and forecasting future periods. Investors should note that the use of intangible assets contributed to our revenues earned during the periods presented and will contribute to our future period revenues as well. Amortization of developed technologies and purchased intangible assets will recur in future periods.
CEO transition costs. We exclude amounts paid to the Company’s former CEOs upon departure under the terms of their transition agreements, including severance payments, acceleration of restricted stock units, and continued vesting of performance stock units, and legal fees incurred with the transition. Also excluded from our non-GAAP measures are recruiting costs related to the search for a new CEO. These costs represent non-recurring expenses and are not indicative of our ongoing operating expenses. We further believe that excluding the CEO transition costs from our non-GAAP results is useful to investors in that it allows for period-over-period comparability.
Goodwill impairment. This is a non-cash charge to write down goodwill to fair value when there is an indication that the asset has been impaired. As explained above, management finds it useful to exclude certain non-cash charges to assess the appropriate level of various operating expenses to assist in budgeting, planning, and forecasting future periods.
Restructuring and other exit costs, net. These expenses are associated with realigning our business strategies based on current economic conditions. In connection with these restructuring actions or other exit actions, we recognize costs related to termination benefits for former employees whose positions were eliminated, the closure of facilities, and cancellation of certain contracts. We exclude these charges because these expenses are not reflective of ongoing business and operating results. We believe it is useful for investors to understand the effects of these items on our total operating expenses.
Lease-related asset impairments and other charges. These charges are associated with the optimization of our facilities costs related to leases for facilities that we have vacated as a result of our one-time move to a more hybrid remote workforce. In
connection with these facility leases, we recognize costs related to the impairment or abandonment of operating lease right-of-use assets, computer equipment, furniture, and leasehold improvements, and other costs. We exclude these charges because these expenses are not reflective of ongoing business and operating results. We believe it is useful for investors to understand the effects of these items on our total operating expenses.
Acquisition-related costs. We exclude certain acquisition-related costs, including due diligence costs, professional fees in connection with an acquisition, certain financing costs, and certain integration-related expenses. These expenses are unpredictable, and depend on factors that may be outside of our control and unrelated to the continuing operations of the acquired business or our Company. In addition, the size and complexity of an acquisition, which often drives the magnitude of acquisition-related costs, may not be indicative of such future costs. We believe excluding acquisition-related costs facilitates the comparison of our financial results to the Company's historical operating results and to other companies in our industry.
Loss (gain) on strategic investments and dispositions. We exclude gains and losses related to our strategic investments and dispositions of strategic investments, purchased intangibles, and businesses from our non-GAAP measures primarily because management finds it useful to exclude these variable gains and losses on these investments and dispositions in assessing our financial results. Included in these amounts are non-cash unrealized gains and losses, dividends received, realized gains and losses on the sales or losses on the impairment of these investments, and gain and loss on dispositions. We believe excluding these items is useful to investors because they do not correlate to the underlying performance of our business and these losses or gains were incurred in connection with strategic investments and dispositions which do not occur regularly.
Discrete tax provision items. We exclude the GAAP tax provision, including discrete items, from the non-GAAP measure of net income (loss), and include a non-GAAP tax provision based upon the projected annual non-GAAP effective tax rate. Discrete tax items include income tax expenses or benefits that do not relate to ordinary income from continuing operations in the current fiscal year, unusual or infrequently occurring items, or the tax impact of certain stock-based compensation. Examples of discrete tax items include, but are not limited to, certain changes in judgment and changes in estimates of tax matters related to prior fiscal years, certain costs related to business combinations, certain changes in the realizability of deferred tax assets, or changes in tax law. Management believes this approach assists investors in understanding the tax provision and the effective tax rate related to ongoing operations. We believe the exclusion of these discrete tax items provides investors with useful supplemental information about our operational performance.
Establishment (release) of a valuation allowance on certain net deferred tax assets. This is a non-cash charge to record or to release a valuation allowance on certain deferred tax assets. As explained above, management finds it useful to exclude certain non-cash charges to assess the appropriate level of various cash expenses to assist in budgeting, planning, and forecasting future periods.
Income tax effects on the difference between GAAP and non-GAAP costs and expenses. The income tax effects that are excluded from the non-GAAP measures relate to the tax impact on the difference between GAAP and non-GAAP expenses, primarily due to stock-based compensation, amortization of purchased intangibles, and restructuring charges and other exit costs (benefits) for GAAP and non-GAAP measures.
LIQUIDITY AND CAPITAL RESOURCES
Our primary source of cash is from the sale of our software and related services. Our primary use of cash is payment of our operating costs, which consist primarily of employee-related expenses, such as compensation and benefits, as well as general operating expenses for marketing, facilities, and overhead costs. Long-term cash requirements for items other than normal operating expenses are anticipated for the following: the acquisition of businesses, software products, or technologies complementary to our business; repayment of debt; common stock repurchases; and capital expenditures, including the purchase and implementation of internal-use software applications.
At January 31, 2024, our principal sources of liquidity were cash, cash equivalents, and marketable securities totaling $2.48 billion and net accounts receivable of $876 million. In connection with the closing of the Payapps and PIX acquisitions in February 2024 and March 2024, we used approximately $387 million and $266 million, net of cash acquired, in readily available cash, respectively. In connection with the acquisition of a provider of a cloud-based artificial intelligence pipeline for creating computer-generated 3D characters into live-action scenes in May 2024, we used approximately $131 million, net of cash acquired, in readily available cash. See Part II, Item 8, Note 17, “Subsequent Events,” in the Notes to Consolidated Financial Statements for further discussion.
In November 2022, Autodesk entered into an amended and restated credit agreement (“Credit Agreement”) by and among Autodesk, the lenders party thereto, and Citibank, N.A., as agent, that provides for a revolving credit facility in the aggregate principal amount of $1.5 billion with an option to be increased up to $2.0 billion. The revolving credit facility is available for working capital or other business needs. The maturity date on the Credit Agreement is September 30, 2026. At January 31, 2024, Autodesk had no outstanding borrowings under the Credit Agreement. Additionally, as of June 10, 2024, we have no amounts outstanding under the Credit Agreement. See Part II, Item 8, Note 8, “Borrowing Arrangements,” in the Notes to Consolidated Financial Statements for further discussion on our covenant requirements. If we are unable to remain in compliance with the covenants under the Credit Agreement, we may not be able to draw on our revolving credit facility.
As of January 31, 2024, we had $2.30 billion aggregate principal amount of notes outstanding. See Part II, Item 8, Note 8, “Borrowing Arrangements,” in the Notes to Consolidated Financial Statements for further discussion.
Our cash and cash equivalents are held by diversified financial institutions globally. Our primary commercial banking relationship is with Citigroup and its global affiliates. In addition, Citibank N.A., an affiliate of Citigroup, is one of the lead lenders and agent in the syndicate of our $1.5 billion revolving credit facility.
Our cash, cash equivalents, and marketable securities balances are concentrated in a few locations around the world, with substantial amounts held outside of the United States. As of January 31, 2024, approximately 68% of our total cash or cash equivalents and marketable securities are located in foreign jurisdictions and that percentage will fluctuate subject to business needs. There are several factors that can impact our ability to utilize foreign cash balances, such as foreign exchange restrictions, foreign regulatory restrictions, or adverse tax costs. Earnings in foreign jurisdictions are generally available for distribution to the United States with little to no incremental U.S. taxes. We regularly review our capital structure and consider a variety of potential financing alternatives and planning strategies to ensure we have the proper liquidity available in the locations in which it is needed. We expect to meet our liquidity needs through or in combination of current cash balances, ongoing cash flows, and external borrowings.
Cash from operations could also be affected by various risks and uncertainties, including, but not limited to the risks detailed in Part I, Item 1A,“Risk Factors.” Based on our current business plan and revenue prospects, we believe that our existing cash and cash equivalents, our anticipated cash flows from operations, and our available revolving credit facility will be sufficient to meet our working capital and operating resource expenditure requirements for at least the next 12 months from the date of this Annual Report.
Our revenue, earnings, cash flows, receivables, and payables are subject to fluctuations due to changes in foreign currency exchange rates, for which we have put in place foreign currency contracts as part of our risk management strategy. See Part II, Item 7A, “Quantitative and Qualitative Disclosures about Market Risk” for further discussion.
| | | | | | | | | | | | | | | | | |
| Fiscal year ended January 31, |
| (in millions) | 2024 | | 2023 | | 2022 |
| Net cash provided by operating activities | $ | 1,313 | | | $ | 2,071 | | | $ | 1,531 | |
| Net cash used in investing activities | (502) | | | (143) | | | (1,595) | |
| Net cash used in financing activities | (852) | | | (1,487) | | | (169) | |
Net cash provided by operating activities of $1,313 million for fiscal 2024, primarily consisted of $906 million of our net income adjusted for $718 million non-cash items such as stock-based compensation expense, depreciation, amortization, and accretion expense, and deferred income tax. The decrease in cash provided by working capital was primarily due to a decrease in deferred revenue of $316 million driven by the transition of multi-year subscription contracts billed upfront to annual billing installments.
Net cash provided by operating activities of $2,071 million for fiscal 2023, primarily consisted of $823 million of our net income adjusted for $556 million non-cash items such as stock-based compensation expense, depreciation, amortization, and accretion expense, lease-related asset impairment charges, and deferred income tax. The increase in cash provided by working capital was primarily due to a net increase in deferred revenue of $798 million driven by an increase in product subscriptions and EBA offerings offset in part by a change in accounts receivable of $247 million due to the seasonality of our billings in the fourth fiscal quarter and timing of cash collections from customers.
Net cash used in investing activities was $502 million for fiscal 2024 and was primarily due to purchases of marketable securities partially offset by sales and maturities of marketable securities.
Net cash used in investing activities was $143 million for fiscal 2023 and was primarily due to purchases of marketable securities and business combinations, net of cash acquired, partially offset by sales and maturities of marketable securities.
Net cash used in financing activities was $852 million in fiscal 2024 and was primarily due to repurchases of our common stock.
Net cash used in financing activities was $1,487 million in fiscal 2023 and was primarily due to repurchases of our common stock and repayment of debt.
CONTRACTUAL OBLIGATIONS
The following table summarizes our significant financial contractual obligations at January 31, 2024, and the effect such obligations are expected to have on our liquidity and cash flows in future periods.
| | | | | | | | | | | | | | | | | | | | | | | | | | | | | | | | |
| (in millions) | Total | | Fiscal year 2025 | | Fiscal years 2026-2027 | | Fiscal years 2028-2029 | | Thereafter | Management Comments |
| Notes payable | $ | 2,651 | | | $ | 69 | | | $ | 416 | | | $ | 583 | | | $ | 1,583 | | Notes payable consist of the notes issued in June 2015, June 2017, January 2020, and October 2021 including interest. See Part II, Item 8, Note 8, “Borrowing Arrangements,” in the Notes to Consolidated Financial Statements for further discussion. |
| Operating leases | 373 | | | 76 | | | 132 | | | 88 | | | 77 | | Operating lease obligations consist primarily of obligations for real estate, vehicles, and certain equipment. See Part II, Item 8, Note 9, “Leases,” in the Notes to Consolidated Financial Statements for further discussion. |
| Purchase obligations | 844 | | | 215 | | | 340 | | | 278 | | | 11 | | Purchase obligations are contractual obligations for purchase of goods or services and are defined as agreements that are enforceable and legally binding to Autodesk and that specify all significant terms, including: fixed or minimum quantities to be purchased; fixed, minimum, or variable price provisions; and the approximate timing of the transaction. Purchase obligations relate primarily to acquisition of cloud services, marketing and commitments related to our investment agreements with limited liability partnership funds. |
| Deferred compensation obligations | 100 | | | 10 | | | 18 | | | 18 | | | 54 | | Deferred compensation obligations relate to amounts held in a rabbi trust under our non-qualified deferred compensation plan. See Part II, Item 8, Note 7, “Deferred Compensation,” in our Notes to Consolidated Financial Statements for further information regarding this plan. |
| Pension obligations | 44 | | | 4 | | | 8 | | | 8 | | | 24 | | Pension obligations relate to our obligations for pension plans outside of the United States. See Part II, Item 8, Note 16, “Retirement Benefit Plans,” in our Notes to Consolidated Financial Statements for further information regarding these obligations. |
| Asset retirement obligations | 9 | | | 1 | | | 4 | | | 1 | | | 3 | | Asset retirement obligations represent the estimated costs to bring certain office buildings that we lease back to their original condition after the termination of the lease. |
| Total (1) | $ | 4,021 | | | $ | 375 | | | $ | 918 | | | $ | 976 | | | $ | 1,752 | | |
____________________
(1)This table generally excludes amounts already recorded on the balance sheet as current liabilities, certain purchase obligations as discussed below, long term deferred revenue, and amounts related to income tax accruals for uncertain tax positions, since we cannot predict with reasonable reliability the timing of cash settlements to the respective taxing authorities (see Part II, Item 8, Note 5, “Income Taxes” in the Notes to Consolidated Financial Statements).
Purchase orders or contracts for the purchase of supplies and other goods and services are not included in the table above. We are not able to determine the aggregate amount of such purchase orders that represent contractual obligations, as purchase orders may represent authorizations to purchase rather than binding agreements. Our purchase orders are based on our current
procurement or development needs and are fulfilled by our vendors within short time horizons. We do not have significant agreements for the purchase of supplies or other goods specifying minimum quantities or set prices that exceed our expected requirements for three months. In addition, we have certain software royalty commitments associated with the shipment and licensing of certain products.
The expected timing of payment of the obligations discussed above is estimated based on current information. Timing of payments and actual amounts paid may be different depending on the time of receipt of goods or services or changes to agreed-upon amounts for some obligations.
We provide indemnifications of varying scopes and certain guarantees, including limited product warranties. Historically, costs related to these warranties and indemnifications have not been significant, but because potential future costs are highly variable, we are unable to estimate the maximum potential impact of these guarantees on our future results of operations.
ISSUER PURCHASES OF EQUITY SECURITIES
Autodesk’s stock repurchase program provides Autodesk with the ability to offset the dilution from the issuance of stock under our employee stock plans and reduce shares outstanding over time and has the effect of returning excess cash generated from our business to stockholders. Under the share repurchase program, Autodesk may repurchase shares from time to time in open market transactions, privately negotiated transactions, accelerated share repurchase programs, tender offers, or by other means. The share repurchase program does not have an expiration date and the pace and timing of repurchases will depend on factors such as cash generation from operations, available surplus, the volume of employee stock plan activity, remaining shares available in the authorized pool, cash requirements for acquisitions, economic and market conditions, stock price, and legal and regulatory requirements.
During the three and 12 months ended January 31, 2024, we repurchased 289 thousand and 4 million shares of our common stock, respectively. At January 31, 2024, $4.74 billion remained available for repurchase under the November 2022 repurchase program approved by the Board of Directors. The plan does not have a fixed expiration date. See Part II, Item 8, Note 12, “Stock Repurchase Program,” in the Notes to Consolidated Financial Statements for further discussion.
ITEM 7A. QUANTITATIVE AND QUALITATIVE DISCLOSURES ABOUT MARKET RISK
FOREIGN CURRENCY EXCHANGE RISK
Our revenue, earnings, cash flows, receivables, and payables are subject to fluctuations due to changes in foreign currency exchange rates. Our risk management strategy utilizes foreign currency contracts to manage our exposure to foreign currency volatility that exists as part of our ongoing business operations. We utilize cash flow hedge contracts to reduce the exchange rate impact on a portion of the net revenue or operating expense of certain anticipated transactions. In addition, we use balance sheet hedge contracts to reduce the exchange rate risk associated primarily with foreign currency denominated receivables and payables. As of January 31, 2024 and 2023, we had open cash flow and balance sheet hedge contracts with future settlements generally within one to 12 months. Contracts were primarily denominated in Euros, British pounds, Japanese yen, Canadian dollars, Australian dollars, Norwegian krone, Singapore dollars, Indian rupees, and Swiss francs. We do not enter into foreign exchange derivative instruments for trading or speculative purposes.
Our option and foreign exchange forward contracts outstanding as of the respective period-ends are summarized in U.S. dollar equivalents as follows (in millions):
| | | | | | | | | | | | | | | | | | | | | | | |
| January 31, 2024 | | January 31, 2023 |
| Notional Amount | | Fair Value | | Notional Amount | | Fair Value |
| Forward Contracts: | | | | | | | |
| Purchased | $ | 1,430 | | | $ | (5) | | | $ | 711 | | | $ | 13 | |
| Sold | 1,789 | | | 11 | | | 1,755 | | | (11) | |
| Option Contracts: | | | | | | | |
| Purchased | 1,048 | | | 8 | | | 904 | | | 5 | |
| Sold | 1,118 | | | (8) | | | 974 | | | (23) | |
We use foreign currency contracts to reduce the exchange rate impact on the net revenue and operating expenses of certain anticipated transactions. A sensitivity analysis performed on our hedging portfolio as of January 31, 2024, indicated that a hypothetical 10% appreciation of the U.S. dollar from its value at January 31, 2024 and 2023, would increase the fair value of our foreign currency contracts by $121 million and $149 million, respectively. A hypothetical 10% depreciation of the dollar from its value at January 31, 2024 and 2023, would decrease the fair value of our foreign currency contracts by $99 million and $191 million, respectively.
INTEREST RATE RISK
Interest rate movements affect both the interest income we earn on our short-term investments and the market value of certain longer term securities. At January 31, 2024, we had $1.71 billion of cash equivalents and marketable securities, including $354 million classified as short-term marketable securities and $234 million classified as long-term marketable securities. If interest rates were to move up by 50 or 100 basis points over a 12-month period, the market value change of these securities would not have a material impact on our results of operations.
OTHER MARKET RISK
From time to time we make direct investments in privately held companies. Privately held company investments generally are considered inherently risky. The technologies and products these companies have under development are typically in the early stages and may never materialize, which could result in a loss of all or a substantial part of our initial investment in these companies. The evaluation of privately held companies is based on information that we request from these companies, which is not subject to the same disclosure regulations as U.S. publicly traded companies, and as such, the basis for these evaluations is subject to the timing and accuracy of the data received from these companies. See Part II, Item 8, Note 3, “Financial Instruments” in the Notes to Consolidated Financial Statements for further discussion regarding these strategic investments.
For information about exposure to counter-party credit-related losses, see Part II, Item 8, Note 1, “Business and Summary of Significant Accounting Policies - Concentration of Credit Risk."
ITEM 8.FINANCIAL STATEMENTS AND SUPPLEMENTARY DATA
AUTODESK, INC.
CONSOLIDATED STATEMENTS OF OPERATIONS
(In millions, except per share data)
| | | | | | | | | | | | | | | | | |
| | Fiscal year ended January 31, |
| 2024 | | 2023 | | 2022 |
|
| Net revenue: | | | | | |
| Subscription | $ | 5,116 | | | $ | 4,651 | | | $ | 4,060 | |
| Maintenance | 54 | | | 65 | | | 76 | |
| Total subscription and maintenance revenue | 5,170 | | | 4,716 | | | 4,136 | |
| Other | 327 | | | 289 | | | 250 | |
| Total net revenue | 5,497 | | | 5,005 | | | 4,386 | |
| Cost of revenue: | | | | | |
| Cost of subscription and maintenance revenue | 381 | | | 343 | | | 299 | |
| Cost of other revenue | 82 | | | 79 | | | 67 | |
| Amortization of developed technologies | 48 | | | 58 | | | 52 | |
| Total cost of revenue | 511 | | | 480 | | | 418 | |
| Gross profit | 4,986 | | | 4,525 | | | 3,968 | |
| Operating expenses: | | | | | |
| Marketing and sales | 1,823 | | | 1,745 | | | 1,623 | |
| Research and development | 1,373 | | | 1,219 | | | 1,115 | |
| General and administrative | 620 | | | 532 | | | 572 | |
| Amortization of purchased intangibles | 42 | | | 40 | | | 40 | |
| | | | | |
| | | | | |
| Total operating expenses | 3,858 | | | 3,536 | | | 3,350 | |
| Income from operations | 1,128 | | | 989 | | | 618 | |
| Interest and other income (expense), net | 8 | | | (43) | | | (53) | |
| Income before income taxes | 1,136 | | | 946 | | | 565 | |
| Provision for income taxes | (230) | | | (123) | | | (68) | |
| Net income | $ | 906 | | | $ | 823 | | | $ | 497 | |
| Basic net income per share | $ | 4.23 | | | $ | 3.81 | | | $ | 2.26 | |
| Diluted net income per share | $ | 4.19 | | | $ | 3.78 | | | $ | 2.24 | |
| Weighted average shares used in computing basic net income per share | 214 | | | 216 | | | 220 | |
| Weighted average shares used in computing diluted net income per share | 216 | | | 218 | | | 222 | |
See accompanying Notes to Consolidated Financial Statements.
AUTODESK, INC.
CONSOLIDATED STATEMENTS OF COMPREHENSIVE INCOME
(In millions)
| | | | | | | | | | | | | | | | | |
| Fiscal year ended January 31, |
| 2024 | | 2023 | | 2022 |
| |
| Net income | $ | 906 | | | $ | 823 | | | $ | 497 | |
| Other comprehensive (loss) income, net of reclassifications: | | | | | |
Net (loss) gain on derivative instruments (net of tax effect of $6, $(7), and $(8)) | (41) | | | 40 | | | 48 | |
Change in net unrealized gain on available-for-sale securities (net of tax effect of zero for all periods presented) | 2 | | | — | | | 12 | |
Change in defined benefit pension items (net of tax effect of $1, $1, and $(1)) | (5) | | | (3) | | | 5 | |
Net change in cumulative foreign currency translation loss (net of tax effect of $4, zero, and zero) | (5) | | | (98) | | | (63) | |
| Total other comprehensive (loss) income | (49) | | | (61) | | | 2 | |
| Total comprehensive income | $ | 857 | | | $ | 762 | | | $ | 499 | |
See accompanying Notes to Consolidated Financial Statements.
AUTODESK, INC.
CONSOLIDATED BALANCE SHEETS
(In millions, except per share data)
| | | | | | | | | | | |
| January 31,
2024 | | January 31,
2023 |
| ASSETS | | | |
| Current assets: | | | |
| Cash and cash equivalents | $ | 1,892 | | | $ | 1,947 | |
| Marketable securities | 354 | | | 125 | |
| Accounts receivable, net | 876 | | | 961 | |
| | | |
| Prepaid expenses and other current assets | 457 | | | 308 | |
| Total current assets | 3,579 | | | 3,341 | |
| Long-term marketable securities | 234 | | | 102 | |
| Computer equipment, software, furniture, and leasehold improvements, net | 121 | | | 144 | |
| Operating lease right-of-use assets | 224 | | | 245 | |
| Intangible assets, net | 406 | | | 407 | |
| Goodwill | 3,653 | | | 3,625 | |
| Deferred income taxes, net | 1,093 | | | 1,014 | |
| Long-term other assets | 602 | | | 560 | |
| Total assets | $ | 9,912 | | | $ | 9,438 | |
| LIABILITIES AND STOCKHOLDERS’ EQUITY | | | |
| Current liabilities: | | | |
| Accounts payable | $ | 100 | | | $ | 102 | |
| Accrued compensation | 476 | | | 358 | |
| Accrued income taxes | 36 | | | 33 | |
| Deferred revenue | 3,500 | | | 3,203 | |
| | | |
| Operating lease liabilities | 67 | | 85 | |
| | | |
| Other accrued liabilities | 172 | | | 219 | |
| Total current liabilities | 4,351 | | | 4,000 | |
| Long-term deferred revenue | 764 | | | 1,377 | |
| Long-term operating lease liabilities | 275 | | | 300 | |
| Long-term income taxes payable | 168 | | | 164 | |
| Long-term deferred income taxes | 25 | | | 32 | |
| Long-term notes payable, net | 2,284 | | | 2,281 | |
| Long-term other liabilities | 190 | | | 139 | |
| Commitments and contingencies | | | |
| Stockholders’ equity: | | | |
Preferred stock, $0.01 par value; shares authorized 2; none issued or outstanding at January 31, 2024 and 2023 | — | | | — | |
Common stock and additional paid-in capital, $0.01 par value; shares authorized 750; 214 and 215 issued and outstanding at January 31, 2024 and 2023, respectively | 3,802 | | | 3,325 | |
| Accumulated other comprehensive loss | (234) | | | (185) | |
| Accumulated deficit | (1,713) | | | (1,995) | |
| Total stockholders’ equity | 1,855 | | | 1,145 | |
| Total liabilities and stockholders' equity | $ | 9,912 | | | $ | 9,438 | |
See accompanying Notes to Consolidated Financial Statements.
AUTODESK, INC.
CONSOLIDATED STATEMENTS OF CASH FLOWS
(In millions) | | | | | | | | | | | | | | | | | |
| | Fiscal year ended January 31, |
| | 2024 | | 2023 | | 2022 |
| |
| Operating activities: | | | | | |
| Net income | $ | 906 | | | $ | 823 | | | $ | 497 | |
| Adjustments to reconcile net income to net cash provided by operating activities: | | | | | |
| Depreciation, amortization, and accretion | 139 | | | 150 | | | 148 | |
| Stock-based compensation expense | 703 | | | 657 | | | 555 | |
| Deferred income taxes | (86) | | | (277) | | | (8) | |
| | | | | |
| | | | | |
| Lease-related asset impairments | 14 | | | 34 | | | 104 | |
| | | | | |
| Other operating activities | (52) | | | (8) | | | 18 | |
| Changes in operating assets and liabilities, net of business combinations: | | | | | |
| Accounts receivable | 86 | | | (247) | | | (66) | |
| Prepaid expenses and other assets | (77) | | | (3) | | | (134) | |
| Accounts payable and other liabilities | (12) | | | (5) | | | 10 | |
| Deferred revenue | (316) | | | 798 | | | 419 | |
| Accrued income taxes | 8 | | | 149 | | | (12) | |
| Net cash provided by operating activities | 1,313 | | | 2,071 | | | 1,531 | |
| Investing activities: | | | | | |
| Purchases of marketable securities | (1,110) | | | (397) | | | (311) | |
| Sales of marketable securities | 277 | | | 152 | | | 12 | |
| Maturities of marketable securities | 487 | | | 298 | | | 26 | |
| Purchases of intangible assets | (30) | | | (6) | | | (11) | |
| Business combinations, net of cash acquired | (70) | | | (96) | | | (1,250) | |
| Capital expenditures | (31) | | | (40) | | | (56) | |
| Other investing activities | (25) | | | (54) | | | (5) | |
| Net cash used in investing activities | (502) | | | (143) | | | (1,595) | |
| Financing activities: | | | | | |
| Proceeds from issuance of common stock, net of issuance costs | 130 | | | 124 | | | 114 | |
| Taxes paid related to net share settlement of equity awards | (187) | | | (160) | | | (194) | |
| Repurchase and retirement of common stock | (795) | | | (1,101) | | | (1,079) | |
| | | | | |
| Proceeds from debt, net of discount | — | | | — | | | 997 | |
| Repayments of debt | — | | | (350) | | | — | |
| | | | | |
| Other financing activities | — | | | — | | | (7) | |
| Net cash used in financing activities | (852) | | | (1,487) | | | (169) | |
| Effect of exchange rate changes on cash and cash equivalents | (14) | | | (22) | | | (11) | |
| Net (decrease) increase in cash and cash equivalents | (55) | | | 419 | | | (244) | |
| Cash and cash equivalents at beginning of fiscal year | 1,947 | | | 1,528 | | | 1,772 | |
| Cash and cash equivalents at end of fiscal year | $ | 1,892 | | | $ | 1,947 | | | $ | 1,528 | |
| Supplemental cash flow disclosure: | | | | | |
| Cash paid for interest | $ | 69 | | | $ | 86 | | | $ | 58 | |
| Cash paid for income taxes, net of tax refunds | $ | 321 | | | $ | 241 | | | $ | 165 | |
Non-cash investing and financing activities: | | | | | |
| Fair value of common stock issued to settle liability-classified restricted stock units | $ | 15 | | | $ | 11 | | | $ | 3 | |
| | | | | |
| Fair value of common stock issued related to business combination (See Note 6) | $ | — | | | $ | 10 | | | $ | 6 | |
See accompanying Notes to Consolidated Financial Statements.
AUTODESK, INC.
CONSOLIDATED STATEMENTS OF STOCKHOLDERS’ EQUITY
(In millions)
| | | | | | | | | | | | | | | | | | | | | | | | | | | | | |
| | Common stock and additional paid-in capital | | Accumulated other comprehensive loss | | Accumulated deficit | | Total stockholders' equity |
| Shares | | Amount | |
| Balances, January 31, 2021 | 220 | | | $ | 2,579 | | | $ | (126) | | | $ | (1,488) | | | $ | 965 | |
| Common shares issued under stock plans | 2 | | | (78) | | | — | | | — | | | (78) | |
| Stock-based compensation expense | — | | | 544 | | | — | | | — | | | 544 | |
| Settlement of liability-classified restricted common shares | — | | | 3 | | | — | | | — | | | 3 | |
| | | | | | | | | |
| Net income | — | | | — | | | — | | | 497 | | | 497 | |
| Other comprehensive income | — | | | — | | | 2 | | | — | | | 2 | |
| Shares issued as consideration for business combination | — | | | 6 | | | — | | | — | | | 6 | |
| Repurchase and retirement of common shares | (4) | | | (131) | | | — | | | (959) | | | (1,090) | |
| Balances, January 31, 2022 | 218 | | | 2,923 | | | (124) | | | (1,950) | | | 849 | |
| Common shares issued under stock plans | 2 | | | (38) | | | — | | | — | | | (38) | |
| Stock-based compensation expense | — | | | 633 | | | — | | | — | | | 633 | |
| Settlement of liability-classified restricted common shares | — | | | 11 | | | — | | | — | | | 11 | |
| | | | | | | | | |
| Net income | — | | | — | | | — | | | 823 | | | 823 | |
| Other comprehensive loss | — | | | — | | | (61) | | | — | | | (61) | |
| Shares issued related to business combination | — | | | 10 | | | — | | | — | | | 10 | |
| Repurchase and retirement of common shares | (5) | | | (214) | | | — | | | (868) | | | (1,082) | |
| Balances, January 31, 2023 | 215 | | | 3,325 | | | (185) | | | (1,995) | | | 1,145 | |
| Common shares issued under stock plans | 3 | | | (60) | | | — | | | — | | | (60) | |
| Stock-based compensation expense | — | | | 693 | | | — | | | — | | | 693 | |
| Settlement of liability-classified restricted common shares | — | | | 15 | | | — | | | — | | | 15 | |
| | | | | | | | | |
| Net income | — | | | — | | | — | | | 906 | | | 906 | |
| Other comprehensive loss | — | | | — | | | (49) | | | — | | | (49) | |
| | | | | | | | | |
| Repurchase and retirement of common shares | (4) | | | (171) | | | — | | | (624) | | | (795) | |
| Balances, January 31, 2024 | 214 | | | $ | 3,802 | | | $ | (234) | | | $ | (1,713) | | | $ | 1,855 | |
See accompanying Notes to Consolidated Financial Statements.
AUTODESK, INC.
NOTES TO CONSOLIDATED FINANCIAL STATEMENTS
January 31, 2024
(Tables in millions of dollars, except per share data, unless otherwise indicated)
1. Business and Summary of Significant Accounting Policies
Business
Autodesk, Inc. (“Autodesk” or the “Company”) is a global leader in 3D design, engineering and entertainment technology solutions, spanning architecture, engineering, construction, product design, manufacturing, media, and entertainment. The Company’s sophisticated software products, offered through a hybrid of desktop and cloud functionality, enable its customers to design, fabricate, manufacture, and build anything by visualizing, simulating, and analyzing real-world performance early in the design process. These capabilities allow our customers to foster innovation, optimize their designs, streamline their manufacturing and construction processes, save time and money, improve quality, deliver more sustainable outcomes, communicate plans, and collaborate with others. Autodesk software products are sold globally through a combination of indirect and direct channels.
Principles of Consolidation
The accompanying consolidated financial statements include the accounts of Autodesk and its wholly owned subsidiaries. All intercompany accounts and transactions have been eliminated.
Use of Estimates
The preparation of financial statements in conformity with U.S. generally accepted accounting principles (“GAAP”) requires management to make estimates and assumptions that affect the amounts reported in Autodesk’s consolidated financial statements and notes thereto. These estimates are based on information available as of the date of the consolidated financial statements. On a regular basis, management evaluates these estimates and assumptions. Actual results may differ materially from these estimates.
Examples of significant estimates and assumptions made by management involve revenue recognition for product subscriptions and enterprise business arrangements (“EBAs”), the determination of the fair value of acquired assets and liabilities, goodwill, financial instruments including strategic investments, long-lived assets, and intangible assets, the realizability of deferred tax assets, and the fair value of stock awards. The Company also makes assumptions, judgments, and estimates in determining the accruals for uncertain tax positions, variable compensation, partner incentive programs, product returns reserves, allowances for credit losses, asset retirement obligations, legal contingencies, and operating lease liabilities.
Segments
Autodesk operates in one operating segment, and accordingly all required financial segment information is included in the consolidated financial statements. Operating segments are defined as components of an enterprise for which separate financial information is evaluated regularly by the chief operating decision maker (“CODM”) in deciding how to allocate resources and assess performance. Autodesk reports segment information based on the “management” approach. The management approach designates the internal reporting used by management for making decisions, allocating resources, and assessing performance as the source of the Company’s reportable segments. The Company's CODM allocates resources and assesses the operating performance of the Company as a whole.
Information regarding Autodesk's long-lived assets by geographic area were as follows:
| | | | | | | | | | | |
| | January 31, |
| | 2024 | | 2023 |
| Long-lived assets (1): | | | |
| Americas | | | |
| U.S. | $ | 221 | | | $ | 256 | |
| Other Americas | 15 | | | 13 | |
| Total Americas | 236 | | | 269 | |
| Europe, Middle East, and Africa | 63 | | | 72 | |
| Asia Pacific | 46 | | | 48 | |
| Total long-lived assets | $ | 345 | | | $ | 389 | |
____________________
(1)Long-lived assets exclude deferred tax assets, marketable securities, goodwill, and intangible assets.
Revenue Recognition
Autodesk’s revenue is divided into three categories: subscription revenue, maintenance revenue, and other revenue. Subscription revenue consists of our term-based product subscriptions, cloud service offerings, and flexible enterprise business agreements (“EBAs”). Maintenance revenue consists of renewal fees for existing maintenance plan agreements that were initially purchased with a perpetual software license. Under our maintenance plan, customers are eligible to receive unspecified upgrades, when and if available, and technical support. Other revenue consists of revenue from consulting and other products and services. Revenue is recognized when control for these offerings is transferred to our customers, in an amount that reflects the consideration we expect to be entitled to in exchange for products and services.
Autodesk’s contracts with customers may include promises to transfer multiple products and services to a customer. Determining whether the products and services are considered distinct performance obligations that should be accounted for separately or as a single performance obligation may require significant judgment. Judgment is required to determine the level of integration and interdependency between individual components of desktop software applications and cloud functionalities. This determination influences whether the desktop software is considered distinct and accounted for separately as a license performance obligation recognized at the time of delivery, or not distinct and accounted for together with the cloud functionalities as a single subscription performance obligation recognized over time.
For product subscriptions and flexible EBA subscriptions in which the desktop software and related cloud functionalities are highly interrelated, the single performance obligation is recognized ratably over the contract term as the subscription is delivered. For subscriptions involving distinct desktop software licenses, the license performance obligation is satisfied when delivered to our customers. For standalone maintenance subscriptions and cloud subscriptions, the performance obligation is satisfied ratably over the contract term as those services are delivered. For consulting services, the performance obligation is satisfied over a period of time as those services are delivered.
When an arrangement includes multiple performance obligations which are concurrently delivered and have the same pattern of transfer to the customer (the services transfer to the customer over the contract period), we account for those performance obligations as a single performance obligation.
For contracts with more than one performance obligation, the transaction price is allocated among the performance obligations in an amount that depicts the relative standalone selling price (“SSP”) of each obligation. We establish SSP for most of our products and services based on observable prices when sold separately in similar circumstances to similar customers. In instances where SSP is not directly observable, such as when we do not sell the product or service separately, we determine the SSP using information that includes market conditions and other observable inputs. We typically have more than one SSP for individual products and services due to the stratification of those products and services by customer and circumstance. In these instances, we use relevant information such as the product type or sales channel to determine the SSP.
Our indirect channel model includes both a two-tiered distribution structure, where Autodesk sells to distributors that subsequently sell to resellers, and a one-tiered structure where Autodesk sells directly to resellers. For these arrangements, transfer of control begins at the time access to our subscriptions is made available electronically to our customer, provided all other criteria for revenue recognition are met. Judgment is required to determine whether our distributors and resellers have the ability to honor their commitment to pay, regardless of whether they collect payment from their customers. If we were to change this assessment, it could cause a material increase or decrease in the amount of revenue that we report in a particular period.
Costs to Obtain a Contract with a Customer
Sales commissions earned by our internal sales personnel and our solution providers are considered incremental and recoverable costs of obtaining a contract with a customer. The commission costs are capitalized and included in “Prepaid expenses and other current assets” and “Long-term other assets” on our Consolidated Balance Sheets. The deferred costs are then amortized over the period of benefit. Autodesk determined that sales commissions earned by internal sales personnel that are related to contract renewals are commensurate with sales commissions earned on the initial contracts, and we determined the period of benefit to be the term of the respective customer contract. Commissions paid to our solution providers that are related to contract renewals may either be commensurate or non-commensurate with commissions earned on the initial contract, depending on the commissions program. Costs for initial contracts that are non-commensurate with commissions on renewal contracts are amortized on a straight-line basis over the period of benefit. For non-commensurate commissions, we determined the estimated period of benefit by taking into consideration customer retention data, customer contracts, our technology, and other factors. Deferred costs are periodically reviewed for impairment. Amortization expense is included in marketing and sales expenses in the Consolidated Statements of Operations.
Fair Value Measurement
Fair value is defined as the price that would be received from the sale of an asset or paid to transfer a liability in the principal or most advantageous market for the asset or liability in an orderly transaction between market participants on the measurement date. In determining the fair value of our investments, we are sometimes required to use various alternative valuation techniques. Inputs to valuation techniques are either observable or unobservable. Observable inputs reflect market data obtained from independent sources, while unobservable inputs reflect our market assumptions. These two types of inputs have created the following fair value hierarchy:
Level 1 - Quoted prices for identical instruments in active markets;
Level 2 - Quoted prices for similar instruments in active markets, quoted prices for identical or similar instruments in markets that are not active, and model-derived valuations in which all significant inputs and significant value drivers are observable in active markets; and
Level 3 - Unobservable inputs for which there is little or no market data, which require Autodesk to develop its own assumptions.
This hierarchy requires us to minimize the use of unobservable inputs and to use observable market data, if available, when determining fair value. This is generally true for our cash and cash equivalents and the majority of our marketable securities, which we consider to be Level 1 and Level 2 assets.
Key inputs for currency derivatives are spot rates, forward rates, interest rates, volatility, and credit default rates. The spot rate for each currency is the same spot rate used for all balance sheet translations at the measurement date. Autodesk reviews for any potential changes on a quarterly basis, in conjunction with our fiscal quarter-end close. It is Autodesk’s assessment that the leveling best reflects current market activity when observing the pricing information for these assets. Autodesk’s Level 2
securities and derivatives are valued primarily using observable inputs other than quoted prices in active markets for identical assets and liabilities. The Company has elected to use the income approach to value derivatives using the observable Level 2 market expectations at measurement date and standard valuation techniques to convert future amounts to a single present amount (discounted). Mid-market pricing is used as a practical expedient and when required, rates are interpolated from commonly quoted intervals published by market sources. See Note 3, “Financial Instruments” for more information.
Cash and Cash Equivalents
Autodesk considers all highly liquid investments with insignificant interest rate risk and remaining maturities of three months or less at the date of purchase to be cash equivalents. Cash equivalents are stated at estimated fair value.
Marketable Securities and Strategic Investments
Autodesk classifies its marketable securities as either short-term or long-term generally based on each instrument’s underlying contractual maturity date. Generally, marketable securities with remaining maturities of less than 12 months are classified as short-term and marketable securities with remaining maturities greater than 12 months are classified as long-term. Autodesk may sell certain of its marketable securities prior to their stated maturities for strategic purposes or in anticipation of credit deterioration.
Marketable securities are stated at fair value. Marketable securities maturing within one year that are not restricted are classified as current assets.
Autodesk determines the appropriate classification of its marketable securities at the time of purchase and re-evaluates such classification as of each balance sheet date. Autodesk carries all “available-for-sale securities” at fair value, with unrealized gains and losses, net of tax, reported in stockholders’ equity until disposition or maturity. Autodesk carries all “trading securities” at fair value, with unrealized gains and losses, recorded in “Interest and other expense, net” in the Company’s Consolidated Statements of Operations. The cost of securities sold is based on the specific-identification method.
The company's strategic investments consist of privately held debt and equity securities.
Under the measurement alternative method, strategic investments in equity securities are measured at cost, less any impairments, plus or minus changes resulting from observable price changes in orderly transactions for the identical or similar investment of the same issuer in the current period. The carrying value is not adjusted for the Company’s strategic investments in equity securities if there are no observable price changes in a same or similar security from the same issuer or if there are no identified events or changes in circumstances that may indicate impairment, as discussed below. To determine if a transaction is deemed a similar investment, Autodesk considers the rights and obligations between the investments and the extent to which those differences would affect the fair values of those investments with additional consideration for the stage of development of the investee company. The fair value would then be adjusted positively or negatively based on available information such as pricing in recent rounds of financing.
The company’s strategic investments in debt and equity securities (Level 3) are valued using significant unobservable inputs or data in an inactive market and the valuation requires the Company’s judgment due to the absence of market prices and inherent lack of liquidity. These assumptions are inherently subjective and involve significant management judgment. Whenever possible, we use observable market data and rely on unobservable inputs only when observable market data is not available, when determining fair value.
In determining the estimated fair value of its strategic investments, the Company utilizes the most recent data available to the Company. In addition, the determination of whether an orderly transaction is for a same or similar investment requires significant management judgment including: the rights and obligations of the investments, the extent to which those differences would affect the fair values of those investments, and the impact of any differences based on the stage of operational development of the investee.
All of Autodesk’s marketable securities and strategic investments are subject to a periodic impairment review. Strategic investments in equity securities are assessed based on available information such as current cash positions, earnings, earnings and cash flow forecasts, recent operational performance and any other readily available market data. For any available-for-sale debt securities, if Autodesk does not intend to sell and it is not more likely than not that Autodesk will be required to sell the available-for-sale debt security prior to recovery of its amortized cost basis, Autodesk will determine whether a decline in fair
value below the amortized cost basis is due to credit-related factors. The credit loss is measured as the amount by which the debt security’s amortized cost basis exceeds the estimate of the present value of cash flows expected to be collected, up to the difference between the amortized cost basis and the fair value. Impairment will be assessed at the individual security level. Credit-related impairment is recognized as an allowance on the Consolidated Balance Sheets with a corresponding adjustment to “Interest and other expense, net” on the Company’s Consolidated Statements of Operations. Any impairment that is not credit-related is recognized in “Accumulated other comprehensive loss” on the Consolidated Balance Sheets.
Autodesk does not measure an allowance for credit losses on accrued interest receivables on available-for-sale debt securities separately. Autodesk writes off accrued interest receivables by reversing interest income in the period deemed uncollectible in “Interest and other expense, net” on the Company’s Consolidated Statements of Operations. Any accrued interest receivable on available-for-sale debt securities is recorded in “Prepaid expenses and other current assets,” in the accompanying Consolidated Balance Sheets, as applicable.
For Autodesk’s quarterly impairment assessment of privately held debt and equity securities strategic investment portfolio, the analysis encompasses an assessment of the severity and duration of the impairment and qualitative and quantitative analysis of other key factors including: the investee’s financial metrics, the investee’s products and technologies meeting or exceeding predefined milestones, market acceptance of the product or technology, other competitive products or technology in the market, general market conditions, management and governance structure of the investee, the investee’s liquidity, debt ratios, and the rate at which the investee is using its cash.
For additional information, see “Concentration of Credit Risk” within this Note 1, “Business and Summary of Significant Accounting Policies” and Note 3, “Financial Instruments.”
Derivative Financial Instruments
Under its risk management strategy, Autodesk uses derivative instruments to manage its short-term exposures to fluctuations in foreign currency exchange rates that exist as part of ongoing business operations. Autodesk’s general practice is to hedge a portion of transaction exposures primarily denominated in euros, Japanese yen, British pounds, Canadian dollars, Australian dollars, Singapore dollars, Swiss francs, Swedish krona, Czech koruna and Indian rupees. These instruments generally have maturities between one and 12 months in the future. Autodesk uses foreign currency contracts not designated as hedging instruments and foreign currency contracts designated as cash flow hedges but Autodesk does not enter into derivative instrument transactions for trading or speculative purposes.
The bank counterparties to the derivative contracts potentially expose Autodesk to credit-related losses in the event of their nonperformance. However, to mitigate that risk, Autodesk only contracts with counterparties who meet the Company’s minimum requirements under its counterparty risk assessment process. Autodesk monitors counterparty risk on at least a quarterly basis and will adjust its exposure to various counterparties as necessary. Autodesk generally enters into master netting arrangements, which reduce credit risk by permitting net settlement of transactions with the same counterparty. Autodesk does not have any master netting arrangements in place with collateral features.
Autodesk accounts for these derivative instruments as either assets or liabilities on the balance sheet and carries them at fair value. Gains and losses resulting from changes in fair value are accounted for depending on the use of the derivative and whether it is designated and qualifies for hedge accounting. Derivatives that do not qualify for hedge accounting are adjusted to fair value through earnings.
In addition to these foreign currency contracts, Autodesk holds derivative instruments issued by privately held companies, which are not designated as hedging instruments. These derivatives consist of certain conversion options on the convertible debt securities held by Autodesk or options to acquire equity securities in a privately held company. These derivatives are recorded at fair value as of each balance sheet date and are recorded in “Long-term other assets.” Changes in the fair values of these instruments are recognized in “Interest and other income (expense), net.”
Foreign Currency Translation and Transactions
The assets and liabilities of Autodesk’s foreign subsidiaries are translated from their respective functional currencies into U.S. dollars at the rates in effect at the balance sheet date, and revenue and expense amounts are translated at exchange rates that approximate those rates in effect during the period in which the underlying transactions occur. Foreign currency translation adjustments are recorded in other comprehensive income (loss).
Gains and losses realized from foreign currency transactions, those transactions denominated in currencies other than the foreign subsidiary’s functional currency, are included in “Interest and other income (expense), net.” Monetary assets and liabilities are remeasured using foreign currency exchange rates at the end of the period, and non-monetary assets and liabilities are remeasured based on historical exchange rates.
Foreign Currency Contracts Designated as Cash Flow Hedges
Autodesk uses foreign currency contracts to reduce the exchange rate impact on a portion of the net revenue or operating expense of certain anticipated transactions. These currency collars and forward contracts are designated and documented as cash flow hedges. The effectiveness of the cash flow hedge contracts is assessed quantitatively using regression at inception and thereafter. To receive cash flow hedge accounting treatment, all hedging relationships are formally documented at the inception of the hedge relationship and the hedges are expected to be highly effective in offsetting changes to future cash flows on hedged transactions. The gains and losses on these hedges are included in “Accumulated other comprehensive loss” and are reclassified into earnings at the time the forecasted revenue or expense is recognized. In the event the underlying forecasted transaction does not occur, or it becomes probable that it will not occur, Autodesk reclassifies and discloses the gain or loss on the related cash flow hedge from “Accumulated other comprehensive loss” to “Interest and other income (expense), net” in the Company’s Consolidated Financial Statements at that time. Derivative contracts and related gain (loss) are presented within “Net cash provided by operating activities” in the Company’s Consolidated Statements of Cash Flow. See Note 3, “Financial Instruments” for additional information.
Derivatives Not Designated as Hedging Instruments
Autodesk uses foreign currency contracts that are not designated as hedging instruments to reduce the exchange rate risk associated primarily with foreign currency denominated receivables, payables, and cash. These forward contracts are marked-to-market at the end of each fiscal quarter with gains and losses recognized as “Interest and other income (expense), net.” These derivative instruments do not subject the Company to material balance sheet risk due to exchange rate movements because gains and losses on these derivative instruments are intended to offset the gains or losses resulting from the revaluation and settlement of the underlying foreign currency denominated receivables, payables, and cash.
Accounts Receivable, Net
Accounts receivable, net, consisted of the following as of January 31:
| | | | | | | | | | | |
| 2024 | | 2023 |
| Trade accounts receivable | $ | 979 | | | $ | 1,046 | |
| Less: Allowance for credit losses | (4) | | | (5) | |
| Product returns reserve | (1) | | | (1) | |
| Partner programs and other obligations | (98) | | | (79) | |
| Accounts receivable, net | $ | 876 | | | $ | 961 | |
Allowances for uncollectible trade receivables and contract assets are subject to impairment using the expected credit loss model. Allowances for expected credit losses are measured based upon the lifetime expected credit loss which is based on historical experience, the number of days that billings are past due, reasonable economic forecast, including revised forecast data for the current economic environment, customer payment behavior, credit reports, and other customer-specific information. Allowances for credit losses on trade receivables and contract assets were not material as of January 31, 2024.
As part of the indirect channel model, Autodesk has a partner incentive program that uses quarterly attainment of monetary rewards to motivate distributors and resellers to achieve mutually agreed upon business goals in a specified time period. The majority of these incentives are recorded as a reduction to deferred revenue in the period the transaction is billed and subsequently recognized as a reduction to subscription revenue over the contract period. The remainder reduces subscription or other revenue in the current period.
These incentive balances do not require significant assumptions or judgments. Depending on how the payments are made, the reserves associated with the partner incentive program are recognized on the balance sheet as either a reduction to accounts receivable or recorded as accounts payable.
Concentration of Credit Risk
Autodesk places its cash, cash equivalents, and marketable securities in highly liquid instruments with, and in the custody of, multiple diversified financial institutions globally with high credit ratings and limits the amounts invested with any one institution, type of security, and issuer. Autodesk’s primary commercial banking relationship is with Citigroup Inc. and its global affiliates. Citibank, N.A., an affiliate of Citigroup, is one of the lead lenders and an agent in the syndicate of Autodesk’s $1.5 billion revolving credit facility.
The bank counterparties to the derivative contracts potentially expose Autodesk to credit-related losses in the event of their nonperformance. However, to mitigate that risk, Autodesk only contracts with counterparties who meet the Company's minimum requirements under its counterparty risk assessment process. Autodesk monitors counterparty risk on at least a quarterly basis and will adjust its exposure to various counterparties as necessary. Autodesk generally enters into master netting arrangements, which reduce credit risk by permitting net settlement of transactions with the same counterparty. However, Autodesk does not have any master netting arrangements in place with collateral features.
Autodesk’s accounts receivable are derived from sales to a large number of resellers, distributors, and direct customers in the Americas, Europe, Middle East and Africa (“EMEA”), and Asia Pacific (“APAC”) geographies. Autodesk performs ongoing evaluations of these partners’ and customers’ financial condition and limits the amount of credit extended when deemed necessary, but generally does not require collateral from such parties. Total revenue from the Company’s largest distributor TD Synnex Corporation, and its global affiliates (“TD Synnex”), accounted for 39%, 37%, and 36% of Autodesk's net revenue for fiscal years ended January 31, 2024, 2023 and 2022, respectively. The majority of the net revenue from sales to TD Synnex is from sales made outside of the United States. In addition, TD Synnex accounted for 18% and 27% of trade accounts receivable as of January 31, 2024 and 2023, respectively. No other customer accounted for more than 10% of Autodesk’s total net revenue or trade accounts receivable for each of the respective periods.
Intangible Assets, Net
Intangible assets include customer relationships, developed technologies, trade names and patents, and other, and the related accumulated amortization. These assets are presented as “Intangible assets, net” in the Consolidated Balance Sheets. The majority of Autodesk’s intangible assets are amortized to expense over the estimated economic life, which ranges from 3 to 15 years. Amortization expense for intangible assets was $89 million in fiscal 2024, $98 million in fiscal 2023, and $94 million in fiscal 2022.
Intangible assets and related accumulated amortization at January 31, 2024 were as follows:
| | | | | | | | | | | | | | | | | | | | | | |
| | |
| Gross Carrying Amount (1) | | Accumulated Amortization | | Net | | | | | |
| Customer relationships | $ | 664 | | | $ | (436) | | | $ | 228 | | | | | | |
| Developed technologies | 933 | | | (765) | | | 168 | | | | | | |
| Trade names and patents | 116 | | | (113) | | | 3 | | | | | | |
| Other | 8 | | | (1) | | | 7 | | | | | | |
| Total intangible assets | $ | 1,721 | | | $ | (1,315) | | | $ | 406 | | | | | | |
_______________
(1)Includes the effects of foreign currency translation.
Intangible assets and related accumulated amortization at January 31, 2023 were as follows:
| | | | | | | | | | | | | | | | | | | |
| | | |
| Gross Carrying Amount (1) | | Accumulated Amortization | | Net | | |
| Customer relationships | $ | 659 | | | $ | (402) | | | $ | 257 | | | |
| Developed technologies | 858 | | | (718) | | | 140 | | | |
| Trade names and patents | 116 | | | (106) | | | 10 | | | |
| | | | | | | |
| Total intangible assets | $ | 1,633 | | | $ | (1,226) | | | $ | 407 | | | |
_______________
(1)Includes the effects of foreign currency translation.
The weighted average amortization period for intangible assets during fiscal 2024 was 9.1 years. Expected future amortization expense for intangible assets for each of the fiscal years ended thereafter is as follows:
| | | | | |
| | Fiscal Year ended January 31, |
| 2025 | $ | 90 | |
| 2026 | 84 | |
| 2027 | 73 | |
| 2028 | 33 | |
| 2029 | 19 | |
| Thereafter | 107 | |
| Total | $ | 406 | |
Computer Equipment, Software, Furniture, and Leasehold Improvements, Net
Computer equipment, software, and furniture are depreciated using the straight-line method over the estimated useful lives of the assets, which range from three to five years. Leasehold improvements are amortized on a straight-line basis over the shorter of their estimated useful lives or the lease term. Depreciation expense was $47 million in fiscal 2024, $50 million in fiscal 2023, and $52 million in fiscal 2022. Impairment losses were not material in both fiscal years ended January 31, 2024 and 2023. Autodesk recognized impairment losses of $29 million in the fiscal year ended January 31, 2022.
Computer equipment, software, furniture, leasehold improvements, and the related accumulated depreciation at January 31 were as follows:
| | | | | | | | | | | |
| 2024 | | 2023 |
| Computer hardware, at cost | $ | 117 | | | $ | 126 | |
| Computer software, at cost | 48 | | | 49 | |
| Furniture and equipment, at cost | 100 | | | 94 | |
| Leasehold improvements, land and buildings, at cost | 357 | | | 363 | |
| 622 | | | 632 | |
| Less: Accumulated depreciation | (501) | | | (488) | |
| Computer equipment, software, furniture, and leasehold improvements, net | $ | 121 | | | $ | 144 | |
Costs incurred for computer software developed or obtained for internal use are capitalized for application development activities, if material, and immediately expensed for preliminary project activities and post-implementation activities. These capitalized costs are amortized straight-line over the software’s expected useful life, which is generally three years.
Software Development Costs
Software development costs for external use incurred prior to the establishment of technological feasibility are included in research and development expenses. Autodesk defines establishment of technological feasibility as the completion of a working model. Software development costs incurred subsequent to the establishment of technological feasibility through the period of general market availability of the products are capitalized and generally amortized over a two-year period, if material. Autodesk had no material capitalized software development costs at January 31, 2024, and January 31, 2023.
Cloud Computing Arrangements
Autodesk enters into certain cloud-based software hosting arrangements that are accounted for as service contracts. Costs incurred for these arrangements are capitalized for application development activities, if material, and immediately expensed for preliminary project activities and post-implementation activities. Autodesk amortizes the capitalized development costs straight-line over the fixed, non-cancellable term of the associated hosting arrangement plus any reasonably certain renewal periods. The capitalized costs are included in “Prepaid expenses and other current assets” and “Long-term other assets” on our Consolidated Balance Sheets. Capitalized costs were $254 million and $190 million at January 31, 2024, and January 31, 2023, respectively. Accumulated amortization was $83 million and $41 million at January 31, 2024, and January 31, 2023, respectively. Amortization expense was $42 million, $24 million, and $12 million in fiscal 2024, fiscal 2023, and fiscal 2022, respectively.
Leases
Autodesk determines if an arrangement is a lease at inception. Operating leases are included in “Operating lease right-of-use assets,” “Operating lease liabilities,” and “Long-term operating lease liabilities” in the Consolidated Balance Sheets.
Operating lease right-of-use assets represent Autodesk’s right to use an underlying asset for the lease term and operating lease liabilities represent the Company’s obligation to make lease payments arising from the lease. Operating lease right-of-use assets and operating lease liabilities are recognized at commencement date based on the present value of lease payments over the lease term. The operating lease right-of-use assets also include any lease payments made and are reduced by any lease incentives. Autodesk uses its incremental borrowing rate, if the Company’s leases do not provide an implicit rate, adjusted for local country-specific borrowing rates as applicable, based on the information available at commencement date in determining the present value of lease payments. Options to extend or terminate the lease are considered in determining the lease term when it is reasonably certain that the option will be exercised. Lease expense for lease payments is recognized on a straight-line basis over the lease term.
Autodesk has lease agreements with lease and non-lease components. Autodesk accounts for the lease and non-lease components as a single lease component.
Business Combinations
Autodesk records the tangible and intangible assets acquired and liabilities assumed in a business combination based on their estimated fair values at the date of the respective acquisition, with the exception of contract assets and contract liabilities (i.e., deferred revenue) which are recognized and measured on the acquisition date in accordance with Autodesk’s “Revenue Recognition” policy in Note 1 “Business and Summary of Significant Accounting Policies”. The fair values assigned to the identifiable intangible assets acquired were based on estimates and assumptions determined by management. Autodesk recorded the excess of consideration transferred over the aggregate fair values as goodwill. During the measurement period, which may be up to one year from the acquisition date, Autodesk may record adjustments to these tangible and intangible assets acquired and liabilities assumed, with the corresponding offset to goodwill.
Impairment of Long-Lived Assets
At least annually or more frequently as circumstances dictate, Autodesk reviews its long-lived assets for impairment whenever impairment indicators exist. Autodesk continually monitors events and changes in circumstances that could indicate the carrying amounts of its long-lived assets may not be recoverable. When such events or changes in circumstances occur, Autodesk assesses the recoverability of these assets. Recoverability is measured by comparison of the carrying amounts of the assets to the future undiscounted cash flow the assets are expected to generate generally using Level 3 inputs. If the long-lived assets are impaired, the impairment to be recognized is equal to the amount by which the carrying value of the assets exceeds its fair market value. Autodesk recorded impairment charges on lease related right-of-use assets related to certain office leases during the fiscal years ended January 31, 2024, 2023, and 2022. See Note 9, “Leases” for further discussion.
In addition to the recoverability assessments, Autodesk routinely reviews the remaining estimated useful lives of its long-lived assets. Any reduction in the useful life assumption will result in increased depreciation and amortization expense in the quarter when such determinations are made, as well as in subsequent quarters.
Goodwill
Goodwill consists of the excess of the consideration transferred over the fair value of net assets acquired in business combinations. Autodesk tests goodwill for impairment annually in its fourth fiscal quarter or more often if circumstances indicate a potential impairment may exist, or if events have affected the composition of its reporting unit.
Autodesk tests goodwill for impairment by performing a quantitative assessment of whether fair value of the reporting unit is greater than its carrying value. In situations in which an entity’s reporting unit is publicly traded, the fair value of the company may be approximated by its market capitalization, in performing the quantitative impairment test.
Goodwill impairment exists when the estimated fair value of goodwill is less than its carrying value. If impairment exists, the carrying value of the goodwill is reduced to fair value through an impairment charge recorded in the Company’s consolidated statements of operations. The process of evaluating the potential impairment of goodwill is subjective and requires significant judgment at many points during the analysis. The value of Autodesk’s goodwill could also be impacted by future adverse changes such as: (i) declines in Autodesk’s actual financial results, (ii) a sustained decline in Autodesk’s market capitalization, (iii) a significant slowdown in the worldwide economy or the industries Autodesk serves, or (iv) changes in Autodesk’s business strategy.
For the annual impairment test, Autodesk’s market capitalization was substantially in excess of the carrying value of the Company as of January 31, 2024. Accordingly, Autodesk has determined there was no goodwill impairment of our reporting unit during the fiscal year ended January 31, 2024. In addition, Autodesk did not recognize any goodwill impairment losses in fiscal 2023 or 2022.
The following table summarizes the changes in the carrying amount of goodwill during the fiscal years ended January 31, 2024 and 2023:
| | | | | | | | | | | |
| January 31, 2024 | | January 31, 2023 |
| Goodwill, beginning of the year | $ | 3,774 | | | $ | 3,753 | |
| Less: accumulated impairment losses, beginning of the year | (149) | | | (149) | |
| Net Goodwill, beginning of the year | 3,625 | | | 3,604 | |
| Additions arising from acquisitions during the year | 25 | | | 85 | |
| Effect of foreign currency translation and measurement period adjustments (1) | 3 | | | (64) | |
| | | |
| Goodwill, end of the year | $ | 3,653 | | | $ | 3,625 | |
_______________
(1)Measurement period adjustments reflect revisions made to the Company's preliminary determination of estimated fair value of assets and liabilities assumed.
Deferred Tax Assets
Deferred tax assets arise primarily from tax credits, net operating losses, and timing differences for reserves, accrued liabilities, stock options, deferred revenue, purchased technologies, and capitalized intangibles, partially offset by U.S. deferred
tax liabilities on acquired intangibles, and valuation allowances against Portugal, New Zealand, California, Michigan and Massachusetts deferred tax assets, and deferred tax assets that will convert into capital loss upon reversal in Australia and U.S. Autodesk performs a quarterly assessment of the recoverability of these net deferred tax assets and believes it will generate sufficient future taxable income in appropriate tax jurisdictions to realize the net deferred tax assets. They are measured using enacted tax rates expected to apply to taxable income in the years in which those temporary differences are expected to reverse. Valuation allowances are established when necessary to reduce gross deferred tax assets to the amount that is more likely than not to be realized.
Stock-based Compensation Expense
The following table summarizes stock-based compensation expense for fiscal 2024, 2023, and 2022, as follows:
| | | | | | | | | | | | | | | | | |
| | Fiscal Year Ended January 31, |
| | 2024 | | 2023 | | 2022 |
| Cost of subscription and maintenance revenue | $ | 37 | | | $ | 34 | | | $ | 25 | |
| Cost of other revenue | 14 | | | 12 | | | 10 | |
| Marketing and sales | 258 | | | 263 | | | 234 | |
| Research and development | 308 | | | 266 | | | 220 | |
| General and administrative | 86 | | | 85 | | | 70 | |
Stock-based compensation expense related to stock awards and Employee Qualified Stock Purchase Plan ("ESPP") purchases | 703 | | | 660 | | | 559 | |
| Tax expense (benefit) | 2 | | | 13 | | | (53) | |
Stock-based compensation expense related to stock awards and ESPP purchases, net | $ | 705 | | | $ | 673 | | | $ | 506 | |
Autodesk measures stock-based compensation cost at the grant date fair value of the award, and recognizes expense ratably over the requisite service period, which is generally the vesting period. Autodesk determines the grant date fair value of its stock-based payment awards for grants of employee stock purchases related to the employee stock purchase plan using the Black-Scholes-Merton (“BSM”) option-pricing model. To determine the grant-date fair value of our stock-based payment awards for restricted stock units and performance stock units, we use the quoted stock price on the date of grant unless the awards are subject to market conditions, in which case we use the Monte Carlo simulation model. The Monte Carlo simulation model utilizes multiple input variables to estimate the probability that market conditions will be achieved. These variables include our expected stock price volatility over the expected term of the award, actual and projected employee stock option exercise behaviors, the risk-free interest rate for the expected term of the award, and expected dividends. The variables used in these models are reviewed on a quarterly basis and adjusted as needed. Stock-based compensation cost for restricted stock is measured on the closing fair market value of our common stock on the date of grant. Autodesk uses the following assumptions to estimate the fair value of stock-based awards:
| | | | | | | | | | | | | | | | | | | | | | | | | | | | | | | | | | | | | | | | | | | | |
| | Fiscal Year Ended | | | | Fiscal Year Ended | | | Fiscal Year Ended |
| | | January 31, 2024 | | | | January 31, 2023 | | | January 31, 2022 |
| | | Performance Stock Unit | | ESPP | | | | Performance Stock Unit | | ESPP | | | | Performance Stock Unit | | ESPP |
Range of expected volatilities | | 40.9 - 42.5% | | 29.4 - 42.4% | | | | 39.4 - 40.7% | | 38.3 - 44.9% | | | | 36.9% | | 29.5 - 41.8% |
Range of expected lives (in years) | | N/A | | 0.5 - 2.0 | | | | N/A | | 0.5 - 2.0 | | | | N/A | | 0.5 - 2.0 |
| Expected dividends | | —% | | —% | | | | —% | | —% | | | | —% | | —% |
Range of risk-free interest rates | | 4.3 - 4.7% | | 4.3 - 5.5% | | | | 1.2 - 1.6% | | 0.9 - 3.9% | | | | 0.1% | | 0.1 - 0.2% |
Autodesk estimates expected volatility for stock-based awards based on the average of the following two measures: (1) a measure of historical volatility in the trading market for the Company’s common stock, and (2) the implied volatility of traded options to purchase shares of the Company’s common stock. The expected volatility for performance stock units subject to market conditions includes the expected volatility of companies within the S&P North American Technology Software Index with a market capitalization over $2.0 billion, depending on the award type.
The range of expected lives of ESPP awards are based upon the four six-month exercise periods within a 24-month offering period.
Autodesk did not pay cash dividends in fiscal 2024, 2023, or 2022 and does not anticipate paying any cash dividends in the foreseeable future. Consequently, an expected dividend yield of zero is used in the BSM option pricing model and the Monte Carlo simulation model.
The risk-free interest rate used in the BSM option pricing model and the Monte Carlo simulation model for stock-based awards is the historical yield on U.S. Treasury securities with equivalent remaining lives.
Autodesk recognizes expense only for the stock-based awards that ultimately vest. Autodesk accounts for forfeitures of stock-based awards as those forfeitures occur.
Advertising Expenses
Advertising costs are expensed as incurred. Total advertising expenses incurred were $64 million in fiscal 2024, $69 million in fiscal 2023, and $80 million in fiscal 2022.
Net Income Per Share
Basic net income per share is computed using the weighted average number of shares of common stock outstanding during the period. Diluted net income per share is computed using the weighted average shares of common stock outstanding during the period and potentially dilutive common shares, including the effect of restricted stock units, performance share awards, and stock options using the treasury stock method.
Defined Benefit Pension Plans
The funded status of Autodesk’s defined benefit pension plans is recognized in the Consolidated Balance Sheets. The funded status is measured as the difference between the fair value of plan assets and the projected benefit obligation for the fiscal years presented. The projected benefit obligation represents the actuarial present value of benefits expected to be paid upon retirement based on employee services already rendered and estimated future compensation levels. The fair value of plan assets represents the current market value of Autodesk’s cumulative company and participant contributions made to the various plans in effect.
Net periodic benefit cost is recorded in the Consolidated Statements of Operations and includes service cost, interest cost, expected return on plan assets, amortization of prior service costs, and gains or losses previously recognized as a component of other comprehensive income (loss). Certain events, such as changes in the employee base, plan amendments, and changes in actuarial assumptions may result in a change in the defined benefit obligation and the corresponding change to other comprehensive loss.
Gains and losses and prior service costs not recognized as a component of net periodic benefit cost in the Consolidated Statements of Operations as they arise are recognized as a component of other comprehensive income (loss) in the Consolidated Statements of Comprehensive Income. Those gains and losses and prior service costs are subsequently amortized as a component of net periodic benefit cost over the average remaining service lives of the plan participants using a corridor approach to determine the portion of gain or loss subject to amortization.
The measurement of projected benefit obligations and net periodic benefit cost is based on estimates and assumptions that reflect the terms of the plans and use participant-specific information such as compensation, age and years of services, as well as certain assumptions, including estimates of discount rates, expected return of plan assets, rate of compensation increases, interest rates, and mortality rates.
Accounting Standards in Fiscal 2024
With the exception of those discussed below, there have been no recent changes in accounting pronouncements issued by FASB or adopted by the Company during the fiscal year ended January 31, 2024, that are applicable to the Company.
Accounting Standards Adopted
In June 2022, the FASB issued ASU No. 2022-03, “Fair Value Measurement (Topic 820): Fair Value Measurement of Equity Securities Subject to Contractual Sale Restrictions” (“ASU 2022-03”), which applies to all equity securities measured at fair value that are subject to contractual sale restrictions. ASU 2022-03 prohibits entities from taking into account contractual restrictions on the sale of equity securities when estimating fair value and introduces required disclosures for such transactions. ASU 2022-03 is effective for Autodesk's fiscal year beginning February 1, 2024 and interim periods within that fiscal year, with early adoption permitted. Autodesk adopted ASU 2022-03 as of February 1, 2023. The adoption of ASU No. 2022-03 did not have a material impact on Autodesk’s consolidated financial statements.
Recently issued accounting standards not yet adopted
In November 2023, the FASB issued ASU No. 2023-07, “Segment Reporting (Topic 280): Improvements to Reportable Segment Disclosures” (“ASU 2023-07”), which are intended to improve reportable segment disclosure requirements. ASU 2023-07 expands public entities’ segment disclosures by requiring disclosure of significant segment expenses that are regularly provided to the chief operating decision maker and included within each reported measure of segment profit or loss, an amount and description of its composition for other segment items, and interim disclosures of a reportable segment’s profit or loss and assets. All disclosure requirements of ASU 2023-07 are required for entities with a single reportable segment. ASU 2023-07 is effective for Autodesk’s fiscal year beginning February 1, 2024, and interim periods for Autodesk’s fiscal year beginning February 1, 2025, and should be applied on a retrospective basis to all periods presented. Autodesk is currently evaluating the effect of adopting ASU 2023-07 on its disclosures.
In December 2023, the FASB issued ASU No. 2023-09, “Income Taxes (Topic 740): Improvement to Income Tax Disclosures” (“ASU 2023-09”), to enhance the transparency and decision usefulness of income tax disclosures. ASU 2023-09 requires disaggregated information about a reporting entity's effective tax rate reconciliation as well as information on income taxes paid. The standard is intended to benefit investors by providing more detailed income tax disclosures that would be useful in making capital allocation decisions and applies to all entities subject to income taxes. ASU 2023-09 is effective for Autodesk’s fiscal year beginning February 1, 2025 on a prospective basis. Early adoption is permitted. Autodesk is currently evaluating the effect of adopting ASU 2023-09 on its disclosures.
2. Revenue Recognition
Revenue Disaggregation
Autodesk recognizes revenue from the sale of (1) product subscriptions, cloud service offerings, and EBAs, (2) renewal fees for existing maintenance plan agreements that were initially purchased with a perpetual software license, and (3) consulting and other products and services. The three categories are presented as line items on Autodesk’s Consolidated Statements of Operations.
Information regarding the components of Autodesk’s net revenue from contracts with customers by product family, geographic location, sales channel, and product type was as follows:
| | | | | | | | | | | | | | | | | |
| | Fiscal Year ended January 31, |
| | 2024 | | 2023 | | 2022 |
| Net revenue by product family: | | | | | |
| Architecture, Engineering and Construction | $ | 2,580 | | | $ | 2,278 | | | $ | 1,969 | |
| AutoCAD and AutoCAD LT | 1,462 | | | 1,387 | | | 1,244 | |
| Manufacturing | 1,063 | | | 978 | | | 876 | |
| Media and Entertainment | 295 | | | 291 | | | 259 | |
| Other | 97 | | | 71 | | | 38 | |
| Total net revenue | $ | 5,497 | | | $ | 5,005 | | | $ | 4,386 | |
| | | | | |
| Net revenue by geographic area: | | | | | |
| Americas | | | | | |
| U.S. | $ | 1,978 | | | $ | 1,720 | | | $ | 1,457 | |
| Other Americas | 460 | | | 372 | | | 308 | |
| Total Americas | 2,438 | | | 2,092 | | | 1,765 | |
| Europe, Middle East and Africa | 2,042 | | | 1,906 | | | 1,700 | |
| Asia Pacific | 1,017 | | | 1,007 | | | 921 | |
| Total net revenue | $ | 5,497 | | | $ | 5,005 | | | $ | 4,386 | |
| | | | | |
| Net revenue by sales channel: | | | | | |
| Indirect | $ | 3,444 | | | $ | 3,250 | | | $ | 2,849 | |
| Direct | 2,053 | | | 1,755 | | | 1,537 | |
| Total net revenue | $ | 5,497 | | | $ | 5,005 | | | $ | 4,386 | |
| | | | | |
| Net revenue by product type: | | | | | |
| Design | $ | 4,647 | | | $ | 4,264 | | | $ | 3,772 | |
| Make | 523 | | | 452 | | | 364 | |
| Other | 327 | | | 289 | | | 250 | |
| Total net revenue | $ | 5,497 | | | $ | 5,005 | | | $ | 4,386 | |
.
Payments for product subscriptions, cloud subscriptions, and maintenance subscriptions are typically due in annual installments or up front with payment terms of 30 to 45 days. Payments on EBAs are typically due in annual installments over the contract term, with payment terms of 30 to 60 days. Autodesk does not have any material variable consideration, such as obligations for returns, refunds, warranties, or amounts due to customers for which significant estimation or judgment is required as of the reporting date.
Remaining performance obligations consist of total short-term, long-term, and unbilled deferred revenue. As of January 31, 2024, Autodesk had remaining performance obligations of $6.11 billion, which represents the total contract price allocated to remaining performance obligations, which are generally recognized over the next three years. We expect to recognize $3.98 billion or 65% of our remaining performance obligations as revenue during the next 12 months. We expect to recognize the remaining $2.13 billion or 35% of our remaining performance obligations as revenue thereafter.
The amount of remaining performance obligations may be impacted by the specific timing, duration, and size of customer subscription and support agreements, the specific timing of customer renewals, and foreign currency fluctuations.
Contract Balances
We receive payments from customers based on a billing schedule as established in our contracts. Contract assets relate to performance completed in advance of scheduled billings. Contract assets were not material as of January 31, 2024. Deferred revenue relates to billings in advance of performance under the contract. The primary changes in our contract assets and deferred revenues are due to our performance under the contracts and billings.
Revenue recognized during the fiscal years ended January 31, 2024 and 2023, that was included in the deferred revenue balances at January 31, 2023 and 2022, was $3.20 billion and $2.85 billion, respectively. The satisfaction of performance obligations typically lags behind billings received under revenue contracts from customers.
3. Financial Instruments
The following tables summarize the Company’s financial instruments by significant investment category as of January 31, 2024 and 2023. | | | | | | | | | | | | | | | | | | | | | | | | | | | | | | | | | | | | |
| | | January 31, 2024 | |
| | | Amortized Cost | | Gross Unrealized Gains | | Gross Unrealized Losses | | Fair Value | | | | | | | |
| Cash equivalents (1): | | | | | | | | | | | | | | |
| Money market funds | $ | 693 | | | $ | — | | | $ | — | | | $ | 693 | | | | | | | | |
| Commercial paper | 250 | | | — | | | — | | | 250 | | | | | | | | |
| U.S. government securities | 92 | | | — | | | — | | | 92 | | | | | | | | |
| Certificates of deposit | 80 | | | — | | | — | | | 80 | | | | | | | | |
| | | | | | | | | | | | | | | |
| | | | | | | | | | | | | | | |
| | | | | | | | | | | | | | | |
| | | | | | | | | | | | | | | |
| | | | | | | | | | | | | | | |
| Other (2) | 6 | | | — | | | — | | | 6 | | | | | | | | |
| Marketable securities: | | | | | | | | | | | | | | |
| Short-term | | | | | | | | | | | | | | |
| | Commercial paper | 159 | | | — | | | — | | | 159 | | | | | | | | |
| | Corporate debt securities | 75 | | | — | | | | | 75 | | | | | | | | |
| | | | | | | | | | | | | | | | |
| | U.S. government securities | 70 | | | — | | | — | | | 70 | | | | | | | | |
| | Asset backed securities | 28 | | | — | | | — | | | 28 | | | | | | | | |
| | | | | | | | | | | | | | | | |
| | | | | | | | | | | | | | | | |
| | | | | | | | | | | | | | | | |
| | Other (3) | 22 | | | | | — | | | 22 | | | | | | | | |
| Long-term | | | | | | | | | | | | | | |
| | Corporate debt securities | 103 | | | 1 | | | — | | | 104 | | | | | | | | |
| | Asset backed securities | 59 | | | — | | | — | | | 59 | | | | | | | | |
| | Agency mortgage-backed securities | 36 | | | — | | | — | | | 36 | | | | | | | | |
| | U.S. government securities | 24 | | | — | | | — | | | 24 | | | | | | | | |
| | | | | | | | | | | | | | | | |
| | | | | | | | | | | | | | | | |
| | Other (4) | 11 | | | — | | | — | | | 11 | | | | | | | | |
| Mutual funds (5) (6) | 89 | | | 12 | | | (1) | | | 100 | | | | | | | | |
| | | | | | | | | | | | | | |
| | | | | | | | | | | | | | |
| | Total | $ | 1,797 | | | $ | 13 | | | $ | (1) | | | $ | 1,809 | | | | | | | | |
____________________
(1)Included in “Cash and cash equivalents” in the accompanying Consolidated Balance Sheets. These investments are classified as debt securities.
(2)Consists primarily of mortgage-backed securities and corporate debt securities.
(3)Consists primarily of agency discount bonds, U.S. government securities, mortgage-backed securities, certificates of deposit, and agency bonds.
(4)Consists primarily of agency bonds, agency collateralized mortgage obligations, and mortgage-backed securities.
(5)See Note 7, "Deferred Compensation" for more information.
(6)Included in “Prepaid expenses and other current assets” or “Long-term other assets” in the accompanying Consolidated Balance Sheets.
| | | | | | | | | | | | | | | | | | | | | | | | | | | | | | | | | | | | |
| | | January 31, 2023 | |
| | | Amortized Cost | | Gross Unrealized Gains | | Gross Unrealized Losses | | Fair Value | | | | | | | |
| Cash equivalents (1): | | | | | | | | | | | | | | |
| Money market funds | $ | 737 | | | $ | — | | | $ | — | | | $ | 737 | | | | | | | | |
| | | | | | | | | | | | | | | |
| Commercial paper | 169 | | | — | | | — | | | 169 | | | | | | | | |
| Certificates of deposit | 35 | | | — | | | — | | | 35 | | | | | | | | |
| U.S. government securities | 13 | | | — | | | — | | | 13 | | | | | | | | |
| | | | | | | | | | | | | | | |
| | | | | | | | | | | | | | | |
| | | | | | | | | | | | | | | |
| | | | | | | | | | | | | | | |
| Other (2) | 12 | | | — | | | — | | | 12 | | | | | | | | |
| Marketable securities: | | | | | | | | | | | | | | |
| Short-term | | | | | | | | | | | | | | |
| | | | | | | | | | | | | | | | |
| | Corporate debt securities | 44 | | | — | | | | | 44 | | | | | | | | |
| | Commercial paper | 42 | | | — | | | — | | | 42 | | | | | | | | |
| | Asset backed securities | 19 | | | — | | | — | | | 19 | | | | | | | | |
| | | | | | | | | | | | | | | | |
| | U.S. government securities | 17 | | | — | | | — | | | 17 | | | | | | | | |
| | | | | | | | | | | | | | | | |
| | | | | | | | | | | | | | | | |
| | Other (3) | 3 | | | | | — | | | 3 | | | | | | | | |
| | | | | | | | | | | | | | | |
| | | | | | | | | | | | | | | | |
| Long-term | | | | | | | | | | | | | | |
| | | | | | | | | | | | | | | | |
| | Corporate debt securities | 45 | | | — | | | — | | | 45 | | | | | | | | |
| | U.S. government securities | 35 | | | — | | | — | | | 35 | | | | | | | | |
| | Asset backed securities | 13 | | | — | | | — | | | 13 | | | | | | | | |
| | | | | | | | | | | | | | | | |
| | Other (4) | 9 | | | — | | | — | | | 9 | | | | | | | | |
| Mutual Funds (5) (6) | 81 | | | 6 | | | (1) | | | 86 | | | | | | | | |
| Convertible debt securities (6) | 3 | | | 1 | | | (2) | | | 2 | | | | | | | | |
Strategic investments derivative asset (6) | 2 | | | — | | | (2) | | | — | | | | | | | | |
| | Total | $ | 1,279 | | | $ | 7 | | | $ | (5) | | | $ | 1,281 | | | | | | | | |
____________________
(1)Included in “Cash and cash equivalents” in the accompanying Consolidated Balance Sheets. These investments are classified as debt securities.
(2)Consists of custody cash deposits, agency discount notes, municipal bonds, corporate debt securities, asset-backed securities, and mortgage-backed securities.
(3)Consists of mortgage-backed securities, agency mortgage-backed securities, common stock, and agency collateralized mortgage obligations.
(4)Consists of agency mortgage-backed securities, agency bonds, agency collateralized mortgage obligations, mortgage-backed securities, and collateralized mortgage obligations.
(5)See Note 7, "Deferred Compensation" for more information.
(6)Included in “Prepaid expenses and other current assets” or “Long-term other assets” in the accompanying Consolidated Balance Sheets.
The following table summarizes the fair values of investments classified as marketable debt securities by contractual maturity date as of January 31, 2024:
| | | | | |
| Fair Value |
| Due within 1 year | $ | 329 | |
| Due in 1 year through 5 years | 220 |
| Due in 5 years through 10 years | 12 |
| Due after 10 years | 27 |
Total | $ | 588 | |
As of both January 31, 2024 and 2023, Autodesk had no material unrealized losses, individually and in the aggregate, for marketable debt securities that are in a continuous unrealized loss position for greater than 12 months. Total unrealized gains for securities with net gains in accumulated other comprehensive income were not material for fiscal 2024.
Autodesk monitors all marketable debt securities for potential credit losses by reviewing indicators such as, but not limited to, current credit rating, change in credit rating, credit outlook, and default risk. There were no allowances for credit losses as of both January 31, 2024 and 2023. There were no write offs of accrued interest receivables for both fiscal 2024 and 2023.
There were no material realized gain or loss for the sales or redemptions of debt securities during fiscal 2024, 2023, and 2022. Realized gains and losses from the sale or redemption of marketable securities are recorded in “Interest and other income (expense), net” on the Company’s Consolidated Statements of Operations.
Proceeds from the sale and maturity of marketable debt securities were as follows:
| | | | | | | | | | | | | | | | | |
| | Fiscal Year Ended |
| 2024 | | 2023 | | 2022 |
| Marketable debt securities | $ | 764 | | | $ | 450 | | | $ | 38 | |
Strategic investments in equity securities
As of January 31, 2024 and 2023, Autodesk had $162 million and $177 million, respectively, in direct investments in privately held companies. These strategic investments in equity securities do not have readily determined fair values and Autodesk uses the measurement alternative to account for the adjustment to these investments in a given quarter. If Autodesk determines that an impairment has occurred, Autodesk writes down the investment to its fair value. These strategic investments in equity securities are generally subject to a security-specific restriction which limits the sale or transfer of the respective equity security during the holding period.
Adjustments to the carrying value of our strategic investments in equity securities with no readily determined fair values measured using the measurement alternative are included in Interest and Other Income (Expense), net on the Company’s Consolidated Statements of Operations. These adjustments were as follows: | | | | | | | | | | | | | | | | | | | | | | | |
| | Fiscal Year Ended | | Cumulative Amount as of |
| 2024 | | 2023 | | 2022 | | January 31, 2024 |
| Upward adjustments | $ | — | | | $ | 6 | | | $ | 7 | | | $ | 29 | |
| Negative adjustments, including impairments | (28) | | | (9) | | | (17) | | | (114) | |
| Net adjustments | $ | (28) | | | $ | (3) | | | $ | (10) | | | $ | (85) | |
Autodesk does not consider the remaining investments to be impaired as of January 31, 2024.
Fair Value
Autodesk applies fair value accounting for certain financial assets and liabilities, which consist of cash equivalents, marketable securities, and other financial instruments, on a recurring basis. The Company defines fair value as the price that would be received from selling an asset or paid to transfer a liability in an orderly transaction between market participants at the measurement date.
The following tables summarize the Company's financial instruments measured at fair value on a recurring basis by significant investment category as of January 31, 2024 and 2023:
| | | | | | | | | | | | | | | | | | | | | | | | | | | | | | | | | | | | | | | |
| | | | | | | | | | January 31, 2024 |
| | | | | | | | | | | Level 1 | | Level 2 | | Level 3 | | Total |
| Cash equivalents (1): | | | | | | | | | | | | | | | |
| Money market funds | | | | | | | | | $ | 693 | | | $ | — | | | $ | — | | | $ | 693 | |
| Commercial paper | | | | | | | | | — | | | 250 | | | — | | | 250 | |
| U.S. government securities | | | | | | | | | — | | | 92 | | | — | | | 92 | |
| Certificates of deposit | | | | | | | | | — | | | 80 | | | — | | | 80 | |
| | | | | | | | | | | | | | | | |
| | | | | | | | | | | | | | | | |
| | | | | | | | | | | | | | | | |
| | | | | | | | | | | | | | | | |
| | | | | | | | | | | | | | | | |
| Other (2) | | | | | | | | | — | | | 6 | | | — | | | 6 | |
| Marketable securities: | | | | | | | | | | | | | | | |
| Short-term | | | | | | | | | | | | | | | |
| | | | | | | | | | | | | | | | | |
| | Commercial paper | | | | | | | | | — | | | 159 | | | — | | | 159 | |
| | Corporate debt securities | | | | | | | | | — | | | 75 | | | — | | | 75 | |
| | U.S. government securities | | | | | | | | | — | | | 70 | | | — | | | 70 | |
| | Asset backed securities | | | | | | | | | — | | | 28 | | | — | | | 28 | |
| | | | | | | | | | | | | | | | | |
| | | | | | | | | | | | | | | | | |
| | | | | | | | | | | | | | | | | |
| | Other (3) | | | | | | | | | — | | | 22 | | | — | | | 22 | |
| Long-term | | | | | | | | | | | | | | | |
| | Corporate debt securities | | | | | | | | | — | | | 104 | | | — | | | 104 | |
| | Asset backed securities | | | | | | | | | — | | | 59 | | | — | | | 59 | |
| | Agency bonds | | | | | | | | | — | | | 36 | | | — | | | 36 | |
| | U.S. government securities | | | | | | | | | — | | | 24 | | | — | | | 24 | |
| | | | | | | | | | | | | | | | | |
| | | | | | | | | | | | | | | | | |
| | Other (4) | | | | | | | | | — | | | 11 | | | — | | | 11 | |
| Long-term other assets: | | | | | | | | | | | | | | | |
| | Mutual funds (5) (6) | | | | | | | | | 100 | | | — | | | — | | | 100 | |
| | | | | | | | | | | | | | | | | |
| Derivative assets: | | | | | | | | | | | | | | | |
| | Derivative contract assets (6) | | | | | | | | | — | | | 21 | | | — | | | 21 | |
| | | | | | | | | | | | | | | | | |
| Derivative liabilities: | | | | | | | | | | | | | | | |
| | Derivative contract liabilities (7) | | | | | | | | | — | | | (15) | | | — | | | (15) | |
| Total | | | | | | | | | $ | 793 | | | $ | 1,022 | | | $ | — | | | $ | 1,815 | |
____________________
(1)Included in “Cash and cash equivalents” in the accompanying Consolidated Balance Sheets. These investments are classified as debt securities.
(2)Consists primarily of mortgage-backed securities and corporate debt securities.
(3)Consists primarily of agency discount bonds, U.S. government securities, mortgage-backed securities, certificates of deposit, and agency bonds.
(4)Consists primarily of agency bonds, agency collateralized mortgage obligations, and mortgage-backed securities.
(5)See Note 7, "Deferred Compensation" for more information.
(6)Included in “Prepaid expenses and other current assets” or “Long-term other assets” in the accompanying Consolidated Balance Sheets.
(7)Included in “Other accrued liabilities” in the accompanying Consolidated Balance Sheets.
| | | | | | | | | | | | | | | | | | | | | | | | | | | | | | | | | | | | | | | |
| | | | | | | | | | January 31, 2023 |
| | | | | | | | | | | Level 1 | | Level 2 | | Level 3 | | Total |
| Cash equivalents (1): | | | | | | | | | | | | | | | |
| Money market funds | | | | | | | | | $ | 737 | | | $ | — | | | $ | — | | | $ | 737 | |
| | | | | | | | | | | | | | | | |
| Commercial paper | | | | | | | | | — | | | 169 | | | — | | | 169 |
| Certificates of deposit | | | | | | | | | — | | | 35 | | | — | | | 35 |
| U.S. government securities | | | | | | | | | — | | | 13 | | | — | | | 13 |
| | | | | | | | | | | | | | | | |
| | | | | | | | | | | | | | | | |
| | | | | | | | | | | | | | | | |
| | | | | | | | | | | | | | | | |
| Other (2) | | | | | | | | | 4 | | | 8 | | | — | | | 12 |
| Marketable securities: | | | | | | | | | | | | | | | |
| Short-term | | | | | | | | | | | | | | | |
| | | | | | | | | | | | | | | | | |
| | Corporate debt securities | | | | | | | | | — | | | 44 | | | — | | | 44 |
| | Commercial paper | | | | | | | | | — | | | 42 | | | — | | | 42 |
| | Asset backed securities | | | | | | | | | — | | | 19 | | | — | | | 19 |
| | | | | | | | | | | | | | | | | |
| | U.S. government securities | | | | | | | | | — | | | 17 | | | — | | | 17 |
| | | | | | | | | | | | | | | | | |
| | | | | | | | | | | | | | | | | |
| | Other (3) | | | | | | | | | — | | | 3 | | | — | | | 3 |
| | | | | | | | | | | | | | | | |
| | | | | | | | | | | | | | | | | |
| Long-term | | | | | | | | | | | | | | | |
| | | | | | | | | | | | | | | | | |
| | Corporate debt securities | | | | | | | | | — | | | 45 | | | — | | | 45 |
| | U.S. government securities | | | | | | | | | — | | | 35 | | | — | | | 35 |
| | Asset backed securities | | | | | | | | | — | | | 13 | | | — | | | 13 |
| | | | | | | | | | | | | | | | | |
| | Other (4) | | | | | | | | | — | | | 9 | | | — | | | 9 |
| | | | | | | | | | | | | | | |
| Long-term other assets: | | | | | | | | | | | | | | | |
| | Mutual Funds (5) (6) | | | | | | | | | 86 | | | — | | | — | | | 86 |
| | Convertible debt securities (6) | | | | | | | | | — | | | — | | | 2 | | | 2 |
| Derivative assets | | | | | | | | | | | | | | | |
| | Derivative contract assets (6) | | | | | | | | | — | | | 14 | | | — | | | 14 |
| Derivative liabilities | | | | | | | | | | | | | | | |
| | Derivative contract liabilities (7) | | | | | | | | | — | | | (31) | | | — | | | (31) | |
| Total | | | | | | | | | $ | 827 | | | $ | 435 | | | $ | 2 | | | $ | 1,264 | |
____________________
(1)Included in “Cash and cash equivalents” in the accompanying Consolidated Balance Sheets. These investments are classified as debt securities.
(2)Consists of custody cash deposits, agency discount notes, municipal bonds, corporate debt securities, asset-backed securities, and mortgage-backed securities.
(3)Consists of mortgage-backed securities, agency mortgage-backed securities, common stock, and agency collateralized mortgage obligations.
(4)Consists of agency mortgage-backed securities, agency bonds, agency collateralized mortgage obligations, mortgage-backed securities, and collateralized mortgage obligations.
(5)See Note 7, "Deferred Compensation" for more information.
(6)Included in “Prepaid expenses and other current assets” or “Long-term other assets” in the accompanying Consolidated Balance Sheets.
(7)Included in “Other accrued liabilities” in the accompanying Consolidated Balance Sheets.
4. Equity Compensation
Stock Plans
The 2022 Equity Incentive Plan (the “2022 Plan”) was approved by Autodesk’s stockholders and became effective on June 16, 2022. The 2022 Plan replaced the 2012 Employee Stock Plan, as amended, and the 2012 Outside Directors’ Stock Plan, as amended (collectively, the “Prior Plans”), and no further equity awards may be granted under the Prior Plans. The 2022 Plan reserves up to 23 million shares. The 2022 Plan permits the grant of stock options, restricted stock units, and restricted stock awards to employees and non-employee members of the Board of Directors. Each restricted stock unit or restricted stock award granted will be counted against the shares authorized for issuance under the 2022 Plan as 2.08 shares. If a granted option, restricted stock unit, or restricted stock award expires or becomes unexercisable for any reason, the unpurchased or forfeited shares that were granted may be returned to the 2022 Plan and may become available for future grant under the 2022 Plan. As of January 31, 2024, 9 million shares subject to restricted stock units and restricted stock awards have been granted under the 2022 Plan. Restricted stock units that were granted under the 2022 Plan vest over one to three years from the date of grant. The 2022 Plan will expire on March 17, 2032. At January 31, 2024, approximately 14 million shares were available for future issuance under the 2022 Plan.
The following sections summarize activity under Autodesk’s stock plans.
Restricted Stock Units:
A summary of restricted stock activity for the fiscal year ended January 31, 2024, was as follows:
| | | | | | | | | | | |
| Unreleased Restricted Stock Units (in thousands) | | Weighted average grant date fair value per share |
Unvested restricted stock at January 31, 2023 | 4,848 | | | $ | 216.20 | |
| Granted | 3,687 | | | 200.53 | |
| Vested | (2,805) | | | 219.71 | |
| Canceled/Forfeited | (348) | | | 210.05 | |
Performance Adjustment (1) | (11) | | | 189.41 | |
Unvested restricted stock at January 31, 2024 | 5,371 | | | $ | 203.87 | |
_______________
(1)Based on Autodesk’s financial results and relative total stockholder return for the fiscal 2023 performance period. The performance stock units were attained at rates ranging from 86% to 110% of the target award.
For the restricted stock granted during fiscal years ended January 31, 2024, 2023, and 2022, the weighted average grant date fair values were $200.53, $198.89, and $288.13, respectively. The fair value of the shares vested during fiscal years ended January 31, 2024, 2023, and 2022 were $580 million, $490 million, and $620 million, respectively.
During the fiscal year ended January 31, 2024, Autodesk granted 3 million restricted stock units. Restricted stock units vest over periods ranging from immediately upon grant to a pre-determined date that is typically within three years from the date of grant. Restricted stock units are not considered outstanding stock at the time of grant, as the holders of these units are not entitled to any of the rights of a stockholder, including voting rights. The fair value of the restricted stock units is expensed ratably over the vesting period.
During the fiscal years ended January 31, 2024 and 2023, Autodesk settled liability-classified awards of $15 million and $11 million, respectively. As these awards were settled in a fixed dollar amount of shares, the awards were accounted for as a liability-classified award and were expensed using the straight-line method over the vesting period.
Autodesk recorded stock-based compensation expense related to restricted stock units of $580 million, $510 million, and $425 million during fiscal years ended January 31, 2024, 2023, and 2022, respectively. As of January 31, 2024, total compensation cost not yet recognized of $742 million related to unvested awards is expected to be recognized over a weighted average period of 1.81 years. At January 31, 2024, the number of restricted stock units granted but unvested was 5 million.
During the fiscal year ended January 31, 2024, Autodesk granted 311 thousand performance stock units for which the ultimate number of shares earned is determined based on the achievement of performance criteria at the end of the stated service and performance period. The performance criteria for the performance stock units are primarily based on revenue and free cash flow goals adopted by the Compensation and Human Resource Committee and total stockholder return compared against companies in the S&P North American Technology Software Index with a market capitalization over $2.0 billion (“Relative TSR”). The fair value of the performance stock units is expensed using the accelerated attribution method over the three-year vesting period and have the following vesting schedule:
•Up to one third of the performance stock units may vest following year one, depending upon the achievement of the performance criteria for fiscal 2024 as well as one-year Relative TSR (covering year one).
•Up to one third of the performance stock units may vest following year two, depending upon the achievement of the performance criteria for year two as well as two-year Relative TSR (covering years one and two).
•Up to one third of the performance stock units may vest following year three, depending upon the achievement of the performance criteria for year three as well as three-year Relative TSR (covering years one, two and three).
The performance criteria for the performance stock units vested during fiscal year ended January 31, 2024, was based on revenue and free cash flow goals adopted by the Compensation and Human Resource Committee.
Performance stock units are not considered outstanding stock at the time of grant, as the holders of these units are not entitled to any of the rights of a stockholder, including voting rights. The fair value of the performance stock units is expensed using the accelerated attribution over the vesting period.
Autodesk recorded stock-based compensation expense related to performance stock units of $42 million, $54 million, and $68 million during fiscal years ended January 31, 2024, 2023, and 2022, respectively. As of January 31, 2024, total compensation cost not yet recognized of $6 million related to unvested performance stock units, is expected to be recognized over a weighted average period of 0.92 years. At January 31, 2024, the number of performance stock units granted but unvested was 478 thousand.
Common Stock
Autodesk recorded stock-based compensation expense related to common stock shares of $19 million, $32 million, and $17 million during the fiscal years ended January 31, 2024, 2023, and 2022, respectively.
1998 Employee Qualified Stock Purchase Plan (“ESPP”)
Under Autodesk’s ESPP, which was approved by stockholders in 1998, eligible employees may purchase shares of Autodesk’s common stock at their discretion using up to 15% of their eligible compensation, subject to certain limitations, at 85% of the lower of Autodesk's closing price (fair market value) on the offering date or the exercise date. The offering period for ESPP awards consists of four six-month exercise periods within a 24-month offering period.
At January 31, 2024, a total of 4 million shares were available for future issuance. Under the ESPP, the Company issues shares on the first trading day following March 31 and September 30 of each fiscal year. The ESPP does not have an expiration date.
A summary of the ESPP activity for the fiscal years ended January 31, 2024, 2023, and 2022 was as follows:
| | | | | | | | | | | | | | | | | | | | |
| | Fiscal year ended January 31, |
| | 2024 | | 2023 | | 2022 |
| Issued shares (in thousands) | | 791 | | | 740 | | | 851 | |
| Average price of issued shares | | $ | 163.91 | | | $ | 166.44 | | | $ | 130.13 | |
| Weighted average grant date fair value of awards granted under the ESPP | | $ | 68.70 | | | $ | 67.77 | | | $ | 84.21 | |
Autodesk recorded $63 million, $62 million, and $37 million of compensation expense associated with the ESPP in fiscal 2024, 2023, and 2022, respectively.
Equity Compensation Plan Information
The following table summarizes the number of outstanding options and awards granted to employees and directors, as well as the number of securities remaining available for future issuance under these plans as of January 31, 2024:
| | | | | | | | | | | | | | | | | |
| (a) | | (b) | | (c) |
| Plan category | Number of securities to be issued upon exercise or vesting of outstanding options and awards (in millions) | | Weighted-average exercise price of outstanding options | | Number of securities remaining available for future issuance under equity compensation plans (excluding securities reflected in column (a)) (in millions) (1) |
| Equity compensation plans approved by security holders | 5 | | | $ | 21.39 | | | 18 | |
| Total | 5 | | | $ | 21.39 | | | 18 | |
____________________
(1)Included in this amount are 4 million securities available for future issuance under Autodesk’s ESPP.
5. Income Taxes
The provision for income taxes consists of the following:
| | | | | | | | | | | | | | | | | |
| | Fiscal year ended January 31, |
| 2024 | | 2023 | | 2022 |
| Federal: | | | | | |
| Current | $ | 86 | | | $ | 219 | | | $ | (1) | |
| Deferred | (97) | | | (222) | | | (5) | |
| State: | | | | | |
| Current | 21 | | | 28 | | | 2 | |
| Deferred | 3 | | | (19) | | | 1 | |
| Foreign: | | | | | |
| Current | 206 | | | 151 | | | 83 | |
| Deferred | 11 | | | (34) | | | (12) | |
| Income tax provision | $ | 230 | | | $ | 123 | | | $ | 68 | |
Foreign pretax income was $730 million in fiscal 2024, $755 million in fiscal 2023, and $560 million in fiscal 2022.
The differences between the U.S. statutory rate and the aggregate income tax provision are as follows:
| | | | | | | | | | | | | | | | | |
| | Fiscal year ended January 31, |
| 2024 | | 2023 | | 2022 |
| Income tax provision at U.S. Federal statutory rate | $ | 239 | | | $ | 199 | | | $ | 119 | |
| State income tax benefit, net of the U.S. Federal benefit | 24 | | | (3) | | | 2 | |
| Foreign income taxed at rates different from the U.S. statutory rate | (12) | | | 22 | | | (25) | |
| Valuation allowance adjustment | 1 | | | (38) | | | — | |
| Tax effect of non-deductible stock-based compensation | 38 | | | 34 | | | 32 | |
| Stock compensation (windfall) / shortfall | 2 | | | 10 | | | (43) | |
| Research and development tax credit benefit | (17) | | | (12) | | | (19) | |
| Closure of income tax audits and changes in uncertain tax positions | 13 | | | 11 | | | — | |
Tax effect of officer compensation in excess of $1 million | 8 | | | 10 | | | 7 | |
| Non-deductible expenses | 2 | | | 1 | | | 5 | |
| Global intangible low-taxed income, foreign derived intangible income | (39) | | | (106) | | | 24 | |
| India withholding tax refund | — | | | — | | | (44) | |
| Acquisition-related integrations | (29) | | | (2) | | | 9 | |
| Other | — | | | (3) | | | 1 | |
| Income tax provision | $ | 230 | | | $ | 123 | | | $ | 68 | |
Autodesk’s fiscal 2024 tax expense is primarily driven by the U.S. and foreign tax expense, including withholding taxes on payments made to the United States or to Singapore from foreign sources, an increase in tax expense relating to stock-based compensation, reduced by non-recurring integration net tax benefit and an income tax benefit arising from relief provided by the Internal Revenue Service relating to U.S. foreign tax credit regulations.
Significant components of Autodesk’s deferred tax assets and liabilities are as follows:
| | | | | | | | | | | |
| | January 31, |
| 2024 | | 2023 |
| Stock-based compensation | $ | 53 | | | $ | 54 | |
| Research and development tax credit carryforwards | 118 | | | 103 | |
| Foreign tax credit carryforwards | 4 | | | — | |
| Accrued compensation and benefits | 11 | | | 7 | |
| Other accruals not currently deductible for tax | 15 | | | 26 | |
| Capitalized research and development | 514 | | | 340 | |
| Fixed assets | 21 | | | 22 | |
| Lease liability | 80 | | | 92 | |
| Tax loss carryforwards | 10 | | | 38 | |
| Deferred revenue | 538 | | | 653 | |
| Purchased technology | 33 | | | (26) | |
| Other | 31 | | | 23 | |
| Total deferred tax assets | 1,428 | | | 1,332 | |
| Less: valuation allowance | (149) | | | (148) | |
| Net deferred tax assets | 1,279 | | | 1,184 | |
| Indefinite lived intangibles | (128) | | | (109) | |
| Right-of-use assets | (52) | | | (58) | |
| Unremitted earnings of foreign subsidiaries | — | | | (2) | |
| Deferred taxes on foreign earnings | (29) | | | (33) | |
| Total deferred tax liabilities | (209) | | | (202) | |
| Net deferred tax assets | $ | 1,070 | | | $ | 982 | |
Autodesk regularly assesses the need for a valuation allowance against its deferred tax assets. In making that assessment, Autodesk evaluates whether it is more likely than not that some or all of the deferred tax assets will not be realized based on all available positive and negative evidence.
The Company continues to retain a valuation allowance against Portugal, New Zealand, California, Massachusetts and Michigan deferred tax assets and deferred tax assets that will convert into a capital loss upon reversal in Australia and U.S., as we do not have sufficient income of the appropriate character to benefit these deferred tax assets. We released our Canada valuation allowance in fiscal 2023 due to positive evidence supporting the utilization of the R&D credits before they expire, resulting in a $38 million non-cash benefit to earnings. The Company established a valuation allowance in Massachusetts in fiscal 2024 on the basis that it is more likely than not that some or all of the deferred tax assets will not be realized. The impact of this establishment was offset by a decrease in the valuation allowance in the Netherlands due to the elimination of the deferred tax assets in that jurisdiction in fiscal 2024.
The valuation allowance decreased by $1 million in fiscal 2024, primarily due to utilization of deferred tax attributes. The valuation allowance decreased by $40 million in fiscal 2023, primarily due to the release of the Canada valuation allowance of $38 million.
The company has elected to recognize any potential GILTI obligations as an expense in the period it is incurred.
As of January 31, 2024, Autodesk had $6 million of cumulative U.S. federal tax loss carryforwards and $283 million of cumulative U.S. state tax loss carryforwards, which may be available to reduce future income tax liabilities in federal and state jurisdictions. The pre-fiscal 2019 U.S. federal tax loss carryforward will expire beginning fiscal 2035 through fiscal 2039. U.S. federal losses generated beginning in fiscal 2019 do not expire and are carried forward indefinitely. The U.S. state tax loss carryforward will expire beginning fiscal 2025 through fiscal 2044. In addition to U.S. federal and state tax loss carryforwards, Portugal, Norway, New Zealand and other foreign jurisdictions incurred tax losses totaling $14 million, which may be available to reduce future income tax liabilities. Our Portugal, Norway, and New Zealand losses of $8 million, $3 million, and $2 million,
respectively, have an indefinite expiration period. Portugal and New Zealand losses have a full valuation allowance against them on our balance sheet as the Company has determined it is more likely than not that these losses will not be utilized.
As of January 31, 2024, Autodesk had $123 million of cumulative California state research tax credit carryforwards, $15 million of cumulative Massachusetts state research tax credit carryforwards, and $43 million of cumulative Canadian federal research, which may be available to reduce future income tax liabilities in the respective jurisdictions. The state research tax credit carryforwards in California and Massachusetts may reduce future California and Massachusetts income tax liabilities indefinitely in those respective states, and the Canadian research tax credit carryforwards will expire beginning fiscal 2031 through fiscal 2044. Autodesk also has $4 million of cumulative U.S. federal foreign tax credit carryforwards, which may be available to reduce future U.S. tax liabilities. These foreign tax credits will expire beginning fiscal 2027 through fiscal 2034. As discussed above, the California and Massachusetts cumulative assets have full valuation allowance against them on our balance sheet as the Company has determined it is more likely than not that these losses and credits will not be utilized.
Utilization of net operating losses and tax credits may be subject to an annual limitation due to ownership change limitations provided in the Internal Revenue Code and similar state provisions. This annual limitation may result in the expiration of net operating losses and credits before utilization. No ownership change has occurred through the balance sheet date that would result in permanent losses of the U.S. federal and state tax attributes.
As of January 31, 2024, the Company had $261 million of gross unrecognized tax benefits, of which $43 million would reduce our valuation allowance, if recognized. The remaining $218 million would impact the effective tax rate. The amount of unrecognized tax benefits will decrease in the next twelve months for statute lapse is nil.
A reconciliation of the beginning and ending amount of the gross unrecognized tax benefits is as follows:
| | | | | | | | | | | | | | | | | |
| Fiscal Year Ended January 31, |
| 2024 | | 2023 | | 2022 |
| Gross unrecognized tax benefits at the beginning of the fiscal year (1) | $ | 238 | | | $ | 217 | | | $ | 198 | |
| Increases for tax positions of prior years (1) | 23 | | | 9 | | | 9 | |
| Decreases for tax positions of prior years (1) | (11) | | | (3) | | | — | |
| Increases for tax positions related to the current year (1) | 13 | | | 21 | | | 10 | |
| Decreases relating to settlements with taxing authorities | — | | | (5) | | | — | |
| Reductions as a result of lapse of the statute of limitations | (2) | | | (1) | | | — | |
| Gross unrecognized tax benefits at the end of the fiscal year | $ | 261 | | | $ | 238 | | | $ | 217 | |
_______________
(1)During the year ended January 31, 2024, the Company corrected its presentation to remove correlative benefits related to certain transfer pricing matters. The above comparatives for fiscal 2023 and 2022 have been corrected to conform to the current period presentation. The effect of the change on the ending gross unrecognized tax benefits was $15 million in fiscal 2023 and $10 million in fiscal 2022.
It is the Company’s continuing practice to recognize interest and/or penalties related to income tax matters in income tax expense. Autodesk had $7 million, $5 million, and $7 million, net of tax benefit, accrued for interest and penalties related to unrecognized tax benefits as of January 31, 2024, 2023, and 2022, respectively. There was $2 million, $(2) million, and $2 million of net expense for interest and penalties related to tax matters recorded through the consolidated statements of operations for the years ended January 31, 2024, 2023, and 2022, respectively.
Autodesk’s U.S. and state income tax returns for fiscal 2002 through fiscal 2024 remain open to examination due to either net operating loss or credit carryforward. The Internal Revenue Service notified the Company of examination of the Company’s consolidated federal income tax returns for fiscal 2020 and 2021. This audit commenced in February 2022 and remains in progress.
Autodesk files tax returns in multiple foreign taxing jurisdictions with open tax years ranging from fiscal 2005 to 2024.
6. Acquisitions
Fiscal 2024 Acquisitions
The results of operations for the following acquisitions are included in the accompanying Consolidated Statements of Operations since their respective acquisition dates. Pro forma results of operations have not been presented because the effects of these acquisitions were not material to Autodesk’s Consolidated Financial Statements.
During the fiscal year ended January 31, 2024, Autodesk completed three business combinations. The acquisition-date fair value of the consideration transferred totaled $85 million in cash. Of the total consideration transferred, $71 million is considered purchase consideration.
Purchase Price Allocation
The acquisitions during fiscal 2024 were accounted for as business combinations, and Autodesk recorded the tangible and intangible assets acquired and liabilities assumed based on their estimated fair values at the date of each respective acquisition. The fair values assigned to the identifiable intangible assets acquired were based on estimates and assumptions determined by management. Autodesk recorded the excess of consideration transferred over the aggregate fair values as goodwill. The goodwill recorded was primarily attributable to synergies expected to arise after the acquisition. Goodwill of $35 million is deductible for U.S. income tax purposes. The transaction costs related to the acquisitions were not material.
The following table summarizes the fair value of the assets acquired and liabilities assumed by major class for the business combinations that were completed during the fiscal year ended January 31, 2024: | | | | | | | | |
| | Aggregated Total |
| Developed technologies | | $ | 51 | |
| Customer relationships | | 3 | |
| | |
| | |
| | |
| | |
| Goodwill | | 25 | |
| Deferred revenue and long-term deferred revenue | | (7) | |
| Long-term deferred income taxes | | (4) | |
| Net tangible assets | | 3 | |
| Total | | $ | 71 | |
For the business combinations, the allocation of purchase price consideration to certain assets and liabilities as well as the final amount of purchase consideration are not yet finalized. For the items not yet finalized, Autodesk's estimates and assumptions are subject to change within the measurement period (up to one year from the acquisition date). The primary areas of the preliminary purchase price allocation that are not yet finalized are amounts for tax assets and liabilities and residual goodwill.
Fiscal 2023 Acquisitions
During the fiscal year ended January 31, 2023, Autodesk completed two business combinations. The acquisition-date fair value of the consideration transferred totaled $114 million, which consisted of $96 million of cash, 40 thousand shares of Autodesk’s restricted common stock at an aggregate fair value of $10 million, and Autodesk issued a fixed amount of $5 million in common stock at future dates to certain employees. Of the total consideration transferred, $97 million was considered purchase consideration. Of the remaining amount, $10 million was recorded in “Prepaid expenses and other current assets” and “Long-term other assets” on our Consolidated Balance Sheets and will be amortized to stock-based compensation expense using the straight-line method over the vesting period, $5 million was accounted for as liability-classified awards and will be recognized as compensation expense using the straight-line method over the vesting period and $2 million was recorded as stock-based compensation expense on the date of acquisition. The 40 thousand shares of restricted common stock are subject to forfeiture until the second anniversary of the acquisition closing date. The shares are released on the first and second anniversaries, 40% and 60%, respectively, subject to continued employment. Issuance of the $5 million fixed value in common stock depends on the respective employees’ continued employment and vests 40% and 60% on the first and second anniversaries of the closing date, respectively.
The results of operations for fiscal 2023 acquisitions were included in the accompanying Consolidated Statement of Operations from the dates of the respective acquisitions. No goodwill is deductible for U.S. income tax purposes.
Fiscal 2022 Acquisitions
Upchain
On May 11, 2021, Autodesk acquired 100% of the outstanding stock of Upchain Inc. (“Upchain”), a cloud-based provider of product lifecycle management and product data management systems, for approximately $127 million in cash and Autodesk issued a fixed amount of $13 million in common stock on the first and second anniversaries of the closing date to certain employees in connection with the acquisition for a total consideration of $140 million. Of the total consideration transferred, $124 million was considered purchase consideration. Of the remaining amount, $13 million was accounted for as liability-classified awards and recognized as compensation expense using the straight-line method over the vesting period, and $3 million was recorded as stock-based compensation expense during the fiscal year ended January 31, 2022.
Autodesk integrated Upchain’s unified cloud platform in Autodesk solutions to centralize data management and process management.
Innovyze
On March 31, 2021, Autodesk acquired all of the outstanding stock of Storm UK Holdco Limited, the parent of Innovyze, Inc. (“Innovyze”), a global leader in water infrastructure software. Innovyze provides comprehensive water modeling solutions that augment Autodesk’s BIM offerings in civil engineering, and extends Autodesk’s presence into operations and maintenance of water infrastructure assets.
The acquisition-date fair value of the consideration transferred totaled $1,038 million, which consisted of $1,035 million of cash and 9 thousand shares of Autodesk’s restricted common stock at an aggregate fair value of $3 million. Of the total consideration transferred, $1,035 million was considered purchase consideration. The remaining amount of $3 million was recorded in “Prepaid expenses and other current assets” and “Long-term other assets”.
Other Acquisitions
During the fiscal year ended January 31, 2022, Autodesk completed four additional business combinations. The acquisition-date fair value of the consideration transferred totaled $113 million, which consisted of $99 million of cash, a fixed amount of $11 million in common stock to be issued at future dates to certain employees in connection with the acquisition, and 13 thousand shares of Autodesk’s restricted common stock at an aggregate fair value of $3 million. Of the total consideration transferred, $99 million was considered purchase consideration. The remaining amounts of $3 million was recorded in “Prepaid expenses and other current assets” and “Long-term other assets” and $11 million is accounted for as liability-classified awards and recognized as compensation expense using the straight-line method over the vesting period. Issuance of the common stock was dependent on the respective employees’ continued employment through the vesting period.
The results of operations for Upchain, Innovyze, and the other acquisitions were included in the accompanying Consolidated Statement of Operations from the dates of the respective acquisitions. Goodwill of $100 million, $246 million, and $81 million is deductible for U.S. income tax purposes for Upchain, Innovyze, and the other acquisitions, respectively.
7. Deferred Compensation
At January 31, 2024, Autodesk had investments in debt and equity securities that are held in a rabbi trust under non-qualified deferred compensation plans and a corresponding deferred compensation liability totaling $100 million. Of this amount, $10 million was classified as current and $90 million was classified as non-current in the Consolidated Balance Sheet. Of the $86 million related to investments and deferred compensation liability in a rabbi trust as of January 31, 2023, $7 million was classified as current and $79 million was classified as non-current. The current and non-current asset portions of the investments in debt and equity securities that are held in a rabbi trust under non-qualified deferred compensation plans are recorded in the Consolidated Balance Sheets under “Prepaid expenses and other current assets” and “Long-term other assets,” respectively. The current and non-current portions of the deferred compensation liability are recorded in the Consolidated Balance Sheets under “Accrued compensation” and “Long-term other liabilities,” respectively.
Costs to obtain a contract with a customer
Sales commissions earned by our internal sales personnel and our solution providers are considered incremental and recoverable costs of obtaining a contract with a customer. The ending balance of assets recognized from costs to obtain a contract with a customer was $210 million and $133 million as of January 31, 2024 and January 31, 2023, respectively. These assets are recorded in “Prepaid expenses and other current assets” and “Long-term other assets” in the Consolidated Balance Sheet. Amortization expense related to assets recognized from costs to obtain a contract with a customer was $140 million, $138 million, and $118 million during fiscal years ended January 31, 2024, 2023, and 2022, respectively. Autodesk did not recognize any contract cost impairment losses during the fiscal years ended January 31, 2024, 2023, or 2022.
8. Borrowing Arrangements
In November 2022, the Company entered into an Amended and Restated Credit Agreement, (the “Credit Agreement”) by and among the Company, the lenders party thereto and Citibank, N.A. (“Citibank”), as administrative agent, which provides for an unsecured revolving loan facility in the aggregate principal amount of $1.5 billion, with an option to be increased up to $2.0 billion. The revolving credit facility is available for working capital or other business needs. The Credit Agreement contains customary covenants that could, among other things, restrict the imposition of liens on Autodesk’s assets, and restrict Autodesk’s ability to incur additional indebtedness or make dispositions of assets if Autodesk fails to maintain compliance with the financial covenants. The Credit Agreement requires the Company to maintain a maximum leverage ratio of Consolidated Covenant Debt to Consolidated EBITDA (each as defined in the Credit Agreement) no greater than 3.50:1.00 during the term of the credit facility, subject to adjustment following the consummation of certain acquisitions up to 4.00:1.00 for up to four consecutive fiscal quarters. Per the Credit Agreement, Autodesk is required to issue annual audited consolidated financial statements within 90 days after the end of Autodesk’s fiscal year. On April 26, 2024, Autodesk obtained lender consent to extend the period to provide annual audited consolidated financial statements to June 14, 2024. At January 31, 2024, Autodesk was in compliance with all other Credit Agreement covenants. Revolving loans under the Credit Agreement will bear interest, at the Company’s option, at either (i) a per annum rate equal to the Base Rate (as defined in the Credit Agreement) plus a margin of between 0.000% and 0.375%, depending on the Company’s Public Debt Rating (as defined in the Credit Agreement), or (ii) a per annum rate equal to the rate at which dollar deposits are offered in the Secured Overnight Financing Rate, plus a margin of between 0.785% and 1.375%, depending on Company’s Public Debt Rating. The interest rates for the revolving credit facility are subject to upward or downward adjustments, on an annual basis, if the Company achieves, or fails to achieve, certain sustainability-linked targets based on two key performance indicator metrics: (i) the amount of scope 1 and 2 greenhouse gas emissions from the global operations of the Company and its subsidiaries during a fiscal year less qualified emissions reduction instruments and (ii) the percentage of employees of the Company and its subsidiaries identifying as female working in technical roles. The maturity date on the Credit Agreement is September 30, 2026. At January 31, 2024, Autodesk had no outstanding borrowings under the Credit Agreement.
In October 2021, Autodesk issued $1.0 billion aggregate principal amount of 2.4% notes due December 15, 2031 (“2021 Notes”). Net of a discount of $3 million and issuance costs of $9 million, Autodesk received net proceeds of $988 million from issuance of the 2021 Notes. Both the discount and issuance costs are being amortized to interest expense over the term of the 2021 Notes using the effective interest method. The 2021 Notes were designated as sustainability bonds, the net proceeds of which are used to fund environmentally and socially responsible projects in the following areas: eco-efficient products, production technologies, and processes, sustainable water and wastewater management, renewable energy & energy efficiency, green buildings, pollution prevention and control, and socioeconomic advancement and empowerment.
In January 2020, Autodesk issued $500 million aggregate principal amount of 2.85% notes due January 15, 2030 (“2020 Notes”). Net of a discount of $1 million and issuance costs of $5 million, Autodesk received net proceeds of $494 million from issuance of the 2020 Notes. Both the discount and issuance costs are being amortized to interest expense over the term of the 2020 Notes using the effective interest method. The proceeds of the 2020 Notes were used for the repayment of $450 million of debt due June 15, 2020, and the remainder is available for general corporate purposes.
In June 2017, Autodesk issued $500 million aggregate principal amount of 3.5% notes due June 15, 2027 (the “2017 Notes”). Net of a discount of $3 million and issuance costs of $5 million, Autodesk received net proceeds of $492 million from issuance of the 2017 Notes. Both the discount and issuance costs are being amortized to interest expense over the term of the 2017 Notes using the effective interest method. The proceeds of the 2017 Notes have been used for the repayment of $400 million of debt due December 15, 2017, and the remainder is available for general corporate purposes.
In June 2015, Autodesk issued $300 million aggregate principal amount of 4.375% notes due June 15, 2025 (“ 2015 Notes”). Net of a discount of $1 million, and issuance costs of $3 million, Autodesk received net proceeds of $296 million from issuance of the 2015 Notes. Both the discount and issuance costs are being amortized to interest expense over the respective terms of the 2015 Notes using the effective interest method. The proceeds of the 2015 Notes are available for general corporate purposes.
The 2021 Notes, 2020 Notes, 2017 Notes, and the 2015 Notes may all be redeemed at any time, subject to a make whole premium. In addition, upon the occurrence of certain change of control triggering events, Autodesk may be required to repurchase all the Notes, at a price equal to 101% of their principal amount, plus accrued and unpaid interest to the date of repurchase. All Notes contain restrictive covenants that limit Autodesk’s ability to create certain liens, to enter into certain sale and leaseback transactions and to consolidate or merge with, or convey, transfer, or lease all or substantially all of its assets, subject to important qualifications and exceptions.
Based on the quoted market prices, the approximate fair value of the notes as of January 31, 2024, were as follows:
| | | | | | | | | | | |
| Aggregate Principal Amount | | Fair value |
| 2015 Notes | $ | 300 | | | $ | 298 | |
| 2017 Notes | 500 | | | 484 | |
| 2020 Notes | 500 | | | 450 | |
| 2021 Notes | 1,000 | | | 846 | |
The expected future principal payments for all borrowings as of January 31, 2024, were as follows:
| | | | | | | | | | | |
| Fiscal year ending | | | | | |
| 2025 | $ | — | | | | | | | |
| 2026 | 300 | | | | | | | |
| 2027 | — | | | | | | | |
| 2028 | 500 | | | | | | | |
| 2029 | — | | | | | | | |
| Thereafter | 1,500 | | | | | | | |
| Total principal outstanding | $ | 2,300 | | | | | | | |
9. Leases
Autodesk has operating leases for real estate, vehicles and certain equipment. Leases have remaining lease terms of less than 1 year to 66 years, some of which include options to extend the lease with renewal terms from 1 year to 9 years and some of which include options to terminate the leases from less than 1 year to 6 years. Options to extend the lease are included in the lease liability if they are reasonably certain of being exercised. Options to terminate are considered in determining the lease liability if they are reasonably certain of being exercised. Payments under our lease arrangements are primarily fixed, however, certain lease agreements contain variable payments, which are expensed as incurred and not included in the operating lease assets and liabilities. These amounts include payments affected by the Consumer Price Index, payments for common area maintenance that are subject to annual reconciliation, and payments for maintenance and utilities. The Company’s leases do not contain residual value guarantees or material restrictive covenants. Short-term leases are recognized in the Consolidated Statement of Operations on a straight-line basis over the lease term. Short-term lease expense was not material for the periods presented. Changes in operating lease right-of-use assets and operating lease liabilities are presented net in the “accounts payable and other liabilities” line in the Consolidated Statements of Cash Flows with the exception of “Lease-related asset impairments” which is presented in “Adjustments to reconcile net income to net cash provided by operating activities”.
During the fiscal years ended January 31, 2024, 2023, and 2022, Autodesk recorded total operating lease right-of-use assets impairment charges of $9 million, $29 million, and $75 million respectively. Autodesk assessed the asset groupings for disaggregation based on the proposed changes in use of the facilities. For asset groups where impairment was triggered, Autodesk utilized an income approach to value the asset groups by developing discounted cash flow models. The significant assumptions used in the discounted cash flow models for each of the asset groups included projected sublease income over the remaining lease terms, expected downtime prior to the commencement of future subleases, expected lease incentives offered to
future tenants, and discount rates that reflected the level of risk associated with these future cash flows. These significant assumptions are considered Level 1 and Level 2 inputs in accordance with the fair value hierarchy described in Note 1, “Business and Summary of Significant Accounting Policies.” The operating lease right-of-use assets and other lease-related assets charges are included in “general and administrative” in the Company’s Consolidated Statements of Operations.
The components of lease cost were as follows:
| | | | | | | | | | | | | | | | | | | | |
| Fiscal Year Ended January 31, 2024 |
| Cost of subscription and maintenance revenue | Cost of other revenue | Marketing and sales | Research and development | General and administrative | Total |
| Operating lease cost | $ | 7 | | $ | 2 | | $ | 28 | | $ | 23 | | $ | 11 | | $ | 71 | |
| Variable lease cost | 1 | | 1 | | 6 | | 5 | | 3 | | 16 | |
| | | | | | | | | | | | | | | | | | | | |
| Fiscal Year Ended January 31, 2023 |
| Cost of subscription and maintenance revenue | Cost of other revenue | Marketing and sales | Research and development | General and administrative | Total |
| Operating lease cost | $ | 8 | | $ | 3 | | $ | 36 | | $ | 27 | | $ | 11 | | $ | 85 | |
| Variable lease cost | 1 | | — | | 6 | | 5 | | 2 | | 14 | |
| | | | | | | | | | | | | | | | | | | | |
| Fiscal Year Ended January 31, 2022 |
| Cost of subscription and maintenance revenue | Cost of other revenue | Marketing and sales | Research and development | General and administrative | Total |
| Operating lease cost | $ | 8 | | $ | 2 | | $ | 43 | | $ | 30 | | $ | 15 | | $ | 98 | |
| Variable lease cost | 1 | | — | | 5 | | 4 | | 2 | | 12 | |
Supplemental operating cash flow information related to leases was as follows:
| | | | | | | | | | | | | | | | | |
| Fiscal Year Ended January 31, 2024 | | Fiscal Year Ended January 31, 2023 | | Fiscal Year Ended January 31, 2022 |
| | | | | |
| Cash paid for operating leases included in operating cash flows (1) | $ | 112 | | | $ | 115 | | | $ | 107 | |
| Non-cash operating lease liabilities arising from obtaining operating right-of-use assets | 48 | | | 48 | | | 53 | |
_______________
(1) Includes $16 million, $14 million, and $12 million in variable lease payments not included in “Operating lease liabilities” and “Long-term operating lease liabilities” on the Consolidated Balance Sheet for fiscal years ended January 31, 2024, 2023, and 2022, respectively.
The weighted average remaining lease term for operating leases is 6.2 years and 6.5 years at January 31, 2024 and 2023, respectively. The weighted average discount rate was 2.86% and 2.60% at January 31, 2024 and 2023, respectively,
Maturities of operating lease liabilities were as follows:
| | | | | |
| Fiscal year ending | |
| 2025 | $ | 76 | |
| 2026 | 77 | |
| 2027 | 55 | |
| 2028 | 48 | |
| 2029 | 40 | |
| Thereafter | 77 | |
| 373 | |
| Less imputed interest | 31 | |
| Present value of operating lease liabilities | $ | 342 | |
Autodesk has subleased certain office space to a third party and has classified the sublease as an operating lease. The sublease has a remaining lease term of 8.1 years. Sublease income was $8 million and $5 million during the fiscal years ended January 31, 2024 and 2023, respectively. There was no sublease income recognized during the fiscal year ended January 31, 2022. Sublease income is recorded as a reduction of lease expense in the Company’s Consolidated Statements of Operations.
Operating lease amounts in the table above do not include sublease income payments of $71 million. Autodesk expects to receive sublease income payments of approximately $42 million for fiscal 2025 through fiscal 2029 and $29 million thereafter.
As of January 31, 2024, operating lease minimum lease payments for executed leases that have not yet commenced was $9 million.
10. Derivative Instruments
The fair values of derivative instruments in Autodesk’s Consolidated Balance Sheets were as follows as of January 31, 2024, and January 31, 2023:
| | | | | | | | | | | | | | | | | |
| | Balance Sheet Location | | Fair Value at |
| January 31, 2024 | | January 31, 2023 |
| Derivative Assets | | | | | |
| Foreign currency contracts designated as cash flow hedges | Prepaid expenses and other current assets | | $ | 8 | | | $ | 9 | |
| Derivatives not designated as hedging instruments | Prepaid expenses and other current assets | | 13 | | | 5 | |
| Total derivative assets | | | $ | 21 | | | $ | 14 | |
| Derivative Liabilities | | | | | |
| Foreign currency contracts designated as cash flow hedges | Other accrued liabilities | | $ | 8 | | | $ | 20 | |
| Derivatives not designated as hedging instruments | Other accrued liabilities | | 7 | | | 11 | |
| Total derivative liabilities | | | $ | 15 | | | $ | 31 | |
The effects of derivatives designated as hedging instruments on Autodesk’s Consolidated Statements of Operations were as follows for the fiscal years ended January 31, 2024, 2023, and 2022, (amounts presented include any income tax effects):
| | | | | | | | | | | | | | | | | |
| | Fiscal Year Ended January 31, |
| | 2024 | | 2023 | | 2022 |
| Amount of (loss) gain recognized in accumulated other comprehensive loss, net of tax, (effective portion) | $ | (41) | | | $ | 40 | | | $ | 31 | |
| Amount and location of gain (loss) reclassified from accumulated other comprehensive loss into income (effective portion) | | | | | |
| Net revenue | $ | 57 | | | $ | 60 | | | $ | (12) | |
| Cost of revenue | — | | | (3) | | | — | |
| Operating expenses | — | | | (21) | | | (5) | |
| | | | | |
| Total | $ | 57 | | | $ | 36 | | | $ | (17) | |
The amount and location of gain (loss) recognized in net income of derivatives not designated as hedging instruments on Autodesk’s Consolidated Statements of Operations were as follows for the fiscal years ended January 31, 2024, 2023, and 2022, (amounts presented include any income tax effects):
| | | | | | | | | | | | | | | | | |
| |
| | Fiscal Year Ended January 31, |
| | 2024 | | 2023 | | 2022 |
| Interest and other income (expense), net | $ | 9 | | | $ | 7 | | | $ | 11 | |
Foreign currency contracts designated as cash flow hedges
Autodesk uses foreign currency contracts to reduce the exchange rate impact on a portion of the net revenue or operating expense of certain anticipated transactions. These currency collars and forward contracts are designated and documented as cash flow hedges. The notional amounts of these contracts are presented net settled and were $1.25 billion at January 31, 2024, and $934 million at January 31, 2023. Outstanding contracts are recognized as either assets or liabilities on the Company’s Consolidated Balance Sheets at fair value. The majority of the net gain of $23 million remaining in “Accumulated other comprehensive loss” as of January 31, 2024, is expected to be recognized into earnings within the next 24 months.
The location and amount of gain or loss recognized in income on cash flow hedges together with the total amount of income or expense presented in the Company’s Consolidated Statements of Operations where the effects of the hedge are recorded were as follows for the fiscal years ended January 31, 2024 and 2023:
| | | | | | | | | | | | | | | | | | | | | | | | | | | | | | | | | | | | | | | | |
| | Fiscal Year Ended January 31, 2024 |
| | Net revenue | | Cost of revenue | | Operating expenses | | |
| | Subscription revenue | | Maintenance revenue | | Cost of subscription and maintenance revenue | | Marketing and sales | | Research and development | | General and administrative | | |
| Total amounts of income and expense line items presented in the Consolidated Statements of Operations | | $ | 5,116 | | $ | 54 | | $ | 381 | | $ | 1,823 | | $ | 1,373 | | $ | 620 | | |
| | | | | | | | | | | | | | |
| Gain (loss) on cash flow hedging relationships in Subtopic ASC 815-20 | | | | | | | | | | | | | | |
Foreign exchange contracts | | | | | | | | | | | | | | |
| Amount of gain (loss) reclassified from accumulated other comprehensive income into income | | $ | 57 | | $ | — | | $ | — | | $ | — | | $ | (1) | | $ | 1 | | |
| | | | | | | | | | | | | | | | | | | | | | | | | | | | | | | | | | | | | | | |
| | Fiscal Year Ended January 31, 2023 | |
| | Net revenue | | Cost of revenue | | Operating expenses | |
| | Subscription revenue | | Maintenance revenue | | Cost of subscription and maintenance revenue | | Marketing and sales | | Research and development | | General and administrative | |
| Total amounts of income and expense line items presented in the Consolidated Statements of Operations | | $ | 4,651 | | $ | 65 | | $ | 343 | | $ | 1,745 | | $ | 1,219 | | $ | 532 | |
| | | | | | | | | | | | | |
| Gain (loss) on cash flow hedging relationships in Subtopic ASC 815-20 | | | | | | | | | | | | | |
Foreign exchange contracts | | | | | | | | | | | | | |
| Amount of gain (loss) reclassified from accumulated other comprehensive income into income | | $ | 60 | | $ | — | | $ | (3) | | $ | (10) | | $ | (5) | | $ | (6) | |
Derivatives not designated as hedging instruments
Autodesk uses foreign currency contracts that are not designated as hedging instruments to reduce the exchange rate risk associated primarily with foreign currency denominated receivables, payables, and cash. The notional amounts of these foreign currency contracts are presented net settled and were $455 million at January 31, 2024, and $951 million at January 31, 2023.
11. Commitments and Contingencies
Purchase Commitments
In the normal course of business, Autodesk enters into various purchase commitments for goods or services. Total non-cancellable purchase commitments as of January 31, 2024, were approximately $844 million for periods through fiscal 2033. These purchase commitments primarily result from contracts entered into for the acquisition of cloud services, marketing, and commitments related to our investment agreements with limited liability partnership funds.
Autodesk has certain royalty commitments associated with the sale and licensing of certain products. Royalty expense is generally based on a fixed rate over a specified period, dollar amount per unit sold or a percentage of the underlying revenue. Royalty expense, which was recorded under cost of subscription and maintenance revenue and cost of other revenue on Autodesk’s Consolidated Statements of Operations, was $21 million in fiscal 2024, $18 million in fiscal 2023, and $16 million in fiscal 2022.
Guarantees and Indemnifications
In the normal course of business, Autodesk provides indemnifications of varying scopes, including limited product warranties and indemnification of customers against claims of intellectual property infringement made by third parties arising from the use of its products or services. Autodesk accrues for known indemnification issues if a loss is probable and can be reasonably estimated. Historically, costs related to these indemnifications have not been significant, and because potential future costs are highly variable, Autodesk is unable to estimate the maximum potential impact of these indemnifications on its future results of operations.
In connection with the purchase, sale, or license of assets or businesses with third parties, Autodesk has entered into or assumed customary indemnification agreements related to the assets or businesses purchased, sold, or licensed. Historically, costs related to these indemnifications have not been significant, and because potential future costs are highly variable, Autodesk is unable to estimate the maximum potential impact of these indemnifications on its future results of operations.
As permitted under Delaware law, Autodesk has agreements whereby it indemnifies its officers and directors for certain events or occurrences while the officer or director is, or was, serving at Autodesk’s request in such capacity. The maximum potential amount of future payments Autodesk could be required to make under these indemnification agreements is unlimited; however, Autodesk has directors’ and officers’ liability insurance coverage that is intended to reduce its financial exposure and may enable Autodesk to recover a portion of any future amounts paid. Autodesk believes the estimated fair value of these indemnification agreements in excess of applicable insurance coverage is minimal.
Legal Proceedings
Autodesk is involved in a variety of claims, suits, inquiries, investigations, and proceedings in the normal course of business including claims of alleged infringement of intellectual property rights, commercial, employment, tax, prosecution of unauthorized use, business practices, and other matters. Autodesk routinely reviews the status of each significant matter and assesses its potential financial exposure. If the potential loss from any matter is considered probable and the amount can be reasonably estimated, Autodesk records a liability for the estimated loss. Because of inherent uncertainties related to these legal matters, Autodesk bases its loss accruals on the best information available at the time. As additional information becomes available, Autodesk reassesses its potential liability and may revise its estimates. In the Company’s opinion, resolution of pending matters is not expected to have a material adverse impact on its consolidated results of operations, cash flows, or its financial position. Given the unpredictable nature of legal proceedings, there is a reasonable possibility that an unfavorable resolution of one or more such proceedings could in the future materially affect the Company’s results of operations, cash flows, or financial position in a particular period, however, based on the information known by the Company as of the date of this filing and the rules and regulations applicable to the preparation of the Company’s financial statements, any such amount is either immaterial or it is not possible to provide an estimated amount of any such potential loss.
In early March 2024, the Audit Committee of Autodesk’s Board of Directors commenced an internal investigation with the assistance of outside counsel and advisors regarding the Company’s free cash flow and non-GAAP operating margin practices (the “Internal Investigation”). On March 8, 2024, the Company voluntarily contacted the U.S. Securities and Exchange Commission (“SEC”) to inform it of the Internal Investigation. On April 3, 2024, the United States Attorney’s Office for the Northern District of California (“USAO”) contacted the Company regarding the Internal Investigation. The Company voluntarily provided the SEC and USAO with certain documents relating to the Internal Investigation and will continue to
cooperate with the SEC and USAO. At this stage, the Company cannot reasonably estimate the amount of any possible financial loss that could result from this matter.
On April 24, 2024, plaintiff Michael Barkasi filed a purported federal securities class action complaint in the Northern District of California against the Company, our Chief Executive Officer Andrew Anagnost, and our former Chief Financial Officer, Deborah L. Clifford. The action is captioned Michael Barkasi v. Autodesk, Inc. et al., 3:24-cv-02431. The complaint, which was filed shortly after the Company’s announcement of the Audit Committee of the Board of Directors’ internal investigation regarding the Company’s free cash flow and non-GAAP operating margin practices, generally alleges that the defendants made false and misleading statements in violation of Sections 10(b) and 20(a) of the Securities Exchange Act of 1934, and Rule 10b-5 promulgated thereunder. The action purports to be brought on behalf of those who purchased or otherwise acquired the Company’s publicly traded securities between June 1, 2023 and April 16, 2024, and seeks unspecified damages and other relief. The case is in its early stages and a lead plaintiff has yet to be appointed. At this stage, the Company cannot reasonably estimate the amount of any possible financial loss that could result from this matter.
12. Stock Repurchase Program
Autodesk has stock repurchase programs that are used to offset dilution from the issuance of stock under the Company’s employee stock plans and for such other purposes as may be in the interests of Autodesk and its stockholders, which has the effect of returning excess cash generated from the Company’s business to stockholders. Autodesk repurchased and retired 4 million shares in fiscal 2024 at an average repurchase price of $201.54 per share, 5 million shares in fiscal 2023 at an average repurchase price of $198.51 per share, and 4 million shares in fiscal 2022 at an average repurchase price of $275.50 per share.
At January 31, 2024, $4.74 billion remained available for repurchase under the November 2022 repurchase program approved by the Board of Directors. The share repurchase program does not have an expiration date and the pace and timing of repurchases will depend on factors such as cash generation from operations, available surplus, the volume of employee stock plan activity, remaining shares available in the authorized pool, cash requirements for acquisitions, cash requirements to retire outstanding debt, economic and market conditions, stock price, and legal and regulatory requirements.
13. Interest and Other Income (Expense), net
Interest and other income (expense), net, consists of the following: | | | | | | | | | | | | | | | | | |
| | Fiscal Year Ended January 31, |
| | 2024 | | 2023 | | 2022 |
| Interest and investment income (expense), net | $ | 26 | | | $ | (71) | | | $ | (65) | |
| Gain on foreign currency | 10 | | | 15 | | | 1 | |
| (Loss) gain on strategic investments | (32) | | | 1 | | | 3 | |
| Other income | 4 | | | 12 | | | 8 | |
| Interest and other income (expense), net | $ | 8 | | | $ | (43) | | | $ | (53) | |
14. Accumulated Other Comprehensive Loss
Accumulated other comprehensive loss, net of taxes, consisted of the following:
| | | | | | | | | | | | | | | | | | | | | | | | | | | | | |
| Net Unrealized Gains (Losses) on Derivative Instruments | | Net Unrealized Gains (Losses) on Available for Sale Securities | | Defined Benefit Pension Components | | Foreign Currency Translation Adjustments | | Total |
| Balances, January 31, 2022 | $ | 24 | | | $ | 18 | | | $ | (16) | | | $ | (150) | | | $ | (124) | |
| Other comprehensive income (loss) before reclassifications | 83 | | | — | | | (1) | | | (98) | | | (16) | |
| Pre-tax gain reclassified from accumulated other comprehensive income | (36) | | | — | | | (3) | | | — | | | (39) | |
| Tax effects | (7) | | | — | | | 1 | | | — | | | (6) | |
| Net current period other comprehensive income (loss) | 40 | | | — | | | (3) | | | (98) | | | (61) | |
| Balances, January 31, 2023 | 64 | | | 18 | | | (19) | | | (248) | | | (185) | |
| Other comprehensive income (loss) before reclassifications | 10 | | | 1 | | | (10) | | | (9) | | | (8) | |
| Pre-tax (gain) loss reclassified from accumulated other comprehensive income | (57) | | | 1 | | | 4 | | | — | | | (52) | |
| Tax effects | 6 | | | — | | | 1 | | | 4 | | | 11 | |
| Net current period other comprehensive (loss) income | (41) | | | 2 | | | (5) | | | (5) | | | (49) | |
| Balances, January 31, 2024 | $ | 23 | | | $ | 20 | | | $ | (24) | | | $ | (253) | | | $ | (234) | |
Reclassifications related to gains and losses on available-for-sale debt securities are included in “Interest and other income (expense), net.” Refer to Note 10, “Derivative Instruments” for the amount and location of reclassifications related to derivative instruments. Reclassifications of the defined benefit pension components of net periodic benefit cost are included in “Interest and other income (expense), net.”
15. Net Income Per Share
Basic net income per share is computed using the weighted average number of shares of common stock outstanding during the period. Diluted net income per share is computed using the weighted average number of shares of common stock outstanding during the period and potentially dilutive common shares, including the effect of restricted stock units, performance share awards, and stock options using the treasury stock method. The following table sets forth the computation of the numerators and denominators used in the basic and diluted net income per share amounts:
| | | | | | | | | | | | | | | | | |
| | Fiscal Year Ended January 31, |
| | 2024 | | 2023 | | 2022 |
| Numerator: | | | | | |
| Net income | $ | 906 | | | $ | 823 | | | $ | 497 | |
| Denominator: | | | | | |
| Weighted average shares for basic net income per share | 214 | | | 216 | | | 220 | |
| Effect of dilutive securities | 2 | | | 2 | | | 2 | |
| Weighted average shares for dilutive net income per share | 216 | | | 218 | | | 222 | |
| Basic net income per share | $ | 4.23 | | | $ | 3.81 | | | $ | 2.26 | |
| Diluted net income per share | $ | 4.19 | | | $ | 3.78 | | | $ | 2.24 | |
The computation of diluted net income per share does not include shares that are anti-dilutive under the treasury stock method because their exercise prices are higher than the average market value of Autodesk’s stock during the fiscal year. The effect of 297 thousand, 962 thousand, and 153 thousand anti-dilutive shares were excluded from the computation of diluted net income per share for the fiscal years ended January 31, 2024, 2023, and 2022, respectively.
16. Retirement Benefit Plans
Pretax Savings Plan
Autodesk has a 401(k) plan that covers nearly all U.S. employees. Eligible employees may contribute up to 75% of their pretax salary, subject to limitations mandated by the Internal Revenue Service. Autodesk makes voluntary cash contributions and matches a portion of employee contributions in cash. Autodesk’s contributions were $26 million in fiscal 2024, $26 million in fiscal 2023, and $24 million in fiscal 2022. Autodesk does not allow participants to invest in Autodesk common stock through the 401(k) plan.
Defined Benefit Pension Plans
Autodesk provides certain defined benefit pension plans to employees located in countries outside of the United States, primarily the United Kingdom, Switzerland, and Japan. The Company deposits funds for specific plans, consistent with the requirements of local law, with insurance companies or third-party trustees, or into government-managed accounts, and accrues for the unfunded portion of the obligation, where material.
The projected benefit obligation was $81 million and $76 million as of January 31, 2024, and January 31, 2023, respectively. The accumulated benefit obligation was $73 million and $69 million as of January 31, 2024, and January 31, 2023, respectively. The related fair value of plan assets was $77 million and $76 million as of January 31, 2024, and January 31, 2023, respectively. Our defined pension plan assets are measured at fair value and consist primarily of insurance contracts categorized as level 2 in the fair value hierarchy and an investment fund valued using net asset value. The insurance contracts represent the immediate cash surrender value of assets managed by qualified insurance companies. The assets held in the investment fund are invested in a diversified growth fund actively managed by a third party.
Autodesk recognized an aggregate pension liability for the funded status of $6 million and $5 million in “Long-term other liabilities” on the Consolidated Balance Sheet as of January 31, 2024, and January 31, 2023, respectively. Our total net periodic pension plan cost was $2 million, $3 million and $3 million for fiscal years 2024, 2023, and 2022, respectively.
Our expected funding for the plans during fiscal 2025 is approximately $5 million.
Estimated Future Benefit Payments
Estimated benefit payments over the next 10 fiscal years are as follows:
| | | | | |
| Pension Benefits |
| 2025 | $ | 4 | |
| 2026 | 4 | |
| 2027 | 4 | |
| 2028 | 4 | |
| 2029 | 4 | |
| 2030-2034 | 24 | |
| Total | $ | 44 | |
Defined Contribution Plans
Autodesk also provides defined contribution plans in certain foreign countries where required by statute. Autodesk’s funding policy for foreign defined contribution plans is consistent with the local requirements in each country. Autodesk’s contributions to these plans were $43 million in fiscal 2024, $39 million in fiscal 2023, and $38 million in fiscal 2022.
Cash Balance Plans
Autodesk provides a cash balance plan that insures the risks of disability, death, and longevity, in which the vested pension capital is reinvested and provides a 100% capital and interest guarantee. The weighted-average guaranteed interest crediting rate for cash balance plans was 1%, 1%, and 1% for mandatory retirement savings and 0.3%, 0.3%, and 0.3% for supplementary retirement savings for fiscal 2024, 2023, and 2022, respectively.
Other Plans
In addition, Autodesk offers a non-qualified deferred compensation plan to certain key employees whereby they may defer a portion (or all) of their annual compensation until retirement or a different date specified by the employee in accordance with terms of the plan. See Note 7, “Deferred Compensation,” for further discussion.
17. Subsequent Events
On February 20, 2024, Autodesk acquired 100% of the outstanding stock of Payapps Limited (“Payapps”), a leading cloud-based software platform for managing construction-related payments, for total consideration of $387 million in cash. Of the total consideration transferred, $381 million is considered purchase consideration. The remaining amount of $6 million will be recorded in “Prepaid expenses and other current assets” and “Long-term other assets” on our Consolidated Balance Sheets and will be amortized to stock-based compensation expense using the straight-line method over the vesting period. Autodesk expects to deepen Autodesk Construction Cloud’s footprint and provide a robust payment management offering to serve the needs of general contractors and trade contractors. Through automating the application of the payment process, Payapps’ solution provides greater transparency, reduces risk and helps accelerate time-to-payment.
On March 15, 2024, Autodesk acquired 100% of the PIX business of X2X, LLC (“PIX”), a production management solution for secure review and content collaboration in the media and entertainment industry for total consideration of $266 million in cash. The acquisition will help foster broader collaboration and communication, as well as help drive greater efficiencies in the production process.
The acquisitions were accounted for as business combinations, and Autodesk will record the tangible and intangible assets acquired and liabilities assumed based on their estimated fair values at the date of acquisition. The fair values assigned to the identifiable intangible assets acquired were based on estimates and assumptions determined by management. Autodesk will record the excess of consideration transferred over the aggregate fair values as goodwill. The goodwill to be recorded is primarily attributable to synergies expected to arise after the respective acquisition. Goodwill in an approximate range of $180 million to $190 million is expected to be deductible for U.S. income tax purposes for PIX. Goodwill expected to be deductible for U.S. income tax purposes for Payapps is pending and not yet finalized. The transaction costs related to the acquisitions were not material.
The following table summarizes the fair value of the assets acquired and liabilities assumed by major class for the business combinations:
| | | | | | | | | | | | | | | | | |
| Payapps | | PIX | | Total |
| Developed technologies | $ | 53 | | | $ | 37 | | | $ | 90 | |
| Customer relationships | 34 | | | 33 | | | 67 | |
| Trade name | 5 | | | — | | | 5 | |
| | | | | |
| | | | | |
| | | | | |
| Goodwill | 300 | | | 191 | | | 491 | |
| Deferred revenue and long-term deferred revenue | (4) | | | (2) | | | (6) | |
| Long-term deferred income taxes | (12) | | | — | | | (12) | |
| Net tangible assets | 5 | | | 7 | | | 12 | |
| Total | $ | 381 | | | $ | 266 | | | $ | 647 | |
For the business combinations, the allocation of purchase price consideration to certain assets and liabilities as well as the final amount of purchase consideration is not yet finalized. For the items not yet finalized, Autodesk's estimates and assumptions are subject to change within the measurement period (up to one year from the acquisition date). The primary areas of the preliminary purchase price allocation that are not yet finalized include, but are not limited to, amounts for intangible assets, tax assets and liabilities, deferred revenue, and residual goodwill.
On May 20, 2024, Autodesk acquired Aether Media, Inc., a provider of a cloud-based artificial intelligence pipeline for creating computer-generated 3D characters into live-action scenes, for preliminary purchase consideration of $131 million, net of cash acquired. This acquisition will enhance artificial intelligence capabilities for Autodesk’s VFX creation tools and democratize high end VFX work on Autodesk’s Flow platform. We are currently in the process of determining the initial purchase accounting for this transaction. Based on the timing of the acquisition and lack of available information, we determined it to be impracticable to disclose a preliminary purchase price allocation at this time.
Report of Independent Registered Public Accounting Firm
To the Stockholders and the Board of Directors of Autodesk, Inc.
Opinion on the Financial Statements
We have audited the accompanying consolidated balance sheets of Autodesk, Inc. (the Company) as of January 31, 2024, and 2023, the related consolidated statements of operations, comprehensive income, stockholders’ equity, and cash flows for each of the three years in the period ended January 31, 2024, and the related notes and financial statement schedule listed in the Index at Item 15(a)(2) (collectively referred to as the “consolidated financial statements”). In our opinion, the consolidated financial statements present fairly, in all material respects, the financial position of the Company at January 31, 2024, and 2023, and the results of its operations and its cash flows for each of the three years in the period ended January 31, 2024, in conformity with U.S. generally accepted accounting principles.
We also have audited, in accordance with the standards of the Public Company Accounting Oversight Board (United States) (PCAOB), the Company’s internal control over financial reporting as of January 31, 2024, based on criteria established in Internal Control—Integrated Framework issued by the Committee of Sponsoring Organizations of the Treadway Commission (2013 framework), and our report dated June 10, 2024 expressed an unqualified opinion thereon.
Basis for Opinion
These financial statements are the responsibility of the Company’s management. Our responsibility is to express an opinion on the Company’s financial statements based on our audits. We are a public accounting firm registered with the PCAOB and are required to be independent with respect to the Company in accordance with the U.S. federal securities laws and the applicable rules and regulations of the Securities and Exchange Commission and the PCAOB.
We conducted our audits in accordance with the standards of the PCAOB. Those standards require that we plan and perform the audit to obtain reasonable assurance about whether the financial statements are free of material misstatement, whether due to error or fraud. Our audits included performing procedures to assess the risks of material misstatement of the financial statements, whether due to error or fraud, and performing procedures that respond to those risks. Such procedures included examining, on a test basis, evidence regarding the amounts and disclosures in the financial statements. Our audits also included evaluating the accounting principles used and significant estimates made by management, as well as evaluating the overall presentation of the financial statements. We believe that our audits provide a reasonable basis for our opinion.
Critical Audit Matter
The critical audit matter communicated below is a matter arising from the current period audit of the financial statements that was communicated or required to be communicated to the audit committee and that: (1) relates to accounts or disclosures that are material to the financial statements and (2) involved our especially challenging, subjective, or complex judgments. The communication of the critical audit matter does not alter in any way our opinion on the consolidated financial statements, taken as a whole, and we are not, by communicating the critical audit matter below, providing a separate opinion on the critical audit matter or on the accounts or disclosures to which it relates.
| | | | | |
| Revenue Recognition |
| Description of the Matter | As discussed in Note 1 to the consolidated financial statements, revenue is recognized when the Company's offerings are delivered to its customers, in an amount that reflects the consideration expected in exchange for the products and services.
The Company enters into contracts with its customers that may include promises to transfer term-based product subscriptions, cloud service offerings, and support services. Auditing the Company’s revenue recognition was challenging and complex due to the effort required to analyze the accounting treatment for the Company’s various product and service offerings in accordance with ASC 606, Revenue from Contracts with Customers. This involved assessing the impact of terms and conditions in contracts with customers to determine whether products and services are considered distinct performance obligations and the related timing of revenue recognition. |
| |
| How We Addressed the Matter in Our Audit | We obtained an understanding, evaluated the design, and tested the operating effectiveness of internal controls over the Company's identification and evaluation of distinct performance obligations and the determination of the timing of revenue recognition.
Among other procedures, to evaluate management’s identification and evaluation of the distinct performance obligations and timing of revenue recognition, we read executed contracts for a sample of sales transactions to understand the contract, identify the promised products and services in the contract, and identify the distinct performance obligations and related timing of revenue recognition. |
| |
| |
| |
| |
| |
| |
/s/ Ernst & Young LLP
We have served as the Company's auditor since 1983.
San Francisco, California
June 10, 2024
Report of Independent Registered Public Accounting Firm
To the Stockholders and the Board of Directors of Autodesk, Inc.
Opinion on Internal Control Over Financial Reporting
We have audited Autodesk, Inc.’s internal control over financial reporting as of January 31, 2024, based on criteria established in Internal Control—Integrated Framework issued by the Committee of Sponsoring Organizations of the Treadway Commission (2013 framework) (the COSO criteria). In our opinion, Autodesk, Inc. (the Company) maintained, in all material respects, effective internal control over financial reporting as of January 31, 2024, based on the COSO criteria.
We also have audited, in accordance with the standards of the Public Company Accounting Oversight Board (United States) (PCAOB), the accompanying consolidated balance sheets of the Company as of January 31, 2024, and 2023, the related consolidated statements of operations, comprehensive income, stockholders’ equity, and cash flows for each of the three years in the period ended January 31, 2024, and the related notes and financial statement schedule listed in the Index at Item 15(a)(2) and our report dated June 10, 2024, expressed an unqualified opinion thereon.
Basis for Opinion
The Company’s management is responsible for maintaining effective internal control over financial reporting and for its assessment of the effectiveness of internal control over financial reporting included in the accompanying Management’s Report on Internal Control Over Financial Reporting. Our responsibility is to express an opinion on the Company’s internal control over financial reporting based on our audit. We are a public accounting firm registered with the PCAOB and are required to be independent with respect to the Company in accordance with the U.S. federal securities laws and the applicable rules and regulations of the Securities and Exchange Commission and the PCAOB.
We conducted our audit in accordance with the standards of the PCAOB. Those standards require that we plan and perform the audit to obtain reasonable assurance about whether effective internal control over financial reporting was maintained in all material respects.
Our audit included obtaining an understanding of internal control over financial reporting, assessing the risk that a material weakness exists, testing and evaluating the design and operating effectiveness of internal control based on the assessed risk, and performing such other procedures as we considered necessary in the circumstances. We believe that our audit provides a reasonable basis for our opinion.
Definition and Limitations of Internal Control Over Financial Reporting
A company’s internal control over financial reporting is a process designed to provide reasonable assurance regarding the reliability of financial reporting and the preparation of financial statements for external purposes in accordance with generally accepted accounting principles. A company’s internal control over financial reporting includes those policies and procedures that (1) pertain to the maintenance of records that, in reasonable detail, accurately and fairly reflect the transactions and dispositions of the assets of the company; (2) provide reasonable assurance that transactions are recorded as necessary to permit preparation of financial statements in accordance with generally accepted accounting principles, and that receipts and expenditures of the company are being made only in accordance with authorizations of management and directors of the company; and (3) provide reasonable assurance regarding prevention or timely detection of unauthorized acquisition, use, or disposition of the company’s assets that could have a material effect on the financial statements.
Because of its inherent limitations, internal control over financial reporting may not prevent or detect misstatements. Also, projections of any evaluation of effectiveness to future periods are subject to the risk that controls may become inadequate because of changes in conditions, or that the degree of compliance with the policies or procedures may deteriorate.
/s/ Ernst & Young LLP
San Francisco, California
June 10, 2024
ITEM 9.CHANGES IN AND DISAGREEMENTS WITH ACCOUNTANTS ON ACCOUNTING AND FINANCIAL DISCLOSURE
None.
ITEM 9A.CONTROLS AND PROCEDURES
EVALUATION OF DISCLOSURE CONTROLS AND PROCEDURES
We maintain “disclosure controls and procedures,” as defined in Rule 13a-15(e) and 15d-15(e) under the Securities Exchange Act of 1934, as amended (the “Exchange Act”). Our disclosure controls and procedures are designed to ensure that information required to be disclosed in our Exchange Act reports is (i) recorded, processed, summarized, and reported within the time periods specified in the rules of the Securities and Exchange Commission (“SEC”), and (ii) accumulated and communicated to Autodesk management, including our Chief Executive Officer and Chief Financial Officer, to allow timely decisions regarding required disclosure. We conducted an evaluation, under the supervision and with the participation of our Chief Executive Officer and Chief Financial Officer, of the effectiveness of the design and operation of our disclosure controls and procedures as of the end of the period covered by this Annual Report on Form 10-K. Based upon this evaluation, our Chief Executive Officer and Chief Financial Officer have concluded that our disclosure controls and procedures are effective as of January 31, 2024.
MANAGEMENT'S REPORT ON INTERNAL CONTROL OVER FINANCIAL REPORTING
Our management is responsible for establishing and maintaining adequate internal control over financial reporting (as defined in Rule 13a-15(f) under the Securities Exchange Act of 1934, as amended). Our management assessed the effectiveness of our internal control over financial reporting as of January 31, 2024. In making this assessment, our management used the criteria set forth by the Committee of Sponsoring Organizations of the Treadway Commission (“COSO”) in the 2013 Internal Control—Integrated Framework. Our management, including our Chief Executive Officer and Chief Financial Officer, does not expect that our disclosure controls and procedures or our internal control over financial reporting will necessarily prevent all errors and all fraud. A control system, no matter how well conceived and operated, can provide only reasonable, not absolute, assurance that the objectives of the control system are met. Further, the design of a control system must reflect the fact that there are resource constraints, and the benefits of controls must be considered relative to their costs. Because of the inherent limitations in all control systems, no evaluation of controls can provide absolute assurance that all control issues and instances of fraud, if any, within Autodesk have been detected.
Our management has concluded that, as of January 31, 2024, our internal control over financial reporting was effective to provide reasonable assurance regarding the reliability of financial reporting and the preparation of financial statements for external purposes in accordance with generally accepted accounting principles. Our independent registered public accounting firm, Ernst & Young LLP, has issued an audit report on our internal control over financial reporting, which is included in Part II, Item 8 herein.
CHANGES IN INTERNAL CONTROL OVER FINANCIAL REPORTING
There were no changes in our internal control over financial reporting (as such term is defined in Rules 13a-15(f) and 15d-15(f) under the Securities Exchange Act of 1934) during the three months ended January 31, 2024, that have materially affected, or are reasonably likely to materially affect, our internal control over financial reporting.
ITEM 9B.OTHER INFORMATION
DEPARTURE OF DIRECTORS OR PRINCIPAL OFFICERS; ELECTION OF DIRECTORS; APPOINTMENT OF PRINCIPAL OFFICERS
For information regarding our recent principal financial officer change, please see the Explanatory Note and Item 10, “Information About Our Executive Officers,” which are hereby incorporated by reference.
SECURITIES TRADING PLANS OF DIRECTORS AND EXECUTIVE OFFICERS
During our last fiscal quarter, the following director(s) and officer(s), as defined in Rule 16a-1(f), adopted a “Rule 10b5-1 trading arrangement” as defined in Regulation S-K Item 408, as follows:
On December 19, 2023, Steve Blum, our Chief Operating Officer, on behalf of the BLUM FAM DECL. TR UAD 4/20/06, adopted a Rule 10b5-1 trading arrangement providing for the sale from time to time of an aggregate of up to 66,740 shares of our common stock. The trading arrangement is intended to satisfy the affirmative defense in Rule 10b5-1(c). The duration of the trading arrangement is until November 29, 2024, or earlier if all transactions under the trading arrangement are completed.
No other officers or directors, as defined in Rule 16a-1(f), adopted and/or terminated a “Rule 10b5-1 trading arrangement” or a "non-10b5-1 trading arrangement” or a "non-10b5-1 trading arrangement” as defined in Regulation S-K Item 408, during the last fiscal quarter.
ITEM 9C. DISCLOSURE REGARDING FOREIGN JURISDICTIONS THAT PREVENT INSPECTIONS
Not Applicable.
PART III
ITEM 10.DIRECTORS, EXECUTIVE OFFICERS AND CORPORATE GOVERNANCE
INFORMATION ABOUT OUR DIRECTORS
The below biographies provide the name, age and certain biographical information as of March 31, 2024, about each director, and the directors’ unique qualifications to serve on the Board.
| | | | | |
| Andrew Anagnost |
| President and Chief Executive Officer |
| Age: 59 | Director since 2017 |
|
Dr. Anagnost joined Autodesk in September 1997 and has served as President and Chief Executive Officer since June 2017. Dr. Anagnost served as Co-CEO from February 2017 to June 2017, Chief Marketing Officer from December 2016 to June 2017, and Senior Vice President, Business Strategy & Marketing, from March 2012 to June 2017. From December 2009 to March 2012, Dr. Anagnost was our Vice President, Product Suites and Web Services. Prior to this position, Dr. Anagnost served as Vice President of CAD/CAE products for our manufacturing division from March 2007 to December 2009. Previously, Dr. Anagnost held other senior management positions at Autodesk. Prior to joining Autodesk, Dr. Anagnost held various engineering, sales, marketing, and product management positions at Lockheed Aeronautical Systems Company and EXA Corporation. He also served as an NRC post-doctoral fellow at NASA Ames Research Center. Dr. Anagnost holds a Bachelor of Science degree in Mechanical Engineering from California State University, Northridge, and holds both an MS in Engineering Science and a PhD in Aeronautical Engineering and Computer Science from Stanford University. Dr. Anagnost joined the board of directors of HubSpot, Inc. in September 2023.
Qualifications and Contributions
Dr. Anagnost brings to the Board extensive experience in the technology industry, and has spent two decades in management roles within Autodesk. As our President and Chief Executive Officer, Dr. Anagnost possesses a deep knowledge and understanding of Autodesk’s business, operations, and employees; the opportunities and risks we face; and management’s strategy and plans for accomplishing Autodesk’s goals.
Pursuant to Dr. Anagnost’s employment agreement, Autodesk has agreed to nominate Dr. Anagnost to serve as a member of the Board for as long as he is employed by Autodesk as CEO. |
| | | | | |
| Stacy J. Smith |
| Non-Executive Chair of the Board of Directors |
| Age: 61 | Director since 2011 | Independent |
| Autodesk Committees: Corporate Governance and Nominating |
|
|
Mr. Smith currently serves as the non-executive Chair of the Board of Directors, and as the executive chairman of Kioxia Corporation (formerly Toshiba Memory Corporation), a leading flash memory company. Mr. Smith previously served as Group President of Sales, Manufacturing and Operations at Intel Corporation from February 2017 to January 2018. He served as the Executive Vice President, Manufacturing, Operations and Sales of Intel Corporation from October 2016 to February 2017. From November 2012 to October 2016, he served as Executive Vice President, Chief Financial Officer. Previously, Mr. Smith served as Senior Vice President, Chief Financial Officer from January 2010 to November 2012; Vice President, Chief Financial Officer from 2007 to 2010; and Vice President, Assistant Chief Financial Officer from 2006 to 2007. From 2004 to 2006, Mr. Smith served as Vice President, Finance and Enterprise Services and Chief Information Officer. Mr. Smith joined Intel in 1988. Mr. Smith has served on the board of directors of Kioxia Corporation since October 2018 and on the board of Wolfspeed, Inc. since January 2023. In March 2024, he joined the board of directors of Intel Corporation. Mr. Smith also serves on The California Chapter of The Nature Conservancy Board of Trustees and the University of Texas McCombs School of Business Advisory Board. Mr. Smith previously served on the boards of directors of Metromile, Inc., from July 2018 to February 2021, Virgin America from February 2014 until it was acquired by Alaska Air Group in December 2016, and Gevo, Inc. from June 2010 to June 2014. Qualifications and Contributions
Mr. Smith is independent and his more than two decades of experience in the technology industry provide him with a strong understanding of Autodesk’s industry, business, and international operational challenges. His management positions with Intel, including his finance and executive roles, and his time spent overseas, provide him with critical insight into the operational requirements of a global company and the management and consensus-building skills required to lead our Board as non-executive Chair and to serve on our Corporate Governance and Nominating Committee. |
| | | | | |
| Karen Blasing |
| Age: 67 | Director since 2018 | Independent |
| Autodesk Committees: Audit |
|
Ms. Blasing has over 25 years of executive operational and financial leadership experience in the technology industry. Ms. Blasing served as the Chief Financial Officer of Guidewire Software, Inc., an insurance software company, from 2009 to March 2015. Prior to Guidewire, Ms. Blasing served as the Chief Financial Officer for Force 10 Networks and Senior Vice President of Finance for salesforce.com, Inc. Ms. Blasing also served as Chief Financial Officer for Nuance Communications, Inc. and Counterpane Internet Security, Inc., and held senior finance roles for Informix (now IBM Informix) and Oracle Corporation. Ms. Blasing has also served on the boards of directors of Zscaler, Inc. since January 2017 and GitLab, Inc., since August 2019. Ms. Blasing previously served on the board of directors of Ellie Mae, Inc., from June 2015 to May 2019.
Qualifications and Contributions
Ms. Blasing is independent and has more than 25 years of executive operational and financial experience in the technology industry. Ms. Blasing’s experience at Guidewire Software, Force 10 Networks, salesforce.com, and Nuance Communications provides her with a strong understanding of Autodesk’s business and international operational challenges. Her experience as a chief financial officer provides her with the financial acumen necessary to serve on our Audit Committee. |
| | | | | |
| Reid French |
| Age: 52 | Director since 2017 | Independent |
| Autodesk Committees: Compensation and Human Resources |
|
Mr. French has over 20 years of executive leadership experience in the software industry. Mr. French served as Chief Executive Officer of Applied Systems, Inc., a leading cloud software provider to the insurance industry, from September 2011 to June 2019, and as a member of its Board of Directors from September 2011 to January 2020. Previously, Mr. French was Chief Operating Officer at Intergraph Corporation, a global geospatial and computer-aided design software company, from April 2005 until October 2010, when Intergraph was acquired by Hexagon AB. From October 2003 to April 2005, Mr. French was Executive Vice President of Strategic Planning and Corporate Development at Intergraph. Mr. French holds a bachelor’s degree in economics from Davidson College, where he serves on the College’s board of trustees. He also holds an M.B.A. from the Harvard Business School. He sits on the board of directors of Verint Systems Inc., JSSI, Inc. and NetDocuments Software, Inc.
Qualifications and Contributions
Mr. French is independent and his executive operational and strategic leadership experience in the technology industry provide him with a deep understanding of Autodesk’s technology and business. Mr. French’s years of service as an executive officer and his service on the board of directors of Applied Systems provide him with the executive compensation knowledge necessary to serve on our Compensation and Human Resources Committee. |
|
| | | | | |
| Dr. Ayanna Howard |
| Age: 52 | Director since 2019 | Independent |
| Autodesk Committees: Audit |
|
Dr. Howard is an entrepreneur and expert in robotics, human-computer interaction, and artificial intelligence. Since March 2021, Dr. Howard has served as Dean of the College of Engineering at The Ohio State University. She is also a tenured professor in the college’s Department of Electrical and Computer Engineering with a joint appointment in Computer Science and Engineering. In addition, Dr. Howard is the Founder and Chief Technology Officer of Zyrobotics, a startup that designs AI-powered STEM tools for early childhood education. Dr. Howard previously served as the Linda J. and Mark C. Smith Professor, School of Electrical & Computer Engineering, at Georgia Institute of Technology from August 2015 to February 2021, and Chair of the School of Interactive Computing at Georgia Tech from January 2018 to February 2021. Prior to Georgia Tech, Dr. Howard served as Senior Robotics Researcher and Deputy Manager in the Office of the Chief Scientist with NASA’s Jet Propulsion Laboratory. Dr. Howard serves on the board of Motorola Solutions, Inc. and serves on the advisory boards for numerous robotics and AI-based organizations. Dr. Howard holds a degree from Brown University, an M.S. and Ph.D. in Electrical Engineering from the University of Southern California, as well as an M.B.A. from the Drucker Graduate School of Management.
Qualifications and Contributions
Dr. Howard is independent and her executive, operational, academic, and strategic leadership experience in the technology industry provide her with a deep understanding of Autodesk’s technology and business. Her experience as an entrepreneur and founder and her business degree provide her with the financial acumen necessary to serve on our Audit Committee. |
| | | | | |
| Blake Irving |
| Age: 64 | Director since 2019 | Independent |
| Autodesk Committees: Corporate Governance and Nominating |
|
Mr. Irving has over 25 years of executive leadership experience in the technology industry. Mr. Irving served as the Chief Executive Officer of GoDaddy Inc., an Internet domain registrar and web hosting company, from January 2013 to January 2018, and served on the board of directors of GoDaddy from May 2014 to June 2018. From 2010 to 2012, Mr. Irving served as Chief Product Officer of Yahoo! Inc. From 2009 to 2010, Mr. Irving was a Professor in the M.B.A. program at Pepperdine University. From 1992 to 2007, Mr. Irving served in various senior and management roles at Microsoft Corporation, including most recently as Corporate Vice President of Windows Live Platform Group. Mr. Irving has served on the boards of directors of DocuSign, Inc., since August 2018, ZipRecruiter, Inc., since November 2018, and Flowhub, LLC, since January 2020.
Qualifications and Contributions
Mr. Irving is independent and has more than 25 years of executive operational and strategic leadership experience in the technology industry. Mr. Irving’s experience at GoDaddy, Yahoo!, and Microsoft provides him with a strong understanding of Autodesk’s industry, business, and international operational challenges, and with the executive compensation knowledge necessary to serve on our Corporate Governance and Nominating Committee. |
| | | | | |
| Mary T. McDowell |
| Age: 59 | Director since 2010 | Independent |
| Autodesk Committees: Compensation and Human Resources (Chair) |
|
Ms. McDowell served as the President and Chief Executive Officer of Mitel Networks Corporation, a telecommunications company, from October 2019 to November 2021 and transitioned to serve as Board Chair until November 2022. Previously, Ms. McDowell served as the Chief Executive Officer and member of the board of directors at Polycom, Inc., from September 2016 to July 2018, when the company was acquired by Plantronics, Inc. Prior to Polycom, Ms. McDowell was an Executive Partner at Siris Capital, LLC. She served as Executive Vice President in charge of Nokia’s Mobile Phone unit from July 2010 to July 2012 and as Executive Vice President and Chief Development Officer of Nokia Corporation from January 2008 to July 2010. Previously, Ms. McDowell served as Executive Vice President and General Manager of Enterprise Solutions of Nokia from January 2004 to December 2007. Prior to joining Nokia in 2004, Ms. McDowell spent 17 years in various executive, managerial, and other positions at Compaq Computer Corporation and Hewlett-Packard Company, including serving as Senior Vice President, Industry-Standard Servers of Hewlett-Packard. Ms. McDowell has served as lead director of Informa plc since November 2021, having served as a director of Informa plc since June 2018. Ms. McDowell previously served as Board Chair of Mitel Networks Corporation from November 2021 to November 2022, and as a director of UBM plc from August 2014 to June 2018, and as a director of Bazaarvoice, Inc., from December 2014 to October 2016, and as compensation committee chair of Bazaarvoice, Inc., from 2015 – 2016. Ms. McDowell also serves as Chair of the University of Illinois College of Engineering's Board of Visitors.
Qualifications and Contributions
Ms. McDowell is independent and brings to our Board extensive management experience in the technology industry. Her two and a half decades of experience working for global technology companies focused on innovation and collaboration provide her with a firm understanding of Autodesk’s core mission, business, and technology. Her years of service as an executive officer at Polycom, Nokia, and other technology companies, including Hewlett-Packard, provide her with the executive compensation knowledge necessary to serve as Chair of our Compensation and Human Resources Committee. |
| | | | | |
| Stephen Milligan |
| Age: 60 | Director since 2018 | Independent |
| Autodesk Committees: Audit |
|
Mr. Milligan served as Chief Executive Officer of Western Digital Corporation, a data storage company, from January 2013 to March 2020, and as its president from March 2012 to October 2015. Previously, Mr. Milligan served as the Chief Financial Officer of Hitachi Global Storage Technologies (“HGST”) from 2007 to 2009, and as HGST’s Chief Executive Officer from 2009 to 2012, when Western Digital acquired HGST. From January 2004 to September 2007, Mr. Milligan served as Western Digital’s Chief Financial Officer after serving in other senior finance roles at Western Digital from September 2002 to January 2004. From April 1997 to September 2002, he held various financial and accounting roles of increasing responsibility at Dell Inc. and was employed at Price Waterhouse for 12 years prior to joining Dell. Mr. Milligan holds a Bachelor of Science degree in Accounting from The Ohio State University. Mr. Milligan has served on the board of directors of Ross Stores, Inc., since January 2015, and served on the board of directors of Western Digital Corporation from January 2013 to May 2020.
Qualifications and Contributions
Mr. Milligan is independent and has over 30 years of executive operational and financial leadership experience in the technology industry. Mr. Milligan’s experience at Western Digital and HGST, including his finance and executive roles, provides him with a strong understanding of Autodesk’s industry, business, and international operational challenges. His experience as a CFO and CEO provides him with the financial acumen necessary to serve on our Audit Committee. |
| | | | | |
| Lorrie M. Norrington |
| Age: 64 | Director since 2011 | Independent |
| Autodesk Committees: Corporate Governance and Nominating (Chair) |
|
Ms. Norrington has over 40 years of operating experience in technology, software, and internet businesses. She currently serves as an adviser and in an Operating Partner capacity for Lead Edge Capital, a growth equity firm that partners with world-class entrepreneurs and exceptional technology businesses. Ms. Norrington was President of eBay Marketplaces from July 2008 to September 2010 and held a number of senior management roles at eBay from July 2006 to June 2008. Prior to joining eBay, Ms. Norrington was President and CEO of Shopping.com, Inc., from June 2005 to July 2006. Prior to joining Shopping.com, Ms. Norrington served, from August 2001 to January 2005, initially as Executive Vice President of Small Business and later in the office of the CEO, at Intuit Inc. Before Intuit, Ms. Norrington served in a variety of executive positions at General Electric Corporation over a 20-year period, working in a broad range of industries and businesses. Ms. Norrington has served on the boards of directors of Asana, Inc., since September 2019, Colgate-Palmolive since September 2015, and HubSpot since September 2013. Previously, she served on the boards of directors of Eventbrite, Inc., from April 2015 to August 2020, BigCommerce from March 2015 to January 2020, DIRECTV from February 2011 until it was acquired by AT&T in July 2015, Lucasfilm from June 2011 until it was acquired by Disney in December 2012, McAfee, Inc., from December 2009 until it was acquired by Intel in February 2011, and Shopping.com from November 2004 until it was acquired by eBay in August 2005.
Qualifications and Contributions
Ms. Norrington is independent, has extensive experience in online commerce SaaS, and valuable management experience in the technology and manufacturing industries. Her four decades of building businesses and adapting to and capitalizing on rapid technological advancement provide Ms. Norrington with a unique perspective. Her executive and board experiences have provided her with the corporate governance skills required to serve on our Board and as Chair of our Corporate Governance and Nominating Committee. |
| | | | | |
| Betsy Rafael |
| Age: 62 | Director since 2013 | Independent until May 31, 2024 |
| Interim Chief Financial Officer: Former Audit (Chair) |
|
Ms. Rafael has over 30 years of executive financial experience in the technology industry. Ms. Rafael has served as Autodesk’s Interim Chief Financial Officer since May 31, 2024 and was previously our Audit Committee Chair. Previously, Ms. Rafael most recently served as Chief Transformation Officer at GoDaddy Inc., an Internet domain registrar and web hosting company, from May 2018 to November 2019. She served as Principal Accounting Officer of Apple Inc. from January 2008 to October 2012, and as its Vice President and Corporate Controller from August 2007 until October 2012. From April 2002 to September 2006, Ms. Rafael served as Vice President, Corporate Controller and Principal Accounting Officer of Cisco Systems, Inc., and held the position of Vice President, Corporate Finance at Cisco from September 2006 to August 2007. From December 2000 to April 2002, Ms. Rafael was the Executive Vice President, Chief Financial Officer, and Chief Administrative Officer of Aspect Communications, Inc., a provider of customer relationship portals. From April 2000 to November 2000, Ms. Rafael was Senior Vice President and CFO of Escalate, Inc., an enterprise e-commerce application service provider. From 1994 to 2000, Ms. Rafael held a number of senior positions at Silicon Graphics International Corp. (“SGI”), culminating her career at SGI as Senior Vice President and Chief Financial Officer. Prior to SGI, Ms. Rafael held senior management positions in finance with Sun Microsystems, Inc., and Apple Computers. Ms. Rafael began her career with Arthur Young & Company. Ms. Rafael has served on the board of directors of Informatica LLC, since July 2021, Proofpoint, Inc., from February 2021 through October 2021, and Kinaxis, Inc., since February 2020. She previously served on the boards of directors of Echelon Corporation from November 2005 to June 2018, GoDaddy Inc. from May 2014 to May 2018, Shutterfly, Inc., from June 2016 to September 2019, and PalmSource, Inc., from April 2004 to November 2005.
Qualifications and Contributions
Ms. Rafael has more than 30 years of executive financial experience in the technology industry. Her experience at GoDaddy, Apple, and Cisco, including her finance and executive roles, provides her with a strong understanding of Autodesk’s industry, business, and international operational challenges. |
| | | | | |
| Rami Rahim |
| Age: 53 | Director since 2022 | Independent |
| Autodesk Committees: Compensation and Human Resources |
|
Rami Rahim has over 25 years’ experience in the technology industry. He serves as Chief Executive Officer of Juniper Networks and is a member of Juniper’s Board of Directors. Mr. Rahim joined Juniper in January 1997 and was appointed as Chief Executive Officer in November 2014. Prior to being appointed to CEO, Mr. Rahim served as Executive Vice President and General Manager of the Juniper Development and Innovation (JDI) organization, overseeing the company's entire product and technology portfolio. Other leadership positions held at Juniper include Executive Vice President and General Manager of Platform Systems Division for routing and switching, Senior Vice President of the Edge and Aggregation Business Unit (EABU) and Vice President and General Manager of EABU.
Mr. Rahim earned a Bachelor of Science degree in electrical engineering from the University of Toronto and a Master of Science degree in electrical engineering from Stanford University. Mr. Rahim is a member of IEEE.
Qualifications and Contributions
Mr. Rahim is independent and has more than 25 years’ experience in the technology industry, and more than 10 years’ experience in leadership positions. His Chief Executive Officer experience at Juniper provides him with cybersecurity experience and a strong understanding of Autodesk’s industry, business, and global and domestic operational challenges. His experience as a CEO provides him with the experience necessary to serve on our Compensation and Human Resources Committee. |
INFORMATION ABOUT OUR EXECUTIVE OFFICERS
The following sets forth certain information as of May 31, 2024, regarding our executive officers.
| | | | | | | | | | | |
| Name | Age | | Position |
| Andrew Anagnost | 59 | | President and Chief Executive Officer |
Betsy Rafael | 62 | | Interim Chief Financial Officer |
| Steve M. Blum | 59 | | Executive Vice President and Chief Operating Officer |
| Ruth Ann Keene | 55 | | Executive Vice President, Corporate Affairs, Chief Legal Officer & Corporate Secretary |
| Rebecca Pearce | 46 | | Executive Vice President, Chief People Officer |
Andrew Anagnost joined Autodesk in September 1997 and has served as President and Chief Executive Officer since June 2017. For further biographical information, see “—Information About Our Directors” above.
Betsy Rafael joined Autodesk in May 31, 2024 and serves as Interim Chief Financial Officer. For further biographical information, see “—Information About Our Directors” above.
Steven M. Blum joined Autodesk in January 2003 and has served as Executive Vice President and Chief Operating Officer since November 1, 2022. He previously served as Executive Vice President and Chief Revenue Officer from December 2020 through January 2022 and as Vice President and Chief Revenue Officer from August 2020 to December 2020. Mr. Blum served as Executive Vice President, Worldwide Field Operations from December 2020 to November 2021 and as Senior Vice President, Worldwide Field Operations from September 2017 to December 2020. Mr. Blum served as Senior Vice President, Worldwide Sales and Services from February 2011 to September 2017. From January 2003 to February 2011, he served as Senior Vice President of Americas Sales. Prior to this position, Blum was Executive Vice President of Sales and Account Management for Parago, Inc. Blum also held positions at Mentor Graphics, most recently serving as Vice President of America's sales. Before joining Mentor Graphics, he held engineering and sales positions at NCR Corporation and Advanced Micro Devices.
Ruth Ann Keene joined Autodesk in January 2022 and has served as Executive Vice President, Corporate Affairs, Chief Legal Officer & Corporate Secretary since May 2022. Ms. Keene previously served as Senior Vice President, Chief Legal Officer, General Counsel & Corporate Secretary of Unity Technologies (“Unity”) from September 2016 to January 2022. Prior to joining Unity, Ms. Keene served as Vice President, Assistant General Counsel and Assistant Secretary of Autodesk from 2012 to 2016, and had served in various legal positions at Autodesk since August 2005. Before joining Autodesk, Ms. Keene was a technology transactions attorney at Morrison & Foerster, LLP.
Rebecca Pearce joined Autodesk in October 2015 and has served as Executive Vice President, Chief People Officer since January 2022. Ms. Pearce previously served as Vice President, People & Places from June 2020 to December 2021 and as Senior HR Director - Digital Platforms and Corporate Functions from September 2018 through May 2020. Ms. Pearce served as HR Director Global Territory Sales from February 2018 to September 2018 and as Asia Pacific and Japan HR Director from October 2015 through January 2018. Prior to joining Autodesk, Ms. Pearce was the HR Director Global Operations, R&D and Engineering for Dyson Limited from December 2011 to September 2015. Ms. Pearce also previously held leadership positions at Microsoft Corporation, including most recently as the Asia Pacific HR Leader for Microsoft Consumer and Online.
There is no family relationship among any of our directors or executive officers.
FISCAL YEAR 2024 BOARD MEETINGS
Each quarter, our Board holds Committee and Board meetings. At each quarterly Board meeting, time is set aside for the independent directors to meet without management present. Additional executive sessions are held as needed. In addition to the quarterly meetings, typically there are other regularly scheduled committee meetings each year.
During fiscal year 2024, the Board held a total of eight meetings (including regularly scheduled and special meetings), and its three standing committees (an Audit Committee, a Compensation and Human Resources Committee, and a Corporate Governance and Nominating Committee) held a collective total of 16 meetings. Each director attended 100% of the total number of meetings of the Board and committees of which he or she was a member during the period he or she served during fiscal year 2024.
Directors are encouraged, but not required, to attend the Annual Meeting of Stockholders. All of our then sitting directors attended the 2023 Annual Meeting of Stockholders.
The following table sets forth the number of meetings held by our Board and the committees during fiscal year 2024:
| | | | | | | | | | | | | | | | | | | | | | | | | | |
| | Board | | Audit | | Compensation and Human Resources | | Corporate Governance and Nominating |
| Number of meetings held in fiscal year 2024 | | 8 | | 8 | | 5 | | 3 |
BOARD COMMITTEES
To support effective corporate governance, our Board delegates certain responsibilities to its committees, who report on their activities to the Board. These committees have the authority to engage legal counsel or other advisors or consultants as they deem appropriate to carry out their responsibilities.
The table below provides summary information about each director’s committee membership and independence during fiscal year 2024 followed by a summary of each committee’s responsibilities. Each committee has a charter describing its specific responsibilities which can be found on our website at https://investors.autodesk.com/corporate-governance/highlights.
| | | | | | | | | | | | | | |
| Name | Independent | Committees |
| Audit Committee | Compensation and Human Resources Committee | Corporate Governance and Nominating Committee |
| Andrew Anagnost | | | | |
| Stacy J. Smith | ü CB | | | ü |
| Karen Blasing | ü | ü À | | |
| Reid French | ü | | ü | |
| Dr. Ayanna Howard | ü | ü | | |
| Blake Irving | ü | | | ü |
| Mary T. McDowell | ü | | C | |
| Stephen Milligan | ü | ü À | | |
| Lorrie M. Norrington | ü | | | C |
| Betsy Rafael* | ü | C À | | |
| Rami Rahim | ü | | ü | |
CB Non-Executive Chair of Board
C Committee Chair
ü Member
À Financial Expert, as defined in the rules of the SEC
* Ms. Rafael is now our Interim Chief Financial Officer, is not currently an independent director, and is no longer a member of the Audit Committee.
Audit Committee
The Audit Committee oversees Autodesk’s financial statements, compliance with our corporate, accounting, and reporting processes, our system of internal accounting and financial controls, and our management of related risks.
The Audit Committee’s responsibilities also include:
•selection, compensation, engagement, retention, termination, and services of our independent registered public accounting firm, including conducting a review of its independence;
•reviewing with management and our independent registered public accounting firm the adequacy of our system of internal financial and disclosure controls;
•reviewing our critical accounting policies and the application of accounting principles;
•reviewing our treasury policies and tax positions;
•overseeing the performance of our internal audit function;
•establishing and overseeing compliance with the procedures for handling complaints regarding accounting, internal accounting controls, or auditing matters, including procedures for confidential, anonymous submission of concerns by employees regarding accounting and auditing matters; and
•overseeing our management of cybersecurity risks relating to financial, accounting, and internal controls matters.
Corporate Governance and Nominating Committee
Our Corporate Governance and Nominating Committee oversees our corporate governance principles and policies, as well as the process to identify and nominate qualified individuals for Board membership, and Board and committee evaluations.
The Corporate Governance and Nominating Committee’s responsibilities include:
•developing general criteria regarding the qualifications and selection of members of the Board;
•determining skills, characteristics, and experiences desired for candidates and overseeing director succession planning;
•recommending candidates for election to the Board;
•developing overall governance guidelines;
•periodically reviewing matters related to our policies and practices concerning environmental, social and governance (“ESG”) initiatives, political contributions and lobbying activities;
•overseeing the performance and evaluation of the Board and individual directors; and
•reviewing and making recommendations regarding director composition and the mandates of Board committees.
Compensation and Human Resources Committee
The Compensation and Human Resources Committee oversees the compensation and benefits for our executive officers, recommends our CEO’s compensation to the independent members of the Board for approval, and grants stock options, RSUs, and PSUs to executive officers and non-executive employees under our stock plans.
As non-employee directors, the members of the Compensation and Human Resources Committee are not eligible to participate in Autodesk’s discretionary employee stock programs. For Fiscal Year 2024, RSUs were granted in June 2023 to all our non-employee directors, automatically, pursuant to the Director Compensation Policy and under the 2023 Equity Incentive Plan.
The Compensation and Human Resource Committee’s responsibilities also include:
•reviewing and approving the corporate goals and objectives relevant to our CEO and executive officer compensation;
•evaluating CEO and executive officer performance;
•reviewing executive and leadership development policies and practices;
•reviewing and administering Autodesk’s clawback policy;
•reviewing succession plans for our CEO and other senior management;
•periodically reviewing matters related to human capital management;
•overseeing matters relating to stockholder approval of executive compensation, including advisory say-on-pay votes; and
•overseeing the management of risks associated with our compensation policies and programs.
DELINQUENT SECTION 16(A) REPORTS
Section 16(a) of the Exchange Act requires our directors and executive officers, and persons who own more than 10% of a registered class of our equity securities, to file reports of ownership on Form 3 and changes in ownership on Form 4 or 5 with the SEC. Such executive officers, directors, and stockholders also are required by SEC rules to furnish us with copies of all Section 16(a) forms that they file.
Based solely on our review of the copies of such reports furnished to us and written representations that no other reports were required to be filed, we believe that all reports were filed on a timely basis.
CODE OF BUSINESS CONDUCT AND CODE OF ETHICS
In addition, we have had a longstanding Code of Business Conduct for our directors and employees as well as a Code of Ethics for Senior Executive and Financial Officers, including our principal executive officer, principal financial officer, principal accounting officer, all senior vice presidents, and all individuals reporting to our principal financial officer, to ensure that our business is conducted in a consistently legal and ethical manner. These codes are reviewed periodically and updated as appropriate. Our current Code of Business Conduct and Code of Ethics for Senior Executive and Financial Officers are available on our website at https://investors.autodesk.com/corporate-governance/highlights. We will post in the Investor Relations section of our website any amendment to our Code of Business Conduct or Code of Ethics for Senior Executive and Financial Officers, as well as any waivers of these Codes that are required to be disclosed by the rules of the SEC or the Nasdaq.
ITEM 11.EXECUTIVE COMPENSATION
Compensation Discussion and Analysis
Throughout this annual report, the individuals included in the Summary Compensation Table beginning on page 141 are referred to as our “named executive officers” or “NEOs.” For fiscal year 2024, our NEOs were:
•Andrew Anagnost, Chief Executive Officer and President;
•Deborah L. Clifford, former Executive Vice President and Chief Financial Officer and current Chief Strategy Officer;
•Steven M. Blum, Executive Vice President and Chief Operating Officer;
•Ruth Ann Keene, Executive Vice President, Corporate Affairs, Chief Legal Officer and Corporate Secretary;
•Rebecca Pearce, Executive Vice President and Chief People Officer.
The information in this discussion provides perspective and narrative analysis relating to, and should be read along with, the executive compensation tables beginning on page 141.
Our Compensation Discussion and Analysis provides an overview of our business performance in fiscal year 2024, highlights the key components and structure of our executive compensation program, discusses the principles underlying our compensation policies and practices, and addresses other matters we believe explain and demonstrate our performance-based compensation philosophy.
Executive Summary
Fiscal Year 2024 Strategic Priorities and Performance Highlights
Autodesk empowers innovators to achieve the new possible, delivering technology that enables our customers to achieve better outcomes for their products, businesses, and the world. In fiscal year 2024, we delivered record revenue and operating income while maintaining healthy free cash flow through the first year of our transition from up-front to annual billings for multi-year contracts. The most significant free cash flow headwinds from this transition are now behind us which means our free cash flow reached its trough during fiscal 2024 and will mechanically rebuild over the next few years.
We achieved strong financial and competitive performance in fiscal 2024 despite macroeconomic, policy and geopolitical related headwinds. Several factors contributed to our performance, including strong renewal rates, resilient new business growth, and expansion from a large renewal cohort of enterprise business agreements which included up-front revenue.
Our resilience comes from our subscription business model and our product and customer diversification, which balances growth across different regions and industries. Disciplined and focused execution and strategic deployment of capital through the economic cycle will drive even greater operational velocity and efficiency within Autodesk, which will free up further resources to invest in our industry clouds and capabilities, including AI, and to sustain margin improvement.
By introducing a new transaction model to engage more directly with our customers and solution providers, we are approaching the final phase of modernizing our go-to-market motion, which has involved updating our infrastructure, retiring old systems and business models, and nurturing more direct relationships with our customers and ecosystem. We are also undertaking a multi-year process to evolve our products into lifecycle solutions within and between our industry clouds,
powered by shared platform services, and with Autodesk’s Data Model at its core. Together, these will enable Autodesk, our customers, and partners, to build more valuable, data-driven, and connected products and services.
Empowering innovators with design-and-make technology to achieve the new possible also enables them to build and manufacture efficiently and sustainably. We continue to execute well in challenging times and look forward to the years ahead with excitement and optimism.
Fiscal Year 2024 Financial Highlights
•Total revenue was $5.50 billion, an increase of 10 percent as reported, and 13 percent on a constant currency basis. Recurring revenue represents 98 percent of total.
•GAAP operating income was $1.13 billion, compared to $989 million last year. GAAP operating margin was 21 percent, up 1 percentage point.
•Total non-GAAP income from operations was $1.96 billion, compared to $1.79 billion last year. Non-GAAP operating margin was 36 percent, flat compared to the prior period.(1)
•Cash flow from operating activities decreased to $1.31 billion, compared to $2.07 billion in fiscal 2023. Free cash flow decreased to $1.28 billion, compared to $2.03 billion in fiscal 2023(1). Our free cash flow experienced a trough during fiscal year 2024 due to our transition from up-front to annual billings for multi-year contracts.
•GAAP diluted net income per share was $4.19, compared to $3.78 last year.
•Non-GAAP diluted net income per share was $7.60, compared to $6.63 last year.(1)
•1-Y Total Shareholder Return is 18% from fiscal year 2023. 5-Y Total Shareholder Return is 72% from fiscal year 2019.
_____________________________
(1) A reconciliation of GAAP to non-GAAP results is provided in Part II, Item 7, “Management's Discussion and Analysis of Financial Condition and Results of Operations”, “Reconciliation of GAAP Financial Measures to Non-GAAP Financial Measures.”
Fiscal Year 2024 Executive Compensation Highlights
Pay Decisions based on Performance Results
The Compensation and Human Resources Committee (the “Committee”) believes that total compensation for our named executive officers should closely align with performance. In fiscal year 2024, we used the following performance metrics to determine the performance-based pay outcomes for the NEOs:
| | | | | |
| Incentive Program | Performance Metrics |
Executive Incentive Plan (EIP) | Total Revenue Non-GAAP Income from Operations |
| Long-Term Incentives — Performance Share Units (PSU) | Total Revenue Free Cash Flow Relative TSR (as defined below) (over 1, 2, and 3 years) |
In March 2024, the Committee made the following determinations relating to the compensation of our NEOs based on Company’s performance against the pre-determined goals. The Committee did not make any discretionary adjustments to the incentive payouts.
| | | | | |
| Fiscal Year 2024 Executive Incentive Plan Results | Based on our fiscal year 2024 financial results, the Committee determined that, based on attainment of the performance metrics for Autodesk’s 2024 Executive Incentive Plan (“EIP”) would be funded at 96.9% for our CEO and other NEOs at the end of fiscal year 2024. |
| Performance Share Unit Results | For each award, the Committee measured performance based on Autodesk’s achievement of 97.5% of the total revenue and free cash flow targets established for fiscal year 2024 and relative total stockholder return (“TSR”) over one-, two-, and three-year performance periods, respectively. The Committee certified the attainment levels for performance measures for tranches of PSUs awarded in April 2023, April 2022, and April 2021. |
Emphasis on Variable “At Risk” Performance-Based Executive Compensation
Our executive compensation program emphasizes variable compensation with both annual and long-term performance components. In fiscal year 2024, 95% of our CEO’s and 91% of other NEOs’ total compensation was variable in nature and “at risk”. 88% of our CEO’s and 83% of other NEOs’ total compensation consisted of long-term equity. Our incentive programs reward strong annual financial and operational performance, as well as relative TSR over one-, two-, and three-year performance periods. The charts below illustrate the fiscal year 2024 pay mix between base salary and targeted short- and long-term equity compensation for our CEO and all other NEOs.
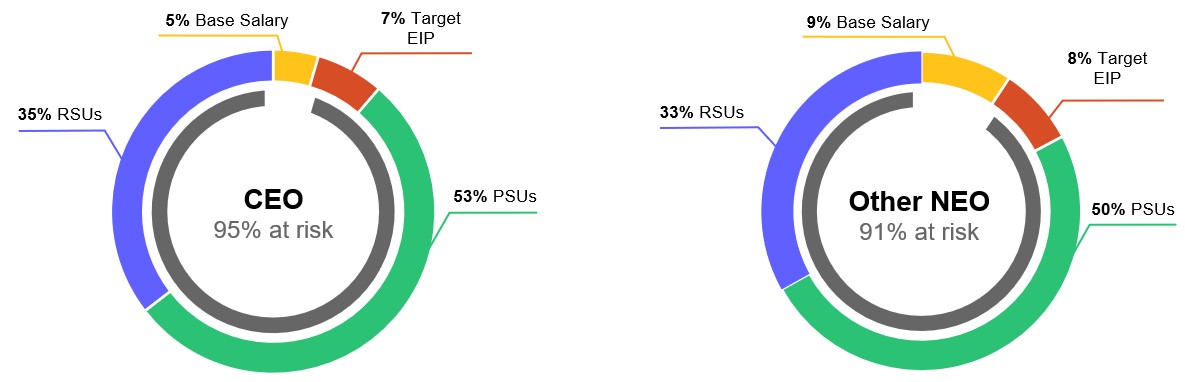
Additionally, to drive the achievement of our key strategic Environmental, Social, and Governance (“ESG”) priorities around environmental sustainability and philanthropy as well as diversity, inclusion and belonging, our executive compensation program allows for the CEO to recommend to the Committee adjustments to awards for the other NEOs based on ESG performance. Given that long-term incentive awards are the largest component of NEO compensation, ESG adjustments will generally focus on equity grants. The Committee will take into account the CEO’s recommendations when determining the final awards for the other NEOs, and will also consider the overall company progress and outcomes on ESG when it determines long-term incentive awards for the CEO.
Only when we significantly exceed our ESG goals or fail to achieve these metrics are long-term incentive awards adjusted upward or downward. For fiscal year 2024, the CEO and Committee concluded that the leadership team’s performance aligned with expectations for progress on ESG initiatives and therefore adjustments to NEO’s long-term incentive awards were not warranted.
Say-on-Pay Results and Stockholder Outreach
Autodesk and the Committee value the input of our stockholders. The Committee carefully considers stockholder feedback as part of its ongoing review of our executive compensation programs, design, and metrics, and this feedback has informed changes the Committee has made in recent years to align our programs with our business transformation. At the 2023 Annual Meeting, 89.5% of the votes cast on our say-on-pay proposal were favorable, reflecting strong stockholder support for our executive compensation programs. In fiscal year 2024, members of our management team and, in certain instances, independent members of our Board continued our regular outreach and contacted stockholders representing approximately 50% of our outstanding shares. Our management team, and in some cases our independent Chair, met with representatives from active and passive funds to discuss strategy, our executive and employee compensation programs, capital allocation, progress
on our sustainability strategy, workforce diversity, board composition and skill sets, sustainability, and a broad range of other ESG issues. This outreach enabled us to gather feedback from a significant cross-section of Autodesk’s stockholder base. Based on these discussions, the Committee found that our stockholders continued to support our executive compensation programs and the alignment.
Compensation Guiding Principles
The Committee believes that Autodesk’s executive compensation program should be designed to attract, motivate, and retain talented executives and should provide a rigorous framework that is tied to stockholder returns, company performance, long-term strategic corporate goals, and individual performance. The general compensation objectives are to:
•Recruit and retain the highest caliber of executives through competitive rewards;
•Motivate executive officers to achieve business and financial goals;
•Balance rewards for short- and long-term performance; and
•Align rewards with stockholder value creation.
Within this framework, the total compensation for each executive officer varies based on multiple dimensions:
•Whether Autodesk achieves its short-term and long-term financial and non-financial objectives;
•Autodesk’s TSR relative to companies in the North American Technology Software Index;
•Autodesk’s progress towards its ESG objectives;
•The specific roles and responsibilities of the officer;
•Each officer’s skills, capabilities, contributions, and performance;
•Internal pay alignment considerations; and
•Retention considerations.
Leading Compensation Governance Practices
Autodesk’s executive compensation objectives are supported by policies and strong governance practices that align executives’ interests with the interests of our stockholders. Some of the program’s most notable features are highlighted in the table and summarized below.
| | | | | | | | | | | | | | |
| What We Do | | | What We Do Not Do |
| a | Engage in robust stockholder outreach | | x | Allow hedging, pledging, or trading in Autodesk derivative securities |
| a | Tie a significant percentage of NEO total pay to achievement of critical financial objectives and stockholder value creation | | x | Reprice stock options |
| a | Employ maximum payouts on performance-based cash and equity incentive compensation | | x | Offer executive benefits that differ from those offered to our other salaried employees or excessive perquisites |
| a | Require significant stock ownership holdings | | x | Use fixed-term employment agreements |
| a | Include a clawback policy in incentive programs | | | |
| a | Provide double-trigger change in control arrangements with no excise tax gross-up | | | |
| a | Ensure effective risk management | | | |
| a | Rely on an independent compensation committee and engage an independent compensation consultant | | | |
The Compensation-Setting Process
The Committee reviews and approves all components of each executive officer’s compensation.
CEO Pay Decisions
Throughout the year, the Committee and other independent members of the Board, including the Chair, review the performance of, and provide feedback to, our CEO at regularly scheduled meetings and through informal discussions. Annually, the Committee meets and discusses with other independent members of the Board the performance of our CEO in light of corporate goals and objectives. The Committee, without the CEO in attendance, took this assessment into account, along with competitive compensation data, in determining our CEO’s compensation. Performance targets are intended to be aggressive yet achievable with diligent effort during the fiscal year. As part of its deliberations on CEO compensation, the Committee consulted with its independent consultant and the other independent directors prior to approving our CEO’s compensation.
Executive Officer Pay Decisions
Our CEO makes recommendations to the Committee regarding the base salary, annual cash incentive awards (EIP), and equity awards for each executive officer other than himself. These recommendations are based on our CEO’s assessment of each executive officer’s performance during the year, competitive compensation data, internal pay alignment, and retention considerations. Our CEO reports on the performance of the executive officers and their business functions during the year in light of corporate goals and objectives. He bases his evaluation on his knowledge of each executive officer’s performance and input from other individuals, including feedback provided by the executive officers, their colleagues, and their direct reports. Members of our People and Places organization assist our CEO in assessing each executive officer’s performance and providing market compensation data for each role. In executing the responsibilities set forth in its charter, the Committee relies on a number of resources to provide input to the decision-making process.
Independent Consultant
The Committee retained Exequity LLP as its compensation adviser for fiscal year 2024. Exequity provided advice and recommendations on a number of issues, including total compensation philosophy; program design, including program goals, components, and metrics; peer data; compensation trends in the technology sector and general market for senior executives; separation plans; the compensation of our CEO and our other executive officers; and disclosure of our executive pay programs. The Committee has considered the independence of Exequity in light of Nasdaq’s listing standards for compensation committee independence and the rules of the SEC, and requested and received written confirmation from Exequity addressing the independence of the firm and its senior advisers working with the Committee. The Committee discussed these considerations and concluded that the work performed by Exequity did not raise any conflict of interest.
Management
The Committee also consults with management and Autodesk’s People and Places organization regarding executive and non-executive employee compensation plans, including administration of Autodesk’s equity incentive plans.
Competitive Compensation Positioning and Peer Group
To ensure our executive compensation practices are competitive and consistent with the Committee’s guiding principles, Exequity and management provide the Committee with compensation data for each executive role. This data is drawn from a group of companies in relevant industries that compete with Autodesk for executive talent. The Committee uses this data, as well as information about broader technology industry compensation practices, when evaluating the compensation of our executive officers.
The compensation peer group is selected based upon multiple criteria, including industry positioning, competition for executive talent, revenue, market capitalization, financial results, and geographic footprint. The Committee reviews the compensation peer group each year to ensure that the comparisons remain meaningful and relevant. Based on the Committee’s review in September 2022, no changes were made to the peer group. The fiscal year 2024 compensation peer group consisted of the following companies:
| | | | | | | | | | | | | | |
| Company | | Revenue for the Most Recent Completed Fiscal Year
(in billions) | | Market Capitalization as of 1/31/2024 (in billions) |
| Adobe Inc. | | 19.4 | | 281.1 |
| Akamai Technologies, Inc. | | 3.8 | | 18.6 |
| ANSYS, Inc. | | 2.3 | | 28.5 |
| Block, Inc. | | 21.9 | | 40.0 |
| Cadence Design Systems, Inc. | | 4.1 | | 78.4 |
| Citrix Systems, Inc. | | 3.2 | | N/A (1) |
| DocuSign, Inc. | | 2.8 | | 12.5 |
| Electronic Arts Inc. | | 7.4 | | 36.9 |
| Fortinet, Inc. | | 5.3 | | 49.1 |
| Gen Digital Inc. | | 3.3 | | 15.0 |
| Intuit Inc. | | 14.4 | | 176.8 |
| NetApp, Inc. | | 6.4 | | 18.0 |
| Palo Alto Networks, Inc. | | 6.9 | | 109.2 |
| PTC Inc. | | 2.1 | | 21.6 |
| Salesforce, Inc. | | 34.9 | | 272.9 |
| ServiceNow, Inc. | | 9.0 | | 156.7 |
Splunk Inc. (2) | | 4.2 | | 25.9 |
| Synopsys, Inc. | | 5.8 | | 81.4 |
| Workday, Inc. | | 7.3 | | 76.8 |
| Autodesk, Inc. | | 5.5 | | 54.3 |
| Autodesk Percentile Ranking | | 47th | | 56th |
_____________
(1) Citrix Systems was acquired in September 2022.
(2) Splunk Inc. was acquired by Cisco in March 2024.
In September 2023, the Committee reviewed the compensation peer group that would be used for fiscal year 2025 compensation decision making. The Committee determined that for fiscal year 2025, all of the fiscal year 2024 peer group companies would still be appropriate to use except for Citrix Systems, which was removed from the peer group due to its acquisition in late 2022.
When determining the base salary, incentive targets, equity grants, and target total direct compensation opportunity for each of our NEOs, the Committee references the median data from our compensation peer group for each component and in the aggregate. Actual compensation awards may be above or below the median levels, depending on Autodesk’s financial and operational performance and each executive officer’s experience, skills, and performance. The Committee believes that referencing the total compensation packages of the companies in the compensation peer group keeps Autodesk’s compensation competitive and within market norms. This also provides flexibility for variances in compensation where appropriate, based on each executive officer’s leadership, contributions, and particular skills or expertise as well as retention considerations.
Principal Elements of the Executive Compensation Program
The principal elements of Autodesk’s fiscal year 2024 executive compensation program for the CEO and other NEOs are described below.
| | | | | | | | | | | | | | | | | | | | |
| Component | | Purpose | | Description | | Performance Measures |
Base Salary | | Forms basis for overall competitive compensation package | | Reflects competitive market conditions, individual performance, and internal alignment | | The Committee considers individual performance when setting and reviewing base salary levels and merit increases |
| | |
| | | | | | |
Executive Incentive Plan (“EIP”), at Targeted Levels | | Motivate achievement of annual strategic priorities relating to top- and bottom-line growth
| | Target percentage based on competitive market practices and internal alignment Actual bonus ranges from 0% to 200% of target and is determined by performance versus goals established at the beginning of the performance period | | Total revenue Non-GAAP income from operations |
| | |
| | | | | | |
Long-Term Incentives —Performance Stock Units (“PSU”), at Grant-Date Fair Values
| | Align compensation with key drivers of the business and relative total stockholder return Encourage focus on near-term and long-term strategic objectives | | Size of award based on competitive market practices, corporate and individual performance, and internal alignment Actual number of shares vested ranges from 0% to 200% of target and is determined by performance versus goals established at the beginning of the performance period | | Total revenue Free cash flow Autodesk’s relative TSR over one-, two-, and three-year performance periods Performance in relation to our ESG objectives Autodesk stock price |
| | |
| | | | | | |
Long-Term Incentives — Restricted Stock Units (“RSU”)
| | Encourage focus on long-term stockholder value creation Retention | | Size of award based on competitive market practices, corporate and individual performance, internal alignment, and retention considerations Recipients earn shares if they remain employed through the three-year vesting period | | Autodesk stock price |
| | |
| | | | | | |
When setting the fiscal 2024 goals for the annual cash incentive opportunity and PSUs, the Committee considered the overlap of total revenue as a performance metric in both programs to be appropriate. Total revenue is a key metric indicator of Autodesk’s success, and the Committee believes it is important to incentivize performance in both the short-term and long-term timeframes by using this as a metric in both our annual and long-term plans, with multiple measurement periods. The use of non-GAAP income from operations in our annual cash incentive and free cash flow as well as relative TSR over one-, two-, and three-year performance periods against market indices as a modifier for the PSUs further differentiates the short- and long-term incentives and aligns those awards with the achievement of Autodesk’s strategic goals and the long-term interests of our stockholders.
Base Salary
Base salary is used to provide our executive officers with a competitive amount of fixed annual cash compensation. The Committee views base salary as a reliable source of income for the executive officers and an important recruiting and retention tool. The Committee sets base salaries at a competitive level that recognizes the scope, responsibility, and skills required of each position, as well as market conditions and internal pay alignment.
As part of the annual review of base salaries, the Committee reviews a competitive benchmarking analyses for each executive role, and an assessment of each executive officer’s experience, skills, responsibilities, and performance level. For fiscal year 2024, after taking account of the above considerations, the Committee determined to hold Dr. Anagnost’s base salary flat, and otherwise made salary adjustments for our NEOs as shown in the table below. The Committee set Ms. Pearce’s base salary at the lower end of the competitive range last year because she was newly promoted to the Chief People Officer’s role. Given her accomplishments over the past year, the Committee adjusted her base salary to a position which more appropriately reflects her skills, experience and performance, and that better aligns with peer practices.
| | | | | | | | | | | | | | | | | | | | |
| Named Executive Officer | | Fiscal Year 2023 Base Salary | | Fiscal Year 2024 Base Salary | | % Change Compared to Prior Fiscal Year |
| Andrew Anagnost | | $1,040,000 | | $1,040,000 | | — | % |
| Deborah L. Clifford | | $625,000 | | $650,000 | | 4 | % |
| Steven M. Blum | | $700,000 | | $700,000 | | — | % |
| Ruth Ann Keene | | $530,000 | | $540,000 | | 2 | % |
| Rebecca Pearce (1) | | $381,300 | | $482,684 | | 27 | % |
_____________
(1) Ms. Pearce’s base salary is paid in British Pounds. The amounts represent the approximate dollar value of her base salary converted to U.S. dollars using the British Pound to dollar exchange rates of 1.23 and 1.25, which represent an average for fiscal years 2023 and 2024, respectively.
Annual Short-Term Incentive Compensation
At the beginning of each fiscal year, the Committee establishes target award opportunities, payout metrics, and performance targets for the Autodesk, Inc., Executive Incentive Plan (“EIP”). This annual cash incentive is intended to motivate and reward participants for achieving company-wide annual financial and non-financial objectives as well as individual objectives.
Target Award Opportunities and Fiscal Year 2024 Executive Incentive Plan
The Committee sets the target annual cash incentive award opportunity for each eligible executive officer based on competitive assessments, the executive’s particular role, and internal alignment considerations. These target opportunities are expressed as a percentage of the NEO’s annual base salary. Based on its review of these factors, the Committee maintained the CEO’s target annual incentive opportunity at 150% of his annual base salary for fiscal year 2024. The Committee increased other NEOs’ target opportunities from 75% to 80% of their annual base salaries for fiscal year 2024. An NEO may receive an earned award that is greater or less than the target award opportunity, depending upon Autodesk’s and the NEO’s performance.
In fiscal year 2024, bonus awards for each of our NEOs were funded under the EIP program. At the beginning of the fiscal year, the Committee established funding performance thresholds, which, if achieved, would establish the maximum fiscal year 2024 EIP funding at 200% of target. For fiscal year 2024, the Committee selected total revenue, non-GAAP income from operations, and absolute TSR as the funding metrics. Autodesk’s fiscal year 2024 performance exceeded the funding threshold, resulting in the maximum bonus award funding for each executive. The Committee then exercised its negative discretion to reduce the actual bonus award for each of the participants based on pre-established performance measures, as described below.
Company Performance Measures and Performance
At the beginning of fiscal year 2024, the Committee approved fiscal year 2024 EIP performance measures to align our CEO’s and other NEOs’ bonus opportunities with our strategic priorities and key drivers of success. In its exercise of negative discretion, the Committee considered the performance attained versus the pre-established performance targets to determine payouts. For our CEO and other NEOs, the Committee assessed the performance of Autodesk against targets set at the beginning of the fiscal year based on the criteria below; the final award could range from 0% to 200% of the target award. This calculation yielded a bonus payout of 96.9% of target, as shown below:
| | | | | | | | | | | | | | | | | | | | | | | | | | | | | | | | | | | | | | |
| Performance Metric (1) | | Weighting | | Actual
(millions) | | Target
(millions) | | Performance Attainment % | | Funding | | Weighted EIP Funding % |
| Total Revenue | | 60% | | $5,497 | | $5,532 | | 99.4% | | 96.8% | | 58.1% |
| Non-GAAP Income from Operations | | 40% | | $1,962 | | $1,991 | | 98.5% | | 97.0% | | 38.8% |
Total | | 100% | | | | | | | | | | 96.9% |
_________________
(1)Consistent with our EIP administrative guidelines, the fiscal year 2024 total revenue and non-GAAP income from operations results were not adjusted for acquired entities.
Based on the level of achievement of the EIP program performance objectives,in March 2024 the Committee approved short-term incentive awards for the NEOs as shown below:
| | | | | | | | | | | | | | | | | | | | | | | | | | |
| Named Executive Officer | | Short-Term Incentive
Target as a Percentage of
Base Salary | | Short-Term Incentive Target (1) | | Short-Term Incentive Payout | | Short-Term Incentive Payout as a Percentage of Target |
| Andrew Anagnost | | 150% | | $1,560,000 | | $1,511,640 | | 96.9% |
| Deborah L. Clifford | | 80% | | $516,767 | | $500,747 | | 96.9% |
| Steven M. Blum | | 80% | | $560,000 | | $542,640 | | 96.9% |
| Ruth Ann Keene | | 80% | | $430,707 | | $417,355 | | 96.9% |
| Rebecca Pearce | | 80% | | $372,798 | | $361,241 | | 96.9% |
_________________
(1) Short-term incentive target amounts are based on actual salary earnings during FY24, which may differ from approved FY24 salaries due to the effective date of salary increases.
Fiscal Year 2025 Short-Term Incentive Compensation
In fiscal year 2025, the bonus awards for each of our NEOs will continue to be determined under the Autodesk, Inc. Executive Incentive Plan. Near the beginning of the fiscal year, the Committee approved the continuation of total revenue, non-GAAP income from operations, and absolute TSR as the threshold funding metrics. If the funding metrics are achieved, in its exercise of discretion, the Committee will consider Autodesk’s performance attainment versus pre-established targets to determine payouts against total revenue and non-GAAP income from operations, which have been retained as the performance metrics for the ultimate determination of bonus payments, with the following weighting:
| | | | | | | | |
| Performance Metric | | Weighting |
| Total Revenue | | 60% |
| Non-GAAP Income from Operations | | 40% |
The Committee believes that the metrics selected for the fiscal year 2025 EIP will align our incentives with key drivers of success. The final awards for our NEOs could range from 0% to 200% of target, depending on the performance achieved. In selecting total revenue and non-GAAP income from operations, the Committee also considered stockholder feedback in support of simplicity, metrics that reflect our evolved business model, and focus on profitability, as well as the practices of our peer companies. The Committee continuously assesses our compensation program structure and metrics to respond to business needs, industry practices, and the talent market.
Long-Term Incentive Compensation
Autodesk uses long-term incentive compensation in the form of equity awards to align executive pay opportunities with stockholder value creation and to motivate and reward executive officers for effectively executing longer-term strategic and operational objectives.
Fiscal Year 2024 Annual Long-Term Equity Awards
During fiscal year 2024, the Committee approved annual equity awards in the form of PSUs and restricted stock units (“RSUs”) for our NEOs. The Committee elected to continue to use a mix of 60% PSUs and 40% RSUs for each of our NEOs, including our CEO, to complement the performance aspects of PSUs with the long-term retention element of RSUs.
In arriving at the value of PSUs and RSUs to award each executive officer in fiscal year 2024, the Committee considered Autodesk’s performance in fiscal year 2023, competitive market data for the executive’s position, historical grants, unvested equity, individual performance of the executive, ESG performance and internal pay alignment.
For fiscal year 2024, we added more structure to our approach to linking ESG to NEO long-term incentive awards. As part of this effort, we defined quantitative and qualitative measures that leaders were assessed against to inform the CEO’s recommendations to the Committee for the other NEOs and the Committee’s determination of the final awards for all NEOs. These metrics focus on diversity and belonging (D&B) and environmental sustainability, including:
•Employee belonging and engagement outcomes
•Turnover rates and representation of women and people of color
•Achievement of decarbonization, greenhouse gas neutralization, and renewable energy goals
•Executive involvement in and support of employee groups, external organizations, and other efforts that promote diversity, belonging, and environmental sustainability
Only when we significantly exceed our ESG goals or fail to achieve these metrics are long-term incentive awards adjusted upward or downward. For fiscal year 2024, the CEO and Committee concluded that the leadership team’s performance aligned with expectations for progress on ESG initiatives and therefore adjustments to NEO’s long-term incentive awards were not warranted.
As a result of this analysis, the following equity awards were approved in fiscal year 2024:
| | | | | | | | | | | | | | | | | | | | | | | | |
Named Executive Officer | | Target Value of PSU and RSU Award | | Target PSU Award (#) (1) | | RSU Award (#) (1) | | | | |
| Andrew Anagnost | | $20,400,000 | | | 61,129 | | | 40,753 | | | | | |
| Deborah L. Clifford | | $6,000,000 | | | 17,979 | | | 11,986 | | | | | |
| Steven M. Blum | | $7,500,000 | | | 22,474 | | | 14,982 | | | | | |
| Ruth Ann Keene | | $3,800,000 | | | 11,386 | | | 7,591 | | | | | |
| Rebecca Pearce | | $3,800,000 | | | 11,386 | | | 7,591 | | | | | |
_________________
(1)Number of shares determined by the weighting of PSUs and RSUs and the average closing stock price over the last 20 trading days prior to the date of grant.
PSU Awards
Our current PSU design was adopted following extensive stockholder outreach and incorporates a number of features our stockholders have identified as being most important, including multiple performance metrics, TSR relative to peers, and multi-year relative TSR measurement periods.
The PSU awards provide for a minimum, target, and maximum number of shares to be earned based upon predetermined performance criteria.
•For fiscal year 2024 awards, PSU vesting will be based on achievement of performance goals adopted by the Committee (“Performance Results”) and Autodesk’s TSR compared against companies in the S&P North American Technology Software Index with a market capitalization over $2 billion (“Relative TSR”) over one-, two-, and three-year performance periods.
•In fiscal year 2024, we measured Performance Results based on total revenue and free cash flow. To create a more predictable cash flow and align with industry standards for subscription business, Autodesk transitioned from up-front to annual billing for multi-year contracts in fiscal year 2024 with an understanding that this transition would create a significant headwind for free cash flow that fiscal year which would abate in fiscal year 2025. As a result, the free cash flow target was set at a level which was lower than fiscal year 2023.
•The use of multiple goals motivates management to drive Autodesk’s growth as well as focus on fundamental metrics used by investors to assess our performance. Combining a one-year financial performance period with one-, two-, and three-year Relative TSR performance periods provides a balance of short- and long-term focus, ensures sufficient line of sight and aligns stockholder interests.
Performance Results for the relevant performance period could result in PSU attainment of 0% to 150% of target. Once the Performance Results percentage is established, it is multiplied by a percentage ranging from 67% to 133%, depending on
Autodesk’s Relative TSR for the period. The combined impact of these performance criteria is that PSUs could be earned from 0% to 200% of target. The chart below illustrates the attainment mechanics for the PSUs approved in fiscal year 2024.
| | | | | | | | | | | | | | |
Fiscal Year 2024
(First PSU Tranche) | | Fiscal Year 2025
(Second PSU Tranche) | | Fiscal Year 2026
(Third PSU Tranche) |
| | | | |
Fiscal Year 2024 Target Shares Multiplied by: Fiscal Year 2024 Financial Performance (0%-150% of Target) Multiplied by: Fiscal Year 2023-2024 Relative TSR (+/- 33%) | | Fiscal Year 2025 Target Shares Multiplied by: Fiscal Year 2025 Financial Performance (0%-150% of Target) Multiplied by: Fiscal Year 2023-2025 Relative TSR (+/- 33%) | | Fiscal Year 2026 Target Shares Multiplied by: Fiscal Year 2026 Financial Performance (0%-150% of Target) Multiplied by: Fiscal Year 2023-2026 Relative TSR (+/- 33%) |
An executive who has received PSU grants in three successive years will have a portion of the total PSU shares vesting in the third year based on each of 3-year, 2-year and 1-year Relative TSR (see “Vesting of PSUs” below for an illustration of this cumulative effect of multiple PSU grants).
Vesting of PSUs in 2024
In March 2024, the Committee reviewed and certified the attainment levels for performance measures for the third tranche of PSUs awarded in April 2021, the second tranche of PSUs awarded in April 2022, and the first tranche of PSUs awarded in April 2023. For each award, the Committee certified the following performance:
| | | | | | | | | | | | | | | | | | | | | | | | | | | | | | | | | | | | | | |
| Performance Metric (1) | | Weighting | | Actual
(in millions) | | Target
(in millions) | | Performance Attainment % | | Funding | | Weighted Funding |
| Total Revenue | | 60% | | $5,497 | | $5,532 | | 99.4% | | 96.8% | | 58.1% |
| Free Cash Flow | | 40% | | $1,282 | | $1,300 | | 98.6% | | 98.6% | | 39.4% |
| Total | | 100% | | | | | | | | | | 97.5% |
_________________
(1)Consistent with administrative guidelines for PSUs, the fiscal year 2024 total revenue and free cash flow results were not adjusted for acquired entities.
Autodesk’s Relative TSR was based on:
| | | | | | | | | | | | | | | | | | | | |
| Performance Period | | Autodesk TSR (1) | | Percentile Rank (2) | | Payout Multiplier |
| Fiscal Year 2022 - Fiscal Year 2024 | | -14% | | 41st Percentile | | 88% |
| Fiscal Year 2023 - Fiscal Year 2024 | | 5% | | 48th Percentile | | 98% |
| Fiscal Year 2024 | | 18% | | 32nd Percentile | | 77% |
_________________
(1)Based on the 31-day average closing stock price (+/- 15 days) at the beginning of each period and the end of fiscal year 2024.
(2)Relative TSR was measured against companies in the S&P North American Technology Software Index with a market capitalization over $2 billion.
The combination of financial attainment and Relative TSR results yielded the following PSU vesting in fiscal year 2024:
| | | | | | | | | | | | | | | | | | | | |
April 2021
3rd Tranche of
Fiscal Year 2022 Award | : | Fiscal Year 2024 Financial
Goal Funding
97.5% | X | Fiscal Year 2022 - Fiscal Year 2024
Relative TSR
88% | = | Percent of PSU Target Award
86% |
| | | | | |
April 2022
2nd Tranche of
Fiscal Year 2023 Award | : | X | Fiscal Year 2023 - Fiscal Year 2024
Relative TSR
98% | = | Percent of PSU Target Award
96% |
| | | | | |
April 2023 1st Tranche of Fiscal Year 2024 Award | : | X | Fiscal Year 2024 Relative TSR 77% | = | Percent of PSU Target Award
75% |
Based on this performance, the PSU awards were earned as follows:
| | | | | | | | | | | | | | | | | | | | | | | | | | | | | | | | | | | | | | |
| | April 2021 Award 3rd Tranche | | April 2022 Award 2nd Tranche | | April 2023 Award 1st Tranche |
| Named Executive Officer | | Target Number of PSUs | | Actual Number of PSUs Earned | | Target Number of PSUs | | Actual Number of PSUs Earned | | Target Number of PSUs | | Actual Number of PSUs Earned |
| Andrew Anagnost | | 11,757 | | 10,111 | | 17,047 | | 16,365 | | 20,377 | | 15,282 |
| Deborah L. Clifford | | 3,057 | | 2,629 | | 4,762 | | 4,571 | | 5,993 | | 4,494 |
| Steven M. Blum | | 2,912 | | 2,504 | | 5,809 | | 5,576 | | 7,492 | | 5,619 |
| Ruth Ann Keene | | N/A | | N/A | | 3,333 | | 3,199 | | 3,796 | | 2,847 |
| Rebecca Pearce | | 364 | | 313 | | 2,935 | | 2,817 | | 3,796 | | 2,847 |
RSU Awards
RSUs are a typical long-term incentive offered among our peers and in general industry, and these awards help us recruit and retain executives in a competitive environment and provide further incentive to focus on longer-term stockholder value creation. In April 2023, our NEOs received time-based RSU awards which vest in three equal annual installments, beginning in March 2024.
Fiscal Year 2025 Equity Awards
For fiscal year 2025, the Committee elected to grant our NEOs 60% of their annual equity in PSUs and 40% in RSUs to align their compensation with Company performance. The fiscal year 2025 PSU awards are structured in the same manner as the fiscal year 2024 PSU awards. The Company’s financial performance will continue to be measured based on the following metrics:
| | | | | | | | |
| Performance Metric | | NEO Weighting |
| Total Revenue | | 60% |
| Free Cash Flow | | 40% |
The Committee selected total revenue and free cash flow as the fiscal year 2025 PSU performance metrics to align our executives' incentives with these key drivers of stockholder value. The Committee determined the overlap of total revenue in the short-term incentive and the PSUs to be appropriate in light of the importance of this goal, the use of different second metrics in the two incentives, and the use of relative TSR modifiers for the PSUs. In fiscal year 2025, the Committee also considered progress and outcomes on diversity and belong (D&B) and environmental sustainability when determining long-term incentive awards for NEOs.
The financial performance results will continue to be adjusted based on Autodesk’s Relative TSR over one-, two-, and three-year performance periods with a relative TSR modifier range of 67% to 133%. The payout of the PSUs will continue to range from 0% to 200% of target.
Executive Benefits
Welfare and Other Employee Benefits
Benefits provided to our executive officers are generally the same as those provided to all other eligible Autodesk employees. In the United States, these benefits include medical, dental, and vision insurance, 401(k) retirement plan with company matching contributions, an employee stock purchase plan, health and dependent care flexible spending accounts, short-term disability salary continuation, long-term disability insurance, accidental death and dismemberment insurance, basic life insurance coverage, and various paid time off and leave programs.
Ms. Pearce is based in the UK and is eligible to participate in the local employee benefit plans made available to UK-based employees, including an employer pension scheme.
Perquisites and Other Personal Benefits
Autodesk does not, as a general practice, provide material benefits or special considerations to our executive officers that are not provided to other employees. However, from time to time, when deemed appropriate by the Committee, certain executive officers receive perquisites and other personal benefits that are competitively prudent or otherwise in Autodesk’s best interest.
Employment Agreement and Post-Employment Compensation
Employment Agreement with CEO
The terms and conditions of Dr. Anagnost’s employment are set forth in his amended employment agreement, which defines the respective rights of Autodesk and Dr. Anagnost. This agreement provides general protection for Dr. Anagnost in the event of termination without cause or resignation for good reason and has been a valuable tool to incentivize Dr. Anagnost to become our CEO and to retain his services. We believe the protections afforded to our CEO in the event of a change in control promote continuity by helping our CEO maintain focus and dedication to enhance stockholder value. Details of the agreement with Dr. Anagnost can be found beginning on page 147.
Severance Plan
During fiscal year 2019, the Committee adopted the Autodesk, Inc. Severance Plan to establish standard executive severance terms that are competitive with our talent competitors and minimize the need to negotiate individualized executive severance terms in the future. Each of our NEOs (other than our CEO), as well as certain other senior executives, is a participant in the plan. If a participant’s employment is terminated without cause, or if a participant terminates his or her employment for good reason, then, in addition to payment of accrued base salary and vacation and any previously awarded but unpaid bonus, the participant is eligible to receive the following benefits:
•a lump-sum payment equal to the sum of (a) 1.5 times the participant’s base pay in effect on the date of termination and (b) 1.5 times the participant’s target annual cash bonus incentive amount under our annual cash bonus incentive plan applicable to the participant in effect the date of termination (for Rebecca Pearce such lump-sum payment would be inclusive of any severance or payment received during or in relation to her notice period);
•accelerated vesting of the participant’s time-based RSUs that would have become vested had the participant remained continuously employed by Autodesk for an additional 12 months following the termination;
•continued vesting of the participant’s PSUs that would have become vested had the participant remained continuously employed by Autodesk for an additional 12 months following the termination, based on the extent to which the underlying performance criteria, with respect to such awards, are satisfied for such performance period;
•a lump-sum payment in an amount equal to 12 times the monthly premium that the participant would be required to pay to continue his or her group health coverage if the participant had made a timely election under the Consolidated Omnibus Budget Reconciliation Act of 1985, as amended (“COBRA”) (for Rebecca Pearce such payment is not applicable); and
•Company-provided outplacement services in accordance with Autodesk’s then-applicable outplacement service program or arrangements for 18 months immediately following the date of termination.
In March 2021, we amended the Severance Plan to provide similar benefits as those set forth above to participants who voluntarily terminate employment for qualified retirement. However, in the case of qualified retirement, participants will receive a dollar amount that is equivalent to 18 times monthly COBRA premium and they will not be eligible for outplacement services. All payments and other benefits under the Autodesk, Inc. Severance Plan are subject to applicable withholding obligations, the participant’s release of all claims, compliance with certain confidentiality covenants and, in circumstances other than a qualified retirement, non-disparagement and non-solicitation covenants.
Estimates of the potential payments and benefits payable in the event of a termination of employment under the Severance Plan are set forth in “Change-in-Control Arrangements, Severance Plan, Retirement Arrangements, and Employment Agreement” below. We intend to enter into a confirmatory employment letter with Ms. Pearce which will confirm the terms and conditions of her executive severance terms, as well change in control terms discussed in the next section.
Change in Control Program
To ensure the continued service of key executive officers in the event of a potential change in control of Autodesk, the Board has adopted the Autodesk, Inc. Executive Change in Control Program. Each of our NEOs, among other employees, is a participant in the program. The payments and benefits available under this program are designed to encourage the continued services of the NEOs in the event of a potential change in control of Autodesk and to allow for a smooth leadership transition thereafter. Further, these arrangements are intended to provide incentives to the NEOs to execute strategic initiatives that are aligned with stockholder value creation, even if these initiatives may result in the elimination of an NEO’s position.
The Executive Change in Control Program provides continuity in the event of a change in control transaction, which is designed to enhance stockholder value further. Payment and benefits under the Executive Change in Control Program are provided only in the event of a qualifying termination of employment following a change in control (“double trigger”). Autodesk does not offer tax reimbursement or “gross-up” payments under the Executive Change in Control Program.
The material terms and conditions of the Executive Change in Control Program, as well as an estimate of the potential payments and benefits payable in the event of a termination of employment in connection with a change in control of Autodesk, are set forth in “Change-in-Control Arrangements, Severance Plan, Retirement Arrangements, and Employment Agreement” below.
Retirement Provisions in RSU and PSU Agreements
To ensure the continued long-term service of key executive officers through an orderly retirement, the Board has adopted retirement provisions in RSU and PSU agreements entered into with executive officers starting in March 2019. Each of our NEOs, among other employees, is eligible to participate in the program. The retirement benefit available under this program is limited to partial continued vesting of outstanding RSUs and PSUs following a qualified retirement and is designed to encourage the continued long-term services of the NEOs and to allow for a smooth leadership transition upon their retirement. Under the retirement provisions in RSU and PSU agreements, continued vesting is provided only in the event of a qualifying retirement.
The material terms and conditions of the retirement provisions, as well as an estimate of the potential benefit payable in the event of a qualifying retirement, are set forth in “Change-in-Control Arrangements, Severance Plan, Retirement Arrangements, and Employment Agreement” below.
Mandatory Stock Ownership Guidelines
The Board believes that stock ownership by our executive officers is important to promote a long-term perspective and align the interests of our executive officers with those of our stockholders. We have adopted mandatory stock ownership guidelines for our executive officers, which require each executive officer to hold shares of Autodesk’s common stock equivalent in value to a multiple of his or her base salary. This is intended to create clear guidelines that tie a portion of the executive officer’s net worth to the performance of Autodesk’s stock price. The current stock ownership guidelines are as follows:
| | | | | | | | | | | | | | |
| | CEO | | Other Senior Executives |
| Multiple of Base Salary | | 6.0 times | | 3.0 times |
Executive officers have four years from their hire or promotion to a position subject to a higher ownership threshold to satisfy the required level of stock ownership. For purposes of satisfying the required stock ownership level, shares of common stock subject to outstanding RSU awards are counted as shares owned, but outstanding PSUs are not counted until the shares underlying these awards have been fully earned based on performance. The Board reviews progress against these guidelines and requirements annually and updates them as appropriate. As of the most recent review of attainment, each of our NEOs satisfied the ownership guidelines.
Clawback Policy
On December 1, 2023, our Board adopted a clawback policy that complies with the updated Nasdaq listing standards that implement the new SEC rules under the Dodd-Frank Wall Street Reform and Consumer Protection Act relating to the recovery of excess incentive-based compensation from current and former executive offers in the event of an accounting restatement, whether or not the executive officer was at fault for the restatement. The clawback policy applies to our executive officers (as defined under the applicable SEC rules). This policy applies to all incentive-based compensation (as such term is defined under the new SEC rules), which includes performance-based awards granted under our equity incentive plan and the cash bonus payments under the annual cash incentive plan in which our executive officers participate.
In addition to the adoption of the new clawback policy, our Board previously adopted a clawback policy, which is still in effect, which allows for an executive officer’s cash incentive-based compensation to be recovered at the discretion of the Board if that officer has engaged in fraudulent or other intentional misconduct and the misconduct caused a material restatement of our financial statements.
Derivatives Trading and Anti-Hedging and Pledging Policy
Our insider trading policy prohibits executive officers, members of the Board, and all other employees from trading derivative securities related to Autodesk’s stock or engaging in short sales or other short-position transactions in shares of our stock. This policy does not restrict ownership of company-granted awards, such as options to purchase shares of our common stock or PSU or RSU awards, which have been granted by the Committee. The policy also prohibits all employees, including our executive officers, and members of the Board, from hedging Autodesk stock, holding it in a margin account, or otherwise pledging Autodesk securities.
Equity Award Grant Policy
The Committee approves all equity awards granted to the executive officers. Approval of the equity awards for the executive officers generally occurs at the Committee’s regularly scheduled quarterly meeting for the first quarter of each year, although on occasion the Committee has approved new-hire, retention, or promotion grants outside of that cycle.
Effective Risk Management
Each year, the Committee evaluates Autodesk’s compensation-related risk profile. The Committee has concluded that our compensation programs do not create risks that are reasonably likely to have a material adverse effect on Autodesk.
Regulatory Considerations and Practices
Autodesk continuously reviews and evaluates the impact of tax laws, accounting practices and related interpretations on the executive compensation program. For example, the Committee considers Financial Accounting Standards Board Accounting Standards Codification Topic 718 (“ASC Topic 718”), which results in recognition of compensation expense for share-based payment awards, and Section 409A of the Code, which affects deferred compensation arrangements, as it evaluates, structures, and implements changes to the program.
Deductibility Limitation
Section 162(m) of the Internal Revenue Code limits the deductibility of compensation paid to certain executive officers to $1 million per year. The Committee has and will continue to consider Section 162(m) in establishing compensation of our executives but also considers other factors and business needs. Interpretations of and changes in applicable tax laws and regulations as well as other factors beyond our control also can affect deductibility of compensation. For these and other reasons, the Committee has determined that it will not necessarily seek to limit executive compensation to the amount that is deductible under Section 162(m) of the Code.
Taxation of Deferred Compensation
Section 409A of the Code imposes significant additional taxes in the event an executive officer, director, or service provider receives “deferred compensation” that does not satisfy the restrictive conditions of the provision. Section 409A applies to a wide range of compensation arrangements, including traditional non-qualified deferred compensation plans, certain equity awards, and separation arrangements. To assist employees with avoiding additional taxes under Section 409A, Autodesk has structured equity awards in a manner intended to be exempt from or comply with the applicable Section 409A conditions.
Taxation of “Golden Parachute” Payments
Sections 280G and 4999 of the Code provide that executive officers and directors who hold significant equity interests and certain other service providers may be subject to an excise tax if, in connection with a change in control, they receive payments or benefits that exceed certain prescribed limits. In addition, the relevant company or a successor may forfeit a deduction on the amounts subject to this additional tax. Autodesk did not provide any executive officer with a “gross-up” or other reimbursement payment for any tax liability the executive might owe as a result of the application of Sections 280G or 4999 during fiscal year 2024. In addition, Autodesk has not agreed and is not otherwise obligated to provide any NEO with such a “gross-up” or other reimbursement or to otherwise address the application of Sections 280G or 4999 in connection with payments or benefits arising from a change in control.
Accounting for Stock-Based Compensation
Autodesk follows Accounting Standards Codification (“ASC”) Topic 718 for stock-based compensation awards. ASC Topic 718 requires Autodesk to measure the compensation expense for all share-based payment awards made to employees (including executive officers) and members of the Board, including options to purchase shares of common stock, based on the grant date “fair value” of these awards. Fair value is calculated for accounting purposes and reported in the compensation tables below, even though the executive officers and directors may never realize any value from their awards. ASC Topic 718 also requires Autodesk to recognize the compensation cost of these share-based payment awards in the income statements over the period that an employee or director is required to render service in exchange for the stock option or other award.
Compensation Committee Report
The Compensation and Human Resources Committee of the Board of Directors, which is composed solely of independent members of the Board of Directors, assists the Board in fulfilling its responsibilities regarding compensation matters and, pursuant to its charter, is responsible for determining the compensation of Autodesk’s executive officers. The Compensation and Human Resources Committee has reviewed and discussed the Compensation Discussion and Analysis included in this Annual Report with management. Based on this review and discussion, the Compensation and Human Resources Committee has recommended to the Board of Directors that the Compensation Discussion and Analysis be included in this Annual Report.
COMPENSATION AND HUMAN RESOURCES COMMITTEE OF THE BOARD OF DIRECTORS
Mary T. McDowell, Chair
Reid French
Rami Rahim
Summary Compensation Table
The Summary Compensation Table below presents information concerning the total compensation of our named executive officers for fiscal years 2024, 2023 and 2022.
| | | | | | | | | | | | | | | | | | | | | | | | | | | | | | | | | | | | | | | | | | | | |
Named Executive Officer
and Principal Position | | Fiscal
Year | | Salary
($) | | Bonus
($) (1) | | Stock
Awards
($) (2) | | Non-Equity
Incentive
Plan
Compensation
($) (3) | | All Other
Compensation
($) (4) | | Total
($) |
| Andrew Anagnost | | 2024 | | 1,046,066 | | | — | | | 17,938,989 | | | 1,511,640 | | | 153,256 | | | 20,649,951 | |
President and Chief Executive | | 2023 | | 1,040,416 | | | — | | | 16,494,632 | | | — | | | 65,704 | | | 17,600,752 | |
Officer (5) | | 2022 | | 1,000,452 | | | — | | | 21,095,069 | | | — | | | — | | | 22,095,521 | |
| Deborah L. Clifford | | 2024 | | 649,461 | | | — | | | 5,144,374 | | | 500,747 | | | 77,996 | | | 6,372,578 | |
| Former Executive Vice President and Chief Financial Officer; | | 2023 | | 626,318 | | | 91,233 | | | 3,781,422 | | | — | | | 69,449 | | | 4,568,422 | |
| Current Chief Strategy Officer (6) | | 2022 | | 540,247 | | | | | 9,943,056 | | | 420,300 | | | | | 10,903,603 | |
| Steven M. Blum | | 2024 | | 704,005 | | | — | | | 6,223,689 | | | 542,640 | | | 156,411 | | | 7,626,745 | |
| Executive Vice President and | | 2023 | | 704,586 | | | — | | | 7,363,064 | | | — | | | 92,992 | | | 8,160,642 | |
| Chief Operating Officer (7) | | 2022 | | 610,909 | | | — | | | 6,140,367 | | | — | | | — | | | 6,751,276 | |
| Ruth Ann Keene | | 2024 | | 541,473 | | | — | | | 2,951,566 | | | 417,355 | | | 55,354 | | | 3,965,748 | |
| Executive Vice President | | 2023 | | 536,982 | | | | | 2,324,237 | | | — | | | 59,977 | | | 2,921,196 | |
| Corporate Affairs, Chief Legal Officer and Corporate Secretary (8) | | | | | | | | | | | | | | |
| Rebecca Pearce | | 2024 | | 465,521 | | | — | | | 2,936,488 | | | 361,241 | | | 81,024 | | | 3,844,274 | |
| Executive Vice President and | | 2023 | | 371,859 | | | | | 2,040,421 | | | — | | | 151,614 | | | 2,563,894 | |
| Chief People Officer (9) | | | | | | | | | | | | | | |
_____________
(1)Represents payments made to our named executive officers for amounts that relate to: signing bonuses and payments made in recognition of years of service as part of an Autodesk company-wide program.
(2)Amounts consist of the aggregate grant date value for PSU and RSU awards computed in accordance with FASB ASC Topic 718, based on target levels of achievement (the probable outcome at grant) in the case of PSUs and does not reflect actual amounts earned. The assumptions used in the valuation of these awards are set forth in Part II, Item 8, Financial Statements and Supplementary Data, Note 1, “Business and Summary of Significant Accounting Policies,” in this Annual Report on Form 10-K. The maximum value of PSU awards generally is capped at 200% of target for fiscal year 2022 through fiscal year 2024. The maximum values for PSU awards granted in fiscal year 2024 are as follows: Dr. Anagnost: $19,728,378; Ms. Clifford: $5,538,935; Mr. Blum: $6,510,311; Ms. Keene: $2,894,970, and Ms. Pearce: $2,864,814. Actual PSU awards earned in fiscal year 2024 by the named executive officers are shown in “Long-Term Incentive Compensation" in the Compensation Discussion and Analysis. Amounts also include grant date for value for PSUs issued pursuant to the bonus to equity exchange program discussed in “Annual Short-Term Incentive Compensation” in the Compensation Discussion and Analysis.
(3)Represents amounts earned for services performed during the relevant fiscal year pursuant to our short-term cash incentive plan (“EIP”) for all executive officers shown. The amounts shown reflect the total cash amounts awarded under the EIP, which are payable in the first quarter of the following fiscal year.
(4)Represents all other compensation for the relevant fiscal year not reported in the previous columns, authorized familial travel in connection with business trips, Autodesk’s matching contributions to pre-tax savings plans, Autodesk’s donation matching, insurance premiums, personal gifts and related tax gross ups. Generally, unless the items included in this category exceed the greater of $25,000 or 10% of the total amount of perquisites received by a given named executive officer, individual perquisites are not separately identified and quantified.
(5)Dr. Anagnost's other compensation for fiscal 2024 includes $71,805 authorized executive and spouse travel in connection with a business trip and tax gross-ups of $70,825 for certain perquisites.
(6)Ms. Clifford’s other compensation for fiscal 2024 includes $33,681 authorized executive and spouse travel in connection with a business trip and tax gross-ups of $33,326 for certain perquisites.
(7)Mr. Blum’s other compensation for fiscal 2024 includes $84,350 authorized executive and spouse travel in connection with business trips and tax gross-ups of $55,485 for certain perquisites.
(8)Ms. Keene’s other compensation for fiscal 2024 includes $22,279 authorized executive and spouse travel in connection with a business trip and tax gross-ups of $22,113 for certain perquisites. Ms. Keene was not a named executive officer during fiscal 2022.
(9)Ms. Pearce’s salary and other compensation are paid or provided in British Pounds. The amounts represent the approximate dollar value of her base salary converted to U.S. dollars using the British Pound to dollar exchange rates of 1.23 and 1.25, which represent an average for fiscal years 2023 and 2024, respectively. Ms. Pearce’s other compensation for fiscal 2024 includes $46,552 for employer contributions to UK pension plan. Ms. Pearce’s other compensation for fiscal 2024 also includes a car allowance and health insurance premiums. Ms. Pearce was not a named executive officer during fiscal 2022.
Grants of Plan-Based Awards in Fiscal Year 2024
Grants of plan-based awards reflect grants made to our named executive officers under our non-equity incentive plans and equity compensation plans during fiscal year 2024. The following tables include potential threshold, target, and maximum amounts payable under our EIP for performance during fiscal year 2024, and do not constitute compensation on top of the amounts included in the Summary Compensation Table. However, these amounts do not reflect amounts actually earned for fiscal year 2024. The following table also includes amounts relating to PSUs and RSUs issued under our 2012 Stock Plan and 2022 Equity Incentive Plan. See “Annual Short-Term Incentive Compensation" and “Long-Term Incentive Compensation" in the Compensation Discussion and Analysis for actual amounts earned in fiscal year 2024 by the named executive officers and further discussion of plan-based and other awards.
The following tables present information concerning grants of plan-based awards to each of the named executive officers during fiscal year 2024:
| | | | | | | | | | | | | | | | | | | | | | | | | | | | | | | | | | | | | | | | | | | | | | | | | | | | | | | | | | | | | | |
| | | | | | | Estimated Future Payouts Under Non-Equity Incentive Plan Awards (2) | | Estimated Future Payouts Under Equity Incentive Plan Awards (3) | | All Other
Stock
Awards:
Number of
Shares of
Stock (#)(4) | | Grant Date
Fair Value
of Stock
Awards ($)
(5) |
| Named Executive Officer | | Award Type | | Grant
Date (1) | | Threshold ($) | | Target ($) | | Maximum ($) | | Threshold (#) | | Target (#) | | Maximum
(#) | |
| Andrew | | EIP | | — | | | — | | | 1,560,000 | | | 2,080,000 | | | — | | | — | | | — | | | — | | | — | |
| Anagnost | | RSU | | 4/10/2023 | | — | | | — | | | — | | | — | | | — | | | — | | | 40,753 | | | 8,074,799 | |
| | PSU | | 4/10/2023 | | — | | | — | | | — | | | — | | | 11,757 | | | 23,514 | | | — | | | 2,275,567 | |
| | PSU | | 4/10/2023 | | — | | | — | | | — | | | — | | | 17,047 | | | 34,094 | | | — | | | 3,663,400 | |
| | PSU | | 4/10/2023 | | — | | | — | | | — | | | — | | | 20,377 | | | 40,754 | | | — | | | 3,925,222 | |
| Deborah L. | | EIP | | — | | | — | | | 516,767 | | | 1,291,918 | | | — | | | — | | | — | | | — | | | — | |
| Clifford | | RSU | | 4/10/2023 | | — | | | — | | | — | | | — | | | — | | | — | | | 11,986 | | | 2,374,906 | |
| | PSU | | 4/10/2023 | | — | | | — | | | — | | | — | | | 3,057 | | | 6,114 | | | — | | | 591,682 | |
| | PSU | | 4/10/2023 | | — | | | — | | | — | | | — | | | 4,762 | | | 9,524 | | | — | | | 1,023,354 | |
| | PSU | | 4/10/2023 | | — | | | — | | | — | | | | | 5,993 | | | 11,986 | | | | | 1,154,432 | |
| Steve M. | | EIP | | — | | | — | | | 560,000 | | | 1,400,000 | | | — | | | — | | | — | | | — | | | — | |
| Blum | | RSU | | 4/10/2023 | | — | | | — | | | — | | | — | | | — | | | — | | | 14,982 | | | 2,968,533 | |
| | PSU | | 4/10/2023 | | — | | | — | | | — | | | — | | | 2,912 | | | 5,824 | | | — | | | 563,618 | |
| | PSU | | 4/10/2023 | | — | | | — | | | — | | | — | | | 5,809 | | | 11,618 | | | — | | | 1,248,354 | |
| | PSU | | 4/10/2023 | | — | | | — | | | — | | | — | | | 7,492 | | | 14,984 | | | — | | | 1,443,184 | |
| Ruth Ann | | EIP | | — | | | — | | | 430,707 | | | 1,076,768 | | | — | | | — | | | — | | | — | | | — | |
| Keene | | RSU | | 4/10/2023 | | — | | | — | | | — | | | — | | | — | | | — | | | 7,591 | | | 1,504,081 | |
| | PSU | | 4/10/2023 | | — | | | — | | | — | | | — | | | 3,333 | | | 6,666 | | | — | | | 716,262 | |
| | PSU | | 4/10/2023 | | — | | | — | | | — | | | | | 3,796 | | | 7,592 | | | | | 731,223 | |
| Rebecca | | EIP | | — | | | — | | | 372,798 | | | 931,996 | | | — | | | — | | | — | | | — | | | — | |
Pearce (6) | | RSU | | 4/10/2023 | | — | | | — | | | — | | | — | | | — | | | — | | | 7,591 | | | 1,504,081 | |
| | PSU | | 4/10/2023 | | — | | | — | | | — | | | — | | | 364 | | | 728 | | | — | | | 70,452 | |
| | PSU | | 4/10/2023 | | — | | | — | | | — | | | — | | | 2,935 | | | 5,870 | | | — | | | 630,732 | |
| | PSU | | 4/10/2023 | | — | | | — | | | — | | | — | | | 3,796 | | | 7,592 | | | | | 731,223 | |
_____________(1)Reflects the date on which the Committee approved the grant of an equity award or, if later in the case of a PSU award, the date on which the Committee established the performance metric underlying such award or a component thereof.
(2)Reflects target and maximum dollar amounts payable under the EIP for performance during fiscal year 2024, as described in “Compensation Discussion and Analysis—Principal Elements of the Executive Compensation Program.” “Threshold” refers to the minimum amount payable for a certain level of performance; “Target” refers to the amount payable if specified performance targets are reached; and “Maximum” refers to the maximum payout possible.
(3)Except as described below, represents shares of our common stock subject to each of the PSU awards granted to the named executive officers in fiscal year 2024 under both the 2012 Stock Plan and 2022 Equity Incentive Plan. These columns show the awards that were possible at the threshold, target, and maximum levels of performance. Shares were to be earned based upon a total revenue and free cash flow goal for fiscal year 2024 adopted by the Committee (the “Annual Financial Results”), as well as TSR compared against the companies in the S&P Computer Software Select Index or the S&P North American Technology Software Index with a market capitalization over $2 billion (“Relative TSR”). In each case, Annual Financial Results for the relevant performance period could result in PSU attainment, subject to the Relative TSR modifier, of 0%-150% of target. Once the Annual Financial Results percentage is established, it is multiplied by a percentage ranging from 67%-133%, depending on Autodesk's Relative TSR performance for the period. Ultimately, PSUs could be earned from 0%-200% of target. Actual PSU awards earned in fiscal year 2024 by the named executive officers under this program are shown in “Long-Term Incentive Compensation” in the Compensation Discussion and Analysis.
(4)RSUs granted on April 10, 2023 vest in three equal annual installments beginning on March 26, 2024.
(5)Reflects the grant date fair value of each equity award. The assumptions used in the valuation of these awards are set forth in Part II, Item 8, Financial Statements and Supplementary Data, Note 1, “Business and Summary of Significant Accounting Policies,” in the Notes to Consolidated Financial Statements in this Annual Report on Form 10-K. These amounts do not correspond to the actual value that will be realized by the named executive officers upon the vesting of RSUs or the sale of the common stock underlying such awards.
(6)Ms. Pearce’s base salary is paid in British Pounds. The amounts in the last row represent the approximate dollar value of her target and maximum dollar amounts payable under the EIP for performance during fiscal year 2024 using her base salary converted to U.S. dollars using the British Pound to dollar exchange rate of 1.25, which represent an average for fiscal year 2024.
Outstanding Equity Awards at Fiscal Year 2024 Year End
The following table presents information concerning outstanding unvested RSU and PSU awards for each named executive officer as of January 31, 2024. This table includes RSUs and PSUs granted under the 2012 and 2022 Stock Plans. Unless otherwise indicated, all RSU awards vest in three equal annual installments beginning on the first anniversary of the date of grant.
| | | | | | | | | | | | | | | | | | | | | | | | | | | |
| | | | | Stock Awards |
| Named Executive Officer | | Grant
Date | | Number of Shares of Stock That Have Not Vested (#) | | | | Market Value of Shares of Stock That Have Not
Vested ($) (1) | |
| Andrew Anagnost | | 4/10/2021 | | 10,111 | | | (2) | | 2,566,273 | | |
| | 4/10/2021 | | 7,838 | | | | | 1,989,363 | | |
| | 4/10/2022 | | 33,411 | | | (3) | | 8,480,046 | | |
| | 4/10/2022 | | 22,728 | | | | | 5,768,594 | | |
| | 4/10/2023 | | 56,034 | | | (4) | | 14,221,990 | | |
| | 4/10/2023 | | 40,753 | | | | | 10,343,519 | | |
| Deborah L. Clifford | | 4/10/2021 | | 2,629 | | | (2) | | 667,266 | | |
| | 4/10/2021 | | 2,038 | | | | | 517,265 | | |
| | 4/10/2022 | | 9,332 | | | (3) | | 2,368,555 | | |
| | 4/10/2022 | | 6,348 | | | | | 1,611,186 | | |
| | 4/10/2023 | | 16,480 | | | (4) | | 4,182,789 | | |
| | 4/10/2023 | | 11,986 | | | | | 3,042,167 | | |
| Steven M. Blum | | 4/10/2021 | | 2,504 | | | (2) | | 635,540 | | |
| | 4/10/2021 | | 1,941 | | | | | 492,645 | | |
| | 4/10/2022 | | 11,385 | | | (3) | | 2,889,627 | | |
| | 2/1/2022 | | 5,225 | | | | | 1,326,157 | | |
| | 4/10/2022 | | 7,745 | | | | | 1,965,758 | | |
| | 4/10/2023 | | 20,601 | | | (4) | | 5,228,740 | | |
| | 4/10/2023 | | 14,982 | | | | | 3,802,581 | | |
| Ruth Ann Keene | | 1/27/2022 | | 22,942 | | | (5) | | 5,245,918 | | |
| | 4/10/2022 | | 6,532 | | | (3) | | 1,657,887 | | |
| | 4/10/2022 | | 4,444 | | | | | 1,127,932 | | |
| | 4/10/2023 | | 10,437 | | | (4) | | 2,649,015 | | |
| | 4/10/2023 | | 7,591 | | | | | 1,926,672 | | |
| Rebecca Pearce | | 4/10/2021 | | 313 | | | (2) | | 79,443 | | |
| | 4/10/2021 | | 364 | | | | | 92,387 | | |
| | 1/4/2022 | | 1,622 | | | | | 411,680 | | |
| | 4/10/2022 | | 5,752 | | | (3) | | 1,459,915 | | |
| | 4/10/2022 | | 3,913 | | | | | 993,159 | | |
| | 4/10/2023 | | 10,437 | | | (4) | | 2,649,015 | | |
| | 4/10/2023 | | 7,591 | | | | | 1,926,672 | | |
_____________
(1)Market value of RSUs and PSUs that have not vested is computed by multiplying (i) $253.81, the closing price on the Nasdaq of Autodesk common stock on January 31, 2024, the last trading day of fiscal year 2024, by (ii) the number of shares of stock underlying the applicable award.
(2)Awards relate to the third-year tranche of PSU awards granted on April 10, 2021, under the 2012 Plan. These PSUs were subject to achievement of a total revenue and free cash flow goal for fiscal year 2024 adopted by the Committee, as well as Relative TSR. This tranche was earned as of January 31, 2024, and subject to vest on March 26, 2024.
(3)Awards related to the second- and third-year tranches of PSU awards granted on April 10, 2022, under the 2012 Plan. The second-year tranche of these PSUs was subject to achievement of a total revenue and free cash flow goal for fiscal year 2024 adopted by the Committee, as well as Relative TSR. The second-year tranche was earned as of January 31, 2024, and subject to vest on March 26, 2024.
(4)Awards related to the first-, second-, and third-year tranches of PSU awards granted on April 10, 2023, under the 2022 Plan. The first-year tranche of these PSUs were subject to achievement of a total revenue and free cash flow goal for fiscal year 2024 adopted by the Committee, as well as Relative TSR. The first-year tranche was earned as of January 31, 2024, and subject to vest on March 26, 2024.
(5)RSUs granted to Ms. Keene on January 27, 2022 vest per the terms of her employment agreement.
Option Exercises and Stock Vested in Fiscal Year 2024
There were no stock options exercised by any of the named executive officers during fiscal year 2024. The following table presents information concerning the vesting of stock awards held by each of the named executive officers during fiscal year 2024.
| | | | | | | | | | | | | | |
| | | Stock Awards |
| Named Executive Officer | | Number of Shares Acquired on Vesting (#) | | Value Realized on Vesting ($) (1) |
| Andrew Anagnost | | 80,790 | | | 16,181,189 | |
| Deborah L. Clifford | | 19,899 | | | 4,009,357 | |
| Steven M. Blum | | 28,021 | | | 5,651,069 | |
| Ruth Ann Keene | | 30,625 | | | 5,955,314 | |
| Rebecca Pearce | | 11,396 | | | 2,337,452 | |
______________
(1)Reflects the number of shares acquired on vesting of RSUs or PSUs multiplied by the closing market price of our common stock as reported on the Nasdaq on the vesting date.
Nonqualified Deferred Compensation for Fiscal Year 2024
Under our Nonqualified Deferred Compensation Plan, certain U.S.-based officers (including named executive officers) may defer compensation earned such as salary or awards under the EIP. Deferral elections are made by eligible executive officers each year during an open enrollment period for amounts to be earned in the following year. Autodesk does not make any contribution for executive officers under the Nonqualified Deferred Compensation Plan. Prior to April 2013, we maintained the Autodesk, Inc. Equity Incentive Deferral Plan, which permitted certain executive officers to defer up to 50% of their EIP award.
The following table presents information regarding non-qualified deferred compensation activity for each listed officer during fiscal year 2024:
| | | | | | | | | | | | | | | | | | | | |
| Named Executive Officer | | Executive Contributions (Distributions) in Fiscal Year ($) | | Aggregate
Earnings/
(Losses) in
Fiscal Year ($) (1) | | Aggregate
Balance at
Fiscal Year End ($) |
| Andrew Anagnost | | 249,600 | | | 478,974 | | | 5,909,513 | |
| Deborah L. Clifford | | 65,375 | | | 46,324 | | | 385,573 | |
| Steven M. Blum | | — | | | 211,773 | | | 2,448,467 | |
| Ruth Ann Keene | | — | | | — | | | — | |
| Rebecca Pearce | | — | | | — | | | — | |
_____________
(1)None of the earnings or losses in this column are reflected in the Summary Compensation Table because they are not considered preferential or above market.
CEO Pay Ratio
In accordance with SEC rules, we are providing the ratio of the annual total compensation of our CEO to the annual total compensation of our median employee (excluding our CEO). The fiscal year 2024 annual total compensation of our CEO was 20,649,951. The fiscal year 2024 annual total compensation of our median compensated employee was $146,199, and the ratio of these amounts was 141.2 to 1.
To identify the median employee, we examined the compensation of our full- and part-time employees (other than our CEO) as of the last day of our fiscal year. We used target total direct compensation as our consistently applied compensation measure. Target total direct compensation for this purpose consisted of each employee’s estimated salary earnings, target non-equity incentive opportunity, and the fair market value price of his or her equity incentive awards granted in fiscal year 2024. We also converted all employee compensation, on a country-by-country basis, to U.S. dollars based on the applicable year-end exchange rate. After identifying the median employee, we calculated the annual total compensation for such employee using the same methodology that we used for our NEOs as set forth in the Summary Compensation Table. In fiscal year 2024 the pay ratio increased year-over-year based largely upon an increase in variable stock-based compensation for our CEO.
The pay ratio reported above is a reasonable estimate calculated in a manner consistent with SEC rules, based on our internal records and the methodology described above. The SEC rules for identifying the median compensated employee and calculating the pay ratio based on that employee’s annual total compensation allow companies to adopt a variety of methodologies, to apply certain exclusions, and to make reasonable estimates and assumptions that reflect their employee populations and compensation practices. Accordingly, the pay ratio reported by other companies may not be comparable to the pay ratio reported above, as other companies have different employee populations and compensation practices and may use different methodologies, exclusions, estimates and assumptions in calculating their own pay ratios.
Change-in-Control Arrangements, Severance Plan, Retirement Arrangements, and Employment Agreement
In an effort to ensure the continued service of our executive officers in the event of a change in control, each of our executive officers (other than our CEO) participates in an Executive Change in Control Program (the “Program”) that was initially approved by the Board in March 2006, and most recently amended and restated by the Committee in April 2022. Dr. Anagnost has a change-in-control provision in his employment agreement, as noted below. Additionally, in August 2018, the Committee adopted the Autodesk, Inc. Severance Plan (the “Severance Plan”) to establish standard executive severance terms and to minimize the need to negotiate individualized executive severance terms in the future. Each of our current executive officers (other than our CEO) has been designated by the Committee to participate in the Severance Plan. The Board adopted retirement provisions in RSU and PSU agreements entered into with executive officers starting in March 2019 and amended the Severance Plan in March 2021 to provide benefits for executive officers who voluntarily terminate their employment for a “qualified retirement” as defined under the Severance Plan. Each of our current executive officers is eligible to receive the retirement benefits, although only two of our executive officers currently meet the requirements to have a qualifying retirement under the provisions.
Executive Change in Control Program
Under the terms of the Program, if, within 60 days prior or 12 months following a “change in control,” an executive officer who participates in the Program is terminated without “cause,” or voluntarily terminates his or her employment for “good reason” (as those terms are defined in the Program), the executive officer will receive (among other benefits), following execution of a release and non-solicitation agreement:
•An amount equal to 1.5 times the sum of the participant’s annual base salary and target annual bonus, plus the participant’s pro-rata target bonus, provided the executive officer was eligible to receive such bonus in cash, payable in a lump sum (for Rebecca Pearce such lump-sum payment would be inclusive of any severance or payment received during or in relation to her notice period);
•Acceleration of all of the participant’s outstanding incentive equity awards, including stock options, RSUs, and PSUs (which PSUs shall become vested at the “target” level set forth in the applicable notice of grant);
•Reimbursement of the total applicable premium cost for medical and dental coverage for the participant and his or her eligible spouse and dependents until the earlier of 18 months from the date of termination or when the participant becomes covered under another employer’s employee benefit plans (for Rebecca Pearce such payment is not applicable); and
•An executive officer who is terminated for any other reason will receive severance or other benefits only to the extent the executive would be entitled to receive them under our then-existing benefit plans and policies. If the benefits provided under the Program constitute parachute payments under Section 280G of the Code and are subject to the excise tax imposed by Section 4999 of the Code, then such benefits will be (1) delivered in full, or (2) delivered to such lesser extent that would result in no portion of the benefits being subject to the excise tax, whichever results in the executive officer receiving the greatest amount of benefits.
As defined in the Program, a “change in control” occurs if any person acquires 50% or more of the total voting power represented by voting securities, if Autodesk sells all or substantially all its assets, if Autodesk merges or consolidates with another corporation, or if the composition of the Board changes substantially.
Severance Plan
Termination Without Cause or for Good Reason
Under the terms of the Severance Plan, if a participant in the Severance Plan is terminated without “cause” or voluntarily terminates his or her employment for “good reason” (as those terms are defined in the Severance Plan) then, in addition to payment of accrued base salary, vacation, and any previously awarded but unpaid bonus, the participant will be eligible to receive the following benefits under the Severance Plan, subject to execution of a release and compliance with certain non-disparagement, non-solicitation and confidentiality covenants:
•A lump sum payment equal to the sum of (a) 1.5 times the participant's base pay as in effect on the date of termination, and (b) 1.5 times the participant’s target annual cash bonus incentive amount under Autodesk’s annual cash bonus incentive plan applicable to the participant as in effect on the date of termination (for Rebecca Pearce such lump-sum payment would be inclusive of any severance or payment received during or in relation to her notice period);
•Accelerated vesting of the participant’s time-based RSUs that would have become vested had the participant remained continuously employed by Autodesk for an additional 12 months following the termination;
•Continued vesting of the participant’s PSUs that would have become vested had the participant remained continuously employed by Autodesk for an additional 12 months following the termination, based on the extent to which the underlying performance criteria with respect to such awards are satisfied for such performance period;
•A taxable lump sum payment in an amount equal to 12 times the monthly premium that the participant would be required to pay to continue their group health coverage if the participant had made a timely election under COBRA (for Rebecca Pearce such payment is not applicable); and
•Company-provided outplacement services in accordance with Autodesk’s then-applicable outplacement service program or arrangements for 18 months immediately following the date of termination.
Retirement
In March 2021, we amended the Severance Plan to provide additional benefits to participants who voluntarily terminate employment for qualified retirement. If a participant’s termination is considered a qualified retirement, then, in addition to payment of accrued base salary, vacation, and any previously awarded but unpaid bonus, the participant will be eligible to receive the following benefits under the Severance Plan:
•A lump sum payment equal to the sum of (a) 1.5 times the participant's base pay, (b) 1.5 times the participant’s target annual cash bonus incentive amount under Autodesk’s annual cash bonus incentive plan applicable to the participant as in effect as of the qualified retirement, and (c) a pro-rata portion of the participant’s target annual cash bonus incentive amount as in effect as of the qualified retirement, for the fiscal year in which the qualified retirement occurs;
•Accelerated vesting of the participant’s time-based RSUs that would have become vested had the participant remained continuously employed by Autodesk for an additional 12 months following the qualified retirement;
•Continued vesting of the participant’s PSUs that would have become vested had the participant remained continuously employed by Autodesk for an additional 12 months following the qualified retirement, based on the extent to which the underlying performance criteria with respect to such awards are satisfied for such performance period; and
•A taxable lump sum payment in an amount equal to 18 times the monthly premium that the participant would be required to pay to continue their group health coverage if the participant had made a timely election under COBRA.
For the purposes of the Severance Plan, “qualified retirement” is defined as a voluntary termination of employment by an executive officer, which meets either of the following requirements: (i) one’s combined total age plus years of employment with Autodesk is equal to or greater than 75 or (ii) one is at least 55 years of age and completes at least 10 years of employment with Autodesk. Unless waived by the administrator of the plan or the Chief Executive Officer, in order for such voluntary termination to be deemed a qualified retirement, one must properly deliver written notice of his or her intent to resign employment with Autodesk in a qualified retirement at least three months prior to the effective date of such qualified retirement.
Internal Revenue Code Section 280G
The Severance Plan does not provide for any excise tax payment. In the event that any payment or benefit payable to a participant under the Severance Plan would result in the imposition of excise taxes under the “golden parachute” provisions of Section 280G of the Code, then such payments and benefits will be (1) delivered in full, or (2) delivered to such lesser extent that would result in no portion of the benefits being subject to the excise tax, whichever results in the participant receiving the greatest amount of benefits.
Employment Agreement with Andrew Anagnost
In connection with Dr. Anagnost’s appointment as CEO, in June 2017, Dr. Anagnost entered into an employment agreement with Autodesk, which was amended in April 2022, which provides for, among other things, certain payments and benefits to be provided to Dr. Anagnost in the event his employment is terminated without “cause” or he resigns for “good reason,” including in connection with a “change of control,” as each such term is defined in Dr. Anagnost's employment agreement.
In the event Dr. Anagnost's employment is terminated by Autodesk without cause or if Dr. Anagnost resigns for good reason and in each case such termination is not in connection with a change of control, Dr. Anagnost would receive (i) payment of 200% of his then current base salary for 12 months; (ii) payout of his pro-rata bonus for the fiscal year in which termination occurs, provided Autodesk bonus targets are satisfied, to be paid in one lump sum on or before March 15 of the succeeding fiscal year; (iii) fully accelerated vesting of all of his then outstanding, unvested equity awards (other than any awards that vest in whole or in part based on performance); (iv) with respect to his then outstanding unvested equity awards that vest in whole or in part based on performance, those awards will vest as if he had remained continuously employed by Autodesk through the end of the performance period in which his employment is terminated, based on the extent, if any, that the underlying performance criteria for those awards are satisfied for that performance period, as prorated to reflect the number of days in which he was employed during such period; and (v) reimbursement for premiums paid for continued health benefits for Dr. Anagnost and his eligible dependents until the earlier of 12 months following termination or the date Dr. Anagnost becomes covered under similar health plans. In addition, Dr. Anagnost is subject to non-solicitation and non-competition covenants for 12 months following a termination that gives rise to the severance benefits discussed above.
If, in connection with a change of control, Dr. Anagnost’s employment is terminated by Autodesk without cause or if Dr. Anagnost resigns for good reason, Dr. Anagnost would receive (i) a lump sum payment in an amount equal to 200% of his annual base salary and target annual bonus; (ii) payout of his pro-rata target bonus for the fiscal year in which termination occurs to be paid in one lump sum on or before March 15 of the succeeding fiscal year; (iii) fully accelerated vesting of all of his then outstanding unvested equity awards, including awards that would otherwise vest only upon satisfaction of performance criteria; and (iv) reimbursement for premiums paid for continued health benefits for Dr. Anagnost and his eligible dependents until the earlier of 18 months following termination or the date Dr. Anagnost becomes covered under similar health plans.
Retirement Provisions in RSU and PSU Agreements
The RSU and PSU agreements entered into with our executive officers in March 2019 and after contain provisions that permit partial continued vesting of outstanding RSUs and PSUs following a qualified retirement, as follows:
•Time-based RSUs that would otherwise vest within 12 months following the qualified retirement will fully accelerate and become vested as of the date of the qualified retirement, and any time-based RSUs that remain unvested after application of this provision will immediately be forfeited and cancelled for no additional consideration upon the qualified retirement; and
•PSUs that would otherwise vest within 12 months following the qualified retirement will continue to vest as if the executive officer had remained continuously employed by Autodesk through the vest date next following the qualified retirement, based on the extent, if any, that the underlying performance criteria with respect to such awards are satisfied for the applicable performance period, and the remainder of such PSUs that do not become vested pursuant to this provision, if any, shall be forfeited and canceled for no additional consideration.
For the purposes of this provision, “qualified retirement” has the same definition as in the Severance Plan. Unless waived by the administrator of the applicable stock plan, in order for such voluntary termination to be deemed a qualified retirement, one must properly deliver written notice of his or her intent to resign from employment with Autodesk in a qualified retirement at least three months prior to the effective date of such qualified retirement.
Potential Payments Upon Termination or Change in Control
The tables below list the estimated amount of compensation payable to each of the named executive officers in the event of voluntary termination, involuntary not-for-cause termination, for-cause termination, termination following a change in control, and termination in the event of disability or death of the executive. The amounts shown assume that such termination was effective as of January 31, 2024, and include all components of compensation, benefits, and perquisites payable under the Severance Plan and Executive Change in Control Program effective during the 2024 fiscal year or, in the case of Dr. Anagnost, pursuant to his employment agreement, discussed above.
Estimated amounts for share-based compensation are based on the closing price of our common stock on the Nasdaq on Monday, January 31, 2024, which was $253.81 per share. The actual amounts for all named executive officers to be paid out can only be determined at the time of such executive’s separation.
Andrew Anagnost
| | | | | | | | | | | | | | | | | | | | | | | | | | | | | | | | | | | | | | |
| Executive Benefits and Payments | | Voluntary
Termination
on
January 31, 2024 ($) | | Involuntary
Not For Cause
or Voluntary
for Good
Reason
(Except
Change
in Control)
Termination on
January 31, 2024 ($) | | For Cause
Termination
on
January 31, 2024 ($) | | Involuntary
Not for Cause
or Voluntary
For Good
Reason
(Change in
Control)
Termination on
January 31, 2024 ($) | | Disability on
January 31, 2024 ($) | | Death on
January 31, 2024 ($) |
| Compensation: | | | | | | | | | | | | |
| Severance (1) | | — | | | 2,080,000 | | | — | | | 5,200,000 | | | — | | | — | |
| Pro-Rata Bonus (2) | | — | | | 1,511,640 | | | — | | | 1,560,000 | | | — | | | — | |
| Equity Awards (3) | | 18,920,492 | | | 28,700,299 | | | — | | | 45,253,815 | | | 45,253,815 | | | 45,253,815 | |
| Benefits and perquisites: | | | | | | | | | | | | |
| Health Insurance (4) | | — | | | 36,724 | | | — | | | 55,086 | | | — | | | — | |
| Disability Income (5) | | — | | | — | | | — | | | — | | | 1,665,045 | | | — | |
| Accidental Death or Dismemberment (6) | | — | | | — | | | — | | | — | | | 2,000,000 | | | 2,000,000 | |
| Life Insurance (7) | | — | | | — | | | — | | | — | | | — | | | 2,000,000 | |
| Total Executive Benefits and Payments Upon Separation | | 18,920,492 | | | 32,328,663 | | | — | | | 52,068,901 | | | 48,918,860 | | | 49,253,815 | |
Deborah L. Clifford | | | | | | | | | | | | | | | | | | | | | | | | | | | | | | | | | | | | | | |
| Executive Benefits and Payments | | Voluntary
Termination
on
January 31, 2024 ($) | | Involuntary
Not For Cause
or Voluntary
for Good
Reason
(Except
Change
in Control)
Termination on
January 31, 2024 ($) | | For Cause
Termination
on
January 31, 2024 ($) | | Involuntary
Not for Cause
or Voluntary
For Good
Reason
(Change in
Control)
Termination on
January 31, 2024 ($) | | Disability on
January 31, 2024 ($) | | Death on
January 31, 2024 ($) |
| Compensation: | | | | | | | | | | | | |
| Severance (1) | | — | | | 1,755,000 | | | — | | | 1,755,000 | | | — | | | — | |
| Pro-Rata Bonus (2) | | — | | | — | | | — | | | 520,000 | | | — | | | — | |
| Equity Awards (3) | | — | | | 5,305,464 | | | — | | | 12,926,797 | | | 12,926,797 | | | 12,926,797 | |
| Benefits and perquisites: | | | | | | | | | | | | |
| Health Insurance (4) | | — | | | 7,483 | | | — | | | 5,065 | | | — | | | — | |
| Disability Income (5) | | — | | | — | | | — | | | — | | | 2,878,795 | | | — | |
| Accidental Death or Dismemberment (6) | | — | | | — | | | — | | | — | | | 650,000 | | | 650,000 | |
| Life Insurance (7) | | — | | | — | | | — | | | — | | | — | | | 650,000 | |
| Total Executive Benefits and Payments Upon Separation | | — | | | 7,067,947 | | | — | | | 15,206,862 | | | 16,455,592 | | | 14,226,797 | |
Steven M. Blum
| | | | | | | | | | | | | | | | | | | | | | | | | | | | | | | | | | | | | | |
| Executive Benefits and Payments | | Voluntary
Termination
on
January 31, 2024 ($) | | Involuntary
Not For Cause
or Voluntary
for Good
Reason
(Except
Change
in Control)
Termination on
January 31, 2024 ($) | | For Cause
Termination
on
January 31, 2024 ($) | | Involuntary
Not for Cause
or Voluntary
For Good
Reason
(Change in
Control)
Termination on
January 31, 2024 ($) | | Disability on
January 31, 2024 ($) | | Death on
January 31, 2024 ($) |
| Compensation: | | | | | | | | | | | | |
| Severance (1) | | 1,890,000 | | | 1,890,000 | | | — | | | 1,890,000 | | | — | | | — | |
| Pro-Rata Bonus (2) | | 560,000 | | | 560,000 | | | — | | | 560,000 | | | — | | | — | |
| Equity Awards (3) | | 6,883,571 | | | 6,883,571 | | | — | | | 16,979,128 | | | 16,979,128 | | | 16,979,128 | |
| Benefits and perquisites: | | | | | | | | | | | | |
| Health Insurance (4) | | 74,223 | | | 49,482 | | | — | | | 41,083 | | | — | | | — | |
| Disability Income (5) | | — | | | — | | | — | | | — | | | 1,624,352 | | | — | |
| Accidental Death or Dismemberment (6) | | — | | | — | | | — | | | — | | | 2,000,000 | | | 2,000,000 | |
| Life Insurance (7) | | — | | | — | | | — | | | — | | | — | | | 2,000,000 | |
| Total Executive Benefits and Payments Upon Separation | | 9,407,794 | | | 9,383,053 | | | — | | | 19,470,211 | | | 20,603,480 | | | 20,979,128 | |
Ruth Ann Keene
| | | | | | | | | | | | | | | | | | | | | | | | | | | | | | | | | | | | | | |
| Executive Benefits and Payments | | Voluntary
Termination
on
January 31, 2024 ($) | | Involuntary
Not For Cause
or Voluntary
for Good
Reason
(Except
Change
in Control)
Termination on
January 31, 2024 ($) | | For Cause
Termination
on
January 31, 2024 ($) | | Involuntary
Not for Cause
or Voluntary
For Good
Reason
(Change in
Control)
Termination on
January 31, 2024 ($) | | Disability on
January 31, 2024 ($) | | Death on
January 31, 2024 ($) |
| Compensation: | | | | | | | | | | | | |
| Severance (1) | | 1,458,000 | | | 1,458,000 | | | — | | | 1,458,000 | | | — | | | — | |
| Pro-Rata Bonus (2) | | 432,000 | | | 432,000 | | | — | | | 432,000 | | | — | | | — | |
| Equity Awards (3) | | 8,563,976 | | | 8,563,976 | | | — | | | 12,613,342 | | | 12,613,342 | | | 12,613,342 | |
| Benefits and perquisites: | | | | | | | | | | | | |
| Health Insurance (4) | | 81,476 | | | 54,318 | | | — | | | 36,762 | | | — | | | — | |
| Disability Income (5) | | — | | | — | | | — | | | — | | | 2,218,608 | | | — | |
| Accidental Death or Dismemberment (6) | | — | | | — | | | — | | | — | | | 1,620,000 | | | 1,620,000 | |
| Life Insurance (7) | | — | | | — | | | — | | | — | | | — | | | 2,000,000 | |
| Total Executive Benefits and Payments Upon Separation | | 10,535,452 | | | 10,508,294 | | | — | | | 14,540,104 | | | 16,451,950 | | | 16,233,342 | |
Rebecca Pearce (8)
| | | | | | | | | | | | | | | | | | | | | | | | | | | | | | | | | | | | | | |
| Executive Benefits and Payments | | Voluntary
Termination
on
January 31, 2024 ($) | | Involuntary
Not For Cause
or Voluntary
for Good
Reason
(Except
Change
in Control)
Termination on
January 31, 2024 ($) | | For Cause
Termination
on
January 31, 2024 ($) | | Involuntary
Not for Cause
or Voluntary
For Good
Reason
(Change in
Control)
Termination on
January 31, 2024 ($) | | Disability on
January 31, 2024 ($) | | Death on
January 31, 2024 ($) |
| Compensation: | | | | | | | | | | | | |
| Severance (1) | | — | | | 1,303,247 | | | — | | | 1,303,247 | | | — | | | — | |
| Pro-Rata Bonus (2) | | — | | | — | | | — | | | 386,147 | | | — | | | — | |
| Equity Awards (3) | | — | | | 3,160,351 | | | — | | | 7,896,029 | | | 7,896,029 | | | 7,896,029 | |
| Benefits and perquisites: | | | | | | | | | | | | |
| Health Insurance (4) | | — | | | — | | | — | | | — | | | — | | | — | |
| Disability Income (5) | | — | | | — | | | — | | | — | | | 5,819,071 | | | — | |
| Accidental Death or Dismemberment (6) | | — | | | — | | | — | | | — | | | — | | | 2,167,841 | |
| Life Insurance (7) | | — | | | — | | | — | | | — | | | — | | | 2,167,841 | |
| Total Executive Benefits and Payments Upon Separation | | — | | | 4,463,598 | | | — | | | 9,585,423 | | | 13,715,100 | | | 12,231,711 | |
______________
(1)Severance: For Dr. Anagnost, the amounts shown would be paid in accordance with his employment agreement as amended on April 27, 2022 based on base salary and target bonus in effect at January 31, 2024. For the other continuing named executive officers, the amounts shown would be paid in accordance with the Severance Plan in effect at January 31, 2024 or Executive Change in Control Program as amended on April 27, 2022 based on base salary and target bonus in effect at January 31, 2024.
(2)Pro-Rata Bonus: Represents pro-rata bonus amounts for the year in which the termination occurred, which is payable under Dr. Anagnost’s employment agreement, Severance Plan, and the Executive Change in Control Program.
(3)Equity Awards: Pursuant to Autodesk's form of RSU and PSU award agreement, in the case of a Qualified Retirement, partial continued vesting of outstanding RSUs and PSUs continues, and in the case of Disability or Death, unvested time-based RSUs vest in full and unvested PSUs vest at target. For Dr. Anagnost, the amounts shown for other termination scenarios reflect the value of unvested equity awards accelerated in accordance with his employment agreement as amended on April 27, 2022. For the other continuing named executive officers, the amounts shown for other termination scenarios reflect the value of unvested equity awards accelerated in accordance with the Severance Plan in effect at January 31, 2024 or Executive Change in Control Program as amended on April 27, 2022. Reported values are based on the closing price of our common stock on January 31, 2024 ($253.81 per share) for RSUs and PSUs and target PSUs.
(4)Health Insurance: For Dr. Anagnost, in accordance with his employment agreement as amended on April 27, 2022, these amounts represent the cost of continuing coverage for Dr. Anagnost and his dependents. The amount shown in the Involuntary Not for Cause or Voluntary for Good Reason (Except Change in Control) Termination column reflects 12 months of coverage after separation. The amounts in the Involuntary Not for Cause or Voluntary for Good Reason (Change in Control) Termination column reflect 18 months of coverage after separation. For the other continuing named executive officers, these amounts represent the cost of continuing coverage for medical and dental benefits for each executive and his or her dependents (i) in the case of the Disability column, for 12 months in accordance with Autodesk's benefits program, (ii) in the case of the Involuntary Not for Cause or Voluntary for Good Reason (Except Change in Control) Termination column, for 12 months after separation and grossed up for taxes in accordance with the Severance Plan in effect at January 31, 2024, and (iii) in the case of the Involuntary Not for Cause or Voluntary for Good Reason (Change in Control) Termination column, for 18 months after separation in accordance with the Executive Change in Control Program as amended on April 27, 2022.
(5)Disability Income: Reflects the estimated present value of all future payments to each executive, except for Ms. Pearce, under his or her elected disability program, which represent 100% of base salary for the first 90 days, and then 662/3% of salary thereafter, with a maximum of $20,000 per month, until the age of 67. Ms. Pearce’s elected disability program represents 75% of base salary, plus average of bonus earnings over the last three fiscal years, minus state incapacity benefit, each year until the retirement age of 65. These payments would be made by the insurance provider, not by Autodesk.
(6)Accidental Death or Dismemberment: Reflects the lump-sum amount payable to each executive or his or her beneficiaries by Autodesk’s insurance provider in the event of the executive’s accidental death. There is also a prorated lump sum payment for dismemberment. The amount shown as payable upon dismemberment is based upon the payout for the most severe dismemberment under the plan.
(7)Life Insurance: Reflects the lump-sum amount payable to beneficiaries by Autodesk’s insurance provider in the event of the executive’s death.
(8)Ms. Pearce’s cash severance and benefits are provided in British Pounds. These amounts represent the approximate dollar value of her base salary and other compensation converted to U.S. dollars using the British Pound to dollar exchange rate of 1.25, which represents an average for fiscal year 2024.
Compensation of Directors
During fiscal year 2024, our non-employee directors were eligible to receive the annual compensation set forth below:
| | | | | | | | |
| Member of the Board of Directors | $75,000 and RSUs ($250,000 equivalent) |
| Non-executive Chair of the Board | an additional | $75,000 |
| Chair of the Audit Committee | an additional | $25,000 |
| Chair of the Compensation and Human Resources Committee | an additional | $20,000 |
| Chair of the Corporate Governance and Nominating Committee | an additional | $10,000 |
The annual compensation cycle for non-employee directors begins on the date of the annual stockholders’ meeting and ends on the date of the next annual stockholders meeting (“Directors’ Compensation Cycle”). Director compensation in the tables below represent the portion of annual compensation with respect to service during Autodesk's fiscal year 2024.
No later than December 31 of the year prior to a director’s re-election to the Board, the director can elect to receive up to 100% of his or her annual fees in the form of RSUs issued at a rate of $1.20 worth of stock for each $1.00 of cash compensation foregone (“Elected RSUs”). If cash is elected, cash compensation is accrued monthly and paid quarterly, in arrears. The Elected RSUs are issued at the beginning of the Directors’ Compensation Cycle on the date of the annual meeting of stockholders and vest on the date of the annual meeting of stockholders in the following year, provided that the recipient is a director on such date.
| | | | | | | | | | | | | | |
Non-Employee Director Annual Compensation Cycle
June 16, 2023 Annual Stockholder Meeting - June 16, 2023 Annual Stockholder Meeting |
| Director | | % Annual Fees Elected to Convert to RSUs
(June 17, 2022 - June 16, 2023) | | % Annual Fees Elected to Convert to RSUs
(June 22, 2023 - June 21, 2024) |
| Stacy J. Smith | | 100 | | | 100 | |
| Karen Blasing | | 100 | | | 100 | |
| Reid French | | 100 | | | 100 | |
Dr. Ayanna Howard | | — | | | — | |
| Blake Irving | | 100 | | | 100 | |
| Mary T. McDowell | | 100 | | | 100 | |
| Stephen Milligan | | 100 | | | 100 | |
| Lorrie M. Norrington | | 100 | | | 100 | |
| Betsy Rafael | | — | | | — | |
| Rami Rahim | | — | | | — | |
During fiscal year 2024, Autodesk’s Director Compensation Policy under the Autodesk’s 2022 Equity Incentive Plan provided for the automatic grant of RSUs to our non-employee directors. Upon being elected or appointed to our Board, each non-employee director would be provided an initial grant of RSUs with a grant date value of $250,000 and prorated based on service on the date such director joined the Board (“Initial RSUs”), with subsequent annual grants of RSUs with a grant date value of $250,000 on the date of the annual meeting (“Subsequent Annual RSUs”).
| | | | | | | | | | | | | | | | | | | | |
| | The number of calendar days from the Date of Grant to Autodesk’s next annual meeting of stockholders | | | | |
| | | Fair Market Value of a Share on the Date of Grant | | Result is rounded down to the nearest whole number of shares |
| $250,000 | x | / | = |
| | 365 | | |
Initial RSUs vest upon the annual meeting of stockholders following the date of grant. Subsequent Annual RSUs vest over a one-year period. If a non-employee director is appointed on the date of an annual meeting, such non-employee director is not eligible to an Initial RSU.
Under the 2022 Equity Incentive Plan, directors may elect to defer all or part of their Subsequent Annual RSUs and Elected RSUs. Distributions of these deferred RSUs will be made in shares of Autodesk’s common stock in annual installments or by lump sum in accordance with the distribution election made by the director.
The tables below present information concerning the compensation paid by us to each of our non-employee directors for fiscal year 2024. Dr. Anagnost, who was an Autodesk employee during fiscal year 2024, did not receive additional compensation for his service as a director.
| | | | | | | | | | | | | | | | | | | | |
| Current Directors | | Fees Earned or
Paid in Cash
($) (1) | | Stock Awards
($) (2) | | Total
($) |
| | | | | | |
| Stacy J. Smith | | 150,000 | | | 280,085 | | | 430,085 | |
| Karen Blasing | | 75,000 | | | 264,992 | | | 339,992 | |
| Reid French | | 75,000 | | | 264,992 | | | 339,992 | |
| Dr. Ayanna Howard | | 75,000 | | | 249,962 | | | 324,962 | |
| Blake Irving | | 75,000 | | | 264,962 | | | 339,962 | |
| Mary T. McDowell | | 95,000 | | | 269,067 | | | 364,067 | |
| Stephen Milligan | | 75,000 | | | 264,992 | | | 339,992 | |
| Lorrie M. Norrington | | 85,000 | | | 267,030 | | | 352,030 | |
| Betsy Rafael | | 100,000 | | | 249,962 | | | 349,962 | |
| Rami Rahim | | 58,636 | | | 233,360 | | | 291,996 | |
______________
(1)Fees Earned or Paid in Cash reflects the dollar amounts of fees earned. As noted above, during fiscal year 2024, directors could elect to receive up to 100% of their compensation in the form of RSUs in lieu of cash. The following table represents actual cash received by the directors in fiscal year 2024 based on their elections. See footnote (b) for more information regarding the RSUs granted in lieu of cash.
| | | | | | | | |
| Current Directors | | Fees Actually Paid in Cash ($) |
| | |
| Stacy J. Smith | | — | |
| Karen Blasing | | — | |
| Reid French | | — | |
| Dr. Ayanna Howard | | 75,000 | |
| Blake Irving | | — | |
| Mary T. McDowell | | — | |
| Stephen Milligan | | — | |
| Lorrie M. Norrington | | — | |
| Betsy Rafael | | 100,000 | |
| Rami Rahim | | 75,000 | |
(2)The Stock Awards column reflects (i) the grant date fair value of the Initial RSUs and Subsequent Annual RSUs and (ii) the pro-rata grant date fair value of 20% of the stock awards the directors earned during fiscal year 2024 in lieu of cash. The 20% represents the premium of $1.20 worth of stock for each $1.00 of cash compensation foregone. The assumptions used in the valuation of these awards are set forth in Part II, Item 8, Financial Statements and Supplementary Data, Note 1, “Business and Summary of Significant Accounting Policies,” in the Notes to Consolidated Financial Statements in this Annual Report on Form 10-K. These amounts do not correspond to the actual value that will be realized by the directors upon the vesting of RSUs or the sale of the common stock underlying such awards.
The following table shows the total amounts and fair values, as well as the 20% premium, of RSUs granted on June 16, 2022, in lieu of cash foregone for the June 17, 2022, through June 16, 2023, Directors’ Compensation Cycle:
| | | | | | | | | | | | | | | | | | | | | | | | | | |
| | Restricted Stock Unit |
| Current Directors | | Total Number of Shares (#) | | Number of Shares Representing the 20% Premium (#) | | Grant Date Fair Value of Stock Awards ($) | | Grant Date Fair Value of the 20% Premium of the Stock Awards ($) |
| Stacy J. Smith | | 1,095 | | | 183 | | | 179,919 | | | 30,069 | |
| Karen Blasing | | 547 | | | 92 | | | 89,878 | | | 15,117 | |
| Reid French | | 547 | | | 92 | | | 89,878 | | | 15,117 | |
| Dr. Ayanna Howard | | — | | | — | | | — | | | — | |
| Blake Irving | | 547 | | | 92 | | | 89,878 | | | 15,117 | |
| Mary T. McDowell | | 693 | | | 116 | | | 113,867 | | | 19,060 | |
| Stephen Milligan | | 547 | | | 92 | | | 89,878 | | | 15,117 | |
| Lorrie M. Norrington | | 620 | | | 104 | | | 101,872 | | | 17,088 | |
| Betsy Rafael | | — | | | — | | | — | | | — | |
| Rami Rahim | | — | | | — | | | — | | | — | |
The following table shows the total amounts and fair values, as well as the 20% premium, of RSUs granted on June 21, 2023, in lieu of cash foregone for the June 22, 2023, through June 21, 2024, Directors’ Compensation Cycle:
| | | | | | | | | | | | | | | | | | | | | | | | | | |
| | Restricted Stock Unit |
| Current Directors | | Total Number of Shares (#) | | Number of Shares Representing the 20% Premium (#) | | Grant Date Fair Value of Stock Awards ($) | | Grant Date Fair Value of the 20% Premium of the Stock Awards ($) |
| | | | | | | | |
| Stacy J. Smith | | 865 | | | 145 | | | 179,903 | | | 30,157 | |
| Karen Blasing | | 432 | | | 72 | | | 89,847 | | | 14,975 | |
| Reid French | | 432 | | | 72 | | | 89,847 | | | 14,975 | |
| Dr. Ayanna Howard | | — | | | — | | | — | | | — | |
| Blake Irving | | 432 | | | 72 | | | 89,847 | | | 14,975 | |
| Mary T. McDowell | | 548 | | | 92 | | | 113,973 | | | 19,134 | |
| Stephen Milligan | | 432 | | | 72 | | | 89,847 | | | 14,975 | |
| Lorrie M. Norrington | | 490 | | | 82 | | | 101,910 | | | 17,054 | |
| Betsy Rafael | | — | | | — | | | — | | | — | |
| Rami Rahim | | — | | | — | | | — | | | — | |
| | | | | | | | |
| | | | | | | | |
The following tables show the total amounts and fair values of Subsequent Annual RSUs granted during fiscal year 2024.
| | | | | | | | | | | | | | | | | | | | |
| | Restricted Stock Unit |
| Current Directors | | Grant Date(s) | | Number of Shares (#) | | Grant Date Fair Value of Stock Awards ($) |
| Stacy J. Smith | | 6/21/2023 | | 1,202 | | 249,992 |
| Karen Blasing | | 6/21/2023 | | 1,202 | | 249,992 |
| Reid French | | 6/21/2023 | | 1,202 | | 249,992 |
| Dr. Ayanna Howard | | 6/21/2023 | | 1,202 | | 249,992 |
| Blake Irving | | 6/21/2023 | | 1,202 | | 249,992 |
| Mary T. McDowell | | 6/21/2023 | | 1,202 | | 249,992 |
| Stephen Milligan | | 6/21/2023 | | 1,202 | | 249,992 |
| Lorrie M. Norrington | | 6/21/2023 | | 1,202 | | 249,992 |
| Betsy Rafael | | 6/21/2023 | | 1,202 | | 249,992 |
| Rami Rahim | | 6/21/2023 | | 1,202 | | 249,992 |
The aggregate number of each director’s RSUs outstanding at January 31, 2024, was:
| | | | | | | | |
| Current Directors | | Aggregate Number of Shares Underlying Outstanding Restricted Stock Units |
| Stacy J. Smith | | 2,067 | |
| Karen Blasing | | 1,634 | |
| Reid French | | 1,634 | |
| Dr. Ayanna Howard | | 1,202 | |
| Blake Irving | | 1,634 | |
| Mary T. McDowell | | 1,750 | |
| Stephen Milligan | | 1,634 | |
| Lorrie M. Norrington | | 1,692 | |
| Betsy Rafael | | 1,202 | |
| Rami Rahim | | 1,202 | |
Director Stock Ownership Guidelines
The Board believes directors should have a meaningful financial stake in Autodesk in order to further align their interests with Autodesk’s stockholders. To that end, the Board has adopted mandatory ownership guidelines for the directors. These mandatory ownership guidelines require all directors to hold shares of Autodesk’s common stock equivalent in value to five times their annual cash retainer.
Compensation Committee Interlocks
The current members of the Compensation and Human Resources Committee are Mary T. McDowell, Reid French and Rami Rahim. No director who served as a member of the Compensation and Human Resources Committee during fiscal year 2024 is or was formerly an officer or employee of Autodesk or any of its subsidiaries. No interlocking relationship existed between any director who served as a member of the Compensation and Human Resources Committee during fiscal year 2024 and the compensation committee of any other company, nor has any such interlocking relationship existed in the past.
ITEM 12.SECURITY OWNERSHIP OF CERTAIN BENEFICIAL OWNERS AND MANAGEMENT AND RELATED STOCKHOLDER MATTERS
The following table sets forth certain information concerning the beneficial ownership of Autodesk’s common stock as of April 30, 2024, for each person or entity who is known by Autodesk to own beneficially more than 5% of the outstanding shares of Autodesk common stock, each of Autodesk’s directors, each of the named executive officers, including former executive officers, and all directors and executive officers as a group.
| | | | | | | | | | | | | | |
| 5% Stockholders, Directors and Officers (1) | | Common Stock
Beneficially
Owned (2) | | Percentage
Beneficially
Owned (3) |
| Principal Stockholders: | | | | |
| The Vanguard Group, Inc. (4) | | 19,038,582 | | | 8.8 | % |
| BlackRock, Inc. (5) | | 19,233,480 | | | 8.9 | % |
| Non-Employee Directors (6): | | | | |
| Stacy J. Smith | | 19,934 | | | * |
| Karen Blasing | | 7,237 | | | * |
| Reid French (7) | | 12,958 | | | * |
| Dr. Ayanna Howard | | 2,241 | | | * |
| Blake Irving | | 8,261 | | | * |
| Mary T. McDowell | | 33,766 | | | * |
| Stephen Milligan (8) | | 9,556 | | | * |
| Lorrie M. Norrington | | 7,248 | | | * |
| Betsy Rafael | | 3,237 | | | * |
| Rami Rahim | | 2,161 | | | * |
| Named Executive Officers: | | | | |
| Andrew Anagnost | | 46,011 | | | * |
| Deborah L. Clifford | | 15,602 | | | * |
| Steven M. Blum (9) | | 72,095 | | | * |
| Ruth Ann Keene | | 60,063 | | | * |
| Rebecca Pearce | | 5,865 | | | * |
| All directors and executive officers as a group (15 individuals) | | 306,235 | | | * |
_______________
* Represents less than one percent (1%) of the outstanding common stock.
(1)Unless otherwise indicated in their respective footnote, the address for each listed person is c/o Autodesk, Inc., One Market Street, Ste. 400, San Francisco, California 94105.
(2)The number and percentage of shares beneficially owned is determined in accordance with Rule 13d-3 of the Exchange Act, and the information is not necessarily indicative of beneficial ownership for any other purpose. Under Rule 13d-3, beneficial ownership includes any shares the individual or entity has the right to acquire within 60 days of April 30, 2024, through the exercise of any stock option or other right. Unless otherwise indicated in the footnotes, each person or entity has sole voting and investment power (or shares such powers with his or her spouse) with respect to the shares shown as beneficially owned.
(3)The total number of shares of common stock outstanding as of April 30, 2024, was 215,476,226.
(4)As of December 29, 2023, the reporting date of The Vanguard Group, Inc.’s most recent filing with the SEC pursuant to Section 13(g) of the Exchange Act filed on February 13, 2024, The Vanguard Group, Inc. was deemed to have sole dispositive power with respect to 18,113,756 shares, shared voting power with respect to 285,944 shares, and shared dispositive power with respect to 924,826 shares. The address of The Vanguard Group, Inc. is 100 Vanguard Blvd., Malvern, PA 19355.
(5)As of December 31, 2023, the reporting date of BlackRock, Inc.’s most recent filing with the SEC pursuant to Section 13(g) of the Exchange Act filed on January 25, 2024, BlackRock, Inc. was deemed to have sole voting power with respect to 17,449,172 shares, sole dispositive power with respect to 19,233,480 shares. The address of BlackRock, Inc. is 50 Hudson Yards, New York, NY 10001.
(6)Directors’ holdings reported include vested awards deferred under our 2012 Outside Directors’ Stock Plan as well as unvested awards granted in fiscal year 2024 and assume they will vest in connection with the fiscal year 2025 Annual Meeting of Stockholders.
(7)Includes 20 shares held indirectly by trust.
(8)Includes 7,922 shares held indirectly by trust.
(9)Includes 71,549 shares held indirectly by trust.
EQUITY COMPENSATION PLAN INFORMATION
The following table summarizes the number of outstanding options and awards granted to employees and directors, as well as the number of securities remaining available for future issuance under these plans as of January 31, 2024:
| | | | | | | | | | | | | | | | | | | | |
| | (a) | | (b) | | (c) |
| Plan category | | Number of securities to be issued upon exercise or vesting of outstanding options and awards (in millions) | | Weighted-average exercise price of outstanding options | | Number of securities remaining available for future issuance under equity compensation plans (excluding securities reflected in column (a)) (in millions) (2) |
| Equity compensation plans approved by security holders (1) | | 5 | | | $ | 21.39 | | | 18 | |
| Total | | 5 | | $ | 21.39 | | | 18 |
______________
(1)Includes the 2022 Equity Incentive Plan that was approved by Autodesk’s stockholders and became effective on June 16, 2022, and the 2012 Employee Stock Plan, as amended, set forth in Part II, Item 8, Financial Statements and Supplementary Data, Note 4, "Equity Compensation".
(2)Included in this amount are 4 million securities available for future issuance under Autodesk’s Employee Stock Purchase Plan.
ITEM 13.CERTAIN RELATIONSHIPS AND RELATED TRANSACTIONS, AND DIRECTOR INDEPENDENCE
RELATED PARTY TRANSACTIONS
Our Audit Committee has established a written policy and procedures for review and approval of related-party transactions. Autodesk’s Related Party Transactions Policy states that all transactions between Autodesk and its wholly owned subsidiaries and any of its directors, executive officers, nominees for director or owners of 5% or more of our stock, or their immediate family members, where the amount involved exceeds $120,000, require the approval of both our Chief Financial Officer and the Audit Committee. If a related-party transaction subject to review involves directly or indirectly a member of the Audit Committee or the Chief Financial Officer (or one of their immediate family members), such Audit Committee member or Chief Financial Officer will recuse him or herself from the review. The Chief Financial Officer and the Audit Committee shall approve or ratify only those transactions that are deemed to be not inconsistent with the best interests of the Company as a whole. Non-routine transactions with vendors and suppliers of Autodesk and its wholly-owned subsidiaries require the prior written approval of the Chief Accounting Officer.
During fiscal year 2024, there were ordinary course transactions between Autodesk and certain related entities, for example for the purchase of software licenses by companies of which a director is an executive officer or where an executive officer was previously employed. None of these transactions constituted a related-party transaction that required approval by the Audit Committee.
DIRECTOR INDEPENDENCE
Our Board believes independence is a critical component of our governance strategy, and that it’s continued independence enables it to be objective in carrying out its oversight responsibilities. Our Corporate Governance Guidelines provide that a substantial majority of our directors will be independent and that each Committee will be made up of solely independent directors. Autodesk’s independent directors meet regularly in executive session, without management present, as part of the quarterly Board meetings, with the intent to facilitate open discussion. Stacy Smith, our Chair, presides at these executive sessions.
Each year, and before a new director is appointed, the Board must affirmatively determine a director has no relationship that would interfere with the exercise of independent judgment in carrying out their responsibilities as a director. Annually, each director also completes a detailed questionnaire that provides information about relationships that might affect the determination of independence. Autodesk management provides the Corporate Governance and Nominating Committee and the Board with the relevant information from the questionnaires along with known facts and circumstances of any relationship bearing on the independence of a director or nominee. The Corporate Governance and Nominating Committee then completes an assessment of each director considering all known relevant facts and circumstances concerning any relationship bearing on the independence of a director or nominee. This process includes evaluating whether any identified relationship otherwise adversely affects a director’s independence and affirmatively determining that the director has no material relationship with Autodesk, another director, or as a partner, stockholder, or officer of an organization that has a relationship with Autodesk. As part of its annual review process, our Corporate Governance and Nominating Committee also considers a director’s tenure.
As required by the Nasdaq listing standards, a majority of the members of our Board qualify as “independent.” The Board has determined that, with the exception of Dr. Anagnost, our President and CEO, and Ms. Rafael, our Interim CFO, all of its members are “independent directors” as that term is defined by applicable Nasdaq listing standards. That definition includes a series of objective tests, including that the director is not an employee of the company and has not engaged in various types of business dealings with the company. In addition, as further required by applicable Nasdaq listing standards, the Board has made a subjective determination as to each independent director that no relationships exist that would interfere with the exercise of independent judgment in carrying out the responsibilities of a director.
Based on the review and recommendation by the Corporate Governance and Nominating Committee, the Board analyzed the independence of each director. The Board determined that Mses. Blasing, Howard, McDowell, and Norrington, and Messrs. French, Irving, Milligan, Rahim and Smith meet the standards of independence under our Corporate Governance Guidelines and the Nasdaq listing standards, including that each member is free of any relationship that would interfere with his or her individual exercise of independent judgment.
ITEM 14.PRINCIPAL ACCOUNTING FEES AND SERVICES
The following table presents fees billed for professional audit services and other services rendered to Autodesk by EY and its affiliates for the fiscal years ended January 31, 2024 and 2023.
| | | | | | | | | | | | | | |
| | Fiscal Year 2024 | | Fiscal Year 2023 |
| | | (in millions) |
| Audit Fees (1) | | $ | 9.3 | | | $ | 6.8 | |
| Audit-Related Fees (2) | | — | | | 0.2 | |
| Tax Fees (3) | | 0.3 | | | 0.2 | |
| All Other Fees (4) | | — | | | 0.1 | |
| Total | | $ | 9.6 | | | $ | 7.3 | |
_________________
(1)Audit Fees consisted of fees billed for professional services rendered for the integrated audit of Autodesk’s annual financial statements and management’s report on internal controls included in Autodesk's Annual Reports on Form 10-K, for the review of the financial statements included in Autodesk’s Quarterly Reports on Form 10-Q, and for other services, including statutory audits and services rendered in connection with SEC filings.
(2)Audit-Related Fees consisted of fees for assurance and related services that are reasonably related to the performance of the audit or review of our financial statements. This category includes fees arising from accounting-related consulting services.
(3)Tax Fees consisted of fees billed for tax compliance, consultation, and planning services.
(4)Other fees consisted of fees for permissible training programs and subscription fees for an online accounting research tool.
PRE-APPROVAL OF AUDIT AND NON-AUDIT SERVICES
Generally, all audit and non-audit services provided by EY and its affiliates to Autodesk must be pre-approved by the Audit Committee. The Audit Committee is presented with a detailed listing of the individual audit and non-audit services and fees (separately describing audit-related services, tax services, and other services) expected to be provided by EY and its affiliates during the year. The Audit Committee is also responsible for the audit fee negotiations associated with Autodesk’s retention of EY. Periodically, the Audit Committee receives an update of all pre-approved audit and non-audit services conducted, and information regarding any new audit and non-audit services to be provided by EY and its affiliates. The Audit Committee reviews the update and approves the proposed services if they are deemed acceptable.
To ensure prompt handling of unexpected matters, the Chair of the Audit Committee has authority to amend or modify the list of approved audit and non-audit services and fees so long as such additional or amended services do not affect EY's independence under applicable SEC rules. The Chair reports any such action taken at subsequent Audit Committee meetings.
PART IV
ITEM 15.EXHIBITS AND FINANCIAL STATEMENT SCHEDULES
(a) The following documents are filed as part of this Report:
1.Financial Statements: The information concerning Autodesk’s financial statements, and the Report of Ernst & Young LLP, Independent Registered Public Accounting Firm (PCAOB ID: 42), San Francisco, California, required by this Item is incorporated by reference herein to the section of this Report in Part II, Item 8, entitled “Financial Statements and Supplementary Data.”
2.Financial Statement Schedule: The following financial statement schedule of Autodesk, Inc., for the fiscal years ended January 31, 2024, 2023, and 2022, is filed as part of this Report and should be read in conjunction with the Consolidated Financial Statements of Autodesk, Inc.:
Schedule II Valuation and Qualifying Accounts
Schedules not listed above have been omitted because they are not applicable or are not required or the information required to be set forth therein is included in the Consolidated Financial Statements or Notes thereto.
3.Exhibits: See Item 15(b) below. We have filed, or incorporated into this Report by reference, the exhibits listed on the accompanying Index to Exhibits immediately prior to the signature page of this Form 10-K.
(b) Exhibits:
We have filed, or incorporated into this Report by reference, the exhibits listed on the accompanying Index to Exhibits immediately prior to the signature page of this Form 10-K.
(c) Financial Statement Schedules: See Item 15(a), above.
ITEM 15(A)(2)FINANCIAL STATEMENT SCHEDULE
SCHEDULE II: VALUATION AND QUALIFYING ACCOUNTS
(in millions)
| | | | | | | | | | | | | | | | | | | | | | | |
| Description | Balance at
Beginning
of Fiscal Year | | Additions
Charged to
Costs and
Expenses or
Revenues | | Deductions | | Balance at
End of Fiscal Year |
| | (in millions) |
| Fiscal Year Ended January 31, 2024 | | | | | | | |
| | | | | | | |
| | | | | | | |
| Partner program reserves (1) | $ | 90 | | | $ | 1,071 | | | $ | 1,058 | | | $ | 103 | |
| | | | | | | |
| Fiscal Year Ended January 31, 2023 | | | | | | | |
| | | | | | | |
| | | | | | | |
| Partner program reserves (1) | 64 | | | 928 | | | 902 | | | 90 | |
| | | | | | | |
| Fiscal Year Ended January 31, 2022 | | | | | | | |
| | | | | | | |
| | | | | | | |
| Partner Program reserves (1) | 64 | | | 623 | | | 623 | | | 64 | |
| | | | | | | |
____________________
(1)The partner program reserves balance impacts "Accounts receivable, net" and "Accounts payable" on the accompanying Consolidated Balance Sheets.
ITEM 16FORM 10-K SUMMARY
None.
Index to Exhibits
| | | | | | | | | | | | | | | | | | | | |
| Exhibit | | Filed | Incorporated by Reference |
| Number | Description | Herewith | Form | SEC File No. | Exhibit | Filing Date |
| 3.1 | | | 10-K | 000-14338 | 3.1 | 3/20/2006 |
| 3.2 | | | 8-K | 000-14338 | 3.1 | 12/15/2022 |
| 4.1 | | | 8-K | 000-14338 | 4.1 | 12/13/2012 |
| 4.2 | | | 8-K | 000-14338 | 4.2 | 12/13/2012 |
| 4.3 | | | 8-K | 000-14338 | 4.1 | 6/8/2017 |
| 4.4 | | | 8-K | 000-14338 | 4.1 | 1/14/2020 |
| 4.5 | | | 8-K | 000-14338 | 4.1 | 10/7/2021 |
| 4.6 | | | 10-K | 000-14338 | 4.6 | 3/19/2020 |
| 10.1* | | | 8-K | 000-14338 | | 3/26/2018 |
| 10.2* | | | 10-Q | 000-14338 | 10.2 | 8/30/2018 |
| 10.3* | | | 10-Q | 000-14338 | 10.2 | 8/30/2016 |
| 10.4* | | | 10-Q | 000-14338 | 10.3 | 8/30/2016 |
| 10.5* | | | 8-K | 000-14338 | 10.2 | 3/13/2012 |
| 10.6* | | | 8-K | 000-14338 | 10.4 | 3/13/2012 |
| 10.7* | | | S-8 | 333-228934 | 99.1 | 12/21/2018 |
| 10.8* | | | S-8 | 333-229346 | 99.1 | 1/24/2019 |
| 10.9* | | | 10-K | 000-14338 | 10.18 | 3/21/2017 |
| 10.10* | | | 8-K | 000-14338 | 10.5 | 3/13/2012 |
| 10.11* | | | 10-Q | 000-14338 | 10.1 | 6/4/2019 |
| 10.12* | | | 10-K | 000-14338 | 10.23 | 3/23/2016 |
| 10.13* | | | 10-Q | 000-14338 | 10.1 | 12/8/2009 |
| 10.14* | | | 8-K | 000-14338 | 10.1 | 4/27/2022 |
| 10.15* | | | 10-K | 000-14338 | 10.8 | 3/31/2005 |
| 10.16 | | | 10-Q | 000-14338 | 10.1 | 9/1/2021 |
| 10.17.1* | | | 8-K | 000-14338 | 10.1 | 6/19/2017 |
| 10.17.2 | | | 8-K | 000-14338 | 10.2 | 4/27/2022 |
| 10.18* | | | 10-Q | 000-14338 | 10.1 | 6/3/2021 |
| 10.19* | | | 10-Q | 000-14338 | 10.2 | 6/3/2021 |
| 10.20* | | | 10-K | 000-14338 | 10.21 | 3/19/2021 |
| 10.21 | | | 10-Q | 000-14338 | 10.1 | 12/16/22 |
| 10.22 | | | 8-K | 000-14338 | 10.1 | 06/21/2022 |
| | | | | | | | | | | | | | | | | | | | |
| Exhibit | | Filed | Incorporated by Reference |
| Number | Description | Herewith | Form | SEC File No. | Exhibit | Filing Date |
| 10.23 | | X | | | | |
| 10.24 | | | 8-K | 000-14338 | 99.1 | 08/23/2022 |
| 10.25 | | | 8-K | 000-14338 | 99.2 | 08/23/2022 |
| 10.26 | | | 10-K | 000-14338 | 10.26 | 03/14/2023 |
| 19.1 | | X | | | | |
| 21.1 | | X | | | | |
| 23.1 | | X | | | | |
| 24.1 | | X | | | | |
| 31.1 | | X | | | | |
| 31.2 | | X | | | | |
| 32.1† | | X | | | | |
| 97.1 | | X | | | | |
| 101.INS †† | XBRL Instance Document | | | | | |
| 101.SCH †† | XBRL Taxonomy Extension Schema | | | | | |
| 101.CAL †† | XBRL Taxonomy Extension Calculation Linkbase | | | | | |
| 101.DEF †† | XBRL Taxonomy Extension Definition Linkbase | | | | | |
| 101.LAB †† | XBRL Taxonomy Extension Label Linkbase | | | | | |
| 101.PRE †† | XBRL Taxonomy Extension Presentation Linkbase | | | | | |
| 104 | Cover Page Interactive Data File (formatted as Inline XBRL and contained in Exhibit 101) | | | | | |
____________________
* Denotes a management contract or compensatory plan or arrangement.
† The certifications attached as Exhibit 32.1 that accompany this Annual Report on Form 10-K are not deemed filed with the Securities and Exchange Commission and are not to be incorporated by reference into any filing of Autodesk, Inc. under the Securities Act of 1933, as amended, or the Securities Exchange Act of 1934, as amended, whether made before or after the date of this Form 10-K, irrespective of any general incorporation language contained in such filing.
†† The financial information contained in these XBRL documents is unaudited.
SIGNATURES
Pursuant to the requirements of Section 13 or 15(d) of the Securities Exchange Act of 1934, the Registrant has duly caused this Report to be signed on its behalf by the undersigned, thereunto duly authorized.
| | | | | | | | | | | |
| | AUTODESK, INC. |
| | By: | /s/ ANDREW ANAGNOST |
| | | Andrew Anagnost |
| | | President and Chief Executive Officer |
| Dated: | June 10, 2024 | | |
POWER OF ATTORNEY
KNOW ALL PERSONS BY THESE PRESENTS, that each person whose signature appears below constitutes and appoints Andrew Anagnost and Elizabeth Rafael each as his or her attorney-in-fact, each with the power of substitution, for him or her in any and all capacities, to sign any amendments to this Report on Form 10-K, and to file the same, with exhibits thereto and other documents in connection therewith, with the Securities and Exchange Commission, hereby ratifying and confirming all that each of said attorneys-in-fact, or his substitute or substitutes, may do or cause to be done by virtue hereof.
Pursuant to the requirements of the Securities Exchange Act of 1934, this Report has been signed below by the following persons on behalf of the Registrant and in the capacities as of June 10, 2024.
| | | | | | | | |
| Signature | | Title |
| /s/ ANDREW ANAGNOST | | President and Chief Executive Officer, Director (Principal Executive Officer) |
| Andrew Anagnost | | |
| | |
| /s/ ELIZABETH RAFAEL | | Interim Chief Financial Officer, Director (Principal Financial Officer) |
Elizabeth Rafael | | |
| | |
| /s/ STEPHEN W. HOPE | | Senior Vice President and Chief Accounting Officer (Principal Accounting Officer) |
| Stephen W. Hope | | |
| | |
| /s/ STACY J. SMITH | | Director
(Non-executive Chairman of the Board) |
| Stacy J. Smith | | |
| | |
| /s/ KAREN BLASING | | Director |
| Karen Blasing | | |
| | |
| /s/ REID FRENCH | | Director |
| Reid French | | |
| | |
| /s/ AYANNA HOWARD | | Director |
| Ayanna Howard | | |
| | |
| /s/ MARY T. MCDOWELL | | Director |
| Mary T. McDowell | | |
| | |
| /s/ BLAKE J. IRVING | | Director |
| Blake J. Irving | | |
| | |
| /s/ STEPHEN D. MILLIGAN | | Director |
| Stephen D. Milligan | | |
| | |
| /s/ LORRIE M. NORRINGTON | | Director |
| Lorrie M. Norrington | | |
| | |
| | |
| | |
| | |
| /s/ RAMI RAHIM | | Director |
| Rami Rahim | | |