UNITED STATES
SECURITIES AND EXCHANGE COMMISSION
Washington, D.C. 20549
FORM N-CSR
CERTIFIED SHAREHOLDER REPORT OF REGISTERED MANAGEMENT INVESTMENT COMPANIES
Investment Company Act file number 811-04282
Name of Fund: BlackRock Natural Resources Trust
Fund Address: 100 Bellevue Parkway, Wilmington, DE 19809
Name and address of agent for service: John M. Perlowski, Chief Executive Officer, BlackRock Natural Resources Trust, 55 East 52nd Street, New York, NY 10055
Registrant’s telephone number, including area code: (800) 441-7762
Date of fiscal year end: 07/31/2011
Date of reporting period: 01/31/2011
Item 1 – Report to Stockholders
|
|
|
|
|
January 31, 2011 |

Semi-Annual Report (Unaudited)
BlackRock Equity Dividend Fund
BlackRock Natural Resources Trust
BlackRock Utilities and Telecommunications Fund, Inc.
|
|
|
Not FDIC Insured § No Bank Guarantee § May Lose Value |
|
|
|
|
|
|
|
Table of Contents |
|
|
|
|
|
|
|
|
|
|
|
Page |
|
|
|
|
|
|
|
|
|
|
3 |
|
|
Semi-Annual Report: |
|
|
|
|
4 |
|
|
|
10 |
|
|
|
11 |
|
|
|
11 |
|
|
Financial Statements: |
|
|
|
|
12 |
|
|
|
21 |
|
|
|
23 |
|
|
|
24 |
|
|
|
26 |
|
|
|
42 |
|
|
|
52 |
|
|
|
53 |
|
|
|
55 |
|
|
|
|
|
|
||
|
2 |
SEMI-ANNUAL REPORT |
JANUARY 31, 2011 |
|
|
|
|
|
|
Economic data fluctuated widely throughout 2010, but as the year drew to a close, it became clear that cyclical stimulus had beaten out structural problems as economic data releases generally became more positive and financial markets showed signs of continuing improvement. The sovereign debt crises and emerging market inflation that troubled the global economy in 2010 remain a challenge to global growth, but overall levels of uncertainty are gradually declining as the United States and the world economy are progressing from a stimulus-driven recovery into a consumption-driven expansion.
In the United States, the corporate sector has been an important area of strength and consumer spending has shown improvement, although weakness in the housing and labor markets continues to burden the economy. It is important to note that we are in the midst of the first global economic recovery that is being led by emerging economies, and the United States has only just begun its transition to a self-sustaining expansion, suggesting that economic improvements still have a way to go.
Global equity markets experienced uneven growth and high volatility over the course of 2010, but ended the year strong. Stocks continued their advance through most of January until the political unrest in Egypt and widespread discord across the Middle East caused a sharp, but temporary decline at the end of the period. US stocks outpaced most international markets over the 12-month period. Small cap stocks outperformed large caps as investors moved into higher-risk assets.
Fixed income markets saw yields trend lower over most of 2010, until the fourth quarter brought an abrupt reversal in sentiment and risk tolerance that drove yields sharply upward (pushing prices downward) through year end and into the New Year. However, on a 12-month basis, yields were lower overall and fixed income markets performed well. Conversely, the tax-exempt municipal market was dealt an additional blow as it became evident that the Build America Bond program would expire at the end of 2010. In addition, negative headlines regarding fiscal challenges faced by state and local governments damaged investor confidence and sparked additional volatility in the municipal market. These conditions began to moderate as the period came to a close and the market has shown signs of improvement in supply-and-demand technicals.
Cash investments, as represented by the 3-month Treasury bill, returned only a fraction over 0% for the 12-month period as short-term interest rates remained low. Yields on money market securities remain near all-time lows.
|
|
|
|
|
|
|
|
|
|
Total Returns as of January 31, 2011 |
|
6-month |
|
12-month |
|
||
|
|
|
|
|
|
|
|
|
|
US large cap equities (S&P 500 Index) |
|
17.93 |
% |
|
22.19 |
% |
|
|
|
|
|
|
|
|
|
|
|
US small cap equities (Russell 2000 Index) |
|
20.75 |
|
|
31.36 |
|
|
|
|
|
|
|
|
|
|
|
|
International equities (MSCI Europe, Australasia, Far East Index) |
|
16.10 |
|
|
15.38 |
|
|
|
|
|
|
|
|
|
|
|
|
3-month Treasury bill (BofA Merrill Lynch 3-Month Treasury Bill Index) |
|
0.06 |
|
|
0.13 |
|
|
|
|
|
|
|
|
|
|
|
|
US Treasury securities (BofA Merrill Lynch 10-Year US Treasury Index) |
|
(2.25 |
) |
|
5.25 |
|
|
|
|
|
|
|
|
|
|
|
|
US investment grade bonds (Barclays Capital US Aggregate Bond Index) |
|
0.20 |
|
|
5.06 |
|
|
|
|
|
|
|
|
|
|
|
|
Tax-exempt municipal bonds (Barclays Capital Municipal Bond Index) |
|
(2.84 |
) |
|
1.10 |
|
|
|
|
|
|
|
|
|
|
|
|
US high yield bonds (Barclays Capital US Corporate High Yield 2% Issuer Capped Index) |
|
8.65 |
|
|
15.96 |
|
|
|
|
|
|
|
|
|
|
|
|
|
|
|
|
Past performance is no guarantee of future results. Index performance shown for illustrative purposes only. You cannot invest directly in an index. |
While no one can peer into a crystal ball and eliminate the uncertainties presented by the economic landscape and financial markets, BlackRock can offer investors the next best thing: partnership with the world’s largest asset management firm and a unique global perspective that allows us to identify trends early and capitalize on market opportunities. For additional market perspective and investment insight, visit www.blackrock.com/shareholdermagazine, where you’ll find the most recent issue of our award-winning Shareholder® magazine, as well as its quarterly companion newsletter, Shareholder Perspectives. As always, we thank you for entrusting BlackRock with your investments, and we look forward to your continued partnership in the months and years ahead.
|
|
|
Sincerely, |
|
|
|
Rob Kapito |
|
President, BlackRock Advisors, LLC |

|
|
|
|
|
|
|
|
|
|
THIS PAGE NOT PART OF YOUR FUND REPORT |
3 |
|
|
|
|
|
|
|
|
|
|
BlackRock Equity Dividend Fund |
|
|
|
|
|
Investment Objective |
|
|
BlackRock Equity Dividend Fund’s (the “Fund”) investment objective is to seek long-term total return and current income.
|
|
|
|
|
Portfolio Management Commentary |
|
|
|
|
|
|
|
How did the Fund perform? |
|
|
|
|
• |
The Fund generated double-digit positive returns for the six-month period, but underperformed its performance benchmark, the Russell 1000 Value Index, and the broad-market S&P 500 Index. The following discussion of relative performance pertains to the Russell 1000 Value Index. |
|
|
|
|
|
What factors influenced performance? |
|
|
|
|
• |
The largest single contributor to the Fund’s overall performance was an underweight position in the financials sector, followed by an overweight in industrials. The Fund also benefited significantly from a heavier overweight in materials and strong stock selection in telecommunication services. Additional out performance was generated through a strategic underweight in the conservative health care sector. |
|
|
|
|
• |
On the negative side, the largest individual detractor from performance during the period was the Fund’s cash weighting, which weighed on returns in an appreciating market. Stock selection in the energy sector also detracted from returns, as several stocks were affected by the Deepwater Horizon disaster and the headline risk surrounding the incident. Additionally, the Fund was adversely affected by an overweight position in consumer staples and individual stock selection within health care. |
|
|
|
|
|
Describe recent portfolio activity. |
|
|
|
|
• |
During the six months, there were relatively few changes to the strategic direction of the Fund, as we remained consistent with our low-turnover philosophy and long-term outlook. However, given our views regarding a prospective economic recovery and higher level of general confidence in the equity market, we pursued investment opportunities in the consumer discretionary, financials and industrials sectors. We believe certain companies in these sectors will be better positioned for a steadier-growth, recovering economic climate. |
|
|
|
|
|
Describe Fund positioning at period end. |
|
|
|
|
• |
In this environment, our emphasis for the latter half of 2010 was on consistency and stability of revenues, dividend growth and continued long-term focus in markets that were decidedly volatile and driven by macroeconomic themes. The Fund’s strategy delivered as would be expected in the midst of a fragile-but-strengthening early economic recovery. Individual stocks generally experienced current income growth and total return in line with the company’s earnings, while markets moved up and down during the year. Given our expectations for economic growth in 2011, a temporary resolution of tax policy, a continued acceleration in dividends and a predicted flow of funds into equities, we believe price appreciation among large-cap stocks could exceed the level of company earnings in 2011. |
|
|
|
|
• |
At period end, the Fund remains positioned to benefit from both domestic and global economic growth, stronger worldwide demand for raw materials and increasing levels of free cash flow at the company level. Our focus continues to be on the balance between growing, reliable dividend income and stable capital appreciation as companies and markets progressively gain structure and momentum in 2011. |
|
|
|
|
|
|
|
|
The views expressed reflect the opinions of BlackRock as of the date of this report and are subject to change based on changes in market, economic or other conditions. These views are not intended to be a forecast of future events and are no guarantee of future results. |
|
|
|
|
|
Portfolio Information |
|
|
|
|
|
|
|
|
|
Ten Largest Holdings |
|
Percent
of |
|
|
|
|
|
|
|
|
|
Chevron Corp. |
|
3 |
% |
|
|
BHP Billiton Ltd. |
|
3 |
|
|
|
JPMorgan Chase & Co. |
|
3 |
|
|
|
ExxonMobil Corp. |
|
2 |
|
|
|
Deere & Co. |
|
2 |
|
|
|
Caterpillar, Inc. |
|
2 |
|
|
|
Wells Fargo & Co. |
|
2 |
|
|
|
Total SA — ADR |
|
2 |
|
|
|
General Electric Co. |
|
2 |
|
|
|
International Business Machines Corp. |
|
2 |
|
|
|
|
|
|
|
|
|
|
|
|
|
|
|
Sector Allocations |
|
Percent
of |
|
|
|
|
|
|
|
|
|
Industrials |
|
17 |
% |
|
|
Financials |
|
16 |
|
|
|
Energy |
|
15 |
|
|
|
Consumer Staples |
|
13 |
|
|
|
Materials |
|
10 |
|
|
|
Utilities |
|
7 |
|
|
|
Telecommunication Services |
|
6 |
|
|
|
Consumer Discretionary |
|
6 |
|
|
|
Health Care |
|
5 |
|
|
|
Information Technology |
|
5 |
|
|
|
|
|
|
|
|
|
|
|
|
|
For Fund compliance purposes, the Fund’s sector classifications refer to any one or more of the sector sub-classifications used by one or more widely recognized market indexes or rating group indexes, and/or as defined by Fund management. This definition may not apply for purposes of this report, which may combine such sector sub-classifications for reporting ease. |
|
|
|
|
|
|
||
|
4 |
SEMI-ANNUAL REPORT |
JANUARY 31, 2011 |
|
|
|
|
|
|
|
BlackRock Equity Dividend Fund |
|
|
|
|
|
Total Return Based on a $10,000 Investment |
|
|

|
|
|
|
|
|
1 |
Assuming maximum sales charge, transaction costs and other operating expenses, including investment advisory fees, if any. Institutional Shares do not have a sales charge. |
|
|
|
|
|
|
2 |
Under normal circumstances, the Fund invests at least 80% of its assets in equity securities and at least 80% of its assets in dividend paying securities. |
|
|
|
|
|
|
3 |
This unmanaged index covers 500 industrial, utility, transportation and financial companies of the US markets (mostly New York Stock Exchange (“NYSE”) issues), representing about 75% of NYSE market capitalization and 30% of NYSE issues. |
|
|
|
|
|
|
4 |
This unmanaged broad-based index is a subset of the Russell 1000 Index consisting of those Russell 1000 securities with lower price/book ratios and lower forecasted growth values. |
|
|
|
|
|
Performance Summary for the Period Ended January 31, 2011 |
|
|
|
|
|
|
|
|
|
|
|
|
|
|
|
|
|
|
|
|
|
|
|
|
|
|
|
|
|
|
|
|
Average Annual Total Returns5 |
|
||||||||||||||||
|
|
|
|
|
|
|
|
||||||||||||||||
|
|
|
|
|
|
1 Year |
|
5 Years |
|
10 Years |
|
||||||||||||
|
|
|
|
|
|
|
|
|
|
|
|
||||||||||||
|
|
|
6-Month |
|
w/o
sales |
|
w/sales |
|
w/o
sales |
|
w/sales |
|
w/o
sales |
|
w/sales |
|
|||||||
|
|
|
|
|
|
|
|
|
|
|
|
|
|
|
|
|
|||||||
|
Institutional |
|
15.29 |
% |
|
19.92 |
% |
|
N/A |
|
|
4.25 |
% |
|
N/A |
|
|
6.59 |
% |
|
N/A |
|
|
|
Service |
|
15.10 |
|
|
19.60 |
|
|
N/A |
|
|
3.98 |
|
|
N/A |
|
|
6.32 |
|
|
N/A |
|
|
|
Investor A |
|
15.16 |
|
|
19.64 |
|
|
13.36 |
% |
|
3.96 |
|
|
2.85 |
% |
|
6.30 |
|
|
5.73 |
% |
|
|
Investor B |
|
14.67 |
|
|
18.68 |
|
|
14.18 |
|
|
3.15 |
|
|
2.79 |
|
|
5.64 |
|
|
5.64 |
|
|
|
Investor C |
|
14.68 |
|
|
18.76 |
|
|
17.76 |
|
|
3.19 |
|
|
3.19 |
|
|
5.50 |
|
|
5.50 |
|
|
|
Class R |
|
14.93 |
|
|
19.21 |
|
|
N/A |
|
|
3.64 |
|
|
N/A |
|
|
6.10 |
|
|
N/A |
|
|
|
|
|
|
|
|
|
|
|
|
|
|
|
|
|
|
|
|
|
|
|
|
|
|
|
S&P 500 Index |
|
17.93 |
|
|
22.19 |
|
|
N/A |
|
|
2.24 |
|
|
N/A |
|
|
1.30 |
|
|
N/A |
|
|
|
Russell 1000 Value Index |
|
16.60 |
|
|
21.54 |
|
|
N/A |
|
|
0.96 |
|
|
N/A |
|
|
3.45 |
|
|
N/A |
|
|
|
|
|
|
|
|
|
|
|
|
|
|
|
|
|
|
|
|
|
|
|
|
|
|
|
|
|
|
|
|
5 |
Assuming maximum sales charges, if any. Average annual total returns with and without sales charges reflect reductions for distribution and service fees. See “About Fund Performance” on page 10 for a detailed description of share classes, including any related sales charges and fees. |
|
|
|
|
|
|
|
N/A — Not applicable as share class and index do not have a sales charge. |
|
|
|
|
|
|
|
Past performance is not indicative of future results. |
|
|
|
|
|
Expense Example |
|
|
|
|
|
|
|
|
|
|
|
|
|
|
|
|
|
|
|
|
|
|
|
|
|
|
|
|
|
|
|
|
|
|
|
|
|
|
|
|
|
Actual |
|
Hypothetical7 |
|
|
|
|
||||||||||||||||||||||||||
|
|
|
|
|
|
|
|
|
|
||||||||||||||||||||||||||
|
|
|
Beginning |
|
Ending |
|
Expenses
Paid |
|
Beginning |
|
Ending |
|
Expenses
Paid |
|
Annualized |
|
|||||||||||||||||||
|
|
|
|
|
|
|
|
|
|
|
|
|
|
|
|
|
|||||||||||||||||||
|
Institutional |
|
|
$ |
1,000.00 |
|
|
|
$ |
1,152.90 |
|
|
|
$ |
4.02 |
|
|
|
$ |
1,000.00 |
|
|
|
$ |
1,021.47 |
|
|
|
$ |
3.77 |
|
|
0.74 |
% |
|
|
Service |
|
|
$ |
1,000.00 |
|
|
|
$ |
1,151.00 |
|
|
|
$ |
5.48 |
|
|
|
$ |
1,000.00 |
|
|
|
$ |
1,020.11 |
|
|
|
$ |
5.14 |
|
|
1.01 |
% |
|
|
Investor A |
|
|
$ |
1,000.00 |
|
|
|
$ |
1,151.60 |
|
|
|
$ |
5.53 |
|
|
|
$ |
1,000.00 |
|
|
|
$ |
1,020.06 |
|
|
|
$ |
5.19 |
|
|
1.02 |
% |
|
|
Investor B |
|
|
$ |
1,000.00 |
|
|
|
$ |
1,146.70 |
|
|
|
$ |
9.85 |
|
|
|
$ |
1,000.00 |
|
|
|
$ |
1,016.03 |
|
|
|
$ |
9.25 |
|
|
1.82 |
% |
|
|
Investor C |
|
|
$ |
1,000.00 |
|
|
|
$ |
1,146.80 |
|
|
|
$ |
9.52 |
|
|
|
$ |
1,000.00 |
|
|
|
$ |
1,016.33 |
|
|
|
$ |
8.94 |
|
|
1.76 |
% |
|
|
Class R |
|
|
$ |
1,000.00 |
|
|
|
$ |
1,149.30 |
|
|
|
$ |
7.15 |
|
|
|
$ |
1,000.00 |
|
|
|
$ |
1,018.55 |
|
|
|
$ |
6.72 |
|
|
1.32 |
% |
|
|
|
|
|
|
|
|
|
|
|
|
|
|
|
|
|
|
|||||||||||||||||||
|
|
|
|
|
|
6 |
For each class of the Fund, expenses are equal to the annualized expense ratio for the class, multiplied by the average account value over the period, multiplied by 184/365 (to reflect the one-half year period shown). |
|
|
|
|
|
|
7 |
Hypothetical 5% annual return before expenses is calculated by pro rating the number of days in the most recent fiscal half year divided by 365. |
|
|
|
|
|
|
|
|
|
SEMI-ANNUAL REPORT |
JANUARY 31, 2011 |
5 |
|
|
|
|
|
|
|
|
|
|
Fund Summary as of January 31, 2011 |
BlackRock Natural Resources Trust |
|
|
|
|
|
|
|
Investment Objective |
|
|
|
|
|
|
|
|
BlackRock Natural Resources Trust’s (the “Fund”) investment objective is to seek long-term growth of capital and to protect the purchasing power of shareholders’ capital by investing in a portfolio of equity securities of domestic and foreign companies with substantial natural resource assets. |
|
|
|
|
|
|
|
|
Portfolio Management Commentary |
|
|
|
|
|
|
|
|
|
How did the Fund perform? |
|
|
|
|
• |
The Fund outperformed its performance benchmark,the MSCI Natural Resources Index, and the broad-market S&P 500 Index for the six-month period. The following discussion of relative performance pertains to the MSCI Natural Resources Index. |
|
|
|
|
|
What factors influenced performance? |
|
|
|
|
• |
During the six months,the largest contributor to performance was the Fund’s overweight position in oil & gas equipment & services. The Fund held an average overweight of approximately 10% in this segment. Since this sub-industry is a higher-beta (more sensitive to market volatility) component of the energy sector, this segment performed particularly well as the energy sector rallied in the fourth quarter of 2010. Stock selection within oil & gas exploration & production also contributed to relative returns, as positions in Brigham Exploration Co. and Anadarko Petroleum Corp. were strong. An overweight position in oil & gas drilling also contributed to returns. |
|
|
|
|
• |
Conversely,the Fund’s cash position created a drag on performance,as energy and resources stocks were particularly strong in the fourth quarter of 2010. Our underweight in ExxonMobil Corp., a large weight in the MSCI Natural Resources Index, was a modest detractor as ExxonMobil Corp. posted relatively strong returns during the period. |
|
|
|
|
|
Describe recent portfolio activity. |
|
|
|
|
• |
Portfolio turnover was low for the six months,as is typical for the Fund.We initiated positions in a silver commodity index and in oil & gas exploration company Uranium Energy Corp., and added to existing positions in oil & gas exploration & production companies Pioneer Natural Resources Co. and Berry Petroleum Co. |
|
|
|
|
|
Describe Fund positioning at period end. |
|
|
|
|
• |
At period end,the Fund had an emphasis on oil-related names,and sub-sequently the Fund’s largest overweights relative to the benchmark were in oil & gas exploration & production and energy equipment & services names. The Fund is overweight in energy and underweight in materials, particularly in the metals & mining industry. Our largest relative underweights were in integrated oil & gas and metals & mining industries, and the Fund was underweight in gas-related names, with a small allocation to the coal segment. |
|
|
|
|
|
The views expressed reflect the opinions of BlackRock as of the date of this report and are subject to change based on changes in market, economic or other conditions. These views are not intended to be a forecast of future events and are no guarantee of future results. |
|
|
|
|
|
|
|
Portfolio Information |
|
|
|
|
|
|
|
|
|
|
|
Ten Largest Holdings |
|
Percent
of |
|
|
|
|
|
|
|
|
|
EOG Resources, Inc. |
|
4 |
% |
|
|
Apache Corp. |
|
4 |
|
|
|
National Oilwell Varco, Inc. |
|
3 |
|
|
|
Murphy Oil Corp. |
|
3 |
|
|
|
Devon Energy Corp. |
|
3 |
|
|
|
ExxonMobil Corp. |
|
3 |
|
|
|
Suncor Energy, Inc. |
|
3 |
|
|
|
Talisman Energy, Inc. |
|
3 |
|
|
|
Occidental Petroleum Corp. |
|
3 |
|
|
|
FMC Technologies, Inc. |
|
3 |
|
|
|
|
|
|
|
|
|
|
|
|
|
|
|
Industry Allocations |
|
Percent
of |
|
|
|
|
|
|
|
|
|
Oil & Gas Exploration & Production |
|
25 |
% |
|
|
Integrated Oil & Gas |
|
14 |
|
|
|
Energy Equipment & Services |
|
13 |
|
|
|
Oil, Gas & Consumable Fuels |
|
12 |
|
|
|
Oil & Gas Equipment & Services |
|
9 |
|
|
|
Canadian Independents |
|
9 |
|
|
|
Metals & Mining |
|
8 |
|
|
|
Oil & Gas Drilling |
|
5 |
|
|
|
Gold |
|
2 |
|
|
|
Oil & Gas Producers |
|
1 |
|
|
|
Chemicals |
|
1 |
|
|
|
Diversified Financial Services |
|
1 |
|
|
|
|
|
|
|
|
|
|
|
|
|
For Fund compliance purposes, the Fund’s industry classifications refer to any one or more of the industry sub-classifications used by one or more widely recognized market indexes or rating group indexes, and/or as defined by Fund management. This definition may not apply for purposes of this report, which may combine such industry sub-classifications for reporting ease. |
|
|
|
|
|
|
|
|
|
6 |
SEMI-ANNUAL REPORT |
JANUARY 31, 2011 |
|
|
|
|
|
|
|
BlackRock Natural Resources Trust |
|
|
|
|
|
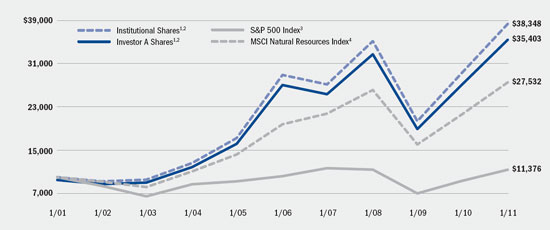
Total Return Based on a $10,000 Investment |
|
|
|
|
|
|
|
|
1 |
Assuming maximum sales charge, transaction costs and other operating expenses, including investment advisory fees, if any. Institutional Shares do not have a sales charge. |
|
|
|
|
|
|
2 |
Under normal circumstances, the Fund invests at least 80% of its assets in domestic and foreign companies with substantial natural resource assets or in securities the value of which is related to the market value of some natural resource asset. |
|
|
|
|
|
|
3 |
This unmanaged index covers the 500 industrial, utility, transportation and financial companies of the US markets (mostly NYSE issues), representing about 75% of NYSE market capitalization and 30% of NYSE issues. |
|
|
|
|
|
|
4 |
This unmanaged index is an index consisting primarily of equity securities of companies engaged in the natural resources industry. |
|
|
|
|
|
|
|
|
|
|
|
|
|
|
|
|
|
|
|
|
|
|
|
|
|
|
||||||||||||||||||||||
|
Performance Summary for the Period Ended January 31, 2011 |
||||||||||||||||||||||
|
|
||||||||||||||||||||||
|
|
||||||||||||||||||||||
|
|
|
Average Annual Total Returns5 |
|
|||||||||||||||||||
|
|
|
|
|
|
|
|
||||||||||||||||
|
|
|
|
|
1 Year |
|
5 Years |
|
10 Years |
|
|||||||||||||
|
|
|
|
|
|
|
|
|
|
|
|||||||||||||
|
|
|
6-Month |
|
w/o
sales |
|
w/sales |
|
w/o
sales |
|
w/sales |
|
w/o
sales |
|
w/sales |
|
|||||||
|
|
|
|
|
|
|
|
|
|
|
|
|
|
|
|
|
|||||||
|
Institutional |
|
29.91 |
% |
|
30.93 |
% |
|
N/A |
|
|
5.81 |
% |
|
N/A |
|
|
14.39 |
% |
|
N/A |
|
|
|
Investor A |
|
29.74 |
|
|
30.61 |
|
|
23.75 |
% |
|
5.53 |
|
|
4.40 |
% |
|
14.09 |
|
|
13.48 |
% |
|
|
Investor B |
|
29.22 |
|
|
29.55 |
|
|
25.05 |
|
|
4.72 |
|
|
4.39 |
|
|
13.39 |
|
|
13.39 |
|
|
|
Investor C |
|
29.20 |
|
|
29.51 |
|
|
28.51 |
|
|
4.70 |
|
|
4.70 |
|
|
13.20 |
|
|
13.20 |
|
|
|
|
|
|
|
|
|
|
|
|
|
|
|
|
|
|
|
|
|
|
|
|
|
|
|
S&P 500 Index |
|
17.93 |
|
|
22.19 |
|
|
N/A |
|
|
2.24 |
|
|
N/A |
|
|
1.30 |
|
|
N/A |
|
|
|
MSCI Natural Resources Index |
|
27.46 |
|
|
27.41 |
|
|
N/A |
|
|
6.83 |
|
|
N/A |
|
|
10.66 |
|
|
N/A |
|
|
|
|
|
|
|
|
|
|
|
|
|
|
|
|
|
|
|
|
|
|
|
|
|
|
|
|
|
|
|
|
5 |
Assuming maximum sales charges, if any. Average annual total returns with and without sales charges reflect reductions for distribution and service fees. See “About Fund Performance” on page 10 for a detailed description of share classes, including any related sales charges and fees. |
|
|
|
|
|
|
|
N/A — Not applicable as
share class and index do not have a sales charge. |
|
|
|
|
|
|
|
|
|
|
|
|
|
|
|
|
|
|
|
|
|
|
||||||||||||||||||
|
Expense Example |
||||||||||||||||||
|
|
||||||||||||||||||
|
|
||||||||||||||||||
|
|
|
Actual |
|
Hypothetical7 |
|
|
|
|||||||||||
|
|
|
|
|
|
|
|
|
|||||||||||
|
|
|
Beginning |
|
Ending |
|
Expenses
Paid |
|
Beginning |
|
Ending |
|
Expenses
Paid |
|
Annualized |
|
|||
|
|
|
|
|
|
|
|
|
|
|
|
|
|
|
|
|
|||
|
Institutional |
|
$1,000.00 |
|
$1,299.10 |
|
|
$ |
4.58 |
|
|
$1,000.00 |
|
$1,021.22 |
|
$4.02 |
|
0.79% |
|
|
Investor A |
|
$1,000.00 |
|
$1,297.40 |
|
|
$ |
6.14 |
|
|
$1,000.00 |
|
$1,019.86 |
|
$5.40 |
|
1.06% |
|
|
Investor B |
|
$1,000.00 |
|
$1,292.20 |
|
|
$ |
10.69 |
|
|
$1,000.00 |
|
$1,015.87 |
|
$9.40 |
|
1.85% |
|
|
Investor C |
|
$1,000.00 |
|
$1,292.00 |
|
|
$ |
10.69 |
|
|
$1,000.00 |
|
$1,015.87 |
|
$9.40 |
|
1.85% |
|
|
|
|
|
|
|
|
|
|
|
|
|
|
|
|
|
|
|
|
|
|
|
|
|
|
|
6 |
For each class of the Fund, expenses are equal to the annualized expense ratio for the class, multiplied by the average account value over the period, multiplied by 184/365 (to reflect the one-half year period shown). |
|
|
||
|
|
7 |
Hypothetical 5% annual return before expenses is calculated by pro rating the number of days in the most recent fiscal half year divided by 365. |
|
|
|
|
|
|
||
|
SEMI-ANNUAL REPORT |
JANUARY 31, 2011 |
7 |
|
|
|
|
|
|
|
|
|
|
Fund Summary as of January 31, 2011 |
BlackRock Utilities and Telecommunications Fund, Inc. |
|
|
|
|
|
|
||
|
Investment Objective |
||
|
|
||
|
|
|
|
|
BlackRock Utilities and Telecommunications Fund, Inc.’s (the “Fund”) investment objective is to seek both capital appreciation and current income. |
||
|
|
|
|
|
|
||
|
Portfolio Management Commentary |
||
|
|
||
|
|
|
|
|
|
How did the Fund perform? |
|
|
|
|
|
|
• |
For the six-month period,the Fund’s Institutional and Investor A Shares outperformed its composite benchmark (70% S&P 500 Utilities Index/ 30% S&P 500 Telecommunication Services Index) and the S&P 500 Utilities Index, but underperformed the S&P 500 Telecommunication Services Index and the broad-market S&P 500 Index. The Fund’s Investor B, Investor B1, Investor C and Investor C1 Shares underperformed its composite benchmark, the S&P 500 Telecommunication Services Index and the broad-market S&P 500 Index, but outperformed the S&P 500 Utilities Index. The following discussion of relative performance pertains to the composite benchmark. |
|
|
|
|
|
|
|
What factors influenced performance? |
|
|
|
|
|
|
• |
The largest boost to performance for the period came from an overweight position in the oil, gas & consumable fuels industry, followed by individual stock selection in electric utilities and a strategic overweight in gas utilities. Within the utilities space, stock selection in integrated utilities significantly aided relative returns for the period. A marginal overweight position in water utilities also helped bolster returns. |
|
|
|
|
|
|
• |
The largest detriment to relative performance came from a large under-weight position in the diversified telecommunication services industry, followed by the Fund’s cash weighting, which weighed on returns in an appreciating market. Elsewhere, an overweight in independent power producers subtracted from performance during the period. |
|
|
|
|
|
|
|
Describe recent portfolio activity. |
|
|
|
|
|
|
• |
While there were no significant changes to the Fund’s overall investment strategy during the six months, we continued to opportunistically increase our allocation to wireless telecommunication services due to favorable industry dynamics. Additionally, we remain concerned about political and regulatory headwinds in Europe and the potential effect on European public utilities. During the reporting period, we continued to allocate assets away from internationally domiciled utilities in favor of US-based names, as foreign utilities have tended to be more challenged in recent markets. |
|
|
|
|
|
|
|
Describe Fund positioning at period end. |
|
|
|
||
|
• |
At period end,we continue to anticipate good market performance for US electric utilities, and believe that general profitability at the company level will move in line with a recovering economy in 2011. We expect some overdue multiple expansion and look for stronger earnings from the industry. Additionally, we believe increased usage of modern electronics and appliances will continue to provide a robust base for volume growth into the next few years. |
|
|
|
|
|
|
• |
In terms of industry trends,we will be keeping a watchful eye on management succession, a general move toward a more regulated approach but away from merchant generation at the company level and public utilities seeking to increase their scale in order to offset new and potentially costly environmental rules. Within telecommunication services, we are currently favoring wireless companies and believe that a lowering unemployment figure and gradually improving economy will directly impact the proliferation of data-heavy smartphones and tablets, helping to support earnings within the sector. |
|
|
|
|
|
|
|
|
The views expressed reflect the opinions of BlackRock as of the date of this report and are subject to change based on changes in market, economic or other conditions. These views are not intended to be a forecast of future events and are no guarantee of future results. |
|
|
|
|
|
|
||
|
Portfolio Information |
||
|
|
||
|
|
|
|
|
|
|
|
Ten Largest Holdings |
|
Percent
of |
|
||
|
|
|
|
|
||
|
NextEra Energy, Inc. |
|
4 |
% |
|
|
|
The Southern Co. |
|
4 |
|
|
|
|
Dominion Resources, Inc. |
|
4 |
|
|
|
|
AT&T Inc. |
|
3 |
|
|
|
|
ITC Holdings Corp. |
|
3 |
|
|
|
|
Entergy Corp. |
|
3 |
|
|
|
|
American Electric Power Co., Inc. |
|
3 |
|
|
|
|
Public Service Enterprise Group, Inc. |
|
3 |
|
|
|
|
PG&E Corp. |
|
3 |
|
|
|
|
Verizon Communications, Inc. |
|
2 |
|
|
|
|
|
|
|
|
|
|
|
|
|
|
|
|
|
|
Sector Allocations |
|
Percent
of |
|
||
|
|
|
|
|
||
|
Utilities |
|
68 |
% |
|
|
|
Telecommunications Services |
|
22 |
|
|
|
|
Energy |
|
8 |
|
|
|
|
Consumer Discretionary |
|
2 |
|
|
|
|
|
|
|
|
|
|
|
|
|
|
|
|
|
|
|
For Fund compliance purposes, the Fund’s sector classifications refer to any one or more of the sector sub-classifications used by one or more widely recognized market indexes or rating group indexes, and/or as defined by Fund management. This definition may not apply for purposes of this report, which may combine such sector sub-classifications for reporting ease. |
||||
|
|
|
|
|
|
|
|
|
8 |
SEMI-ANNUAL REPORT |
JANUARY 31, 2011 |
|
|
|
|
|
|
|
BlackRock Utilities and Telecommunications Fund, Inc. |
|
|
|
|
|
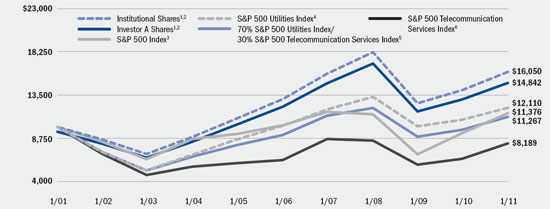
Total Return Based on a $10,000 Investment |
|
|
|
|
|
|
|
|
1 |
Assuming maximum sales charge, transaction costs and other operating expenses, including investment advisory fees, if any. Institutional Shares do not have a sales charge. |
|
|
|
|
|
|
2 |
Under normal circumstances, the Fund invests at least 80% of its assets in equity and debt securities issued by domestic and foreign utilities companies and telecommunications companies. |
|
|
|
|
|
|
3 |
This unmanaged index covers 500 industrial, utility, transportation and financial companies of the US markets (mostly NYSE issues), representing about 75% of NYSE market capitalization and 30% of NYSE issues. |
|
|
|
|
|
|
4 |
This unmanaged index is comprised of all stocks designed to measure the performance of electric and natural gas utilities within the S&P 500 Index. |
|
|
|
|
|
|
5 |
This composite index is comprised 70% of the S&P 500 Utilities Index and 30% of the S&P 500 Telecommunication Services Index. |
|
|
|
|
|
|
6 |
This unmanaged index is comprised of all stocks designed to measure the performance of telecommunication services companies within the S&P 500 Index. |
|
|
|
|
|
Performance Summary for the Period Ended January 31, 2011 |
|
|
|
|
|
|
|
|
|
|
|
|
|
|
|
|
|
|
|
|
|
|
|
|
|
|
|
|
|
|
|
Average Annual Total Returns7 |
|
|||||||||||||||||
|
|
|
|
|
|
|
|||||||||||||||||
|
|
|
|
|
1 Year |
|
5 Years |
|
10 Years |
|
|||||||||||||
|
|
|
|
|
|
|
|
|
|
|
|||||||||||||
|
|
|
6-Month |
|
w/o
sales |
|
w/sales |
|
w/o
sales |
|
w/sales |
|
w/o
sales |
|
w/sales |
|
|||||||
|
|
|
|
|
|
|
|
|
|
|
|
|
|
|
|
|
|||||||
|
Institutional |
|
9.71 |
% |
|
14.25 |
% |
|
N/A |
|
|
4.21 |
% |
|
N/A |
|
|
4.84 |
% |
|
N/A |
|
|
|
Investor A |
|
9.57 |
|
|
13.98 |
|
|
8.00 |
% |
|
3.96 |
|
|
2.84 |
% |
|
4.59 |
|
|
4.03 |
% |
|
|
Investor B |
|
9.04 |
|
|
12.85 |
|
|
8.35 |
|
|
3.04 |
|
|
2.70 |
|
|
3.74 |
|
|
3.74 |
|
|
|
Investor B1 |
|
9.20 |
|
|
13.31 |
|
|
9.31 |
|
|
3.36 |
|
|
3.02 |
|
|
4.14 |
|
|
4.14 |
|
|
|
Investor C |
|
9.19 |
|
|
13.06 |
|
|
12.06 |
|
|
3.12 |
|
|
3.12 |
|
|
3.78 |
|
|
3.78 |
|
|
|
Investor C1 |
|
9.27 |
|
|
13.26 |
|
|
12.26 |
|
|
3.31 |
|
|
3.31 |
|
|
3.97 |
|
|
3.97 |
|
|
|
|
|
|
|
|
|
|
|
|
|
|
|
|
|
|
|
|
|
|
|
|
|
|
|
S&P 500 Index |
|
17.93 |
|
|
22.19 |
|
|
N/A |
|
|
2.24 |
|
|
N/A |
|
|
1.30 |
|
|
N/A |
|
|
|
S&P 500 Utilities Index |
|
6.81 |
|
|
12.21 |
|
|
N/A |
|
|
3.63 |
|
|
N/A |
|
|
1.93 |
|
|
N/A |
|
|
|
S&P 500 Telecommunication Services Index |
|
15.40 |
|
|
25.99 |
|
|
N/A |
|
|
5.19 |
|
|
N/A |
|
|
(1.98 |
) |
|
N/A |
|
|
|
70% S&P 500 Utilities Index/30% S&P 500 Telecommunication Services Index |
|
9.39 |
|
|
16.28 |
|
|
N/A |
|
|
4.33 |
|
|
N/A |
|
|
1.20 |
|
|
N/A |
|
|
|
|
|
|
|
|
|
|
|
|
|
|
|
|
|
|
|
|
|
|
|
|
|
|
|
|
|
|
|
|
7 |
Assuming maximum sales charges, if any. Average annual total returns with and without sales charges reflect reductions for distribution and service fees. See “About Fund Performance” on page 10 for a detailed description of share classes, including any related sales charges and fees. |
|
|
||
|
|
|
N/A — Not applicable as share class and index do not have a sales charge. |
|
|
||
|
|
|
Past performance is not indicative of future results. |
|
|
|
|
|
|
|
|
|
|
|
|
|
|
|
|
|
|
|
|
|
|
|
|
|
|||||||||||||||||||||
|
Expense Example |
|||||||||||||||||||||
|
|
|||||||||||||||||||||
|
|
|||||||||||||||||||||
|
|
|
Actual |
|
Hypothetical9 |
|
|
|
||||||||||||||
|
|
|
|
|
|
|
|
|
||||||||||||||
|
|
|
Beginning |
|
Ending |
|
Expenses Paid |
|
Beginning |
|
Ending |
|
Expenses Paid |
|
Annualized |
|
||||||
|
|
|
|
|
|
|
|
|
|
|
|
|
|
|
|
|
||||||
|
Institutional |
|
$1,000.00 |
|
$1,097.10 |
|
|
$ |
5.07 |
|
|
$1,000.00 |
|
$1,020.36 |
|
|
$ |
4.89 |
|
|
0.96% |
|
|
Investor A |
|
$1,000.00 |
|
$1,095.70 |
|
|
$ |
6.34 |
|
|
$1,000.00 |
|
$1,019.15 |
|
|
$ |
6.11 |
|
|
1.20% |
|
|
Investor B |
|
$1,000.00 |
|
$1,090.40 |
|
|
$ |
11.38 |
|
|
$1,000.00 |
|
$1,014.31 |
|
|
$ |
10.97 |
|
|
2.16% |
|
|
Investor B1 |
|
$1,000.00 |
|
$1,092.00 |
|
|
$ |
9.86 |
|
|
$1,000.00 |
|
$1,015.77 |
|
|
$ |
9.50 |
|
|
1.87% |
|
|
Investor C |
|
$1,000.00 |
|
$1,091.90 |
|
|
$ |
10.49 |
|
|
$1,000.00 |
|
$1,015.17 |
|
|
$ |
10.11 |
|
|
1.99% |
|
|
Investor C1 |
|
$1,000.00 |
|
$1,092.70 |
|
|
$ |
9.81 |
|
|
$1,000.00 |
|
$1,015.82 |
|
|
$ |
9.45 |
|
|
1.86% |
|
|
|
|
|
|
|
|
|
|
|
|
|
|
|
|
|
|
|
|
|
|
|
|
|
|
|
|
|
|
8 |
For each class of the Fund, expenses are equal to the annualized expense ratio for the class, multiplied by the average account value over the period, multiplied by 184/365 (to reflect the one-half year period shown). |
|
|
|
|
|
|
9 |
Hypothetical 5% annual return before expenses is calculated by pro rating the number of days in the most recent fiscal half year divided by 365. |
|
|
|
|
|
|
||
|
SEMI-ANNUAL REPORT |
JANUARY 31, 2011 |
9 |
|
|
|
|
|
|
|
|
|
|
• |
Institutional Shares are not subject to any sales charge.Institutional Shares bear no ongoing distribution or service fees and are available only to eligible investors. |
|
|
|
|
• |
Service Shares (available only to BlackRock Equity Dividend Fund) are not subject to any sales charge. Service Shares are subject to a service fee of 0.25% per year (but no distribution fee) and are available only to eligible investors. Prior to October 2, 2006, Service Share performance results are those of Institutional Shares (which have no distribution or service fees) restated to reflect the Service Share fees. |
|
|
|
|
• |
Investor A Shares incur a maximum initial sales charge (front-end load) of 5.25% and a service fee of 0.25% per year (but no distribution fee). |
|
|
|
|
• |
Investor B Shares are subject to a maximum contingent deferred sales charge of 4.50% declining to 0% after six years. In addition, Investor B Shares are subject to a distribution fee of 0.75% per year and a service fee of 0.25% per year. These shares automatically convert to Investor A Shares after approximately eight years. (There is no initial sales charge for automatic share conversions.) For BlackRock Equity Dividend Fund and BlackRock Natural Resources Trust, all returns for periods greater than eight years reflect this conversion. For BlackRock Utilities and Telecommunications Fund, Inc. prior to October 2, 2006, Investor B Share performance results are those of Institutional Shares (which have no distribution or service fees) restated to reflect the Investor B Share fees. |
|
|
|
|
• |
Investor B1 Shares (available only to BlackRock Utilities and Telecommunications Fund, Inc.) are subject to a maximum contingent deferred sales charge of 4% declining to 0% after six years. In addition, Investor B1 Shares are subject to a distribution fee of 0.50% per year and a service fee of 0.25% per year. These shares automatically convert to Investor A Shares after approximately eight years. (There is no initial sales charge for automatic share conversions.) All returns for periods greater than eight years reflect this conversion. |
|
|
|
|
• |
Investor C Shares are subject to a 1% contingent deferred sales charge if redeemed within one year of purchase. In addition, Investor C Shares are subject to a distribution fee of 0.75% and a service fee of 0.25% per year. For BlackRock Utilities and Telecommunications Fund, Inc. prior to October 2, 2006, Investor C Share performance results are those of Institutional Shares (which have no distribution or service fees) restated to reflect the Investor C Share fees. |
|
|
|
|
• |
Investor C1 Shares (available only to BlackRock Utilities and Telecommunications Fund, Inc.) are subject to a distribution fee of 0.55% per year and a service fee of 0.25% per year. In addition, Investor C1 Shares are subject to a 1% contingent deferred sales charge if redeemed within one year of purchase. |
|
|
|
|
• |
Class R Shares (available only to BlackRock Equity Dividend Fund) do not incur a maximum initial sales charge (front-end load) or deferred sales charge. These shares are subject to a distribution fee of 0.25% per year and a service fee of 0.25% per year. Class R Shares are available only to certain retirement plans. Prior to January 3, 2003, Class R Share performance results are those of Institutional Shares (which have no distribution or service fees) restated to reflect the Class R Share fees. |
|
|
|
|
|
Investor B, B1 and C1 Shares of the Funds are only available for purchase through exchanges, dividend reinvestment by existing shareholders or for purchase by certain qualified employee benefit plans. |
|
|
|
|
|
Performance information reflects past performance and does not guarantee future results. Current performance may be lower or higher than the performance data quoted. Refer to www.blackrock.com/funds to obtain performance data current to the most recent month-end. Performance results do not reflect the deduction of taxes that a shareholder would pay on fund distributions or the redemption of fund shares. Figures shown in the performance tables on the previous pages assume reinvestment of all dividends and capital gain distributions, if any, at net asset value on the ex-dividend date. Investment return and principal value of shares will fluctuate so that shares, when redeemed, may be worth more or less than their original cost. Dividends paid to each class of shares will vary because of the different levels of service, distribution and transfer agency fees applicable to each class, which are deducted from the income available to be paid to shareholders. The Funds’ investment advisor waived a portion of its investment advisory fee. Without such a waiver, the Funds’ performance would have been lower. |
|
|
|
|
|
|
|
|
|
10 |
SEMI-ANNUAL REPORT |
JANUARY 31, 2011 |
|
|
|
|
|
|
|
|
|
Shareholders of the Funds may incur the following charges: (a) expenses related to transactions, including sales charges, redemption fees and exchange fees; and (b) operating expenses including advisory fees, service and distribution fees including 12b-1 fees and other Fund expenses.The expense examples on the previous pages (which are based on a hypothetical investment of $1,000 invested on August 1, 2010 and held through January 31, 2011) are intended to assist shareholders both in calculating expenses based on an investment in each Fund and in comparing these expenses with similar costs of investing in other mutual funds. |
|
|
|
The tables provide information about actual account values and actual expenses. In order to estimate the expenses a shareholder paid during the period covered by this report, shareholders can divide their account value by $1,000 and then multiply the result by the number corresponding to their Fund and share class under the heading entitled “Expenses Paid During the Period.” |
|
|
|
The tables also provide information about hypothetical account values and hypothetical expenses based on each Fund’s actual expense ratio and an assumed rate of return of 5% per year before expenses. In order to assist shareholders in comparing the ongoing expenses of investing in these Funds and other funds, compare the 5% hypothetical example with the 5% hypothetical examples that appear in other funds’ shareholder reports. |
|
|
|
The expenses shown in the tables are intended to highlight shareholders’ ongoing costs only and do not reflect any transactional expenses, such as sales charges, redemption fees or exchange fees. Therefore, the hypothetical examples are useful in comparing ongoing expenses only, and will not help shareholders determine the relative total expenses of owning different funds. If these transactional expenses were included, shareholder expenses would have been higher. |
|
|
|
|
|
|
|
|
|
The Funds may invest in various derivative instruments, including financial futures contracts and foreign currency exchange contracts, as specified in Note 2 of the Notes to Financial Statements, which may constitute forms of economic leverage. Such instruments are used to obtain exposure to a market without owning or taking physical custody of securities or to hedge market, equity and/or foreign currency exchange rate risks. Such derivative instruments involve risks, including the imperfect correlation between the value of a derivative instrument and the underlying asset, possible default of the counterparty to the transaction or illiquidity of the derivative instrument. The Funds’ ability to successfully use a derivative instrument depends on the investment advisor’s ability to accurately predict pertinent market movements, which cannot be assured. The use of derivative instruments may result in losses greater than if they had not been used, may require a Fund to sell or purchase portfolio investments at inopportune times or for distressed values, may limit the amount of appreciation a Fund can realize on an investment, may result in lower dividends paid to shareholders or may cause a Fund to hold an investment that it might otherwise sell. The Funds’ investments in these instruments are discussed in detail in the Notes to Financial Statements. |
|
|
|
|
|
|
||
|
SEMI-ANNUAL REPORT |
JANUARY 31, 2011 |
11 |
|
|
|
|
|
|
|
|
|
|
BlackRock Equity Dividend Fund |
|
|
|
(Percentages shown are based on Net Assets) |
|
|
|
|
|
|
|
|
|
|
Common Stocks |
|
Shares |
|
Value |
|
||
|
|
|
|
|
|
|
|
|
|
Aerospace & Defense — 6.0% |
|
|
|
|
|
|
|
|
General Dynamics Corp. |
|
|
1,699,400 |
|
$ |
128,134,760 |
|
|
Honeywell International, Inc. |
|
|
1,029,300 |
|
|
57,651,093 |
|
|
Northrop Grumman Corp. |
|
|
1,821,700 |
|
|
126,243,810 |
|
|
Raytheon Co. |
|
|
3,336,300 |
|
|
166,781,637 |
|
|
Rockwell Collins, Inc. |
|
|
486,300 |
|
|
31,191,282 |
|
|
United Technologies Corp. |
|
|
2,371,800 |
|
|
192,827,340 |
|
|
|
|
|
|
|
|
|
|
|
|
|
|
|
|
|
702,829,922 |
|
|
|
|
|
|
|
|
|
|
|
Air Freight & Logistics — 0.7% |
|
|
|
|
|
|
|
|
United Parcel Service, Inc., Class B |
|
|
1,141,800 |
|
|
81,775,716 |
|
|
|
|
|
|
|
|
|
|
|
Auto Components — 0.4% |
|
|
|
|
|
|
|
|
Johnson Controls, Inc. |
|
|
1,088,900 |
|
|
41,802,871 |
|
|
|
|
|
|
|
|
|
|
|
Beverages — 2.2% |
|
|
|
|
|
|
|
|
The Coca-Cola Co. |
|
|
2,255,300 |
|
|
141,745,605 |
|
|
Diageo Plc |
|
|
5,806,700 |
|
|
111,630,649 |
|
|
|
|
|
|
|
|
|
|
|
|
|
|
|
|
|
253,376,254 |
|
|
|
|
|
|
|
|
|
|
|
Capital Markets — 0.3% |
|
|
|
|
|
|
|
|
The Bank of New York Mellon Corp. |
|
|
1,136,368 |
|
|
35,488,773 |
|
|
|
|
|
|
|
|
|
|
|
Chemicals — 3.3% |
|
|
|
|
|
|
|
|
Air Products & Chemicals, Inc. |
|
|
379,200 |
|
|
33,085,200 |
|
|
The Dow Chemical Co. |
|
|
981,400 |
|
|
34,820,072 |
|
|
E.I. du Pont de Nemours & Co. |
|
|
3,887,800 |
|
|
197,033,704 |
|
|
Olin Corp. |
|
|
2,447,600 |
|
|
47,654,772 |
|
|
Praxair, Inc. |
|
|
866,100 |
|
|
80,581,944 |
|
|
|
|
|
|
|
|
|
|
|
|
|
|
|
|
|
393,175,692 |
|
|
|
|
|
|
|
|
|
|
|
Commercial Banks — 6.6% |
|
|
|
|
|
|
|
|
The Bank of Nova Scotia |
|
|
2,380,700 |
|
|
134,233,108 |
|
|
National Bank of Canada |
|
|
1,973,000 |
|
|
137,549,438 |
|
|
Royal Bank of Canada |
|
|
818,100 |
|
|
43,856,402 |
|
|
The Toronto-Dominion Bank |
|
|
1,163,500 |
|
|
87,098,377 |
|
|
U.S. Bancorp |
|
|
4,890,900 |
|
|
132,054,300 |
|
|
Wells Fargo & Co. |
|
|
7,308,100 |
|
|
236,928,602 |
|
|
|
|
|
|
|
|
|
|
|
|
|
|
|
|
|
771,720,227 |
|
|
|
|
|
|
|
|
|
|
|
Computers & Peripherals — 0.9% |
|
|
|
|
|
|
|
|
Hewlett-Packard Co. |
|
|
2,206,000 |
|
|
100,792,140 |
|
|
|
|
|
|
|
|
|
|
|
Consumer Finance — 0.7% |
|
|
|
|
|
|
|
|
American Express Co. |
|
|
1,762,000 |
|
|
76,435,560 |
|
|
|
|
|
|
|
|
|
|
|
Containers & Packaging — 0.6% |
|
|
|
|
|
|
|
|
Packaging Corp. of America |
|
|
993,000 |
|
|
28,052,250 |
|
|
Temple-Inland, Inc. |
|
|
1,617,200 |
|
|
38,796,628 |
|
|
|
|
|
|
|
|
|
|
|
|
|
|
|
|
|
66,848,878 |
|
|
|
|
|
|
|
|
|
|
|
Diversified Financial Services — 3.7% |
|
|
|
|
|
|
|
|
Bank of America Corp. |
|
|
8,723,700 |
|
|
119,776,401 |
|
|
JPMorgan Chase & Co. |
|
|
6,871,150 |
|
|
308,789,481 |
|
|
|
|
|
|
|
|
|
|
|
|
|
|
|
|
|
428,565,882 |
|
|
|
|
|
|
|
|
|
|
|
|
|
|
|
|
|
|
|
|
Common Stocks |
|
Shares |
|
Value |
|
||
|
|
|
|
|
|
|
|
|
|
Diversified Telecommunication Services — 5.0% |
|
|
|
|
|
|
|
|
AT&T Inc. |
|
|
6,179,403 |
|
$ |
170,057,171 |
|
|
BCE, Inc. |
|
|
1,119,573 |
|
|
40,674,087 |
|
|
CenturyLink, Inc. |
|
|
1,263,300 |
|
|
54,625,092 |
|
|
Frontier Communications Corp. |
|
|
657,567 |
|
|
6,029,889 |
|
|
Qwest Communications International, Inc. |
|
|
21,099,800 |
|
|
150,441,574 |
|
|
Verizon Communications, Inc. |
|
|
3,577,021 |
|
|
127,413,488 |
|
|
Windstream Corp. |
|
|
3,063,842 |
|
|
39,247,816 |
|
|
|
|
|
|
|
|
|
|
|
|
|
|
|
|
|
588,489,117 |
|
|
|
|
|
|
|
|
|
|
|
Electric Utilities — 3.6% |
|
|
|
|
|
|
|
|
American Electric Power Co., Inc. |
|
|
1,433,600 |
|
|
51,150,848 |
|
|
Duke Energy Corp. |
|
|
2,370,520 |
|
|
42,384,898 |
|
|
Entergy Corp. |
|
|
740,300 |
|
|
53,427,451 |
|
|
Exelon Corp. |
|
|
693,900 |
|
|
29,497,689 |
|
|
FirstEnergy Corp. |
|
|
525,000 |
|
|
20,538,000 |
|
|
ITC Holdings Corp. |
|
|
372,000 |
|
|
24,440,400 |
|
|
NextEra Energy, Inc. |
|
|
1,194,700 |
|
|
63,868,662 |
|
|
Northeast Utilities, Inc. |
|
|
1,178,400 |
|
|
38,792,928 |
|
|
PPL Corp. |
|
|
1,128,100 |
|
|
29,093,699 |
|
|
The Southern Co. |
|
|
1,779,300 |
|
|
66,937,266 |
|
|
|
|
|
|
|
|
|
|
|
|
|
|
|
|
|
420,131,841 |
|
|
|
|
|
|
|
|
|
|
|
Electrical Equipment — 0.4% |
|
|
|
|
|
|
|
|
Rockwell Automation, Inc. |
|
|
558,700 |
|
|
45,260,287 |
|
|
|
|
|
|
|
|
|
|
|
Energy Equipment & Services — 0.5% |
|
|
|
|
|
|
|
|
Schlumberger Ltd. |
|
|
605,700 |
|
|
53,901,243 |
|
|
|
|
|
|
|
|
|
|
|
Food & Staples Retailing — 0.9% |
|
|
|
|
|
|
|
|
Wal-Mart Stores, Inc. |
|
|
1,842,300 |
|
|
103,297,761 |
|
|
|
|
|
|
|
|
|
|
|
Food Products — 3.9% |
|
|
|
|
|
|
|
|
General Mills, Inc. |
|
|
2,682,300 |
|
|
93,290,394 |
|
|
H.J. Heinz Co. |
|
|
1,466,500 |
|
|
69,658,750 |
|
|
Kraft Foods, Inc. |
|
|
2,380,103 |
|
|
72,759,749 |
|
|
Mead Johnson Nutrition Co. |
|
|
1,577,319 |
|
|
91,437,182 |
|
|
Unilever NV — ADR |
|
|
4,441,700 |
|
|
131,607,571 |
|
|
|
|
|
|
|
|
|
|
|
|
|
|
|
|
|
458,753,646 |
|
|
|
|
|
|
|
|
|
|
|
Gas Utilities — 0.1% |
|
|
|
|
|
|
|
|
AGL Resources, Inc. |
|
|
267,500 |
|
|
9,817,250 |
|
|
|
|
|
|
|
|
|
|
|
Hotels, Restaurants & Leisure — 1.4% |
|
|
|
|
|
|
|
|
McDonald’s Corp. |
|
|
2,266,950 |
|
|
167,006,207 |
|
|
|
|
|
|
|
|
|
|
|
Household Products — 2.8% |
|
|
|
|
|
|
|
|
Clorox Co. |
|
|
1,485,400 |
|
|
93,416,806 |
|
|
Kimberly-Clark Corp. |
|
|
1,353,400 |
|
|
87,605,582 |
|
|
The Procter & Gamble Co. |
|
|
2,414,500 |
|
|
152,427,385 |
|
|
|
|
|
|
|
|
|
|
|
|
|
|
|
|
|
333,449,773 |
|
|
|
|
|
|
|
|
|
|
|
IT Services — 1.7% |
|
|
|
|
|
|
|
|
International Business Machines Corp. |
|
|
1,222,400 |
|
|
198,028,800 |
|
|
|
|
|
|
|
|
|
|
|
|
|
|
|
|
|
Portfolio Abbreviation |
|
|
|
|
|
|
|
|
ADR |
American Depositary Receipts |
|
|
|
|
|
See Notes to Financial Statements. |
|
|
|
|
|
|
|
12 |
SEMI-ANNUAL REPORT |
JANUARY 31, 2011 |
|
|
|
|
|
|
|
|
|
|
Schedule of Investments (continued) |
BlackRock Equity Dividend Fund |
|
|
(Percentages shown are based on Net Assets) |
|
|
|
|
|
|
|
|
|
|
Common Stocks |
|
Shares |
|
Value |
|
||
|
|
|
|
|
|
|
|
|
|
Industrial Conglomerates — 2.7% |
|
|
|
|
|
|
|
|
3M Co. |
|
|
1,281,200 |
|
$ |
112,643,104 |
|
|
General Electric Co. |
|
|
10,299,303 |
|
|
207,427,962 |
|
|
|
|
|
|
|
|
|
|
|
|
|
|
|
|
|
320,071,066 |
|
|
|
|
|
|
|
|
|
|
|
Insurance — 3.1% |
|
|
|
|
|
|
|
|
Chubb Corp. |
|
|
1,945,500 |
|
|
112,702,815 |
|
|
Prudential Financial, Inc. |
|
|
1,566,900 |
|
|
96,380,019 |
|
|
The Travelers Cos., Inc. |
|
|
2,838,294 |
|
|
159,682,420 |
|
|
|
|
|
|
|
|
|
|
|
|
|
|
|
|
|
368,765,254 |
|
|
|
|
|
|
|
|
|
|
|
Leisure Equipment & Products — 0.4% |
|
|
|
|
|
|
|
|
Mattel, Inc. |
|
|
2,136,800 |
|
|
50,599,424 |
|
|
|
|
|
|
|
|
|
|
|
Machinery — 4.4% |
|
|
|
|
|
|
|
|
Caterpillar, Inc. |
|
|
2,570,600 |
|
|
249,373,906 |
|
|
Deere & Co. |
|
|
2,944,300 |
|
|
267,636,870 |
|
|
|
|
|
|
|
|
|
|
|
|
|
|
|
|
|
517,010,776 |
|
|
|
|
|
|
|
|
|
|
|
Media — 0.7% |
|
|
|
|
|
|
|
|
Comcast Corp., Special Class A |
|
|
3,464,800 |
|
|
74,285,312 |
|
|
The McGraw-Hill Cos., Inc. |
|
|
273,500 |
|
|
10,661,030 |
|
|
|
|
|
|
|
|
|
|
|
|
|
|
|
|
|
84,946,342 |
|
|
|
|
|
|
|
|
|
|
|
Metals & Mining — 4.9% |
|
|
|
|
|
|
|
|
BHP Billiton Ltd. |
|
|
7,014,200 |
|
|
312,052,011 |
|
|
Barrick Gold Corp. |
|
|
1,506,500 |
|
|
71,417,142 |
|
|
BlueScope Steel Ltd. |
|
|
13,260,400 |
|
|
28,235,388 |
|
|
Rio Tinto Ltd. |
|
|
1,238,829 |
|
|
104,276,732 |
|
|
Southern Copper Corp. |
|
|
1,393,200 |
|
|
62,443,224 |
|
|
|
|
|
|
|
|
|
|
|
|
|
|
|
|
|
578,424,497 |
|
|
|
|
|
|
|
|
|
|
|
Multi-Utilities — 2.5% |
|
|
|
|
|
|
|
|
Consolidated Edison, Inc. |
|
|
533,300 |
|
|
26,617,003 |
|
|
Dominion Resources, Inc. |
|
|
2,122,300 |
|
|
92,404,942 |
|
|
PG&E Corp. |
|
|
612,000 |
|
|
28,323,360 |
|
|
Public Service Enterprise Group, Inc. |
|
|
2,219,600 |
|
|
71,981,628 |
|
|
Sempra Energy |
|
|
733,700 |
|
|
38,203,759 |
|
|
Wisconsin Energy Corp. |
|
|
601,800 |
|
|
36,282,522 |
|
|
|
|
|
|
|
|
|
|
|
|
|
|
|
|
|
293,813,214 |
|
|
|
|
|
|
|
|
|
|
|
Oil, Gas & Consumable Fuels — 13.3% |
|
|
|
|
|
|
|
|
Cameco Corp. |
|
|
969,000 |
|
|
40,168,962 |
|
|
Chevron Corp. (a) |
|
|
3,622,438 |
|
|
343,878,040 |
|
|
ConocoPhillips |
|
|
1,696,198 |
|
|
121,210,309 |
|
|
Consol Energy, Inc. |
|
|
448,000 |
|
|
22,265,600 |
|
|
EQT Corp. |
|
|
1,566,300 |
|
|
75,479,997 |
|
|
Enbridge, Inc. |
|
|
2,271,900 |
|
|
131,728,680 |
|
|
ExxonMobil Corp. |
|
|
3,341,706 |
|
|
269,608,840 |
|
|
Marathon Oil Corp. |
|
|
2,580,500 |
|
|
117,928,850 |
|
|
Murphy Oil Corp. |
|
|
225,900 |
|
|
14,977,170 |
|
|
Occidental Petroleum Corp. |
|
|
1,314,600 |
|
|
127,095,528 |
|
|
Peabody Energy Corp. |
|
|
429,100 |
|
|
27,213,522 |
|
|
Spectra Energy Corp. |
|
|
2,018,060 |
|
|
52,933,714 |
|
|
Total SA — ADR |
|
|
3,765,500 |
|
|
221,298,435 |
|
|
|
|
|
|
|
|
|
|
|
|
|
|
|
|
|
1,565,787,647 |
|
|
|
|
|
|
|
|
|
|
|
Paper & Forest Products — 0.5% |
|
|
|
|
|
|
|
|
MeadWestvaco Corp. |
|
|
1,929,100 |
|
|
55,230,133 |
|
|
|
|
|
|
|
|
|
|
|
Personal Products — 0.3% |
|
|
|
|
|
|
|
|
Avon Products, Inc. |
|
|
1,415,600 |
|
|
40,075,636 |
|
|
|
|
|
|
|
|
|
|
|
|
|
|
|
|
|
|
|
|
Common Stocks |
|
Shares |
|
Value |
|
||
|
|
|
|
|
|
|
|
|
|
Pharmaceuticals — 4.8% |
|
|
|
|
|
|
|
|
Abbott Laboratories |
|
|
1,671,800 |
|
$ |
75,498,488 |
|
|
Bristol-Myers Squibb Co. |
|
|
6,120,266 |
|
|
154,108,298 |
|
|
Johnson & Johnson |
|
|
1,595,000 |
|
|
95,333,150 |
|
|
Merck & Co., Inc. |
|
|
3,505,600 |
|
|
116,280,752 |
|
|
Pfizer, Inc. |
|
|
6,896,068 |
|
|
125,646,359 |
|
|
|
|
|
|
|
|
|
|
|
|
|
|
|
|
|
566,867,047 |
|
|
|
|
|
|
|
|
|
|
|
Real Estate Investment Trusts (REITs) — 0.5% |
|
|
|
|
|
|
|
|
Weyerhaeuser Co. |
|
|
2,311,678 |
|
|
53,584,696 |
|
|
|
|
|
|
|
|
|
|
|
Road & Rail — 1.6% |
|
|
|
|
|
|
|
|
Canadian National Railway Co. |
|
|
1,794,600 |
|
|
121,853,340 |
|
|
Union Pacific Corp. |
|
|
670,400 |
|
|
63,439,952 |
|
|
|
|
|
|
|
|
|
|
|
|
|
|
|
|
|
185,293,292 |
|
|
|
|
|
|
|
|
|
|
|
Semiconductors & Semiconductor Equipment — 0.8% |
|
|
|
|
|
|
|
|
Intel Corp. |
|
|
4,428,016 |
|
|
95,025,223 |
|
|
|
|
|
|
|
|
|
|
|
Software — 0.7% |
|
|
|
|
|
|
|
|
Microsoft Corp. |
|
|
2,838,730 |
|
|
78,703,789 |
|
|
|
|
|
|
|
|
|
|
|
Specialty Retail — 1.3% |
|
|
|
|
|
|
|
|
Home Depot, Inc. |
|
|
2,336,828 |
|
|
85,925,166 |
|
|
Limited Brands, Inc. |
|
|
2,407,100 |
|
|
70,383,604 |
|
|
|
|
|
|
|
|
|
|
|
|
|
|
|
|
|
156,308,770 |
|
|
|
|
|
|
|
|
|
|
|
Textiles, Apparel & Luxury Goods — 0.8% |
|
|
|
|
|
|
|
|
VF Corp. |
|
|
1,161,000 |
|
|
96,037,920 |
|
|
|
|
|
|
|
|
|
|
|
Tobacco — 2.1% |
|
|
|
|
|
|
|
|
Altria Group, Inc. |
|
|
1,780,600 |
|
|
41,861,906 |
|
|
Lorillard, Inc. |
|
|
496,100 |
|
|
37,326,564 |
|
|
Philip Morris International, Inc. |
|
|
2,994,000 |
|
|
171,376,560 |
|
|
|
|
|
|
|
|
|
|
|
|
|
|
|
|
|
250,565,030 |
|
|
|
|
|
|
|
|
|
|
|
Water Utilities — 0.5% |
|
|
|
|
|
|
|
|
American Water Works Co., Inc. |
|
|
2,415,300 |
|
|
61,590,150 |
|
|
|
|
|
|
|
|
|
|
|
Wireless Telecommunication Services — 0.6% |
|
|
|
|
|
|
|
|
Rogers Communications, Inc., Class B |
|
|
515,500 |
|
|
18,002,731 |
|
|
Vodafone Group Plc — ADR |
|
|
1,947,481 |
|
|
55,230,561 |
|
|
|
|
|
|
|
|
|
|
|
|
|
|
|
|
|
73,233,292 |
|
|
|
|
|
|
|
|
|
|
|
Total Common Stocks — 92.2% |
|
|
|
|
|
10,822,881,038 |
|
|
|
|
|
|
|
|
|
|
|
|
|
|
|
|
|
|
|
|
|
|||||||
|
|
|
|
|
|
|
|
|
|
Preferred Stocks |
|
|
|
|
|
|
|
|
|
|
|
|
|
|
|
|
|
Oil, Gas & Consumable Fuels — 0.1% |
|
|
|
|
|
|
|
|
Apache Corp., 6.00% (b) |
|
|
250,000 |
|
|
16,360,000 |
|
|
|
|
|
|
|
|
|
|
|
Total Preferred Stocks — 0.1% |
|
|
|
|
|
16,360,000 |
|
|
|
|
|
|
|
|
|
|
|
Total
Long-Term Investments |
|
|
|
|
|
10,839,241,038 |
|
|
|
|
|
|
|
|
|
|
|
|
|
|
|
See Notes to Financial Statements. |
|
|
|
|
||
|
SEMI-ANNUAL REPORT |
JANUARY 31, 2011 |
13 |
|
|
|
|
|
|
|
|
|
|
Schedule of Investments (continued) |
BlackRock Equity Dividend Fund |
|
|
(Percentages shown are based on Net Assets) |
|
|
|
|
|
|
|
|
|
|
Short-Term Securities |
|
Shares |
|
Value |
|
||
|
|
|
|
|
|
|
|
|
|
BlackRock Liquidity Funds, TempFund, |
|
|
857,387,359 |
|
$ |
857,387,359 |
|
|
|
|
|
|
|
|
|
|
|
Total
Short-Term Securities |
|
|
|
|
|
857,387,359 |
|
|
|
|
|
|
|
|
|
|
|
Total Investments (Cost — $10,248,435,842*) — 99.6% |
|
|
|
|
|
11,696,628,397 |
|
|
Other Assets Less Liabilities — 0.4% |
|
|
|
|
|
44,252,767 |
|
|
|
|
|
|
|
|
|
|
|
Net Assets — 100.0% |
|
|
|
|
$ |
11,740,881,164 |
|
|
|
|
|
|
|
|
|
|
|
|
|||||||
|
|
|
|
|
|
|
|
|
|
|
|
|
* |
The cost and unrealized appreciation (depreciation) of investments as of January 31, 2011, as computed for federal income tax purposes were as follows: |
|
|
|
|
|
|
|
Aggregate cost |
|
$ |
10,249,839,939 |
|
|
|
|
|
|
|
|
Gross unrealized appreciation |
|
$ |
1,602,304,765 |
|
|
Gross unrealized depreciation |
|
|
(155,516,307 |
) |
|
|
|
|
|
|
|
Net unrealized appreciation |
|
$ |
1,446,788,458 |
|
|
|
|
|
|
|
|
|
|
|
(a) |
All or a portion of security has been pledged as collateral in connection with open financial futures contracts. |
|
|
|
|
(b) |
Convertible security. |
|
|
|
|
(c) |
Investments in companies considered to be an affiliate of the Fund during the period, for purposes of Section 2(a)(3) of the Investment Company Act of 1940, as amended, were as follows: |
|
|
|
|
|
|
|
|
|
|
|
|
|
|
|
|
|
|
|
|
|
|
|
|
|
|
||||
|
Affiliate |
|
Shares
Held |
|
Net |
|
Shares
Held |
|
Income |
|
||||
|
|
|
|
|
|
|
|
|
|
|
||||
|
BlackRock Liquidity Funds, TempFund, Institutional Class |
|
|
750,064,318 |
|
|
107,323,041 |
|
|
857,387,359 |
|
$ |
648,819 |
|
|
BlackRock Liquidity Series, LLC Money Market Series |
|
|
— |
|
|
— |
|
|
— |
|
$ |
173 |
|
|
|
|
|
|
|
|
|
|
|
|
|
|
|
|
|
|
|
|
(d) |
Represents the current yield as of report date. |
|
|
|
|
• |
For Fund compliance purposes,the Fund’s industry classifications refer to any one or more of the industry sub-classifications used by one or more widely recognized market indexes or rating group indexes, and/or as defined by Fund management. This definition may not apply for purposes of this report, which may combine such industry sub-classifications for reporting ease. |
|
|
|
|
• |
Financial futures contracts purchased as of January 31,2011 were as follows: |
|
|
|
|
|
|
|
|
|
|
|
|
|
||
|
Contracts |
|
Issue |
|
Exchange |
|
Expiration |
|
Notional |
|
Unrealized |
|
||
|
|
|
|
|
|
|
|
|
|
|
|
|
||
|
1,400 |
|
S&P 500 Index |
|
Chicago Mercantile |
|
March 2011 |
|
$ |
434,846,905 |
|
$ |
13,993,095 |
|
|
|
|
|
|
|
|
|
|
|
|
|
|
|
|
|
|
|
|
|
• |
Fair Value Measurements — Various inputs are used in determining the fair value of investments and derivatives, which are as follows: |
|
|
|
|
|
|
|
• |
Level 1 — price quotations in active markets/exchanges for identical assets and liabilities |
|
|
|
|
|
|
• |
Level 2 — other observable inputs (including,but not limited to: quoted prices for similar assets or liabilities in markets that are active, quoted prices for identical or similar assets or liabilities in markets that are not active, inputs other than quoted prices that are observable for the assets or liabilities (such as interest rates, yield curves, volatilities, prepayment speeds, loss severities, credit risks and default rates) or other market-corroborated inputs) |
|
|
|
|
|
|
• |
Level 3 — unobservable inputs based on the best information available in the circumstances, to the extent observable inputs are not available (including the Fund’s own assumptions used in determining the fair value of investments and derivatives) |
|
|
|
|
|
|
|
The inputs or methodologies used for valuing securities are not necessarily an indication of the risk associated with investing in those securities. For information about the Fund’s policy regarding valuation of investments and derivatives and other significant accounting policies, please refer to Note 1 of the Notes to Financial Statements. |
|
|
|
|
|
See Notes to Financial Statements. |
|
|
|
|
|
|
|
14 |
SEMI-ANNUAL REPORT |
JANUARY 31, 2011 |
|
|
|
|
|
|
|
|
|
|
Schedule of Investments (concluded) |
BlackRock Equity Dividend Fund |
The following tables summarize the inputs used as of January 31, 2011 in determining the fair valuation of the Fund’s investments and derivatives:
|
|
|
|
|
|
|
|
|
|
|
|
|
|
|
|
|
|
|
|
|
|
|
|
|
|
||||
|
Valuation Inputs |
|
Level 1 |
|
Level 2 |
|
Level 3 |
|
Total |
|
||||
|
|
|
|
|
|
|
|
|
|
|
||||
|
Assets: |
|
|
|
|
|
|
|
|
|
|
|
|
|
|
Investments in Securities: |
|
|
|
|
|
|
|
|
|
|
|
|
|
|
Long-Term Investments: |
|
|
|
|
|
|
|
|
|
|
|
|
|
|
Common Stocks: |
|
|
|
|
|
|
|
|
|
|
|
|
|
|
Aerospace & Defense |
|
$ |
702,829,922 |
|
|
— |
|
|
— |
|
$ |
702,829,922 |
|
|
Air Freight & Logistics |
|
|
81,775,716 |
|
|
— |
|
|
— |
|
|
81,775,716 |
|
|
Auto Components |
|
|
41,802,871 |
|
|
— |
|
|
— |
|
|
41,802,871 |
|
|
Beverages |
|
|
141,745,605 |
|
$ |
111,630,649 |
|
|
— |
|
|
253,376,254 |
|
|
Capital Markets |
|
|
35,488,773 |
|
|
— |
|
|
— |
|
|
35,488,773 |
|
|
Chemicals |
|
|
393,175,692 |
|
|
— |
|
|
— |
|
|
393,175,692 |
|
|
Commercial Banks |
|
|
771,720,227 |
|
|
— |
|
|
— |
|
|
771,720,227 |
|
|
Computers & Peripherals |
|
|
100,792,140 |
|
|
— |
|
|
— |
|
|
100,792,140 |
|
|
Consumer Finance |
|
|
76,435,560 |
|
|
— |
|
|
— |
|
|
76,435,560 |
|
|
Containers & Packaging |
|
|
66,848,878 |
|
|
— |
|
|
— |
|
|
66,848,878 |
|
|
Diversified Financial Services |
|
|
428,565,882 |
|
|
— |
|
|
— |
|
|
428,565,882 |
|
|
Diversified Telecommunication Services |
|
|
588,489,117 |
|
|
— |
|
|
— |
|
|
588,489,117 |
|
|
Electric Utilities |
|
|
420,131,841 |
|
|
— |
|
|
— |
|
|
420,131,841 |
|
|
Electrical Equipment |
|
|
45,260,287 |
|
|
— |
|
|
— |
|
|
45,260,287 |
|
|
Energy Equipment & Services |
|
|
53,901,243 |
|
|
— |
|
|
— |
|
|
53,901,243 |
|
|
Food & Staples Retailing |
|
|
103,297,761 |
|
|
— |
|
|
— |
|
|
103,297,761 |
|
|
Food Products |
|
|
458,753,646 |
|
|
— |
|
|
— |
|
|
458,753,646 |
|
|
Gas Utilities |
|
|
9,817,250 |
|
|
— |
|
|
— |
|
|
9,817,250 |
|
|
Hotels, Restaurants & Leisure |
|
|
167,006,207 |
|
|
— |
|
|
— |
|
|
167,006,207 |
|
|
Household Products |
|
|
333,449,773 |
|
|
— |
|
|
— |
|
|
333,449,773 |
|
|
IT Services |
|
|
198,028,800 |
|
|
— |
|
|
— |
|
|
198,028,800 |
|
|
Industrial Conglomerates |
|
|
320,071,066 |
|
|
— |
|
|
— |
|
|
320,071,066 |
|
|
Insurance |
|
|
368,765,254 |
|
|
— |
|
|
— |
|
|
368,765,254 |
|
|
Leisure Equipment & Products |
|
|
50,599,424 |
|
|
— |
|
|
— |
|
|
50,599,424 |
|
|
Machinery |
|
|
517,010,776 |
|
|
— |
|
|
— |
|
|
517,010,776 |
|
|
Media |
|
|
84,946,342 |
|
|
— |
|
|
— |
|
|
84,946,342 |
|
|
Metals & Mining |
|
|
133,860,366 |
|
|
444,564,131 |
|
|
— |
|
|
578,424,497 |
|
|
Multi-Utilities |
|
|
293,813,214 |
|
|
— |
|
|
— |
|
|
293,813,214 |
|
|
Oil, Gas & Consumable Fuels |
|
|
1,565,787,647 |
|
|
— |
|
|
— |
|
|
1,565,787,647 |
|
|
Paper & Forest Products |
|
|
55,230,133 |
|
|
— |
|
|
— |
|
|
55,230,133 |
|
|
Personal Products |
|
|
40,075,636 |
|
|
— |
|
|
— |
|
|
40,075,636 |
|
|
Pharmaceuticals |
|
|
566,867,047 |
|
|
— |
|
|
— |
|
|
566,867,047 |
|
|
Real Estate Investment Trusts (REITs) |
|
|
53,584,696 |
|
|
— |
|
|
— |
|
|
53,584,696 |
|
|
Road & Rail |
|
|
185,293,292 |
|
|
— |
|
|
— |
|
|
185,293,292 |
|
|
Semiconductors & Semiconductor |
|
|
95,025,223 |
|
|
— |
|
|
— |
|
|
95,025,223 |
|
|
Software |
|
|
78,703,789 |
|
|
— |
|
|
— |
|
|
78,703,789 |
|
|
Specialty Retail |
|
|
156,308,770 |
|
|
— |
|
|
— |
|
|
156,308,770 |
|
|
Textiles, Apparel & Luxury Goods |
|
|
96,037,920 |
|
|
— |
|
|
— |
|
|
96,037,920 |
|
|
Tobacco |
|
|
250,565,030 |
|
|
— |
|
|
— |
|
|
250,565,030 |
|
|
Water Utilities |
|
|
61,590,150 |
|
|
— |
|
|
— |
|
|
61,590,150 |
|
|
Wireless Telecommunication Services |
|
|
73,233,292 |
|
|
— |
|
|
— |
|
|
73,233,292 |
|
|
Preferred Stocks: |
|
|
|
|
|
|
|
|
|
|
|
|
|
|
Oil, Gas & Consumable Fuels |
|
|
16,360,000 |
|
|
— |
|
|
— |
|
|
16,360,000 |
|
|
Short-Term Securities |
|
|
857,387,359 |
|
|
— |
|
|
— |
|
|
857,387,359 |
|
|
|
|
|
|
|
|
|
|
|
|
|
|
|
|
|
Total |
|
$ |
11,140,433,617 |
|
$ |
556,194,780 |
|
|
— |
|
$ |
11,696,628,397 |
|
|
|
|
|
|
|
|
|
|
|
|
|
|
|
|
|
|
|
|
|
|
|
|
|
|
|
|
|
|
|
|
|
|
|
|
||||||||||
|
|
|
Derivative Financial Instruments1 |
|
||||||||||
|
|
|
|
|
|
|
|
|
|
|
||||
|
Valuation Inputs |
|
Level 1 |
|
Level 2 |
|
Level 3 |
|
Total |
|
||||
|
|
|
|
|
|
|
|
|
|
|
||||
|
Assets: |
|
|
|
|
|
|
|
|
|
|
|
|
|
|
Equity contracts |
|
$ |
13,993,095 |
|
|
— |
|
|
— |
|
$ |
13,993,095 |
|
|
|
|
|
|
|
|
|
|
|
|
|
|
|
|
|
|
|
|
1 |
Derivative financial instruments are financial futures contracts, which are shown at the unrealized appreciation/depreciation on the instrument. |
|
|
|
|
|
See Notes to Financial Statements. |
|
|
|
|
||
|
SEMI-ANNUAL REPORT |
JANUARY 31, 2011 |
15 |
|
|
|
|
|
|
|
|
|
|
Schedule of Investments January 31, 2011 (Unaudited) |
BlackRock Natural Resources Trust |
|
|
|
|
|
|
|
|
|
|
Common Stocks |
|
Shares |
|
Value |
|
||
|
|
|
|
|
|
|
||
|
Canadian Independents — 7.9% |
|
|
|
|
|
|
|
|
Canadian Natural Resources Ltd. |
|
|
225,100 |
|
$ |
10,037,165 |
|
|
Crew Energy, Inc. (a) |
|
|
302,600 |
|
|
6,077,082 |
|
|
EnCana Corp. |
|
|
143,022 |
|
|
4,609,098 |
|
|
Husky Energy, Inc. |
|
|
112,800 |
|
|
3,041,494 |
|
|
Nexen, Inc. |
|
|
122,700 |
|
|
3,081,745 |
|
|
Niko Resources Ltd. |
|
|
23,100 |
|
|
2,249,213 |
|
|
Pan Orient Energy Corp. (a) |
|
|
224,000 |
|
|
1,532,331 |
|
|
Paramount Resources Ltd. (a) |
|
|
75,000 |
|
|
2,312,129 |
|
|
Progress Energy Resources Corp. |
|
|
162,753 |
|
|
2,213,707 |
|
|
Talisman Energy, Inc. |
|
|
696,100 |
|
|
15,947,005 |
|
|
|
|
|
|
|
|
|
|
|
|
|
|
|
|
|
51,100,969 |
|
|
|
|
|
|
|
|
|
|
|
Chemicals — 0.7% |
|
|
|
|
|
|
|
|
E.I. du Pont de Nemours & Co. |
|
|
33,400 |
|
|
1,692,712 |
|
|
Intrepid Potash, Inc. (a) |
|
|
18,400 |
|
|
664,976 |
|
|
Praxair, Inc. |
|
|
20,900 |
|
|
1,944,536 |
|
|
|
|
|
|
|
|
|
|
|
|
|
|
|
|
|
4,302,224 |
|
|
|
|
|
|
|
|
|
|
|
Energy Equipment & Services — 11.8% |
|
|
|
|
|
|
|
|
Cameron International Corp. (a) |
|
|
215,400 |
|
|
11,480,820 |
|
|
Dresser-Rand Group, Inc. (a) |
|
|
207,900 |
|
|
9,548,847 |
|
|
Dril-Quip, Inc. (a) |
|
|
90,400 |
|
|
6,971,648 |
|
|
National Oilwell Varco, Inc. |
|
|
277,201 |
|
|
20,485,154 |
|
|
Noble Corp. |
|
|
173,400 |
|
|
6,632,550 |
|
|
Seahawk Drilling, Inc. (a) |
|
|
4,713 |
|
|
32,732 |
|
|
Subsea 7 — ADR |
|
|
85,000 |
|
|
2,082,500 |
|
|
Tesco Corp. (a) |
|
|
106,300 |
|
|
1,622,670 |
|
|
Transocean Ltd. (a) |
|
|
164,709 |
|
|
13,165,190 |
|
|
Trican Well Service Ltd. |
|
|
49,200 |
|
|
1,077,993 |
|
|
Weatherford International Ltd. (a) |
|
|
156,752 |
|
|
3,718,157 |
|
|
|
|
|
|
|
|
|
|
|
|
|
|
|
|
|
76,818,261 |
|
|
|
|
|
|
|
|
|
|
|
Gold — 1.6% |
|
|
|
|
|
|
|
|
Barrick Gold Corp. |
|
|
59,900 |
|
|
2,839,620 |
|
|
Eldorado Gold Corp. |
|
|
467,800 |
|
|
7,516,754 |
|
|
|
|
|
|
|
|
|
|
|
|
|
|
|
|
|
10,356,374 |
|
|
|
|
|
|
|
|
|
|
|
Integrated Oil & Gas — 12.8% |
|
|
|
|
|
|
|
|
Chevron Corp. |
|
|
161,391 |
|
|
15,320,848 |
|
|
ConocoPhillips |
|
|
130,175 |
|
|
9,302,305 |
|
|
Eni SpA — ADR |
|
|
19,250 |
|
|
914,375 |
|
|
ExxonMobil Corp. |
|
|
205,690 |
|
|
16,595,069 |
|
|
Hess Corp. |
|
|
100,700 |
|
|
8,470,884 |
|
|
Marathon Oil Corp. |
|
|
164,700 |
|
|
7,526,790 |
|
|
Murphy Oil Corp. |
|
|
271,300 |
|
|
17,987,190 |
|
|
Total SA — ADR |
|
|
117,600 |
|
|
6,911,352 |
|
|
|
|
|
|
|
|
|
|
|
|
|
|
|
|
|
83,028,813 |
|
|
|
|
|
|
|
|
|
|
|
Metals & Mining — 7.5% |
|
|
|
|
|
|
|
|
Alcoa, Inc. |
|
|
22,900 |
|
|
379,453 |
|
|
Aluminum Corp. of China Ltd. — ADR (a) |
|
|
205,700 |
|
|
5,091,075 |
|
|
BHP Billiton Ltd. |
|
|
64,100 |
|
|
2,851,720 |
|
|
First Quantum Minerals Ltd. |
|
|
55,700 |
|
|
6,444,145 |
|
|
Franco-Nevada Corp. (b) |
|
|
75,000 |
|
|
2,084,436 |
|
|
Gammon Gold, Inc. (a) |
|
|
139,100 |
|
|
1,047,400 |
|
|
Goldcorp, Inc. |
|
|
144,182 |
|
|
5,786,862 |
|
|
HudBay Minerals, Inc. |
|
|
206,700 |
|
|
3,422,466 |
|
|
Inmet Mining Corp. |
|
|
12,700 |
|
|
946,777 |
|
|
Newcrest Mining Ltd. |
|
|
162,000 |
|
|
6,000,205 |
|
|
Newmont Mining Corp. |
|
|
9,900 |
|
|
545,193 |
|
|
|
|
|
|
|
|
|
|
|
Common Stocks |
|
Shares |
|
Value |
|
||
|
|
|
|
|
|
|
||
|
Metals & Mining (concluded) |
|
|
|
|
|
|
|
|
Southern Copper Corp. |
|
|
158,900 |
|
$ |
7,121,898 |
|
|
Vale SA — ADR |
|
|
201,300 |
|
|
7,011,279 |
|
|
|
|
|
|
|
|
|
|
|
|
|
|
|
|
|
48,732,909 |
|
|
|
|
|
|
|
|
|
|
|
Oil & Gas Drilling — 4.3% |
|
|
|
|
|
|
|
|
Diamond Offshore Drilling, Inc. |
|
|
49,100 |
|
|
3,520,961 |
|
|
Helmerich & Payne, Inc. |
|
|
110,100 |
|
|
6,466,173 |
|
|
Nabors Industries Ltd. (a) |
|
|
119,600 |
|
|
2,918,240 |
|
|
Pride International, Inc. (a) |
|
|
146,300 |
|
|
4,754,750 |
|
|
Rowan Cos., Inc. (a) |
|
|
57,800 |
|
|
1,981,384 |
|
|
Saipem SpA |
|
|
164,500 |
|
|
8,219,253 |
|
|
|
|
|
|
|
|
|
|
|
|
|
|
|
|
|
27,860,761 |
|
|
|
|
|
|
|
|
|
|
|
Oil & Gas Equipment & Services — 8.3% |
|
|
|
|
|
|
|
|
Baker Hughes, Inc. |
|
|
118,180 |
|
|
8,096,512 |
|
|
Exterran Holdings, Inc. (a) |
|
|
521 |
|
|
12,926 |
|
|
FMC Technologies, Inc. (a) |
|
|
164,900 |
|
|
15,500,600 |
|
|
Halliburton Co. |
|
|
216,800 |
|
|
9,756,000 |
|
|
Schlumberger Ltd. |
|
|
158,715 |
|
|
14,124,048 |
|
|
Technip SA — ADR |
|
|
64,975 |
|
|
6,335,062 |
|
|
|
|
|
|
|
|
|
|
|
|
|
|
|
|
|
53,825,148 |
|
|
|
|
|
|
|
|
|
|
|
Oil & Gas Exploration & Production — 23.1% |
|
|
|
|
|
|
|
|
Anadarko Petroleum Corp. |
|
|
154,200 |
|
|
11,885,736 |
|
|
Apache Corp. |
|
|
187,412 |
|
|
22,369,496 |
|
|
Brigham Exploration Co. (a) |
|
|
240,000 |
|
|
7,106,400 |
|
|
Cabot Oil & Gas Corp., Class A |
|
|
118,200 |
|
|
4,920,666 |
|
|
Carrizo Oil & Gas, Inc. (a)(c) |
|
|
68,400 |
|
|
2,315,340 |
|
|
Cimarex Energy Co. |
|
|
51,294 |
|
|
5,341,244 |
|
|
Denbury Resources, Inc. (a) |
|
|
63,413 |
|
|
1,290,455 |
|
|
Devon Energy Corp. |
|
|
191,998 |
|
|
17,028,303 |
|
|
EOG Resources, Inc. |
|
|
243,900 |
|
|
25,948,521 |
|
|
Forest Oil Corp. (a) |
|
|
50,200 |
|
|
1,947,760 |
|
|
Newfield Exploration Co. (a) |
|
|
79,800 |
|
|
5,838,966 |
|
|
Noble Energy, Inc. |
|
|
91,900 |
|
|
8,372,090 |
|
|
Occidental Petroleum Corp. |
|
|
162,300 |
|
|
15,691,164 |
|
|
Pioneer Natural Resources Co. |
|
|
70,000 |
|
|
6,661,200 |
|
|
Range Resources Corp. |
|
|
181,600 |
|
|
9,056,392 |
|
|
Southwestern Energy Co. (a) |
|
|
106,600 |
|
|
4,210,700 |
|
|
|
|
|
|
|
|
|
|
|
|
|
|
|
|
|
149,984,433 |
|
|
|
|
|
|
|
|
|
|
|
Oil & Gas Producers — 1.1% |
|
|
|
|
|
|
|
|
Whiting Petroleum Corp. (a) |
|
|
54,100 |
|
|
6,831,748 |
|
|
|
|
|
|
|
|
|
|
|
Oil, Gas & Consumable Fuels — 10.9% |
|
|
|
|
|
|
|
|
Arch Coal, Inc. |
|
|
39,300 |
|
|
1,346,025 |
|
|
Berry Petroleum Co., Class A |
|
|
79,800 |
|
|
3,724,266 |
|
|
CNOOC Ltd. — ADR |
|
|
34,300 |
|
|
7,637,238 |
|
|
Cenovus Energy, Inc. |
|
|
143,022 |
|
|
4,941,890 |
|
|
Chinook Energy, Inc. (a) |
|
|
21,955 |
|
|
44,070 |
|
|
Coastal Energy Co. (a) |
|
|
527,400 |
|
|
3,793,536 |
|
|
Consol Energy, Inc. |
|
|
71,900 |
|
|
3,573,430 |
|
|
EQT Corp. |
|
|
114,000 |
|
|
5,493,660 |
|
|
EXCO Resources, Inc. |
|
|
113,300 |
|
|
2,275,064 |
|
|
MEG Energy Corp. (a)(b) |
|
|
49,400 |
|
|
2,198,296 |
|
|
Patriot Coal Corp. (a) |
|
|
27,840 |
|
|
728,573 |
|
|
Peabody Energy Corp. |
|
|
144,000 |
|
|
9,132,480 |
|
|
PetroBakken Energy Ltd. |
|
|
63,337 |
|
|
1,356,115 |
|
|
Petrohawk Energy Corp. (a) |
|
|
60,400 |
|
|
1,211,020 |
|
|
Petroleo Brasileiro SA — ADR |
|
|
127,000 |
|
|
4,664,710 |
|
|
Suncor Energy, Inc. |
|
|
392,804 |
|
|
16,263,698 |
|
|
Uranium Energy Corp. (a) |
|
|
494,024 |
|
|
2,583,745 |
|
|
|
|
|
|
|
|
|
|
|
|
|
|
|
|
|
70,967,816 |
|
|
|
|
|
|
|
|
|
|
|
|
|
|
|
|
||
|
16 |
SEMI-ANNUAL REPORT |
JANUARY 31, 2011 |
|
|
|
|
|
|
|
|
|
|
Schedule of Investments (continued) |
BlackRock Natural Resources Trust |
|
|
|
|
|
|
|
|
|
|
Common Stocks |
|
Shares |
|
Value |
|
||
|
|
|
|
|
|
|
||
|
Paper & Forest Products — 0.2% |
|
|
|
|
|
|
|
|
Fibria Celulose SA — ADR (a) |
|
|
91,000 |
|
$ |
1,393,210 |
|
|
|
|
|
|
|
|
|
|
|
Refining, Marketing & Transportation — 0.3% |
|
|
|
|
|
|
|
|
Valero Energy Corp. |
|
|
89,000 |
|
|
2,257,040 |
|
|
|
|
|
|
|
|
|
|
|
Transportation Infrastructure — 0.1% |
|
|
|
|
|
|
|
|
Aegean Marine Petroleum Network, Inc. |
|
|
72,300 |
|
|
788,070 |
|
|
|
|
|
|
|
|
|
|
|
Utilities — 0.3% |
|
|
|
|
|
|
|
|
Williams Cos., Inc. |
|
|
69,500 |
|
|
1,875,805 |
|
|
|
|
|
|
|
|
|
|
|
Total Common Stocks — 90.9% |
|
|
|
|
|
590,123,581 |
|
|
|
|
|
|
|
|
|
|
|
|
|
|
|
|
|
|
|
|
|
|
|
|
|
|
|
|
|
|
|
|
|
|
|
|
|
|
Investment Companies |
|
|
|
|
|
|
|
|
|
|
|
|
|
|
|
|
|
Diversified Financial Services — 0.4% |
|
|
|
|
|
|
|
|
Sprott Physical Silver Trust (a) |
|
|
191,300 |
|
|
2,389,337 |
|
|
|
|
|
|
|
|
|
|
|
Total Investment Companies — 0.4% |
|
|
|
|
|
2,389,337 |
|
|
|
|
|
|
|
|
|
|
|
|
|
|
|
|
|
|
|
|
|
|
|
|
|
|
|
|
|
|
|
|
|
|
|
|
|
|
Warrants (d) |
|
|
|
|
|
|
|
|
|
|
|
|
|
|
|
|
|
Oil, Gas & Consumable Fuels — 0.0% |
|
|
|
|
|
|
|
|
Uranium Energy Corp. (Expires 10/21/11) |
|
|
247,012 |
|
|
316,175 |
|
|
|
|
|
|
|
|
|
|
|
Total Warrants — 0.0% |
|
|
|
|
|
316,175 |
|
|
|
|
|
|
|
|
|
|
|
Total
Long-Term Investments |
|
|
|
|
|
592,829,093 |
|
|
|
|
|
|
|
|
|
|
|
|
|
|
|
|
|
|
|
|
|
|
|
|
|
|
|
|
|
|
|
|
|
|
|
|
|
|
Short-Term Securities |
|
|
|
|
|
|
|
|
|
|
|
|
|
|
|
|
|
BlackRock Liquidity Funds, TempFund, |
|
|
57,936,660 |
|
|
57,936,660 |
|
|
|
|
|
|
|
|
|
|
|
|
|
|
|
|
|
|
|
|
|
|
Beneficial |
|
|
|
|
|
|
|
|
|
|
|
|
|
|
|
BlackRock Liquidity Series, LLC |
|
$ |
503 |
|
|
502,500 |
|
|
|
|
|
|
|
|
|
|
|
Total
Short-Term Securities |
|
|
|
|
|
58,439,160 |
|
|
|
|
|
|
|
|
|
|
|
Total Investments (Cost — $315,330,224*) — 100.3% |
|
|
|
|
|
651,268,253 |
|
|
Liabilities in Excess of Other Assets — (0.3)% |
|
|
|
|
|
(2,249,709 |
) |
|
|
|
|
|
|
|
|
|
|
Net Assets — 100.0% |
|
|
|
|
$ |
649,018,544 |
|
|
|
|
|
|
|
|
|
|
|
|
|
|
* |
The cost and unrealized appreciation (depreciation) of investments as of January 31, 2011, as computed for federal income tax purposes were as follows: |
|
|
|
|
|
|
|
Aggregate cost |
|
$ |
316,616,741 |
|
|
|
|
|
|
|
|
Gross unrealized appreciation |
|
$ |
339,366,657 |
|
|
Gross unrealized depreciation |
|
|
(4,715,145 |
) |
|
|
|
|
|
|
|
Net unrealized appreciation |
|
$ |
334,651,512 |
|
|
|
|
|
|
|
|
|
|
|
(a) |
Non-income producing security. |
|
|
|
|
(b) |
Security exempt from registration under Rule 144A of the Securities Act of 1933. These securities may be resold in transactions exempt from registration to qualified institutional investors. |
|
|
|
|
(c) |
Security, or a portion of security, is on loan. |
|
|
|
|
(d) |
Warrants entitle the Fund to purchase a predetermined number of shares of common stock and are non-income producing. The purchase price and number of shares are subject to adjustment under certain conditions until the expiration date, if any. |
|
|
|
|
(e) |
Investments in companies considered to be an affiliate of the Fund during the period, for purposes of Section 2(a)(3) of the Investment Company Act of 1940, as amended, were as follows: |
|
|
|
|
|
|
|
|
|
|
|
|
|
|
|
|
|
|
|
|
|
|
|
|
|
|
||||
|
Affiliate |
|
Shares/ |
|
Net |
|
Shares/ |
|
Income |
|
||||
|
|
|
|
|
|
|
|
|
|
|
||||
|
BlackRock Liquidity Funds, TempFund, Institutional Class |
|
|
49,573,332 |
|
|
8,363,328 |
|
|
57,936,660 |
|
$ |
46,344 |
|
|
BlackRock Liquidity Series, LLC Money Market Series |
|
$ |
300,000 |
|
$ |
202,500 |
|
$ |
502,500 |
|
$ |
352 |
|
|
|
|
|
|
|
|
|
|
|
|
|
|
|
|
|
|
|
|
|
(f) |
Represents the current yield as of report date. |
|
|
|
|
|
|
(g) |
Security was purchased with the cash collateral from loaned securities. |
|
|
|
|
|
|
• |
For Fund compliance purposes, the Fund’s industry classifications refer to any one or more of the industry sub-classifications used by one or more widely recognized market indexes or rating group indexes, and/or as defined by Fund management. This definition may not apply for purposes of this report, which may combine such industry sub-classifications for reporting ease. |
|
|
|
|
|
|
• |
Fair Value Measurements — Various inputs are used in determining the fair value of investments, which are as follows: |
|
|
|
|
|
|
|
• |
Level 1 — price quotations in active markets/exchanges for identical assets and liabilities |
|
|
|
|
|
|
• |
Level 2 — other observable inputs (including, but not limited to: quoted prices for similar assets or liabilities in markets that are active, quoted prices for identical or similar assets or liabilities in markets that are not active, inputs other than quoted prices that are observable for the assets or liabilities (such as interest rates, yield curves, volatilities, prepayment speeds, loss severities, credit risks and default rates) or other market-corroborated inputs) |
|
|
|
|
|
|
• |
Level 3 — unobservable inputs based on the best information available in the circumstances, to the extent observable inputs are not available (including the Fund’s own assumptions used in determining the fair value of investments) |
The inputs or methodologies used for valuing securities are not necessarily an indication of the risk associated with investing in those securities. For information about the Fund’s policy regarding valuation of investments and other significant accounting policies, please refer to Note 1 of the Notes to Financial Statements.
|
|
|
|
|
|
|
|
|
SEMI-ANNUAL REPORT |
JANUARY 31, 2011 |
17 |
|
|
|
|
|
|
|
|
|
|
Schedule of Investments (concluded) |
BlackRock Natural Resources Trust |
|
|
|
The following table summarizes the inputs used as of January 31, 2011 in determining the fair valuation of the Fund’s investments: |
|
|
|
|
|
|
|
|
|
|
|
|
|
|
|
|
|
|
|
|
|
|
|
|
|
|
||||
|
Valuation Inputs |
|
Level 1 |
|
Level 2 |
|
Level 3 |
|
Total |
|
||||
|
|
|
|
|
|
|
|
|
|
|
||||
|
Assets: |
|
|
|
|
|
|
|
|
|
|
|
|
|
|
Investments in Securities: |
|
|
|
|
|
|
|
|
|
|
|
|
|
|
Long-Term Investments: |
|
|
|
|
|
|
|
|
|
|
|
|
|
|
Common Stocks: |
|
|
|
|
|
|
|
|
|
|
|
|
|
|
Canadian Independents |
|
$ |
51,100,969 |
|
|
— |
|
|
— |
|
$ |
51,100,969 |
|
|
Chemicals |
|
|
4,302,224 |
|
|
— |
|
|
— |
|
|
4,302,224 |
|
|
Energy Equipment & Services |
|
|
76,818,261 |
|
|
— |
|
|
— |
|
|
76,818,261 |
|
|
Gold |
|
|
10,356,374 |
|
|
— |
|
|
— |
|
|
10,356,374 |
|
|
Integrated Oil & Gas |
|
|
83,028,813 |
|
|
— |
|
|
— |
|
|
83,028,813 |
|
|
Metals & Mining |
|
|
39,880,984 |
|
$ |
8,851,925 |
|
|
— |
|
|
48,732,909 |
|
|
Oil & Gas Drilling |
|
|
19,641,508 |
|
|
8,219,253 |
|
|
— |
|
|
27,860,761 |
|
|
Oil & Gas Equipment & Services |
|
|
53,825,148 |
|
|
— |
|
|
— |
|
|
53,825,148 |
|
|
Oil & Gas Exploration & Production |
|
|
149,984,433 |
|
|
— |
|
|
— |
|
|
149,984,433 |
|
|
Oil & Gas Producers |
|
|
6,831,748 |
|
|
— |
|
|
— |
|
|
6,831,748 |
|
|
Oil, Gas & Consumable Fuels |
|
|
66,185,775 |
|
|
4,782,041 |
|
|
— |
|
|
70,967,816 |
|
|
Paper & Forest Products |
|
|
1,393,210 |
|
|
— |
|
|
— |
|
|
1,393,210 |
|
|
Refining, Marketing & Transportation |
|
|
2,257,040 |
|
|
— |
|
|
— |
|
|
2,257,040 |
|
|
Transportation Infrastructure |
|
|
788,070 |
|
|
— |
|
|
— |
|
|
788,070 |
|
|
Utilities |
|
|
1,875,805 |
|
|
— |
|
|
— |
|
|
1,875,805 |
|
|
Investment Companies |
|
|
2,389,337 |
|
|
— |
|
|
— |
|
|
2,389,337 |
|
|
Warrants |
|
|
— |
|
|
316,175 |
|
|
— |
|
|
316,175 |
|
|
Short-Term Securities |
|
|
57,936,660 |
|
|
502,500 |
|
|
— |
|
|
58,439,160 |
|
|
|
|
|
|
|
|
|
|
|
|
|
|
|
|
|
Total |
|
$ |
628,596,359 |
|
$ |
22,671,894 |
|
|
— |
|
$ |
651,268,253 |
|
|
|
|
|
|
|
|
|
|
|
|
|
|
|
|
|
|
|
|
|
|
||
|
18 |
SEMI-ANNUAL REPORT |
JANUARY 31, 2011 |
|
|
|
|
|
|
|
|
|
|
Schedule of Investments January 31, 2011 (Unaudited) |
BlackRock Utilities and Telecommunications Fund, Inc. |
|
|
(Percentages shown are based on Net Assets) |
|
|
|
|
|
|
|
|
|
|
Common Stocks |
|
Shares |
|
Value |
|
||
|
|
|
|
|
|
|
|
|
|
Commercial Services & Supplies — 0.2% |
|
|
|
|
|
|
|
|
Tetra Tech, Inc. (a) |
|
|
9,600 |
|
$ |
222,192 |
|
|
|
|
|
|
|
|
|
|
|
Diversified Telecommunication Services — 11.7% |
|
|
|
|
|
|
|
|
AT&T Inc. |
|
|
126,462 |
|
|
3,480,234 |
|
|
BCE, Inc. |
|
|
33,500 |
|
|
1,217,055 |
|
|
CenturyLink, Inc. |
|
|
13,400 |
|
|
579,416 |
|
|
Frontier Communications Corp. |
|
|
16,634 |
|
|
152,534 |
|
|
Qwest Communications International, Inc. |
|
|
303,700 |
|
|
2,165,381 |
|
|
Swisscom AG |
|
|
1,100 |
|
|
485,287 |
|
|
TW Telecom, Inc. (a) |
|
|
31,500 |
|
|
540,225 |
|
|
Telefonica SA |
|
|
25,648 |
|
|
642,110 |
|
|
Verizon Communications, Inc. |
|
|
69,300 |
|
|
2,468,466 |
|
|
Windstream Corp. |
|
|
40,241 |
|
|
515,487 |
|
|
|
|
|
|
|
|
|
|
|
|
|
|
|
|
|
12,246,195 |
|
|
|
|
|
|
|
|
|
|
|
Electric Utilities — 33.4% |
|
|
|
|
|
|
|
|
American Electric Power Co., Inc. |
|
|
84,800 |
|
|
3,025,664 |
|
|
CPFL Energia SA — ADR |
|
|
6,400 |
|
|
481,344 |
|
|
Cia Energetica de Minas Gerais — ADR |
|
|
28,050 |
|
|
463,386 |
|
|
Cleco Corp. |
|
|
13,900 |
|
|
434,514 |
|
|
DPL, Inc. |
|
|
75,000 |
|
|
1,963,500 |
|
|
Duke Energy Corp. |
|
|
129,832 |
|
|
2,321,396 |
|
|
EDP — Energias do Brasil SA |
|
|
34,200 |
|
|
768,344 |
|
|
Edison International |
|
|
61,700 |
|
|
2,238,476 |
|
|
Entergy Corp. |
|
|
44,900 |
|
|
3,240,433 |
|
|
Exelon Corp. |
|
|
24,600 |
|
|
1,045,746 |
|
|
FirstEnergy Corp. |
|
|
39,700 |
|
|
1,553,064 |
|
|
ITC Holdings Corp. |
|
|
51,000 |
|
|
3,350,700 |
|
|
Iberdrola SA |
|
|
64,338 |
|
|
550,551 |
|
|
NV Energy, Inc. |
|
|
17,600 |
|
|
252,912 |
|
|
NextEra Energy, Inc. |
|
|
79,600 |
|
|
4,255,416 |
|
|
Northeast Utilities, Inc. |
|
|
31,600 |
|
|
1,040,272 |
|
|
PPL Corp. |
|
|
38,300 |
|
|
987,757 |
|
|
Pinnacle West Capital Corp. |
|
|
19,300 |
|
|
785,703 |
|
|
Progress Energy, Inc. |
|
|
28,800 |
|
|
1,293,696 |
|
|
The Southern Co. |
|
|
109,800 |
|
|
4,130,676 |
|
|
Westar Energy, Inc. |
|
|
31,000 |
|
|
790,500 |
|
|
|
|
|
|
|
|
|
|
|
|
|
|
|
|
|
34,974,050 |
|
|
|
|
|
|
|
|
|
|
|
Gas Utilities — 3.2% |
|
|
|
|
|
|
|
|
Energen Corp. |
|
|
10,900 |
|
|
609,310 |
|
|
New Jersey Resources Corp. |
|
|
20,400 |
|
|
855,984 |
|
|
Oneok, Inc. |
|
|
7,400 |
|
|
435,786 |
|
|
Questar Corp. |
|
|
45,700 |
|
|
796,551 |
|
|
UGI Corp. |
|
|
19,600 |
|
|
614,460 |
|
|
|
|
|
|
|
|
|
|
|
|
|
|
|
|
|
3,312,091 |
|
|
|
|
|
|
|
|
|
|
|
Independent Power Producers & Energy Traders — 6.1% |
|
|
|
|
|
|
|
|
The AES Corp. (a) |
|
|
103,900 |
|
|
1,288,360 |
|
|
AES Tiete SA, Preference Shares |
|
|
42,300 |
|
|
595,821 |
|
|
Calpine Corp. (a) |
|
|
71,500 |
|
|
1,020,305 |
|
|
Cia Energetica de São Paulo, Preference ‘B’ Shares |
|
|
41,700 |
|
|
712,198 |
|
|
International Power Plc |
|
|
136,400 |
|
|
922,069 |
|
|
NRG Energy, Inc. (a) |
|
|
86,000 |
|
|
1,784,500 |
|
|
|
|
|
|
|
|
|
|
|
|
|
|
|
|
|
6,323,253 |
|
|
|
|
|
|
|
|
|
|
|
Media — 1.4% |
|
|
|
|
|
|
|
|
Comcast Corp., Special Class A |
|
|
44,400 |
|
|
951,936 |
|
|
Time Warner Cable, Inc. |
|
|
8,000 |
|
|
542,640 |
|
|
|
|
|
|
|
|
|
|
|
|
|
|
|
|
|
1,494,576 |
|
|
|
|
|
|
|
|
|
|
|
|
|
|
|
|
|
|
|
|
Common Stocks |
|
Shares |
|
Value |
|
||
|
|
|
|
|
|
|
|
|
|
Multi-Utilities — 21.1% |
|
|
|
|
|
|
|
|
CMS Energy Corp. |
|
|
116,100 |
|
$ |
2,263,950 |
|
|
CenterPoint Energy, Inc. |
|
|
71,100 |
|
|
1,148,265 |
|
|
Centrica Plc |
|
|
116,300 |
|
|
595,528 |
|
|
Consolidated Edison, Inc. |
|
|
32,500 |
|
|
1,622,075 |
|
|
DTE Energy Co. |
|
|
9,300 |
|
|
430,218 |
|
|
Dominion Resources, Inc. |
|
|
94,174 |
|
|
4,100,336 |
|
|
Integrys Energy Group, Inc. |
|
|
7,300 |
|
|
347,407 |
|
|
NSTAR |
|
|
27,000 |
|
|
1,171,260 |
|
|
NiSource, Inc. |
|
|
20,800 |
|
|
387,296 |
|
|
OGE Energy Corp. |
|
|
13,700 |
|
|
628,693 |
|
|
PG&E Corp. |
|
|
56,100 |
|
|
2,596,308 |
|
|
Public Service Enterprise Group, Inc. |
|
|
92,400 |
|
|
2,996,532 |
|
|
Sempra Energy |
|
|
25,600 |
|
|
1,332,992 |
|
|
United Utilities Group Plc |
|
|
63,200 |
|
|
550,145 |
|
|
Wisconsin Energy Corp. |
|
|
19,700 |
|
|
1,187,713 |
|
|
Xcel Energy, Inc. |
|
|
30,900 |
|
|
728,313 |
|
|
|
|
|
|
|
|
|
|
|
|
|
|
|
|
|
22,087,031 |
|
|
|
|
|
|
|
|
|
|
|
Oil, Gas & Consumable Fuels — 7.8% |
|
|
|
|
|
|
|
|
EOG Resources, Inc. |
|
|
8,600 |
|
|
914,954 |
|
|
EQT Corp. |
|
|
18,000 |
|
|
867,420 |
|
|
Petrohawk Energy Corp. (a) |
|
|
11,600 |
|
|
232,580 |
|
|
QEP Resources, Inc. |
|
|
45,700 |
|
|
1,857,248 |
|
|
Range Resources Corp. |
|
|
8,200 |
|
|
408,934 |
|
|
Southwestern Energy Co. (a) |
|
|
18,100 |
|
|
714,950 |
|
|
Spectra Energy Corp. |
|
|
51,616 |
|
|
1,353,888 |
|
|
Talisman Energy, Inc. |
|
|
19,500 |
|
|
446,940 |
|
|
Williams Cos., Inc. |
|
|
48,300 |
|
|
1,303,617 |
|
|
|
|
|
|
|
|
|
|
|
|
|
|
|
|
|
8,100,531 |
|
|
|
|
|
|
|
|
|
|
|
Water Utilities — 2.4% |
|
|
|
|
|
|
|
|
American States Water Co. |
|
|
3,400 |
|
|
115,600 |
|
|
American Water Works Co., Inc. |
|
|
43,200 |
|
|
1,101,600 |
|
|
Aqua America, Inc. |
|
|
32,400 |
|
|
749,088 |
|
|
California Water Service Group |
|
|
14,200 |
|
|
518,300 |
|
|
Cia Saneamento, Preference Shares (a)(b) |
|
|
314 |
|
|
— |
|
|
|
|
|
|
|
|
|
|
|
|
|
|
|
|
|
2,484,588 |
|
|
|
|
|
|
|
|
|
|
|
Wireless Telecommunication Services — 10.1% |
|
|
|
|
|
|
|
|
America Movil, SA de CV — ADR |
|
|
24,700 |
|
|
1,407,653 |
|
|
American Tower Corp., Class A (a) |
|
|
14,600 |
|
|
742,556 |
|
|
Cellcom Israel Ltd. |
|
|
11,200 |
|
|
342,048 |
|
|
Clearwire Corp., Class A (a) |
|
|
72,800 |
|
|
385,112 |
|
|
Crown Castle International Corp. (a) |
|
|
18,000 |
|
|
759,060 |
|
|
Millicom International Cellular SA |
|
|
8,200 |
|
|
764,650 |
|
|
NII Holdings, Inc. (a) |
|
|
34,400 |
|
|
1,444,112 |
|
|
NTELOS Holdings Corp. |
|
|
20,400 |
|
|
411,264 |
|
|
Rogers Communications, Inc., Class B |
|
|
16,500 |
|
|
576,227 |
|
|
SBA Communications Corp., Class A (a) |
|
|
38,800 |
|
|
1,583,040 |
|
|
Vivo Participações SA — ADR |
|
|
13,600 |
|
|
462,944 |
|
|
Vodafone Group Plc — ADR |
|
|
60,512 |
|
|
1,716,120 |
|
|
|
|
|
|
|
|
|
|
|
|
|
|
|
|
|
10,594,786 |
|
|
|
|
|
|
|
|
|
|
|
Total Long-Term Investments |
|
|
|
|
|
101,839,293 |
|
|
|
|
|
|
|
|
|
|
|
|
|
|
|
|
||
|
SEMI-ANNUAL REPORT |
JANUARY 31, 2011 |
19 |
|
|
|
|
|
|
|
|
|
|
Schedule of Investments (concluded) |
BlackRock Utilities and Telecommunications Fund, Inc. |
|
|
(Percentages shown are based on Net Assets) |
|
|
|
|
|
|
|
|
|
|
Short-Term Securities |
|
Shares |
|
Value |
|
||
|
|
|
|
|
|
|
|
|
|
BlackRock Liquidity Funds, TempCash, |
|
|
2,771,581 |
|
$ |
2,771,581 |
|
|
|
|
|
|
|
|
|
|
|
Total
Short-Term Securities |
|
|
|
|
|
2,771,581 |
|
|
|
|
|
|
|
|
|
|
|
Total Investments (Cost — $73,987,377*) — 100.0% |
|
|
|
|
|
104,610,874 |
|
|
Liabilities in Excess of Other Assets — (0.0)% |
|
|
|
|
|
(31,425 |
) |
|
|
|
|
|
|
|
|
|
|
Net Assets — 100.0% |
|
|
|
|
$ |
104,579,449 |
|
|
|
|
|
|
|
|
|
|
|
|
|
|
|
|
|
* |
The cost and unrealized appreciation (depreciation) of investments as of January 31, 2011, as computed for federal income tax purposes were as follows: |
|
|
|
|
|
|
|
|
|
|
|
|
Aggregate cost |
|
|
|
|
$ |
74,097,165 |
|
|
|
|
|
|
|
|
|
|
|
|
|
Gross unrealized appreciation |
|
|
|
|
$ |
31,169,229 |
|
|
|
Gross unrealized depreciation |
|
|
|
|
|
(655,520 |
) |
|
|
|
|
|
|
|
|
|
|
|
|
Net unrealized appreciation |
|
|
|
|
$ |
30,513,709 |
|
|
|
|
|
|
|
|
|
|
|
|
|
|
|
(a) |
Non-income producing security. |
|
|
|
|
(b) |
Convertible security. |
|
|
|
|
(c) |
Represents the current yield as of report date. |
|
|
|
|
(d) |
Investments in companies considered to be an affiliate of the Fund during the period, for purposes of Section 2(a)(3) of the Investment Company Act of 1940, as amended, were as follows: |
|
|
|
|
|
|
|
|
|
|
|
|
|
|
|
|
|
|
|
|
|
|
|
|
|
|
Affiliate |
|
Shares
Held |
|
Net |
|
Shares
Held |
|
Income |
|
|
|
|
|
|
|
|
|
|
|
|
|
|
|
BlackRock Liquidity Funds, TempCash, Institutional Class |
|
2,505,607 |
|
265,974 |
|
2,771,581 |
|
$3,167 |
|
|
|
|
|
|
|
|
|
|
|
|
|
|
|
|
|
|
• |
For Fund compliance purposes,the Fund’s industry classifications refer to any one or more of the industry sub-classifications used by one or more widely recognized market indexes or rating group indexes, and/or as defined by Fund management. This definition may not apply for purposes of this report, which may combine such industry sub-classifications for reporting ease. |
|
|
|
|
|
|
• |
Fair Value Measurements — Various inputs are used in determining the fair value of investments, which are as follows: |
|
|
|
|
|
|
|
• |
Level 1 — price quotations in active markets/exchanges for identical assets and liabilities |
|
|
|
|
|
|
• |
Level 2 — other observable inputs (including, but not limited to: quoted prices for similar assets or liabilities in markets that are active, quoted prices for identical or similar assets or liabilities in markets that are not active, inputs other than quoted prices that are observable for the assets or liabilities (such as interest rates, yield curves, volatilities, prepayment speeds, loss severities, credit risks and default rates) or other market-corroborated inputs) |
|
|
|
|
|
|
• |
Level 3 — unobservable inputs based on the best information available in the circumstances, to the extent observable inputs are not available (including the Fund’s own assumptions used in determining the fair value of investments) |
|
|
|
|
|
|
The inputs or methodologies used for valuing securities are not necessarily an indication of the risk associated with investing in those securities. For information about the Fund’s policy regarding valuation of investments and other significant accounting policies, please refer to Note 1 of the Notes to Financial Statements. |
|
|
|
|
|
|
|
The following table summarizes the inputs used as of January 31, 2011 in determining the fair valuation of the Fund’s investments: |
|
|
|
|
|
|
|
|
|
|
|
|
|
|
|
|
|
|
|
|
|
|
|
|
|
|
|
|
|
|
|
|
Valuation Inputs |
|
Level 1 |
|
Level 2 |
|
Level 3 |
|
Total |
|
||||
|
|
|
|
|
|
|
|
|
|
|
||||
|
Assets: |
|
|
|
|
|
|
|
|
|
|
|
|
|
|
Investments in Securities: |
|
|
|
|
|
|
|
|
|
|
|
|
|
|
Long-Term Investments: |
|
|
|
|
|
|
|
|
|
|
|
|
|
|
Common Stocks: |
|
|
|
|
|
|
|
|
|
|
|
|
|
|
Commercial Services & Supplies |
|
$ |
222,192 |
|
|
— |
|
|
— |
|
$ |
222,192 |
|
|
Diversified Telecommunication Services |
|
|
11,118,798 |
|
$ |
1,127,397 |
|
|
— |
|
|
12,246,195 |
|
|
Electric Utilities |
|
|
34,423,499 |
|
|
550,551 |
|
|
— |
|
|
34,974,050 |
|
|
Gas Utilities |
|
|
3,312,091 |
|
|
— |
|
|
— |
|
|
3,312,091 |
|
|
Independent Power Producers & Energy Traders |
|
|
4,093,165 |
|
|
2,230,088 |
|
|
— |
|
|
6,323,253 |
|
|
Media |
|
|
1,494,576 |
|
|
— |
|
|
— |
|
|
1,494,576 |
|
|
Multi-Utilities |
|
|
20,941,358 |
|
|
1,145,673 |
|
|
— |
|
|
22,087,031 |
|
|
Oil, Gas & Consumable Fuels |
|
|
8,100,531 |
|
|
— |
|
|
— |
|
|
8,100,531 |
|
|
Water Utilities |
|
|
2,484,588 |
|
|
— |
|
|
— |
|
|
2,484,588 |
|
|
Wireless Telecommunication Services |
|
|
10,594,786 |
|
|
— |
|
|
— |
|
|
10,594,786 |
|
|
Short-Term Securities |
|
|
2,771,581 |
|
|
— |
|
|
— |
|
|
2,771,581 |
|
|
|
|
|
|
|
|
|
|
|
|
|
|
|
|
|
Total |
|
$ |
99,557,165 |
|
$ |
5,053,709 |
|
|
— |
|
$ |
104,610,874 |
|
|
|
|
|
|
|
|
|
|
|
|
|
|
|
|
|
|
|
|
|
|
|
|
|
20 |
SEMI-ANNUAL REPORT |
JANUARY 31, 2011 |
|
|
|
|
|
|
|
|
|
|
|
|
|
|
|
|
|
|
|
|
|
January 31, 2011 (Unaudited) |
|
BlackRock |
|
BlackRock |
|
BlackRock |
|
|||||
|
|
|
|
|
|
|
|
|
|||||
|
Assets |
|
|
|
|
|
|
|
|
|
|
||
|
|
|
|
|
|
|
|
|
|
|
|
||
|
Investments at value — unaffiliated1,2 |
|
$ |
10,839,241,038 |
|
$ |
592,829,093 |
|
$ |
101,839,293 |
|
||
|
Investments at value — affiliated3 |
|
|
857,387,359 |
|
|
58,439,160 |
|
|
2,771,581 |
|
||
|
Foreign currency at value4 |
|
|
646,372 |
|
|
— |
|
|
30,670 |
|
||
|
Capital shares sold receivable |
|
|
56,673,185 |
|
|
1,959,882 |
|
|
125,394 |
|
||
|
Dividends receivable |
|
|
17,205,694 |
|
|
80,040 |
|
|
227,253 |
|
||
|
Margin variation receivable |
|
|
3,815,000 |
|
|
— |
|
|
— |
|
||
|
Securities lending income receivable — affiliated |
|
|
— |
|
|
146 |
|
|
— |
|
||
|
Prepaid expenses |
|
|
160,759 |
|
|
30,642 |
|
|
17,657 |
|
||
|
Other assets |
|
|
— |
|
|
22,322 |
|
|
59 |
|
||
|
|
|
|
|
|
|
|
|
|
|
|
||
|
Total assets |
|
|
11,775,129,407 |
|
|
653,361,285 |
|
|
105,011,907 |
|
||
|
|
|
|
|
|
|
|
|
|
|
|
||
|
|
|
|
|
|
|
|
|
|
|
|
||
|
|
|
|
|
|
|
|
|
|
|
|
||
|
Liabilities |
|
|
|
|
|
|
|
|
|
|
||
|
|
|
|
|
|
|
|
|
|
|
|
||
|
Collateral on securities loaned at value |
|
|
— |
|
|
502,500 |
|
|
— |
|
||
|
Capital shares redeemed payable |
|
|
23,071,895 |
|
|
2,378,078 |
|
|
286,675 |
|
||
|
Investment advisory fees payable |
|
|
5,793,177 |
|
|
316,209 |
|
|
53,151 |
|
||
|
Service and distribution fees payable |
|
|
2,361,622 |
|
|
211,258 |
|
|
30,329 |
|
||
|
Other affiliates payable |
|
|
110,243 |
|
|
9,404 |
|
|
1,506 |
|
||
|
Officer’s and Directors’ fees payable |
|
|
4,020 |
|
|
237 |
|
|
47 |
|
||
|
Investments purchased payable |
|
|
— |
|
|
651,806 |
|
|
— |
|
||
|
Other accrued expenses payable |
|
|
2,900,927 |
|
|
273,249 |
|
|
60,750 |
|
||
|
Other liabilities payable |
|
|
6,359 |
|
|
— |
|
|
— |
|
||
|
|
|
|
|
|
|
|
|
|
|
|
||
|
Total liabilities |
|
|
34,248,243 |
|
|
4,342,741 |
|
|
432,458 |
|
||
|
|
|
|
|
|
|
|
|
|
|
|
||
|
Net Assets |
|
$ |
11,740,881,164 |
|
$ |
649,018,544 |
|
$ |
104,579,449 |
|
||
|
|
|
|
|
|
|
|
|
|
|
|
||
|
|
|
|
|
|
|
|
|
|
|
|
||
|
|
|
|
|
|
|
|
|
|
|
|
||
|
Net Assets Consist of |
|
|
|
|
|
|
|
|
|
|
||
|
|
|
|
|
|
|
|
|
|
|
|
||
|
Paid-in capital |
|
$ |
10,588,728,345 |
|
$ |
322,717,775 |
|
$ |
79,814,216 |
|
||
|
Undistributed (accumulated) net investment income (loss) |
|
|
5,933,541 |
|
|
(1,836,951 |
) |
|
98,531 |
|
||
|
Accumulated net realized loss |
|
|
(315,980,779 |
) |
|
(7,801,396 |
) |
|
(5,959,989 |
) |
||
|
Net unrealized appreciation/depreciation |
|
|
1,462,200,057 |
|
|
335,939,116 |
|
|
30,626,691 |
|
||
|
|
|
|
|
|
|
|
|
|
|
|
||
|
Net Assets |
|
$ |
11,740,881,164 |
|
$ |
649,018,544 |
|
$ |
104,579,449 |
|
||
|
|
|
|
|
|
|
|
|
|
|
|
||
|
|
1 |
Securities loaned at value |
|
|
— |
|
$ |
507,750 |
|
|
— |
|
|
|
|
|
|
|
|
|
|
|
|
|
|
|
|
|
2 |
Investments at cost — unaffiliated |
|
$ |
9,391,048,483 |
|
$ |
256,891,064 |
|
$ |
71,215,796 |
|
|
|
|
|
|
|
|
|
|
|
|
|
|
|
|
|
3 |
Investments at cost — affiliated |
|
$ |
857,387,359 |
|
$ |
58,439,160 |
|
$ |
2,771,581 |
|
|
|
|
|
|
|
|
|
|
|
|
|
|
|
|
|
4 |
Foreign currency at cost |
|
$ |
646,857 |
|
|
— |
|
$ |
29,225 |
|
|
|
|
|
|
|
|
|
|
|
|
|
||
|
|
|
|
|
|
|
|
|
|
|
|
||
|
|
|
|
|
|
|
|
|
|
|
|
||
|
Net Asset Value |
|
|
|
|
|
|
|
|
|
|
||
|
|
|
|
|
|
|
|
|
|
|
|
||
|
Institutional: |
|
|
|
|
|
|
|
|
|
|
||
|
|
Net assets |
|
$ |
4,844,576,470 |
|
$ |
97,955,679 |
|
$ |
11,493,382 |
|
|
|
|
|
|
|
|
|
|
|
|
|
|
|
|
|
|
Shares outstanding |
|
|
271,641,406 |
|
|
1,433,791 |
|
|
967,109 |
|
|
|
|
|
|
|
|
|
|
|
|
|
|
|
|
|
|
Net asset value |
|
$ |
17.83 |
|
$ |
68.32 |
|
$ |
11.88 |
|
|
|
|
|
|
|
|
|
|
|
|
|
|
|
|
|
|
Par value per share |
|
$ |
0.10 |
|
$ |
0.10 |
|
$ |
0.10 |
|
|
|
|
|
|
|
|
|
|
|
|
|
|
|
|
|
|
Shares authorized |
|
|
unlimited |
|
|
unlimited |
|
|
100 million |
|
|
|
|
|
|
|
|
|
|
|
|
|
|
|
|
|
|
|
|
|
|
|
|
|
SEMI-ANNUAL REPORT |
JANUARY 31, 2011 |
21 |
|
|
|
|
|
|
|
Statements of Assets and Liabilities (concluded) |
|
|
|
|
|
|
|
|
|
|
|
|
|
January 31, 2011 (Unaudited) |
|
BlackRock |
|
BlackRock |
|
BlackRock |
|
|||
|
|
|
|
|
|
|
|
|
|||
|
Net Asset Value (concluded) |
|
|
|
|
|
|
|
|
|
|
|
|
|
|
|
|
|
|
|
|
|
|
|
Service: |
|
|
|
|
|
|
|
|
|
|
|
Net assets |
|
$ |
48,501,592 |
|
|
— |
|
|
— |
|
|
|
|
|
|
|
|
|
|
|
|
|
|
Shares outstanding |
|
|
2,725,600 |
|
|
— |
|
|
— |
|
|
|
|
|
|
|
|
|
|
|
|
|
|
Net asset value |
|
$ |
17.79 |
|
|
— |
|
|
— |
|
|
|
|
|
|
|
|
|
|
|
|
|
|
Par value per share |
|
$ |
0.10 |
|
|
— |
|
|
— |
|
|
|
|
|
|
|
|
|
|
|
|
|
|
Shares authorized |
|
|
unlimited |
|
|
— |
|
|
— |
|
|
|
|
|
|
|
|
|
|
|
|
|
|
Investor A: |
|
|
|
|
|
|
|
|
|
|
|
Net assets |
|
$ |
4,979,885,419 |
|
$ |
391,263,720 |
|
$ |
74,388,111 |
|
|
|
|
|
|
|
|
|
|
|
|
|
|
Shares outstanding |
|
|
279,768,244 |
|
|
5,874,280 |
|
|
6,254,596 |
|
|
|
|
|
|
|
|
|
|
|
|
|
|
Net asset value |
|
$ |
17.80 |
|
$ |
66.61 |
|
$ |
11.89 |
|
|
|
|
|
|
|
|
|
|
|
|
|
|
Par value per share |
|
$ |
0.10 |
|
$ |
0.10 |
|
$ |
0.10 |
|
|
|
|
|
|
|
|
|
|
|
|
|
|
Shares authorized |
|
|
unlimited |
|
|
unlimited |
|
|
100 million |
|
|
|
|
|
|
|
|
|
|
|
|
|
|
Investor B: |
|
|
|
|
|
|
|
|
|
|
|
Net assets |
|
$ |
60,544,689 |
|
$ |
20,521,864 |
|
$ |
766,000 |
|
|
|
|
|
|
|
|
|
|
|
|
|
|
Shares outstanding |
|
|
3,380,430 |
|
|
337,513 |
|
|
64,902 |
|
|
|
|
|
|
|
|
|
|
|
|
|
|
Net asset value |
|
$ |
17.91 |
|
$ |
60.80 |
|
$ |
11.80 |
|
|
|
|
|
|
|
|
|
|
|
|
|
|
Par value per share |
|
$ |
0.10 |
|
$ |
0.10 |
|
$ |
0.10 |
|
|
|
|
|
|
|
|
|
|
|
|
|
|
Shares authorized |
|
|
unlimited |
|
|
unlimited |
|
|
100 million |
|
|
|
|
|
|
|
|
|
|
|
|
|
|
Investor B1: |
|
|
|
|
|
|
|
|
|
|
|
Net assets |
|
|
— |
|
|
— |
|
$ |
1,090,376 |
|
|
|
|
|
|
|
|
|
|
|
|
|
|
Shares outstanding |
|
|
— |
|
|
— |
|
|
91,620 |
|
|
|
|
|
|
|
|
|
|
|
|
|
|
Net asset value |
|
|
— |
|
|
— |
|
$ |
11.90 |
|
|
|
|
|
|
|
|
|
|
|
|
|
|
Par value per share |
|
|
— |
|
|
— |
|
$ |
0.10 |
|
|
|
|
|
|
|
|
|
|
|
|
|
|
Shares authorized |
|
|
— |
|
|
— |
|
|
100 million |
|
|
|
|
|
|
|
|
|
|
|
|
|
|
Investor C: |
|
|
|
|
|
|
|
|
|
|
|
Net assets |
|
$ |
1,251,547,969 |
|
$ |
139,277,281 |
|
$ |
9,415,148 |
|
|
|
|
|
|
|
|
|
|
|
|
|
|
Shares outstanding |
|
|
71,743,466 |
|
|
2,326,583 |
|
|
812,304 |
|
|
|
|
|
|
|
|
|
|
|
|
|
|
Net asset value |
|
$ |
17.44 |
|
$ |
59.86 |
|
$ |
11.59 |
|
|
|
|
|
|
|
|
|
|
|
|
|
|
Par value per share |
|
$ |
0.10 |
|
$ |
0.10 |
|
$ |
0.10 |
|
|
|
|
|
|
|
|
|
|
|
|
|
|
Shares authorized |
|
|
unlimited |
|
|
unlimited |
|
|
100 million |
|
|
|
|
|
|
|
|
|
|
|
|
|
|
Investor C1: |
|
|
|
|
|
|
|
|
|
|
|
Net assets |
|
|
— |
|
|
— |
|
$ |
7,426,432 |
|
|
|
|
|
|
|
|
|
|
|
|
|
|
Shares outstanding |
|
|
— |
|
|
— |
|
|
634,135 |
|
|
|
|
|
|
|
|
|
|
|
|
|
|
Net asset value |
|
|
— |
|
|
— |
|
$ |
11.71 |
|
|
|
|
|
|
|
|
|
|
|
|
|
|
Par value per share |
|
|
— |
|
|
— |
|
$ |
0.10 |
|
|
|
|
|
|
|
|
|
|
|
|
|
|
Shares authorized |
|
|
— |
|
|
— |
|
|
100 million |
|
|
|
|
|
|
|
|
|
|
|
|
|
|
Class R: |
|
|
|
|
|
|
|
|
|
|
|
Net assets |
|
$ |
555,825,025 |
|
|
— |
|
|
— |
|
|
|
|
|
|
|
|
|
|
|
|
|
|
Shares outstanding |
|
|
31,080,942 |
|
|
— |
|
|
— |
|
|
|
|
|
|
|
|
|
|
|
|
|
|
Net asset value |
|
$ |
17.88 |
|
|
— |
|
|
— |
|
|
|
|
|
|
|
|
|
|
|
|
|
|
Par value per share |
|
$ |
0.10 |
|
|
— |
|
|
— |
|
|
|
|
|
|
|
|
|
|
|
|
|
|
Shares authorized |
|
|
unlimited |
|
|
— |
|
|
— |
|
|
|
|
|
|
|
|
|
|
|
|
|
|
|
|
|
|
|
||
|
22 |
SEMI-ANNUAL REPORT |
JANUARY 31, 2011 |
|
|
|
|
|
|
|
|
|
|
|
|
|
|
|
|
|
|
|
Six Months Ended January 31, 2011 (Unaudited) |
|
BlackRock |
|
BlackRock |
|
BlackRock |
|
|||
|
|
|
|
|
|
|
|
|
|
|
|
|
Investment Income |
|
|
|
|
|
|
|
|
|
|
|
|
|
|
|
|
|
|
|
|
|
|
|
Dividends — unaffiliated |
|
$ |
146,718,265 |
|
$ |
2,802,303 |
|
$ |
1,779,529 |
|
|
Foreign taxes withheld |
|
|
(2,794,403 |
) |
|
(154,106 |
) |
|
(18,018 |
) |
|
Dividends — affiliated |
|
|
648,819 |
|
|
46,344 |
|
|
3,167 |
|
|
Securities lending — affiliated |
|
|
173 |
|
|
352 |
|
|
— |
|
|
|
|
|
|
|
|
|
|
|
|
|
|
Total income |
|
|
144,572,854 |
|
|
2,694,893 |
|
|
1,764,678 |
|
|
|
|
|
|
|
|
|
|
|
|
|
|
|
|
|
|
|
|
|
|
|
|
|
|
|
|
|
|
|
|
|
|
|
|
|
|
Expenses |
|
|
|
|
|
|
|
|
|
|
|
|
|
|
|
|
|
|
|
|
|
|
|
Investment advisory |
|
|
30,011,191 |
|
|
1,666,002 |
|
|
312,596 |
|
|
Service — Service |
|
|
50,643 |
|
|
— |
|
|
— |
|
|
Service — Investor A |
|
|
5,454,356 |
|
|
422,008 |
|
|
90,289 |
|
|
Service and distribution — Investor B |
|
|
299,344 |
|
|
95,784 |
|
|
3,938 |
|
|
Service and distribution — Investor B1 |
|
|
— |
|
|
— |
|
|
6,072 |
|
|
Service and distribution — Investor C |
|
|
5,441,941 |
|
|
592,819 |
|
|
44,643 |
|
|
Service and distribution — Investor C1 |
|
|
— |
|
|
— |
|
|
30,508 |
|
|
Service and distribution — Class R |
|
|
1,213,649 |
|
|
— |
|
|
— |
|
|
Transfer agent — Institutional |
|
|
2,207,055 |
|
|
47,840 |
|
|
8,278 |
|
|
Transfer agent — Service |
|
|
27,604 |
|
|
— |
|
|
— |
|
|
Transfer agent — Investor A |
|
|
3,242,845 |
|
|
252,882 |
|
|
43,875 |
|
|
Transfer agent — Investor B |
|
|
57,558 |
|
|
16,696 |
|
|
1,279 |
|
|
Transfer agent — Investor B1 |
|
|
— |
|
|
— |
|
|
2,256 |
|
|
Transfer agent — Investor C |
|
|
718,173 |
|
|
112,293 |
|
|
7,138 |
|
|
Transfer agent — Investor C1 |
|
|
— |
|
|
— |
|
|
8,703 |
|
|
Transfer agent — Class R |
|
|
475,345 |
|
|
— |
|
|
— |
|
|
Accounting services |
|
|
640,154 |
|
|
57,385 |
|
|
5,417 |
|
|
Registration |
|
|
242,356 |
|
|
38,221 |
|
|
39,538 |
|
|
Custodian |
|
|
186,736 |
|
|
21,436 |
|
|
5,752 |
|
|
Printing |
|
|
149,508 |
|
|
20,195 |
|
|
11,641 |
|
|
Officer and Directors |
|
|
90,624 |
|
|
14,411 |
|
|
10,156 |
|
|
Professional |
|
|
72,826 |
|
|
30,243 |
|
|
31,040 |
|
|
Miscellaneous |
|
|
101,451 |
|
|
19,051 |
|
|
17,320 |
|
|
|
|
|
|
|
|
|
|
|
|
|
|
Total expenses |
|
|
50,683,359 |
|
|
3,407,266 |
|
|
680,439 |
|
|
Less fees waived by advisor |
|
|
(229,881 |
) |
|
(15,904 |
) |
|
(1,252 |
) |
|
|
|
|
|
|
|
|
|
|
|
|
|
Total expenses after fees waived |
|
|
50,453,478 |
|
|
3,391,362 |
|
|
679,187 |
|
|
|
|
|
|
|
|
|
|
|
|
|
|
Net investment income (loss) |
|
|
94,119,376 |
|
|
(696,469 |
) |
|
1,085,491 |
|
|
|
|
|
|
|
|
|
|
|
|
|
|
|
|
|
|
|
|
|
|
|
|
|
|
|
|
|
|
|
|
|
|
|
|
|
|
Realized and Unrealized Gain (Loss) |
|
|
|
|
|
|
|
|
|
|
|
|
|
|
|
|
|
|
|
|
|
|
|
Net realized gain (loss) from: |
|
|
|
|
|
|
|
|
|
|
|
Investments |
|
|
(1,799,226 |
) |
|
1,908,189 |
|
|
140,519 |
|
|
Financial futures contracts |
|
|
34,692,872 |
|
|
— |
|
|
— |
|
|
Foreign currency transactions |
|
|
168,040 |
|
|
(2,904 |
) |
|
4,312 |
|
|
|
|
|
|
|
|
|
|
|
|
|
|
|
|
|
33,061,686 |
|
|
1,905,285 |
|
|
144,831 |
|
|
|
|
|
|
|
|
|
|
|
|
|
|
Net change in unrealized appreciation/depreciation on: |
|
|
|
|
|
|
|
|
|
|
|
Investments |
|
|
1,256,640,747 |
|
|
143,400,277 |
|
|
8,098,659 |
|
|
Financial futures contracts |
|
|
7,549,713 |
|
|
— |
|
|
— |
|
|
Foreign currency transactions |
|
|
14,892 |
|
|
3,480 |
|
|
(354 |
) |
|
|
|
|
|
|
|
|
|
|
|
|
|
|
|
|
1,264,205,352 |
|
|
143,403,757 |
|
|
8,098,305 |
|
|
|
|
|
|
|
|
|
|
|
|
|
|
Total realized and unrealized gain |
|
|
1,297,267,038 |
|
|
145,309,042 |
|
|
8,243,136 |
|
|
|
|
|
|
|
|
|
|
|
|
|
|
Net Increase in Net Assets Resulting from Operations |
|
$ |
1,391,386,414 |
|
$ |
144,612,573 |
|
$ |
9,328,627 |
|
|
|
|
|
|
|
|
|
|
|
|
|
|
|
|
|
|
|
|
|
|
SEMI-ANNUAL REPORT |
JANUARY 31, 2011 |
23 |
|
|
|
|
|
|
|
|
|
|
BlackRock Equity Dividend Fund |
|
|
|
|
|
|
|
|
|
|
|
Increase (Decrease) in Net Assets: |
|
Six
Months Ended |
|
Year
Ended |
|
||
|
|
|
|
|
|
|
||
|
Operations |
|
|
|
|
|
|
|
|
|
|
|
|
|
|
|
|
|
Net investment income |
|
$ |
94,119,376 |
|
$ |
143,379,310 |
|
|
Net realized gain (loss) |
|
|
33,061,686 |
|
|
(240,215 |
) |
|
Net change in unrealized appreciation/depreciation |
|
|
1,264,205,352 |
|
|
496,235,995 |
|
|
|
|
|
|
|
|
|
|
|
Net increase in net assets resulting from operations |
|
|
1,391,386,414 |
|
|
639,375,090 |
|
|
|
|
|
|
|
|
|
|
|
|
|
|
|
|
|
|
|
|
|
|
|
|
|
|
|
|
|
Dividends to Shareholders From |
|
|
|
|
|
|
|
|
|
|
|
|
|
|
|
|
|
Net investment income: |
|
|
|
|
|
|
|
|
Institutional |
|
|
(51,944,201 |
) |
|
(49,550,890 |
) |
|
Service |
|
|
(446,282 |
) |
|
(615,011 |
) |
|
Investor A |
|
|
(48,586,722 |
) |
|
(59,243,460 |
) |
|
Investor B |
|
|
(423,668 |
) |
|
(568,911 |
) |
|
Investor C |
|
|
(8,739,570 |
) |
|
(8,780,296 |
) |
|
Class R |
|
|
(4,765,328 |
) |
|
(4,746,085 |
) |
|
|
|
|
|
|
|
|
|
|
Decrease in net assets resulting from dividends to shareholders |
|
|
(114,905,771 |
) |
|
(123,504,653 |
) |
|
|
|
|
|
|
|
|
|
|
|
|
|
|
|
|
|
|
|
|
|
|
|
|
|
|
|
|
Capital Share Transactions |
|
|
|
|
|
|
|
|
|
|
|
|
|
|
|
|
|
Net increase in net assets derived from capital share transactions |
|
|
1,900,477,776 |
|
|
3,027,983,606 |
|
|
|
|
|
|
|
|
|
|
|
|
|
|
|
|
|
|
|
|
|
|
|
|
|
|
|
|
|
Net Assets |
|
|
|
|
|
|
|
|
|
|
|
|
|
|
|
|
|
Total increase in net assets |
|
|
3,176,958,419 |
|
|
3,543,854,043 |
|
|
Beginning of period |
|
|
8,563,922,745 |
|
|
5,020,068,702 |
|
|
|
|
|
|
|
|
|
|
|
End of period |
|
$ |
11,740,881,164 |
|
$ |
8,563,922,745 |
|
|
|
|
|
|
|
|
|
|
|
Undistributed net investment income |
|
$ |
5,933,541 |
|
$ |
26,719,936 |
|
|
|
|
|
|
|
|
|
|
|
|
|
BlackRock Natural Resources Trust |
|
|
|
|
|
|
|
|
|
|
Increase (Decrease) in Net Assets: |
|
Six
Months Ended |
|
Year
Ended |
|
||
|
|
|
|
|
|
|
||
|
Operations |
|
|
|
|
|
|
|
|
|
|
|
|
|
|
|
|
|
Net investment loss |
|
$ |
(696,469 |
) |
$ |
(534,153 |
) |
|
Net realized gain (loss) |
|
|
1,905,285 |
|
|
(67,705 |
) |
|
Net change in unrealized appreciation/depreciation |
|
|
143,403,757 |
|
|
39,308,988 |
|
|
|
|
|
|
|
|
|
|
|
Net increase in net assets resulting from operations |
|
|
144,612,573 |
|
|
38,707,130 |
|
|
|
|
|
|
|
|
|
|
|
|
|
|
|
|
|
|
|
|
|
|
|
|
|
|
|
|
|
Capital Share Transactions |
|
|
|
|
|
|
|
|
|
|
|
|
|
|
|
|
|
Net increase in net assets derived from capital share transactions |
|
|
14,055,995 |
|
|
67,723,684 |
|
|
|
|
|
|
|
|
|
|
|
|
|
|
|
|
|
|
|
|
|
|
|
|
|
|
|
|
|
Net Assets |
|
|
|
|
|
|
|
|
|
|
|
|
|
|
|
|
|
Total increase in net assets |
|
|
158,668,568 |
|
|
106,430,814 |
|
|
Beginning of period |
|
|
490,349,976 |
|
|
383,919,162 |
|
|
|
|
|
|
|
|
|
|
|
End of period |
|
$ |
649,018,544 |
|
$ |
490,349,976 |
|
|
|
|
|
|
|
|
|
|
|
Accumulated net investment loss |
|
$ |
(1,836,951 |
) |
$ |
(1,140,482 |
) |
|
|
|
|
|
|
|
|
|
|
|
|
|
|
See Notes to Financial Statements. |
|
|
|
|
|
|
|
24 |
SEMI-ANNUAL REPORT |
JANUARY 31, 2011 |
|
|
|
|
|
|
|
|
|
|
Statements of Changes in Net Assets |
BlackRock Utilities and Telecommunications Fund, Inc. |
|
|
|
|
|
|
|
|
|
|
Increase (Decrease) in Net Assets: |
|
Six
Months Ended |
|
Year
Ended |
|
||
|
|
|
|
|
|
|
||
|
Operations |
|
|
|
|
|
|
|
|
|
|
|
|
|
|
|
|
|
Net investment income |
|
$ |
1,085,491 |
|
$ |
2,454,254 |
|
|
Net realized gain |
|
|
144,831 |
|
|
1,337,213 |
|
|
Net change in unrealized appreciation/depreciation |
|
|
8,098,305 |
|
|
2,425,580 |
|
|
|
|
|
|
|
|
|
|
|
Net increase in net assets resulting from operations |
|
|
9,328,627 |
|
|
6,217,047 |
|
|
|
|
|
|
|
|
|
|
|
|
|
|
|
|
|
|
|
|
|
|
|
|
|
|
|
|
|
Dividends to Shareholders From |
|
|
|
|
|
|
|
|
|
|
|
|
|
|
|
|
|
Net investment income: |
|
|
|
|
|
|
|
|
Institutional |
|
|
(156,393 |
) |
|
(401,712 |
) |
|
Investor A |
|
|
(773,405 |
) |
|
(1,731,290 |
) |
|
Investor B |
|
|
(4,962 |
) |
|
(12,900 |
) |
|
Investor B1 |
|
|
(12,648 |
) |
|
(45,066 |
) |
|
Investor C |
|
|
(62,160 |
) |
|
(135,167 |
) |
|
Investor C1 |
|
|
(57,524 |
) |
|
(150,894 |
) |
|
|
|
|
|
|
|
|
|
|
Decrease in net assets resulting from dividends to shareholders |
|
|
(1,067,092 |
) |
|
(2,477,029 |
) |
|
|
|
|
|
|
|
|
|
|
|
|
|
|
|
|
|
|
|
|
|
|
|
|
|
|
|
|
Capital Share Transactions |
|
|
|
|
|
|
|
|
|
|
|
|
|
|
|
|
|
Net decrease in net assets derived from capital share transactions |
|
|
(4,102,205 |
) |
|
(2,893,693 |
) |
|
|
|
|
|
|
|
|
|
|
|
|
|
|
|
|
|
|
|
|
|
|
|
|
|
|
|
|
Net Assets |
|
|
|
|
|
|
|
|
|
|
|
|
|
|
|
|
|
Total increase in net assets |
|
|
4,159,330 |
|
|
846,325 |
|
|
Beginning of period |
|
|
100,420,119 |
|
|
99,573,794 |
|
|
|
|
|
|
|
|
|
|
|
End of period |
|
$ |
104,579,449 |
|
$ |
100,420,119 |
|
|
|
|
|
|
|
|
|
|
|
Undistributed net investment income |
|
$ |
98,531 |
|
$ |
80,132 |
|
|
|
|
|
|
|
|
|
|
|
|
|
|
|
See Notes to Financial Statements. |
|
|
|
|
||
|
SEMI-ANNUAL REPORT |
JANUARY 31, 2011 |
25 |
|
|
|
|
|
|
|
|
|
|
BlackRock Equity Dividend Fund |
|
|
|
|
|
|
|
|
|
|
|
|
|
|
|
|
|
|
|
|
|
|
|
|
|
Institutional |
|
||||||||||||||||
|
|
|
|
|
||||||||||||||||
|
|
|
Six
Months |
|
|
|
|
|
|
|
|
|
|
|
||||||
|
|
|
|
|
|
|
|
|
|
|
|
|
|
|||||||
|
|
|
|
Year Ended July 31, |
|
|||||||||||||||
|
|
|
|
|
|
|||||||||||||||
|
|
|
|
2010 |
|
2009 |
|
2008 |
|
2007 |
|
2006 |
|
|||||||
|
|
|
|
|
|
|
|
|
|
|
|
|
|
|
||||||
|
Per Share Operating Performance |
|
|
|
|
|
|
|
|
|
|
|
|
|
|
|
|
|
|
|
|
|
|
|
|
|
|
|
|
|
|
|
|
|
|
|
|
|
|
|
|
|
Net asset value, beginning of period |
|
$ |
15.66 |
|
$ |
14.22 |
|
$ |
18.23 |
|
$ |
19.57 |
|
$ |
17.20 |
|
$ |
15.32 |
|
|
|
|
|
|
|
|
|
|
|
|
|
|
|
|
|
|
|
|
|
|
|
Net investment income1 |
|
|
0.18 |
|
|
0.37 |
|
|
0.37 |
|
|
0.45 |
|
|
0.39 |
|
|
0.34 |
|
|
Net realized and unrealized gain (loss) |
|
|
2.20 |
|
|
1.38 |
|
|
(4.02 |
) |
|
(1.12 |
) |
|
2.60 |
|
|
1.88 |
|
|
|
|
|
|
|
|
|
|
|
|
|
|
|
|
|
|
|
|
|
|
|
Net increase (decrease) from investment operations |
|
|
2.38 |
|
|
1.75 |
|
|
(3.65 |
) |
|
(0.67 |
) |
|
2.99 |
|
|
2.22 |
|
|
|
|
|
|
|
|
|
|
|
|
|
|
|
|
|
|
|
|
|
|
|
Dividends and distributions from: |
|
|
|
|
|
|
|
|
|
|
|
|
|
|
|
|
|
|
|
|
Net investment income |
|
|
(0.21 |
) |
|
(0.31 |
) |
|
(0.36 |
) |
|
(0.39 |
) |
|
(0.39 |
) |
|
(0.31 |
) |
|
Net realized gain |
|
|
— |
|
|
— |
|
|
— |
|
|
(0.27 |
) |
|
(0.23 |
) |
|
(0.03 |
) |
|
Tax return of capital |
|
|
— |
|
|
— |
|
|
— |
|
|
(0.01 |
) |
|
— |
|
|
— |
|
|
|
|
|
|
|
|
|
|
|
|
|
|
|
|
|
|
|
|
|
|
|
Total dividends and distributions |
|
|
(0.21 |
) |
|
(0.31 |
) |
|
(0.36 |
) |
|
(0.67 |
) |
|
(0.62 |
) |
|
(0.34 |
) |
|
|
|
|
|
|
|
|
|
|
|
|
|
|
|
|
|
|
|
|
|
|
Net asset value, end of period |
|
$ |
17.83 |
|
$ |
15.66 |
|
$ |
14.22 |
|
$ |
18.23 |
|
$ |
19.57 |
|
$ |
17.20 |
|
|
|
|
|
|
|
|
|
|
|
|
|
|
|
|
|
|
|
|
|
|
|
|
|
|
|
|
|
|
|
|
|
|
|
|
|
|
|
|
|
|
|
|
|
|
|
|
|
|
|
|
|
|
|
|
|
|
|
|
|
|
|
|
|
Total Investment Return2 |
|
|
|
|
|
|
|
|
|
|
|
|
|
|
|
|
|
|
|
|
|
|
|
|
|
|
|
|
|
|
|
|
|
|
|
|
|
|
|
|
|
Based on net asset value |
|
|
15.29 |
%3 |
|
12.31 |
% |
|
(19.80 |
)% |
|
(3.67 |
)% |
|
17.68 |
% |
|
14.68 |
% |
|
|
|
|
|
|
|
|
|
|
|
|
|
|
|
|
|
|
|
|
|
|
|
|
|
|
|
|
|
|
|
|
|
|
|
|
|
|
|
|
|
|
|
|
|
|
|
|
|
|
|
|
|
|
|
|
|
|
|
|
|
|
|
|
Ratios to Average Net Assets |
|
|
|
|
|
|
|
|
|
|
|
|
|
|
|
|
|
|
|
|
|
|
|
|
|
|
|
|
|
|
|
|
|
|
|
|
|
|
|
|
|
Total expenses |
|
|
0.74 |
%4 |
|
0.78 |
% |
|
0.77 |
% |
|
0.74 |
% |
|
0.76 |
% |
|
0.82 |
% |
|
|
|
|
|
|
|
|
|
|
|
|
|
|
|
|
|
|
|
|
|
|
Total expenses after fees waived and/or reimbursed and paid indirectly |
|
|
0.74 |
%4 |
|
0.77 |
% |
|
0.76 |
% |
|
0.74 |
% |
|
0.76 |
% |
|
0.82 |
% |
|
|
|
|
|
|
|
|
|
|
|
|
|
|
|
|
|
|
|
|
|
|
Net investment income |
|
|
2.13 |
%4 |
|
2.37 |
% |
|
2.78 |
% |
|
2.31 |
% |
|
2.08 |
% |
|
2.10 |
% |
|
|
|
|
|
|
|
|
|
|
|
|
|
|
|
|
|
|
|
|
|
|
|
|
|
|
|
|
|
|
|
|
|
|
|
|
|
|
|
|
|
|
|
|
|
|
|
|
|
|
|
|
|
|
|
|
|
|
|
|
|
|
|
|
Supplemental Data |
|
|
|
|
|
|
|
|
|
|
|
|
|
|
|
|
|
|
|
|
|
|
|
|
|
|
|
|
|
|
|
|
|
|
|
|
|
|
|
|
|
Net assets, end of period (000) |
|
$ |
4,844,576 |
|
$ |
3,058,137 |
|
$ |
1,651,607 |
|
$ |
1,107,277 |
|
$ |
496,465 |
|
$ |
276,433 |
|
|
|
|
|
|
|
|
|
|
|
|
|
|
|
|
|
|
|
|
|
|
|
Portfolio turnover |
|
|
1 |
% |
|
4 |
% |
|
7 |
% |
|
2 |
% |
|
9 |
% |
|
2 |
% |
|
|
|
|
|
|
|
|
|
|
|
|
|
|
|
|
|
|
|
|
|
|
|
|
|
1 |
Based on average shares outstanding. |
|
|
|
|
2 |
Where applicable, total investment returns exclude the effects of any sales charges and include the reinvestment of dividends and distributions. |
|
|
|
|
3 |
Aggregate total investment return. |
|
|
|
|
4 |
Annualized. |
|
|
|
|
|
See Notes to Financial Statements. |
|
|
|
|
|
|
|
26 |
SEMI-ANNUAL REPORT |
JANUARY 31, 2011 |
|
|
|
|
|
|
|
|
|
|
Financial Highlights (continued) |
BlackRock Equity Dividend Fund |
|
|
|
|
|
|
|
|
|
|
|
|
|
|
|
|
|
|
|
|
|
Service |
|
|||||||||||||
|
|
|
|
|
|||||||||||||
|
|
|
Six
Months |
|
Year Ended July 31, |
|
Period |
|
|||||||||
|
|
|
|
|
|
||||||||||||
|
|
|
|
|
|
|
|||||||||||
|
|
|
|
2010 |
|
2009 |
|
2008 |
|
|
|||||||
|
|
|
|
|
|
|
|
|
|
|
|
|
|||||
|
Per Share Operating Performance |
|
|
|
|
|
|
|
|
|
|
|
|
|
|
|
|
|
|
|
|
|
|
|
|
|
|
|
|
|
|
|
|
|
|
|
Net asset value, beginning of period |
|
$ |
15.63 |
|
$ |
14.19 |
|
$ |
18.19 |
|
$ |
19.55 |
|
$ |
17.34 |
|
|
|
|
|
|
|
|
|
|
|
|
|
|
|
|
|
|
|
|
Net investment income2 |
|
|
0.16 |
|
|
0.32 |
|
|
0.32 |
|
|
0.39 |
|
|
0.23 |
|
|
Net realized and unrealized gain (loss) |
|
|
2.19 |
|
|
1.39 |
|
|
(3.98 |
) |
|
(1.11 |
) |
|
2.56 |
|
|
|
|
|
|
|
|
|
|
|
|
|
|
|
|
|
|
|
|
Net increase (decrease) from investment operations |
|
|
2.35 |
|
|
1.71 |
|
|
(3.66 |
) |
|
(0.72 |
) |
|
2.79 |
|
|
|
|
|
|
|
|
|
|
|
|
|
|
|
|
|
|
|
|
Dividends and distributions from: |
|
|
|
|
|
|
|
|
|
|
|
|
|
|
|
|
|
Net investment income |
|
|
(0.19 |
) |
|
(0.27 |
) |
|
(0.34 |
) |
|
(0.36 |
) |
|
(0.35 |
) |
|
Net realized gain |
|
|
— |
|
|
— |
|
|
— |
|
|
(0.27 |
) |
|
(0.23 |
) |
|
Tax return of capital |
|
|
— |
|
|
— |
|
|
— |
|
|
(0.01 |
) |
|
— |
|
|
|
|
|
|
|
|
|
|
|
|
|
|
|
|
|
|
|
|
Total dividends and distributions |
|
|
(0.19 |
) |
|
(0.27 |
) |
|
(0.34 |
) |
|
(0.64 |
) |
|
(0.58 |
) |
|
|
|
|
|
|
|
|
|
|
|
|
|
|
|
|
|
|
|
Net asset value, end of period |
|
$ |
17.79 |
|
$ |
15.63 |
|
$ |
14.19 |
|
$ |
18.19 |
|
$ |
19.55 |
|
|
|
|
|
|
|
|
|
|
|
|
|
|
|
|
|
|
|
|
|
|
|
|
|
|
|
|
|
|
|
|
|
|
|
|
|
|
|
|
|
|
|
|
|
|
|
|
|
|
|
|
|
|
|
|
Total Investment Return3 |
|
|
|
|
|
|
|
|
|
|
|
|
|
|
|
|
|
|
|
|
|
|
|
|
|
|
|
|
|
|
|
|
|
|
|
Based on net asset value |
|
|
15.10 |
%4 |
|
12.07 |
% |
|
(19.95 |
)% |
|
(3.93 |
)% |
|
16.42 |
%4 |
|
|
|
|
|
|
|
|
|
|
|
|
|
|
|
|
|
|
|
|
|
|
|
|
|
|
|
|
|
|
|
|
|
|
|
|
|
|
|
|
|
|
|
|
|
|
|
|
|
|
|
|
|
|
|
Ratios to Average Net Assets |
|
|
|
|
|
|
|
|
|
|
|
|
|
|
|
|
|
|
|
|
|
|
|
|
|
|
|
|
|
|
|
|
|
|
|
Total expenses |
|
|
1.02 |
%5 |
|
1.01 |
% |
|
1.01 |
% |
|
0.99 |
% |
|
1.02 |
%5 |
|
|
|
|
|
|
|
|
|
|
|
|
|
|
|
|
|
|
|
Total expenses after fees waived and/or reimbursed and paid indirectly |
|
|
1.01 |
%5 |
|
1.00 |
% |
|
1.01 |
% |
|
0.99 |
% |
|
1.02 |
%5 |
|
|
|
|
|
|
|
|
|
|
|
|
|
|
|
|
|
|
|
Net investment income |
|
|
1.89 |
%5 |
|
2.10 |
% |
|
2.47 |
% |
|
2.02 |
% |
|
1.60 |
%5 |
|
|
|
|
|
|
|
|
|
|
|
|
|
|
|
|
|
|
|
|
|
|
|
|
|
|
|
|
|
|
|
|
|
|
|
|
|
|
|
|
|
|
|
|
|
|
|
|
|
|
|
|
|
|
|
Supplemental Data |
|
|
|
|
|
|
|
|
|
|
|
|
|
|
|
|
|
|
|
|
|
|
|
|
|
|
|
|
|
|
|
|
|
|
|
Net assets, end of period (000) |
|
$ |
48,502 |
|
$ |
37,479 |
|
$ |
31,356 |
|
$ |
9,688 |
|
$ |
1,642 |
|
|
|
|
|
|
|
|
|
|
|
|
|
|
|
|
|
|
|
|
Portfolio turnover |
|
|
1 |
% |
|
4 |
% |
|
7 |
% |
|
2 |
% |
|
9 |
% |
|
|
|
|
|
|
|
|
|
|
|
|
|
|
|
|
|
|
|
|
|
|
1 |
Commencement of operations. |
|
|
|
|
2 |
Based on average shares outstanding. |
|
|
|
|
3 |
Where applicable, total investment returns include the reinvestment of dividends and distributions. |
|
|
|
|
4 |
Aggregate total investment return. |
|
|
|
|
5 |
Annualized. |
|
|
|
|
|
See Notes to Financial Statements. |
|
|
|
|
||
|
SEMI-ANNUAL REPORT |
JANUARY 31, 2011 |
27 |
|
|
|
|
|
|
|
|
|
|
Financial Highlights (continued) |
BlackRock Equity Dividend Fund |
|
|
|
|
|
|
|
|
|
|
|
|
|
|
|
|
|
|
|
|
|
|
|
|
Investor A |
|||||||||||||||||
|
|
|
|
|||||||||||||||||
|
|
|
Six
Months |
|
|
|
|
|
|
|
|
|
|
|
||||||
|
|
|
Year Ended July 31, |
|
||||||||||||||||
|
|
|
|
|
||||||||||||||||
|
|
|
|
2010 |
|
2009 |
|
2008 |
|
2007 |
|
2006 |
|
|||||||
|
|
|
|
|
|
|
|
|
|
|
|
|
|
|
||||||
|
Per Share Operating Performance |
|
|
|
|
|
|
|
|
|
|
|
|
|
|
|
|
|||
|
|
|
|
|
|
|
|
|
|
|
|
|
|
|
|
|
|
|
|
|
|
Net asset value, beginning of period |
|
$ |
15.63 |
|
$ |
14.20 |
|
$ |
18.20 |
|
$ |
19.55 |
|
$ |
17.19 |
|
$ |
15.31 |
|
|
|
|
|
|
|
|
|
|
|
|
|
|
|
|
|
|
|
|
|
|
|
Net investment income1 |
|
|
0.16 |
|
|
0.32 |
|
|
0.33 |
|
|
0.39 |
|
|
0.34 |
|
|
0.30 |
|
|
Net realized and unrealized gain (loss) |
|
|
2.21 |
|
|
1.38 |
|
|
(4.01 |
) |
|
(1.12 |
) |
|
2.59 |
|
|
1.89 |
|
|
|
|
|
|
|
|
|
|
|
|
|
|
|
|
|
|
|
|
|
|
|
Net increase (decrease) from investment operations |
|
|
2.37 |
|
|
1.70 |
|
|
(3.68 |
) |
|
(0.73 |
) |
|
2.93 |
|
|
2.19 |
|
|
|
|
|
|
|
|
|
|
|
|
|
|
|
|
|
|
|
|
|
|
|
Dividends and distributions from: |
|
|
|
|
|
|
|
|
|
|
|
|
|
|
|
|
|
|
|
|
Net investment income |
|
|
(0.20 |
) |
|
(0.27 |
) |
|
(0.32 |
) |
|
(0.34 |
) |
|
(0.34 |
) |
|
(0.28 |
) |
|
Net realized gain |
|
|
— |
|
|
— |
|
|
— |
|
|
(0.27 |
) |
|
(0.23 |
) |
|
(0.03 |
) |
|
Tax return of capital |
|
|
— |
|
|
— |
|
|
— |
|
|
(0.01 |
) |
|
— |
|
|
— |
|
|
|
|
|
|
|
|
|
|
|
|
|
|
|
|
|
|
|
|
|
|
|
Total dividends and distributions |
|
|
(0.20 |
) |
|
(0.27 |
) |
|
(0.32 |
) |
|
(0.62 |
) |
|
(0.57 |
) |
|
(0.31 |
) |
|
|
|
|
|
|
|
|
|
|
|
|
|
|
|
|
|
|
|
|
|
|
Net asset value, end of period |
|
$ |
17.80 |
|
$ |
15.63 |
|
$ |
14.20 |
|
$ |
18.20 |
|
$ |
19.55 |
|
$ |
17.19 |
|
|
|
|
|
|
|
|
|
|
|
|
|
|
|
|
|
|
|
|
|
|
|
|
|
|
|
|
|
|
|
|
|
|
|
|
|
|
|
|
|
|
|
|
|
|
|
|
|
|
|
|
|
|
|
|
|
|
|
|
|
|
|
|
|
Total Investment Return2 |
|
|
|
|
|
|
|
|
|
|
|
|
|
|
|
|
|
|
|
|
|
|
|
|
|
|
|
|
|
|
|
|
|
|
|
|
|
|
|
|
|
Based on net asset value |
|
|
15.16 |
%3 |
|
11.96 |
% |
|
(20.03 |
)% |
|
(3.94 |
)% |
|
17.35 |
% |
|
14.42 |
% |
|
|
|
|
|
|
|
|
|
|
|
|
|
|
|
|
|
|
|
|
|
|
|
|
|
|
|
|
|
|
|
|
|
|
|
|
|
|
|
|
|
|
|
|
|
|
|
|
|
|
|
|
|
|
|
|
|
|
|
|
|
|
|
|
Ratios to Average Net Assets |
|
|
|
|
|
|
|
|
|
|
|
|
|
|
|
|
|
|
|
|
|
|
|
|
|
|
|
|
|
|
|
|
|
|
|
|
|
|
|
|
|
Total expenses |
|
|
1.03 |
%4 |
|
1.05 |
% |
|
1.09 |
% |
|
1.02 |
% |
|
1.03 |
% |
|
1.07 |
% |
|
|
|
|
|
|
|
|
|
|
|
|
|
|
|
|
|
|
|
|
|
|
Total expenses after fees waived and/or reimbursed and paid indirectly |
|
|
1.02 |
%4 |
|
1.04 |
% |
|
1.08 |
% |
|
1.02 |
% |
|
1.03 |
% |
|
1.07 |
% |
|
|
|
|
|
|
|
|
|
|
|
|
|
|
|
|
|
|
|
|
|
|
Net investment income |
|
|
1.88 |
%4 |
|
2.09 |
% |
|
2.46 |
% |
|
2.01 |
% |
|
1.80 |
% |
|
1.85 |
% |
|
|
|
|
|
|
|
|
|
|
|
|
|
|
|
|
|
|
|
|
|
|
|
|
|
|
|
|
|
|
|
|
|
|
|
|
|
|
|
|
|
|
|
|
|
|
|
|
|
|
|
|
|
|
|
|
|
|
|
|
|
|
|
|
Supplemental Data |
|
|
|
|
|
|
|
|
|
|
|
|
|
|
|
|
|
|
|
|
|
|
|
|
|
|
|
|
|
|
|
|
|
|
|
|
|
|
|
|
|
Net assets, end of period (000) |
|
$ |
4,979,885 |
|
$ |
4,055,036 |
|
$ |
2,435,103 |
|
$ |
1,733,008 |
|
$ |
531,661 |
|
$ |
278,233 |
|
|
|
|
|
|
|
|
|
|
|
|
|
|
|
|
|
|
|
|
|
|
|
Portfolio turnover |
|
|
1 |
% |
|
4 |
% |
|
7 |
% |
|
2 |
% |
|
9 |
% |
|
2 |
% |
|
|
|
|
|
|
|
|
|
|
|
|
|
|
|
|
|
|
|
|
|
|
|
|
|
1 |
Based on average shares outstanding. |
|
|
|
|
2 |
Where applicable, total investment returns exclude the effects of any sales charges and include the reinvestment of dividends and distributions. |
|
|
|
|
3 |
Aggregate total investment return. |
|
|
|
|
4 |
Annualized. |
|
|
|
|
|
See Notes to Financial Statements. |
|
|
|
|
|
|
|
28 |
SEMI-ANNUAL REPORT |
JANUARY 31, 2011 |
|
|
|
|
|
|
|
|
|
|
Financial Highlights (continued) |
BlackRock Equity Dividend Fund |
|
|
|
|
|
|
|
|
|
|
|
|
|
|
|
|
|
|
|
|
|
|
|
|
Investor B |
|
||||||||||||||||
|
|
|
|
|
||||||||||||||||
|
|
|
Six
Months |
|
|
|
|
|
|
|
|
|
|
|
||||||
|
|
|
|
Year Ended July 31, |
|
|||||||||||||||
|
|
|
|
|
|
|||||||||||||||
|
|
|
|
2010 |
|
2009 |
|
2008 |
|
2007 |
|
2006 |
|
|||||||
|
|
|
|
|
|
|
|
|
|
|
|
|
|
|
|
|
|
|
|
|
|
Per Share Operating Performance |
|
|
|
|
|
|
|
|
|
|
|
|
|
|
|
|
|
|
|
|
|
|
|
|
|
|
|
|
|
|
|
|
|
|
|
|
|
|
|
|
|
Net asset value, beginning of period |
|
$ |
15.73 |
|
$ |
14.28 |
|
$ |
18.27 |
|
$ |
19.62 |
|
$ |
17.24 |
|
$ |
15.36 |
|
|
|
|
|
|
|
|
|
|
|
|
|
|
|
|
|
|
|
|
|
|
|
Net investment income1 |
|
|
0.09 |
|
|
0.19 |
|
|
0.24 |
|
|
0.26 |
|
|
0.20 |
|
|
0.18 |
|
|
Net realized and unrealized gain (loss) |
|
|
2.21 |
|
|
1.40 |
|
|
(4.03 |
) |
|
(1.16 |
) |
|
2.60 |
|
|
1.88 |
|
|
|
|
|
|
|
|
|
|
|
|
|
|
|
|
|
|
|
|
|
|
|
Net increase (decrease) from investment operations |
|
|
2.30 |
|
|
1.59 |
|
|
(3.79 |
) |
|
(0.90 |
) |
|
2.80 |
|
|
2.06 |
|
|
|
|
|
|
|
|
|
|
|
|
|
|
|
|
|
|
|
|
|
|
|
Dividends and distributions from: |
|
|
|
|
|
|
|
|
|
|
|
|
|
|
|
|
|
|
|
|
Net investment income |
|
|
(0.12 |
) |
|
(0.14 |
) |
|
(0.20 |
) |
|
(0.17 |
) |
|
(0.19 |
) |
|
(0.15 |
) |
|
Net realized gain |
|
|
— |
|
|
— |
|
|
— |
|
|
(0.27 |
) |
|
(0.23 |
) |
|
(0.03 |
) |
|
Tax return of capital |
|
|
— |
|
|
— |
|
|
— |
|
|
(0.01 |
) |
|
— |
|
|
— |
|
|
|
|
|
|
|
|
|
|
|
|
|
|
|
|
|
|
|
|
|
|
|
Total dividends and distributions |
|
|
(0.12 |
) |
|
(0.14 |
) |
|
(0.20 |
) |
|
(0.45 |
) |
|
(0.42 |
) |
|
(0.18 |
) |
|
|
|
|
|
|
|
|
|
|
|
|
|
|
|
|
|
|
|
|
|
|
Net asset value, end of period |
|
$ |
17.91 |
|
$ |
15.73 |
|
$ |
14.28 |
|
$ |
18.27 |
|
$ |
19.62 |
|
$ |
17.24 |
|
|
|
|
|
|
|
|
|
|
|
|
|
|
|
|
|
|
|
|
|
|
|
|
|
|
|
|
|
|
|
|
|
|
|
|
|
|
|
|
|
|
|
|
|
|
|
|
|
|
|
|
|
|
|
|
|
|
|
|
|
|
|
|
|
Total Investment Return2 |
|
|
|
|
|
|
|
|
|
|
|
|
|
|
|
|
|
|
|
|
|
|
|
|
|
|
|
|
|
|
|
|
|
|
|
|
|
|
|
|
|
Based on net asset value |
|
|
14.67 |
%3 |
|
11.10 |
% |
|
(20.62 |
)% |
|
(4.75 |
)% |
|
16.50 |
% |
|
13.48 |
% |
|
|
|
|
|
|
|
|
|
|
|
|
|
|
|
|
|
|
|
|
|
|
|
|
|
|
|
|
|
|
|
|
|
|
|
|
|
|
|
|
|
|
|
|
|
|
|
|
|
|
|
|
|
|
|
|
|
|
|
|
|
|
|
|
Ratios to Average Net Assets |
|
|
|
|
|
|
|
|
|
|
|
|
|
|
|
|
|
|
|
|
|
|
|
|
|
|
|
|
|
|
|
|
|
|
|
|
|
|
|
|
|
Total expenses |
|
|
1.83 |
%4 |
|
1.84 |
% |
|
1.87 |
% |
|
1.80 |
% |
|
1.82 |
% |
|
1.84 |
% |
|
|
|
|
|
|
|
|
|
|
|
|
|
|
|
|
|
|
|
|
|
|
Total expenses after fees waived and/or reimbursed and paid indirectly |
|
|
1.82 |
%4 |
|
1.83 |
% |
|
1.86 |
% |
|
1.80 |
% |
|
1.82 |
% |
|
1.84 |
% |
|
|
|
|
|
|
|
|
|
|
|
|
|
|
|
|
|
|
|
|
|
|
Net investment income |
|
|
1.11 |
%4 |
|
1.26 |
% |
|
1.73 |
% |
|
1.31 |
% |
|
1.05 |
% |
|
1.09 |
% |
|
|
|
|
|
|
|
|
|
|
|
|
|
|
|
|
|
|
|
|
|
|
|
|
|
|
|
|
|
|
|
|
|
|
|
|
|
|
|
|
|
|
|
|
|
|
|
|
|
|
|
|
|
|
|
|
|
|
|
|
|
|
|
|
Supplemental Data |
|
|
|
|
|
|
|
|
|
|
|
|
|
|
|
|
|
|
|
|
|
|
|
|
|
|
|
|
|
|
|
|
|
|
|
|
|
|
|
|
|
Net assets, end of period (000) |
|
$ |
60,545 |
|
$ |
57,788 |
|
$ |
69,474 |
|
$ |
100,597 |
|
$ |
102,810 |
|
$ |
83,643 |
|
|
|
|
|
|
|
|
|
|
|
|
|
|
|
|
|
|
|
|
|
|
|
Portfolio turnover |
|
|
1 |
% |
|
4 |
% |
|
7 |
% |
|
2 |
% |
|
9 |
% |
|
2 |
% |
|
|
|
|
|
|
|
|
|
|
|
|
|
|
|
|
|
|
|
|
|
|
|
|
|
|
|
1 |
Based on average shares outstanding. |
|
|
|
|
|
|
2 |
Where applicable, total investment returns exclude the effects of any sales charges and include the reinvestment of dividends and distributions. |
|
|
|
|
|
|
3 |
Aggregate total investment return. |
|
|
|
|
|
|
4 |
Annualized. |
|
|
|
|
|
See Notes to Financial Statements. |
|
|
|
|
||
|
SEMI-ANNUAL REPORT |
JANUARY 31, 2011 |
29 |
|
|
|
|
|
|
|
|
|
|
Financial Highlights (continued) |
BlackRock Equity Dividend Fund |
|
|
|
|
|
|
|
|
|
|
|
|
|
|
|
|
|
|
|
|
|
|
|
|
Investor C |
|
||||||||||||||||
|
|
|
|
|
||||||||||||||||
|
|
|
Six
Months |
|
|
|
|
|
|
|
|
|
|
|
||||||
|
|
|
|
Year Ended July 31, |
|
|||||||||||||||
|
|
|
|
|
|
|||||||||||||||
|
|
|
|
2010 |
|
2009 |
|
2008 |
|
2007 |
|
2006 |
|
|||||||
|
|
|
|
|
|
|
|
|
|
|
|
|
|
|
|
|
|
|
|
|
|
Per Share Operating Performance |
|
|
|
|
|
|
|
|
|
|
|
|
|
|
|
|
|
|
|
|
|
|
|
|
|
|
|
|
|
|
|
|
|
|
|
|
|
|
|
|
|
Net asset value, beginning of period |
|
$ |
15.33 |
|
$ |
13.94 |
|
$ |
17.87 |
|
$ |
19.22 |
|
$ |
16.92 |
|
$ |
15.08 |
|
|
|
|
|
|
|
|
|
|
|
|
|
|
|
|
|
|
|
|
|
|
|
Net investment income1 |
|
|
0.09 |
|
|
0.20 |
|
|
0.23 |
|
|
0.25 |
|
|
0.19 |
|
|
0.17 |
|
|
Net realized and unrealized gain (loss) |
|
|
2.15 |
|
|
1.36 |
|
|
(3.94 |
) |
|
(1.11 |
) |
|
2.56 |
|
|
1.86 |
|
|
|
|
|
|
|
|
|
|
|
|
|
|
|
|
|
|
|
|
|
|
|
Net increase (decrease) from investment operations |
|
|
2.24 |
|
|
1.56 |
|
|
(3.71 |
) |
|
(0.86 |
) |
|
2.75 |
|
|
2.03 |
|
|
|
|
|
|
|
|
|
|
|
|
|
|
|
|
|
|
|
|
|
|
|
Dividends and distributions from: |
|
|
|
|
|
|
|
|
|
|
|
|
|
|
|
|
|
|
|
|
Net investment income |
|
|
(0.13 |
) |
|
(0.17 |
) |
|
(0.22 |
) |
|
(0.21 |
) |
|
(0.22 |
) |
|
(0.16 |
) |
|
Net realized gain |
|
|
— |
|
|
— |
|
|
— |
|
|
(0.27 |
) |
|
(0.23 |
) |
|
(0.03 |
) |
|
Tax return of capital |
|
|
— |
|
|
— |
|
|
— |
|
|
(0.01 |
) |
|
— |
|
|
— |
|
|
|
|
|
|
|
|
|
|
|
|
|
|
|
|
|
|
|
|
|
|
|
Total dividends and distributions |
|
|
(0.13 |
) |
|
(0.17 |
) |
|
(0.22 |
) |
|
(0.49 |
) |
|
(0.45 |
) |
|
(0.19 |
) |
|
|
|
|
|
|
|
|
|
|
|
|
|
|
|
|
|
|
|
|
|
|
Net asset value, end of period |
|
$ |
17.44 |
|
$ |
15.33 |
|
$ |
13.94 |
|
$ |
17.87 |
|
$ |
19.22 |
|
$ |
16.92 |
|
|
|
|
|
|
|
|
|
|
|
|
|
|
|
|
|
|
|
|
|
|
|
|
|
|
|
|
|
|
|
|
|
|
|
|
|
|
|
|
|
|
|
|
|
|
|
|
|
|
|
|
|
|
|
|
|
|
|
|
|
|
|
|
|
Total Investment Return2 |
|
|
|
|
|
|
|
|
|
|
|
|
|
|
|
|
|
|
|
|
|
|
|
|
|
|
|
|
|
|
|
|
|
|
|
|
|
|
|
|
|
Based on net asset value |
|
|
14.68 |
%3 |
|
11.15 |
% |
|
(20.62 |
)% |
|
(4.67 |
)% |
|
16.50 |
% |
|
13.56 |
% |
|
|
|
|
|
|
|
|
|
|
|
|
|
|
|
|
|
|
|
|
|
|
|
|
|
|
|
|
|
|
|
|
|
|
|
|
|
|
|
|
|
|
|
|
|
|
|
|
|
|
|
|
|
|
|
|
|
|
|
|
|
|
|
|
Ratios to Average Net Assets |
|
|
|
|
|
|
|
|
|
|
|
|
|
|
|
|
|
|
|
|
|
|
|
|
|
|
|
|
|
|
|
|
|
|
|
|
|
|
|
|
|
Total expenses |
|
|
1.76 |
%4 |
|
1.79 |
% |
|
1.83 |
% |
|
1.76 |
% |
|
1.78 |
% |
|
1.84 |
% |
|
|
|
|
|
|
|
|
|
|
|
|
|
|
|
|
|
|
|
|
|
|
Total expenses after fees waived and/or reimbursed and paid indirectly |
|
|
1.76 |
%4 |
|
1.78 |
% |
|
1.83 |
% |
|
1.76 |
% |
|
1.78 |
% |
|
1.84 |
% |
|
|
|
|
|
|
|
|
|
|
|
|
|
|
|
|
|
|
|
|
|
|
Net investment income |
|
|
1.14 |
%4 |
|
1.35 |
% |
|
1.73 |
% |
|
1.31 |
% |
|
1.04 |
% |
|
1.09 |
% |
|
|
|
|
|
|
|
|
|
|
|
|
|
|
|
|
|
|
|
|
|
|
|
|
|
|
|
|
|
|
|
|
|
|
|
|
|
|
|
|
|
|
|
|
|
|
|
|
|
|
|
|
|
|
|
|
|
|
|
|
|
|
|
|
Supplemental Data |
|
|
|
|
|
|
|
|
|
|
|
|
|
|
|
|
|
|
|
|
|
|
|
|
|
|
|
|
|
|
|
|
|
|
|
|
|
|
|
|
|
Net assets, end of period (000) |
|
$ |
1,251,548 |
|
$ |
942,989 |
|
$ |
615,159 |
|
$ |
570,963 |
|
$ |
295,005 |
|
$ |
135,557 |
|
|
|
|
|
|
|
|
|
|
|
|
|
|
|
|
|
|
|
|
|
|
|
Portfolio turnover |
|
|
1 |
% |
|
4 |
% |
|
7 |
% |
|
2 |
% |
|
9 |
% |
|
2 |
% |
|
|
|
|
|
|
|
|
|
|
|
|
|
|
|
|
|
|
|
|
|
|
|
|
|
|
|
1 |
Based on average shares outstanding. |
|
|
|
|
|
|
2 |
Where applicable, total investment returns exclude the effects of any sales charges and include the reinvestment of dividends and distributions. |
|
|
|
|
|
|
3 |
Aggregate total investment return. |
|
|
|
|
|
|
4 |
Annualized. |
|
|
|
|
|
See Notes to Financial Statements. |
|
|
|
|
|
|
|
30 |
SEMI-ANNUAL REPORT |
JANUARY 31, 2011 |
|
|
|
|
|
|
|
|
|
|
Financial Highlights (concluded) |
BlackRock Equity Dividend Fund |
|
|
|
|
|
|
|
|
|
|
|
|
|
|
|
|
|
|
|
|
|
|
|
|
Class R |
|
||||||||||||||||
|
|
|
|
|
||||||||||||||||
|
|
|
Six
Months |
|
|
|
||||||||||||||
|
|
|
|
Year Ended July 31, |
|
|||||||||||||||
|
|
|
|
|
|
|||||||||||||||
|
|
|
|
2010 |
|
2009 |
|
2008 |
|
2007 |
|
2006 |
|
|||||||
|
|
|
|
|
|
|
|
|
|
|
|
|
|
|
|
|
|
|
|
|
|
Per Share Operating Performance |
|
|
|
|
|
|
|
|
|
|
|
|
|
|
|
|
|
|
|
|
|
|
|
|
|
|
|
|
|
|
|
|
|
|
|
|
|
|
|
|
|
Net asset value, beginning of period |
|
$ |
15.71 |
|
$ |
14.27 |
|
$ |
18.29 |
|
$ |
19.66 |
|
$ |
17.30 |
|
$ |
15.41 |
|
|
|
|
|
|
|
|
|
|
|
|
|
|
|
|
|
|
|
|
|
|
|
Net investment income1 |
|
|
0.13 |
|
|
0.30 |
|
|
0.29 |
|
|
0.33 |
|
|
0.27 |
|
|
0.27 |
|
|
Net realized and unrealized gain (loss) |
|
|
2.21 |
|
|
1.37 |
|
|
(4.02 |
) |
|
(1.13 |
) |
|
2.61 |
|
|
1.89 |
|
|
|
|
|
|
|
|
|
|
|
|
|
|
|
|
|
|
|
|
|
|
|
Net increase (decrease) from investment operations |
|
|
2.34 |
|
|
1.67 |
|
|
(3.73 |
) |
|
(0.80 |
) |
|
2.88 |
|
|
2.16 |
|
|
|
|
|
|
|
|
|
|
|
|
|
|
|
|
|
|
|
|
|
|
|
Dividends and distributions from: |
|
|
|
|
|
|
|
|
|
|
|
|
|
|
|
|
|
|
|
|
Net investment income |
|
|
(0.17 |
) |
|
(0.23 |
) |
|
(0.29 |
) |
|
(0.29 |
) |
|
(0.29 |
) |
|
(0.24 |
) |
|
Net realized gain |
|
|
— |
|
|
— |
|
|
— |
|
|
(0.27 |
) |
|
(0.23 |
) |
|
(0.03 |
) |
|
Tax return of capital |
|
|
— |
|
|
— |
|
|
— |
|
|
(0.01 |
) |
|
— |
|
|
— |
|
|
|
|
|
|
|
|
|
|
|
|
|
|
|
|
|
|
|
|
|
|
|
Total dividends and distributions |
|
|
(0.17 |
) |
|
(0.23 |
) |
|
(0.29 |
) |
|
(0.57 |
) |
|
(0.52 |
) |
|
(0.27 |
) |
|
|
|
|
|
|
|
|
|
|
|
|
|
|
|
|
|
|
|
|
|
|
Net asset value, end of period |
|
$ |
17.88 |
|
$ |
15.71 |
|
$ |
14.27 |
|
$ |
18.29 |
|
$ |
19.66 |
|
$ |
17.30 |
|
|
|
|
|
|
|
|
|
|
|
|
|
|
|
|
|
|
|
|
|
|
|
|
|
|
|
|
|
|
|
|
|
|
|
|
|
|
|
|
|
|
|
|
|
|
|
|
|
|
|
|
|
|
|
|
|
|
|
|
|
|
|
|
|
Total Investment Return2 |
|
|
|
|
|
|
|
|
|
|
|
|
|
|
|
|
|
|
|
|
|
|
|
|
|
|
|
|
|
|
|
|
|
|
|
|
|
|
|
|
|
Based on net asset value |
|
|
14.93 |
%3 |
|
11.67 |
% |
|
(20.25 |
)% |
|
(4.26 |
)% |
|
16.96 |
% |
|
14.18 |
% |
|
|
|
|
|
|
|
|
|
|
|
|
|
|
|
|
|
|
|
|
|
|
|
|
|
|
|
|
|
|
|
|
|
|
|
|
|
|
|
|
|
|
|
|
|
|
|
|
|
|
|
|
|
|
|
|
|
|
|
|
|
|
|
|
Ratios to Average Net Assets |
|
|
|
|
|
|
|
|
|
|
|
|
|
|
|
|
|
|
|
|
|
|
|
|
|
|
|
|
|
|
|
|
|
|
|
|
|
|
|
|
|
Total expenses |
|
|
1.33 |
%4 |
|
1.39 |
% |
|
1.46 |
% |
|
1.34 |
% |
|
1.37 |
% |
|
1.32 |
% |
|
|
|
|
|
|
|
|
|
|
|
|
|
|
|
|
|
|
|
|
|
|
Total expenses after fees waived and/or reimbursed and paid indirectly |
|
|
1.32 |
%4 |
|
1.36 |
% |
|
1.38 |
% |
|
1.33 |
% |
|
1.36 |
% |
|
1.32 |
% |
|
|
|
|
|
|
|
|
|
|
|
|
|
|
|
|
|
|
|
|
|
|
Net investment income |
|
|
1.57 |
%4 |
|
1.79 |
% |
|
2.14 |
% |
|
1.68 |
% |
|
1.41 |
% |
|
1.61 |
% |
|
|
|
|
|
|
|
|
|
|
|
|
|
|
|
|
|
|
|
|
|
|
|
|
|
|
|
|
|
|
|
|
|
|
|
|
|
|
|
|
|
|
|
|
|
|
|
|
|
|
|
|
|
|
|
|
|
|
|
|
|
|
|
|
Supplemental Data |
|
|
|
|
|
|
|
|
|
|
|
|
|
|
|
|
|
|
|
|
|
|
|
|
|
|
|
|
|
|
|
|
|
|
|
|
|
|
|
|
|
Net assets, end of period (000) |
|
$ |
555,825 |
|
$ |
412,493 |
|
$ |
217,370 |
|
$ |
118,681 |
|
$ |
32,259 |
|
$ |
10,204 |
|
|
|
|
|
|
|
|
|
|
|
|
|
|
|
|
|
|
|
|
|
|
|
Portfolio turnover |
|
|
1 |
% |
|
4 |
% |
|
7 |
% |
|
2 |
% |
|
9 |
% |
|
2 |
% |
|
|
|
|
|
|
|
|
|
|
|
|
|
|
|
|
|
|
|
|
|
|
|
|
|
|
|
1 |
Based on average shares outstanding. |
|
|
|
|
|
|
2 |
Where applicable, total investment returns include the reinvestment of dividends and distributions. |
|
|
|
|
|
|
3 |
Aggregate total investment return. |
|
|
|
|
|
|
4 |
Annualized. |
|
|
|
|
|
See Notes to Financial Statements. |
|
|
|
|
||
|
SEMI-ANNUAL REPORT |
JANUARY 31, 2011 |
31 |
|
|
|
|
|
|
|
|
|
|
Financial Highlights |
BlackRock Natural Resources Trust |
|
|
|
|
|
|
|
|
|
|
|
|
|
|
|
|
|
|
|
|
|
|
|
|
Institutional |
|
||||||||||||||||
|
|
|
|
|
||||||||||||||||
|
|
|
Six
Months |
|
|
|
|
|
|
|
|
|
|
|
||||||
|
|
|
|
Year Ended July 31, |
|
|||||||||||||||
|
|
|
|
|
|
|||||||||||||||
|
|
|
|
2010 |
|
2009 |
|
2008 |
|
2007 |
|
2006 |
|
|||||||
|
|
|
|
|
|
|
|
|
|
|
|
|
|
|
||||||
|
Per Share Operating Performance |
|
|
|
|
|
|
|
|
|
|
|
|
|
|
|
|
|
|
|
|
|
|
|
|
|
|
|
|
|
|
|
|
|
|
|
|
|
|
|
|
|
Net asset value, beginning of period |
|
$ |
52.59 |
|
$ |
47.18 |
|
$ |
71.61 |
|
$ |
63.83 |
|
$ |
55.85 |
|
$ |
44.93 |
|
|
|
|
|
|
|
|
|
|
|
|
|
|
|
|
|
|
|
|
|
|
|
Net investment income1 |
|
|
0.05 |
|
|
0.18 |
|
|
0.24 |
|
|
0.17 |
|
|
0.17 |
|
|
0.16 |
|
|
Net realized and unrealized gain (loss) |
|
|
15.68 |
|
|
5.23 |
|
|
(23.88 |
) |
|
10.48 |
|
|
10.65 |
|
|
11.09 |
|
|
|
|
|
|
|
|
|
|
|
|
|
|
|
|
|
|
|
|
|
|
|
Net increase (decrease) from investment operations |
|
|
15.73 |
|
|
5.41 |
|
|
(23.64 |
) |
|
10.65 |
|
|
10.82 |
|
|
11.25 |
|
|
|
|
|
|
|
|
|
|
|
|
|
|
|
|
|
|
|
|
|
|
|
Distributions from net realized gain |
|
|
— |
|
|
— |
|
|
(0.79 |
) |
|
(2.87 |
) |
|
(2.84 |
) |
|
(0.33 |
) |
|
|
|
|
|
|
|
|
|
|
|
|
|
|
|
|
|
|
|
|
|
|
Net asset value, end of period |
|
$ |
68.32 |
|
$ |
52.59 |
|
$ |
47.18 |
|
$ |
71.61 |
|
$ |
63.83 |
|
$ |
55.85 |
|
|
|
|
|
|
|
|
|
|
|
|
|
|
|
|
|
|
|
|
|
|
|
|
|
|
|
|
|
|
|
|
|
|
|
|
|
|
|
|
|
|
|
|
|
|
|
|
|
|
|
|
|
|
|
|
|
|
|
|
|
|
|
|
|
Total Investment Return2 |
|
|
|
|
|
|
|
|
|
|
|
|
|
|
|
|
|
|
|
|
|
|
|
|
|
|
|
|
|
|
|
|
|
|
|
|
|
|
|
|
|
Based on net asset value |
|
|
29.91 |
%3 |
|
11.47 |
% |
|
(32.68 |
)% |
|
16.86 |
% |
|
20.98 |
% |
|
25.10 |
% |
|
|
|
|
|
|
|
|
|
|
|
|
|
|
|
|
|
|
|
|
|
|
|
|
|
|
|
|
|
|
|
|
|
|
|
|
|
|
|
|
|
|
|
|
|
|
|
|
|
|
|
|
|
|
|
|
|
|
|
|
|
|
|
|
Ratios to Average Net Assets |
|
|
|
|
|
|
|
|
|
|
|
|
|
|
|
|
|
|
|
|
|
|
|
|
|
|
|
|
|
|
|
|
|
|
|
|
|
|
|
|
|
Total expenses |
|
|
0.79 |
%4 |
|
0.83 |
% |
|
0.92 |
% |
|
0.80 |
% |
|
0.83 |
% |
|
0.82 |
% |
|
|
|
|
|
|
|
|
|
|
|
|
|
|
|
|
|
|
|
|
|
|
Total expenses after fees waived |
|
|
0.79 |
%4 |
|
0.82 |
% |
|
0.91 |
% |
|
0.80 |
% |
|
0.83 |
% |
|
0.82 |
% |
|
|
|
|
|
|
|
|
|
|
|
|
|
|
|
|
|
|
|
|
|
|
Net investment income |
|
|
0.17 |
%4 |
|
0.33 |
% |
|
0.54 |
% |
|
0.23 |
% |
|
0.32 |
% |
|
0.31 |
% |
|
|
|
|
|
|
|
|
|
|
|
|
|
|
|
|
|
|
|
|
|
|
|
|
|
|
|
|
|
|
|
|
|
|
|
|
|
|
|
|
|
|
|
|
|
|
|
|
|
|
|
|
|
|
|
|
|
|
|
|
|
|
|
|
Supplemental Data |
|
|
|
|
|
|
|
|
|
|
|
|
|
|
|
|
|
|
|
|
|
|
|
|
|
|
|
|
|
|
|
|
|
|
|
|
|
|
|
|
|
Net assets, end of period (000) |
|
$ |
97,956 |
|
$ |
65,221 |
|
$ |
49,900 |
|
$ |
87,353 |
|
$ |
69,739 |
|
$ |
75,429 |
|
|
|
|
|
|
|
|
|
|
|
|
|
|
|
|
|
|
|
|
|
|
|
Portfolio turnover |
|
|
1 |
% |
|
3 |
% |
|
3 |
% |
|
4 |
% |
|
6 |
% |
|
10 |
% |
|
|
|
|
|
|
|
|
|
|
|
|
|
|
|
|
|
|
|
|
|
|
|
|
|
|
|
1 |
Based on average shares outstanding. |
|
|
|
|
|
|
2 |
Where applicable, total investment returns exclude the effects of any sales charges and include the reinvestment of dividends and distributions. |
|
|
|
|
|
|
3 |
Aggregate total investment return. |
|
|
|
|
|
|
4 |
Annualized. |
|
|
|
|
|
See Notes to Financial Statements. |
|
|
|
|
|
|
|
32 |
SEMI-ANNUAL REPORT |
JANUARY 31, 2011 |
|
|
|
|
|
|
|
|
|
|
Financial Highlights (continued) |
BlackRock Natural Resources Trust |
|
|
|
|
|
|
|
|
|
|
|
|
|
|
|
|
|
|
|
|
|
|
|
|
Investor A |
|
||||||||||||||||
|
|
|
|
|
||||||||||||||||
|
|
|
Six
Months |
|
|
|
|
|
|
|
|
|
|
|
||||||
|
|
|
|
Year Ended July 31, |
|
|||||||||||||||
|
|
|
|
|
|
|||||||||||||||
|
|
|
|
2010 |
|
2009 |
|
2008 |
|
2007 |
|
2006 |
|
|||||||
|
|
|
|
|
|
|
|
|
|
|
|
|
|
|
||||||
|
Per Share Operating Performance |
|
|
|
|
|
|
|
|
|
|
|
|
|
|
|
|
|||
|
|
|
|
|
|
|
|
|
|
|
|
|
|
|
|
|
|
|
|
|
|
Net asset value, beginning of period |
|
$ |
51.34 |
|
$ |
46.18 |
|
$ |
70.34 |
|
$ |
62.73 |
|
$ |
54.94 |
|
$ |
44.32 |
|
|
|
|
|
|
|
|
|
|
|
|
|
|
|
|
|
|
|
|
|
|
|
Net investment income (loss)1 |
|
|
(0.03 |
) |
|
0.03 |
|
|
0.10 |
|
|
(0.02 |
) |
|
0.03 |
|
|
0.03 |
|
|
Net realized and unrealized gain (loss) |
|
|
15.30 |
|
|
5.13 |
|
|
(23.47 |
) |
|
10.32 |
|
|
10.48 |
|
|
10.92 |
|
|
|
|
|
|
|
|
|
|
|
|
|
|
|
|
|
|
|
|
|
|
|
Net increase (decrease) from investment operations |
|
|
15.27 |
|
|
5.16 |
|
|
(23.37 |
) |
|
10.30 |
|
|
10.51 |
|
|
10.95 |
|
|
|
|
|
|
|
|
|
|
|
|
|
|
|
|
|
|
|
|
|
|
|
Distributions from net realized gain |
|
|
— |
|
|
— |
|
|
(0.79 |
) |
|
(2.69 |
) |
|
(2.72 |
) |
|
(0.33 |
) |
|
|
|
|
|
|
|
|
|
|
|
|
|
|
|
|
|
|
|
|
|
|
Net asset value, end of period |
|
$ |
66.61 |
|
$ |
51.34 |
|
$ |
46.18 |
|
$ |
70.34 |
|
$ |
62.73 |
|
$ |
54.94 |
|
|
|
|
|
|
|
|
|
|
|
|
|
|
|
|
|
|
|
|
|
|
|
|
|
|
|
|
|
|
|
|
|
|
|
|
|
|
|
|
|
|
|
|
|
|
|
|
|
|
|
|
|
|
|
|
|
|
|
|
|
|
|
|
|
Total Investment Return2 |
|
|
|
|
|
|
|
|
|
|
|
|
|
|
|
|
|
|
|
|
|
|
|
|
|
|
|
|
|
|
|
|
|
|
|
|
|
|
|
|
|
Based on net asset value |
|
|
29.74 |
%3 |
|
11.17 |
% |
|
(32.89 |
)% |
|
16.57 |
% |
|
20.66 |
% |
|
24.77 |
% |
|
|
|
|
|
|
|
|
|
|
|
|
|
|
|
|
|
|
|
|
|
|
|
|
|
|
|
|
|
|
|
|
|
|
|
|
|
|
|
|
|
|
|
|
|
|
|
|
|
|
|
|
|
|
|
|
|
|
|
|
|
|
|
|
Ratios to Average Net Assets |
|
|
|
|
|
|
|
|
|
|
|
|
|
|
|
|
|
|
|
|
|
|
|
|
|
|
|
|
|
|
|
|
|
|
|
|
|
|
|
|
|
Total expenses |
|
|
1.07 |
%4 |
|
1.09 |
% |
|
1.23 |
% |
|
1.06 |
% |
|
1.08 |
% |
|
1.07 |
% |
|
|
|
|
|
|
|
|
|
|
|
|
|
|
|
|
|
|
|
|
|
|
Total expenses after fees waived |
|
|
1.06 |
%4 |
|
1.08 |
% |
|
1.22 |
% |
|
1.06 |
% |
|
1.08 |
% |
|
1.07 |
% |
|
|
|
|
|
|
|
|
|
|
|
|
|
|
|
|
|
|
|
|
|
|
Net investment income (loss) |
|
|
(0.09 |
)%4 |
|
0.06 |
% |
|
0.24 |
% |
|
(0.03 |
)% |
|
0.05 |
% |
|
0.05 |
% |
|
|
|
|
|
|
|
|
|
|
|
|
|
|
|
|
|
|
|
|
|
|
|
|
|
|
|
|
|
|
|
|
|
|
|
|
|
|
|
|
|
|
|
|
|
|
|
|
|
|
|
|
|
|
|
|
|
|
|
|
|
|
|
|
Supplemental Data |
|
|
|
|
|
|
|
|
|
|
|
|
|
|
|
|
|
|
|
|
|
|
|
|
|
|
|
|
|
|
|
|
|
|
|
|
|
|
|
|
|
Net assets, end of period (000) |
|
$ |
391,264 |
|
$ |
301,813 |
|
$ |
229,126 |
|
$ |
317,892 |
|
$ |
239,916 |
|
$ |
208,789 |
|
|
|
|
|
|
|
|
|
|
|
|
|
|
|
|
|
|
|
|
|
|
|
Portfolio turnover |
|
|
1 |
% |
|
3 |
% |
|
3 |
% |
|
4 |
% |
|
6 |
% |
|
10 |
% |
|
|
|
|
|
|
|
|
|
|
|
|
|
|
|
|
|
|
|
|
|
|
|
|
|
1 |
Based on average shares outstanding. |
|
|
|
|
2 |
Where applicable, total investment returns exclude the effects of any sales charges and include the reinvestment of dividends and distributions. |
|
|
|
|
3 |
Aggregate total investment return. |
|
|
|
|
4 |
Annualized. |
|
|
|
|
|
See Notes to Financial Statements. |
|
|
|
|
||
|
SEMI-ANNUAL REPORT |
JANUARY 31, 2011 |
33 |
|
|
|
|
|
|
|
|
|
|
Financial Highlights (continued) |
BlackRock Natural Resources Trust |
|
|
|
|
|
|
|
|
|
|
|
|
|
|
|
|
|
|
|
|
|
|
|
|
Investor B |
|
||||||||||||||||
|
|
|
|
|
||||||||||||||||
|
|
|
Six
Months |
|
|
|
|
|
|
|
|
|
|
|
||||||
|
|
|
|
Year Ended July 31, |
|
|||||||||||||||
|
|
|
|
|
|
|||||||||||||||
|
|
|
|
2010 |
|
2009 |
|
2008 |
|
2007 |
|
2006 |
|
|||||||
|
|
|
|
|
|
|
|
|
|
|
|
|
|
|
||||||
|
Per Share Operating Performance |
|
|
|
|
|
|
|
|
|
|
|
|
|
|
|
|
|||
|
|
|
|
|
|
|
|
|
|
|
|
|
|
|
|
|
|
|
|
|
|
Net asset value, beginning of period |
|
$ |
47.05 |
|
$ |
42.66 |
|
$ |
65.57 |
|
$ |
59.05 |
|
$ |
52.23 |
|
$ |
42.47 |
|
|
|
|
|
|
|
|
|
|
|
|
|
|
|
|
|
|
|
|
|
|
|
Net investment loss1 |
|
|
(0.23 |
) |
|
(0.34 |
) |
|
(0.20 |
) |
|
(0.51 |
) |
|
(0.35 |
) |
|
(0.35 |
) |
|
Net realized and unrealized gain (loss) |
|
|
13.98 |
|
|
4.73 |
|
|
(21.92 |
) |
|
9.70 |
|
|
9.85 |
|
|
10.44 |
|
|
|
|
|
|
|
|
|
|
|
|
|
|
|
|
|
|
|
|
|
|
|
Net increase (decrease) from investment operations |
|
|
13.75 |
|
|
4.39 |
|
|
(22.12 |
) |
|
9.19 |
|
|
9.50 |
|
|
10.09 |
|
|
|
|
|
|
|
|
|
|
|
|
|
|
|
|
|
|
|
|
|
|
|
Distributions from net realized gain |
|
|
— |
|
|
— |
|
|
(0.79 |
) |
|
(2.67 |
) |
|
(2.68 |
) |
|
(0.33 |
) |
|
|
|
|
|
|
|
|
|
|
|
|
|
|
|
|
|
|
|
|
|
|
Net asset value, end of period |
|
$ |
60.80 |
|
$ |
47.05 |
|
$ |
42.66 |
|
$ |
65.57 |
|
$ |
59.05 |
|
$ |
52.23 |
|
|
|
|
|
|
|
|
|
|
|
|
|
|
|
|
|
|
|
|
|
|
|
|
|
|
|
|
|
|
|
|
|
|
|
|
|
|
|
|
|
|
|
|
|
|
|
|
|
|
|
|
|
|
|
|
|
|
|
|
|
|
|
|
|
Total Investment Return2 |
|
|
|
|
|
|
|
|
|
|
|
|
|
|
|
|
|
|
|
|
|
|
|
|
|
|
|
|
|
|
|
|
|
|
|
|
|
|
|
|
|
Based on net asset value |
|
|
29.22 |
%3 |
|
10.29 |
% |
|
(33.39 |
)% |
|
15.69 |
% |
|
19.74 |
% |
|
23.82 |
% |
|
|
|
|
|
|
|
|
|
|
|
|
|
|
|
|
|
|
|
|
|
|
|
|
|
|
|
|
|
|
|
|
|
|
|
|
|
|
|
|
|
|
|
|
|
|
|
|
|
|
|
|
|
|
|
|
|
|
|
|
|
|
|
|
Ratios to Average Net Assets |
|
|
|
|
|
|
|
|
|
|
|
|
|
|
|
|
|
|
|
|
|
|
|
|
|
|
|
|
|
|
|
|
|
|
|
|
|
|
|
|
|
Total expenses |
|
|
1.85 |
%4 |
|
1.88 |
% |
|
1.96 |
% |
|
1.81 |
% |
|
1.85 |
% |
|
1.84 |
% |
|
|
|
|
|
|
|
|
|
|
|
|
|
|
|
|
|
|
|
|
|
|
Total expenses after fees waived |
|
|
1.85 |
%4 |
|
1.87 |
% |
|
1.96 |
% |
|
1.81 |
% |
|
1.85 |
% |
|
1.84 |
% |
|
|
|
|
|
|
|
|
|
|
|
|
|
|
|
|
|
|
|
|
|
|
Net investment loss |
|
|
(0.86 |
)%4 |
|
(0.71 |
)% |
|
(0.50 |
)% |
|
(0.77 |
)% |
|
(0.70 |
)% |
|
(0.71 |
)% |
|
|
|
|
|
|
|
|
|
|
|
|
|
|
|
|
|
|
|
|
|
|
|
|
|
|
|
|
|
|
|
|
|
|
|
|
|
|
|
|
|
|
|
|
|
|
|
|
|
|
|
|
|
|
|
|
|
|
|
|
|
|
|
|
Supplemental Data |
|
|
|
|
|
|
|
|
|
|
|
|
|
|
|
|
|
|
|
|
|
|
|
|
|
|
|
|
|
|
|
|
|
|
|
|
|
|
|
|
|
Net assets, end of period (000) |
|
$ |
20,522 |
|
$ |
18,065 |
|
$ |
21,719 |
|
$ |
46,394 |
|
$ |
47,381 |
|
$ |
57,926 |
|
|
|
|
|
|
|
|
|
|
|
|
|
|
|
|
|
|
|
|
|
|
|
Portfolio turnover |
|
|
1 |
% |
|
3 |
% |
|
3 |
% |
|
4 |
% |
|
6 |
% |
|
10 |
% |
|
|
|
|
|
|
|
|
|
|
|
|
|
|
|
|
|
|
|
|
|
|
|
|
|
1 |
Based on average shares outstanding. |
|
|
|
|
2 |
Where applicable, total investment returns exclude the effects of any sales charges and include the reinvestment of dividends and distributions. |
|
|
|
|
3 |
Aggregate total investment return. |
|
|
|
|
4 |
Annualized. |
|
|
|
|
|
See Notes to Financial Statements. |
|
|
|
|
|
|
|
34 |
SEMI-ANNUAL REPORT |
JANUARY 31, 2011 |
|
|
|
|
|
|
|
|
|
|
Financial Highlights (concluded) |
BlackRock Natural Resources Trust |
|
|
|
|
|
|
|
|
|
|
|
|
|
|
|
|
|
|
|
|
|
|
|
|
Investor C |
|
||||||||||||||||
|
|
|
|
|
||||||||||||||||
|
|
|
Six
Months |
|
|
|
|
|
|
|
|
|
|
|
||||||
|
|
|
|
Year Ended July 31, |
|
|||||||||||||||
|
|
|
|
|
|
|||||||||||||||
|
|
|
|
2010 |
|
2009 |
|
2008 |
|
2007 |
|
2006 |
|
|||||||
|
|
|
|
|
|
|
|
|
|
|
|
|
|
|
||||||
|
Per Share Operating Performance |
|
|
|
|
|
|
|
|
|
|
|
|
|
|
|
||||
|
|
|
|
|
|
|
|
|
|
|
|
|
|
|
|
|
|
|
|
|
|
Net asset value, beginning of period |
|
$ |
46.33 |
|
$ |
42.01 |
|
$ |
64.63 |
|
$ |
58.25 |
|
$ |
51.57 |
|
$ |
41.93 |
|
|
|
|
|
|
|
|
|
|
|
|
|
|
|
|
|
|
|
|
|
|
|
Net investment loss1 |
|
|
(0.23 |
) |
|
(0.35 |
) |
|
(0.22 |
) |
|
(0.53 |
) |
|
(0.36 |
) |
|
(0.35 |
) |
|
Net realized and unrealized gain (loss) |
|
|
13.76 |
|
|
4.67 |
|
|
(21.61 |
) |
|
9.58 |
|
|
9.72 |
|
|
10.32 |
|
|
|
|
|
|
|
|
|
|
|
|
|
|
|
|
|
|
|
|
|
|
|
Net increase (decrease) from investment operations |
|
|
13.53 |
|
|
4.32 |
|
|
(21.83 |
) |
|
9.05 |
|
|
9.36 |
|
|
9.97 |
|
|
|
|
|
|
|
|
|
|
|
|
|
|
|
|
|
|
|
|
|
|
|
Distributions from net realized gain |
|
|
— |
|
|
— |
|
|
(0.79 |
) |
|
(2.67 |
) |
|
(2.68 |
) |
|
(0.33 |
) |
|
|
|
|
|
|
|
|
|
|
|
|
|
|
|
|
|
|
|
|
|
|
Net asset value, end of period |
|
$ |
59.86 |
|
$ |
46.33 |
|
$ |
42.01 |
|
$ |
64.63 |
|
$ |
58.25 |
|
$ |
51.57 |
|
|
|
|
|
|
|
|
|
|
|
|
|
|
|
|
|
|
|
|
|
|
|
|
|
|
|
|
|
|
|
|
|
|
|
|
|
|
|
|
|
|
|
|
|
|
|
|
|
|
|
|
|
|
|
|
|
|
|
|
|
|
|
|
|
Total Investment Return2 |
|
|
|
|
|
|
|
|
|
|
|
|
|
|
|
|
|
|
|
|
|
|
|
|
|
|
|
|
|
|
|
|
|
|
|
|
|
|
|
|
|
Based on net asset value |
|
|
29.20 |
%3 |
|
10.28 |
% |
|
(33.43 |
)% |
|
15.67 |
% |
|
19.72 |
% |
|
23.84 |
% |
|
|
|
|
|
|
|
|
|
|
|
|
|
|
|
|
|
|
|
|
|
|
|
|
|
|
|
|
|
|
|
|
|
|
|
|
|
|
|
|
|
|
|
|
|
|
|
|
|
|
|
|
|
|
|
|
|
|
|
|
|
|
|
|
Ratios to Average Net Assets |
|
|
|
|
|
|
|
|
|
|
|
|
|
|
|
|
|
|
|
|
|
|
|
|
|
|
|
|
|
|
|
|
|
|
|
|
|
|
|
|
|
Total expenses |
|
|
1.86 |
%4 |
|
1.91 |
% |
|
2.01 |
% |
|
1.84 |
% |
|
1.86 |
% |
|
1.84 |
% |
|
|
|
|
|
|
|
|
|
|
|
|
|
|
|
|
|
|
|
|
|
|
Total expenses after fees waived |
|
|
1.85 |
%4 |
|
1.90 |
% |
|
2.01 |
% |
|
1.84 |
% |
|
1.86 |
% |
|
1.84 |
% |
|
|
|
|
|
|
|
|
|
|
|
|
|
|
|
|
|
|
|
|
|
|
Net investment loss |
|
|
(0.88 |
)%4 |
|
(0.75 |
)% |
|
(0.55 |
)% |
|
(0.81 |
)% |
|
(0.71 |
)% |
|
(0.71 |
)% |
|
|
|
|
|
|
|
|
|
|
|
|
|
|
|
|
|
|
|
|
|
|
|
|
|
|
|
|
|
|
|
|
|
|
|
|
|
|
|
|
|
|
|
|
|
|
|
|
|
|
|
|
|
|
|
|
|
|
|
|
|
|
|
|
Supplemental Data |
|
|
|
|
|
|
|
|
|
|
|
|
|
|
|
|
|
|
|
|
|
|
|
|
|
|
|
|
|
|
|
|
|
|
|
|
|
|
|
|
|
Net assets, end of period (000) |
|
$ |
139,277 |
|
$ |
105,251 |
|
$ |
83,174 |
|
$ |
118,825 |
|
$ |
99,115 |
|
$ |
96,895 |
|
|
|
|
|
|
|
|
|
|
|
|
|
|
|
|
|
|
|
|
|
|
|
Portfolio turnover |
|
|
1 |
% |
|
3 |
% |
|
3 |
% |
|
4 |
% |
|
6 |
% |
|
10 |
% |
|
|
|
|
|
|
|
|
|
|
|
|
|
|
|
|
|
|
|
|
|
|
|
|
|
1 |
Based on average shares outstanding. |
|
|
|
|
2 |
Where applicable, total investment returns exclude the effects of any sales charges and include the reinvestment of dividends and distributions. |
|
|
|
|
3 |
Aggregate total investment return. |
|
|
|
|
4 |
Annualized. |
|
|
|
|
|
See Notes to Financial Statements. |
|
|
|
|
||
|
SEMI-ANNUAL REPORT |
JANUARY 31, 2011 |
35 |
|
|
|
|
|
|
|
|
|
|
Financial Highlights |
BlackRock Utilities and Telecommunications Fund, Inc. |
|
|
|
|
|
|
|
|
|
|
|
|
|
|
|
|
|
|
|
|
|
|
|
|
|
|
|
Institutional |
|
|||||||||||||||||||
|
|
|
|
|
|||||||||||||||||||
|
|
|
Six
Months |
|
|
|
|
|
Period |
|
|
|
|
|
|
|
|||||||
|
|
|
|
Year
Ended |
|
|
Year Ended November 30, |
|
|||||||||||||||
|
|
|
|
|
|
|
|
|
|||||||||||||||
|
|
|
|
2010 |
|
2009 |
|
|
2007 |
|
2006 |
|
2005 |
|
|||||||||
|
|
|
|
|
|
|
|
|
|
|
|
|
|
|
|
|
|||||||
|
Per Share Operating Performance |
|
|
|
|
|
|
|
|
|
|
|
|
|
|
|
|
|
|
|
|
|
|
|
|
|
|
|
|
|
|
|
|
|
|
|
|
|
|
|
|
|
|
|
|
|
|
|
Net asset value, beginning of period |
|
$ |
10.96 |
|
$ |
10.51 |
|
$ |
14.53 |
|
$ |
17.85 |
|
$ |
14.37 |
|
$ |
11.87 |
|
$ |
10.37 |
|
|
|
|
|
|
|
|
|
|
|
|
|
|
|
|
|
|
|
|
|
|
|
|
|
|
Net investment income1 |
|
|
0.14 |
|
|
0.30 |
|
|
0.28 |
|
|
0.21 |
|
|
0.25 |
|
|
0.35 |
|
|
0.26 |
|
|
Net realized and unrealized gain (loss) |
|
|
0.92 |
|
|
0.46 |
|
|
(3.54 |
) |
|
(1.84 |
) |
|
3.48 |
|
|
2.50 |
|
|
1.51 |
|
|
|
|
|
|
|
|
|
|
|
|
|
|
|
|
|
|
|
|
|
|
|
|
|
|
Net increase (decrease) from investment operations |
|
|
1.06 |
|
|
0.76 |
|
|
(3.26 |
) |
|
(1.63 |
) |
|
3.73 |
|
|
2.85 |
|
|
1.77 |
|
|
|
|
|
|
|
|
|
|
|
|
|
|
|
|
|
|
|
|
|
|
|
|
|
|
Dividends and distributions from: |
|
|
|
|
|
|
|
|
|
|
|
|
|
|
|
|
|
|
|
|
|
|
|
Net investment income |
|
|
(0.14 |
) |
|
(0.31 |
) |
|
(0.31 |
) |
|
(0.23 |
) |
|
(0.25 |
) |
|
(0.35 |
) |
|
(0.27 |
) |
|
Net realized gain |
|
|
— |
|
|
— |
|
|
(0.45 |
) |
|
(1.46 |
) |
|
— |
|
|
— |
|
|
— |
|
|
|
|
|
|
|
|
|
|
|
|
|
|
|
|
|
|
|
|
|
|
|
|
|
|
Total dividends and distributions |
|
|
(0.14 |
) |
|
(0.31 |
) |
|
(0.76 |
) |
|
(1.69 |
) |
|
(0.25 |
) |
|
(0.35 |
) |
|
(0.27 |
) |
|
|
|
|
|
|
|
|
|
|
|
|
|
|
|
|
|
|
|
|
|
|
|
|
|
Net asset value, end of period |
|
$ |
11.88 |
|
$ |
10.96 |
|
$ |
10.51 |
|
$ |
14.53 |
|
$ |
17.85 |
|
$ |
14.37 |
|
$ |
11.87 |
|
|
|
|
|
|
|
|
|
|
|
|
|
|
|
|
|
|
|
|
|
|
|
|
|
|
|
|
|
|
|
|
|
|
|
|
|
|
|
|
|
|
|
|
|
|
|
|
|
|
|
|
|
|
|
|
|
|
|
|
|
|
|
|
|
|
|
|
|
|
|
|
|
|
Total Investment Return2 |
|
|
|
|
|
|
|
|
|
|
|
|
|
|
|
|
|
|
|
|
|
|
|
|
|
|
|
|
|
|
|
|
|
|
|
|
|
|
|
|
|
|
|
|
|
|
|
Based on net asset value |
|
|
9.71 |
%3 |
|
7.20 |
% |
|
(21.93 |
)% |
|
(10.03 |
)%3 |
|
26.10 |
% |
|
24.45 |
% |
|
17.25 |
% |
|
|
|
|
|
|
|
|
|
|
|
|
|
|
|
|
|
|
|
|
|
|
|
|
|
|
|
|
|
|
|
|
|
|
|
|
|
|
|
|
|
|
|
|
|
|
|
|
|
|
|
|
|
|
|
|
|
|
|
|
|
|
|
|
|
|
|
|
|
|
|
|
|
Ratios to Average Net Assets |
|
|
|
|
|
|
|
|
|
|
|
|
|
|
|
|
|
|
|
|
|
|
|
|
|
|
|
|
|
|
|
|
|
|
|
|
|
|
|
|
|
|
|
|
|
|
|
Total expenses |
|
|
0.96 |
%4 |
|
1.07 |
% |
|
1.13 |
% |
|
0.98 |
%4 |
|
0.96 |
% |
|
0.97 |
% |
|
0.98 |
% |
|
|
|
|
|
|
|
|
|
|
|
|
|
|
|
|
|
|
|
|
|
|
|
|
|
Total expenses after fees waived and paid indirectly |
|
|
0.96 |
%4 |
|
1.07 |
% |
|
1.13 |
% |
|
0.98 |
%4 |
|
0.96 |
% |
|
0.97 |
% |
|
0.98 |
% |
|
|
|
|
|
|
|
|
|
|
|
|
|
|
|
|
|
|
|
|
|
|
|
|
|
Net investment income |
|
|
2.45 |
%4 |
|
2.83 |
% |
|
2.72 |
% |
|
1.99 |
%4 |
|
1.57 |
% |
|
2.77 |
% |
|
2.32 |
% |
|
|
|
|
|
|
|
|
|
|
|
|
|
|
|
|
|
|
|
|
|
|
|
|
|
|
|
|
|
|
|
|
|
|
|
|
|
|
|
|
|
|
|
|
|
|
|
|
|
|
|
|
|
|
|
|
|
|
|
|
|
|
|
|
|
|
|
|
|
|
|
|
|
Supplemental Data |
|
|
|
|
|
|
|
|
|
|
|
|
|
|
|
|
|
|
|
|
|
|
|
|
|
|
|
|
|
|
|
|
|
|
|
|
|
|
|
|
|
|
|
|
|
|
|
Net assets, end of period (000) |
|
$ |
11,493 |
|
$ |
14,120 |
|
$ |
15,834 |
|
$ |
24,428 |
|
$ |
29,915 |
|
$ |
27,255 |
|
$ |
25,125 |
|
|
|
|
|
|
|
|
|
|
|
|
|
|
|
|
|
|
|
|
|
|
|
|
|
|
Portfolio turnover |
|
|
1 |
% |
|
25 |
% |
|
30 |
% |
|
8 |
% |
|
31 |
% |
|
44 |
% |
|
25 |
% |
|
|
|
|
|
|
|
|
|
|
|
|
|
|
|
|
|
|
|
|
|
|
|
|
|
|
|
|
1 |
Based on average shares outstanding. |
|
|
|
|
2 |
Where applicable, total investment returns exclude the effects of any sales charges and include the reinvestment of dividends and distributions. |
|
|
|
|
3 |
Aggregate total investment return. |
|
|
|
|
4 |
Annualized. |
|
|
|
|
|
See Notes to Financial Statements. |
|
|
|
|
|
|
|
36 |
SEMI-ANNUAL REPORT |
JANUARY 31, 2011 |
|
|
|
|
|
|
|
|
|
|
Financial Highlights (continued) |
BlackRock Utilities and Telecommunications Fund, Inc. |
|
|
|
|
|
|
|
|
|
|
|
|
|
|
|
|
|
|
|
|
|
|
|
|
|
|
|
Investor A |
||||||||||||||||||||
|
|
|
|
||||||||||||||||||||
|
|
|
Six
Months |
|
|
|
Period |
|
|
|
|||||||||||||
|
|
|
|
Year
Ended |
|
|
Year Ended November 30, |
|
|||||||||||||||
|
|
|
|
|
|
|
|
|
|||||||||||||||
|
|
|
|
2010 |
|
2009 |
|
|
2007 |
|
2006 |
|
2005 |
|
|||||||||
|
|
|
|
|
|
|
|
|
|
|
|
|
|
|
|
|
|||||||
|
Per Share Operating Performance |
|
|
|
|
|
|
|
|
|
|
|
|
|
|
|
|
|
|
|
|
|
|
|
|
|
|
|
|
|
|
|
|
|
|
|
|
|
|
|
|
|
|
|
|
|
|
|
|
|
|
|
|
|
|
|
|
|
|
|
|
|
|
|
|
|
|
|
|
|
|
|
Net asset value, beginning of period |
|
$ |
10.97 |
|
$ |
10.52 |
|
$ |
14.54 |
|
$ |
17.86 |
|
$ |
14.37 |
|
$ |
11.88 |
|
$ |
10.38 |
|
|
|
|
|
|
|
|
|
|
|
|
|
|
|
|
|
|
|
|
|
|
|
|
|
|
Net investment income1 |
|
|
0.13 |
|
|
0.28 |
|
|
0.26 |
|
|
0.19 |
|
|
0.22 |
|
|
0.32 |
|
|
0.24 |
|
|
Net realized and unrealized gain (loss) |
|
|
0.92 |
|
|
0.45 |
|
|
(3.55 |
) |
|
(1.85 |
) |
|
3.48 |
|
|
2.47 |
|
|
1.51 |
|
|
|
|
|
|
|
|
|
|
|
|
|
|
|
|
|
|
|
|
|
|
|
|
|
|
Net increase (decrease) from investment operations |
|
|
1.05 |
|
|
0.73 |
|
|
(3.29 |
) |
|
(1.66 |
) |
|
3.70 |
|
|
2.79 |
|
|
1.75 |
|
|
|
|
|
|
|
|
|
|
|
|
|
|
|
|
|
|
|
|
|
|
|
|
|
|
Dividends and distributions from: |
|
|
|
|
|
|
|
|
|
|
|
|
|
|
|
|
|
|
|
|
|
|
|
Net investment income |
|
|
(0.13 |
) |
|
(0.28 |
) |
|
(0.28 |
) |
|
(0.20 |
) |
|
(0.21 |
) |
|
(0.30 |
) |
|
(0.25 |
) |
|
Net realized gain |
|
|
— |
|
|
— |
|
|
(0.45 |
) |
|
(1.46 |
) |
|
— |
|
|
— |
|
|
— |
|
|
|
|
|
|
|
|
|
|
|
|
|
|
|
|
|
|
|
|
|
|
|
|
|
|
Total dividends and distributions |
|
|
(0.13 |
) |
|
(0.28 |
) |
|
(0.73 |
) |
|
(1.66 |
) |
|
(0.21 |
) |
|
(0.30 |
) |
|
(0.25 |
) |
|
|
|
|
|
|
|
|
|
|
|
|
|
|
|
|
|
|
|
|
|
|
|
|
|
Net asset value, end of period |
|
$ |
11.89 |
|
$ |
10.97 |
|
$ |
10.52 |
|
$ |
14.54 |
|
$ |
17.86 |
|
$ |
14.37 |
|
$ |
11.88 |
|
|
|
|
|
|
|
|
|
|
|
|
|
|
|
|
|
|
|
|
|
|
|
|
|
|
|
|
|
|
|
|
|
|
|
|
|
|
|
|
|
|
|
|
|
|
|
|
|
|
|
|
|
|
|
|
|
|
|
|
|
|
|
|
|
|
|
|
|
|
|
|
|
|
Total Investment Return2 |
|
|
|
|
|
|
|
|
|
|
|
|
|
|
|
|
|
|
|
|
|
|
|
|
|
|
|
|
|
|
|
|
|
|
|
|
|
|
|
|
|
|
|
|
|
|
|
Based on net asset value |
|
|
9.57 |
%3 |
|
6.96 |
% |
|
(22.11 |
)% |
|
(10.19 |
)%3 |
|
25.90 |
% |
|
24.04 |
% |
|
16.95 |
% |
|
|
|
|
|
|
|
|
|
|
|
|
|
|
|
|
|
|
|
|
|
|
|
|
|
|
|
|
|
|
|
|
|
|
|
|
|
|
|
|
|
|
|
|
|
|
|
|
|
|
|
|
|
|
|
|
|
|
|
|
|
|
|
|
|
|
|
|
|
|
|
|
|
Ratios to Average Net Assets |
|
|
|
|
|
|
|
|
|
|
|
|
|
|
|
|
|
|
|
|
|
|
|
|
|
|
|
|
|
|
|
|
|
|
|
|
|
|
|
|
|
|
|
|
|
|
|
Total expenses |
|
|
1.20 |
%4 |
|
1.29 |
% |
|
1.36 |
% |
|
1.22 |
%4 |
|
1.20 |
% |
|
1.22 |
% |
|
1.23 |
% |
|
|
|
|
|
|
|
|
|
|
|
|
|
|
|
|
|
|
|
|
|
|
|
|
|
Total expenses after fees waived and paid indirectly |
|
|
1.20 |
%4 |
|
1.29 |
% |
|
1.36 |
% |
|
1.22 |
%4 |
|
1.20 |
% |
|
1.22 |
% |
|
1.23 |
% |
|
|
|
|
|
|
|
|
|
|
|
|
|
|
|
|
|
|
|
|
|
|
|
|
|
Net investment income |
|
|
2.18 |
%4 |
|
2.55 |
% |
|
2.51 |
% |
|
1.76 |
%4 |
|
1.33 |
% |
|
2.52 |
% |
|
2.07 |
% |
|
|
|
|
|
|
|
|
|
|
|
|
|
|
|
|
|
|
|
|
|
|
|
|
|
|
|
|
|
|
|
|
|
|
|
|
|
|
|
|
|
|
|
|
|
|
|
|
|
|
|
|
|
|
|
|
|
|
|
|
|
|
|
|
|
|
|
|
|
|
|
|
|
Supplemental Data |
|
|
|
|
|
|
|
|
|
|
|
|
|
|
|
|
|
|
|
|
|
|
|
|
|
|
|
|
|
|
|
|
|
|
|
|
|
|
|
|
|
|
|
|
|
|
|
Net assets, end of period (000) |
|
$ |
74,388 |
|
$ |
67,299 |
|
$ |
66,543 |
|
$ |
96,086 |
|
$ |
113,647 |
|
$ |
93,670 |
|
$ |
79,008 |
|
|
|
|
|
|
|
|
|
|
|
|
|
|
|
|
|
|
|
|
|
|
|
|
|
|
Portfolio turnover |
|
|
1 |
% |
|
25 |
% |
|
30 |
% |
|
8 |
% |
|
31 |
% |
|
44 |
% |
|
25 |
% |
|
|
|
|
|
|
|
|
|
|
|
|
|
|
|
|
|
|
|
|
|
|
|
|
|
|
|
|
1 |
Based on average shares outstanding. |
|
|
|
|
2 |
Where applicable, total investment returns exclude the effects of any sales charges and include the reinvestment of dividends and distributions. |
|
|
|
|
3 |
Aggregate total investment return. |
|
|
|
|
4 |
Annualized. |
|
|
|
|
|
See Notes to Financial Statements. |
|
|
|
|
|
|
|
SEMI-ANNUAL REPORT |
JANUARY 31, 2011 |
37 |
|
|
|
|
|
|
|
|
|
|
Financial Highlights (continued) |
BlackRock Utilities and Telecommunications Fund, Inc. |
|
|
|
|
|
|
|
|
|
|
|
|
|
|
|
|
|
|
|
|
|
|
|
|
Investor B |
|||||||||||||||||
|
|
|
|
|||||||||||||||||
|
|
|
Six
Months |
|
|
|
Period |
|
Year |
|
Period |
|
||||||||
|
|
|
|
|
|
|
|
|
||||||||||||
|
|
|
|
Year
Ended |
|
|
|
|
||||||||||||
|
|
|
|
|
|
|
|
|
||||||||||||
|
|
|
|
2010 |
|
2009 |
|
|
|
|
||||||||||
|
|
|
|
|
|
|
|
|
|
|
|
|
|
|
||||||
|
Per Share Operating Performance |
|
|
|
|
|
|
|
|
|
|
|
|
|
|
|
|
|
|
|
|
|
|
|
|
|
|
|
|
|
|
|
|
|
|
|
|
|
|
|
|
|
Net asset value, beginning of period |
|
$ |
10.89 |
|
$ |
10.44 |
|
$ |
14.41 |
|
$ |
17.69 |
|
$ |
14.29 |
|
$ |
13.58 |
|
|
|
|
|
|
|
|
|
|
|
|
|
|
|
|
|
|
|
|
|
|
|
Net investment income2 |
|
|
0.07 |
|
|
0.16 |
|
|
0.16 |
|
|
0.10 |
|
|
0.08 |
|
|
0.02 |
|
|
Net realized and unrealized gain (loss) |
|
|
0.91 |
|
|
0.46 |
|
|
(3.51 |
) |
|
(1.82 |
) |
|
3.45 |
|
|
0.80 |
|
|
|
|
|
|
|
|
|
|
|
|
|
|
|
|
|
|
|
|
|
|
|
Net increase (decrease) from investment operations |
|
|
0.98 |
|
|
0.62 |
|
|
(3.35 |
) |
|
(1.72 |
) |
|
3.53 |
|
|
0.82 |
|
|
|
|
|
|
|
|
|
|
|
|
|
|
|
|
|
|
|
|
|
|
|
Dividends and distributions from: |
|
|
|
|
|
|
|
|
|
|
|
|
|
|
|
|
|
|
|
|
Net investment income |
|
|
(0.07 |
) |
|
(0.17 |
) |
|
(0.17 |
) |
|
(0.10 |
) |
|
(0.13 |
) |
|
(0.11 |
) |
|
Net realized gain |
|
|
— |
|
|
— |
|
|
(0.45 |
) |
|
(1.46 |
) |
|
— |
|
|
— |
|
|
|
|
|
|
|
|
|
|
|
|
|
|
|
|
|
|
|
|
|
|
|
Total dividends and distributions |
|
|
(0.07 |
) |
|
(0.17 |
) |
|
(0.62 |
) |
|
(1.56 |
) |
|
(0.13 |
) |
|
(0.11 |
) |
|
|
|
|
|
|
|
|
|
|
|
|
|
|
|
|
|
|
|
|
|
|
Net asset value, end of period |
|
$ |
11.80 |
|
$ |
10.89 |
|
$ |
10.44 |
|
$ |
14.41 |
|
$ |
17.69 |
|
$ |
14.29 |
|
|
|
|
|
|
|
|
|
|
|
|
|
|
|
|
|
|
|
|
|
|
|
|
|
|
|
|
|
|
|
|
|
|
|
|
|
|
|
|
|
|
|
|
|
|
|
|
|
|
|
|
|
|
|
|
|
|
|
|
|
|
|
|
|
Total Investment Return3 |
|
|
|
|
|
|
|
|
|
|
|
|
|
|
|
|
|
|
|
|
|
|
|
|
|
|
|
|
|
|
|
|
|
|
|
|
|
|
|
|
|
Based on net asset value |
|
|
9.04 |
%4 |
|
5.91 |
% |
|
(22.84 |
)% |
|
(10.64 |
)%4 |
|
24.79 |
% |
|
6.05 |
%4 |
|
|
|
|
|
|
|
|
|
|
|
|
|
|
|
|
|
|
|
|
|
|
|
|
|
|
|
|
|
|
|
|
|
|
|
|
|
|
|
|
|
|
|
|
|
|
|
|
|
|
|
|
|
|
|
|
|
|
|
|
|
|
|
|
Ratios to Average Net Assets |
|
|
|
|
|
|
|
|
|
|
|
|
|
|
|
|
|
|
|
|
|
|
|
|
|
|
|
|
|
|
|
|
|
|
|
|
|
|
|
|
|
Total expenses |
|
|
2.16 |
%5 |
|
2.30 |
% |
|
2.35 |
% |
|
2.09 |
%5 |
|
2.07 |
% |
|
1.96 |
%5 |
|
|
|
|
|
|
|
|
|
|
|
|
|
|
|
|
|
|
|
|
|
|
Total expenses after fees waived and paid indirectly |
|
|
2.16 |
%5 |
|
2.30 |
% |
|
2.34 |
% |
|
2.09 |
%5 |
|
2.07 |
% |
|
1.96 |
%5 |
|
|
|
|
|
|
|
|
|
|
|
|
|
|
|
|
|
|
|
|
|
|
Net investment income |
|
|
1.24 |
%5 |
|
1.54 |
% |
|
1.53 |
% |
|
0.94 |
%5 |
|
0.51 |
% |
|
1.00 |
%5 |
|
|
|
|
|
|
|
|
|
|
|
|
|
|
|
|
|
|
|
|
|
|
|
|
|
|
|
|
|
|
|
|
|
|
|
|
|
|
|
|
|
|
|
|
|
|
|
|
|
|
|
|
|
|
|
|
|
|
|
|
|
|
|
|
Supplemental Data |
|
|
|
|
|
|
|
|
|
|
|
|
|
|
|
|
|
|
|
|
|
|
|
|
|
|
|
|
|
|
|
|
|
|
|
|
|
|
|
|
|
Net assets, end of period (000) |
|
$ |
766 |
|
$ |
745 |
|
$ |
921 |
|
$ |
1,483 |
|
$ |
1,334 |
|
$ |
238 |
|
|
|
|
|
|
|
|
|
|
|
|
|
|
|
|
|
|
|
|
|
|
|
Portfolio turnover |
|
|
1 |
% |
|
25 |
% |
|
30 |
% |
|
8 |
% |
|
31 |
% |
|
44 |
% |
|
|
|
|
|
|
|
|
|
|
|
|
|
|
|
|
|
|
|
|
|
|
|
|
|
1 |
Commencement of operations. |
|
|
|
|
2 |
Based on average shares outstanding. |
|
|
|
|
3 |
Where applicable, total investment returns exclude the effects of any sales charges and include the reinvestment of dividends and distributions. |
|
|
|
|
4 |
Aggregate total investment return. |
|
|
|
|
5 |
Annualized. |
|
|
|
|
|
See Notes to Financial Statements. |
|
|
|
|
|
|
|
38 |
SEMI-ANNUAL REPORT |
JANUARY 31, 2011 |
|
|
|
|
|
|
|
|
|
|
Financial Highlights (continued) |
BlackRock Utilities and Telecommunications Fund, Inc. |
|
|
|
|
|
|
|
|
|
|
|
|
|
|
|
|
|
|
|
|
|
|
|
|
|
|
|
Investor B1 |
|
|||||||||||||||||||
|
|
|
|
|
|||||||||||||||||||
|
|
|
Six
Months |
|
Year Ended July 31, |
|
Period |
|
Year Ended November 30, |
|
|||||||||||||
|
|
|
2011 |
|
|
|
July 31, |
|
|
|
|||||||||||||
|
|
|
(Unaudited) |
|
2010 |
|
2009 |
|
2008 |
|
2007 |
|
2006 |
|
2005 |
|
|||||||
|
|
|
|
|
|
|
|
|
|
|
|
|
|
|
|
|
|
|
|
|
|
|
|
|
Per Share Operating Performance |
|
|
|
|
|
|
|
|
|
|
|
|
|
|
|
|
|
|
|
|
|
|
|
|
|
|
|
|
|
|
|
|
|
|
|
|
|
|
|
|
|
|
|
|
|
|
|
Net asset value, beginning of period |
|
$ |
10.98 |
|
$ |
10.52 |
|
$ |
14.52 |
|
$ |
17.81 |
|
$ |
14.33 |
|
$ |
11.84 |
|
$ |
10.35 |
|
|
|
|
|
|
|
|
|
|
|
|
|
|
|
|
|
|
|
|
|
|
|
|
|
|
Net investment income1 |
|
|
0.10 |
|
|
0.21 |
|
|
0.20 |
|
|
0.12 |
|
|
0.12 |
|
|
0.26 |
|
|
0.18 |
|
|
Net realized and unrealized gain (loss) |
|
|
0.91 |
|
|
0.46 |
|
|
(3.54 |
) |
|
(1.82 |
) |
|
3.47 |
|
|
2.48 |
|
|
1.49 |
|
|
|
|
|
|
|
|
|
|
|
|
|
|
|
|
|
|
|
|
|
|
|
|
|
|
Net increase (decrease) from investment operations |
|
|
1.01 |
|
|
0.67 |
|
|
(3.34 |
) |
|
(1.70 |
) |
|
3.59 |
|
|
2.74 |
|
|
1.67 |
|
|
|
|
|
|
|
|
|
|
|
|
|
|
|
|
|
|
|
|
|
|
|
|
|
|
Dividends and distributions from: |
|
|
|
|
|
|
|
|
|
|
|
|
|
|
|
|
|
|
|
|
|
|
|
Net investment income |
|
|
(0.09 |
) |
|
(0.21 |
) |
|
(0.21 |
) |
|
(0.13 |
) |
|
(0.11 |
) |
|
(0.25 |
) |
|
(0.18 |
) |
|
Net realized gain |
|
|
— |
|
|
— |
|
|
(0.45 |
) |
|
(1.46 |
) |
|
— |
|
|
— |
|
|
— |
|
|
|
|
|
|
|
|
|
|
|
|
|
|
|
|
|
|
|
|
|
|
|
|
|
|
Total dividends and distributions |
|
|
(0.09 |
) |
|
(0.21 |
) |
|
(0.66 |
) |
|
(1.59 |
) |
|
(0.11 |
) |
|
(0.25 |
) |
|
(0.18 |
) |
|
|
|
|
|
|
|
|
|
|
|
|
|
|
|
|
|
|
|
|
|
|
|
|
|
Net asset value, end of period |
|
$ |
11.90 |
|
$ |
10.98 |
|
$ |
10.52 |
|
$ |
14.52 |
|
$ |
17.81 |
|
$ |
14.33 |
|
$ |
11.84 |
|
|
|
|
|
|
|
|
|
|
|
|
|
|
|
|
|
|
|
|
|
|
|
|
|
|
|
|
|
|
|
|
|
|
|
|
|
|
|
|
|
|
|
|
|
|
|
|
|
|
|
|
|
|
|
|
|
|
|
|
|
|
|
|
|
|
|
|
|
|
|
|
|
|
Total Investment Return2 |
|
|
|
|
|
|
|
|
|
|
|
|
|
|
|
|
|
|
|
|
|
|
|
|
|
|
|
|
|
|
|
|
|
|
|
|
|
|
|
|
|
|
|
|
|
|
|
Based on net asset value |
|
|
9.20 |
%3 |
|
6.33 |
% |
|
(22.58 |
) % |
|
(10.46 |
)%3 |
|
25.13 |
% |
|
23.43 |
% |
|
16.26 |
% |
|
|
|
|
|
|
|
|
|
|
|
|
|
|
|
|
|
|
|
|
|
|
|
|
|
|
|
|
|
|
|
|
|
|
|
|
|
|
|
|
|
|
|
|
|
|
|
|
|
|
|
|
|
|
|
|
|
|
|
|
|
|
|
|
|
|
|
|
|
|
|
|
|
Ratios to Average Net Assets |
|
|
|
|
|
|
|
|
|
|
|
|
|
|
|
|
|
|
|
|
|
|
|
|
|
|
|
|
|
|
|
|
|
|
|
|
|
|
|
|
|
|
|
|
|
|
|
Total expenses |
|
|
1.87 |
%4 |
|
1.90 |
% |
|
1.94 |
% |
|
1.77 |
%4 |
|
1.75 |
% |
|
1.75 |
% |
|
1.75 |
% |
|
|
|
|
|
|
|
|
|
|
|
|
|
|
|
|
|
|
|
|
|
|
|
|
|
Total expenses after fees waived and paid indirectly |
|
|
1.87 |
%4 |
|
1.89 |
% |
|
1.94 |
% |
|
1.77 |
%4 |
|
1.75 |
% |
|
1.75 |
% |
|
1.75 |
% |
|
|
|
|
|
|
|
|
|
|
|
|
|
|
|
|
|
|
|
|
|
|
|
|
|
|
|
|
|
|
|
|
|
|
|
|
|
|
|
|
|
|
|
|
|
|
|
|
|
Net investment income |
|
|
1.66 |
%4 |
|
1.98 |
% |
|
1.89 |
% |
|
1.17 |
%4 |
|
0.77 |
% |
|
2.02 |
% |
|
1.56 |
% |
|
|
|
|
|
|
|
|
|
|
|
|
|
|
|
|
|
|
|
|
|
|
|
|
|
|
|
|
|
|
|
|
|
|
|
|
|
|
|
|
|
|
|
|
|
|
|
|
|
|
|
|
|
|
|
|
|
|
|
|
|
|
|
|
|
|
|
|
|
|
|
|
|
Supplemental Data |
|
|
|
|
|
|
|
|
|
|
|
|
|
|
|
|
|
|
|
|
|
|
|
|
|
|
|
|
|
|
|
|
|
|
|
|
|
|
|
|
|
|
|
|
|
|
|
Net assets, end of period (000) |
|
$ |
1,090 |
|
$ |
1,802 |
|
$ |
3,676 |
|
$ |
9,460 |
|
$ |
13,921 |
|
$ |
18,347 |
|
$ |
28,298 |
|
|
|
|
|
|
|
|
|
|
|
|
|
|
|
|
|
|
|
|
|
|
|
|
|
|
Portfolio turnover |
|
|
1 |
% |
|
25 |
% |
|
30 |
% |
|
8 |
% |
|
31 |
% |
|
44 |
% |
|
25 |
% |
|
|
|
|
|
|
|
|
|
|
|
|
|
|
|
|
|
|
|
|
|
|
|
|
|
|
|
|
|
|
1 |
Based on average shares outstanding. |
|
|
|
|
|
|
2 |
Where applicable, total investment returns exclude the effects of any sales charges and include the reinvestment of dividends and distributions. |
|
|
|
|
|
|
3 |
Aggregate total investment return. |
|
|
|
|
|
|
4 |
Annualized. |
|
|
|
|
|
See Notes to Financial Statements. |
|
|
|
|
||
|
SEMI-ANNUAL REPORT |
JANUARY 31, 2011 |
39 |
|
|
|
|
|
|
|
|
|
|
Financial Highlights (continued) |
BlackRock Utilities and Telecommunications Fund, Inc. |
|
|
|
|
|
|
|
|
|
|
|
|
|
|
|
|
|
|
|
|
|
|
|
|
Investor C |
|
||||||||||||||||
|
|
|
|
|
||||||||||||||||
|
|
|
Six
Months |
|
Year
Ended |
|
Period |
|
Year |
|
Period |
|
||||||||
|
|
|
2011 |
|
|
|
July 31, |
|
November 30, |
|
November 30, |
|
||||||||
|
|
|
(Unaudited) |
|
2010 |
|
2009 |
|
2008 |
|
2007 |
|
2006 |
|
||||||
|
|
|
|
|
|
|
|
|
|
|
|
|
|
|
|
|
|
|
|
|
|
Per Share Operating Performance |
|
|
|
|
|
|
|
|
|
|
|
|
|
|
|
|
|
|
|
|
|
|
|
|
|
|
|
|
|
|
|
|
|
|
|
|
|
|
|
|
|
Net asset value, beginning of period |
|
$ |
10.69 |
|
$ |
10.28 |
|
$ |
14.23 |
|
$ |
17.50 |
|
$ |
14.15 |
|
$ |
13.44 |
|
|
|
|
|
|
|
|
|
|
|
|
|
|
|
|
|
|
|
|
|
|
|
Net investment income2 |
|
|
0.08 |
|
|
0.19 |
|
|
0.17 |
|
|
0.10 |
|
|
0.09 |
|
|
0.02 |
|
|
Net realized and unrealized gain (loss) |
|
|
0.90 |
|
|
0.43 |
|
|
(3.47 |
) |
|
(1.80 |
) |
|
3.41 |
|
|
0.80 |
|
|
|
|
|
|
|
|
|
|
|
|
|
|
|
|
|
|
|
|
|
|
|
Net increase (decrease) from investment operations |
|
|
0.98 |
|
|
0.62 |
|
|
(3.30 |
) |
|
(1.70 |
) |
|
3.50 |
|
|
0.82 |
|
|
|
|
|
|
|
|
|
|
|
|
|
|
|
|
|
|
|
|
|
|
|
Dividends and distributions from: |
|
|
|
|
|
|
|
|
|
|
|
|
|
|
|
|
|
|
|
|
Net investment income |
|
|
(0.08 |
) |
|
(0.21 |
) |
|
(0.20 |
) |
|
(0.11 |
) |
|
(0.15 |
) |
|
(0.11 |
) |
|
Net realized gain |
|
|
— |
|
|
— |
|
|
(0.45 |
) |
|
(1.46 |
) |
|
— |
|
|
— |
|
|
|
|
|
|
|
|
|
|
|
|
|
|
|
|
|
|
|
|
|
|
|
Total dividends and distributions |
|
|
(0.08 |
) |
|
(0.21 |
) |
|
(0.65 |
) |
|
(1.57 |
) |
|
(0.15 |
) |
|
(0.11 |
) |
|
|
|
|
|
|
|
|
|
|
|
|
|
|
|
|
|
|
|
|
|
|
Net asset value, end of period |
|
$ |
11.59 |
|
$ |
10.69 |
|
$ |
10.28 |
|
$ |
14.23 |
|
$ |
17.50 |
|
$ |
14.15 |
|
|
|
|
|
|
|
|
|
|
|
|
|
|
|
|
|
|
|
|
|
|
|
|
|
|
|
|
|
|
|
|
|
|
|
|
|
|
|
|
|
|
|
|
Total Investment Return3 |
|
|
|
|
|
|
|
|
|
|
|
|
|
|
|
|
|
|
|
|
|
|
|
|
|
|
|
|
|
|
|
|
|
|
|
|
|
|
|
|
|
Based on net asset value |
|
|
9.19 |
%4 |
|
6.02 |
% |
|
(22.80 |
)% |
|
(10.63 |
)%4 |
|
24.86 |
% |
|
6.11 |
%4 |
|
|
|
|
|
|
|
|
|
|
|
|
|
|
|
|
|
|
|
|
|
|
|
|
|
|
|
|
|
|
|
|
|
|
|
|
|
|
|
|
|
|
|
Ratios to Average Net Assets |
|
|
|
|
|
|
|
|
|
|
|
|
|
|
|
|
|
|
|
|
|
|
|
|
|
|
|
|
|
|
|
|
|
|
|
|
|
|
|
|
|
Total expenses |
|
|
1.99 |
%5 |
|
2.10 |
% |
|
2.25 |
% |
|
2.06 |
%5 |
|
2.01 |
% |
|
1.97 |
%5 |
|
|
|
|
|
|
|
|
|
|
|
|
|
|
|
|
|
|
|
|
|
|
Total expenses after fees waived and paid indirectly |
|
|
1.99 |
%5 |
|
2.10 |
% |
|
2.25 |
% |
|
2.06 |
%5 |
|
2.01 |
% |
|
1.97 |
%5 |
|
|
|
|
|
|
|
|
|
|
|
|
|
|
|
|
|
|
|
|
|
|
Net investment income |
|
|
1.40 |
%5 |
|
1.77 |
% |
|
1.67 |
% |
|
0.99 |
%5 |
|
0.56 |
% |
|
0.98 |
%5 |
|
|
|
|
|
|
|
|
|
|
|
|
|
|
|
|
|
|
|
|
|
|
|
|
|
|
|
|
|
|
|
|
|
|
|
|
|
|
|
|
|
|
|
Supplemental Data |
|
|
|
|
|
|
|
|
|
|
|
|
|
|
|
|
|
|
|
|
|
|
|
|
|
|
|
|
|
|
|
|
|
|
|
|
|
|
|
|
|
Net assets, end of period (000) |
|
$ |
9,415 |
|
$ |
8,961 |
|
$ |
4,502 |
|
$ |
4,494 |
|
$ |
3,617 |
|
$ |
292 |
|
|
|
|
|
|
|
|
|
|
|
|
|
|
|
|
|
|
|
|
|
|
|
Portfolio turnover |
|
|
1 |
% |
|
25 |
% |
|
30 |
% |
|
8 |
% |
|
31 |
% |
|
44 |
% |
|
|
|
|
|
|
|
|
|
|
|
|
|
|
|
|
|
|
|
|
|
|
|
|
|
|
|
1 |
Commencement of operations. |
|
|
|
|
|
|
2 |
Based on average shares outstanding. |
|
|
|
|
|
|
3 |
Where applicable, total investment returns exclude the effects of any sales charges and include the reinvestment of dividends and distributions. |
|
|
|
|
|
|
4 |
Aggregate total investment return. |
|
|
|
|
|
|
5 |
Annualized. |
|
|
|
|
|
See Notes to Financial Statements. |
|
|
|
|
|
|
|
40 |
SEMI-ANNUAL REPORT |
JANUARY 31, 2011 |
|
|
|
|
|
|
|
|
|
|
Financial Highlights (concluded) |
BlackRock Utilities and Telecommunications Fund, Inc. |
|
|
|
|
|
|
|
|
|
|
|
|
|
|
|
|
|
|
|
|
|
|
|
|
|
|
|
Investor C1 |
|
|||||||||||||||||||
|
|
|
|
|
|||||||||||||||||||
|
|
|
Six Months |
|
Year Ended July 31, |
|
Period |
|
Year Ended November 30, |
|
|||||||||||||
|
|
|
2011 |
|
|
|
July 31, |
|
|
|
|||||||||||||
|
|
|
(Unaudited) |
|
2010 |
|
2009 |
|
2008 |
|
2007 |
|
2006 |
|
2005 |
|
|||||||
|
|
|
|
|
|
|
|
|
|
|
|
|
|
|
|
|
|
|
|
|
|
|
|
|
Per Share Operating Performance |
|
|
|
|
|
|
|
|
|
|
|
|
|
|
|
|
|
|
|
|
|
|
|
|
|
|
|
|
|
|
|
|
|
|
|
|
|
|
|
|
|
|
|
|
|
|
|
Net asset value, beginning of period |
|
$ |
10.80 |
|
$ |
10.37 |
|
$ |
14.34 |
|
$ |
17.61 |
|
$ |
14.18 |
|
$ |
11.73 |
|
$ |
10.25 |
|
|
|
|
|
|
|
|
|
|
|
|
|
|
|
|
|
|
|
|
|
|
|
|
|
|
Net investment income1 |
|
|
0.09 |
|
|
0.20 |
|
|
0.19 |
|
|
0.12 |
|
|
0.12 |
|
|
0.25 |
|
|
0.17 |
|
|
Net realized and unrealized gain (loss) |
|
|
0.91 |
|
|
0.44 |
|
|
(3.50 |
) |
|
(1.81 |
) |
|
3.43 |
|
|
2.45 |
|
|
1.50 |
|
|
|
|
|
|
|
|
|
|
|
|
|
|
|
|
|
|
|
|
|
|
|
|
|
|
Net increase (decrease) from investment operations |
|
|
1.00 |
|
|
0.64 |
|
|
( 3.31 |
) |
|
(1.69 |
) |
|
3.55 |
|
|
2.70 |
|
|
1.67 |
|
|
|
|
|
|
|
|
|
|
|
|
|
|
|
|
|
|
|
|
|
|
|
|
|
|
Dividends and distributions from: |
|
|
|
|
|
|
|
|
|
|
|
|
|
|
|
|
|
|
|
|
|
|
|
Net investment income |
|
|
(0.09 |
) |
|
(0.21 |
) |
|
(0.21 |
) |
|
(0.12 |
) |
|
(0.12 |
) |
|
(0.25 |
) |
|
(0.19 |
) |
|
Net realized gain |
|
|
— |
|
|
— |
|
|
(0.45 |
) |
|
(1.46 |
) |
|
— |
|
|
— |
|
|
— |
|
|
|
|
|
|
|
|
|
|
|
|
|
|
|
|
|
|
|
|
|
|
|
|
|
|
Total dividends and distributions |
|
|
(0.09 |
) |
|
(0.21 |
) |
|
(0.66 |
) |
|
(1.58 |
) |
|
(0.12 |
) |
|
(0.25 |
) |
|
(0.19 |
) |
|
|
|
|
|
|
|
|
|
|
|
|
|
|
|
|
|
|
|
|
|
|
|
|
|
Net asset value, end of period |
|
$ |
11.71 |
|
$ |
10.80 |
|
$ |
10.37 |
|
$ |
14.34 |
|
$ |
17.61 |
|
$ |
14.18 |
|
$ |
11.73 |
|
|
|
|
|
|
|
|
|
|
|
|
|
|
|
|
|
|
|
|
|
|
|
|
|
|
|
|
|
|
|
|
|
|
|
|
|
|
|
|
|
|
|
|
|
|
|
|
|
|
|
|
|
|
|
|
|
|
|
|
|
|
|
|
|
|
|
|
|
|
|
|
|
|
Total Investment Return2 |
|
|
|
|
|
|
|
|
|
|
|
|
|
|
|
|
|
|
|
|
|
|
|
|
|
|
|
|
|
|
|
|
|
|
|
|
|
|
|
|
|
|
|
|
|
|
|
Based on net asset value |
|
|
9.27 |
%3 |
|
6.17 |
% |
|
(22.62 |
)% |
|
(10.48 |
)%3 |
|
25.11 |
% |
|
23.30 |
% |
|
16.34 |
% |
|
|
|
|
|
|
|
|
|
|
|
|
|
|
|
|
|
|
|
|
|
|
|
|
|
|
|
|
|
|
|
|
|
|
|
|
|
|
|
|
|
|
|
|
|
|
|
|
|
|
|
|
|
|
|
|
|
|
|
|
|
|
|
|
|
|
|
|
|
|
|
|
|
Ratios to Average Net Assets |
|
|
|
|
|
|
|
|
|
|
|
|
|
|
|
|
|
|
|
|
|
|
|
|
|
|
|
|
|
|
|
|
|
|
|
|
|
|
|
|
|
|
|
|
|
|
|
Total expenses |
|
|
1.87 |
%4 |
|
1.95 |
% |
|
2.02 |
% |
|
1.83 |
%4 |
|
1.79 |
% |
|
1.79 |
% |
|
1.80 |
% |
|
|
|
|
|
|
|
|
|
|
|
|
|
|
|
|
|
|
|
|
|
|
|
|
|
Total expenses after fees waived and paid indirectly |
|
|
1.86 |
%4 |
|
1.95 |
% |
|
2.01 |
% |
|
1.83 |
%4 |
|
1.79 |
% |
|
1.79 |
% |
|
1.80 |
% |
|
|
|
|
|
|
|
|
|
|
|
|
|
|
|
|
|
|
|
|
|
|
|
|
|
Net investment income |
|
|
1.52 |
%4 |
|
1.89 |
% |
|
1.84 |
% |
|
1.14 |
%4 |
|
0.74 |
% |
|
1.94 |
% |
|
1.49 |
% |
|
|
|
|
|
|
|
|
|
|
|
|
|
|
|
|
|
|
|
|
|
|
|
|
|
|
|
|
|
|
|
|
|
|
|
|
|
|
|
|
|
|
|
|
|
|
|
|
|
|
|
|
|
|
|
|
|
|
|
|
|
|
|
|
|
|
|
|
|
|
|
|
|
Supplemental Data |
|
|
|
|
|
|
|
|
|
|
|
|
|
|
|
|
|
|
|
|
|
|
|
|
|
|
|
|
|
|
|
|
|
|
|
|
|
|
|
|
|
|
|
|
|
|
|
Net assets, end of period (000) |
|
$ |
7,426 |
|
$ |
7,493 |
|
$ |
8,098 |
|
$ |
13,041 |
|
$ |
16,754 |
|
$ |
16,527 |
|
$ |
14,789 |
|
|
|
|
|
|
|
|
|
|
|
|
|
|
|
|
|
|
|
|
|
|
|
|
|
|
Portfolio turnover |
|
|
1 |
% |
|
25 |
% |
|
30 |
% |
|
8 |
% |
|
31 |
% |
|
44 |
% |
|
25 |
% |
|
|
|
|
|
|
|
|
|
|
|
|
|
|
|
|
|
|
|
|
|
|
|
|
|
|
|
|
|
|
1 |
Based on average shares outstanding. |
|
|
|
|
|
|
2 |
Where applicable, total investment returns exclude the effects of any sales charges and include the reinvestment of dividends and distributions. |
|
|
|
|
|
|
3 |
Aggregate total investment return. |
|
|
|
|
|
|
4 |
Annualized. |
|
|
|
|
|
See Notes to Financial Statements. |
|
|
|
|
||
|
SEMI-ANNUAL REPORT |
JANUARY 31, 2011 |
41 |
|
|
|
|
|
|
1. Organization and Significant Accounting Policies:
BlackRock Equity Dividend Fund (“Equity Dividend”), BlackRock Natural Resources Trust (“Natural Resources”) and BlackRock Utilities and Telecommunications Fund, Inc. (“Utilities and Telecommunications”) (collectively referred to as the “Funds” or individually as a “Fund”) are registered under the Investment Company Act of 1940, as amended (the “1940 Act”). Equity Dividend and Utilities and Telecommunications are registered as diversified, open-end management investment companies. Natural Resources is registered as a non-diversified, open-end management investment company. Equity Dividend and Natural Resources are organized as Massachusetts business trusts and Utilities and Telecommunications is organized as a Maryland corporation. The Funds’ financial statements are prepared in conformity with accounting principles generally accepted in the United States of America (“US GAAP”), which may require management to make estimates and assumptions that affect the reported amounts and disclosures in the financial statements. Actual results could differ from those estimates. The Board of Directors and the Boards of Trustees of the Funds are referred to throughout this report as the “Board of Directors” or the “Board.” Each Fund offers multiple classes of shares. Institutional and Service Shares are sold without a sales charge and only to certain eligible investors. Investor A Shares are generally sold with a front-end sales charge. Investor B, Investor B1, Investor C and Investor C1 Shares may be subject to a contingent deferred sales charge. Class R Shares are sold without a sales charge and only to certain retirement and other similar plans. All classes of shares have identical voting, dividend, liquidation and other rights and the same terms and conditions, except that Service, Investor A, Investor B, Investor B1, Investor C, Investor C1 and Class R Shares bear certain expenses related to the shareholder servicing of such shares, and Investor B, Investor B1, Investor C, Investor C1 and Class R Shares also bear certain expenses related to the distribution of such shares. Investor B and Investor B1 Shares automatically convert to Investor A Shares after approximately eight years. Investor B, Investor B1 and Investor C1 Shares are only available through exchanges, dividend reinvestment by existing shareholders or for purchase by certain qualified employee benefit plans. Each class has exclusive voting rights with respect to matters relating to its shareholder servicing and distribution expenditures (except that Investor B and Investor B1 shareholders may vote on material changes to the Investor A distribution plan).
The following is a summary of significant accounting policies followed by the Funds:
Valuation: The Funds fair value their financial instruments at market value using independent dealers or pricing services under policies approved by the Board. Equity investments traded on a recognized securities exchange or the NASDAQ Global Market System (“NASDAQ”) are valued at the last reported sale price that day or the NASDAQ official closing price, if applicable. For equity investments traded on more than one exchange, the last reported sale price on the exchange where the stock is primarily traded is used. Equity investments traded on a recognized exchange for which there were no sales on that day are valued at the last available bid price. If no bid price is available, the prior day’s price will be used, unless it is determined that such prior day’s price no longer reflects the fair value of the security. Financial futures contracts traded on exchanges are valued at their last sale price. Investments in open-end registered investment companies are valued at net asset value each business day. Short-term securities with remaining maturities of 60 days or less may be valued at amortized cost, which approximates fair value.
Certain Funds value their investments in BlackRock Liquidity Series, LLC Money Market Series (the “Money Market Series”) at fair value, which is ordinarily based upon their pro rata ownership in the net assets of the underlying fund. The Money Market Series seeks current income consistent with maintaining liquidity and preserving capital. Although the Money Market Series is not registered under the 1940 Act, its investments will follow the parameters of investments by a money market fund that is subject to Rule 2a-7 promulgated by the Securities and Exchange Commission (“SEC”) under the 1940 Act. The Funds may withdraw up to 25% of their investment daily, although the manager of the Money Market Series, in its sole discretion, may permit an investor to withdraw more than 25% on any one day.
Securities and other assets and liabilities denominated in foreign currencies are translated into US dollars using exchange rates determined as of the close of business on the New York Stock Exchange (“NYSE”). Foreign currency exchange contracts are valued at the mean between the bid and ask prices and are determined as of the close of business on the NYSE. Interpolated values are derived when the settlement date of the contract is an interim date for which quotations are not available.
In the event that application of these methods of valuation results in a price for an investment which is deemed not to be representative of the market value of such investment or is not available, the investment will be valued in accordance with a policy approved by the Board as reflecting fair value (“Fair Value Assets”). When determining the price for Fair Value Assets, the investment advisor and/or the sub-advisor seeks to determine the price that each Fund might reasonably expect to receive from the current sale of that asset in an arm’s-length transaction. Fair value determinations shall be based upon all available factors that the investment advisor and/or sub-advisor deems relevant. The pricing of all Fair Value Assets is subsequently reported to the Board or a committee thereof.
|
|
|
|
|
|
|
|
|
42 |
SEMI-ANNUAL REPORT |
JANUARY 31, 2011 |
|
|
|
|
|
|
|
Notes to Financial Statements (continued) |
Generally, trading in foreign instruments is substantially completed each day at various times prior to the close of business on the NYSE. Occasionally, events affecting the values of such instruments may occur between the foreign market close and the close of business on the NYSE that may not be reflected in the computation of each Fund’s net assets. If events (for example, a company announcement, market volatility or a natural disaster) occur during such periods that are expected to materially affect the value of such instruments, those instruments may be Fair Value Assets and be valued at their fair value, as determined in good faith by the investment advisor using a pricing service and/or policies approved by the Board. Each business day, the Funds use a pricing service to assist with the valuation of certain foreign exchange-traded equity securities and foreign exchange-traded and over-the-counter (“OTC”) options (the “Systematic Fair Value Price”). Using current market factors, the Systematic Fair Value Price is designed to value such foreign securities and foreign options at fair value as of the close of business on the NYSE, which follows the close of the local markets.
Foreign Currency Transactions: The Funds’ books and records are maintained in US dollars. Purchases and sales of investment securities are recorded at the rates of exchange prevailing on the date the transactions are entered into. Generally, when the US dollar rises in value against a foreign currency, the Funds’ investments denominated in that currency will lose value because its currency is worth fewer US dollars; the opposite effect occurs if the US dollar falls in relative value.
The Funds report foreign currency related transactions as components of realized gain (loss) for financial reporting purposes, whereas such components are treated as ordinary income for federal income tax purposes.
Preferred Stock: The Funds may invest in preferred stocks. Preferred stock has a preference over common stock in liquidation (and generally in receiving dividends as well) but is subordinated to the liabilities of the issuer in all respects. As a general rule, the market value of preferred stock with a fixed dividend rate and no conversion element varies inversely with interest rates and perceived credit risk, while the market price of convertible preferred stock generally also reflects some element of conversion value. Because preferred stock is junior to debt securities and other obligations of the issuer, deterioration in the credit quality of the issuer will cause greater changes in the value of a preferred stock than in a more senior debt security with similar stated yield characteristics. Unlike interest payments on debt securities, preferred stock dividends are payable only if declared by the issuer’s board of directors. Preferred stock also may be subject to optional or mandatory redemption provisions.
Segregation and Collateralization: In cases in which the 1940 Act and the interpretive positions of the SEC require that the Funds either deliver collateral or segregate assets in connection with certain investments (e.g., financial futures contracts), the Funds will, consistent with SEC rules and/or certain interpretive letters issued by the SEC, segregate collateral or designate on their books and records cash or other liquid securities having a market value at least equal to the amount that would otherwise be required to be physically segregated. Furthermore, based on requirements and agreements with certain exchanges and third party broker-dealers, each party has requirements to deliver/deposit securities as collateral for certain investments.
Investment Transactions and Investment Income: For financial reporting purposes, investment transactions are recorded on the dates the transactions are entered into (the trade dates). Realized gains and losses on investment transactions are determined on the identified cost basis. Dividend income is recorded on the ex-dividend dates. Dividends from foreign securities where the ex-dividend date may have passed are subsequently recorded when the Funds have determined the ex-dividend date. Under the applicable foreign tax laws, a withholding tax at various rates may be imposed on capital gains, dividends and interest. Upon notification from issuers, some of the dividend income received from a real estate investment trust may be redesignated as a reduction of cost of the related investment and/or realized gain. Interest income, including amortization and accretion of premiums and discounts on debt securities, is recognized on the accrual basis. Income and realized and unrealized gains and losses are allocated daily to each class based on its relative net assets.
Dividends and Distributions: Dividends and distributions paid by the Funds are recorded on the ex-dividend dates. If the total dividends and distributions made in any tax year exceeds net investment income and accumulated realized capital gains, a portion of the total distribution may be treated as a tax return of capital. The amount and timing of dividends and distributions are determined in accordance with federal income tax regulations, which may differ from US GAAP.
Securities Lending: The Funds may lend securities to financial institutions that provide cash as collateral, which will be maintained at all times in an amount equal to at least 100% of the current market value of the loaned securities. The market value of the loaned securities is determined at the close of business of the Funds and any additional required collateral is delivered to the Funds on the next business day. Securities lending income, as disclosed in the Statements of Operations, represents the income earned from the investment of the cash collateral, net of rebates paid to, or fees paid by, borrowers and less the fees paid to the securities lending agent. During the term of the loan, the Funds earn dividends and
|
|
|
|
|
|
|
|
|
SEMI-ANNUAL REPORT |
JANUARY 31, 2011 |
43 |
|
|
|
|
|
|
|
Notes to Financial Statements (continued) |
interest on the securities loaned. Loans of securities are terminable at any time and the borrower, after notice, is required to return borrowed securities within the standard time period for settlement of securities transactions. In the event that the borrower defaults on its obligation to return borrowed securities because of insolvency or for any other reason, the Funds could experience delays and costs in gaining access to the collateral. The Funds also could suffer a loss if the value of an investment purchased with cash collateral falls below the market value of loaned securities or if the value of an investment purchased with cash collateral falls below the value of the original cash collateral received.
Income Taxes: It is each Fund’s policy to comply with the requirements of the Internal Revenue Code of 1986, as amended, applicable to regulated investment companies and to distribute substantially all of its taxable income to its shareholders. Therefore, no federal income tax provision is required.
Each Fund files US federal and various state and local tax returns. No income tax returns are currently under examination. The statute of limitations on the Funds’ US federal tax returns remains open for each of the four periods ended as follows:
|
|
|
|
|
|
|
|
|
|
|
|
|
|
|
|
|
|
|
|
|
|||
|
|
|
Four
Years |
|
Three
Periods |
|
One
Year |
|
|||
|
|
|
|
|
|
|
|
|
|||
|
Equity Dividend |
|
|
July 31, 2010 |
|
|
— |
|
|
— |
|
|
Natural Resources |
|
|
July 31, 2010 |
|
|
— |
|
|
— |
|
|
Utilities and Telecommunications |
|
|
— |
|
|
July 31, 2010 |
|
|
November 30, 2007 |
|
|
|
|
|
|
|
|
|
|
|
|
|
The statutes of limitations on each Fund’s state and local tax returns may remain open for an additional year depending upon the jurisdiction. Management does not believe there are any uncertain tax positions that require recognition of a tax liability.
Other: Expenses directly related to a Fund or its classes are charged to that Fund or class. Other operating expenses shared by several funds are pro rated among those funds on the basis of relative net assets or other appropriate methods. Other expenses of the Fund are allocated daily to each class based on its relative net assets. The Funds have an arrangement with the custodians whereby fees may be reduced by credits earned on uninvested cash balances, which if applicable are shown as fees paid indirectly in the Statements of Operations. The custodians impose fees on overdrawn cash balances, which can be offset by accumulated credits earned or may result in additional custody charges.
2. Derivative Financial Instruments:
The Funds engage in various portfolio investment strategies using derivative contracts both to increase the returns of the Funds and to economically hedge, or protect, their exposure to certain risks such as equity risk and foreign currency exchange rate risk. These contracts may be transacted on an exchange or OTC.
Losses may arise if the value of the contract decreases due to an unfavorable change in the market rates or values of the underlying instrument or if the counterparty does not perform under the contract. The Funds’ maximum risk of loss from counterparty credit risk on OTC derivatives is generally the aggregate unrealized gain netted against any collateral pledged by/posted to the counterparty. For OTC options purchased, the Funds bear the risk of loss in the amount of the premiums paid plus the positive change in market values net of any collateral received on the options should the counterparty fail to perform under the contracts. Options written by the Funds do not give rise to counterparty credit risk, as options written obligate the Funds to perform and not the counterparty. Counter-party risk related to exchange-traded financial futures contracts is deemed to be minimal due to the protection against defaults provided by the exchange on which these contracts trade.
The Funds may mitigate counterparty risk by procuring collateral and through netting provisions included within an International Swaps and Derivatives Association, Inc. (“ISDA”) Master Agreement implemented between a Fund and each of its respective counterparties. The ISDA Master Agreement allows each Fund to offset with each separate counterparty certain derivative financial instrument’s payables and/or receivables with collateral held. The amount of collateral moved to/from applicable coun-terparties is generally based upon minimum transfer amounts of up to $500,000. To the extent amounts due to the Funds from their counterpar-ties are not fully collateralized contractually or otherwise, the Funds bear the risk of loss from counterparty non-performance. See Note 1 “Segregation and Collateralization” for information with respect to collateral practices. In addition, the Funds manage counterparty risk by entering into agreements only with counterparties that it believes have the financial resources to honor their obligations and by monitoring the financial stability of those counterparties.
Certain ISDA Master Agreements allow counterparties to OTC derivatives to terminate derivative contracts prior to maturity in the event the Funds’ net assets decline by a stated percentage or the Funds fail to meet the terms of its ISDA Master Agreements, which would cause the Funds to accelerate payment of any net liability owed to the counterparty.
|
|
|
|
|
|
|
|
|
44 |
SEMI-ANNUAL REPORT |
JANUARY 31, 2011 |
|
|
|
|
|
|
|
Notes to Financial Statements (continued) |
Financial Futures Contracts: The Funds purchase or sell financial futures contracts and options on financial futures contracts to gain exposure to, or economically hedge against, changes in the value of equity securities (equity risk). Financial futures contracts are agreements between the Funds and counterparty to buy or sell a specific quantity of an underlying instrument at a specified price and at a specified date. Depending on the terms of the particular contract, futures contracts are settled either through physical delivery of the underlying instrument on the settlement date or by payment of a cash settlement amount on settlement date. Pursuant to the contract, the Funds agree to receive from or pay to the broker an amount of cash equal to the daily fluctuation in value of the contract. Such receipts or payments are known as margin variation and are recorded by the Funds as unrealized gains or losses. When the contract is closed, the Funds record a realized gain or loss equal to the difference between the value of the contract at the time it was opened and the value at the time it was closed. The use of financial futures transactions involves the risk of an imperfect correlation in the movements in the price of financial futures contracts, interest rates and the underlying assets.
Foreign Currency Exchange Contracts: The Funds enter into foreign currency exchange contracts as an economic hedge against either specific transactions or portfolio instruments or to obtain exposure to foreign currencies (foreign currency exchange rate risk). A foreign currency exchange contract is an agreement between two parties to buy and sell a currency at a set exchange rate on a future date. Foreign currency exchange contracts, when used by the Funds, help to manage the overall exposure to the currency backing some of the investments held by the Funds. The contract is marked-to-market daily and the change in market value is recorded by the Funds as an unrealized gain or loss. When the contract is closed, the Funds record a realized gain or loss equal to the difference between the value at the time it was opened and the value at the time it was closed. The use of foreign currency exchange contracts involves the risk that the value of a foreign currency exchange contract changes unfavorably due to movements in the value of the referenced foreign currencies and the risk that a counterparty to the contract does not perform its obligations under the agreement.
|
|
|
|
|
|
|
|
|
|
Derivative Instruments Categorized by Risk Exposure: |
|
|
|
||||
|
|
|
|
|
||||
|
Fair Values of Derivative Instruments as of January 31, 2011 |
|||||||
|
|
|
|
|
||||
|
|
|
Asset Derivatives |
|
||||
|
|
|
|
|
|
|
||
|
|
|
|
|
Equity Dividend |
|
||
|
|
|
|
|
|
|
||
|
|
|
Statements
of Assets and |
|
Value |
|
||
|
|
|
|
|
|
|
||
|
Equity contracts |
|
|
Net unrealized appreciation/depreciation* |
|
$ |
13,993,095 |
|
|
|
|
|
|
|
|
|
|
|
|
|
|
* |
Includes cumulative unrealized appreciation/depreciation of financial futures contracts as reported in the Schedules of Investments. Only current day’s margin variation is reported within the Statements of Assets and Liabilities. |
|
|
|
|
|
|
|
|
|
|
|
|
|
|
||||||||||
|
The
Effect of Derivative Instruments in the Statements of Operations |
||||||||||
|
|
||||||||||
|
|
|
Net Realized Gain (Loss) from |
|
|||||||
|
|
|
|
|
|||||||
|
|
|
Equity |
|
Natural |
|
Utilities
and |
|
|||
|
|
|
|
|
|
|
|
|
|||
|
Foreign currency |
|
|
|
|
|
|
|
|
|
|
|
exchange contracts: |
|
|
|
|
|
|
|
|
|
|
|
Foreign currency transactions |
|
$ |
(423,773 |
) |
$ |
(9,351 |
) |
$ |
12,254 |
|
|
Equity contracts: |
|
|
|
|
|
|
|
|
|
|
|
Financial futures contracts |
|
|
34,692,872 |
|
|
— |
|
|
— |
|
|
|
|
|
|
|
|
|
|
|
|
|
|
Total |
|
$ |
34,269,099 |
|
$ |
(9,351 |
) |
$ |
12,254 |
|
|
|
|
|
|
|
|
|
|
|
|
|
|
|
|
|
|
|
|
|
|
|
|
|
|
|
||||
|
|
|
Net
Change in Unrealized |
|
||||
|
|
|
|
|
||||
|
|
|
Equity |
|
Natural |
|
||
|
|
|
|
|
|
|
||
|
Foreign currency exchange contracts: |
|
|
|
|
|
|
|
|
Foreign currency transactions |
|
$ |
(65,455 |
) |
$ |
(2,107 |
) |
|
Equity contracts: |
|
|
|
|
|
|
|
|
Financial futures contracts |
|
|
7,549,713 |
|
|
— |
|
|
|
|
|
|
|
|
|
|
|
Total |
|
$ |
7,484,258 |
|
$ |
(2,107 |
) |
|
|
|
|
|
|
|
|
|
|
|
|
|
|
|
|
|
|
SEMI-ANNUAL REPORT |
JANUARY 31, 2011 |
45 |
|
|
|
|
|
|
|
Notes to Financial Statements (continued) |
For the six months ended January 31, 2011, the average quarterly balances of outstanding derivative financial instruments were as follows:
|
|
|
|
|
|
|
|
|
|
|
|
|
|
|
|
|
|
|
|
|
|||
|
|
|
Equity |
|
Natural |
|
Utilities
and |
|
|||
|
|
|
|
|
|
|
|
|
|
|
|
|
Financial futures contracts: |
|
|
|
|
|
|
|
|
|
|
|
Average number of contracts purchased |
|
|
1,325 |
|
|
— |
|
|
— |
|
|
Average notional value of contracts purchased |
|
$ |
395,619,984 |
|
|
— |
|
|
— |
|
|
Foreign currency exchange contracts: |
|
|
|
|
|
|
|
|
|
|
|
Average number of contracts — US dollars purchased |
|
|
1 |
|
|
— |
|
|
1 |
|
|
Average number of contracts — US dollars sold |
|
|
3 |
|
|
22 |
|
|
— |
|
|
Average US dollar amounts purchased |
|
|
— |
|
|
— |
|
$ |
125,928 |
|
|
Average US dollar amounts sold |
|
$ |
1,454,369 |
|
$ |
1,161,985 |
|
|
— |
|
|
|
|
|
|
|
|
|
|
|
|
|
3. Investment Advisory Agreement and Other Transactions with Affiliates:
The PNC Financial Services Group, Inc. (“PNC”), Bank of America Corporation (“BAC”) and Barclays Bank PLC (“Barclays”) are the largest stockholders of BlackRock, Inc. (“BlackRock”). Due to the ownership structure, PNC is an affiliate of the Funds for 1940 Act purposes, but BAC and Barclays are not.
Each Fund entered into an Investment Advisory Agreement with BlackRock Advisors, LLC (the “Manager”), the Funds’ investment advisor, an indirect, wholly owned subsidiary of BlackRock, to provide investment advisory and administration services. The Manager is responsible for the management of each Fund’s portfolio and provides the necessary personnel, facilities, equipment and certain other services necessary to the operations of each Fund. For such services, each Fund pays the Manager a monthly fee at an annual rate of 0.60% of each Fund’s average daily net assets.
For Equity Dividend, the Manager voluntarily agreed to waive and/or reimburse fees and expenses (excluding interest expense, dividend expense, acquired fund fees and expenses and certain other expenses) in order to limit expenses to 0.90% for Institutional Shares, 1.15% for Service and Investor A Shares, 1.90% for Investor B Shares and Investor C Shares and 1.40% for Class R Shares of average daily net assets. The Manager may reduce or discontinue this arrangement at any time without notice.
The Manager voluntarily agreed to waive its investment advisory fees by the amount of investment advisory fees each Fund pays to the Manager indirectly through each Fund’s investment in affiliated money market funds, however the Manager does not waive its investment advisory fees by the amount of investment advisory fees paid through each Fund’s investment in other affiliated investment companies, if any. These amounts are shown as fees waived by advisor in the Statements of Operations. For the six months ended January 31, 2011, the amounts waived were as follows:
|
|
|
|
|
|
|
|
|
|
|
|
|
Equity Dividend |
|
$ |
229,881 |
|
|
Natural Resources |
|
$ |
15,904 |
|
|
Utilities and Telecommunications |
|
$ |
1,252 |
|
|
|
|
|
|
|
The Manager entered into a sub-advisory agreement with BlackRock Investment Management, LLC (“BIM”), an affiliate of the Manager. The Manager pays BIM for services it provides, a monthly fee that is a percentage of the investment advisory fees paid by each Fund to the Manager.
For the six months ended January 31, 2011, each Fund reimbursed the Manager for certain accounting services, which are included in accounting services in the Statements of Operations. The reimbursements were as follows:
|
|
|
|
|
|
|
|
|
|
|
|
|
Equity Dividend |
|
$ |
74,902 |
|
|
Natural Resources |
|
$ |
4,840 |
|
|
Utilities and Telecommunications |
|
$ |
1,014 |
|
|
|
|
|
|
|
The Funds entered into a Distribution Agreement and Distribution and Service Plan with BlackRock Investments, LLC (“BRIL”), an affiliate of BlackRock. Pursuant to the Distribution and Service Plan and in accordance with Rule 12b-1 under the 1940 Act, each Fund pays BRIL ongoing service and distribution fees. The fees are accrued daily and paid monthly at annual rates based upon the average daily net assets of the shares of Funds, as follows:
|
|
|
|
|
|
|
|
|
|
|
|
|
|
|
|
|
|||||||
|
|
|
Service Fees |
|
|||||||
|
|
|
|
|
|||||||
|
|
|
Equity |
|
Natural |
|
Utilities
and |
|
|||
|
|
|
|
|
|||||||
|
Service |
|
|
0.25 |
% |
|
— |
|
|
— |
|
|
Investor A |
|
|
0.25 |
% |
|
0.25 |
% |
|
0.25 |
% |
|
Investor B |
|
|
0.25 |
% |
|
0.25 |
% |
|
0.25 |
% |
|
Investor B1 |
|
|
— |
|
|
— |
|
|
0.25 |
% |
|
Investor C |
|
|
0.25 |
% |
|
0.25 |
% |
|
0.25 |
% |
|
Investor C1 |
|
|
— |
|
|
— |
|
|
0.25 |
% |
|
Class R |
|
|
0.25 |
% |
|
— |
|
|
— |
|
|
|
|
|
|
|
|
|
|
|
|
|
|
|
|
|
|
|
|
|
|
46 |
SEMI-ANNUAL REPORT |
JANUARY 31, 2011 |
|
|
|
|
|
|
|
Notes to Financial Statements (continued) |
|
|
|
|
|
|
|
|
|
|
|
|
|
|
|
|
|
|
|
|
|
|
|
|
|
|
|
Distribution Fees |
|
|||||||
|
|
|
|
|
|
|
|
|
|
|
|
|
|
|
Equity |
|
Natural |
|
Utilities and |
|
|||
|
|
|
|
|
|
|
|
|
|||
|
Investor B |
|
|
0.75 |
% |
|
0.75 |
% |
|
0.75 |
% |
|
Investor B1 |
|
|
— |
|
|
— |
|
|
0.50 |
% |
|
Investor C |
|
|
0.75 |
% |
|
0.75 |
% |
|
0.75 |
% |
|
Investor C1 |
|
|
— |
|
|
— |
|
|
0.55 |
% |
|
Class R |
|
|
0.25 |
% |
|
— |
|
|
— |
|
|
|
|
|
|
|
|
|
|
|
|
|
Pursuant to sub-agreements with BRIL, broker-dealers and BRIL provide shareholder servicing and distribution services to each Fund. The ongoing service and/or distribution fee compensates BRIL and each broker-dealer for providing shareholder servicing and/or distribution related services to Service, Investor A, Investor B, Investor B1, Investor C, Investor C1 and Class R shareholders.
For the six months ended January 31, 2011, affiliates earned underwriting discounts, direct commissions and dealer concessions on sales of the Funds’ Investor A Shares as follows:
|
|
|
|
|
|
|
|
|
|
|
|
|
Equity Dividend |
|
$ |
313,239 |
|
|
Natural Resources |
|
$ |
17,517 |
|
|
Utilities and Telecommunications |
|
$ |
2,506 |
|
|
|
|
|
|
|
For the six months ended January 31, 2011, affiliates received the following contingent deferred sales charges relating to transactions in Investor B, Investor B1 and Investor C Shares.
|
|
|
|
|
|
|
|
|
|
|
|
|
|
|
|
|
|
|
|
|
|||
|
|
|
Investor B |
|
Investor B1 |
|
Investor C |
|
|||
|
|
|
|
|
|
|
|
|
|||
|
Equity Dividend |
|
$ |
53,196 |
|
|
— |
|
$ |
102,320 |
|
|
Natural Resources |
|
$ |
13,405 |
|
|
— |
|
$ |
10,724 |
|
|
Utilities and Telecommunications |
|
$ |
487 |
|
$ |
895 |
|
$ |
1,816 |
|
|
|
|
|
|
|
|
|
|
|
|
|
Furthermore, affiliates received contingent deferred sales charges relating to transactions subject to front-end sales charge waivers as follows:
|
|
|
|
|
|
|
|
|
|
|
|
|
|
|
Investor A |
|
|
|
|
|
|
|
|
|
Equity Dividend |
|
$ |
59,956 |
|
|
Natural Resources |
|
$ |
6,134 |
|
|
|
|
|
|
|
The Manager maintains a call center, which is responsible for providing certain shareholder services to the Funds, such as responding to shareholder inquiries and processing transactions based upon instructions from shareholders with respect to the subscription and redemption of Fund shares. For the six months ended January 31, 2011, the Funds reimbursed the Manager the following amounts for costs incurred in running the call center, which are included in transfer agent — class specific in the Statements of Operations:
|
|
|
|
|
|
|
|
|
|
|
|
|
|
|
|
|
|
|
|
|
|||
|
|
|
Equity |
|
Natural |
|
Utilities
and |
|
|||
|
|
|
|
|
|
|
|
|
|||
|
Institutional |
|
$ |
7,676 |
|
$ |
670 |
|
$ |
75 |
|
|
Service |
|
$ |
263 |
|
|
— |
|
|
— |
|
|
Investor A |
|
$ |
33,851 |
|
$ |
3,763 |
|
$ |
618 |
|
|
Investor B |
|
$ |
834 |
|
$ |
283 |
|
$ |
29 |
|
|
Investor B1 |
|
|
— |
|
|
— |
|
$ |
11 |
|
|
Investor C |
|
$ |
10,515 |
|
$ |
1,528 |
|
$ |
80 |
|
|
Investor C1 |
|
|
— |
|
|
— |
|
$ |
42 |
|
|
Class R |
|
$ |
1,836 |
|
|
— |
|
|
— |
|
|
|
|
|
|
|
|
|
|
|
|
|
The Funds received an exemptive order from the SEC permitting them, among other things, to pay an affiliated securities lending agent a fee based on a share of the income derived from the securities lending activities and have retained BIM as the securities lending agent. BIM may, on behalf of the Funds, invest cash collateral received by the Funds for such loans, among other things, in a private investment company managed by the Manager or in registered money market funds advised by the Manager or its affiliates. The market value of securities on loan and the value of the related collateral, if applicable are shown in the Statements of Assets and Liabilities as securities loaned and collateral on securities loaned at value, respectively. The cash collateral invested by BIM is disclosed in the Schedules of Investments. The share of income earned by the Funds on such investments is shown as securities lending — affiliated in the Statements of Operations. For the six months ended January 31, 2011, BIM received securities lending agent fees related to securities lending agent fees as follows:
|
|
|
|
|
|
|
|
|
|
|
|
|
Natural Resources |
|
$ |
90 |
|
|
|
|
|
|
|
Certain officers and/or directors of the Funds are officers and/or directors of BlackRock or its affiliates. The Funds reimburse the Manager for compensation paid to the Funds’ Chief Compliance Officer.
4. Investments:
Purchases and sales of investments, excluding short-term securities, for the six months ended January 31, 2011, were as follows:
|
|
|
|
|
|
|
|
|
|
|
|
|
|
|
|
|
|
|
|
|
Purchases |
|
Sales |
|
||
|
|
|
|
|
|
|
||
|
Equity Dividend |
|
$ |
1,680,764,493 |
|
$ |
126,433,283 |
|
|
Natural Resources |
|
$ |
8,369,786 |
|
$ |
3,817,208 |
|
|
Utilities and Telecommunications |
|
$ |
502,263 |
|
$ |
4,313,138 |
|
|
|
|
|
|
|
|
|
|
|
|
|
|
|
|
|
|
|
SEMI-ANNUAL REPORT |
JANUARY 31, 2011 |
47 |
|
|
|
|
|
|
|
Notes to Financial Statements (continued) |
5. Borrowings:
The Funds, along with certain other funds managed by the Manager and its affiliates, are a party to a $500 million credit agreement with a group of lenders, which expired in November 2010. The Funds may borrow under the credit agreement to fund shareholder redemptions. Effective Novem-ber 2009, the credit agreement had the following terms: 0.02% upfront fee on the aggregate commitment amount which was allocated to each Fund based on its net assets as of October 31, 2009, a commitment fee of 0.10% per annum based on each Fund’s pro rata share of the unused portion of the credit agreement and interest at a rate equal to the higher of (a) the one-month LIBOR plus 1.25% per annum and (b) the Fed Funds rate plus 1.25% per annum on amounts borrowed. In addition, the Funds paid administration and arrangement fees which were allocated to the Funds based on their net assets as of October 31, 2009. Effective Novem-ber 2010, the credit agreement was renewed until November 2011 with the following terms: a commitment fee of 0.08% per annum based on the Funds’ pro rata share of the unused portion of the credit agreement and interest at a rate equal to the higher of (a) the one-month LIBOR plus 1.00% per annum and (b) the Fed Funds rate plus 1.00% per annum on amounts borrowed. In addition, the Funds paid administration and arrangement fees which were allocated to the Funds based on their net assets as of October 31, 2010. The Funds did not borrow under the credit agreement during the six months ended January 31, 2011.
6. Capital Loss Carryforwards:
As of July 31, 2010, the Funds had capital loss carryforwards available to offset future realized gains through the indicated expiration dates:
|
|
|
|
|
|
|
|
|
|
|
|
|
|
|
|
|
|
|
|
|
|
|
|
|
Expires July 31, |
|
Equity |
|
Natural |
|
Utilities |
|
|||
|
|
|
|
|
|
|
|
|
|||
|
2016 |
|
$ |
5,748,100 |
|
|
— |
|
|
— |
|
|
2017 |
|
|
55,141,466 |
|
$ |
3,394,198 |
|
$ |
3,372,478 |
|
|
2018 |
|
|
243,453,541 |
|
|
6,882,828 |
|
|
2,622,554 |
|
|
|
|
|
|
|
|
|
|
|
|
|
|
Total |
|
$ |
304,343,107 |
|
$ |
10,277,026 |
|
$ |
5,995,032 |
|
|
|
|
|
|
|
|
|
|
|
|
|
Under the recently enacted Regulated Investment Company Modernization Act of 2010, capital losses incurred by the Funds after July 31, 2011 will not be subject to expiration. In addition, these losses must be utilized prior to the losses incurred in pre-enactment taxable years.
7. Concentration, Market and Credit Risk:
As of January 31, 2011, Natural Resources and Utilities and Telecommunications invest a significant portion of their assets in securities in the Energy and Utilities and Telecommunications Services sectors, respectively. Changes in economic conditions affecting the Energy, Utilities or Telecommunications Services sectors would have a greater impact on these Funds and could affect the value, income and/or liquidity of positions in such securities.
In the normal course of business, the Funds invest in securities and enter into transactions where risks exist due to fluctuations in the market (market risk) or failure of the issuer of a security to meet all its obligations (issuer credit risk). The value of securities held by the Funds may decline in response to certain events, including those directly involving the issuers whose securities are owned by the Funds; conditions affecting the general economy; overall market changes; local, regional or global political, social or economic instability; and currency and interest rate and price fluctuations. Similar to issuer credit risk, the Funds may be exposed to counter-party credit risk, or the risk that an entity with which the Funds have unsettled or open transactions may fail to or be unable to perform on its commitments. The Funds manage counterparty credit risk by entering into transactions only with counterparties that they believe have the financial resources to honor their obligations and by monitoring the financial stability of those counterparties. Financial assets, which potentially expose the Funds to market, issuer and counterparty credit risks, consist principally of financial instruments and receivables due from counterparties. The extent of the Funds’ exposure to market, issuer and counterparty credit risks with respect to these financial assets is generally approximated by their value recorded in the Funds’ Statements of Assets and Liabilities, less any collateral held by the Funds.
|
|
|
|
|
|
|
|
|
48 |
SEMI-ANNUAL REPORT |
JANUARY 31, 2011 |
|
|
|
|
|
|
|
|
|
|
Notes to Financial Statements (continued) |
|
|
|
|
|
8. Capital Share Transactions: |
|
|
|
|
|
Transactions in capital shares for each class were as follows: |
|
|
|
|
|
|
|
|
|
|
|
|
|
|
|
|
|
|
|
Six
Months Ended |
|
Year
Ended |
|
||||||||
|
|
|
|
|
|
|
||||||||
|
Equity Dividend |
|
Shares |
|
Amount |
|
Shares |
|
Amount |
|
||||
|
|
|
|
|
|
|
|
|
|
|
||||
|
Institutional |
|
|
|
|
|
|
|
|
|
|
|
|
|
|
|
|
|
|
|
|
|
|
|
|
|
|
|
|
|
Shares sold |
|
|
97,062,970 |
|
$ |
1,629,127,411 |
|
|
112,716,024 |
|
$ |
1,749,154,256 |
|
|
Shares issued to shareholders in reinvestment of dividends |
|
|
2,614,034 |
|
|
44,172,214 |
|
|
2,488,467 |
|
|
39,482,348 |
|
|
|
|
|
|
|
|
|
|
|
|
|
|
|
|
|
Total issued |
|
|
99,677,004 |
|
|
1,673,299,625 |
|
|
115,204,491 |
|
|
1,788,636,604 |
|
|
Shares redeemed |
|
|
(23,327,193 |
) |
|
(392,772,548 |
) |
|
(36,031,762 |
) |
|
(557,163,159 |
) |
|
|
|
|
|
|
|
|
|
|
|
|
|
|
|
|
Net increase |
|
|
76,349,811 |
|
$ |
1,280,527,077 |
|
|
79,172,729 |
|
$ |
1,231,473,445 |
|
|
|
|
|
|
|
|
|
|
|
|
|
|
|
|
|
|
|
|
|
|
|
|
|
|
|
|
|
|
|
|
|
|
|
|
|
|
|
|
|
|
|
|
|
|
|
Service |
|
|
|
|
|
|
|
|
|
|
|
|
|
|
|
|
|
|
|
|
|
|
|
|
|
|
|
|
|
Shares sold |
|
|
776,022 |
|
$ |
13,256,720 |
|
|
1,959,950 |
|
$ |
31,031,418 |
|
|
Shares issued to shareholders in reinvestment of dividends |
|
|
25,229 |
|
|
425,286 |
|
|
36,681 |
|
|
582,721 |
|
|
|
|
|
|
|
|
|
|
|
|
|
|
|
|
|
Total issued |
|
|
801,251 |
|
|
13,682,006 |
|
|
1,996,631 |
|
|
31,614,139 |
|
|
Shares redeemed |
|
|
(474,281 |
) |
|
(7,879,894 |
) |
|
(1,807,228 |
) |
|
(27,593,319 |
) |
|
|
|
|
|
|
|
|
|
|
|
|
|
|
|
|
Net increase |
|
|
326,970 |
|
$ |
5,802,112 |
|
|
189,403 |
|
$ |
4,020,820 |
|
|
|
|
|
|
|
|
|
|
|
|
|
|
|
|
|
|
|
|
|
|
|
|
|
|
|
|
|
|
|
|
|
|
|
|
|
|
|
|
|
|
|
|
|
|
|
Investor A |
|
|
|
|
|
|
|
|
|
|
|
|
|
|
|
|
|
|
|
|
|
|
|
|
|
|
|
|
|
Shares sold |
|
|
69,779,273 |
|
$ |
1,173,610,864 |
|
|
146,971,643 |
|
$ |
2,282,326,523 |
|
|
Shares issued to shareholders in reinvestment of dividends |
|
|
2,758,019 |
|
|
46,509,068 |
|
|
3,521,305 |
|
|
55,783,817 |
|
|
|
|
|
|
|
|
|
|
|
|
|
|
|
|
|
Total issued |
|
|
72,537,292 |
|
|
1,220,119,932 |
|
|
150,492,948 |
|
|
2,338,110,340 |
|
|
Shares redeemed |
|
|
(52,192,200 |
) |
|
(851,249,893 |
) |
|
(62,552,678 |
) |
|
(967,410,272 |
) |
|
|
|
|
|
|
|
|
|
|
|
|
|
|
|
|
Net increase |
|
|
20,345,092 |
|
$ |
368,870,039 |
|
|
87,940,270 |
|
$ |
1,370,700,068 |
|
|
|
|
|
|
|
|
|
|
|
|
|
|
|
|
|
|
|
|
|
|
|
|
|
|
|
|
|
|
|
|
|
|
|
|
|
|
|
|
|
|
|
|
|
|
|
Investor B |
|
|
|
|
|
|
|
|
|
|
|
|
|
|
|
|
|
|
|
|
|
|
|
|
|
|
|
|
|
Shares sold |
|
|
188,722 |
|
$ |
3,162,997 |
|
|
307,081 |
|
$ |
4,780,670 |
|
|
Shares issued to shareholders in reinvestment of dividends |
|
|
21,471 |
|
|
363,926 |
|
|
30,346 |
|
|
482,516 |
|
|
|
|
|
|
|
|
|
|
|
|
|
|
|
|
|
Total issued |
|
|
210,193 |
|
|
3,526,923 |
|
|
337,427 |
|
|
5,263,186 |
|
|
Shares redeemed |
|
|
(504,046 |
) |
|
(8,437,483 |
) |
|
(1,528,632 |
) |
|
(23,754,278 |
) |
|
|
|
|
|
|
|
|
|
|
|
|
|
|
|
|
Net decrease |
|
|
(293,853 |
) |
$ |
(4,910,560 |
) |
|
(1,191,205 |
) |
$ |
(18,491,092 |
) |
|
|
|
|
|
|
|
|
|
|
|
|
|
|
|
|
|
|
|
|
|
|
|
|
|
|
|
|
|
|
|
|
|
|
|
|
|
|
|
|
|
|
|
|
|
|
Investor C |
|
|
|
|
|
|
|
|
|
|
|
|
|
|
|
|
|
|
|
|
|
|
|
|
|
|
|
|
|
Shares sold |
|
|
15,657,449 |
|
$ |
258,009,622 |
|
|
26,946,565 |
|
$ |
412,107,667 |
|
|
Shares issued to shareholders in reinvestment of dividends |
|
|
480,289 |
|
|
7,934,991 |
|
|
511,546 |
|
|
7,951,723 |
|
|
|
|
|
|
|
|
|
|
|
|
|
|
|
|
|
Total issued |
|
|
16,137,738 |
|
|
265,944,613 |
|
|
27,458,111 |
|
|
420,059,390 |
|
|
Shares redeemed |
|
|
(5,916,325 |
) |
|
(96,678,864 |
) |
|
(10,073,547 |
) |
|
(152,503,502 |
) |
|
|
|
|
|
|
|
|
|
|
|
|
|
|
|
|
Net increase |
|
|
10,221,413 |
|
$ |
169,265,749 |
|
|
17,384,564 |
|
$ |
267,555,888 |
|
|
|
|
|
|
|
|
|
|
|
|
|
|
|
|
|
|
|
|
|
|
|
|
|
|
|
|
|
|
|
|
|
|
|
|
|
|
|
|
|
|
|
|
|
|
|
Class R |
|
|
|
|
|
|
|
|
|
|
|
|
|
|
|
|
|
|
|
|
|
|
|
|
|
|
|
|
|
Shares sold |
|
|
7,688,926 |
|
$ |
128,918,411 |
|
|
15,681,924 |
|
$ |
244,739,743 |
|
|
Shares issued to shareholders in reinvestment of dividends |
|
|
281,076 |
|
|
4,761,671 |
|
|
297,690 |
|
|
4,738,565 |
|
|
|
|
|
|
|
|
|
|
|
|
|
|
|
|
|
Total issued |
|
|
7,970,002 |
|
|
133,680,082 |
|
|
15,979,614 |
|
|
249,478,308 |
|
|
Shares redeemed |
|
|
(3,153,379 |
) |
|
(52,756,723 |
) |
|
(4,945,169 |
) |
|
(76,753,831 |
) |
|
|
|
|
|
|
|
|
|
|
|
|
|
|
|
|
Net increase |
|
|
4,816,623 |
|
$ |
80,923,359 |
|
|
11,034,445 |
|
$ |
172,724,477 |
|
|
|
|
|
|
|
|
|
|
|
|
|
|
|
|
|
|
|
|
|
|
||
|
SEMI-ANNUAL REPORT |
JANUARY 31, 2011 |
49 |
|
|
|
|
|
|
|
Notes to Financial Statements (continued) |
|
|
|
|
|
|
|
|
|
|
|
|
|
|
|
|
|
|
Six
Months Ended |
|
Year
Ended |
|
||||||||
|
|
|
|
|
|
|
||||||||
|
Natural Resources |
|
Shares |
|
Amount |
|
Shares |
|
Amount |
|
||||
|
|
|
|
|
|
|
|
|
|
|
||||
|
Institutional |
|
|
|
|
|
|
|
|
|
|
|
|
|
|
|
|
|
|
|
|
|
|
|
|
|
|
|
|
|
Shares sold |
|
|
427,742 |
|
$ |
25,876,978 |
|
|
735,716 |
|
$ |
39,410,774 |
|
|
Shares redeemed |
|
|
(234,195 |
) |
|
(13,842,666 |
) |
|
(553,111 |
) |
|
(28,591,815 |
) |
|
|
|
|
|
|
|
|
|
|
|
|
|
|
|
|
Net increase |
|
|
193,547 |
|
$ |
12,034,312 |
|
|
182,605 |
|
$ |
10,818,959 |
|
|
|
|
|
|
|
|
|
|
|
|
|
|
|
|
|
|
|
|
|
|
|
|
|
|
|
|
|
|
|
|
|
|
|
|
|
|
|
|
|
|
|
|
|
|
|
Investor A |
|
|
|
|
|
|
|
|
|
|
|
|
|
|
|
|
|
|
|
|
|
|
|
|
|
|
|
|
|
Shares sold and automatic conversion of shares |
|
|
784,633 |
|
$ |
46,351,811 |
|
|
2,436,230 |
|
$ |
127,245,444 |
|
|
Shares redeemed |
|
|
(788,864 |
) |
|
(45,439,025 |
) |
|
(1,519,130 |
) |
|
(78,671,501 |
) |
|
|
|
|
|
|
|
|
|
|
|
|
|
|
|
|
Net increase (decrease) |
|
|
(4,231 |
) |
$ |
912,786 |
|
|
917,100 |
|
$ |
48,573,943 |
|
|
|
|
|
|
|
|
|
|
|
|
|
|
|
|
|
|
|
|
|
|
|
|
|
|
|
|
|
|
|
|
|
|
|
|
|
|
|
|
|
|
|
|
|
|
|
Investor B |
|
|
|
|
|
|
|
|
|
|
|
|
|
|
|
|
|
|
|
|
|
|
|
|
|
|
|
|
|
Shares sold |
|
|
7,383 |
|
$ |
394,219 |
|
|
23,917 |
|
$ |
1,155,470 |
|
|
Shares redeemed and automatic conversion of shares |
|
|
(53,792 |
) |
|
(2,802,379 |
) |
|
(149,141 |
) |
|
(7,105,308 |
) |
|
|
|
|
|
|
|
|
|
|
|
|
|
|
|
|
Net decrease |
|
|
(46,409 |
) |
$ |
(2,408,160 |
) |
|
(125,224 |
) |
$ |
(5,949,838 |
) |
|
|
|
|
|
|
|
|
|
|
|
|
|
|
|
|
|
|
|
|
|
|
|
|
|
|
|
|
|
|
|
|
|
|
|
|
|
|
|
|
|
|
|
|
|
|
Investor C |
|
|
|
|
|
|
|
|
|
|
|
|
|
|
|
|
|
|
|
|
|
|
|
|
|
|
|
|
|
Shares sold |
|
|
284,315 |
|
$ |
15,352,571 |
|
|
821,100 |
|
$ |
39,071,943 |
|
|
Shares redeemed |
|
|
(229,563 |
) |
|
(11,835,514 |
) |
|
(529,126 |
) |
|
(24,791,323 |
) |
|
|
|
|
|
|
|
|
|
|
|
|
|
|
|
|
Net increase |
|
|
54,752 |
|
$ |
3,517,057 |
|
|
291,974 |
|
$ |
14,280,620 |
|
|
|
|
|
|
|
|
|
|
|
|
|
|
|
|
|
|
|
|
|
|
|
|
|
|
|
|
|
|
|
|
Utilities and Telecommunications |
|
|
|
|
|
|
|
|
|
|
|
|
|
|
|
|
|
|
|
|
|
|
|
|
|
|
|
|
|
Institutional |
|
|
|
|
|
|
|
|
|
|
|
|
|
|
|
|
|
|
|
|
|
|
|
|
|
|
|
|
|
Shares sold |
|
|
54,250 |
|
$ |
624,707 |
|
|
354,269 |
|
$ |
3,891,766 |
|
|
Shares issued to shareholders in reinvestment of dividends |
|
|
11,190 |
|
|
129,210 |
|
|
31,094 |
|
|
342,703 |
|
|
|
|
|
|
|
|
|
|
|
|
|
|
|
|
|
Total issued |
|
|
65,440 |
|
|
753,917 |
|
|
385,363 |
|
|
4,234,469 |
|
|
Shares redeemed |
|
|
(386,605 |
) |
|
(4,454,602 |
) |
|
(603,111 |
) |
|
(6,384,411 |
) |
|
|
|
|
|
|
|
|
|
|
|
|
|
|
|
|
Net decrease |
|
|
(321,165 |
) |
$ |
(3,700,685 |
) |
|
(217,748 |
) |
$ |
(2,149,942 |
) |
|
|
|
|
|
|
|
|
|
|
|
|
|
|
|
|
|
|
|
|
|
|
|
|
|
|
|
|
|
|
|
|
|
|
|
|
|
|
|
|
|
|
|
|
|
|
Investor A |
|
|
|
|
|
|
|
|
|
|
|
|
|
|
|
|
|
|
|
|
|
|
|
|
|
|
|
|
|
Shares sold and automatic conversion of shares |
|
|
507,507 |
|
$ |
5,856,817 |
|
|
938,052 |
|
$ |
10,254,149 |
|
|
Shares issued to shareholders in reinvestment of dividends |
|
|
52,714 |
|
|
608,650 |
|
|
122,378 |
|
|
1,349,253 |
|
|
|
|
|
|
|
|
|
|
|
|
|
|
|
|
|
Total issued |
|
|
560,221 |
|
|
6,465,467 |
|
|
1,060,430 |
|
|
11,603,402 |
|
|
Shares redeemed |
|
|
(440,752 |
) |
|
(5,070,731 |
) |
|
(1,248,058 |
) |
|
(13,530,700 |
) |
|
|
|
|
|
|
|
|
|
|
|
|
|
|
|
|
Net increase (decrease) |
|
|
119,469 |
|
$ |
1,394,736 |
|
|
(187,628 |
) |
$ |
(1,927,298 |
) |
|
|
|
|
|
|
|
|
|
|
|
|
|
|
|
|
|
|
|
|
|
|
|
|
|
|
|
|
|
|
|
|
|
|
|
|
|
|
|
|
|
|
|
|
|
|
Investor B |
|
|
|
|
|
|
|
|
|
|
|
|
|
|
|
|
|
|
|
|
|
|
|
|
|
|
|
|
|
Shares sold |
|
|
8,119 |
|
$ |
92,695 |
|
|
9,262 |
|
$ |
99,769 |
|
|
Shares issued to shareholders in reinvestment of dividends |
|
|
380 |
|
|
4,355 |
|
|
955 |
|
|
10,452 |
|
|
|
|
|
|
|
|
|
|
|
|
|
|
|
|
|
Total issued |
|
|
8,499 |
|
|
97,050 |
|
|
10,217 |
|
|
110,221 |
|
|
Shares redeemed and automatic conversion of shares |
|
|
(12,022 |
) |
|
(139,021 |
) |
|
(29,949 |
) |
|
(322,803 |
) |
|
|
|
|
|
|
|
|
|
|
|
|
|
|
|
|
Net decrease |
|
|
(3,523 |
) |
$ |
(41,971 |
) |
|
(19,732 |
) |
$ |
(212,582 |
) |
|
|
|
|
|
|
|
|
|
|
|
|
|
|
|
|
|
|
|
|
|
|
|
|
50 |
SEMI-ANNUAL REPORT |
JANUARY 31, 2011 |
|
|
|
|
|
|
|
Notes to Financial Statements (concluded) |
|
|
|
|
|
|
|
|
|
|
|
|
|
|
|
|
|
|
Six
Months Ended |
|
Year
Ended |
|
||||||||
|
|
|
|
|
|
|
||||||||
|
Utilities and Telecommunications (concluded) |
|
Shares |
|
Amount |
|
Shares |
|
Amount |
|
||||
|
|
|
|
|
|
|
|
|
|
|
||||
|
Investor B1 |
|
|
|
|
|
|
|
|
|
|
|
|
|
|
|
|
|
|
|
|
|
|
|
|
|
|
|
|
|
Shares sold |
|
|
2,939 |
|
$ |
33,358 |
|
|
4,333 |
|
$ |
46,938 |
|
|
Shares issued to shareholders in reinvestment of dividends |
|
|
834 |
|
|
9,646 |
|
|
2,855 |
|
|
31,478 |
|
|
|
|
|
|
|
|
|
|
|
|
|
|
|
|
|
Total issued |
|
|
3,773 |
|
|
43,004 |
|
|
7,188 |
|
|
78,416 |
|
|
Shares redeemed |
|
|
(76,305 |
) |
|
(883,550 |
) |
|
(192,400 |
) |
|
(2,073,185 |
) |
|
|
|
|
|
|
|
|
|
|
|
|
|
|
|
|
Net decrease |
|
|
(72,532 |
) |
$ |
(840,546 |
) |
|
(185,212 |
) |
$ |
(1,994,769 |
) |
|
|
|
|
|
|
|
|
|
|
|
|
|
|
|
|
|
|
|
|
|
|
|
|
|
|
|
|
|
|
|
|
|
|
|
|
|
|
|
|
|
|
|
|
|
|
Investor C |
|
|
|
|
|
|
|
|
|
|
|
|
|
|
|
|
|
|
|
|
|
|
|
|
|
|
|
|
|
Shares sold |
|
|
191,339 |
|
$ |
2,159,113 |
|
|
567,288 |
|
$ |
6,067,328 |
|
|
Shares issued to shareholders in reinvestment of dividends |
|
|
4,459 |
|
|
50,197 |
|
|
9,968 |
|
|
107,069 |
|
|
|
|
|
|
|
|
|
|
|
|
|
|
|
|
|
Total issued |
|
|
195,798 |
|
|
2,209,310 |
|
|
577,256 |
|
|
6,174,397 |
|
|
Shares redeemed |
|
|
(221,579 |
) |
|
(2,450,932 |
) |
|
(177,079 |
) |
|
(1,856,736 |
) |
|
|
|
|
|
|
|
|
|
|
|
|
|
|
|
|
Net increase (decrease) |
|
|
(25,781 |
) |
$ |
(241,622 |
) |
|
400,177 |
|
$ |
4,317,661 |
|
|
|
|
|
|
|
|
|
|
|
|
|
|
|
|
|
|
|
|
|
|
|
|
|
|
|
|
|
|
|
|
|
|
|
|
|
|
|
|
|
|
|
|
|
|
|
Investor C1 |
|
|
|
|
|
|
|
|
|
|
|
|
|
|
|
|
|
|
|
|
|
|
|
|
|
|
|
|
|
Shares sold |
|
|
11,857 |
|
$ |
133,227 |
|
|
33,262 |
|
$ |
358,877 |
|
|
Shares issued to shareholders in reinvestment of dividends |
|
|
3,972 |
|
|
45,220 |
|
|
11,273 |
|
|
122,416 |
|
|
|
|
|
|
|
|
|
|
|
|
|
|
|
|
|
Total issued |
|
|
15,829 |
|
|
178,447 |
|
|
44,535 |
|
|
481,293 |
|
|
Shares redeemed |
|
|
(75,246 |
) |
|
(850,564 |
) |
|
(131,963 |
) |
|
(1,408,056 |
) |
|
|
|
|
|
|
|
|
|
|
|
|
|
|
|
|
Net decrease |
|
|
(59,417 |
) |
$ |
(672,117 |
) |
|
(87,428 |
) |
$ |
(926,763 |
) |
|
|
|
|
|
|
|
|
|
|
|
|
|
|
|
9. Subsequent Events:
Management has evaluated the impact of all subsequent events on each Fund through the date the financial statements were issued and has determined that there were no subsequent events requiring adjustment or additional disclosure in the financial statements.
|
|
|
|
|
|
||
|
SEMI-ANNUAL REPORT |
JANUARY 31, 2011 |
51 |
|
|
|
|
|
|
|
Robert M. Hernandez, Chairman of the Board, Director and Member of the Audit Committee |
|
Fred G. Weiss, Vice Chairman of the Board, Chairman of the Audit Committee and Director |
|
James H. Bodurtha, Director |
|
Bruce R. Bond, Director |
|
Donald W. Burton, Director |
|
Richard S. Davis, Fund President1 and Director |
|
Stuart E. Eizenstat, Director |
|
Laurence D. Fink, Director |
|
Kenneth A. Froot, Director |
|
Henry Gabbay, Director |
|
John F. O’Brien, Director |
|
Roberta Cooper Ramo, Director |
|
David H. Walsh, Director |
|
John M. Perlowski, Fund President2 and Chief Executive Officer |
|
Brendan Kyne, Vice President |
|
Brian Schmidt, Vice President |
|
Neal Andrews, Chief Financial Officer |
|
Jay Fife, Treasurer |
|
Brian Kindelan, Chief Compliance Officer of the Funds |
|
Ira Shapiro, Secretary |
|
|
|
|
1 |
Fund President for Equity Dividend. |
|
|
|
|
2 |
Fund President for Natural Resources and Utilities and Telecommunications. |
|
|
|
Investment Advisor |
|
BlackRock Advisors, LLC |
|
Wilmington, DE 19809 |
|
|
|
Sub-Advisor |
|
BlackRock Investment Management, LLC |
|
Plainsboro, NJ 08536 |
|
|
|
Custodians |
|
State Street Bank and Trust Company3 |
|
Boston, MA 02111 |
|
|
|
The Bank of New York4 |
|
Brooklyn, NY 11217 |
|
|
|
JPMorgan Chase Bank & Co.5 |
|
Brooklyn, NY 11245 |
|
|
|
Transfer Agent |
|
BNY Mellon Investment Servicing (US) Inc. |
|
Wilmington, DE 19809 |
|
|
|
Accounting Agent |
|
State Street Bank and Trust Company |
|
Princeton, NJ 08540 |
|
|
|
Distributor |
|
BlackRock Investments, LLC |
|
New York, NY 10022 |
|
|
|
Independent Registered Public Accounting Firm |
|
Deloitte & Touche LLP |
|
Princeton, NJ 08540 |
|
|
|
Legal Counsel |
|
Willkie Farr & Gallagher LLP |
|
New York, NY 10019 |
|
|
|
Address of the Funds |
|
100 Bellevue Parkway |
|
Wilmington, DE 19809 |
|
|
|
|
3 |
For Equity Dividend. |
|
|
|
|
4 |
For Natural Resources. |
|
|
|
|
5 |
For Utilities and Telecommunications. |
|
|
|
|
|
Effective December 31, 2010, Richard R. West retired as a Director of the Funds. The Board wishes Mr. West well in his retirement. |
|
|
|
Effective September 15, 2010, John M. Perlowski became President and Chief Executive Officer of the Funds. |
|
|
|
Effective November 10, 2010, Ira Shapiro became Secretary of the Funds. |
|
|
|
|
|
|
|
|
|
|
|
52 |
SEMI-ANNUAL REPORT |
JANUARY 31, 2011 |
|
|
|
|
|
|
|
|
|
|
|
General Information |
|
|
Electronic Delivery
Electronic copies of most financial reports and prospectuses are available on the Funds’ websites or shareholders can sign up for e-mail notifications of quarterly statements, annual and semi-annual reports and prospectuses by enrolling in the Funds’ electronic delivery program.
To enroll:
Shareholders Who Hold Accounts with Investment Advisors, Banks or Brokerages:
Please contact your financial advisor. Please note that not all investment advisors, banks or brokerages may offer this service.
Shareholders Who Hold Accounts Directly with BlackRock:
|
|
|
|
1) |
Access the BlackRock website at |
|
|
http://www.blackrock.com/edelivery |
|
|
|
|
2) |
Select “eDelivery” under the “More Information” section |
|
|
|
|
3) |
Log into your account |
Householding
The Funds will mail only one copy of shareholder documents, including prospectuses, annual and semi-annual reports and proxy statements, to shareholders with multiple accounts at the same address. This practice is commonly called “householding” and is intended to reduce expenses and eliminate duplicate mailings of shareholder documents. Mailings of your shareholder documents may be householded indefinitely unless you instruct us otherwise. If you do not want the mailing of these documents to be combined with those for other members of your household, please call (800) 441-7762.
Availability of Quarterly Schedule of Investments
The Funds file their complete schedule of portfolio holdings with the Security and Exchange Commission (“SEC”) for the first and third quarters of each fiscal year on Form N-Q. The Funds’ Forms N-Q are available on the SEC’s website at http://www.sec.gov and may also be reviewed and copied at the SEC’s Public Reference Room in Washington, D.C. Information on the operation of the Public Reference Room may be obtained by calling (800) SEC-0330. The Funds’ Forms N-Q may also be obtained upon request and without charge by calling (800) 441-7762.
Availability of Proxy Voting Policies and Procedures
A description of the policies and procedures that the Funds use to determine how to vote proxies relating to portfolio securities is available
(1) without charge, upon request, by calling (800) 441-7762;
(2) at http://www.blackrock.com; and (3) on the SEC’s website at http://www.sec.gov.
Availability of Proxy Voting Record
Information about how the Funds voted proxies relating to securities held in the Funds’ portfolios during the most recent 12-month period ended June 30 is available upon request and without charge
(1) at http://www.blackrock.com or by calling (800) 441-7762 and
(2) on the SEC’s website at http://www.sec.gov.
|
|
|
|
|
|
|
|
|
|
||
|
SEMI-ANNUAL REPORT |
JANUARY 31, 2011 |
53 |
|
|
|
|
|
Additional Information (concluded) |
|
|
|
|
|
Shareholder Privileges |
|
|
Account Information
Call us at (800) 441-7762 from 8:00 AM to 6:00 PM EST on any business day to get information about your account balances, recent transactions and share prices. You can also reach us on the Web at http://www.blackrock.com/funds.
Automatic Investment Plans
Investor Class shareholders who want to invest regularly can arrange to have $50 or more automatically deducted from their checking or savings account and invested in any of the BlackRock funds.
Systematic Withdrawal Plans
Investor Class shareholders can establish a systematic withdrawal plan and receive periodic payments of $50 or more from their BlackRock funds, as long as their account balance is at least $10,000.
Retirement Plans
Shareholders may make investments in conjunction with Traditional, Rollover, Roth, Coverdell, Simple IRAs, SEP IRAs and 403(b) Plans.
|
|
|
|
|
BlackRock Privacy Principles |
|
|
BlackRock is committed to maintaining the privacy of its current and former fund investors and individual clients (collectively, “Clients”) and to safeguarding their non-public personal information. The following information is provided to help you understand what personal information BlackRock collects, how we protect that information and why in certain cases we share such information with select parties.
If you are located in a jurisdiction where specific laws, rules or regulations require BlackRock to provide you with additional or different privacy-related rights beyond what is set forth below, then BlackRock will comply with those specific laws, rules or regulations.
BlackRock obtains or verifies personal non-public information from and about you from different sources, including the following: (i) information we receive from you or, if applicable, your financial intermediary, on applications, forms or other documents; (ii) information about your transactions with us, our affiliates, or others; (iii) information we receive from a consumer reporting agency; and (iv) from visits to our websites.
BlackRock does not sell or disclose to non-affiliated third parties any non-public personal information about its Clients, except as permitted by law or as is necessary to respond to regulatory requests or to service Client accounts. These non-affiliated third parties are required to protect the confidentiality and security of this information and to use it only for its intended purpose.
We may share information with our affiliates to service your account or to provide you with information about other BlackRock products or services that may be of interest to you. In addition, BlackRock restricts access to non-public personal information about its Clients to those BlackRock employees with a legitimate business need for the information. BlackRock maintains physical, electronic and procedural safeguards that are designed to protect the non-public personal information of its Clients, including procedures relating to the proper storage and disposal of such information.
|
|
|
|
|
|
|
|
|
54 |
SEMI-ANNUAL REPORT |
JANUARY 31, 2011 |
|
|
|
|
|
|
BlackRock offers a diverse lineup of open-end mutual funds crossing all investment styles and managed by experts in equity, fixed income and tax-exempt investing.
|
|
|
|
|
Equity Funds |
|
|
|
|
|
BlackRock All-Cap Energy & Resources Portfolio |
|
BlackRock Asset Allocation Portfolio† |
|
BlackRock Balanced Capital Fund† |
|
BlackRock Basic Value Fund |
|
BlackRock Capital Appreciation Fund |
|
BlackRock Energy & Resources Portfolio |
|
BlackRock Equity Dividend Fund |
|
BlackRock EuroFund |
|
BlackRock Focus Growth Fund |
|
BlackRock Focus Value Fund |
|
BlackRock Global Allocation Fund† |
|
BlackRock Global Dividend Income Portfolio |
|
BlackRock Global Dynamic Equity Fund |
|
BlackRock Global Emerging Markets Fund |
|
BlackRock Global Growth Fund |
|
BlackRock Global Opportunities Portfolio |
|
BlackRock Global SmallCap Fund |
|
BlackRock Health Sciences Opportunities Portfolio |
|
BlackRock Healthcare Fund |
|
BlackRock Index Equity Portfolio |
|
BlackRock International Fund |
|
BlackRock International Index Fund |
|
BlackRock International Opportunities Portfolio |
|
BlackRock International Value Fund |
|
BlackRock Large Cap Core Fund |
|
BlackRock Large Cap Core Plus Fund |
|
BlackRock Large Cap Growth Fund |
|
BlackRock Large Cap Value Fund |
|
BlackRock Latin America Fund |
|
BlackRock Mid-Cap Growth Equity Portfolio |
|
BlackRock Mid-Cap Value Equity Portfolio |
|
BlackRock Mid Cap Value Opportunities Fund |
|
BlackRock Natural Resources Trust |
|
BlackRock Pacific Fund |
|
BlackRock Science & Technology |
|
Opportunities Portfolio |
|
BlackRock Small Cap Growth Equity Portfolio |
|
BlackRock Small Cap Growth Fund II |
|
BlackRock Small Cap Index Fund |
|
BlackRock Small/Mid-Cap Growth Portfolio |
|
BlackRock S&P 500 Index Fund |
|
BlackRock S&P 500 Stock Fund |
|
BlackRock U.S. Opportunities Portfolio |
|
BlackRock Utilities and Telecommunications Fund |
|
BlackRock Value Opportunities Fund |
|
BlackRock World Gold Fund |
|
|
|
|
|
Fixed Income Funds |
|
|
|
|
|
BlackRock Bond Index Fund |
|
BlackRock Bond Portfolio |
|
BlackRock Emerging Market Debt Portfolio |
|
BlackRock Floating Rate Income Portfolio |
|
BlackRock GNMA Portfolio |
|
BlackRock Government Income Portfolio |
|
BlackRock High Income Fund |
|
BlackRock High Yield Bond Portfolio |
|
BlackRock Income Portfolio† |
|
BlackRock Inflation Protected Bond Portfolio |
|
BlackRock Intermediate Government |
|
Bond Portfolio |
|
BlackRock International Bond Portfolio |
|
BlackRock Long Duration Bond Portfolio |
|
BlackRock Low Duration Bond Portfolio |
|
BlackRock Managed Income Portfolio |
|
BlackRock Multi-Sector Bond Portfolio |
|
BlackRock Short-Term Bond Fund |
|
BlackRock Strategic Income |
|
Opportunities Portfolio |
|
BlackRock Total Return Fund |
|
BlackRock Total Return Portfolio II |
|
BlackRock World Income Fund |
|
|
|
|
|
Municipal Bond Funds |
|
|
|
|
|
BlackRock AMT-Free Municipal Bond Portfolio |
|
BlackRock California Municipal Bond Fund |
|
BlackRock High Yield Municipal Fund |
|
BlackRock Intermediate Municipal Fund |
|
BlackRock Municipal Fund |
|
BlackRock National Municipal Fund |
|
BlackRock New Jersey Municipal Bond Fund |
|
BlackRock New York Municipal Bond Fund |
|
BlackRock Pennsylvania Municipal Bond Fund |
|
BlackRock Short-Term Municipal Fund |
|
|
|
|
|
Target Risk & Target Date Funds† |
|
|
|
|
|
BlackRock Prepared Portfolios |
|
Conservative Prepared Portfolio |
|
Moderate Prepared Portfolio |
|
Growth Prepared Portfolio |
|
Aggressive Growth Prepared Portfolio |
|
BlackRock Lifecycle Prepared Portfolios |
|
2015 |
|
2020 |
|
2025 |
|
2030 |
|
2035 |
|
2040 |
|
2045 |
|
2050 |
|
BlackRock LifePath Portfolios |
|
Retirement |
|
2020 |
|
2025 |
|
2030 |
|
2035 |
|
2040 |
|
2045 |
|
2050 |
|
2055 |
† Mixed asset fund.
BlackRock mutual funds are currently distributed by BlackRock Investments, LLC. You should consider the investment objectives, risks, charges and expenses of the funds under consideration carefully before investing. Each fund’s prospectus contains this and other information and is available at www.blackrock.com or by calling (800) 441-7762 or from your financial advisor. The prospectus should be read carefully before investing.
|
|
|
|
|
|
|
|
|
SEMI-ANNUAL REPORT |
JANUARY 31, 2011 |
55 |
This report is not authorized for use as an offer of sale or a solicitation of an offer to buy shares of the Funds unless accompanied or preceded by the Funds’ current prospectus. Past performance results shown in this report should not be considered a representation of future performance. Investment returns and principal value of shares will fluctuate so that shares, when redeemed, may be worth more or less than their original cost. Statements and other information herein are as dated and are subject to change.

|
|
|
|
#EDNRUT-1/11 |
|

|
Item 2 – |
Code of Ethics – Not Applicable to this semi-annual report |
|
|
|
|
Item 3 – |
Audit Committee Financial Expert – Not Applicable to this semi-annual report |
|
|
|
|
Item 4 – |
Principal Accountant Fees and Services – Not Applicable to this semi-annual report |
|
|
|
|
Item 5 – |
Audit Committee of Listed Registrants – Not Applicable |
|
|
|
|
Item 6 – |
Investments |
|
|
(a) The registrant’s Schedule of Investments is included as part of the Report to Stockholders filed under Item 1 of this form. |
|
|
(b) Not Applicable due to no such divestments during the semi-annual period covered since the previous Form N-CSR filing. |
|
|
|
|
Item 7 – |
Disclosure of Proxy Voting Policies and Procedures for Closed-End Management Investment Companies – Not Applicable |
|
|
|
|
Item 8 – |
Portfolio Managers of Closed-End Management Investment Companies – Not Applicable |
|
|
|
|
Item 9 – |
Purchases of Equity Securities by Closed-End Management Investment Company and Affiliated Purchasers – Not Applicable |
|
|
|
|
Item 10 – |
Submission of Matters to a Vote of Security Holders – The registrant’s Nominating and Governance Committee will consider nominees to the board of directors recommended by shareholders when a vacancy becomes available. Shareholders who wish to recommend a nominee should send nominations that include biographical information and set forth the qualifications of the proposed nominee to the registrant’s Secretary. There have been no material changes to these procedures. |
|
|
|
|
Item 11 – |
Controls and Procedures |
|
|
|
|
11(a) – |
The registrant’s principal executive and principal financial officers, or persons performing similar functions, have concluded that the registrant’s disclosure controls and procedures (as defined in Rule 30a-3(c) under the Investment Company Act of 1940, as amended (the “1940 Act”)) are effective as of a date within 90 days of the filing of this report based on the evaluation of these controls and procedures required by Rule 30a-3(b) under the 1940 Act and Rule 15d-15(b) under the Securities Exchange Act of 1934, as amended. |
|
|
|
|
11(b) – |
There were no changes in the registrant’s internal control over financial reporting (as defined in Rule 30a-3(d) under the 1940 Act) that occurred during the second fiscal quarter of the period covered by this report that have materially affected, or are reasonably likely to materially affect, the registrant’s internal control over financial reporting. |
|
|
|
|
Item 12 – |
Exhibits attached hereto |
|
|
|
|
12(a)(1) – |
Code of Ethics – Not Applicable to this semi-annual report |
|
|
|
|
12(a)(2) – |
Certifications – Attached hereto |
|
|
|
|
12(a)(3) – |
Not Applicable |
|
|
|
|
12(b) – |
Certifications – Attached hereto |
|
|
Pursuant to the requirements of the Securities Exchange Act of 1934 and the Investment Company Act of 1940, the registrant has duly caused this report to be signed on its behalf by the undersigned, thereunto duly authorized. | ||
|
|
| ||
|
|
BlackRock Natural Resources Trust | ||
| By: | /s/ John M. Perlowski | ||
| John M. Perlowski | |||
| Chief Executive Officer of | |||
| BlackRock Natural Resources Trust | |||
| Date: April 4, 2011 | |||
| Pursuant to the requirements of the Securities Exchange Act of 1934 and the Investment Company Act of 1940, this report has been signed below by the following persons on behalf of the registrant and in the capacities and on the dates indicated. | |||
| By: | /s/ John M. Perlowski | ||
| John M. Perlowski | |||
| Chief Executive Officer (principal executive officer) of | |||
| BlackRock Natural Resources Trust | |||
| Date: April 4, 2011 | |||
| By: | /s/ Neal J. Andrews | ||
| Neal J. Andrews | |||
| Chief Financial Officer (principal financial officer) of | |||
| BlackRock Natural Resources Trust | |||
| Date: April 4, 2011 | |||