
FNB United Corp. May 17, 2013 First Quarter 2013
Presenters Brian Simpson Chief Executive Officer David Nielsen Chief Financial Officer 2
Forward Looking Statements & Other Information Forward Looking Statements This presentation contains certain forward-looking statements within the safe harbor rules of the federal securities laws. These statements generally relate to FNB’s financial condition, results of operations, plans, objectives, future performance or business. They usually can be identified by the use of forward-looking terminology, such as “believes,” “expects,” or “are expected to,” “plans,” “projects,” “goals,” “estimates,” “may,” “should,” “could,” “would,” “intends to,” “outlook” or “anticipates,” or variations of these and similar words, or by discussions of strategies that involve risks and uncertainties. Forward looking statements are subject to risks and uncertainties, including but not limited to, those risks described in FNB’s Annual Report on Form 10-K for the year ended December 31, 2012 under the section entitled “Item 1A, Risk Factors,” and in the Quarterly Reports of Form 10-Q and other reports that are filed by FNB with the Securities and Exchange Commission. You are cautioned not to place undue reliance on these forward-looking statements, which are subject to numerous assumptions, risks and uncertainties, and which change over time. These forward-looking statements speak only as of the date of this presentation. Actual results may differ materially from those expressed in or implied by any forward looking statements contained in this presentation. We assume no duty to revise or update any forward-looking statements, except as required by applicable law. Non-GAAP Financial Measures In addition to the results of operations presented in accordance with Generally Accepted Accounting Principles (GAAP), FNB management uses and this presentation contains or references, certain non-GAAP financial measures, such as core earnings, core noninterest expense, core noninterest income, net interest income on a fully taxable equivalent basis, pro forma total ALL and fair value mark, Granite purchased impaired loan ALL and FV mark, Granite purchased contractual loan ALL and FV mark and tangible shareholders’ equity. FNB believes these non-GAAP financial measures provide information useful to investors in understanding our underlying operational performance and our business and performance trends as they facilitate comparisons with the performance of others in the financial services industry; however, these non-GAAP financial measures should not be considered an alternative to GAAP. The non- GAAP financial measures contained within this presentation should be read in conjunction with the audited financial statements and analysis as presented in FNB’s Annual Report on Form 10-K as well as the unaudited financial statements and analyses as presented in FNB’s Quarterly Reports on Form 10-Q. A reconciliation of non-GAAP measures to the most directly comparable GAAP measure is included within tables in the presentation or with the appendix to this presentation. 3

Key Accomplishments 4 Progress toward key goals for 2013 Reduced problem assets by $25.5 million, or 18%, in 1Q, at negligible cost – NPLs fell $8.9 million (11%) to $70.6 million – OREO reduced $16.6 million (26%) to $46.5 million – NPAs reduced to 5.6% of total assets, down from 8.8% – $0.2 million net loan recoveries and $0.3 million net OREO losses, $0.1 million provision Continued implementation of “Back to Business” strategies – Residential mortgage origination up 27% over 1Q 2012 – Commercial loan origination up 252% – Consumer loan origination up 182% – Total loan production up 96% vs 1Q 12 and up 4% vs 4Q 12 Improvements in deposit portfolio in 1Q – Grew low cost core, non-CD, deposits $21.2 million or 7.6% annualized rate – Increased low cost core to 63% of total deposits, up from 60% – Cost of deposits fell 9 basis points to 0.49% Bank legal merger on June 8, 2013, subject to receipt of regulatory approval Bank of Granite Order lifted effective February 27th

Quarterly Operating Highlights 1Q net loss before tax of $2.7 million – Best performance since 2Q 2009 1Q 2013 net loss from continuing operations of $4.6 million, $1.7 million better than 4Q 2012, and $6.2 million better than 1Q 2012 – $1.9 million tax expense related to deferred tax asset allowance Net loss per common share of $0.21 per share, compared to net losses of $0.29 in 4Q 2012 and net loss per common share of $0.51 in 1Q 2012 Net interest margin was improved at 3.20% in 1Q vs 2.96% sequential quarter and 2.82% linked quarter All quarters reflect the full results of Granite 5 Quarterly Performance Metrics Dollars in thousands except per share data 1Q 2012 2Q 2012 3Q 2012 4Q 2012 1Q 2013 Net loss before taxes from continuing operations (10,909)$ (18,112)$ (4,789)$ (7,207)$ (2,743)$ Net loss from continuing operations, net of taxes (10,832) (18,138) (4,712) (6,296) (4,596) Net loss to common shareholders (10,859) (18,138) (4,712) (6,296) (4,596) (0.51) (0.86) (0.22) (0.29) (0.21) Net loss to common shareholders per share (0.51) (0.86) (0.22) (0.29) (0.21) Return on average assets (1.82%) (3.13%) (0.84%) (1.14%) (0.87%) Return on average equity (34.26%) (60.99%) (17.51%) (24.00%) (19.04%) Net interest margin 2.82% 3.06% 2.95% 2.96% 3.20% Core noninterest expense to average assets 1 3.06% 3.38% 3.37% 3.14% 3.65% 1 Non-GAAP measure. See Appendix for reconciliation to GAAP presentation. Net loss from continuing operations to common shareholders per share Quarterly Results Results of Operations Dollars in thousands, except per share data 1Q 2012 2Q 2012 3Q 2012 4Q 2012 1Q 2013 et interest income 15,180$ 16,049$ 15,202$ 14,849$ 15,173$ Provision for loan losses (3,067) (7,778) (32) (3,172) (110) Noninterest income 3,826 6,532 4,643 6,957 6,533 Noninterest expense (26,848) (32,915) (24,602) (25,841) (24,339) Net loss from continuing operations, net of taxes (10,832) (18,138) (4,712) (6,296) (4,596) Net loss from discontinued operations, net of taxes (27) - - - - Net loss to common shareholders (10,859)$ (18,138)$ (4,712)$ (6,296)$ (4,596)$ Weighted average basic and diluted shares outstanding 21,102,465 21,190,848 21,588,027 21,368,460 21,698,115

Core Earnings Core earnings net income of $0.1 million in 1Q 2013 decreased $2.2 million from 4Q 2012 $0.3 million increase in net interest income $0.6 million decline in core noninterest income – $0.3 million seasonal and rate related decline in mortgage – $0.3 million service charges weakness on seasonality and product change service charge waivers $1.9 million increase in core noninterest expense – $1 million increase in compensation expense on payroll taxes in 1Q 2013 and bonus accrual reversals in 4Q 2012 – $0.3 million increase in legal expenses – By June 30, 8 branch consolidations and 30+ merger FTE reductions 6 Quarterly Core Earnings 1 Dollars in thousands except per share data 1Q 2012 2Q 2012 3Q 2012 4Q 2012 1Q 2013 Net loss to common shareholders (10,859)$ (18,138)$ (4,712)$ (6,296)$ (4,596)$ Less taxes, credit costs and nonrecurring items: Loss on discontinued operations, net (27) - - - - TaxesIncome tax benefit (expense) 77 (26) 77 911 (1,853) Other real estate owned expenseGain on sales of securiti s (46) 2,002 (33) 2,198 2,377 Provision expenseOther real estate owned expense (5,519) (12,473) (3,602) (6,289) (883) Merger related expenseProvision for loan losses (3,067) (7,778) (32) (3,172) (110) Granite and litigation accruals - (1,100) - - - Loan collection expense (746) (514) (1,119) (895) (1,572) Branch closure and severance expense - - - (96) (587) Rebranding expense - - - (397) (552) Merger-related expense (2,258) 840 (939) (884) (1,509) Core Earnings 1 727$ 911$ 936$ 2,328$ 93$ 1 Non-GAAP measure. Table reconciles to GAAP presentation.

Net Interest Margin Net interest margin improved 24 bps in the 1st quarter to 3.20%, and improved 38 bps over 1Q 2012 Average loans and securities, which exclude low yielding cash balances, fell by $5.9 million in 1Q 2013 Average loan yield increased 12 bps to 5.24% on improved yields in Granite purchased loans Average loans fell $62.6 million (5%) during 1Q 2013 on runoff of purchased residential loan pools, continued asset resolution and loan prepayment that exceeded new origination $47.1 million (75%) of the net reduction in period end loan balances were non-Pass and residential mortgage pool loans Continued improved deposit mix resulted in 10 bp decline in cost of deposits to 57 bps in 1Q 2013, down from 67 bps in 4Q 2012, and down 34 bps from 1Q 2012 7 0.0% 1.0% 2.0% 3.0% 4.0% 5.0% 6.0% 1Q 2012 2Q 2012 3Q 2012 4Q 2012 1Q 2013 Yield on Loans Yield on Investment Securities 0.0% 0.5% 1.0% 1.5% 2.0% 2.5% 3.0% 3.5% 1Q 012 2Q 2012 3Q 2012 4Q 2012 1Q 2013 Cost of Interest Bearing D posits Net Interest Margin Quarterly Results Average Balances, Yields and Net Interest Margin Dollars in thousands 1Q 2012 2Q 2012 3Q 2012 4Q 2012 1Q 2013 Average loans (includes loans held for sale) 1,224,349$ 1,287,022$ 1,262,229$ 1,209,947$ 1,147,347$ Average yield 5.59% 5.40% 5.14% 5.12% 5.24% Average loans and securities 1,662,210 1,744,436 1,737,261 1,718,446 1,712,572 Average earning assets 2,170,079 2,115,029 2,055,193 2,000,882 1,931,330 Average yield 3.71% 3.89% 3.73% 3.66% 3.80% Average interest bearing liabilities 1,999,005 1,926,658 1,858,339 1,811,224 1,734,391 Average rate 0.97% 0.91% 0.86% 0.77% 0.68% Average cost of deposits 0.91% 0.83% 0.76% 0.67% 0.57% Net interest margin 2.82% 3.06% 2.95% 2.96% 3.20% Net interest rate spread 2.75% 2.98% 2.87% 2.89% 3.13% Quarterly Loan and Securities Yields Quarterly Margin and Cost of Deposits

Quarterly Noninterest Income Total noninterest income decreased $0.4 million in 1Q 2013, and increased $2.7 million compared to 1Q 2012 – Nonrecurring securities gains of $2.4 million in 1Q 2013 compared to 1Q 2012 Core noninterest income decreased $0.6 million (13%) to $4.1 million from 4Q 2012, and increased $0.3 million compared to 1Q 2012, an 8% increase – $0.3 million, seasonal and rate related decline in mortgage – $0.3 million service charges weakness on seasonality and product change service charge waivers 8 Quarterly Results Noninterest Income Dollars in thousands 1Q 2012 2Q 2012 3Q 2012 4Q 2012 1Q 2013 Service charges on deposit accounts 1,816$ 1,830$ 1,778$ 1,656$ 1,376$ Mortgage loan income 36 287 728 1,014 744 Cardholder and merchant services income 1,141 1,176 1,119 1,143 1,069 Trust and investment services 202 256 234 344 241 Bank-owned life insurance 306 314 290 285 263 Other service charges, commissions and fees 254 271 252 351 258 Securities gains/(losses), net (46) 2,002 (33) 2,198 2,377 Other income/(loss) 117 396 275 (34) 205 Total noninterest income 3,826$ 6,532$ 4,643$ 6,957$ 6,533$ Less: Securities gains/(losses), net (46) 2,002 (33) 2,198 2,377 Core noninterest income 1 3,872$ 4,530$ 4,676$ 4,759$ 4,156$ 1 Non-GAAP measure. Reconciliation included in this table.
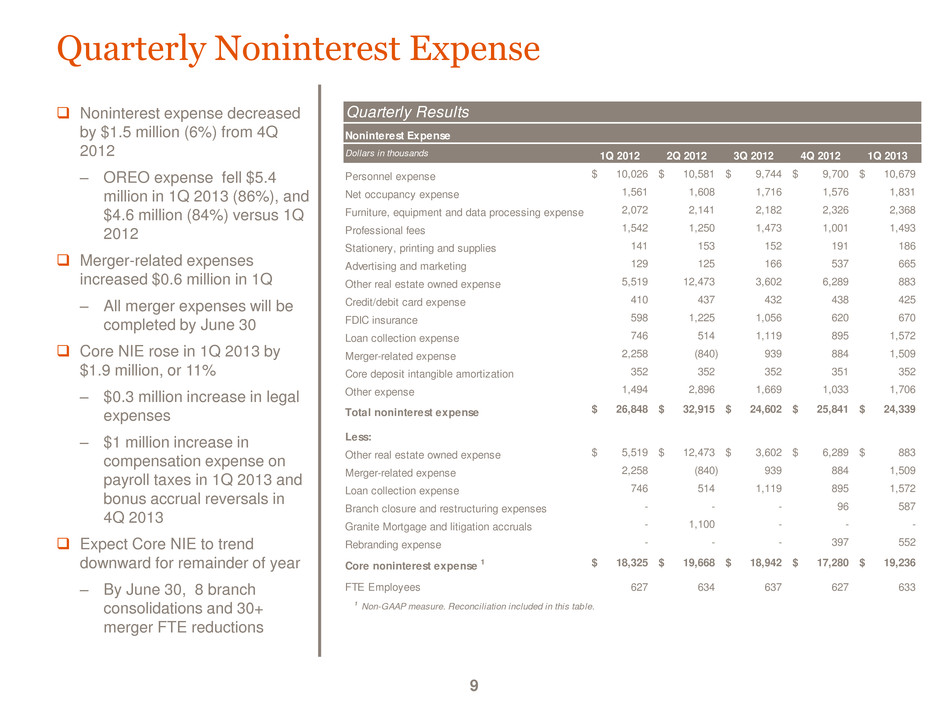
Quarterly Noninterest Expense Noninterest expense decreased by $1.5 million (6%) from 4Q 2012 – OREO expense fell $5.4 million in 1Q 2013 (86%), and $4.6 million (84%) versus 1Q 2012 Merger-related expenses increased $0.6 million in 1Q – All merger expenses will be completed by June 30 Core NIE rose in 1Q 2013 by $1.9 million, or 11% – $0.3 million increase in legal expenses – $1 million increase in compensation expense on payroll taxes in 1Q 2013 and bonus accrual reversals in 4Q 2013 Expect Core NIE to trend downward for remainder of year – By June 30, 8 branch consolidations and 30+ merger FTE reductions 9 Quarterly Results Noninterest Expense Dollars in thousands 1Q 2012 2Q 2012 3Q 2012 4Q 2012 1Q 2013 Personnel expense 10,026$ 10,581$ 9,744$ 9,700$ 10,679$ Net occupancy expense 1,561 1,608 1,716 1,576 1,831 Furniture, equipment and data processing expense 2,072 2,141 2,182 2,326 2,368 Professional fees 1,542 1,250 1,473 1,001 1,493 Stationery, printing and supplies 141 153 152 191 186 Advertising and marketing 129 125 166 537 665 Other real estate owned expense 5,519 12,473 3,602 6,289 883 Credit/debit card expense 410 437 432 438 425 FDIC insurance 598 1,225 1,056 620 670 Loan collection expense 746 514 1,119 895 1,572 Merger-related expense 2,258 (840) 939 884 1,509 Core deposit intangible amortization 352 352 352 351 352 Other expense 1,494 2,896 1,669 1,033 1,706 Total noninterest expense 26,848$ 32,915$ 24,602$ 25,841$ 24,339$ Less: Other real estate owned expense 5,519$ 12,473$ 3,602$ 6,289$ 883$ Merger-related expense 2,258 (840) 939 884 1,509 Loan collection expense 746 514 1,119 895 1,572 Branch closure and restructuring expenses - - - 96 587 Granite Mortgage and litigation accruals - 1,100 - - - Rebranding expense - - - 397 552 Core noninterest expense 1 18,325$ 19,668$ 18,942$ 17,280$ 19,236$ FTE Employees 627 634 637 627 633 1 Non-GAAP measure. Reconciliation included in this table.

20% 16% 15% 11% 13% 20% 21% 22% 26% 27% 51% 54% 54% 53% 52% 10% 9% 9% 9% 8% 0% 10% 20% 30% 40% 50% 60% 70% 80% 90% 100% 1Q 2012 2Q 2012 3Q 2012 4Q 2012 1Q 2013 Cash and bank balances Investment securities Loans Other assets Balance Sheet Total assets fell $58.3 million (3%) during 1Q 2013 – Cash and interest bearing balances increased $22.7 (9%) due to sale of OREO, and loan repayment – Net loans decreased $58.6 million (5%) on residential mortgage pool repayment, problem asset resolution, and loan payoff activity that outpaced new loan origination – OREO decreased $16.6 million (26%) Deposits declined $50.8 million (3%) – Improved mix change from time deposits to lower rate deposit products continued Balance sheet excludes reserved deferred tax assets of $184.2 million, including $35.6 million relating to Granite 10 Quarterly Balance Sheet Dollars in thousands 1Q 2012 2Q 2012 3Q 2012 4Q 2012 1Q 2013 Cash and interest bearing bank balances 468,549$ 363,879$ 327,870$ 239,610$ 262,293$ Investment securities 473,916 477,136 492,386 564,850 565,870 Loans and loans held for sale, net 1,209,902 1,244,596 1,209,148 1,147,721 1,089,136 Other real estate owned 104,379 86,400 80,800 63,131 46,537 Intangible assets 12,030 11,678 11,574 11,700 11,650 Other assets 119,170 118,072 116,287 124,553 117,825 Total assets 2,387,946$ 2,301,761$ 2,238,065$ 2,151,565$ 2,093,311$ Deposits 2,120,081$ 2,041,770$ 1,982,253$ 1,906,988$ 1,856,161$ Borrowings 123,400 126,507 124,474 123,705 122,320 26,491 25,482 24,465 22,427 25,456 Equity 117,974 108,002 106,873 98,445 89,374 Total liabilities and equity 2,387,946$ 2,301,761$ 2,238,065$ 2,151,565$ 2,093,311$ Other liabilities Quarterly Balance Sheet Composition
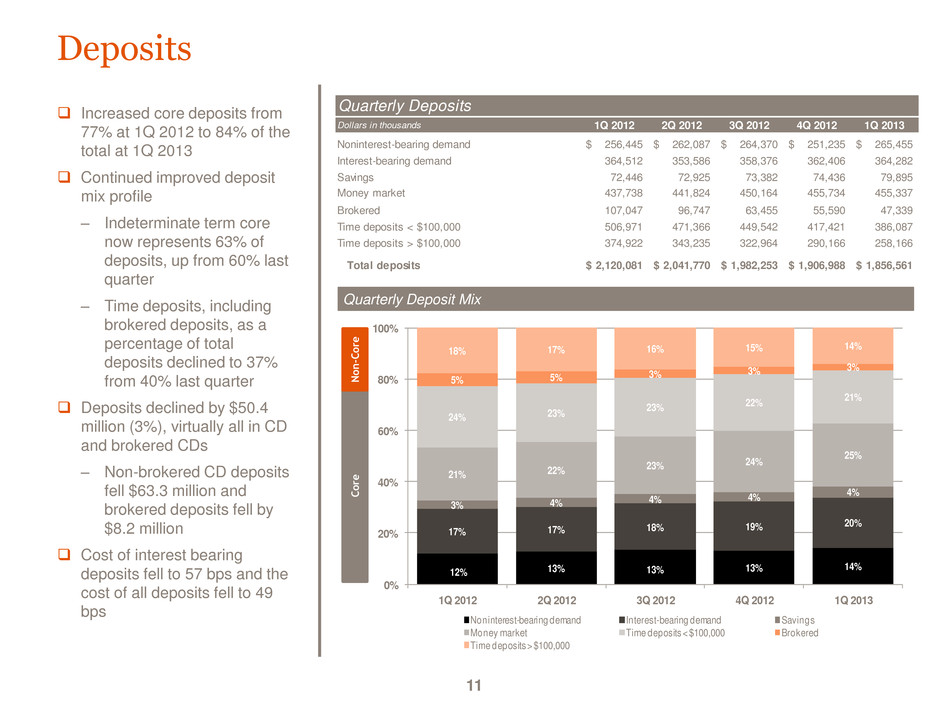
Deposits Increased core deposits from 77% at 1Q 2012 to 84% of the total at 1Q 2013 Continued improved deposit mix profile – Indeterminate term core now represents 63% of deposits, up from 60% last quarter – Time deposits, including brokered deposits, as a percentage of total deposits declined to 37% from 40% last quarter Deposits declined by $50.4 million (3%), virtually all in CD and brokered CDs – Non-brokered CD deposits fell $63.3 million and brokered deposits fell by $8.2 million Cost of interest bearing deposits fell to 57 bps and the cost of all deposits fell to 49 bps 11 12% 13% 13% 13% 14% 17% 17% 18% 19% 20% 3% 4% 4% 4% 4% 21% 22% 23% 24% 25% 24% 23% 23% 22% 21% 5% 5% 3% 3% 3% 18% 17% 16% 15% 14% 0% 20% 40% 60% 80% 100% 1Q 2012 2Q 2012 3Q 2012 4Q 2012 1Q 2013 Noninterest-bearing demand Interest-bearing demand Savings Money market Time deposits < $100,000 Brokered Time deposits > $100,000 Quarterly Deposits Dollars in thousands 1Q 2012 2Q 2012 3Q 2012 4Q 2012 1Q 2013 Noninterest-bearing demand 256,445$ 262,087$ 264,370$ 251,235$ 265,455$ Interest-bearing demand 364,512 353,586 358,376 362,406 364,282 Savings 72,446 72,925 73,382 74,436 79,895 Money market 437,738 441,824 450,164 455,734 455,337 Brokered 107,047 96,747 63,455 55,590 47,339 Time deposits < $100,000 506,971 471,366 449,542 417,421 386,087 Time deposits > $100,000 374,922 343,235 322,964 290,166 258,166 Total deposits 2,120,081$ 2,041,770$ 1,982,253$ 1,906,988$ 1,856,561$ Quarterly Deposit Mix Co re N o n -Co re

Capital and Liquidity Capital ratios at both banks remain above the level defined as “well capitalized” under applicable law On February 27, 2013 the FDIC terminated its Order with Granite CommunityOne is currently designated as “adequately capitalized” by the OCC because it remains subject to an Order – CommunityOne’s leverage and total risk based capital ratios remain below the levels required in its Order Pro forma combined bank leverage ratio was 6.90% The loans to deposits ratio declined to 60% in 1Q 2013, but improved slightly from 59% at 1Q 2012 12 Quarterly Capital and Liquidity Ratios Well Regulatory 1Q 2012 2Q 2012 3Q 2012 4Q 2012 1Q 2013 Capitalized Order FNB United Corp Leverage 6.22% 5.83% 5.68% 5.45% 5.37% 5.00% Tier 1 risk based capital 10.53% 9.62% 9.60% 9.26% 9.19% 6.00% Total risk based capital 12.93% 12.19% 12.47% 12.34% 12.58% 10.00% Tangible common equity/tangible assets 4.46% 4.21% 4.28% 4.05% 3.73% Loans/deposits 59% 63% 62% 62% 60% Cash and investment securities/deposits 44% 41% 41% 42% 45% CommunityOne Bank Leverage 6.86% 6.47% 6.46% 6.17% 6.15% 5.00% 9.00% Tier 1 risk based capital 11.78% 10.45% 10.52% 10.13% 10.24% 6.00% Total risk based capital 13.07% 11.73% 11.79% 11.40% 11.51% 10.00% 12.00% Bank of Granite Leverage 7.64% 7.61% 7.88% 8.12% 8.51% 5.00% Tier 1 risk based capital 12.86% 13.37% 14.54% 15.04% 15.56% 6.00% Total risk based capital 12.92% 13.53% 15.57% 16.30% 16.81% 10.00%

Asset Quality We significantly improved asset quality in 1Q – Classified loans decreased by over $71 million (34%) compared to 1Q 2012 – Special Mention loans decreased by $44 million (41%) since 1Q 2012 – $137 million of Classified loans and $63 million of Special Mention loans remain The allowance has been reduced from $39.8 million to $29.6 million from 1Q 2012, reflecting the improved asset quality The remaining fair value adjustment on the acquired Granite portfolio fell by $1.7 million as a result of accretion and realization of expected loss content 13 $107 $92 $82 $72 $63 $208 $192 $170 $153 $137 $0 $50 $100 $150 $200 $250 $300 $350 1Q 2012 2Q 2012 3Q 2012 4Q 2012 1Q 2013 M ill io n s of D ol la rs Special Mention Classif ied $105 $96 $86 $79 $71 $104 $86 $81 $63 $47 $0 $50 $100 $150 $200 $250 1 2012 2 2012 3Q 2012 4Q 2012 1Q 2013 M ill io ns o f D ol la rs Nonperforming loans OREO and foreclosed assets Quarterly Problem Asset Trends Quarterly Asset Quality 1 Dollars in thousands 1Q 2012 2Q 2012 3Q 2012 4Q 2012 1Q 2013 Allowance for loan losses (ALL) 39,795$ 38,551$ 30,859$ 29,314$ 29,641$ Remaining fair value (FV) mark on Granite portfolio 20,662 14,767 10,851 7,824 6,150 Nonperforming loans / Total loans 8.5% 7.5% 7.0% 6.8% 6.3% Nonperforming assets / Total assets 8.8% 7.9% 7.5% 6.6% 5.6% Annualized net charge-offs / Average loans 0.87% 2.83% 2.46% 1.94% -0.07% All wance f r loan loss / Total loans 3.19% 3.01% 2.51% 2.49% 2.66% Pro forma ALL and FV mark / Total loans 1 4.85% 4.16% 3.39% 3.16% 3.21% 1 Non-GAAP presentation, see Appendix. Includes remaining fair value marks on purchased Granite loans

Nonperforming Assets Nonperforming loans fell by $34.8 million (33%) and $8.9 million (11%) since 1Q 2012 and 4Q 2012, respectively Real estate construction loans remain a troubled category and we have reduced them by $11.6 million (50%) and $2.5 million (18%) since 1Q 2012 and 4Q 2012, respectively OREO dispositions have been outpacing foreclosure additions. OREO was reduced by $16.6 million (26%) in the 1st quarter As of March 31, 2013, $7.3 million of OREO (16%) was under contract for sale and carried at the sales price net of costs to sell Non-performing assets have been reduced by $92.7 million (44%) since 1Q 2012 14 Nonperforming Loans and OREO Dollars in thousands 1Q 2012 2Q 2012 3Q 2012 4Q 2012 1Q 2013 Commercial and agricultural 4,259$ 2,934$ 3,147$ 2,796$ 2,350$ Real estate - construction 23,383 24,853 18,506 14,297 11,762 Real estate - mortgage: 1-4 family residential 30,427 22,300 22,131 18,372 19,166 Commercial 46,825 44,817 42,133 43,798 37,217 Consumer 447 633 226 206 63 Total nonperforming loans 105,341 95,537 86,143 79,469 70,558 OREO, other foreclosed assets and disc ops assets 104,379 86,400 80,800 63,131 46,537 Total nonperforming assets 209,720$ 181,937$ 166,943$ 142,600$ 117,095$ Quarterly Nonperforming Loan Composition 0% 20% 40% 60% 80% 100% 1Q 2012 2Q 2012 3Q 2012 4Q 2012 1Q 2013 Consumer Real estate - construction Commercial and agricultural RE - Commercial RE - 1-4 Family

Loan Portfolio Total loans decreased $130.9 million (10%) from 1Q 2012 and $65.2 million (6%) in 1Q 2013. $24.5 million of net 1Q reductions were non-Pass rated loans 1-4 family residential mortgage loans portfolio comprised $33 million (51%) of the 1Q 2013 loan portfolio contraction. The reduction was driven by prepayments on our portfolio of originated mortgages and prepayments/amortization of purchased loan pools Real Estate Construction loans fell by $21.5 million (27%) from 1Q 2012 to 5% of our total loans at 1Q 2013 Credit costs for 1Q 2013 included net recoveries of $0.2 million and OREO write- downs, net of gains on sale, of $0.3 million 11% reduction in criticized loans since 4Q 2012 15 Quarterly Loan Portfolio Dollars in thousands 1Q 2012 2Q 2012 3Q 2012 4Q 2012 1Q 2013 Loans held for sale 3,938$ 1,324$ 8,212$ 6,974$ 5,012$ Loans held for investment: Commercial and agricultural 85,475 78,367 72,669 79,704 77,490 Real estate-construction 79,122 75,576 61,263 58,414 57,653 Real estate-mortgage: 1-4 family residential 529,300 589,972 590,251 553,538 520,808 Commercial 508,067 493,721 463,173 441,836 414,995 Consumer 43,795 44,187 44,439 43,543 42,819 Total Loans held for investment 1,245,759 1,281,823 1,231,795 1,177,035 1,113,765 Total loans 1,249,697$ 1,283,147$ 1,240,007$ 1,184,009$ 1,118,777$ 4% 3% 4% 4% 4% 41% 38% 37% 37% 37% 42% 46% 48% 47% 47% 6% 6% 5% 5% 5% 7% 6% 6% 7% 7% 0% 10% 20% 30% 40% 50% 60% 70% 80% 90% 100% 1Q 2012 2Q 2012 3Q 2012 4Q 2012 1Q 2013 Loans held for sale Commercial and agricultural Real estate- construction 1-4 family residential CRE, OO and NOO Consumer Quarterly Loan Portfolio Mix
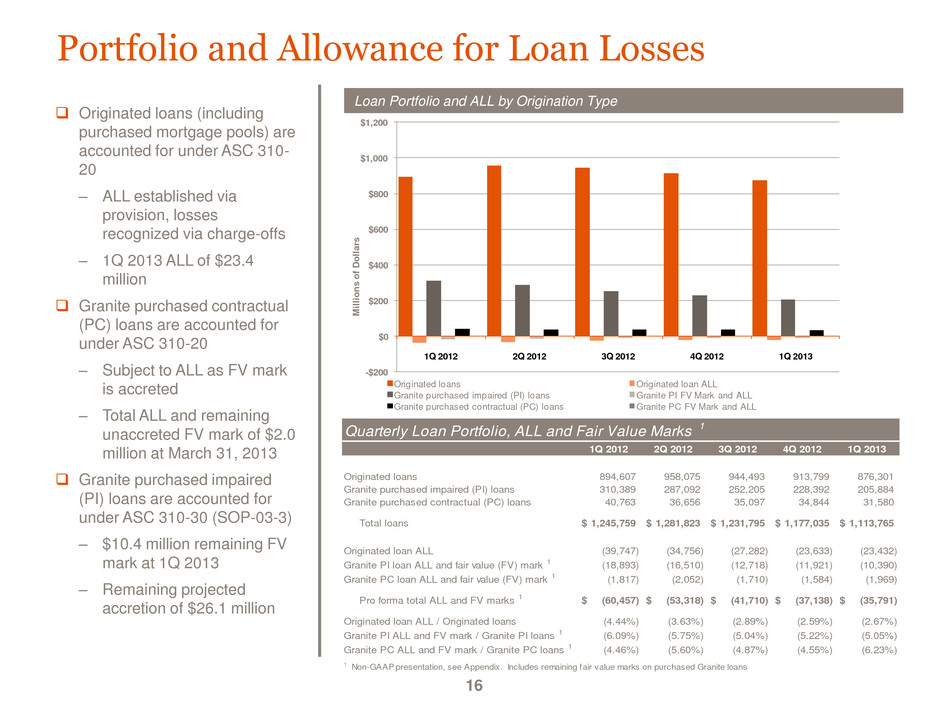
-$200 $0 $200 $400 $600 $800 $1,000 $1,200 1Q 2012 2Q 2012 3Q 2012 4Q 2012 1Q 2013 M ill io ns o f D ol la rs Originated loans Originated loan ALL Granite purchased impaired (PI) loans Granite PI FV Mark and ALL Granite purchased contractual (PC) loans Granite PC FV Mark and ALL Portfolio and Allowance for Loan Losses Originated loans (including purchased mortgage pools) are accounted for under ASC 310- 20 – ALL established via provision, losses recognized via charge-offs – 1Q 2013 ALL of $23.4 million Granite purchased contractual (PC) loans are accounted for under ASC 310-20 – Subject to ALL as FV mark is accreted – Total ALL and remaining unaccreted FV mark of $2.0 million at March 31, 2013 Granite purchased impaired (PI) loans are accounted for under ASC 310-30 (SOP-03-3) – $10.4 million remaining FV mark at 1Q 2013 – Remaining projected accretion of $26.1 million 16 Quarterly Loan Portfolio, ALL and Fair Value Marks 1 1Q 2012 2Q 2012 3Q 2012 4Q 2012 1Q 2013 Originated loans 894,607 958,075 944,493 913,799 876,301 Granite purchased impaired (PI) loans 310,389 287,092 252,205 228,392 205,884 Granite purchased contractual (PC) loans 40,763 36,656 35,097 34,844 31,580 Total loans 1,245,759$ 1,281,823$ 1,231,795$ 1,177,035$ 1,113,765$ Originated loan ALL (39,747) (34,756) (27,282) (23,633) (23,432) Granite PI loan ALL and fair value (FV) mark 1 (18,893) (16,510) (12,718) (11,921) (10,390) Granite PC loan ALL and fair valu (FV m rk 1 (1,817) (2,052) (1,710) (1,584) (1,969) Pro forma total ALL and FV marks 1 (60,457)$ (53,318)$ (41,710)$ (37,138)$ (35,791)$ Originated loan ALL / Originated loans (4.44%) (3.63%) (2.89%) (2.59%) (2.67%) Granite PI ALL and FV mark / Granite PI loans 1 (6.09%) (5.75%) (5.04%) (5.22%) (5.05%) Granite PC ALL and FV mark / Granite PC loans 1 (4.46%) (5.60%) (4.87%) (4.55%) (6.23%) 1 Non-GAAP presentation, see Appendix. Includes remaining fair value marks on purchased Granite loans Loan Portfolio and ALL by Origination Type

17 2013 Goals Complete the merger Merge Granite into CommunityOne on June 8 – Consolidate branch and ATM networks – Complete consolidation of operational functions – Implement new product set at Granite branches – Capture remaining expense synergies – Better serve customers throughout footprint Reduced NPAs by 18% in 1Q at negligible cost Complete credit cleanup Anticipate return to profitability in the second half of 2013 – NIM up 24 basis points in 1Q – Additional reductions in core NIE – Continued reduction in credit-related costs Return to profitability FDIC action to lift Granite Order acknowledges progress to date Continue Improvements to return to satisfactory condition 2013 Goals

Appendix 18

Non-GAAP Measures Reconciliation of non-GAAP measures to the most directly comparable GAAP measure 19 Reconciliation of Non-GAAP Measures Dollars in thousands 1Q 2012 2Q 2012 3Q 2012 4Q 2012 1Q 2013 Total shareholders' equity 117,974$ 108,002$ 106,873$ 98,445$ 89,374$ Less: Goodwill (4,205) (4,205) (4,205) (4,205) (4,205) Core deposit and other intangibles (7,825) (7,473) (7,369) (7,495) (7,445) Tangible shareholders' equity 105,944$ 96,324$ 95,299$ 86,745$ 77,724$ 1Q 2012 2Q 2012 3Q 2012 4Q 2012 1Q 2013 Originated loan ALL (39,747)$ (34,756)$ (27,282)$ (23,633)$ (23,432)$ Purchased contractual (PC) loan ALL (48) (459) (281) (308) (836) Purchased impaired (PI) loan ALL - (3,336) (3,296) (5,373) (5,373) Total allowance for loan losses (39,795) (38,551) (30,859) (29,314) (29,641) Plus: Fair value (FV) mark on PC loans (1,769) (1,593) (1,429) (1,276) (1,133) Fair value (FV) mark on PI loans (18,893) (13,174) (9,422) (6,548) (5,017) Pro forma total ALL and FV mark (60,457)$ (53,318)$ (41,710)$ (37,138)$ (35,791)$ Purchased impaired (PI) loan ALL -$ (3,336)$ (3,296)$ (5,373)$ (5,373)$ Fair value (FV) mark on PI loans (18,893) (13,174) (9,422) (6,548) (5,017) Granite PI loan ALL and FV mark (18,893)$ (16,510)$ (12,718)$ (11,921)$ (10,390)$ Purchased contractual (PC) loan ALL (48)$ (459)$ (281)$ (308)$ (836)$ Fair value (FV) mark on PC loans (1,769) (1,593) (1,429) (1,276) (1,133) Granite PC loan ALL and FV mark (1,817)$ (2,052)$ (1,710)$ (1,584)$ (1,969)$