UNITED STATES
SECURITIES AND EXCHANGE COMMISSION
Washington, D.C. 20549
FORM 8-K
CURRENT REPORT
Pursuant to Section 13 or 15(d) of the
Securities Exchange Act of 1934
Date of Report (Date of earliest event reported): December 31, 2013
Commission File Number |
|
Exact Name of Registrant as Specified in |
|
IRS Employer |
|
|
|
|
|
1-8962 |
|
Pinnacle West Capital Corporation |
|
86-0512431 |
|
|
|
|
|
1-4473 |
|
Arizona Public Service Company |
|
86-0011170 |
Check the appropriate box below if the Form 8-K filing is intended to simultaneously satisfy the filing obligation of the registrant under any of the following provisions:
o Written communications pursuant to Rule 425 under the Securities Act (17 CFR 230.425)
o Soliciting material pursuant to Rule 14a-12 under the Exchange Act (17 CFR 240.14a-12)
o Pre-commencement communications pursuant to Rule 14d-2(b) under the Exchange Act (17 CFR 240.14d-2(b))
o Pre-commencement communications pursuant to Rule 13e-4(c) under the Exchange Act (17 CFR 240.13e-4(c))
This combined Form 8-K is separately filed or furnished by Pinnacle West Capital Corporation and Arizona Public Service Company. Each registrant is filing or furnishing on its own behalf all of the information contained in this Form 8-K that relates to such registrant and, where required, its subsidiaries. Except as stated in the preceding sentence, neither registrant is filing or furnishing any information that does not relate to such registrant, and therefore makes no representation as to any such information.
Item 2.02. Results of Operations and Financial Condition and Item 7.01. Regulation FD Disclosure.
The following information is furnished pursuant to both Item 2.02 and 7.01.
On February 21, 2014, Pinnacle West Capital Corporation (Pinnacle West or the Company) issued a press release regarding its financial results for the fiscal quarter and full year ended December 31, 2013 and its earnings outlook for 2014. A copy of the press release is attached hereto as Exhibit 99.1.
The Company is providing a quarterly and full year consolidated statistical summary and earnings variance explanations and a copy of the slide presentation made in connection with its earnings conference call on February 21, 2014. This information contains Company operating results for the fiscal quarter and fiscal year ended December 31, 2013 and is attached hereto as Exhibits 99.2, 99.3 and 99.4. The statistical summary, earnings variance explanations, and slide presentation are concurrently being posted to the Companys website at www.pinnaclewest.com, which also contains a glossary of relevant terms.
Item 5.02. Departure of Directors or Certain Officers; Election of Directors; Appointment of Certain Officers; Compensatory Arrangements of Certain Officers.
On February 19, 2014, the Board of Directors (the Board) of Pinnacle West expanded the number of directors on the Board by two and elected Messrs. Richard P. Fox and David P. Wagener as Directors. Messrs. Fox and Wageners initial terms will extend until the Pinnacle West 2014 Annual Meeting of Shareholders in May 2014 (2014 Annual Meeting of Shareholders). The Board of Arizona Public Service Company (APS), the principal subsidiary of Pinnacle West, also elected Messrs. Fox and Wagener to its Board. Mr. Fox has been appointed to the Audit and Finance Committees of Pinnacle West and Mr. Wagener has been appointed to the Finance and Nuclear and Operating Committees of Pinnacle West. Messrs. Fox and Wagener will participate in the compensation arrangements for non-employee directors described on page 57 of the Pinnacle West Proxy Statement for its Annual Meeting of Shareholders held on May 15, 2013, except the annual retainer and equity grant will be prorated to reflect their service from the date of their election until the 2014 Annual Meeting of Shareholders.
Item 9.01. Financial Statements and Exhibits.
(d) Exhibits
Exhibit |
|
Registrant(s) |
|
Description |
|
|
|
|
|
99.1 |
|
Pinnacle West |
|
Earnings News Release issued on February 21, 2014. |
|
|
|
|
|
99.2 |
|
Pinnacle West |
|
Pinnacle West quarterly consolidated statistical summary for the three-month and twelve-month periods ended December 31, 2013 and 2012. |
|
|
|
|
|
99.3 |
|
Pinnacle West |
|
Pinnacle West 4th Quarter and Full-Year 2013 Results slide presentation accompanying February 21, 2014 conference call. |
|
|
|
|
|
99.4 |
|
Pinnacle West |
|
Pinnacle West earnings variance explanations for the three and twelve months ended December 31, 2013 and 2012 and Consolidated Statements of Income for the three and twelve months ended December 31, 2013 and 2012. |
SIGNATURES
Pursuant to the requirements of the Securities Exchange Act of 1934, each registrant has duly caused this report to be signed on its behalf by the undersigned hereunto duly authorized.
|
PINNACLE WEST CAPITAL CORPORATION | |
|
(Registrant) | |
|
| |
|
|
|
Dated: February 21, 2014 |
By: |
/s/ James R. Hatfield |
|
|
James R. Hatfield |
|
|
Executive Vice President and |
|
|
Chief Financial Officer |
|
|
|
|
|
|
|
ARIZONA PUBLIC SERVICE COMPANY | |
|
(Registrant) | |
|
|
|
|
|
|
Dated: February 21, 2014 |
By: |
/s/ James R. Hatfield |
|
|
James R. Hatfield |
|
|
Executive Vice President and |
|
|
Chief Financial Officer |
Exhibit Index
Exhibit |
|
Registrant(s) |
|
Description |
|
|
|
|
|
99.1 |
|
Pinnacle West |
|
Earnings News Release issued on February 21, 2014. |
|
|
|
|
|
99.2 |
|
Pinnacle West |
|
Pinnacle West quarterly consolidated statistical summary for the three-month and twelve-month periods ended December 31, 2013 and 2012. |
|
|
|
|
|
99.3 |
|
Pinnacle West |
|
Pinnacle West 4th Quarter and Full-Year 2013 Results slide presentation accompanying February 21, 2014 conference call. |
|
|
|
|
|
99.4 |
|
Pinnacle West |
|
Pinnacle West earnings variance explanations for the three and twelve months ended December 31, 2013 and 2012 and Consolidated Statements of Income for the three and twelve months ended December 31, 2013 and 2012. |
Exhibit 99.1
FOR IMMEDIATE RELEASE |
February 21, 2014 | |
Media Contact: |
Alan Bunnell, (602) 250-3376 |
|
Analyst Contact: |
Paul Mountain, (602) 250-4952 |
|
Website: |
pinnaclewest.com |
|
PINNACLE WEST REPORTS 2013 FOURTH-QUARTER
AND FULL-YEAR RESULTS
· Fourth-quarter results impacted by lower retail energy sales and milder-than-normal weather
· Full-year results benefit from superior operational performance and cost management
· 2013 results in top half of earnings guidance range
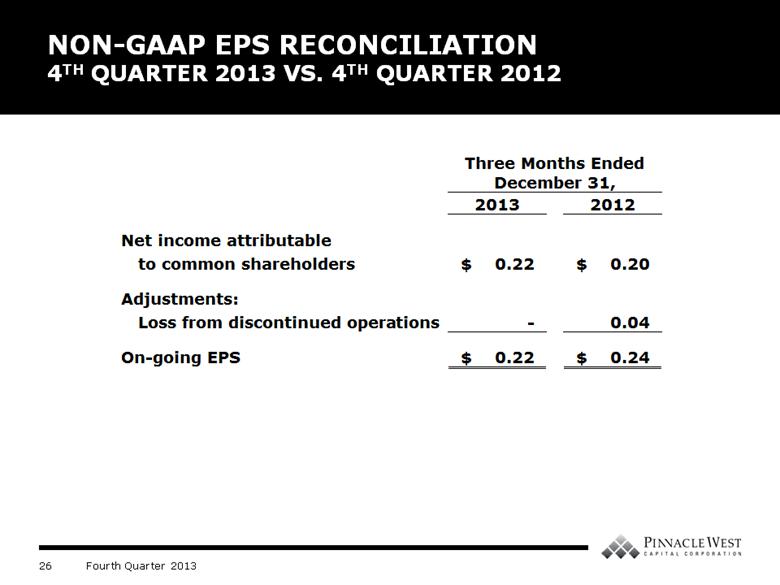
PHOENIX - Pinnacle West Capital Corporation (NYSE: PNW) today reported consolidated on-going earnings of $24.3 million, or $0.22 per diluted share of common stock, for the quarter ended December 31, 2013. This result compares with on-going earnings of $26.9 million, or $0.24 per share, in the same 2012 period. The Companys net income attributable to common shareholders for the 2013 fourth quarter was $24.3 million, or $0.22 per diluted share, compared with net income of $22.6 million, or $0.20 per share, for the same quarter a year ago.
For full-year 2013, Pinnacle West reported consolidated on-going earnings of $406.1 million, or $3.66 per diluted share, compared to $387.4 million, or $3.50 per share, a year ago. The Companys consolidated net income attributable to common shareholders for 2013 also was $3.66 per diluted share, compared with $3.45 per share in 2012.
By managing our costs and focusing on operational excellence, our employees delivered solid full-year financial results for shareholders while also maintaining superior service for our 1.2 million customers, said Pinnacle West Chairman, President and Chief Executive Officer Don Brandt. We provided our customers with top-tier service reliability, maintained superior power plant performance, and once again ranked among the top 10 percent in the electric utility industry for overall customer satisfaction.
Brandt cited additional examples of the Companys recent achievements:
· About 400 megawatts (MW) of solar capacity was added to APSs system in 2013, the most the company has tallied in a single year, thus growing total solar resources to 755 MW.
· The purchase of Southern California Edisons ownership in Units 4 and 5 of the Four Corners Power Plant was completed, and the plants older, less efficient Units 1, 2 and 3 were retired.
· Palo Verde Nuclear Generating Station achieved its 22nd consecutive year as the nations largest power producer. And, for the ninth time, Palo Verde became the only U.S. generating facility to ever produce more than 30 million megawatt-hours in a year.
· The Company experienced its safest year ever as the number of recordable employee injuries decreased for the sixth straight year, besting 2012s prior record by 26 percent.
· Pinnacle Wests total return to shareholders was 8.0 percent, and total shareholder value increased $466 million in 2013.
· And, for the third time in as many years, Standard & Poors Corporation (S&P) upgraded credit ratings for Pinnacle West and APS, up from BBB+ to A-, the companies highest credit ratings since 1984. Additionally, Moodys upgraded APSs senior unsecured and corporate credit ratings to A3 and Pinnacle Wests corporate credit rating to Baa1.
The fourth-quarter on-going results comparison was adversely impacted by the following major items:
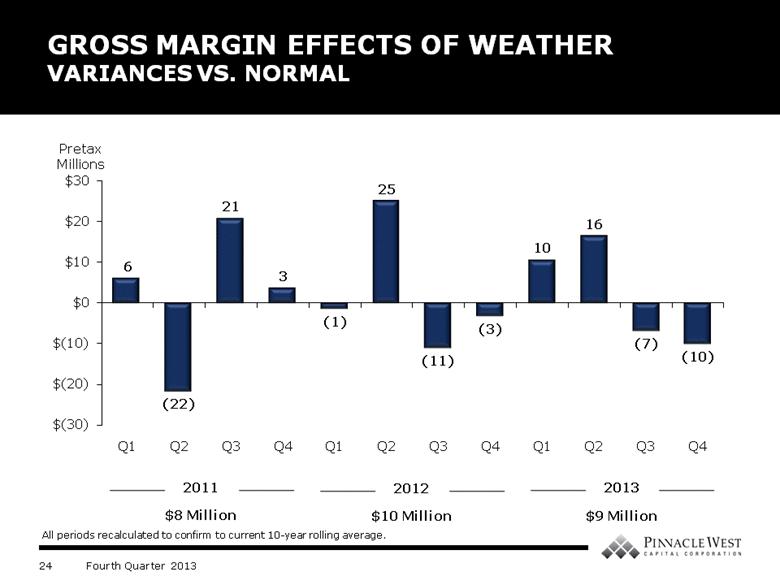
· Weather variations decreased the quarterly results by $0.05 per share compared to the 2012 fourth quarter. The decline was driven primarily by one of the coolest Octobers on record in the Phoenix-metro area, thereby reducing the number of residential cooling degree-days (a proxy for the effects of weather) by 84 percent compared to normal for the month of October.
· Lower transmission revenue reduced earnings by $0.04 per share due to the timing of the FERC formula rate true-up.
· A decrease in retail electricity sales excluding the effects of weather variations, but including effects of customer conservation, energy efficiency programs and distributed renewable generation affected earnings by $0.03 per share. Weather-normalized retail sales decreased 1.9 percent in the current-year fourth quarter compared with the corresponding 2012 period. The sales decrease was primarily related to changes in customer usage, partially offset by customer growth of 1.3 percent.
These factors were offset in part by the following positive factors:
· Tax-related items positively impacted earnings by $0.04 per share.
· Lower operating expenses impacted earnings by $0.02 per share compared with the prior-year quarter. The decrease largely was the result of lower employee benefit costs, partially offset by higher depreciation and amortization resulting from increased plant in service, as well as increased property taxes.
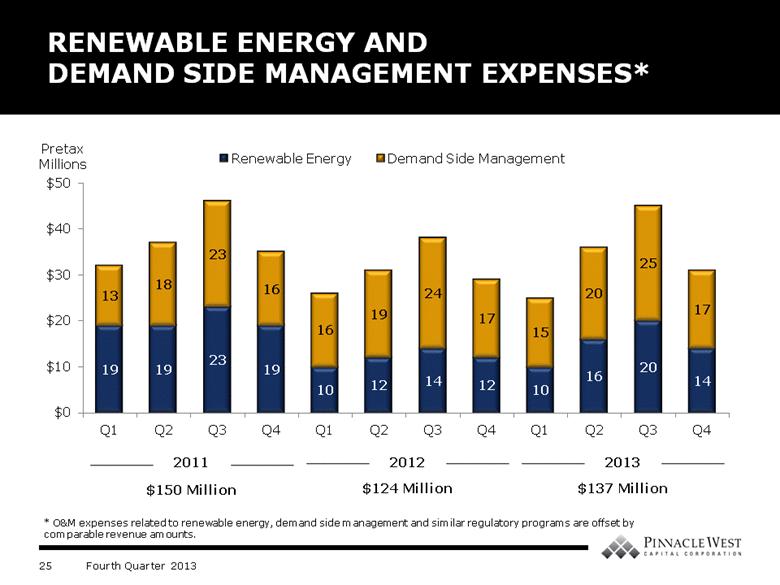
The operating expense variance excludes costs associated with renewable energy, energy efficiency and similar regulatory programs, which are largely offset by comparable amounts of operating revenues.
· The Companys 2012 regulatory settlement, which included a retail non-fuel base rate increase, improved earnings by $0.02 per share, largely due to adjustment of the Lost Fixed Cost Recovery (LFCR) mechanism. The regulatory settlement became effective July 1, 2012.
· The net effect of other items increased earnings $0.02 per share.
APS, the Companys principal subsidiary, recorded 2013 fourth-quarter net income attributable to common shareholder of $30.0 million versus net income of $26.8 million for the comparable 2012 quarter. For 2013 as a whole, APS net income attributable to common shareholder was $425.0 million compared with $395.5 million for 2012.
Financial Outlook
For 2014, the Company continues to expect its on-going consolidated earnings will be in the range of $3.60 to $3.75 per diluted share. Longer-term, the Companys goal is to achieve a consolidated earned return on average common equity of at least 9.5 percent annually through 2015.
Key factors and assumptions underlying the 2014 outlook can be found in the fourth-quarter 2013 earnings presentation slides on the Companys website at pinnaclewest.com/investors.
Conference Call and Webcast
Pinnacle West invites interested parties to listen to the live webcast of managements conference call to discuss the Companys 2013 fourth-quarter and full-year results, as well as recent developments, at 11 a.m. (ET) today, February 21. The webcast can be accessed at pinnaclewest.com/presentations and will be available for replay on the website for 30 days. To access the live conference call by telephone, dial (877) 407-8035 or (201) 689-8035 for international callers. A replay of the call also will be available until 11:59 p.m. (ET), Friday, Feb. 28, 2014, by calling (877) 660-6853 in the U.S. and Canada or (201) 612-7415 internationally and entering conference ID number 13574456.
General Information
Pinnacle West Capital, an energy holding company based in Phoenix, has consolidated assets of about $13.5 billion, nearly 6,400 megawatts of generating capacity and about 6,400 employees in Arizona and New Mexico. Through its principal subsidiary, Arizona Public Service, the Company provides retail electricity service to nearly 1.2 million Arizona homes and businesses. For more information about Pinnacle West, visit the Companys website at pinnaclewest.com.
Dollar amounts in this news release are after income taxes. Earnings per share amounts are based on average diluted common shares outstanding. For more information on Pinnacle Wests operating statistics and earnings, please visit pinnaclewest.com/investors.
PINNACLE WEST CAPITAL CORPORATION
NON-GAAP FINANCIAL MEASURE RECONCILIATION
NET INCOME ATTRIBUTABLE TO COMMON SHAREHOLDERS
(GAAP MEASURE) TO ON-GOING EARNINGS (NON-GAAP FINANCIAL MEASURE)
|
|
Three Months Ended |
|
Three Months Ended |
| ||||||||
|
|
Dollars in |
|
Diluted |
|
Dollars in |
|
Diluted |
| ||||
|
|
|
|
|
|
|
|
|
| ||||
Net Income Attributable to Common Shareholders |
|
$ |
24.3 |
|
$ |
0.22 |
|
$ |
22.6 |
|
$ |
0.20 |
|
Adjustments: |
|
|
|
|
|
|
|
|
| ||||
Loss from Discontinued Operations |
|
|
|
|
|
4.3 |
|
0.04 |
| ||||
On-going Earnings |
|
$ |
24.3 |
|
$ |
0.22 |
|
$ |
26.9 |
|
$ |
0.24 |
|
|
|
Twelve Months Ended |
|
Twelve Months Ended |
| ||||||||
|
|
Dollars in |
|
Diluted |
|
Dollars in |
|
Diluted |
| ||||
|
|
|
|
|
|
|
|
|
| ||||
Net Income Attributable to Common Shareholders |
|
$ |
406.1 |
|
$ |
3.66 |
|
$ |
381.5 |
|
$ |
3.45 |
|
Adjustments: |
|
|
|
|
|
|
|
|
| ||||
Loss from Discontinued Operations |
|
|
|
|
|
5.9 |
|
0.05 |
| ||||
On-going Earnings |
|
$ |
406.1 |
|
$ |
3.66 |
|
$ |
387.4 |
|
$ |
3.50 |
|
NON-GAAP FINANCIAL INFORMATION
In this press release, we refer to on-going earnings. On-going earnings is a non-GAAP financial measure, as defined in accordance with SEC rules. We believe on-going earnings provide investors with a useful indicator of our results that is comparable among periods because it excludes the effects of unusual items that may occur on an irregular basis. Investors should note that these non-GAAP financial measures involve judgments by management, including whether an item is classified as an unusual item. We use on-going earnings, or similar concepts, to measure our performance internally in reports for management.
FORWARD-LOOKING STATEMENTS
This press release contains forward-looking statements based on our current expectations, including statements regarding our earnings guidance and financial outlook and goals. These forward-looking statements are often identified by words such as estimate, predict, may, believe, plan, expect, require, intend, assume and similar words. Because actual results may differ materially from expectations, we caution readers not to place undue reliance on these statements. A number of factors could cause future results to differ materially from historical results, or from outcomes currently expected or sought by Pinnacle West or APS. These factors include, but are not limited to:
· our ability to manage capital expenditures and operations and maintenance costs while maintaining reliability and customer service levels;
· variations in demand for electricity, including those due to weather, the general economy, customer and sales growth (or decline), and the effects of energy conservation measures and distributed generation;
· power plant and transmission system performance and outages;
· competition in retail and wholesale power markets;
· regulatory and judicial decisions, developments and proceedings;
· new legislation or regulation including those relating to environmental requirements, nuclear plant operations and potential deregulation of retail electric markets;
· fuel and water supply availability;
· our ability to achieve timely and adequate rate recovery of our costs, including returns on debt and equity capital;
· our ability to meet renewable energy and energy efficiency mandates and recover related costs;
· risks inherent in the operation of nuclear facilities, including spent fuel disposal uncertainty;
· current and future economic conditions in Arizona, particularly in real estate markets;
· the cost of debt and equity capital and the ability to access capital markets when required;
· environmental and other concerns surrounding coal-fired generation;
· volatile fuel and purchased power costs;
· the investment performance of the assets of our nuclear decommissioning trust, pension, and other postretirement benefit plans and the resulting impact on future funding requirements;
· the liquidity of wholesale power markets and the use of derivative contracts in our business;
· potential shortfalls in insurance coverage;
· new accounting requirements or new interpretations of existing requirements;
· generation, transmission and distribution facility and system conditions and operating costs;
· the ability to meet the anticipated future need for additional baseload generation and associated transmission facilities in our region;
· the willingness or ability of our counterparties, power plant participants and power plant land owners to meet contractual or other obligations or extend the rights for continued power plant operations;
· technological developments affecting the electric industry; and
· restrictions on dividends or other provisions in our credit agreements and ACC orders.
These and other factors are discussed in Risk Factors described in Part 1, Item 1A of the Pinnacle West/APS Annual Report on Form 10-K for the fiscal year ended December 31, 2013, which readers should review carefully before placing any reliance on our financial statements or disclosures. Neither Pinnacle West nor APS assumes any obligation to update these statements, even if our internal estimates change, except as required by law.
# # #
PINNACLE WEST CAPITAL CORPORATION
CONSOLIDATED STATEMENTS OF INCOME
(unaudited)
(dollars and shares in thousands, except per share amounts)
|
|
THREE MONTHS ENDED |
|
TWELVE MONTHS ENDED |
| ||||||||
|
|
DECEMBER 31, |
|
DECEMBER 31, |
| ||||||||
|
|
2013 |
|
2012 |
|
2013 |
|
2012 |
| ||||
|
|
|
|
|
|
|
|
|
| ||||
Operating Revenues |
|
$ |
699,762 |
|
$ |
693,122 |
|
$ |
3,454,628 |
|
$ |
3,301,804 |
|
|
|
|
|
|
|
|
|
|
| ||||
Operating Expenses |
|
|
|
|
|
|
|
|
| ||||
Fuel and purchased power |
|
236,493 |
|
210,864 |
|
1,095,709 |
|
994,790 |
| ||||
Operations and maintenance |
|
238,854 |
|
237,141 |
|
924,727 |
|
884,769 |
| ||||
Depreciation and amortization |
|
98,298 |
|
103,268 |
|
415,708 |
|
404,336 |
| ||||
Taxes other than income taxes |
|
40,076 |
|
39,052 |
|
164,167 |
|
159,323 |
| ||||
Other expenses |
|
2,141 |
|
1,508 |
|
7,994 |
|
6,831 |
| ||||
Total |
|
615,862 |
|
591,833 |
|
2,608,305 |
|
2,450,049 |
| ||||
|
|
|
|
|
|
|
|
|
| ||||
Operating Income |
|
83,900 |
|
101,289 |
|
846,323 |
|
851,755 |
| ||||
|
|
|
|
|
|
|
|
|
| ||||
Other Income (Deductions) |
|
|
|
|
|
|
|
|
| ||||
Allowance for equity funds used during construction |
|
6,883 |
|
6,797 |
|
25,581 |
|
22,436 |
| ||||
Other income |
|
317 |
|
249 |
|
1,704 |
|
1,606 |
| ||||
Other expense |
|
(2,603 |
) |
(7,409 |
) |
(16,024 |
) |
(19,842 |
) | ||||
Total |
|
4,597 |
|
(363 |
) |
11,261 |
|
4,200 |
| ||||
|
|
|
|
|
|
|
|
|
| ||||
Interest Expense |
|
|
|
|
|
|
|
|
| ||||
Interest charges |
|
50,516 |
|
52,407 |
|
201,888 |
|
214,616 |
| ||||
Allowance for borrowed funds used during construction |
|
(4,000 |
) |
(4,543 |
) |
(14,861 |
) |
(14,971 |
) | ||||
Total |
|
46,516 |
|
47,864 |
|
187,027 |
|
199,645 |
| ||||
|
|
|
|
|
|
|
|
|
| ||||
Income From Continuing Operations Before Income Taxes |
|
41,981 |
|
53,062 |
|
670,557 |
|
656,310 |
| ||||
|
|
|
|
|
|
|
|
|
| ||||
Income Taxes |
|
9,167 |
|
18,157 |
|
230,591 |
|
237,317 |
| ||||
|
|
|
|
|
|
|
|
|
| ||||
Income From Continuing Operations |
|
32,814 |
|
34,905 |
|
439,966 |
|
418,993 |
| ||||
|
|
|
|
|
|
|
|
|
| ||||
Loss From Discontinued Operations |
|
|
|
|
|
|
|
|
| ||||
Net of Income Taxes |
|
|
|
(4,234 |
) |
|
|
(5,829 |
) | ||||
|
|
|
|
|
|
|
|
|
| ||||
Net Income |
|
32,814 |
|
30,671 |
|
439,966 |
|
413,164 |
| ||||
|
|
|
|
|
|
|
|
|
| ||||
Less: Net income attributable to noncontrolling interests |
|
8,554 |
|
8,040 |
|
33,892 |
|
31,622 |
| ||||
|
|
|
|
|
|
|
|
|
| ||||
Net Income Attributable To Common Shareholders |
|
$ |
24,260 |
|
$ |
22,631 |
|
$ |
406,074 |
|
$ |
381,542 |
|
|
|
|
|
|
|
|
|
|
| ||||
Weighted-Average Common Shares Outstanding - Basic |
|
110,130 |
|
109,693 |
|
109,984 |
|
109,510 |
| ||||
|
|
|
|
|
|
|
|
|
| ||||
Weighted-Average Common Shares Outstanding - Diluted |
|
110,936 |
|
110,776 |
|
110,806 |
|
110,527 |
| ||||
|
|
|
|
|
|
|
|
|
| ||||
Earnings Per Weighted-Average Common Share Outstanding |
|
|
|
|
|
|
|
|
| ||||
Income from continuing operations attributable to common shareholders - basic |
|
$ |
0.22 |
|
$ |
0.24 |
|
$ |
3.69 |
|
$ |
3.54 |
|
Net income attributable to common shareholders - basic |
|
$ |
0.22 |
|
$ |
0.21 |
|
$ |
3.69 |
|
$ |
3.48 |
|
Income from continuing operations attributable to common shareholders - diluted |
|
$ |
0.22 |
|
$ |
0.24 |
|
$ |
3.66 |
|
$ |
3.50 |
|
Net income attributable to common shareholders - diluted |
|
$ |
0.22 |
|
$ |
0.20 |
|
$ |
3.66 |
|
$ |
3.45 |
|
|
|
|
|
|
|
|
|
|
| ||||
Amounts Attributable To Common Shareholders |
|
|
|
|
|
|
|
|
| ||||
Income from continuing operations, net of tax |
|
$ |
24,260 |
|
$ |
26,865 |
|
$ |
406,074 |
|
$ |
387,380 |
|
Discontinued operations, net of tax |
|
|
|
(4,234 |
) |
|
|
(5,838 |
) | ||||
Net income attributable to common shareholders |
|
$ |
24,260 |
|
$ |
22,631 |
|
$ |
406,074 |
|
$ |
381,542 |
|
Exhibit 99.2
|
Last Updated |
2/21/2014 |
Pinnacle West Capital Corporation
Quarterly Consolidated Statistical Summary
Periods Ended December 31, 2013 and 2012
|
|
|
3 Months Ended December 31, |
|
12 Months Ended December 31, |
| ||||||||||||||
Line |
|
|
2013 |
|
2012 |
|
Incr (Decr) |
|
2013 |
|
2012 |
|
Incr (Decr) |
| ||||||
|
|
|
|
|
|
|
|
|
|
|
|
|
|
| ||||||
|
EARNINGS CONTRIBUTION BY SUBSIDIARY |
|
|
|
|
|
|
|
|
|
|
|
|
| ||||||
|
|
|
|
|
|
|
|
|
|
|
|
|
|
| ||||||
1 |
Arizona Public Service |
|
$ |
39 |
|
$ |
35 |
|
$ |
4 |
|
$ |
459 |
|
$ |
427 |
|
$ |
32 |
|
2 |
El Dorado |
|
- |
|
- |
|
- |
|
(4) |
|
(2) |
|
(2 |
) | ||||||
3 |
Parent Company |
|
(6) |
|
- |
|
(6) |
|
(15) |
|
(6) |
|
(9 |
) | ||||||
|
|
|
|
|
|
|
|
|
|
|
|
|
|
| ||||||
4 |
Income From Continuing Operations |
|
33 |
|
35 |
|
(2) |
|
440 |
|
419 |
|
21 |
| ||||||
|
|
|
|
|
|
|
|
|
|
|
|
|
|
| ||||||
|
Income (Loss) From Discontinued Operations - Net of Tax |
|
|
|
|
|
|
|
|
|
|
|
|
| ||||||
5 |
SunCor |
|
- |
|
- |
|
- |
|
- |
|
(2) |
|
2 |
| ||||||
6 |
Other |
|
- |
|
(4) |
|
4 |
|
- |
|
(4) |
|
4 |
| ||||||
7 |
Total |
|
- |
|
(4) |
|
4 |
|
- |
|
(6) |
|
6 |
| ||||||
|
|
|
|
|
|
|
|
|
|
|
|
|
|
| ||||||
8 |
Net Income |
|
33 |
|
31 |
|
2 |
|
440 |
|
413 |
|
27 |
| ||||||
|
|
|
|
|
|
|
|
|
|
|
|
|
|
| ||||||
9 |
Less: Net Income Attributable to Noncontrolling Interests |
|
9 |
|
8 |
|
1 |
|
34 |
|
31 |
|
3 |
| ||||||
|
|
|
|
|
|
|
|
|
|
|
|
|
|
| ||||||
10 |
Net Income Attributable to Common Shareholders |
|
$ |
24 |
|
$ |
23 |
|
$ |
1 |
|
$ |
406 |
|
$ |
382 |
|
$ |
24 |
|
|
|
|
|
|
|
|
|
|
|
|
|
|
|
| ||||||
|
|
|
|
|
|
|
|
|
|
|
|
|
|
| ||||||
|
EARNINGS PER SHARE BY SUBSIDIARY - DILUTED |
|
|
|
|
|
|
|
|
|
|
|
|
| ||||||
|
|
|
|
|
|
|
|
|
|
|
|
|
|
| ||||||
11 |
Arizona Public Service |
|
$ |
0.35 |
|
$ |
0.31 |
|
$ |
0.04 |
|
$ |
4.14 |
|
$ |
3.86 |
|
$ |
0.28 |
|
12 |
El Dorado |
|
- |
|
- |
|
- |
|
(0.04) |
|
(0.02) |
|
(0.02 |
) | ||||||
13 |
Parent Company |
|
(0.05) |
|
- |
|
(0.05) |
|
(0.13) |
|
(0.05) |
|
(0.08 |
) | ||||||
|
|
|
|
|
|
|
|
|
|
|
|
|
|
| ||||||
14 |
Income From Continuing Operations |
|
0.30 |
|
0.31 |
|
(0.01) |
|
3.97 |
|
3.79 |
|
0.18 |
| ||||||
|
|
|
|
|
|
|
|
|
|
|
|
|
|
| ||||||
|
Income (Loss) From Discontinued Operations - Net of Tax |
|
|
|
|
|
|
|
|
|
|
|
|
| ||||||
15 |
SunCor |
|
- |
|
- |
|
- |
|
- |
|
(0.01) |
|
0.01 |
| ||||||
16 |
Other |
|
- |
|
(0.04) |
|
0.04 |
|
- |
|
(0.04) |
|
0.04 |
| ||||||
17 |
Total |
|
- |
|
(0.04) |
|
0.04 |
|
- |
|
(0.05) |
|
0.05 |
| ||||||
|
|
|
|
|
|
|
|
|
|
|
|
|
|
| ||||||
18 |
Net Income |
|
0.30 |
|
0.27 |
|
0.03 |
|
3.97 |
|
3.74 |
|
0.23 |
| ||||||
|
|
|
|
|
|
|
|
|
|
|
|
|
|
| ||||||
19 |
Less: Net Income Attributable to Noncontrolling Interests |
|
0.08 |
|
0.07 |
|
0.01 |
|
0.31 |
|
0.29 |
|
0.02 |
| ||||||
|
|
|
|
|
|
|
|
|
|
|
|
|
|
| ||||||
20 |
Net Income Attributable to Common Shareholders |
|
$ |
0.22 |
|
$ |
0.20 |
|
$ |
0.02 |
|
$ |
3.66 |
|
$ |
3.45 |
|
$ |
0.21 |
|
|
|
|
|
|
|
|
|
|
|
|
|
|
|
| ||||||
|
|
|
|
|
|
|
|
|
|
|
|
|
|
| ||||||
21 |
BOOK VALUE PER SHARE |
|
$ |
38.07 |
|
$ |
36.20 |
|
$ |
1.87 |
|
$ |
38.07 |
|
$ |
36.20 |
|
$ |
1.87 |
|
|
|
|
|
|
|
|
|
|
|
|
|
|
|
| ||||||
|
|
|
|
|
|
|
|
|
|
|
|
|
|
| ||||||
|
COMMON SHARES OUTSTANDING |
|
|
|
|
|
|
|
|
|
|
|
|
| ||||||
22 |
Average - Diluted |
|
110,936 |
|
110,776 |
|
160 |
|
110,806 |
|
110,527 |
|
279 |
| ||||||
23 |
End of Period |
|
110,182 |
|
109,743 |
|
439 |
|
110,182 |
|
109,743 |
|
439 |
|
See Glossary of terms |
|
|
Last Updated |
2/21/2014 |
Pinnacle West Capital Corporation
Quarterly Consolidated Statistical Summary
Periods Ended December 31, 2013 and 2012
|
|
3 Months Ended December 31, |
|
12 Months Ended December 31, | ||||||||||||||||
Line |
|
2013 |
|
2012 |
|
Incr (Decr) |
|
2013 |
|
2012 |
|
Incr (Decr) |
| |||||||
|
|
|
|
|
|
|
|
|
|
|
|
|
| |||||||
|
ELECTRIC OPERATING REVENUES (Dollars in Millions) |
|
|
|
|
|
|
|
|
|
|
|
|
| ||||||
|
|
|
|
|
|
|
|
|
|
|
|
|
|
| ||||||
|
Retail |
|
|
|
|
|
|
|
|
|
|
|
|
| ||||||
24 |
Residential |
|
$ |
298 |
|
$ |
291 |
|
$ |
7 |
|
$ |
1,675 |
|
$ |
1,587 |
|
$ |
88 |
|
25 |
Business |
|
352 |
|
344 |
|
8 |
|
1,558 |
|
1,473 |
|
85 |
| ||||||
26 |
Total retail |
|
650 |
|
635 |
|
15 |
|
3,233 |
|
3,060 |
|
173 |
| ||||||
|
Wholesale revenue on delivered electricity |
|
|
|
|
|
|
|
|
|
|
|
|
| ||||||
27 |
Traditional contracts |
|
9 |
|
11 |
|
(2) |
|
53 |
|
62 |
|
(9 |
) | ||||||
28 |
Off-system sales |
|
23 |
|
25 |
|
(2) |
|
89 |
|
88 |
|
1 |
| ||||||
29 |
Native load hedge liquidation |
|
2 |
|
- |
|
2 |
|
11 |
|
4 |
|
7 |
| ||||||
30 |
Total wholesale |
|
34 |
|
36 |
|
(2) |
|
153 |
|
154 |
|
(1 |
) | ||||||
31 |
Transmission for others |
|
7 |
|
6 |
|
1 |
|
32 |
|
29 |
|
3 |
| ||||||
32 |
Other miscellaneous services |
|
8 |
|
10 |
|
(2) |
|
33 |
|
50 |
|
(17 |
) | ||||||
33 |
Total electric operating revenues |
|
$ |
699 |
|
$ |
687 |
|
$ |
12 |
|
$ |
3,451 |
|
$ |
3,293 |
|
$ |
158 |
|
|
|
|
|
|
|
|
|
|
|
|
|
|
|
| ||||||
|
|
|
|
|
|
|
|
|
|
|
|
|
|
| ||||||
|
ELECTRIC SALES (GWH) |
|
|
|
|
|
|
|
|
|
|
|
|
| ||||||
|
|
|
|
|
|
|
|
|
|
|
|
|
|
| ||||||
|
Retail sales |
|
|
|
|
|
|
|
|
|
|
|
|
| ||||||
34 |
Residential |
|
2,464 |
|
2,552 |
|
(88) |
|
13,290 |
|
13,256 |
|
34 |
| ||||||
35 |
Business |
|
3,410 |
|
3,541 |
|
(131) |
|
14,798 |
|
14,898 |
|
(100 |
) | ||||||
36 |
Total retail |
|
5,874 |
|
6,093 |
|
(219) |
|
28,088 |
|
28,154 |
|
(66 |
) | ||||||
|
Wholesale electricity delivered |
|
|
|
|
|
|
|
|
|
|
|
|
| ||||||
37 |
Traditional contracts |
|
99 |
|
103 |
|
(4) |
|
683 |
|
761 |
|
(78 |
) | ||||||
38 |
Off-system sales |
|
717 |
|
835 |
|
(118) |
|
2,998 |
|
3,264 |
|
(266 |
) | ||||||
39 |
Retail load hedge management |
|
3 |
|
48 |
|
(45) |
|
95 |
|
269 |
|
(174 |
) | ||||||
40 |
Total wholesale |
|
819 |
|
986 |
|
(167) |
|
3,776 |
|
4,294 |
|
(518 |
) | ||||||
41 |
Total electric sales |
|
6,693 |
|
7,079 |
|
(386) |
|
31,864 |
|
32,448 |
|
(584 |
) |
See Glossary of terms |
|
|
Last Updated |
2/21/2014 |
Pinnacle West Capital Corporation
Quarterly Consolidated Statistical Summary
Periods Ended December 31, 2013 and 2012
|
|
|
3 Months Ended December 31, |
|
12 Months Ended December 31, |
| ||||||||
Line |
|
2013 |
|
2012 |
|
Incr (Decr) |
|
2013 |
|
2012 |
|
Incr (Decr) |
| |
|
|
|
|
|
|
|
|
|
|
|
|
|
|
|
|
AVERAGE ELECTRIC CUSTOMERS |
|
|
|
|
|
|
|
|
|
|
|
|
|
|
|
|
|
|
|
|
|
|
|
|
|
|
|
|
|
Retail customers |
|
|
|
|
|
|
|
|
|
|
|
|
|
42 |
Residential |
|
1,024,619 |
|
1,010,532 |
|
14,087 |
|
1,019,292 |
|
1,005,074 |
|
14,218 |
|
43 |
Business |
|
128,547 |
|
127,687 |
|
860 |
|
128,170 |
|
127,222 |
|
948 |
|
44 |
Total retail |
|
1,153,166 |
|
1,138,219 |
|
14,947 |
|
1,147,462 |
|
1,132,296 |
|
15,166 |
|
45 |
Wholesale customers |
|
52 |
|
50 |
|
2 |
|
52 |
|
49 |
|
3 |
|
46 |
Total customers |
|
1,153,218 |
|
1,138,269 |
|
14,949 |
|
1,147,514 |
|
1,132,345 |
|
15,169 |
|
|
|
|
|
|
|
|
|
|
|
|
|
|
|
|
47 |
Total customer growth (% over prior year) |
|
1.3% |
|
1.4% |
|
(0.1)% |
|
1.3% |
|
1.1% |
|
0.2% |
|
|
|
|
|
|
|
|
|
|
|
|
|
|
|
|
|
RETAIL SALES (GWH) - WEATHER NORMALIZED |
|
|
|
|
|
|
|
|
|
|
| ||
|
|
|
|
|
|
|
|
|
|
|
|
|
|
|
48 |
Residential |
|
2,561 |
|
2,617 |
|
(56) |
|
13,163 |
|
13,187 |
|
(24) |
|
49 |
Business |
|
3,464 |
|
3,523 |
|
(59) |
|
14,774 |
|
14,885 |
|
(111) |
|
50 |
Total |
|
6,025 |
|
6,140 |
|
(115) |
|
27,937 |
|
28,072 |
|
(135) |
|
|
|
|
|
|
|
|
|
|
|
|
|
|
|
|
51 |
Retail sales (GWH) (% over prior year) |
|
(1.9)% |
|
|
|
|
|
(0.5)% |
|
|
|
|
|
|
|
|
|
|
|
|
|
|
|
|
|
|
|
|
|
RETAIL USAGE |
|
|
|
|
|
|
|
|
|
|
|
|
|
|
(KWh/Average Customer) |
|
|
|
|
|
|
|
|
|
|
|
|
|
|
|
|
|
|
|
|
|
|
|
|
|
|
|
|
52 |
Residential |
|
2,405 |
|
2,525 |
|
(120) |
|
13,039 |
|
13,190 |
|
(151) |
|
53 |
Business |
|
26,530 |
|
27,733 |
|
(1,203) |
|
115,453 |
|
117,100 |
|
(1,647) |
|
|
|
|
|
|
|
|
|
|
|
|
|
|
|
|
|
RETAIL USAGE - WEATHER NORMALIZED |
|
|
|
|
|
|
|
|
|
|
|
|
|
|
(KWh/Average Customer) |
|
|
|
|
|
|
|
|
|
|
|
|
|
|
|
|
|
|
|
|
|
|
|
|
|
|
|
|
54 |
Residential |
|
2,499 |
|
2,590 |
|
(91) |
|
12,914 |
|
13,121 |
|
(207) |
|
55 |
Business |
|
26,950 |
|
27,590 |
|
(640) |
|
115,266 |
|
116,999 |
|
(1,733) |
|
|
|
|
|
|
|
|
|
|
|
|
|
|
|
|
|
ELECTRICITY DEMAND (MW) |
|
|
|
|
|
|
|
|
|
|
|
|
|
|
|
|
|
|
|
|
|
|
|
|
|
|
|
|
56 |
Native load peak demand |
|
4,500 |
|
5,339 |
|
(839) |
|
6,927 |
|
7,207 |
|
(280) |
|
|
|
|
|
|
|
|
|
|
|
|
|
|
|
|
|
WEATHER INDICATORS - RESIDENTIAL |
|
|
|
|
|
|
|
|
|
|
|
|
|
|
|
|
|
|
|
|
|
|
|
|
|
|
|
|
|
Actual |
|
|
|
|
|
|
|
|
|
|
|
|
|
57 |
Cooling degree-days |
|
8 |
|
53 |
|
(45) |
|
1,800 |
|
1,791 |
|
9 |
|
58 |
Heating degree-days |
|
323 |
|
279 |
|
44 |
|
937 |
|
705 |
|
232 |
|
59 |
Average humidity |
|
23% |
|
26% |
|
(3)% |
|
24% |
|
26% |
|
(2)% |
|
|
|
|
|
|
|
|
|
|
|
|
|
|
|
|
|
10-Year Averages |
|
|
|
|
|
|
|
|
|
|
|
|
|
60 |
Cooling degree-days |
|
51 |
|
51 |
|
- |
|
1,776 |
|
1,776 |
|
- |
|
61 |
Heating degree-days |
|
366 |
|
366 |
|
- |
|
872 |
|
872 |
|
- |
|
62 |
Average humidity |
|
30% |
|
30% |
|
- |
|
24% |
|
24% |
|
- |
|
See Glossary of Terms |
|
|
Last Updated |
2/21/2014 |
Pinnacle West Capital Corporation
Quarterly Consolidated Statistical Summary
Periods Ended December 31, 2013 and 2012
|
|
|
3 Months Ended December 31, |
|
12 Months Ended December 31, |
| ||||||||
Line |
|
2013 |
|
2012 |
|
Incr (Decr) |
|
2013 |
|
2012 |
|
Incr (Decr) |
| |
|
|
|
|
|
|
|
|
|
|
|
|
|
|
|
|
ENERGY SOURCES (GWH) |
|
|
|
|
|
|
|
|
|
|
|
|
|
|
|
|
|
|
|
|
|
|
|
|
|
|
|
|
|
Generation production |
|
|
|
|
|
|
|
|
|
|
|
|
|
63 |
Nuclear |
|
1,923 |
|
2,115 |
|
(192) |
|
9,146 |
|
9,293 |
|
(147) |
|
64 |
Coal |
|
2,483 |
|
2,939 |
|
(456) |
|
10,899 |
|
10,877 |
|
22 |
|
65 |
Gas, oil and other |
|
1,301 |
|
1,551 |
|
(250) |
|
6,127 |
|
7,465 |
|
(1,338) |
|
66 |
Total generation production |
|
5,707 |
|
6,606 |
|
(898) |
|
26,172 |
|
27,635 |
|
(1,463) |
|
|
Purchased power |
|
|
|
|
|
|
|
|
|
|
|
|
|
67 |
Firm load |
|
1,262 |
|
769 |
|
493 |
|
6,826 |
|
6,288 |
|
538 |
|
68 |
Marketing and trading |
|
105 |
|
62 |
|
43 |
|
513 |
|
306 |
|
207 |
|
69 |
Total purchased power |
|
1,366 |
|
831 |
|
535 |
|
7,339 |
|
6,594 |
|
745 |
|
70 |
Total energy sources |
|
7,073 |
|
7,436 |
|
(363) |
|
33,511 |
|
34,229 |
|
(718) |
|
|
|
|
|
|
|
|
|
|
|
|
|
|
|
|
|
|
|
|
|
|
|
|
|
|
|
|
|
|
|
|
POWER PLANT PERFORMANCE |
|
|
|
|
|
|
|
|
|
|
|
|
|
|
|
|
|
|
|
|
|
|
|
|
|
|
|
|
|
Capacity Factors |
|
|
|
|
|
|
|
|
|
|
|
|
|
71 |
Nuclear |
|
76% |
|
84% |
|
(8)% |
|
91% |
|
92% |
|
(1)% |
|
72 |
Coal |
|
64% |
|
76% |
|
(12)% |
|
71% |
|
71% |
|
0% |
|
73 |
Gas, oil and other |
|
17% |
|
20% |
|
(3)% |
|
20% |
|
25% |
|
(4)% |
|
74 |
System average |
|
40% |
|
47% |
|
(7)% |
|
47% |
|
49% |
|
(2)% |
|
|
|
|
|
|
|
|
|
|
|
|
|
|
|
|
|
|
|
|
|
|
|
|
|
|
|
|
|
|
|
|
ECONOMIC INDICATORS |
|
|
|
|
|
|
|
|
|
|
|
|
|
|
|
|
|
|
|
|
|
|
|
|
|
|
|
|
|
Building Permits (a) |
|
|
|
|
|
|
|
|
|
|
|
|
|
75 |
Metro Phoenix |
|
3,707 |
|
3,736 |
|
(29) |
|
15,153 |
|
13,584 |
|
1,569 |
|
|
|
|
|
|
|
|
|
|
|
|
|
|
|
|
|
Arizona Job Growth (b) |
|
|
|
|
|
|
|
|
|
|
|
|
|
76 |
Payroll job growth (% over prior year) |
|
1.9% |
|
2.2% |
|
(0.3)% |
|
1.9% |
|
2.1% |
|
(0.2)% |
|
77 |
Unemployment rate (%, seasonally adjusted) |
|
7.9% |
|
8.0% |
|
(0.1)% |
|
8.0% |
|
8.3% |
|
(0.3)% |
|
|
|
|
|
|
|
|
|
|
|
|
|
|
|
|
|
|
|
|
|
|
|
|
|
|
|
|
|
|
|
Sources: |
|
|
|
|
|
|
|
|
|
|
|
|
| |
(a) |
U.S. Census Bureau |
|
|
|
|
|
|
|
|
|
|
|
|
|
(b) |
Arizona Department of Economic Security |
|
|
|
|
|
|
|
|
|
|
|
|
|
See Glossary of Terms |
|
Exhibit 99.3
4TH QUARTER AND FULL-YEAR 2013 RESULTS February 21, 2014 |
FORWARD LOOKING STATEMENTS AND NON-GAAP FINANCIAL MEASURES This presentation contains forward-looking statements based on current expectations, including statements regarding our earnings guidance and financial outlook and goals. These forward-looking statements are often identified by words such as estimate, predict, may, believe, plan, expect, require, intend, assume and similar words. Because actual results may differ materially from expectations, we caution you not to place undue reliance on these statements. A number of factors could cause future results to differ materially from historical results, or from outcomes currently expected or sought by Pinnacle West or APS. These factors include, but are not limited to: our ability to manage capital expenditures and operations and maintenance costs while maintaining reliability and customer service levels; variations in demand for electricity, including those due to weather, the general economy, customer and sales growth (or decline), and the effects of energy conservation measures and distributed generation; power plant and transmission system performance and outages; competition in retail and wholesale power markets; regulatory and judicial decisions, developments and proceedings; new legislation or regulation, including those relating to environmental requirements, nuclear plant operations and potential deregulation of retail electric markets; fuel and water supply availability; our ability to achieve timely and adequate rate recovery of our costs, including returns on debt and equity capital; our ability to meet renewable energy and energy efficiency mandates and recover related costs; risks inherent in the operation of nuclear facilities, including spent fuel disposal uncertainty; current and future economic conditions in Arizona, particularly in real estate markets; the cost of debt and equity capital and the ability to access capital markets when required; environmental and other concerns surrounding coal-fired generation; volatile fuel and purchased power costs; the investment performance of the assets of our nuclear decommissioning trust, pension, and other postretirement benefit plans and the resulting impact on future funding requirements; the liquidity of wholesale power markets and the use of derivative contracts in our business; potential shortfalls in insurance coverage; new accounting requirements or new interpretations of existing requirements; generation, transmission and distribution facility and system conditions and operating costs; the ability to meet the anticipated future need for additional baseload generation and associated transmission facilities in our region; the willingness or ability of our counterparties, power plant participants and power plant land owners to meet contractual or other obligations or extend the rights for continued power plant operations; technological developments affecting the electric industry; and restrictions on dividends or other provisions in our credit agreements and ACC orders. These and other factors are discussed in Risk Factors described in Part I, Item 1A of the Pinnacle West/APS Annual Report on Form 10-K for the fiscal year ended December 31, 2013, which you should review carefully before placing any reliance on our financial statements, disclosures or earnings outlook. Neither Pinnacle West nor APS assumes any obligation to update these statements, even if our internal estimates change, except as required by law. In this presentation, references to net income and earnings per share (EPS) refer to amounts attributable to common shareholders. We present gross margin per diluted share of common stock. Gross margin refers to operating revenues less fuel and purchased power expenses. Gross margin is a non-GAAP financial measure, as defined in accordance with SEC rules. The appendix contains a reconciliation of this non-GAAP financial measure to the referenced revenue and expense line items on our Consolidated Statements of Income, which are the most directly comparable financial measures calculated and presented in accordance with generally accepted accounting principles in the United States of America (GAAP). We view gross margin as an important performance measure of the core profitability of our operations. We refer to on-going earnings in this presentation, which is also a non-GAAP financial measure. We believe on-going earnings provide investors with a useful indicator of our results that is comparable among periods because it excludes the effects of unusual items that may occur on an irregular basis. Reconciliations of on-going earnings to our net income attributable to common shareholders are included in this presentation. Investors should note that these non-GAAP financial measures may involve judgments by management, including whether an item is classified as an unusual item. These measures are key components of our internal financial reporting and are used by our management in analyzing the operations of our business. We believe that investors benefit from having access to the same financial measures that management uses. |
Operational Excellence Strategic Investments 2014 Calendar CEO AGENDA |
4th Quarter and 2013 Full-Year Results Arizona Economic Outlook Balance Sheet Strength 2014 Outlook CFO AGENDA |
CONSOLIDATED EPS COMPARISON 2013 VS. 2012 4th Quarter GAAP Net Income $0.22 $0.20 Full-Year GAAP Net Income $3.66 $3.45 4th Quarter On-Going Earnings Full-Year On-Going Earnings |
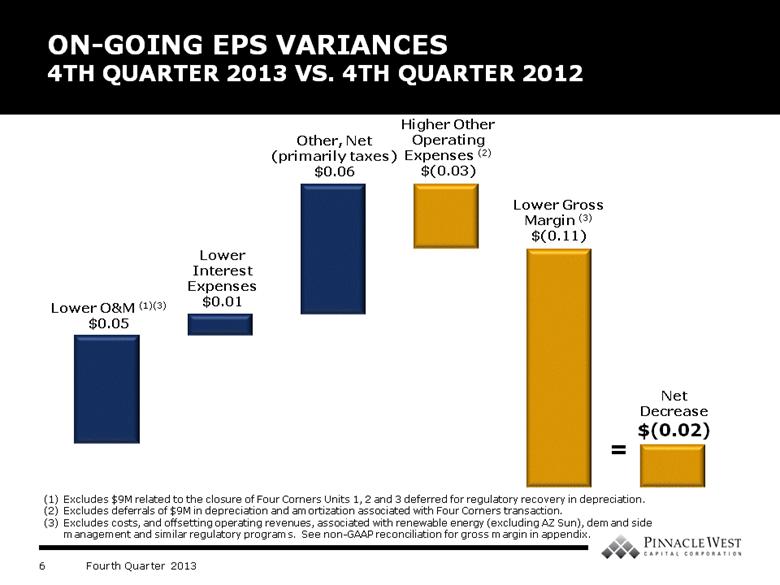
Lower Interest Expenses $0.01 Higher Other Operating Expenses (2) $(0.03) Other, Net (primarily taxes) $0.06 Lower Gross Margin (3) $(0.11) = Net Decrease $(0.02) ON-GOING EPS VARIANCES 4TH QUARTER 2013 VS. 4TH QUARTER 2012 Excludes $9M related to the closure of Four Corners Units 1, 2 and 3 deferred for regulatory recovery in depreciation. Excludes deferrals of $9M in depreciation and amortization associated with Four Corners transaction. Excludes costs, and offsetting operating revenues, associated with renewable energy (excluding AZ Sun), demand side management and similar regulatory programs. See non-GAAP reconciliation for gross margin in appendix. Lower O&M (1)(3) $0.05 |
GROSS MARGIN EPS DRIVERS 4TH QUARTER 2013 VS. 4TH QUARTER 2012 Lost Fixed Cost Recovery Mechanism $0.02 Other Items, Net $(0.01) Lower Retail kWh Sales $(0.03) Retail Transmission Revenue $(0.04) = Net Decrease $(0.11) Weather $(0.05) |
ARIZONA ECONOMIC INDICATORS Nonresidential Building Vacancy Metro Phoenix New Home Sales & Single Family Permits Home Prices Metro Phoenix Value Relative to Jan 05 YTD-Nov Vacancy Rate Office Retail Job Growth (Total Nonfarm) - Arizona YoY Change |
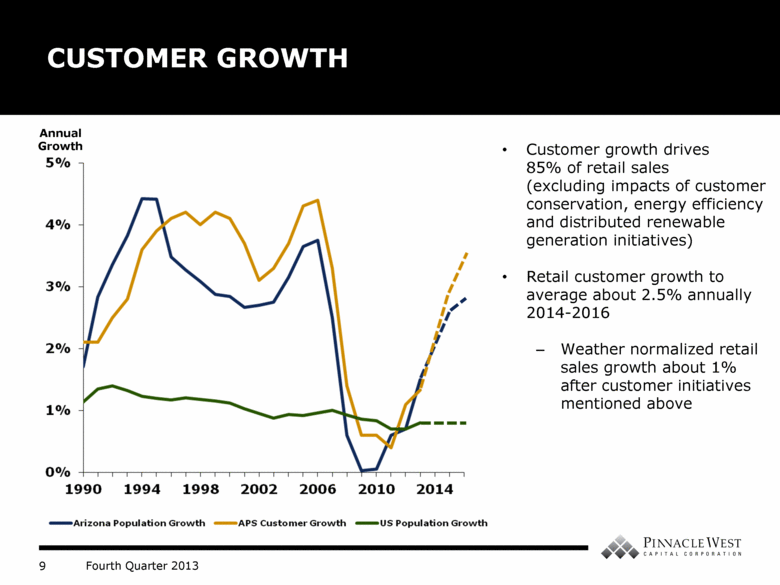
CUSTOMER GROWTH Annual Growth Customer growth drives 85% of retail sales (excluding impacts of customer conservation, energy efficiency and distributed renewable generation initiatives) Retail customer growth to average about 2.5% annually 2014-2016 Weather normalized retail sales growth about 1% after customer initiatives mentioned above |
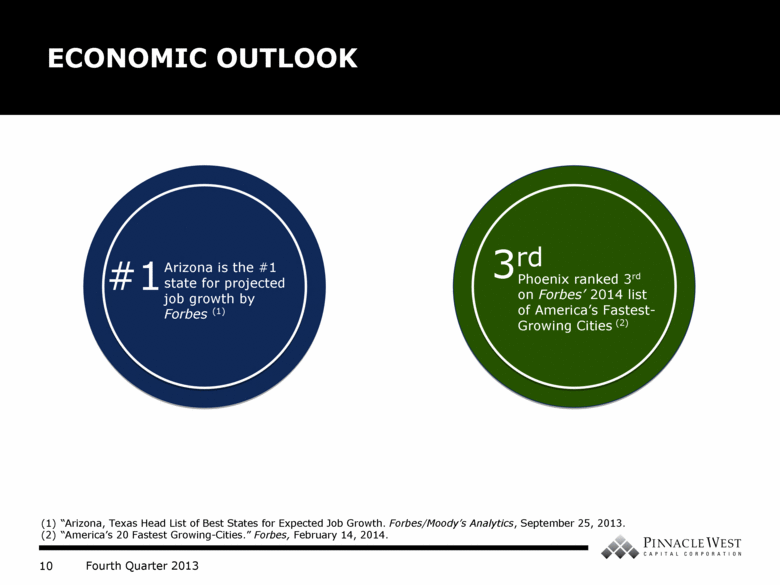
ECONOMIC OUTLOOK Arizona, Texas Head List of Best States for Expected Job Growth. Forbes/Moodys Analytics, September 25, 2013. Americas 20 Fastest Growing-Cities. Forbes, February 14, 2014. Arizona is the #1 state for projected job growth by Forbes (1) #1 Phoenix ranked 3rd on Forbes 2014 list of Americas Fastest-Growing Cities (2) 3rd |
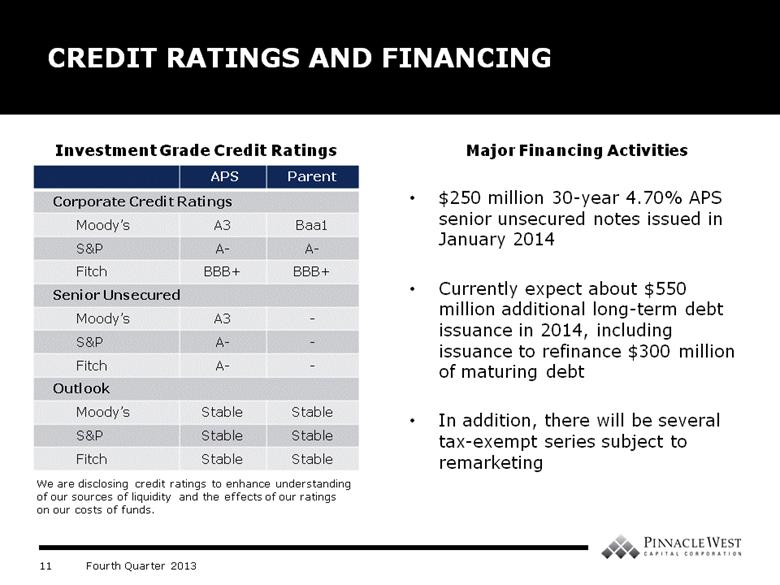
CREDIT RATINGS AND FINANCING APS Parent Corporate Credit Ratings Moodys A3 Baa1 S&P A- A- Fitch BBB+ BBB+ Senior Unsecured Moodys A3 - S&P A- - Fitch A- - Outlook Moodys Stable Stable S&P Stable Stable Fitch Stable Stable We are disclosing credit ratings to enhance understanding of our sources of liquidity and the effects of our ratings on our costs of funds. Investment Grade Credit Ratings Major Financing Activities $250 million 30-year 4.70% APS senior unsecured notes issued in January 2014 Currently expect about $550 million additional long-term debt issuance in 2014, including issuance to refinance $300 million of maturing debt In addition, there will be several tax-exempt series subject to remarketing |
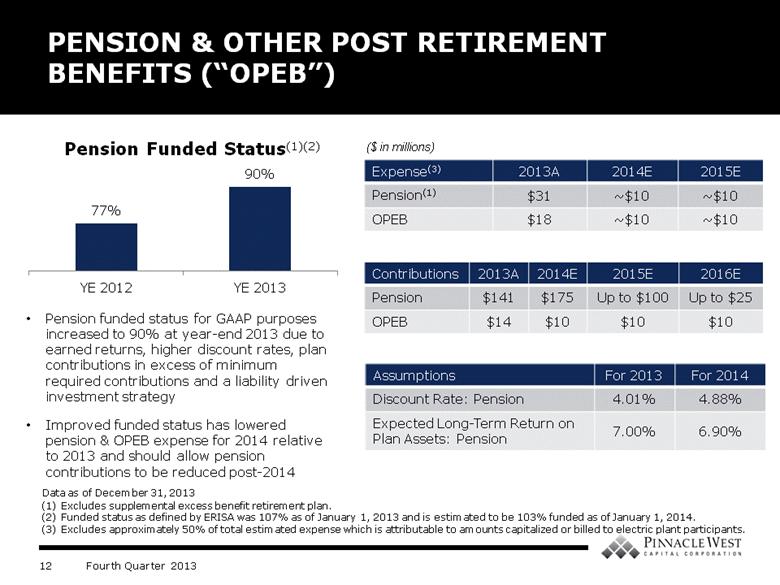
Pension funded status for GAAP purposes increased to 90% at year-end 2013 due to earned returns, higher discount rates, plan contributions in excess of minimum required contributions and a liability driven investment strategy Improved funded status has lowered pension & OPEB expense for 2014 relative to 2013 and should allow pension contributions to be reduced post-2014 PENSION & OTHER POST RETIREMENT BENEFITS (OPEB) Expense(3) 2013A 2014E 2015E Pension(1) $31 ~$10 ~$10 OPEB $18 ~$10 ~$10 Contributions 2013A 2014E 2015E 2016E Pension $141 $175 Up to $100 Up to $25 OPEB $14 $10 $10 $10 Assumptions For 2013 For 2014 Discount Rate: Pension 4.01% 4.88% Expected Long-Term Return on Plan Assets: Pension 7.00% 6.90% Excludes supplemental excess benefit retirement plan. Funded status as defined by ERISA was 107% as of January 1, 2013 and is estimated to be 103% funded as of January 1, 2014. Excludes approximately 50% of total estimated expense which is attributable to amounts capitalized or billed to electric plant participants. Data as of December 31, 2013 ($ in millions) |
APPENDIX |
2014 KEY DATES Docket # Q1 Q2 Q3 Q4 Key Regulatory Adjustor Filings Lost Fixed Cost Recovery 11-0224 January 15 Transmission Cost Adjustor May 15 Renewable Energy Surcharge July 1 10-Year Transmission Plan (Annual) 13-0002 January 31 2014 Integrated Resource Plan (Biennial) - April 1 Net Metering (Decision No. 74202) 13-0248 Value and Cost of Distributed Generation 14-0023 Workshops To Be Scheduled Quarterly Installation Filings April 15 July 15 September 15 Innovations and Technological Developments Docket (Workshops) 13-0375 Workshops To Be Scheduled Four Corners Rate Rider 11-0224 Pending ALJ Procedural Order Energy Efficiency 13-0214 March 18 March 31 April 17 ACC Open Meetings - ACC Open Meetings Held Monthly Elections - May 28 Candidate Nominations August 26 - Primary November 4 - General Arizona State Legislature - In Session January 13 End of Q2 Annual Shareholder Meeting - May 21 |
Utility-scale photovoltaic solar plants to be owned by APS Constructive rate recovery through RES until included in base rates 118 MW in commercial operation to date; 150 MW by end of 2014 Commitments to date: 170 MW; $695 million estimated capital investment AZ SUN PROGRAM Owning solar resources makes sense for our customers and the environment and provides earnings growth potential Name Location Capacity Developer Actual or Target COD* Paloma Gila Bend, AZ 17 MW First Solar September 2011 Cotton Center Gila Bend, AZ 17 MW Solon October 2011 Hyder Phase 1 Hyder, AZ 11 MW SunEdison October 2011 Hyder Phase 2 Hyder, AZ 5 MW SunEdison February 2012 Chino Valley Chino Valley, AZ 19 MW SunEdison November 2012 Yuma Foothills Phase 1 Yuma, AZ 17 MW AMEC March 2013 Yuma Foothills Phase 2 Yuma, AZ 18 MW AMEC November 2013 Hyder II Hyder, AZ 14 MW McCarthy November 2013 Gila Bend Gila Bend, AZ 32 MW Black & Veatch 2Q 2014 City of Phoenix Buckeye, AZ 10 MW TBD 2015 Luke Air Force Base Glendale, AZ 10 MW TBD 2015 Total 170 MW As of December 31, 2013 * In-Service or Commercial Operation Date |
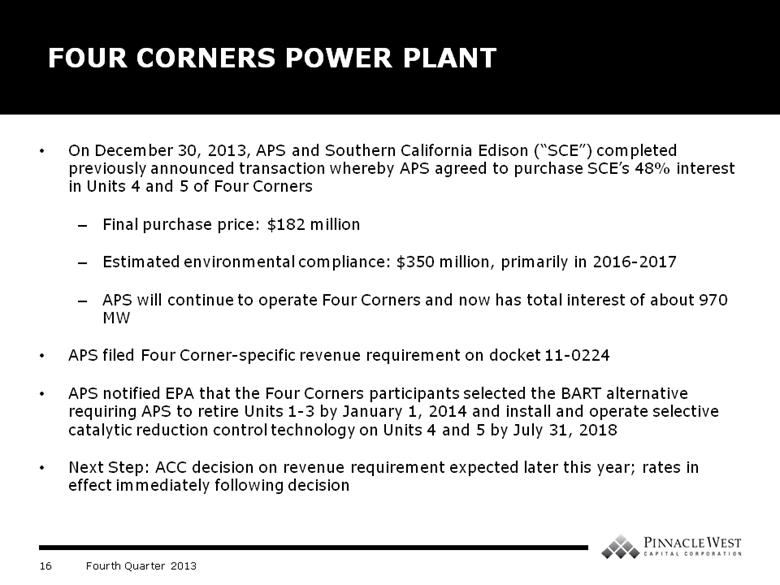
On December 30, 2013, APS and Southern California Edison (SCE) completed previously announced transaction whereby APS agreed to purchase SCEs 48% interest in Units 4 and 5 of Four Corners Final purchase price: $182 million Estimated environmental compliance: $350 million, primarily in 2016-2017 APS will continue to operate Four Corners and now has total interest of about 970 MW APS filed Four Corner-specific revenue requirement on docket 11-0224 APS notified EPA that the Four Corners participants selected the BART alternative requiring APS to retire Units 1-3 by January 1, 2014 and install and operate selective catalytic reduction control technology on Units 4 and 5 by July 31, 2018 Next Step: ACC decision on revenue requirement expected later this year; rates in effect immediately following decision Our proposal represents a balanced solution to new environmental regulations. FOUR CORNERS POWER PLANT |
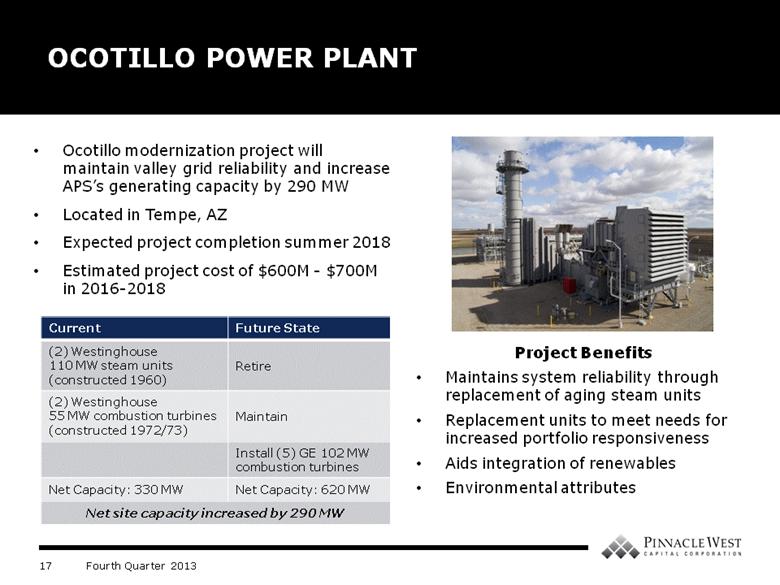
OCOTILLO POWER PLANT Current Future State (2) Westinghouse 110 MW steam units (constructed 1960) Retire (2) Westinghouse 55 MW combustion turbines (constructed 1972/73) Maintain Install (5) GE 102 MW combustion turbines Net Capacity: 330 MW Net Capacity: 620 MW Net site capacity increased by 290 MW Ocotillo modernization project will maintain valley grid reliability and increase APSs generating capacity by 290 MW Located in Tempe, AZ Expected project completion summer 2018 Estimated project cost of $600M - $700M in 2016-2018 Project Benefits Maintains system reliability through replacement of aging steam units Replacement units to meet needs for increased portfolio responsiveness Aids integration of renewables Environmental attributes |
CAPITAL EXPENDITURES 80% of capital expenditures are recovered through rate adjustors (40%) and depreciation cash flow (40%) ($ Millions) $986 $965 $1,026 2014 2016 as disclosed in 2013 Form 10-K Distribution Transmission Renewable Generation Environmental Traditional Generation Projected $1,263 |
RATE BASE APSs revenues come from a regulated retail rate base and meaningful transmission business $6.9 Billion Total Approved Rate Base 6-7% Compound Annual Growth Rate Projected Most Recent Rate Decisions ACC FERC Rate Effective Date 7/1/2012 6/1/2013 Test Year Ended 12/31/2010* 12/31/2012 Rate Base $5.7 B $1.2 B Equity Layer 54% 57% Allowed ROE 10.00% 10.75% *Adjusted to include post test-year plant in service through 3/31/2012 Rate base $ in billions, rounded |
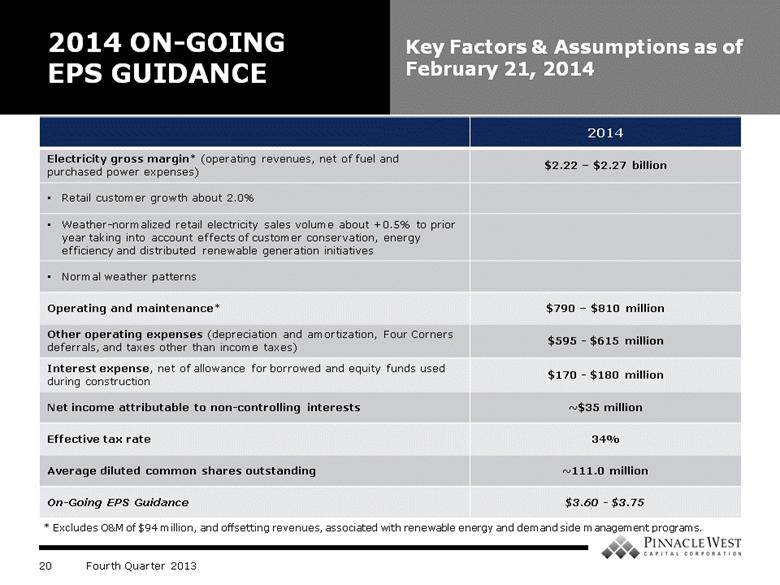
2014 ON-GOING EPS GUIDANCE Key Factors & Assumptions as of February 21, 2014 2014 Electricity gross margin* (operating revenues, net of fuel and purchased power expenses) $2.22 $2.27 billion Retail customer growth about 2.0% Weather-normalized retail electricity sales volume about +0.5% to prior year taking into account effects of customer conservation, energy efficiency and distributed renewable generation initiatives Normal weather patterns Operating and maintenance* $790 $810 million Other operating expenses (depreciation and amortization, Four Corners deferrals, and taxes other than income taxes) $595 - $615 million Interest expense, net of allowance for borrowed and equity funds used during construction $170 - $180 million Net income attributable to non-controlling interests ~$35 million Effective tax rate 34% Average diluted common shares outstanding ~111.0 million On-Going EPS Guidance $3.60 - $3.75 * Excludes O&M of $94 million, and offsetting revenues, associated with renewable energy and demand side management programs. |
OPERATIONS & MAINTENANCE Our goal is to keep consolidated O&M growth at or below retail sales growth levels Note: Pinnacle West O&M for 2009-2014E: $10M, $9M, $8M, $11M, $27M and $10M, respectively. * 2013 includes $9M related to the closure of Four Corners Units 1, 2 and 3 deferred for regulatory recovery in depreciation. **Renewable energy and demand side management expenses are offset by revenue adjustors. $790 - $810 ($ Millions) $788* |
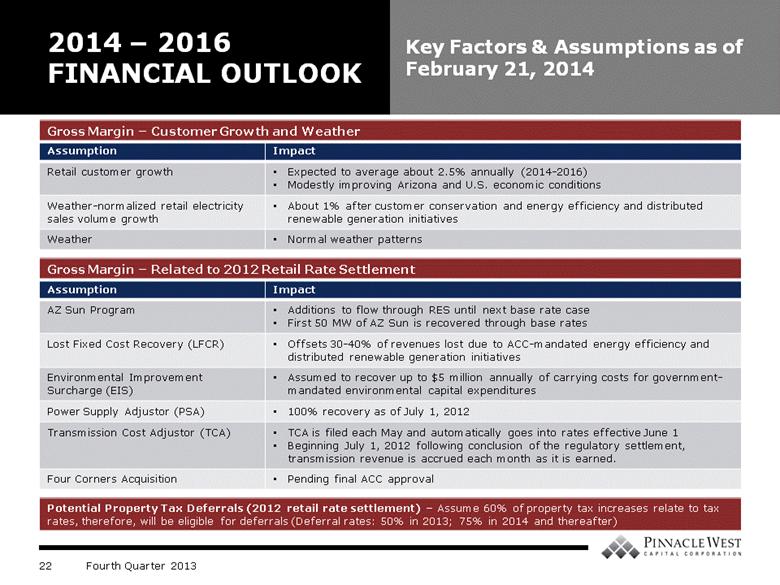
2014 2016 FINANCIAL OUTLOOK Key Factors & Assumptions as of February 21, 2014 Assumption Impact Retail customer growth Expected to average about 2.5% annually (2014-2016) Modestly improving Arizona and U.S. economic conditions Weather-normalized retail electricity sales volume growth About 1% after customer conservation and energy efficiency and distributed renewable generation initiatives Weather Normal weather patterns Assumption Impact AZ Sun Program Additions to flow through RES until next base rate case First 50 MW of AZ Sun is recovered through base rates Lost Fixed Cost Recovery (LFCR) Offsets 30-40% of revenues lost due to ACC-mandated energy efficiency and distributed renewable generation initiatives Environmental Improvement Surcharge (EIS) Assumed to recover up to $5 million annually of carrying costs for government-mandated environmental capital expenditures Power Supply Adjustor (PSA) 100% recovery as of July 1, 2012 Transmission Cost Adjustor (TCA) TCA is filed each May and automatically goes into rates effective June 1 Beginning July 1, 2012 following conclusion of the regulatory settlement, transmission revenue is accrued each month as it is earned. Four Corners Acquisition Pending final ACC approval Potential Property Tax Deferrals (2012 retail rate settlement) Assume 60% of property tax increases relate to tax rates, therefore, will be eligible for deferrals (Deferral rates: 50% in 2013; 75% in 2014 and thereafter) Gross Margin Customer Growth and Weather Gross Margin Related to 2012 Retail Rate Settlement |
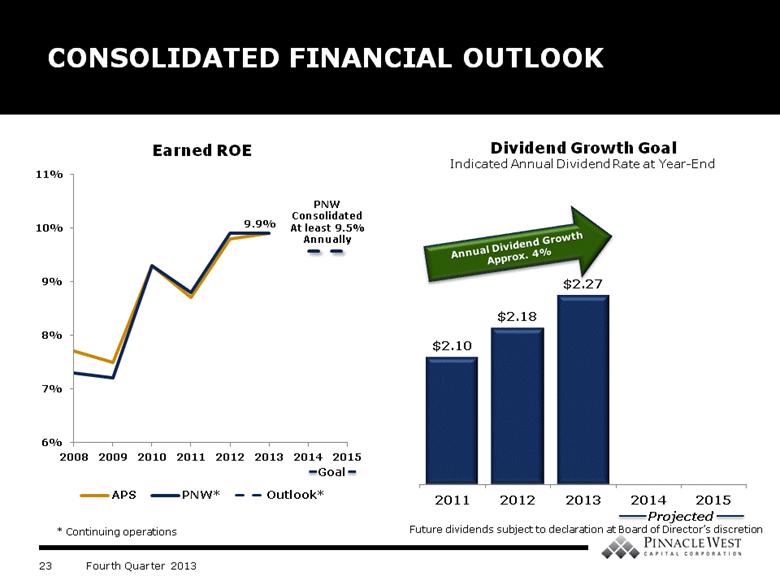
PNW Consolidated At least 9.5% Annually CONSOLIDATED FINANCIAL OUTLOOK Earned ROE * Continuing operations Projected Future dividends subject to declaration at Board of Directors discretion Annual Dividend Growth Approx. 4% Goal |
GROSS MARGIN EFFECTS OF WEATHER VARIANCES VS. NORMAL $8 Million Pretax Millions All periods recalculated to confirm to current 10-year rolling average. $10 Million $9 Million |
RENEWABLE ENERGY AND DEMAND SIDE MANAGEMENT EXPENSES* $150 Million $124 Million * O&M expenses related to renewable energy, demand side management and similar regulatory programs are offset by comparable revenue amounts. $137 Million Pretax Millions |
NON-GAAP EPS RECONCILIATION 4TH QUARTER 2013 VS. 4TH QUARTER 2012 2013 2012 Net income attributable to common shareholders 0.22 $ 0.20 $ Adjustments: Loss from discontinued operations - 0.04 On-going EPS 0.22 $ 0.24 $ Three Months Ended December 31, |
NON-GAAP EPS RECONCILIATION YTD 2013 VS. YTD 2012 2013 2012 Net income attributable to common shareholders 3.66 $ 3.45 $ Adjustments: Loss from discontinued operations - 0.05 On-going EPS 3.66 $ 3.50 $ Twelve Months Ended December 31, |
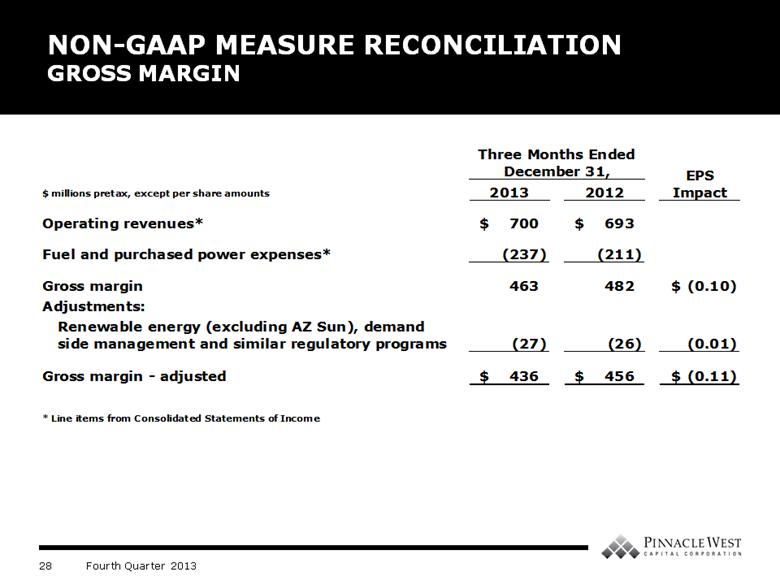
NON-GAAP MEASURE RECONCILIATION GROSS MARGIN $ millions pretax, except per share amounts 2013 2012 Operating revenues* 700 $ 693 $ Fuel and purchased power expenses* (237) (211) Gross margin 463 482 (0.10) $ Adjustments: Renewable energy (excluding AZ Sun), demand side management and similar regulatory programs (27) (26) (0.01) Gross margin - adjusted 436 $ 456 $ (0.11) $ * Line items from Consolidated Statements of Income Three Months Ended December 31, EPS Impact |
Exhibit 99.4
Pinnacle West Capital Corporation
Earnings Variance Explanations
For the Three-Month and Twelve-Month Periods Ended December 31, 2013 and 2012
The following discussion includes the earnings variance explanations for Pinnacle West Capital Corporation (Pinnacle West) for the three months and twelve months ended December 31, 2013 and 2012. We suggest that this discussion be read in connection with the Pinnacle West/APS Annual Report on Form 10-K for the fiscal year ended December 31, 2013. Additional operating and financial statistics and a glossary of terms are available on our website (www.pinnaclewest.com).
RESULTS OF OPERATIONS
Pinnacle Wests only reportable business segment is our regulated electricity segment, which consists of traditional regulated retail and wholesale electricity businesses (primarily electric service to Native Load customers) and related activities and includes electricity generation, transmission and distribution.
Operating Results Three-month period ended December 31, 2013 compared with three-month period ended December 31, 2012.
Our consolidated net income attributable to common shareholders for the three months ended December 31, 2013 was $24 million, compared with net income of $23 million for the prior-year period. The regulated electricity segment results were comparable to the prior-year period. The results reflect decreases related to the effects of weather; lower retail transmission revenues; and lower retail sales as a result of changes in customer usage related to energy efficiency, customer conservation and distributed generation, partially offset by customer growth. These negative factors were partially offset by lower operations and maintenance expenses related to lower employee benefit costs.
The following table presents net income attributable to common shareholders by business segment compared with the prior-year period:
|
|
Three Months Ended |
|
|
| |||||
|
|
2013 |
|
2012 |
|
Net Change |
| |||
|
|
(dollars in millions) |
| |||||||
Regulated Electricity Segment: |
|
|
|
|
|
|
| |||
Operating revenues less fuel and purchased power expenses |
|
$ |
462 |
|
$ |
476 |
|
$ |
(14 |
) |
Operations and maintenance |
|
(239 |
) |
(237 |
) |
(2 |
) | |||
Depreciation and amortization |
|
(98 |
) |
(103 |
) |
5 |
| |||
Taxes other than income taxes |
|
(40 |
) |
(39 |
) |
(1 |
) | |||
Other income (expenses), net |
|
4 |
|
(1 |
) |
5 |
| |||
Interest charges, net of allowance for borrowed funds used during construction |
|
(47 |
) |
(48 |
) |
1 |
| |||
Income taxes |
|
(9 |
) |
(16 |
) |
7 |
| |||
Less income related to noncontrolling interests (Note 19) |
|
(9 |
) |
(8 |
) |
(1 |
) | |||
Regulated electricity segment net income |
|
24 |
|
24 |
|
|
| |||
|
|
|
|
|
|
|
| |||
All other |
|
|
|
3 |
|
(3 |
) | |||
Income from Continuing Operations Attributable to Common Shareholders |
|
24 |
|
27 |
|
(3 |
) | |||
Loss from Discontinued Operations Attributable to Common Shareholders (a) |
|
|
|
(4 |
) |
4 |
| |||
Net Income Attributable to Common Shareholders |
|
$ |
24 |
|
$ |
23 |
|
$ |
1 |
|
(a) Includes activities related to SunCor.
Operating revenues less fuel and purchased power expenses. Regulated electricity segment operating revenues less fuel and purchased power expenses were $14 million lower for the three months ended December 31, 2013 compared with the prior-year period. The following table summarizes the major components of this change:
|
|
Increase (Decrease) |
| |||||||
|
|
Operating |
|
Fuel and |
|
Net change |
| |||
|
|
(dollars in millions) |
| |||||||
|
|
|
|
|
|
|
| |||
Effects of weather |
|
$ |
(12 |
) |
$ |
(3 |
) |
$ |
(9 |
) |
Lower retail transmission revenues |
|
(7 |
) |
|
|
(7 |
) | |||
Lower retail sales due to changes in customer usage, partially offset by customer growth |
|
(10 |
) |
(4 |
) |
(6 |
) | |||
Higher fuel and purchased power costs, net of related deferrals and off-system sales |
|
29 |
|
30 |
|
(1 |
) | |||
Higher demand-side management, renewable energy and similar regulatory surcharges |
|
9 |
|
2 |
|
7 |
| |||
Miscellaneous items, net |
|
3 |
|
1 |
|
2 |
| |||
Total |
|
$ |
12 |
|
$ |
26 |
|
$ |
(14 |
) |
Operations and maintenance. Operations and maintenance expenses increased $2 million for the three months ended December 31, 2013 compared with the prior-year period primarily because of:
· An increase of $9 million related to the closure of Four Corners Units 1, 2, and 3 deferred for regulatory recovery in depreciation;
· An increase of $5 million related to technical analysis, consulting, advertising and communication costs;
· An increase of $3 million related to costs for demand-side management, renewable energy and similar regulatory programs, which were largely offset in operating revenues; and
· A decrease of $15 million related to lower employee benefit costs.
Depreciation and amortization. Depreciation and amortization expenses were $5 million lower for the three months ended December 31, 2013 compared with the prior-year period primarily because of the regulatory deferral of operating expenses associated with the closure of Four Corners Units 1, 2, and 3, partially offset by increased plant in service.
Income taxes. Income taxes were $7 million lower for the three months ended December 31, 2013 compared with the prior-year period primarily due to lower pretax income and a lower effective tax rate in the current period.
Operating Results 2013 compared with 2012.
Our consolidated net income attributable to common shareholders for the year ended December 31, 2013 was $406 million, compared with net income of $382 million for the prior year. The results reflect an increase of approximately $21 million for the regulated electricity segment, primarily due to increases related to the retail regulatory settlement effective July 1, 2012 (see Note 3); higher retail transmission revenues; and lower net interest charges due to lower debt balances and lower interest rates in the current-year period. These positive factors were partially offset by higher operations and maintenance expenses; higher fuel and purchased power costs, net of related deferrals; lower retail sales as a result of changes in customer usage related to energy efficiency, customer conservation and distributed generation, partially offset by customer growth; and higher depreciation and amortization expenses.
The following table presents net income attributable to common shareholders by business segment compared with the prior year:
|
|
Year Ended |
|
|
| |||||
|
|
2013 |
|
2012 |
|
Net Change |
| |||
|
|
(dollars in millions) |
| |||||||
Regulated Electricity Segment: |
|
|
|
|
|
|
| |||
Operating revenues less fuel and purchased power expenses |
|
$ |
2,356 |
|
$ |
2,299 |
|
$ |
57 |
|
Operations and maintenance |
|
(925 |
) |
(885 |
) |
(40 |
) | |||
Depreciation and amortization |
|
(416 |
) |
(404 |
) |
(12 |
) | |||
Taxes other than income taxes |
|
(164 |
) |
(159 |
) |
(5 |
) | |||
Other income (expenses), net |
|
11 |
|
6 |
|
5 |
| |||
Interest charges, net of allowance for borrowed funds used during construction |
|
(187 |
) |
(200 |
) |
13 |
| |||
Income taxes |
|
(232 |
) |
(237 |
) |
5 |
| |||
Less income related to noncontrolling interests (Note 19) |
|
(34 |
) |
(32 |
) |
(2 |
) | |||
Regulated electricity segment net income |
|
409 |
|
388 |
|
21 |
| |||
|
|
|
|
|
|
|
| |||
All other |
|
(3 |
) |
|
|
(3 |
) | |||
Income from Continuing Operations Attributable to Common Shareholders |
|
406 |
|
388 |
|
18 |
| |||
|
|
|
|
|
|
|
| |||
Loss from Discontinued Operations Attributable to Common Shareholders (a) |
|
|
|
(6 |
) |
6 |
| |||
|
|
|
|
|
|
|
| |||
Net Income Attributable to Common Shareholders |
|
$ |
406 |
|
$ |
382 |
|
$ |
24 |
|
(a) Includes activities related to SunCor.
Operating revenues less fuel and purchased power expenses. Regulated electricity segment operating revenues less fuel and purchased power expenses were $57 million higher for the year ended December 31, 2013 compared with the prior year. The following table summarizes the major components of this change:
|
|
Increase (Decrease) |
| |||||||
|
|
Operating |
|
Fuel and |
|
Net change |
| |||
|
|
(dollars in millions) |
| |||||||
|
|
|
|
|
|
|
| |||
Impacts of retail regulatory settlement effective July 1, 2012 |
|
$ |
64 |
|
$ |
6 |
|
$ |
58 |
|
Higher demand-side management, renewable energy and similar regulatory surcharges |
|
34 |
|
7 |
|
27 |
| |||
Higher retail transmission revenues |
|
11 |
|
|
|
11 |
| |||
Lower retail sales due to changes in customer usage patterns and related pricing, partially offset by customer growth |
|
(17 |
) |
(4 |
) |
(13 |
) | |||
Higher fuel and purchased power costs, net of related deferrals and off-system sales |
|
74 |
|
95 |
|
(21 |
) | |||
Miscellaneous items, net |
|
(8 |
) |
(3 |
) |
(5 |
) | |||
Total |
|
$ |
158 |
|
$ |
101 |
|
$ |
57 |
|
Operations and maintenance. Operations and maintenance expenses increased $40 million for the year ended December 31, 2013 compared with the prior year primarily because of:
· An increase of $14 million related to technical analysis, consulting, advertising and communications costs;
· An increase of $13 million related to costs for demand-side management, renewable energy and similar regulatory programs, which were largely offset in operating revenues;
· An increase of $9 million related to the closure of Four Corners Units 1, 2, and 3, deferred for regulatory recovery in depreciation;
· An increase of $6 million in energy delivery and customer service costs;
· An increase of $6 million in information technology costs;
· A decrease of $6 million in generation costs primarily related to lower fossil generation outage costs and lower nuclear generation costs; and
· A decrease of $2 million related to other miscellaneous factors.
Depreciation and amortization. Depreciation and amortization expenses were $12 million higher for the year ended December 31, 2013 compared with the prior year, primarily because of increased plant in service, partially offset by the regulatory deferral of operating expenses associated with the closure of Four Corners Units 1, 2, and 3.
Interest charges, net of allowance for borrowed funds used during construction. Interest charges, net of allowance for borrowed funds used during construction, decreased $13 million for the year ended December 31, 2013 compared with the prior year, primarily because of lower debt balances and lower interest rates in the current year.
Income taxes. Income taxes were $5 million lower for the year ended December 31, 2013 compared with the prior year primarily due to a lower effective tax rate in the current period, partially offset by the effects of higher pretax income in the current year.
PINNACLE WEST CAPITAL CORPORATION
CONSOLIDATED STATEMENTS OF INCOME
(unaudited)
(dollars and shares in thousands, except per share amounts)
|
|
THREE MONTHS ENDED |
|
|
|
|
|
|
| |||||
|
|
DECEMBER 31, |
|
Increase (Decrease) |
|
|
| |||||||
|
|
2013 |
|
2012 |
|
Amount |
|
Percent |
|
|
| |||
|
|
|
|
|
|
|
|
|
|
|
| |||
Operating Revenues |
|
$ |
699,762 |
|
$ |
693,122 |
|
$ |
6,640 |
|
1.0 |
% |
B |
|
|
|
|
|
|
|
|
|
|
|
|
| |||
Operating Expenses |
|
|
|
|
|
|
|
|
|
|
| |||
Fuel and purchased power |
|
236,493 |
|
210,864 |
|
25,629 |
|
12.2 |
% |
W |
| |||
Operations and maintenance |
|
238,854 |
|
237,141 |
|
1,713 |
|
0.7 |
% |
W |
| |||
Depreciation and amortization |
|
98,298 |
|
103,268 |
|
(4,970 |
) |
4.8 |
% |
B |
| |||
Taxes other than income taxes |
|
40,076 |
|
39,052 |
|
1,024 |
|
2.6 |
% |
W |
| |||
Other expenses |
|
2,141 |
|
1,508 |
|
633 |
|
42.0 |
% |
W |
| |||
Total |
|
615,862 |
|
591,833 |
|
24,029 |
|
4.1 |
% |
W |
| |||
|
|
|
|
|
|
|
|
|
|
|
| |||
Operating Income |
|
83,900 |
|
101,289 |
|
(17,389 |
) |
17.2 |
% |
W |
| |||
|
|
|
|
|
|
|
|
|
|
|
| |||
Other Income (Deductions) |
|
|
|
|
|
|
|
|
|
|
| |||
Allowance for equity funds used during construction |
|
6,883 |
|
6,797 |
|
86 |
|
1.3 |
% |
B |
| |||
Other income |
|
317 |
|
249 |
|
68 |
|
27.3 |
% |
B |
| |||
Other expense |
|
(2,603 |
) |
(7,409 |
) |
4,806 |
|
64.9 |
% |
B |
| |||
Total |
|
4,597 |
|
(363 |
) |
4,960 |
|
1366.4 |
% |
B |
| |||
|
|
|
|
|
|
|
|
|
|
|
| |||
Interest Expense |
|
|
|
|
|
|
|
|
|
|
| |||
Interest charges |
|
50,516 |
|
52,407 |
|
(1,891 |
) |
3.6 |
% |
B |
| |||
Allowance for borrowed funds used during construction |
|
(4,000 |
) |
(4,543 |
) |
543 |
|
12.0 |
% |
W |
| |||
Total |
|
46,516 |
|
47,864 |
|
(1,348 |
) |
2.8 |
% |
B |
| |||
|
|
|
|
|
|
|
|
|
|
|
| |||
Income From Continuing Operations Before Income Taxes |
|
41,981 |
|
53,062 |
|
(11,081 |
) |
20.9 |
% |
W |
| |||
|
|
|
|
|
|
|
|
|
|
|
| |||
Income Taxes |
|
9,167 |
|
18,157 |
|
(8,990 |
) |
49.5 |
% |
B |
| |||
|
|
|
|
|
|
|
|
|
|
|
| |||
Income From Continuing Operations |
|
32,814 |
|
34,905 |
|
(2,091 |
) |
6.0 |
% |
W |
| |||
|
|
|
|
|
|
|
|
|
|
|
| |||
Loss From Discontinued Operations |
|
|
|
|
|
|
|
|
|
|
| |||
Net of Income Taxes |
|
|
|
(4,234 |
) |
4,234 |
|
100.0 |
% |
B |
| |||
|
|
|
|
|
|
|
|
|
|
|
| |||
Net Income |
|
32,814 |
|
30,671 |
|
2,143 |
|
7.0 |
% |
B |
| |||
|
|
|
|
|
|
|
|
|
|
|
| |||
Less: Net income attributable to noncontrolling interests |
|
8,554 |
|
8,040 |
|
514 |
|
6.4 |
% |
W |
| |||
|
|
|
|
|
|
|
|
|
|
|
| |||
Net Income Attributable To Common Shareholders |
|
$ |
24,260 |
|
$ |
22,631 |
|
$ |
1,629 |
|
7.2 |
% |
B |
|
|
|
|
|
|
|
|
|
|
|
|
| |||
Weighted-Average Common Shares Outstanding - Basic |
|
110,130 |
|
109,693 |
|
437 |
|
0.4 |
% |
|
| |||
|
|
|
|
|
|
|
|
|
|
|
| |||
Weighted-Average Common Shares Outstanding - Diluted |
|
110,936 |
|
110,776 |
|
160 |
|
0.1 |
% |
|
| |||
|
|
|
|
|
|
|
|
|
|
|
| |||
Earnings Per Weighted-Average Common Share Outstanding |
|
|
|
|
|
|
|
|
|
|
| |||
Income from continuing operations attributable to common shareholders - basic |
|
$ |
0.22 |
|
$ |
0.24 |
|
$ |
(0.02 |
) |
8.3 |
% |
W |
|
Net income attributable to common shareholders - basic |
|
$ |
0.22 |
|
$ |
0.21 |
|
$ |
0.01 |
|
4.8 |
% |
B |
|
Income from continuing operations attributable to common shareholders - diluted |
|
$ |
0.22 |
|
$ |
0.24 |
|
$ |
(0.02 |
) |
8.3 |
% |
W |
|
Net income attributable to common shareholders - diluted |
|
$ |
0.22 |
|
$ |
0.20 |
|
$ |
0.02 |
|
10.0 |
% |
B |
|
|
|
|
|
|
|
|
|
|
|
|
| |||
Amounts Attributable To Common Shareholders |
|
|
|
|
|
|
|
|
|
|
| |||
Income from continuing operations, net of tax |
|
$ |
24,260 |
|
$ |
26,865 |
|
$ |
(2,605 |
) |
9.7 |
% |
W |
|
Discontinued operations, net of tax |
|
|
|
(4,234 |
) |
4,234 |
|
100.0 |
% |
B |
| |||
Net income attributable to common shareholders |
|
$ |
24,260 |
|
$ |
22,631 |
|
$ |
1,629 |
|
7.2 |
% |
B |
|
B Better
W Worse
PINNACLE WEST CAPITAL CORPORATION
CONSOLIDATED STATEMENTS OF INCOME
(unaudited)
(dollars and shares in thousands, except per share amounts)
|
|
TWELVE MONTHS ENDED |
|
|
|
|
|
|
| |||||
|
|
DECEMBER 31, |
|
Increase (Decrease) |
|
|
| |||||||
|
|
2013 |
|
2012 |
|
Amount |
|
Percent |
|
|
| |||
|
|
|
|
|
|
|
|
|
|
|
| |||
Operating Revenues |
|
$ |
3,454,628 |
|
$ |
3,301,804 |
|
$ |
152,824 |
|
4.6 |
% |
B |
|
|
|
|
|
|
|
|
|
|
|
|
| |||
Operating Expenses |
|
|
|
|
|
|
|
|
|
|
| |||
Fuel and purchased power |
|
1,095,709 |
|
994,790 |
|
100,919 |
|
10.1 |
% |
W |
| |||
Operations and maintenance |
|
924,727 |
|
884,769 |
|
39,958 |
|
4.5 |
% |
W |
| |||
Depreciation and amortization |
|
415,708 |
|
404,336 |
|
11,372 |
|
2.8 |
% |
W |
| |||
Taxes other than income taxes |
|
164,167 |
|
159,323 |
|
4,844 |
|
3.0 |
% |
W |
| |||
Other expenses |
|
7,994 |
|
6,831 |
|
1,163 |
|
17.0 |
% |
W |
| |||
Total |
|
2,608,305 |
|
2,450,049 |
|
158,256 |
|
6.5 |
% |
W |
| |||
|
|
|
|
|
|
|
|
|
|
|
| |||
Operating Income |
|
846,323 |
|
851,755 |
|
(5,432 |
) |
0.6 |
% |
W |
| |||
|
|
|
|
|
|
|
|
|
|
|
| |||
Other Income (Deductions) |
|
|
|
|
|
|
|
|
|
|
| |||
Allowance for equity funds used during construction |
|
25,581 |
|
22,436 |
|
3,145 |
|
14.0 |
% |
B |
| |||
Other income |
|
1,704 |
|
1,606 |
|
98 |
|
6.1 |
% |
B |
| |||
Other expense |
|
(16,024 |
) |
(19,842 |
) |
3,818 |
|
19.2 |
% |
B |
| |||
Total |
|
11,261 |
|
4,200 |
|
7,061 |
|
168.1 |
% |
B |
| |||
|
|
|
|
|
|
|
|
|
|
|
| |||
Interest Expense |
|
|
|
|
|
|
|
|
|
|
| |||
Interest charges |
|
201,888 |
|
214,616 |
|
(12,728 |
) |
5.9 |
% |
B |
| |||
Allowance for borrowed funds used during construction |
|
(14,861 |
) |
(14,971 |
) |
110 |
|
0.7 |
% |
W |
| |||
Total |
|
187,027 |
|
199,645 |
|
(12,618 |
) |
6.3 |
% |
B |
| |||
|
|
|
|
|
|
|
|
|
|
|
| |||
Income From Continuing Operations Before Income Taxes |
|
670,557 |
|
656,310 |
|
14,247 |
|
2.2 |
% |
B |
| |||
|
|
|
|
|
|
|
|
|
|
|
| |||
Income Taxes |
|
230,591 |
|
237,317 |
|
(6,726 |
) |
2.8 |
% |
B |
| |||
|
|
|
|
|
|
|
|
|
|
|
| |||
Income From Continuing Operations |
|
439,966 |
|
418,993 |
|
20,973 |
|
5.0 |
% |
B |
| |||
|
|
|
|
|
|
|
|
|
|
|
| |||
Loss From Discontinued Operations |
|
|
|
|
|
|
|
|
|
|
| |||
Net of Income Taxes |
|
|
|
(5,829 |
) |
5,829 |
|
100.0 |
% |
B |
| |||
|
|
|
|
|
|
|
|
|
|
|
| |||
Net Income |
|
439,966 |
|
413,164 |
|
26,802 |
|
6.5 |
% |
B |
| |||
|
|
|
|
|
|
|
|
|
|
|
| |||
Less: Net income attributable to noncontrolling interests |
|
33,892 |
|
31,622 |
|
2,270 |
|
7.2 |
% |
W |
| |||
|
|
|
|
|
|
|
|
|
|
|
| |||
Net Income Attributable To Common Shareholders |
|
$ |
406,074 |
|
$ |
381,542 |
|
$ |
24,532 |
|
6.4 |
% |
B |
|
|
|
|
|
|
|
|
|
|
|
|
| |||
Weighted-Average Common Shares Outstanding - Basic |
|
109,984 |
|
109,510 |
|
474 |
|
0.4 |
% |
|
| |||
|
|
|
|
|
|
|
|
|
|
|
| |||
Weighted-Average Common Shares Outstanding - Diluted |
|
110,806 |
|
110,527 |
|
279 |
|
0.3 |
% |
|
| |||
|
|
|
|
|
|
|
|
|
|
|
| |||
Earnings Per Weighted-Average Common Share Outstanding |
|
|
|
|
|
|
|
|
|
|
| |||
Income from continuing operations attributable to common shareholders - basic |
|
$ |
3.69 |
|
$ |
3.54 |
|
$ |
0.15 |
|
4.2 |
% |
B |
|
Net income attributable to common shareholders - basic |
|
$ |
3.69 |
|
$ |
3.48 |
|
$ |
0.21 |
|
6.0 |
% |
B |
|
Income from continuing operations attributable to common shareholders - diluted |
|
$ |
3.66 |
|
$ |
3.50 |
|
$ |
0.16 |
|
4.6 |
% |
B |
|
Net income attributable to common shareholders - diluted |
|
$ |
3.66 |
|
$ |
3.45 |
|
$ |
0.21 |
|
6.1 |
% |
B |
|
|
|
|
|
|
|
|
|
|
|
|
| |||
Amounts Attributable To Common Shareholders |
|
|
|
|
|
|
|
|
|
|
| |||
Income from continuing operations, net of tax |
|
$ |
406,074 |
|
$ |
387,380 |
|
$ |
18,694 |
|
4.8 |
% |
B |
|
Discontinued operations, net of tax |
|
|
|
(5,838 |
) |
5,838 |
|
100.0 |
% |
B |
| |||
Net income attributable to common shareholders |
|
$ |
406,074 |
|
$ |
381,542 |
|
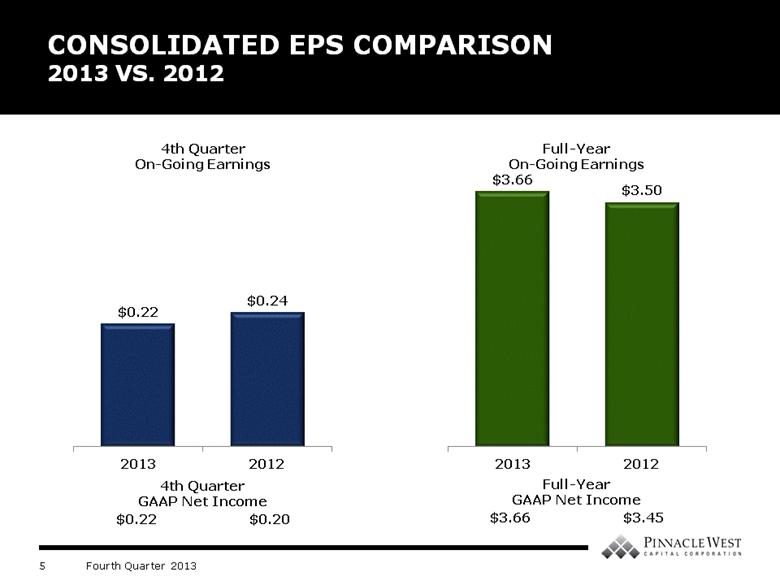
$ |
24,532 |
|
6.4 |
% |
B |
|
B Better
W Worse
0/K_2H*0";1_=%&T>@I
M:DAADGE6*%&>1N`JC)-,"N57^Z/RI-H]!^52'K3[:W>ZNX;="H>5P@+=`2<9
M-`+5V+>CZ#>:V;O[''&5M+=KF9G.`J+_`%/0"KNM>''TK1M(U*2=)&U*-I?)
M4 "KQKDPC6;6X\MF6?)89&,+W
MG->=2#Y6JA6+,O-C;G_>'ZU6KI5TO3F\*6]XU^%E\TJZ;#+C4X]1NIVTV[M)(;66%MHN9E`X(7^$$GKP<5!H?AZ^\
M3>$KV:.]Q*DT%K;VBA0)I,X&3U`"DGCZTT]"K+8XJ8`"-<#A/3UYIL4#3R;(
MT!.,DG@`>I]!5Z]TZ:#5;NWF9%6UE,4LHY48XX]3Z"JEQ=*(S;VP*V^<\_>D
M/JW^%#(;N[(O:E-I]ALM](D$I,0$]UW9NX7@8%8I('8?E2%J:`6^E9W93LVW
M8?'.\+[H\!L8SC.*ZG3DT>W^'FJSWB$ZG
-Q`EVT?R8SRS$<#W^E5HM1+F=DUZ'%JH_NC\J]"T+QE'
MX;\$/:VMO927\Q;!EB#.A/&[WX)K,^('A"W\'^(+?2[2XEN=]NDC,X&XN20>
M!T''`JMXA\)ZEX?T^QN]0,*FY&!$C9>/`!&_T)!Z4XM=46KVT.?X9B2HR3Z5
MU%G?ZRVG1:?I_F%7C+-';Q#)7W(&<8ZUS$2&2154$L3@`#.:]PT:XLOA]X3M
MI-6@FCOKM20L>"S=<]A@CBJOI8%#FU?0\?"`/AD7/^[7H&@^+O[!T"."WT
MFWGG?.'F0$+@\-CO_P#6KD5O;!KD*EFK(6Y>5B3@GT%>G:CJ.A:1X)?3K;89
MIX]NR&/+;\Y#,_88[4IJ-TMV73NHM]#8BM["]T!-6\12V1?5#^G->L:5J]E)\-M
M5MFO(/,$3A%,@^;=P-OKS7EQ'3/KS_*FV.&QRDG;ZU77Y;M3ZFKEPFQW3/W&
M(/X53D&)4842W*+Z=",4UNM*AY-(U:`5YN]6$^Y'UZ57E'6K*?=3ITJ([@2'
MY8C_`"J]%^[@)]%K,EFVD1;
WQODN45,KST7!]>U>>
M^(_B%KGB(/!+/]GL678MI#\J!>P/K7.@SRWTADE9I6W;W=^3USDFM"ZTW3K/
M269K_P`[4BT92*-3L"$$L2<
:]X-L=.LM5AL_LJI^Y6([W4'+,3UY!.,
M>O-9LT1U$*V-D4M=-ADOKZ%=NQ3NQZEW/"_YXK,\1>#KN_F6]N)+=7"`1E(]
MT/W<'EN_/Z5V]I:6MC:);V<2Q0#D(HQC_/O27R"2P?.,)\V3VXZT^72XN;
M4X?]]96C6\<;L`NR-@
^EOM7@O'6XN(WRN%<*H`[#`)&*1:O8G\60:=X=T^YN='LH9S/J
MY_TT-N$?ED$)GOELG\Z\YU%I)S;7$\L;23@N=O498Y)KK5OM/GT#4Q?J[/87
M_G6<1?:)-\F67'T%