UNITED STATES
SECURITIES AND EXCHANGE COMMISSION
Washington, D.C. 20549
FORM 8-K
CURRENT REPORT
Pursuant to Section 13 or 15(d) of the
Securities Exchange Act of 1934
Date of report (Date of earliest event reported): August 2, 2013
Commission File Number |
|
Exact Name of Registrant as Specified in Address and Telephone Number |
|
IRS Employer |
|
|
|
|
|
1-8962 |
|
Pinnacle West Capital Corporation (an Arizona corporation) 400 North Fifth Street, P.O. Box 53999 Phoenix, AZ 85072-3999 (602) 250-1000 |
|
86-0512431 |
|
|
|
|
|
1-4473 |
|
Arizona Public Service Company (an Arizona corporation) 400 North Fifth Street, P.O. Box 53999 Phoenix, AZ 85072-3999 (602) 250-1000 |
|
86-0011170 |
Check the appropriate box below if the Form 8-K filing is intended to simultaneously satisfy the filing obligation of the registrant under any of the following provisions:
o Written communications pursuant to Rule 425 under the Securities Act (17 CFR 230.425)
o Soliciting material pursuant to Rule 14a-12 under the Exchange Act (17 CFR 240.14a-12)
o Pre-commencement communications pursuant to Rule 14d-2(b) under the Exchange Act (17 CFR 240.14d-2(b))
o Pre-commencement communications pursuant to Rule 13e-4(c) under the Exchange Act (17 CFR 240.13e-4(c))
This combined Form 8-K is separately filed or furnished by Pinnacle West Capital Corporation and Arizona Public Service Company. Each registrant is filing or furnishing on its own behalf all of the information contained in this Form 8-K that relates to such registrant and, where required, its subsidiaries. Except as stated in the preceding sentence, neither registrant is filing or furnishing any information that does not relate to such registrant, and therefore makes no representation as to any such information.
Item 2.02. Results of Operations and Financial Condition.
Item 7.01. Regulation FD Disclosure.
The following information is furnished pursuant to both Item 2.02 and 7.01.
On August 2, 2013, Pinnacle West Capital Corporation (the Company or Pinnacle West) issued a press release regarding its financial results for the fiscal quarter ended June 30, 2013 and its earnings outlook for 2013. A copy of the press release is attached hereto as Exhibit 99.1.
The Company is providing a quarterly consolidated statistical summary and a copy of the slide presentation made in connection with the quarterly earnings conference call on August 2, 2013. This information contains Company operating results for the fiscal quarter ended June 30, 2013 and is attached hereto as Exhibits 99.2 and 99.3. The summary and slide presentation are concurrently being posted to the Companys website at www.pinnaclewest.com, which also contains a glossary of relevant terms.
Item 9.01. Financial Statements and Exhibits.
(d) Exhibits.
Exhibit |
|
Registrant(s) |
|
Description |
|
|
|
|
|
99.1 |
|
Pinnacle West |
|
Earnings News Release issued on August 2, 2013. |
|
|
|
|
|
99.2 |
|
Pinnacle West |
|
Pinnacle West Capital Corporation quarterly consolidated statistical summary for the three-month and six-month periods ended June 30, 2013 and 2012. |
|
|
|
|
|
99.3 |
|
Pinnacle West |
|
Pinnacle West Capital Corporation 2nd Quarter 2013 Results slide presentation accompanying August 2, 2013 conference call. |
SIGNATURES
Pursuant to the requirements of the Securities Exchange Act of 1934, each registrant has duly caused this report to be signed on its behalf by the undersigned hereunto duly authorized.
|
PINNACLE WEST CAPITAL CORPORATION | |
|
(Registrant) | |
|
| |
|
| |
Dated: August 2, 2013 |
By: |
/s/ James R. Hatfield |
|
|
James R. Hatfield |
|
|
Executive Vice President and |
|
|
Chief Financial Officer |
|
|
|
|
|
|
|
ARIZONA PUBLIC SERVICE COMPANY | |
|
(Registrant) | |
|
| |
|
| |
Dated: August 2, 2013 |
By: |
/s/ James R. Hatfield |
|
|
James R. Hatfield |
|
|
Executive Vice President and |
|
|
Chief Financial Officer |
Exhibit Index
Exhibit |
|
Registrant(s) |
|
Description |
|
|
|
|
|
99.1 |
|
Pinnacle West |
|
Earnings News Release issued on August 2, 2013. |
|
|
|
|
|
99.2 |
|
Pinnacle West |
|
Pinnacle West Capital Corporation quarterly consolidated statistical summary for the three-month and six-month periods ended June 30, 2013 and 2012. |
|
|
|
|
|
99.3 |
|
Pinnacle West |
|
Pinnacle West Capital Corporation 2nd Quarter 2013 Results slide presentation accompanying August 2, 2013 conference call. |
Exhibit 99.1
FOR IMMEDIATE RELEASE |
August 2, 2013 | |
Media Contact: Analyst Contact: |
Alan Bunnell, (602) 250-3376 Paul Mountain, (602) 250-4952 |
|
Website: |
pinnaclewest.com | |
PINNACLE WEST REPORTS 2013 SECOND-QUARTER RESULTS
· 2013 earnings guidance revised upward largely as a result of favorable weather
· Reliable service, operational excellence and disciplined cost management remain Company priorities
PHOENIX Pinnacle West Capital Corp. (NYSE: PNW) today reported consolidated on-going earnings of $131.2 million, or $1.18 per diluted share of common stock, for the quarter ended June 30, 2013. This result compares with on-going earnings of $123.1 million or $1.12 per share, in the same 2012 period.
The Companys net income attributable to common shareholders for the 2013 second quarter was $131.2 million, or $1.18 per diluted share, compared with net income of $122.3 million, or $1.11 per share, for the same quarter a year ago. On-going earnings exclude results of discontinued operations. A reconciliation of reported earnings to on-going earnings is provided at the end of this release.
Beneficial weather variations compared with normal patterns were positive contributors to our second-quarter and year-to-date results, said Pinnacle West Chairman, President and Chief Executive Officer Don Brandt. As a result, we have revised our earnings guidance upward to reflect the weathers impact on our full-year financial projections.
By executing our strategy, we are continuing to create value for customers and shareholders through operational excellence, disciplined cost management and sound capital investments that produce a reliable, sustainable energy future for Arizona.
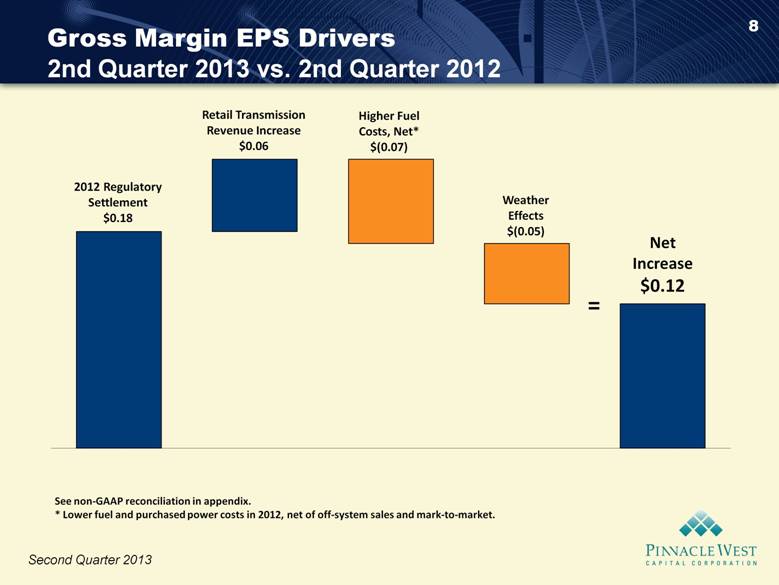
The 2013 second-quarter on-going results comparison was positively impacted by the following factors:
· The Companys 2012 regulatory settlement, which included a retail non-fuel base rate increase, improved earnings by $0.18 per share. The settlement became effective July 1, 2012.
· Higher transmission revenues augmented results by $0.06 per share, primarily because of transmission rate changes implemented in 2012 and June 2013. These increases were largely due to increased investment in transmission infrastructure and related costs.
The positive quarter-over-quarter factors were partially offset by:
· Higher fuel and purchased power costs, net of lower mark-to-market valuations, reduced earnings by $0.07 per share as a result of changes in regulatory treatment.
· The effects of weather a combination of year-over-year variations in heating and cooling degree days (a measure of the effects of weather) and relative humidity decreased the Companys results by $0.05 per share compared with the same period a year ago. Even though 2013s second-quarter weather was hotter than normal, it was not nearly as hot as the same period last year. Weather positively impacted 2013 second-quarter results by $0.09 per share, while weather positively impacted 2012s second-quarter earnings by $0.14 per share compared with historically normal conditions.
· Higher operations and maintenance expenses impacted the bottom line by $0.04 per share compared with the prior-year quarter. The higher expense primarily related to amortization of certain retirement benefits in 2013, compared with the regulatory deferral of such costs in 2012.
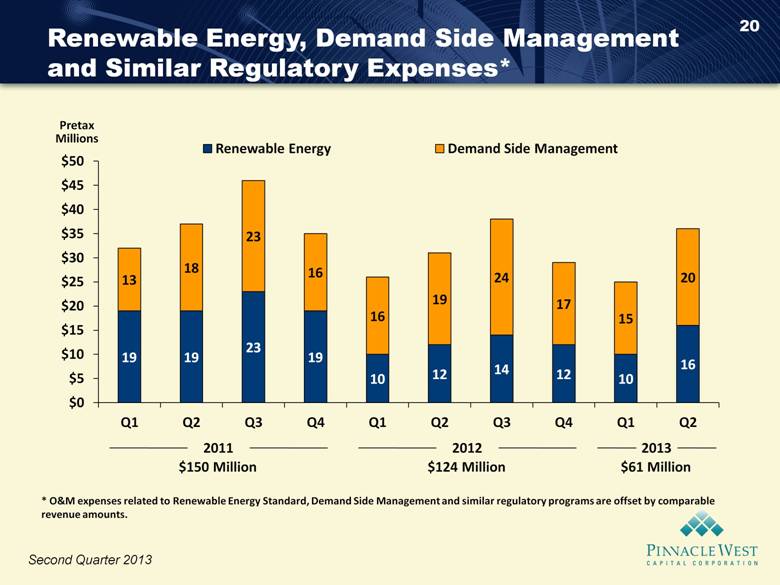
The O&M variance excludes costs associated with renewable energy, energy efficiency and similar regulatory programs, which are largely offset by comparable amounts of operating revenues.
Arizona Public Service Co. (APS), the Companys principal subsidiary, reported 2013 second-quarter net income attributable to common shareholder of $133.9 million versus earnings of $124.9 million in the similar 2012 period.
Financial Outlook
Pinnacle West expects its 2013 consolidated on-going earnings will be in the range of $3.55 to $3.70 per diluted share. Key factors and assumptions underlying this outlook are:
· Normal weather patterns for the remainder of the year;
· Weather-normalized retail electricity sales volumes about the same as the prior year, in part due to the effects of customer conservation and initiatives associated with energy efficiency and distributed renewable generation;
· Retail customer growth of about 1.5 percent;
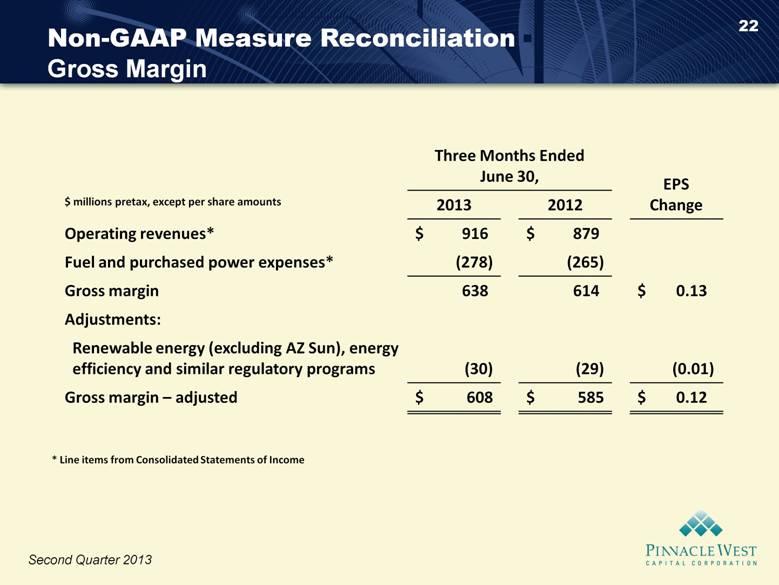
· Total electricity gross margin (operating revenues, net of fuel and purchased power expenses, excluding retail rate adjustment mechanisms associated with renewable energy and energy efficiency programs) is expected to be in a range of about $2.21 billion to $2.26 billion, an increase from the previous range of about $2.17 billion to $2.22 billion;
· Anticipated operating expenses (operations and maintenance, excluding costs for Renewable Energy Standard and similar regulatory programs; depreciation and amortization; and taxes other than income taxes) of about $1.37 billion to $1.40 billion, which was previously estimated to be about $1.34 billion to $1.37 billion;
· Anticipated interest expense, net of allowances for borrowed and equity funds used for construction, has been reduced to a range of about $160 million to $170 million, down from the previous estimated range of about $175 million to $185 million; and
· An effective income tax rate of about 35 percent.
Longer term, the Companys goal is to achieve a consolidated earned return on average common equity of at least 9.5 percent annually in 2013 through 2015. Key factors and assumptions underlying the outlook can be found in the earnings presentation slides for the second-quarter 2013 on the Companys website at pinnaclewest.com/investors.
Conference Call and Web Cast
Pinnacle West invites interested parties to listen to the live webcast of managements conference call to discuss the Companys 2013 second-quarter results, as well as recent developments, at 12 noon (ET) today, Aug. 2. The webcast can be accessed at pinnaclewest.com/presentations and will be available for replay on the website for 30 days. To access the live conference call by telephone, dial (877) 407-8035 or (201) 689-8035 for international callers. A replay of the call also will be available until 11:59 p.m. (ET), Friday, Aug. 9, 2013, by calling (877) 660-6853 in the U.S. and Canada or (201) 612-7415 internationally and entering conference ID number 417155.
General Information
Pinnacle West Capital, an energy holding company based in Phoenix, has consolidated assets of about $13.6 billion, more than 6,300 megawatts of generating capacity and about 6,600 employees in Arizona and New Mexico. Through its principal subsidiary, Arizona Public Service, the Company provides retail electricity service to more than 1.1 million Arizona homes and businesses. For more information about Pinnacle West, visit the Companys website at pinnaclewest.com.
Dollar amounts in this news release are after income taxes. Earnings per share amounts are based on average diluted common shares outstanding. For more information on Pinnacle Wests operating statistics and earnings, please visit pinnaclewest.com/investors.
PINNACLE WEST CAPITAL CORPORATION
NON-GAAP FINANCIAL MEASURE RECONCILIATION
NET INCOME ATTRIBUTABLE TO COMMON SHAREHOLDERS
(GAAP MEASURE) TO ON-GOING EARNINGS
(NON-GAAP FINANCIAL MEASURE)
|
|
Three Months Ended |
|
Three Months Ended |
| ||||||||
|
|
Dollars in |
|
Diluted |
|
Dollars in |
|
Diluted |
| ||||
|
|
|
|
|
|
|
|
|
| ||||
Net Income Attributable to Common Shareholders |
|
$ |
131.2 |
|
$ |
1.18 |
|
$ |
122.3 |
|
$ |
1.11 |
|
Less: Income (loss) from discontinued operations |
|
|
|
|
|
(0.8 |
) |
(0.01 |
) | ||||
On-going Earnings |
|
$ |
131.2 |
|
$ |
1.18 |
|
$ |
123.1 |
|
$ |
1.12 |
|
NON-GAAP FINANCIAL INFORMATION
In this press release, we refer to on-going earnings. On-going earnings is a non-GAAP financial measure, as defined in accordance with SEC rules. We believe on-going earnings provide investors with a useful indicator of our results that is comparable among periods because it excludes the effects of unusual items that may occur on an irregular basis. Investors should note that these non-GAAP financial measures involve judgments by management, including whether an item is classified as an unusual item. We use on-going earnings, or similar concepts, to measure our performance internally in reports for management.
FORWARD-LOOKING STATEMENTS
This press release contains forward-looking statements based on our current expectations, including statements regarding our earnings guidance and financial outlook and goals. These forward-looking statements are often identified by words such as estimate, predict, may, believe, plan, expect, require, intend, assume and similar words. Because actual results may differ materially from expectations, we caution readers not to place undue reliance on these statements. A number of factors could cause future results to differ materially from historical results, or from outcomes currently expected or sought by Pinnacle West or APS. These factors include, but are not limited to:
· our ability to manage capital expenditures and operations and maintenance costs while maintaining reliability and customer service levels;
· variations in demand for electricity, including those due to weather, the general economy, customer and sales growth (or decline), and the effects of energy conservation measures and distributed generation;
· power plant and transmission system performance and outages;
· volatile fuel and purchased power costs;
· fuel and water supply availability;
· our ability to achieve timely and adequate rate recovery of our costs, including returns on debt and equity capital;
· regulatory and judicial decisions, developments and proceedings;
· new legislation or regulation including those relating to environmental requirements, nuclear plant operations and potential deregulation of retail electric markets;
· our ability to meet renewable energy and energy efficiency mandates and recover related costs;
· risks inherent in the operation of nuclear facilities, including spent fuel disposal uncertainty;
· competition in retail and wholesale power markets;
· the duration and severity of the economic decline in Arizona and current real estate market conditions;
· the cost of debt and equity capital and the ability to access capital markets when required;
· changes to our credit ratings;
· the investment performance of the assets of our nuclear decommissioning trust, pension, and other postretirement benefit plans and the resulting impact on future funding requirements;
· the liquidity of wholesale power markets and the use of derivative contracts in our business;
· potential shortfalls in insurance coverage;
· new accounting requirements or new interpretations of existing requirements;
· generation, transmission and distribution facility and system conditions and operating costs;
· the ability to meet the anticipated future need for additional baseload generation and associated transmission facilities in our region;
· the willingness or ability of our counterparties, power plant participants and power plant land owners to meet contractual or other obligations or extend the rights for continued power plant operations;
· technological developments affecting the electric industry; and
· restrictions on dividends or other provisions in our credit agreements and Arizona Corporation Commission orders.
These and other factors are discussed in Risk Factors described in Part 1, Item 1A of the Pinnacle West/APS Annual Report on Form 10-K for the fiscal year ended December 31, 2012, which readers should review carefully before placing any reliance on our financial statements or disclosures. Neither Pinnacle West nor APS assumes any obligation to update these statements, even if our internal estimates change, except as required by law.
# # #
PINNACLE WEST CAPITAL CORPORATION
CONDENSED CONSOLIDATED STATEMENTS OF INCOME
(unaudited)
(dollars and shares in thousands, except per share amounts)
|
|
THREE MONTHS ENDED |
|
SIX MONTHS ENDED |
| ||||||||
|
|
JUNE 30, |
|
JUNE 30, |
| ||||||||
|
|
2013 |
|
2012 |
|
2013 |
|
2012 |
| ||||
|
|
|
|
|
|
|
|
|
| ||||
Operating Revenues |
|
$ |
915,822 |
|
$ |
878,576 |
|
$ |
1,602,474 |
|
$ |
1,499,207 |
|
|
|
|
|
|
|
|
|
|
| ||||
Operating Expenses |
|
|
|
|
|
|
|
|
| ||||
Fuel and purchased power |
|
277,584 |
|
264,723 |
|
508,263 |
|
481,032 |
| ||||
Operations and maintenance |
|
229,300 |
|
216,236 |
|
452,550 |
|
426,899 |
| ||||
Depreciation and amortization |
|
106,292 |
|
100,606 |
|
210,022 |
|
200,715 |
| ||||
Taxes other than income taxes |
|
40,814 |
|
41,289 |
|
80,835 |
|
83,764 |
| ||||
Other expenses |
|
2,020 |
|
1,233 |
|
4,069 |
|
4,301 |
| ||||
Total |
|
656,010 |
|
624,087 |
|
1,255,739 |
|
1,196,711 |
| ||||
|
|
|
|
|
|
|
|
|
| ||||
Operating Income |
|
259,812 |
|
254,489 |
|
346,735 |
|
302,496 |
| ||||
|
|
|
|
|
|
|
|
|
| ||||
Other Income (Deductions) |
|
|
|
|
|
|
|
|
| ||||
Allowance for equity funds used during construction |
|
6,265 |
|
5,175 |
|
13,129 |
|
9,931 |
| ||||
Other income |
|
469 |
|
177 |
|
1,227 |
|
937 |
| ||||
Other expense |
|
(2,234 |
) |
(2,669 |
) |
(5,986 |
) |
(6,737 |
) | ||||
Total |
|
4,500 |
|
2,683 |
|
8,370 |
|
4,131 |
| ||||
|
|
|
|
|
|
|
|
|
| ||||
Interest Expense |
|
|
|
|
|
|
|
|
| ||||
Interest charges |
|
51,307 |
|
53,000 |
|
100,785 |
|
109,967 |
| ||||
Allowance for borrowed funds used during construction |
|
(3,636 |
) |
(3,447 |
) |
(7,626 |
) |
(6,598 |
) | ||||
Total |
|
47,671 |
|
49,553 |
|
93,159 |
|
103,369 |
| ||||
|
|
|
|
|
|
|
|
|
| ||||
Income From Continuing Operations Before Income Taxes |
|
216,641 |
|
207,619 |
|
261,946 |
|
203,258 |
| ||||
|
|
|
|
|
|
|
|
|
| ||||
Income Taxes |
|
77,043 |
|
76,689 |
|
89,512 |
|
72,044 |
| ||||
|
|
|
|
|
|
|
|
|
| ||||
Income From Continuing Operations |
|
139,598 |
|
130,930 |
|
172,434 |
|
131,214 |
| ||||
|
|
|
|
|
|
|
|
|
| ||||
Loss From Discontinued Operations |
|
|
|
|
|
|
|
|
| ||||
Net of Income Taxes |
|
|
|
(819 |
) |
|
|
(1,584 |
) | ||||
|
|
|
|
|
|
|
|
|
| ||||
Net Income |
|
139,598 |
|
130,111 |
|
172,434 |
|
129,630 |
| ||||
|
|
|
|
|
|
|
|
|
| ||||
Less: Net income attributable to noncontrolling interests |
|
8,391 |
|
7,766 |
|
16,783 |
|
15,542 |
| ||||
|
|
|
|
|
|
|
|
|
| ||||
Net Income Attributable To Common Shareholders |
|
$ |
131,207 |
|
$ |
122,345 |
|
$ |
155,651 |
|
$ |
114,088 |
|
|
|
|
|
|
|
|
|
|
| ||||
Weighted-Average Common Shares Outstanding - Basic |
|
109,962 |
|
109,491 |
|
109,898 |
|
109,395 |
| ||||
|
|
|
|
|
|
|
|
|
| ||||
Weighted-Average Common Shares Outstanding - Diluted |
|
110,932 |
|
110,359 |
|
110,843 |
|
110,183 |
| ||||
|
|
|
|
|
|
|
|
|
| ||||
Earnings Per Weighted-Average Common Share Outstanding |
|
|
|
|
|
|
|
|
| ||||
Income from continuing operations attributable to common shareholders - basic |
|
$ |
1.19 |
|
$ |
1.12 |
|
$ |
1.42 |
|
$ |
1.06 |
|
Net income attributable to common shareholders - basic |
|
$ |
1.19 |
|
$ |
1.12 |
|
$ |
1.42 |
|
$ |
1.04 |
|
Income from continuing operations attributable to common shareholders - diluted |
|
$ |
1.18 |
|
$ |
1.12 |
|
$ |
1.40 |
|
$ |
1.05 |
|
Net income attributable to common shareholders - diluted |
|
$ |
1.18 |
|
$ |
1.11 |
|
$ |
1.40 |
|
$ |
1.04 |
|
|
|
|
|
|
|
|
|
|
| ||||
Amounts Attributable To Common Shareholders |
|
|
|
|
|
|
|
|
| ||||
Income from continuing operations, net of tax |
|
$ |
131,207 |
|
$ |
123,164 |
|
$ |
155,651 |
|
$ |
115,681 |
|
Discontinued operations, net of tax |
|
|
|
(819 |
) |
|
|
(1,593 |
) | ||||
Net income attributable to common shareholders |
|
$ |
131,207 |
|
$ |
122,345 |
|
$ |
155,651 |
|
$ |
114,088 |
|
Exhibit 99.2
|
Last Updated |
8/2/2013 |
Pinnacle West Capital Corporation
Quarterly Consolidated Statistical Summary
Periods Ended June 30, 2013 and 2012
|
|
|
3 Months Ended June 30, |
|
|
6 Months Ended June 30, |
| ||||||||||||||||||
Line |
|
|
2013 |
|
|
2012 |
|
|
Incr (Decr) |
|
|
2013 |
|
|
2012 |
|
|
Incr (Decr) |
| ||||||
|
|
|
|
|
|
|
|
|
|
|
|
|
|
|
|
|
|
|
| ||||||
|
EARNINGS CONTRIBUTION BY SUBSIDIARY (Dollars in Millions) |
|
|
|
|
|
|
|
|
|
|
|
|
|
|
|
|
|
| ||||||
1 |
Arizona Public Service |
|
$ |
142 |
|
|
$ |
133 |
|
|
$ |
9 |
|
|
$ |
177 |
|
|
$ |
136 |
|
|
$ |
41 |
|
2 |
El Dorado |
|
- |
|
|
- |
|
|
- |
|
|
(1 |
) |
|
- |
|
|
(1 |
) | ||||||
3 |
Parent Company |
|
(3 |
) |
|
(2 |
) |
|
(1 |
) |
|
(4 |
) |
|
(5 |
) |
|
1 |
| ||||||
|
|
|
|
|
|
|
|
|
|
|
|
|
|
|
|
|
|
|
| ||||||
4 |
Income From Continuing Operations |
|
139 |
|
|
131 |
|
|
8 |
|
|
172 |
|
|
131 |
|
|
41 |
| ||||||
|
|
|
|
|
|
|
|
|
|
|
|
|
|
|
|
|
|
|
| ||||||
|
Income (Loss) From Discontinued Operations - Net of Tax |
|
|
|
|
|
|
|
|
|
|
|
|
|
|
|
|
|
| ||||||
5 |
SunCor |
|
- |
|
|
- |
|
|
- |
|
|
- |
|
|
(1 |
) |
|
1 |
| ||||||
6 |
Other |
|
- |
|
|
(1 |
) |
|
1 |
|
|
- |
|
|
- |
|
|
- |
| ||||||
7 |
Total |
|
- |
|
|
(1 |
) |
|
1 |
|
|
- |
|
|
(1 |
) |
|
1 |
| ||||||
|
|
|
|
|
|
|
|
|
|
|
|
|
|
|
|
|
|
|
| ||||||
8 |
Net Income |
|
139 |
|
|
130 |
|
|
9 |
|
|
172 |
|
|
130 |
|
|
42 |
| ||||||
|
|
|
|
|
|
|
|
|
|
|
|
|
|
|
|
|
|
|
| ||||||
9 |
Less: Net Income (Loss) Attributable to Noncontrolling Interests |
|
8 |
|
|
8 |
|
|
- |
|
|
16 |
|
|
16 |
|
|
- |
| ||||||
|
|
|
|
|
|
|
|
|
|
|
|
|
|
|
|
|
|
|
| ||||||
10 |
Net Income Attributable to Common Shareholders |
|
$ |
131 |
|
|
$ |
122 |
|
|
$ |
9 |
|
|
$ |
156 |
|
|
$ |
114 |
|
|
$ |
42 |
|
|
|
|
|
|
|
|
|
|
|
|
|
|
|
|
|
|
|
|
| ||||||
|
|
|
|
|
|
|
|
|
|
|
|
|
|
|
|
|
|
|
| ||||||
|
EARNINGS PER SHARE BY SUBSIDIARY - DILUTED |
|
|
|
|
|
|
|
|
|
|
|
|
|
|
|
|
|
| ||||||
11 |
Arizona Public Service |
|
$ |
1.28 |
|
|
$ |
1.20 |
|
|
$ |
0.08 |
|
|
$ |
1.59 |
|
|
$ |
1.24 |
|
|
$ |
0.35 |
|
12 |
El Dorado |
|
- |
|
|
- |
|
|
- |
|
|
(0.01 |
) |
|
- |
|
|
(0.01 |
) | ||||||
13 |
Parent Company |
|
(0.02 |
) |
|
(0.01 |
) |
|
(0.01 |
) |
|
(0.03 |
) |
|
(0.05 |
) |
|
0.02 |
| ||||||
|
|
|
|
|
|
|
|
|
|
|
|
|
|
|
|
|
|
|
| ||||||
14 |
Income From Continuing Operations |
|
1.26 |
|
|
1.19 |
|
|
0.07 |
|
|
1.55 |
|
|
1.19 |
|
|
0.36 |
| ||||||
|
|
|
|
|
|
|
|
|
|
|
|
|
|
|
|
|
|
|
| ||||||
|
Income (Loss) From Discontinued Operations - Net of Tax |
|
|
|
|
|
|
|
|
|
|
|
|
|
|
|
|
|
| ||||||
15 |
SunCor |
|
- |
|
|
- |
|
|
- |
|
|
- |
|
|
(0.01 |
) |
|
0.01 |
| ||||||
16 |
Other |
|
- |
|
|
(0.01 |
) |
|
0.01 |
|
|
- |
|
|
- |
|
|
- |
| ||||||
17 |
Total |
|
- |
|
|
(0.01 |
) |
|
0.01 |
|
|
- |
|
|
(0.01 |
) |
|
0.01 |
| ||||||
|
|
|
|
|
|
|
|
|
|
|
|
|
|
|
|
|
|
|
| ||||||
18 |
Net Income |
|
1.26 |
|
|
1.18 |
|
|
0.08 |
|
|
1.55 |
|
|
1.18 |
|
|
0.37 |
| ||||||
|
|
|
|
|
|
|
|
|
|
|
|
|
|
|
|
|
|
|
| ||||||
19 |
Less: Net Income (Loss) Attributable to Noncontrolling Interests |
|
0.08 |
|
|
0.07 |
|
|
0.01 |
|
|
0.15 |
|
|
0.14 |
|
|
0.01 |
| ||||||
|
|
|
|
|
|
|
|
|
|
|
|
|
|
|
|
|
|
|
| ||||||
20 |
Net Income Attributable to Common Shareholders |
|
$ |
1.18 |
|
|
$ |
1.11 |
|
|
$ |
0.07 |
|
|
$ |
1.40 |
|
|
$ |
1.04 |
|
|
$ |
0.36 |
|
|
|
|
|
|
|
|
|
|
|
|
|
|
|
|
|
|
|
|
| ||||||
|
|
|
|
|
|
|
|
|
|
|
|
|
|
|
|
|
|
|
| ||||||
21 |
BOOK VALUE PER SHARE |
|
$ |
36.66 |
|
|
$ |
34.49 |
|
|
$ |
2.17 |
|
|
$ |
36.66 |
|
|
$ |
34.49 |
|
|
$ |
2.17 |
|
|
|
|
|
|
|
|
|
|
|
|
|
|
|
|
|
|
|
|
| ||||||
|
COMMON SHARES OUTSTANDING (Thousands) |
|
|
|
|
|
|
|
|
|
|
|
|
|
|
|
|
|
| ||||||
22 |
Average - Diluted |
|
110,932 |
|
|
110,359 |
|
|
573 |
|
|
110,843 |
|
|
110,183 |
|
|
660 |
| ||||||
23 |
End of Period |
|
109,993 |
|
|
109,540 |
|
|
453 |
|
|
109,993 |
|
|
109,540 |
|
|
453 |
|
See Glossary of Terms. |
|
|
Last Updated |
8/2/2013 |
Pinnacle West Capital Corporation
Quarterly Consolidated Statistical Summary
Periods Ended June 30, 2013 and 2012
|
|
|
3 Months Ended June 30, |
|
|
6 Months Ended June 30, |
| ||||||||||||||||||
Line |
|
|
2013 |
|
|
2012 |
|
|
Incr (Decr) |
|
|
2013 |
|
|
2012 |
|
|
Incr (Decr) |
| ||||||
|
|
|
|
|
|
|
|
|
|
|
|
|
|
|
|
|
|
|
| ||||||
|
ELECTRIC OPERATING REVENUES |
|
|
|
|
|
|
|
|
|
|
|
|
|
|
|
|
|
| ||||||
|
Retail |
|
|
|
|
|
|
|
|
|
|
|
|
|
|
|
|
|
| ||||||
24 |
Residential |
|
$ |
444 |
|
|
$ |
418 |
|
|
$ |
26 |
|
|
$ |
752 |
|
|
$ |
691 |
|
|
$ |
61 |
|
25 |
Business |
|
420 |
|
|
401 |
|
|
19 |
|
|
749 |
|
|
693 |
|
|
56 |
| ||||||
26 |
Total retail |
|
864 |
|
|
819 |
|
|
45 |
|
|
1,501 |
|
|
1,384 |
|
|
117 |
| ||||||
|
Wholesale revenue on delivered electricity |
|
|
|
|
|
|
|
|
|
|
|
|
|
|
|
|
|
| ||||||
27 |
Traditional contracts |
|
15 |
|
|
22 |
|
|
(7 |
) |
|
26 |
|
|
34 |
|
|
(8 |
) | ||||||
28 |
Off-system sales |
|
17 |
|
|
16 |
|
|
1 |
|
|
39 |
|
|
36 |
|
|
3 |
| ||||||
29 |
Native load hedge liquidation |
|
3 |
|
|
- |
|
|
3 |
|
|
4 |
|
|
- |
|
|
4 |
| ||||||
30 |
Transmission for others |
|
8 |
|
|
7 |
|
|
1 |
|
|
15 |
|
|
13 |
|
|
2 |
| ||||||
31 |
Other miscellaneous services |
|
8 |
|
|
14 |
|
|
(6 |
) |
|
16 |
|
|
31 |
|
|
(15 |
) | ||||||
32 |
Total wholesale |
|
51 |
|
|
59 |
|
|
(8 |
) |
|
100 |
|
|
114 |
|
|
(14 |
) | ||||||
33 |
Total electric operating revenue |
|
915 |
|
|
878 |
|
|
37 |
|
|
1,601 |
|
|
1,498 |
|
|
103 |
| ||||||
|
|
|
|
|
|
|
|
|
|
|
|
|
|
|
|
|
|
|
| ||||||
|
ELECTRIC SALES (GWH) |
|
|
|
|
|
|
|
|
|
|
|
|
|
|
|
|
|
| ||||||
|
Retail sales |
|
|
|
|
|
|
|
|
|
|
|
|
|
|
|
|
|
| ||||||
34 |
Residential |
|
3,344 |
|
|
3,333 |
|
|
11 |
|
|
6,074 |
|
|
5,886 |
|
|
188 |
| ||||||
35 |
Business |
|
3,877 |
|
|
3,923 |
|
|
(46 |
) |
|
7,148 |
|
|
7,112 |
|
|
36 |
| ||||||
36 |
Total retail |
|
7,221 |
|
|
7,256 |
|
|
(35 |
) |
|
13,222 |
|
|
12,998 |
|
|
224 |
| ||||||
|
Wholesale electricity delivered |
|
|
|
|
|
|
|
|
|
|
|
|
|
|
|
|
|
| ||||||
37 |
Traditional contracts |
|
213 |
|
|
334 |
|
|
(121 |
) |
|
343 |
|
|
497 |
|
|
(154 |
) | ||||||
38 |
Off-system sales |
|
537 |
|
|
651 |
|
|
(114 |
) |
|
1,354 |
|
|
1,518 |
|
|
(164 |
) | ||||||
39 |
Retail load hedge management |
|
20 |
|
|
50 |
|
|
(30 |
) |
|
19 |
|
|
80 |
|
|
(61 |
) | ||||||
40 |
Total wholesale |
|
770 |
|
|
1,035 |
|
|
(265 |
) |
|
1,716 |
|
|
2,095 |
|
|
(379 |
) | ||||||
41 |
Total electric sales |
|
7,991 |
|
|
8,291 |
|
|
(300 |
) |
|
14,938 |
|
|
15,093 |
|
|
(155 |
) | ||||||
See Glossary of Terms. |
|
|
Last Updated |
8/2/2013 |
Pinnacle West Capital Corporation
Quarterly Consolidated Statistical Summary
Periods Ended June 30, 2013 and 2012
|
|
|
3 Months Ended June 30, |
|
|
6 Months Ended June 30, |
| ||||||||||||
Line |
|
|
2013 |
|
|
2012 |
|
|
Incr (Decr) |
|
|
2013 |
|
|
2012 |
|
|
Incr (Decr) |
|
|
|
|
|
|
|
|
|
|
|
|
|
|
|
|
|
|
|
|
|
|
AVERAGE ELECTRIC CUSTOMERS |
|
|
|
|
|
|
|
|
|
|
|
|
|
|
|
|
|
|
|
Retail customers |
|
|
|
|
|
|
|
|
|
|
|
|
|
|
|
|
|
|
42 |
Residential |
|
1,015,649 |
|
|
1,001,323 |
|
|
14,326 |
|
|
1,018,733 |
|
|
1,004,452 |
|
|
14,281 |
|
43 |
Business |
|
127,993 |
|
|
127,209 |
|
|
784 |
|
|
127,944 |
|
|
126,921 |
|
|
1,023 |
|
44 |
Total retail |
|
1,143,642 |
|
|
1,128,532 |
|
|
15,110 |
|
|
1,146,677 |
|
|
1,131,373 |
|
|
15,304 |
|
45 |
Wholesale customers |
|
51 |
|
|
48 |
|
|
3 |
|
|
52 |
|
|
47 |
|
|
5 |
|
46 |
Total customers |
|
1,143,693 |
|
|
1,128,580 |
|
|
15,113 |
|
|
1,146,729 |
|
|
1,131,420 |
|
|
15,309 |
|
|
|
|
|
|
|
|
|
|
|
|
|
|
|
|
|
|
|
|
|
47 |
Customer growth (% over prior year) |
|
1.3% |
|
|
0.9% |
|
|
0.4% |
|
|
1.4% |
|
|
0.9% |
|
|
0.5% |
|
|
|
|
|
|
|
|
|
|
|
|
|
|
|
|
|
|
|
|
|
|
|
|
|
|
|
|
|
|
|
|
|
|
|
|
|
|
|
|
|
|
RETAIL SALES (GWH) - WEATHER NORMALIZED |
|
|
|
|
|
|
|
|
|
|
|
|
|
|
|
|
|
|
48 |
Residential |
|
3,207 |
|
|
3,111 |
|
|
96 |
|
|
5,788 |
|
|
5,674 |
|
|
114 |
|
49 |
Business |
|
3,820 |
|
|
3,849 |
|
|
(29 |
) |
|
7,044 |
|
|
7,055 |
|
|
(11 |
) |
50 |
Total |
|
7,027 |
|
|
6,960 |
|
|
67 |
|
|
12,832 |
|
|
12,729 |
|
|
103 |
|
|
|
|
|
|
|
|
|
|
|
|
|
|
|
|
|
|
|
|
|
51 |
Retail sales (GWH) (% over prior year) |
|
1.0% |
|
|
|
|
|
|
|
|
0.8% |
|
|
|
|
|
|
|
|
|
|
|
|
|
|
|
|
|
|
|
|
|
|
|
|
|
|
|
|
RETAIL USAGE (KWh/Average Customer) |
|
|
|
|
|
|
|
|
|
|
|
|
|
|
|
|
|
|
52 |
Residential |
|
3,292 |
|
|
3,328 |
|
|
(36 |
) |
|
5,962 |
|
|
5,860 |
|
|
102 |
|
53 |
Business |
|
30,287 |
|
|
30,836 |
|
|
(549 |
) |
|
55,866 |
|
|
56,033 |
|
|
(167 |
) |
|
|
|
|
|
|
|
|
|
|
|
|
|
|
|
|
|
|
|
|
|
|
|
|
|
|
|
|
|
|
|
|
|
|
|
|
|
|
|
|
|
RETAIL USAGE - WEATHER NORMALIZED (KWh/Average Customer) |
|
|
|
|
|
|
|
|
|
|
|
|
|
|
|
|
|
|
54 |
Residential |
|
3,158 |
|
|
3,107 |
|
|
51 |
|
|
5,681 |
|
|
5,649 |
|
|
32 |
|
55 |
Business |
|
29,844 |
|
|
30,255 |
|
|
(411 |
) |
|
55,059 |
|
|
55,588 |
|
|
(529 |
) |
|
|
|
|
|
|
|
|
|
|
|
|
|
|
|
|
|
|
|
|
|
|
|
|
|
|
|
|
|
|
|
|
|
|
|
|
|
|
|
|
|
ELECTRICITY DEMAND (MW) |
|
|
|
|
|
|
|
|
|
|
|
|
|
|
|
|
|
|
56 |
Native load peak demand |
|
6,931 |
|
|
6,750 |
|
|
181 |
|
|
6,931 |
|
|
6,750 |
|
|
181 |
|
|
|
|
|
|
|
|
|
|
|
|
|
|
|
|
|
|
|
|
|
|
|
|
|
|
|
|
|
|
|
|
|
|
|
|
|
|
|
|
|
|
WEATHER INDICATORS - RESIDENTIAL |
|
|
|
|
|
|
|
|
|
|
|
|
|
|
|
|
|
|
|
Actual |
|
|
|
|
|
|
|
|
|
|
|
|
|
|
|
|
|
|
57 |
Cooling degree-days |
|
580 |
|
|
568 |
|
|
12 |
|
|
580 |
|
|
568 |
|
|
12 |
|
58 |
Heating degree-days |
|
1 |
|
|
9 |
|
|
(8 |
) |
|
614 |
|
|
426 |
|
|
188 |
|
59 |
Average humidity |
|
14% |
|
|
15% |
|
|
(1)% |
|
|
14% |
|
|
15% |
|
|
(1 |
)% |
|
|
|
|
|
|
|
|
|
|
|
|
|
|
|
|
|
|
|
|
|
10-Year Averages |
|
|
|
|
|
|
|
|
|
|
|
|
|
|
|
|
|
|
60 |
Cooling degree-days |
|
480 |
|
|
480 |
|
|
- |
|
|
480 |
|
|
480 |
|
|
- |
|
61 |
Heating degree-days |
|
10 |
|
|
10 |
|
|
- |
|
|
506 |
|
|
506 |
|
|
- |
|
62 |
Average humidity |
|
15% |
|
|
15% |
|
|
- |
|
|
15% |
|
|
15% |
|
|
- |
|
See Glossary of Terms. |
|
|
Last Updated |
8/2/2013 |
Pinnacle West Capital Corporation
Quarterly Consolidated Statistical Summary
Periods Ended June 30, 2013 and 2012
|
|
|
3 Months Ended June 30, |
|
|
6 Months Ended June 30, |
| ||||||||||||
Line |
|
|
2013 |
|
|
2012 |
|
|
Incr (Decr) |
|
|
2013 |
|
|
2012 |
|
|
Incr (Decr) |
|
|
|
|
|
|
|
|
|
|
|
|
|
|
|
|
|
|
|
|
|
|
ENERGY SOURCES (GWH) |
|
|
|
|
|
|
|
|
|
|
|
|
|
|
|
|
|
|
|
Generation production |
|
|
|
|
|
|
|
|
|
|
|
|
|
|
|
|
|
|
63 |
Nuclear |
|
2,246 |
|
|
2,336 |
|
|
(90 |
) |
|
4,702 |
|
|
4,696 |
|
|
6 |
|
64 |
Coal |
|
2,903 |
|
|
2,376 |
|
|
527 |
|
|
5,656 |
|
|
4,948 |
|
|
708 |
|
65 |
Gas, oil and other |
|
1,261 |
|
|
2,180 |
|
|
(919 |
) |
|
2,511 |
|
|
3,424 |
|
|
(913 |
) |
66 |
Total generation production |
|
6,410 |
|
|
6,892 |
|
|
(482 |
) |
|
12,869 |
|
|
13,068 |
|
|
(199 |
) |
|
Purchased power |
|
|
|
|
|
|
|
|
|
|
|
|
|
|
|
|
|
|
67 |
Firm load |
|
1,903 |
|
|
1,688 |
|
|
215 |
|
|
2,595 |
|
|
2,857 |
|
|
(262 |
) |
68 |
Marketing and trading |
|
115 |
|
|
100 |
|
|
15 |
|
|
228 |
|
|
170 |
|
|
58 |
|
69 |
Total purchased power |
|
2,018 |
|
|
1,788 |
|
|
230 |
|
|
2,823 |
|
|
3,027 |
|
|
(204 |
) |
70 |
Total energy sources |
|
8,428 |
|
|
8,680 |
|
|
(252 |
) |
|
15,692 |
|
|
16,095 |
|
|
(403 |
) |
|
|
|
|
|
|
|
|
|
|
|
|
|
|
|
|
|
|
|
|
|
|
|
|
|
|
|
|
|
|
|
|
|
|
|
|
|
|
|
|
|
POWER PLANT PERFORMANCE |
|
|
|
|
|
|
|
|
|
|
|
|
|
|
|
|
|
|
|
Capacity Factors |
|
|
|
|
|
|
|
|
|
|
|
|
|
|
|
|
|
|
71 |
Nuclear |
|
90% |
|
|
93% |
|
|
(3)% |
|
|
94% |
|
|
94% |
|
|
- |
|
72 |
Coal |
|
77% |
|
|
62% |
|
|
15% |
|
|
74% |
|
|
65% |
|
|
9% |
|
73 |
Gas, oil and other |
|
17% |
|
|
29% |
|
|
(12)% |
|
|
17% |
|
|
23% |
|
|
(6)% |
|
74 |
System average |
|
46% |
|
|
50% |
|
|
(4)% |
|
|
46% |
|
|
47% |
|
|
(1)% |
|
|
|
|
|
|
|
|
|
|
|
|
|
|
|
|
|
|
|
|
|
|
|
|
|
|
|
|
|
|
|
|
|
|
|
|
|
|
|
|
|
|
ECONOMIC INDICATORS |
|
|
|
|
|
|
|
|
|
|
|
|
|
|
|
|
|
|
|
Building Permits |
|
|
|
|
|
|
|
|
|
|
|
|
|
|
|
|
|
|
75 |
Housing Permits - Metro Phoenix (a) |
|
4,710 |
|
|
3,302 |
|
|
1,408 |
|
|
7,986 |
|
|
6,170 |
|
|
1,816 |
|
|
|
|
|
|
|
|
|
|
|
|
|
|
|
|
|
|
|
|
|
|
Arizona Job Growth (b) |
|
|
|
|
|
|
|
|
|
|
|
|
|
|
|
|
|
|
76 |
Payroll job growth (% over prior year) |
|
1.9% |
|
|
2.0% |
|
|
(0.1)% |
|
|
1.8% |
|
|
2.0% |
|
|
(0.2)% |
|
77 |
Unemployment rate (%, seasonally adjusted) |
|
7.9% |
|
|
8.4% |
|
|
(0.5)% |
|
|
7.9% |
|
|
8.4% |
|
|
(0.5)% |
|
|
|
|
|
|
|
|
|
|
|
|
|
|
|
|
|
|
|
|
|
|
|
|
|
|
|
|
|
|
|
|
|
|
|
|
|
|
|
|
|
Sources: |
|
|
|
|
|
|
|
|
|
|
|
|
|
|
|
|
|
| |
(a) |
U.S. Census Bureau |
|
|
|
|
|
|
|
|
|
|
|
|
|
|
|
|
|
|
(b) |
Arizona Department of Economic Security |
|
|
|
|
|
|
|
|
|
|
|
|
|
|
|
|
|
|
See Glossary of Terms. |
|
Exhibit 99.3
PINNACLE WEST CAPITAL CORPORATION 2ND QUARTER 2013 RESULTS August 2, 2013 |
2 This presentation contains forward-looking statements based on current expectations, including statements regarding our earnings guidance and financial outlook and goals. These forward-looking statements are often identified by words such as estimate, predict, may, believe, plan, expect, require, intend, assume and similar words. Because actual results may differ materially from expectations, we caution you not to place undue reliance on these statements. A number of factors could cause future results to differ materially from historical results, or from outcomes currently expected or sought by Pinnacle West or APS. These factors include, but are not limited to: our ability to manage capital expenditures and operations and maintenance costs while maintaining reliability and customer service levels; variations in demand for electricity, including those due to weather, the general economy, customer and sales growth (or decline), and the effects of energy conservation measures and distributed generation; power plant and transmission system performance and outages; volatile fuel and purchased power costs; fuel and water supply availability; our ability to achieve timely and adequate rate recovery of our costs, including returns on debt and equity capital; regulatory and judicial decisions, developments and proceedings; new legislation or regulation, including those relating to environmental requirements, nuclear plant operations and potential deregulation of electric markets; our ability to meet renewable energy and energy efficiency mandates and recover related costs; risks inherent in the operation of nuclear facilities, including spent fuel disposal uncertainty; competition in retail and wholesale power markets; the duration and severity of the economic decline in Arizona and current real estate market conditions; the cost of debt and equity capital and the ability to access capital markets when required; changes to our credit ratings; the investment performance of the assets of our nuclear decommissioning trust, pension, and other postretirement benefit plans and the resulting impact on future funding requirements; the liquidity of wholesale power markets and the use of derivative contracts in our business; potential shortfalls in insurance coverage; new accounting requirements or new interpretations of existing requirements; generation, transmission and distribution facility and system conditions and operating costs; the ability to meet the anticipated future need for additional baseload generation and associated transmission facilities in our region; the willingness or ability of our counterparties, power plant participants and power plant land owners to meet contractual or other obligations or extend the rights for continued power plant operations; technological developments affecting the electric industry; and restrictions on dividends or other provisions in our credit agreements and Arizona Corporation Commission orders. These and other factors are discussed in Risk Factors described in Part I, Item 1A of the Pinnacle West/APS Annual Report on Form 10-K for the fiscal year ended December 31, 2012, which you should review carefully before placing any reliance on our financial statements, disclosures or earnings outlook. Neither Pinnacle West nor APS assumes any obligation to update these statements, even if our internal estimates change, except as required by law. Forward-Looking Statements Second Quarter 2013 |
Amounts Attributable to Common Shareholders and Non-GAAP Financial Measures In this presentation, references to net income and earnings per share (EPS) refer to amounts attributable to common shareholders. We present gross margin per diluted share of common stock. Gross margin refers to operating revenues less fuel and purchased power expenses. Gross margin is a non-GAAP financial measure, as defined in accordance with SEC rules. The appendix contains a reconciliation of this non-GAAP financial measure to the referenced revenue and expense line items on our Consolidated Statements of Income, which are the most directly comparable financial measures calculated and presented in accordance with generally accepted accounting principles in the United States of America (GAAP). We view gross margin as an important performance measure of the core profitability of our operations. We refer to on-going earnings in this presentation, which is also a non-GAAP financial measure. We believe on-going earnings provide investors with a useful indicator of our results that is comparable among periods because it excludes the effects of unusual items that may occur on an irregular basis. Reconciliations of on-going earnings to our net income attributable to common shareholders are included in this presentation. Investors should note that these non-GAAP financial measures may involve judgments by management, including whether an item is classified as an unusual item. These measures are key components of our internal financial reporting and are used by our management in analyzing the operations of our business. We believe that investors benefit from having access to the same financial measures that management uses. Second Quarter 2013 3 |
CEO Agenda Second Quarter 2013 4 Regulatory Update Four Corners Transaction Operational Performance |
CFO Agenda Second Quarter 2013 5 2nd Quarter Results Arizona Economic Outlook Credit Ratings and Financing Earnings Guidance and Financial Outlook |
Consolidated EPS Comparisons 2013 vs. 2012 Per Share 2nd Quarter On-Going Earnings YTD On-Going Earnings Per Share 2nd Quarter GAAP Net Income YTD GAAP Net Income Second Quarter 2013 6 $1.18 $1.11 $1.40 $1.04 |
On-Going EPS Variances 2nd Quarter 2013 vs. 2nd Quarter 2012 Higher Gross Margin* $0.12 Higher O&M* $(0.04) Net Increase $0.06 = * Excludes costs, and offsetting operating revenues, associated with renewable energy (excluding AZ Sun), energy efficiency and similar regulatory programs. See non-GAAP reconciliation for gross margin in appendix. Other Items $(0.02) 7 Second Quarter 2013 |
Gross Margin EPS Drivers 2nd Quarter 2013 vs. 2nd Quarter 2012 Net Increase $0.12 = See non-GAAP reconciliation in appendix. * Lower fuel and purchased power costs in 2012, net of off-system sales and mark-to-market. Retail Transmission Revenue Increase $0.06 2012 Regulatory Settlement $0.18 Higher Fuel Costs, Net* $(0.07) Weather Effects $(0.05) Second Quarter 2013 8 |
Arizona Economic Indicators Employment & Excess Housing YTD YTD Second Quarter 2013 Non-Farm Job Growth Year-Over- Year Change Metro Phoenix Vacant Housing APS Service Territory Source: U.S. Bureau of Labor Statistics Source: APS 9 |
Arizona Economic Indicators Metro Phoenix Housing Prices & Nonresidential Vacancy YTD YTD Second Quarter 2013 Value Relative to Jan 05 Home Prices Nonresidential Building Vacancy Vacancy Rate Office Retail Source: S&P/Case-Shiller Home Price Index YTD through April 2013 Source: CoStar Group, Inc. 10 |
We are disclosing these ratings to enhance understanding of our sources of liquidity and the effects of our ratings on our costs of funds. Investment-Grade Credit Ratings *On May 17, 2013, Fitch Ratings upgraded APSs and Pinnacle Wests corporate credit ratings from BBB to BBB+ and upgraded APSs senior unsecured rating from BBB+ to A-. Second Quarter 2013 11 APS Parent Corporate Credit Ratings Moodys Baa1 Baa2 S&P BBB+ BBB+ Fitch* BBB+ BBB+ Senior Unsecured Moodys Baa1 - S&P BBB+ - Fitch* A- - Outlook Moodys Stable Stable S&P Stable Stable Fitch* Stable Stable |
2013 On-Going EPS Guidance As of August 2, 2013 See key factors and assumptions in appendix. Second Quarter 2013 12 |
Consolidated Financial Outlook As of August 2, 2013 Second Quarter 2013 13 Dividend Growth Goal Indicated Annual Dividend Rate at Year-End Consolidated Earned ROE Goal 9.9% * Future dividends subject to declaration at Board of Directors discretion. Projected $ Billions Year-End APS Rate Base Growth 6% Compound Annual Growth Rate ACC FERC Projected Projected |
APPENDIX |
2013 On-Going EPS Guidance Key Factors & Assumptions as of August 2, 2013 Second Quarter 2013 15 Prior Revised Electricity gross margin* (operating revenues, net of fuel and purchase power expenses) $ 2.17 - $2.22 billion $2.21 - $2.26 billion Retail customer growth about 1.5% Weather-normalized retail electricity sales volume about flat to prior year taking into account effects of customer conservation, energy efficiency and distributed renewable generation initiatives Actual weather through June; normal weather patterns remainder of year Operating expenses* (operations and maintenance, depreciation and amortization, and taxes other than income taxes) $1.34 - $1.37 billion $1.37 - $1.40 billion Interest expense, net of allowances for borrowed and equity funds used during construction $175 - $185 million $160 - $170 million Net income attributable to non-controlling interests $30 - $35 million ~$35 million Effective tax rate 35% 35% * Excludes O&M of $119 million, and offsetting revenues, associated with renewable energy and energy efficiency programs. |
2013 2015 Financial Outlook Key Factors & Assumptions as of August 2, 2013 Second Quarter 2013 16 Assumption Impact Retail customer growth Expected to average 2% annually (2013-2015) Modestly improving Arizona and U.S. economic conditions Weather-normalized retail electricity sales volume growth Less than 1% after customer conservation and energy efficiency and distributed renewable generation initiatives Weather Actual weather through June 2013; normal weather patterns thereafter Gross Margin Customer Growth and Weather Assumption Impact AZ Sun Program Additions to flow through RES until next base rate case First 50 MW of AZ Sun is recovered through base rates Lost Fixed Cost Recovery (LFCR) Assumed to offset 30-40% of revenues lost due to ACC-mandated energy efficiency and distributed renewable energy generation initiatives Environmental Improvement Surcharge (EIS) Assumed to recover up to $5 million annually of carrying costs for government-mandated environmental capital expenditures Power Supply Adjustor (PSA) 100% pass-through as of July 1, 2012 Transmission Cost Adjustor (TCA) TCA is filed each May and automatically goes into rates effective June 1 Beginning July 1, 2012 under terms of the regulatory settlement, transmission revenue is accrued each month as it is earned Four Corners Acquisition Pending transaction closing Gross Margin Related to 2012 Retail Rate Settlement Potential property tax deferrals (2012 retail rate settlement) Assume 60% of property tax increases relate to tax rates, therefore, will be eligible for deferrals (Deferral rates: 50% in 2013; 75% in 2014 and thereafter) |
Second Quarter 2013 17 Docket # 2012 Retail Rate Settlement (including Four Corners rate recovery) E-01345A-11-0224 Retail Electric Competition* E-00000W-13-0135 Energy Efficiency and Integrated Resource Planning* E-00000XX-13-0214 2014 Renewable Energy Standard Implementation Plan E-01345A-13-0140 Net Metering E-01345A-13-0248 * Generic docket Regulatory Calendar List of Selected Dockets |
Gross Margin Effects of Weather Variances vs. Normal Pretax Millions All periods recalculated to conform to current 10-year rolling average. 2011 2012 2013 Second Quarter 2013 $8 Million $10 Million $26 Million 18 |
Quarterly Mark-to-Market on Hedge Contracts* Pretax Millions * Related to APS 10% share under Power Supply Adjustor (PSA), net of related deferrals, effective through June 30, 2012. 2011 2012 2013 Second Quarter 2013 19 |
Renewable Energy, Demand Side Management and Similar Regulatory Expenses* Pretax Millions * O&M expenses related to Renewable Energy Standard, Demand Side Management and similar regulatory programs are offset by comparable revenue amounts. 2011 2012 2013 Second Quarter 2013 $150 Million $124 Million $61 Million 20 |
Non-GAAP EPS Reconciliation 2nd Quarter 2013 vs. 2nd Quarter 2012 Second Quarter 2013 21 2nd Qtr 2013 2nd Qtr 2012 Change EPS as reported $ 1.18 $ 1.11 $ 0.07 Adjustments: Loss from discontinued operations - 0.01 (0.01) On-going EPS $ 1.18 $ 1.12 $ 0.06 |
Non-GAAP Measure Reconciliation Gross Margin Second Quarter 2013 22 Three Months Ended June 30, EPS Change $ millions pretax, except per share amounts 2013 2012 Operating revenues* $ 916 $ 879 Fuel and purchased power expenses* (278) (265) Gross margin 638 614 $ 0.13 Adjustments: Renewable energy (excluding AZ Sun), energy efficiency and similar regulatory programs (30) (29) (0.01) Gross margin adjusted $ 608 $ 585 $ 0.12 * Line items from Consolidated Statements of Income |
I["
M%CK@*78R*B($+BDE$+,E:1]`+SFA*VLA(']',NL'16I1>TDA*`@1`XC!H9@:
M&,['C($2%M [`4#)2$8T<%:E*/4I( XTX1"#&'E@CA>/617@H,!0 ':"-'9`#
M(0"3(VB-2*&!%5B!$L"]]FC-B4&!]M"6UFS-XBL^V4Q+XJ.5THP#EYR!#[E`
M-_F0?M.=B9L0;FL1NA&29?P;S)#&$X$#_(-.$Z$15NG&`(236/\JP"&)G#XY
MGA:1@^[Y+U)BG2.0`2'8
MN89)4,3[0JPZL689H;>C#+'`R"P4.C,4"8`!ECXC%QD`LJ%H##+<@5(IH`7"
M4:R3"2=3RB?CRSB4PR(S"IAXB=2+B0%),6UI%PMJ"8TD(5XQ/E[)P1_R&-AP
M#_&Q"#2;S!B80HM@N@1-E;>(BVFA%WG9BYVTD3B3L\C3@:-R*D);B:C(@1PP
M"!,]`<5*BK&("H.)/.Q\)\>@BJ+8M.__V)3/N*)-:0&/D91%N1ZNV)X$I8$]
M2E"N(E)0`%QV8B(>3\[X(^@8!#=^*"B$;D[,P_&(8J2Z0ZYDH),^:Q-_HBR\
M`PB.X#@$)HI
#0ZW6/!WZ<59)D\_B;N[9U8'=%L$B:SFI
MLX)UI"0:;6K9LOB[&-)RX2)L91D1855)3O\JA"(K,Q>T/+J$OP(0,DA\&`&B
M((D:)PB"^`""A(P4(!@V!"$CQ@>*$C%BE#C0H,2.#!TNE#C"I$F0*`L6+-ER
M1$.5*U5^-$F0X,N3.5$:U-ESIDD2)PU^('$"YTD41G.24"'4H(H30R6>:)J2
MYL>.)*RF:`&RXPP47D&@H+'R8XP86!WJ*+$31(H:05F"B%%#+(@::;V2T*'0
M:XH=6GF^%2)8\(P=(4>0F*Q&.3)P"?8"J'$*$Z<%*,.)$410LA*E2D$*VB
M19$
%]U`U#Q)Y0,$0!H82)X$D
Q"ZN=&H(BM5GPE0E\XW9"7^[H+!!'*'W@
MANS!*T;$GD5(9TD?S`JTP%&@0`[4@$7D!UH8R`I,EY[<^6'L2N3+CRFUB[71,2?-,8*0`EWM$G)
MI>U2+?QYH,`0_$Z(8N:$7`[EZ`\
US@G5`!!G'<"2U`P:B-4@V'.K!E(/(
M-^P$/D++/"H7E4]Y(/_/LR%/4@,D11Q\PR1\$Z:+:;
T')HU
M0`21(9I5P2EQM&4W97C:,6!V,3^AR"S&+!;(_&>H;HI%+.$0
M7D0W4L*1B&`)8F(