UNITED STATES
SECURITIES AND EXCHANGE COMMISSION
WASHINGTON, D.C. 20549
FORM
CURRENT REPORT
Pursuant to Section 13 or 15(d) of the Securities Exchange Act of 1934
Date of Report (Date of earliest event reported):
(Exact name of registrant as specified in its charter)
(State or Other Jurisdiction of Incorporation) | (Commission File Number) | (IRS Employer Identification No.) |
(Address of principal executive offices) | (Zip Code) |
(
(Registrant’s telephone number, including area code)
Not Applicable
(Former name or former address, if changed since last report)
Check the appropriate box below if the Form 8-K filing is intended to simultaneously satisfy the filing obligation of the registrant under any of the following provisions (see General Instruction A.2. below):
Securities registered pursuant to Section 12(b) of the Act:
Title of each class | Trading Symbol(s) | Name of each exchange on which registered |
Indicate by check mark whether the registrant is an emerging growth company as defined in Rule 405 of the Securities Act of 1933 (§230.405 of this chapter) or Rule 12b-2 of the Securities Exchange Act of 1934 (§240.12b-2 of this chapter).
Emerging growth company
If an emerging growth company, indicate by check mark if the registrant has elected not to use the extended transition period for complying with any new or revised financial accounting standards provided pursuant to Section 13(a) of the Exchange Act. ☐
Item 2.02 | Results of Operations and Financial Condition |
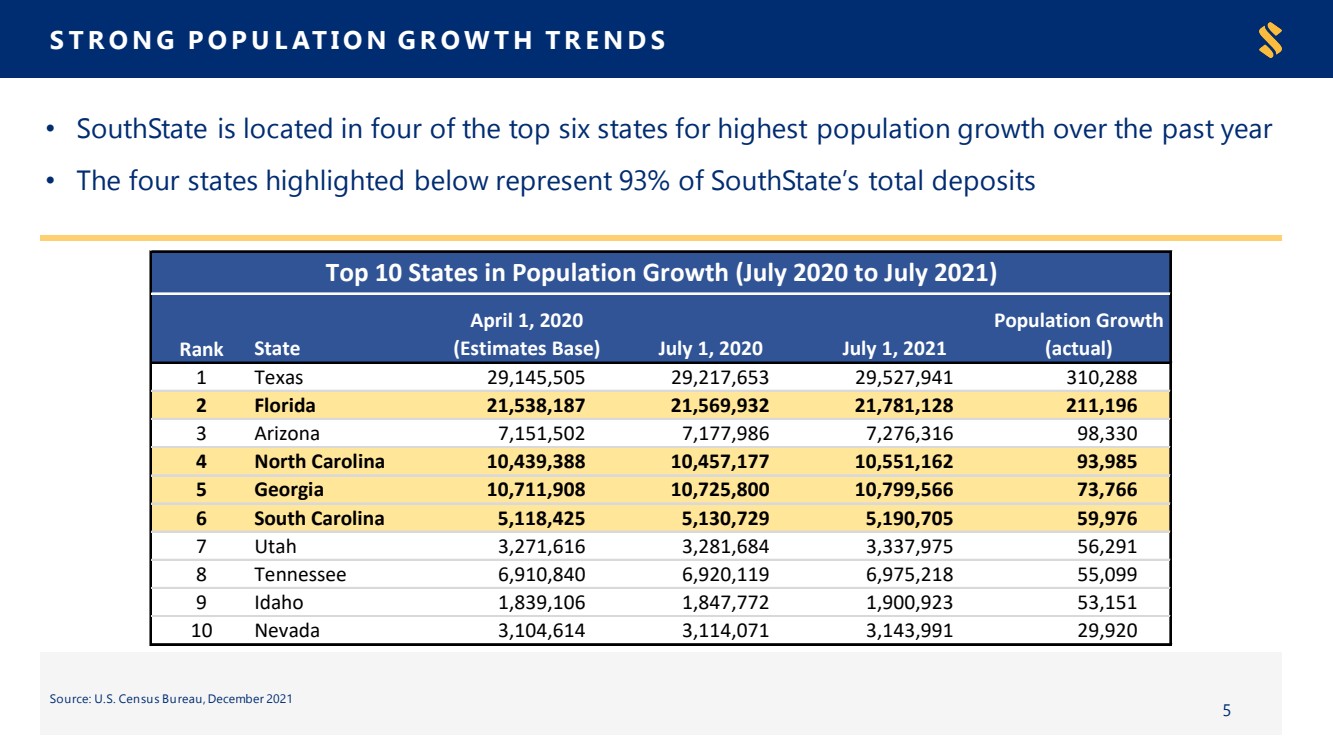
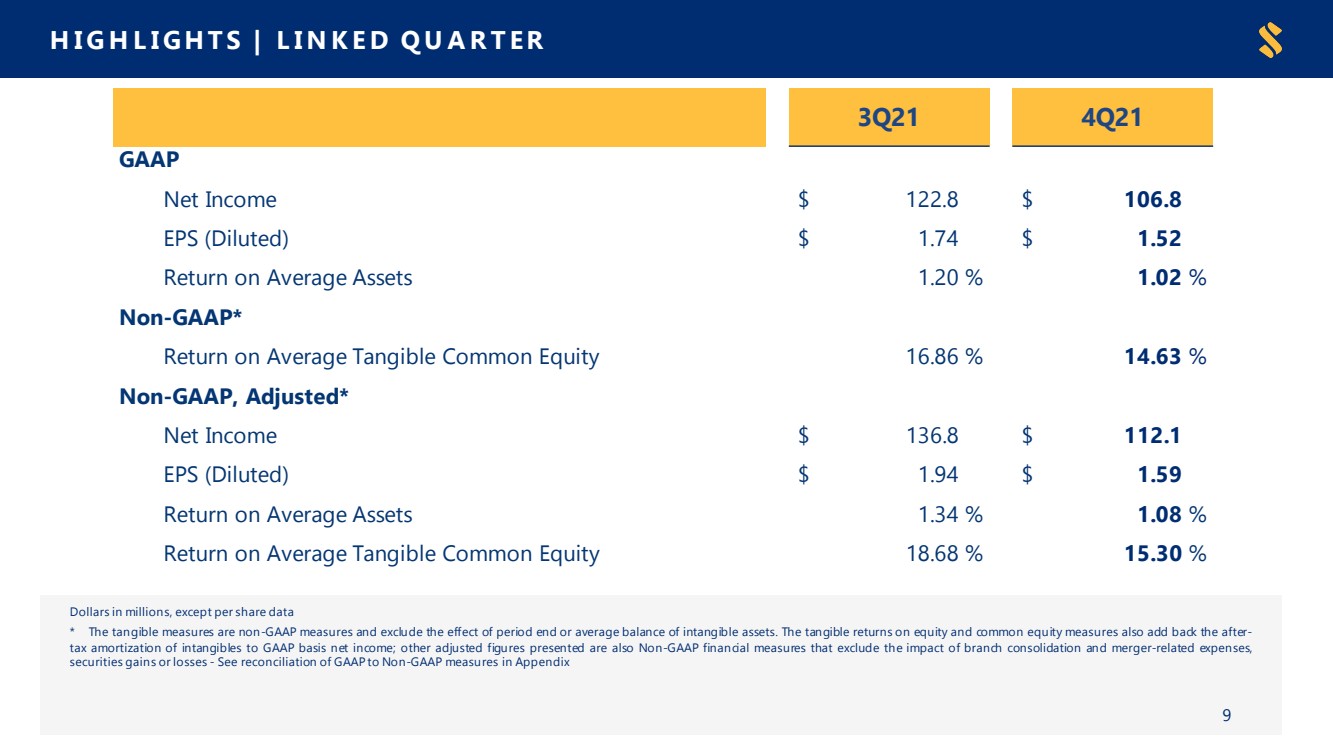
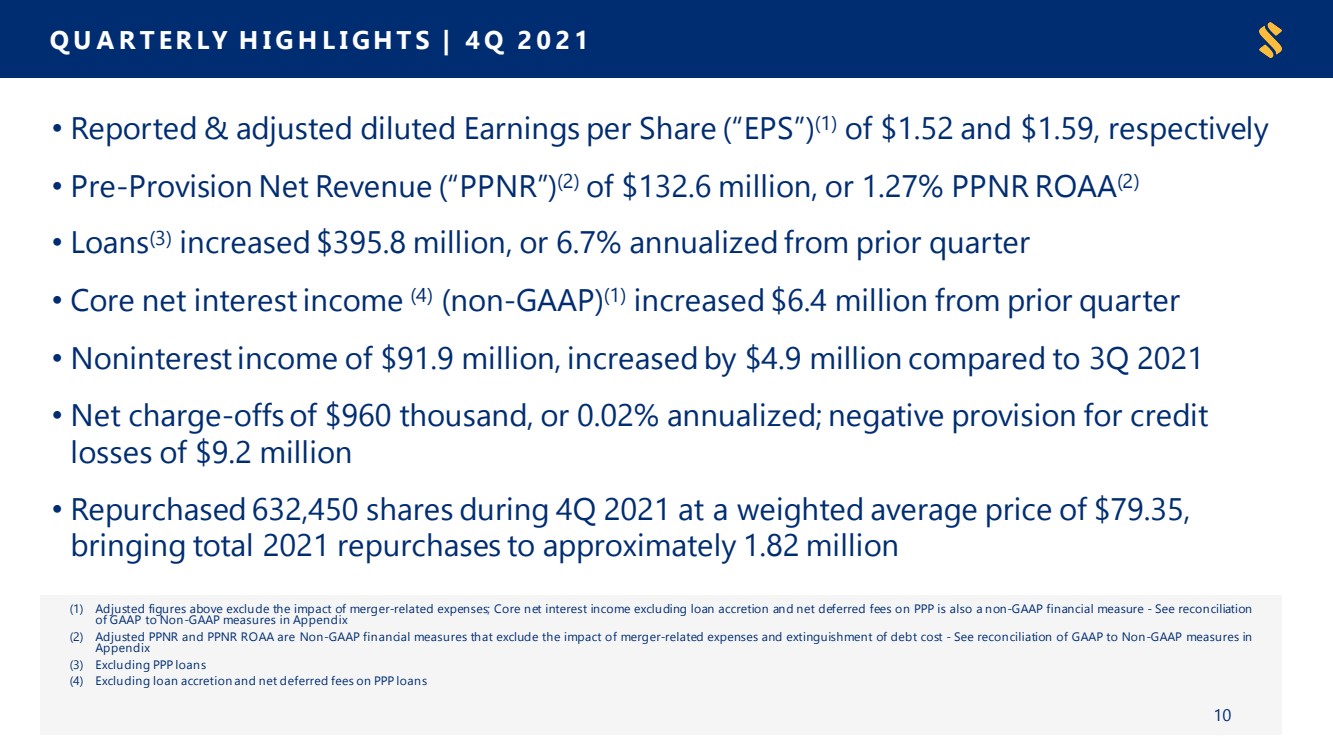
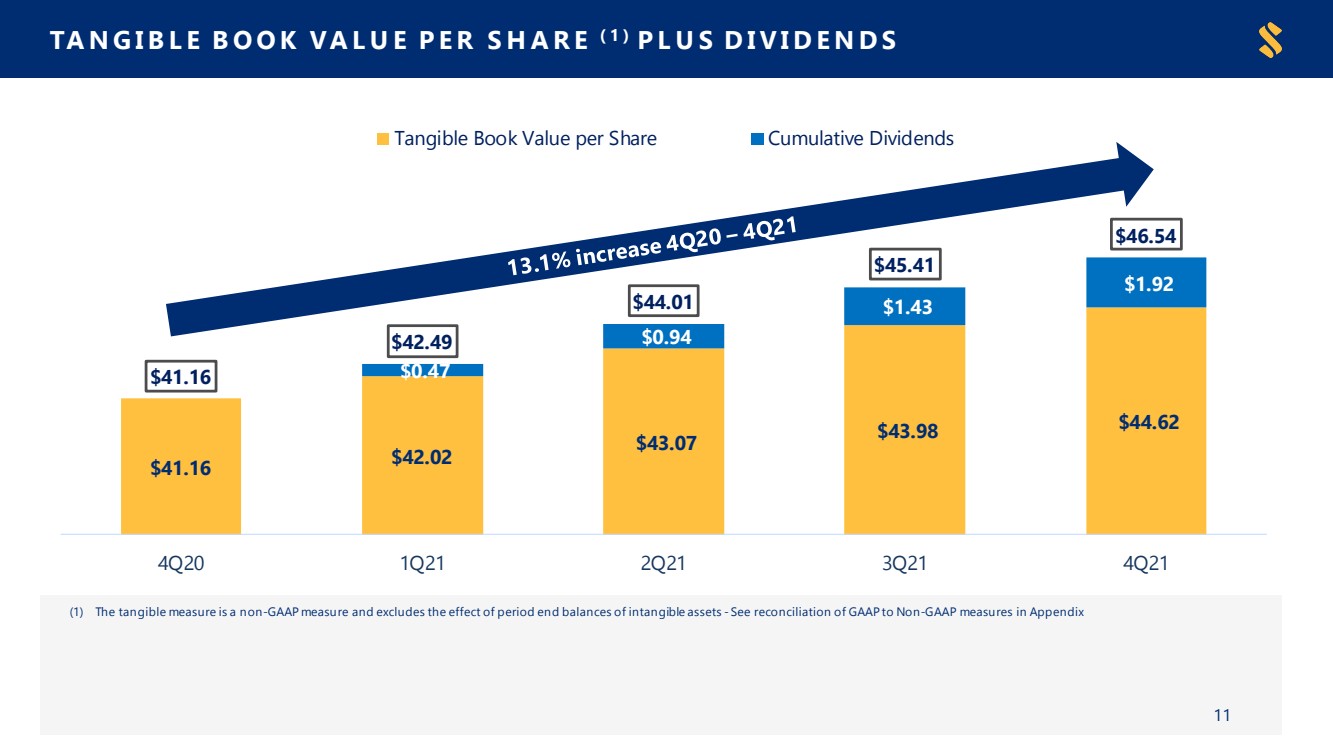
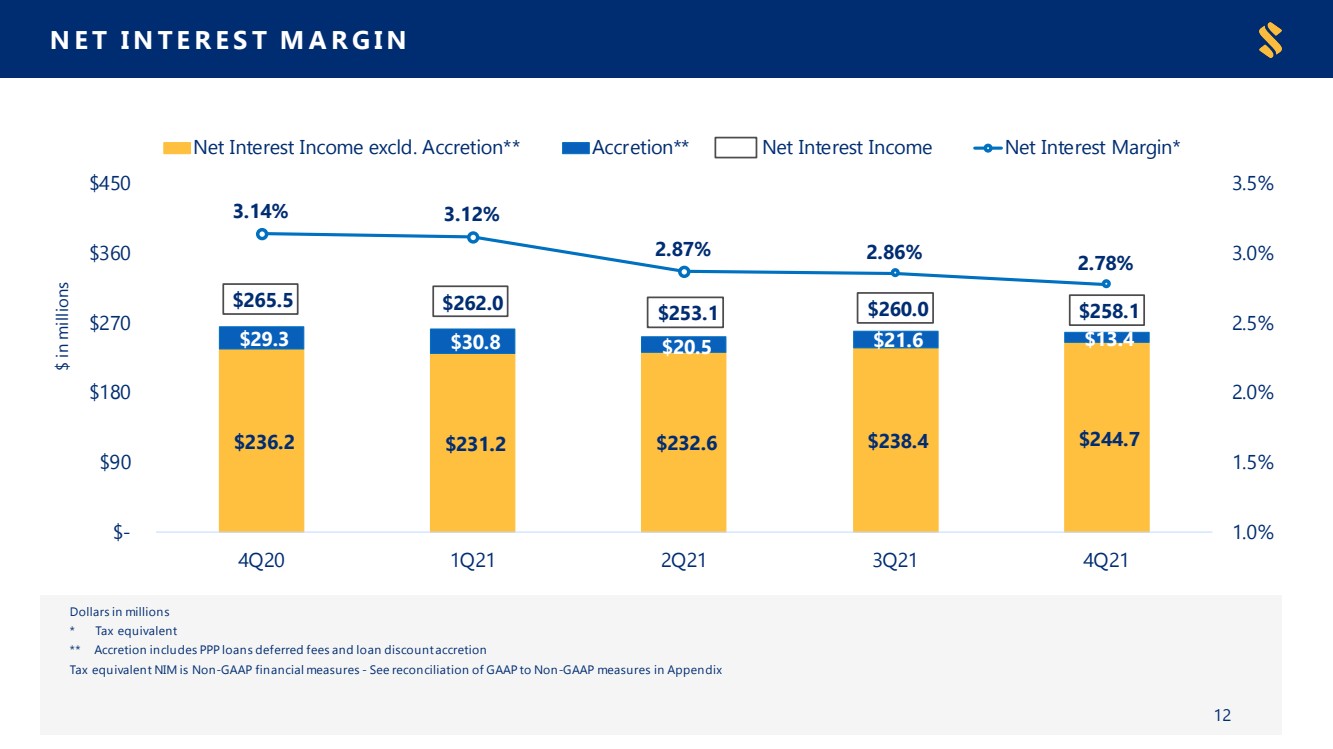
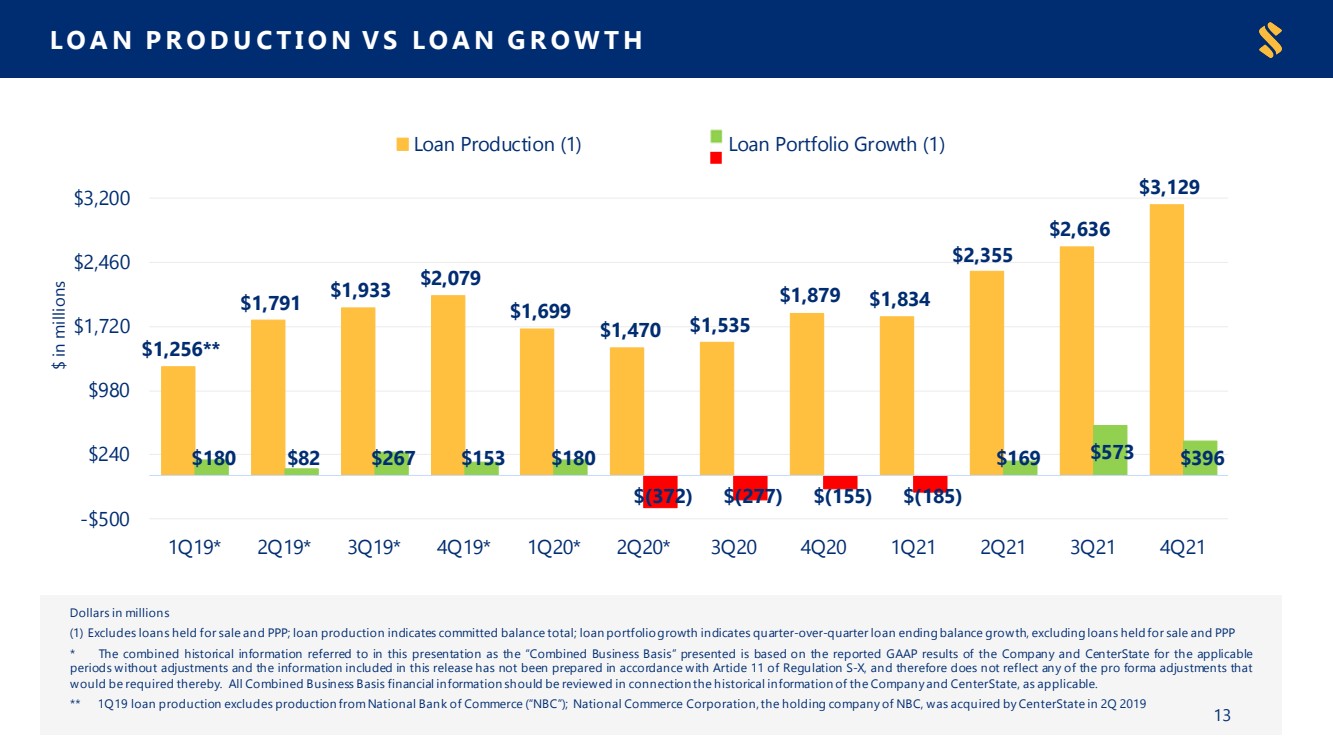
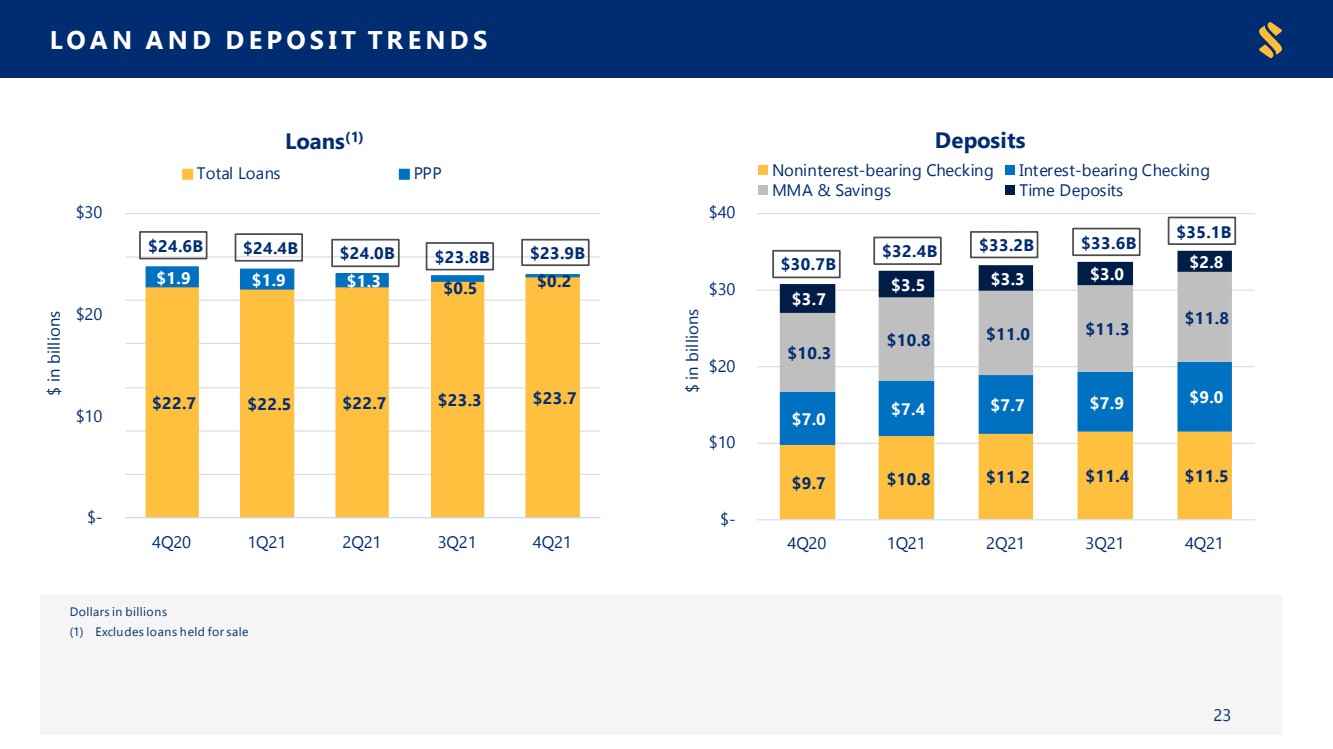
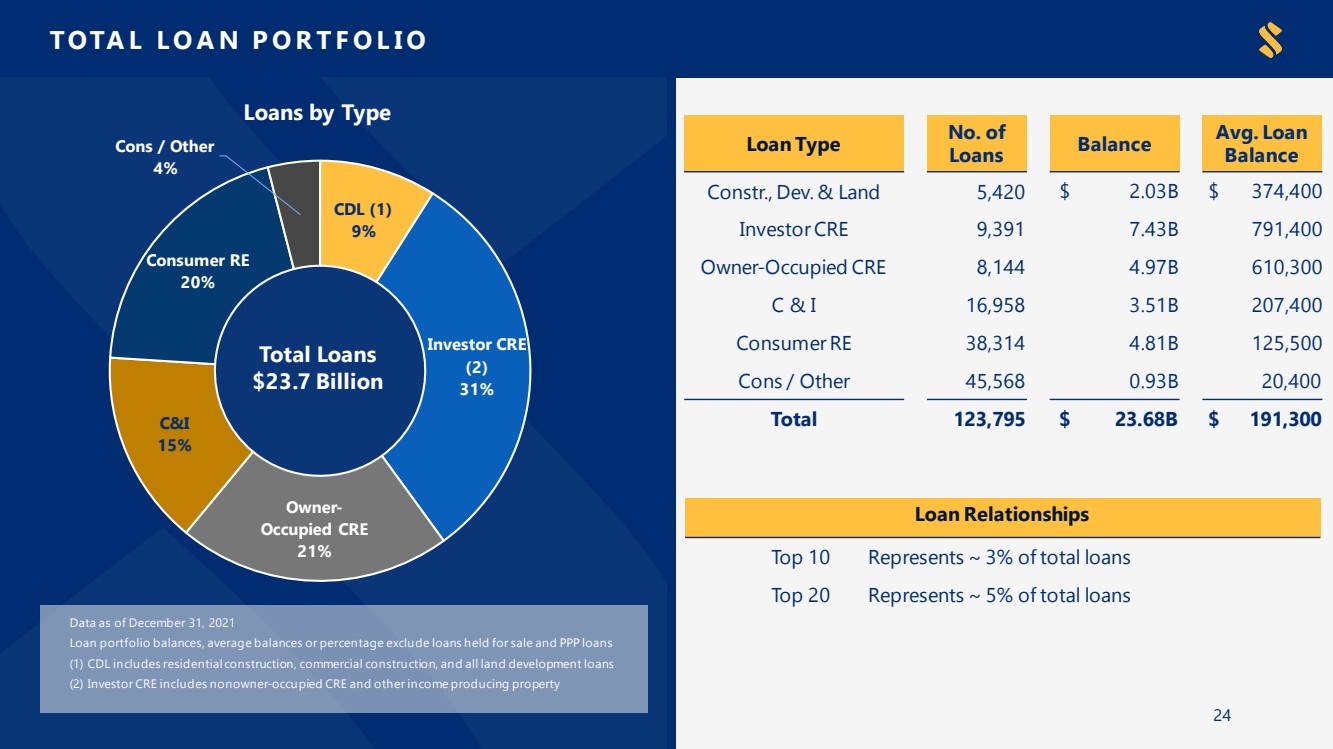
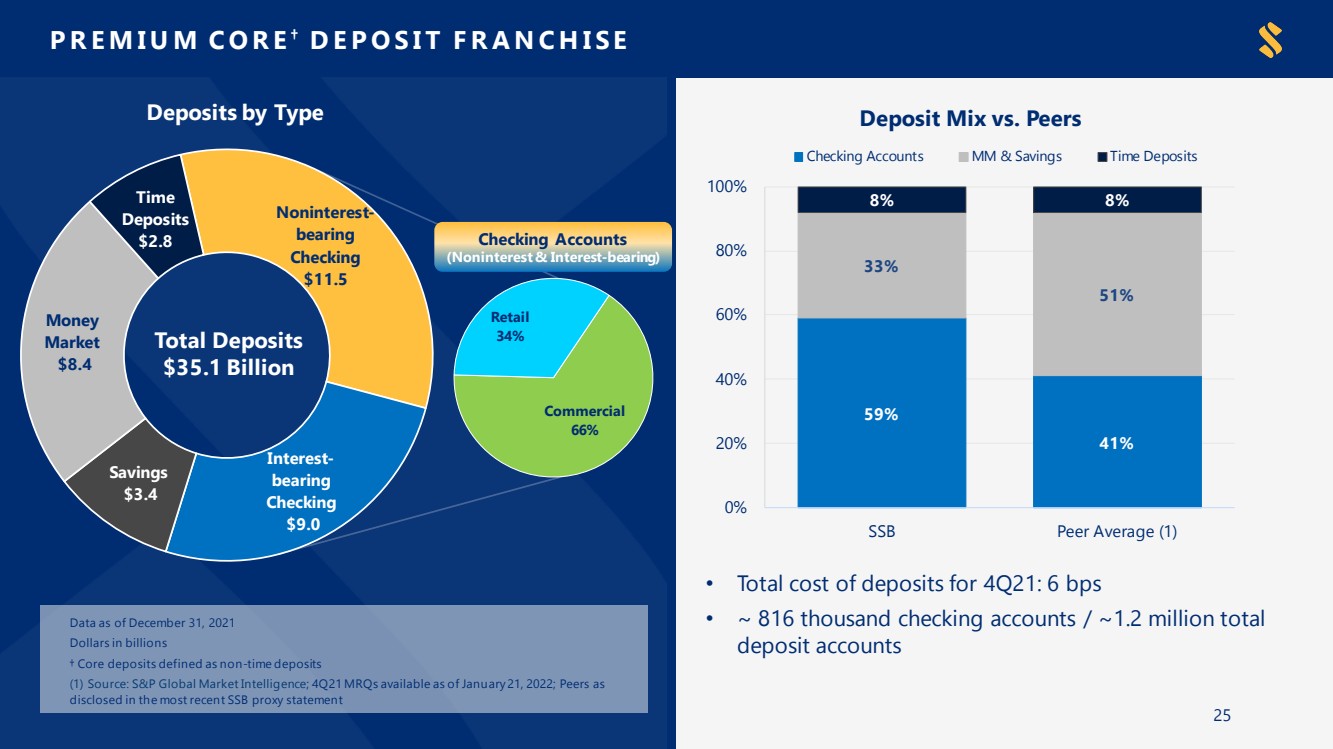
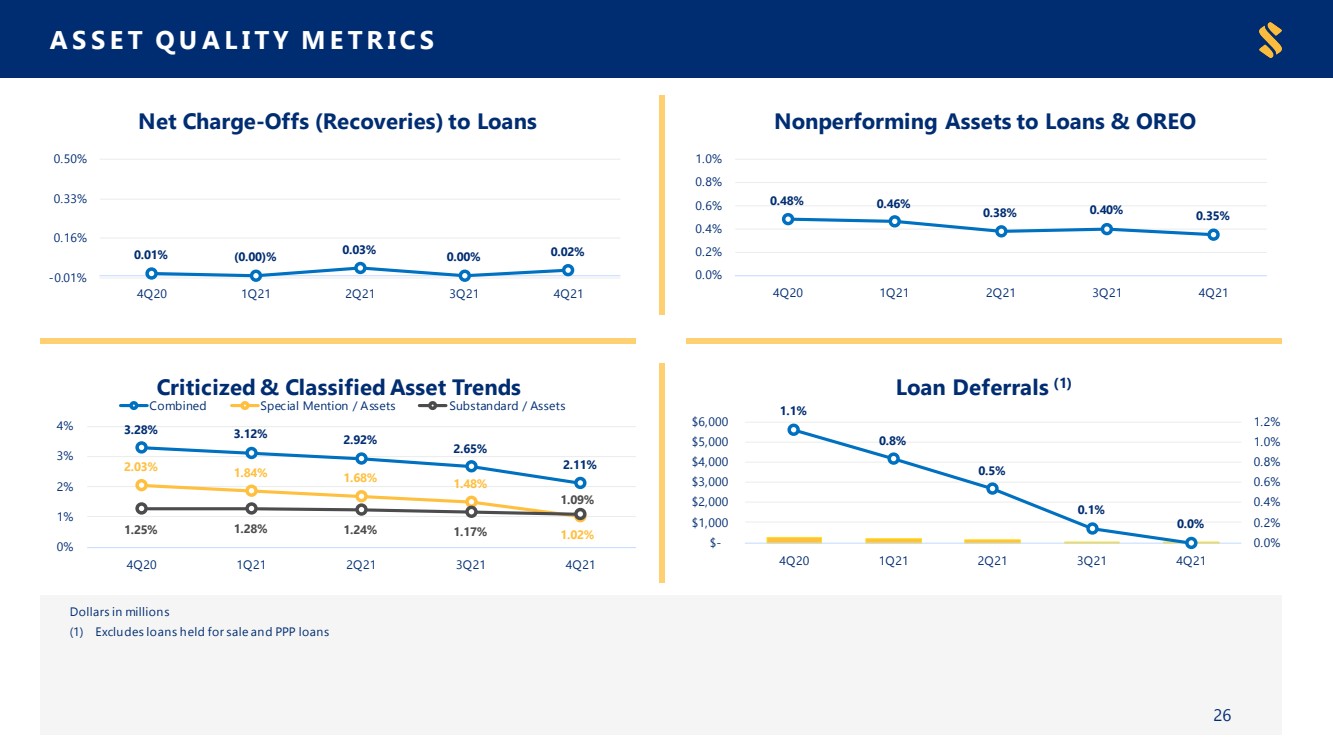
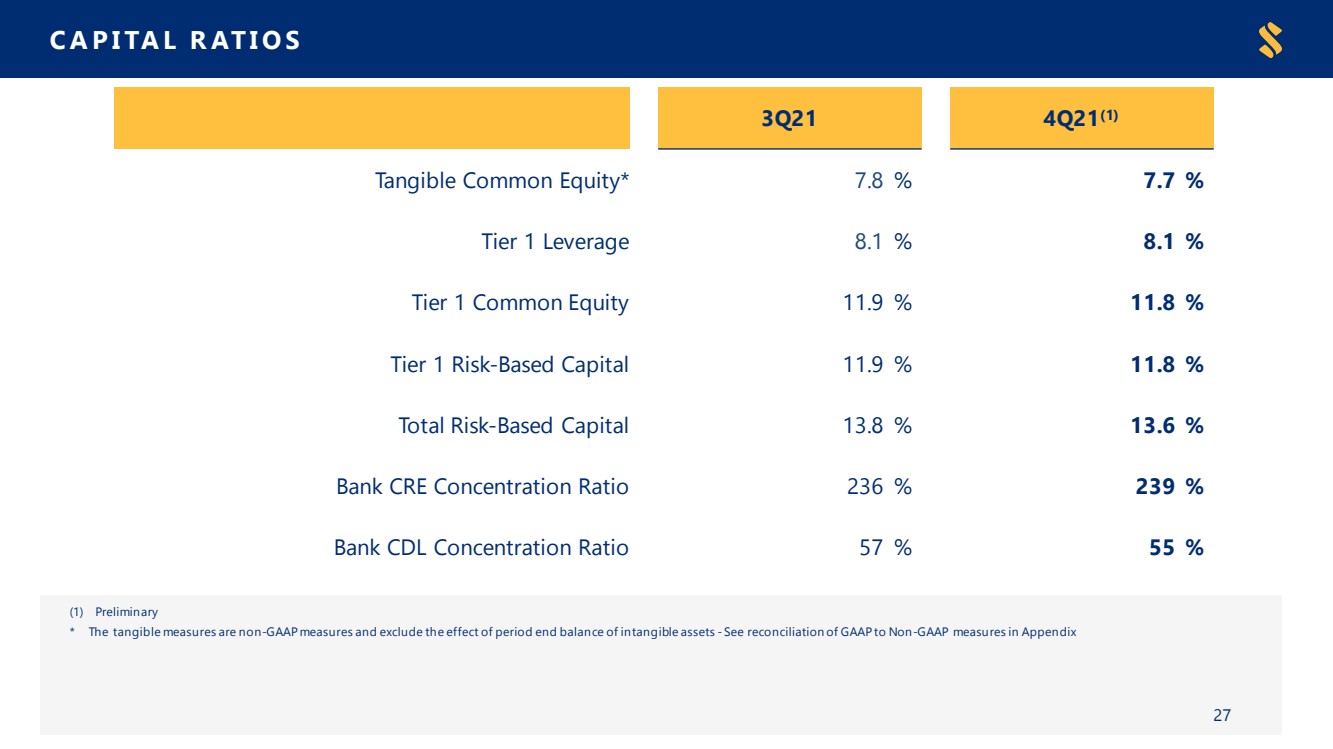
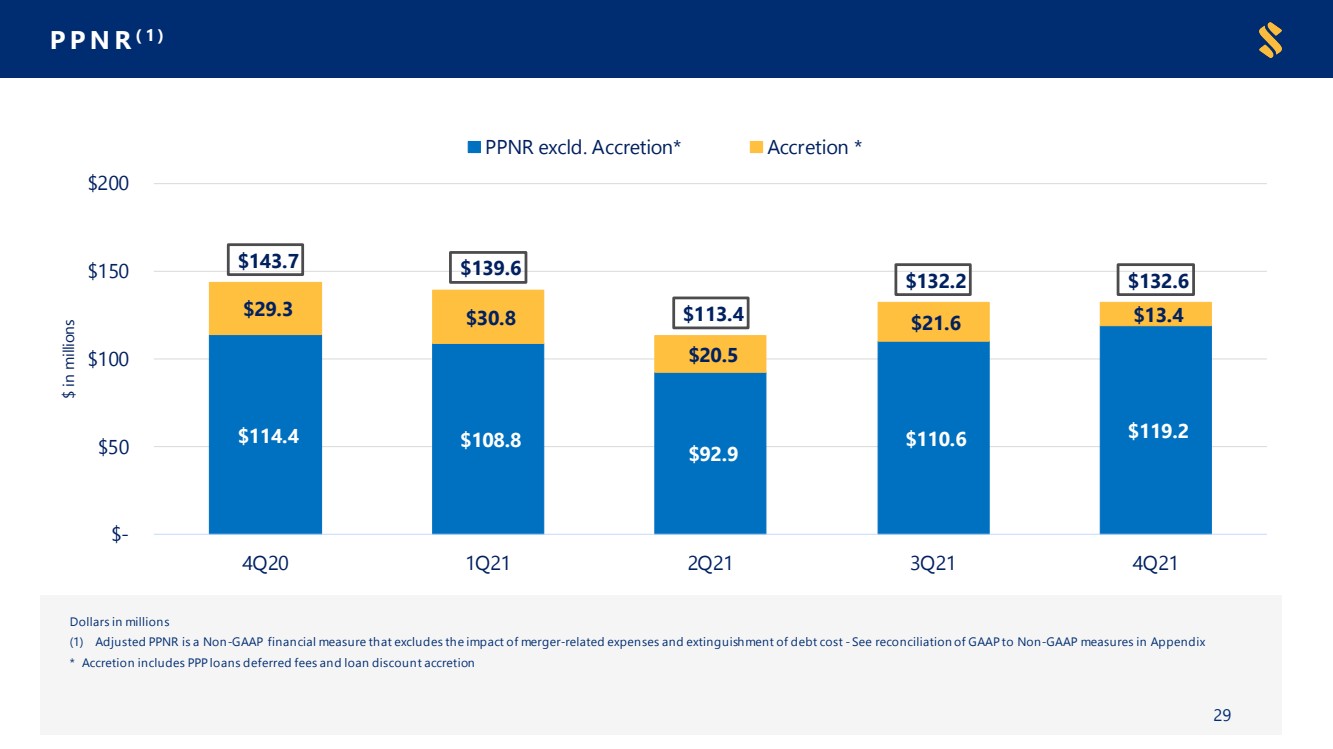
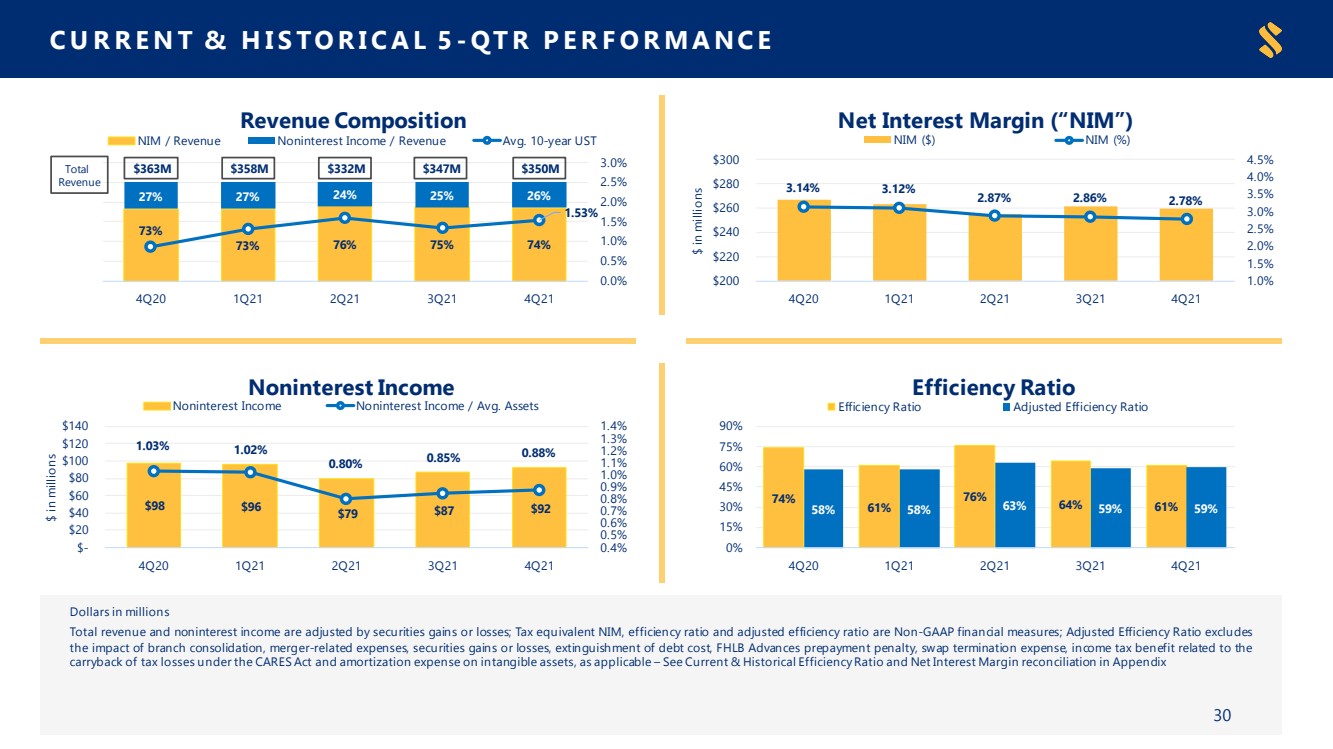
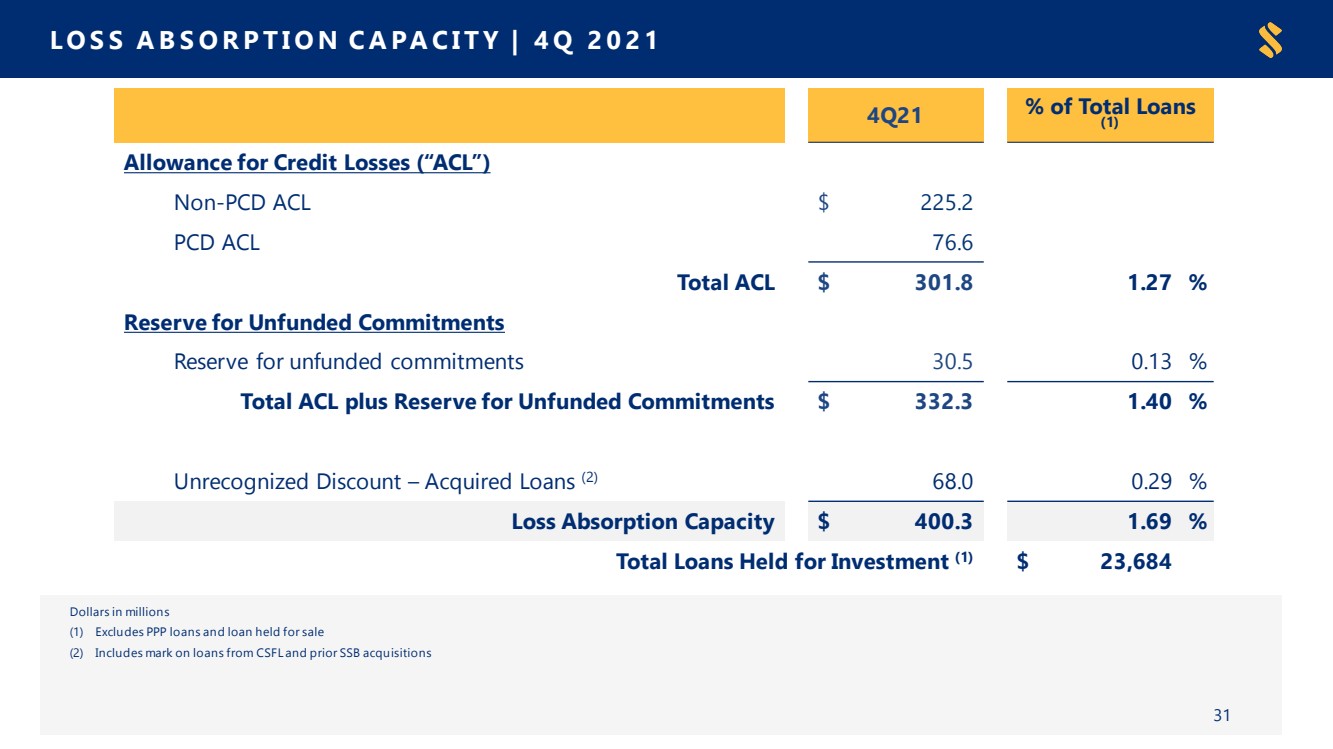
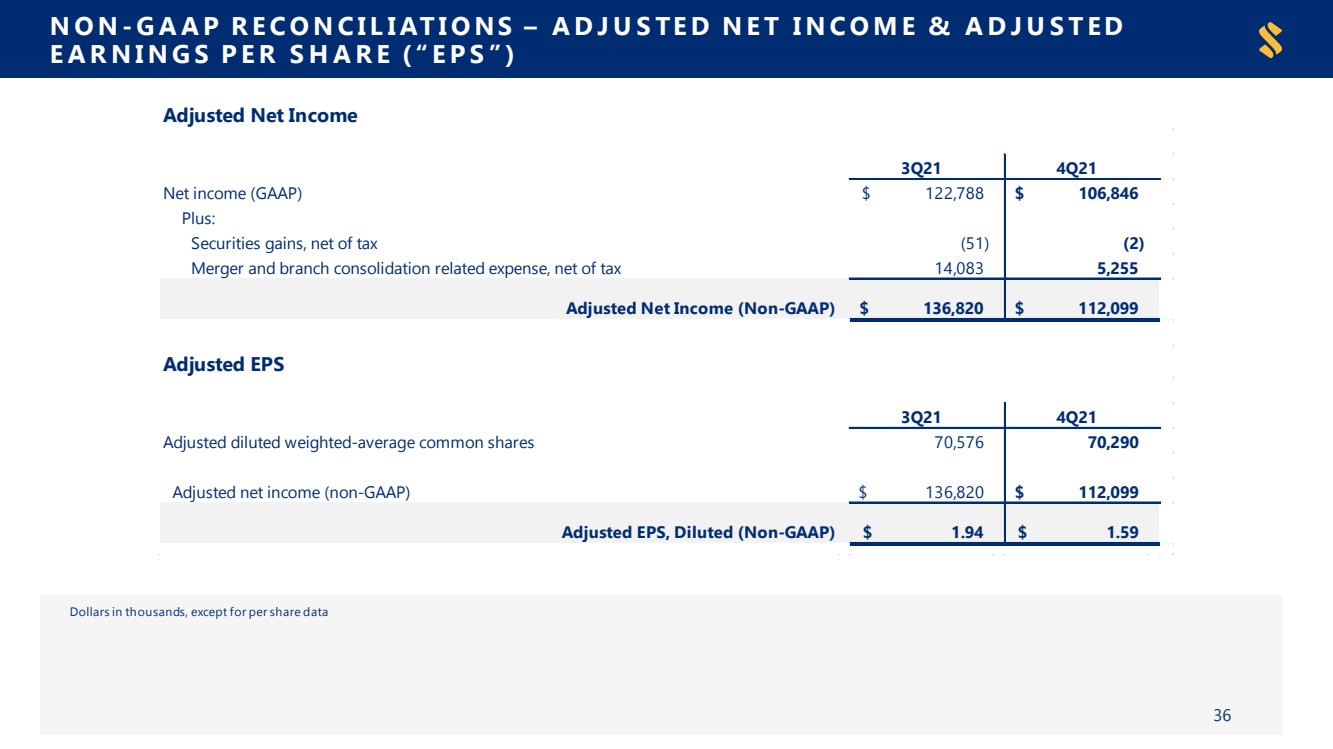
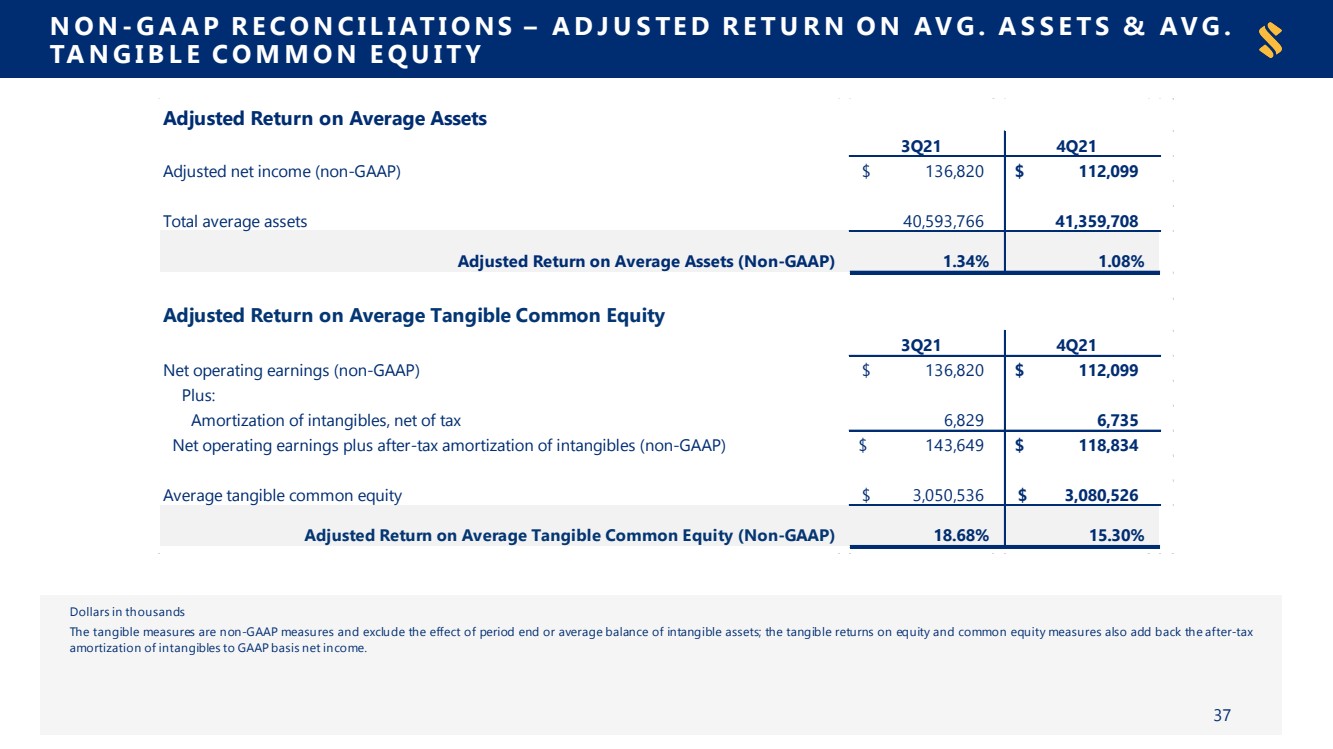
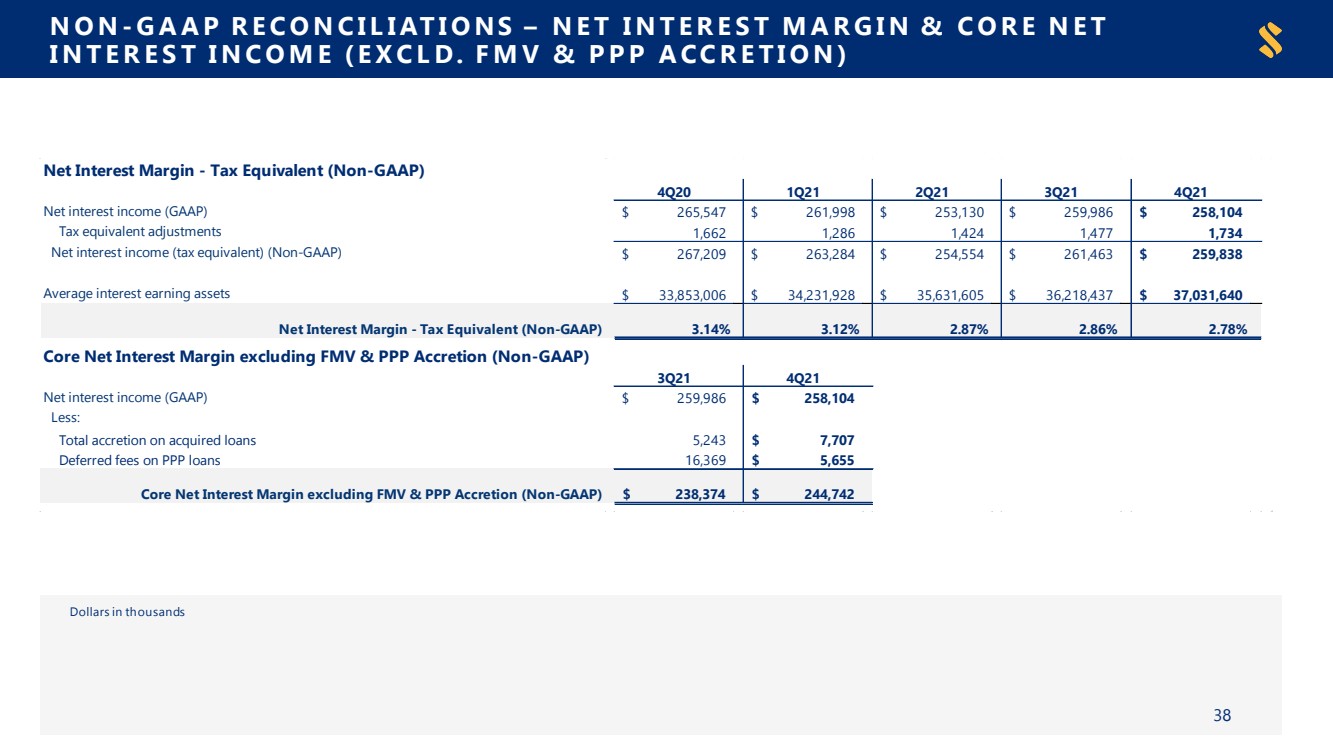
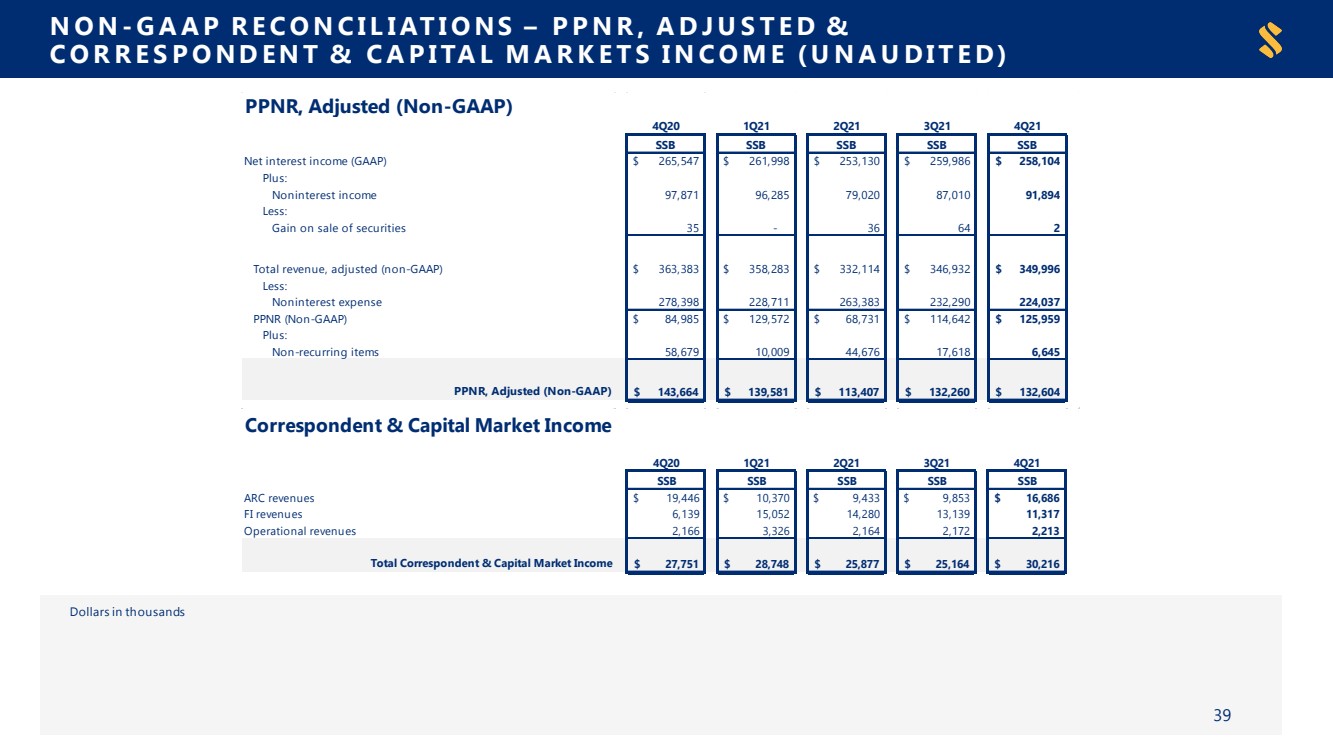
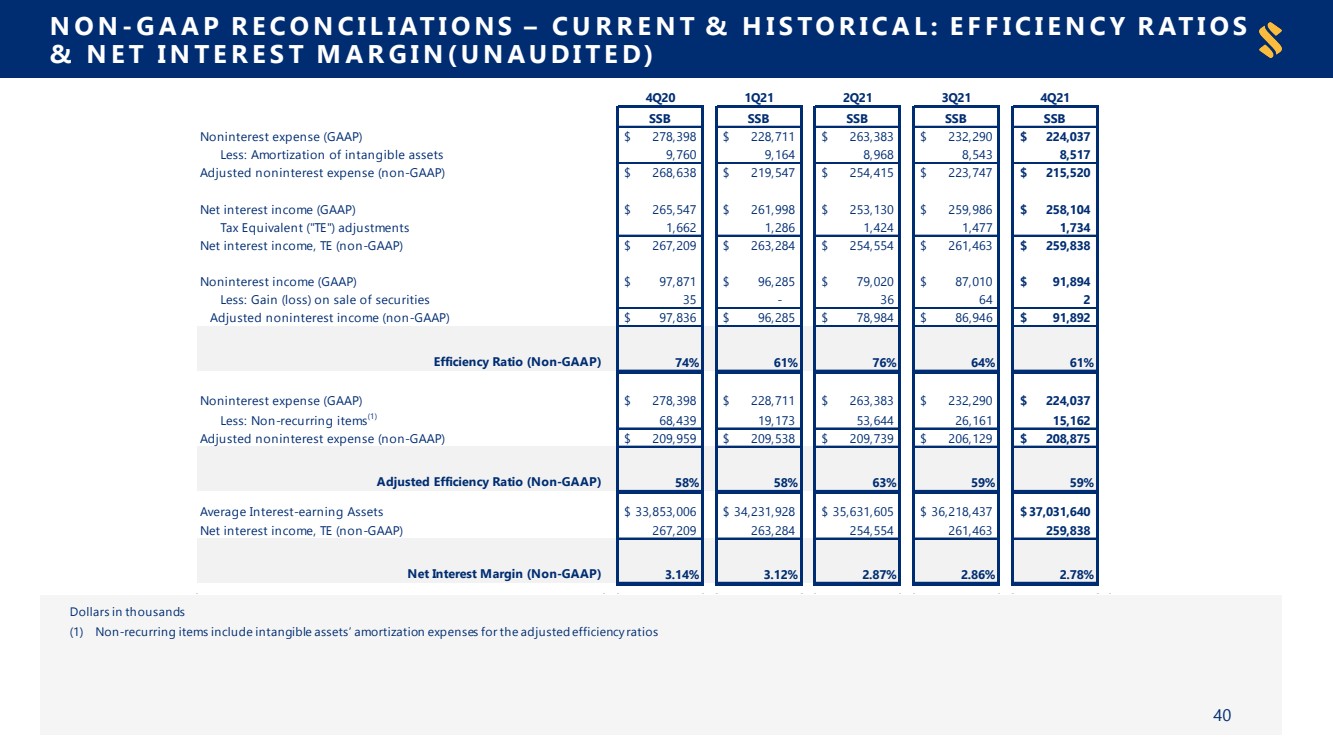
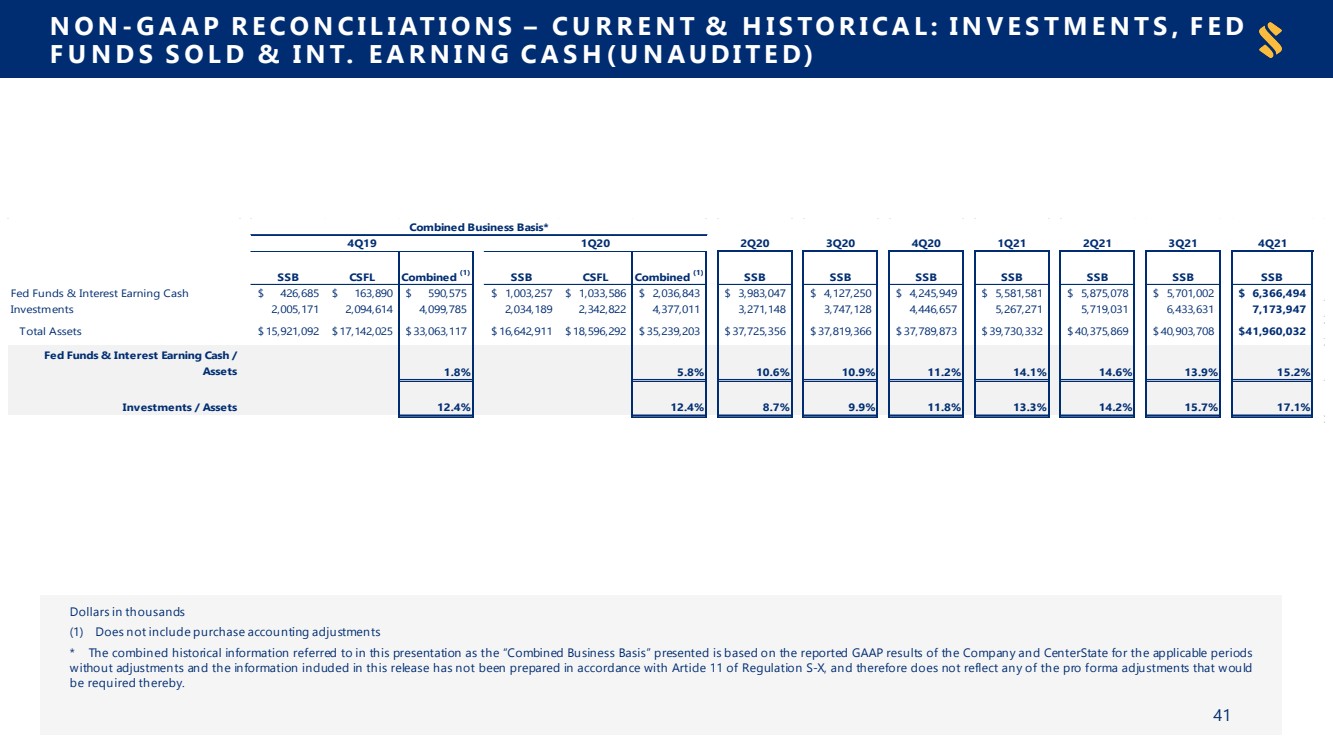
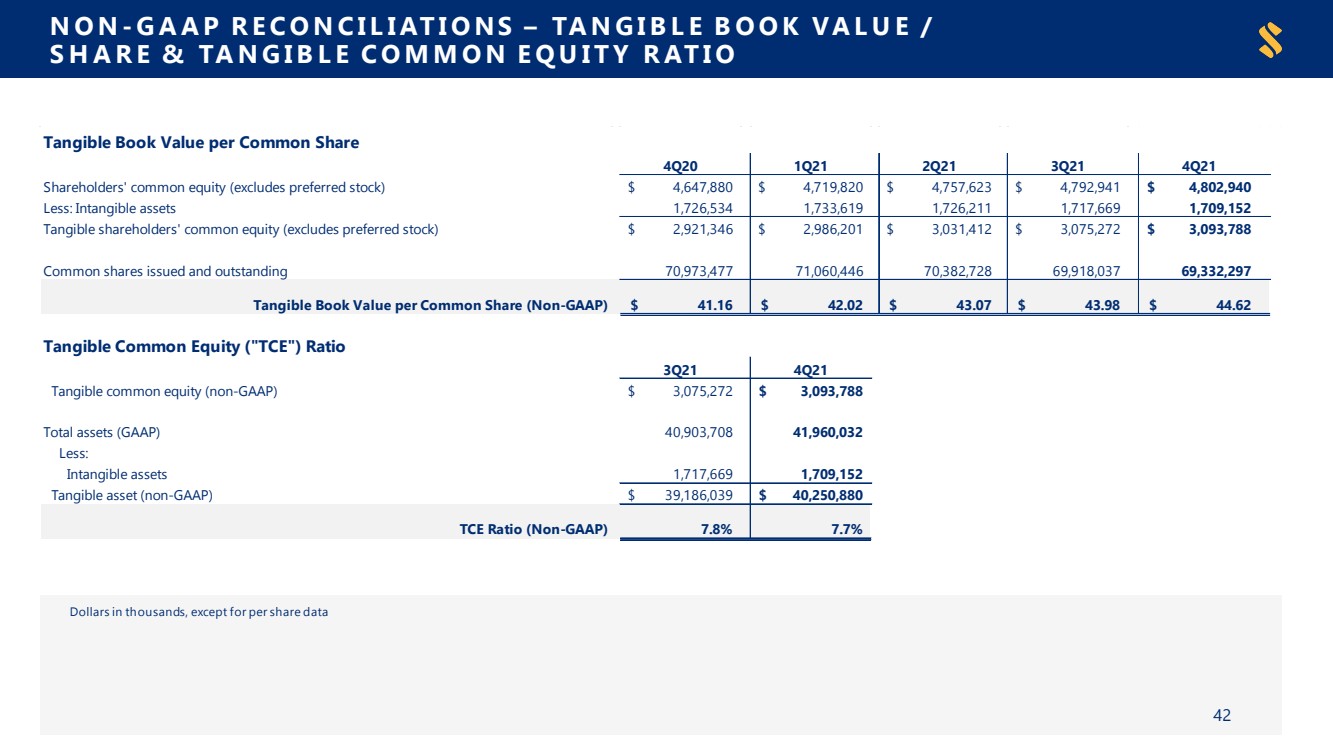
On January 24, 2022, SouthState Corporation (“SouthState” or the “Company”) issued a press release announcing its financial results for the three and twelve-month periods ended December 31, 2021, along with certain other financial information. Copies of the Company’s press release and presentation are attached as Exhibit 99.1 and 99.2, respectively, to this report and incorporated herein by reference.
SouthState will host a conference call on January 25, 2022 at 10 a.m. (ET) to discuss the Company’s fourth quarter 2021 results. Investors may call in (toll free) by dialing (844) 200-6205 within the U.S. and 929-526-1599 for all other locations (passcode 642852; host: Will Matthews, CFO).
Item 7.01 | Regulation FD Disclosure |
On January 24, 2022, the Company also made available the presentation (“Presentation”) prepared for use with the press release during the earnings conference call on January 25, 2022. Attached hereto and incorporated herein as Exhibit 99.2 is the text of that presentation.
The information contained in this Item 7.01 of this Current Report, including the information set forth in the Presentation filed as Exhibit 99.2 to, and incorporated in, this Current Report, is being "furnished" and shall not be deemed to be “filed” for purposes of Section 18 of the Exchange Act, or otherwise subject to the liability of that section, and shall not be incorporated by reference into any registration statement or other document filed under the Securities Act or the Exchange Act, except as shall be expressly set forth by specific reference in such filing.
Item 8.01 | Other Events |
First Quarter 2022 Shareholder Dividend
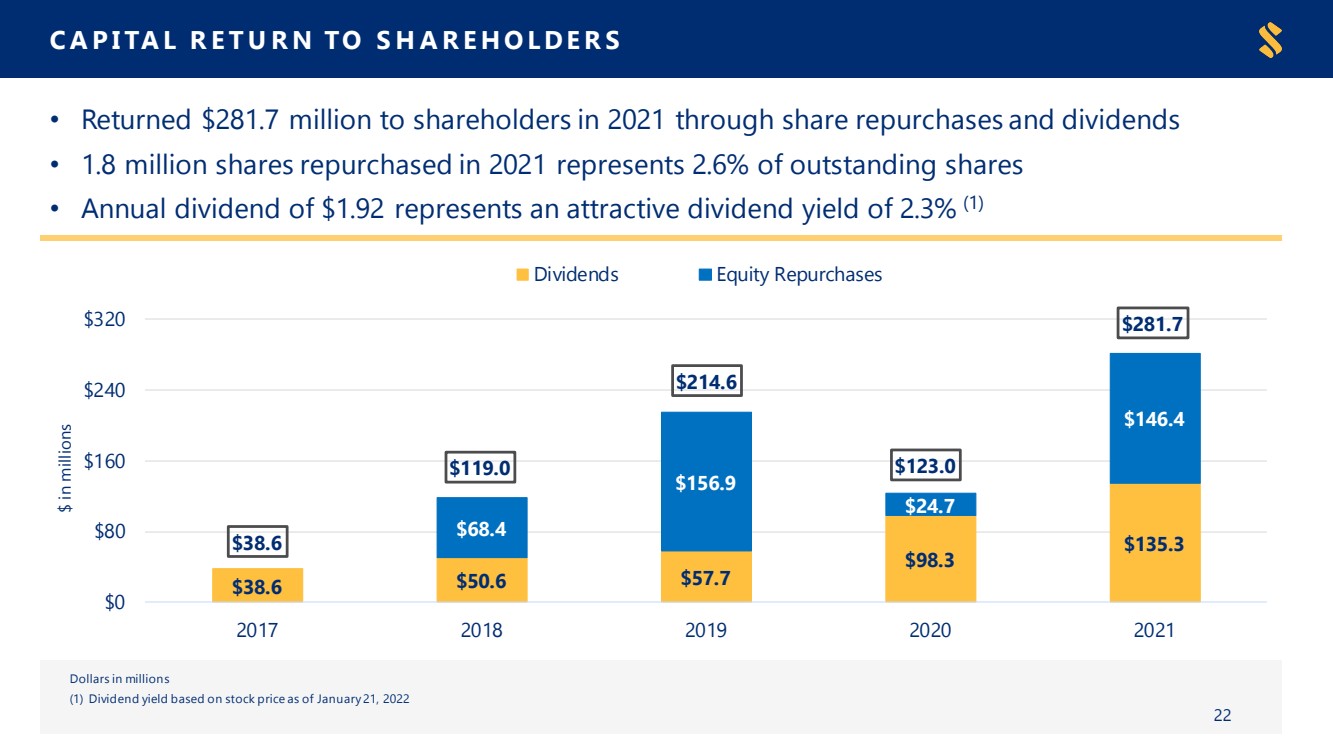
The Board of Directors of the Company declared a quarterly cash dividend on its common stock of $0.49 per share. The dividend is payable on February 18, 2022 to shareholders of record as of February 11, 2022.
Item 9.01 | Financial Statements and Exhibits. | |||
(d) | Exhibits: | |||
Exhibit No. | Description | |||
Exhibit 99.1 | ||||
Exhibit 99.2 | ||||
Exhibit 104 | Cover Page Interactive Data File (embedded within the Inline XBRL document) |
Cautionary Statement Regarding Forward Looking Statements
Statements included in this communication, which are not historical in nature are intended to be, and are hereby identified as, forward-looking statements for purposes of the safe harbor provided by Section 27A of the Securities Act of 1933 and Section 21E of the Securities Exchange Act of 1934. Forward-looking statements are based on, among other things, management’s beliefs, assumptions, current expectations, estimates and projections about the financial services industry, the economy and SouthState. Words and phrases such as “may,” “approximately,” “continue,” “should,” “expects,” “projects,” “anticipates,” “is likely,” “look ahead,” “look forward,” “believes,” “will,” “intends,” “estimates,” “strategy,” “plan,” “could,” “potential,” “possible” and variations of such words and similar expressions are intended to identify such forward-looking statements. SouthState cautions readers that forward-looking statements are subject to certain risks, uncertainties and assumptions that are difficult to predict with regard to, among other things, timing, extent, likelihood
2
and degree of occurrence, which could cause actual results to differ materially from anticipated results. Such risks, uncertainties and assumptions, include, among others, the following: (1) economic downturn risk, potentially resulting in deterioration in the credit markets, greater than expected noninterest expenses, excessive loan losses and other negative consequences, which risks could be exacerbated by potential continued negative economic developments resulting from the Covid19 pandemic, or from federal spending cuts and/or one or more federal budget-related impasses or actions; (2) interest rate risk primarily resulting from the low interest rate environment, potentially rising interest rates, and their impact on the Bank’s earnings, including from the correspondent and mortgage divisions, housing demand, the market value of the bank’s loan and securities portfolios, and the market value of SouthState’s equity; (3) risks related to the merger and integration of SouthState and CSFL including, among others, (i) the risk that the cost savings and any revenue synergies from the merger may not be fully realized or may take longer than anticipated to be realized, (ii) the risk that the integration of each party’s operations will be materially delayed or will be more costly or difficult than expected or that the parties are otherwise unable to successfully integrate each party’s businesses into the other’s businesses, (iii) the amount of the costs, fees, expenses and charges related to the merger, (iv) reputational risk and the reaction of each company's customers, suppliers, employees or other business partners to the merger, (4) risks related to the merger and integration of SouthState and Atlantic Capital including, among others, (i) the risk that the cost savings and any revenue synergies from the merger may not be fully realized or may take longer than anticipated to be realized, (ii) disruption to the parties’ businesses as a result of the announcement and pendency of the merger, (iii) the occurrence of any event, change or other circumstances that could give rise to the termination of the merger agreement, (iv) the risk that the integration of each party’s operations will be materially delayed or will be more costly or difficult than expected or that the parties are otherwise unable to successfully integrate each party’s businesses into the other’s businesses, (v) the amount of the costs, fees, expenses and charges related to the merger, (vi) the ability by each of SouthState and Atlantic Capital to obtain required governmental approvals of the merger (and the risk that such approvals may result in the imposition of conditions that could adversely affect the combined company or the expected benefits of the transaction), (vii) reputational risk and the reaction of each company's customers, suppliers, employees or other business partners to the merger, (viii) the failure of the closing conditions in the merger agreement to be satisfied, or any unexpected delay in closing the merger, (ix) the possibility that the merger may be more expensive to complete than anticipated, including as a result of unexpected factors or events, (x) the dilution caused by SouthState’s issuance of additional shares of its common stock in the merger, (xi) general competitive, economic, political and market conditions, and (xii) other factors that may affect future results of Atlantic Capital and SouthState including changes in asset quality and credit risk; the inability to sustain revenue and earnings growth; changes in interest rates and capital markets; inflation; customer borrowing, repayment, investment and deposit practices; the impact, extent and timing of technological changes; capital management activities; and other actions of the Board of Governors of the Federal Reserve System and Office of the Comptroller of the Currency and legislative and regulatory actions and reforms (5) risks relating to the continued impact of the Covid19 pandemic on the company, including possible impact to the company and its employees from contacting Covid19, and to efficiencies and the control environment due to the continued work from home environment and to our results of operations due to government stimulus and other interventions to blunt the impact of the pandemic; (6) the impact of increasing digitization of the banking industry and movement of customers to on-line platforms, and the possible impact on the Bank’s results of operations, customer base, expenses, suppliers and operations; (7) controls and procedures risk, including the potential failure or circumvention of our controls and procedures or failure to comply with regulations related to controls and procedures; (8) potential deterioration in real estate values; (9) the impact of competition with other financial institutions, including pricing pressures (including those resulting from the CARES Act) and the resulting impact, including as a result of compression to net interest margin; (10) risks relating to the ability to retain our culture and attract and retain qualified people; (11) credit risks associated with an obligor’s failure to meet the terms of any contract with the bank or otherwise fail to perform as agreed under the terms of any loan-related document; (12) risks related to the ability of the company to pursue its strategic plans which depend upon certain growth goals in our lines of business; (13) liquidity risk affecting the Bank’s ability to meet its obligations when they come due; (14) risks associated with an anticipated increase in SouthState’s investment securities portfolio, including risks associated with acquiring and holding investment securities or potentially determining that the amount of investment securities SouthState desires to acquire are not available on terms acceptable to SouthState; (15) price risk focusing on changes in market factors that may affect the value of traded instruments in “mark-to-market” portfolios; (16) transaction risk arising from problems with service or product delivery; (17) compliance risk involving risk to earnings or capital resulting from violations of or nonconformance with laws, rules, regulations, prescribed practices, or ethical standards; (18) regulatory change risk resulting from new laws, rules, regulations, accounting principles, proscribed practices or ethical standards, including, without limitation, the possibility that regulatory agencies may require higher levels of capital above the current regulatory-mandated minimums and
3
including the impact of the CARES Act, the Consumer Financial Protection Bureau regulations, and the possibility of changes in accounting standards, policies, principles and practices, including changes in accounting principles relating to loan loss recognition (CECL); (19) strategic risk resulting from adverse business decisions or improper implementation of business decisions; (20) reputation risk that adversely affects earnings or capital arising from negative public opinion; (21) cybersecurity risk related to the dependence of SouthState on internal computer systems and the technology of outside service providers, as well as the potential impacts of internal or external security breaches, which may subject the company to potential business disruptions or financial losses resulting from deliberate attacks or unintentional events; (22) reputational and operational risks associated with environment, social and governance matters; (23) greater than expected noninterest expenses; (24) excessive loan losses; (25) potential deposit attrition, higher than expected costs, customer loss and business disruption associated with the Atlantic Capital integration, and potential difficulties in maintaining relationships with key personnel; (26) the risks of fluctuations in market prices for SouthState common stock that may or may not reflect economic condition or performance of SouthState; (27) the payment of dividends on SouthState common stock, which is subject to legal and regulatory limitations as well as the discretion of the board of directors of SouthState, SouthState’s performance and other factors; (28) ownership dilution risk associated with potential acquisitions in which SouthState’s stock may be issued as consideration for an acquired company; (29) operational, technological, cultural, regulatory, legal, credit and other risks associated with the exploration, consummation and integration of potential future acquisition, whether involving stock or cash consideration; (30) major catastrophes such as hurricanes, tornados, earthquakes, floods or other natural or human disasters, including infectious disease outbreaks, including the ongoing Covid19 pandemic, and the related disruption to local, regional and global economic activity and financial markets, and the impact that any of the foregoing may have on SouthState and its customers and other constituencies; (31) terrorist activities risk that results in loss of consumer confidence and economic disruptions; and (32) other factors that may affect future results of SouthState, as disclosed in SouthState’s Annual Report on Form 10-K, Quarterly Reports on Form 10-Q, and Current Reports on Form 8-K, filed by SouthState with the U.S. Securities and Exchange Commission (“SEC”) and available on the SEC’s website at http://www.sec.gov, any of which could cause actual results to differ materially from future results expressed, implied or otherwise anticipated by such forward-looking statements.
All forward-looking statements speak only as of the date they are made and are based on information available at that time. SouthState does not undertake any obligation to update or otherwise revise any forward-looking statements, whether as a result of new information, future events, or otherwise, except as required by federal securities laws. As forward-looking statements involve significant risks and uncertainties, caution should be exercised against placing undue reliance on such statements.
4
SIGNATURES
Pursuant to the requirements of the Securities Exchange Act of 1934, the registrant has duly caused this report to be signed on its behalf by the undersigned hereunto duly authorized.
SOUTHSTATE CORPORATION | ||
(Registrant) | ||
By: | /s/ William E. Matthews, V | |
Dated: January 24, 2022
5
Exhibit 99.1
SouthState Corporation Reports Fourth Quarter 2021 Results Declares Quarterly Cash Dividend | For Immediate Release |
Media Contact | |
Jackie Smith, 803.231.3486 |
WINTER HAVEN, FL – January 24, 2022 – SouthState Corporation (NASDAQ: SSB) today released its unaudited results of operations and other financial information for the three-month and twelve-month periods ended December 31, 2021.
The Company reported consolidated net income of $1.52 per diluted common share for the three months ended December 31, 2021, compared to $1.74 per diluted common share for the three months ended September 30, 2021, and compared to $1.21 per diluted common share one year ago.
Adjusted net income (non-GAAP) totaled $1.59 per diluted share for the three months ended December 31, 2021, compared to $1.94 per diluted share for the three months ended September 30, 2021, and compared to $1.44 per diluted share one year ago. Adjusted net income in the fourth quarter of 2021 excludes $5.3 million of merger-related costs (after-tax).
“We are pleased to report a solid fourth quarter to end the year,” said John C. Corbett, Chief Executive Officer. “Our teams generated another record quarter for loan production with the fourth quarter’s $3.1 billion, topping the previous record of $2.6 billion from the third quarter and leading to another quarter of strong loan growth. We reported net interest income of $258.1 million and core net interest income of $244.7 million, which we are pleased to report is a $6.4 million increase from the prior quarter. The combination of our growth momentum, surplus cash position, strong asset quality, and our location in growing markets makes us optimistic about our future.”
Highlights of the fourth quarter of 2021 include:
Returns
● | Reported and adjusted diluted Earnings per Share (“EPS”) of $1.52 and $1.59 (Non-GAAP), respectively |
● | Net income and adjusted net income of $106.8 million and $112.1 million (Non-GAAP), respectively |
● | Return on average common equity of 8.84% and reported and adjusted return on average tangible common equity of 14.6% (Non-GAAP) and 15.3% (Non-GAAP), respectively |
● | Return on Average Assets (“ROAA”) and adjusted ROAA of 1.02% and 1.08% (Non-GAAP), respectively |
● | Pre-Provision Net Revenue (“PPNR”) of $132.6 million (Non-GAAP), or 1.27% PPNR ROAA (Non-GAAP) |
● | Book value per share of $69.27 increased by $0.72 per share compared to the prior quarter |
● | Tangible Book Value (“TBV”) per share of $44.62 (Non-GAAP), up $3.46, or 8.4% from the year ago quarter |
● | Recorded a negative provision for credit losses of $9.2 million compared to a negative provision for credit losses of $38.9 million in the prior quarter |
Performance
● | Net interest income of $258.1 million; core net interest income (non-GAAP) (excluding loan accretion and deferred fees on PPP) increased $6.4 million from prior quarter |
● | Total deposit cost of 0.06%, down 3 basis points from prior quarter |
● | Noninterest income of $91.9 million, up $4.9 million compared to the prior quarter, primarily due to a $5.1 million increase in correspondent banking and capital market income and $4.2 million increase in deposit fee income, offset by a $3.5 million decrease in mortgage banking income |
● | Noninterest expense excluding merger-related cost (Non-GAAP) increased $2.7 million compared to the prior quarter due primarily to an increase in incentive accruals, commissions, charitable donations, operational charge-offs, and higher FDIC assessment expense |
Balance Sheet / Credit
● | Fed funds and interest-earning cash of $6.4 billion represents 15.2% of assets and provides significant optionality in a rising rate environment |
● | Record loan production for the third straight quarter; $3.1 billion of production is 19% higher than the previous quarter |
● | Loans, excluding PPP loans, increased $395.8 million, or 6.7% annualized, centered in $279.4 million growth in investor commercial real estate, commercial owner occupied real estate, and single family construction to permanent loans (which are included in the construction and land development loans category) and $73.4 million growth in consumer real estate loans |
● | Total deposits increased $1.5 billion, or 17.7% annualized, with core deposit growth totaling $1.7 billion, or 21.8% annualized |
● | 32.8% of deposits are noninterest-bearing |
● | Net charge-offs of $960 thousand, or 0.02% annualized |
Capital Returns
● | Repurchased 632,450 shares during 4Q 2021 at a weighted average price of $79.35, bringing total 2021 repurchases to approximately 1.82 million shares at a weighted average price of $80.51; approximately 6,000 shares purchased in January 2022 |
Subsequent Events
● | Received OCC and Atlantic Capital Bancshares, Inc. (“ACBI”) shareholders’ approvals for the ACBI merger, awaiting FRB approval |
● | Declared a cash dividend on common stock of $0.49 per share, payable on February 18, 2022 to shareholders of record as of February 11, 2022 |
2
Financial Performance
| | Three Months Ended | | Twelve Months Ended | | |||||||||||||||||
(Dollars in thousands, except per share data) | | Dec. 31, | | Sep. 30, | | Jun. 30, | | Mar. 31, | | Dec. 31, | | Dec. 31, | | Dec. 31, | | |||||||
INCOME STATEMENT | | 2021 | | 2021 | | 2021 | | 2021 | | 2020 | | 2021 | | 2020 | | |||||||
Interest income | | | | | | | | | | | | | | | | | | | | | | |
Loans, including fees (1) | | $ | 238,310 | | $ | 246,065 | | $ | 246,177 | | $ | 259,967 | | $ | 269,632 | | $ | 990,519 | | $ | 851,199 | |
Investment securities, trading securities, federal funds sold and securities | | | | | | | | | | | | | | | | | | | | | | |
purchased under agreements to resell | | | 29,071 | | | 25,384 | | | 21,364 | | | 18,509 | | | 16,738 | | | 94,328 | | | 58,830 | |
Total interest income | | | 267,381 | | | 271,449 | | | 267,541 | | | 278,476 | | | 286,370 | | | 1,084,847 | | | 910,029 | |
Interest expense | | | | | | | | | | | | | | | | | | | | | | |
Deposits | | | 5,121 | | | 7,267 | | | 9,537 | | | 11,257 | | | 13,227 | | | 33,182 | | | 55,442 | |
Federal funds purchased, securities sold under agreements | | | | | | | | | | | | | | | | | | | | | | |
to repurchase, and other borrowings | | | 4,156 | | | 4,196 | | | 4,874 | | | 5,221 | | | 7,596 | | | 18,447 | | | 28,122 | |
Total interest expense | | | 9,277 | | | 11,463 | | | 14,411 | | | 16,478 | | | 20,823 | | | 51,629 | | | 83,564 | |
Net interest income | | | 258,104 | | | 259,986 | | | 253,130 | | | 261,998 | | | 265,547 | | | 1,033,218 | | | 826,465 | |
(Recovery) provision for credit losses | | | (9,157) | | | (38,903) | | | (58,793) | | | (58,420) | | | 18,185 | | | (165,273) | | | 235,989 | |
Net interest income after (recovery) provision for credit losses | | | 267,261 | | | 298,889 | | | 311,923 | | | 320,418 | | | 247,362 | | | 1,198,491 | | | 590,476 | |
Noninterest income | | | 91,894 | | | 87,010 | | | 79,020 | | | 96,285 | | | 97,871 | | | 354,209 | | | 311,140 | |
Noninterest expense | | | | | | | | | | | | | | | | | | | | | | |
Pre-tax operating expense | | | 217,392 | | | 214,672 | | | 218,707 | | | 218,702 | | | 219,719 | | | 869,473 | | | 672,696 | |
Merger and/or branch consolid. expense | | | 6,645 | | | 17,618 | | | 32,970 | | | 10,009 | | | 19,836 | | | 67,242 | | | 85,906 | |
Extinguishment of debt cost | | | — | | | — | | | 11,706 | | | — | | | — | | | 11,706 | | | — | |
SWAP termination expense | | | — | | | — | | | — | | | — | | | 38,787 | | | — | | | 38,787 | |
Federal Home Loan Bank advances prepayment fee | | | — | | | — | | | — | | | — | | | 56 | | | — | | | 255 | |
Total noninterest expense | | | 224,037 | | | 232,290 | | | 263,383 | | | 228,711 | | | 278,398 | | | 948,421 | | | 797,644 | |
Income before provision for income taxes | | | 135,118 | | | 153,609 | | | 127,560 | | | 187,992 | | | 66,835 | | | 604,279 | | | 103,972 | |
Income taxes provision (benefit) | | | 28,272 | | | 30,821 | | | 28,600 | | | 41,043 | | | (19,401) | | | 128,736 | | | (16,660) | |
Net income | | $ | 106,846 | | $ | 122,788 | | $ | 98,960 | | $ | 146,949 | | $ | 86,236 | | $ | 475,543 | | $ | 120,632 | |
| | | | | | | | | | | | | | | | | | | | | | |
Adjusted net income (non-GAAP) (2) | | | | | | | | | | | | | | | | | | | | | | |
Net income (GAAP) | | $ | 106,846 | | $ | 122,788 | | $ | 98,960 | | $ | 146,949 | | $ | 86,236 | | $ | 475,543 | | $ | 120,632 | |
Securities gains, net of tax | | | (2) | | | (51) | | | (28) | | | — | | | (29) | | | (81) | | | (41) | |
Income taxes benefit - carryback tax loss | | | — | | | — | | | — | | | — | | | (31,468) | | | — | | | (31,468) | |
FHLB prepayment penalty, net of tax | | | — | | | — | | | — | | | — | | | 46 | | | — | | | 200 | |
Pension plan termination expense, net of tax | | | — | | | — | | | — | | | — | | | — | | | — | | | — | |
SWAP termination expense, net of tax | | | — | | | — | | | — | | | — | | | 31,784 | | | — | | | 31,784 | |
Initial provision for credit losses - NonPCD loans and UFC | | | — | | | — | | | — | | | — | | | — | | | — | | | 92,212 | |
Merger and/or branch consolid. expense, net of tax | | | 5,255 | | | 14,083 | | | 25,578 | | | 7,824 | | | 16,255 | | | 52,740 | | | 68,369 | |
Extinguishment of debt cost, net of tax | | | — | | | — | | | 9,081 | | | — | | | — | | | 9,081 | | | — | |
Adjusted net income (non-GAAP) | | $ | 112,099 | | $ | 136,820 | | $ | 133,591 | | $ | 154,773 | | $ | 102,824 | | $ | 537,283 | | $ | 281,688 | |
| | | | | | | | | | | | | | | | | | | | | | |
Basic earnings per common share | | $ | 1.53 | | $ | 1.75 | | $ | 1.40 | | $ | 2.07 | | $ | 1.22 | | $ | 6.76 | | $ | 2.20 | |
Diluted earnings per common share | | $ | 1.52 | | $ | 1.74 | | $ | 1.39 | | $ | 2.06 | | $ | 1.21 | | $ | 6.71 | | $ | 2.19 | |
Adjusted net income per common share - Basic (non-GAAP) (2) | | $ | 1.61 | | $ | 1.95 | | $ | 1.89 | | $ | 2.18 | | $ | 1.45 | | $ | 7.63 | | $ | 5.14 | |
Adjusted net income per common share - Diluted (non-GAAP) (2) | | $ | 1.59 | | $ | 1.94 | | $ | 1.87 | | $ | 2.17 | | $ | 1.44 | | $ | 7.58 | | $ | 5.12 | |
Dividends per common share | | $ | 0.49 | | $ | 0.49 | | $ | 0.47 | | $ | 0.47 | | $ | 0.47 | | $ | 1.92 | | $ | 1.88 | |
Basic weighted-average common shares outstanding | | | 69,651,334 | | | 70,066,235 | | | 70,866,193 | | | 71,009,209 | | | 70,941,200 | | | 70,393,262 | | | 54,755,518 | |
Diluted weighted-average common shares outstanding | | | 70,289,971 | | | 70,575,726 | | | 71,408,888 | | | 71,484,490 | | | 71,294,864 | | | 70,888,896 | | | 55,062,748 | |
Effective tax rate | | | 20.92% | | | 20.06% | | | 22.42% | | | 21.83% | | | (29.03)% | | | 21.30% | | | (16.02)% | |
Adjusted effective tax rate | | | 20.92% | | | 20.06% | | | 22.42% | | | 21.83% | | | 18.05% | | | 21.30% | | | 14.24% | |
3
Performance and Capital Ratios
| | Three Months Ended | | Twelve Months Ended | | | |||||||||||||||
| | Dec. 31, | | Sep. 30, | | Jun. 30, | | Mar. 31, | | Dec. 31, | | Dec. 31, | | Dec. 31, | | | |||||
| | 2021 | | 2021 | | 2021 | | 2021 | | 2020 | | 2021 | | 2020 | | | |||||
PERFORMANCE RATIOS | | | | | | | | | | | | | | | | | | | | | |
Return on average assets (annualized) | | | 1.02 | % | | 1.20 | % | | 1.00 | % | | 1.56 | % | | 0.90 | % | 1.19 | % | 0.42 | % | |
Adjusted return on average assets (annualized) (non-GAAP) (2) | | | 1.08 | % | | 1.34 | % | | 1.35 | % | | 1.64 | % | | 1.08 | % | 1.34 | % | 0.98 | % | |
Return on average equity (annualized) | | | 8.84 | % | | 10.21 | % | | 8.38 | % | | 12.71 | % | | 7.45 | % | 10.01 | % | 3.35 | % | |
Adjusted return on average equity (annualized) (non-GAAP) (2) | | | 9.28 | % | | 11.37 | % | | 11.31 | % | | 13.39 | % | | 8.88 | % | 11.31 | % | 7.81 | % | |
Return on average tangible common equity (annualized) (non-GAAP) (3) | | | 14.63 | % | | 16.86 | % | | 14.12 | % | | 21.16 | % | | 13.05 | % | 16.64 | % | 6.67 | % | |
Adjusted return on average tangible common equity (annualized) (non-GAAP) (2) (3) | | | 15.30 | % | | 18.68 | % | | 18.74 | % | | 22.24 | % | | 15.35 | % | 18.68 | % | 14.14 | % | |
Efficiency ratio (tax equivalent) | | | 61.27 | % | | 64.22 | % | | 76.28 | % | | 61.06 | % | | 73.59 | % | 65.55 | % | 67.47 | % | |
Adjusted efficiency ratio (non-GAAP) (4) | | | 59.39 | % | | 59.16 | % | | 62.88 | % | | 58.27 | % | | 57.52 | % | 59.88 | % | 56.53 | % | |
Dividend payout ratio (5) | | | 32.02 | % | | 27.94 | % | | 33.65 | % | | 22.72 | % | | 38.67 | % | 28.43 | % | 81.45 | % | |
Book value per common share | | $ | 69.27 | | $ | 68.55 | | $ | 67.60 | | $ | 66.42 | | $ | 65.49 | | | | | | |
Tangible book value per common share (non-GAAP) (3) | | $ | 44.62 | | $ | 43.98 | | $ | 43.07 | | $ | 42.02 | | $ | 41.16 | | | | | | |
| | | | | | | | | | | | | | | | | | | | | |
CAPITAL RATIOS | | | | | | | | | | | | | | | | | | | | | |
Equity-to-assets | | | 11.4 | % | | 11.7 | % | | 11.8 | % | | 11.9 | % | | 12.3 | % | | | | | |
Tangible equity-to-tangible assets (non-GAAP) (3) | | | 7.7 | % | | 7.8 | % | | 7.8 | % | | 7.9 | % | | 8.1 | % | | | | | |
Tier 1 leverage (6) * | | | 8.1 | % | | 8.1 | % | | 8.1 | % | | 8.5 | % | | 8.3 | % | | | | | |
Tier 1 common equity (6) * | | | 11.8 | % | | 11.9 | % | | 12.1 | % | | 12.2 | % | | 11.8 | % | | | | | |
Tier 1 risk-based capital (6) * | | | 11.8 | % | | 11.9 | % | | 12.1 | % | | 12.2 | % | | 11.8 | % | | | | | |
Total risk-based capital (6) * | | | 13.6 | % | | 13.8 | % | | 14.1 | % | | 14.5 | % | | 14.2 | % | | | | | |
*The regulatory capital ratios presented above include the assumption of the transitional method relative to the CARES Act in relief of COVID-19 pandemic on the economy and financial institutions in the United States. The referenced relief allows a total five-year “phase in” of the CECL impact on capital and relief over the next two years for the impact on the allowance for credit losses resulting from COVID-19.
4
Balance Sheet
| | Ending Balance | | |||||||||||||
(Dollars in thousands, except per share and share data) | | Dec. 31, | | Sep. 30, | | Jun. 30, | | Mar. 31, | | Dec. 31, | | |||||
BALANCE SHEET | | 2021 | | 2021 | | 2021 | | 2021 | | 2020 | | |||||
Assets | | | | | | | | | | | | | | | | |
Cash and due from banks | | $ | 476,653 | | $ | 597,321 | | $ | 529,434 | | $ | 392,556 | | $ | 363,306 | |
Federal Funds Sold and interest-earning deposits with banks | | | 6,366,494 | | | 5,701,002 | | | 5,875,078 | | | 5,581,581 | | | 4,245,949 | |
Cash and cash equivalents | | | 6,843,147 | | | 6,298,323 | | | 6,404,512 | | | 5,974,137 | | | 4,609,255 | |
| | | | | | | | | | | | | | | | |
Trading securities, at fair value | | | 77,689 | | | 61,294 | | | 89,925 | | | 83,947 | | | 10,674 | |
Investment securities: | | | | | | | | | | | | | | | | |
Securities held to maturity | | | 1,819,901 | | | 1,641,485 | | | 1,189,265 | | | 1,214,313 | | | 955,542 | |
Securities available for sale, at fair value | | | 5,193,478 | | | 4,631,554 | | | 4,369,159 | | | 3,891,490 | | | 3,330,672 | |
Other investments | | | 160,568 | | | 160,592 | | | 160,607 | | | 161,468 | | | 160,443 | |
Total investment securities | | | 7,173,947 | | | 6,433,631 | | | 5,719,031 | | | 5,267,271 | | | 4,446,657 | |
Loans held for sale | | | 191,723 | | | 242,813 | | | 171,447 | | | 352,997 | | | 290,467 | |
Loans: | | | | | | | | | | | | | | | | |
Purchased credit deteriorated | | | 1,987,322 | | | 2,255,874 | | | 2,434,259 | | | 2,680,466 | | | 2,915,809 | |
Purchased non-credit deteriorated | | | 5,890,069 | | | 6,554,647 | | | 7,457,950 | | | 8,433,913 | | | 9,458,869 | |
Non-acquired | | | 16,050,775 | | | 14,978,428 | | | 14,140,869 | | | 13,377,086 | | | 12,289,456 | |
Less allowance for credit losses | | | (301,807) | | | (314,144) | | | (350,401) | | | (406,460) | | | (457,309) | |
Loans, net | | | 23,626,359 | | | 23,474,805 | | | 23,682,677 | | | 24,085,005 | | | 24,206,825 | |
Other real estate owned ("OREO") | | | 2,736 | | | 3,687 | | | 5,039 | | | 11,471 | | | 11,914 | |
Premises and equipment, net | | | 558,499 | | | 569,817 | | | 568,473 | | | 569,171 | | | 579,239 | |
Bank owned life insurance | | | 783,049 | | | 778,552 | | | 773,452 | | | 562,624 | | | 559,368 | |
Mortgage servicing rights | | | 65,620 | | | 60,922 | | | 57,351 | | | 54,285 | | | 43,820 | |
Core deposit and other intangibles | | | 128,067 | | | 136,584 | | | 145,126 | | | 153,861 | | | 162,592 | |
Goodwill | | | 1,581,085 | | | 1,581,085 | | | 1,581,085 | | | 1,579,758 | | | 1,563,942 | |
Other assets | | | 928,111 | | | 1,262,195 | | | 1,177,751 | | | 1,035,805 | | | 1,305,120 | |
Total assets | | $ | 41,960,032 | | $ | 40,903,708 | | $ | 40,375,869 | | $ | 39,730,332 | | $ | 37,789,873 | |
| | | | | | | | | | | | | | | | |
Liabilities and Shareholders' Equity | | | | | | | | | | | | | | | | |
Deposits: | | | | | | | | | | | | | | | | |
Noninterest-bearing | | $ | 11,498,840 | | $ | 11,333,881 | | $ | 11,176,338 | | $ | 10,801,812 | | $ | 9,711,338 | |
Interest-bearing | | | 23,555,989 | | | 22,226,677 | | | 22,066,031 | | | 21,639,598 | | | 20,982,544 | |
Total deposits | | | 35,054,829 | | | 33,560,558 | | | 33,242,369 | | | 32,441,410 | | | 30,693,882 | |
Federal funds purchased and securities | | | | | | | | | | | | | | | | |
sold under agreements to repurchase | | | 781,239 | | | 859,736 | | | 862,429 | | | 878,581 | | | 779,666 | |
Other borrowings | | | 327,066 | | | 326,807 | | | 351,548 | | | 390,323 | | | 390,179 | |
Reserve for unfunded commitments | | | 30,510 | | | 28,289 | | | 30,981 | | | 35,829 | | | 43,380 | |
Other liabilities | | | 963,448 | | | 1,335,377 | | | 1,130,919 | | | 1,264,369 | | | 1,234,886 | |
Total liabilities | | | 37,157,092 | | | 36,110,767 | | | 35,618,247 | | | 35,010,512 | | | 33,141,993 | |
| | | | | | | | | | | | | | | | |
Shareholders' equity: | | | | | | | | | | | | | | | | |
Common stock - $2.50 par value; authorized 160,000,000 shares | | | 173,331 | | | 174,795 | | | 175,957 | | | 177,651 | | | 177,434 | |
Surplus | | | 3,653,098 | | | 3,693,622 | | | 3,720,946 | | | 3,772,248 | | | 3,765,406 | |
Retained earnings | | | 997,657 | | | 925,044 | | | 836,584 | | | 770,952 | | | 657,451 | |
Accumulated other comprehensive (loss) income | | | (21,146) | | | (520) | | | 24,136 | | | (1,031) | | | 47,589 | |
Total shareholders' equity | | | 4,802,940 | | | 4,792,941 | | | 4,757,623 | | | 4,719,820 | | | 4,647,880 | |
Total liabilities and shareholders' equity | | $ | 41,960,032 | | $ | 40,903,708 | | $ | 40,375,869 | | $ | 39,730,332 | | $ | 37,789,873 | |
| | | | | | | | | | | | | | | | |
Common shares issued and outstanding | | | 69,332,297 | | | 69,918,037 | | | 70,382,728 | | | 71,060,446 | | | 70,973,477 | |
5
Net Interest Income and Margin
| | Three Months Ended | | ||||||||||||||||||||||
| | Dec. 31, 2021 | | Sep. 30, 2021 | | Dec. 31, 2020 | | ||||||||||||||||||
(Dollars in thousands) | | Average | | Income/ | | Yield/ | | Average | | Income/ | | Yield/ | | Average | | Income/ | | Yield/ | | ||||||
YIELD ANALYSIS | | Balance | | Expense | | Rate | | Balance | | Expense | | Rate | | Balance | | Expense | | Rate | | ||||||
Interest-Earning Assets: | | | | | | | | | | | | | | | | | | | | | | | | | |
Federal funds sold and interest-earning deposits with banks | | $ | 6,070,349 | | $ | 2,224 | | 0.15% | | $ | 6,072,760 | | $ | 2,199 | | 0.14% | | $ | 4,509,137 | | $ | 1,098 | | 0.10% | |
Investment securities | | | 6,945,952 | | | 26,847 | | 1.53% | | | 6,084,812 | | | 23,185 | | 1.51% | | | 4,070,218 | | | 15,641 | | 1.53% | |
Loans held for sale | | | 206,920 | | | 1,526 | | 2.93% | | | 184,547 | | | 1,307 | | 2.81% | | | 382,115 | | | 2,328 | | 2.42% | |
Total loans, excluding PPP | | | 23,445,336 | | | 230,337 | | 3.90% | | | 22,937,207 | | | 226,083 | | 3.91% | | | 22,701,840 | | | 245,273 | | 4.30% | |
Total PPP loans | | | 363,083 | | | 6,447 | | 7.04% | | | 939,111 | | | 18,675 | | 7.89% | | | 2,189,696 | | | 22,031 | | 4.00% | |
Total loans held for investment | | | 23,808,419 | | | 236,784 | | 3.95% | | | 23,876,318 | | | 244,758 | | 4.07% | | | 24,891,536 | | | 267,304 | | 4.27% | |
Total interest-earning assets | | | 37,031,640 | | | 267,381 | | 2.86% | | | 36,218,437 | | | 271,449 | | 2.97% | | | 33,853,006 | | | 286,371 | | 3.37% | |
Noninterest-earning assets | | | 4,328,068 | | | | | | | | 4,375,329 | | | | | | | | 4,174,105 | | | | | | |
Total Assets | | $ | 41,359,708 | | | | | | | $ | 40,593,766 | | | | | | | $ | 38,027,111 | | | | | | |
| | | | | | | | | | | | | | | | | | | | | | | | | |
Interest-Bearing Liabilities: | | | | | | | | | | | | | | | | | | | | | | | | | |
Transaction and money market accounts | | $ | 16,492,540 | | $ | 2,230 | | 0.05% | | $ | 15,908,784 | | $ | 3,110 | | 0.08% | | $ | 14,038,057 | | $ | 6,675 | | 0.19% | |
Savings deposits | | | 3,267,366 | | | 135 | | 0.02% | | | 3,126,055 | | | 241 | | 0.03% | | | 2,667,211 | | | 505 | | 0.08% | |
Certificates and other time deposits | | | 2,889,741 | | | 2,756 | | 0.38% | | | 3,256,488 | | | 3,916 | | 0.48% | | | 3,805,708 | | | 6,047 | | 0.63% | |
Federal funds purchased | | | 493,776 | | | 107 | | 0.09% | | | 479,960 | | | 101 | | 0.08% | | | 366,071 | | | 80 | | 0.09% | |
Repurchase agreements | | | 390,212 | | | 150 | | 0.15% | | | 380,850 | | | 158 | | 0.16% | | | 388,386 | | | 355 | | 0.36% | |
Other borrowings | | | 326,921 | | | 3,899 | | 4.73% | | | 334,256 | | | 3,937 | | 4.67% | | | 876,781 | | | 7,161 | | 3.25% | |
Total interest-bearing liabilities | | | 23,860,556 | | | 9,277 | | 0.15% | | | 23,486,393 | | | 11,463 | | 0.19% | | | 22,142,214 | | | 20,823 | | 0.37% | |
Noninterest-bearing liabilities ("Non-IBL") | | | 12,704,738 | | | | | | | | 12,333,922 | | | | | | | | 11,277,541 | | | | | | |
Shareholders' equity | | | 4,794,414 | | | | | | | | 4,773,451 | | | | | | | | 4,607,356 | | | | | | |
Total Non-IBL and shareholders' equity | | | 17,499,152 | | | | | | | | 17,107,373 | | | | | | | | 15,884,897 | | | | | | |
Total Liabilities and Shareholders' Equity | | $ | 41,359,708 | | | | | | | $ | 40,593,766 | | | | | | | $ | 38,027,111 | | | | | | |
Net Interest Income and Margin (Non-Tax Equivalent) | | | | | $ | 258,104 | | 2.77% | | | | | $ | 259,986 | | 2.85% | | | | | $ | 265,548 | | 3.12% | |
Net Interest Margin (Tax Equivalent) | | | | | | | | 2.78% | | | | | | | | 2.86% | | | | | | | | 3.14% | |
Total Deposit Cost (without Debt and Other Borrowings) | | | | | | | | 0.06% | | | | | | | | 0.09% | | | | | | | | 0.17% | |
Overall Cost of Funds (including Demand Deposits) | | | | | | | | 0.10% | | | | | | | | 0.13% | | | | | | | | 0.26% | |
| | | | | | | | | | | | | | | | | | | | | | | | | |
Total Accretion on Acquired Loans (1) | | | | | $ | 7,707 | | | | | | | $ | 5,243 | | | | | | | $ | 12,686 | | | |
Total Deferred Fees on PPP Loans | | | | | $ | 5,655 | | | | | | | $ | 16,369 | | | | | | | $ | 16,614 | | | |
TEFRA (included in NIM, Tax Equivalent) | | | | | $ | 1,734 | | | | | | | $ | 1,477 | | | | | | | $ | 1,663 | | | |
(1) | The remaining loan discount on acquired loans to be accreted into loan interest income totals $68.0 million and the remaining net deferred fees on PPP loans totals $1.1 million as of December 31, 2021. |
6
Noninterest Income and Expense
| | Three Months Ended | | Twelve Months Ended | | |||||||||||||||||
| | Dec. 31, | | Sep. 30, | | Jun. 30, | | Mar. 31, | | Dec. 31, | | Dec. 31, | | Dec. 31, | | |||||||
(Dollars in thousands) | | 2021 | | 2021 | | 2021 | | 2021 | | 2020 | | 2021 | | 2020 | | |||||||
Noninterest Income: | | | | | | | | | | | | | | | | | | | | | | |
Fees on deposit accounts | | $ | 30,293 | | $ | 26,130 | | $ | 23,936 | | $ | 25,282 | | $ | 25,153 | | $ | 105,641 | | $ | 84,319 | |
Mortgage banking income | | | 12,044 | | | 15,560 | | | 10,115 | | | 26,880 | | | 25,162 | | | 64,599 | | | 106,202 | |
Trust and investment services income | | | 9,520 | | | 9,150 | | | 9,733 | | | 8,578 | | | 7,506 | | | 36,981 | | | 29,437 | |
Securities gains, net | | | 2 | | | 64 | | | 36 | | | — | | | 35 | | | 102 | | | 50 | |
Correspondent banking and capital market income | | | 30,216 | | | 25,164 | | | 25,877 | | | 28,748 | | | 27,751 | | | 110,005 | | | 64,743 | |
Bank owned life insurance income | | | 4,932 | | | 5,132 | | | 5,047 | | | 3,300 | | | 3,341 | | | 18,410 | | | 11,379 | |
Other | | | 4,887 | | | 5,810 | | | 4,276 | | | 3,498 | | | 8,923 | | | 18,471 | | | 15,010 | |
Total Noninterest Income | | $ | 91,894 | | $ | 87,010 | | $ | 79,020 | | $ | 96,286 | | $ | 97,871 | | $ | 354,209 | | $ | 311,140 | |
| | | | | | | | | | | | | | | | | | | | | | |
Noninterest Expense: | | | | | | | | | | | | | | | | | | | | | | |
Salaries and employee benefits | | $ | 137,321 | | $ | 136,969 | | $ | 137,379 | | $ | 140,361 | | $ | 138,982 | | $ | 552,030 | | $ | 416,599 | |
Swap termination expense | | | — | | | — | | | — | | | — | | | 38,787 | | | — | | | 38,787 | |
Occupancy expense | | | 22,915 | | | 23,135 | | | 22,844 | | | 23,331 | | | 23,496 | | | 92,225 | | | 75,587 | |
Information services expense | | | 18,489 | | | 18,061 | | | 19,078 | | | 18,789 | | | 19,527 | | | 74,417 | | | 59,843 | |
FHLB prepayment penalty | | | — | | | — | | | — | | | — | | | 56 | | | — | | | 255 | |
OREO and loan related expense | | | (740) | | | 1,527 | | | 240 | | | 1,002 | | | 728 | | | 2,029 | | | 3,568 | |
Business development and staff related | | | 4,577 | | | 4,424 | | | 4,305 | | | 3,371 | | | 3,835 | | | 16,677 | | | 10,125 | |
Amortization of intangibles | | | 8,517 | | | 8,543 | | | 8,968 | | | 9,164 | | | 9,760 | | | 35,192 | | | 26,992 | |
Professional fees | | | 2,639 | | | 2,415 | | | 2,301 | | | 3,274 | | | 4,306 | | | 10,629 | | | 14,033 | |
Supplies and printing expense | | | 2,179 | | | 2,310 | | | 2,500 | | | 2,670 | | | 2,809 | | | 9,659 | | | 8,679 | |
FDIC assessment and other regulatory charges | | | 4,965 | | | 4,245 | | | 4,931 | | | 3,841 | | | 3,403 | | | 17,982 | | | 10,713 | |
Advertising and marketing | | | 2,375 | | | 2,185 | | | 1,659 | | | 1,740 | | | 1,544 | | | 7,959 | | | 4,092 | |
Other operating expenses | | | 14,155 | | | 10,858 | | | 14,502 | | | 11,159 | | | 11,329 | | | 50,674 | | | 42,465 | |
Branch consolidation and merger expense | | | 6,645 | | | 17,618 | | | 32,970 | | | 10,009 | | | 19,836 | | | 67,242 | | | 85,906 | |
Extinguishment of debt cost | | | — | | | — | | | 11,706 | | | — | | | — | | | 11,706 | | | — | |
Total Noninterest Expense | | $ | 224,037 | | $ | 232,290 | | $ | 263,383 | | $ | 228,711 | | $ | 278,398 | | $ | 948,421 | | $ | 797,644 | |
7
Loans and Deposits
The following table presents a summary of the loan portfolio by type (dollars in thousands):
| | Ending Balance | | |||||||||||||
(Dollars in thousands) | | Dec. 31, | | Sep. 30, | | Jun. 30, | | Mar. 31, | | Dec. 31, | | |||||
LOAN PORTFOLIO | | 2021 | | 2021 | | 2021 | | 2021 | | 2020 | | |||||
Construction and land development * † | | $ | 2,029,216 | | $ | 2,032,731 | | $ | 1,947,646 | | $ | 1,888,240 | | $ | 1,890,846 | |
Investor commercial real estate* | | | 7,432,503 | | | 7,131,192 | | | 7,094,109 | | | 6,978,326 | | | 7,007,146 | |
Commercial owner occupied real estate | | | 4,970,116 | | | 4,988,490 | | | 4,895,189 | | | 4,817,346 | | | 4,832,697 | |
Commercial and industrial, excluding PPP | | | 3,516,485 | | | 3,458,520 | | | 3,121,625 | | | 3,140,893 | | | 3,112,848 | |
Consumer real estate * | | | 4,806,958 | | | 4,733,567 | | | 4,748,693 | | | 4,835,567 | | | 4,974,808 | |
Consumer/other | | | 928,240 | | | 943,243 | | | 907,181 | | | 885,320 | | | 912,327 | |
Total loans, excluding PPP | | | 23,683,518 | | | 23,287,743 | | | 22,714,443 | | | 22,545,692 | | | 22,730,672 | |
PPP loans | | | 244,648 | | | 501,206 | | | 1,318,635 | | | 1,945,773 | | | 1,933,462 | |
Total Loans | | $ | 23,928,166 | | $ | 23,788,949 | | $ | 24,033,078 | | $ | 24,491,465 | | $ | 24,664,134 | |
As a result of the conversion of legacy CenterState’s core system to the Company’s core system completed in 2Q 2021, several loans were reclassified to conform with the Company’s loan segmentation, most notably residential investment loans which were reclassed from consumer real estate to investor commercial real estate. All periods prior to 2Q 2021 presented above were revised to conform with the current loan segmentation.
* Single family home construction-to-permanent loans originated by the Company’s mortgage banking division are included in construction and land development category until completion. Investor commercial real estate loans include commercial non-owner occupied real estate and other income producing property. Consumer real estate includes consumer owner occupied real estate and home equity loans.
† Includes single family home construction-to-permanent loans of $686.5 million, $665.0 million, $599.4 million, $559.5 million, and $635.8 million, for the quarters ended December 31, 2021, September 30, 2021, June 30, 2021, March 31, 2021, and December 31, 2020, respectively.
| | Ending Balance | | |||||||||||||
(Dollars in thousands) | | Dec. 31, | | Sep. 30, | | Jun. 30, | | Mar. 31, | | Dec. 31, | | |||||
DEPOSITS | | 2021 | | 2021 | | 2021 | | 2021 | | 2020 | | |||||
Noninterest-bearing checking | | $ | 11,498,840 | | $ | 11,333,881 | | $ | 11,176,338 | | $ | 10,801,812 | | $ | 9,711,338 | |
Interest-bearing checking | | | 9,018,987 | | | 7,920,236 | | | 7,651,433 | | | 7,369,066 | | | 6,955,575 | |
Savings | | | 3,350,547 | | | 3,201,543 | | | 3,051,229 | | | 2,906,673 | | | 2,694,010 | |
Money market | | | 8,376,380 | | | 8,110,162 | | | 8,024,117 | | | 7,884,132 | | | 7,584,353 | |
Time deposits | | | 2,810,075 | | | 2,994,736 | | | 3,339,252 | | | 3,479,727 | | | 3,748,605 | |
Total Deposits | | $ | 35,054,829 | | $ | 33,560,558 | | $ | 33,242,369 | | $ | 32,441,410 | | $ | 30,693,881 | |
| | | | | | | | | | | | | | | | |
Core Deposits (excludes Time Deposits) | | $ | 32,244,754 | | $ | 30,565,822 | | $ | 29,903,117 | | $ | 28,961,683 | | $ | 26,945,276 | |
8
Asset Quality
| | Ending Balance | | |||||||||||||
| | Dec. 31, | | Sep. 30, | | Jun. 30, | | Mar. 31, | | Dec. 31, | | |||||
(Dollars in thousands) | | 2021 | | 2021 | | 2021 | | 2021 | | 2020 | | |||||
NONPERFORMING ASSETS: | | | | | | | | | | | | | | | | |
Non-acquired | | | | | | | | | | | | | | | | |
Non-acquired nonperforming loans | | $ | 23,312 | | $ | 25,529 | | $ | 16,624 | | $ | 21,034 | | $ | 29,171 | |
Non-acquired OREO and other nonperforming assets | | | 590 | | | 365 | | | 695 | | | 654 | | | 688 | |
Total non-acquired nonperforming assets | | | 23,902 | | | 25,894 | | | 17,319 | | | 21,688 | | | 29,859 | |
Acquired | | | | | | | | | | | | | | | | |
Acquired nonperforming loans | | | 56,969 | | | 64,672 | | | 69,053 | | | 80,024 | | | 77,668 | |
Acquired OREO and other nonperforming assets | | | 2,875 | | | 3,804 | | | 4,777 | | | 11,292 | | | 11,568 | |
Total acquired nonperforming assets | | | 59,844 | | | 68,476 | | | 73,830 | | | 91,316 | | | 89,236 | |
Total nonperforming assets | | $ | 83,746 | | $ | 94,370 | | $ | 91,149 | | $ | 113,004 | | $ | 119,095 | |
| | Three Months Ended | | |||||||||||||
| | Dec. 31, | | Sep. 30, | | Jun. 30, | | Mar. 31, | | Dec. 31, | | |||||
| | 2021 | | 2021 | | 2021 | | 2021 | | 2020 | | |||||
ASSET QUALITY RATIOS: | | | | | | | | | | | | | | | | |
Allowance for credit losses as a percentage of loans | | | 1.26% | | | 1.32% | | | 1.46% | | | 1.66% | | | 1.85% | |
Allowance for credit losses as a percentage of loans, excluding PPP loans | | | 1.27% | | | 1.35% | | | 1.54% | | | 1.80% | | | 2.01% | |
Allowance for credit losses as a percentage of nonperforming loans | | | 375.94% | | | 348.27% | | | 408.98% | | | 402.20% | | | 428.04% | |
Net charge-offs (recoveries) as a percentage of average loans (annualized) | | | 0.02% | | | 0.00% | | | 0.03% | | | (0.00)% | | | 0.01% | |
Total nonperforming assets as a percentage of total assets | | | 0.20% | | | 0.23% | | | 0.23% | | | 0.28% | | | 0.32% | |
Nonperforming loans as a percentage of period end loans | | | 0.34% | | | 0.38% | | | 0.36% | | | 0.41% | | | 0.43% | |
Current Expected Credit Losses (“CECL”)
Below is a table showing the roll forward of the ACL and UFC for the fourth quarter of 2021:
| | Allowance for Credit Losses ("ACL and UFC") | | ||||||||||
| | NonPCD ACL | | PCD ACL | | Total | | UFC | | ||||
Ending Balance 9/30/2021 | | $ | 221,381 | | $ | 92,763 | | $ | 314,144 | | $ | 28,289 | |
Charge offs | | | (3,138) | | | — | | | (3,138) | | | — | |
Acquired charge offs | | | (380) | | | (498) | | | (878) | | | — | |
Recoveries | | | 1,385 | | | — | | | 1,385 | | | — | |
Acquired recoveries | | | 460 | | | 1,211 | | | 1,671 | | | — | |
Provision (recovery) for credit losses | | | 5,519 | | | (16,896) | | | (11,377) | | | 2,221 | |
Ending balance 12/31/2021 | | $ | 225,227 | | $ | 76,580 | | $ | 301,807 | | $ | 30,510 | |
| | | | | | | | | | | | | |
Period end loans (includes PPP Loans) | | $ | 21,940,844 | | $ | 1,987,322 | | $ | 23,928,166 | | | N/A | |
Reserve to Loans (includes PPP Loans) | | | 1.03% | | | 3.85% | | | 1.26% | | | N/A | |
Period end loans (excludes PPP Loans) | | $ | 21,696,196 | | $ | 1,987,322 | | $ | 23,683,518 | | | N/A | |
Reserve to Loans (excludes PPP Loans) | | | 1.04% | | | 3.85% | | | 1.27% | | | N/A | |
Unfunded commitments (off balance sheet) * | | | | | | | | | | | $ | 5,787,524 | |
Reserve to unfunded commitments (off balance sheet) | | | | | | | | | | | | 0.53% | |
* Unfunded commitments exclude unconditionally cancelable commitments and letters of credit.
Conference Call
The Company will host a conference call to discuss its fourth quarter results at 10:00 a.m. Eastern Time on January 25, 2022. Management from Atlantic Capital Bancshares, Inc. will participate in this call to provide some commentary on its financial results for the quarter. Callers wishing to participate may call toll-free by dialing 844-200-6205. The number for international participants is (929) 526-1599. The conference ID number is 642852. Alternatively, individuals may listen to the live webcast of the presentation by visiting SouthStateBank.com. An audio replay of the live webcast is expected to be available by the evening of January 25, 2022 on the Investor Relations section of SouthStateBank.com.
SouthState Corporation is a financial services company headquartered in Winter Haven, Florida. SouthState Bank, N.A., the Company’s nationally chartered bank subsidiary, provides consumer, commercial, mortgage and wealth management solutions to more than one million customers throughout Florida, Alabama, Georgia, the Carolinas and Virginia. The Bank also serves clients coast to coast through its correspondent banking division. Additional information is available at SouthStateBank.com.
9
###
Non-GAAP Measures
Statements included in this press release include non-GAAP measures and should be read along with the accompanying tables that provide a reconciliation of non-GAAP measures to GAAP measures. Management believes that these non-GAAP measures provide additional useful information, which allows readers to evaluate the ongoing performance of the Company. Non-GAAP measures should not be considered as an alternative to any measure of performance or financial condition as promulgated under GAAP, and investors should consider the company's performance and financial condition as reported under GAAP and all other relevant information when assessing the performance or financial condition of the company. Non-GAAP measures have limitations as analytical tools, and investors should not consider them in isolation or as a substitute for analysis of the company's results or financial condition as reported under GAAP.
(Dollars in thousands) | | | | | | | | | | | | | | | | | | | | |
PRE-PROVISION NET REVENUE ("PPNR") (NON-GAAP) | | Dec. 31, 2021 | | | Sep. 30, 2021 | | | Jun. 30, 2021 | | | Mar. 31, 2021 | | | Dec. 31, 2020 | | |||||
Net income (GAAP) | | $ | 106,846 | | | $ | 122,788 | | | $ | 98,960 | | | $ | 146,949 | | | $ | 86,236 | |
(Recovery) provision for credit losses | | | (9,157) | | | | (38,903) | | | | (58,793) | | | | (58,420) | | | | 18,185 | |
Tax provision (benefit) | | | 28,272 | | | | 30,821 | | | | 28,600 | | | | 41,043 | | | | (19,401) | |
Merger-related costs | | | 6,645 | | | | 17,618 | | | | 32,970 | | | | 10,009 | | | | 19,836 | |
Extinguishment of debt costs | | | — | | | | — | | | | 11,706 | | | | — | | | | — | |
Securities gains | | | (2) | | | | (64) | | | | (36) | | | | — | | | | (35) | |
FHLB advance prepayment cost | | | — | | | | — | | | | — | | | | — | | | | 56 | |
Swap termination cost | | | — | | | | — | | | | — | | | | — | | | | 38,787 | |
Pre-provision net revenue (PPNR) (Non-GAAP) | | $ | 132,604 | | | $ | 132,260 | | | $ | 113,407 | | | $ | 139,581 | | | $ | 143,664 | |
| | | | | | | | | | | | | | | | | | | | |
Average asset balance (GAAP) | | $ | 41,359,708 | | | $ | 40,593,766 | | | $ | 39,832,752 | | | $ | 38,245,410 | | | $ | 38,027,111 | |
| | | | | | | | | | | | | | | | | | | | |
PPNR ROAA | | | 1.27 | % | | | 1.29 | % | | | 1.14 | % | | | 1.48 | % | | | 1.50 | % |
(Dollars in thousands) | | | | | | | | | | | | | | | | | | | | |
CORE NET INTEREST INCOME (NON-GAAP) | | Dec. 31, 2021 | | | Sep. 30, 2021 | | | Jun. 30, 2021 | | | Mar. 31, 2021 | | | Dec. 31, 2020 | | |||||
Net interest income (GAAP) | | $ | 258,104 | | | $ | 259,986 | | | $ | 253,130 | | | $ | 261,998 | | | $ | 265,547 | |
Less: | | | | | | | | | | | | | | | | | | | | |
Total accretion on acquired loans | | | 7,707 | | | | 5,243 | | | | 6,292 | | | | 10,416 | | | | 12,686 | |
Total deferred fees on PPP loans | | | 5,655 | | | | 16,369 | | | | 14,232 | | | | 20,402 | | | | 16,614 | |
Core net interest income (Non-GAAP) | | $ | 244,742 | | | $ | 238,374 | | | $ | 232,606 | | | $ | 231,180 | | | $ | 236,247 | |
10
| | Three Months Ended | | | Twelve Months Ended | | ||||||||||||||||||||||
(Dollars in thousands, except per share data) | | Dec. 31, | | | Sep. 30, | | | Jun. 30, | | | Mar. 31, | | | Dec. 31, | | | Dec. 31, | | | Dec. 31, | | |||||||
RECONCILIATION OF GAAP TO NON-GAAP | | 2021 | | | 2021 | | | 2021 | | | 2021 | | | 2020 | | | 2021 | | | 2020 | | |||||||
Adjusted Net Income (non-GAAP) (2) | | | | | | | | | | | | | | | | | | | | | | | | | | | | |
Net income (GAAP) | | $ | 106,846 | | | $ | 122,788 | | | $ | 98,960 | | | $ | 146,949 | | | $ | 86,236 | | | $ | 475,543 | | | $ | 120,632 | |
Securities gains, net of tax | | | (2) | | | | (51) | | | | (28) | | | | — | | | | (29) | | | | (81) | | | | (41) | |
PCL - NonPCD loans and unfunded commitments | | | — | | | | — | | | | — | | | | — | | | | — | | | | — | | | | 92,212 | |
Pension plan termination expense, net of tax | | | — | | | | — | | | | — | | | | — | | | | — | | | | — | | | | — | |
Swap termination expense, net of tax | | | — | | | | — | | | | — | | | | — | | | | 31,784 | | | | — | | | | 31,784 | |
Benefit for income taxes - carryback tax loss | | | — | | | | — | | | | — | | | | — | | | | (31,468) | | | | — | | | | (31,468) | |
FHLB prepayment penalty, net of tax | | | — | | | | — | | | | — | | | | — | | | | 46 | | | | — | | | | 200 | |
Merger and branch consolidation/acq. expense, net of tax | | | 5,255 | | | | 14,083 | | | | 25,578 | | | | 7,824 | | | | 16,255 | | | | 52,740 | | | | 68,369 | |
Extinguishment of debt cost, net of tax | | | — | | | | — | | | | 9,081 | | | | — | | | | — | | | | 9,081 | | | | — | |
Adjusted net income (non-GAAP) | | $ | 112,099 | | | $ | 136,820 | | | $ | 133,591 | | | $ | 154,773 | | | $ | 102,824 | | | $ | 537,283 | | | $ | 281,688 | |
| | | | | | | | | | | | | | | | | | | | | | | | | | | | |
Adjusted Net Income per Common Share - Basic (2) | | | | | | | | | | | | | | | | | | | | | | | | | | | | |
Earnings per common share - Basic (GAAP) | | $ | 1.53 | | | $ | 1.75 | | | $ | 1.40 | | | $ | 2.07 | | | $ | 1.22 | | | $ | 6.76 | | | $ | 2.20 | |
Effect to adjust for securities gains | | | — | | | | (0.00) | | | | (0.00) | | | | — | | | | (0.00) | | | | (0.00) | | | | (0.00) | |
Effect to adjust for PCL - NonPCD loans and unfunded commitments | | | — | | | | — | | | | — | | | | — | | | | — | | | | — | | | | 1.68 | |
Effect to adjust for swap termination expense, net of tax | | | — | | | | — | | | | — | | | | — | | | | 0.45 | | | | — | | | | 0.58 | |
Effect to adjust for benefit for income taxes - carryback tax loss | | | — | | | | — | | | | — | | | | — | | | | (0.44) | | | | — | | | | (0.57) | |
Effect to adjust for FHLB prepayment penalty, net of tax | | | — | | | | — | | | | — | | | | — | | | | 0.00 | | | | — | | | | 0.00 | |
Effect to adjust for merger and branch consol./acq expenses, net of tax | | | 0.08 | | | | 0.20 | | | | 0.36 | | | | 0.11 | | | | 0.23 | | | | 0.75 | | | | 1.25 | |
Effect to adjust for extinguishment of debt cost | | | — | | | | — | | | | 0.13 | | | | — | | | | — | | | | 0.12 | | | | — | |
Adjusted net income per common share - Basic (non-GAAP) | | $ | 1.61 | | | $ | 1.95 | | | $ | 1.89 | | | $ | 2.18 | | | $ | 1.45 | | | $ | 7.63 | | | $ | 5.14 | |
| | | | | | | | | | | | | | | | | | | | | | | | | | | | |
Adjusted Net Income per Common Share - Diluted (2) | | | | | | | | | | | | | | | | | | | | | | | | | | | | |
Earnings per common share - Diluted (GAAP) | | $ | 1.52 | | | $ | 1.74 | | | $ | 1.39 | | | $ | 2.06 | | | $ | 1.21 | | | $ | 6.71 | | | $ | 2.19 | |
Effect to adjust for securities gains | | | — | | | | (0.00) | | | | (0.00) | | | | — | | | | (0.00) | | | | (0.00) | | | | (0.00) | |
Effect to adjust for PCL - NonPCD loans and unfunded commitments | | | — | | | | — | | | | — | | | | — | | | | — | | | | — | | | | 1.67 | |
Effect to adjust for swap termination expense, net of tax | | | — | | | | — | | | | — | | | | — | | | | 0.45 | | | | — | | | | 0.58 | |
Effect to adjust for benefit for income taxes - carryback tax loss | | | — | | | | — | | | | — | | | | — | | | | (0.44) | | | | — | | | | (0.57) | |
Effect to adjust for FHLB prepayment penalty, net of tax | | | — | | | | — | | | | — | | | | — | | | | 0.00 | | | | — | | | | 0.00 | |
Effect to adjust for merger and branch consol./acq expenses, net of tax | | | 0.07 | | | | 0.20 | | | | 0.35 | | | | 0.11 | | | | 0.23 | | | | 0.74 | | | | 1.25 | |
Effect to adjust for extinguishment of debt cost | | | — | | | | — | | | | 0.13 | | | | — | | | | — | | | | 0.13 | | | | — | |
Adjusted net income per common share - Diluted (non-GAAP) | | $ | 1.59 | | | $ | 1.94 | | | $ | 1.87 | | | $ | 2.17 | | | $ | 1.44 | | | $ | 7.58 | | | $ | 5.12 | |
| | | | | | | | | | | | | | | | | | | | | | | | | | | | |
Adjusted Return on Average Assets (2) | | | | | | | | | | | | | | | | | | | | | | | | | | | | |
Return on average assets (GAAP) | | | 1.02 | % | | | 1.20 | % | | | 1.00 | % | | | 1.56 | % | | | 0.90 | % | | | 1.19 | % | | | 0.42 | % |
Effect to adjust for securities gains | | | (0.00) | % | | | (0.00) | % | | | (0.00) | % | | | — | % | | | (0.00) | % | | | (0.00) | % | | | (0.00) | % |
Effect to adjust for PCL - NonPCD loans and unfunded commitments | | | — | % | | | — | % | | | — | % | | | — | % | | | — | % | | | — | % | | | 0.32 | % |
Effect to adjust for swap termination expense | | | — | % | | | — | % | | | — | % | | | — | % | | | 0.33 | % | | | — | % | | | 0.12 | % |
Effect to adjust for benefit for income taxes - carryback tax loss | | | — | % | | | — | % | | | — | % | | | — | % | | | (0.33) | % | | | — | % | | | (0.11) | % |
Effect to adjust for FHLB prepayment penalty, net of tax | | | — | % | | | — | % | | | — | % | | | — | % | | | 0.00 | % | | | — | % | | | 0.00 | % |
Effect to adjust for merger and branch consol./acq expenses, net of tax | | | 0.06 | % | | | 0.14 | % | | | 0.26 | % | | | 0.08 | % | | | 0.18 | % | | | 0.13 | % | | | 0.23 | % |
Effect to adjust for extinguishment of debt cost | | | — | % | | | — | % | | | 0.09 | % | | | — | % | | | — | % | | | 0.02 | % | | | — | % |
Adjusted return on average assets (non-GAAP) | | | 1.08 | % | | | 1.34 | % | | | 1.35 | % | | | 1.64 | % | | | 1.08 | % | | | 1.34 | % | | | 0.98 | % |
| | | | | | | | | | | | | | | | | | | | | | | | | | | | |
Adjusted Return on Average Common Equity (2) | | | | | | | | | | | | | | | | | | | | | | | | | | | | |
Return on average common equity (GAAP) | | | 8.84 | % | | | 10.21 | % | | | 8.38 | % | | | 12.71 | % | | | 7.45 | % | | | 10.01 | % | | | 3.35 | % |
Effect to adjust for securities gains | | | (0.00) | % | | | (0.00) | % | | | (0.00) | % | | | — | % | | | (0.00) | % | | | (0.00) | % | | | (0.00) | % |
Effect to adjust for PCL - NonPCD loans and unfunded commitments | | | — | % | | | — | % | | | — | % | | | — | % | | | — | % | | | — | % | | | 2.56 | % |
Effect to adjust for swap termination expense | | | — | % | | | — | % | | | — | % | | | — | % | | | 2.74 | % | | | — | % | | | 0.88 | % |
Effect to adjust for benefit for income taxes - carryback tax loss | | | — | % | | | — | % | | | — | % | | | — | % | | | (2.72) | % | | | — | % | | | (0.87) | % |
Effect to adjust for FHLB prepayment penalty, net of tax | | | — | % | | | — | % | | | — | % | | | — | % | | | (0.00) | % | | | — | % | | | 0.01 | % |
Effect to adjust for merger and branch consol./acq expenses, net of tax | | | 0.44 | % | | | 1.16 | % | | | 2.16 | % | | | 0.68 | % | | | 1.41 | % | | | 1.11 | % | | | 1.88 | % |
Effect to adjust for extinguishment of debt cost | | | — | % | | | — | % | | | 0.77 | % | | | — | % | | | — | | | | 0.19 | % | | | — | % |
Adjusted return on average common equity (non-GAAP) | | | 9.28 | % | | | 11.37 | % | | | 11.31 | % | | | 13.39 | % | | | 8.88 | % | | | 11.31 | % | | | 7.81 | % |
| | | | | | | | | | | | | | | | | | | | | | | | | | | | |
Adjusted Return on Average Common Tangible Equity (2) (3) | | | | | | | | | | | | | | | | | | | | | | | | | | | | |
Return on average common equity (GAAP) | | | 8.84 | % | | | 10.21 | % | | | 8.38 | % | | | 12.71 | % | | | 7.45 | % | | | 10.01 | % | | | 3.35 | % |
Effect to adjust for securities gains | | | (0.00) | % | | | (0.00) | % | | | (0.00) | % | | | — | % | | | (0.00) | % | | | (0.00) | % | | | (0.00) | % |
Effect to adjust for PCL - NonPCD loans and unfunded commitments | | | — | % | | | — | % | | | — | % | | | — | % | | | — | % | | | — | % | | | 2.56 | % |
Effect to adjust for swap termination expense | | | — | % | | | — | % | | | — | % | | | — | % | | | 2.74 | % | | | — | % | | | 3.51 | % |
Effect to adjust for benefit for income taxes - carryback tax loss | | | — | % | | | — | % | | | — | % | | | — | % | | | (2.72) | % | | | — | % | | | (0.87) | % |
Effect to adjust for FHLB prepayment penalty, net of tax | | | — | % | | | — | % | | | — | % | | | — | % | | | — | % | | | — | % | | | 0.01 | % |
Effect to adjust for merger and branch consol./acq expenses, net of tax | | | 0.43 | % | | | 1.17 | % | | | 2.16 | % | | | 0.68 | % | | | 1.40 | % | | | 1.11 | % | | | 1.90 | % |
Effect to adjust for extinguishment of debt cost | | | — | % | | | — | % | | | 0.77 | % | | | — | % | | | — | | | | 0.19 | % | | | — | % |
Effect to adjust for intangible assets | | | 6.03 | % | | | 7.30 | % | | | 7.43 | % | | | 8.85 | % | | | 6.48 | % | | | 7.37 | % | | | 3.68 | % |
Adjusted return on average common tangible equity (non-GAAP) | | | 15.30 | % | | | 18.68 | % | | | 18.74 | % | | | 22.24 | % | | | 15.35 | % | | | 18.68 | % | | | 14.14 | % |
11
| | Three Months Ended | | | Twelve Months Ended | | ||||||||||||||||||||||
(Dollars in thousands, except per share data) | | Dec. 31, | | | Sep. 30, | | | Jun. 30, | | | Mar. 31, | | | Dec. 31, | | | Dec. 31, | | | Dec. 31, | | |||||||
RECONCILIATION OF GAAP TO NON-GAAP | | 2021 | | | 2021 | | | 2021 | | | 2021 | | | 2020 | | | 2021 | | | 2020 | | |||||||
Adjusted Efficiency Ratio (4) | | | | | | | | | | | | | | | | | | | | | | | | | | | | |
Efficiency ratio | | | 61.27 | % | | | 64.22 | % | | | 76.28 | % | | | 61.06 | % | | | 73.59 | % | | | 65.55 | % | | | 67.47 | % |
Effect to adjust for merger and branch consolidation related expenses | | | (1.89) | % | | | (5.06) | % | | | (13.38) | % | | | (2.79) | % | | | (16.07) | % | | | (5.67) | % | | | (10.94) | % |
Adjusted efficiency ratio | | | 59.38 | % | | | 59.16 | % | | | 62.88 | % | | | 58.26 | % | | | 57.52 | % | | | 59.88 | % | | | 56.53 | % |
| | | | | | | | | | | | | | | | | | | | | | | | | | | | |
Tangible Book Value Per Common Share (3) | | | | | | | | | | | | | | | | | | | | | | | | | | | | |
Book value per common share (GAAP) | | $ | 69.27 | | | $ | 68.55 | | | $ | 67.60 | | | $ | 66.42 | | | $ | 65.49 | | | | | | | | | |
Effect to adjust for intangible assets | | | (24.65) | | | | (24.57) | | | | (24.53) | | | | (24.40) | | | | (24.33) | | | | | | | | | |
Tangible book value per common share (non-GAAP) | | $ | 44.62 | | | $ | 43.98 | | | $ | 43.07 | | | $ | 42.02 | | | $ | 41.16 | | | | | | | | | |
| | | | | | | | | | | | | | | | | | | | | | | | | | | | |
Tangible Equity-to-Tangible Assets (3) | | | | | | | | | | | | | | | | | | | | | | | | | | | | |
Equity-to-assets (GAAP) | | | 11.45 | % | | | 11.72 | % | | | 11.78 | % | | | 11.88 | % | | | 12.30 | % | | | | | | | | |
Effect to adjust for intangible assets | | | (3.76) | % | | | (3.87) | % | | | (3.94) | % | | | (4.02) | % | | | (4.20) | % | | | | | | | | |
Tangible equity-to-tangible assets (non-GAAP) | | | 7.69 | % | | | 7.85 | % | | | 7.84 | % | | | 7.86 | % | | | 8.10 | % | | | | | | | | |
Certain prior period information has been reclassified to conform to the current period presentation, and these reclassifications had no impact on net income or equity as previously reported.
Footnotes to tables:
(1) | Includes loan accretion (interest) income related to the discount on acquired loans of $7.7 million, $5.2 million, $6.3 million, $10.4 million, and $12.7 million, respectively, during the five quarters above. |
(2) | Adjusted earnings, adjusted return on average assets, adjusted EPS, and adjusted return on average equity are non-GAAP measures and exclude the gains or losses on sales of securities, FHLB Advances prepayment penalty, initial provision for credit losses on non-PCD loans and unfunded commitments, income tax benefit related to the carryback of tax losses under the CARES Act, swap termination expense, extinguishment of debt cost and merger and branch consolidation related expense. Management believes that non-GAAP adjusted measures provide additional useful information that allows readers to evaluate the ongoing performance of the company. Non-GAAP measures should not be considered as an alternative to any measure of performance or financial condition as promulgated under GAAP, and investors should consider the company's performance and financial condition as reported under GAAP and all other relevant information when assessing the performance or financial condition of the company. Non-GAAP measures have limitations as analytical tools, and investors should not consider them in isolation or as a substitute for analysis of the company's results or financial condition as reported under GAAP. Adjusted earnings and the related adjusted return measures (non-GAAP) exclude the following from net income (GAAP) on an after-tax basis: (a) pre-tax merger and branch consolidation related expense of $6.6 million, $17.6 million, $33.0 million, $10.0 million, and $19.8 million for the quarters ended December 31, 2021, September 30, 2021, June 30, 2021, March 31, 2021, and December 31, 2020, respectively; (b) net securities gains of $2,000, $64,000, $36,000, and $35,000 for the quarters ended December 31, 2021, September 30, 2021, June 30, 2021, and December 31, 2020, respectively; (c) FHLB prepayment penalty of $56,000 for the quarter ended December 31, 2020; and (d) swap termination expense of $38.8 million for the quarter ended December 31, 2020; (e) tax carryback losses under the CARES Act of $31.5 million for the quarter ended December 31, 2020. |
(3) | The tangible measures are non-GAAP measures and exclude the effect of period end or average balance of intangible assets. The tangible returns on equity and common equity measures also add back the after-tax amortization of intangibles to GAAP basis net income. Management believes that these non-GAAP tangible measures provide additional useful information, particularly since these measures are widely used by industry analysts for companies with prior merger and acquisition activities. Non-GAAP measures should not be considered as an alternative to any measure of performance or financial condition as promulgated under GAAP, and investors should consider the company's performance and financial condition as reported under GAAP and all other relevant information when assessing the performance or financial condition of the company. Non-GAAP measures have limitations as analytical tools, and investors should not consider them in isolation or as a substitute for analysis of the company's results or financial condition as reported under GAAP. The sections titled "Reconciliation of Non-GAAP to GAAP" provide tables that reconcile non-GAAP measures to GAAP. |
(4) | Adjusted efficiency ratio is calculated by taking the noninterest expense excluding swap termination expense, branch consolidation cost and merger cost, extinguishment of debt cost, tax carryback losses under the CARES Act, amortization of intangible assets, and the FHLB prepayment penalty divided by net interest income and noninterest income excluding securities gains (losses). The pre-tax amortization expenses of intangible assets were $8.5 million, $8.5 million, $9.0 million, $9.2 million, and $9.8 million, for the quarters ended December 31, 2021, September 30, 2021, June 30, 2021, March 31, 2021, and December 31, 2020, respectively. |
(5) | The dividend payout ratio is calculated by dividing total dividends paid during the period by the total net income for the same period. |
(6) | December 31, 2021 ratios are estimated and may be subject to change pending the final filing of the FR Y-9C; all other periods are presented as filed. |
(7) | Loan data excludes mortgage loans held for sale. |
12
Cautionary Statement Regarding Forward Looking Statements
Statements included in this communication, which are not historical in nature are intended to be, and are hereby identified as, forward-looking statements for purposes of the safe harbor provided by Section 27A of the Securities Act of 1933 and Section 21E of the Securities Exchange Act of 1934. Forward-looking statements are based on, among other things, management’s beliefs, assumptions, current expectations, estimates and projections about the financial services industry, the economy and SouthState. Words and phrases such as “may,” “approximately,” “continue,” “should,” “expects,” “projects,” “anticipates,” “is likely,” “look ahead,” “look forward,” “believes,” “will,” “intends,” “estimates,” “strategy,” “plan,” “could,” “potential,” “possible” and variations of such words and similar expressions are intended to identify such forward-looking statements. SouthState cautions readers that forward-looking statements are subject to certain risks, uncertainties and assumptions that are difficult to predict with regard to, among other things, timing, extent, likelihood and degree of occurrence, which could cause actual results to differ materially from anticipated results. Such risks, uncertainties and assumptions, include, among others, the following: (1) economic downturn risk, potentially resulting in deterioration in the credit markets, greater than expected noninterest expenses, excessive loan losses and other negative consequences, which risks could be exacerbated by potential continued negative economic developments resulting from the Covid19 pandemic, or from federal spending cuts and/or one or more federal budget-related impasses or actions; (2) interest rate risk primarily resulting from the low interest rate environment, potentially rising interest rates, and their impact on the Bank’s earnings, including from the correspondent and mortgage divisions, housing demand, the market value of the bank’s loan and securities portfolios, and the market value of SouthState’s equity; (3) risks related to the merger and integration of SouthState and CSFL including, among others, (i) the risk that the cost savings and any revenue synergies from the merger may not be fully realized or may take longer than anticipated to be realized, (ii) the risk that the integration of each party’s operations will be materially delayed or will be more costly or difficult than expected or that the parties are otherwise unable to successfully integrate each party’s businesses into the other’s businesses, (iii) the amount of the costs, fees, expenses and charges related to the merger, (iv) reputational risk and the reaction of each company's customers, suppliers, employees or other business partners to the merger, (4) risks related to the merger and integration of SouthState and Atlantic Capital including, among others, (i) the risk that the cost savings and any revenue synergies from the merger may not be fully realized or may take longer than anticipated to be realized, (ii) disruption to the parties’ businesses as a result of the announcement and pendency of the merger, (iii) the occurrence of any event, change or other circumstances that could give rise to the termination of the merger agreement, (iv) the risk that the integration of each party’s operations will be materially delayed or will be more costly or difficult than expected or that the parties are otherwise unable to successfully integrate each party’s businesses into the other’s businesses, (v) the amount of the costs, fees, expenses and charges related to the merger, (vi) the ability by each of SouthState and Atlantic Capital to obtain required governmental approvals of the merger (and the risk that such approvals may result in the imposition of conditions that could adversely affect the combined company or the expected benefits of the transaction), (vii) reputational risk and the reaction of each company's customers, suppliers, employees or other business partners to the merger, (viii) the failure of the closing conditions in the merger agreement to be satisfied, or any unexpected delay in closing the merger, (ix) the possibility that the merger may be more expensive to complete than anticipated, including as a result of unexpected factors or events, (x) the dilution caused by SouthState’s issuance of additional shares of its common stock in the merger, (xi) general competitive, economic, political and market conditions, and (xii) other factors that may affect future results of Atlantic Capital and SouthState including changes in asset quality and credit risk; the inability to sustain revenue and earnings growth; changes in interest rates and capital markets; inflation; customer borrowing, repayment, investment and deposit practices; the impact, extent and timing of technological changes; capital management activities; and other actions of the Board of Governors of the Federal Reserve System and Office of the Comptroller of the Currency and legislative and regulatory actions and reforms (5) risks relating to the continued impact of the Covid19 pandemic on the company, including possible impact to the company and its employees from contacting Covid19, and to efficiencies and the control environment due to the continued work from home environment and to our results of operations due to government stimulus and other interventions to blunt the impact of the pandemic; (6) the impact of increasing digitization of the banking industry and movement of customers to on-line platforms, and the possible impact on the Bank’s results of operations, customer base, expenses, suppliers and operations; (7) controls and procedures risk, including the potential failure or circumvention of our controls and procedures or failure to comply with regulations related to controls and procedures; (8) potential deterioration in real estate values; (9) the impact of competition with other financial institutions, including pricing pressures (including those resulting from the CARES Act) and the resulting impact, including as a result of compression to net interest margin; (10) risks relating to the ability to retain our culture and attract and retain qualified people; (11) credit risks associated with an obligor’s failure to meet the terms of any contract with the bank or otherwise fail to perform as agreed under the terms of any loan-related document; (12) risks related to the ability of the company to pursue its strategic plans which depend upon certain growth goals in our lines of business; (13) liquidity risk affecting the Bank’s ability to meet its obligations when they come due; (14) risks associated with an anticipated increase in SouthState’s investment securities portfolio, including risks associated with acquiring and holding investment securities or potentially determining that the amount of investment securities SouthState desires to acquire are not available on terms acceptable to SouthState; (15) price risk focusing on changes in market factors that may affect the value of traded instruments in “mark-to-market” portfolios; (16) transaction risk arising from problems with service or product delivery; (17) compliance risk involving risk to earnings or capital resulting from violations of or nonconformance with laws, rules, regulations, prescribed practices, or ethical standards; (18) regulatory change risk resulting from new laws, rules, regulations, accounting principles, proscribed practices or ethical standards, including, without limitation, the possibility that regulatory agencies may require higher levels of capital above the current regulatory-mandated minimums and including the impact of the CARES Act, the Consumer Financial Protection Bureau regulations, and the possibility of changes in accounting standards, policies, principles and practices, including changes in accounting principles relating to loan loss recognition (CECL); (19) strategic risk resulting from adverse business decisions or improper implementation of business decisions; (20) reputation risk that adversely affects earnings or capital arising from negative public opinion; (21) cybersecurity risk related to the dependence of SouthState on internal computer systems and the technology of outside service providers, as well as the potential impacts of internal or external security breaches, which may subject the company to potential business disruptions or financial losses resulting from deliberate attacks or unintentional events; (22) reputational and operational risks associated with environment, social and governance matters; (23) greater than expected noninterest expenses; (24) excessive loan losses; (25) potential deposit attrition, higher than expected costs, customer loss and business disruption associated with the Atlantic Capital integration, and potential difficulties in maintaining relationships with key personnel; (26) the risks of fluctuations in market prices for SouthState common stock that may or may not reflect economic condition or performance of SouthState; (27) the payment of dividends on SouthState
13
common stock, which is subject to legal and regulatory limitations as well as the discretion of the board of directors of SouthState, SouthState’s performance and other factors; (28) ownership dilution risk associated with potential acquisitions in which SouthState’s stock may be issued as consideration for an acquired company; (29) operational, technological, cultural, regulatory, legal, credit and other risks associated with the exploration, consummation and integration of potential future acquisition, whether involving stock or cash consideration; (30) major catastrophes such as hurricanes, tornados, earthquakes, floods or other natural or human disasters, including infectious disease outbreaks, including the ongoing Covid19 pandemic, and the related disruption to local, regional and global economic activity and financial markets, and the impact that any of the foregoing may have on SouthState and its customers and other constituencies; (31) terrorist activities risk that results in loss of consumer confidence and economic disruptions; and (32) other factors that may affect future results of SouthState, as disclosed in SouthState’s Annual Report on Form 10-K, Quarterly Reports on Form 10-Q, and Current Reports on Form 8-K, filed by SouthState with the U.S. Securities and Exchange Commission (“SEC”) and available on the SEC’s website at http://www.sec.gov, any of which could cause actual results to differ materially from future results expressed, implied or otherwise anticipated by such forward-looking statements.
All forward-looking statements speak only as of the date they are made and are based on information available at that time. SouthState does not undertake any obligation to update or otherwise revise any forward-looking statements, whether as a result of new information, future events, or otherwise, except as required by federal securities laws. As forward-looking statements involve significant risks and uncertainties, caution should be exercised against placing undue reliance on such statements.
14
Exhibit 99.2
Earnings Call 4Q 2021 Tuesday, January 25, 2022 Exhibit 99.2 |
DISCLAIMER2 Statementsincludedinthiscommunication,whicharenothistoricalinnatureareintendedtobe,andareherebyidentifiedas,forward-lookingstatementsforpurposesofthesafeharborprovidedbySection27AoftheSecuritiesActof1933andSection21EoftheSecuritiesExchangeActof1934.Forward-lookingstatementsarebasedon,amongotherthings,management’sbeliefs,assumptions,currentexpectations,estimatesandprojectionsaboutthefinancialservicesindustry,theeconomyandSouthState.Wordsandphrasessuchas“may,”“approximately,”“continue,”“should,”“expects,”“projects,”“anticipates,”“islikely,”“lookahead,”“lookforward,”“believes,”“will,”“intends,”“estimates,”“strategy,”“plan,”“could,”“potential,”“possible”andvariationsofsuchwordsandsimilarexpressionsareintendedtoidentifysuchforward-lookingstatements.SouthStatecautionsreadersthatforward-lookingstatementsaresubjecttocertainrisks,uncertaintiesandassumptionsthataredifficulttopredictwithregardto,amongotherthings,timing,extent,likelihoodanddegreeofoccurrence,whichcouldcauseactualresultstodiffermateriallyfromanticipatedresults.Suchrisks,uncertaintiesandassumptions,include,amongothers,thefollowing:(1)economicdownturnrisk,potentiallyresultingindeteriorationinthecreditmarkets,greaterthanexpectednoninterestexpenses,excessiveloanlossesandothernegativeconsequences,whichriskscouldbeexacerbatedbypotentialcontinuednegativeeconomicdevelopmentsresultingfromtheCovid19pandemic,orfromfederalspendingcutsand/oroneormorefederalbudget-relatedimpassesoractions;(2)interestrateriskprimarilyresultingfromthelowinterestrateenvironment,potentiallyrisinginterestrates,andtheirimpactontheBank’searnings,includingfromthecorrespondentandmortgagedivisions,housingdemand,themarketvalueofthebank’sloanandsecuritiesportfolios,andthemarketvalueofSouthState’sequity;(3)risksrelatedtothemergerandintegrationofSouthStateandCSFLincluding,amongothers,(i)theriskthatthecostsavingsandanyrevenuesynergiesfromthemergermaynotbefullyrealizedormaytakelongerthananticipatedtoberealized,(ii)theriskthattheintegrationofeachparty’soperationswillbemateriallydelayedorwillbemorecostlyordifficultthanexpectedorthatthepartiesareotherwiseunabletosuccessfullyintegrateeachparty’sbusinessesintotheother’sbusinesses,(iii)theamountofthecosts,fees,expensesandchargesrelatedtothemerger,(iv)reputationalriskand thereactionofeachcompany'scustomers,suppliers,employeesorotherbusinesspartnerstothemerger,(4)risksrelatedtothemergerandintegrationofSouthStateandAtlanticCapitalincluding,amongothers,(i)theriskthatthecostsavingsandanyrevenuesynergiesfromthemergermaynotbefullyrealizedormaytakelongerthananticipatedtoberealized,(ii)disruptiontotheparties’businessesasaresultoftheannouncementandpendencyofthemerger,(iii)theoccurrenceofanyevent,changeorothercircumstancesthatcouldgiverisetotheterminationofthemergeragreement,(iv)theriskthattheintegrationofeachparty’soperationswillbemateriallydelayedorwillbemorecostlyordifficultthanexpectedorthatthepartiesareotherwiseunabletosuccessfullyintegrateeachparty’sbusinessesintotheother’sbusinesses,(v)theamountofthecosts,fees,expensesandchargesrelatedtothemerger,(vi)theabilitybyeachofSouthStateandAtlanticCapitaltoobtainrequiredgovernmentalapprovalsofthemerger(andtheriskthatsuchapprovalsmayresultintheimpositionofconditionsthatcouldadverselyaffectthecombinedcompanyortheexpectedbenefitsofthetransaction),(vii)reputationalriskandthereactionofeachcompany'scustomers,suppliers,employeesorotherbusinesspartnerstothemerger,(viii)thefailureoftheclosingconditionsinthemergeragreementtobesatisfied,oranyunexpecteddelayinclosingthemerger,(ix)thepossibilitythatthemergermaybemoreexpensivetocompletethananticipated,includingasaresultofunexpectedfactorsorevents,(x)thedilutioncausedbySouthState’sissuanceofadditionalsharesofitscommonstockinthemerger,(xi)generalcompetitive,economic,politicalandmarketconditions,and(xii)otherfactorsthatmayaffectfutureresultsofAtlanticCapitalandSouthStateincludingchangesinassetqualityandcreditrisk;theinabilitytosustainrevenueandearningsgrowth;changesininterestratesandcapitalmarkets;inflation;customerborrowing,repayment,investmentanddepositpractices;theimpact,extentandtimingoftechnologicalchanges;capitalmanagementactivities;andotheractionsoftheBoardofGovernorsoftheFederalReserveSystemandOfficeoftheComptrolleroftheCurrencyandlegislativeandregulatoryactionsandreforms(5)risksrelatingtothecontinuedimpactoftheCovid19pandemiconthecompany,includingpossibleimpact tothecompanyanditsemployeesfromcontactingCovid19,andtoefficienciesandthecontrolenvironmentduetothecontinuedworkfromhomeenvironmentandtoourresultsofoperationsduetogovernmentstimulusandotherinterventionstoblunttheimpactofthepandemic;(6)theimpactofincreasingdigitizationofthebankingindustryandmovementofcustomerstoon-lineplatforms,andthepossibleimpactontheBank’sresultsofoperations,customerbase,expenses,suppliersandoperations;(7)controlsandproceduresrisk,includingthepotentialfailureorcircumventionofourcontrolsandproceduresorfailuretocomplywithregulationsrelatedtocontrolsandprocedures;(8)potentialdeteriorationinrealestatevalues;(9)theimpactofcompetitionwithotherfinancialinstitutions,includingpricingpressures(includingthoseresultingfromtheCARESAct)andtheresultingimpact,includingasaresultofcompressiontonetinterestmargin;(10)risksrelatingtotheabilitytoretainourcultureandattractandretainqualifiedpeople;(11)creditrisksassociatedwithanobligor’sfailuretomeetthetermsofanycontractwiththebankorotherwisefailtoperformasagreedunderthetermsofanyloan-relateddocument;(12)risksrelatedtotheabilityofthecompanytopursueitsstrategicplanswhichdependuponcertaingrowthgoalsinourlinesofbusiness;(13)liquidityriskaffectingtheBank’sabilitytomeetitsobligationswhentheycomedue;(14)risksassociatedwithananticipatedincreaseinSouthState’sinvestmentsecuritiesportfolio,includingrisksassociatedwithacquiringandholdinginvestmentsecuritiesorpotentiallydeterminingthattheamountofinvestmentsecuritiesSouthStatedesirestoacquirearenotavailableontermsacceptabletoSouthState;(15)priceriskfocusingonchangesinmarketfactorsthatmayaffectthevalueoftradedinstrumentsin“mark-to-market”portfolios;(16)transactionriskarisingfromproblemswithserviceorproductdelivery;(17)complianceriskinvolvingrisktoearningsorcapitalresultingfromviolationsofornonconformancewithlaws,rules,regulations,prescribedpractices,orethicalstandards;(18)regulatorychangeriskresultingfromnewlaws,rules,regulations,accountingprinciples,proscribedpracticesorethicalstandards,including,withoutlimitation,thepossibility thatregulatoryagenciesmayrequirehigherlevelsofcapitalabovethecurrentregulatory-mandatedminimumsandincludingtheimpactoftheCARESAct,theConsumerFinancialProtectionBureauregulations,andthepossibilityofchangesinaccountingstandards,policies,principlesandpractices,includingchangesinaccountingprinciplesrelatingtoloanlossrecognition(CECL);(19)strategicriskresultingfromadversebusinessdecisionsorimproperimplementationofbusinessdecisions;(20)reputationriskthatadverselyaffectsearningsorcapitalarisingfromnegativepublicopinion;(21)cybersecurityriskrelatedtothedependenceofSouthStateoninternalcomputersystemsandthetechnologyofoutsideserviceproviders,aswellasthepotentialimpactsofinternalorexternalsecuritybreaches,whichmaysubjectthecompanytopotentialbusinessdisruptionsorfinanciallossesresultingfromdeliberateattacksorunintentionalevents;(22)reputationalandoperationalrisksassociatedwithenvironment,socialandgovernancematters;(23)greaterthanexpectednoninterestexpenses;(24)excessiveloanlosses;(25)potentialdepositattrition,higherthanexpectedcosts,customerlossandbusinessdisruptionassociatedwiththeAtlanticCapitalintegration,andpotentialdifficultiesinmaintainingrelationshipswithkeypersonnel;(26)therisksoffluctuationsinmarketpricesforSouthStatecommonstockthatmayormaynotreflecteconomicconditionorperformanceofSouthState;(27)thepaymentofdividendsonSouthStatecommonstock,whichissubjecttolegalandregulatorylimitationsaswellasthediscretionoftheboardofdirectorsofSouthState,SouthState’sperformanceandotherfactors;(28)ownershipdilutionriskassociatedwithpotentialacquisitionsinwhichSouthState’sstockmaybeissuedasconsiderationforanacquiredcompany;(29)operational,technological,cultural,regulatory,legal,creditandotherrisksassociatedwiththeexploration,consummationandintegrationofpotentialfutureacquisition,whetherinvolvingstockorcashconsideration;(30)majorcatastrophessuchashurricanes,tornados,earthquakes,floodsorothernaturalorhumandisasters,includinginfectiousdiseaseoutbreaks,includingtheongoingCovid19pandemic,andtherelateddisruptiontolocal,regionalandglobaleconomicactivityandfinancialmarkets,andtheimpactthatanyoftheforegoingmayhaveonSouthStateanditscustomersandotherconstituencies;(31)terroristactivitiesriskthatresultsinlossofconsumerconfidenceandeconomicdisruptions; and(32)otherfactorsthatmayaffectfutureresultsofSouthState,asdisclosedinSouthState’sAnnualReportonForm10-K,QuarterlyReportsonForm10-Q,andCurrentReportsonForm8-K,filedbySouthStatewiththeU.S.SecuritiesandExchangeCommission(“SEC”)andavailableontheSEC’swebsiteathttp://www.sec.gov,anyofwhichcouldcauseactualresultstodiffermateriallyfromfutureresultsexpressed,impliedorotherwiseanticipatedbysuchforward-lookingstatements. Allforward-lookingstatementsspeakonlyasofthedatetheyaremadeandarebasedoninformationavailableatthattime.SouthStatedoesnotundertakeanyobligationtoupdateorotherwisereviseanyforward-lookingstatements,whetherasaresultofnewinformation,futureevents,orotherwise,exceptasrequiredbyfederalsecuritieslaws.Asforward-lookingstatementsinvolvesignificantrisksanduncertainties,cautionshouldbeexercisedagainstplacingunduerelianceonsuchstatements. |
$35Billion in deposits $24Billion in loans $42Billion in assets $5.7Billion market cap(1)FinancialmetricsasofDecember31,2021;marketcapasofJanuary21,2022;pendingAtlanticCapitalBancshares,Inc.(“ACBI”)mergerexcludedSouthState CorporationOverview of Franchise (1)3 (281) 7Greenwich Excellence Awards 2021 #1 in Florida#2 in Georgia #3 in South Carolina Top 50Forbes 100 Best Banks in America 2021 |
DIVERSIFIED LINES OF BUSINESS4High-Growth Southeast Markets with National Line of Business Capabilities Regional •Commercial Banking•Retail Banking•Business Banking•Treasury Management•Mortgage•Wealth•Correspondent Banking & Capital Markets•Payroll & Payments / Fintech (1)•Corporate Billing / Factoring•Association Prime (HOA)•SBA National (1) Proforma basis, including pending ACBI merger4 |
STRONG POPULATION GROWTH TRENDS5 •SouthStateis located in four of the top six states for highest population growth over the past year•The four states highlighted below represent 93% of SouthState’stotal deposits Source: U.S. Census Bureau, December 20215 Rank State April 1, 2020 (Estimates Base) July 1, 2020July 1, 2021 Population Growth (actual) 1Texas29,145,50529,217,65329,527,941310,288 2Florida21,538,18721,569,93221,781,128211,196 3Arizona7,151,5027,177,9867,276,31698,330 4North Carolina10,439,38810,457,17710,551,16293,985 5Georgia10,711,90810,725,80010,799,56673,766 6South Carolina5,118,4255,130,7295,190,70559,976 7Utah3,271,6163,281,6843,337,97556,291 8Tennessee6,910,8406,920,1196,975,21855,099 9Idaho1,839,1061,847,7721,900,92353,151 10Nevada3,104,6143,114,0713,143,99129,920 Top 10 States in Population Growth (July 2020 to July 2021) |
Local MarketLeadershipOur business model supports the unique character of the communities we serve and encourages decision making by the banker that is closest to the customer.Long-TermHorizonWe think and act like owners and measure success over entire economic cycles. We prioritize soundness before short-term profitability and growth.RemarkableExperiencesWe will make our customers’ lives better by anticipating their needs and responding with a sense of urgency. Each of us has the freedom, authority and responsibility to do the right thing for our customers.Meaningful and LastingRelationshipsWe communicate with candor and transparency. The relationship is more valuable than the transaction.Greater PurposeWe enable our team members to pursue their ultimate purpose in life—their personal faith, their family, their service to community.The WHATThe HOW Guiding PrinciplesCore Values Leadership The WHY To invest in the entrepreneurial spirit, pursue excellence and inspire a greater purpose.6 |
INVESTMENT THESIS7 •True alternative to the largest banks with capital markets platform and upgraded technology solutions•High growth markets•Low-cost core deposit base•Diversified revenue streams •Strong credit quality and disciplined underwriting •Energetic and experienced management team with entrepreneurial ownership culture |
Quarterly Results |
HIGHLIGHTS | LINKED QUARTER Dollars in millions, except per share data*Thetangiblemeasuresarenon-GAAPmeasuresandexcludetheeffectofperiodendoraveragebalanceofintangibleassets.Thetangiblereturnsonequityandcommonequitymeasuresalsoaddbacktheafter-taxamortizationofintangiblestoGAAPbasisnetincome;otheradjustedfigurespresentedarealsoNon-GAAPfinancialmeasuresthatexcludetheimpactofbranchconsolidationandmerger-relatedexpenses,securitiesgainsorlosses-SeereconciliationofGAAPtoNon-GAAPmeasuresinAppendix9 3Q214Q21GAAPNet Income$122.8$106.8EPS (Diluted)$1.74$1.52Return on AverageAssets1.20%1.02%Non-GAAP*Return on AverageTangible Common Equity16.86%14.63%Non-GAAP,Adjusted*Net Income$136.8$112.1EPS (Diluted)$1.94$1.59Return on AverageAssets1.34%1.08%Return on AverageTangible Common Equity18.68%15.30% |
(1)Adjustedfiguresaboveexcludetheimpactofmerger-relatedexpenses;CorenetinterestincomeexcludingloanaccretionandnetdeferredfeesonPPPisalsoanon-GAAPfinancialmeasure-SeereconciliationofGAAPtoNon-GAAPmeasuresinAppendix(2)AdjustedPPNRandPPNRROAAareNon-GAAPfinancialmeasuresthatexcludetheimpactofmerger-relatedexpensesandextinguishmentofdebtcost-SeereconciliationofGAAPtoNon-GAAPmeasuresinAppendix(3)ExcludingPPPloans(4)ExcludingloanaccretionandnetdeferredfeesonPPPloans10•Reported & adjusted diluted Earnings per Share (“EPS”)(1)of $1.52 and $1.59, respectively•Pre-Provision Net Revenue (“PPNR”)(2)of $132.6 million, or 1.27% PPNR ROAA(2)•Loans(3)increased $395.8 million, or 6.7% annualized from prior quarter•Corenet interest income (4)(non-GAAP)(1)increased $6.4 million from prior quarter•Noninterest income of $91.9 million, increased by $4.9 million compared to 3Q 2021 •Net charge-offs of $960 thousand, or 0.02% annualized; negative provision for credit losses of $9.2 million•Repurchased 632,450 shares during 4Q 2021 at a weighted average price of $79.35, bringing total 2021 repurchases to approximately 1.82 millionQUARTERLY HIGHLIGHTS | 4Q 2021 |
TANGIBLE BOOK VALUE PER SHARE (1) PLUS DIVIDENDS (1)Thetangiblemeasureisanon-GAAPmeasureandexcludestheeffectofperiodendbalancesofintangibleassets-SeereconciliationofGAAPtoNon-GAAPmeasuresinAppendix11 $41.16 $42.02 $43.07 $43.98 $44.62 $0.47 $0.94 $1.43 $1.92 $41.16 $42.49 $44.01 $45.41 $46.54 $36.00$37.00$38.00$39.00$40.00$41.00$42.00 $43.00 $44.00$45.00$46.00$47.00$48.00$49.004Q201Q212Q213Q214Q21 Tangible Book Value per Share Cumulative Dividends |
NET INTEREST MARGIN Dollarsinmillions*Taxequivalent**AccretionincludesPPPloansdeferredfeesandloandiscountaccretionTaxequivalentNIMisNon-GAAPfinancialmeasures-SeereconciliationofGAAPtoNon-GAAPmeasuresinAppendix12 $236.2 $231.2 $232.6 $238.4 $244.7 $29.3 $30.8 $20.5 $21.6 $13.4 $265.5 $262.0 $253.1 $260.0 $258.1 3.14%3.12%2.87%2.86%2.78%1.0%1.5%2.0% 2.5%3.0%3.5% $- $90 $180 $270 $360 $4504Q201Q212Q213Q214Q21$ in millions Net Interest Income excld. Accretion** Accretion**Net Interest Income Net Interest Margin* |
LOAN PRODUCTION VS LOAN GROWTH Dollarsinmillions(1)ExcludesloansheldforsaleandPPP;loanproductionindicatescommittedbalancetotal;loanportfoliogrowthindicatesquarter-over-quarterloanendingbalancegrowth,excludingloansheldforsaleandPPP*Thecombinedhistoricalinformationreferredtointhispresentationasthe“CombinedBusinessBasis”presentedisbasedonthereportedGAAPresultsoftheCompanyandCenterStatefortheapplicableperiodswithoutadjustmentsandtheinformationincludedinthisreleasehasnotbeenpreparedinaccordancewithArticle11ofRegulationS-X,andthereforedoesnotreflectanyoftheproformaadjustmentsthatwouldberequiredthereby.AllCombinedBusinessBasisfinancialinformationshouldbereviewedinconnectionthehistoricalinformationoftheCompanyandCenterState,asapplicable.**1Q19loanproductionexcludesproductionfromNationalBankofCommerce(“NBC”);NationalCommerceCorporation,theholdingcompanyofNBC,wasacquiredbyCenterStatein2Q201913 $1,256**$1,791 $1,933 $2,079 $1,699 $1,470 $1,535 $1,879 $1,834 $2,355 $2,636 $3,129 $180 $82 $267 $153 $180 $(372)$(277)$(155)$(185)$169 $573 $396 -$500$240$980$1,720$2,460 $3,2001Q19*2Q19*3Q19*4Q19*1Q20*2Q20*3Q204Q201Q212Q213Q214Q21$ in millions Loan Production (1) Loan Portfolio Growth (1) |
QTD Production ($mm)$1,413$1,332$1,381 Refinance37%30%31% Purchase63%70%69%MORTGAGE BANKING DIVISION (1)Includes pipeline, LHFS and MBS forwards14 Highlights Quarterly Mortgage Production Gain on Sale Margin 4Q203Q214Q21 Secondary Market Gain on Sale, net$44,690$12,484$15,417Fair Value Change(1)(20,255)1,640(5,081)Total Secondary Market Mortgage Income$24,435$14,124$10,336 MSR Servicing Fee Income$3,010$3,781$3,620Fair Value Change(2,283)(2,344)(1,912)Total MSR-Related Income$727$1,437$1,708Total Mortgage Banking Income$25,162$15,561$12,044•Mortgage banking income of $12.0 million in 4Q 2021 compared to $15.6 million in 3Q 2021•Secondary pipeline at 4Q 2021 of $254 million, as compared to $410million at 3Q 2021 4.56%4.33%2.85%3.13%2.83%4Q201Q212Q213Q214Q21 Mortgage Banking Income ($mm) 47%53%4Q21 28%72%4Q20 Portfolio Secondary 46%54%3Q21 |
•Provides capital markets hedging (ARC), fixed income sales, international, clearing and other services to over 1,000 financial institutions across the country CORRESPONDENT BANKING DIVISION1,060 Financial Institution Clients15 $27.8 $28.7 $25.9 $25.2 $30.2 $0.0$5.0$10.0$15.0$20.0$25.0 $30.0$35.0 $- $5 $10 $15 $20 $25 $30 $354Q201Q212Q213Q214Q21$ in millionsCorrespondent Revenue Breakout ARC Revenues FI Revenues Operational RevenuesTotal Revenue |
Interest Rate Sensitivity |
CASH & SECURITIES Dollarsinbillions*Thecombinedhistoricalinformationreferredtointhispresentationasthe“CombinedBusinessBasis”presentedisbasedonthereportedGAAPresultsoftheCompanyandCenterStatefortheapplicableperiodswithoutadjustmentsandtheinformationincludedinthisreleasehasnotbeenpreparedinaccordancewithArticle11ofRegulationS-X,andthereforedoesnotreflectanyoftheproformaadjustmentsthatwouldberequiredthereby.AllCombinedBusinessBasisfinancialinformationshouldbereviewedinconnectionthehistoricalinformationoftheCompanyandCenterState,asapplicable,includedintheAppendixtothispresentation.17 $4.1 $4.4 $3.3 $3.7 $4.5 $5.3 $5.7 $6.4 $7.1 $0.6 $2.0 $4.0 $4.1 $4.2 $5.6 $5.9 $5.7 $6.4 $4.7B $6.4B $7.3B $7.8B $8.7B $10.9B $11.6B $12.1B $13.5B 1.80%1.38%0.69%0.65%0.86%1.32%1.59%1.33%1.53%0.0%0.5% 1.0%1.5%2.0%2.5%3.0% $- $1.0 $2.0 $3.0 $4.0 $5.0 $6.0 $7.0 $8.0 $9.0 $10.0 $11.0 $12.0 $13.0 $14.0 $15.04Q19*1Q20*2Q203Q204Q201Q212Q213Q214Q21$ in billions Investments ($) Fed Funds & Int. Earning Cash ($) Avg. 10-Yr Treasury |
EXCESS LIQUIDITY PROVIDES SIGNIFICANT TAILWIND (1)Source:S&PGlobalMarketIntelligence;PeersasdisclosedinthemostrecentSSBproxystatement;The4Q21averagesarebasedonMRQsavailableasofJanuary21,2022*Thecombinedhistoricalinformationreferredtointhispresentationasthe“CombinedBusinessBasis”presentedisbasedonthereportedGAAPresultsoftheCompanyandCenterStatefortheapplicableperiodswithoutadjustmentsandtheinformationincludedinthisreleasehasnotbeenpreparedinaccordancewithArticle11ofRegulationS-X,andthereforedoesnotreflectanyoftheproformaadjustmentsthatwouldberequiredthereby.AllCombinedBusinessBasisfinancialinformationshouldbereviewedinconnectionthehistoricalinformationoftheCompanyandCenterState,asapplicable,includedintheAppendixtothispresentation.18 1.8% 5.8% 10.6% 10.9% 11.2% 14.1% 14.6% 13.9% 15.2% 12.4% 12.4% 8.7% 9.9% 11.8% 13.3% 14.2% 15.7% 17.1%3.0%3.2%5.5%5.5%7.4%8.8%9.7%10.5%9.5%18.6%18.8%17.9%18.4%18.6%19.3%20.3%21.0%21.1%-1.0%4.0%9.0%14.0%19.0%0%4%8%12%16%20%4Q19*1Q20*2Q20*3Q204Q201Q212Q213Q214Q21 Fed Funds & Interest Earning Cash / Assets Investments / Assets Peer Avg. - Fed Funds & Interest Earning Cash / Assets (1) Peer Avg. - Investments / Assets (1) |
INTEREST RATE RISK PROFILE 29.6%40.1%14.9%20.4% $- 5.0% 10.0% 15.0% 20.0% 25.0% 30.0% 35.0% 40.0% 45.0%% Change in Consensus AdjustedNet Income Year 1% Change in Consensus AdjustedNet Income Year 2Static Balance Sheet Instantaneous Rate Shock Up 200 Up 10019 49.0%49.0%30.7%41.5%20.2%9.5%0.0%10.0%20.0%30.0%40.0%50.0%60.0% Variable Equals 1 Month or Less Variable Equals 12 Months or LessLoan Repricing Frequency (excluding PPP) Fixed Variable Adjustable |
WELL-POSITIONED FOR HIGHER RATES –HISTORICAL DEPOSIT BETA* *Thecombinedhistoricalinformationreferredtointhispresentationasthe“CombinedBusinessBasis”presentedisbasedonthereportedGAAPresultsoftheCompanyandCenterStatefortheapplicableperiodswithoutadjustmentsandtheinformationincludedinthisreleasehasnotbeenpreparedinaccordancewithArticle11ofRegulationS-X,andthereforedoesnotreflectanyoftheproformaadjustmentsthatwouldberequiredthereby.AllCombinedBusinessBasisfinancialinformationshouldbereviewedinconnectionthehistoricalinformationoftheCompanyandCenterState,asapplicable.20 0.12% 0.12% 0.11% 0.11% 0.12% 0.13% 0.15% 0.17% 0.19% 0.25% 0.34% 0.44% 0.52% 0.56% 0.64%0.16%0.37%0.37%0.40%0.45%0.70%0.95%1.16%1.20%1.45%1.74%1.92%2.22%2.40%2.40%1.58%1.37%1.24%1.12%1.61%1.94%1.80%1.81%2.07%2.53%2.76%2.80%2.88%2.47%2.12%0.0%0.5% 1.0%1.5%2.0%2.5% 3.0%4Q151Q162Q163Q164Q161Q172Q173Q174Q171Q182Q183Q184Q181Q192Q19 Cost of Deposits Average Fed Funds Rate Average 5-YR UST 4Q15 -2Q19 SouthState total deposit beta (including DDA) equal to 24% |
Balance Sheet Strength |
CAPITAL RETURN TO SHAREHOLDERS $38.6$50.6$57.7$98.3$135.3$68.4$156.9$24.7$146.4 $38.6 $119.0 $214.6 $123.0 $281.7 $0$80$160$240$32020172018201920202021$ in millions Dividends Equity Repurchases22•Returned $281.7 million to shareholders in 2021 through share repurchases and dividends•1.8 million shares repurchased in 2021 represents 2.6% of outstanding shares •Annual dividend of $1.92 represents an attractive dividend yield of 2.3%(1) Dollars in millions(1)Dividend yield based on stock price as of January 21, 202222 |
LOAN AND DEPOSIT TRENDS $22.7 $22.5 $22.7 $23.3 $23.7 $1.9 $1.9 $1.3 $0.5 $0.2 $24.6B $24.4B $24.0B $23.8B $23.9B $23.4B $23.6B $23.8B $24.0B $24.2B $24.4B $24.6B $24.8B $- $10 $20 $304Q201Q212Q213Q214Q21$ in billionsLoans(1) Total Loans PPP Dollarsinbillions(1)Excludesloansheldforsale23 $9.7 $10.8 $11.2 $11.4 $11.5 $7.0 $7.4 $7.7 $7.9 $9.0 $10.3 $10.8 $11.0 $11.3 $11.8 $3.7 $3.5 $3.3 $3.0 $2.8 $30.7B $32.4B $33.2B $33.6B $35.1B $- $50,000,000.0B $100,000,000.0B $150,000,000.0B $200,000,000.0B $250,000,000.0B $300,000,000.0B $350,000,000.0B $- $10 $20 $30 $404Q201Q212Q213Q214Q21$ in billionsDeposits Noninterest-bearing Checking Interest-bearing Checking MMA & Savings Time Deposits |
CDL (1)9%Investor CRE (2)31%Owner-Occupied CRE21%C&I15%Consumer RE20%Cons / Other4%TOTAL LOAN PORTFOLIO24 Data as of December 31, 2021Loan portfolio balances, average balances or percentage exclude loans held for sale and PPP loans(1) CDL includes residential construction, commercial construction, and all land development loans (2) Investor CRE includes nonowner-occupied CRE and other income producing property Loan TypeNo. of LoansBalanceAvg. Loan BalanceConstr., Dev. & Land5,420$ 2.03B $ 374,400 Investor CRE9,391 7.43B 791,400 Owner-Occupied CRE8,144 4.97B 610,300 C & I16,958 3.51B 207,400 Consumer RE38,314 4.81B 125,500 Cons / Other45,568 0.93B 20,400Total123,795$23.68B$191,300 Loan RelationshipsTop 10Represents ~ 3% of total loansTop 20Represents ~ 5% of total loansLoans by TypeTotal Loans$23.7 Billion |
59%41%33%51%8%8%0%20%40%60%80%100%SSBPeer Average (1)Deposit Mix vs. Peers Checking Accounts MM & Savings Time Deposits PREMIUM CORE†DEPOSIT FRANCHISE Noninterest-bearing Checking$11.5Interest-bearing Checking$9.0 Savings$3.4 Money Market$8.4 Time Deposits$2.825 Data as of December 31, 2021Dollars in billions† Core deposits defined as non-time deposits(1) Source: S&P Global Market Intelligence; 4Q21 MRQs available as of January 21, 2022; Peers as disclosed in the most recent SSB proxy statementTotal Deposits$35.1 Billion Commercial66%Retail34%Deposits by Type Checking Accounts(Noninterest & Interest-bearing)•Total cost of deposits for 4Q21: 6 bps•~ 816 thousand checking accounts / ~1.2 million total deposit accounts |
ASSET QUALITY METRICS Dollarsinmillions(1)ExcludesloansheldforsaleandPPPloans 0.01%(0.00)%0.03%0.00%0.02%-0.01%0.16%0.33%0.50%4Q201Q212Q213Q214Q21Net Charge-Offs (Recoveries) to Loans 0.48%0.46%0.38%0.40%0.35% 0.0% 0.2% 0.4% 0.6% 0.8% 1.0%4Q201Q212Q213Q214Q21Nonperforming Assets to Loans & OREO 3.28%3.12%2.92%2.65%2.11%2.03%1.84%1.68%1.48%1.02%1.25%1.28%1.24%1.17%1.09%0%1%2% 3%4%4Q201Q212Q213Q214Q21Criticized & Classified Asset Trends Combined Special Mention / Assets Substandard / Assets26 1.1%0.8%0.5%0.1%0.0%0.0%0.2%0.4%0.6%0.8% 1.0%1.2% $- $1,000 $2,000 $3,000 $4,000 $5,000 $6,0004Q201Q212Q213Q214Q21Loan Deferrals (1) |
CAPITAL RATIOS (1)Preliminary* The tangible measures are non-GAAP measures and exclude the effect of period end balance of intangible assets -See reconciliation of GAAP to Non-GAAP measures in Appendix27 3Q214Q21(1) Tangible Common Equity * 7.8%7.7% Tier 1 Leverage 8.1%8.1% Tier 1 Common Equity 11.9 %11.8% Tier 1 Risk- Based Capital 11.9 %11.8% Total Risk- Based Capital 13.8 %13.6%BankCRE Concentration Ratio 236 %239%Bank CDL Concentration Ratio 57 %55% |
Appendix |
PPNR(1) Dollars in millions(1)Adjusted PPNR is a Non-GAAP financial measure that excludes the impact of merger-related expenses and extinguishment of debt cost -See reconciliation of GAAP to Non-GAAP measures in Appendix* Accretion includes PPP loans deferred fees and loan discount accretion29 $114.4 $108.8 $92.9 $110.6 $119.2 $29.3 $30.8 $20.5 $21.6 $13.4 $143.7 $139.6 $113.4 $132.2 $132.6 $- $50 $100 $150 $2004Q201Q212Q213Q214Q21$ in millions PPNR excld. Accretion* Accretion * |
CURRENT & HISTORICAL 5-QTR PERFORMANCE DollarsinmillionsTotalrevenueandnoninterestincomeareadjustedbysecuritiesgainsorlosses;TaxequivalentNIM,efficiencyratioandadjustedefficiencyratioareNon-GAAPfinancialmeasures;AdjustedEfficiencyRatioexcludestheimpactofbranchconsolidation,merger-relatedexpenses,securitiesgainsorlosses,extinguishmentofdebtcost,FHLBAdvancesprepaymentpenalty,swapterminationexpense,incometaxbenefitrelatedtothecarrybackoftaxlossesundertheCARESActandamortizationexpenseonintangibleassets,asapplicable–SeeCurrent&HistoricalEfficiencyRatioandNetInterestMarginreconciliationinAppendix30 3.14%3.12%2.87%2.86%2.78%1.0%1.5% 2.0% 2.5%3.0%3.5%4.0%4.5% $200 $220 $240 $260 $280 $3004Q201Q212Q213Q214Q21 $ in millions Net Interest Margin (“NIM”) NIM ($) NIM (%) 73%73%76%75%74%27%27%24%25%26% $363M $358M $332M $347M $350M 1.53%0.0%0.5% 1.0%1.5%2.0%2.5%3.0% 0% 20% 40% 60% 80% 100% 120%4Q201Q212Q213Q214Q21Revenue Composition NIM / Revenue Noninterest Income / Revenue Avg. 10-year UST Total Revenue $98 $96 $79 $87 $92 1.03%1.02%0.80%0.85%0.88%0.4%0.5% 0.6% 0.7% 0.8% 0.9% 1.0% 1.1% 1.2% 1.3% 1.4% $- $20 $40 $60 $80 $100 $120 $1404Q201Q212Q213Q214Q21 $ in millions Noninterest Income Noninterest Income Noninterest Income / Avg. Assets 74%61%76%64%61%58%58%63%59%59% 0% 15% 30% 45% 60% 75% 90%4Q201Q212Q213Q214Q21Efficiency Ratio Efficiency Ratio Adjusted Efficiency Ratio |
LOSS ABSORPTION CAPACITY | 4Q 2021 Dollars in millions(1)Excludes PPP loans and loan held for sale(2)Includes mark on loans from CSFL and prior SSB acquisitions31 4Q21% of Total Loans (1) Allowance for Credit Losses (“ACL”) Non-PCD ACL$225.2PCD ACL76.6Total ACL$301.81.27% Reserve for Unfunded Commitments Reserve for unfunded commitments30.50.13%Total ACL plus Reserve for Unfunded Commitments$332.31.40%Unrecognized Discount –Acquired Loans (2)68.00.29%Loss Absorption Capacity$400.31.69%Total Loans Held for Investment (1)$23,684 |
BRANCH OPTIMIZATION 85 BranchesAverage Size $40M 420 Branches Acquired Plus12 DeNovo Branches 236 Branches Consolidated or Sold 281 BranchesAverage Size $125M ~213% growth in deposits per branch 854322362812009 …..……………..………..……....…………………………….. 202132 |
Best in ClassPlatformsDIGITAL INVESTMENTS Consumer Mobile/OnlineFinanceRisk/Audit Wealth SBA Platform SSB Website33 |
PPP UPDATE3434•As of 4Q21, approximately 92%, or $3.0 billion of PPP loans have been forgiven by the SBA (1)•In 4Q21, we recognized PPP deferred fees of $5.7 million•Approximately $1.1 million of PPP fees remaining to recognize•Average loan amount fully forgiven of $113 thousand(1)ThetotalforgivendollaramountrepresentsapprovedbytheSBAandprocessedPPPloans $263 $2,955 $- $400 $800 $1,200 $1,600 $2,000 $2,400 $2,800 $3,200 $3,600PPP Totals ($ in millions) Not Forgiven Forgiven |
DollarsinthousandsThetangiblemeasuresarenon-GAAPmeasuresandexcludetheeffectofperiodendoraveragebalanceofintangibleassets;thetangiblereturnsonequityandcommonequitymeasuresalsoaddbacktheafter-taxamortizationofintangiblestoGAAPbasisnetincome.35NON-GAAP RECONCILIATIONS –RETURN ON AVG. TANGIBLE COMMON EQUITY & PPNR RETURN ON AVG. ASSETS Return on Average Tangible Equity3Q214Q21Net income (GAAP)122,788$ 106,846$ Plus:Amortization of intangibles8,543 8,517 Effective tax rate, excluding DTA write-off20% 21% Amortization of intangibles, net of tax6,829 6,735 Net income plus after-tax amortization of intangibles (non-GAAP)129,617$ 113,581$ Average shareholders' common equity, excluding preferred stock4,773,451$ 4,794,414$ Less:Average intangible assets1,722,9151,713,888Average tangible common equity3,050,536$ 3,080,526$ Return on Average Tangible Common Equity (Non-GAAP)16.9%14.6%PPNR Return on Average Assets 3Q214Q21PPNR, Adjusted (Non-GAAP)132,260$ 132,604$ Average assets 40,593,766 41,359,708 PPNR ROAA1.29%1.27% |
NON-GAAP RECONCILIATIONS –ADJUSTED NET INCOME & ADJUSTED EARNINGS PER SHARE (“EPS”) Dollarsinthousands,exceptforpersharedata36 Adjusted Net Income3Q214Q21Net income (GAAP)122,788$ 106,846$ Plus:Securities gains, net of tax(51) (2) Merger and branch consolidation related expense, net of tax14,083 5,255 Adjusted Net Income (Non-GAAP)136,820$ 112,099$ Adjusted EPS 3Q214Q21Adjusted diluted weighted-average common shares70,576 70,290 Adjusted net income (non-GAAP)136,820$ 112,099$ Adjusted EPS, Diluted (Non-GAAP)1.94$ 1.59$ |
NON-GAAP RECONCILIATIONS –ADJUSTED RETURN ON AVG. ASSETS & AVG. TANGIBLE COMMON EQUITY DollarsinthousandsThetangiblemeasuresarenon-GAAPmeasuresandexcludetheeffectofperiodendoraveragebalanceofintangibleassets;thetangiblereturnsonequityandcommonequitymeasuresalsoaddbacktheafter-taxamortizationofintangiblestoGAAPbasisnetincome.Dollars in thousands, except for per share data37 Adjusted Return on Average Assets3Q214Q21Adjusted net income (non-GAAP)136,820$ 112,099$ Total average assets40,593,766 41,359,708 Adjusted Return on Average Assets (Non-GAAP)1.34%1.08%Adjusted Return on Average Tangible Common Equity3Q214Q21Net operating earnings (non-GAAP)136,820$ 112,099$ Plus:Amortization of intangibles, net of tax6,829 6,735 Net operating earnings plus after-tax amortization of intangibles (non-GAAP)143,649$ 118,834$ Average tangible common equity3,050,536$ 3,080,526$ Adjusted Return on Average Tangible Common Equity (Non-GAAP)18.68%15.30% |
NON-GAAP RECONCILIATIONS –NET INTEREST MARGIN & CORE NET INTEREST INCOME (EXCLD. FMV & PPP ACCRETION) DollarsinthousandsDollars in thousands, except for per share data38 Net Interest Margin - Tax Equivalent (Non-GAAP)4Q201Q212Q213Q214Q21Net interest income (GAAP)265,547$ 261,998$ 253,130$ 259,986$ 258,104$ Tax equivalent adjustments1,662 1,286 1,424 1,477 1,734 Net interest income (tax equivalent) (Non-GAAP)267,209$ 263,284$ 254,554$ 261,463$ 259,838$ Average interest earning assets33,853,006$ 34,231,928$ 35,631,605$ 36,218,437$ 37,031,640$ Net Interest Margin - Tax Equivalent (Non-GAAP)3.14%3.12%2.87%2.86%2.78%Core Net Interest Margin excluding FMV & PPP Accretion (Non-GAAP)3Q214Q21Net interest income (GAAP)259,986$ 258,104$ Less: Total accretion on acquired loans5,243 7,707$ Deferred fees on PPP loans16,369 5,655$ Core Net Interest Margin excluding FMV & PPP Accretion (Non-GAAP)238,374$ 244,742$ |
NON-GAAP RECONCILIATIONS –PPNR, ADJUSTED & CORRESPONDENT & CAPITAL MARKETS INCOME (UNAUDITED) Dollarsinthousands39 4Q201Q212Q213Q214Q21SSBSSBSSBSSBSSB ARC revenues19,446$ 10,370$ 9,433$ 9,853$ 16,686$ FI revenues6,139 15,052 14,280 13,139 11,317 Operational revenues2,166 3,326 2,164 2,172 2,213 Total Correspondent & Capital Market Income27,751$ 28,748$ 25,877$ 25,164$ 30,216$ Correspondent & Capital Market Income PPNR, Adjusted (Non-GAAP) 4Q201Q212Q213Q214Q21 SSBSSBSSBSSBSSB Net interest income (GAAP)265,547$ 261,998$ 253,130$ 259,986$ 258,104$ Plus: Noninterest income 97,871 96,285 79,020 87,010 91,894 Less: Gain on sale of securities35 - 36 64 2 Total revenue, adjusted (non-GAAP)363,383$ 358,283$ 332,114$ 346,932$ 349,996$ Less: Noninterest expense278,398 228,711 263,383 232,290 224,037 PPNR (Non-GAAP)84,985$ 129,572$ 68,731$ 114,642$ 125,959$ Plus: Non-recurring items58,679 10,009 44,676 17,618 6,645 PPNR, Adjusted (Non-GAAP)143,664$ 139,581$ 113,407$ 132,260$ 132,604$ |
NON-GAAP RECONCILIATIONS –CURRENT & HISTORICAL: EFFICIENCY RATIOS & NET INTEREST MARGIN(UNAUDITED) Dollarsinthousands(1)Non-recurringitemsincludeintangibleassets’amortizationexpensesfortheadjustedefficiencyratios40 4Q201Q212Q213Q214Q21 SSBSSBSSBSSBSSB Noninterest expense (GAAP)278,398$ 228,711$ 263,383$ 232,290$ 224,037$ Less: Amortization of intangible assets9,760 9,164 8,968 8,543 8,517 Adjusted noninterest expense (non-GAAP)268,638$ 219,547$ 254,415$ 223,747$ 215,520$ Net interest income (GAAP)265,547$ 261,998$ 253,130$ 259,986$ 258,104$ Tax Equivalent ("TE") adjustments1,662 1,286 1,424 1,477 1,734 Net interest income, TE (non-GAAP)267,209$ 263,284$ 254,554$ 261,463$ 259,838$ Noninterest income (GAAP)97,871$ 96,285$ 79,020$ 87,010$ 91,894$ Less: Gain (loss) on sale of securities35 - 36 64 2 Adjusted noninterest income (non-GAAP)97,836$ 96,285$ 78,984$ 86,946$ 91,892$ Efficiency Ratio (Non-GAAP)74%61%76%64%61% Noninterest expense (GAAP)278,398$ 228,711$ 263,383$ 232,290$ 224,037$ Less: Non-recurring items(1)68,439 19,173 53,644 26,161 15,162 Adjusted noninterest expense (non-GAAP)209,959$ 209,538$ 209,739$ 206,129$ 208,875$ Adjusted Efficiency Ratio (Non-GAAP)58%58%63%59%59% Average Interest-earning Assets33,853,006$ 34,231,928$ 35,631,605$ 36,218,437$ 37,031,640$ Net interest income, TE (non-GAAP)267,209 263,284 254,554 261,463 259,838 Net Interest Margin (Non-GAAP)3.14%3.12%2.87%2.86%2.78% |
NON-GAAP RECONCILIATIONS –CURRENT & HISTORICAL: INVESTMENTS, FED FUNDS SOLD & INT. EARNING CASH(UNAUDITED) Dollarsinthousands(1)Doesnotincludepurchaseaccountingadjustments*Thecombinedhistoricalinformationreferredtointhispresentationasthe“CombinedBusinessBasis”presentedisbasedonthereportedGAAPresultsoftheCompanyandCenterStatefortheapplicableperiodswithoutadjustmentsandtheinformationincludedinthisreleasehasnotbeenpreparedinaccordancewithArticle11ofRegulationS-X,andthereforedoesnotreflectanyoftheproformaadjustmentsthatwouldberequiredthereby.41 2Q203Q204Q201Q212Q213Q214Q21 SSBCSFL Combined (1)SSBCSFL Combined (1)SSBSSBSSBSSBSSBSSBSSB Fed Funds & Interest Earning Cash426,685$ 163,890$ 590,575$ 1,003,257$ 1,033,586$ 2,036,843$ 3,983,047$ 4,127,250$ 4,245,949$ 5,581,581$ 5,875,078$ 5,701,002$ 6,366,494$ Investments2,005,171 2,094,614 4,099,785 2,034,189 2,342,822 4,377,011 3,271,148 3,747,128 4,446,657 5,267,271 5,719,031 6,433,631 7,173,947 Total Assets15,921,092$ 17,142,025$ 33,063,117$ 16,642,911$ 18,596,292$ 35,239,203$ 37,725,356$ 37,819,366$ 37,789,873$ 39,730,332$ 40,375,869$ 40,903,708$ 41,960,032$ Fed Funds & Interest Earning Cash / Assets 1.8%5.8%10.6%10.9%11.2%14.1%14.6%13.9%15.2% Investments / Assets12.4%12.4%8.7%9.9%11.8%13.3%14.2%15.7%17.1% Combined Business Basis* 4Q19 1Q20 |
NON-GAAP RECONCILIATIONS –TANGIBLE BOOK VALUE / SHARE & TANGIBLE COMMON EQUITY RATIO Dollarsinthousands,exceptforpersharedata42 Tangible Book Value per Common Share4Q201Q212Q213Q214Q21Shareholders' common equity (excludes preferred stock)4,647,880$ 4,719,820$ 4,757,623$ 4,792,941$ 4,802,940$ Less: Intangible assets1,726,534 1,733,619 1,726,211 1,717,669 1,709,152 Tangible shareholders' common equity (excludes preferred stock)2,921,346$ 2,986,201$ 3,031,412$ 3,075,272$ 3,093,788$ Common shares issued and outstanding70,973,477 71,060,446 70,382,728 69,918,037 69,332,297 Tangible Book Value per Common Share (Non-GAAP)41.16$ 42.02$ 43.07$ 43.98$ 44.62$ Tangible Common Equity ("TCE") Ratio3Q214Q21Tangible common equity (non-GAAP)3,075,272$ 3,093,788$ Total assets (GAAP)40,903,708 41,960,032 Less:Intangible assets1,717,669 1,709,152 Tangible asset (non-GAAP)39,186,039$ 40,250,880$ TCE Ratio (Non-GAAP)7.8%7.7% |
FGM]E/_H55O@:RCQC=*2 3:-@>OS"DO\ =/D-_P"\&C\> M]0=M4TC31D1QPO.>>&+-M&1[;#^9KC_AO=>(K3Q%/)X8LK>[OC:LKQSGY1'N M3)'S+SG;W[UZ!\=]#DEMM-UN),K#NMYSZ G*'Z9W?F*\U\ >(5\,^,;*_E8K M;$F*?_<;@G\#@_A54=<-:*N*II6U/6_[:^+W_0NZ5_WT/_CM))8G5XW4,K*A%/KACB7!WC M%(ZI45)6;9Y+X#T'Q?X8T.:RETE,OPJI7<:CI-OJ"$L-D MH'$@_KZUR-]I\]A+LF7@_=8=#7Q>.P56C-S>J?7_ #/H\+B85(J*T:Z%6NCT M'6#E;.X;VC<_R- 0K^\4?.! M_$/7ZURU=MHUZ;[3U,G+I\CY[UR]]8LFKRVL"ESN^50.Q&?ZUZ&8T(R4<12V ME^9R8.K*+E1G]DI*"S!0,DG KT*!62WC1OO*H!^N*R=(T(6C"XN"&F_A4=% M_P#KUM5Z&5X2="+G/=]#DQV(C5:C'9!61XITM-;\+:GISJ#Y]NP7(SA@,J?P M(!_"M>BO63L[H\]JZL?,_AKX<>-;J1-2L+=M->([HIIY#$Q/^R.OXXP:]&M? M'OB[0(_(\4^%+N8Q@ W=HH*GW.,KGIT(KU*BNF>)]H_?BF8QH &_#.H2W;#Y7EC)V^^U :O_ &_XO.96E\_[*6#,[9SE MR.,>WYXZ5[-14^WY4U35KC]E=WF[A@8QCBO%_&_P9EGNIM1\,^7^\)9K%F"X M)Z[">!]#BO:**SI594G>) >+=#TR+3M:\(ZI>SP 1K.B,"RC@ M9.TY/OWK U3P[XV^)NOI=WFF-I=G&NR/[2"BQKWP#\S$_3'TKWVBM5B%%\T8 MI,AT;JTGH<_X0\(Z?X/T@65FN^5SNGG8?-*W] .P_J37.?%3P)<>++"WO--5 M6U*T! C) \U#SMR>X/(^IKT.BLHU91GSWU+=.+CR]#Y+@\,>++*]1[?1M6AN MHVRCQP2*RGU! KTC1/AOXI\4-#<>--3O%LT(9+62 V45T3QLY; M*S,HX:*W9\MWWPX\4KJ%R+;0+OR!*PCP 1MR<=_2O0_AK)XS\-"+1;[PY<-I MLDN1,V%,&>I]QWKV&BE/%RG'EDD$<.HNZ9XQ\5OAOJ.HZJ^OZ+ UTTH N;=/ MO@@8#*._ P.?;K7%>%H/B#H%X\>B:;J4+3D"1'M3L/H3N&!UZ\5].440Q 9Z1X?\ $VCM)XJUZ6ZUG6ECV16%O+M5%)Y''R_@!CZ]:\V\ M3>&?&_B?7[G5;GP[=H\Q&$ !"*!@#K7TK14PQ4HOFLKCE04E:YX#X"LO&O@G M4KB8>%KJYM[E LL?"MP<@@_B?SKT+Q_JGB632I=)T7P]/<&]M=LMR&!$0?(9 M,?WL=_>N\HI3K\T^=Q5RHTN6/*F?*G_"N?&'_0 O/^^1_C7M7PYU#Q-!96NA MZWH%Q;QV\15+QF &T=%(]>WX5Z#155<4ZL;22)IT%!W3/GSQW\/]8U'XCWR: M+IKRQ76VX+CY8T9A\V6/&2P)Q[UT&C#XC^ (([:?3?[;TM<86"3S&B'HO\6, M>Q KV.BAXJ3BHR2:0*@DW)/4\QF^,D,*;'\,ZLMV.#"RX /UZ_I7+7FA>-/B MGK$%QJ5DVE:7#GR_.!4*#C.U3RS'UQCCK7N]%3&O&&L(V?WC=)RTD]#*\.^' M['PSHT.F:>FV*/EF/WI&/5C[FO*_BI\-;^^U677]#MVN#, ;FVC^^& QN4=\ M@#('.>:]IHJ*=:4)\ZW*G3C*/*SYC\*V_P 0- O9$T/3=1A>?"R(]L=C8Z;M MPP,9//%=S>?"OQ#XCTB?4/$&L&;7F4>1$6'E1 =5.!C)_P!GC/K7L=%;3Q <_0?E7L%%$\6Y[Q5Q1P_+LV?-OC'X5Z]H=RL]F MD^K6T@!>:)"T@?ON49.,YY_.MCX9:'X\M+QHK43:7I;R+)<-=0@;L8X56&22 M.,CCWZ5[U10\9.4.5I,%AXJ7,F<#\4/ LWB_3(9]/*?VC:9V*YP)5/5<] ?2 MO$M.T3QKX>U=+G3]*U6VO8B55DMF;/8CH0P_,5]5T4J6*E3CR-70ZE!3ES7L MSR32_!_B_P 9M!/XXOI(M-0AUT]"$:0_[07I^//7I7+>*_@SK&FSR7&A#^T+ M,DD1;@)D'T. WX<^U?0E%*.+G%W6W;H#H1:LSYT\-ZY\1?"D L+;2;^6V4_+ M;W%F[!/7;QD?3I7801?$KQO']GO]N@:6_$K*FR5U[J!G=_(?7I7K=%.6)3=U M%7"-&VCD[&/X?\,Z9X;TB+3K&!?+4[F=P"TC'JQ/K_A16Q17,Y-N[-DDE9!4 M +G.\9:V+'AB!X[265@0)&&T'V[UM+ M#&LC2*BAW^\P')IR@*H '84M>WAZ*I4HPWL>96J.I-R[A1116YD%%%% !1 M110 4444 %%%% !1110 4444 %%%% !1110 4444 %%%% !1110 4444 %%% H% !1110 4444 %%%% !1110 4444 %%%% !1110 4444 %%%% '_V0$! end
E.CD26-9(W5T895E.01Z@TZOB]8OS/H-&CQ#
MQAX7E\,ZDLD!8V4K9@DSRAZ[2?4=CWKT+P+XI_M_3S;73C[?;@;S_P ]%[-_
M0_\ UZW=:TF#6])GL)P,2+\K?W&[,/H:\5\/74^A>+[;=\KQW'D3+GL3M8?Y
M]*^QI36 -444J=*-._+U'.HYVOT"BBBM3,**** "BBB@ HHHH **** "BB
MB@ HHHH **** "BBB@ HHHH **** "BBB@ HHHH **** "BBB@ HHHH ****
M "BBB@ HHHH **** "BBB@ HHHH **** "BBB@ HHHH **** "BBB@ HHHH
M**** "BBB@ HHHH **** "BBB@ HHHH **** "BBB@ HHHH **** "BBB@ H
MHHH **** "BBB@ HHHH **** "BBB@ HHHH **** "BBB@ HHHH **** "BB
MB@ HHHH **** "BBB@ HHHH **** "BBB@ HHHH **** "BBB@ HIZ1EN3P*
M'CQR.E.SM<+C****0!1110 4Y'VGVIM% %D'(R**@1]I]JG!R,BM4[D-6"BB
MBF(**** "BBB@ HHHH **** "BBB@ HHHH **** "HY$SR*DHI-7!.Q6HJ21
M, :[SQM
M\:M8D\YF0:1XC50(M7MD!9L# 65>/,7IUP1C@@9!_)\
M1XET\OS2-+&T;82K&,J=2-V[-*[:ZV=TTM8VV9]I2X2EBL&YX>I^_@VI1>BN
MGHEZK5-Z._0_,2BMWQUX.O?A]XNU3P[J,EO->Z=,899+63?&QP#D'Z$<$ CH
M0""*PJ_:Z-:GB*4:U)WC))I]T]4_N/S^I"5*;IS5FG9^J"BBBMC,**** "BB
MB@ HHHH **** "BBB@#])_\ @E%;R7GPT^+,$*[YI98$11W8PR@"O#/@_P#L
M1?&[PW\8/!^L:EX"NK73;+6;6YN)VO+8B.-9E9FP)23@ G@5[G_P2BN9+/X:
M?%FXA;9-%+ Z-C.&$,I!_.O$/A!^W'\$OQ?\'Z-J7CRXNM-OM9M;6X@-A:
M*)(VF567(B!&02.#FOD7]9^M8KV'+;2][_R]+'T"]C["A[6]];6MWZW.P_X*
MW?\ ):/"/_8#_P#:\E=Y_P $C_'.KWD'C?PG+.AT2Q6+4((1&H99I"5=BV,D
M$(O'3BN#_P""MW_):/"/_8#_ /:\E=W_ ,$CO ^L6D7CCQ7+;JNAWR1:?!/Y
MBDM-&Q9UVYW# =>2,
.+&SLO$?BO6_$%G9\VUOJFHS7,<'&/D5V(7@ <=JFT
MGXL>-] \-R^'=,\8^(-.\/S*ZR:5::I/%:N'^^#$K!2&[Y'/>N5HI^SA;EY5
M8.>5[W"BBBM" HHHH **** "BBB@ HHHH **** "BBB@ HHHH **** "BBB@
M HHHH **** "BBB@ HHHH **** "BBB@ HHHH **** "BBB@ HHHH **** "
MBBB@ HHHH **** "BBB@ HHHH **** "BBB@ HHHH **** "BBB@ HHHH **
M** "BBB@ HHHH **** "BBB@ HHHH **** "BBB@ HHHH **** "BBB@ HHH
MH *]X_9>_:/@^"%[>Z?JFEK=Z)J=
M_9V$^L_7%37M._X:]'IW"BBBO"/1"BBB@ HHHH **** "BBB@ KJ/AG_ ,CO
MIO\ VT_]%/7+UU'PS_Y'?3?^VG_HIZ]G)?\ D:87_KY#_P!*1PX__=*W^&7Y
M,]VHHHK^KS\=/,/C7_S!O^VW_M.O,*]/^-?_ #!O^VW_ +3KS"OYIXP_Y'F(
M_P"W?_2(GZIDG_(OI_/_ -*84445\:>X%%%% !1110 4444 %%%% 'FWQ7^
MGAKXM&.XOEEL-5B&U-0L\"0CLK@C##]1V-7/A%\)XOA/IE]:1ZO=ZP;N596E
MNP 5PN !R>*[VBO=EGF93P']F3K-T/Y79VL[Z-ZI7Z)V/.6782.)^N1II5._
M]:,****\(]$**** "BBB@ HHHH **** "N[^#G_(SW7_ %YM_P"AI7"5W?P<
M_P"1GNO^O-O_ $-*^EX:_P"1QAO\1Y6:_P"Y5?0]CHHHK^HS\D"BBB@ HHHH
M **** "BBB@ HHHH **** "BBB@ HHHH **** "BBB@ HHHH **** "BBB@
MHHHH XN_^%.D:C?7-W)<7JR3R-*P1TP"Q)./EZ2UD1R@,FX(0V F5;=@9YQMKZ>T#7O&/[$
M_P"S/\-]!C\ :I\0]:DE:&_MM(D8BQ:1VD(+)')G!?:. "0>>F_M*_#+XK:^=
M$\)^+K/6]5$+3FV@20-Y:XW-\R@<9'YUYW^W9J*:1\,?"=]);7%Y';>+]+F:
MWM8C++*%D8E40?>8XP!W-=Y\+/C-I7Q(UFZL;+P-XN\,RP6YF-UX@\/O80N,
M@;5=NK'["&Z
MO;W6(;J&QBCO9'^U0^6"[L2&55(4@]<#K]M6%K]AL;>V\QIO)C6/S'^\V!C)
M]SBGBUA%R;@0QBX9!&9=HWE0\8> =>U3]ISX>^+;6P\WP
M_I6D:E:WEYYT8\J279Y:["VYLX/(! [XKV&BM:=1TVVNJ:^]6,YP4TD^Z?W'
M*WWB7Q!;_$;3-#@\*RW/ARYLI+BX\1B\14MIE.%A,)&YBPYW \?GCA/!_@#Q
M!/\ M,>.?'.O:?\ 9]+CTRTT;P_*TT;^9#S)<.%5BR9DP/F )Q7LM%5&KRIJ
M*W5OQO\ \#T$Z?,TV]G<\O\ 'W[./@WXD>,8O%.K#6(-=BM19)=Z9K-U9,(0
MQ;9^ZD7@DY/KQZ5Y[\%/V:Y/AS\?_'?B62/6DT9UM%T:YN]>FNA=?N&2?S4:
M5F?:3A?-''\-?25%7'%5HP=/FT:M\O(AX>FY*=M4[A1117*= 4444 %%%% !
M5#79=1@T6_DTF""ZU1(':U@N7*1R2@':K, 2 3@$XXJ_136C$SX=\;>%OB#^
MT)\3_$OAB_\ =MX0NKBST2:]O[W5H+K^SHX+BX<36_E99W?YE7[INP"*^
MX(T\N-5R6V@#)ZFF+:PI<+#&L[J%>4*-S 9P">I R?S-2UU5\0ZRC%*R73
MY)=?0PI4?9-N]V_Z_4****Y#H"BBB@ HHHH **** "BBB@ HHHH \R_:8\':
MQ\0?@)XX\.:!:?;]9U+39+>UMO-2/S'.,#