Exhibit 99.1

Popular, Inc. Announces First Quarter 2023 Financial Results
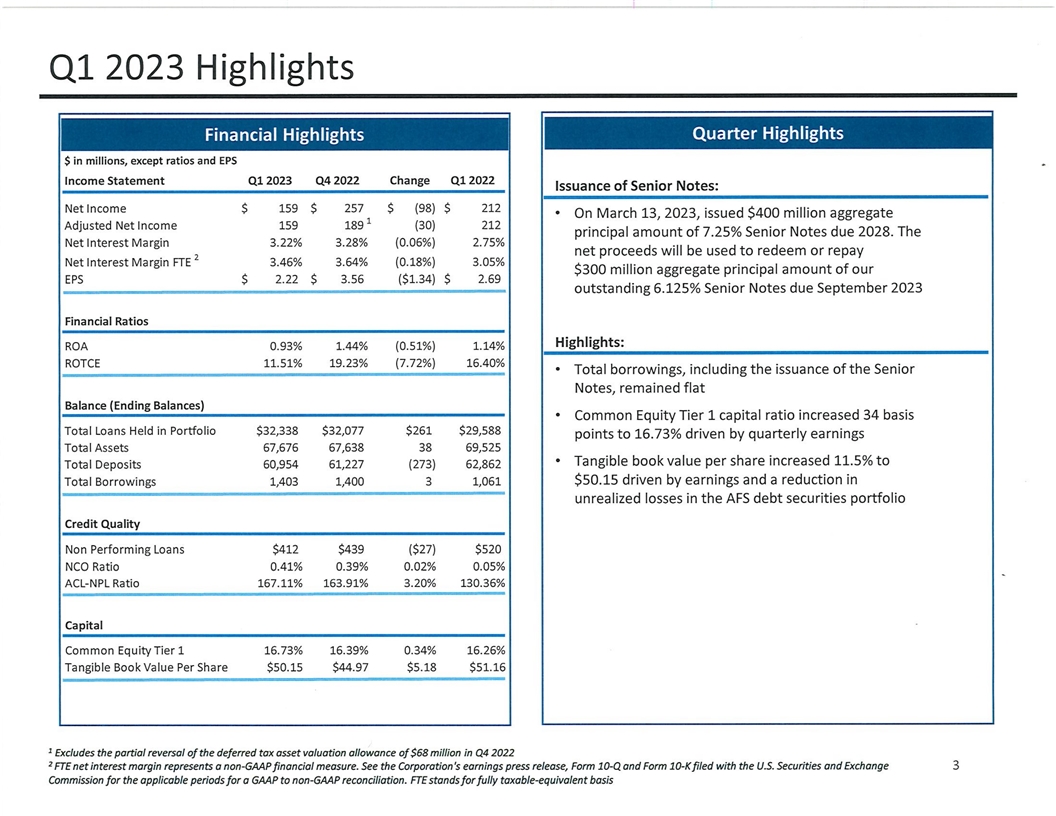
| • | Net income of $159.0 million in Q1 2023, compared to net income of $257.1 million in Q4 2022; the results of Q4 2022 included a tax benefit of $68.2 million related to the partial release of the deferred tax valuation allowance in the U.S. |
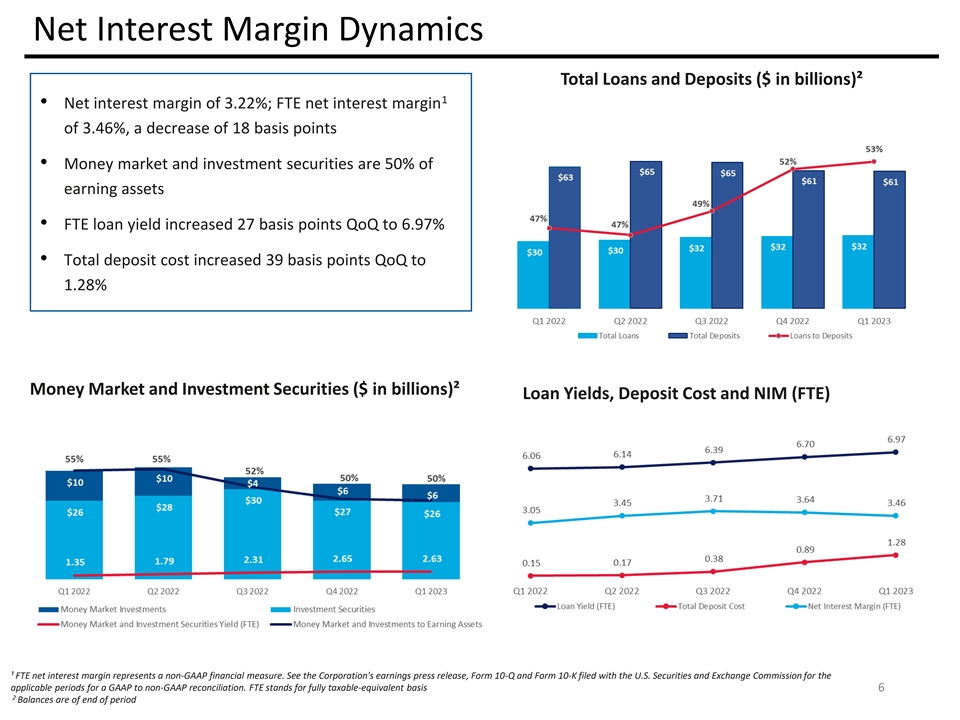
| • | Net interest margin of 3.22% in Q1 2023, compared to 3.28% in Q4 2022; net interest margin on a taxable equivalent basis of 3.46% in Q1 2023, compared to 3.64% in Q4 2022. |
| • | Credit Quality: |
| • | Non-performing loans held-in-portfolio (“NPLs”) decreased by $27.1 million from Q4 2022; NPLs to loans ratio at 1.3% vs. 1.4% in Q4 2022; |
| • | Net charge-offs (“NCOs”) increased by $1.6 million from Q4 2022; annualized NCOs at 0.41% of average loans held-in-portfolio vs. 0.39% in Q4 2022; |
| • | Allowance for credit losses (“ACL”) to loans held-in-portfolio at 2.13% vs. 2.25% in Q4 2022; and |
| • | ACL to NPLs at 167.1% vs. 163.9% in Q4 2022. |
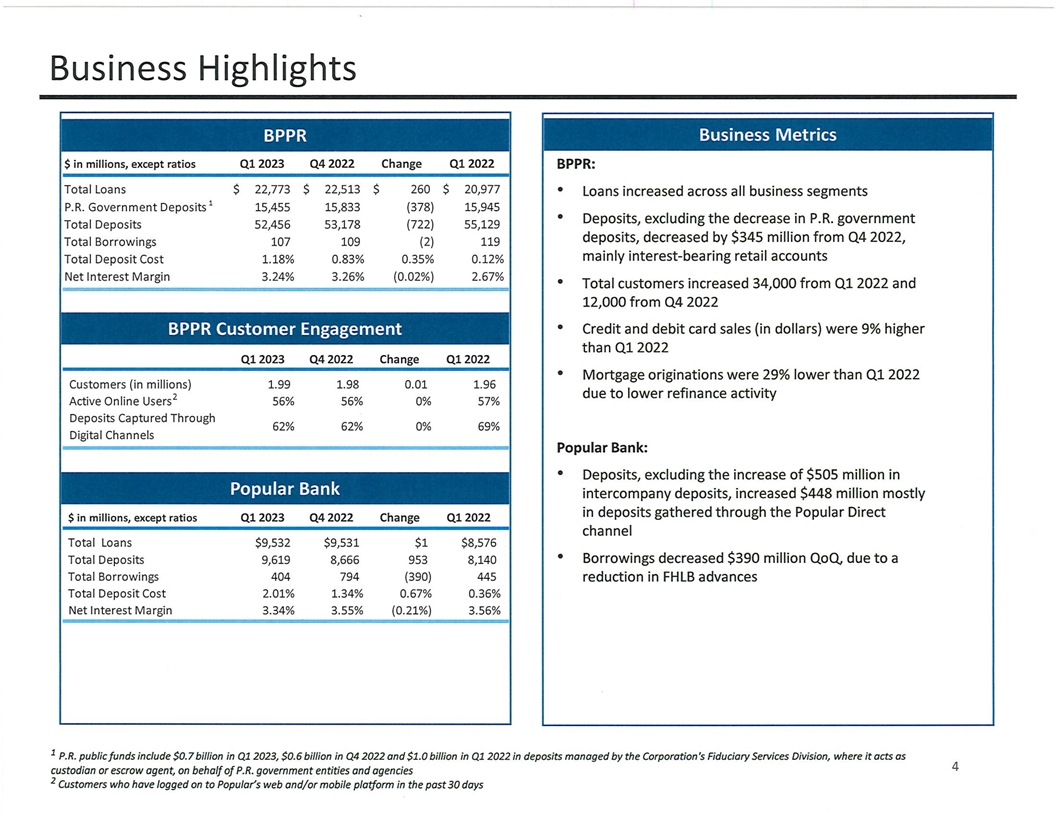
| • | Loans increased by $260.6 million, $334.5 million in average quarterly balances, from Q4 2022. |
| • | Deposit balances decreased by $273.3 million, $1.3 billion in average quarterly balances, from Q4 2022. |
| • | Total borrowings at Q1 2023 were $1.4 billion, flat compared to Q4 2022. |
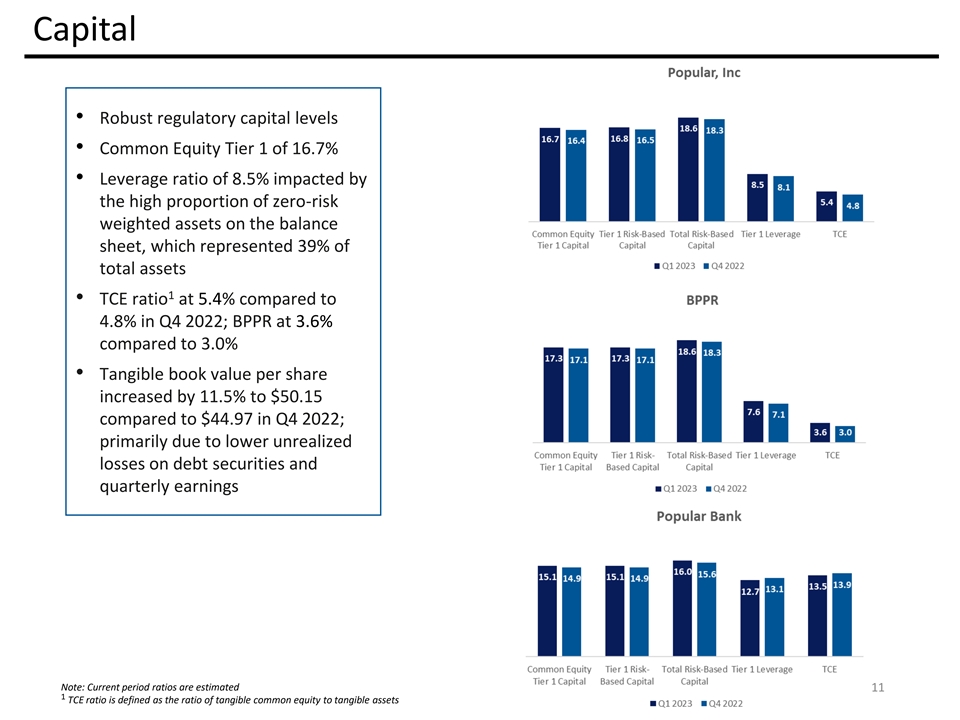
| • | Common Equity Tier 1 ratio of 16.73%, Common Equity per Share of $61.82 and Tangible Book Value per Share of $50.15 at March 31, 2023. |
SAN JUAN, Puerto Rico – (BUSINESS WIRE) – Popular, Inc. (the “Corporation,” “Popular,” “we,” “us,” “our”) (NASDAQ:BPOP) reported net income of $159.0 million for the quarter ended March 31, 2023, compared to net income of $257.1 million for the quarter ended December 31, 2022. Excluding the effects of the partial release of $68.2 million of the deferred tax asset valuation allowance, the net income for the fourth quarter was $188.9 million.
Ignacio Alvarez, President and Chief Executive Officer, said: “We reported strong results for the first quarter as we continued to support our clients during a period of increased volatility and uncertainty. Our diversified business model and strong deposit base, robust capital and liquidity positions are a source of strength and allow us to continue to meet our clients’ needs, as reflected by the growth in our loan portfolio and client base during the quarter. We remain optimistic about the opportunities that lie ahead as we remain vigilant of potential risks stemming from continued inflation and economic and market uncertainty. Economic trends in Puerto Rico are positive, and a considerable amount of recovery funds yet to be disbursed are expected to support additional economic activity in future years. I want to express my gratitude to our colleagues; it is their effort and commitment that lead to our customers’ continued trust in Popular.”
1
Significant Events
Issuance of Senior Notes
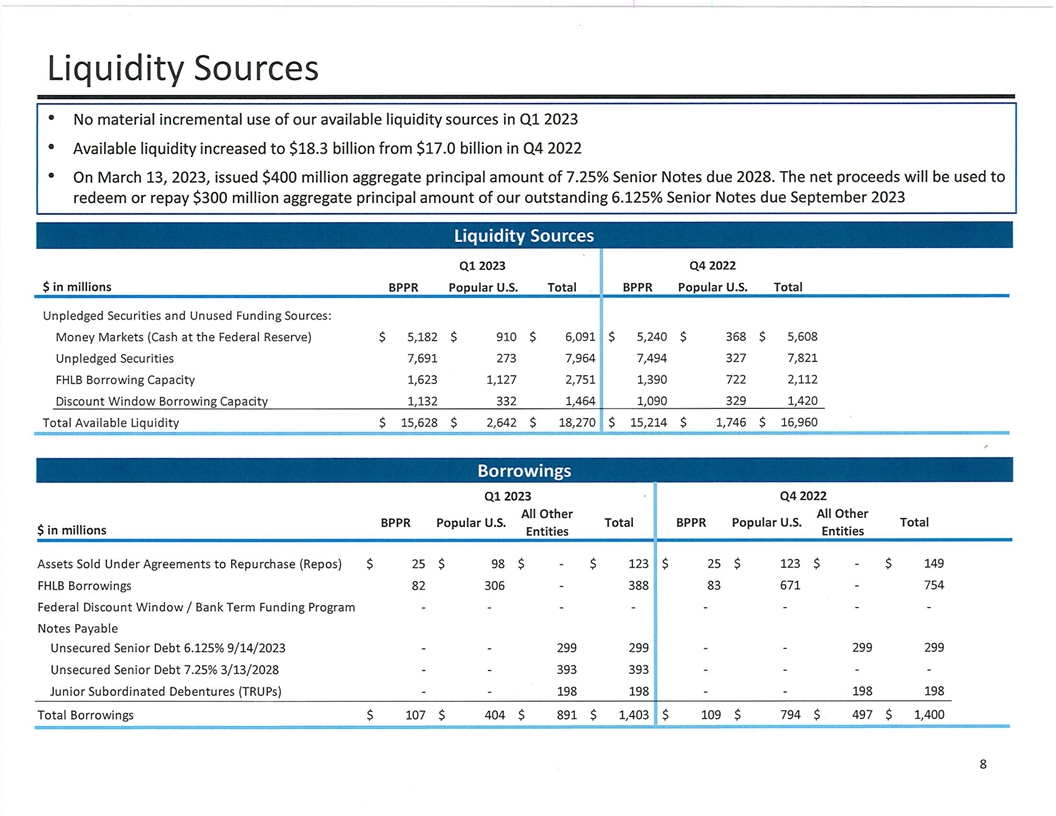
On March 13, 2023, the Corporation issued $400 million aggregate principal amount of 7.25% Senior Notes due 2028 (the “Notes”) in an underwritten public offering. The Corporation intends to use the net proceeds of the offering to redeem or repay $300 million aggregate principal amount of its outstanding 6.125% Senior Notes due September 2023.
Refer to Table I for further details of liquidity sources.
Earnings Highlights
| (Unaudited) |
Quarters ended | |||||||||||
| (Dollars in thousands, except per share information) |
31-Mar-23 | 31-Dec-22 | 31-Mar-22 | |||||||||
| Net interest income |
$ | 531,656 | $ | 559,566 | $ | 494,312 | ||||||
| Provision for credit losses (benefit) |
47,637 | 49,531 | (15,500 | ) | ||||||||
|
|
|
|
|
|
|
|||||||
| Net interest income after provision for credit losses (benefit) |
484,019 | 510,035 | 509,812 | |||||||||
| Other non-interest income |
161,961 | 158,465 | 154,692 | |||||||||
| Operating expenses |
440,687 | 461,708 | 402,339 | |||||||||
|
|
|
|
|
|
|
|||||||
| Income before income tax |
205,293 | 206,792 | 262,165 | |||||||||
| Income tax expense (benefit) |
46,314 | (50,347 | ) | 50,479 | ||||||||
|
|
|
|
|
|
|
|||||||
| Net income |
$ | 158,979 | $ | 257,139 | $ | 211,686 | ||||||
|
|
|
|
|
|
|
|||||||
| Net income applicable to common stock |
$ | 158,626 | $ | 256,786 | $ | 211,333 | ||||||
|
|
|
|
|
|
|
|||||||
| Net income per common share - basic |
$ | 2.22 | $ | 3.56 | $ | 2.69 | ||||||
|
|
|
|
|
|
|
|||||||
| Net income per common share - diluted |
$ | 2.22 | $ | 3.56 | $ | 2.69 | ||||||
|
|
|
|
|
|
|
|||||||
Net interest income on a taxable equivalent basis – Non-GAAP financial measure
Net interest income, on a taxable equivalent basis, is presented with its different components in Tables D and E for the quarter ended March 31, 2023 and comparable periods. Net interest income on a taxable equivalent basis is a non-GAAP financial measure. Management believes that this presentation provides meaningful information since it facilitates the comparison of revenues arising from taxable and tax-exempt sources.
Non-GAAP financial measures used by the Corporation may not be comparable to similarly named non-GAAP financial measures used by other companies.
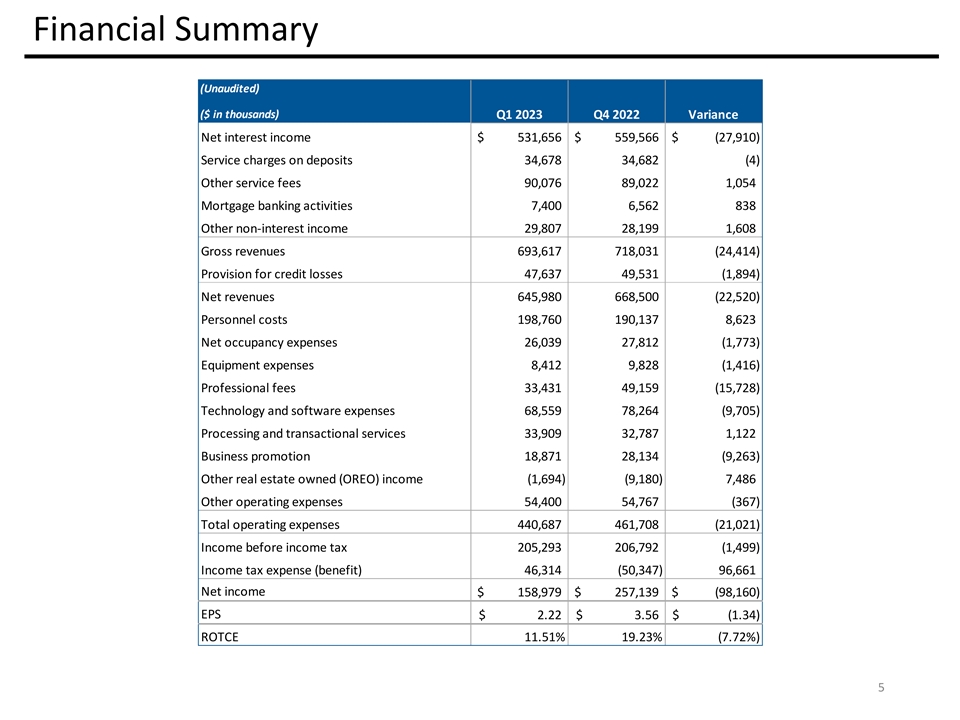
For the quarter ended March 31, 2023, net interest income was $531.7 million, compared to $559.6 million in the previous quarter, a decrease of $27.9 million. The impact of two less days in the quarter results in a reduction of $9.0 million to net interest income and impacts the net interest margin for the quarter. Net interest income on a taxable equivalent basis for the first quarter of 2023 was $570.4 million compared to $621.5 million in the previous quarter, a decrease of $51.1 million. The higher variance in the taxable equivalent net interest income as compared to the GAAP net interest income is related to a higher effective tax during the first quarter of 2023 due to a higher disallowed interest expense as a result of the increase in the Corporation’s cost of deposits. Refer to the Income taxes discussion for further information.
Net interest margin for the quarter was 3.22% compared to 3.28% in the fourth quarter of 2022 or a decrease of 6 basis points. On a taxable equivalent basis, net interest margin for the first quarter of 2023 was 3.46%, compared to 3.64% for the prior quarter. The main variances in net interest income on a taxable equivalent basis were:
| • | Lower interest income from money market, investment and trading securities by $15.4 million driven by lower average volume by $1.5 billion; |
| • | higher interest expense on deposits by $53.9 million due to the increase in rates, mainly from Puerto Rico government, commercial deposits and Popular Bank (“PB”) deposits; |
2
Partially offset by:
| • | higher interest income from loans by $18.1 million resulting from an increase in average loans by $336 million reflecting increases in both PB and Banco Popular de Puerto Rico (“BPPR”) and across most major lending segments except construction loans in PB. Loan origination in a higher interest rate environment and the repricing of adjustable-rate loans resulted in a higher yield on loans by 27 basis points. The categories with the highest impact were commercial loans with an increase of $10.8 million in interest income, or 31 basis points, and consumer loans which increased $4.2 million in interest income, or 59 basis points. The yield on the construction portfolio increased by 86 basis points but was offset by lower average balances. |
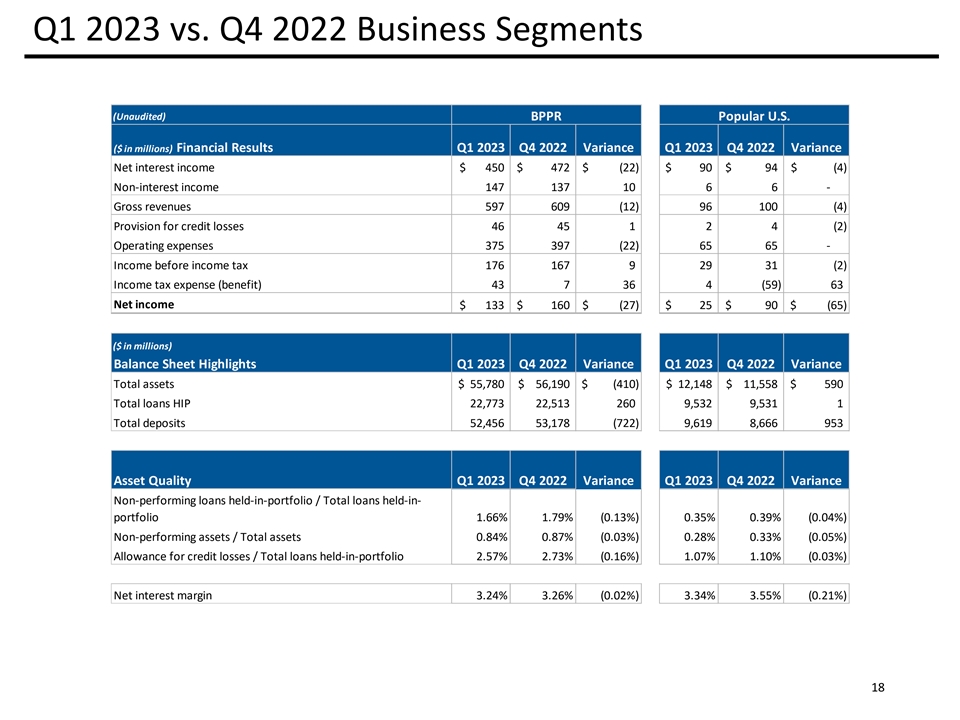
Net interest income for the BPPR segment amounted to $449.8 million for the first quarter of 2023, compared to $472.4 million in the fourth quarter of 2022. Net interest margin decreased slightly to 3.24% compared to 3.26% in the fourth quarter of 2022. The decrease in net interest income of $22.6 million was mainly driven by a higher cost of deposits, partially offset by an improvement in the yield on earning assets. The latter increased 30 basis points driven by the repricing of money market investments and adjustable-rate loans and a higher average volume of loans by $150 million. Earning assets decreased by $1.5 billion, driven primarily by the decrease of P.R. public sector and commercial interest-bearing deposits. The cost of interest-bearing deposits increased 48 basis points to 1.61% from 1.13% the previous quarter. The increase in the cost of deposits was mainly impacted by the repricing of public funds and corporate clients. Total deposit costs for the quarter increased by 35 basis points, from 0.83% to 1.18%.
Net interest income for PB was $90.1 million for the quarter ended March 31, 2023, compared to $94.2 million during the previous quarter, a decrease of $4.1 million. Net interest margin decreased 21 basis points in the quarter to 3.34% compared to 3.55% in the fourth quarter of 2022. The decrease in net interest margin was mostly driven by a higher cost of deposits, partially offset by a higher volume of loans and the repricing of adjustable-rate loans driven by the changes in interest rates. The cost of interest-bearing deposits was 2.47% compared to 1.71%, or an increase of 76 basis points, while total deposit cost was 2.01% compared to 1.34% in the previous quarter.
Non-interest income
Non-interest income amounted to $162.0 million for the first quarter of 2023, an increase of $3.5 million compared to $158.5 million for the fourth quarter of 2022. The main factors that contributed to the variance in non-interest income were:
| • | higher other service fees by $1.1 million mainly due to higher credit card fees, mainly from commercial clients, and higher investment management and trust fees, partially offset by lower insurance fees, including contingent payments typically received during the fourth quarter; |
| • | The first quarter of 2023’s results included $7.0 million in income from the successful insurance claim reimbursements related to prior period legal matters while the fourth quarter of 2022’s results included a gain of $8.2 million related to a recovery on the sale of a previously charged-off investment. |
Refer to Table B for further details.
3
Operating expenses
Operating expenses for the first quarter of 2023 totaled $440.7 million, a decrease of $21.0 million when compared to the fourth quarter of 2022. The variance in operating expenses was driven primarily by:
| • | lower professional fees by $15.7 million mainly due to lower advisory expenses arising from the Corporation’s Transformation initiative designed to expand its digital capabilities, modernize its technology platform, incurred in the fourth quarter of 2022; though this initiative is ongoing, its initial planning stages required certain up front expenditures in 2022; |
| • | lower technology and software expenses by $9.7 million mainly due to a decrease in IT professional and consulting fees by $7.6 million, driven by the incurrence during the fourth quarter of 2022 of higher Transformation initiative expenses, and lower network management, application processing and hosting expenses by $1.9 million; |
| • | lower other business promotion expenses by $9.3 million mainly due to lower seasonal donations, advertising and sponsorship expenses, which are typically higher in the fourth quarter; and |
| • | lower other operating expenses by $3.3 million mainly due to a reserve of $2.0 million in legal matters recorded during the fourth quarter of 2022 and lower mortgage servicing related losses; |
partially offset by:
| • | higher personnel costs by $8.6 million, mainly due to higher salaries by $8.9 million as a result of an increase in minimum salary at BPPR effective in January 2023 and higher headcount, an increase in health insurance costs by $2.8 million, and higher payroll taxes, fringe benefits and other compensation expenses by $5.2 million that traditionally are higher during the first quarter of the year; partially offset by a decrease in profit-sharing accrual of $8.0 million; |
| • | higher credit and debit card processing and transactional expenses by $2.3 million mainly due to higher volume of transactions; |
| • | higher FDIC deposit insurance expense by $2.5 million due to amendments to the Deposit Insurance Fund restoration plan implemented by the FDIC that increased the base deposit assessment rate by 2 basis points, annually, beginning with the first quarterly assessment period of 2023; and |
| • | lower other real estate owned (OREO) benefit by $7.5 million mainly due to lower gain on sale of mortgage and commercial properties by $5.1 million and lower expense claim reimbursement from federal government agency programs by $1.2 million. |
Management believes that the level of expenditures related to the Corporation’s Transformation initiative incurred during the first quarter of 2023 reflects the current maturity of the project: as the initiative matures, expenses are expected to shift from being primarily advisory-related to expenses related to the development and execution of implementation plans, which have a slower pace of expenditure but are expected to accelerate as the year progresses.
Full-time equivalent employees were 8,975 as of March 31, 2023, compared to 8,813 as of December 31, 2022.
For a breakdown of operating expenses by category refer to Table B.
4
Income taxes
For the quarter ended March 31, 2023, the Corporation recorded an income tax expense of $46.3 million compared to an income tax benefit of $50.3 million for the previous quarter. The unfavorable variance in income tax expense was mainly attributable to a partial reversal of the deferred tax asset valuation allowance of the U.S. operation during the fourth quarter of 2022 of $68.2 million and a true-up adjustment of $9.5 million in relation to the fiscal year 2021 tax returns for the P.R. subsidiaries filed in the fourth quarter and related year-to-date adjustments for tax exempt income. The effective tax rate (“ETR”) for the first quarter of 2023 was of 23%. The ETR for the fourth quarter of 2022 was (24)%. Excluding the impact of the partial release of the valuation allowance and true up adjustment, the ETR for the fourth quarter was 12%. The higher ETR during the first quarter of 2023 is mainly due to lower projected tax-exempt income and higher disallowed interest expense deductions as a result of an increase in the Corporation’s projected interest expense for the remainder of 2023. Under the Puerto Rico income tax law, taxable income is computed excluding the exempt interest income but requires a disallowance of the related interest and administrative expenses allocated to support the exempt assets’ income, which has the effect of reducing the benefit of tax-exempt income.
The ETR of the Corporation is impacted by the composition and source of its taxable income. The Corporation expects its ETR for the year 2023 to be within a range from 21% to 26%.
Credit Quality
During the first quarter of 2023, the Corporation continued to reflect strong credit quality metrics with low levels of NCOs and decreasing NPLs. We continue to closely monitor changes in the macroeconomic environment and on borrower performance, given inflationary pressures and geopolitical risks. However, management believes that the improvement over recent years in the risk profile of the Corporation’s loan portfolios positions Popular to continue to operate successfully under the current environment.
The following presents credit quality results for the first quarter of 2023:
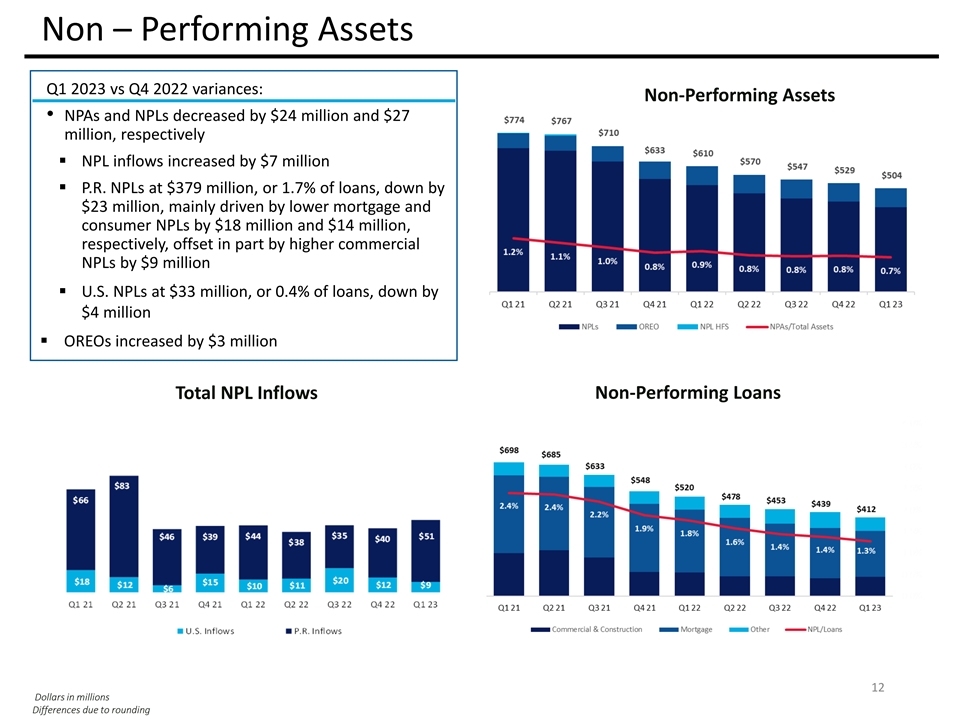
| • | At March 31, 2023, total non-performing loans held-in-portfolio decreased by $27.1 million from December 31, 2022. BPPR’s NPLs decreased by $23.0 million, mostly driven by lower mortgage and consumer NPLs by $18.3 million and $13.7 million, respectively, in part offset by higher commercial loans NPLs by $8.8 million. The consumer NPLs decrease was mostly driven by a $10.5 million line of credit charge-off on a single relationship, while the commercial NPLs increase was driven by a $14.3 million loan relationship. PB’s NPLs decreased by $4.0 million quarter-over-quarter, mostly due to lower mortgage NPLs by $5.8 million. At March 31, 2023, the ratio of NPLs to total loans held-in-portfolio was at 1.3%, compared to 1.4% in the fourth quarter of 2022. |
| • | Inflows of NPLs held-in-portfolio, excluding consumer loans, increased by $6.8 million quarter-over-quarter. In BPPR, total inflows increased by $10.4 million, mainly driven by the abovementioned commercial relationship, while PB inflows decrease by $3.5 million quarter-over-quarter, mainly driven by lower commercial inflows by $2.8 million. |
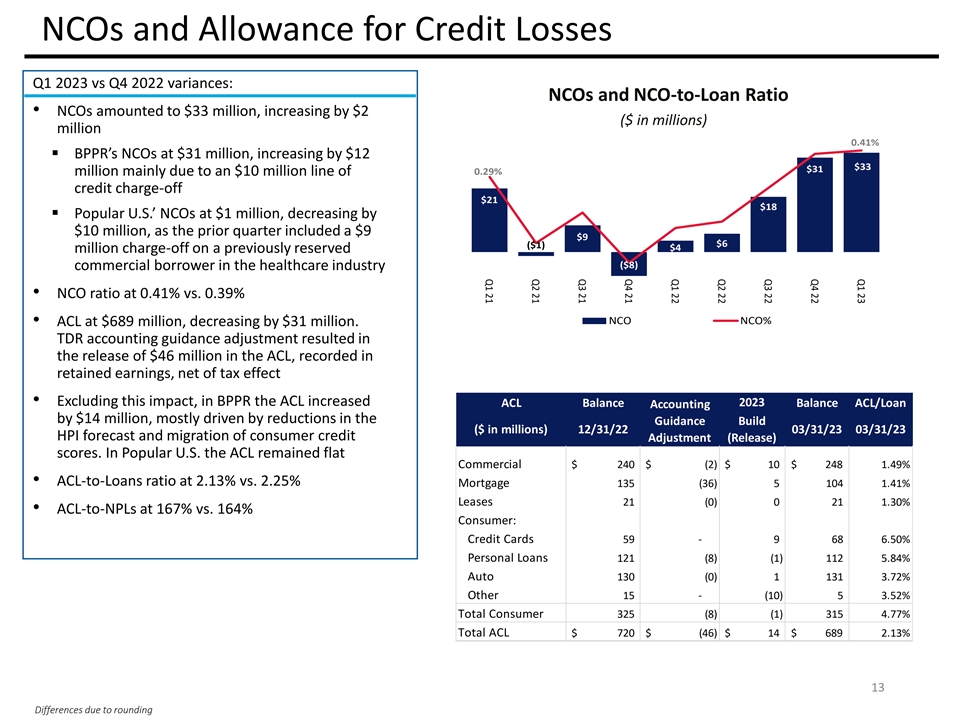
| • | NCOs amounted to $32.8 million, increasing by $1.6 million when compared to the fourth quarter of 2022. BPPR’s NCOs increased by $11.6 million quarter-over-quarter, mainly driven by higher consumer NCOs by $10.4 million, mostly due to the previously mentioned $10.5 million line of credit charge-off. PB’s NCOs decreased by $10.0 million quarter-over-quarter, as the prior quarter included an $8.7 million charge-off on a healthcare loan. During the first quarter of 2023, the Corporation’s ratio of annualized net charge-offs to average loans held-in-portfolio was 0.41%, compared to 0.39% in the fourth quarter of 2022. Excluding the impact of the abovementioned $10.5 line of credit charge-off, the annualized net charge-off ratio was 0.28%. Refer to Table O for further information on net charge-offs and related ratios. |
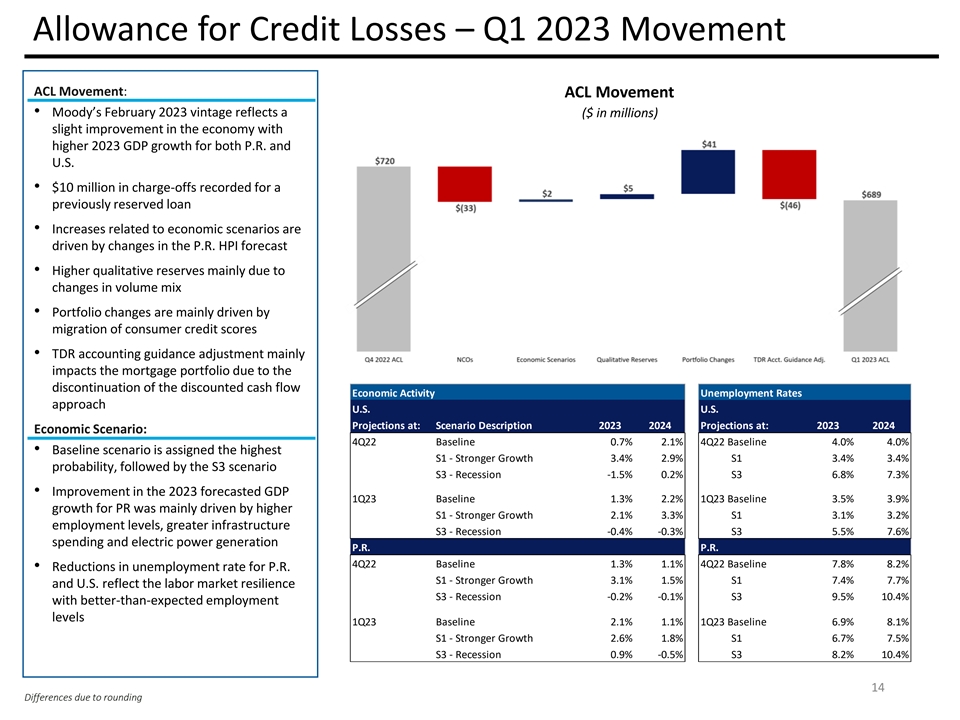
| • | At March 31, 2023, the ACL decreased by $31.2 million from the fourth quarter of 2022 to $689.1 million. The Financial Accounting Standards Board (“FASB”) issued Accounting Standards Update (“ASU”) 2022-02 in March 2022, which eliminates the accounting guidance for troubled debt restructures (“TDRs”) and the requirement to measure the effect of the concession from a loan modification, for which the Corporation used a discounted cash flow (“DCF”) method. This impact resulted in a release in the ACL of approximately $45.6 million, mostly as a result of our mortgage TDR portfolio, presented as an adjustment to the beginning balance of retained earnings, net of tax effect. Excluding the impact of ASU 2022-02, the ACL increased by $14.4 million mainly within the Puerto Rico region. The ACL incorporated updated macroeconomic scenarios for Puerto Rico and the United States. Given that any one economic outlook is inherently uncertain, the Corporation leverages multiple scenarios to estimate its ACL. The baseline scenario continues to be assigned the highest probability, followed by the pessimistic scenario. |
| • | The 2023 annualized GDP growth in the baseline scenario stands at 2.1% and 1.3% for Puerto Rico and the United States, respectively, increasing from 1.3% and 0.7% in the previous quarter. The 2023 forecasted average unemployment rate continues strong, improving quarter-over-quarter to 6.9% and 3.5% for Puerto Rico and United States, respectively, from 7.8% and 4.0% respectively, in the previous forecast. |
5
| • | Excluding ASU 2022-02 impact, in BPPR the ACL increased by $13.8 million, mostly driven by reductions in the P.R. Home Pricing Index (“HPI”) forecast, higher loan volumes and migration of consumer credit scores. In the PB segment the ACL remained essentially flat quarter-over-quarter. The Corporation’s ratio of the allowance for credit losses to loans held-in-portfolio was 2.13% in the first quarter of 2023, compared to 2.25% in the previous quarter. The ratio of the allowance for credit losses to NPLs held-in-portfolio stood at 167.1%, compared to 163.9% in the previous quarter. |
| • | The provision for credit losses for the loan portfolios for the first quarter of 2023 was an expense of $47.1 million, compared to an expense of $48.3 million in the previous quarter, reflecting the previously mentioned changes in the allowance for credit losses. The provision for the BPPR segment was an expense of $45.2 million, compared to an expense of $44.4 million in the previous quarter, while the provision for PB was an expense of $1.9 million, compared to an expense of $3.9 million in the previous quarter. |
| • | The provision for unfunded loan commitments, provision for credit losses on our loan and lease portfolios and provision for credit losses on our investment portfolio are aggregated and presented in the provision for credit losses caption in our Statement of Operations. |
Non-Performing Assets
| (Unaudited) |
||||||||||||
| (In thousands) |
31-Mar-23 | 31-Dec-22 | 31-Mar-22 | |||||||||
| Non-performing loans held-in-portfolio |
$ | 412,383 | $ | 439,441 | $ | 519,921 | ||||||
| Other real estate owned (“OREO”) |
91,721 | 89,126 | 90,567 | |||||||||
|
|
|
|
|
|
|
|||||||
| Total non-performing assets |
$ | 504,104 | $ | 528,567 | $ | 610,488 | ||||||
|
|
|
|
|
|
|
|||||||
| Net charge-offs (recoveries) for the quarter |
$ | 32,813 | $ | 31,200 | $ | 3,781 | ||||||
|
|
|
|
|
|
|
|||||||
| Ratios: |
||||||||||||
| Loans held-in-portfolio |
$ | 32,338,373 | $ | 32,077,769 | $ | 29,588,190 | ||||||
| Non-performing loans held-in-portfolio to loans held-in-portfolio |
1.28 | % | 1.37 | % | 1.76 | % | ||||||
| Allowance for credit losses to loans held-in-portfolio |
2.13 | 2.25 | 2.29 | |||||||||
| Allowance for credit losses to non-performing loans, excluding loans held-for-sale |
167.11 | 163.91 | 130.36 | |||||||||
Refer to Table M for additional information.
Provision for Credit Losses (Benefit) - Loan Portfolios
| (Unaudited) |
Quarters ended | |||||||||||
| (In thousands) |
31-Mar-23 | 31-Dec-22 | 31-Mar-22 | |||||||||
| Provision for credit losses (benefit) - loan portfolios: |
||||||||||||
| BPPR |
$ | 45,203 | $ | 44,383 | $ | (12,661 | ) | |||||
| Popular U.S. |
1,943 | 3,949 | (1,744 | ) | ||||||||
|
|
|
|
|
|
|
|||||||
| Total provision for credit losses (benefit) - loan portfolios |
$ | 47,146 | $ | 48,332 | $ | (14,405 | ) | |||||
|
|
|
|
|
|
|
|||||||
6
Credit Quality by Segment
| (Unaudited) | ||||||||||||
| (In thousands) |
Quarters ended | |||||||||||
| BPPR |
31-Mar-23 | 31-Dec-22 | 31-Mar-22 | |||||||||
| Provision for credit losses (benefit) - loan portfolios |
$ | 45,203 | $ | 44,383 | $ | (12,661 | ) | |||||
| Net charge-offs (recoveries) |
31,464 | 19,846 | 5,502 | |||||||||
| Total non-performing loans held-in-portfolio |
378,979 | 402,009 | 486,816 | |||||||||
| Allowance / loans held-in-portfolio |
2.57 | % | 2.73 | % | 2.74 | % | ||||||
| Allowance / non-performing loans held-in-portfolio |
154.89 | % | 153.12 | % | 118.45 | % | ||||||
| Quarters ended | ||||||||||||
| Popular U.S. |
31-Mar-23 | 31-Dec-22 | 31-Mar-22 | |||||||||
| Provision for credit losses (benefit) - loan portfolios |
$ | 1,943 | $ | 3,949 | $ | (1,744 | ) | |||||
| Net charge-offs (recoveries) |
1,349 | 11,354 | (1,721 | ) | ||||||||
| Total non-performing loans held-in-portfolio |
33,404 | 37,432 | 33,105 | |||||||||
| Allowance / loans held-in-portfolio |
1.07 | % | 1.10 | % | 1.18 | % | ||||||
| Allowance / non-performing loans held-in-portfolio |
305.69 | % | 279.86 | % | 305.64 | % | ||||||
Financial Condition Highlights
| (Unaudited) |
||||||||||||
| (In thousands) |
31-Mar-23 | 31-Dec-22 | 31-Mar-22 | |||||||||
| Cash and money market investments |
$ | 6,560,301 | $ | 6,084,096 | $ | 10,508,840 | ||||||
| Investment securities |
25,951,936 | 26,553,317 | 26,658,289 | |||||||||
| Loans |
32,338,373 | 32,077,769 | 29,588,190 | |||||||||
| Total assets |
67,675,759 | 67,637,917 | 69,525,082 | |||||||||
| Deposits |
60,953,888 | 61,227,227 | 62,862,295 | |||||||||
| Borrowings |
1,402,626 | 1,400,319 | 1,060,706 | |||||||||
| Total liabilities |
63,205,034 | 63,544,492 | 64,853,836 | |||||||||
| Stockholders’ equity |
4,470,725 | 4,093,425 | 4,671,246 | |||||||||
7
Total assets amounted to $67.7 billion at March 31, 2023, an increase of $37.8 million from the fourth quarter of 2022, driven by:
| • | an increase in overnight FED fund balances of $483.1 million, reflecting net funding activities and the issuance of the $400 million senior notes due in 2028, offset by loan originations, the repayment of short-term borrowings and the reduction in deposits discussed below; |
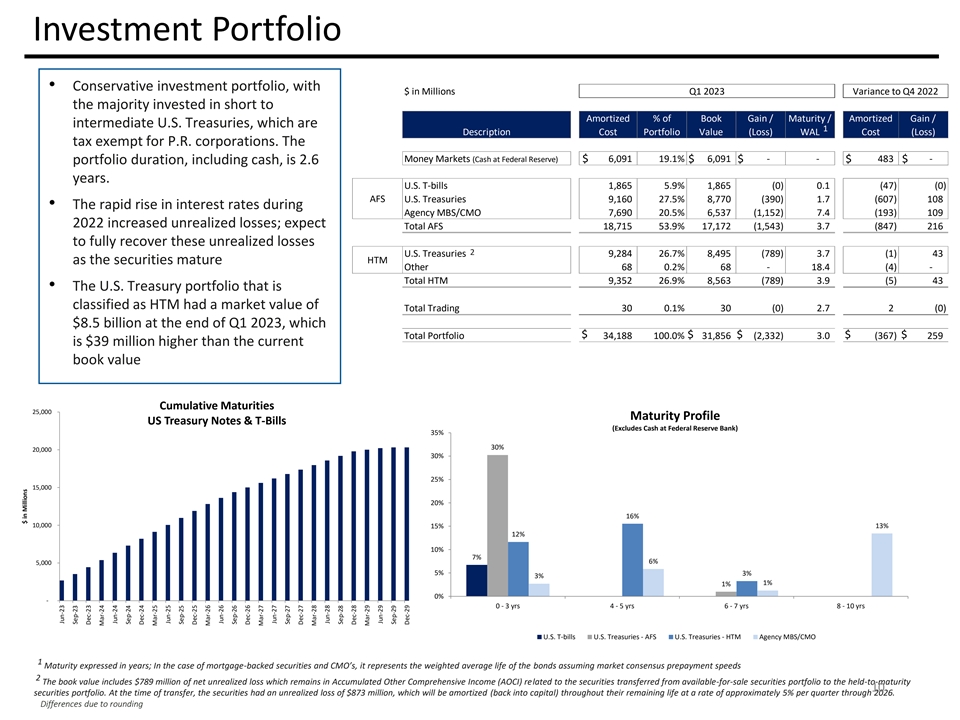
| • | an increase in securities held to maturity of $37.8 million, mainly due to the amortization of $42.0 million of the discount related to securities previously reclassified from the available-for-sale to held-to-maturity (“HTM”), which has an offsetting unrealized loss included within other comprehensive income that is also being accreted, resulting in a neutral effect to earnings; and |
| • | an increase in loans held-in-portfolio of $260.6 million, reflected across all portfolios in BPPR, and an increase in commercial loans at PB, offset by a decrease in its construction and consumer loans portfolio. |
partially offset by:
| • | a decrease in other assets of $144.5 million due to a positive variance of $125.3 million in securities trade receivable; and |
| • | a decrease in securities available for sale of $631.2 million reflecting repayment and maturities, offset by a reduction of $215.5 million in unrealized losses mainly from U.S. Treasury and mortgage-backed securities at BPPR. |
Total liabilities decreased by $339.5 million from the fourth quarter of 2022, driven by:
| • | a decrease of $273.3 million in deposits, mainly in public sector accounts as well as interest bearing retail deposits at BPPR, partially offset by an increase at PB, mainly from time and savings deposits gathered through its direct channel; and |
| • | a decrease in short term borrowings of $365.0 million due to the repayment of advances with the FHLB at Popular Bank |
partially offset by:
| • | an increase in notes payable of $392.4 million due to the issuance of $400 million in senior notes due on 2028. |
Stockholders’ equity increased by $377.3 million from the fourth quarter of 2022, principally due to net income for the quarter of $159.0 million, the after-tax impact of the favorable variance in net unrealized losses in the portfolio of available-for-sale securities of $191.8 million, the amortization of the unrealized losses from securities reclassified to HTM as described above of $33.6 million, and the adoption of the new ASU during the quarter of $28.8 million, partially offset by dividends declared for the quarter.
Common equity tier-1 ratio (“CET1”), common equity per share and tangible book value per share were 16.73%, $61.82 and $50.15, respectively, at March 31, 2023, compared to 16.39%, $56.66 and $44.97 at December 31, 2022. Refer to Table A for capital ratios.
During the first quarter of 2023 the Corporation had no material incremental use of its available liquidity sources. At March 31, 2023, the Corporation’s available liquidity increased to $18.3 billion from $17.0 billion on December 31, 2022. Refer to Table I for additional information on the Corporation’s liquidity sources.
8
Cautionary Note Regarding Forward-Looking Statements
This press release contains “forward-looking statements” within the meaning of the U.S. Private Securities Litigation Reform Act of 1995, including without limitation those regarding Popular’s business, financial condition, results of operations, plans, objectives and future performance. These statements are not guarantees of future performance, are based on management’s current expectations and, by their nature, involve risks, uncertainties, estimates and assumptions. Potential factors, some of which are beyond the Corporation’s control, could cause actual results to differ materially from those expressed in, or implied by, such forward-looking statements. Risks and uncertainties include, without limitation, the effect of competitive and economic factors, and our reaction to those factors, the adequacy of the allowance for loan losses, delinquency trends, market risk and the impact of interest rate changes, capital market conditions, capital adequacy and liquidity, the effect of legal and regulatory proceedings, new accounting standards on the Corporation’s financial condition and results of operations, the scope and duration of the COVID-19 pandemic (including the appearance of new strains of the virus), actions taken by governmental authorities in response thereto, and the direct and indirect impact of the pandemic on Popular, our customers, service providers and third parties. Other potential factors include Popular’s ability to successfully execute its transformation initiative, including, but not limited to, achieving projected earnings, efficiencies and return on tangible common equity and accurately anticipating costs and expenses associated therewith, changes to regulatory capital, liquidity and resolution-related requirements applicable to financial institutions in response to recent developments affecting the banking sector and the impact of bank failures or adverse developments at other banks and related negative media coverage of the banking industry in general on investor and depositor sentiment regarding the stability and liquidity of banks. All statements contained herein that are not clearly historical in nature, are forward-looking, and the words “anticipate,” “believe,” “continues,” “expect,” “estimate,” “intend,” “project” and similar expressions, and future or conditional verbs such as “will,” “would,” “should,” “could,” “might,” “can,” “may” or similar expressions, are generally intended to identify forward-looking statements.
More information on the risks and important factors that could affect the Corporation’s future results and financial condition is included in our Form 10-K for the year ended December 31, 2022 and in our Form 10-Q for the quarter ended March 31, 2023 to be filed with the Securities and Exchange Commission. Our filings are available on the Corporation’s website (www.popular.com) and on the Securities and Exchange Commission website (www.sec.gov). The Corporation assumes no obligation to update or revise any forward-looking statements or information which speak as of their respective dates.
About Popular, Inc.
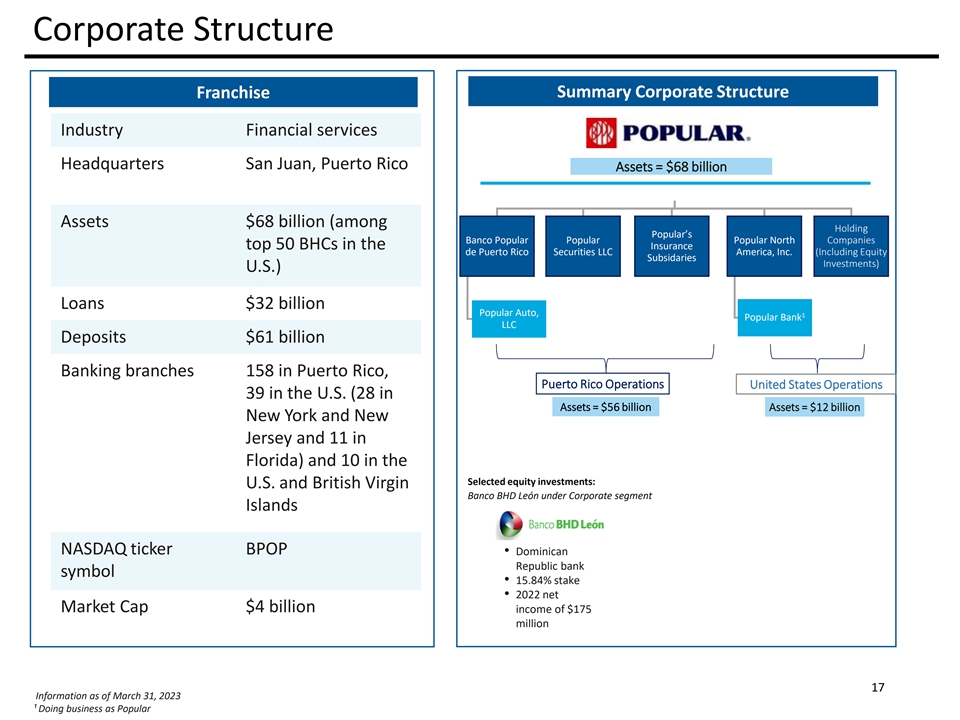
Popular, Inc. (NASDAQ: BPOP) is the leading financial institution in Puerto Rico, by both assets and deposits, and ranks among the top 50 U.S. bank holding companies by assets. Founded in 1893, Banco Popular de Puerto Rico, Popular’s principal subsidiary, provides retail, mortgage and commercial banking services in Puerto Rico and the U.S. Virgin Islands. Popular also offers in Puerto Rico auto and equipment leasing and financing, investment banking, broker-dealer and insurance services through specialized subsidiaries. In the mainland United States, Popular provides retail, mortgage and commercial banking services through its New York-chartered banking subsidiary, Popular Bank, which has branches located in New York, New Jersey and Florida.
Conference Call
Popular will hold a conference call to discuss its financial results today, Wednesday, April 26, 2023 at 11:00 a.m. Eastern Time. The call will be broadcast live over the Internet and can be accessed through the Investor Relations section of the Corporation’s website: www.popular.com.
Listeners are recommended to go to the website at least 15 minutes prior to the call to download and install any necessary audio software. The call may also be accessed through a dial-in telephone number 1-833-470-1428 (Toll Free) or 1-404-975-4839 (Local). The dial-in access code is 980053.
A replay of the webcast will be archived in Popular’s website. A telephone replay will be available one hour after the end of the conference call through Thursday, May 25, 2023. The replay dial in is: 1-866-813-9403 or 1-929-458-6194. The replay passcode is 275290.
An electronic version of this press release can be found at the Corporation’s website: www.popular.com.
9
Popular, Inc.
Financial Supplement to First Quarter 2023 Earnings Release
Table A - Selected Ratios and Other Information
Table B - Consolidated Statement of Operations
Table C - Consolidated Statement of Financial Condition
Table D - Analysis of Levels and Yields on a Taxable Equivalent Basis (Non-GAAP) - For the quarter ended March 31, 2023 and December 31, 2022
Table E - Analysis of Levels and Yields on a Taxable Equivalent Basis (Non-GAAP) - For the quarter ended March 31, 2023 and March 31, 2022
Table F - Analysis of Levels and Yields on a Taxable Equivalent Basis (Non-GAAP) - YEAR-TO-DATE [Left Blank]
Table G - Mortgage Banking Activities & Other Service Fees
Table H - Loans and Deposits
Table I - Liquidity Sources, Deposits and Borrowings
Table J - Loan Delinquency - PUERTO RICO OPERATIONS
Table K - Loan Delinquency - POPULAR U.S. OPERATIONS
Table L - Loan Delinquency - CONSOLIDATED
Table M - Non-Performing Assets
Table N - Activity in Non-Performing Loans
Table O - Allowance for Credit Losses, Net Charge-offs and Related Ratios
Table P - Allowance for Credit Losses - Loan Portfolios - CONSOLIDATED
Table Q - Allowance for Credit Losses - Loan Portfolios - PUERTO RICO OPERATIONS
Table R - Allowance for Credit Losses - Loan Portfolios - POPULAR U.S. OPERATIONS
Table S - Reconciliation to GAAP Financial Measures
10
POPULAR, INC.
Financial Supplement to First Quarter 2023 Earnings Release
Table A - Selected Ratios and Other Information
(Unaudited)
| Quarters ended | ||||||||||||
| 31-Mar-23 | 31-Dec-22 | 31-Mar-22 | ||||||||||
| Basic EPS |
$ | 2.22 | $ | 3.56 | $ | 2.69 | ||||||
| Diluted EPS |
$ | 2.22 | $ | 3.56 | $ | 2.69 | ||||||
| Average common shares outstanding |
71,541,778 | 72,101,177 | 78,443,706 | |||||||||
| Average common shares outstanding - assuming dilution |
71,606,196 | 72,192,680 | 78,595,463 | |||||||||
| Common shares outstanding at end of period |
71,965,984 | 71,853,720 | 76,487,523 | |||||||||
| Market value per common share |
$ | 57.41 | $ | 66.32 | $ | 81.74 | ||||||
| Market capitalization - (In millions) |
$ | 4,132 | $ | 4,765 | $ | 6,252 | ||||||
| Return on average assets |
0.93 | % | 1.44 | % | 1.14 | % | ||||||
| Return on average common equity |
10.00 | % | 16.59 | % | 14.38 | % | ||||||
| Net interest margin (non-taxable equivalent basis) |
3.22 | % | 3.28 | % | 2.75 | % | ||||||
| Net interest margin (taxable equivalent basis) -non-GAAP |
3.46 | % | 3.64 | % | 3.05 | % | ||||||
| Common equity per share |
$ | 61.82 | $ | 56.66 | $ | 60.78 | ||||||
| Tangible common book value per common share (non-GAAP) [1] |
$ | 50.15 | $ | 44.97 | $ | 51.16 | ||||||
| Tangible common equity to tangible assets (non-GAAP) [1] |
5.40 | % | 4.84 | % | 5.69 | % | ||||||
| Return on average tangible common equity [1] |
11.51 | % | 19.23 | % | 16.40 | % | ||||||
| Tier 1 capital |
16.79 | % | 16.45 | % | 16.33 | % | ||||||
| Total capital |
18.61 | % | 18.26 | % | 18.19 | % | ||||||
| Tier 1 leverage |
8.47 | % | 8.06 | % | 6.98 | % | ||||||
| Common Equity Tier 1 capital |
16.73 | % | 16.39 | % | 16.26 | % | ||||||
| [1] | Refer to Table S for reconciliation to GAAP financial measures. |
11
| POPULAR, INC. |
| |||||||||||||||||||
| Financial Supplement to First Quarter 2023 Earnings Release |
| |||||||||||||||||||
| Table B - Consolidated Statement of Operations |
| |||||||||||||||||||
| (Unaudited) |
| |||||||||||||||||||
| Quarters ended | Variance | Quarter ended | Variance | |||||||||||||||||
| Q1 2023 | Q1 2023 | |||||||||||||||||||
| (In thousands, except per share information) |
31-Mar-23 | 31-Dec-22 | vs. Q4 2022 | 31-Mar-22 | vs. Q1 2022 | |||||||||||||||
| Interest income: |
||||||||||||||||||||
| Loans |
$ | 541,210 | $ | 522,042 | $ | 19,168 | $ | 426,791 | $ | 114,419 | ||||||||||
| Money market investments |
65,724 | 50,908 | 14,816 | 6,464 | 59,260 | |||||||||||||||
| Investment securities |
132,088 | 140,244 | (8,156 | ) | 96,466 | 35,622 | ||||||||||||||
|
|
|
|
|
|
|
|
|
|
|
|||||||||||
| Total interest income |
739,022 | 713,194 | 25,828 | 529,721 | 209,301 | |||||||||||||||
|
|
|
|
|
|
|
|
|
|
|
|||||||||||
| Interest expense: |
||||||||||||||||||||
| Deposits |
193,215 | 139,338 | 53,877 | 24,783 | 168,432 | |||||||||||||||
| Short-term borrowings |
2,885 | 4,488 | (1,603 | ) | 80 | 2,805 | ||||||||||||||
| Long-term debt |
11,266 | 9,802 | 1,464 | 10,546 | 720 | |||||||||||||||
|
|
|
|
|
|
|
|
|
|
|
|||||||||||
| Total interest expense |
207,366 | 153,628 | 53,738 | 35,409 | 171,957 | |||||||||||||||
|
|
|
|
|
|
|
|
|
|
|
|||||||||||
| Net interest income |
531,656 | 559,566 | (27,910 | ) | 494,312 | 37,344 | ||||||||||||||
| Provision for credit losses (benefit) |
47,637 | 49,531 | (1,894 | ) | (15,500 | ) | 63,137 | |||||||||||||
|
|
|
|
|
|
|
|
|
|
|
|||||||||||
| Net interest income after provision for credit losses (benefit) |
484,019 | 510,035 | (26,016 | ) | 509,812 | (25,793 | ) | |||||||||||||
|
|
|
|
|
|
|
|
|
|
|
|||||||||||
| Service charges on deposit accounts |
34,678 | 34,682 | (4 | ) | 40,713 | (6,035 | ) | |||||||||||||
| Other service fees |
90,076 | 89,022 | 1,054 | 77,134 | 12,942 | |||||||||||||||
| Mortgage banking activities |
7,400 | 6,562 | 838 | 12,865 | (5,465 | ) | ||||||||||||||
| Net gain (loss), including impairment, on equity securities |
1,100 | 317 | 783 | (2,094 | ) | 3,194 | ||||||||||||||
| Net gain (loss) on trading account debt securities |
378 | 162 | 216 | (723 | ) | 1,101 | ||||||||||||||
| Adjustments to indemnity reserves on loans sold |
612 | (221 | ) | 833 | (745 | ) | 1,357 | |||||||||||||
| Other operating income |
27,717 | 27,941 | (224 | ) | 27,542 | 175 | ||||||||||||||
|
|
|
|
|
|
|
|
|
|
|
|||||||||||
| Total non-interest income |
161,961 | 158,465 | 3,496 | 154,692 | 7,269 | |||||||||||||||
|
|
|
|
|
|
|
|
|
|
|
|||||||||||
| Operating expenses: |
||||||||||||||||||||
| Personnel costs |
||||||||||||||||||||
| Salaries |
125,393 | 116,503 | 8,890 | 98,673 | 26,720 | |||||||||||||||
| Commissions, incentives and other bonuses |
31,162 | 39,570 | (8,408 | ) | 35,521 | (4,359 | ) | |||||||||||||
| Pension, postretirement and medical insurance |
15,378 | 12,452 | 2,926 | 12,783 | 2,595 | |||||||||||||||
| Other personnel costs, including payroll taxes |
26,827 | 21,612 | 5,215 | 20,019 | 6,808 | |||||||||||||||
|
|
|
|
|
|
|
|
|
|
|
|||||||||||
| Total personnel costs |
198,760 | 190,137 | 8,623 | 166,996 | 31,764 | |||||||||||||||
| Net occupancy expenses |
26,039 | 27,812 | (1,773 | ) | 24,723 | 1,316 | ||||||||||||||
| Equipment expenses |
8,412 | 9,828 | (1,416 | ) | 8,389 | 23 | ||||||||||||||
| Other taxes |
16,291 | 16,142 | 149 | 15,715 | 576 | |||||||||||||||
| Professional fees |
33,431 | 49,159 | (15,728 | ) | 36,792 | (3,361 | ) | |||||||||||||
| Technology and software expenses |
68,559 | 78,264 | (9,705 | ) | 70,535 | (1,976 | ) | |||||||||||||
| Processing and transactional services |
||||||||||||||||||||
| Credit and debit cards |
12,550 | 10,278 | 2,272 | 11,472 | 1,078 | |||||||||||||||
| Other processing and transactional services |
21,359 | 22,509 | (1,150 | ) | 19,481 | 1,878 | ||||||||||||||
|
|
|
|
|
|
|
|
|
|
|
|||||||||||
| Total processing and transactional services |
33,909 | 32,787 | 1,122 | 30,953 | 2,956 | |||||||||||||||
| Communications |
4,088 | 3,857 | 231 | 3,673 | 415 | |||||||||||||||
| Business promotion |
||||||||||||||||||||
| Rewards and customer loyalty programs |
12,348 | 13,538 | (1,190 | ) | 10,021 | 2,327 | ||||||||||||||
| Other business promotion |
6,523 | 14,596 | (8,073 | ) | 5,062 | 1,461 | ||||||||||||||
|
|
|
|
|
|
|
|
|
|
|
|||||||||||
| Total business promotion |
18,871 | 28,134 | (9,263 | ) | 15,083 | 3,788 | ||||||||||||||
| FDIC deposit insurance |
8,865 | 6,342 | 2,523 | 7,372 | 1,493 | |||||||||||||||
| Other real estate owned (OREO) income |
(1,694 | ) | (9,180 | ) | 7,486 | (2,713 | ) | 1,019 | ||||||||||||
| Other operating expenses |
||||||||||||||||||||
| Operational losses |
6,800 | 9,018 | (2,218 | ) | 11,825 | (5,025 | ) | |||||||||||||
| All other |
17,561 | 18,614 | (1,053 | ) | 12,105 | 5,456 | ||||||||||||||
|
|
|
|
|
|
|
|
|
|
|
|||||||||||
12
| Total other operating expenses |
24,361 | 27,632 | (3,271 | ) | 23,930 | 431 | ||||||||||||||
| Amortization of intangibles |
795 | 794 | 1 | 891 | (96 | ) | ||||||||||||||
|
|
|
|
|
|
|
|
|
|
|
|||||||||||
| Total operating expenses |
440,687 | 461,708 | (21,021 | ) | 402,339 | 38,348 | ||||||||||||||
|
|
|
|
|
|
|
|
|
|
|
|||||||||||
| Income before income tax |
205,293 | 206,792 | (1,499 | ) | 262,165 | (56,872 | ) | |||||||||||||
| Income tax (benefit) expense |
46,314 | (50,347 | ) | 96,661 | 50,479 | (4,165 | ) | |||||||||||||
| Net income |
$ | 158,979 | $ | 257,139 | $ | (98,160 | ) | $ | 211,686 | $ | (52,707 | ) | ||||||||
|
|
|
|
|
|
|
|
|
|
|
|||||||||||
| Net income applicable to common stock |
$ | 158,626 | $ | 256,786 | $ | (98,160 | ) | $ | 211,333 | $ | (52,707 | ) | ||||||||
|
|
|
|
|
|
|
|
|
|
|
|||||||||||
| Net income per common share - basic |
$ | 2.22 | $ | 3.56 | $ | (1.34 | ) | $ | 2.69 | $ | (0.47 | ) | ||||||||
|
|
|
|
|
|
|
|
|
|
|
|||||||||||
| Net income per common share - diluted |
$ | 2.22 | $ | 3.56 | $ | (1.34 | ) | $ | 2.69 | $ | (0.47 | ) | ||||||||
|
|
|
|
|
|
|
|
|
|
|
|||||||||||
| Dividends Declared per Common Share |
$ | 0.55 | $ | 0.55 | $ | — | $ | 0.55 | $ | — | ||||||||||
|
|
|
|
|
|
|
|
|
|
|
13
| Popular, Inc. |
| |||||||||||||||
| Financial Supplement to First Quarter 2023 Earnings Release |
| |||||||||||||||
| Table C - Consolidated Statement of Financial Condition |
| |||||||||||||||
| (Unaudited) |
| |||||||||||||||
| Variance | ||||||||||||||||
| Q1 2023 vs. | ||||||||||||||||
| (In thousands) |
31-Mar-23 | 31-Dec-22 | 31-Mar-22 | Q4 2022 | ||||||||||||
| Assets: |
||||||||||||||||
| Cash and due from banks |
$ | 462,013 | $ | 469,501 | $ | 439,148 | $ | (7,488 | ) | |||||||
| Money market investments |
6,098,288 | 5,614,595 | 10,069,692 | 483,693 | ||||||||||||
| Trading account debt securities, at fair value |
29,839 | 27,723 | 36,042 | 2,116 | ||||||||||||
| Debt securities available-for-sale, at fair value |
17,173,128 | 17,804,374 | 26,359,915 | (631,246 | ) | |||||||||||
| Debt securities held-to-maturity, at amortized cost |
8,563,052 | 8,525,366 | 75,984 | 37,686 | ||||||||||||
| Less: Allowance for credit losses |
6,792 | 6,911 | 7,844 | (119 | ) | |||||||||||
|
|
|
|
|
|
|
|
|
|||||||||
| Total debt securities held-to-maturity, net |
8,556,260 | 8,518,455 | 68,140 | 37,805 | ||||||||||||
|
|
|
|
|
|
|
|
|
|||||||||
| Equity securities |
185,917 | 195,854 | 186,348 | (9,937 | ) | |||||||||||
| Loans held-for-sale, at lower of cost or fair value |
11,181 | 5,381 | 55,150 | 5,800 | ||||||||||||
| Loans held-in-portfolio |
32,645,023 | 32,372,925 | 29,856,356 | 272,098 | ||||||||||||
| Less: Unearned income |
306,650 | 295,156 | 268,166 | 11,494 | ||||||||||||
| Allowance for credit losses |
689,120 | 720,302 | 677,792 | (31,182 | ) | |||||||||||
|
|
|
|
|
|
|
|
|
|||||||||
| Total loans held-in-portfolio, net |
31,649,253 | 31,357,467 | 28,910,398 | 291,786 | ||||||||||||
|
|
|
|
|
|
|
|
|
|||||||||
| Premises and equipment, net |
508,007 | 498,711 | 488,390 | 9,296 | ||||||||||||
| Other real estate |
91,721 | 89,126 | 90,567 | 2,595 | ||||||||||||
| Accrued income receivable |
239,815 | 240,195 | 204,466 | (380 | ) | |||||||||||
| Mortgage servicing rights, at fair value |
127,475 | 128,350 | 125,358 | (875 | ) | |||||||||||
| Other assets |
1,703,285 | 1,847,813 | 1,755,847 | (144,528 | ) | |||||||||||
| Goodwill |
827,428 | 827,428 | 720,293 | — | ||||||||||||
| Other intangible assets |
12,149 | 12,944 | 15,328 | (795 | ) | |||||||||||
|
|
|
|
|
|
|
|
|
|||||||||
| Total assets |
$ | 67,675,759 | $ | 67,637,917 | $ | 69,525,082 | $ | 37,842 | ||||||||
|
|
|
|
|
|
|
|
|
|||||||||
| Liabilities and Stockholders’ Equity: |
||||||||||||||||
| Liabilities: |
||||||||||||||||
| Deposits: |
||||||||||||||||
| Non-interest bearing |
$ | 15,940,850 | $ | 15,960,557 | $ | 16,096,666 | $ | (19,707 | ) | |||||||
| Interest bearing |
45,013,038 | 45,266,670 | 46,765,629 | (253,632 | ) | |||||||||||
|
|
|
|
|
|
|
|
|
|||||||||
| Total deposits |
60,953,888 | 61,227,227 | 62,862,295 | (273,339 | ) | |||||||||||
|
|
|
|
|
|
|
|
|
|||||||||
| Assets sold under agreements to repurchase |
123,499 | 148,609 | 72,819 | (25,110 | ) | |||||||||||
| Other short-term borrowings |
— | 365,000 | — | (365,000 | ) | |||||||||||
| Notes payable |
1,279,127 | 886,710 | 987,887 | 392,417 | ||||||||||||
| Other liabilities |
848,520 | 916,946 | 930,835 | (68,426 | ) | |||||||||||
|
|
|
|
|
|
|
|
|
|||||||||
| Total liabilities |
63,205,034 | 63,544,492 | 64,853,836 | (339,458 | ) | |||||||||||
|
|
|
|
|
|
|
|
|
|||||||||
| Stockholders’ equity: |
||||||||||||||||
| Preferred stock |
22,143 | 22,143 | 22,143 | — | ||||||||||||
| Common stock |
1,047 | 1,047 | 1,046 | — | ||||||||||||
| Surplus |
4,792,619 | 4,790,993 | 4,571,111 | 1,626 | ||||||||||||
| Retained earnings |
3,982,140 | 3,834,348 | 3,143,004 | 147,792 | ||||||||||||
| Treasury stock |
(2,025,399 | ) | (2,030,178 | ) | (1,668,820 | ) | 4,779 | |||||||||
| Accumulated other comprehensive loss, net of tax |
(2,301,825 | ) | (2,524,928 | ) | (1,397,238 | ) | 223,103 | |||||||||
|
|
|
|
|
|
|
|
|
|||||||||
| Total stockholders’ equity |
4,470,725 | 4,093,425 | 4,671,246 | 377,300 | ||||||||||||
|
|
|
|
|
|
|
|
|
|||||||||
| Total liabilities and stockholders’ equity |
$ | 67,675,759 | $ | 67,637,917 | $ | 69,525,082 | $ | 37,842 | ||||||||
|
|
|
|
|
|
|
|
|
|||||||||
14
| Popular, Inc. | ||||||||||||||||||||||||||||||||||||||||||||
| Financial Supplement to First Quarter 2023 Earnings Release | ||||||||||||||||||||||||||||||||||||||||||||
| Table D - Analysis of Levels and Yields on a Taxable Equivalent Basis (Non-GAAP) | ||||||||||||||||||||||||||||||||||||||||||||
| For the quarters ended March 31, 2023 and December 31, 2022 | ||||||||||||||||||||||||||||||||||||||||||||
| (Unaudited) | ||||||||||||||||||||||||||||||||||||||||||||
| Average Volume | Average Yields / Costs | Interest | Variance Attributable to |
|||||||||||||||||||||||||||||||||||||||||
| 31-Mar-23 |
31-Dec-22 | Variance | 31-Mar-23 | 31-Dec-22 | Variance | 31-Mar-23 | 31-Dec-22 | Variance | Rate | Volume | ||||||||||||||||||||||||||||||||||
| (In millions) | (In thousands) | |||||||||||||||||||||||||||||||||||||||||||
| $ | 5,736 | $ | 5,262 | $ | 474 | 4.65 | % | 3.84 | % | 0.81 | % | Money market investments |
$ | 65,724 | $ | 50,907 | $ | 14,817 | $ | 9,946 | $ | 4,871 | ||||||||||||||||||||||
| 28,862 | 30,843 | (1,981 | ) | 2.22 | 2.44 | (0.22 | ) | Investment securities [1] |
158,914 | 189,189 | (30,275 | ) | (19,127 | ) | (11,148 | ) | ||||||||||||||||||||||||||||
| 31 | 30 | 1 | 4.47 | 4.28 | 0.19 | Trading securities |
338 | 325 | 13 | 7 | 6 | |||||||||||||||||||||||||||||||||
|
|
|
|
|
|
|
|
|
|
|
|
|
|
|
|
|
|
|
|
|
|
|
|||||||||||||||||||||||
| 34,629 | 36,135 | (1,506 | ) | 2.63 | 2.65 | (0.02 | ) | Total money market, investment and trading securities |
224,976 | 240,421 | (15,445 | ) | (9,174 | ) | (6,271 | ) | ||||||||||||||||||||||||||||
|
|
|
|
|
|
|
|
|
|
|
|
|
|
|
|
|
|
|
|
|
|
|
|||||||||||||||||||||||
| Loans: |
||||||||||||||||||||||||||||||||||||||||||||
| 15,761 | 15,503 | 258 | 6.32 | 6.01 | 0.31 | Commercial |
245,469 | 234,707 | 10,762 | 6,824 | 3,938 | |||||||||||||||||||||||||||||||||
| 732 | 769 | (37 | ) | 8.40 | 7.54 | 0.86 | Construction |
15,155 | 14,615 | 540 | 1,263 | (723 | ) | |||||||||||||||||||||||||||||||
| 1,588 | 1,557 | 31 | 6.12 | 5.92 | 0.20 | Leasing |
24,282 | 23,049 | 1,233 | 760 | 473 | |||||||||||||||||||||||||||||||||
| 7,388 | 7,346 | 42 | 5.46 | 5.38 | 0.08 | Mortgage |
100,773 | 98,880 | 1,893 | 1,330 | 563 | |||||||||||||||||||||||||||||||||
| 3,020 | 2,961 | 59 | 12.85 | 12.26 | 0.59 | Consumer |
95,715 | 91,519 | 4,196 | 2,078 | 2,118 | |||||||||||||||||||||||||||||||||
| 3,559 | 3,576 | (17 | ) | 8.14 | 7.98 | 0.16 | Auto |
71,407 | 71,910 | (503 | ) | (173 | ) | (330 | ) | |||||||||||||||||||||||||||||
|
|
|
|
|
|
|
|
|
|
|
|
|
|
|
|
|
|
|
|
|
|
|
|||||||||||||||||||||||
| 32,048 | 31,712 | 336 | 6.97 | 6.70 | 0.27 | Total loans |
552,801 | 534,680 | 18,121 | 12,082 | 6,039 | |||||||||||||||||||||||||||||||||
|
|
|
|
|
|
|
|
|
|
|
|
|
|
|
|
|
|
|
|
|
|
|
|||||||||||||||||||||||
| $ | 66,677 | $ | 67,847 | $ | (1,170 | ) | 4.72 | % | 4.54 | % | 0.18 | % | Total earning assets |
$ | 777,777 | $ | 775,101 | $ | 2,676 | $ | 2,908 | $ | (232 | ) | ||||||||||||||||||||
|
|
|
|
|
|
|
|
|
|
|
|
|
|
|
|
|
|
|
|
|
|
|
|||||||||||||||||||||||
| Interest bearing deposits: |
||||||||||||||||||||||||||||||||||||||||||||
| $ | 23,313 | $ | 24,399 | $ | (1,086 | ) | 2.52 | % | 1.73 | % | 0.79 | % | NOW and money market [2] |
$ | 144,970 | $ | 106,591 | $ | 38,379 | $ | 42,884 | $ | (4,505 | ) | ||||||||||||||||||||
| 15,029 | 15,248 | (219 | ) | 0.47 | 0.29 | 0.18 | Savings |
17,443 | 10,971 | 6,472 | 6,771 | (299 | ) | |||||||||||||||||||||||||||||||
| 7,099 | 6,675 | 424 | 1.76 | 1.29 | 0.47 | Time deposits |
30,802 | 21,776 | 9,026 | 7,264 | 1,762 | |||||||||||||||||||||||||||||||||
|
|
|
|
|
|
|
|
|
|
|
|
|
|
|
|
|
|
|
|
|
|
|
|||||||||||||||||||||||
| 45,441 | 46,322 | (881 | ) | 1.72 | 1.19 | 0.53 | Total interest bearing deposits |
193,215 | 139,338 | 53,877 | 56,919 | (3,042 | ) | |||||||||||||||||||||||||||||||
|
|
|
|
|
|
|
|
|
|
|
|
|
|
|
|
|
|
|
|
|
|
|
|||||||||||||||||||||||
| 15,704 | 16,110 | (406 | ) | Non-interest bearing demand deposits |
||||||||||||||||||||||||||||||||||||||||
|
|
|
|
|
|
|
|
|
|
|
|
|
|
|
|
|
|
|
|
|
|
|
|||||||||||||||||||||||
| 61,145 | 62,432 | (1,287 | ) | 1.28 | 0.89 | 0.39 | Total deposits |
193,215 | 139,338 | 53,877 | 56,919 | (3,042 | ) | |||||||||||||||||||||||||||||||
|
|
|
|
|
|
|
|
|
|
|
|
|
|
|
|
|
|
|
|
|
|
|
|||||||||||||||||||||||
| 247 | 450 | (203 | ) | 4.74 | 3.96 | 0.78 | Short-term borrowings |
2,885 | 4,488 | (1,603 | ) | 710 | (2,313 | ) | ||||||||||||||||||||||||||||||
| 947 | 913 | 34 | 4.78 | 4.30 | 0.48 | Other medium and long-term debt |
11,266 | 9,802 | 1,464 | 855 | 609 | |||||||||||||||||||||||||||||||||
|
|
|
|
|
|
|
|
|
|
|
|
|
|
|
|
|
|
|
|
|
|
|
|||||||||||||||||||||||
| 46,635 | 47,685 | (1,050 | ) | 1.80 | 1.28 | 0.52 | Total interest bearing liabilities (excluding demand deposits) |
207,366 | 153,628 | 53,738 | 58,484 | (4,746 | ) | |||||||||||||||||||||||||||||||
|
|
|
|
|
|
|
|
|
|
|
|
|
|
|
|
|
|
|
|
|
|
|
|||||||||||||||||||||||
| 4,338 | 4,052 | 286 | Other sources of funds |
|||||||||||||||||||||||||||||||||||||||||
|
|
|
|
|
|
|
|
|
|
|
|
|
|
|
|
|
|
|
|
|
|
|
|||||||||||||||||||||||
| $ | 66,677 | $ | 67,847 | $ | (1,170 | ) | 1.26 | % | 0.90 | % | 0.36 | % | Total source of funds |
207,366 | 153,628 | 53,738 | 58,484 | (4,746 | ) | |||||||||||||||||||||||||
|
|
|
|
|
|
|
|
|
|
|
|
|
|||||||||||||||||||||||||||||||||
| 3.46 | % | 3.64 | % | (0.18 | )% | Net interest margin/income on a taxable equivalent basis (Non-GAAP) |
570,411 | 621,473 | (51,062 | ) | $ | (55,576 | ) | $ | 4,514 | |||||||||||||||||||||||||||||
|
|
|
|
|
|
|
|
|
|
|
|
|
|
|
|
|
|||||||||||||||||||||||||||||
| 2.92 | % | 3.26 | % | (0.34 | )% | Net interest spread |
||||||||||||||||||||||||||||||||||||||
|
|
|
|
|
|
|
|||||||||||||||||||||||||||||||||||||||
| Taxable equivalent adjustment |
38,755 | 61,907 | (23,152 | ) | ||||||||||||||||||||||||||||||||||||||||
|
|
|
|
|
|
|
|||||||||||||||||||||||||||||||||||||||
| 3.22 | % | 3.28 | % | (0.06 | )% | Net interest margin/income non-taxable equivalent basis (GAAP) |
$ | 531,656 | $ | 559,566 | $ | (27,910 | ) | |||||||||||||||||||||||||||||||
|
|
|
|
|
|
|
|
|
|
|
|
|
|||||||||||||||||||||||||||||||||
Note: The changes that are not due solely to volume or rate are allocated to volume and rate based on the proportion of the change in each category.
| [1] | Average balances exclude unrealized gains or losses on debt securities available-for-sale and the unrealized loss related to certain securities transferred from available-for-sale to held-to-maturity. |
| [2] | Includes interest bearing demand deposits corresponding to certain government entities in Puerto Rico. |
15
Popular, Inc.
Financial Supplement to First Quarter 2023 Earnings Release
Table E - Analysis of Levels and Yields on a Taxable Equivalent Basis (Non-GAAP)
For the quarters ended March 31, 2023 and March 31, 2022
(Unaudited)
| Average Volume | Average Yields / Costs | Interest | Variance Attributable to |
|||||||||||||||||||||||||||||||||||||||||
|
31-Mar-23 |
31-Mar-22 | Variance | 31-Mar-23 | 31-Mar-22 | Variance | 31-Mar-23 | 31-Mar-22 | Variance | Rate | Volume | ||||||||||||||||||||||||||||||||||
| (In millions) | (In thousands) | |||||||||||||||||||||||||||||||||||||||||||
| $ | 5,736 | $ | 14,763 | $ | (9,027 | ) | 4.65 | % | 0.18 | % | 4.47 | % | Money market investments |
$ | 65,724 | $ | 6,464 | $ | 59,260 | $ | 65,572 | $ | (6,312 | ) | ||||||||||||||||||||
| 28,862 | 28,471 | 391 | 2.22 | 1.95 | 0.27 | Investment securities [1] |
158,914 | 137,350 | 21,564 | 21,280 | 284 | |||||||||||||||||||||||||||||||||
| 31 | 70 | (39 | ) | 4.47 | 5.90 | (1.43 | ) | Trading securities |
338 | 1,019 | (681 | ) | (206 | ) | (475 | ) | ||||||||||||||||||||||||||||
|
|
|
|
|
|
|
|
|
|
|
|
|
|
|
|
|
|
|
|
|
|
|
|||||||||||||||||||||||
| 34,629 | 43,304 | (8,675 | ) | 2.63 | 1.35 | 1.28 | Total money market, investment and trading securities |
224,976 | 144,833 | 80,143 | 86,646 | (6,503 | ) | |||||||||||||||||||||||||||||||
|
|
|
|
|
|
|
|
|
|
|
|
|
|
|
|
|
|
|
|
|
|
|
|||||||||||||||||||||||
| Loans: | ||||||||||||||||||||||||||||||||||||||||||||
| 15,761 | 13,741 | 2,020 | 6.32 | 5.08 | 1.24 | Commercial |
245,469 | 172,128 | 73,341 | 45,728 | 27,613 | |||||||||||||||||||||||||||||||||
| 732 | 727 | 5 | 8.40 | 5.45 | 2.95 | Construction | 15,155 | 9,758 | 5,397 | 5,320 | 77 | |||||||||||||||||||||||||||||||||
| 1,588 | 1,393 | 195 | 6.12 | 5.95 | 0.17 | Leasing | 24,282 | 20,720 | 3,562 | 586 | 2,976 | |||||||||||||||||||||||||||||||||
| 7,388 | 7,388 | — | 5.46 | 5.24 | 0.22 | Mortgage | 100,773 | 96,768 | 4,005 | 4,005 | — | |||||||||||||||||||||||||||||||||
| 3,020 | 2,537 | 483 | 12.85 | 11.20 | 1.65 | Consumer | 95,715 | 70,062 | 25,653 | 11,118 | 14,535 | |||||||||||||||||||||||||||||||||
| 3,559 | 3,460 | 99 | 8.14 | 8.12 | 0.02 | Auto | 71,407 | 69,252 | 2,155 | 169 | 1,986 | |||||||||||||||||||||||||||||||||
|
|
|
|
|
|
|
|
|
|
|
|
|
|
|
|
|
|
|
|
|
|
|
|||||||||||||||||||||||
| 32,048 | 29,246 | 2,802 | 6.97 | 6.06 | 0.91 | Total loans |
552,801 | 438,688 | 114,113 | 66,926 | 47,187 | |||||||||||||||||||||||||||||||||
|
|
|
|
|
|
|
|
|
|
|
|
|
|
|
|
|
|
|
|
|
|
|
|||||||||||||||||||||||
| $ | 66,677 | $ | 72,550 | $ | (5,873 | ) | 4.72 | % | 3.25 | % | 1.47 | % | Total earning assets |
$ | 777,777 | $ | 583,521 | $ | 194,256 | $ | 153,572 | $ | 40,684 | |||||||||||||||||||||
|
|
|
|
|
|
|
|
|
|
|
|
|
|
|
|
|
|
|
|
|
|
|
|||||||||||||||||||||||
| Interest bearing deposits: |
||||||||||||||||||||||||||||||||||||||||||||
| $ | 23,313 | $ | 28,288 | $ | (4,975 | ) | 2.52 | % | 0.10 | % | 2.42 | % | NOW and money market [2] |
$ | 144,970 | $ | 7,323 | $ | 137,647 | $ | 139,459 | $ | (1,812 | ) | ||||||||||||||||||||
| 15,029 | 16,434 | (1,405 | ) | 0.47 | 0.16 | 0.31 | Savings |
17,443 | 6,564 | 10,879 | 12,314 | (1,435 | ) | |||||||||||||||||||||||||||||||
| 7,099 | 6,737 | 362 | 1.76 | 0.66 | 1.10 | Time deposits |
30,802 | 10,896 | 19,906 | 16,703 | 3,203 | |||||||||||||||||||||||||||||||||
|
|
|
|
|
|
|
|
|
|
|
|
|
|
|
|
|
|
|
|
|
|
|
|||||||||||||||||||||||
| 45,441 | 51,459 | (6,018 | ) | 1.72 | 0.20 | 1.52 | Total interest bearing deposits |
193,215 | 24,783 | 168,432 | 168,476 | (44 | ) | |||||||||||||||||||||||||||||||
|
|
|
|
|
|
|
|
|
|
|
|
|
|
|
|
|
|
|
|
|
|
|
|||||||||||||||||||||||
| 15,704 | 16,143 | (439 | ) | Non-interest bearing demand deposits |
||||||||||||||||||||||||||||||||||||||||
|
|
|
|
|
|
|
|
|
|
|
|
|
|
|
|
|
|
|
|
|
|
|
|||||||||||||||||||||||
| 61,145 | 67,602 | (6,457 | ) | 1.28 | 0.15 | 1.13 | Total deposits |
193,215 | 24,783 | 168,432 | 168,476 | (44 | ) | |||||||||||||||||||||||||||||||
|
|
|
|
|
|
|
|
|
|
|
|
|
|
|
|
|
|
|
|
|
|
|
|||||||||||||||||||||||
| 247 | 91 | 156 | 4.74 | 0.36 | 4.38 | Short-term borrowings |
2,885 | 80 | 2,805 | 2,081 | 724 | |||||||||||||||||||||||||||||||||
| 947 | 1,013 | (66 | ) | 4.78 | 4.18 | 0.60 | Other medium and long-term debt |
11,266 | 10,546 | 720 | 426 | 294 | ||||||||||||||||||||||||||||||||
|
|
|
|
|
|
|
|
|
|
|
|
|
|
|
|
|
|
|
|
|
|
|
|||||||||||||||||||||||
| 46,635 | 52,563 | (5,928 | ) | 1.80 | 0.27 | 1.53 | Total interest bearing liabilities (excluding demand deposits) |
207,366 | 35,409 | 171,957 | 170,983 | 974 | ||||||||||||||||||||||||||||||||
|
|
|
|
|
|
|
|
|
|
|
|
|
|
|
|
|
|
|
|
|
|
|
|||||||||||||||||||||||
| 4,338 | 3,844 | 494 | Other sources of funds |
|||||||||||||||||||||||||||||||||||||||||
|
|
|
|
|
|
|
|
|
|
|
|
|
|
|
|
|
|
|
|
|
|
|
|||||||||||||||||||||||
| $ | 66,677 | $ | 72,550 | $ | (5,873 | ) | 1.26 | % | 0.20 | % | 1.06 | % | Total source of funds |
207,366 | 35,409 | 171,957 | 170,983 | 974 | ||||||||||||||||||||||||||
|
|
|
|
|
|
|
|
|
|
|
|
|
|||||||||||||||||||||||||||||||||
| 3.46 | % | 3.05 | % | 0.41 | % | Net interest margin/income on a taxable equivalent basis (Non-GAAP) |
570,411 | 548,112 | 22,299 | $ | (17,411 | ) | $ | 39,710 | ||||||||||||||||||||||||||||||
|
|
|
|
|
|
|
|
|
|
|
|
|
|
|
|
|
|||||||||||||||||||||||||||||
| 2.92 | % | 2.98 | % | (0.06 | )% | Net interest spread |
||||||||||||||||||||||||||||||||||||||
|
|
|
|
|
|
|
|||||||||||||||||||||||||||||||||||||||
| Taxable equivalent adjustment |
38,755 | 53,800 | (15,045 | ) | ||||||||||||||||||||||||||||||||||||||||
|
|
|
|
|
|
|
|||||||||||||||||||||||||||||||||||||||
| 3.22 | % | 2.75 | % | 0.47 | % | Net interest margin/income non-taxable equivalent basis (GAAP) |
$ | 531,656 | $ | 494,312 | $ | 37,344 | ||||||||||||||||||||||||||||||||
|
|
|
|
|
|
|
|
|
|
|
|
|
|||||||||||||||||||||||||||||||||
Note: The changes that are not due solely to volume or rate are allocated to volume and rate based on the proportion of the change in each category.
| [1] | Average balances exclude unrealized gains or losses on debt securities available-for-sale and the unrealized loss related to certain securities transferred from available-for-sale to held-to-maturity. |
| [2] | Includes interest bearing demand deposits corresponding to certain government entities in Puerto Rico. |
16
| Popular, Inc. |
| Financial Supplement to First Quarter 2023 Earnings Release |
| Table F – Analysis of Levels and Yields on a Taxable Equivalent Basis (Non-GAAP) - YEAR-TO-DATE |
[THIS PAGE INTENTIONALLY LEFT BLANK]
17
| Popular, Inc. |
| Financial Supplement to First Quarter 2023 Earnings Release |
| Table G - Mortgage Banking Activities and Other Service Fees |
| (Unaudited) |
| Mortgage Banking Activities |
| Quarters ended | Variance | |||||||||||||||||||
| (In thousands) |
31-Mar-23 | 31-Dec-22 | 31-Mar-22 | Q1 2023 vs.Q4 2022 |
Q1 2023 vs.Q1 2022 |
|||||||||||||||
| Mortgage servicing fees, net of fair value adjustments: |
||||||||||||||||||||
| Mortgage servicing fees |
$ | 8,689 | $ | 8,852 | $ | 9,323 | $ | (163 | ) | $ | (634 | ) | ||||||||
| Mortgage servicing rights fair value adjustments |
(1,376 | ) | (2,610 | ) | 1,088 | 1,234 | (2,464 | ) | ||||||||||||
|
|
|
|
|
|
|
|
|
|
|
|||||||||||
| Total mortgage servicing fees, net of fair value adjustments |
7,313 | 6,242 | 10,411 | 1,071 | (3,098 | ) | ||||||||||||||
|
|
|
|
|
|
|
|
|
|
|
|||||||||||
| Net gain (loss) on sale of loans, including valuation on loans held-for-sale |
263 | 123 | (1,534 | ) | 140 | 1,797 | ||||||||||||||
|
|
|
|
|
|
|
|
|
|
|
|||||||||||
| Trading account (loss) profit: |
||||||||||||||||||||
| Unrealized (loss) gains on outstanding derivative positions |
(131 | ) | — | 2 | (131 | ) | (133 | ) | ||||||||||||
| Realized gains on closed derivative positions |
56 | 310 | 4,135 | (254 | ) | (4,079 | ) | |||||||||||||
|
|
|
|
|
|
|
|
|
|
|
|||||||||||
| Total trading account (loss) profit |
(75 | ) | 310 | 4,137 | (385 | ) | (4,212 | ) | ||||||||||||
|
|
|
|
|
|
|
|
|
|
|
|||||||||||
| Losses on repurchased loans, including interest advances |
(101 | ) | (113 | ) | (149 | ) | 12 | 48 | ||||||||||||
|
|
|
|
|
|
|
|
|
|
|
|||||||||||
| Total mortgage banking activities |
$ | 7,400 | $ | 6,562 | $ | 12,865 | $ | 838 | $ | (5,465 | ) | |||||||||
|
|
|
|
|
|
|
|
|
|
|
|||||||||||
Other Service Fees
| Quarters ended | Variance | |||||||||||||||||||
| (In thousands) |
31-Mar-23 | 31-Dec-22 | 31-Mar-22 | Q1 2023 vs.Q4 2022 |
Q1 2023 vs.Q1 2022 |
|||||||||||||||
| Other service fees: |
||||||||||||||||||||
| Debit card fees |
$ | 13,166 | $ | 13,379 | $ | 11,779 | $ | (213 | ) | $ | 1,387 | |||||||||
| Insurance fees |
13,873 | 14,587 | 14,156 | (714 | ) | (283 | ) | |||||||||||||
| Credit card fees |
40,498 | 39,777 | 33,642 | 721 | 6,856 | |||||||||||||||
| Sale and administration of investment products |
6,558 | 5,793 | 5,791 | 765 | 767 | |||||||||||||||
| Trust fees |
5,775 | 5,223 | 5,927 | 552 | (152 | ) | ||||||||||||||
| Other fees |
10,206 | 10,263 | 5,839 | (57 | ) | 4,367 | ||||||||||||||
|
|
|
|
|
|
|
|
|
|
|
|||||||||||
| Total other service fees |
$ | 90,076 | $ | 89,022 | $ | 77,134 | $ | 1,054 | $ | 12,942 | ||||||||||
|
|
|
|
|
|
|
|
|
|
|
|||||||||||
18
| Popular, Inc. |
| Financial Supplement to First Quarter 2023 Earnings Release |
| Table H - Loans and Deposits |
| (Unaudited) |
| Loans - Ending Balances |
| Variance | ||||||||||||||||||||
| (In thousands) |
31-Mar-23 | 31-Dec-22 | 31-Mar-22 | Q1 2023 vs.Q4 2022 |
Q1 2023 vs.Q1 2022 |
|||||||||||||||
| Loans held-in-portfolio: |
||||||||||||||||||||
| Commercial |
$ | 16,005,261 | $ | 15,739,132 | $ | 14,028,246 | $ | 266,129 | $ | 1,977,015 | ||||||||||
| Construction |
698,996 | 757,984 | 744,783 | (58,988 | ) | (45,787 | ) | |||||||||||||
| Leasing |
1,614,344 | 1,585,739 | 1,426,122 | 28,605 | 188,222 | |||||||||||||||
| Mortgage |
7,405,907 | 7,397,471 | 7,326,346 | 8,436 | 79,561 | |||||||||||||||
| Auto |
3,517,940 | 3,512,530 | 3,430,162 | 5,410 | 87,778 | |||||||||||||||
| Consumer |
3,095,925 | 3,084,913 | 2,632,531 | 11,012 | 463,394 | |||||||||||||||
|
|
|
|
|
|
|
|
|
|
|
|||||||||||
| Total loans held-in-portfolio |
$ | 32,338,373 | $ | 32,077,769 | $ | 29,588,190 | $ | 260,604 | $ | 2,750,183 | ||||||||||
|
|
|
|
|
|
|
|
|
|
|
|||||||||||
| Loans held-for-sale: |
||||||||||||||||||||
| Mortgage |
$ | 11,181 | $ | 5,381 | $ | 55,150 | $ | 5,800 | $ | (43,969 | ) | |||||||||
|
|
|
|
|
|
|
|
|
|
|
|||||||||||
| Total loans held-for-sale |
$ | 11,181 | $ | 5,381 | $ | 55,150 | $ | 5,800 | $ | (43,969 | ) | |||||||||
|
|
|
|
|
|
|
|
|
|
|
|||||||||||
| Total loans |
$ | 32,349,554 | $ | 32,083,150 | $ | 29,643,340 | $ | 266,404 | $ | 2,706,214 | ||||||||||
|
|
|
|
|
|
|
|
|
|
|
|||||||||||
Deposits - Ending Balances
| Variance | ||||||||||||||||||||
| (In thousands) |
31-Mar-23 | 31-Dec-22 | 31-Mar-22 | Q1 2023 vs. Q4 2022 |
Q1 2023 vs.Q1 2022 |
|||||||||||||||
| Demand deposits [1] |
$ | 26,191,672 | $ | 26,382,605 | $ | 25,684,715 | $ | (190,933 | ) | $ | 506,957 | |||||||||
| Savings, NOW and money market deposits (non-brokered) |
26,622,020 | 27,265,156 | 29,318,333 | (643,136 | ) | (2,696,313 | ) | |||||||||||||
| Savings, NOW and money market deposits (brokered) |
734,069 | 798,064 | 768,558 | (63,995 | ) | (34,489 | ) | |||||||||||||
| Time deposits (non-brokered) |
6,891,051 | 6,442,886 | 6,964,848 | 448,165 | (73,797 | ) | ||||||||||||||
| Time deposits (brokered CDs) |
515,076 | 338,516 | 125,841 | 176,560 | 389,235 | |||||||||||||||
|
|
|
|
|
|
|
|
|
|
|
|||||||||||
| Total deposits |
$ | 60,953,888 | $ | 61,227,227 | $ | 62,862,295 | $ | (273,339 | ) | $ | (1,908,407 | ) | ||||||||
|
|
|
|
|
|
|
|
|
|
|
|||||||||||
| [1] | Includes interest and non-interest bearing demand deposits. |
19
| Popular, Inc. |
| Financial Supplement to First Quarter 2023 Earnings Release |
| Table I - Liquidity Sources, Deposits and Borrowings |
| (Unaudited) |
| Liquidity Sources | 31-Mar-23 | 31-Dec-22 | ||||||||||||||||||||||
| (In thousands) |
BPPR | Popular U.S. | Total | BPPR | Popular U.S. | Total | ||||||||||||||||||
| Unpledged securities and unused funding sources: |
||||||||||||||||||||||||
| Money market (excess funds at the Federal Reserve Bank) |
$ | 5,181,531 | $ | 909,613 | $ | 6,091,144 | $ | 5,240,100 | $ | 367,966 | $ | 5,608,066 | ||||||||||||
| Unpledged securities |
7,690,887 | 273,980 | 7,694,867 | 7,494,189 | 326,599 | 7,820,788 | ||||||||||||||||||
| FHLB borrowing capacity |
1,623,246 | 1,127,316 | 2,750,562 | 1,389,579 | 722,005 | 2,111,584 | ||||||||||||||||||
| Discount window of the Federal Reserve Bank borrowing capacity |
1,132,411 | 331,753 | 1,464,164 | 1,090,308 | 329,385 | 1,419,693 | ||||||||||||||||||
|
|
|
|
|
|
|
|
|
|
|
|
|
|||||||||||||
| Total available liquidity |
$ | 15,628,075 | $ | 2,642,662 | $ | 18,270,737 | $ | 15,214,176 | $ | 1,745,955 | $ | 16,960,131 | ||||||||||||
|
|
|
|
|
|
|
|
|
|
|
|
|
|||||||||||||
Deposits
| 31-Mar-23 | ||||||||||||||||||||||||
| (In thousands) |
BPPR | % of Total | Popular U.S. | % of Total | Popular, Inc. (Consolidated) |
% of Total | ||||||||||||||||||
| Deposits: |
||||||||||||||||||||||||
| Deposits balances under $250,000 [1] |
$ | 24,823,608 | 47 | % | $ | 5,979,010 | 62 | % | $ | 30,802,618 | 51 | % | ||||||||||||
| Transactional deposits balances over $250,000 |
9,503,850 | 18 | % | 2,151,732 | 22 | % | 11,655,582 | 19 | % | |||||||||||||||
| Time deposits balances over $250,000 |
1,869,792 | 4 | % | 255,322 | 3 | % | 2,125,114 | 3 | % | |||||||||||||||
| Foreign deposits |
412,444 | 1 | % | — | % | 412,444 | 1 | |||||||||||||||||
| Collateralized public funds |
15,712,622 | 30 | % | 245,508 | 3 | % | 15,958,130 | 26 | % | |||||||||||||||
| Intercompany deposits |
134,110 | — | % | 986,943 | 10 | % | — | — | % | |||||||||||||||
|
|
|
|
|
|
|
|
|
|
|
|
|
|||||||||||||
| Total deposits |
$ | 52,456,426 | 100 | % | $ | 9,618,515 | 100 | % | $ | 60,953,888 | 100 | % | ||||||||||||
|
|
|
|
|
|
|
|
|
|
|
|
|
|||||||||||||
| [1] | Includes the first $250,000 in balances of transactional and time deposit accounts with balances in excess of $250,000. |
| 31-Dec-22 | ||||||||||||||||||||||||
| (In thousands) |
BPPR | % of Total | Popular U.S. | % of Total | Popular, Inc. (Consolidated) |
% of Total | ||||||||||||||||||
| Deposits |
||||||||||||||||||||||||
| Deposits balances under $250,000 [1] |
$ | 24,505,697 | 46 | % | $ | 5,231,417 | 60 | % | $ | 29,737,114 | 49 | % | ||||||||||||
| Transactional deposits balances over $250,000 |
9,957,877 | 19 | % | 2,674,841 | 31 | % | 12,632,718 | 21 | % | |||||||||||||||
| Time deposits balances over $250,000 |
1,920,455 | 4 | % | 167,067 | 2 | % | 2,087,522 | 3 | % | |||||||||||||||
| Foreign deposits |
425,855 | 1 | % | — | — | % | 425,855 | 1 | % | |||||||||||||||
| Collateralized public funds |
16,233,342 | 31 | % | 110,676 | 1 | % | 16,344,018 | 27 | % | |||||||||||||||
| Intercompany deposits |
135,172 | — | % | 482,167 | 6 | % | — | — | % | |||||||||||||||
|
|
|
|
|
|
|
|
|
|
|
|
|
|||||||||||||
| Total deposits |
$ | 53,178,398 | 100 | % | $ | 8,666,168 | 100 | % | $ | 61,227,227 | 100 | % | ||||||||||||
|
|
|
|
|
|
|
|
|
|
|
|
|
|||||||||||||
| [1] | Includes the first $250,000 in balances of transactional and time deposit accounts with balances in excess of $250,000. |
20
| Borrowings | 31-Mar-23 | 31-Dec-22 | ||||||||||||||||||||||||||||||
| (In thousands) |
BPPR | Popular U.S. | All other entities |
Total | BPPR | Popular U.S. | All other entities |
Total | ||||||||||||||||||||||||
| Assets sold under agreements to repurchase |
$ | 25,158 | $ | 98,341 | $ | — | $ | 123,499 | $ | 25,496 | $ | 123,113 | $ | — | $ | 148,609 | ||||||||||||||||
| FHLB borrowings |
82,292 | 305,990 | — | 388,282 | 83,292 | 670,990 | — | 754,282 | ||||||||||||||||||||||||
| Federal discount window / bank term funding program (BTFP) |
— | — | — | — | — | — | — | — | ||||||||||||||||||||||||
| Notes payable |
||||||||||||||||||||||||||||||||
| Unsecured senior debt securities maturing on September 2023 |
— | — | 299,426 | 299,426 | — | — | 299,109 | 299,109 | ||||||||||||||||||||||||
| Unsecured senior debt securities maturing on March 2028 |
— | — | 393,093 | 393,093 | — | — | — | — | ||||||||||||||||||||||||
| Junior subordinated deferrable interest debentures |
— | — | 198,326 | 198,326 | — | — | 198,319 | 198,319 | ||||||||||||||||||||||||
|
|
|
|
|
|
|
|
|
|
|
|
|
|
|
|
|
|||||||||||||||||
| Total borrowings |
$ | 107,450 | $ | 404,331 | $ | 890,845 | $ | 1,402,626 | $ | 108,788 | $ | 794,103 | $ | 497,428 | $ | 1,400,319 | ||||||||||||||||
|
|
|
|
|
|
|
|
|
|
|
|
|
|
|
|
|
|||||||||||||||||
21
| Popular, Inc. |
| Financial Supplement to First Quarter 2023 Earnings Release |
| Table J - Loan Delinquency -BPPR Operations |
| (Unaudited) |
| 31-Mar-23 |
||||||||||||||||||||||||||||||||
| BPPR |
||||||||||||||||||||||||||||||||
| Past due | Past due 90 days or more | |||||||||||||||||||||||||||||||
| (In thousands) |
30-59 days |
60-89 days |
90 days or more |
Total past due |
Current | Loans HIP | Non-accrual loans |
Accruing loans |
||||||||||||||||||||||||
| Commercial multi-family |
$ | 650 | $ | — | $ | 185 | $ | 835 | $ | 291,971 | $ | 292,806 | $ | 185 | $ | — | ||||||||||||||||
| Commercial real estate: |
||||||||||||||||||||||||||||||||
| Non-owner occupied |
2,739 | 1,584 | 22,856 | 27,179 | 2,858,304 | 2,885,483 | 22,856 | — | ||||||||||||||||||||||||
| Owner occupied |
21,496 | — | 37,779 | 59,275 | 1,438,228 | 1,497,503 | 37,779 | — | ||||||||||||||||||||||||
| Commercial and industrial |
17,934 | 793 | 31,847 | 50,574 | 3,883,859 | 3,934,433 | 30,132 | 1,715 | ||||||||||||||||||||||||
| Construction |
8,081 | — | — | 8,081 | 147,268 | 155,349 | — | — | ||||||||||||||||||||||||
| Mortgage |
183,187 | 81,729 | 515,752 | 780,668 | 5,336,016 | 6,116,684 | 224,075 | 291,677 | ||||||||||||||||||||||||
| Leasing |
12,301 | 2,605 | 6,103 | 21,009 | 1,593,335 | 1,614,344 | 6,103 | — | ||||||||||||||||||||||||
| Consumer: |
||||||||||||||||||||||||||||||||
| Credit cards |
7,162 | 5,823 | 12,061 | 25,046 | 1,021,129 | 1,046,175 | — | 12,061 | ||||||||||||||||||||||||
| Home equity lines of credit |
— | — | — | — | 2,865 | 2,865 | — | — | ||||||||||||||||||||||||
| Personal |
14,131 | 8,990 | 17,427 | 40,548 | 1,572,370 | 1,612,918 | 17,412 | 15 | ||||||||||||||||||||||||
| Auto |
60,324 | 12,684 | 39,516 | 112,524 | 3,405,416 | 3,517,940 | 39,516 | — | ||||||||||||||||||||||||
| Other |
1,264 | 49 | 1,091 | 2,404 | 127,608 | 130,012 | 921 | 170 | ||||||||||||||||||||||||
|
|
|
|
|
|
|
|
|
|
|
|
|
|
|
|
|
|||||||||||||||||
| Total |
$ | 329,269 | $ | 114,257 | $ | 684,617 | $ | 1,128,143 | $ | 21,678,369 | $ | 22,806,512 | $ | 378,979 | $ | 305,638 | ||||||||||||||||
|
|
|
|
|
|
|
|
|
|
|
|
|
|
|
|
|
|||||||||||||||||
| 31-Dec-22 |
||||||||||||||||||||||||||||||||
| BPPR |
||||||||||||||||||||||||||||||||
| Past due | Past due 90 days or more | |||||||||||||||||||||||||||||||
| (In thousands) |
30-59 days |
60-89 days |
90 days or more |
Total past due |
Current | Loans HIP | Non-accrual loans |
Accruing loans |
||||||||||||||||||||||||
| Commercial multi-family |
$ | 425 | $ | — | $ | 242 | $ | 667 | $ | 280,706 | $ | 281,373 | $ | 242 | $ | — | ||||||||||||||||
| Commercial real estate: |
||||||||||||||||||||||||||||||||
| Non-owner occupied |
941 | 428 | 23,662 | 25,031 | 2,732,296 | 2,757,327 | 23,662 | — | ||||||||||||||||||||||||
| Owner occupied |
729 | 245 | 23,990 | 24,964 | 1,563,092 | 1,588,056 | 23,990 | — | ||||||||||||||||||||||||
| Commercial and industrial |
3,036 | 941 | 35,777 | 39,754 | 3,756,754 | 3,796,508 | 34,277 | 1,500 | ||||||||||||||||||||||||
| Construction |
— | — | — | — | 147,041 | 147,041 | — | — | ||||||||||||||||||||||||
| Mortgage |
222,926 | 91,881 | 579,993 | 894,800 | 5,215,479 | 6,110,279 | 242,391 | 337,602 | ||||||||||||||||||||||||
| Leasing |
11,983 | 3,563 | 5,941 | 21,487 | 1,564,252 | 1,585,739 | 5,941 | — | ||||||||||||||||||||||||
| Consumer: |
||||||||||||||||||||||||||||||||
| Credit cards |
7,106 | 5,049 | 11,910 | 24,065 | 1,017,766 | 1,041,831 | — | 11,910 | ||||||||||||||||||||||||
| Home equity lines of credit |
— | — | — | — | 2,954 | 2,954 | — | — | ||||||||||||||||||||||||
| Personal |
13,232 | 8,752 | 18,082 | 40,066 | 1,545,621 | 1,585,687 | 18,082 | — | ||||||||||||||||||||||||
| Auto |
68,868 | 19,243 | 40,978 | 129,089 | 3,383,441 | 3,512,530 | 40,978 | — | ||||||||||||||||||||||||
| Other |
487 | 87 | 12,682 | 13,256 | 124,324 | 137,580 | 12,446 | 236 | ||||||||||||||||||||||||
|
|
|
|
|
|
|
|
|
|
|
|
|
|
|
|
|
|||||||||||||||||
| Total |
$ | 329,733 | $ | 130,189 | $ | 753,257 | $ | 1,213,179 | $ | 21,333,726 | $ | 22,546,905 | $ | 402,009 | $ | 351,248 | ||||||||||||||||
|
|
|
|
|
|
|
|
|
|
|
|
|
|
|
|
|
|||||||||||||||||
22
| Variance |
||||||||||||||||||||||||||||||||
| Past due | Past due 90 days or more | |||||||||||||||||||||||||||||||
| (In thousands) |
30-59 days | 60-89 days | 90 days or more |
Total past due |
Current | Loans HIP | Non-accrual loans |
Accruing loans |
||||||||||||||||||||||||
| Commercial multi-family |
$ | 225 | $ | — | $ | (57 | ) | $ | 168 | $ | 11,265 | $ | 11,433 | $ | (57 | ) | $ | — | ||||||||||||||
| Commercial real estate: |
||||||||||||||||||||||||||||||||
| Non-owner occupied |
1,798 | 1,156 | (806 | ) | 2,148 | 126,008 | 128,156 | (806 | ) | — | ||||||||||||||||||||||
| Owner occupied |
20,767 | (245 | ) | 13,789 | 34,311 | (124,864 | ) | (90,553 | ) | 13,789 | — | |||||||||||||||||||||
| Commercial and industrial |
14,898 | (148 | ) | (3,930 | ) | 10,820 | 127,105 | 137,925 | (4,145 | ) | 215 | |||||||||||||||||||||
| Construction |
8,081 | — | — | 8,081 | 227 | 8,308 | — | — | ||||||||||||||||||||||||
| Mortgage |
(39,739 | ) | (10,152 | ) | (64,241 | ) | (114,132 | ) | 120,537 | 6,405 | (18,316 | ) | (45,925 | ) | ||||||||||||||||||
| Leasing |
318 | (958 | ) | 162 | (478 | ) | 29,083 | 28,605 | 162 | — | ||||||||||||||||||||||
| Consumer: |
||||||||||||||||||||||||||||||||
| Credit cards |
56 | 774 | 151 | 981 | 3,363 | 4,344 | — | 151 | ||||||||||||||||||||||||
| Home equity lines of credit |
— | — | — | — | (89 | ) | (89 | ) | — | — | ||||||||||||||||||||||
| Personal |
899 | 238 | (655 | ) | 482 | 26,749 | 27,231 | (670 | ) | 15 | ||||||||||||||||||||||
| Auto |
(8,544 | ) | (6,559 | ) | (1,462 | ) | (16,565 | ) | 21,975 | 5,410 | (1,462 | ) | — | |||||||||||||||||||
| Other |
777 | (38 | ) | (11,591 | ) | (10,852 | ) | 3,284 | (7,568 | ) | (11,525 | ) | (66 | ) | ||||||||||||||||||
|
|
|
|
|
|
|
|
|
|
|
|
|
|
|
|
|
|||||||||||||||||
| Total |
$ | (464 | ) | $ | (15,932 | ) | $ | (68,640 | ) | $ | (85,036 | ) | $ | 344,643 | $ | 259,607 | $ | (23,030 | ) | $ | (45,610 | ) | ||||||||||
|
|
|
|
|
|
|
|
|
|
|
|
|
|
|
|
|
|||||||||||||||||
23
| Popular, Inc. |
| Financial Supplement to First Quarter 2023 Earnings Release |
| Table K - Loan Delinquency - Popular U.S. Operations |
| (Unaudited) |
| 31-Mar-23 |
||||||||||||||||||||||||||||||||
| Popular U.S. |
||||||||||||||||||||||||||||||||
| Past due | Past due 90 days or more | |||||||||||||||||||||||||||||||
| (In thousands) |
30-59 days |
60-89 days |
90 days or more |
Total past due |
Current | Loans HIP | Non-accrual loans |
Accruing loans |
||||||||||||||||||||||||
| Commercial multi-family |
$ | — | $ | — | $ | 421 | $ | 421 | $ | 2,043,130 | $ | 2,043,551 | $ | 421 | $ | — | ||||||||||||||||
| Commercial real estate: |
||||||||||||||||||||||||||||||||
| Non-owner occupied |
16,033 | — | 207 | 16,240 | 1,748,952 | 1,765,192 | 207 | — | ||||||||||||||||||||||||
| Owner occupied |
18,042 | — | 5,095 | 23,137 | 1,497,947 | 1,521,084 | 5,095 | — | ||||||||||||||||||||||||
| Commercial and industrial |
13,779 | 3 | 5,570 | 19,352 | 2,045,857 | 2,065,209 | 5,325 | 245 | ||||||||||||||||||||||||
| Construction |
7,165 | — | — | 7,165 | 536,482 | 543,647 | — | — | ||||||||||||||||||||||||
| Mortgage |
22,041 | 1,499 | 14,719 | 38,259 | 1,250,964 | 1,289,223 | 14,719 | — | ||||||||||||||||||||||||
| Consumer: |
||||||||||||||||||||||||||||||||
| Credit cards |
— | — | — | — | 21 | 21 | — | — | ||||||||||||||||||||||||
| Home equity lines of credit |
496 | 70 | 4,618 | 5,184 | 61,838 | 67,022 | 4,618 | — | ||||||||||||||||||||||||
| Personal |
1,900 | 1,259 | 2,505 | 5,664 | 222,487 | 228,151 | 2,505 | — | ||||||||||||||||||||||||
| Other |
2 | — | 514 | 516 | 8,245 | 8,761 | 514 | — | ||||||||||||||||||||||||
|
|
|
|
|
|
|
|
|
|
|
|
|
|
|
|
|
|||||||||||||||||
| Total |
$ | 79,458 | $ | 2,831 | $ | 33,649 | $ | 115,938 | $ | 9,415,923 | $ | 9,531,861 | $ | 33,404 | $ | 245 | ||||||||||||||||
|
|
|
|
|
|
|
|
|
|
|
|
|
|
|
|
|
|||||||||||||||||
| 31-Dec-22 |
||||||||||||||||||||||||||||||||
| Popular U.S. |
||||||||||||||||||||||||||||||||
| Past due | Past due 90 days or more | |||||||||||||||||||||||||||||||
| (In thousands) |
30-59 days |
60-89 days |
90 days or more |
Total past due |
Current | Loans HIP | Non-accrual loans |
Accruing loans |
||||||||||||||||||||||||
| Commercial multi-family |
$ | 2,177 | $ | — | $ | — | $ | 2,177 | $ | 2,038,163 | $ | 2,040,340 | $ | — | $ | — | ||||||||||||||||
| Commercial real estate: |
||||||||||||||||||||||||||||||||
| Non-owner occupied |
484 | — | 1,454 | 1,938 | 1,740,405 | 1,742,343 | 1,454 | — | ||||||||||||||||||||||||
| Owner occupied |
— | — | 5,095 | 5,095 | 1,485,398 | 1,490,493 | 5,095 | — | ||||||||||||||||||||||||
| Commercial and industrial |
12,960 | 2,205 | 4,685 | 19,850 | 2,022,842 | 2,042,692 | 4,319 | 366 | ||||||||||||||||||||||||
| Construction |
— | — | — | — | 610,943 | 610,943 | — | — | ||||||||||||||||||||||||
| Mortgage |
16,131 | 5,834 | 20,488 | 42,453 | 1,244,739 | 1,287,192 | 20,488 | — | ||||||||||||||||||||||||
| Consumer: |
||||||||||||||||||||||||||||||||
| Credit cards |
— | — | — | — | 39 | 39 | — | — | ||||||||||||||||||||||||
| Home equity lines of credit |
413 | 161 | 4,110 | 4,684 | 64,278 | 68,962 | 4,110 | — | ||||||||||||||||||||||||
| Personal |
1,808 | 1,467 | 1,958 | 5,233 | 232,659 | 237,892 | 1,958 | — | ||||||||||||||||||||||||
| Other |
— | — | 8 | 8 | 9,960 | 9,968 | 8 | — | ||||||||||||||||||||||||
|
|
|
|
|
|
|
|
|
|
|
|
|
|
|
|
|
|||||||||||||||||
| Total |
$ | 33,973 | $ | 9,667 | $ | 37,798 | $ | 81,438 | $ | 9,449,426 | $ | 9,530,864 | $ | 37,432 | $ | 366 | ||||||||||||||||
|
|
|
|
|
|
|
|
|
|
|
|
|
|
|
|
|
|||||||||||||||||
24
| Variance |
||||||||||||||||||||||||||||||||
| Past due | Past due 90 days or more | |||||||||||||||||||||||||||||||
| 30-59 | 60-89 | 90 days | Total | Non-accrual | Accruing | |||||||||||||||||||||||||||
| (In thousands) |
days | days | or more | past due | Current | Loans HIP | loans | loans | ||||||||||||||||||||||||
| Commercial multi-family |
$ | (2,177 | ) | $ | — | $ | 421 | $ | (1,756 | ) | $ | 4,967 | $ | 3,211 | $ | 421 | $ | — | ||||||||||||||
| Commercial real estate: |
||||||||||||||||||||||||||||||||
| Non-owner occupied |
15,549 | — | (1,247 | ) | 14,302 | 8,547 | 22,849 | (1,247 | ) | — | ||||||||||||||||||||||
| Owner occupied |
18,042 | — | — | 18,042 | 12,549 | 30,591 | — | — | ||||||||||||||||||||||||
| Commercial and industrial |
819 | (2,202 | ) | 885 | (498 | ) | 23,015 | 22,517 | 1,006 | (121 | ) | |||||||||||||||||||||
| Construction |
7,165 | — | — | 7,165 | (74,461 | ) | (67,296 | ) | — | — | ||||||||||||||||||||||
| Mortgage |
5,910 | (4,335 | ) | (5,769 | ) | (4,194 | ) | 6,225 | 2,031 | (5,769 | ) | — | ||||||||||||||||||||
| Consumer: |
||||||||||||||||||||||||||||||||
| Credit cards |
— | — | — | — | (18 | ) | (18 | ) | — | — | ||||||||||||||||||||||
| Home equity lines of credit |
83 | (91 | ) | 508 | 500 | (2,440 | ) | (1,940 | ) | 508 | — | |||||||||||||||||||||
| Personal |
92 | (208 | ) | 547 | 431 | (10,172 | ) | (9,741 | ) | 547 | — | |||||||||||||||||||||
| Other |
2 | — | 506 | 508 | (1,715 | ) | (1,207 | ) | 506 | — | ||||||||||||||||||||||
|
|
|
|
|
|
|
|
|
|
|
|
|
|
|
|
|
|||||||||||||||||
| Total |
$ | 45,485 | $ | (6,836 | ) | $ | (4,149 | ) | $ | 34,500 | $ | (33,503 | ) | $ | 997 | $ | (4,028 | ) | $ | (121 | ) | |||||||||||
|
|
|
|
|
|
|
|
|
|
|
|
|
|
|
|
|
|||||||||||||||||
25
| Popular, Inc. |
| |||||||||||||||||||||||||||||||
| Financial Supplement to First Quarter 2023 Earnings Release |
| |||||||||||||||||||||||||||||||
| Table L - Loan Delinquency - Consolidated |
| |||||||||||||||||||||||||||||||
| (Unaudited) |
| |||||||||||||||||||||||||||||||
| 31-Mar-23 |
||||||||||||||||||||||||||||||||
| Popular, Inc. |
||||||||||||||||||||||||||||||||
| Past due | Past due 90 days or more | |||||||||||||||||||||||||||||||
| 30-59 | 60-89 | 90 days | Total | Non-accrual | Accruing | |||||||||||||||||||||||||||
| (In thousands) |
days | days | or more | past due | Current | Loans HIP | loans | loans | ||||||||||||||||||||||||
| Commercial multi-family |
$ | 650 | $ | — | $ | 606 | $ | 1,256 | $ | 2,335,101 | $ | 2,336,357 | $ | 606 | $ | — | ||||||||||||||||
| Commercial real estate: |
||||||||||||||||||||||||||||||||
| Non-owner occupied |
18,772 | 1,584 | 23,063 | 43,419 | 4,607,256 | 4,650,675 | 23,063 | — | ||||||||||||||||||||||||
| Owner occupied |
39,538 | — | 42,874 | 82,412 | 2,936,175 | 3,018,587 | 42,874 | — | ||||||||||||||||||||||||
| Commercial and industrial |
31,713 | 796 | 37,417 | 69,926 | 5,929,716 | 5,999,642 | 35,457 | 1,960 | ||||||||||||||||||||||||
| Construction |
15,246 | — | — | 15,246 | 683,750 | 698,996 | — | — | ||||||||||||||||||||||||
| Mortgage |
205,228 | 83,228 | 530,471 | 818,927 | 6,586,980 | 7,405,907 | 238,794 | 291,677 | ||||||||||||||||||||||||
| Leasing |
12,301 | 2,605 | 6,103 | 21,009 | 1,593,335 | 1,614,344 | 6,103 | — | ||||||||||||||||||||||||
| Consumer: |
||||||||||||||||||||||||||||||||
| Credit cards |
7,162 | 5,823 | 12,061 | 25,046 | 1,021,150 | 1,046,196 | — | 12,061 | ||||||||||||||||||||||||
| Home equity lines of credit |
496 | 70 | 4,618 | 5,184 | 64,703 | 69,887 | 4,618 | — | ||||||||||||||||||||||||
| Personal |
16,031 | 10,249 | 19,932 | 46,212 | 1,794,857 | 1,841,069 | 19,917 | 15 | ||||||||||||||||||||||||
| Auto |
60,324 | 12,684 | 39,516 | 112,524 | 3,405,416 | 3,517,940 | 39,516 | — | ||||||||||||||||||||||||
| Other |
1,266 | 49 | 1,605 | 2,920 | 135,853 | 138,773 | 1,435 | 170 | ||||||||||||||||||||||||
|
|
|
|
|
|
|
|
|
|
|
|
|
|
|
|
|
|||||||||||||||||
| Total |
$ | 408,727 | $ | 117,088 | $ | 718,266 | $ | 1,244,081 | $ | 31,094,292 | $ | 32,338,373 | $ | 412,383 | $ | 305,883 | ||||||||||||||||
|
|
|
|
|
|
|
|
|
|
|
|
|
|
|
|
|
|||||||||||||||||
| 31-Dec-22 |
||||||||||||||||||||||||||||||||
| Popular, Inc. |
||||||||||||||||||||||||||||||||
| Past due | Past due 90 days or more | |||||||||||||||||||||||||||||||
| 30-59 | 60-89 | 90 days | Total | Non-accrual | Accruing | |||||||||||||||||||||||||||
| (In thousands) |
days | days | or more | past due | Current | Loans HIP | loans | loans | ||||||||||||||||||||||||
| Commercial multi-family |
$ | 2,602 | $ | — | $ | 242 | $ | 2,844 | $ | 2,318,869 | $ | 2,321,713 | $ | 242 | $ | — | ||||||||||||||||
| Commercial real estate: |
||||||||||||||||||||||||||||||||
| Non-owner occupied |
1,425 | 428 | 25,116 | 26,969 | 4,472,701 | 4,499,670 | 25,116 | — | ||||||||||||||||||||||||
| Owner occupied |
729 | 245 | 29,085 | 30,059 | 3,048,490 | 3,078,549 | 29,085 | — | ||||||||||||||||||||||||
| Commercial and industrial |
15,996 | 3,146 | 40,462 | 59,604 | 5,779,596 | 5,839,200 | 38,596 | 1,866 | ||||||||||||||||||||||||
| Construction |
— | — | — | — | 757,984 | 757,984 | — | — | ||||||||||||||||||||||||
| Mortgage |
239,057 | 97,715 | 600,481 | 937,253 | 6,460,218 | 7,397,471 | 262,879 | 337,602 | ||||||||||||||||||||||||
| Leasing |
11,983 | 3,563 | 5,941 | 21,487 | 1,564,252 | 1,585,739 | 5,941 | — | ||||||||||||||||||||||||
| Consumer: |
||||||||||||||||||||||||||||||||
| Credit cards |
7,106 | 5,049 | 11,910 | 24,065 | 1,017,805 | 1,041,870 | — | 11,910 | ||||||||||||||||||||||||
| Home equity lines of credit |
413 | 161 | 4,110 | 4,684 | 67,232 | 71,916 | 4,110 | — | ||||||||||||||||||||||||
| Personal |
15,040 | 10,219 | 20,040 | 45,299 | 1,778,280 | 1,823,579 | 20,040 | — | ||||||||||||||||||||||||
| Auto |
68,868 | 19,243 | 40,978 | 129,089 | 3,383,441 | 3,512,530 | 40,978 | — | ||||||||||||||||||||||||
| Other |
487 | 87 | 12,690 | 13,264 | 134,284 | 147,548 | 12,454 | 236 | ||||||||||||||||||||||||
|
|
|
|
|
|
|
|
|
|
|
|
|
|
|
|
|
|||||||||||||||||
| Total |
$ | 363,706 | $ | 139,856 | $ | 791,055 | $ | 1,294,617 | $ | 30,783,152 | $ | 32,077,769 | $ | 439,441 | $ | 351,614 | ||||||||||||||||
|
|
|
|
|
|
|
|
|
|
|
|
|
|
|
|
|
|||||||||||||||||
26
| Variance |
||||||||||||||||||||||||||||||||
| Past due | Past due 90 days or more | |||||||||||||||||||||||||||||||
| 30-59 | 60-89 | 90 days | Total | Non-accrual | Accruing | |||||||||||||||||||||||||||
| (In thousands) |
days | days | or more | past due | Current | Loans HIP | loans | loans | ||||||||||||||||||||||||
| Commercial multi-family |
$ | (1,952 | ) | $ | — | $ | 364 | $ | (1,588 | ) | $ | 16,232 | $ | 14,644 | $ | 364 | $ | — | ||||||||||||||
| Commercial real estate: |
||||||||||||||||||||||||||||||||
| Non-owner occupied |
17,347 | 1,156 | (2,053 | ) | 16,450 | 134,555 | 151,005 | (2,053 | ) | — | ||||||||||||||||||||||
| Owner occupied |
38,809 | (245 | ) | 13,789 | 52,353 | (112,315 | ) | (59,962 | ) | 13,789 | — | |||||||||||||||||||||
| Commercial and industrial |
15,717 | (2,350 | ) | (3,045 | ) | 10,322 | 150,120 | 160,442 | (3,139 | ) | 94 | |||||||||||||||||||||
| Construction |
15,246 | — | — | 15,246 | (74,234 | ) | (58,988 | ) | — | — | ||||||||||||||||||||||
| Mortgage |
(33,829 | ) | (14,487 | ) | (70,010 | ) | (118,326 | ) | 126,762 | 8,436 | (24,085 | ) | (45,925 | ) | ||||||||||||||||||
| Leasing |
318 | (958 | ) | 162 | (478 | ) | 29,083 | 28,605 | 162 | — | ||||||||||||||||||||||
| Consumer: |
||||||||||||||||||||||||||||||||
| Credit cards |
56 | 774 | 151 | 981 | 3,345 | 4,326 | — | 151 | ||||||||||||||||||||||||
| Home equity lines of credit |
83 | (91 | ) | 508 | 500 | (2,529 | ) | (2,029 | ) | 508 | — | |||||||||||||||||||||
| Personal |
991 | 30 | (108 | ) | 913 | 16,577 | 17,490 | (123 | ) | 15 | ||||||||||||||||||||||
| Auto |
(8,544 | ) | (6,559 | ) | (1,462 | ) | (16,565 | ) | 21,975 | 5,410 | (1,462 | ) | — | |||||||||||||||||||
| Other |
779 | (38 | ) | (11,085 | ) | (10,344 | ) | 1,569 | (8,775 | ) | (11,019 | ) | (66 | ) | ||||||||||||||||||
|
|
|
|
|
|
|
|
|
|
|
|
|
|
|
|
|
|||||||||||||||||
| Total |
$ | 45,021 | $ | (22,768 | ) | $ | (72,789 | ) | $ | (50,536 | ) | $ | 311,140 | $ | 260,604 | $ | (27,058 | ) | $ | (45,731 | ) | |||||||||||
|
|
|
|
|
|
|
|
|
|
|
|
|
|
|
|
|
|||||||||||||||||
27
| Popular, Inc. |
| |||||||||||||||||||||||||||||||
| Financial Supplement to First Quarter 2023 Earnings Release |
| |||||||||||||||||||||||||||||||
| Table M - Non-Performing Assets |
| |||||||||||||||||||||||||||||||
| (Unaudited) |
| |||||||||||||||||||||||||||||||
| Variance | ||||||||||||||||||||||||||||||||
| (In thousands) |
31-Mar-23 | As a % of loans HIP by category |
31-Dec-22 | As a % of loans HIP by category |
31-Mar-22 | As a % of loans HIP by category |
Q1 2023 vs. Q4 2022 |
Q1 2023 vs. Q1 2022 |
||||||||||||||||||||||||
| Non-accrual loans: |
||||||||||||||||||||||||||||||||
| Commercial |
$ | 102,000 | 0.6 | % | $ | 93,039 | 0.6 | % | $ | 123,185 | 0.9 | % | $ | 8,961 | $ | (21,185 | ) | |||||||||||||||
| Leasing |
6,103 | 0.4 | 5,941 | 0.4 | 3,766 | 0.3 | 162 | 2,337 | ||||||||||||||||||||||||
| Mortgage |
238,794 | 3.2 | 262,879 | 3.6 | 328,386 | 4.5 | (24,085 | ) | (89,592 | ) | ||||||||||||||||||||||
| Auto |
39,516 | 1.1 | 40,978 | 1.2 | 27,514 | 0.8 | (1,462 | ) | 12,002 | |||||||||||||||||||||||
| Consumer |
25,970 | 0.8 | 36,604 | 1.2 | 37,070 | 1.4 | (10,634 | ) | (11,100 | ) | ||||||||||||||||||||||
|
|
|
|
|
|
|
|
|
|
|
|
|
|
|
|
|
|||||||||||||||||
| Total non-performing loans held-in-portfolio |
412,383 | 1.3 | % | 439,441 | 1.4 | % | 519,921 | 1.8 | % | (27,058 | ) | (107,538 | ) | |||||||||||||||||||
| Other real estate owned (“OREO”) |
91,721 | 89,126 | 90,567 | 2,595 | 1,154 | |||||||||||||||||||||||||||
|
|
|
|
|
|
|
|
|
|
|
|||||||||||||||||||||||
| Total non-performing assets [1] |
$ | 504,104 | $ | 528,567 | $ | 610,488 | $ | (24,463 | ) | $ | (106,384 | ) | ||||||||||||||||||||
|
|
|
|
|
|
|
|||||||||||||||||||||||||||
| Accruing loans past due 90 days or more [2] |
$ | 305,883 | $ | 351,614 | $ | 440,554 | $ | (45,731 | ) | $ | (134,671 | ) | ||||||||||||||||||||
|
|
|
|
|
|
|
|
|
|
|
|||||||||||||||||||||||
| Ratios: |
||||||||||||||||||||||||||||||||
| Non-performing assets to total assets |
0.74 | % | 0.78 | % | 0.88 | % | ||||||||||||||||||||||||||
| Non-performing loans held-in-portfolio to loans held-in-portfolio |
1.28 | 1.37 | 1.76 | |||||||||||||||||||||||||||||
| Allowance for credit losses to loans held-in-portfolio |
2.13 | 2.25 | 2.29 | |||||||||||||||||||||||||||||
| Allowance for credit losses to non-performing loans, excluding loans held-for-sale |
167.11 | 163.91 | 130.36 | |||||||||||||||||||||||||||||
|
|
|
|
|
|
|
|||||||||||||||||||||||||||
| [1] | There were no non-performing loans held-for-sale as of March 31, 2023, December 31, 2022 and March 31, 2022. |
| [2] | It is the Corporation’s policy to report delinquent residential mortgage loans insured by FHA or guaranteed by the VA as accruing loans past due 90 days or more as opposed to non-performing since the principal repayment is insured. The balance of these loans includes $7 million at March 31, 2023, related to the rebooking of loans previously pooled into GNMA securities, in which the Corporation had a buy-back option as further described below (December 31, 2022—$14 million; March 31, 2022—$13 million). Under the GNMA program, issuers such as BPPR have the option but not the obligation to repurchase loans that are 90 days or more past due. For accounting purposes, these loans subject to the repurchase option are required to be reflected (rebooked) on the financial statements of BPPR with an offsetting liability. These balances include $167 million of residential mortgage loans insured by FHA or guaranteed by the VA that are no longer accruing interest as of March 31, 2023 (December 31, 2022—$190 million; March 31, 2022—$266 million). Furthermore, the Corporation has approximately $40 million in reverse mortgage loans which are guaranteed by FHA, but which are currently not accruing interest. Due to the guaranteed nature of the loans, it is the Corporation’s policy to exclude these balances from non-performing assets (December 31, 2022—$42 million; March 31, 2022—$45 million). |
28
| Popular, Inc. |
| |||||||||||||||||||||||
| Financial Supplement to First Quarter 2023 Earnings Release |
| |||||||||||||||||||||||
| Table N - Activity in Non-Performing Loans |
| |||||||||||||||||||||||
| (Unaudited) |
| |||||||||||||||||||||||
| Commercial loans held-in-portfolio: |
||||||||||||||||||||||||
| Quarter ended | Quarter ended | |||||||||||||||||||||||
| 31-Mar-23 | 31-Dec-22 | |||||||||||||||||||||||
| (In thousands) |
BPPR | Popular U.S. | Popular, Inc. | BPPR | Popular U.S. | Popular, Inc. | ||||||||||||||||||
| Beginning balance NPLs |
$ | 82,171 | $ | 10,868 | $ | 93,039 | $ | 87,448 | $ | 16,428 | $ | 103,876 | ||||||||||||
| Plus: |
||||||||||||||||||||||||
| New non-performing loans |
16,594 | 5,719 | 22,313 | 5,770 | 8,572 | 14,342 | ||||||||||||||||||
| Advances on existing non-performing loans |
— | 26 | 26 | — | 7 | 7 | ||||||||||||||||||
| Less: |
||||||||||||||||||||||||
| Non-performing loans transferred to OREO |
(287 | ) | — | (287 | ) | (445 | ) | — | (445 | ) | ||||||||||||||
| Non-performing loans charged-off |
(673 | ) | (216 | ) | (889 | ) | (131 | ) | (8,725 | ) | (8,856 | ) | ||||||||||||
| Loans returned to accrual status / loan collections |
(6,853 | ) | (5,349 | ) | (12,202 | ) | (10,471 | ) | (5,414 | ) | (15,885 | ) | ||||||||||||
|
|
|
|
|
|
|
|
|
|
|
|
|
|||||||||||||
| Ending balance NPLs |
$ | 90,952 | $ | 11,048 | $ | 102,000 | $ | 82,171 | $ | 10,868 | $ | 93,039 | ||||||||||||
|
|
|
|
|
|
|
|
|
|
|
|
|
|||||||||||||
| Mortgage loans held-in-portfolio: |
||||||||||||||||||||||||
| Quarter ended | Quarter ended | |||||||||||||||||||||||
| 31-Mar-23 | 31-Dec-22 | |||||||||||||||||||||||
| (In thousands) |
BPPR | Popular U.S. | Popular, Inc. | BPPR | Popular U.S. | Popular, Inc. | ||||||||||||||||||
| Beginning balance NPLs |
$ | 242,391 | $ | 20,488 | $ | 262,879 | $ | 252,773 | $ | 21,533 | $ | 274,306 | ||||||||||||
| Plus: |
||||||||||||||||||||||||
| New non-performing loans |
34,019 | 2,812 | 36,831 | 34,449 | 3,561 | 38,010 | ||||||||||||||||||
| Advances on existing non-performing loans |
— | 39 | 39 | — | 1 | 1 | ||||||||||||||||||
| Less: |
||||||||||||||||||||||||
| Non-performing loans transferred to OREO |
(10,586 | ) | (58 | ) | (10,644 | ) | (7,242 | ) | — | (7,242 | ) | |||||||||||||
| Non-performing loans charged-off |
(503 | ) | — | (503 | ) | (90 | ) | — | (90 | ) | ||||||||||||||
| Loans returned to accrual status / loan collections |
(41,246 | ) | (8,562 | ) | (49,808 | ) | (37,499 | ) | (4,607 | ) | (42,106 | ) | ||||||||||||
|
|
|
|
|
|
|
|
|
|
|
|
|
|||||||||||||
| Ending balance NPLs |
$ | 224,075 | $ | 14,719 | $ | 238,794 | $ | 242,391 | $ | 20,488 | $ | 262,879 | ||||||||||||
|
|
|
|
|
|
|
|
|
|
|
|
|
|||||||||||||
| Total non-performing loans held-in-portfolio (excluding consumer): |
||||||||||||||||||||||||
| Quarter ended | Quarter ended | |||||||||||||||||||||||
| 31-Mar-23 | 31-Dec-22 | |||||||||||||||||||||||
| (In thousands) |
BPPR | Popular U.S. | Popular, Inc. | BPPR | Popular U.S. | Popular, Inc. | ||||||||||||||||||
| Beginning balance NPLs |
$ | 324,562 | $ | 31,356 | $ | 355,918 | $ | 340,221 | $ | 37,961 | $ | 378,182 | ||||||||||||
| Plus: |
||||||||||||||||||||||||
| New non-performing loans |
50,613 | 8,531 | 59,144 | 40,219 | 12,133 | 52,352 | ||||||||||||||||||
| Advances on existing non-performing loans |
— | 65 | 65 | — | 8 | 8 | ||||||||||||||||||
| Less: |
||||||||||||||||||||||||
| Non-performing loans transferred to OREO |
(10,873 | ) | (58 | ) | (10,931 | ) | (7,687 | ) | — | (7,687 | ) | |||||||||||||
| Non-performing loans charged-off |
(1,176 | ) | (216 | ) | (1,392 | ) | (221 | ) | (8,725 | ) | (8,946 | ) | ||||||||||||
| Loans returned to accrual status / loan collections |
(48,099 | ) | (13,911 | ) | (62,010 | ) | (47,970 | ) | (10,021 | ) | (57,991 | ) | ||||||||||||
|
|
|
|
|
|
|
|
|
|
|
|
|
|||||||||||||
| Ending balance NPLs |
$ | 315,027 | $ | 25,767 | $ | 340,794 | $ | 324,562 | $ | 31,356 | $ | 355,918 | ||||||||||||
|
|
|
|
|
|
|
|
|
|
|
|
|
|||||||||||||
29
| Popular, Inc. |
||||||||||||
| Financial Supplement to First Quarter 2023 Earnings Release |
||||||||||||
| Table O - Allowance for Credit Losses, Net Charge-offs and Related Ratios |
||||||||||||
| (Unaudited) |
||||||||||||
| Quarters ended | ||||||||||||
| ( In thousands) |
31-Mar-23 | 31-Dec-22 | 31-Mar-22 | |||||||||
| Balance at beginning of period - loans held-in-portfolio |
$ | 720,302 | $ | 703,096 | $ | 695,366 | ||||||
| Impact of adopting ASU-2022-02 |
(45,583 | ) | — | — | ||||||||
| Provision for credit losses (benefit) |
47,146 | 48,332 | (14,405 | ) | ||||||||
| Initial allowance for credit losses - PCD Loans |
68 | 74 | 612 | |||||||||
|
|
|
|
|
|
|
|||||||
| 721,933 | 751,502 | 681,573 | ||||||||||
|
|
|
|
|
|
|
|||||||
| Net loans charge-off (recovered)- BPPR |
||||||||||||
| Commercial: |
||||||||||||
| Commercial multi-family |
— | — | ||||||||||
| Commercial real estate non-owner occupied |
(135 | ) | (305 | ) | (184 | ) | ||||||
| Commercial real estate owner occupied |
(1,507 | ) | (462 | ) | (2,942 | ) | ||||||
| Commercial and industrial |
442 | (1,333 | ) | (1,104 | ) | |||||||
| Total Commercial |
(1,200 | ) | (2,100 | ) | (4,230 | ) | ||||||
| Construction |
— | (416 | ) | |||||||||
| Leasing |
327 | 2,221 | (434 | ) | ||||||||
| Mortgage |
(3,954 | ) | (6,135 | ) | (2,992 | ) | ||||||
| Consumer: |
||||||||||||
| Credit Cards |
6,287 | 5,433 | 3,418 | |||||||||
| HELOCs |
(36 | ) | (72 | ) | (4 | ) | ||||||
| Personal |
12,045 | 9,268 | 5,081 | |||||||||
| Auto |
7,204 | 10,978 | 4,861 | |||||||||
| Other Consumer |
10,791 | 253 | 218 | |||||||||
| Total Consumer |
36,291 | 25,860 | 13,574 | |||||||||
|
|
|
|
|
|
|
|||||||
| Total net charged-off (recovered) BPPR |
$ | 31,464 | $ | 19,846 | $ | 5,502 | ||||||
|
|
|
|
|
|
|
|||||||
| Net loans charge-off (recovered) - Popular U.S. |
||||||||||||
| Commercial: |
||||||||||||
| Commercial multi-family |
(2 | ) | (1 | ) | (7 | ) | ||||||
| Commercial real estate non-owner occupied |
(1,852 | ) | 8,668 | (3 | ) | |||||||
| Commercial real estate owner occupied |
(24 | ) | (111 | ) | (112 | ) | ||||||
| Commercial and industrial |
(469 | ) | (162 | ) | (505 | ) | ||||||
| Total Commercial |
(2,347 | ) | 8,394 | (627 | ) | |||||||
| Construction |
— | — | (1,128 | ) | ||||||||
| Mortgage |
(14 | ) | (32 | ) | (20 | ) | ||||||
| Consumer: |
||||||||||||
| Credit Cards |
1 | (3 | ) | (9 | ) | |||||||
| HELOCs |
(126 | ) | (156 | ) | (909 | ) | ||||||
| Personal |
3,787 | 3,142 | 905 | |||||||||
| Other Consumer |
48 | 9 | 67 | |||||||||
| Total Consumer |
3,710 | 2,992 | 54 | |||||||||
|
|
|
|
|
|
|
|||||||
| Total net charged-off (recovered) Popular U.S. |
$ | 1,349 | $ | 11,354 | $ | (1,721 | ) | |||||
|
|
|
|
|
|
|
|||||||
| Total loans charged-off (recovered) - Popular, Inc. |
$ | 32,813 | $ | 31,200 | $ | 3,781 | ||||||
|
|
|
|
|
|
|
|||||||
| Balance at end of period - loans held-in-portfolio |
$ | 689,120 | $ | 720,302 | $ | 677,792 | ||||||
|
|
|
|
|
|
|
|||||||
| Balance at beginning of period - unfunded commitments |
$ | 8,805 | $ | 7,307 | $ | 7,897 | ||||||
| Provision for credit losses (benefit) |
610 | 1,498 | (843 | ) | ||||||||
|
|
|
|
|
|
|
|||||||
| Balance at end of period - unfunded commitments [1] |
$ | 9,415 | $ | 8,805 | $ | 7,054 | ||||||
|
|
|
|
|
|
|
|||||||
30
| POPULAR, INC. |
||||||||||||
| Annualized net charge-offs (recoveries) to average loans held-in-portfolio |
0.41 | % | 0.39 | % | 0.05 | % | ||||||
| Provision for credit losses (benefit) - loan portfolios to net charge-offs |
143.68 | % | 154.91 | % | (380.98 | )% | ||||||
| BPPR |
||||||||||||
| Annualized net charge-offs (recoveries) to average loans held-in-portfolio |
0.56 | % | 0.35 | % | 0.11 | % | ||||||
| Provision for credit losses (benefit) - loan portfolios to net charge-offs |
143.67 | % | 223.64 | % | (230.12 | )% | ||||||
| Popular U.S. |
||||||||||||
| Annualized net charge-offs (recoveries) to average loans held-in-portfolio |
0.06 | % | 0.49 | % | (0.08 | )% | ||||||
| Provision for credit losses (benefit) - loan portfolios to net charge-offs |
144.03 | % | 34.78 | % | 101.34 | % |
N.M. - Not meaningful.
| [1] | Allowance for credit losses of unfunded commitments is presented as part of Other Liabilities in the Consolidated Statements of Financial Condition. |
31
| Popular, Inc. | ||||||
| Financial Supplement to First Quarter 2023 Earnings Release | ||||||
| Table P - Allowance for Credit Losses “ACL”- Loan Portfolios - CONSOLIDATED | ||||||
| (Unaudited) | ||||||
| 31-Mar-23 |
||||||||||||
| (In thousands) |
Total ACL | Total loans held-in-portfolio |
ACL to loans held-in-portfolio |
|||||||||
| Commercial: |
||||||||||||
| Commercial multi-family |
$ | 25,366 | $ | 2,336,357 | 1.09 | % | ||||||
| Commercial real estate - non-owner occupied |
71,850 | 4,650,675 | 1.54 | % | ||||||||
| Commercial real estate - owner occupied |
54,497 | 3,018,587 | 1.81 | % | ||||||||
| Commercial and industrial |
92,266 | 5,999,642 | 1.54 | % | ||||||||
|
|
|
|
|
|
|
|||||||
| Total commercial |
$ | 243,979 | $ | 16,005,261 | 1.52 | % | ||||||
|
|
|
|
|
|
|
|||||||
| Construction |
4,330 | 698,996 | 0.62 | % | ||||||||
| Mortgage |
104,477 | 7,405,907 | 1.41 | % | ||||||||
| Leasing |
20,990 | 1,614,344 | 1.30 | % | ||||||||
| Consumer: |
||||||||||||
| Credit cards |
67,953 | 1,046,196 | 6.50 | % | ||||||||
| Home equity lines of credit |
1,953 | 69,887 | 2.79 | % | ||||||||
| Personal |
109,729 | 1,841,069 | 5.96 | % | ||||||||
| Auto |
130,829 | 3,517,940 | 3.72 | % | ||||||||
| Other consumer |
4,880 | 138,773 | 3.52 | % | ||||||||
|
|
|
|
|
|
|
|||||||
| Total consumer |
$ | 315,344 | $ | 6,613,865 | 4.77 | % | ||||||
|
|
|
|
|
|
|
|||||||
| Total |
$ | 689,120 | $ | 32,338,373 | 2.13 | % | ||||||
|
|
|
|
|
|
|
|||||||
| 31-Dec-22 |
||||||||||||
| (In thousands) |
Total ACL | Total loans held-in-portfolio |
ACL to loans held-in-portfolio |
|||||||||
| Commercial: |
||||||||||||
| Commercial multi-family |
$ | 26,311 | $ | 2,321,713 | 1.13 | % | ||||||
| Commercial real estate - non-owner occupied |
71,540 | 4,499,670 | 1.59 | % | ||||||||
| Commercial real estate - owner occupied |
57,081 | 3,078,549 | 1.85 | % | ||||||||
| Commercial and industrial |
80,444 | 5,839,200 | 1.38 | % | ||||||||
|
|
|
|
|
|
|
|||||||
| Total commercial |
$ | 235,376 | $ | 15,739,132 | 1.50 | % | ||||||
|
|
|
|
|
|
|
|||||||
| Construction |
4,246 | 757,984 | 0.56 | % | ||||||||
| Mortgage |
135,254 | 7,397,471 | 1.83 | % | ||||||||
| Leasing |
20,618 | 1,585,739 | 1.30 | % | ||||||||
| Consumer: |
||||||||||||
| Credit cards |
58,670 | 1,041,870 | 5.63 | % | ||||||||
| Home equity lines of credit |
2,542 | 71,916 | 3.53 | % | ||||||||
| Personal |
118,426 | 1,823,579 | 6.49 | % | ||||||||
| Auto |
129,735 | 3,512,530 | 3.69 | % | ||||||||
| Other consumer |
15,435 | 147,548 | 10.46 | % | ||||||||
|
|
|
|
|
|
|
|||||||
| Total consumer |
$ | 324,808 | $ | 6,597,443 | 4.92 | % | ||||||
|
|
|
|
|
|
|
|||||||
| Total |
$ | 720,302 | $ | 32,077,769 | 2.25 | % | ||||||
|
|
|
|
|
|
|
|||||||
32
| Variance |
||||||||||||
| (In thousands) |
Total ACL | Total loans held-in-portfolio |
ACL to loans held-in-portfolio |
|||||||||
| Commercial: |
||||||||||||
| Commercial multi-family |
$ | (945 | ) | $ | 14,644 | (0.04 | )% | |||||
| Commercial real estate - non-owner occupied |
310 | 151,005 | (0.05 | )% | ||||||||
| Commercial real estate - owner occupied |
(2,584 | ) | (59,962 | ) | (0.04 | )% | ||||||
| Commercial and industrial |
11,822 | 160,442 | 0.16 | % | ||||||||
|
|
|
|
|
|
|
|||||||
| Total commercial |
$ | 8,603 | $ | 266,129 | 0.02 | % | ||||||
|
|
|
|
|
|
|
|||||||
| Construction |
84 | (58,988 | ) | 0.06 | % | |||||||
| Mortgage [1] |
(30,777 | ) | 8,436 | (0.42 | )% | |||||||
| Leasing |
372 | 28,605 | — | % | ||||||||
| Consumer: |
||||||||||||
| Credit cards |
9,283 | 4,326 | 0.87 | % | ||||||||
| Home equity lines of credit |
(589 | ) | (2,029 | ) | (0.74 | )% | ||||||
| Personal |
(8,697 | ) | 17,490 | (0.53 | )% | |||||||
| Auto |
1,094 | 5,410 | 0.03 | % | ||||||||
| Other consumer |
(10,555 | ) | (8,775 | ) | (6.94 | )% | ||||||
|
|
|
|
|
|
|
|||||||
| Total consumer |
$ | (9,464 | ) | $ | 16,422 | (0.15 | )% | |||||
|
|
|
|
|
|
|
|||||||
| Total |
$ | (31,182 | ) | $ | 260,604 | (0.12 | )% | |||||
|
|
|
|
|
|
|
|||||||
| [1] | Variance is mainly due to impact of ASU 2022-02 adoption. Refer to Credit Quality section for further details. |
33
Popular, Inc.
Financial Supplement to First Quarter 2023 Earnings Release
Table Q - Allowance for Credit Losses “ACL”- Loan Portfolios - BPPR OPERATIONS
(Unaudited)
| 31-Mar-23 |
||||||||||||
| BPPR |
||||||||||||
| (In thousands) |
Total ACL | Total loans held-in-portfolio | ACL to loans held-in-portfolio | |||||||||
| Commercial: |
||||||||||||
| Commercial multi-family |
$ | 4,756 | $ | 292,806 | 1.62 | % | ||||||
| Commercial real estate - non-owner occupied |
53,894 | 2,885,483 | 1.87 | % | ||||||||
| Commercial real estate - owner occupied |
46,009 | 1,497,503 | 3.07 | % | ||||||||
| Commercial and industrial |
77,042 | 3,934,433 | 1.96 | % | ||||||||
|
|
|
|
|
|
|
|||||||
| Total commercial |
$ | 181,701 | $ | 8,610,225 | 2.11 | % | ||||||
|
|
|
|
|
|
|
|||||||
| Construction |
3,072 | 155,349 | 1.98 | % | ||||||||
| Mortgage |
89,077 | 6,116,684 | 1.46 | % | ||||||||
| Leasing |
20,990 | 1,614,344 | 1.30 | % | ||||||||
| Consumer: |
||||||||||||
| Credit cards |
67,953 | 1,046,175 | 6.50 | % | ||||||||
| Home equity lines of credit |
100 | 2,865 | 3.49 | % | ||||||||
| Personal |
88,408 | 1,612,918 | 5.48 | % | ||||||||
| Auto |
130,829 | 3,517,940 | 3.72 | % | ||||||||
| Other consumer |
4,877 | 130,012 | 3.75 | % | ||||||||
|
|
|
|
|
|
|
|||||||
| Total consumer |
$ | 292,167 | $ | 6,309,910 | 4.63 | % | ||||||
|
|
|
|
|
|
|
|||||||
| Total |
$ | 587,007 | $ | 22,806,512 | 2.57 | % | ||||||
|
|
|
|
|
|
|
|||||||
34
| 31-Dec-22 |
||||||||||||
| BPPR |
||||||||||||
| (In thousands) |
Total ACL | Total loans held-in-portfolio |
ACL to loans held-in-portfolio |
|||||||||
| Commercial: |
||||||||||||
| Commercial multi-family |
$ | 5,210 | $ | 281,373 | 1.85 | % | ||||||
| Commercial real estate - non-owner occupied |
52,475 | 2,757,327 | 1.90 | % | ||||||||
| Commercial real estate - owner occupied |
48,393 | 1,588,056 | 3.05 | % | ||||||||
| Commercial and industrial |
68,217 | 3,796,508 | 1.80 | % | ||||||||
|
|
|
|
|
|
|
|||||||
| Total commercial |
$ | 174,295 | $ | 8,423,264 | 2.07 | % | ||||||
|
|
|
|
|
|
|
|||||||
| Construction |
2,978 | 147,041 | 2.03 | % | ||||||||
| Mortgage |
117,344 | 6,110,279 | 1.92 | % | ||||||||
| Leasing |
20,618 | 1,585,739 | 1.30 | % | ||||||||
| Consumer: |
||||||||||||
| Credit cards |
58,670 | 1,041,831 | 5.63 | % | ||||||||
| Home equity lines of credit |
103 | 2,954 | 3.49 | % | ||||||||
| Personal |
96,369 | 1,585,687 | 6.08 | % | ||||||||
| Auto |
129,735 | 3,512,530 | 3.69 | % | ||||||||
| Other consumer |
15,433 | 137,580 | 11.22 | % | ||||||||
|
|
|
|
|
|
|
|||||||
| Total consumer |
$ | 300,310 | $ | 6,280,582 | 4.78 | % | ||||||
|
|
|
|
|
|
|
|||||||
| Total |
$ | 615,545 | $ | 22,546,905 | 2.73 | % | ||||||
|
|
|
|
|
|
|
|||||||
| Variance |
||||||||||||
| (In thousands) |
Total ACL | Total loans held-in-portfolio |
ACL to loans held-in-portfolio |
|||||||||
| Commercial: |
||||||||||||
| Commercial multi-family |
(454 | ) | 11,433 | (0.23 | )% | |||||||
| Commercial real estate - non-owner occupied |
1,419 | 128,156 | (0.03 | )% | ||||||||
| Commercial real estate - owner occupied |
(2,384 | ) | (90,553 | ) | 0.02 | % | ||||||
| Commercial and industrial |
8,825 | 137,925 | 0.16 | % | ||||||||
|
|
|
|
|
|
|
|||||||
| Total commercial |
$ | 7,406 | $ | 186,961 | 0.04 | % | ||||||
|
|
|
|
|
|
|
|||||||
| Construction |
94 | 8,308 | (0.05 | )% | ||||||||
| Mortgage |
(28,267 | ) | 6,405 | (0.46 | )% | |||||||
| Leasing |
372 | 28,605 | — | % | ||||||||
| Consumer: |
||||||||||||
| Credit cards |
9,283 | 4,344 | 0.87 | % | ||||||||
| Home equity lines of credit |
(3 | ) | (89 | ) | — | % | ||||||
| Personal |
(7,961 | ) | 27,231 | (0.60 | )% | |||||||
| Auto |
1,094 | 5,410 | 0.03 | % | ||||||||
| Other consumer |
(10,556 | ) | (7,568 | ) | (7.47 | )% | ||||||
|
|
|
|
|
|
|
|||||||
| Total consumer |
$ | (8,143 | ) | $ | 29,328 | (0.15 | )% | |||||
|
|
|
|
|
|
|
|||||||
| Total |
$ | (28,538 | ) | $ | 259,607 | (0.16 | )% | |||||
|
|
|
|
|
|
|
|||||||
35
Popular, Inc.
Financial Supplement to First Quarter 2023 Earnings Release
Table R - Allowance for Credit Losses “ACL”- Loan Portfolios - POPULAR U.S. OPERATIONS
(Unaudited)
| 31-Mar-23 |
||||||||||||
| Popular U.S. |
||||||||||||
| (In thousands) |
Total ACL | Total loans held-in-portfolio |
ACL to loans held-in-portfolio |
|||||||||
| Commercial: |
||||||||||||
| Commercial multi-family |
$ | 20,610 | $ | 2,043,551 | 1.01 | % | ||||||
| Commercial real estate - non-owner occupied |
17,956 | 1,765,192 | 1.02 | % | ||||||||
| Commercial real estate - owner occupied |
8,488 | 1,521,084 | 0.56 | % | ||||||||
| Commercial and industrial |
15,224 | 2,065,209 | 0.74 | % | ||||||||
|
|
|
|
|
|
|
|||||||
| Total commercial |
$ | 62,278 | $ | 7,395,036 | 0.84 | % | ||||||
|
|
|
|
|
|
|
|||||||
| Construction |
1,258 | 543,647 | 0.23 | % | ||||||||
| Mortgage |
15,400 | 1,289,223 | 1.19 | % | ||||||||
| Leasing |
— | — | — | % | ||||||||
| Consumer: |
||||||||||||
| Credit cards |
— | 21 | — | % | ||||||||
| Home equity lines of credit |
1,853 | 67,022 | 2.76 | % | ||||||||
| Personal |
21,321 | 228,151 | 9.35 | % | ||||||||
| Auto |
— | — | — | % | ||||||||
| Other consumer |
3 | 8,761 | 0.03 | % | ||||||||
|
|
|
|
|
|
|
|||||||
| Total consumer |
$ | 23,177 | $ | 303,955 | 7.63 | % | ||||||
|
|
|
|
|
|
|
|||||||
| Total |
$ | 102,113 | $ | 9,531,861 | 1.07 | % | ||||||
|
|
|
|
|
|
|
|||||||
36
| 31-Dec-22 |
||||||||||||
| Popular U.S. |
||||||||||||
| (In thousands) |
Total ACL | Total loans held-in-portfolio |
ACL to loans held-in-portfolio |
|||||||||
| Commercial: |
||||||||||||
| Commercial multi-family |
$ | 21,101 | $ | 2,040,340 | 1.03 | % | ||||||
| Commercial real estate - non-owner occupied |
19,065 | 1,742,343 | 1.09 | % | ||||||||
| Commercial real estate - owner occupied |
8,688 | 1,490,493 | 0.58 | % | ||||||||
| Commercial and industrial |
12,227 | 2,042,692 | 0.60 | % | ||||||||
|
|
|
|
|
|
|
|||||||
| Total commercial |
$ | 61,081 | $ | 7,315,868 | 0.83 | % | ||||||
|
|
|
|
|
|
|
|||||||
| Construction |
1,268 | 610,943 | 0.21 | % | ||||||||
| Mortgage |
17,910 | 1,287,192 | 1.39 | % | ||||||||
| Leasing |
— | — | — | % | ||||||||
| Consumer: |
||||||||||||
| Credit cards |
— | 39 | — | % | ||||||||
| Home equity lines of credit |
2,439 | 68,962 | 3.54 | % | ||||||||
| Personal |
22,057 | 237,892 | 9.27 | % | ||||||||
| Auto |
— | — | — | % | ||||||||
| Other consumer |
2 | 9,968 | 0.02 | % | ||||||||
|
|
|
|
|
|
|
|||||||
| Total consumer |
$ | 24,498 | $ | 316,861 | 7.73 | % | ||||||
|
|
|
|
|
|
|
|||||||
| Total |
$ | 104,757 | $ | 9,530,864 | 1.10 | % | ||||||
|
|
|
|
|
|
|
|||||||
| Variance |
||||||||||||
| (In thousands) |
Total ACL | Total loans held-in-portfolio |
ACL to loans held-in-portfolio |
|||||||||
| Commercial: |
||||||||||||
| Commercial multi-family |
$ | (491 | ) | $ | 3,211 | (0.02 | )% | |||||
| Commercial real estate - non-owner occupied |
(1,109 | ) | 22,849 | (0.07 | )% | |||||||
| Commercial real estate - owner occupied |
(200 | ) | 30,591 | (0.02 | )% | |||||||
| Commercial and industrial |
2,997 | 22,517 | 0.14 | % | ||||||||
|
|
|
|
|
|
|
|||||||
| Total commercial |
$ | 1,197 | $ | 79,168 | 0.01 | % | ||||||
|
|
|
|
|
|
|
|||||||
| Construction |
(10 | ) | (67,296 | ) | 0.02 | % | ||||||
| Mortgage |
(2,510 | ) | 2,031 | (0.20 | )% | |||||||
| Leasing |
— | — | — | % | ||||||||
| Consumer: |
||||||||||||
| Credit cards |
— | (18 | ) | — | % | |||||||
| Home equity lines of credit |
(586 | ) | (1,940 | ) | (0.78 | )% | ||||||
| Personal |
(736 | ) | (9,741 | ) | 0.08 | % | ||||||
| Auto |
— | — | — | % | ||||||||
| Other consumer |
1 | (1,207 | ) | 0.01 | % | |||||||
|
|
|
|
|
|
|
|||||||
| Total consumer |
$ | (1,321 | ) | $ | (12,906 | ) | (0.10 | )% | ||||
|
|
|
|
|
|
|
|||||||
| Total |
$ | (2,644 | ) | $ | 997 | (0.03 | )% | |||||
|
|
|
|
|
|
|
|||||||
37
Popular, Inc.
Financial Supplement to First Quarter 2023 Earnings Release
Table S - Reconciliation to GAAP Financial Measures
(Unaudited)
| (In thousands, except share or per share information) |
31-Mar-23 | 31-Dec-22 | 31-Mar-22 | |||||||||
| Total stockholders’ equity |
$ | 4,470,725 | $ | 4,093,425 | $ | 4,671,246 | ||||||
| Less: Preferred stock |
(22,143 | ) | (22,143 | ) | (22,143 | ) | ||||||
| Less: Goodwill |
(827,428 | ) | (827,428 | ) | (720,293 | ) | ||||||
| Less: Other intangibles |
(12,149 | ) | (12,944 | ) | (15,328 | ) | ||||||
|
|
|
|
|
|
|
|||||||
| Total tangible common equity |
$ | 3,609,005 | $ | 3,230,910 | $ | 3,913,482 | ||||||
|
|
|
|
|
|
|
|||||||
| Total assets |
$ | 67,675,759 | $ | 67,637,917 | $ | 69,525,082 | ||||||
| Less: Goodwill |
(827,428 | ) | (827,428 | ) | (720,293 | ) | ||||||
| Less: Other intangibles |
(12,149 | ) | (12,944 | ) | (15,328 | ) | ||||||
|
|
|
|
|
|
|
|||||||
| Total tangible assets |
$ | 66,836,182 | $ | 66,797,545 | $ | 68,789,461 | ||||||
|
|
|
|
|
|
|
|||||||
| Tangible common equity to tangible assets |
5.40 | % | 4.84 | % | 5.69 | % | ||||||
| Common shares outstanding at end of period |
71,965,984 | 71,853,720 | 76,487,523 | |||||||||
| Tangible book value per common share |
$ | 50.15 | $ | 44.97 | $ | 51.16 | ||||||
|
|
|
|
|
|
|
|||||||
| Quarterly average | ||||||||||||
| Total stockholders’ equity [1] |
$ | 6,452,889 | $ | 6,161,634 | $ | 5,983,309 | ||||||
| Less: Preferred Stock |
(22,143 | ) | (22,143 | ) | (22,143 | ) | ||||||
| Less: Goodwill |
(827,427 | ) | (827,427 | ) | (720,292 | ) | ||||||
| Less: Other intangibles |
(12,678 | ) | (13,440 | ) | (15,881 | ) | ||||||
|
|
|
|
|
|
|
|||||||
| Total tangible equity |
$ | 5,590,641 | $ | 5,298,624 | $ | 5,224,993 | ||||||
| Return on average tangible common equity |
11.51 | % | 19.23 | % | 16.40 | % | ||||||
|
|
|
|
|
|
|
|||||||
| [1] | Average balances exclude unrealized gains or losses on debt securities available-for-sale and the unrealized loss related to certain securities transferred from available-for-sale to held-to-maturity. |
CONTACTS:
Popular, Inc.
Investor Relations:
Paul J. Cardillo, 212-417-6721
Senior Vice President and Investor Relations Officer
pcardillo@popular.com
or
Media Relations:
MC González Noguera, 917-804-5253
Executive Vice President and Chief Communications & Public Affairs Officer
mc.gonzalez@popular.com
38