Prospectus
J.P. Morgan Municipal Bond Funds
Class A, Class C & Class I Shares
July 1, 2022, as supplemented March 9, 2023
JPMorgan Sustainable Municipal Income Fund
Class/Ticker: A/OTBAX; C/OMICX; I/HLTAX
JPMorgan Short-Intermediate Municipal Bond Fund
Class/Ticker: A/OSTAX; C/STMCX; I/JIMIX
JPMorgan Tax Free Bond Fund
Class/Ticker: A/PMBAX; C/JTFCX; I/PRBIX
JPMorgan Ultra-Short Municipal Fund
Class/Ticker: A/USMSX; I/USMTX
JPMorgan California Tax Free Bond Fund
Class/Ticker: A/JCBAX; C/JCBCX; I/JPICX
JPMorgan High Yield Municipal Fund
Class/Ticker: A/JTIAX; C/JTICX; I/JTISX
JPMorgan Intermediate Tax Free Bond Fund
Class/Ticker: A/JITAX; C/JITCX; I/JITIX
JPMorgan New York Tax Free Bond Fund
Class/Ticker: A/VANTX; C/JCNTX; I/JNYIX
The Securities and Exchange Commission and the Commodity Futures Trading Commission have not approved or disapproved of these securities or determined if this prospectus is truthful or complete. Any representation to the contrary is a criminal offense.

Contents
| | |
| 1 | |
| 7 | |
| 13 | |
| 19 | |
| 25 | |
| 31 | |
| 38 | |
| 44 | |
| 50 | |
| 50 | |
| 51 | |
| 54 | |
| 63 | |
| 63 | |
| 63 | |
| 64 | |
| 67 | |
| 67 |
| 71 | |
| 78 | |
| 81 | |
| 82 | |
| 84 | |
| 85 | |
| 86 | |
| 87 | |
| 90 | |
| 90 | |
| 90 | |
| 91 | |
| 92 | |
| 100 | |
| 116 | |
| 121 | |
| Back cover |
JPMorgan Sustainable Municipal Income Fund
| | |||
| |
Class A |
Class C |
Class I |
| Maximum Sales Charge (Load) Imposed on Purchases as % of the Offering Price |
|
|
|
| Maximum Deferred Sales Charge (Load) as % of Original Cost of the Shares |
1 |
|
|
1
| | |||
| |
Class A |
Class C |
Class I |
| Management Fees |
|
|
|
| Distribution (Rule 12b-1) Fees |
|
|
|
| Other Expenses |
|
|
|
| Service Fees |
|
|
|
| Remainder of Other Expenses |
|
|
|
| Total Annual Fund Operating Expenses |
|
|
|
| Fee Waivers and/or Expense Reimbursements1 |
- |
- |
- |
| Total Annual Fund Operating Expenses after Fee Waivers and/or Expense Reimburse- ments1 |
|
|
|
1
| | ||||
| |
1 Year |
3 Years |
5 Years |
10 Years |
| CLASS A SHARES ($) |
|
|
|
|
| CLASS C SHARES ($) |
|
|
|
|
| CLASS I SHARES ($) |
|
|
|
|
| | ||||
| |
1 Year |
3 Years |
5 Years |
10 Years |
| CLASS A SHARES ($) |
|
|
|
|
| CLASS C SHARES ($) |
|
|
|
|
| CLASS I SHARES ($) |
|
|
|
|
July 1, 2022 | 1
JPMorgan Sustainable Municipal Income Fund (continued)
2 | J.P. Morgan Municipal Bond Funds
July 1, 2022 | 3
JPMorgan Sustainable Municipal Income Fund (continued)
4 | J.P. Morgan Municipal Bond Funds
July 1, 2022 | 5
JPMorgan Sustainable Municipal Income Fund (continued)
| |
| |
|
|
| |
|
|
| |
|
|
|
|
|
| | |||
| |
Past 1 Year |
Past 5 Years |
Past 10 Years |
| CLASS I SHARES |
|
|
|
| Return Before Taxes |
|
|
|
| Return After Taxes on Distributions |
|
|
|
| Return After Taxes on Distributions and Sale of Fund Shares |
|
|
|
| CLASS A SHARES |
|
|
|
| Return Before Taxes |
- |
|
|
| CLASS C SHARES |
|
|
|
| Return Before Taxes |
- |
|
|
| BLOOMBERG U.S. 1-15 YEAR BLEND (1-17) MUNICIPAL BOND INDEX (Reflects No Deduction for Fees, Expenses, or Taxes) |
|
|
|
Management
J.P. Morgan Investment Management Inc. (the adviser)
| Portfolio Manager |
Managed the Fund Since |
Primary Title with Investment Adviser |
| Kevin M. Ellis |
2020 |
Managing Director |
| Wayne Godlin |
2020 |
Managing Director |
| David Sivinski |
2006 |
Executive Director |
Purchase and Sale of Fund Shares
Purchase minimums
| For Class A and Class C Shares |
|
| To establish an account |
$1,000 |
| To add to an account |
$50 |
| For Class I Shares | |
| To establish an account |
$1,000,000 |
| To add to an account |
No minimum levels |
In general, you may purchase or redeem shares on any business day:
•
Through your Financial Intermediary
•
By writing to J.P. Morgan Funds Services, P.O. Box 219143, Kansas City, MO 64121-9143
•
After you open an account, by calling J.P. Morgan Funds Services at 1-800-480-4111
Tax Information
The Fund’s distributions of interest on municipal bonds generally are not subject to federal income tax; however the Fund may distribute taxable dividends, including distributions of short-term capital gains, and long-term capital gains. In addition, interest on certain bonds may be subject to the federal alternative minimum tax. To the extent that the Fund’s distributions are derived from interest on bonds that are not exempt from applicable state and local taxes, such distributions will be subject to such state and local taxes. When your investment is in an IRA, 401(k) plan or other tax-advantaged investment plan, you may be subject to federal income tax on ordinary income or capital gains upon withdrawal from the tax-advantaged investment plan.
Payments to Broker-Dealers and Other Financial Intermediaries
If you purchase shares of the Fund through a broker-dealer or other financial intermediary (such as a bank), the Fund and its related companies may pay the financial intermediary for the sale of Fund shares and related services. These payments may create a conflict of interest by influencing the broker-dealer or financial intermediary and your salesperson to recommend the Fund over another investment. Ask your salesperson or visit your financial intermediary’s website for more information.
6 | J.P. Morgan Municipal Bond Funds
JPMorgan Short-Intermediate Municipal Bond Fund
| | |||
| |
Class A |
Class C |
Class I |
| Maximum Sales Charge (Load) Imposed on Purchases as % of the Offering Price |
|
|
|
| Maximum Deferred Sales Charge (Load) as % of Original Cost of the Shares |
1 |
|
|
1
| | |||
| |
Class A |
Class C |
Class I |
| Management Fees |
|
|
|
| Distribution (Rule 12b-1) Fees |
|
|
|
| Other Expenses |
|
|
|
| Service Fees |
|
|
|
| Remainder of Other Expenses |
|
|
|
| Acquired Fund Fees and Expenses |
|
|
|
| Total Annual Fund Operating Expenses |
|
|
|
| Fee Waivers and/or Expense Reimbursements1 |
- |
- |
- |
| Total Annual Fund Operating Expenses after Fee Waivers and/or Expense Reimburse- ments1 |
|
|
|
1
July 1, 2022 | 7
JPMorgan Short-Intermediate Municipal Bond Fund (continued)
| | ||||
| |
1 Year |
3 Years |
5 Years |
10 Years |
| CLASS A SHARES ($) |
|
|
|
|
| CLASS C SHARES ($) |
|
|
|
|
| CLASS I SHARES ($) |
|
|
|
|
| | ||||
| |
1 Year |
3 Years |
5 Years |
10 Years |
| CLASS A SHARES ($) |
|
|
|
|
| CLASS C SHARES ($) |
|
|
|
|
| CLASS I SHARES ($) |
|
|
|
|
8 | J.P. Morgan Municipal Bond Funds
July 1, 2022 | 9
JPMorgan Short-Intermediate Municipal Bond Fund (continued)
10 | J.P. Morgan Municipal Bond Funds
| |

| |
|
|
| |
|
|
| |
|
|
|
|
|
July 1, 2022 | 11
JPMorgan Short-Intermediate Municipal Bond Fund (continued)
| | |||
| |
Past 1 Year |
Past 5 Years |
Past 10 Years |
| CLASS I SHARES |
|
|
|
| Return Before Taxes |
|
|
|
| Return After Taxes on Distributions |
|
|
|
| Return After Taxes on Distributions and Sale of Fund Shares |
|
|
|
| CLASS A SHARES |
|
|
|
| Return Before Taxes |
- |
|
|
| CLASS C SHARES |
|
|
|
| Return Before Taxes |
- |
|
|
| BLOOMBERG U.S. 1-5 YEAR BLEND (1-6) MUNICIPAL BOND INDEX (Reflects No Deduction for Fees, Expenses, or Taxes) |
|
|
|
Management
J.P. Morgan Investment Management Inc. (the adviser)
| Portfolio Manager |
Managed the Fund Since |
Primary Title with Investment Adviser |
| James Ahn |
2006 |
Managing Director |
| Kevin M. Ellis |
2006 |
Managing Director |
Purchase and Sale of Fund Shares
Purchase minimums
| For Class A and Class C Shares | |
| To establish an account |
$1,000 |
| To add to an account |
$50 |
| For Class I Shares | |
| To establish an account |
$1,000,000 |
| To add to an account |
No minimum levels |
In general, you may purchase or redeem shares on any business day:
•
Through your Financial Intermediary
•
By writing to J.P. Morgan Funds Services, P.O. Box 219143, Kansas City, MO 64121-9143
•
After you open an account, by calling J.P. Morgan Funds Services at 1-800-480-4111
Tax Information
The Fund’s distributions of interest on municipal bonds generally are not subject to federal income tax; however the Fund may distribute taxable dividends, including distributions of short-term capital gains, and long-term capital gains. In addition, interest on certain bonds may be subject to the federal alternative minimum tax. To the extent that the Fund’s distributions are derived from interest on bonds that are not exempt from applicable state and local taxes, such distributions will be subject to such state and local taxes. When your investment is in an IRA, 401(k) plan or other tax-advantaged investment plan, you may be subject to federal income tax on ordinary income or capital gains upon withdrawal from the tax-advantaged investment plan.
Payments to Broker-Dealers and Other Financial Intermediaries
If you purchase shares of the Fund through a broker-dealer or other financial intermediary (such as a bank), the Fund and its related companies may pay the financial intermediary for the sale of Fund shares and related services. These payments may create a conflict of interest by influencing the broker-dealer or financial intermediary and your salesperson to recommend the Fund over another investment. Ask your salesperson or visit your financial intermediary’s website for more information.
12 | J.P. Morgan Municipal Bond Funds
JPMorgan Tax Free Bond Fund
| | |||
| |
Class A |
Class C |
Class I |
| Maximum Sales Charge (Load) Imposed on Purchases as % of the Offering Price |
|
|
|
| Maximum Deferred Sales Charge (Load) as % of Original Cost of the Shares |
1 |
|
|
1
| | |||
| |
Class A |
Class C |
Class I |
| Management Fees |
|
|
|
| Distribution (Rule 12b-1) Fees |
|
|
|
| Other Expenses |
|
|
|
| Service Fees |
|
|
|
| Remainder of Other Expenses |
|
|
|
| Total Annual Fund Operating Expenses |
|
|
|
| Fee Waivers and/or Expense Reimbursements1 |
- |
- |
- |
| Total Annual Fund Operating Expenses after Fee Waivers and/or Expense Reimburse- ments1 |
|
|
|
1
July 1, 2022 | 13
JPMorgan Tax Free Bond Fund (continued)
| | ||||
| |
1 Year |
3 Years |
5 Years |
10 Years |
| CLASS A SHARES ($) |
|
|
|
|
| CLASS C SHARES ($) |
|
|
|
|
| CLASS I SHARES ($) |
|
|
|
|
| | ||||
| |
1 Year |
3 Years |
5 Years |
10 Years |
| CLASS A SHARES ($) |
|
|
|
|
| CLASS C SHARES ($) |
|
|
|
|
| CLASS I SHARES ($) |
|
|
|
|
14 | J.P. Morgan Municipal Bond Funds
July 1, 2022 | 15
JPMorgan Tax Free Bond Fund (continued)
16 | J.P. Morgan Municipal Bond Funds
| |

| |
|
|
| |
|
|
| |
|
|
|
|
|
| | |||
| |
Past 1 Year |
Past 5 Years |
Past 10 Years |
| CLASS I SHARES |
|
|
|
| Return Before Taxes |
|
|
|
| Return After Taxes on Distributions |
|
|
|
| Return After Taxes on Distributions and Sale of Fund Shares |
|
|
|
| CLASS A SHARES |
|
|
|
| Return Before Taxes |
- |
|
|
| CLASS C SHARES |
|
|
|
| Return Before Taxes |
|
|
|
| BLOOMBERG US MUNICIPAL INDEX (Reflects No Deduction for Fees, Expenses, or Taxes) |
|
|
|
July 1, 2022 | 17
JPMorgan Tax Free Bond Fund (continued)
Management
J.P. Morgan Investment Management Inc. (the adviser)
| Portfolio Manager |
Managed the Fund Since |
Primary Title with Investment Adviser |
| Richard Taormina |
2005 |
Managing Director |
| Michelle Hallam |
2014 |
Executive Director |
Purchase and Sale of Fund Shares
Purchase minimums
| For Class A and Class C Shares | |
| To establish an account |
$1,000 |
| To add to an account |
$50 |
| For Class I Shares | |
| To establish an account |
$1,000,000 |
| To add to an account |
No minimum levels |
In general, you may purchase or redeem shares on any business day:
•
Through your Financial Intermediary
•
By writing to J.P. Morgan Funds Services, P.O. Box 219143, Kansas City, MO 64121-9143
•
After you open an account, by calling J.P. Morgan Funds Services at 1-800-480-4111
Tax Information
The Fund’s distributions of interest on municipal bonds generally are not subject to federal income tax; however the Fund may distribute taxable dividends, including distributions of short-term capital gains, and long-term capital gains. In addition, interest on certain bonds may be subject to the federal alternative minimum tax. To the extent that the Fund’s distributions are derived from interest on bonds that are not exempt from applicable state and local taxes, such distributions will be subject to such state and local taxes. When your investment is in an IRA, 401(k) plan or other tax-advantaged investment plan, you may be subject to federal income tax on ordinary income or capital gains upon withdrawal from the tax-advantaged investment plan.
Payments to Broker-Dealers and Other Financial Intermediaries
If you purchase shares of the Fund through a broker-dealer or other financial intermediary (such as a bank), the Fund and its related companies may pay the financial intermediary for the sale of Fund shares and related services. These payments may create a conflict of interest by influencing the broker-dealer or financial intermediary and your salesperson to recommend the Fund over another investment. Ask your salesperson or visit your financial intermediary’s website for more information.
18 | J.P. Morgan Municipal Bond Funds
JPMorgan Ultra-Short Municipal Fund
| | ||
| |
Class A |
Class I |
| Maximum Sales Charge (Load) Imposed on Purchases as a % of the Offering Price |
|
|
| Maximum Deferred Sales Charge (Load) as a % of Original Cost of Shares |
|
|
| | ||
| |
Class A |
Class I |
| Management Fees |
|
|
| Distribution (Rule 12b-1) Fees |
|
|
| Other Expenses |
|
|
| Service Fees |
|
|
| Remainder of Other Expenses |
|
|
| Acquired Fund Fees and Expenses |
|
|
| Total Annual Fund Operating Expenses |
|
|
| Fee Waivers and/or Expense Reimburse- ments1 |
- |
- |
| Total Annual Fund Operating Expenses after Fee Waivers and/or Expense Reimbursements1 |
|
|
1
| | ||||
| |
1 Year |
3 Years |
5 Years |
10 Years |
| CLASS A SHARES ($) |
|
|
|
|
| CLASS I SHARES ($) |
|
|
|
|
July 1, 2022 | 19
JPMorgan Ultra-Short Municipal Fund (continued)
20 | J.P. Morgan Municipal Bond Funds
July 1, 2022 | 21
JPMorgan Ultra-Short Municipal Fund (continued)
22 | J.P. Morgan Municipal Bond Funds
July 1, 2022 | 23
JPMorgan Ultra-Short Municipal Fund (continued)
| |
| |
|
|
| |
|
|
| |
|
|
|
|
|
| | |||
| |
Past |
Past |
Life of Fund since |
| |
1 Year |
5 Years |
|
| CLASS I SHARES |
|
|
|
| Return Before Taxes |
- |
|
|
| Return After Taxes on Distributions |
- |
|
|
| Return After Taxes on Distributions and Sale of Fund Shares |
|
|
|
| CLASS A SHARES |
|
|
|
| Return Before Taxes |
- |
|
|
| BLOOMBERG 1 YEAR MUNICIPAL BOND INDEX (Reflects No Deduction for Fees, Expenses, or Taxes) |
|
|
|
Management
J.P. Morgan Investment Management Inc. (the adviser)
| Portfolio Manager |
Managed the Fund Since |
Primary Title with Investment Adviser |
| Richard Taormina |
2016 |
Managing Director |
| James Ahn |
2016 |
Managing Director |
Purchase and Sale of Fund Shares
Purchase minimums
| For Class A Shares | |
| To establish an account |
$1,000 |
| To add to an account |
$50 |
| For Class I Shares | |
| To establish an account |
$1,000,000 |
| To add to an account |
No minimum levels |
In general, you may purchase or redeem shares on any business day:
•
Through your Financial Intermediary
•
By writing to J.P. Morgan Funds Services, P.O. Box 219143, Kansas City, MO 64121-9143
•
After you open an account, by calling J.P. Morgan Funds Services at 1-800-480-4111
Tax Information
The Fund’s distributions of interest on municipal bonds generally are not subject to federal income tax; however the Fund may distribute taxable dividends, including distributions of short-term capital gains, and long-term capital gains. In addition, interest on certain bonds may be subject to the federal alternative minimum tax. To the extent that the Fund’s distributions are derived from interest on bonds that are not exempt from applicable state and local taxes, such distributions will be subject to such state and local taxes. When your investment is in an IRA, 401(k) plan or other tax-advantaged investment plan, you may be subject to federal income tax on ordinary income or capital gains upon withdrawal from the tax-advantaged investment plan.
Payments to Broker-Dealers and Other Financial Intermediaries
If you purchase shares of the Fund through a broker-dealer or other financial intermediary (such as a bank), the Fund and its related companies may pay the financial intermediary for the sale of Fund shares and related services. These payments may create a conflict of interest by influencing the broker-dealer or financial intermediary and your salesperson to recommend the Fund over another investment. Ask your salesperson or visit your financial intermediary’s website for more information.
24 | J.P. Morgan Municipal Bond Funds
JPMorgan California Tax Free Bond Fund
| | |||
| |
Class A |
Class C |
Class I |
| Maximum Sales Charge (Load) Imposed on Purchases as % of the Offering Price |
|
|
|
| Maximum Deferred Sales Charge (Load) as % of Original Cost of the Shares |
1 |
|
|
1
| | |||
| |
Class A |
Class C |
Class I |
| Management Fees |
|
|
|
| Distribution (Rule 12b-1) Fees |
|
|
|
| Other Expenses |
|
|
|
| Service Fees |
|
|
|
| Remainder of Other Expenses |
|
|
|
| Total Annual Fund Operating Expenses |
|
|
|
| Fee Waivers and/or Expense Reimbursements1 |
- |
- |
- |
| Total Annual Fund Operating Expenses after Fee Waivers and/or Expense Reimburse- ments1 |
|
|
|
1
| | ||||
| |
1 Year |
3 Years |
5 Years |
10 Years |
| CLASS A SHARES ($) |
|
|
|
|
| CLASS C SHARES ($) |
|
|
|
|
| CLASS I SHARES ($) |
|
|
|
|
| | ||||
| |
1 Year |
3 Years |
5 Years |
10 Years |
| CLASS A SHARES ($) |
|
|
|
|
| CLASS C SHARES ($) |
|
|
|
|
| CLASS I SHARES ($) |
|
|
|
|
July 1, 2022 | 25
JPMorgan California Tax Free Bond Fund (continued)
26 | J.P. Morgan Municipal Bond Funds
July 1, 2022 | 27
JPMorgan California Tax Free Bond Fund (continued)
28 | J.P. Morgan Municipal Bond Funds
| |
| |
|
|
| |
|
|
| |
|
|
|
|
|
| | |||
| |
Past 1 Year |
Past 5 Years |
Past 10 Years |
| CLASS I SHARES |
|
|
|
| Return Before Taxes |
- |
|
|
| Return After Taxes on Distributions |
- |
|
|
| Return After Taxes on Distributions and Sale of Fund Shares |
|
|
|
| CLASS A SHARES |
|
|
|
| Return Before Taxes |
- |
|
|
| CLASS C SHARES |
|
|
|
| Return Before Taxes |
- |
|
|
| BLOOMBERG LB CALIFORNIA 1-17 YEAR MUNI INDEX (Reflects No Deduction for Fees, Expenses, or Taxes) |
|
|
|
July 1, 2022 | 29
JPMorgan California Tax Free Bond Fund (continued)
Management
J.P. Morgan Investment Management Inc. (the adviser)
| Portfolio Manager |
Managed the Fund Since |
Primary Title with Investment Adviser |
| David Sivinski |
2005 |
Executive Director |
| Michelle Hallam |
2004 |
Executive Director |
Purchase and Sale of Fund Shares
Purchase minimums
| For Class A and Class C Shares | |
| To establish an account |
$1,000 |
| To add to an account |
$50 |
| For Class I Shares | |
| To establish an account |
$1,000,000 |
| To add to an account |
No minimum levels |
In general, you may purchase or redeem shares on any business day:
•
Through your Financial Intermediary
•
By writing to J.P. Morgan Funds Services, P.O. Box 219143, Kansas City, MO 64121-9143
•
After you open an account, by calling J.P. Morgan Funds Services at 1-800-480-4111
Tax Information
The Fund’s distributions of interest on municipal bonds generally are not subject to federal income tax; however the Fund may distribute taxable dividends, including distributions of short-term capital gains, and long-term capital gains. In addition, interest on certain bonds may be subject to the federal alternative minimum tax. To the extent that the Fund’s distributions are derived from interest on bonds that are not exempt from applicable state and local taxes, such distributions will be subject to such state and local taxes. When your investment is in an IRA, 401(k) plan or other tax-advantaged investment plan, you may be subject to federal income tax on ordinary income or capital gains upon withdrawal from the tax-advantaged investment plan.
Payments to Broker-Dealers and Other Financial Intermediaries
If you purchase shares of the Fund through a broker-dealer or other financial intermediary (such as a bank), the Fund and its related companies may pay the financial intermediary for the sale of Fund shares and related services. These payments may create a conflict of interest by influencing the broker dealer or financial intermediary and your salesperson to recommend the Fund over another investment. Ask your salesperson or visit your financial intermediary’s website for more information.
30 | J.P. Morgan Municipal Bond Funds
JPMorgan High Yield Municipal Fund
| | |||
| |
Class A |
Class C |
Class I |
| Maximum Sales Charge (Load) Imposed on Purchases as a % of the Offering Price |
|
|
|
| Maximum Deferred Sales Charge (Load) as a % of Original Cost of the Shares |
1 |
|
|
1
| | |||
| |
Class A |
Class C |
Class I |
| Management Fees |
|
|
|
| Distribution (Rule 12b-1) Fees |
|
|
|
| Other Expenses |
|
|
|
| Service Fees |
|
|
|
| Remainder of Other Expenses |
|
|
|
| Total Annual Fund Operating Expenses |
|
|
|
| Fee Waivers and/or Expense Reimbursements1 |
- |
- |
- |
| Total Annual Fund Operating Expenses after Fee Waivers and/or Expense Reimburse- ments1 |
|
|
|
1
| | ||||
| |
1 Year |
3 Years |
5 Years |
10 Years |
| CLASS A SHARES ($) |
|
|
|
|
| CLASS C SHARES ($) |
|
|
|
|
| CLASS I SHARES ($) |
|
|
|
|
| | ||||
| |
1 Year |
3 Years |
5 Years |
10 Years |
| CLASS A SHARES ($) |
|
|
|
|
| CLASS C SHARES ($) |
|
|
|
|
| CLASS I SHARES ($) |
|
|
|
|
July 1, 2022 | 31
JPMorgan High Yield Municipal Fund (continued)
32 | J.P. Morgan Municipal Bond Funds
July 1, 2022 | 33
JPMorgan High Yield Municipal Fund (continued)
34 | J.P. Morgan Municipal Bond Funds
July 1, 2022 | 35
JPMorgan High Yield Municipal Fund (continued)
| |
| |
|
|
| |
|
|
| |
|
|
|
|
|
| | |||
| |
Past 1 Year |
Past 5 Years |
Past 10 Years |
| CLASS I SHARES |
|
|
|
| Return Before Taxes |
|
|
|
| Return After Taxes on Distributions |
|
|
|
| Return After Taxes on Distributions and Sale of Fund Shares |
|
|
|
| CLASS A SHARES |
|
|
|
| Return Before Taxes |
|
|
|
| CLASS C SHARES |
|
|
|
| Return Before Taxes |
|
|
|
| BLOOMBERG US MUNICIPAL INDEX (Reflects No Deduction for Fees, Expenses, or Taxes) |
|
|
|
| BLOOMBERG HIGH YIELD MUNICIPAL BOND INDEX (Reflects No Deduction for Fees, Expenses, or Taxes) |
|
|
|
Management
J.P. Morgan Investment Management Inc. (the adviser)
| Portfolio Manager |
Managed the Fund Since |
Primary Title with Investment Adviser |
| Wayne Godlin |
2018 |
Managing Director |
| Richard Taormina |
2007 |
Managing Director |
| Kevin M. Ellis |
2018 |
Managing Director |
Purchase and Sale of Fund Shares
Purchase minimums
| For Class A and Class C Shares | |
| To establish an account |
$1,000 |
| To add to an account |
$50 |
| For Class I Shares | |
| To establish an account |
$1,000,000 |
| To add to an account |
No minimum levels |
36 | J.P. Morgan Municipal Bond Funds
In general, you may purchase or redeem shares on any business day:
•
Through your Financial Intermediary
•
By writing to J.P. Morgan Funds Services, P.O. Box 219143, Kansas City, MO 64121-9143
•
After you open an account, by calling J.P. Morgan Funds Services at 1-800-480-4111
Tax Information
The Fund’s distributions of interest on municipal bonds generally are not subject to federal income tax; however the Fund will distribute taxable dividends, including distributions of short-term gains, and long-term gains. In addition, interest on certain bonds may be subject to the federal alternative minimum tax. To the extent that the Fund’s distributions are derived from
interest on bonds that are not exempt from applicable state and local taxes, such distributions will be subject to such state and local taxes.
Payments to Broker-Dealers and Other Financial Intermediaries
If you purchase shares of the Fund through a broker-dealer or other financial intermediary (such as a bank), the Fund and its related companies may pay the financial intermediary for the sale of Fund shares and related services. These payments may create a conflict of interest by influencing the broker-dealer or financial intermediary and your salesperson to recommend the Fund over another investment. Ask your salesperson or visit your financial intermediary’s website for more information.
July 1, 2022 | 37
JPMorgan Intermediate Tax Free Bond Fund
| | |||
| |
Class A |
Class C |
Class I |
| Maximum Sales Charge (Load) Imposed on Purchases as % of the Offering Price |
|
|
|
| Maximum Deferred Sales Charge (Load) as % of Original Cost of the Shares |
1 |
|
|
1
| | |||
| |
Class A |
Class C |
Class I |
| Management Fees |
|
|
|
| Distribution (Rule 12b-1) Fees |
|
|
|
| Other Expenses |
|
|
|
| Service Fees |
|
|
|
| Remainder of Other Expenses |
|
|
|
| Total Annual Fund Operating Expenses |
|
|
|
| Fee Waivers and/or Expense Reimbursements1 |
- |
- |
- |
| Total Annual Fund Operating Expenses after Fee Waivers and/or Expense Reimburse- ments1 |
|
|
|
1
38 | J.P. Morgan Municipal Bond Funds
| | ||||
| |
1 Year |
3 Years |
5 Years |
10 Years |
| CLASS A SHARES ($) |
|
|
|
|
| CLASS C SHARES ($) |
|
|
|
|
| CLASS I SHARES ($) |
|
|
|
|
| | ||||
| |
1 Year |
3 Years |
5 Years |
10 Years |
| CLASS A SHARES ($) |
|
|
|
|
| CLASS C SHARES ($) |
|
|
|
|
| CLASS I SHARES ($) |
|
|
|
|
July 1, 2022 | 39
JPMorgan Intermediate Tax Free Bond Fund (continued)
40 | J.P. Morgan Municipal Bond Funds
July 1, 2022 | 41
JPMorgan Intermediate Tax Free Bond Fund (continued)
| |
| |
|
|
| |
|
|
| |
|
|
|
|
|
| | |||
| |
Past 1 Year |
Past 5 Years |
Past 10 Years |
| CLASS I SHARES |
|
|
|
| Return Before Taxes |
|
|
|
| Return After Taxes on Distributions |
|
|
|
| Return After Taxes on Distributions and Sale of Fund Shares |
|
|
|
| CLASS A SHARES |
|
|
|
| Return Before Taxes |
- |
|
|
| CLASS C SHARES |
|
|
|
| Return Before Taxes |
- |
|
|
| BLOOMBERG U.S. 1-15 YEAR BLEND (1-17) MUNICIPAL BOND INDEX (Reflects No Deduction for Fees, Expenses, or Taxes) |
|
|
|
42 | J.P. Morgan Municipal Bond Funds
Management
J.P. Morgan Investment Management Inc. (the adviser)
| Portfolio Managers |
Managed the Fund Since |
Primary Title with Investment Adviser |
| Richard Taormina |
2006 |
Managing Director |
| David Sivinski |
2005 |
Executive Director |
| Kevin M. Ellis |
2014 |
Managing Director |
Purchase and Sale of Fund Shares
Purchase minimums
| For Class A and Class C Shares | |
| To establish an account |
$1,000 |
| To add to an account |
$50 |
| For Class I Shares | |
| To establish an account |
$1,000,000 |
| To add to an account |
No minimum levels |
In general, you may purchase or redeem shares on any business day:
•
Through your Financial Intermediary
•
By writing to J.P. Morgan Funds Services, P.O. Box 219143, Kansas City, MO 64121-9143
•
After you open an account, by calling J.P. Morgan Funds Services at 1-800-480-4111
Tax Information
The Fund’s distributions of interest on municipal bonds generally are not subject to federal income tax; however the Fund may distribute taxable dividends, including distributions of short-term capital gains, and long-term capital gains. In addition, interest on certain bonds may be subject to the federal alternative minimum tax. To the extent that the Fund’s distributions are derived from interest on bonds that are not exempt from applicable state and local taxes, such distributions will be subject to such state and local taxes. When your investment is in an IRA, 401(k) plan or other tax-advantaged investment plan, you may be subject to federal income tax on ordinary income or capital gains upon withdrawal from the tax-advantaged investment plan.
Payments to Broker-Dealers and Other Financial Intermediaries
If you purchase shares of the Fund through a broker-dealer or other financial intermediary (such as a bank), the Fund and its related companies may pay the financial intermediary for the sale of Fund shares and related services. These payments may create a conflict of interest by influencing the broker-dealer or financial intermediary and your salesperson to recommend the Fund over another investment. Ask your salesperson or visit your financial intermediary’s website for more information.
July 1, 2022 | 43
JPMorgan New York Tax Free Bond Fund
| | |||
| |
Class A |
Class C |
Class I |
| Maximum Sales Charge (Load) Imposed on Purchases as % of the Offering Price |
|
|
|
| Maximum Deferred Sales Charge (Load) as % of Original Cost of the Shares |
1 |
|
|
1
| | |||
| |
Class A |
Class C |
Class I |
| Management Fees |
|
|
|
| Distribution (Rule 12b-1) Fees |
|
|
|
| Other Expenses |
|
|
|
| Service Fees |
|
|
|
| Remainder of Other Expenses |
|
|
|
| Total Annual Fund Operating Expenses |
|
|
|
| Fee Waivers and/or Expense Reimbursements1 |
- |
- |
- |
| Total Annual Fund Operating Expenses after Fee Waivers and/or Expense Reimburse- ments1 |
|
|
|
1
44 | J.P. Morgan Municipal Bond Funds
| | ||||
| |
1 Year |
3 Years |
5 Years |
10 Years |
| CLASS A SHARES ($) |
|
|
|
|
| CLASS C SHARES ($) |
|
|
|
|
| CLASS I SHARES ($) |
|
|
|
|
| | ||||
| |
1 Year |
3 Years |
5 Years |
10 Years |
| CLASS A SHARES ($) |
|
|
|
|
| CLASS C SHARES ($) |
|
|
|
|
| CLASS I SHARES ($) |
|
|
|
|
July 1, 2022 | 45
JPMorgan New York Tax Free Bond Fund (continued)
46 | J.P. Morgan Municipal Bond Funds
July 1, 2022 | 47
JPMorgan New York Tax Free Bond Fund (continued)
| |

| |
|
|
| |
|
|
| |
|
|
|
|
|
48 | J.P. Morgan Municipal Bond Funds
| | |||
| |
Past 1 Year |
Past 5 Years |
Past 10 Years |
| CLASS I SHARES |
|
|
|
| Return Before Taxes |
|
|
|
| Return After Taxes on Distributions |
|
|
|
| Return After Taxes on Distributions and Sale of Fund Shares |
|
|
|
| CLASS A SHARES |
|
|
|
| Return Before Taxes |
- |
|
|
| CLASS C SHARES |
|
|
|
| Return Before Taxes |
- |
|
|
| BLOOMBERG NEW YORK INTERMEDI- ATE (1-17 YEAR) MATURITIES INDEX (Reflects No Deduction for Fees, Expenses, or Taxes) |
|
|
|
Management
J.P. Morgan Investment Management Inc. (the adviser)
| Portfolio Manager |
Managed the Fund Since |
Primary Title with Investment Adviser |
| David Sivinski |
2005 |
Executive Director |
| Kevin M. Ellis |
2005 |
Managing Director |
Purchase and Sale of Fund Shares
Purchase minimums
| For Class A and Class C Shares | |
| To establish an account |
$1,000 |
| To add to an account |
$50 |
| For Class I Shares | |
| To establish an account |
$1,000,000 |
| To add to an account |
No minimum levels |
In general, you may purchase or redeem shares on any business day:
•
Through your Financial Intermediary
•
By writing to J.P. Morgan Funds Services, P.O. Box 219143, Kansas City, MO 64121-9143
•
After you open an account, by calling J.P. Morgan Funds Services at 1-800-480-4111
Tax Information
The Fund’s distributions of interest on municipal bonds generally are not subject to federal income tax; however the Fund may distribute taxable dividends, including distributions of short-term capital gains, and long-term capital gains. In addition, interest on certain bonds may be subject to the federal alternative minimum tax. To the extent that the Fund’s distributions are derived from interest on bonds that are not exempt from applicable state and local taxes, such distributions will be subject to such state and local taxes. When your investment is in an IRA, 401(k) plan or other tax-advantaged investment plan, you may be subject to federal income tax on ordinary income or capital gains upon withdrawal from the tax-advantaged investment plan.
Payments to Broker-Dealers and Other Financial Intermediaries
If you purchase shares of the Fund through a broker-dealer or other financial intermediary (such as a bank), the Fund and its related companies may pay the financial intermediary for the sale of Fund shares and related services. These payments may create a conflict of interest by influencing the broker-dealer or financial intermediary and your salesperson to recommend the Fund over another investment. Ask your salesperson or visit your financial intermediary’s website for more information.
July 1, 2022 | 49
More About the Funds
Additional Information About the Funds’ Investment Strategies
The Funds are managed by J.P. Morgan Investment Management Inc. (JPMIM). The principal types of securities and the main strategies that each Fund currently anticipates using are summarized in its Risk/Return Summary. Additional information about some of each Fund’s main investment strategies are included below. Except as otherwise indicated, the strategies described below are principal investment strategies of a Fund. Where applicable, the following also identifies other strategies that are not anticipated to be main strategies of a Fund but that may become more important to a Fund’s management in the future.
Each Fund may also use other non-principal strategies that are not described herein but which are described in the Statement of Additional Information. Each Fund may utilize these investments and strategies to a greater or lesser degree in the future.
The frequency with which each Fund buys and sells securities will vary from year to year, depending on market conditions.
Each of the Funds
Each Fund’s Board of Trustees may change any of the investment policies (including its investment objective), other than such policies that are designated as fundamental, without shareholder approval.
Credit Quality: Certain Funds may invest all, or are required to invest a certain percentage, of their investments in investment grade securities or the unrated equivalent. Each of the Funds may invest at least a portion of their investments in below investment grade securities, while the High Yield Municipal Fund may invest all of its assets in below investment grade securities. Below investment grade securities are also called “high yield bonds”, “junk bonds” and “non-investment grade bonds.” These securities generally are rated in the fifth or lower rating categories (for example, the equivalent of BB+ or lower). These securities generally offer a higher yield than investment grade securities, but involve a higher degree of risk.
A security’s quality is determined at the time of purchase and securities that are rated investment grade or the unrated equivalent may be downgraded or decline in credit quality such that subsequently they would be deemed to be below investment grade. The adviser will consider such an event in determining whether a Fund should continue to hold the security and is not required to sell a security in the event of a downgrade. The Funds use the methodology described below to determine the credit quality of their investments.
For each Fund, investment grade securities are securities that have been determined to be investment grade (for example, the equivalent of BBB- or higher) based on ratings by the following NRSROs - Moody’s Investors Service Inc. (Moody’s), Standard & Poor’s Corporation (S&P) or Fitch Ratings (Fitch) and the following methodology. If all three of these NRSROs rate the security, the middle rating is used to determine whether the security is investment grade. If only two of the three NRSROs rate the security, the lower rating is used to determine whether the security is investment grade. If only one of the three NRSROs rates a security, that rating will be used to determine if the security is investment grade. If none of these NRSROs rate a security, the adviser must determine that it is of comparable quality to an investment grade security or a non-investment grade security, respectively, in order for such security to be treated as an investment grade or a non-investment grade security, respectively.
| FUNDAMENTAL INVESTMENT OBJECTIVES |
| An investment objective is fundamental if it cannot be changed without the consent of a majority of the outstanding shares of the Fund. The investment objectives for the Short-Intermediate Municipal Bond Fund, Sustainable Municipal Income Fund and Tax Free Bond Fund are fundamental. The investment objectives for the remaining Funds are non-fundamental and can be changed without the consent of a majority of the outstanding shares of that Fund. |
SUSTAINABLE MUNICIPAL INCOME FUND, SHORT-INTERMEDIATE MUNICIPAL BOND FUND, ULTRA-SHORT MUNICIPAL FUND, INTERMEDIATE TAX FREE BOND FUND AND NEW YORK TAX FREE BOND FUND
Average Weighted Maturity. These Funds have average weighted maturity requirements. Average weighted maturity is the average of all the current maturities (that is, the term of the securities) of the individual bonds in a Fund calculated so as to count most heavily those securities with the highest dollar value. Average weighted maturity is important to investors as an indication of a Fund’s sensitivity to changes in interest rates. Usually, the longer the average weighted maturity, the more fluctuation in share price you can expect. The terms “Intermediate,” “Short-Intermediate” or “Ultra-Short” in a Fund’s name refer to the average maturity the Fund maintains. Mortgage-related securities are subject to prepayment of principal, which can shorten the average weighted maturity of the Fund’s portfolio. Therefore, in the case of a Fund holding mortgage-backed securities, asset-backed securities and similar types of securities, the average weighted maturity is equivalent to its weighted average life. Weighted average life is the average weighted maturity of the cash flows in the securities held by the Fund given certain prepayment assumptions.
50 | J.P. Morgan Municipal Bond Funds
SHORT-INTERMEDIATE MUNICIPAL BOND FUND AND TAX FREE BOND FUND
The Funds may invest up to 20% of their assets in cash and cash equivalents. See Temporary Defensive and Cash Positions.
HIGH YIELD MUNICIPAL FUND
All of the Fund’s assets may be invested in municipal bonds, the interest on which may be subject to the federal alternative minimum tax for both individuals and corporations. Shareholders who are subject to the federal alternative minimum tax may have all or a portion of their income from the Fund subject to federal income tax. In addition, corporate shareholders may be required to take the interest on municipal bonds into account in determining their alternative minimum taxable income. Any capital gain distributed by the Fund generally will be taxable.
The Fund may invest in inverse floaters. An inverse floater is a derivative instrument, typically created by a trust that divides a municipal security into two securities, a short-term tax-exempt floating rate security (sometimes referred to as a “tender option bond”) and a long-term tax-exempt floating rate security (referred to as a “residual certificate” or “inverse floater”) that pays interest at rates that move in the opposite direction of the yield on the short-term floating rate security. The purchaser of a “tender option bond” has the right to tender the security periodically for repayment of the principal value. As short-term interest rates rise, inverse floaters produce less current income (and, in extreme cases, may pay no income) and as short-term interest rates fall, inverse floaters produce more current income.
To facilitate the creation of inverse floaters, the Fund may purchase a fixed-rate municipal security and subsequently transfer it to a broker-dealer (the sponsor), which deposits the municipal security in a trust. The trust issues the residual certificates and short-term floating rate securities. The trust documents enable the Fund to withdraw the underlying bond to unwind or “collapse” the trust (upon tendering the residual certificate and paying the value of the short-term bonds and certain other costs). The Fund may also purchase inverse floaters created by municipal issuers directly or by other parties that have deposited municipal bonds into a sponsored trust.
Additional Investment Strategies
Each of the Funds
Each Fund has flexibility to invest in derivatives and may use such instruments to manage duration, sector and yield curve exposure, credit and spread volatility and to respond to volatile market conditions. Derivatives, which are instruments that have a value based on another instrument, exchange rate or index, may also be used as substitutes for securities in which each Fund can invest. Although the use of derivatives is not a main strategy of each Fund, each Fund may use futures contracts, options and swaps in connection with its principal strategies in order to hedge various investments, for risk management purposes and/or to increase the Fund’s income or gain to the Fund.
Each Fund may invest in shares of exchange-traded funds (ETFs), affiliated money market funds and other investment companies. ETFs, which are pooled investment vehicles whose ownership interests are purchased and sold on a securities exchange, may be passively or actively managed. Passively managed ETFs generally seek to track the performance of a particular market index, including broad-based market indexes, as well as indexes relating to particular sectors, markets, regions or industries. Actively managed ETFs do not seek to track the performance of a particular market index. Ordinarily, a Fund must limit its investments in a single non-affiliated ETF to 5% of its total assets and in all non-affiliated ETFs to 10% of its total assets. The Securities and Exchange Commission has issued exemptive orders to many ETFs that currently allow any fund investing in such ETFs to disregard these 5% and 10% limitations, subject to certain conditions. If a Fund invests in ETFs that have received such exemptive orders, it may invest any amount of its total assets in a single ETF or in multiple ETFs. ETFs that are not structured as investment companies as defined in the Investment Company Act of 1940 are not subject to these percentage limitations. The price movement of an index-based ETF may not track the underlying index and may result in a loss. In addition, ETFs may trade at a price above (premium) or below (discount) their net asset value, especially during periods of significant market volatility or stress, causing investors to pay or receive significantly more or less than the value of the ETF’s underlying portfolio when they purchase or sell their ETF shares, respectively.
Short-Intermediate Municipal Bond Fund
The adviser buys and sells securities and investments for the Fund based on its view of individual securities and market sectors. Taking a long-term approach, the adviser looks for individual fixed income investments that it believes will perform well over market cycles. The adviser is value oriented and makes decisions to purchase and sell individual securities and instruments after performing a risk/reward analysis that includes an evaluation of interest rate risk, credit risk, duration, liquidity and the complex legal and technical structure of the transaction. The adviser also integrates financially material environmental, social and governance (“ESG”) factors as part of the Fund’s investment process (“ESG Integration”). ESG Integration is the systematic inclusion of ESG issues in
July 1, 2022 | 51
More About the Funds (continued)
investment analysis and investment decisions. In applying ESG Integration in the evaluation of individual municipal issuers, the adviser seeks to assess the impact of environmental, social and governance factors on certain issuers in the universe in which the Fund may invest. The adviser’s assessment is based on an analysis of key opportunities and risks across sectors to identify financially material issues on the Fund’s investments in municipal issues and ascertain key issues that merit engagement with municipal issuers. These assessments may not be conclusive and securities that may be negatively impacted by such factors may be purchased and retained by the Fund while the Fund may divest or not invest in securities that may be positively impacted by such factors.
Tax Free Bond Fund
The adviser buys and sells securities and investments for the Fund based on its view of individual securities and market sectors. Taking a long-term approach, the adviser looks for individual fixed income investments that it believes will perform well over market cycles. The adviser is value oriented and makes decisions to purchase and sell individual securities and instruments after performing a risk/reward analysis that includes an evaluation of interest rate risk, credit risk, duration, liquidity and the complex legal and technical structure of the transaction. The adviser also integrates financially material environmental, social and governance (“ESG”) factors as part of the Fund’s investment process (“ESG Integration”). ESG Integration is the systematic inclusion of ESG issues in investment analysis and investment decisions. In applying ESG Integration in the evaluation of individual municipal issuers, the adviser seeks to assess the impact of environmental, social and governance factors on certain issuers in the universe in which the Fund may invest. The adviser’s assessment is based on an analysis of key opportunities and risks across sectors to identify financially material issues on the Fund’s investments in municipal issues and ascertain key issues that merit engagement with municipal issuers. These assessments may not be conclusive and securities that may be negatively impacted by such factors may be purchased and retained by the Fund while the Fund may divest or not invest in securities that may be positively impacted by such factors.
Ultra-Short Municipal Fund
The adviser buys and sells securities and investments for the Fund based on its view of individual securities and market sectors. The adviser looks for individual fixed income investments that it believes will perform well over market cycles. The adviser is value oriented and makes decisions to purchase and sell individual securities and instruments after performing a risk/reward analysis that includes an evaluation of interest rate risk, credit risk, duration, liquidity and the legal and technical structure of the transaction. The adviser also integrates financially material environmental, social and governance (“ESG”) factors as part of the Fund’s investment process (“ESG Integration”). ESG Integration is the systematic inclusion of ESG issues in investment analysis and investment decisions. In applying ESG Integration in the evaluation of individual municipal issuers, the adviser seeks to assess the impact of environmental, social and governance factors on certain issuers in the universe in which the Fund may invest. The adviser’s assessment is based on an analysis of key opportunities and risks across sectors to identify financially material issues on the Fund’s investments in municipal issues and ascertain key issues that merit engagement with municipal issuers. These assessments may not be conclusive and securities that may be negatively impacted by such factors may be purchased and retained by the Fund while the Fund may divest or not invest in securities that may be positively impacted by such factors.
California Tax Free Bond Fund
The adviser buys and sells securities and investments for the Fund based on its view of individual securities and market sectors. Taking a long-term approach, the adviser looks for individual fixed income investments that it believes will perform well over market cycles. The adviser is value oriented and makes decisions to purchase and sell individual securities and instruments after performing a risk/reward analysis that includes an evaluation of interest rate risk, credit risk, duration, liquidity and the complex legal and technical structure of the transaction. The adviser also integrates financially material environmental, social and governance (“ESG”) factors as part of the Fund’s investment process (“ESG Integration”). ESG Integration is the systematic inclusion of ESG issues in investment analysis and investment decisions. In applying ESG Integration in the evaluation of individual municipal issuers, the adviser seeks to assess the impact of environmental, social and governance factors on certain issuers in the universe in which the Fund may invest. The adviser’s assessment is based on an analysis of key opportunities and risks across sectors to identify financially material issues on the Fund’s investments in municipal issues and ascertain key issues that merit engagement with municipal issuers. These assessments may not be conclusive and securities that may be negatively impacted by such factors may be purchased and retained by the Fund while the Fund may divest or not invest in securities that may be positively impacted by such factors.
High Yield Municipal Fund
The adviser buys and sells securities and investments for the Fund based on its view of individual securities and market sectors. Taking a long-term approach, the adviser primarily looks for individual fixed income investments that it believes will perform well over market cycles. The adviser is value oriented and makes investment decisions after performing a risk/reward analysis that includes an evaluation of interest rate risk, credit risk, duration, liquidity, any security pledge, and a review of the security’s attributes, such as
52 | J.P. Morgan Municipal Bond Funds
the coupon, maturity, and any redemption and tender provisions. The adviser also factors in the overall investment strategy of the Fund, including its duration and its credit strategy, as well as the adviser’s interest rate outlook. The adviser also integrates financially material environmental, social and governance (“ESG”) factors as part of the Fund’s investment process (“ESG Integration”). ESG Integration is the systematic inclusion of ESG issues in investment analysis and investment decisions. In applying ESG Integration in the evaluation of individual municipal issuers, the adviser seeks to assess the impact of environmental, social and governance factors on certain issuers in the universe in which the Fund may invest. The adviser’s assessment is based on an analysis of key opportunities and risks across sectors to identify financially material issues on the Fund’s investments in municipal issues and ascertain key issues that merit engagement with municipal issuers. These assessments may not be conclusive and securities that may be negatively impacted by such factors may be purchased and retained by the Fund while the Fund may divest or not invest in securities that may be positively impacted by such factors.
The Fund may invest in loan assignments and participations (Loans). Loans will typically consist of senior secured floating rate loans, but may also include unsecured loans, second lien loans or more junior and bridge loans as well as commitments to purchase loans. Loans may be issued by obligors in the U.S. or in foreign or emerging markets. When the Fund acquires a loan assignment, the Fund typically will have a direct contractual relationship with the obligor; provided, however, the Fund may only be able to enforce its rights through an administrative agent. When the Fund acquires a loan participation, the Fund typically enters into a contractual relationship with the third party selling such participations, but not the borrower. As a result, the Fund assumes the credit risk of the seller of the loan participation and any other parties interpositioned between the Fund and the borrower. Under a loan participation, the Fund may have no direct rights to enforce the terms of the loan against the borrower. The Fund may not benefit directly from the collateral supporting the loan in which it has purchased the loan participations or assignments.
The Fund may invest in municipal mortgage-backed and asset-backed securities and municipal housing authority obligations. The Fund may also invest in bank obligations.
Intermediate Tax Free Bond Fund
The adviser buys and sells securities and investments for the Fund based on its view of individual securities and market sectors. Taking a long-term approach, the adviser looks for individual fixed income investments that it believes will perform well over market cycles. The adviser is value oriented and makes decisions to purchase and sell individual securities and instruments after performing a risk/reward analysis that includes an evaluation of interest rate risk, credit risk, duration, liquidity and the complex legal and technical structure of the transaction. The adviser also integrates financially material environmental, social and governance (“ESG”) factors as part of the Fund’s investment process (“ESG Integration”). ESG Integration is the systematic inclusion of ESG issues in investment analysis and investment decisions. In applying ESG Integration in the evaluation of individual municipal issuers, the adviser seeks to assess the impact of environmental, social and governance factors on certain issuers in the universe in which the Fund may invest. The adviser’s assessment is based on an analysis of key opportunities and risks across sectors to identify financially material issues on the Fund’s investments in municipal issues and ascertain key issues that merit engagement with municipal issuers. These assessments may not be conclusive and securities that may be negatively impacted by such factors may be purchased and retained by the Fund while the Fund may divest or not invest in securities that may be positively impacted by such factors.
New York Tax Free Bond Fund
The adviser buys and sells securities and investments for the Fund based on its view of individual securities and market sectors. Taking a long-term approach, the adviser looks for individual fixed income investments that it believes will perform well over market cycles. The adviser is value oriented and makes decisions to purchase and sell individual securities and instruments after performing a risk/reward analysis that includes an evaluation of interest rate risk, credit risk, duration, liquidity and the complex legal and technical structure of the transaction. The adviser also integrates financially material environmental, social and governance (“ESG”) factors as part of the Fund’s investment process (“ESG Integration”). ESG Integration is the systematic inclusion of ESG issues in investment analysis and investment decisions. In applying ESG Integration in the evaluation of individual municipal issuers, the adviser seeks to assess the impact of environmental, social and governance factors on certain issuers in the universe in which the Fund may invest. The adviser’s assessment is based on an analysis of key opportunities and risks across sectors to identify financially material issues on the Fund’s investments in municipal issues and ascertain key issues that merit engagement with municipal issuers. These assessments may not be conclusive and securities that may be negatively impacted by such factors may be purchased and retained by the Fund while the Fund may divest or not invest in securities that may be positively impacted by such factors.
Please note that the Funds also may use strategies that are not described in this section, but which are described in the “Investment Practices” section later in the prospectus and in the Statement of Additional Information.
July 1, 2022 | 53
More About the Funds (continued)
Investment Risks
There can be no assurance that the Funds will achieve their investment objectives.
The main risks associated with investing in each Fund are summarized in the “Risk/Return Summaries” at the front of this prospectus. In addition to each Fund’s main risks, each Fund may be subject to additional risks in connection with investments and strategies used by each Fund from time to time. The table below identifies main risks and some of the additional risks for each Fund.
An investment in a Fund or any other fund may not provide a complete investment program. The suitability of an investment in a Fund should be considered based on the investment objective, strategies and risks described in this prospectus, considered in light of all of the other investments in your portfolio, as well as your risk tolerance, financial goals and time horizons. You may want to consult with a financial advisor to determine if a Fund is suitable for you.
The Funds are subject to the main risks designated as such in the table below, any of which may adversely affect a Fund’s net asset value (NAV), performance and ability to meet its investment objective. Each Fund may also be subject to additional risks that are noted in the table below, as well as those that are not described herein but which are described in the Statement of Additional Information.
| |
Sustainable Municipal Income Fund |
Short-Intermediate Municipal Bond Fund |
Tax Free Bond Fund |
Ultra-Short Municipal Fund |
California Tax Free Bond Fund |
High Yield Municipal Fund |
Intermediate Tax Free Bond Fund |
New York Tax Free Bond Fund |
| Alternative Minimum Tax Risk |
• |
• |
• |
• |
• |
• |
• |
• |
| Auction Rate Securities Risk |
○ |
• |
○ |
• |
○ |
• |
○ |
○ |
| California Geographic Concentration Risk |
|
|
|
|
• |
|
|
|
| Credit Risk |
• |
• |
• |
• |
• |
• |
• |
• |
| Debt Securities and Other Callable Securities Risk |
• |
• |
• |
• |
• |
• |
• |
• |
| Derivatives Risk |
○ |
○ |
○ |
○ |
○ |
○ |
○ |
○ |
| Exchange-Traded Fund (ETF) and/or Other Investment Company Risk |
○ |
○ |
○ |
○ |
○ |
• |
○ |
○ |
| Floating and Variable Rate Securities Risk |
○ |
○ |
○ |
• |
○ |
• |
○ |
○ |
| General Market Risk |
• |
• |
• |
• |
• |
• |
• |
• |
| Government Securities Risk |
○ |
○ |
○ |
○ |
• |
• |
• |
• |
| High Yield Securities Risk |
• |
• |
• |
• |
• |
• |
• |
• |
| Industry and Sector Focus Risk |
• |
• |
• |
• |
• |
• |
• |
• |
| Interest Rate Risk |
• |
• |
• |
• |
• |
• |
• |
• |
| Inverse Floating Rate Instrument Risk |
○ |
○ |
○ |
○ |
○ |
• |
○ |
○ |
| Loan Risk |
|
|
|
|
|
○ |
|
|
| Mortgage-Related and Other Asset-Backed Securities Risk |
• |
• |
• |
• |
• |
○ |
• |
• |
| Municipal Housing Authority Obligations Risk |
• |
• |
○ |
• |
○ |
○ |
○ |
○ |
•
Main Risks
○
Additional Risks
54 | J.P. Morgan Municipal Bond Funds
| |
Sustainable Municipal Income Fund |
Short-Intermediate Municipal Bond Fund |
Tax Free Bond Fund |
Ultra-Short Municipal Fund |
California Tax Free Bond Fund |
High Yield Municipal Fund |
Intermediate Tax Free Bond Fund |
New York Tax Free Bond Fund |
| Municipal Obligations Risk |
• |
• |
• |
• |
• |
• |
• |
• |
| New York Geographic Concentration Risk |
|
|
|
|
|
|
|
• |
| Pay-In-Kind and Deferred Payment Securities Risk |
○ |
○ |
○ |
○ |
○ |
○ |
○ |
○ |
| Restricted Securities Risk |
• |
• |
○ |
• |
○ |
• |
○ |
○ |
| Social or Environmental Investing Risk |
• |
|
|
|
|
|
|
|
| Structured Product Risk |
○ |
○ |
○ |
• |
○ |
• |
○ |
○ |
| Taxability Risk |
• |
• |
• |
• |
• |
• |
• |
• |
| Risk Associated with the Fund Holding Cash, Money Market Instruments and Other Short-Term Investments |
|
• |
• |
|
|
|
|
|
| Transactions and Liquidity Risk |
• |
• |
• |
• |
• |
• |
• |
• |
| Ultra-Short Fund Risk |
|
|
|
• |
|
|
|
|
| Cyber Security Risk |
○ |
○ |
○ |
○ |
○ |
○ |
○ |
○ |
| Volcker Rule Risk |
○ |
○ |
○ |
○ |
○ |
○ |
○ |
○ |
| Zero-Coupon Bond Risk |
• |
• |
• |
• |
• |
• |
• |
• |
•
Main Risks
○
Additional Risks
Municipal Obligations Risk. The risk of a municipal obligation generally depends on the financial and credit status of the issuer. Changes in the financial health of a municipal issuer may make it difficult for the issuer to make interest and principal payments when due. A number of municipalities have had significant financial problems recently, and these and other municipalities could, potentially, continue to experience significant financial problems resulting from lower tax revenues and/or decreased aid from state and local governments in the event of an economic downturn. This could decrease the Funds’ income or hurt its ability to preserve capital and liquidity.
Under some circumstances, municipal obligations might not pay interest unless the state legislature or municipality authorizes money for that purpose. Some securities, including municipal lease obligations, carry additional risks. For example, they may be difficult to trade or interest payments may be tied only to a specific stream of revenue.
Municipal bonds may be more susceptible to downgrades or defaults during recessions or similar periods of economic stress. Factors contributing to the economic stress on municipalities may include lower property tax collections as a result of lower home values, lower sales tax revenue as a result of consumers cutting back spending and lower income tax revenue as a result of a higher unemployment rate. In addition, since some municipal obligations may be secured or guaranteed by banks and other institutions, the risk to a Fund could increase if the banking or financial sector suffers an economic downturn and/or if the credit ratings of the institutions issuing the guarantee are downgraded or at risk of being downgraded by a national rating organization. If such events were to occur, the value of the security could decrease or the value could be lost entirely, and it may be difficult or impossible for a Fund to sell the security at the time and the price that normally prevails in the market.
July 1, 2022 | 55
More About the Funds (continued)
In addition to being downgraded, an insolvent municipality may file for bankruptcy. For example, Chapter 9 of the Bankruptcy Code provides a financially distressed municipality protection from its creditors while it develops and negotiates a plan for reorganizing its debts. “Municipality” is defined broadly by the Bankruptcy Code as a “political subdivision or public agency or instrumentality of a state” and may include various issuers of securities in which a Fund invests. The reorganization of a municipality’s debts may include extending debt maturities, reducing the amount of principal or interest, refinancing the debt or taking other measures, which may significantly affect the rights of creditors and the value of the securities issued by the municipality and the value of a Fund’s investments. Interest on municipal obligations, while generally exempt from federal income tax, may not be exempt from federal alternative minimum tax.
General Market Risk. Economies and financial markets throughout the world are becoming increasingly interconnected, which increases the likelihood that events or conditions in one country or region will adversely impact markets or issuers in other countries or regions. Securities in the Fund’s portfolio may underperform in comparison to securities in general financial markets, a particular financial market or other asset classes due to a number of factors, including inflation (or expectations for inflation), deflation (or expectations for deflation), interest rates, global demand for particular products or resources, market instability, debt crises and downgrades, embargoes, tariffs, sanctions and other trade barriers, regulatory events, other governmental trade or market control programs and related geopolitical events. In addition, the value of the Fund’s investments may be negatively affected by the occurrence of global events such as war, terrorism, environmental disasters, natural disasters or events, country instability, and infectious disease epidemics or pandemics.
For example, the outbreak of COVID-19 has negatively affected economies, markets and individual companies throughout the world, including those in which the Fund invests. The effects of this pandemic to public health and business and market conditions, including, among other things, reduced consumer demand and economic output, supply chain disruptions and increased government spending, may continue to have a significant negative impact on the performance of the Fund’s investments, increase the Fund’s volatility, exacerbate pre-existing political, social and economic risks to the Fund, and negatively impact broad segments of businesses and populations. In addition, governments, their regulatory agencies, or self-regulatory organizations have taken or may take actions in response to the pandemic that affect the instruments in which the Fund invests, or the issuers of such instruments, in ways that could have a significant negative impact on the Fund’s investment performance. The duration and extent of COVID-19 and associated economic and market conditions and uncertainty over the long-term cannot be reasonably estimated at this time. The ultimate impact of COVID-19 and the extent to which the associated conditions impact a Fund will also depend on future developments, which are highly uncertain, difficult to accurately predict and subject to frequent changes.
Interest Rate Risk. The Fund invests in debt securities that change in value based on changes in interest rates. If rates increase, the value of these investments generally declines. On the other hand, if rates fall, the value of these investments generally increases. Your investment will decline in value if the value of these investments decreases. Securities with greater interest rate sensitivity and longer maturities generally are subject to greater fluctuations in value. Many factors can cause interest rates to rise. Some examples include central bank monetary policy, rising inflation rates and general economic conditions. The Fund may face a heightened level of interest rate risk due to certain changes or uncertainty in monetary policy.
Debt market conditions are highly unpredictable and some parts of the market are subject to dislocations. Beginning in March 2022, the Federal Reserve Board began increasing interest rates and has signaled the possibility of further increases. It is difficult to accurately predict the pace at which the Federal Reserve Board will increase interest rates any further, or the timing, frequency or magnitude of any such increases, and the evaluation of macro-economic and other conditions could cause a change in approach in the future. Any such changes could be sudden and could expose debt markets to significant volatility and reduced liquidity for Fund investments.
Credit Risk. There is a risk that issuers and/or a counterparty to a security, contract, repurchase agreement or other investment will not make payments when due or default completely on securities, repurchase agreements or other investments held by a Fund. The risk of defaults across issuers and/or counterparties increases in adverse market and economic conditions, including the conditions resulting from the COVID-19 pandemic. Such defaults could result in losses to the Fund. In addition, the credit quality of securities held by a Fund may be lowered if an issuer’s or a counterparty’s financial condition changes. Lower credit quality may lead to greater volatility in the price of a security and in shares of a Fund. Lower credit quality also may affect liquidity and make it difficult for a Fund to sell the security. Although U.S. government securities issued directly by the U.S. government are guaranteed by the U.S. Treasury, other U.S. government securities issued by an agency or instrumentality of the U.S. government may not be. No assurance can be given that the U.S. government would provide financial support to its agencies or instrumentalities if not required to do so by law. Prices of the Fund’s investments may be adversely affected if any of the issuers or counterparties it is invested in are subject to an actual or perceived deterioration in their credit quality. Credit spreads may increase, which may reduce the market values of the Fund’s securities. Credit spread risk is the risk that economic and market conditions or any actual or perceived credit deterioration may lead to an increase in the credit spreads (i.e., the difference in yield between two securities of similar maturity but different credit quality) and a decline in price of the issuer’s securities.
56 | J.P. Morgan Municipal Bond Funds
Floating and Variable Rate Securities Risk. Floating and variable rate securities provide for a periodic adjustment in the interest rate paid on the securities. The rate adjustment intervals may be regular and range from daily up to annually, or may be based on an event, such as a change in the prime rate. Floating and variable rate securities may be subject to greater liquidity risk than other debt securities, meaning that there may be limitations on a Fund’s ability to sell the securities at any given time. Such securities also may lose value.
Structured Product Risk. Structured products, such as tender option bonds, involve structural complexities and potential risks that may not be present where a municipal security is owned directly. These enhanced risks may include additional counter-party risk (the risk that the counterparty will not fulfill its contractual obligations) and call risk (the risk that the instruments will be called and the proceeds may need to be reinvested). Additionally, an active trading market for such instruments may not exist. To the extent that a structured product provides a put, the Fund may receive a lower interest rate in return for such feature and will be subject to the risk that the put provider will be unable to honor the put feature (purchase the security). Finally, short-term municipal or tax-exempt structured products may present tax issues not presented by investments in other short-term municipal or tax-exempt securities. These issues might be resolved in a manner adverse to the Fund.
Alternative Minimum Tax Risk. A Fund may invest all of its assets in municipal bonds, the interest on which may be subject to the federal alternative minimum tax. Shareholders who are subject to the federal alternative minimum tax may have all or a portion of their income from the Fund subject to federal income tax. In addition, corporate shareholders will, with limited exceptions, be required to take the interest on municipal bonds into account in determining their alternative minimum taxable income. Any capital gain distributed by a Fund may be taxable.
Restricted Securities Risk.Restricted securities are securities that cannot be offered for public resale unless registered under the applicable securities laws or that have a contractual restriction that prohibits or limits their resale. Restricted securities include private placement securities that have not been registered under the applicable securities laws, such as Rule 144A securities, and securities of U.S. and non-U.S. issuers that are issued pursuant to Regulation S. Private placements are generally subject to strict restrictions on resale. Restricted securities may not be listed on an exchange and may have no active trading market. Restricted securities may be illiquid. The Fund may be unable to sell a restricted security on short notice or may be able to sell them only at a price below current value. It may be more difficult to determine a market value for a restricted security. Also, the Fund may get only limited information about the issuer of a restricted security, so it may be less able to predict a loss. In addition, if Fund management receives material non-public information about the issuer, the Fund may as a result be unable to sell the securities. Certain restricted securities may involve a high degree of business and financial risk and may result in substantial losses.
Mortgage-Related and Other Asset-Backed Securities Risk. Mortgage-related and asset-backed securities, including certain municipal housing authority obligations, differ from conventional debt securities and are subject to certain additional risks because principal is paid back over the life of the security rather than at maturity. The value of these securities will be influenced by the factors affecting the housing market and the assets underlying such securities. As a result, during periods of declining asset values, difficult or frozen credit markets, significant changes in interest rates, or deteriorating economic conditions, mortgage-related and asset-backed securities may decline in value, face valuation difficulties, become more volatile and/or become illiquid. These securities are also subject to prepayment and call risk. Gains and losses associated with prepayments will increase/decrease the income available for distribution by the Fund and the Fund’s yield. In periods of declining interest rates, the Fund may be subject to contraction risk which is the risk that borrowers will increase the rate at which they prepay the maturity value of mortgages and other obligations. When mortgages and other obligations are prepaid and when securities are called, the Fund may have to reinvest in securities with a lower yield or fail to recover additional amounts (i.e., premiums) paid for securities with higher interest rates, resulting in an unexpected capital loss and/or a decrease in the amount of dividends and yield. In periods of either rising or declining interest rates, the Fund may be subject to extension risk which is the risk that the expected maturity of an obligation will lengthen in duration due to a decrease in prepayments. As a result, in certain interest rate environments, the Fund may exhibit additional volatility. The structure of some of these securities may be complex and there may be less available information than for other types of debt securities. Additionally, asset-backed, mortgage-related and mortgage-backed securities are subject to risks associated with their structure and the nature of the assets underlying the securities and the servicing of those assets. Certain asset-backed, mortgage-related and mortgage-backed securities may face valuation difficulties and may be less liquid than other types of asset-backed, mortgage-related and mortgage-backed securities, or debt securities.
The mortgage loans underlying privately issued mortgage-related securities may not be subject to the same underwriting requirements for the underlying mortgages that are applicable to those mortgage-related securities that have government or government-sponsored entity guarantees. As a result, the mortgage loans underlying privately issued mortgage-related securities may have less favorable collateral, credit risk or other underwriting characteristics than government or government-sponsored mortgage-related securities and have wider variances in a number of terms including interest rate, term, size, purpose and borrower characteristics. In addition, certain mortgage-related securities which may include loans that originally qualified under standards established by
July 1, 2022 | 57
More About the Funds (continued)
government-sponsored entities (for example, certain REMICs that include Fannie Mae mortgages) are not considered as government securities for purposes of a Fund’s investment strategies or policies. There is no government or government-sponsored guarantee for such privately issued investments.
A Fund may invest in collateralized mortgage obligations (CMOs). CMOs are debt obligations collateralized by mortgage loans or mortgage pass-through securities. CMOs are issued in multiple classes, and each class may have its own interest rate and/or final payment date. A class with an earlier final payment date may have certain preferences in receiving principal payments or earning interest. As a result, the value of some classes in which the Fund invests may be more volatile and may be subject to higher risk of non-payment.
The values of interest-only (IO) and principal-only (PO) mortgage-backed securities are more volatile than other types of mortgage-related securities. They are very sensitive not only to changes in interest rates, but also to the rate of prepayments. A rapid or unexpected increase in prepayments can significantly depress the price of interest-only securities, while a rapid or unexpected decrease could have the same effect on principal-only securities. In addition, because there may be a drop in trading volume, an inability to find a ready buyer, or the imposition of legal restrictions on the resale of securities, these instruments may be illiquid.
Zero-Coupon, Pay-In-Kind and Deferred Payment Securities Risk. The market value of a zero-coupon bond is generally more volatile than the market value of other fixed income securities with similar maturities that pay interest periodically. In addition, federal income tax law requires that the holder of a zero-coupon bond accrue a portion of the discount at which the bond was purchased as taxable income each year, even though the holder receives no interest payments on the bond during the year. The Fund must distribute substantially all of its net income (including non-cash income attributable to zero-coupon bonds) to its shareholders each year to maintain its status as a regulated investment company and to eliminate tax at the Fund level. Accordingly, such accrued discount must be taken into account in determining the amount of taxable distributions to shareholders. The Fund may consequently have to dispose of portfolio securities under disadvantageous circumstances to generate cash to satisfy such distribution requirements. These actions may reduce the assets to which the Fund’s expenses could otherwise be allocated and may reduce the Fund’s rate of return.
The market value of a zero-coupon, pay-in-kind or deferred payment security is generally more volatile than the market value of interest-paying securities, and is more likely to respond to a greater degree to changes in interest rates and credit quality than other fixed income securities with similar maturities that pay interest periodically. In addition, federal income tax law requires that the holder of a zero-coupon bond accrue a portion of the discount at which the bond was purchased as taxable income each year, even though the holder receives no interest payment on the bond during the year. Each Fund must distribute substantially all of its net income (including non-cash income attributable to zero-coupon bonds) to its shareholders each year to maintain its status as a regulated investment company and to eliminate tax at the Fund level. Accordingly, such accrued discount must be taken into account in determining the amount of taxable distributions to shareholders. A Fund may consequently have to dispose of portfolio securities under disadvantageous circumstances to generate cash to satisfy such distribution requirements. These actions may reduce the assets to which the Fund’s expenses could otherwise be allocated and may reduce the Fund’s rate of return.
In addition, (1) the higher yields and interest rates on certain pay-in-kind securities (PIK) reflect the payment deferral and increased credit risk associated with such instruments and such investments may represent a significantly higher credit risk than coupon loans; (2) PIK securities may have higher price volatility because their continuing accruals require continuing judgments about the collectability of the deferred payments and the value of any associated collateral; (3) PIK interest has the effect of generating investment income and (4) the deferral of PIK interest may also reduce the loan-to-value ratio at a compounding rate.
Risk Associated with the Fund Holding Cash, Money Market Instruments and Other Short-Term Investments. The Fund will, at times, hold assets in cash, money market instruments and other short-term investments, which may hurt the Fund’s performance. These positions may also subject the Fund to additional risks and costs.
Transactions and Liquidity Risk. A Fund could experience a loss when selling securities to meet redemption requests and its liquidity may be negatively impacted. The risk of loss increases if the redemption requests are large or frequent, occur in times of overall market turmoil or declining prices for the securities sold, or when the securities a Fund wishes to, or is required to, sell are illiquid. To the extent a large proportion of shares of a Fund are held by a small number of shareholders (or a single shareholder) including funds or accounts over which the adviser or its affiliates have investment discretion, the Fund is subject to the risk that these shareholders will purchase or redeem Fund shares in large amounts rapidly or unexpectedly, including as a result of an asset allocation decision made by the adviser or its affiliates. In addition to the other risks described in this section, these transactions could adversely affect the ability of the Fund to conduct its investment program. A Fund may be unable to sell illiquid securities at its desired time or price or the price at which the securities have been valued for purposes of the Fund’s net asset value. Illiquidity can be caused by a drop in overall market trading volume, an inability to find a ready buyer, or legal restrictions on the securities’ resale. Other market participants may be attempting to sell debt securities at the same time as a Fund, causing downward pricing pressure and contributing to illiquidity. The capacity for bond dealers to engage in trading or “make a market” in debt securities has not kept
58 | J.P. Morgan Municipal Bond Funds
pace with the growth of bond markets. Liquidity and valuation risk may be magnified in a rising interest rate environment, when credit quality is deteriorating or in other circumstances where investor redemptions from fixed income mutual funds may be higher than normal. Certain securities that were liquid when purchased may later become illiquid, particularly in times of overall economic distress. Similarly, large purchases of Fund shares may adversely affect the Fund’s performance to the extent that the Fund is delayed in investing new cash and is required to maintain a larger cash position than it ordinarily would. Large redemptions also could accelerate the realization of capital gains, increase a Fund’s transaction costs and impact a Fund’s performance.
Industry and Sector Focus Risk. At times the Fund may increase the relative emphasis of its investments in a particular industry or sector. The prices of securities of issuers in a particular industry or sector may be more susceptible to fluctuations due to changes in economic or business conditions, government regulations, availability of basic resources or supplies, or other events that affect that industry or sector more than securities of issuers in other industries and sectors. To the extent that the Fund increases the relative emphasis of its investments in a particular industry or sector, the value of a Fund’s shares may fluctuate in response to events affecting that industry or sector.
Debt Securities and Other Callable Securities Risk. As part of its main investment strategy, each Fund invests in debt securities. The issuers of these securities and other callable securities may be able to repay principal in advance, especially when interest rates fall. Changes in prepayment rates can affect the return on investment and yield of these securities. When debt obligations are prepaid and when securities are called, a Fund may have to reinvest in securities with a lower yield. A Fund also may fail to recover additional amounts (i.e., premiums) paid for securities with higher interest rates, resulting in an unexpected capital loss.
Inverse Floating Rate Instrument Risk. The market value of an inverse floater residual certificate can be more volatile than that of a conventional fixed-rate bond having similar credit quality, maturity and redemption provisions. Inverse floater residual certificates entail a degree of leverage because the trust issues short-term securities in a ratio to the residual certificates with the underlying long-term bond providing collateral for the obligation to pay the principal value of the short-term securities if and when they are tendered. If a Fund has created the inverse floater by depositing a long-term bond into a trust, it may be required to provide additional collateral for the short-term securities if the value of the underlying bond deposited in the trust fails.
An inverse floater that has a higher degree of leverage is typically more volatile with respect to its price and income than an inverse floater having a lower degree of leverage. Under inverse floater arrangements, if the remarketing agent that offers the short-term securities for sale is unable to sell them, or if the holders tender (or put) them for repayment of principal and the remarketing agent is unable to remarket them, the remarketing agent may cause the trust to be collapsed, and in the case of floaters created by the Fund, the Fund will then be required to repay the principal amount of the tendered securities. During times of market volatility, illiquidity or uncertainty, the Fund could be required to sell other portfolio holdings at a disadvantageous time to raise cash to meet that obligation.
Because of the accounting treatment for inverse floaters created by the Fund’s transfer of a municipal bond to a trust, the Fund’s financial statements will reflect these transactions as “secured borrowings,” which affects the Fund’s Statements of Assets and Liabilities and Operations, expense ratios and the Schedule of Investments will include the underlying municipal bond. The Fund’s annual fund operating expenses will include certain expenses and fees related to the Fund’s investments. Some of those expenses may be liabilities with respect to interest paid on short-term floating rate notes issued by the trusts whose inverse floater certificates are held by the Fund. Under accounting rules, the Fund will also recognize additional income in an amount that directly corresponds to these expenses and, as a result the Fund’s net asset values per share and total returns will not be affected by these additional expenses.
Taxability Risk. The Fund’s investments in municipal securities rely on the opinion of the issuer’s bond counsel that the interest paid on those securities will not be subject to federal income tax. Tax opinions are generally provided at the time the municipal security is initially issued. However, after the Fund buys a security, the Internal Revenue Service may determine that a bond issued as tax-exempt should in fact be taxable and the Fund’s dividends with respect to that bond might be subject to federal income tax.
Social or Environmental Investing Risk. The JPMorgan Sustainable Municipal Income Fund’s investment in securities whose use of proceeds, in the Adviser’s opinion, provide positive social or environmental benefits could cause it to perform differently compared to funds that do not have such a policy. Investing in securities whose use of proceeds, in the Adviser’s opinion, provide positive social or environmental benefits may result in the Fund forgoing opportunities to buy certain securities when it might otherwise be advantageous to do so, or selling securities when it might be otherwise disadvantageous for it to do so. In addition, there is a risk that the municipal bonds identified by the Adviser’s use of proceeds determination do not operate as expected when addressing positive social or environmental benefits. The Adviser’s assessment of the positive social or environmental impact of a municipal bond’s proceeds is made at the time of purchase and the actual use of proceeds by the issuer could vary over time, which could cause the Fund to be invested in bonds that do not comply with the Fund’s approach towards considering social or environmental characteristics. The factors that the Adviser considers in evaluating whether a security has positive social or environmental benefits may change over time. There are significant differences in interpretations of what it means to promote positive social or
July 1, 2022 | 59
More About the Funds (continued)
environmental benefits. While the Adviser believes its definitions are reasonable, the portfolio decisions it makes may differ with other’s views. In making investment decisions, the Adviser relies on information and third-party data that could be incomplete or erroneous, which could cause the Adviser to incorrectly assess a municipal bond’s positive social or environmental impact.
High Yield Securities Risk. The Fund invests in instruments including junk bonds, Loans and instruments of municipal issuers that are highly leveraged, less creditworthy or financially distressed. These investments are considered to be speculative and may be subject to greater risk of loss, greater sensitivity to economic changes, valuation difficulties and potential illiquidity. Such investments are subject to additional risks including subordination to other creditors, no collateral or limited rights in collateral, lack of a regular trading market, extended settlement periods, liquidity risks, prepayment risks, potentially less protections under the federal securities laws and lack of publicly available information. High yield securities and Loans that are deemed to be liquid at the time of purchase may become illiquid.
In recent years, there has been a broad trend of weaker or less restrictive covenant protections in the high yield market. Among other things, under such weaker or less restrictive covenants, borrowers might be able to exercise more flexibility with respect to certain activities than borrowers who are subject to stronger or more protective covenants. For example, borrowers might be able to incur more debt, including secured debt, return more capital to shareholders, remove or reduce assets that are designated as collateral securing high yield securities, increase the claims against assets that are permitted against collateral securing high yield securities or otherwise manage their business in ways that could impact creditors negatively. In addition, certain privately held borrowers might be permitted to file less frequent, less detailed or less timely financial reporting or other information, which could negatively impact the value of the high yield securities issued by such borrowers. Each of these factors might negatively impact the high yield instruments held by the Fund.
No active trading market may exist for some instruments and certain investments may be subject to restrictions on resale. In addition, the settlement period for Loans is uncertain as there is no standardized settlement schedule applicable to such investments. The inability to dispose of the Fund’s securities and other investments in a timely fashion could result in losses to the Fund. Because some instruments may have a more limited secondary market, liquidity risk is more pronounced for the Fund than for funds that invest primarily in other types of fixed income instruments or equity securities. When bonds and other instruments securities are prepaid, the Fund may have to reinvest in instruments with a lower yield or fail to recover additional amounts (i.e., premiums) paid for these instruments resulting in an unexpected capital loss and/or a decrease in the amount of dividends and yield.
Government Securities Risk. The Fund invests in securities issued or guaranteed by the U.S. government or its agencies and instrumentalities (such as securities issued by the Government National Mortgage Association (Ginnie Mae), the Federal National Mortgage Association (Fannie Mae) or the Federal Home Loan Mortgage Corporation (Freddie Mac)). U.S. government securities are subject to market risk, interest rate risk and credit risk. Securities, such as those issued or guaranteed by Ginnie Mae or the U.S. Treasury, that are backed by the full faith and credit of the United States are guaranteed only as to the timely payment of interest and principal when held to maturity and the market prices for such securities will fluctuate. Notwithstanding that these securities are backed by the full faith and credit of the United States, circumstances could arise that would prevent the payment of interest or principal. This would result in losses to the Fund. Securities issued or guaranteed by U.S. government related organizations, such as Fannie Mae and Freddie Mac, are not backed by the full faith and credit of the U.S. government and no assurance can be given that the U.S. government will provide financial support. Therefore, U.S. government related organizations may not have the funds to meet their payment obligations in the future. U.S. government securities include zero coupon securities, which tend to be subject to greater market risk than interest-paying securities of similar maturities.
California Geographic Concentration Risk. Because the JPMorgan California Tax Free Bond Fund primarily invests in issuers in the State of California, its political subdivisions, authorities and agencies, its performance will be affected by the fiscal and economic health of that state and its municipalities. Provisions of the California Constitution and state statutes that limit the taxing and spending authority of California’s governmental entities may impair the ability of California issuers to pay principal and/or interest on their obligations. While California’s economy is broad, it does have major concentrations in high technology, manufacturing, entertainment, agriculture, tourism, construction and services, and may be sensitive to economic problems affecting those industries.
Any deterioration of California’s fiscal situation could increase the risk of investing in California municipal securities, including the risk of potential issuer default, and could heighten the risk that the prices of California municipal securities, and the Fund’s net asset value and/or yield, will experience greater volatility. Furthermore, any such deterioration could result in a downgrade of the credit rating of an issuer of California municipal securities. Future downgrades could reduce the market value of the securities held by the Fund, which could adversely affect the Fund’s performance.
New York Geographic Concentration Risk. Because the JPMorgan New York Tax Free Bond Fund invests primarily in municipal obligations issued by the State of New York, New York City, their political subdivisions, authorities and agencies, its performance will be affected by the fiscal and economic health of that state, the city and their political subdivisions. Additionally, as the nation’s financial capital, New York’s and New York City’s economy is heavily dependent on the financial sector and may be sensitive to
60 | J.P. Morgan Municipal Bond Funds
economic problems affecting the sector. New York and New York City also face a particularly large degree of uncertainty from interest rate risk and equity market volatility. The New York and New York City economy tends to be more sensitive to monetary policy actions and to movements in the national and world economies than the economies of other states or cities.
Any deterioration of New York’s fiscal situation could increase the risk of investing in New York municipal securities, including the risk of potential issuer default, and could heighten the risk that the prices of New York municipal securities, and the Fund’s net asset value and/or yield, will experience greater volatility. Furthermore, any such deterioration could result in a downgrade of the credit rating of an issuer of New York municipal securities. Future downgrades could reduce the market value of the securities held by the Fund, which could adversely affect the Fund’s performance.
Derivatives Risk. A Fund may use derivatives in connection with its investment strategies. Derivatives may be riskier than other types of investments because they may be more sensitive to changes in economic or market conditions than other types of investments and could result in losses that significantly exceed a Fund’s original investment. Derivatives are subject to the risk that changes in the value of a derivative may not correlate perfectly with the underlying asset, rate or index. The use of derivatives may not be successful, resulting in losses to the Fund and the cost of such strategies may reduce a Fund’s returns. Certain derivatives also expose the Fund to counterparty risk (which is the risk that the derivative counterparty will not fulfill its contractual obligations), and to the credit risk of the derivative counterparty. In addition, a Fund may use derivatives for non-hedging purposes, which increases the Fund’s potential for loss. Certain derivatives are synthetic instruments that attempt to replicate the performance of certain reference assets. With regard to such derivatives, the Fund does not have a claim on the reference assets and is subject to enhanced counterparty risk.
Investing in derivatives will result in a form of leverage. Leverage involves special risks. A Fund may be more volatile than if the Fund had not been leveraged because the leverage tends to exaggerate any effect on the value of the Fund’s portfolio securities. Registered investment companies are limited in their ability to engage in derivative transactions and are required to identify and earmark assets to provide asset coverage for derivative transactions.
The possible lack of a liquid secondary market for derivatives and the resulting inability of a Fund to sell or otherwise close a derivatives position could expose the Fund to losses and could make derivatives more difficult for the Fund to value accurately.
A Fund’s transactions in futures contracts, swaps and other derivatives could also affect the amount, timing and character of distributions to shareholders which may result in the Fund realizing more short-term capital gain and ordinary income subject to tax at ordinary income tax rates than it would if it did not engage in such transactions, which may adversely impact the Fund’s after-tax return.
| WHAT IS A DERIVATIVE? |
| Derivatives are securities or contracts (for example, futures and options) that derive their value from the performance of underlying assets or securities. |
Exchange-Traded Fund (ETF) and/or Other Investment Company Risk. A Fund may invest in shares of other investment companies and ETFs. Shareholders bear both their proportionate share of a Fund’s expenses and similar expenses of the underlying investment company or ETF when the Fund invests in shares of another investment company or ETF. A Fund is subject to the risks associated with the ETF’s or investment company’s investments. ETFs and companies that invest in commodities or currencies are subject to the risks associated with direct investments in commodities or currencies. The price and movement of an ETF or closed-end fund designed to track an index may not track the index and may result in a loss. In addition, closed-end funds that trade on an exchange often trade at a price below their net asset value (also known as a discount). Certain ETFs or closed-end funds traded on exchanges may be thinly traded and experience large spreads between the “ask” price quoted by a seller and the “bid” price offered by a buyer.
Loan Risk. The Fund may invest in Loans including Loans that are rated below investment grade. Like other high yield, corporate debt instruments, such Loans are subject to an increased risk of default in the payment of principal and interest as well as the other risks described under “Interest Rate Risk,”“Credit Risk” and “High Yield Securities Risk.” Although certain Loans are secured by collateral, the Fund could experience delays or limitations in realizing on such collateral or have its interest subordinated to other indebtedness of the obligor. Loans are vulnerable to market sentiment such that economic conditions or other events may reduce the demand for Loans and cause their value to decline rapidly and unpredictably. Although the Fund limits its investments in illiquid securities to no more than 15% of the Fund’s net assets at the time of purchase, Loans that are deemed to be liquid at the time of purchase may become illiquid. In recent years, there has been a broad trend of weaker or less restrictive covenant protections in the Loan market. Among other things, under such weaker or less restrictive covenants, borrowers might be able to exercise more flexibility with respect to certain activities than borrowers who are subject to stronger or more protective covenants. For example, borrowers might be able to incur more debt, including secured debt, return more capital to shareholders, remove or reduce assets that are designated as collateral securing Loans, increase the claims against assets that are permitted against collateral securing Loans or
July 1, 2022 | 61
More About the Funds (continued)
otherwise manage their business in ways that could impact creditors negatively. In addition, certain privately held borrowers might be permitted to file less frequent, less detailed or less timely financial reporting or other information, which could negatively impact the value of the Loans issued by such borrowers. Each of these factors might negatively impact the Loans held by a Fund. No active trading market may exist for some of the Loans and certain Loans may be subject to restrictions on resale. The inability to dispose of Loans in a timely fashion could result in losses to the Fund. In addition, the settlement period for Loans is uncertain as there is no standardized schedule applicable to such investments. Certain Loans may take more than seven days to settle. Because some Loans that the Fund invests in may have a more limited secondary market, liquidity and valuation risk is more pronounced for the Fund than for funds that invest primarily in other types of fixed income instruments or equity securities. Typically, Loans are not registered securities and are not listed on any national securities exchange. Consequently, there may be less public information available about the Fund’s investments and the market for certain Loans may be subject to irregular trading activity, wide bid/ask spreads and extended trade settlement periods. As a result, the Fund may be more dependent upon the analytical ability of its adviser.
When a Fund acquires a loan participation, the Fund typically enters into a contractual relationship with the lender or third party selling such participations, but not the borrower. As a result, the Fund assumes the credit risk of the seller of the loan participation and any other parties interpositioned between the Fund and the borrower. The Fund may not benefit directly from the collateral supporting the loan in which it has purchased the loan participations or assignments.
Affiliates of the adviser may participate in the primary and secondary market for Loans. Because of limitations imposed by applicable law, the presence of the adviser’s affiliates in the Loan market may restrict the Fund’s ability to acquire some Loans, affect the timing of such acquisition or affect the price at which the Loan is acquired. Also, because the adviser may wish to invest in the publicly traded securities of an obligor, it may not have access to material non-public information regarding the obligor to which other investors have access.
Loans are subject to prepayment risks. Gains and losses associated with prepayments will increase or decrease the Fund’s yield and the income available for distribution by the Fund. When Loans are prepaid, the Fund may have to reinvest in securities with a lower yield or fail to recover additional amounts (i.e. premiums) paid for Loans, resulting in an unexpected capital loss and/or a decrease in the amount of dividends and yields.
Ultra-Short Fund Risk. The JPMorgan Ultra-Short Municipal Fund is not a money market fund. Therefore, the Fund does not attempt to maintain a stable net asset value and is not subject to the rules that govern the diversity, quality, maturity, liquidity and other features of securities that money market funds may purchase. Under normal conditions, the Fund’s investment may be more susceptible than a money market fund to interest rate risk, valuation risk, credit risk and other risks relevant to the Fund’s investments. Unlike certain money market funds, the Fund’s net asset value per share will fluctuate. Because the Fund is not a money market fund, it does not qualify for the special money market fund tax treatment or tax accounting methods under Treasury regulations.
Cyber Security Risk. As the use of technology has become more prevalent in the course of business, the Funds have become more susceptible to operational and financial risks associated with cyber security, including: theft, loss, misuse, improper release, corruption and destruction of, or unauthorized access to, confidential or highly restricted data relating to a Fund and its shareholders; and compromises or failures to systems, networks, devices and applications relating to the operations of a Fund and its service providers. Cyber security risks may result in financial losses to a Fund and its shareholders; the inability of a Fund to transact business with its shareholders; delays or mistakes in the calculation of a Fund’s NAV or other materials provided to shareholders; the inability to process transactions with shareholders or other parties; violations of privacy and other laws; regulatory fines, penalties and reputational damage; and compliance and remediation costs, legal fees and other expenses. A Fund’s service providers (including, but not limited to, the adviser, any sub-advisers, administrator, transfer agent, and custodian or their agents), financial intermediaries, companies in which a Fund invests and parties with which a Fund engages in portfolio or other transactions also may be adversely impacted by cyber security risks in their own businesses, which could result in losses to a Fund or its shareholders. While measures have been developed which are designed to reduce the risks associated with cyber security, there is no guarantee that those measures will be effective, particularly since the Funds do not directly control the cyber security defenses or plans of their service providers, financial intermediaries and companies in which they invest or with which they do business.
Volcker Rule Risk. Pursuant to section 619 of the Dodd-Frank Wall Street Reform and Consumer Protection Act and certain rules promulgated thereunder known as the Volcker Rule, if the adviser and/or its affiliates own 25% or more of the outstanding ownership interests of a Fund after the permitted seeding period from the implementation of a Fund’s investment strategy, a Fund could be subject to restrictions on trading that would adversely impact the Fund’s ability to execute its investment strategy. Generally, the permitted seeding period is three years from the implementation of a Fund’s investment strategy. As a result, the adviser and/or its affiliates may be required to reduce their ownership interests in a Fund at a time that is sooner than would otherwise be desirable, which may result in the Fund’s liquidation or, if the Fund is able to continue operating, may result in losses, increased transaction costs and adverse tax consequences as a result of the sale of portfolio securities.
62 | J.P. Morgan Municipal Bond Funds
Auction Rate Securities Risk. The auction rate municipal securities the Fund will purchase will typically have a long-term nominal maturity for which the interest rate is regularly reset through a “Dutch” auction. The interest rate set by the auction is the lowest interest rate that covers all securities offered for sale. While this process is designed to permit auction rate securities to be traded at par value, there is a risk that an auction will fail due to insufficient demand for the securities, which may adversely affect the liquidity and price of auction rate securities. Moreover, between auctions, there may be no secondary market for these securities, and sales conducted on a secondary market may not be on terms favorable to the seller. Thus, with respect to liquidity and price stability, auction rate securities may differ substantially from cash equivalents, notwithstanding the frequency of auctions and the credit quality of the security.
For more information about risks associated with the types of investments that a Fund purchases, please read the “Risk/Return Summary” at the front of this prospectus and “Investment Practices” section later in the prospectus, and the Statement of Additional Information.
Conflicts of Interest
An investment in a Fund is subject to a number of actual or potential conflicts of interest. For example, the Adviser and/or its affiliates provide a variety of different services to a Fund, for which the Fund compensates them. As a result, the Adviser and/or its affiliates have an incentive to enter into arrangements with a Fund, and face conflicts of interest when balancing that incentive against the best interests of a Fund. The Adviser and/or its affiliates also face conflicts of interest in their service as investment adviser to other clients, and, from time to time, make investment decisions that differ from and/or negatively impact those made by the Adviser on behalf of a Fund. In addition, affiliates of the Adviser provide a broad range of services and products to their clients and are major participants in the global currency, equity, commodity, fixed-income and other markets in which a Fund invests or will invest. In certain circumstances, by providing services and products to their clients, these affiliates’ activities will disadvantage or restrict the Funds and/or benefit these affiliates. The Adviser may also acquire material non-public information which would negatively affect the Adviser’s ability to transact in securities for a Fund. JPMorgan and the Funds have adopted policies and procedures reasonably designed to appropriately prevent, limit or mitigate conflicts of interest. In addition, many of the activities that create these conflicts of interest are limited and/or prohibited by law, unless an exception is available. For more information about conflicts of interest, see the Potential Conflicts of Interest section in the Statement of Additional Information.
Temporary Defensive and Cash Positions
For liquidity and to respond to unusual market conditions, the Funds may invest all or most of their total assets in cash and cash equivalents for temporary defensive purposes. In addition, certain Funds may invest in cash and cash equivalents as a principal investment strategy. These investments may result in a lower yield than lower-quality or longer-term investments.
| WHAT IS A CASH EQUIVALENT? |
| Cash equivalents are highly liquid, high-quality instruments with maturities of three months or less on the date they are purchased. They include securities issued by the U.S. government, its agencies and instrumentalities, repurchase agreements, certificates of deposit, bankers’ acceptances, commercial paper, money market mutual funds and bank deposit accounts. |
While the Funds are engaged in a temporary defensive position, they may not meet their investment objectives. These investments may also be inconsistent with a Fund’s main investment strategies. Therefore, the Funds will pursue a temporary defensive position only when market conditions warrant.
Additional Fee Waiver and/or Expense Reimbursement
Service providers to the Funds may, from time to time, voluntarily waive all or a portion of any fees to which they are entitled and/or reimburse certain expenses as they may determine from time to time. The Funds’ service providers may discontinue or modify these voluntary actions at any time without notice. Performance for the Funds will reflect the voluntary waiver of fees and/or the reimbursement of expenses, if any. Without these voluntary waivers and/or expense reimbursements, performance would have been less favorable.
July 1, 2022 | 63
The Funds' Management and Administration
The following Funds are series of JPMorgan Trust I (JPMT I), a Delaware statutory trust:
California Tax Free Bond Fund
High Yield Municipal Fund
Intermediate Tax Free Bond Fund
New York Tax Free Bond Fund
High Yield Municipal Fund
Intermediate Tax Free Bond Fund
New York Tax Free Bond Fund
The following Funds are series of JPMorgan Trust II (JPMT II), a Delaware statutory trust:
Sustainable Municipal Income Fund
Short-Intermediate Municipal Bond Fund
Tax Free Bond Fund
Short-Intermediate Municipal Bond Fund
Tax Free Bond Fund
The following Fund is a series of JPMorgan Trust IV (JPMT IV), a Delaware statutory trust:
Ultra-Short Municipal Fund
Each Trust is governed by the Board of Trustees, which is responsible for overseeing all business activities of the Funds.
Each of the Funds operates in a multiple class structure. A multiple class fund is an open-end investment company that issues two or more classes of shares representing interests in the same investment portfolio.
Each class in a multiple class fund can set its own transaction minimums and may vary with respect to expenses for distribution, administration and shareholder services. This means that one class could offer access to a Fund on different terms than another class. Certain classes may be more appropriate for a particular investor.
Each Fund may issue other classes of shares that have different expense levels and performance and different requirements for who may invest. Call 1-800-480-4111 to obtain more information concerning all of the Funds’ other share classes. A Financial Intermediary who receives compensation for selling Fund shares may receive a different amount of compensation for sales of different classes of shares.
The Funds' Investment Adviser
J.P. Morgan Investment Management Inc. (JPMIM) is the investment adviser to the Funds and makes the day-to-day investment decisions for the Funds. In rendering investment advisory services to certain Funds, JPMIM uses the portfolio management, research and other resources of a foreign (non-U.S.) affiliate of JPMIM and may provide services to a Fund through a “participating affiliate” arrangement, as that term is used in relief granted by the staff of the SEC. Under this relief, U.S. registered investment advisers are allowed to use portfolio management or research resources of advisory affiliates subject to the regulatory supervision of the registered investment adviser. JPMIM is located at 383 Madison Avenue, New York, NY 10179.
JPMIM is a wholly-owned subsidiary of JPMorgan Asset Management Holdings Inc., which is a wholly-owned subsidiary of JPMorgan Chase & Co. (JPMorgan Chase), a bank holding company.
During the most recent fiscal year ended 2/28/22, JPMIM was paid management fees (net of waivers), as shown below, as a percentage of average daily net assets:
| California Tax Free Bond Fund |
0.28% |
| High Yield Municipal Fund |
0.31 |
| Intermediate Tax Free Bond Fund |
0.24 |
| New York Tax Free Bond Fund |
0.28 |
| Short-Intermediate Municipal Bond Fund |
0.15 |
| Sustainable Municipal Income Fund |
0.23 |
| Tax Free Bond Fund |
0.28 |
| Ultra-Short Municipal Fund |
0.00 |
A discussion of the basis the Board of Trustees of the Trusts used in reapproving the investment advisory agreement for the Funds is available in the semi-annual reports for the most recent fiscal period ended August 31.
64 | J.P. Morgan Municipal Bond Funds
The Portfolio Managers
The lead portfolio managers who are primarily responsible for the day-to-day management of the Funds are listed below. As part of that responsibility, the portfolio managers establish and monitor the overall duration, yield curve, and sector allocation strategies for the Funds. The portfolio managers are assisted by multiple sector and research teams who help formulate duration and allocation recommendations and support the strategies of the Funds within the parameters established by the portfolio managers.
JPMorgan Sustainable Municipal Income Fund. Kevin M. Ellis, CFA charterholder and Managing Director and Wayne Godlin, Managing Director, are the co-lead portfolio managers responsible for the day-to-day management of the JPMorgan Sustainable Municipal Income Fund. An employee of JPMIM and/or its affiliates since May 2003 and portfolio manager of the Fund since 2020, Mr. Ellis is a portfolio manager in the U.S. Fixed Income Group and is responsible for managing separate accounts in the Municipal Bond Group. An employee since 2018 and portfolio manager of the Fund since 2020, Mr. Godlin is a senior portfolio manager for the Municipal and Tax Aware Strategies team focusing on high yield municipal bonds. Mr. Godlin has over thirty years of municipal bond market experience in both credit analysis and portfolio management, with a focus on analyzing and managing high yield municipal bond portfolios. Previously, Mr. Godlin was a Consultant, evaluating client municipal bond portfolios, at Herbert J. Sims & Co. from 2017 to 2018 and a senior portfolio manager and a member of the Investment Policy Committee at AllianceBernstein Asset Management from 2009 to 2016. David Sivinski, CFA charterholder and Executive Director, has also participated in the management of the JPMorgan Sustainable Municipal Income Fund since March 2006. In addition to his role as portfolio manager, Mr. Sivinski coordinates municipal management for a number of high net worth clients that focus principally on single state municipal bonds.
JPMorgan Short-Intermediate Municipal Bond Fund. James Ahn has been the lead portfolio manager responsible for the day-to-day management of the JPMorgan Short-Intermediate Municipal Bond Fund since June 2006. Mr. Ahn, Managing Director, is a portfolio manager in the U.S. Fixed Income Group. An employee of JPMIM and/or its affiliates since 1996 and a member of the portfolio management team since February 1999, Mr. Ahn is responsible for strategy formulation and trading short-term tax-aware fixed income strategies for U.S. institutional clients and the Private Bank. Kevin M. Ellis has also participated in the management of the JPMorgan Short-Intermediate Municipal Bond Fund since June 2006. Mr. Ellis, CFA charterholder and Managing Director, is a portfolio manager in the U.S. Fixed Income Group. An employee of JPMIM and/or its affiliates since May 2003, he is responsible for managing separate accounts in the Municipal Bond Group. Previously, Mr. Ellis worked at Alliance Capital/Sanford Bernstein from 1995 through 2003 as a municipal bond trader.
JPMorgan Tax Free Bond Fund. Richard Taormina, Managing Director, has been the lead portfolio manager responsible for the day-to-day management of the JPMorgan Tax Free Bond Fund since February 2005. Mr. Taormina is a portfolio manager in the Global Fixed Income, Currency & Commodities (GFICC) group. An employee since 1997, Mr. Taormina is responsible for managing municipal and tax-aware mutual funds, high net worth and institutional fixed income accounts, and quantitative analysis. Michelle Hallam has participated in the management of the JPMorgan Tax Free Bond Fund since 2014. Mrs. Hallam, CFA charterholder and Executive Director, is a portfolio manager in the Municipal Group within the GFICC group. An employee of JPMIM since 1999, Mrs. Hallam is responsible for portfolios under the Low Tax Rate Strategy. She began her career at JPMIM in July 1999 as an analyst in the Internal Consulting Services program where she worked on projects in Investment Management and Financial Risk Management.
JPMorgan Ultra-Short Municipal Fund. Richard Taormina, Managing Director, and James Ahn, Managing Director, are the lead portfolio managers responsible for the day-to-day management of the JPMorgan Ultra-Short Municipal Fund. Mr. Taormina has been an employee of JPMIM 1997. Mr. Taormina is responsible for managing municipal mutual funds, institutional fixed income accounts and quantitative analysis. Mr. Ahn is a portfolio manager in the U.S. Fixed Income Group. An employee of JPMIM and/or its affiliates since 1996, Mr. Ahn is responsible for strategy formulation and trading short-term tax-aware fixed income strategies for U.S. institutional clients and the Private Bank.
JPMorgan California Tax Free Bond Fund and JPMorgan New York Tax Free Bond Fund. David Sivinski, CFA charterholder and Executive Director, has been the lead portfolio manager responsible for the day-to-day management of the JPMorgan California Tax Free Bond Fund and the JPMorgan New York Tax Free Bond Fund since April 2005 and March 2005, respectively. In addition to his role as portfolio manager, Mr. Sivinski coordinates municipal management for a number of high net worth clients that focus principally on single state municipal bonds. Michelle G. Hallam has also participated in the management of the JPMorgan California Tax Free Bond Fund since June 2004. Biographical information on Mrs. Hallam is described under the JPMorgan Tax Free Bond Fund. Kevin M. Ellis has also participated in the management of the JPMorgan New York Tax Free Bond Fund since May 2005. Biographical information on Mr. Ellis is described under the JPMorgan Short-Intermediate Municipal Bond Fund.
JPMorgan Intermediate Tax Free Bond Fund. Richard Taormina has been the lead portfolio manager responsible for the day-to-day management of the JPMorgan Intermediate Tax Free Bond Fund since February 2006. Biographical information on Mr. Taormina is described under the JPMorgan Tax Free Bond Fund. David Sivinski has also participated in the management of the JPMorgan Intermediate Tax Free Bond Fund since June 2005. In addition to his role as portfolio manager, Mr. Sivinski coordinates municipal
July 1, 2022 | 65
The Funds' Management and Administration (continued)
management for a number of high net worth clients that focus principally on single state municipal bonds. Kevin M. Ellis has also participated in the management of the JPMorgan Intermediate Tax Free Bond Fund since 2014. Biographical information on Mr. Ellis is described under the JPMorgan Short-Intermediate Municipal Bond Fund.
JPMorgan High Yield Municipal Fund. An employee since 2018, Wayne Godlin, Managing Director, is a senior portfolio manager for the Municipal and Tax Aware Strategies team focusing on high yield municipal bonds and is the lead portfolio manager responsible for the day-to-day management of the Fund’s investments. Mr. Godlin has over thirty years of municipal bond market experience in both credit analysis and portfolio management, with a focus on analyzing and managing high yield municipal bond portfolios. Previously, Mr. Godlin was a Consultant, evaluating client municipal bond portfolios, at Herbert J. Sims & Co. from 2017 to 2018 and a senior portfolio manager and a member of the Investment Policy Committee at AllianceBernstein Asset Management from 2009 to 2016. Richard Taormina, Managing Director, is a portfolio manager in the Municipal and Tax Aware Fixed Income Group and is responsible for overseeing the Fund’s investments in taxable and tax-exempt securities. An employee since 1997, Mr. Taormina is responsible for managing municipal mutual funds, institutional fixed income accounts, and quantitative analysis. Mr. Ellis, CFA charterholder and Managing Director, is a portfolio manager in the U.S. Fixed Income Group. An employee of JPMIM and/or its affiliates since May 2003, he is responsible for managing separate accounts in the Municipal Bond Group.
The Statement of Additional Information provides additional information about the portfolio managers’ compensation, other accounts managed by the portfolio managers and the portfolio managers’ ownership of securities in the Funds.
The Funds' Administrator
JPMIM (the Administrator) provides administration services and oversees each Fund's other service providers. The Administrator receives the following annual fee from each Fund for administration services: 0.075% of the first $10 billion of average daily net assets for the Fund, plus 0.050% of average daily net assets of the Fund between $10 billion and $20 billion, plus 0.025% of average daily net assets of the Fund between $20 billion and $25 billion, plus 0.010% of the average daily net assets of the Fund over $25 billion.
The Funds' Shareholder Servicing Agent
The Trusts, on behalf of the Funds, have entered into shareholder servicing agreements with JPMorgan Distribution Services, Inc. (JPMDS) under which JPMDS has agreed to provide certain support services to the Funds’ shareholders. For performing these services, JPMDS, as shareholder servicing agent, receives an annual fee of up to 0.25% of the average daily net assets of the Class A, Class C and Class I Shares of each Fund. JPMDS may enter into service agreements with Financial Intermediaries under which it will pay all or a portion of the annual fee to such Financial Intermediaries for performing shareholder and administrative services.
The Funds' Distributor
JPMDS (the Distributor) is the distributor for the Funds. The Distributor is an affiliate of JPMIM.
Additional Compensation to Financial Intermediaries
JPMIM, JPMDS and, from time to time, other affiliates of JPMorgan Chase may also, at their own expense and out of their own legitimate profits, provide additional cash payments to Financial Intermediaries whose customers invest in shares of the J.P. Morgan Funds. For this purpose, Financial Intermediaries include financial advisors, investment advisers, brokers, financial planners, banks, insurance companies, retirement or 401(k) plan administrators and others, including various affiliates of JPMorgan Chase, that have entered into agreements with JPMDS. These additional cash payments are payments over and above any sales charges (including Rule 12b-1 fees), service fees (including sub-transfer agency and networking fees) that are paid to such Financial Intermediaries, as described elsewhere in this prospectus. These additional cash payments are generally made to Financial Intermediaries that provide shareholder, sub-transfer agency or administrative services or marketing support. Marketing support may include access to sales meetings, sales representatives and Financial Intermediary management representatives, inclusion of the J.P. Morgan Funds on a sales list, including a preferred or select sales list, or other sales programs and/or for training and educating a Financial Intermediary’s employees. These additional cash payments also may be made as an expense reimbursement in cases where the Financial Intermediary provides shareholder services to J.P. Morgan Fund shareholders. JPMIM and JPMDS may also pay cash compensation in the form of finders’ fees that vary depending on the J.P. Morgan Fund and the dollar amount of shares sold. Such additional compensation may provide such Financial Intermediaries with an incentive to favor sales of shares of the J.P. Morgan Funds over other investment options they make available to their customers. See the Statement of Additional Information for more information.
66 | J.P. Morgan Municipal Bond Funds
Investing with J.P. Morgan Funds
Choosing A Share Class
Each share class represents an investment in the same portfolio of securities, but each has different availability and eligibility criteria, sales charges, expenses, dividends and distributions. These arrangements allow you to choose the available class that best meets your needs. You should read this section carefully to determine which share class is best for you. Factors you should consider in choosing a share class include:
•
The amount you plan to invest;
•
The length of time you expect to hold your investment;
•
The total costs associated with your investment, including any sales charges that you pay when you buy or sell your Fund shares and expenses that are paid out of Fund assets over time;
•
Whether you qualify for any reduction or waiver of sales charges;
•
Whether you plan to take any distributions in the near future;
•
The availability of the share class;
•
The services that will be available to you;
•
The amount of compensation that your Financial Intermediary will receive; and
•
The advantages and disadvantages of each share class.
Please read this prospectus carefully, and then select the Fund and share class most appropriate for you and decide how much you want to invest. Each Fund may offer other classes of shares not included in this prospectus that have different expense levels, performance and eligibility requirements from the share classes offered in this prospectus. Call 1-800-480-4111 to obtain more information concerning these or other share classes. A Financial Intermediary may receive different compensation based on the share class sold.
Additional Information that Applies to All Accounts: If your identity or the identity of any other person(s) authorized to act on your behalf cannot be verified, or if potentially criminal activity is identified, the J.P. Morgan Funds and the Distributor reserve the right to reject opening an account for you, close your account, or take such other action they deem reasonable or required by law.
Shares of the Funds have not been registered for sale outside of the United States. This prospectus is not intended for distribution to prospective investors outside of the United States. The Funds generally do not market or sell shares to investors domiciled outside of the United States, even, with regard to individuals, if they are citizens or lawful permanent residents of the United States.
July 1, 2022 | 67
Investing with J.P. Morgan Funds (continued)
| |
Class A |
Class C |
Class I |
| Eligibility1,2 |
May be purchased by the general public |
May be purchased by the general public3 |
May be purchased by: •Institutional Investors who meet the minimum investment requirements; •Individuals purchasing directly from the Fund through JPMorgan Distribution Services, Inc. (the “Distributor”) and meeting the investment minimum requirements; •Financial Intermediaries or any other organization, including affiliates of JPMorgan Chase & Co. (JPMorgan Chase), authorized to act in a fiduciary, advisory or custodial capacity for its clients or customers; •Brokerage program of a Financial Intermediary that has entered into a written agreement with the Distributor to offer such shares (“Eligible Brokerage Program”); and •Employees of JPMorgan Chase and its affiliates and officers or trustees of the JPMorgan Funds.4 |
| Minimum Investment1,5,6 |
$1,000 for each Fund or $50, if establishing a monthly $50 Systematic Investment Plan7 |
$1,000 for each Fund or $50, if establishing a monthly $50 Systematic Investment Plan7 |
$1,000,000 – An investor can combine purchases of Class I Shares of other J.P. Morgan Funds in order to meet the minimum. $1,000 for each Fund or $50, if establishing a monthly $50 Systematic Investment Plan for investments through an Eligible Brokerage Program. $1,000 for each Fund or $50 if establishing a monthly $50 Systematic Investment Plan7for investments by employees of JPMorgan Chase and its affiliates and officers or trustees of the J.P. Morgan Funds.4 |
68 | J.P. Morgan Municipal Bond Funds
| |
Class A |
Class C |
Class I |
| Minimum Subsequent Investments1 |
$508 |
$508 |
No minimum except $50 for investments by employees of JPMorgan Chase and its affiliates and officers or trustees of the J.P. Morgan Funds and investments through an Eligible Brokerage Program. |
| Systematic Investment Plan |
Yes |
Yes |
No except for investments by employees of JPMorgan Chase and its affiliates and officers or trustees of the J.P. Morgan Funds and investments through an Eligible Brokerage Program. |
| Systematic Redemption Plan |
Yes |
Yes |
No except for investments by employees of JPMorgan Chase and its affiliates and officers or trustees of the JPMorgan Funds. |
| Front-End Sales Charge (refer to Sales Charges and Financial Intermediary Compensation Section for more details) |
Up to 2.25% reduced or waived for large purchases and certain investors, eliminated for purchases of $250,000 or more for Short-Intermediate Municipal Bond Fund and all purchases of the Ultra-Short Municipal Fund. Up to 3.75% reduced or waived for large purchases and certain investors, eliminated for purchases of $250,000 or more for Funds (other than Short- Intermediate Municipal Bond Fund and Ultra-Short Municipal Fund) |
None |
None |
| Contingent Deferred Sales Charge (CDSC) (refer to Sales Charges and Financial Intermediary Compensation Section for more details) |
None for purchases of Ultra- Short Municipal Fund. On purchases of $250,000 or more of Short-Intermediate Municipal Bond Fund. •0.75% on redemptions made within 18 months after purchase. On purchases of $250,000 or more for Funds (other than Ultra-Short Municipal Fund or Short-Intermediate Municipal Bond Fund) •0.75% on redemptions made within 18 months after purchase. Waived under certain circumstances. |
•1.00% on redemptions made within 12 months after purchase. Waived under certain circumstances. |
None |
| Distribution (12b-1) Fee |
0.25% of the average daily net assets. |
0.75% of the average daily net assets. |
None |
July 1, 2022 | 69
Investing with J.P. Morgan Funds (continued)
| |
Class A |
Class C |
Class I |
| Service Fee |
0.25% of the average daily net assets. |
0.25% of the average daily net assets. |
0.25% of the average daily net assets. |
| Redemption Fee |
None |
None |
None |
| Conversion Feature9 |
None |
Class C Shares will be converted to Class A Shares in the following instances: •If an investor is eligible to purchase Class A Shares, then their Class C Share positions will convert to Class A Shares after 8 years, calculated from the first day of the month of purchase and processed on the tenth business day of the anniversary month. •If Class C Shares held in an account with a third party broker of record are transferred to an account with the Distributor, those Class C Shares will be converted to Class A Shares on the tenth business day of the month following the transfer. |
None |
| Advantages |
If you are eligible to have the sales charge reduced or eliminated or you have a long- term investment horizon, these shares have lower distribution fees over a longer term investment horizon than Class C Shares. |
No front-end sales charge is assessed so you own more shares initially. These shares may make sense for investors who have a shorter investment horizon relative to Class A Shares. |
No front-end sales charge or CDSC is assessed so you own more shares initially. In addition, Class I Shares have lower fees than Class A and Class C Shares. |
| Disadvantages |
A front-end sales charge is generally assessed, diminishing the number of shares owned. If you are eligible to have the sales charge reduced or eliminated, you may be subject to a CDSC. Class A Shares may not make sense for investors who have a shorter investment horizon relative to Class C Shares. |
Shares are subject to CDSC and have higher ongoing distribution fees. This means that over the long term Class C Shares accrue higher fees than Class A Shares. |
Limited availability and higher minimum initial investment than Class A and Class C Shares. |
1
Financial Intermediaries or other organizations making the Funds available to their clients or customers may impose minimums which may be different from the requirements for investors purchasing directly from the Funds.
2
Certain Retirement Plans may purchase Shares. For more information, see “ELIGIBLE RETIREMENT PLANS” below.
3
Investors who hold shares in accounts where the Distributor is broker of record are no longer eligible to purchase Class C Shares. In addition, shareholders are ineligible to hold Class C Shares if they are eligible for conversion to Class A Shares.
4
Must be purchased directly from the Funds or on an approved JPMorgan Chase & Co. affiliated platforms. Employees for this purpose include officers, directors, trustees, retirees and employees and their immediate family members (i.e., spouses, domestic partners, children, grandchildren, parents, grandparents and any dependent of the person, as defined in section 152 of the Internal Revenue Code) of J.P. Morgan Funds or JPMorgan Chase and its subsidiaries and affiliates. Approved affiliated platforms may impose minimums which may be different from the requirements for investors purchasing directly from the Funds.
5
Investment minimums may be waived for certain types of Group Retirement Plans, as well as for certain fee-based programs. The JPMorgan Funds and/or the
70 | J.P. Morgan Municipal Bond Funds
Distributor reserve the right to waive any initial or subsequent investment minimum.
6
Please see “MINIMUM ACCOUNT BALANCE” for more information about minimum balance requirements.
7
You are eligible for the lower $50 initial investment amount as long as you agree to make regular monthly investments of at least $50 until you reach the required $1,000 investment amount per fund. Once the required amount is reached, you must maintain the minimum $1,000 investment in the Fund.
8
Minimum subsequent investment amount for Systematic Investment Plans established before 3/1/15 is $25.
9
Please see “Class C Shares Conversion Feature” for more information about the conversion feature.
ELIGIBLE RETIREMENT PLANS
The only retirement plans that are eligible to purchase Class Class A, Class C and Class I Shares are the following:
•
Employer sponsored retirement, deferred compensation, employee benefit plans (including health savings accounts) and trusts used to fund those plans held directly at a broker dealer or financial intermediary (that is outside of retirement plan record keeping or third party administrator platform). Employer sponsored plans include 401(k) plans, 457 plans, 403(b) plans, profit-sharing and money purchase pension plans, defined benefit plans, retiree health benefit plans, group annuity separate accounts offered to retirement plans, and non-qualified deferred compensation plans. Purchases may be subject to applicable sales charges as described in this prospectus.
•
Group Retirement Plans (and their successor, related, and affiliated plans) which have these share classes available to participants on or before 4/3/2017, may continue to open accounts for new participants in such share classes of the Fund and purchase additional shares in existing participant accounts.
•
Group Retirement Plans (or financial intermediary platforms available to Group Retirement Plans) that were approved by a Fund and the Distributor after 4/3/2017 and before 12/31/18 because the particular Group Retirement Plan had operational difficulties in implementing the eligibility restrictions may continue to purchase Class A, Class C, Class I or Class L Shares of the Funds.
•
Select Financial Intermediaries, which have received written approval from a Fund on behalf of existing Group Retirement Plan Participants that hold Class C shares, may purchase Class A shares.
All other new Group Retirement Plans are no longer eligible to purchase these share classes.
Sales Charges and Financial Intermediary Compensation
The following section describes the various sales charges and other fees that you will pay if you purchase shares of the Funds. In addition, it describes the types of compensation paid to Financial Intermediaries for the sale of Fund shares and related services. The Funds and/or the Distributor reserve the right to change sales charges, commissions and finder’s fees at any time.
To obtain information regarding sales charges and the reduction, and elimination or waiver of sales charges on Class A and Class C Shares of the J.P. Morgan Funds, see below, visit www.jpmorganfunds.com or call 1-800-480-4111. You may contact your Financial Intermediary about the reduction, elimination or waiver of sales charges. You may also contact your Financial Intermediary about any commissions charged by them on your purchase of Class I Shares
Class A Shares
The public offering price of Class A Shares of each Fund is the net asset value (NAV) per share plus the applicable sales charge, unless you qualify for a waiver of the sales charge. The sales charge is allocated between your Financial Intermediary and the Distributor as shown in the tables below, except if the Distributor, in its discretion, re-allows the entire amount to your Financial Intermediary. In those instances in which the entire amount is re-allowed, such Financial Intermediaries may be deemed to be underwriters under the Securities Act of 1933.
The table below shows the front-end sales charge you would pay at different levels of investment, the commission paid to Financial Intermediaries, any finder’s fees paid to Financial Intermediaries and any applicable CDSC. Purchases at certain dollar levels, known as “breakpoints,” allow for a reduction in the front-end sales charge.
For the JPMorgan Ultra-Short Municipal Fund:
July 1, 2022 | 71
Investing with J.P. Morgan Funds (continued)
| Class A Shares Amount of Investment |
Sales Charge as a % of Offering Price |
Sales Charge as a % of your Investment |
Commission as a % of Offering Price2 |
CDSC |
| Less than $50,000 |
0.00 |
0.00 |
0.00 |
0.00 |
| $50,000 to $99,999 |
0.00 |
0.00 |
0.00 |
0.00 |
| $100,000 to $249,999 |
0.00 |
0.00 |
0.00 |
0.00 |
| $250,000 or more |
0.00 |
0.00 |
0.00 |
0.00 |
For the JPMorgan Short-Intermediate Municipal Bond Fund:
| Class A Shares Amount of Investment |
Sales Charge as a % of Offering Price |
Sales Charge as a % of your Investment1 |
Commission as a % of Offering Price2 |
CDSC |
| Less than $50,000 |
2.25 |
2.30 |
2.00 |
0.00 |
| $50,000 to $99,999 |
2.00 |
2.04 |
1.50 |
0.00 |
| $100,000 to $249,999 |
1.25 |
1.27 |
1.00 |
0.00 |
| Amount of Investment |
Sales Charge as a % of Offering Price |
Sales Charge as a % of your Investment |
Finder’s Fee as a % of your Investment4 |
CDSC as a % of your Redemption3 |
| $250,000 to $3,999,999 |
0.00 |
0.00 |
0.75 |
0-18 months – 0.75% |
| $4,000,000 to $9,999,999 |
0.00 |
0.00 |
0.50 | |
| $10,000,000 or more |
0.00 |
0.00 |
0.25 |
For the JPMorgan Tax Free Bond Fund, the JPMorgan California Tax Free Bond Fund, the JPMorgan High Yield Municipal Fund the JPMorgan Intermediate Tax Free Bond Fund, the JPMorgan Sustainable Municipal Income Fund and the JPMorgan New York Tax Free Bond Fund:
| Class A Shares Amount of Investment |
Sales Charge as a % of Offering Price |
Sales Charge as a % of your Investment1 |
Commission as a % of Offering Price2 |
CDSC |
| Less than $100,000 |
3.75 |
3.90 |
3.25 |
0.00 |
| $100,000 to $249,999 |
3.25 |
3.36 |
2.75 |
0.00 |
| Amount of Investment |
Sales Charge as a % of Offering Price |
Sales Charge as a % of your Investment |
Finder’s Fee as a % of your Investment4 |
CDSC as a % of your Redemption3 |
| $250,000 to $3,999,999 |
0.00 |
0.00 |
0.75 |
0-18 months — 0.75% |
| $4,000,000 to $49,999,999 |
0.00 |
0.00 |
0.50 | |
| $50,000,000 or more |
0.00 |
0.00 |
0.25 |
1
The actual sales charge you pay may differ slightly from the rates disclosed above due to rounding calculations.
2
The sales charge is allocated between your Financial Intermediary and the Distributor. The Distributor, at its discretion, may re-allow the entire sales charge to your Financial Intermediary; in those instances such Financial Intermediaries may be deemed to be underwriters under the Securities Act of 1933.
3
Please see the “Exchanging Fund Shares” section for details regarding CDSC and exchanges.
The Distributor may also pay Financial Intermediaries a finder’s fee on sales to defined contribution plans with no minimum investment amount.
Finder’s Fee Schedule for Defined Contribution Plans
For the JPMorgan Short-Intermediate Municipal Bond Fund:
72 | J.P. Morgan Municipal Bond Funds
| Class A Shares Amount of Investment |
Sales Charge as a % of Offering Price |
Sales Charge as a % of your Investment |
Finder’s Fee as a % of your Investment |
CDSC as a % of your Redemption1 |
| $0 to $3,999,999 |
0.00 |
0.00 |
0.75 |
0.00 |
| $4,000,000 to $9,999,999 |
0.00 |
0.00 |
0.50 |
0.00 |
| $10,000,000 or more |
0.00 |
0.00 |
0.25 |
0.00 |
For the JPMorgan Tax Free Bond Fund, the JPMorgan California Tax Free Bond Fund, the JPMorgan High Yield Municipal Fund, the JPMorgan Intermediate Tax Free Bond Fund, the JPMorgan Sustainable Municipal Income Fund and the JPMorgan New York Tax Free Bond Fund:
| Class A Shares Amount of Investment |
Sales Charge as a % of Offering Price |
Sales Charge as a % of your Investment |
Finder’s Fee as a % of your Investment |
CDSC as a % of your Redemption1 |
| $0 to $3,999,999 |
0.00 |
0.00 |
0.75 |
0.00 |
| $4,000,000 to $49,999,999 |
0.00 |
0.00 |
0.50 |
0.00 |
| $50,000,000 or more |
0.00 |
0.00 |
0.25 |
0.00 |
1
If a plan redeems the shares for which a finder’s fee has been paid within 18 months of the purchase date, no CDSC is charged; however, the Distributor reserves the right to reclaim the finder’s fee paid to the Financial Intermediary.
Class C Shares
The table below shows the amount of sales charge, commission paid and any CDSC that may be charged.
| Class C Shares Amount of Investment |
Sales Charge as a % of Offering Price |
Sales Charge as a % of your Investment |
Commission as a % of Offering Price |
CDSC as a % of your Redemption |
| All Investments |
0.00 |
0.00 |
1.00 |
0-12 months —1.00% |
Class I Shares
There is no sales charge, commission or CDSC associated with Class I Shares.
Reducing Your Class A Sales Charges
Each Fund permits you to reduce the front-end sales charge you pay on Class A Shares by exercising your Rights of Accumulation or Letter of Intent privileges. Both of these are described below.
Rights of Accumulation: For Class A Shares, a front-end sales charge can be reduced by breakpoint discounts based on the amount of a single purchase or through Rights of Accumulation. By using Rights of Accumulation, you may combine the current market value of any existing qualifying holdings and account types (as described below) with the amount of the current purchase to qualify for a breakpoint and reduced sales charge on the current purchase.
The amount of the sales charge will be calculated based on the higher of (a) the market value of your qualified holdings as of the last calculated NAV prior to your investment or (b) if you purchased shares after July 3, 2017, the initial value of total share purchases, or if you already held shares on July 3, 2017, the market value of the shares on that date, provided that, in either case, the value will be reduced by the market value on the applicable redemption date of any shares you have redeemed. Depending on their operational capabilities, Financial Intermediaries may utilize one or both of the methods described above so your holdings could be valued differently depending on where you hold your shares.
Letter of Intent: By signing a Letter of Intent, you may combine the current market value of any existing qualifying holdings and account types with the value that you intend to buy over a 13 month period to calculate the front-end sales charge and any breakpoint discounts. Each purchase that you make during that 13 month period will receive the sales charge and breakpoint discount that applies to the total amount. The 13 month Letter of Intent period commences on the day that the Letter of Intent is received by the J.P. Morgan Funds or your Financial Intermediary, and you must inform your Financial Intermediary or the J.P. Morgan
July 1, 2022 | 73
Investing with J.P. Morgan Funds (continued)
Funds that you have a Letter of Intent each time you make an investment. Purchases submitted prior to the date on which the Letter of Intent is received by the J.P. Morgan Funds or your Financial Intermediary are considered only in determining the level of sales charge that will be paid. The Letter of Intent will not result in a reduction in the amount of any previously paid sales charges.
A percentage of your investment will be held in escrow until the full amount covered by the Letter of Intent has been invested. If the terms of the Letter of Intent are not fulfilled by the end of the 13th month, you must pay the Distributor the difference between the sales charges applicable to the purchases at the time they were made and the reduced sales charges previously paid or the Distributor will liquidate sufficient escrowed shares to obtain the difference and/or adjust the shareholder’s account to reflect the correct number of shares that would be held after deduction of the sales charge. The Letter of Intent will be considered completed if the shareholder dies within the 13 month period covered by the Letter of Intent. Commissions to dealers will not be adjusted or paid on the difference between the Letter of Intent amount and the amount actually invested before the shareholder’s death. Calculations made to determine whether a Letter of Intent commitment has been fulfilled will be made on the basis of the amount invested prior to the deduction of any applicable sales charge.
Below are the qualifying holdings and account types that may be aggregated in order to exercise your Rights of Accumulation and Letter of Intent privileges to qualify for a reduced front-end sales charge on Class A Shares.
Qualifying Holdings: Class A, Class C, Class I, Class L Shares and Class R6 Shares (only when used in advisory programs) of the J.P. Morgan Funds and Class A, Class C and the Advisor Class units in New York’s 529 Advisor-Guided College Savings Program (NY 529 Advisor-Guided Plan). Investments in the JPMorgan 529 U.S. Government Money Market Portfolio are not included.
Qualifying Accounts:
1.
Your account(s);
2.
Account(s) of your spouse or domestic partner;
3.
Account(s) of children under the age of 21 who share your residential address;
4.
Trust accounts established by any of the individuals in items (1) through (3) above. If the person(s) who established the trust is deceased, the trust account may be aggregated with the account(s) of the primary beneficiary of the trust;
5.
Solely controlled business accounts; and
6.
Single-participant retirement plans of any of the individuals in items (1) through (3) above.
You may use your qualifying holdings and account types even if they are held at different Financial Intermediaries. In order to obtain any reduction in the sales charge by utilizing either the Rights of Accumulation or Letter of Intent privileges, you must, before each purchase of Class A Shares, inform your Financial Intermediary or the J.P. Morgan Funds if you have any existing holdings that may be aggregated with your current purchase in order to qualify for a reduced front-end sales charge.
In order to verify your eligibility for a reduced sales charge, you may be required to provide appropriate documentation, such as an account statement or the social security or tax identification number on an account, so that J.P. Morgan Funds may confirm (1) the value of each of your accounts invested in J.P. Morgan Funds or in the NY 529 Advisor-Guided Plan and (2) the value of the accounts owned by your spouse or domestic partner and by children under the age of 21 who share your residential address.
Certain Financial Intermediaries may not participate in extending the Rights of Accumulation or Letter of Intent privileges to your holdings in the NY 529 Advisor-Guided Plan. Please check with your Financial Intermediary to determine whether the Financial Intermediary makes these privileges available with respect to NY 529 Advisor-Guided Plan investments.
Additional information regarding the reduction of Class A sales charges is available in each Fund's Statement of Additional Information. To determine if you are eligible for Rights of Accumulation or Letter of Intent privileges or to request a copy of the Statement of Additional Information, call 1-800-480-4111. These programs may be terminated or amended at any time.
Sales Charge Waivers
The availability of certain sales charge waivers and discounts will depend on whether you purchase your shares directly from a Fund or on a Financial Intermediary platform. Financial Intermediaries may have different policies and procedures regarding the availability of front-end sales load waivers or contingent deferred (back-end) sales load (“CDSC”) waivers, which are discussed in Appendix A. Except as described in Appendix A, purchases will be subject to the waivers or discounts discussed below.
Waiver of the Class A Sales Charge
No sales charge is imposed on Class A Shares of the Funds if the shares were:
1.
Bought with the reinvestment of dividends and capital gains distributions.
74 | J.P. Morgan Municipal Bond Funds
2.
Acquired in exchange for shares of another J.P. Morgan Fund if a comparable sales charge has been paid for the exchanged shares.
3.
Bought through a Financial Intermediary and not directly from the Funds by officers, directors, trustees, retirees and employees, and their immediate family members (i.e., spouses, domestic partners, children, grandchildren, parents, grandparents and any dependent of the person, as defined in Section 152 of the Internal Revenue Code) of:
•
J.P. Morgan Funds.
•
JPMorgan Chase and its subsidiaries and affiliates.
Former employees and their immediate family members can make subsequent purchases in accounts established during the employees’ employment. Officers, directors, trustees, retirees and employees, and their immediate family members of J.P. Morgan Funds and JPMorgan Chase and its subsidiaries and affiliates may open new Class I Share accounts subject to a $1,000 minimum investment requirement provided such accounts are opened directly from the Funds and not through a Financial Intermediary. Class I Shares have lower expenses than Class A Shares. Please call 1-800-480-4111 for more information concerning all of the Funds’ other share classes.
4.
Bought by employees of:
•
DST Asset Manager Solutions, Inc. and its subsidiaries and affiliates.
•
Financial Intermediaries or financial institutions that have entered into dealer agreements with the Funds or the Distributor and their subsidiaries and affiliates (or otherwise have an arrangement with a Financial Intermediary or financial institution with respect to sales of Fund shares). This waiver includes the employees’ immediate family members (i.e., spouses, domestic partners, children, grandchildren, parents, grandparents and any dependent of the employee, as defined in Section 152 of the Internal Revenue Code).
5.
Bought by:
•
Employer sponsored retirement, deferred compensation, employee benefit plans (including health savings accounts) and trusts used to fund those plans. Employer sponsored plans include 401(k) plans, 457 plans, 403(b) plans, profit-sharing and money purchase pension plans, defined benefit plans, retiree health benefit plans and non-qualified deferred compensation plans. Traditional IRAs, Roth IRAs, Coverdell Education Savings Accounts, SEPs, SARSEPs, SIMPLE IRAs and KEOGHs plans do not qualify under this waiver.
•
Financial Intermediaries, including affiliates of JPMorgan Chase, who have a dealer arrangement with the Distributor, act in a custodial capacity, or who place trades for their own accounts or for the accounts of their clients and who charge a management, asset allocation, consulting, or other fee for their services.
•
Financial Intermediaries who have entered into an agreement with the Distributor and have been approved by the Distributor to offer Fund shares to investment brokerage programs in which the end shareholder makes investment decisions independent of a financial advisor; these programs may or may not charge a transaction fee.
•
Tuition programs that qualify under Section 529 of the Internal Revenue Code.
•
A bank, trust company or thrift institution which is acting as a fiduciary exercising investment discretion, provided that appropriate notification of such fiduciary relationship is reported at the time of the investment to the Fund or the Fund’s Distributor.
6.
Bought in connection with plans of reorganization of a J.P. Morgan Fund, such as mergers, asset acquisitions and exchange offers to which the Fund is a party. However, you may pay a CDSC when you redeem the Fund shares you received in connection with the plan of reorganization.
7.
Purchased in Individual Retirement Accounts (IRAs) established prior to September 2, 2014:
i.
That were established through a rollover from a qualified retirement plan for which J.P. Morgan Retirement Plan Services LLC had a contractual relationship to provide recordkeeping for the plan (an “RPS Rollover IRA”) or an IRA that was subsequently established in connection with the RPS Rollover IRA;
ii.
Where JPMorgan Institutional Investments Inc. continues to be the broker of record for the IRA; and
iii.
Where UMB Bank, n.a. continues to serve as custodian for the IRA.
8. Purchased in an account where the Distributor is the broker of record as of April 10, 2017.
July 1, 2022 | 75
Investing with J.P. Morgan Funds (continued)
To determine if you qualify for a sales charge waiver, call 1-800-480-4111 or contact your Financial Intermediary. These waivers may not continue indefinitely and may be discontinued at any time without notice.
Contingent Deferred Sales Charge (CDSC)
Certain redemptions of Class A and Class C Shares are subject to a CDSC. Please see “SALES CHARGES AND FINANCIAL INTERMEDIARY COMPENSATION” for the amount of the applicable CDSC. The CDSC is calculated by multiplying the original cost of the shares by the CDSC rate. For Class A Shares, the CDSC is calculated from the date of the purchase of the applicable shares. For Class C Shares, the Funds assume that all purchases made in a given month were made on the first day of the month.
No CDSC is imposed on share appreciation, nor is a CDSC imposed on shares acquired through reinvestment of dividends or capital gains distributions.
To keep your CDSC as low as possible, the Funds will first redeem any shares that are not subject to a CDSC (i.e., shares that have been held for longer than the CDSC period or shares acquired through reinvestment of dividends or capital gains distributions), followed by the shares held for the longest time. You should retain any records necessary to substantiate historical costs because the Distributor, the Funds, the transfer agent and your Financial Intermediary may not maintain such information.
If you received Fund shares in connection with a fund reorganization, the CDSC applicable to your original shares (including the period of time you have held those shares) will be applied to the shares received in the reorganization.
Waiver of the Class A and Class C CDSC
No CDSC is imposed on redemptions of shares:
1.
If you participate in a Systematic Redemption Plan and withdraw no more than the amount permitted to be withdrawn without a CDSC. Please refer to Systematic Redemption Plan in the “HOW TO REDEEM” table below.
2.
Made due to the death or disability of a shareholder. For shareholders that become disabled, the redemption must be made within one year of initial qualification for Social Security disability payments or within one year of becoming disabled as defined in section 72(m)(7) of the Internal Revenue Code. This waiver is only available for accounts opened prior to the shareholder’s disability. In order to qualify for the waiver, the Distributor must be notified of the death or disability at the time of the redemption order and be provided with satisfactory evidence of such death or disability.
3.
That represent a Required Minimum Distribution from your IRA Account or other qualifying retirement plan. The waiver only applies to the pro rata required minimum distribution amount from the assets invested in one or more of the J.P. Morgan Funds.
4.
That are part of a J.P. Morgan Fund-initiated event, such as mergers, liquidations, asset acquisitions, and exchange offers to which the Fund is a party, or result from a failure to maintain the required minimum balance in an account. However, you may pay a sales charge when you redeem the Fund shares you received in connection with the Fund-initiated event.
5.
Exchanged into the same share class of other J.P. Morgan Funds. Your new Fund will be subject to the CDSC of the Fund from which you exchanged and the current holding period is carried over to your new shares. Please read “Exchanging Fund Shares” for more information.
6.
For Class C Shares only, if your Financial Intermediary has notified the Distributor before you invest that it is waiving its commission.
7.
Sold as a return of excess contributions from an IRA Account.
8.
Sold to pay the Distributor or a Financial Intermediary account-related fees (only if the transaction is initiated by the Distributor or the Financial Intermediary).
To see if you qualify for a CDSC waiver, call 1-800-480-4111 or contact your Financial Intermediary. These waivers may not continue indefinitely and may be discontinued at any time without notice.
Repurchase Rights
If you redeem shares in a mutual fund, Repurchase Rights may allow you to reinvest all or a portion of the redemption proceeds or repurchase shares at NAV if the purchase is made within 90 days of the sale or distribution. In order to take advantage of Repurchase Rights, you must inform your Financial Intermediary or J.P. Morgan Funds you wish to do so at the time of purchase. This policy does not apply to systematic purchases.
There is no sales charge on:
76 | J.P. Morgan Municipal Bond Funds
•
Class A Shares if they are bought with proceeds from the sale of Class A Shares of a J.P. Morgan Fund
•
Class A Shares if they are bought with proceeds from the sale of Class I Shares or Class L Shares of a J.P. Morgan Fund
•
Class A Shares if they are bought with proceeds from the sale of Class R6 Shares of a J.P. Morgan Fund held in a fee-based advisory account
•
Class A Shares if they are bought with proceeds from the sale of Morgan Shares of a J.P. Morgan Money Market Fund, provided that the Morgan Shares were acquired from Class A Shares where a sales charge was paid or waived
In addition, if you repurchase Class C Shares within 90 days of a redemption, there will be no CDSC on the new Class C Shares.
Rule 12b–1 Fees
Each Fund described in this prospectus has adopted a Distribution Plan under Rule 12b-1 with respect to Class A and Class C Shares that allows it to pay distribution fees for the sale and distribution of these shares of the Funds. These fees are called “Rule 12b-1 fees.” Rule 12b-1 fees are paid by the Funds to the Distributor as compensation for its services and expenses in connection with the sale and distribution of Fund shares. The Distributor in turn pays all or part of these Rule 12b-1 fees to Financial Intermediaries that have agreements with the Distributor to sell shares of the Funds. The Distributor may pay Rule 12b-1 fees to its affiliates. Payments are not tied to actual expenses incurred.
The Rule 12b-1 fees (based on average daily net assets of the share class) vary by share class as follows:
| Class |
Rule 12b-1 Fee |
| Class A |
0.25% |
| Class C |
0.75% |
| Class I |
None |
Rule 12b-1 fees, together with the CDSC, help the Distributor sell Class C Shares without an upfront sales charge by defraying the costs of advancing brokerage commissions and other expenses paid to Financial Intermediaries.
Because Rule 12b-1 fees are paid out of Fund assets on an ongoing basis, over time these fees will increase the cost of your investment and may cost you more than paying other types of sales charges.
With respect to Class A Shares transactions, for purchases at NAV where the Distributor paid a finder’s fee at the time of the purchase, the selling Financial Intermediary will start to receive the applicable Rule 12b-1 fee in the 13th month after the sale and the Distributor will retain the Rule 12b-1 fees during such period.
Networking and Sub-Transfer Agency Fees
JPMDS, as shareholder servicing agent, has entered into agreements with Financial Intermediaries pursuant to which the Financial Intermediary is paid for services such as networking or sub-transfer agency (collectively, the “Sub-TA Agreements”). Sub-TA Agreement payments are generally based on either (1) a percentage of the average daily net assets of clients serviced by such Financial Intermediary up to a set maximum dollar amount per shareholder account serviced, or (2) a per account fee based on the number of accounts serviced by such Financial Intermediary. Sub-TA Agreement payments are in addition to, rather than in lieu of, Rule 12b-1 fees the Financial Intermediary may also be receiving pursuant to agreements with the Distributor for classes with Rule 12b-1 fees. Payments to Financial Intermediaries for sub-transfer agency services will be made by JPMDS, as shareholder servicing agent, from the service fee. From time to time, JPMIM or its affiliates may pay a portion of the sub-transfer agency fees at its or their own expense and out of its or their legitimate profits.
Service Fees
JPMDS, as shareholder servicing agent, receives an annual fee of up to the following fee (based on the average daily net assets of the applicable class of a Fund).
| Class |
Service Fee |
| Class A |
0.25% |
| Class C |
0.25% |
| Class I |
0.25% |
JPMDS may enter into service agreements with Financial Intermediaries under which it will pay all or a portion of that fee to such Financial Intermediaries for performing shareholder and administrative services.
July 1, 2022 | 77
Investing with J.P. Morgan Funds (continued)
Conversion Feature for Certain Class A Shares Held by Employees
Employees will no longer be eligible to hold Class A Shares directly with the Funds. Therefore, Class A Shares held by employees purchased directly from the Funds were converted to Class I Shares beginning on November 6, 2020. Employees include officers, directors, trustees, retirees and employees, and their immediate family members (i.e., spouses, domestic partners, children, grandchildren, parents, grandparents and any dependent of the person, as defined in Section 152 of the Internal Revenue Code) of J.P. Morgan Funds and JPMorgan Chase and its subsidiaries and affiliates.
Because the share price of the Class I Shares may be higher than that of the Class A Shares at the time of conversion, you may receive fewer Class I Shares; however, the dollar value will be the same. After conversion, your new shares will no longer be subject to Rule 12b-1 fees charged on Class A Shares. You will not be assessed any sales charges, fees or other charges for the conversion of the shares, nor will you be subject to any federal income tax as a result of the conversion.
Class C Shares Conversion Feature
Class C Shares will be converted to Class A Shares in the following instances:
•
If an investor is eligible to purchase Class A Shares, then their Class C Share positions will convert to Class A Shares after 8 years, calculated from the first day of the month of purchase and processed on the tenth business day of the anniversary month.
•
If Class C Shares held in an account with a third party broker of record are transferred to an account with the Distributor, those Class C Shares will be converted to Class A Shares on the tenth business day of the month following the transfer.
Because the share price of the Class A Shares may be higher than that of the Class C Shares at the time of conversion, you may receive fewer Class A Shares; however, the dollar value will be the same.
After conversion, your new shares will be subject to the lower Rule 12b-1 fees charged on Class A Shares. You will not be assessed any sales charges, fees or other charges for the conversion of shares, nor will you be subject to any federal income tax as a result of the conversion. You will not pay any CDSC when you sell Class A Shares that have converted from Class C Shares.
Purchasing Fund Shares
You may purchase shares directly from the J.P. Morgan Funds through the Distributor or through your Financial Intermediary.
This prospectus offers multiple share classes. Each share class has different sales charges and/or expenses. When deciding what share class to buy, you should consider the amount of your investment, the length of time you intend to hold the shares, the sales charges and expenses applicable to each share class and whether you qualify for any sales charge discounts. Please refer to “Choos- ing a Share Class” for investment minimums for initial and subsequent purchases and to help you determine which share class would be best for you.
Purchase and redemption orders will be accepted only on days that J.P. Morgan Funds are open for business. The Funds are open for business on each day the NYSE is open for trading. A purchase or redemption order received by the Funds prior to the close of regular trading on the NYSE (normally 4:00 p.m. ET) (“Fund Close”), on a day the Funds are open for business, will be effected at that day’s NAV. The Funds will not treat an intraday unscheduled disruption or closure in NYSE trading as a closure of the NYSE and will calculate NAV as of 4:00 p.m. ET, if the particular disruption or closure directly affects only the NYSE. An order received after the Fund Close will generally be effected at the NAV determined on the next business day. However, orders received by Financial Intermediaries on a business day prior to the Fund Close and communicated to the Funds prior to such time as agreed upon by the Funds and the Financial Intermediary will be effected at the NAV determined on the business day the order was received by the Financial Intermediary.
A purchase order must be supported by all appropriate documentation and information in the proper form. The Funds may refuse to honor incomplete purchase orders.
Share ownership is electronically recorded; therefore, no certificate will be issued. A shareholder who purchases shares of a Fund that accrues dividends daily will not accrue a dividend on the day of the purchase.
If you purchase shares through your Financial Intermediary, contact your investment representative for its requirements and procedures. If a Financial Intermediary holds your shares, it is the responsibility of the Financial Intermediary to send your purchase order to the Fund. Your Financial Intermediary may have an earlier cut-off time for purchase orders.
If you purchase shares directly with the Funds, see the information below.
78 | J.P. Morgan Municipal Bond Funds
| HOW TO PURCHASE DIRECTLY WITH THE J.P. MORGAN FUNDS | ||
| |
Opening a New Account |
Purchasing into an Existing Account |
| By Phone or Online 1-800-480-4111 Shareholder Services representatives are available Monday through Friday from 8:00 am to 6:00 pm ET. www.jpmorganfunds.com Note: Certain account types are not available for online account access. Please call for additional information. |
A new account generally may not be opened by phone or online. Employees of JPMorgan Chase & Co. may open a new account online. A new fund position can be added to an existing account by phone or online if you have bank information on file. The minimum initial investment requirement must be met. |
You must already have bank information on file. If we do not have bank information on file, you must submit written instructions. Please call for instructions on how to add bank information to your account. |
| By Mail Regular mailing address: J.P. Morgan Funds Services P.O. Box 219143 Kansas City, MO 64121-9143 Overnight mailing address: J.P. Morgan Funds Services 430 W 7th Street, Suite 219143 Kansas City, MO 64105-1407 |
Mail the completed and signed application with a check to our Regular or Overnight mailing address. Refer to the Additional Information Regarding Purchases section. |
Please mail your check and include your name, the Fund name, and your fund account number. |
| All checks must be made payable to one of the following: •J.P. Morgan Funds; or •The specific Fund in which you are investing. Please include your existing account number, if applicable. All checks must be in U.S. dollars. The J.P. Morgan Funds do not accept credit cards, cash, starter checks, money orders or credit card checks. The Funds and/or the Distributor reserve the right to refuse “third-party” checks and checks drawn on non- U.S. financial institutions even if payment may be effected through a U.S. financial institution. Checks made payable to any individual or company and endorsed to J.P. Morgan Funds or a Fund are considered third-party checks. | ||
| By ACH or Wire1 1-800-480-4111 Wire Instructions: DST Asset Manager Solutions, Inc. 2000 Crown Colony Drive Quincy, MA 02169 Attn: J.P. Morgan Funds Services ABA: 021 000 021 DDA: 323 125 832 FBO: Fund Name Fund: Fund # Account: Your Account # and Your Account Registration |
You may include bank information on your application for your initial purchase to be processed via Automated Clearing House (ACH) rather than sending a check. New accounts cannot be opened by wire purchase. |
Purchase by ACH: To process a purchase via ACH using bank information on file you may call us or process the purchase online. Purchase by Wire: If you choose to pay by wire, please call to notify the Fund of your purchase. You must also initiate the wire with your financial institution. |
July 1, 2022 | 79
Investing with J.P. Morgan Funds (continued)
| HOW TO PURCHASE DIRECTLY WITH THE J.P. MORGAN FUNDS | ||
| |
Opening a New Account |
Purchasing into an Existing Account |
| Systematic Investment Plan1 |
You may include instructions to set up a Systematic Investment Plan on your application. Bank Information must be included. Refer to Choosing A Share Class for fund minimums. |
If bank information is on file, you may call, go online or mail written instructions to start, edit or delete a Systematic Investment Plan. You cannot have a Systematic Investment Plan and a Systematic Redemption Plan or Systematic Exchange Plan on the same fund account. If bank information is not on file, you will be required to submit a completed form with your bank information and Systematic Investment Plan details. |
1
The Funds currently do not charge for these services, but may impose a charge in the future. However, your bank may impose a charge for debiting your bank account.
Transactions by phone, fax or the Internet
You may access your account and conduct certain transactions using phone, fax or the J.P. Morgan Funds website. Phone conversations are recorded. The J.P. Morgan Funds and their agents use reasonable procedures to verify the identity of the shareholder. If these procedures are followed, the J.P. Morgan Funds and their agents are not liable for any losses, liability, cost or expenses (including attorney fees) that may occur from acting on unauthorized or fraudulent instructions. Therefore please take precautions to protect your account information and immediately review account statements or other information provided to you. In addition, a confirmation is sent promptly after a transaction. Please review it carefully and contact J.P. Morgan Funds Services or your Financial Intermediary immediately about any transaction you believe to be unauthorized. You may revoke your right to make purchases over the phone or by mailing written instructions to us.
You may not always reach J.P. Morgan Funds Services by phone or online. This may be true at times of unusual market changes and shareholder activity. You can mail us your instructions or contact your Financial Intermediary. We may modify or cancel the ability to purchase or redeem shares online or by phone without notice.
Additional Information Regarding Purchases
Federal law requires all financial institutions to obtain, verify and record information that identifies each person who opens an account. When you open an account, we will ask for your name, residential or business street address, date of birth (for an individual), and other information that will allow us to identify you, including your social security number, tax identification number or other identifying number. The J.P. Morgan Funds cannot waive these requirements. A Fund is required by law to reject your Account Application if the required identifying information is not provided.
We will attempt to collect any missing information required on the Account Application by contacting either you or your Financial Intermediary. If we cannot obtain this information within the established time frame, your Account Application will be rejected. Amounts received prior to receipt of the required information will be held uninvested and will be returned to you without interest if your Account Application is rejected. If the required information is obtained, your investment will be accepted and you will pay the NAV per share next calculated after all of the required information is received, plus any applicable sales charge.
Once we have received all of the required information, federal law requires us to verify your identity. After an account is opened, we may restrict your ability to purchase additional shares until your identity is verified. If we are unable to verify your identity within a reasonable time, the Funds and/or the Distributor reserve the right to close your account at the current day’s NAV per share. If your account is closed for this reason, your shares will be redeemed at the NAV per share next calculated after the account is closed, less any applicable CDSC are fees. In addition, you will not be entitled to recoup any sales charges paid to a Fund in connection with your purchase of Fund shares.
Purchases by wire may be canceled if J.P. Morgan Funds Services does not receive payment by 4:00 p.m. ET on the settlement date. You will be responsible for any expenses and/or losses to the Funds.
80 | J.P. Morgan Municipal Bond Funds
Exchanging Fund Shares
An exchange is selling shares of one J.P. Morgan Fund and taking the proceeds to simultaneously purchase shares of another J.P. Morgan Fund. Before making an exchange request, you should read the prospectus of the J.P. Morgan Fund whose shares you would like to purchase by exchange. You can obtain a prospectus for any J.P. Morgan Fund by contacting your Financial Intermediary, by visiting www.jpmorganfunds.com, or by calling 1-800-480-4111.
| EXCHANGE PRIVILEGES |
| Class A Shares of a Fund may be exchanged for: |
| •Class A Shares of another J.P. Morgan Fund, |
| •Morgan Shares of a J.P. Morgan money market fund (except for JPMorgan Prime Money Market Fund), or |
| •Another share class of the same Fund if you are eligible to purchase that class. |
| Class C Shares of a Fund may be exchanged for: |
| •Class C Shares of another J.P. Morgan Fund (except for JPMorgan Prime Money Market Fund). Your new Class C Shares will be subject to the CDSC of the Fund from which you exchanged, and the current holding period for your exchanged Class C Shares is carried over to your new shares. |
| •Class I, Class L or Class R6 Shares, if available, of the same Fund, provided you meet the eligibility requirements for the class you are exchanging into. In addition, the Class C Shares that you wish to exchange must not currently be subject to any CDSC. |
| Class I Shares of a Fund may be exchanged for: |
| •Class I Shares of another J.P. Morgan Fund, |
| •Morgan Shares of a J.P. Morgan money market fund (except for JPMorgan Prime Money Market Fund), or |
| •Another share class of the same Fund if you are eligible to purchase that class. |
The following rules and procedures apply to exchanges:
•
All exchanges are subject to meeting any investment minimum or eligibility requirements of the new Fund and class.
•
The J.P. Morgan Funds will provide 60 days’ written notice of any termination of or material change to your exchange privilege.
•
All exchanges are based upon the net asset value that is next calculated after the Fund receives your order, provided the exchange out of one Fund must occur before the exchange into the other Fund.
•
In order for an exchange to take place on the date that the order is submitted, the order must be received prior to the close of both the Fund that you wish to exchange into and the Fund that you wish to exchange out of, otherwise, the exchange will occur on the following business day on which both Funds are open.
•
A shareholder that exchanges into shares of a Fund that accrues dividends daily, including a money market fund, will not accrue a dividend on the day of the exchange. A shareholder that exchanges out of shares of a Fund that accrues a daily dividend will accrue a dividend on the day of the exchange.
•
The exchange privilege is not intended as a way for you to speculate on short-term movements in the market. Therefore, to prevent disruptions in the management of J.P. Morgan Funds, certain J.P. Morgan Funds limit excessive exchange activity as described in the “Frequent Trading Policy” section. Your exchange privilege will be limited or revoked if the exchange activity is considered excessive. In addition, any J.P. Morgan Fund may reject any exchange request for any reason, including if it is not in the best interests of the Fund and/or its shareholders to accept the exchange.
•
For Class A and Class C Shares only, you can set up a systematic exchange program to automatically exchange shares on a regular basis. However, you cannot have simultaneous systematic investment plans for the same Fund. You may call 1-800-480-4111 for complete instructions.
Generally, you will not pay a sales charge on an exchange except as specified below.
If you exchange Class A or Class C Shares of a Fund that are subject to a CDSC for Class A (Morgan Shares of a J.P. Morgan money market fund) or Class C Shares, respectively, of another Fund, you will not pay a CDSC at the time of the exchange, however:
1.
Your new Class A (Morgan Shares of a J.P. Morgan money market fund) or Class C Shares will be subject to the CDSC of the Fund from which you exchanged, and
2.
The current holding period for your exchanged Class A (Morgan Shares of a J.P. Morgan money market fund) or Class C Shares, is carried over to your new shares.
Following an exchange, the fees and expenses of the new share class may be higher than those of the class you previously held. You should carefully review the prospectus for the new share class, including information on the fees, expenses and exchange features of the new share class, or contact your Financial Intermediary for more information.
July 1, 2022 | 81
Investing with J.P. Morgan Funds (continued)
Tax Consequences on Exchanges
Generally, an exchange between J.P. Morgan Funds is considered a sale and generally results in a capital gain or loss for federal income tax purposes. An exchange between classes of shares of the same Fund is generally not taxable for federal income tax purposes. You should talk to your tax advisor before making an exchange.
Redeeming Fund Shares
If you sell shares through your Financial Intermediary, contact your investment representative for its requirements and procedures. If a Financial Intermediary holds your shares, it is the responsibility of the Financial Intermediary to send your redemption order to the Fund. Your Financial Intermediary may have an earlier cut-off time for redemption orders.
If you sell shares directly with a Fund, see the information below.
Your redemption proceeds may be mailed to you at your address of record1, wired, or sent by ACH to a pre-existing bank account on file.
| HOW TO REDEEM | |
| By Phone or Online Note: Certain account types are not available for online account access. |
Call us at 1-800-480-4111 Shareholder Services representatives are available Monday through Friday from 8:00 am to 6:00 pm ET. www.jpmorganfunds.com |
| By Mail |
Regular mailing address: J.P. Morgan Funds Services P.O. Box 219143 Kansas City, MO 64121-9143 Overnight mailing address: J.P. Morgan Funds Services 430 W 7th Street, Suite 219143 Kansas City, MO 64105-1407 |
| Systematic Redemption Plan2, 3 Note:The Funds currently do not charge for this service, but may impose a charge in the future. |
You may include instructions to set up a Systematic Redemption Plan on your application. Payment instructions must be included. You may call, or mail written instructions to start, edit or delete a Systematic Redemption Plan. You may send a written redemption request to your Financial Intermediary, if applicable, or to the Fund at the following address: J.P. Morgan Funds Services P.O. Box 219143 Kansas City, MO 64121-9143 You may redeem over the phone. Please see “Can I redeem by phone?” for more information. If you own Class A or Class C Shares, the applicable CDSC will be deducted from those payments unless such payments are made: 4 •Monthly and constitute no more than 1/12 of 10% of your then-current balance in the Fund each month; or •Quarterly and constitute no more than ¼ of 10% of your then-current balance in the Fund each quarter. It may not be in your best interest to buy additional Class A Shares while participating in a Systematic Redemption Plan. This is because Class A Shares have an upfront sales charge. |
1
You cannot request a redemption by check to be sent to an address updated within 15 days.
2
If the amount of the systematic payment exceeds the income earned by your account since the previous payment under the Systematic Redemption Plan, payments will be made by redeeming some of your shares. This will reduce the amount of your investment, up to possibly closing your account.
82 | J.P. Morgan Municipal Bond Funds
3
The Funds currently do not charge for these services, but may impose a charge in the future. However, your bank may impose a charge for crediting your bank account.
4
Your current balance in the Fund for purposes of these calculations will be determined by multiplying the number of shares held by the last calculated NAV per share of the applicable class.
You may redeem some or all of your shares on any day that the Funds are open for business. You will not be permitted to enter a redemption order for shares purchased directly through J.P. Morgan Funds Services by check or through an ACH transaction for five business days following the acceptance of a purchase order unless you provide satisfactory proof that your purchase check or ACH transaction has cleared (sometimes referred to as uncollected shares).
If a Fund or Financial Intermediary receives your redemption order before the close of the NYSE (normally 4 p.m. ET or before 4:00 p.m. ET, if the NYSE closes before 4:00 p.m. ET), you will receive the NAV per share calculated after your redemption order is received in good order (meaning that it includes the information required by, and complies with security requirements implemented by, the Fund’s transfer agent or the Fund), minus the amount of any applicable CDSC are fees. Your Financial Intermediary may have an earlier cut-off time for redemption orders and may charge a fee to process redemption of shares. A shareholder that redeems out of shares of a Fund that accrues a daily dividend will accrue a dividend on the day of the redemption.
All redemption requests must be supported by valid identity authentication, the appropriate documentation (if applicable) and any necessary information in good order. Additional information may be required depending on the situation.
For accounts held directly with the Funds, the length of time that the Funds typically expect to pay redemption proceeds depends on whether payment is made by ACH, wire or check. The Funds typically expect to make payments of redemption proceeds by wire or ACH on the next business day following receipt of the redemption order by the Funds. For payment by check, the Funds typically expect to mail the check on the next business day following receipt of the redemption order by the Funds.
For accounts held through Financial Intermediaries, the length of time that the Funds typically expect to pay redemption proceeds depends on the method of payment and the agreement between the Financial Intermediary and the Funds. For redemption proceeds that are paid directly to you by the Fund, the Fund typically expects to make payments by wire or ACH or by mailing a check on the next business day following the Fund’s receipt of a redemption order from the Financial Intermediary. For payments that are made to your Financial Intermediary for transmittal to you, the Funds expect to pay redemption proceeds to the Financial Intermediary within 1 to 3 business days following the Fund’s receipt of the redemption order from the Financial Intermediary.
Payment of redemption proceeds may take longer than the time a Fund typically expects and may take up to seven days as permitted by the Investment Company Act of 1940.
Transactions by phone, fax or the Internet
You may access your account and conduct certain transactions using phone, fax or the J.P. Morgan Funds website. Phone conversations are recorded. The J.P. Morgan Funds and their agents use reasonable procedures to verify the identity of the shareholder. If these procedures are followed, the J.P. Morgan Funds and their agents are not liable for any losses, liability, cost or expenses (including attorney fees) that may occur from acting on unauthorized or fraudulent instructions. Therefore please take precautions to protect your account information and immediately review account statements or other information provided to you. In addition, a confirmation is sent promptly after a transaction. Please review it carefully and contact J.P. Morgan Funds Services or your Financial Intermediary immediately about any transaction you believe to be unauthorized. You may revoke your right to make redemptions over the phone or by mailing written instructions to us.
You may not always reach J.P. Morgan Funds Services by phone or online. This may be true at times of unusual market changes and shareholder activity. You can mail us your instructions or contact your Financial Intermediary. We may modify or cancel the ability to purchase or redeem shares online or by phone without notice.
Additional Information Regarding Redemptions
Medallion signature guarantees may be required if:
•
You want to redeem shares with a value of $50,000 or more and you want to receive your proceeds in the form of a check; or
•
You want your payment sent to an address, bank account or payee other than the one currently designated on your Fund account.
The Fund may refuse to honor incomplete redemption orders.
The Fund may suspend your ability to redeem when:
1.
Trading on the NYSE is restricted;
July 1, 2022 | 83
Investing with J.P. Morgan Funds (continued)
2.
The NYSE is closed (other than weekend and holiday closings);
3.
Federal securities laws permit;
4.
The SEC has permitted a suspension; or
5.
An emergency exists, as determined by the SEC.
You generally will recognize a gain or loss on a redemption for federal income tax purposes. You should talk to your tax advisor before making a redemption.
Generally, all redemptions will be for cash. The J.P. Morgan Funds typically expect to satisfy redemption requests by selling portfolio assets or by using holdings of cash or cash equivalents. On a less regular basis, the Funds may also satisfy redemption requests by borrowing from another Fund, by drawing on a line of credit from a bank, or using other short-term borrowings from its custodian. These methods may be used during both normal and stressed market conditions. In addition to paying redemption proceeds in cash, if you redeem shares worth $250,000 or more, the J.P. Morgan Funds reserve the right to pay part or all of your redemption proceeds in readily marketable securities instead of cash. If payment is made in securities, the Fund will value the securities selected in the same manner in which it computes its NAV. This process minimizes the effect of large redemptions on the Fund and its remaining shareholders. If you receive a redemption in-kind, securities received by you may be subject to market risk and you could incur taxable gains and brokerage or other charges in converting the securities to cash. While the J.P. Morgan Funds do not routinely use redemptions in-kind, the Funds reserve the right to use redemptions in-kind to manage the impact of large redemptions on the Funds. Redemption in-kind proceeds will typically be made by delivering a pro-rata amount of a Fund’s holdings that are readily marketable securities to the redeeming shareholder within seven days after the Fund’s receipt of the redemption order.
The Funds and their service providers may temporarily hold redemption proceeds from accounts maintained directly with the Funds if there is a reasonable belief that financial exploitation of a Specified Adult has occurred, is occurring, has been attempted, or will be attempted. For purposes of this paragraph, the term “Specified Adult” refers to an individual who is (A) a natural person age 65 and older; or (B) a natural person age 18 and older who the member reasonably believes has a mental or physical impairment that renders the individual unable to protect his or her own interests.
Minimum Account Balance
Due to the relatively high cost associated with maintaining small accounts J.P. Morgan Funds has established minimum balance requirements for each Fund held in your accounts. Minimum investment amounts per Fund are described earlier within the Investing with J.P. Morgan Funds section of this prospectus. If a shareholder does not maintain the required minimum balance in each Fund, J.P. Morgan Funds may either 1) redeem all remaining shares in that Fund or 2) charge a $10 below minimum balance fee per Fund. To collect the fee, the Fund will redeem $10 worth of shares from your account. The Funds and/or the Distributor reserve the right to determine whether we redeem all remaining shares and close your account or charge the annual below minimum account fee. You will not be charged a CDSC, if applicable, for these actions. Shareholders will receive written notice and be given 60 days to bring Fund balances above minimum requirements before action is taken on your account.
If your account is below the minimum balance, you are participating in a systematic investment plan, and you are not actively selling shares, it will be excluded from the minimum balance requirements as long as the systematic payments will increase your Fund value above the required minimum balance within 18 months of the date that the account was established. Once the required minimum account balance is reached, you must maintain the minimum investment amount in that Fund.
Investors in Class A or Class C Shares, employees investing in Class I Shares, as well as investors in the Premier and Morgan share classes of the J.P. Morgan Money Market Funds cannot combine investments for purposes of meeting the minimum.
Certain Financial Intermediaries or other organizations making the J.P. Morgan Funds available to their clients or customers impose minimum account balances that may be different than the requirements for investors purchasing directly from the Funds. If a shareholder purchases shares through such an intermediary and does not maintain the required minimum balance imposed by that intermediary, the intermediary may redeem the investor’s shares or impose a fee consistent with the terms of the investment arrangement with the investor. Please contact your intermediary for more information.
Closings, Reorganizations and Liquidations
To the extent authorized by law, each Fund reserves the right to discontinue offering shares at any time, to merge or reorganize itself or a share class, or to cease operations and liquidate at any time.
84 | J.P. Morgan Municipal Bond Funds
Frequent Trading Policy
J.P. Morgan Funds do not authorize market timing and, except for the Funds identified below, use reasonable methods to identify market timers and to prevent such activity. However, there can be no assurance that these methods will prevent market timing or other trading that may be deemed abusive. Market timing is an investment strategy using frequent purchases, redemptions and/or exchanges in an attempt to profit from short-term market movements. Market timing may result in dilution of the value of Fund shares held by long-term shareholders, disrupt portfolio management and increase Fund expenses for all shareholders. Although market timing may affect any Fund, these risks may be higher for Funds that invest significantly in non-U.S. securities or thinly traded securities (e.g., certain small cap securities), such as international, global or emerging market funds or small cap funds. For example, when a Fund invests in securities trading principally in non-U.S. markets that close prior to the close of the NYSE, market timers may seek to take advantage of the difference between the prices of these securities at the close of their non-U.S. markets and the value of such securities when the Fund calculates its net asset value.
J.P. Morgan Funds or the Distributor will prohibit any purchase order (including exchanges) with respect to one investor, a related group of investors or their agent(s) where they detect a pattern of either purchases and sales of one of the J.P. Morgan Funds, or exchanges between or among J.P. Morgan Funds, that indicates market timing or trading that they determine is abusive.
Although J.P. Morgan Funds use a variety of methods to detect and deter market timing, there is no assurance that the Funds’ own operational systems and procedures will identify and eliminate all market timing strategies. For example, certain accounts, which are known as omnibus accounts, include multiple investors and such accounts typically provide the Funds with a net purchase or redemption order on any given day where purchasers of Fund shares and redeemers of Fund shares are netted against one another and the identity of individual purchasers and redeemers are not known by the Funds. While the Funds seek to monitor for market timing activities in omnibus accounts, the netting effect limits the Funds’ ability to locate and eliminate individual market timers. As a result, the Funds are often dependent upon Financial Intermediaries who utilize their own policies and procedures to identify market timers. These policies and procedures may be different than those utilized by the Funds.
The Boards of J.P. Morgan Funds have adopted various policies and procedures to identify market timers, including reviewing “round trips” in and out of J.P. Morgan Funds by investors. A “round trip” includes a purchase or exchange into a Fund followed or preceded by a redemption or exchange out of the same Fund. If the Distributor detects that you have completed two round trips within 60 days in the same Fund, the Distributor will reject your purchase and exchange orders for a period of at least 90 days. For subsequent violations, the Distributor may, in its sole discretion, reject your purchase and exchange orders temporarily or permanently. In identifying market timers, the Distributor may also consider activity of accounts that it believes to be under common ownership or control.
J.P. Morgan Funds have attempted to put safeguards in place to assure that Financial Intermediaries have implemented procedures designed to deter market timing and abusive trading. Despite these safeguards, there is no assurance that the Funds will be able to effectively identify and eliminate market timing and abusive trading in the Funds particularly with respect to omnibus accounts.
J.P. Morgan Funds will seek to apply the Funds’ market timing policies and restrictions as uniformly as practicable to accounts with the Funds, except with respect to the following:
1.
Trades that occur through omnibus accounts at Financial Intermediaries as described above;
2.
Purchases, redemptions and exchanges made on a systematic basis;
3.
Automatic reinvestments of dividends and distributions;
4.
Purchases, redemptions or exchanges that are part of a rebalancing program, such as a wrap, advisory or bona fide asset allocation program, which includes investment models developed and maintained by a financial intermediary;
5.
Redemptions of shares to pay fund or account fees;
6.
Transactions initiated by the trustee or adviser to a donor-advised charitable gift fund;
7.
Transactions in Section 529 college savings plans;
8.
Transactions in Fund of Fund Products; and
9.
Transactions within a Retirement account such as:
•
Shares redeemed to return an excess contribution;
•
Transactions initiated by sponsors of group employee benefit plans or other related accounts;
•
Retirement plan contributions, loans, distributions, and hardship withdrawals;
July 1, 2022 | 85
Investing with J.P. Morgan Funds (continued)
•
IRA re-characterizations and conversions; and
•
IRA purchases of shares by asset transfer or direct rollover.
In addition to rejecting purchases in connection with suspected market timing activities, the Distributor can reject a purchase (including purchases for the Funds listed below) for any reason, including purchases that it does not think are in the best interests of a Fund and/or its shareholders or if it determines the trading to be abusive. Your Financial Intermediary may also have additional procedures for identifying market timers and rejecting or otherwise restricting purchases and/or exchanges.
Certain J.P. Morgan Funds are intended for short-term investment horizons and do not monitor for market timers or prohibit such short-term trading activity. Those Funds are the JPMorgan Short Duration Bond Fund, JPMorgan Short Duration Core Plus Fund, JPMorgan Short-Intermediate Municipal Bond Fund, JPMorgan Limited Duration Bond Fund, JPMorgan Managed Income Fund, JPMorgan Ultra-Short Municipal Fund and the J.P. Morgan Money Market Funds. Although these Funds are managed in a manner that is consistent with their investment objectives, frequent trading by shareholders may disrupt their management and increase their expenses.
Valuation
Shares are purchased at NAV per share, plus a sales charge, if any. This is also known as the offering price. Shares are also redeemed at NAV, minus any applicable CDSC. The NAV of each class within a Fund varies, primarily because each class has different class-specific expenses such as distribution and service fees.
The NAV per share of a class of a Fund is equal to the value of all the assets attributable to that class, minus the liabilities attributable to that class, divided by the number of outstanding shares of that class. The following is a summary of the procedures generally used to value J.P. Morgan Funds’ investments.
Securities for which market quotations are readily available are generally valued at their current market value. Other securities and assets, including securities for which market quotations are not readily available; market quotations are determined not to be reliable; or, their value has been materially affected by events occurring after the close of trading on the exchange or market on which the security is principally traded but before a Fund’s NAV is calculated, may be valued at fair value in accordance with policies and procedures adopted by the J.P. Morgan Funds’ Board of Trustees. Fair value represents a good faith determination of the value of a security or other asset based upon specifically applied procedures. Fair valuation may require subjective determinations. There can be no assurance that the fair value of an asset is the price at which the asset could have been sold during the period in which the particular fair value was used in determining a Fund’s NAV.
Equity securities listed on a North American, Central American, South American or Caribbean securities exchange are generally valued at the last sale price on the exchange on which the security is principally traded. Other foreign equity securities are fair valued using quotations from an independent pricing service, as applicable. The value of securities listed on the NASDAQ Stock Market, Inc. is generally the NASDAQ official closing price.
Fixed income securities are valued using prices supplied by an approved independent third party or affiliated pricing services or broker/dealers. Those prices are determined using a variety of inputs and factors as more fully described in the Statement of Additional Information.
Assets and liabilities initially expressed in foreign currencies are converted into U.S. dollars at the prevailing market rates from an approved independent pricing service as of 4:00 p.m. ET.
Shares of ETFs are generally valued at the last sale price on the exchange on which the ETF is principally traded. Shares of open-end investment companies are valued at their respective NAVs.
Options traded on U.S. securities exchanges are valued at the composite mean price, using the National Best Bid and Offer quotes.
Options traded on foreign exchanges are valued at the settled price, or if no settled price is available, at the last sale price available prior to the calculation of a Fund’s NAV and will be fair valued by applying fair value factors provided by independent pricing services, as applicable, for any options involving equity reference obligations listed on exchanges other than North American, Central American, South American or Caribbean securities exchanges.
Exchange traded futures are valued at the last sale price available prior to the calculation of a Fund’s NAV. Any futures involving equity reference obligations listed on exchanges other than North American, Central American, South American or Caribbean securities exchanges will be fair valued by applying fair value factors provided by independent pricing services, as applicable.
Non-listed over-the-counter options and futures are valued utilizing market quotations provided by approved pricing services.
Swaps and structured notes are priced generally by an approved independent third party or affiliated pricing service or at an evaluated price provided by a counterparty or broker/dealer.
86 | J.P. Morgan Municipal Bond Funds
Any derivatives involving equity reference obligations listed on exchanges other than North American, Central American, South American or Caribbean securities exchanges will be fair valued by applying fair value factors provided by independent pricing services, as applicable.
NAV is calculated each business day as of the close of the NYSE, which is typically 4:00 p.m. ET. On occasion, the NYSE will close before 4:00 p.m. ET. When that happens, NAV will be calculated as of the time the NYSE closes. The Funds will not treat an intraday unscheduled disruption or closure in NYSE trading as a closure of the NYSE and will calculate NAV as of 4:00 p.m. ET, if the particular disruption or closure directly affects only the NYSE. The price at which a purchase is effected is based on the next calculation of NAV after the order is received in proper form in accordance with this prospectus. To the extent a Fund invests in securities that are primarily listed on foreign exchanges or other markets that trade on weekends or other days when a Fund does not price its shares, the value of a Fund’s shares may change on days when you will not be able to purchase or redeem your shares.
Distributions and Taxes
Each Fund has elected to be treated and intends to qualify each taxable year as a regulated investment company. A regulated investment company is not subject to tax at the corporate level on income and gains from investments that are distributed to shareholders. Each Fund’s failure to qualify as a regulated investment company would result in corporate-level taxation and, consequently, a reduction in income available for distribution to shareholders.
Each Fund can earn income and realize capital gain. Each Fund deducts any expenses and then pays out the earnings, if any, to shareholders as distributions.
Each Fund generally distributes net investment income, if any, at least on a monthly basis. The Funds will distribute net realized capital gains, if any, at least annually. For each taxable year, each Fund will distribute substantially all of its net investment income and net realized capital gains.
You have the following options for your distributions. You may:
•
Reinvest all distributions in additional Fund shares;
•
Take distributions of net investment income in cash and reinvest distributions of net capital gain in additional shares;
•
Take distributions of net capital gain in cash and reinvest distributions of net investment income; or
•
Take all distributions in cash.
If you do not select an option when you open your account, we will reinvest all distributions. If your distributions are reinvested, they will be in the form of shares of the same class without a sales charge. If you take your distributions in cash, you can choose to have a check mailed to your address of record or you can have them deposited into a pre-assigned bank account. The taxation of the dividends will not be affected whether you have them deposited into a bank account or sent by check.
If, at the close of each quarter of its taxable year, at least 50% of the value of a Fund’s total assets consists of tax-exempt interest obligations, the Fund will be eligible to designate distributions of interest derived from tax-exempt-interest obligations as “exempt interest dividends.” As described in the section entitled “What are the Fund’s main investment strategies?” for each Fund, the Funds invest primarily in various types of municipal bonds, the interest on which is exempt from federal income tax. Distributions that are properly reported as exempt-interest dividends generally are not subject to federal income tax but may be subject to state and local taxes and, in certain instances, may result in liability for the federal alternative minimum tax, both for individual and corporate shareholders. You should consult your tax advisor concerning your own tax situation.
Shares of the Funds may not be suitable for tax-exempt investors since such investors are generally tax exempt and, therefore, would not gain any additional benefit from the Funds' dividends being tax exempt.
Shareholders who receive social security or railroad retirement benefits should also consult their tax advisors to determine what effect, if any, an investment in any of the Funds may have on the federal taxation of their benefits. Exempt-interest dividends generally are included in income for purposes of determining the amount of benefits that are taxable.
The Funds may invest a portion of their assets in securities that generate income subject to federal, state, and/or local taxes. For Federal income tax purposes, distributions of net investment income that are not properly reported as exempt-interest dividends generally are taxable as ordinary income from dividends. Dividends of net investment income paid to a non-corporate U.S. shareholder that are properly reported as qualified dividend income generally will be taxable to such shareholder at preferential rates. The maximum individual federal income tax rate applicable to “qualified dividend income” is either 15% or 20%, depending on whether the individual’s income exceeds certain threshold amounts. The amount of dividend income that may be so reported by a Fund generally will be limited to the aggregate of the eligible dividends received by each Fund. In addition, a Fund must meet certain holding period and other requirements with respect to the shares on which the Fund received the eligible dividends, and the non-corporate U.S. shareholder must meet certain holding period and other requirements with respect to the Fund. The amount of a
July 1, 2022 | 87
Investing with J.P. Morgan Funds (continued)
Fund’s distributions that would otherwise qualify for this favorable tax treatment may be reduced as a result of the Fund’s securities lending activities or high portfolio turnover rate. Dividends of net investment income that are not reported as either qualified dividend income or exempt-interest dividend income and dividends of net short-term capital gain will be taxable to a U.S. shareholder as ordinary income. It is unlikely that dividends from any of the Funds will qualify to a significant extent for designation as qualified dividend income.
Distributions of net capital gain (that is, the excess of the net gains from the sale of investments that a Fund owned for more than one year over the net losses from investments that the Fund owned for one year or less) that are properly reported by a Fund as capital gain dividends will be taxable as long-term capital gain, regardless of how long you have held your shares in the Fund. The maximum individual federal income tax rate applicable to long-term capital gains is generally either 15% or 20%, depending on whether the individual’s income exceeds certain threshold amounts. Distributions of net short-term capital gain (that is, the excess of any net short-term capital gain over net long-term capital loss), if any, will be taxable to U.S. shareholders as ordinary income. Capital gain of a corporate shareholder is taxed at the same rate as ordinary income.
An additional 3.8% Medicare tax is imposed on certain net investment income (including ordinary dividends and capital gain distributions received from a Fund and net gains from redemptions or other taxable dispositions of Fund shares, but excluding any exempt-interest dividends received from a Fund) of U.S. individuals, estates and trusts to the extent that such person’s “modified adjusted gross income” (in the case of an individual) or “adjusted gross income” (in the case of an estate or trust) exceeds certain threshold amounts.
If you buy shares of a Fund just before a distribution, you will be subject to tax on the entire amount of the taxable distribution you receive. Distributions are taxable to you even if they are paid from income or gains earned by a Fund before your investment (and thus were included in the price you paid for your Fund shares). Any gain resulting from the sale or exchange of Fund shares generally will be taxable as long-term or short-term gain, depending upon how long you have held your shares.
A Fund’s investments in certain debt obligations, mortgage-backed and asset-backed securities, and derivative instruments may require the Fund to accrue and distribute income not yet received. In order to generate sufficient cash to make the requisite distributions, a Fund may be required to liquidate other investments in its portfolio that it otherwise would have continued to hold, including at times when it is not advantageous to do so.
A Fund’s transactions in futures contracts, short sales, swaps and other derivatives will be subject to special tax rules, the effect of which may be to accelerate income to the Fund, defer losses to the Fund, cause adjustments in the holding periods of the Fund’s securities, and convert short-term capital losses into long-term capital losses. These rules could therefore affect the amount, timing and character of distributions to shareholders. A Fund’s use of these types of transactions may result in the Fund realizing more short-term capital gain and ordinary income subject to tax at ordinary income tax rates than it would if it did not engage in such transactions.
Investors should consult their advisers about state and local tax consequences of the investment in the Funds. The information below is only a general summary based on current statutes and regulations as well as current policies of each state, all of which may change possibly with retroactive effect.
California Taxes. California personal income tax law provides that dividends paid by a regulated investment company, or series thereof, are excludable from gross income if (1) at the close of each quarter of such company’s taxable year, at least 50% of the value of its total assets consists of obligations the interest from which would be exempt from California taxation if such obligations were held by an individual and (2) if such dividends are reported by the Fund as exempt interest dividends in written statements furnished to shareholders. Under California law, exempt-interest dividends (including some dividends paid after the close of the year as described in Section 855 of the Internal Revenue Code) may not exceed the excess of (A) the amount of interest received by the Fund which would be tax-exempt interest if the obligations on which the interest was paid were held by an individual over (B) the amount that would be considered expenses related to exempt income and thus would not be deductible under California personal income tax law. Distributions to individual shareholders derived from items other than exempt-interest described above will be subject to California personal income tax. In addition, corporate shareholders should note that dividends will not be exempt from California corporate franchise tax and may not be exempt from California corporate income tax. California has an alternative minimum tax (“AMT”) similar to the federal AMT. However, the California AMT does not include interest from private activity municipal obligations as an item of tax preference. Interest on indebtedness incurred or continued by a shareholder in connection with the purchase of shares of a Fund will generally not be deductible for California personal income tax purposes.
New York Taxes. Dividends paid by the New York Tax Free Bond Fund that are derived from interest attributable to obligations of the State of New York or its political subdivisions or certain other governmental entities (for example, the Commonwealth of Puerto Rico or the U.S. Virgin Islands), the interest on which was excludable from gross income for purposes of both federal income taxation and New York State and City personal income taxation (“New York Tax-Exempt Bonds”) and designated as such, generally are exempt from New York State and New York City personal income tax as well as from the New York City unincorporated business tax (but not
88 | J.P. Morgan Municipal Bond Funds
the New York State corporation franchise tax or New York City general corporation tax), provided that such dividends constitute exempt-interest dividends under Section 852(b)(5) of the Internal Revenue Code. Dividends and other distributions (aside from exempt-interest dividends derived from New York Tax-Exempt Bonds) generally are not exempt from New York State and City taxes. For New York State and City tax purposes, distributions of net long-term capital gain will be taxable at the same rates as ordinary income. Distributions by the Fund from investment income and capital gain, including exempt -interest dividends, also generally are included in a corporation’s net investment income for purposes of calculating such corporation’s obligations under the New York State corporate franchise tax and the New York City general corporation tax, if received by a corporation subject to those taxes, and will be subject to such taxes to the extent that a corporation’s net investment income is allocated to New York State and/or New York City. To the extent that investors are subject to state and local taxes outside of New York State, all dividends paid by the Fund may be taxable income for purposes thereof. To the extent that the Fund’s dividends are derived from interest attributable to the obligations of any other state or of a political subdivision of any such other state or are derived from capital gains, such dividends will generally not be exempt from New York State or New York City tax. The New York minimum tax for individuals, which excluded tax-exempt interest as an item of tax preference, has been eliminated for tax years beginning on or after January 1, 2014. Interest incurred to buy or carry shares of the Fund generally is not deductible for federal, New York State or New York City personal income tax purposes.
Please see the Statement of Additional Information for additional discussion of the tax consequences of the above-described and other investments to each Fund and its shareholders.
The dates on which net investment income and capital gain dividends, if any, will be distributed are available online at www.jpmorganfunds.com.
Early in each calendar year, each Fund will send you a notice showing the amount of distributions you received during the preceding calendar year and the tax status of those distributions.
The Funds are not intended for foreign shareholders. Any foreign shareholders would generally be subject to U.S. tax-withholding on distributions by the Funds, as discussed in the Statement of Additional Information.
Distributions by a Fund to retirement plans and other entities that qualify for tax-exempt or tax-deferred treatment under federal income tax laws will generally not be taxable. Special tax rules apply to investments through such plans. The tax considerations described in this section do not apply to such tax-exempt or tax-deferred entities or accounts. You should consult your tax advisor to determine the suitability of a Fund as an investment and the tax treatment of distributions.
Any investor for whom a Fund does not have a valid Taxpayer Identification Number may be subject to backup withholding.
The above is a general summary of tax implications of investing in the Funds. Because each investor’s tax consequences are unique, please consult your tax advisor to see how investing in a Fund and, for individuals and S corporations, selection of a particular cost method of accounting will affect your own tax situation.
IMPORTANT TAX REPORTING CONSIDERATIONS
Your Financial Intermediary or the Fund (if you hold your shares in the Fund direct account) will report gains and losses realized on redemptions of shares for shareholders who are individuals and S corporations purchased after January 1, 2012 to the Internal Revenue Service (IRS). This information will also be reported to you on Form 1099-B and the IRS each year. In calculating the gain or loss on redemptions of shares, the average cost method will be used to determine the cost basis of Fund shares purchased after January 1, 2012 unless you instruct the Fund in writing at J.P. Morgan Funds Services, P.O. Box 219143, Kansas City, MO 64121-9143 that you want to use another available method for cost basis reporting (for example, First In, First Out (FIFO), Last In, First Out (LIFO), Specific Lot Identification (SLID) or High Cost, First Out (HIFO)). If you designate SLID as your cost basis method, you will also need to designate a secondary cost basis method (Secondary Method). If a Secondary Method is not provided, the Fund will designate FIFO as the Secondary Method and will use the Secondary Method with respect to systematic redemptions.
Not all cost basis methods are available. Please contact the Fund at J.P. Morgan Funds Services, P.O. Box 219143, Kansas City, MO 64121-9143 for more information on the available methods for cost basis reporting. To determine which available cost basis method is best for you, you should consult with your tax advisor. Please note that you will be responsible for calculating and reporting gains and losses on redemptions of shares purchased prior to January 1, 2012 to the IRS as such information will not be reported by the Fund and may not be maintained by your Financial Intermediary.
Your Financial Intermediary or the Fund (if you hold your shares in the Fund direct account) is also required to report gains and losses to the IRS in connection with redemptions of shares by S corporations. If a shareholder is a corporation and has not instructed the Fund that it is a C corporation in its account application or by written instruction to J.P. Morgan Funds Services, P.O. Box 219143, Kansas City, MO 64121-9143, the Fund will treat the shareholder as an S corporation and file a Form 1099-B.
July 1, 2022 | 89
Investing with J.P. Morgan Funds (continued)
Shareholder Statements and Reports
The J.P. Morgan Funds or your Financial Intermediary will send you transaction confirmation statements and quarterly account statements. Please review these statements carefully. The Funds will correct errors if notified within one year of the date printed on the transaction confirmation or account statement. Your Financial Intermediary may have a different cut-off time. J.P. Morgan Funds will charge a fee for requests for statements that are older than two years. Please retain all of your statements, as they could be needed for tax purposes.
To reduce expenses and conserve natural resources, the J.P. Morgan Funds will deliver a single copy of prospectuses and financial reports to individual investors who share a residential address, provided they have the same last name or the J.P. Morgan Funds reasonably believe they are members of the same family. If you would like to receive separate mailings, please call 1-800-480-4111 and the Fund will begin individual delivery within 30 days. If you would like to receive these documents by e-mail, please visit www.jpmorganfunds.com and sign up for electronic delivery.
If you hold your Fund shares directly, you may access your account statements at www.jpmorganfunds.com.
After each fiscal half year you will receive a financial report from the Funds. In addition, the Funds will periodically send you proxy statements and other reports.
If you have any questions or need additional information, please write to J.P. Morgan Funds Services at P.O. Box 219143, Kansas City, MO 64121-9143, call 1-800-480-4111 or visit www.jpmorganfunds.com.
Availability of Proxy Voting Record
The Trustees for each Fund have delegated the authority to vote proxies for securities owned by the Funds to the Funds' adviser. A copy of each Fund’s voting record for the most recent 12-month period ended June 30 is available on the SEC’s website at www.sec.gov or on J.P. Morgan Funds’ website at www.jpmorganfunds.com no later than August 31 of each year. Each Fund’s proxy voting record will include, among other things, a brief description of the matter voted on for each portfolio security, and will state how each vote was cast, for example, for or against the proposal.
Portfolio Holdings Disclosure
No sooner than three calendar days after the end of each month, each Fund will make available upon request the uncertified, complete schedule of its portfolio holdings as of the last day of that month.
Not later than 60 days after the end of each fiscal quarter, each Fund will make available upon request a complete schedule of its portfolio holdings as of the last day of that quarter.
Each Fund will post these quarterly schedules on the J.P. Morgan Funds’ website at www.jpmorganfunds.com and on the SEC’s website at www.sec.gov.
The Funds may disclose a Fund’s 10 largest portfolio holdings and the percentage that each of these 10 holdings represent of the Fund’s portfolio as of the most recent month’s end, online at www.jpmorganfunds.com, no sooner than 10 calendar days after month’s end.
Shareholders may request portfolio holdings schedules at no charge by calling 1-800-480-4111. A description of each Fund’s policies and procedures with respect to the disclosure of a Fund’s portfolio holdings is available in the Statement of Additional Information.
90 | J.P. Morgan Municipal Bond Funds
Glossary of Common Investment Terminology
For the purpose of the “INVESTING WITH J.P. MORGAN FUNDS” section, references to “account” and “Fund” are not interchangeable. Fund refers to an individual mutual fund position. An account may be invested in a single Fund or multiple Funds.
Breakpoints — Differences in sales charges that are assessed based on the amount of purchases. The larger the investment, the lower the sales charge.
Capital Gains Distribution — Payment to mutual fund shareholders of gains realized on securities that a Fund has sold at a profit, minus any realized losses.
Contingent Deferred Sales Charge (CDSC) — A back-end sales charge imposed when shares are redeemed from a Fund. This fee usually declines over time.
Dividend Distribution — Payment to mutual fund shareholders of income from interest or dividends generated by a Fund’s investments.
Financial Intermediaries — Include financial advisors, investment advisers, brokers, financial planners, banks, insurance companies, retirement or 401(k) plan administrators and others, including various affiliates of JPMorgan Chase, that have entered into agreements with the Distributor and/or shareholder servicing agent. Shares purchased this way will typically be held for you by the Financial Intermediary.
Group Retirement Plans — Refers to employer-sponsored retirement, deferred compensation and employee benefit plans (including health savings accounts) and trusts used to fund those plans. To satisfy eligibility requirements, the plan must be a group plan (more than one participant), the shares cannot be held in a commission-based brokerage account and
•
Shares must be held at a plan level or
•
Shares must be held at the Fund level through an omnibus account of a retirement plan recordkeeper.
Group Retirement Plans include group employer-sponsored 401(k) plans, 457 plans, employer-sponsored 403(b) plans, profit-sharing and money purchase pension plans, defined benefit plans, retiree health benefit plans, group annuity separate accounts offered to retirement plans and non-qualified deferred compensation plans. Group Retirement Plans do not include traditional IRAs, Roth IRAs, Coverdell Education Savings Accounts, SEPs, SARSEPs, SIMPLE IRAs, KEOGHs, individual 401(k) or individual 403(b) plans.
Institutional Investors — Include fee-based “wrap” account sponsors (provided they have an agreement covering the arrangement with the Distributor), corporations, qualified nonprofit organizations, charitable trusts, foundations and endowments, state, county, city or any instrumentality, department, authority or agency thereof, and banks, trust companies or other depository institutions investing for their own account or on behalf of their clients.
Letter of Intent (LOI) — A Letter of Intent is signed by an investor stating the investor’s intention to buy a specified amount over a period of 13 months in order to receive a reduced front-end sales charge. Each purchase the investor makes during the 13 month period will receive the sales charge and breakpoint discount that applies to the total amount specified in the Letter of Intent. If the amount is not met within the 13 month period, the investor must pay the Distributor the difference between the sales charges applicable to the purchases at the time they were made and the reduced sales charges previously paid. A Letter of Intent shall be based on the sales charge and breakpoint schedules in effect when the initial shares were purchased.
Medallion Signature Guarantee — A special stamp used to verify the authenticity of certain documents. It is a guarantee by a financial institution that the signature is genuine and the financial institution accepts liability for any forgery. Medallion signature guarantees protect shareholders by preventing unauthorized transfer of assets that could result in monetary losses to the investor due to fraud. Medallion guarantee stamps can be obtained at many bank branches or brokerage firms.
Required Minimum Distribution (RMD) — Refers to the annual amounts that must be withdrawn from pre-tax retirement accounts (such as Traditional, SEP, and SIMPLE IRAs) in or after the year the shareholder reaches the qualified age based on applicable IRS regulations.
Rights of Accumulation (ROA) — When utilizing “rights of accumulation,” the investor can combine the current market value of any existing qualifying holdings and account types with the amount of the current purchase to qualify for a breakpoint and reduced front-end sales charge on the current purchase. Rights of Accumulation shall be based on the sales charge and breakpoint schedules in effect when the initial shares were purchased.
Uncollected Shares — Shares purchased directly through J.P. Morgan Funds Services by check or through an ACH transaction are not available for redemption for up to five business days following the acceptance of a purchase order unless you provide satisfactory proof that your purchase check or ACH transaction has cleared.
Wire or ACH — Refers to the method used for payment or redemptions. Movement of money by wire is typically faster than money sent by ACH (Automated Clearing House). While J.P. Morgan Funds does not charge for either method, your bank may charge a fee for these services.
July 1, 2022 | 91
Investment Practices
The table discusses the types of investments which can be held by the Funds. In each case, the related types of risk are also listed.
| FUND NAME |
FUND CODE |
| JPMorgan Sustainable Municipal Income Fund |
1 |
| JPMorgan Short-Intermediate Municipal Bond Fund |
2 |
| JPMorgan Tax Free Bond Fund |
3 |
| JPMorgan Ultra-Short Municipal Fund |
4 |
| JPMorgan California Tax Free Bond Fund |
5 |
| JPMorgan High Yield Municipal Fund |
6 |
| JPMorgan Intermediate Tax Free Bond Fund |
7 |
| JPMorgan New York Tax Free Bond Fund |
8 |
| INSTRUMENT |
FUND CODE |
RISK TYPE |
| Adjustable Rate Mortgage Loans (ARMs): Loans in a mortgage pool which provide for a fixed initial mortgage interest rate for a specified period of time, after which the rate may be subject to periodic adjustments. |
2, 6 |
Credit Interest Rate Liquidity Market Political Prepayment Valuation |
| Asset-Backed Securities: Securities secured by company receivables, home equity loans, truck and auto loans, leases, and credit card receivables or other securities backed by other types of receivables or other assets. |
1–8 |
Credit Interest Rate Liquidity Market Political Prepayment Valuation |
| Auction Rate Securities: Auction rate municipal securities and auction rate preferred securities issued by closed-end investment companies. |
1–8 |
Credit Interest Rate Liquidity Market |
| Bank Obligations: Bankers’ acceptances, certificates of deposit and time deposits. Bankers’ acceptances are bills of exchange or time drafts drawn on and accepted by a commercial bank. Maturities are generally six months or less. Certificates of deposit are negotiable certificates issued by a bank for a specified period of time and earning a specified return. Time deposits are non-negotiable receipts issued by a bank in exchange for the deposit of funds. |
1–8 |
Credit Currency Interest Rate Liquidity Market Political |
| Borrowings: A Fund may borrow for temporary purposes and/or for investment purposes. Such a practice will result in leveraging of the Fund’s assets and may cause a Fund to liquidate portfolio positions when it would not be advantageous to do so. A Fund must maintain continuous asset coverage of 300% of the amount borrowed, with the exception for borrowings not in excess of 5% of the Fund’s total assets made for temporary administrative purposes. |
1–8 |
Credit Interest Rate Market |
| Call and Put Options: A call option gives the buyer the right to buy, and obligates the seller of the option to sell a security at a specified price at a future date. A put option gives the buyer the right to sell, and obligates the seller of the option to buy a security at a specified price at a future date. A Fund will sell only covered call and secured put options. |
1–8 |
Credit Leverage Liquidity Management Market |
92 | J.P. Morgan Municipal Bond Funds
| INSTRUMENT |
FUND CODE |
RISK TYPE |
| Commercial Paper: Secured and unsecured short-term promissory notes issued by corporations and other entities. Maturities generally vary from a few days to nine months. |
1–8 |
Credit Currency Interest Rate Liquidity Market Political Valuation |
| Common Stock Warrants and Rights: Securities, typically issued with preferred stock or bonds, that give the holder the right to buy a proportionate amount of common stock at a specified price. |
3 |
Credit Market |
| Corporate Debt Securities: May include bonds and other debt securities of domestic and foreign issuers, including obligations of industrial, utility, banking and other corporate issuers. |
1–8 |
Credit Currency Interest Rate Liquidity Market Political Prepayment Valuation |
| Credit Default Swaps (CDSs): A swap agreement between two parties pursuant to which one party pays the other a fixed periodic coupon for the specified life of the agreement. The other party makes no payment unless a credit event, relating to a predetermined reference asset, occurs. If such an event occurs, the party will then make a payment to the first party, and the swap will terminate. |
1–3, 5–8 |
Credit Currency Interest Rate Leverage Liquidity Management Market Political Valuation |
| Custodial Receipts: A Fund may acquire securities in the form of custodial receipts that evidence ownership of future interest payments, principal payments or both on certain U.S. Treasury notes or bonds in connection with programs sponsored by banks and brokerage firms. These are not considered to be U.S. government securities. These notes and bonds are held in custody by a bank on behalf of the owners of the receipts. |
1–3, 5–8 |
Credit Liquidity Market |
| Demand Features: Securities that are subject to puts and standby commitments to purchase the securities at a fixed price (usually with accrued interest) within a fixed period of time following demand by a Fund. |
1–8 |
Liquidity Management Market |
| Exchange-Traded Funds (ETFs): Ownership interest in unit investment trusts, depositary receipts, and other pooled investment vehicles that hold a portfolio of securities or stocks designed to track the price performance and dividend yield of a particular broad-based, sector or international index. ETFs include a wide range of investments. |
1–3, 5–8 |
Investment Company Market |
| Foreign Investments: Equity and debt securities (e.g., bonds and commercial paper) of foreign entities and obligations of foreign branches of U.S. banks and foreign banks. Foreign securities may also include American Depositary Receipts (ADRs), Global Depositary Receipts (GDRs), European Depositary Receipts (EDRs) and American Depositary Securities. |
6 |
Foreign Investment Liquidity Market Political Prepayment Valuation |
July 1, 2022 | 93
Investment Practices (continued)
| INSTRUMENT |
FUND CODE |
RISK TYPE |
| High Yield/High Risk Securities/Junk Bonds: Securities that are generally rated below investment grade by the primary rating agencies or are unrated but deemed by a Fund’s adviser to be of comparable quality. |
1-8 |
Credit Currency High Yield Securities Interest Rate Liquidity Market Political Portfolio Quality Valuation |
| Inflation-Linked Debt Securities: Includes fixed and floating rate debt securities of varying maturities issued by the U.S. government as well as securities issued by other entities such as corporations, foreign governments and foreign issuers. |
4, 6 |
Credit Currency Interest Rate Political |
| Interfund Lending: Involves lending money and borrowing money for temporary purposes through a credit facility. |
1–8 |
Credit Interest Rate Market |
| Inverse Floating Rate Instruments: Leveraged variable debt instruments with interest rates that reset in the opposite direction from the market rate of interest to which the inverse floater is indexed. |
1–8 |
Credit Leverage Market |
| Investment Company Securities: Shares of other investment companies, including money market funds for which the adviser and/or its affiliates serve as investment adviser or administrator. The adviser will waive certain fees when investing in funds for which it serves as investment adviser, to the extent required by law or by contract. |
1–8 |
Investment Company Market |
| Loan Assignments and Participations: Assignments of, or participations in all or a portion of loans to corporations or to governments, including governments in less developed countries. |
1–3, 5–8 |
Credit Currency Extension Foreign Investment Interest Rate Liquidity Market Political Prepayment |
| Master Limited Partnerships: Limited partnerships that are publicly traded on a securities exchange. |
6 |
Market |
| Mortgages (Directly Held): Debt instruments secured by real property. |
6 |
Credit Environmental Extension Interest Rate Liquidity Market Natural Event Political Prepayment Valuation |
94 | J.P. Morgan Municipal Bond Funds
| INSTRUMENT |
FUND CODE |
RISK TYPE |
| Mortgage-Backed Securities: Debt obligations secured by real estate loans and pools of loans such as collateralized mortgage obligations (CMOs), commercial mortgage-backed securities (CMBSs) and other asset-backed structures. |
1–8 |
Credit Currency Extension Interest Rate Leverage Liquidity Market Political Prepayment Tax Valuation |
| Mortgage Dollar Rolls1 : A transaction in which the Fund sells securities for delivery in a current month and simultaneously contracts with the same party to repurchase similar but not identical securities on a specified future date. |
2, 6 |
Currency Extension Interest Rate Leverage Liquidity Market Political Prepayment |
| Municipal Securities: Securities issued by a state or political subdivision to obtain funds for various public purposes. Municipal securities include, among others, private activity bonds and industrial development bonds, as well as general obligation notes, tax anticipation notes, bond anticipation notes, revenue anticipation notes, other short-term tax-exempt obligations, municipal leases, obligations of municipal housing authorities and single family revenue bonds. |
1–8 |
Credit Interest Rate Market Natural Event Political Prepayment Tax Valuation |
| New Financial Products: New options and futures contracts and other financial products continue to be developed and the Fund may invest in such options, contracts and products. |
1–8 |
Credit Liquidity Management Market |
| Obligations of Supranational Agencies: Obligations which are chartered to promote economic development and are supported by various governments and governmental agencies. |
2 |
Credit Foreign Investment Liquidity Political Valuation |
| Options and Futures Transactions: A Fund may purchase and sell (a) exchange traded and over- the-counter put and call options on securities, indexes of securities and futures contracts on securities and indexes of securities, and (b) futures contracts on securities and indexes of securities. |
1–8 |
Credit Leverage Liquidity Management Market |
| Preferred Stock: A class of stock that generally pays a dividend at a specified rate and has preference over common stock in the payment of dividends and in liquidation. |
2, 6 |
Market |
| Private Placements, Restricted Securities and Other Unregistered Securities: Securities not registered under the Securities Act of 1933, such as privately placed commercial paper and Rule 144A securities. |
1–8 |
Liquidity Market Valuation |
1
All forms of borrowing (including mortgage dollar-rolls and reverse repurchase agreements) are limited in the aggregate and may not exceed 33 1∕3% of the Fund’s
total assets except as permitted by law.
July 1, 2022 | 95
Investment Practices (continued)
| INSTRUMENT |
FUND CODE |
RISK TYPE |
| Real Estate Investment Trusts (REITs): Pooled investment vehicles which invest primarily in income producing real estate or real estate related loans or interest. |
6 |
Credit Interest Rate Liquidity Management Market Political Prepayment Tax Valuation |
| Repurchase Agreements: The purchase of a security and the simultaneous commitment to return the security to the seller at an agreed upon price on an agreed upon date. This is treated as a loan. |
1–8 |
Credit Liquidity Market |
| Reverse Repurchase Agreements1: The sale of a security and the simultaneous commitment to buy the security back at an agreed upon price on an agreed upon date. This is treated as borrowing by a Fund. |
1, 4, 6 |
Credit Leverage Market |
| Securities Issued in Connection with Reorganizations and Corporate Restructurings: In connection with reorganizing or restructuring of an issuer, an issuer may issue common stock or other securities to holders of its debt securities. |
6 |
Market |
| Short Selling: A Fund sells a security it does not own in anticipation of a decline in the market value of the security. To complete the transaction, a Fund must borrow the security to make delivery to the buyer. A Fund is obligated to replace the security borrowed by purchasing it subsequently at the market price at the time of replacement. |
6 |
Credit Liquidity Market |
| Short-Term Funding Agreements: Agreements issued by banks and highly rated U.S. insurance companies such as Guaranteed Investment Contracts (GICs) and Bank Investment Contracts (BICs). |
1–8 |
Credit Liquidity Market |
| Sovereign Obligations: Investments in debt obligations issued or guaranteed by a foreign sovereign government or its agencies, authorities or political subdivisions. |
2, 6 |
Credit Foreign Investment Liquidity Political Valuation |
| Stripped Mortgage-Backed Securities: Derivative multi-class mortgage securities which are usually structured with two classes of shares that receive different proportions of the interest and principal from a pool of mortgage assets. These include Interest Only (IO) and Principal Only (PO) securities issued outside a Real Estate Mortgage Investment Conduit (REMIC) or CMO structure. |
1–3, 5–8 |
Credit Liquidity Market Political Prepayment Valuation |
| Structured Investments: A security having a return tied to an underlying index or other security or asset class. Structured investments generally are individually negotiated agreements and may be traded over-the-counter. Structured investments are organized and operated to restructure the investment characteristics of the underlying security. |
1–8 |
Credit Foreign Investment Liquidity Management Market Valuation |
1
All forms of borrowing (including mortgage dollar-rolls and reverse repurchase agreements) are limited in the aggregate and may not exceed 33 1∕3% of the Fund’s
total assets except as permitted by law.
96 | J.P. Morgan Municipal Bond Funds
| INSTRUMENT |
FUND CODE |
RISK TYPE |
| Swaps and Related Swap Products: Swaps involve an exchange of obligations by two parties. Caps and floors entitle a purchaser to a principal amount from the seller of the cap or floor to the extent that a specified index exceeds or falls below a predetermined interest rate or amount. A Fund may enter into these transactions to manage its exposure to changing interest rates and other factors. |
1–8 |
Credit Currency Interest Rate Leverage Liquidity Management Market Political Valuation |
| Synthetic Variable Rate Instruments: Instruments that generally involve the deposit of a long- term tax exempt bond in a custody or trust arrangement and the creation of a mechanism to adjust the long-term interest rate on the bond to a variable short-term rate and a right (subject to certain conditions) on the part of the purchaser to tender it periodically to a third party at par. |
1–8 |
Credit Liquidity Market |
| Temporary Defensive Positions: To respond to unusual circumstances a Fund may invest in cash and cash equivalents for temporary defensive purposes. |
1–8 |
Credit Interest Rate Liquidity Market |
| Treasury Receipts: A Fund may purchase interests in separately traded interest and principal component parts of U.S. Treasury obligations that are issued by banks or brokerage firms and that are created by depositing U.S. Treasury notes and U.S. Treasury bonds into a special account at a custodian bank. Receipts include Treasury Receipts (TRs), Treasury Investment Growth Receipts (TIGRs) and Certificates of Accrual on Treasury Securities (CATS). |
1–8 |
Market |
| Trust Preferreds: Securities with characteristics of both subordinated debt and preferred stock. Trust preferreds are generally long term securities that make periodic fixed or variable interest payments. |
6 |
Credit Currency Interest Rate Liquidity Market Political Valuation |
| U.S. Government Agency Securities: Securities issued or guaranteed by agencies and instrumentalities of the U.S. government. These include all types of securities issued by the Government National Mortgage Association (Ginnie Mae), the Federal National Mortgage Association (Fannie Mae) and the Federal Home Loan Mortgage Corporation (Freddie Mac), including funding notes, subordinated benchmark notes, CMOs and Real Estate Mortgage Investment Conduits (REMICs). |
1–8 |
Credit Government Securities Interest Rate Market |
| U.S. Government Obligations: May include direct obligations of the U.S. Treasury, including Treasury bills, notes and bonds, all of which are backed as to principal and interest payments by the full faith and credit of the United States, and separately traded principal and interest component parts of such obligations that are transferable through the Federal book-entry system known as Separate Trading of Registered Interest and Principal of Securities (STRIPS) and Coupons Under Book Entry Safekeeping (CUBES). |
1–8 |
Interest Rate Market |
| Variable and Floating Rate Instruments: Obligations with interest rates which are reset daily, weekly, quarterly or some other frequency and which may be payable to a Fund on demand or at the expiration of a specified term. |
1–8 |
Credit Liquidity Market Valuation |
| When-Issued Securities,Delayed Delivery Securities and Forward Commitments: Purchase or contract to purchase securities at a fixed price for delivery at a future date. |
1–8 |
Credit Leverage Liquidity Market Valuation |
July 1, 2022 | 97
Investment Practices (continued)
| INSTRUMENT |
FUND CODE |
RISK TYPE |
| Zero-Coupon, Pay-in-Kind and Deferred Payment Securities: Zero-coupon securities are securities that are sold at a discount to par value and on which interest payments are not made during the life of the security. Pay-in-kind securities are securities that have interest payable by delivery of additional securities. Deferred payment securities are zero-coupon debt securities which convert on a specified date to interest bearing debt securities. |
1–8 |
Credit Currency Interest Rate Liquidity Market Political Valuation Zero-Coupon Bond |
Risk related to certain investments held by the Funds:
Credit risk The risk that a financial obligation will not be met by the issuer of a security or the counterparty to a contract, resulting in a loss to the purchaser.
Currency risk The risk that currency exchange rate fluctuations may reduce gains or increase losses on foreign investments.
Environmental risk The risk that an owner or operator of real estate may be liable for the costs associated with hazardous or toxic substances located on the property.
Extension risk The risk that a rise in interest rates will extend the life of a mortgage-backed security to a date later than the anticipated prepayment date, causing the value of the investment to fall.
Foreign investment risk The risk associated with higher transaction costs, delayed settlements, currency controls and adverse economic developments. This also includes the risk that fluctuations in the exchange rates between the U.S. dollar and foreign currencies may negatively affect an investment. Adverse changes in exchange rates may erode or reverse any gains produced by foreign currency denominated investments and may widen any losses. Exchange rate volatility also may affect the ability of an issuer to repay U.S. dollar denominated debt, thereby increasing credit risk.
Government securities risk U.S. government securities are subject to market risk, interest rate risk and credit risk. Securities, such as those issued or guaranteed by Ginnie Mae or the U.S. Treasury, that are backed by the full faith and credit of the United States are guaranteed only as to the timely payment of interest and principal when held to maturity and the market prices for such securities will fluctuate. Circumstances could arise that would prevent the payment of interest or principal. Securities issued or guaranteed by certain U.S. government-related organizations, such as Fannie Mae and Freddie Mac, are not backed by the full faith and credit of the U.S. government and no assurance can be given that the U.S. government will provide financial support.
High yield securities risk The risk that the Fund may invest in high yield, high risk securities (also known as junk bonds) which are considered to be speculative. These investments may be issued by companies which are highly leveraged, less creditworthy or financially distressed. Non-investment grade debt securities can be more sensitive to short-term corporate, economic and market developments. During periods of economic uncertainty and change, the market price of the Fund’s investments and the Fund’s net asset value may be volatile. Furthermore, though these investments generally provide a higher yield than higher-rated debt securities, the high degree of risk involved in these investments can result in substantial or total losses. These securities are subject to greater risk of loss, greater sensitivity to economic changes, valuation difficulties, and a potential lack of a secondary or public market for securities. The market price of these securities can change suddenly and unexpectedly.
Interest rate risk The risk that a change in interest rates will adversely affect the value of an investment. The value of fixed income securities generally moves in the opposite direction of interest rates (decreases when interest rates rise and increases when interest rates fall). A Fund may face a heightened level of interest rate risk due to certain changes in monetary policy, such as an interest rate increase by the Federal Reserve.
Investment company risk If a Fund invests in shares of another investment company, shareholders would bear not only their proportionate share of the Fund’s expenses, but also similar expenses of the investment company. The price movement of an investment company that is an ETF may not track the underlying index and may result in a loss.
Leverage risk The risk that gains or losses will be disproportionately higher than the amount invested.
Liquidity risk The risk that the holder may not be able to sell the security at the time or price it desires.
Management risk The risk that a strategy used by a Fund’s management may fail to produce the intended result. This includes the risk that changes in the value of a hedging instrument will not match those of the asset being hedged. Incomplete matching can result in unanticipated risks.
Market risk The risk that when the market as a whole declines, the value of a specific investment will decline proportionately. This systematic risk is common to all investments and the mutual funds that purchase them.
Natural event risk The risk that a natural disaster, such as a hurricane or similar event, will cause severe economic losses and default in payments by the issuer of the security.
Political risk The risk that governmental policies or other political actions will negatively impact the value of the investment.
Portfolio quality risk The risks associated with below investment grade securities including greater risk of default, greater sensitivity to interest rates and economic changes, potential valuation difficulties, and sudden and unexpected changes in credit quality.
Prepayment risk The risk that declining interest rates or other factors will result in unexpected prepayments, causing the value of the investment to fall.
Tax risk The risk that the issuer of the securities will fail to comply with certain requirements of the Internal Revenue Code, which could cause adverse tax consequences. Also the risk that the tax treatment of municipal or other securities could be changed by Congress thereby affecting the value of outstanding securities.
Valuation risk The risk that the estimated value of a security does not match the actual amount that can be realized if the security is sold.
Zero-Coupon Bond Risk The risk that the market value of a zero-coupon bond is generally more volatile than the market value of other fixed income securities with similar maturities that pay interest periodically. In addition, federal income tax law requires that the holder of a zero-coupon bond accrue a portion of the discount at which the bond was purchased as taxable income each year, even though the holder receives no interest payment on the bond during the year. A Fund must distribute substantially all of its net income (including non-cash income attributable to zero-coupon bonds) to its shareholders each year to maintain its status as a regulated investment company and to eliminate tax at the Fund level. Accordingly, such accrued discount must be taken into account in determining the amount of taxable distributions to shareholders. The Fund may consequently have to dispose of portfolio securities under disadvantageous circumstances to generate cash to satisfy such distribution requirements. These actions may reduce the assets to which the Fund’s expenses could otherwise be allocated and may reduce the Fund’s rate of return.
98 | J.P. Morgan Municipal Bond Funds
Financial Highlights
The financial highlights tables are intended to help you understand each Fund’s financial performance for each share class for each of the past one through five fiscal years or periods, as applicable. Certain information reflects financial results for a single Fund share. The total returns in the tables represent the rate that an investor would have earned (or lost) on an investment in a Fund (assuming reinvestment of all dividends and distributions). The information for each period presented has been audited by PricewaterhouseCoopers LLP, whose reports, along with each Fund’s financial statements, are included in the respective Fund’s annual report, which is available upon request.
To the extent a Fund invests in other Funds, the Total Annual Operating Expenses included in the Fee Table will not correlate to the ratio of expenses to average net assets in the financial highlights below.
| |
|
Per share operating performance | |||||
| |
|
Investment operations |
Distributions | ||||
| |
Net asset value, beginning of period |
Net investment income (loss) (a) |
Net realized and unrealized gains (losses) on investments |
Total from investment operations |
Net investment income |
Net realized gain |
Total distributions |
| JPMorgan Sustainable Municipal Income Fund |
|
|
|
|
|
|
|
| Class A |
|
|
|
|
|
|
|
| Year Ended February 28, 2022 |
$9.96 |
$0.18 |
$(0.29) |
$(0.11) |
$(0.18) |
$— |
$(0.18) |
| Year Ended February 28, 2021 |
10.02 |
0.17 |
(0.06) |
0.11 |
(0.17) |
— |
(0.17) |
| Year Ended February 29, 2020 |
9.55 |
0.20 |
0.47 |
0.67 |
(0.20) |
— |
(0.20) |
| Year Ended February 28, 2019 |
9.52 |
0.21 |
0.08 |
0.29 |
(0.21) |
(0.05) |
(0.26) |
| Year Ended February 28, 2018 |
9.70 |
0.23 (d) |
(0.11) |
0.12 |
(0.23) |
(0.07) |
(0.30) |
| Class C |
|
|
|
|
|
|
|
| Year Ended February 28, 2022 |
9.86 |
0.12 |
(0.30) |
(0.18) |
(0.12) |
— |
(0.12) |
| Year Ended February 28, 2021 |
9.92 |
0.11 |
(0.06) |
0.05 |
(0.11) |
— |
(0.11) |
| Year Ended February 29, 2020 |
9.45 |
0.14 |
0.47 |
0.61 |
(0.14) |
— |
(0.14) |
| Year Ended February 28, 2019 |
9.42 |
0.16 |
0.08 |
0.24 |
(0.16) |
(0.05) |
(0.21) |
| Year Ended February 28, 2018 |
9.61 |
0.17 (d) |
(0.12) |
0.05 |
(0.17) |
(0.07) |
(0.24) |
| Class I |
|
|
|
|
|
|
|
| Year Ended February 28, 2022 |
9.88 |
0.20 |
(0.29) |
(0.09) |
(0.20) |
— |
(0.20) |
| Year Ended February 28, 2021 |
9.95 |
0.19 |
(0.07) |
0.12 |
(0.19) |
— |
(0.19) |
| Year Ended February 29, 2020 |
9.48 |
0.22 |
0.47 |
0.69 |
(0.22) |
— |
(0.22) |
| Year Ended February 28, 2019 |
9.45 |
0.24 |
0.08 |
0.32 |
(0.24) |
(0.05) |
(0.29) |
| Year Ended February 28, 2018 |
9.63 |
0.25 (d) |
(0.11) |
0.14 |
(0.25) |
(0.07) |
(0.32) |
(a)Calculated based upon average shares outstanding.
(b)
Includes adjustments in accordance with accounting principles generally accepted in the United States of America and as such, the net asset values for financial reporting purposes and the returns based upon those net asset values may differ from the net asset values and returns for shareholder transactions.
(c)
Includes earnings credits and interest expense, if applicable, each of which is less than 0.005% unless otherwise noted.
(d)
Net investment income (loss) may appear disproportionate among the classes due to the timing of recognition of income and changes in the relative size of the classes.
100 | J.P. Morgan Municipal Bond Funds
| |
Ratios/Supplemental data | |||||
| |
|
|
Ratios to average net assets |
| ||
| Net asset value, end of period |
Total return (excludes sales charge) (b) |
Net assets, end of period (000’s) |
Net expenses (c) |
Net investment income (loss) |
Expenses without waivers, reimbursements and earnings credits |
Portfolio turnover rate |
| |
|
|
|
|
|
|
| |
|
|
|
|
|
|
| $9.67 |
(1.16)% |
$107,969 |
0.70% |
1.79% |
0.96% |
18% |
| 9.96 |
1.09 |
125,754 |
0.69 |
1.71 |
0.96 |
22 |
| 10.02 |
7.04 |
96,844 |
0.70 |
2.02 |
0.99 |
7 |
| 9.55 |
3.15 |
60,078 |
0.70 |
2.26 |
1.01 |
13 |
| 9.52 |
1.16 |
66,258 |
0.69 |
2.33 (d) |
1.01 |
21 |
| |
|
|
|
|
|
|
| 9.56 |
(1.82) |
7,156 |
1.25 |
1.24 |
1.46 |
18 |
| 9.86 |
0.54 |
9,178 |
1.24 |
1.16 |
1.46 |
22 |
| 9.92 |
6.52 |
12,868 |
1.25 |
1.49 |
1.51 |
7 |
| 9.45 |
2.61 |
12,833 |
1.25 |
1.71 |
1.51 |
13 |
| 9.42 |
0.51 |
15,138 |
1.24 |
1.78 (d) |
1.51 |
21 |
| |
|
|
|
|
|
|
| 9.59 |
(0.92) |
116,395 |
0.45 |
2.04 |
0.71 |
18 |
| 9.88 |
1.25 |
111,724 |
0.44 |
1.96 |
0.71 |
22 |
| 9.95 |
7.36 |
114,772 |
0.44 |
2.28 |
0.74 |
7 |
| 9.48 |
3.43 |
74,386 |
0.45 |
2.51 |
0.76 |
13 |
| 9.45 |
1.42 |
71,161 |
0.44 |
2.57 (d) |
0.74 |
21 |
July 1, 2022 | 101
Financial Highlights (continued)
| |
|
Per share operating performance | |||
| |
|
Investment operations |
Distributions | ||
| |
Net asset value, beginning of period |
Net investment income (loss) (a) |
Net realized and unrealized gains (losses) on investments |
Total from investment operations |
Net investment income |
| JPMorgan Short-Intermediate Municipal Bond Fund |
|
|
|
|
|
| Class A |
|
|
|
|
|
| Year Ended February 28, 2022 |
$10.78 |
$0.11 |
$(0.32) |
$(0.21) |
$(0.11) |
| Year Ended February 28, 2021 |
10.86 |
0.13 |
(0.08) |
0.05 |
(0.13) |
| Year Ended February 29, 2020 |
10.49 |
0.16 |
0.37 |
0.53 |
(0.16) |
| Year Ended February 28, 2019 |
10.39 |
0.16 |
0.10 |
0.26 |
(0.16) |
| Year Ended February 28, 2018 |
10.48 |
0.12 |
(0.09) |
0.03 |
(0.12) |
| Class C |
|
|
|
|
|
| Year Ended February 28, 2022 |
10.88 |
0.06 |
(0.32) |
(0.26) |
(0.06) |
| Year Ended February 28, 2021 |
10.96 |
0.08 |
(0.09) |
(0.01) |
(0.07) |
| Year Ended February 29, 2020 |
10.59 |
0.11 |
0.37 |
0.48 |
(0.11) |
| Year Ended February 28, 2019 |
10.48 |
0.11 |
0.11 |
0.22 |
(0.11) |
| Year Ended February 28, 2018 |
10.56 |
0.06 |
(0.08) |
(0.02) |
(0.06) |
| Class I |
|
|
|
|
|
| Year Ended February 28, 2022 |
10.84 |
0.16 |
(0.32) |
(0.16) |
(0.16) |
| Year Ended February 28, 2021 |
10.92 |
0.18 |
(0.09) |
0.09 |
(0.17) |
| Year Ended February 29, 2020 |
10.55 |
0.21 |
0.37 |
0.58 |
(0.21) |
| Year Ended February 28, 2019 |
10.44 |
0.21 |
0.11 |
0.32 |
(0.21) |
| Year Ended February 28, 2018 |
10.53 |
0.16 |
(0.09) |
0.07 |
(0.16) |
(a)Calculated based upon average shares outstanding.
(b)
Includes adjustments in accordance with accounting principles generally accepted in the United States of America and as such, the net asset values for financial reporting purposes and the returns based upon those net asset values may differ from the net asset values and returns for shareholder transactions.
(c)
Includes earnings credits and interest expense, if applicable, each of which is less than 0.005% unless otherwise noted.
102 | J.P. Morgan Municipal Bond Funds
| |
Ratios/Supplemental data | |||||
| |
|
|
Ratios to average net assets |
| ||
| Net asset value, end of period |
Total return (excludes sales charge) (b) |
Net assets, end of period (000’s) |
Net expenses (c) |
Net investment income (loss) |
Expenses without waivers, reimbursements and earnings credits |
Portfolio turnover rate |
| |
|
|
|
|
|
|
| |
|
|
|
|
|
|
| $10.46 |
(1.96)% |
$93,976 |
0.70% |
1.02% |
0.85% |
21% |
| 10.78 |
0.43 |
80,956 |
0.69 |
1.20 |
0.86 |
21 |
| 10.86 |
5.12 |
53,408 |
0.70 |
1.48 |
0.86 |
24 |
| 10.49 |
2.55 |
33,554 |
0.70 |
1.54 |
0.86 |
42 |
| 10.39 |
0.26 |
32,373 |
0.69 |
1.10 |
0.86 |
73 |
| |
|
|
|
|
|
|
| 10.56 |
(2.45) |
3,473 |
1.20 |
0.52 |
1.36 |
21 |
| 10.88 |
(0.09) |
4,626 |
1.19 |
0.72 |
1.36 |
21 |
| 10.96 |
4.52 |
4,303 |
1.20 |
0.99 |
1.36 |
24 |
| 10.59 |
2.10 |
4,590 |
1.20 |
1.03 |
1.38 |
42 |
| 10.48 |
(0.19) |
6,406 |
1.19 |
0.56 |
1.37 |
73 |
| |
|
|
|
|
|
|
| 10.52 |
(1.51) |
823,600 |
0.25 |
1.47 |
0.60 |
21 |
| 10.84 |
0.87 |
829,847 |
0.24 |
1.66 |
0.60 |
21 |
| 10.92 |
5.56 |
641,836 |
0.24 |
1.94 |
0.61 |
24 |
| 10.55 |
3.09 |
573,350 |
0.25 |
1.97 |
0.61 |
42 |
| 10.44 |
0.70 |
1,680,807 |
0.24 |
1.53 |
0.60 |
73 |
July 1, 2022 | 103
Financial Highlights (continued)
| |
|
Per share operating performance | |||
| |
|
Investment operations |
Distributions | ||
| |
Net asset value, beginning of period |
Net investment income (loss) (a) |
Net realized and unrealized gains (losses) on investments |
Total from investment operations |
Net investment income |
| JPMorgan Tax Free Bond Fund |
|
|
|
|
|
| Class A |
|
|
|
|
|
| Year Ended February 28, 2022 |
$12.46 |
$0.27 |
$(0.31) |
$(0.04) |
$(0.27) |
| Year Ended February 28, 2021 |
12.66 |
0.28 |
(0.20) |
0.08 |
(0.28) |
| Year Ended February 29, 2020 |
11.77 |
0.32 |
0.89 |
1.21 |
(0.32) |
| Year Ended February 28, 2019 |
11.82 |
0.40 |
(0.05) |
0.35 |
(0.40) |
| Year Ended February 28, 2018 |
11.93 |
0.39 |
(0.11) |
0.28 |
(0.39) |
| Class C |
|
|
|
|
|
| Year Ended February 28, 2022 |
12.35 |
0.19 |
(0.31) |
(0.12) |
(0.19) |
| Year Ended February 28, 2021 |
12.55 |
0.21 |
(0.21) |
— (d) |
(0.20) |
| Year Ended February 29, 2020 |
11.67 |
0.25 |
0.87 |
1.12 |
(0.24) |
| Year Ended February 28, 2019 |
11.72 |
0.33 |
(0.05) |
0.28 |
(0.33) |
| Year Ended February 28, 2018 |
11.84 |
0.32 |
(0.12) |
0.20 |
(0.32) |
| Class I |
|
|
|
|
|
| Year Ended February 28, 2022 |
12.41 |
0.29 |
(0.32) |
(0.03) |
(0.29) |
| Year Ended February 28, 2021 |
12.61 |
0.31 |
(0.21) |
0.10 |
(0.30) |
| Year Ended February 29, 2020 |
11.72 |
0.34 |
0.89 |
1.23 |
(0.34) |
| Year Ended February 28, 2019 |
11.77 |
0.42 |
(0.05) |
0.37 |
(0.42) |
| Year Ended February 28, 2018 |
11.88 |
0.42 |
(0.11) |
0.31 |
(0.42) |
(a)Calculated based upon average shares outstanding.
(b)
Includes adjustments in accordance with accounting principles generally accepted in the United States of America and as such, the net asset values for financial reporting purposes and the returns based upon those net asset values may differ from the net asset values and returns for shareholder transactions.
(c)
Includes earnings credits and interest expense, if applicable, each of which is less than 0.005% unless otherwise noted.
(d)
Amount rounds to less than $0.005.
104 | J.P. Morgan Municipal Bond Funds
| |
Ratios/Supplemental data | |||||
| |
|
|
Ratios to average net assets |
| ||
| Net asset value, end of period |
Total return (excludes sales charge) (b) |
Net assets, end of period (000’s) |
Net expenses (c) |
Net investment income (loss) |
Expenses without waivers, reimbursements and earnings credits |
Portfolio turnover rate |
| |
|
|
|
|
|
|
| |
|
|
|
|
|
|
| $12.15 |
(0.40)% |
$330,640 |
0.67% |
2.12% |
0.94% |
16% |
| 12.46 |
0.66 |
302,134 |
0.66 |
2.28 |
0.95 |
23 |
| 12.66 |
10.37 |
231,815 |
0.67 |
2.58 |
0.97 |
31 |
| 11.77 |
3.00 |
132,813 |
0.67 |
3.40 |
1.00 |
53 |
| 11.82 |
2.36 |
130,462 |
0.66 |
3.27 |
0.98 |
39 |
| |
|
|
|
|
|
|
| 12.04 |
(0.99) |
12,535 |
1.25 |
1.54 |
1.44 |
16 |
| 12.35 |
0.07 |
16,524 |
1.24 |
1.70 |
1.45 |
23 |
| 12.55 |
9.73 |
26,965 |
1.25 |
2.05 |
1.48 |
31 |
| 11.67 |
2.43 |
27,701 |
1.25 |
2.81 |
1.49 |
53 |
| 11.72 |
1.70 |
25,172 |
1.24 |
2.69 |
1.48 |
39 |
| |
|
|
|
|
|
|
| 12.09 |
(0.27) |
173,023 |
0.45 |
2.34 |
0.69 |
16 |
| 12.41 |
0.88 |
176,073 |
0.45 |
2.50 |
0.70 |
23 |
| 12.61 |
10.66 |
177,584 |
0.45 |
2.82 |
0.72 |
31 |
| 11.72 |
3.24 |
135,295 |
0.45 |
3.61 |
0.74 |
53 |
| 11.77 |
2.60 |
160,391 |
0.44 |
3.49 |
0.72 |
39 |
July 1, 2022 | 105
Financial Highlights (continued)
| |
|
Per share operating performance | |||
| |
|
Investment operations |
Distributions | ||
| |
Net asset value, beginning of period |
Net investment income (loss) (a) |
Net realized and unrealized gains (losses) on investments |
Total from investment operations |
Net investment income |
| JPMorgan Ultra-Short Municipal Fund |
|
|
|
|
|
| Class A |
|
|
|
|
|
| Year Ended February 28, 2022 |
$10.07 |
$0.01 |
$(0.09) |
$(0.08) |
$(0.01) |
| Year Ended February 28, 2021 |
10.08 |
0.03 |
— (d) |
0.03 |
(0.04) |
| Year Ended February 29, 2020 |
10.03 |
0.12 |
0.06 |
0.18 |
(0.13) |
| Year Ended February 28, 2019 |
10.01 |
0.13 |
— (d) |
0.13 |
(0.11) |
| Year Ended February 28, 2018 |
10.02 |
0.07 |
(0.02) |
0.05 |
(0.06) |
| Class I |
|
|
|
|
|
| Year Ended February 28, 2022 |
10.06 |
0.03 |
(0.08) |
(0.05) |
(0.03) |
| Year Ended February 28, 2021 |
10.07 |
0.05 |
— (d) |
0.05 |
(0.06) |
| Year Ended February 29, 2020 |
10.02 |
0.14 |
0.05 |
0.19 |
(0.14) |
| Year Ended February 28, 2019 |
10.00 |
0.14 |
0.02 |
0.16 |
(0.14) |
| Year Ended February 28, 2018 |
10.02 |
0.09 |
(0.03) |
0.06 |
(0.08) |
(a)Calculated based upon average shares outstanding.
(b)
Includes adjustments in accordance with accounting principles generally accepted in the United States of America and as such, the net asset values for financial reporting purposes and the returns based upon those net asset values may differ from the net asset values and returns for shareholder transactions.
(c)
Includes earnings credits and interest expense, if applicable, each of which is less than 0.005% unless otherwise noted.
(d)
Amount rounds to less than $0.005.
(e)
Certain non-recurring expenses incurred by the Fund were not annualized for the period indicated.
106 | J.P. Morgan Municipal Bond Funds
| |
Ratios/Supplemental data | |||||
| |
|
|
Ratios to average net assets |
| ||
| Net asset value, end of period |
Total return (excludes sales charge) (b) |
Net assets, end of period (000’s) |
Net expenses (c) |
Net investment income (loss) |
Expenses without waivers, reimbursements and earnings credits |
Portfolio turnover rate |
| |
|
|
|
|
|
|
| |
|
|
|
|
|
|
| $9.98 |
(0.83)% |
$72,506 |
0.45% |
0.06% |
0.75% |
33% |
| 10.07 |
0.30 |
143,944 |
0.44 |
0.35 |
0.75 |
71 |
| 10.08 |
1.76 |
106,625 |
0.45 |
1.23 |
0.76 |
48 |
| 10.03 |
1.33 |
67,256 |
0.44 |
1.32 |
0.77 |
50 |
| 10.01 |
0.47 |
772 |
0.44 (e) |
0.67 (e) |
0.85 (e) |
71 |
| |
|
|
|
|
|
|
| 9.98 |
(0.53) |
3,984,195 |
0.25 |
0.26 |
0.50 |
33 |
| 10.06 |
0.51 |
6,666,678 |
0.24 |
0.53 |
0.50 |
71 |
| 10.07 |
1.96 |
4,050,886 |
0.25 |
1.43 |
0.50 |
48 |
| 10.02 |
1.60 |
3,021,190 |
0.24 |
1.42 |
0.52 |
50 |
| 10.00 |
0.63 |
2,064,297 |
0.24 (e) |
0.90 (e) |
0.56 (e) |
71 |
July 1, 2022 | 107
Financial Highlights (continued)
| |
|
Per share operating performance | |||
| |
|
Investment operations |
Distributions | ||
| |
Net asset value, beginning of period |
Net investment income (loss) (a) |
Net realized and unrealized gains (losses) on investments |
Total from investment operations |
Net investment income |
| JPMorgan California Tax Free Bond Fund |
|
|
|
|
|
| Class A |
|
|
|
|
|
| Year Ended February 28, 2022 |
$11.06 |
$0.16 |
$(0.38) |
$(0.22) |
$(0.16) |
| Year Ended February 28, 2021 |
11.25 |
0.17 |
(0.19) |
(0.02) |
(0.17) |
| Year Ended February 29, 2020 |
10.71 |
0.23 |
0.54 |
0.77 |
(0.23) |
| Year Ended February 28, 2019 |
10.64 |
0.28 |
0.07 |
0.35 |
(0.28) |
| Year Ended February 28, 2018 |
10.78 |
0.28 |
(0.14) |
0.14 |
(0.28) |
| Class C |
|
|
|
|
|
| Year Ended February 28, 2022 |
10.96 |
0.10 |
(0.37) |
(0.27) |
(0.10) |
| Year Ended February 28, 2021 |
11.15 |
0.12 |
(0.20) |
(0.08) |
(0.11) |
| Year Ended February 29, 2020 |
10.62 |
0.18 |
0.53 |
0.71 |
(0.18) |
| Year Ended February 28, 2019 |
10.55 |
0.22 |
0.07 |
0.29 |
(0.22) |
| Year Ended February 28, 2018 |
10.69 |
0.22 |
(0.14) |
0.08 |
(0.22) |
| Class I |
|
|
|
|
|
| Year Ended February 28, 2022 |
10.80 |
0.17 |
(0.37) |
(0.20) |
(0.17) |
| Year Ended February 28, 2021 |
10.99 |
0.18 |
(0.19) |
(0.01) |
(0.18) |
| Year Ended February 29, 2020 |
10.47 |
0.24 |
0.52 |
0.76 |
(0.24) |
| Year Ended February 28, 2019 |
10.41 |
0.28 |
0.07 |
0.35 |
(0.29) |
| Year Ended February 28, 2018 |
10.55 |
0.29 |
(0.14) |
0.15 |
(0.29) |
(a)Calculated based upon average shares outstanding.
(b)
Includes adjustments in accordance with accounting principles generally accepted in the United States of America and as such, the net asset values for financial reporting purposes and the returns based upon those net asset values may differ from the net asset values and returns for shareholder transactions.
(c)
Includes earnings credits and interest expense, if applicable, each of which is less than 0.005% unless otherwise noted.
108 | J.P. Morgan Municipal Bond Funds
| |
Ratios/Supplemental data | |||||
| |
|
|
Ratios to average net assets |
| ||
| Net asset value, end of period |
Total return (excludes sales charge) (b) |
Net assets, end of period (000’s) |
Net expenses (c) |
Net investment income (loss) |
Expenses without waivers, reimbursements and earnings credits |
Portfolio turnover rate |
| |
|
|
|
|
|
|
| |
|
|
|
|
|
|
| $10.68 |
(2.05)% |
$136,939 |
0.60% |
1.43% |
0.94% |
11% |
| 11.06 |
(0.19) |
154,108 |
0.59 |
1.54 |
0.93 |
6 |
| 11.25 |
7.29 |
126,253 |
0.60 |
2.13 |
0.96 |
8 |
| 10.71 |
3.31 |
67,275 |
0.60 |
2.63 |
0.97 |
17 |
| 10.64 |
1.27 |
69,092 |
0.60 |
2.58 |
0.98 |
8 |
| |
|
|
|
|
|
|
| 10.59 |
(2.47) |
24,442 |
1.10 |
0.93 |
1.43 |
11 |
| 10.96 |
(0.70) |
33,234 |
1.09 |
1.07 |
1.43 |
6 |
| 11.15 |
6.72 |
52,168 |
1.10 |
1.66 |
1.47 |
8 |
| 10.62 |
2.82 |
46,950 |
1.10 |
2.13 |
1.48 |
17 |
| 10.55 |
0.78 |
54,655 |
1.10 |
2.08 |
1.48 |
8 |
| |
|
|
|
|
|
|
| 10.43 |
(1.90) |
80,566 |
0.50 |
1.53 |
0.68 |
11 |
| 10.80 |
(0.09) |
100,163 |
0.49 |
1.62 |
0.68 |
6 |
| 10.99 |
7.37 |
60,122 |
0.50 |
2.26 |
0.71 |
8 |
| 10.47 |
3.39 |
62,069 |
0.50 |
2.72 |
0.72 |
17 |
| 10.41 |
1.41 |
143,734 |
0.50 |
2.68 |
0.71 |
8 |
July 1, 2022 | 109
Financial Highlights (continued)
| |
|
Per share operating performance | |||||
| |
|
Investment operations |
Distributions | ||||
| |
Net asset value, beginning of period |
Net investment income (loss) (a) |
Net realized and unrealized gains (losses) on investments |
Total from investment operations |
Net investment income |
Net realized gain |
Total distributions |
| JPMorgan High Yield Municipal Fund |
|
|
|
|
|
|
|
| Class A |
|
|
|
|
|
|
|
| Year Ended February 28, 2022 |
$11.50 |
$0.34 |
$(0.17) |
$0.17 |
$(0.34) |
$— |
$(0.34) |
| Year Ended February 28, 2021 |
11.93 |
0.33 |
(0.42) |
(0.09) |
(0.33) |
(0.01) |
(0.34) |
| Year Ended February 29, 2020 |
10.88 |
0.32 |
1.05 |
1.37 |
(0.31) |
(0.01) |
(0.32) |
| Year Ended February 28, 2019 |
10.78 |
0.36 |
0.09 |
0.45 |
(0.35) |
— |
(0.35) |
| Year Ended February 28, 2018 |
10.82 |
0.28 |
(0.04) |
0.24 |
(0.28) |
— |
(0.28) |
| Class C |
|
|
|
|
|
|
|
| Year Ended February 28, 2022 |
11.47 |
0.28 |
(0.17) |
0.11 |
(0.28) |
— |
(0.28) |
| Year Ended February 28, 2021 |
11.90 |
0.28 |
(0.43) |
(0.15) |
(0.27) |
(0.01) |
(0.28) |
| Year Ended February 29, 2020 |
10.85 |
0.27 |
1.05 |
1.32 |
(0.26) |
(0.01) |
(0.27) |
| Year Ended February 28, 2019 |
10.76 |
0.30 |
0.09 |
0.39 |
(0.30) |
— |
(0.30) |
| Year Ended February 28, 2018 |
10.80 |
0.22 |
(0.03) |
0.19 |
(0.23) |
— |
(0.23) |
| Class I |
|
|
|
|
|
|
|
| Year Ended February 28, 2022 |
11.50 |
0.35 |
(0.17) |
0.18 |
(0.35) |
— |
(0.35) |
| Year Ended February 28, 2021 |
11.93 |
0.34 |
(0.42) |
(0.08) |
(0.34) |
(0.01) |
(0.35) |
| Year Ended February 29, 2020 |
10.87 |
0.34 |
1.06 |
1.40 |
(0.33) |
(0.01) |
(0.34) |
| Year Ended February 28, 2019 |
10.78 |
0.37 |
0.08 |
0.45 |
(0.36) |
— |
(0.36) |
| Year Ended February 28, 2018 |
10.82 |
0.29 |
(0.03) |
0.26 |
(0.30) |
— |
(0.30) |
(a)Calculated based upon average shares outstanding.
(b)
Includes adjustments in accordance with accounting principles generally accepted in the United States of America and as such, the net asset values for financial reporting purposes and the returns based upon those net asset values may differ from the net asset values and returns for shareholder transactions.
(c)
Includes earnings credits and interest expense, if applicable, each of which is less than 0.005% unless otherwise noted.
110 | J.P. Morgan Municipal Bond Funds
| |
Ratios/Supplemental data | |||||
| |
|
|
Ratios to average net assets |
| ||
| Net asset value, end of period |
Total return (excludes sales charge) (b) |
Net assets, end of period (000’s) |
Net expenses (c) |
Net investment income (loss) |
Expenses without waivers, reimbursements and earnings credits |
Portfolio turnover rate |
| |
|
|
|
|
|
|
| |
|
|
|
|
|
|
| $11.33 |
1.39% |
$195,574 |
0.65% |
2.87% |
1.01% |
24% |
| 11.50 |
(0.61) |
179,459 |
0.65 |
2.99 |
1.02 |
39 |
| 11.93 |
12.81 |
194,623 |
0.64 |
2.80 |
1.06 |
18 |
| 10.88 |
4.28 |
43,565 |
0.64 |
3.32 |
1.22 |
130 |
| 10.78 |
2.25 |
35,071 |
0.64 |
2.56 |
1.20 |
17 |
| |
|
|
|
|
|
|
| 11.30 |
0.89 |
28,844 |
1.15 |
2.37 |
1.51 |
24 |
| 11.47 |
(1.11) |
32,499 |
1.14 |
2.50 |
1.51 |
39 |
| 11.90 |
12.29 |
37,623 |
1.14 |
2.34 |
1.57 |
18 |
| 10.85 |
3.67 |
17,929 |
1.14 |
2.82 |
1.71 |
130 |
| 10.76 |
1.74 |
18,675 |
1.14 |
2.06 |
1.70 |
17 |
| |
|
|
|
|
|
|
| 11.33 |
1.50 |
247,902 |
0.55 |
2.97 |
0.76 |
24 |
| 11.50 |
(0.51) |
256,624 |
0.55 |
3.09 |
0.76 |
39 |
| 11.93 |
13.02 |
296,450 |
0.54 |
2.92 |
0.81 |
18 |
| 10.87 |
4.29 |
95,662 |
0.54 |
3.45 |
0.97 |
130 |
| 10.78 |
2.36 |
51,274 |
0.54 |
2.66 |
0.95 |
17 |
July 1, 2022 | 111
Financial Highlights (continued)
| |
|
Per share operating performance | |||||
| |
|
Investment operations |
Distributions | ||||
| |
Net asset value, beginning of period |
Net investment income (loss) (a) |
Net realized and unrealized gains (losses) on investments |
Total from investment operations |
Net investment income |
Net realized gain |
Total distributions |
| JPMorgan Intermediate Tax Free Bond Fund |
|
|
|
|
|
|
|
| Class A |
|
|
|
|
|
|
|
| Year Ended February 28, 2022 |
$11.37 |
$0.23 |
$(0.37) |
$(0.14) |
$(0.23) |
$(0.09) |
$(0.32) |
| Year Ended February 28, 2021 |
11.52 |
0.22 |
(0.16) |
0.06 |
(0.21) |
— |
(0.21) |
| Year Ended February 29, 2020 |
10.91 |
0.24 |
0.61 |
0.85 |
(0.24) |
— |
(0.24) |
| Year Ended February 28, 2019 |
10.80 |
0.25 |
0.11 |
0.36 |
(0.25) |
— |
(0.25) |
| Year Ended February 28, 2018 |
10.94 |
0.24 |
(0.15) |
0.09 |
(0.23) |
— |
(0.23) |
| Class C |
|
|
|
|
|
|
|
| Year Ended February 28, 2022 |
11.07 |
0.17 |
(0.36) |
(0.19) |
(0.17) |
(0.09) |
(0.26) |
| Year Ended February 28, 2021 |
11.23 |
0.15 |
(0.16) |
(0.01) |
(0.15) |
— |
(0.15) |
| Year Ended February 29, 2020 |
10.63 |
0.18 |
0.60 |
0.78 |
(0.18) |
— |
(0.18) |
| Year Ended February 28, 2019 |
10.53 |
0.18 |
0.11 |
0.29 |
(0.19) |
— |
(0.19) |
| Year Ended February 28, 2018 |
10.68 |
0.18 |
(0.15) |
0.03 |
(0.18) |
— |
(0.18) |
| Class I |
|
|
|
|
|
|
|
| Year Ended February 28, 2022 |
11.15 |
0.26 |
(0.37) |
(0.11) |
(0.26) |
(0.09) |
(0.35) |
| Year Ended February 28, 2021 |
11.31 |
0.24 |
(0.16) |
0.08 |
(0.24) |
— |
(0.24) |
| Year Ended February 29, 2020 |
10.71 |
0.27 |
0.60 |
0.87 |
(0.27) |
— |
(0.27) |
| Year Ended February 28, 2019 |
10.61 |
0.27 |
0.10 |
0.37 |
(0.27) |
— |
(0.27) |
| Year Ended February 28, 2018 |
10.75 |
0.27 |
(0.14) |
0.13 |
(0.27) |
— |
(0.27) |
(a)Calculated based upon average shares outstanding.
(b)
Includes adjustments in accordance with accounting principles generally accepted in the United States of America and as such, the net asset values for financial reporting purposes and the returns based upon those net asset values may differ from the net asset values and returns for shareholder transactions.
(c)
Includes earnings credits and interest expense, if applicable, each of which is less than 0.005% unless otherwise noted.
112 | J.P. Morgan Municipal Bond Funds
| |
Ratios/Supplemental data | |||||
| |
|
|
Ratios to average net assets |
| ||
| Net asset value, end of period |
Total return (excludes sales charge) (b) |
Net assets, end of period (000’s) |
Net expenses (c) |
Net investment income (loss) |
Expenses without waivers, reimbursements and earnings credits |
Portfolio turnover rate |
| |
|
|
|
|
|
|
| |
|
|
|
|
|
|
| $10.91 |
(1.29)% |
$341,321 |
0.65% |
2.06% |
0.90% |
12% |
| 11.37 |
0.57 |
308,709 |
0.64 |
1.93 |
0.90 |
34 |
| 11.52 |
7.86 |
250,087 |
0.65 |
2.17 |
0.90 |
20 |
| 10.91 |
3.34 |
222,295 |
0.64 |
2.32 |
0.90 |
48 |
| 10.80 |
0.83 |
174,653 |
0.71 |
2.17 |
0.91 |
30 |
| |
|
|
|
|
|
|
| 10.62 |
(1.77) |
14,423 |
1.20 |
1.51 |
1.40 |
12 |
| 11.07 |
(0.07) |
19,061 |
1.19 |
1.38 |
1.40 |
34 |
| 11.23 |
7.38 |
29,173 |
1.20 |
1.63 |
1.40 |
20 |
| 10.63 |
2.76 |
37,603 |
1.19 |
1.76 |
1.40 |
48 |
| 10.53 |
0.24 |
50,481 |
1.22 |
1.65 |
1.41 |
30 |
| |
|
|
|
|
|
|
| 10.69 |
(1.06) |
655,190 |
0.40 |
2.31 |
0.65 |
12 |
| 11.15 |
0.75 |
622,009 |
0.39 |
2.17 |
0.65 |
34 |
| 11.31 |
8.19 |
660,041 |
0.40 |
2.42 |
0.64 |
20 |
| 10.71 |
3.57 |
523,544 |
0.39 |
2.57 |
0.65 |
48 |
| 10.61 |
1.17 |
770,626 |
0.39 |
2.45 |
0.64 |
30 |
July 1, 2022 | 113
Financial Highlights (continued)
| |
|
Per share operating performance | |||
| |
|
Investment operations |
Distributions | ||
| |
Net asset value, beginning of period |
Net investment income (loss) (a) |
Net realized and unrealized gains (losses) on investments |
Total from investment operations |
Net investment income |
| JPMorgan New York Tax Free Bond Fund |
|
|
|
|
|
| Class A |
|
|
|
|
|
| Year Ended February 28, 2022 |
$6.93 |
$0.11 |
$(0.21) |
$(0.10) |
$(0.12) |
| Year Ended February 28, 2021 |
7.06 |
0.12 |
(0.13) |
(0.01) |
(0.12) |
| Year Ended February 29, 2020 |
6.71 |
0.14 |
0.35 |
0.49 |
(0.14) |
| Year Ended February 28, 2019 |
6.70 |
0.18 |
0.01 |
0.19 |
(0.18) |
| Year Ended February 28, 2018 |
6.84 |
0.20 |
(0.14) |
0.06 |
(0.20) |
| Class C |
|
|
|
|
|
| Year Ended February 28, 2022 |
6.93 |
0.08 |
(0.22) |
(0.14) |
(0.08) |
| Year Ended February 28, 2021 |
7.05 |
0.09 |
(0.13) |
(0.04) |
(0.08) |
| Year Ended February 29, 2020 |
6.71 |
0.10 |
0.34 |
0.44 |
(0.10) |
| Year Ended February 28, 2019 |
6.69 |
0.14 |
0.02 |
0.16 |
(0.14) |
| Year Ended February 28, 2018 |
6.84 |
0.16 |
(0.15) |
0.01 |
(0.16) |
| Class I |
|
|
|
|
|
| Year Ended February 28, 2022 |
6.96 |
0.13 |
(0.21) |
(0.08) |
(0.13) |
| Year Ended February 28, 2021 |
7.09 |
0.14 |
(0.13) |
0.01 |
(0.14) |
| Year Ended February 29, 2020 |
6.75 |
0.15 |
0.34 |
0.49 |
(0.15) |
| Year Ended February 28, 2019 |
6.73 |
0.20 |
0.01 |
0.21 |
(0.19) |
| Year Ended February 28, 2018 |
6.87 |
0.21 |
(0.14) |
0.07 |
(0.21) |
(a)Calculated based upon average shares outstanding.
(b)
Includes adjustments in accordance with accounting principles generally accepted in the United States of America and as such, the net asset values for financial reporting purposes and the returns based upon those net asset values may differ from the net asset values and returns for shareholder transactions.
(c)
Includes earnings credits and interest expense, if applicable, each of which is less than 0.005% unless otherwise noted.
114 | J.P. Morgan Municipal Bond Funds
| |
Ratios/Supplemental data | |||||
| |
|
|
Ratios to average net assets |
| ||
| Net asset value, end of period |
Total return (excludes sales charge) (b) |
Net assets, end of period (000’s) |
Net expenses (c) |
Net investment income (loss) |
Expenses without waivers, reimbursements and earnings credits |
Portfolio turnover rate |
| |
|
|
|
|
|
|
| |
|
|
|
|
|
|
| $6.71 |
(1.55)% |
$143,940 |
0.75% |
1.60% |
0.94% |
10% |
| 6.93 |
(0.13) |
166,435 |
0.74 |
1.77 |
0.93 |
5 |
| 7.06 |
7.31 |
164,358 |
0.75 |
1.96 |
0.95 |
13 |
| 6.71 |
2.86 |
120,371 |
0.75 |
2.66 |
0.96 |
21 |
| 6.70 |
0.81 |
128,973 |
0.75 |
2.85 |
0.96 |
8 |
| |
|
|
|
|
|
|
| 6.71 |
(2.05) |
24,776 |
1.25 |
1.10 |
1.44 |
10 |
| 6.93 |
(0.51) |
31,173 |
1.24 |
1.26 |
1.43 |
5 |
| 7.05 |
6.62 |
57,781 |
1.25 |
1.49 |
1.45 |
13 |
| 6.71 |
2.50 |
67,242 |
1.25 |
2.16 |
1.45 |
21 |
| 6.69 |
0.15 |
83,807 |
1.25 |
2.35 |
1.45 |
8 |
| |
|
|
|
|
|
|
| 6.75 |
(1.16) |
76,802 |
0.50 |
1.85 |
0.69 |
10 |
| 6.96 |
0.12 |
87,928 |
0.49 |
2.02 |
0.68 |
5 |
| 7.09 |
7.38 |
105,497 |
0.50 |
2.22 |
0.70 |
13 |
| 6.75 |
3.26 |
87,158 |
0.50 |
2.92 |
0.70 |
21 |
| 6.73 |
1.06 |
163,141 |
0.50 |
3.10 |
0.69 |
8 |
July 1, 2022 | 115
Additional Fee and Expense Information for the JPMT II Funds and Former One Group Mutual Funds
In connection with the 2004 final settlement between Banc One Investment Advisors Corporation (BOIA), subsequently known as JPMorgan Investment Advisors Inc. (JPMIA1), with the New York Attorney General arising out of market timing of certain mutual funds advised by BOIA, BOIA agreed, among other things, to disclose hypothetical information regarding investment and expense information to Fund shareholders. The hypothetical examples are provided for JPMT II Funds or those Funds that have acquired the assets and liabilities of a JPMT II Fund or a series of One Group Mutual Funds.
The “Gross Expense Ratio” includes the contractual expenses that make up the investment advisory, administration and servicing fees, Rule 12b-1 distribution fees, fees paid to vendors not affiliated with JPMIM that provide services to the Funds and other fees and expenses of the Funds. The “Net Expense Ratio” is Gross Expenses less any fee waivers or expense reimbursements memorialized in a written contract between the Funds and JPMIM and/or its affiliates, as applicable.
The table below shows the ratios for Class A, Class C and Class I Shares of the affected Funds offered in this prospectus.
| |
|
|
|
| |
Class |
Net Expense Ratio |
Gross Expense Ratio |
| JPMorgan Sustainable Municipal Income Fund |
A |
0.70% |
0.96% |
| |
C |
1.25% |
1.46% |
| |
I |
0.45% |
0.71% |
| JPMorgan Short-Intermediate Municipal Bond Fund |
A |
0.70% |
0.86% |
| |
C |
1.20% |
1.37% |
| |
I |
0.25% |
0.61% |
| JPMorgan Tax Free Bond Fund |
A |
0.67% |
0.94% |
| |
C |
1.25% |
1.44% |
| |
I |
0.45% |
0.69% |
| JPMorgan Intermediate Tax Free Bond Fund |
A |
0.65% |
0.90% |
| |
C |
1.20% |
1.40% |
| |
I |
0.40% |
0.65% |
A Fund’s annual return is reduced by its fees and expenses for that year. The examples below are intended to help you understand the annual and cumulative impact of the Fund’s fees and expenses on your investment through a hypothetical investment of $10,000 held for the next 10 years. The examples assume the following:
•
On 7/1/22, you invest $10,000 in the Fund and you will hold the shares for the entire 10 year period;
•
Your investment has a 5% return each year;
•
The Fund’s operating expenses remain at the levels discussed below and are not affected by increases or decreases in Fund assets over time;
•
At the time of purchase, any applicable initial sales charges (loads) are deducted; and
•
There is no sales charge (load) on reinvested dividends.
•
The annual costs are calculated using the Net Expense Ratios for the period through the expiration of any fee waivers or expense reimbursements memorialized in a written contract between the Funds and JPMIM and/or its affiliates; and the Gross Expense Ratios thereafter.
“Annual Net Return” shows what effect the “Annual Costs” will have on the assumed 5% annual return for each year. “Gross Cumulative Return” shows what the cumulative return on your investment at the end of each 12 month period (year) ended October 31 would be if Fund expenses are not deducted. “Net Cumulative Return” shows what the cumulative return on your investment at the end of each year would be assuming Fund expenses are deducted each year in the amount shown under “Annual Costs.” “Annual Net Return” shows what effect the “Annual Costs” will have on the assumed 5% annual return for each year.
Your actual costs may be higher or lower than those shown.
1
Effective January 1, 2010, the investment advisory business of JPMorgan Investment Advisors Inc. (JPMIA), which was the adviser for certain of the J.P. Morgan Funds, was transferred to JPMIM and JPMIM became the investment adviser for certain J.P. Morgan Funds that were previously advised by JPMIA.
116 | J.P. Morgan Municipal Bond Funds
| JPMorgan Sustainable Municipal Income Fund | ||||||||
| |
Class A |
Class C1 | ||||||
| Period Ended |
Annual Costs |
Gross Cumulative Return |
Net Cumulative Return |
Net Annual Return |
Annual Costs |
Gross Cumulative Return |
Net Cumulative Return |
Net Annual Return |
| June 30, 2023 |
$444 |
1.06% |
0.39% |
0.39% |
$127 |
5.00% |
3.75% |
3.75% |
| June 30, 2024 |
98 |
6.12 |
4.44 |
4.04 |
154 |
10.25 |
7.42 |
3.54 |
| June 30, 2025 |
102 |
11.42 |
8.66 |
4.04 |
160 |
15.76 |
11.23 |
3.54 |
| June 30, 2026 |
106 |
16.99 |
13.05 |
4.04 |
165 |
21.55 |
15.16 |
3.54 |
| June 30, 2027 |
111 |
22.84 |
17.62 |
4.04 |
171 |
27.63 |
19.24 |
3.54 |
| June 30, 2028 |
115 |
28.98 |
22.37 |
4.04 |
177 |
34.01 |
23.46 |
3.54 |
| June 30, 2029 |
120 |
35.43 |
27.32 |
4.04 |
183 |
40.71 |
27.83 |
3.54 |
| June 30, 2030 |
125 |
42.21 |
32.46 |
4.04 |
190 |
47.75 |
32.36 |
3.54 |
| June 30, 2031 |
130 |
49.32 |
37.81 |
4.04 |
130 |
55.13 |
37.70 |
4.04 |
| June 30, 2032 |
135 |
56.78 |
43.38 |
4.04 |
135 |
62.89 |
43.27 |
4.04 |
1
The disclosure and numbers for Class C Shares shown above assume that the shareholder did not redeem the shares.With redemption, the numbers for Class C Shares for the first year (period ended June 30, 2023) would be as follows:
| |
Annual Costs |
Gross Cumulative Return |
Net Cumulative Return |
Net Annual Return |
|
| |
$227 |
4.00% |
2.75% |
2.75% |
|
| | ||||
| |
Class I | |||
| Period Ended |
Annual Costs |
Gross Cumulative Return |
Net Cumulative Return |
Net Annual Return |
| June 30, 2023 |
$46 |
5.00% |
4.55% |
4.55% |
| June 30, 2024 |
76 |
10.25 |
9.04 |
4.29 |
| June 30, 2025 |
79 |
15.76 |
13.71 |
4.29 |
| June 30, 2026 |
82 |
21.55 |
18.59 |
4.29 |
| June 30, 2027 |
86 |
27.63 |
23.68 |
4.29 |
| June 30, 2028 |
90 |
34.01 |
28.98 |
4.29 |
| June 30, 2029 |
94 |
40.71 |
34.52 |
4.29 |
| June 30, 2030 |
98 |
47.75 |
40.29 |
4.29 |
| June 30, 2031 |
102 |
55.13 |
46.31 |
4.29 |
| June 30, 2032 |
106 |
62.89 |
52.58 |
4.29 |
July 1, 2022 | 117
Additional Fee and Expense Information for the JPMT II Funds and Former One Group Mutual Funds (continued)
| JPMorgan Short-Intermediate Municipal Bond Fund | ||||||||
| |
Class A |
Class C1 | ||||||
| Period Ended |
Annual Costs |
Gross Cumulative Return |
Net Cumulative Return |
Net Annual Return |
Annual Costs |
Gross Cumulative Return |
Net Cumulative Return |
Net Annual Return |
| June 30, 2023 |
$295 |
2.64% |
1.95% |
1.95% |
$122 |
5.00% |
3.80% |
3.80% |
| June 30, 2024 |
89 |
7.77 |
6.17 |
4.14 |
145 |
10.25 |
7.57 |
3.63 |
| June 30, 2025 |
93 |
13.16 |
10.57 |
4.14 |
150 |
15.76 |
11.47 |
3.63 |
| June 30, 2026 |
97 |
18.82 |
15.15 |
4.14 |
155 |
21.55 |
15.52 |
3.63 |
| June 30, 2027 |
101 |
24.76 |
19.91 |
4.14 |
161 |
27.63 |
19.71 |
3.63 |
| June 30, 2028 |
105 |
30.99 |
24.88 |
4.14 |
167 |
34.01 |
24.06 |
3.63 |
| June 30, 2029 |
110 |
37.54 |
30.05 |
4.14 |
173 |
40.71 |
28.56 |
3.63 |
| June 30, 2030 |
114 |
44.42 |
35.43 |
4.14 |
179 |
47.75 |
33.23 |
3.63 |
| June 30, 2031 |
119 |
51.64 |
41.04 |
4.14 |
117 |
55.13 |
38.74 |
4.14 |
| June 30, 2032 |
124 |
59.22 |
46.88 |
4.14 |
122 |
62.89 |
44.49 |
4.14 |
1
The disclosure and numbers for Class C Shares shown above assume that the shareholder did not redeem the shares.With redemption, the numbers for Class C Shares for the first year (period ended June 30, 2023) would be as follows:
| |
Annual Costs |
Gross Cumulative Return |
Net Cumulative Return |
Net Annual Return |
|
| |
$222 |
4.00% |
2.80% |
2.80% |
|
| | ||||
| |
Class I | |||
| Period Ended |
Annual Costs |
Gross Cumulative Return |
Net Cumulative Return |
Net Annual Return |
| June 30, 2023 |
$26 |
5.00% |
4.75% |
4.75% |
| June 30, 2024 |
65 |
10.25 |
9.35 |
4.39 |
| June 30, 2025 |
68 |
15.76 |
14.15 |
4.39 |
| June 30, 2026 |
71 |
21.55 |
19.16 |
4.39 |
| June 30, 2027 |
74 |
27.63 |
24.39 |
4.39 |
| June 30, 2028 |
78 |
34.01 |
29.85 |
4.39 |
| June 30, 2029 |
81 |
40.71 |
35.55 |
4.39 |
| June 30, 2030 |
85 |
47.75 |
41.50 |
4.39 |
| June 30, 2031 |
88 |
55.13 |
47.72 |
4.39 |
| June 30, 2032 |
92 |
62.89 |
54.20 |
4.39 |
118 | J.P. Morgan Municipal Bond Funds
| JPMorgan Tax Free Bond Fund | ||||||||
| |
Class A |
Class C1 | ||||||
| Period Ended |
Annual Costs |
Gross Cumulative Return |
Net Cumulative Return |
Net Annual Return |
Annual Costs |
Gross Cumulative Return |
Net Cumulative Return |
Net Annual Return |
| June 30, 2023 |
$441 |
1.06% |
0.42% |
0.42% |
$127 |
5.00% |
3.75% |
3.75% |
| June 30, 2024 |
96 |
6.12 |
4.49 |
4.06 |
152 |
10.25 |
7.44 |
3.56 |
| June 30, 2025 |
100 |
11.42 |
8.74 |
4.06 |
157 |
15.76 |
11.27 |
3.56 |
| June 30, 2026 |
104 |
16.99 |
13.15 |
4.06 |
163 |
21.55 |
15.23 |
3.56 |
| June 30, 2027 |
109 |
22.84 |
17.75 |
4.06 |
169 |
27.63 |
19.33 |
3.56 |
| June 30, 2028 |
113 |
28.98 |
22.53 |
4.06 |
175 |
34.01 |
23.58 |
3.56 |
| June 30, 2029 |
118 |
35.43 |
27.50 |
4.06 |
181 |
40.71 |
27.98 |
3.56 |
| June 30, 2030 |
122 |
42.21 |
32.68 |
4.06 |
188 |
47.75 |
32.54 |
3.56 |
| June 30, 2031 |
127 |
49.32 |
38.06 |
4.06 |
127 |
55.13 |
37.92 |
4.06 |
| June 30, 2032 |
132 |
56.78 |
43.67 |
4.06 |
132 |
62.89 |
43.52 |
4.06 |
1
The disclosure and numbers for Class C Shares shown above assume that the shareholder did not redeem the shares.With redemption, the numbers for Class C Shares for the first year (period ended June 30, 2023) would be as follows:
| |
Annual Costs |
Gross Cumulative Return |
Net Cumulative Return |
Net Annual Return |
|
| |
$227 |
4.00% |
2.75% |
2.75% |
|
| | ||||
| |
Class I | |||
| Period Ended |
Annual Costs |
Gross Cumulative Return |
Net Cumulative Return |
Net Annual Return |
| June 30, 2023 |
$46 |
5.00% |
4.55% |
4.55% |
| June 30, 2024 |
74 |
10.25 |
9.06 |
4.31 |
| June 30, 2025 |
77 |
15.76 |
13.76 |
4.31 |
| June 30, 2026 |
80 |
21.55 |
18.66 |
4.31 |
| June 30, 2027 |
84 |
27.63 |
23.77 |
4.31 |
| June 30, 2028 |
87 |
34.01 |
29.11 |
4.31 |
| June 30, 2029 |
91 |
40.71 |
34.67 |
4.31 |
| June 30, 2030 |
95 |
47.75 |
40.48 |
4.31 |
| June 30, 2031 |
99 |
55.13 |
46.53 |
4.31 |
| June 30, 2032 |
103 |
62.89 |
52.85 |
4.31 |
July 1, 2022 | 119
Additional Fee and Expense Information for the JPMT II Funds and Former One Group Mutual Funds (continued)
| JPMorgan Intermediate Tax Free Bond Fund | ||||||||
| |
Class A |
Class C1 | ||||||
| Period Ended |
Annual Costs |
Gross Cumulative Return |
Net Cumulative Return |
Net Annual Return |
Annual Costs |
Gross Cumulative Return |
Net Cumulative Return |
Net Annual Return |
| June 30, 2023 |
$439 |
1.06% |
0.44% |
0.44% |
$122 |
5.00% |
3.80% |
3.80% |
| June 30, 2024 |
92 |
6.12 |
4.55 |
4.10 |
148 |
10.25 |
7.54 |
3.60 |
| June 30, 2025 |
96 |
11.42 |
8.84 |
4.10 |
153 |
15.76 |
11.41 |
3.60 |
| June 30, 2026 |
100 |
16.99 |
13.30 |
4.10 |
159 |
21.55 |
15.42 |
3.60 |
| June 30, 2027 |
104 |
22.84 |
17.95 |
4.10 |
164 |
27.63 |
19.57 |
3.60 |
| June 30, 2028 |
108 |
28.98 |
22.79 |
4.10 |
170 |
34.01 |
23.88 |
3.60 |
| June 30, 2029 |
113 |
35.43 |
27.82 |
4.10 |
177 |
40.71 |
28.34 |
3.60 |
| June 30, 2030 |
117 |
42.21 |
33.06 |
4.10 |
183 |
47.75 |
32.96 |
3.60 |
| June 30, 2031 |
122 |
49.32 |
38.52 |
4.10 |
122 |
55.13 |
38.41 |
4.10 |
| June 30, 2032 |
127 |
56.78 |
44.19 |
4.10 |
127 |
62.89 |
44.08 |
4.10 |
1
The disclosure and numbers for Class C Shares shown above assume that the shareholder did not redeem the shares.With redemption, the numbers for Class C Shares for the first year (period ended June 30, 2023) would be as follows:
| |
Annual Costs |
Gross Cumulative Return |
Net Cumulative Return |
Net Annual Return |
|
| |
$222 |
4.00% |
2.80% |
2.80% |
|
| | ||||
| |
Class I | |||
| Period Ended |
Annual Costs |
Gross Cumulative Return |
Net Cumulative Return |
Net Annual Return |
| June 30, 2023 |
$41 |
5.00% |
4.60% |
4.60% |
| June 30, 2024 |
69 |
10.25 |
9.15 |
4.35 |
| June 30, 2025 |
72 |
15.76 |
13.90 |
4.35 |
| June 30, 2026 |
76 |
21.55 |
18.85 |
4.35 |
| June 30, 2027 |
79 |
27.63 |
24.02 |
4.35 |
| June 30, 2028 |
82 |
34.01 |
29.42 |
4.35 |
| June 30, 2029 |
86 |
40.71 |
35.05 |
4.35 |
| June 30, 2030 |
90 |
47.75 |
40.92 |
4.35 |
| June 30, 2031 |
94 |
55.13 |
47.05 |
4.35 |
| June 30, 2032 |
98 |
62.89 |
53.45 |
4.35 |
120 | J.P. Morgan Municipal Bond Funds
Appendix A – Financial Intermediary-Specific Sales Charge Waivers
Each Financial Intermediary below is responsible for the implementation or administration of the applicable waivers, discounts, and/or other platform or account features on its platform or for its accounts, as described below.
WAIVERS APPLICABLE TO PURCHASES THROUGH AMERIPRISE FINANCIAL
Front-end Sales Charge Waivers on Class A Shares available at Ameriprise Financial
The following information applies to Class A shares purchases if you have an account with or otherwise purchase Fund shares through Ameriprise Financial:
Shareholders purchasing Fund shares through an Ameriprise Financial retail brokerage account are eligible for the following front-end sales charge waivers, which may differ from those disclosed elsewhere in this Fund’s prospectus or Statement of Additional Information (“SAI”):
•
Employer-sponsored retirement plans (e.g., 401(k) plans, 457 plans, employer-sponsored 403(b) plans, profit sharing and money purchase pension plans and defined benefit plans). For purposes of this provision, employer-sponsored retirement plans do not include SEP IRAs, Simple IRAs or SAR-SEPs.
•
Shares purchased through reinvestment of capital gains distributions and dividend reinvestment when purchasing shares of the same Fund (but not any other fund within the same fund family).
•
Shares exchanged by Ameriprise Financial from Class C Shares of the same Fund in the month of or following the 7-year anniversary of the purchase date. To the extent that this prospectus elsewhere provides for a waiver with respect to exchanges of Class C Shares or conversion of Class C Shares following a shorter holding period, that waiver will apply.
•
Employees and registered representatives of Ameriprise Financial or its affiliates and their immediate family members.
•
Shares purchased by or through qualified accounts (including IRAs, Coverdell Education Savings Accounts, 401(k)s, 403(b) TSCAs subject to ERISA and defined benefit plans) that are held by a covered family member, defined as an Ameriprise financial advisor and/or the advisor’s spouse, advisor’s lineal ascendant (mother, father, grandmother, grandfather, great grandmother, great grandfather), advisor’s lineal descendant (son, step-son, daughter, step-daughter, grandson, granddaughter, great grandson, great granddaughter) or any spouse of a covered family member who is a lineal descendant.
•
Shares purchased from the proceeds of redemptions within the same fund family, provided (1) the repurchase occurs within 90 days following the redemption, (2) the redemption and purchase occur in the same account, and (3) redeemed shares were subject to a front-end or deferred sales load (i.e. Rights of Reinstatement.)
WAIVERS APPLICABLE TO PURCHASES THROUGH D.A. DAVIDSON
Shareholders purchasing Fund shares including existing Fund shareholders through a D.A. Davidson &. Co. (“D.A. Davidson”) platform or account, or through an introducing broker-dealer or independent registered investment advisor for which D.A. Davidson provides trade execution, clearance, and/or custody services, where the account is held omnibus at the Fund, will be eligible for the following sales charge waivers (front-end sales charge waivers and contingent deferred, or back-end, sales charge waivers) and discounts, which may differ from those disclosed elsewhere in this prospectus or Statement of Additional Information.
Front-end sales charge waivers on Class A Shares available at D.A. Davidson
•
Shares purchased within the same fund family through a systematic reinvestment of capital gains and dividend distributions.
•
Employees and registered representatives of D.A. Davidson or its affiliates and their family members as designated by D.A. Davidson.
•
Shares purchased from the proceeds of redemptions within the same fund family, provided (1) the repurchase occurs within 90 days following the redemption, (2) the redemption and purchase occur in the same account, and (3) redeemed shares were subject to a front-end or deferred sales charge (known as Rights of Reinstatement).
•
A shareholder in a Fund’s Class C Shares will have their shares exchanged at net asset value to Class A Shares (or the appropriate share class) of the Fund if the shares are no longer subject to a CDSC and the exchange is consistent with D.A. Davidson’s policies and procedures.
CDSC Waivers on Class A and C Shares available at D.A. Davidson
•
Death or disability of the shareholder.
•
Shares sold as part of a systematic withdrawal plan as described in the fund’s prospectus.
•
Return of excess contributions from an IRA Account.
•
Shares sold as part of a required minimum distribution for IRA or other qualifying retirement accounts as described in the fund’s prospectus.
July 1, 2022 | 121
Appendix A – Financial Intermediary-Specific Sales Charge Waivers (continued)
•
Shares acquired through a right of reinstatement.
Front-end sales charge discounts available at D.A. Davidson: breakpoints, rights of accumulation and/or letters of intent
•
Breakpoints as described in this prospectus.
•
Rights of accumulation which entitle shareholders to breakpoint discounts will be automatically calculated based on the aggregated holding of fund family assets held by accounts within the purchaser’s household at D.A. Davidson. Eligible fund family assets not held at D.A. Davidson may be included in the calculation of rights of accumulation only if the shareholder notifies his or her financial advisor about such assets.
•
Letters of intent which allow for breakpoint discounts based on anticipated purchases within a fund family, over a 13-month time period. Eligible fund family assets not held at D.A. Davidson may be included in the calculation of letters of intent only if the shareholder notifies his or her financial advisor about such assets.
POLICIES REGARDING TRANSACTIONS THROUGH EDWARD JONES
Effective on or after January 15, 2021, the following information supersedes prior information with respect to transactions and positions held in fund shares through an Edward Jones system. Clients of Edward Jones (also referred to as “shareholders”) purchasing fund shares on the Edward Jones commission and fee-based platforms are eligible only for the following sales charge discounts (also referred to as “breakpoints”) and waivers, which can differ from discounts and waivers described elsewhere in this Fund prospectus or statement of additional information (“SAI”) or through another broker-dealer. In all instances, it is the shareholder’s responsibility to inform Edward Jones at the time of purchase of any relationship, holdings of J.P. Morgan Funds, or other facts qualifying the purchaser for discounts or waivers. Edward Jones can ask for documentation of such circumstance. Shareholders should contact Edward Jones if they have questions regarding their eligibility for these discounts and waivers.
Breakpoints
•
Breakpoint pricing, otherwise known as volume pricing, at dollar thresholds as described in the prospectus.
Rights of Accumulation (“ROA”)
•
The applicable sales charge on a purchase of Class A Shares is determined by taking into account all share classes (except certain money market funds and any assets held in group retirement plans) of the J.P. Morgan Funds held by the shareholder or in an account grouped by Edward Jones with other accounts for the purpose of providing certain pricing considerations (“pricing groups”). If grouping assets as a shareholder, this includes all share classes held on the Edward Jones platform and/or held on another platform. The inclusion of eligible fund family assets in the ROA calculation is dependent on the shareholder notifying Edward Jones of such assets at the time of calculation. Money market funds are included only if such shares were sold with a sales charge at the time of purchase or acquired in exchange for shares purchased with a sales charge.
•
The employer maintaining a SEP IRA plan and/or SIMPLE IRA plan may elect to establish or change ROA for the IRA accounts associated with the plan to a plan-level grouping as opposed to including all share classes at a shareholder or pricing group level.
•
ROA is determined by calculating the higher of cost minus redemptions or market value (current shares x NAV).
Letter of Intent (“LOI”)
•
Through a LOI, shareholders can receive the sales charge and breakpoint discounts for purchases shareholders intend to make over a 13-month period from the date Edward Jones receives the LOI. The LOI is determined by calculating the higher of cost or market value of qualifying holdings at LOI initiation in combination with the value that the shareholder intends to buy over a 13-month period to calculate the front-end sales charge and any breakpoint discounts. Each purchase the shareholder makes during that 13-month period will receive the sales charge and breakpoint discount that applies to the total amount. The inclusion of eligible fund family assets in the LOI calculation is dependent on the shareholder notifying Edward Jones of such assets at the time of calculation. Purchases made before the LOI is received by Edward Jones are not adjusted under the LOI and will not reduce the sales charge previously paid. Sales charges will be adjusted if LOI is not met.
•
If the employer maintaining a SEP IRA plan and/or SIMPLE IRA plan has elected to establish or change ROA for the IRA accounts associated with the plan to a plan-level grouping, LOIs will also be at the plan-level and may only be established by the employer.
Front-End Sales Charge Waivers
Sales charges are waived for the following shareholders and in the following situations:
•
Associates of Edward Jones and its affiliates and their family members who are in the same pricing group (as determined by Edward Jones under its policies and procedures) as the associate. This waiver will continue for the remainder of the associate’s life if the associate retires from Edward Jones in good-standing and remains in good standing pursuant to Edward Jones’ policies and procedures.
122 | J.P. Morgan Municipal Bond Funds
•
Shares purchased in an Edward Jones fee-based program.
•
Shares purchased through reinvestment of capital gains distributions and dividend reinvestment.
•
Shares purchased from the proceeds of redeemed shares of the same fund family so long as the following conditions are met: 1) the proceeds are from the sale of shares within 60 days of the purchase, and 2) the sale and purchase are made in the same share class and the same account or the purchase is made in an individual retirement account with proceeds from liquidations in a non-retirement account.
•
Shares exchanged into Class A Shares from another share class so long as the exchange is into the same Fund and was initiated at the discretion of Edward Jones. Edward Jones is responsible for any remaining CDSC due to the fund company, if applicable. Any future purchases are subject to the applicable sales charge as disclosed in a Fund’s prospectus.
•
Exchanges from Class C Shares to Class A Shares of the same Fund, generally, in the 84th month following the anniversary of the purchase date or earlier at the discretion of Edward Jones.
Contingent Deferred Sales Charge (“CDSC”) Waivers
If the shareholder purchases shares that are subject to a CDSC and those shares are redeemed before the CDSC is expired, the shareholder is responsible to pay the CDSC except in the following conditions:
•
The death or disability of the shareholder.
•
Systematic withdrawals with up to 10% per year of the account value.
•
Return of excess contributions from an Individual Retirement Account (IRA).
•
Shares sold as part of a required minimum distribution for IRA and retirement accounts if the redemption is taken in or after the year the shareholder reaches qualified age based on applicable IRS regulations.
•
Shares sold to pay Edward Jones fees or costs in such cases where the transaction is initiated by Edward Jones.
•
Shares exchanged in an Edward Jones fee-based program. Edward Jones is responsible for any remaining CDSC due to the fund company, if applicable.
•
Shares acquired through NAV reinstatement.
•
Shares redeemed at the discretion of Edward Jones for Minimum Balances, as described below.
Other Important Information Regarding Transactions Through Edward Jones
Minimum Purchase Amounts
•
Initial purchase minimum: $250
•
Subsequent purchase minimum: none
Minimum Balances
Edward Jones has the right to redeem at its discretion fund holdings with a balance of $250 or less. The following are examples of accounts that are not included in this policy:
•
A fee-based account held on an Edward Jones platform
•
A 529 account held on an Edward Jones platform
•
An account with an active systematic investment plan or LOI
Exchanging Share Classes
•
At any time it deems necessary, Edward Jones has the authority to exchange at NAV a shareholder’s holdings in a Fund to Class A Shares of the same Fund.
WAIVERS APPLICABLE TO PURCHASES THROUGH JANNEY MONTGOMERY SCOTT LLC
Effective May 1, 2020, if you purchase Fund shares through a Janney Montgomery Scott LLC (“Janney”) brokerage account where the shares are held in an omnibus account at the Fund, you will be eligible for the following load waivers (front-end sales charge waivers and contingent deferred sales charge (“CDSC”), or back-end sales charge, waivers) and discounts, which may differ from those disclosed elsewhere in the Funds’ prospectus or Statement of Additional Information.
Front-end sales charge waivers on Class A Shares available at Janney
•
Shares purchased through reinvestment of capital gains distributions and dividend reinvestment when purchasing shares of the same Fund (but not any other Fund within the fund family).
•
Shares purchased by employees and registered representatives of Janney or its affiliates and their family members as designated by Janney.
July 1, 2022 | 123
Appendix A – Financial Intermediary-Specific Sales Charge Waivers (continued)
•
Shares purchased from the proceeds of redemptions within the same fund family, provided (1) the repurchase occurs within ninety (90) days following the redemption, (2) the redemption and purchase occur in the same account, and (3) redeemed shares were subject to a front-end or deferred sales load (i.e., right of reinstatement).
•
Shares purchased through Employer-sponsored retirement plans (e.g., 401(k) plans, 457 plans, employer-sponsored 403(b) plans, profit sharing and money purchase pension plans and defined benefit plans). For purposes of this provision, employer-sponsored retirement plans do not include SEP IRAs, Simple IRAs, SAR-SEPs or Keogh plans.
•
Shares acquired through a right of reinstatement.
•
Class C Shares that are no longer subject to a contingent deferred sales charge and are exchanged into Class A Shares of the same Fund pursuant to Janney’s policies and procedures.
CDSC waivers on Class A and C Shares available at Janney
•
Shares sold upon the death or disability of the shareholder.
•
Shares sold as part of a systematic withdrawal plan as described in a Fund’s Prospectus.
•
Shares purchased in connection with a return of excess contributions from an IRA account.
•
Shares sold as part of a required minimum distribution for IRA and other retirement accounts as described in a Fund’s Prospectus.
•
Shares sold to pay Janney fees but only if the transaction is initiated by Janney.
•
Shares acquired through a right of reinstatement.
•
Shares exchanged into the same share class of a different Fund within the fund family.
Front-end sales charge discounts available at Janney: breakpoints, rights of accumulation, and/or letters of intent
•
Breakpoints as described in a Fund’s Prospectus.
•
Rights of accumulation (“ROA”), which entitle shareholders to breakpoint discounts, will be automatically calculated based on the aggregated holding of fund family assets held by accounts within the purchaser’s household at Janney. Eligible fund family assets not held at Janney may be included in the ROA calculation only if the shareholder notifies his or her financial advisor about such assets.
•
Letters of intent which allow for breakpoint discounts based on anticipated purchases within a fund family, over a 13-month time period. Eligible fund family assets not held at Janney may be included in the calculation of letters of intent only if the shareholder notifies his or her financial advisor about such assets.
WAIVERS APPLICABLE TO PURCHASES THROUGH LPL FINANCIAL
Shareholders purchasing Fund shares through LPL Financial’s Mutual Fund Only Platform are eligible only for the following front-end sales charge waivers for Class A Shares, which differ from those disclosed elsewhere in this Fund’s prospectus or Statement of Additional Information:
Sales charges will be waived for Class A Shares bought by clients of LPL Financial who are accessing the J.P. Morgan Funds through LPL Financial’s mutual fund only platform.
For accounts where LPL Financial is listed as the broker dealer, the following waiver replaces the first bullet point under item five in “Waiver of the Class A Sales Charge” under the “Sales Charges and Financial Intermediary Compensation” section of each prospectus:
Class A Shares may be purchased without a sales charge by Group Retirement Plans (as defined in the Glossary) which are employer sponsored retirement, deferred compensation, employee benefit plans (including health savings accounts) and trusts used to fund those plans. Please note that no new Group Retirement Plans will be permitted to invest in Class A Shares after April 3, 2017.
WAIVERS APPLICABLE TO PURCHASES THROUGH MERRILL LYNCH
Shareholders purchasing Fund shares through a Merrill Lynch platform or account are eligible only for the following load waivers (front-end sales charge waivers and contingent deferred, or back-end, sales charge waivers) and discounts, which may differ from those disclosed elsewhere in this Fund’s prospectus or Statement of Additional Information. In all instances, it is the purchaser’s responsibility to notify Merrill Lynch at the time of purchase of any relationship or other facts qualifying the purchaser for sales charge waivers or discounts. With regard to these waivers and discounts, Merrill Lynch is responsible for the implementation on the Merrill Lynch platform or accounts.
124 | J.P. Morgan Municipal Bond Funds
Front-end Sales Load Waivers on Class A Shares available at Merrill Lynch
Employer-sponsored retirement, deferred compensation and employee benefit plans (including health savings accounts) and trusts used to fund those plans, provided that the shares are not held in a commission-based brokerage account and shares are held for the benefit of the plan.
Shares purchased by a 529 Plan (does not include 529 Plan units or 529-specific share classes or equivalents).
Exchanges as described in this prospectus.
Shares purchased through a Merrill Lynch affiliated investment advisory program.
Shares exchanged due to the holdings moving from a Merrill Lynch affiliated investment advisory program to a Merrill Lynch brokerage (non-advisory) account pursuant to Merrill Lynch’s policies relating to sales load discounts and waivers.
Shares purchased by third party investment advisors on behalf of their advisory clients through Merrill Lynch’s platform.
Shares of funds purchased through the Merrill Edge Self-Directed platform.
Shares purchased through reinvestment of capital gains distributions and dividend reinvestment when purchasing shares of the same Fund (but not any other Fund within the fund family).
Shares exchanged from Class C (i.e. level-load) shares of the same Fund pursuant to Merrill Lynch’s policies relating to sales load discounts and waivers.
Employees and registered representatives of Merrill Lynch or its affiliates and their family members as defined by Merrill Lynch.
Directors or Trustees of the Fund, and employees of the Fund’s investment adviser or any of its affiliates, as described in this prospectus.
Eligible shares purchased from the proceeds of redemptions within the same fund family, provided (1) the repurchase occurs within 90 days following the redemption, (2) the redemption and purchase occur in the same account, and (3) redeemed shares were subject to a front-end or deferred sales load (known as Rights of Reinstatement). Automated transactions (i.e. systematic purchases and withdrawals) and purchases made after shares are automatically sold to pay Merrill Lynch’s account maintenance fees are not eligible for reinstatement.
CDSC Waivers on Class A and Class C Shares available at Merrill Lynch
Death or disability of the shareholder.
Shares sold as part of a systematic withdrawal plan as described in the Fund’s prospectus.
Return of excess contributions from an IRA Account.
Shares sold as part of a required minimum distribution for IRA and retirement accounts pursuant to the Internal Revenue Code.
Shares sold to pay Merrill Lynch fees but only if the transaction is initiated by Merrill Lynch.
Shares acquired through a right of reinstatement.
Shares held in retirement brokerage accounts, that are exchanged for a lower cost share class due to transfer to certain fee based accounts or platforms.
Shares received through an exchange due to the holdings moving from a Merrill Lynch affiliated investment advisory program to a Merrill Lynch brokerage (non-advisory) account pursuant to Merrill Lynch’s policies relating to sales load discounts and waivers.
Front-end Load Discounts available at Merrill Lynch: Breakpoints, Rights of Accumulation and Letters of Intent
Breakpoints as described in this prospectus.
Rights of Accumulation (ROA) which entitle shareholders to breakpoint discounts as described in the Fund’s prospectus will be automatically calculated based on the aggregated holding of fund family assets held by accounts (including 529 program holdings, where applicable) within the purchaser’s household at Merrill Lynch. Eligible fund family assets not held at Merrill Lynch may be included in the ROA calculation only if the shareholder notifies his or her financial advisor about such assets.
Letters of Intent (LOI) which allow for breakpoint discounts based on anticipated purchases within a fund family, through Merrill Lynch, over a 13-month period of time.
July 1, 2022 | 125
Appendix A – Financial Intermediary-Specific Sales Charge Waivers (continued)
WAIVERS APPLICABLE TO PURCHASES THROUGH TRANSACTIONAL BROKERAGE ACCOUNTS AT MORGAN STANLEY WEALTH MANAGEMENT
Front-end Sales Charge Waivers on Class A Shares available at Morgan Stanley Wealth Management
Shareholders purchasing Fund shares through a Morgan Stanley Wealth Management transactional brokerage account are eligible only for the following front-end sales charge waivers with respect to Class A Shares, which may differ from and may be more limited than those disclosed elsewhere in a Fund’s Prospectus or Statement of Additional Information.
•
Employer-sponsored retirement plans (e.g., 401(k) plans, 457 plans, employer-sponsored 403(b) plans, profit sharing and money purchase pension plans and defined benefit plans). For purposes of this provision, employer-sponsored retirement plans do not include SEPs, Simple IRAs, SARSEPs or Keogh plans.
•
Morgan Stanley employees and employee-related accounts according to Morgan Stanley’s account linking rules.
•
Shares purchased through reinvestment of dividends and capital gains distributions when purchasing shares of the same fund.
•
Shares purchased through a Morgan Stanley self-directed brokerage account.
•
Class C (i.e., level-load) shares that are no longer subject to a contingent deferred sales charge and are exchanged into Class A Shares of the same fund pursuant to Morgan Stanley Wealth Management’s share class conversion program.
•
Shares purchased from the proceeds of redemptions within the same fund family, provided (i) the repurchase occurs within 90 days following the redemption, (ii) the redemption and purchase occur in the same account, and (iii) redeemed shares were subject to a front-end or deferred sales charge.
WAIVERS APPLICABLE TO PURCHASES THROUGH RAYMOND JAMES
Raymond James & Associates, Inc., Raymond James Financial Services, Inc. and each entity’s affiliates are defined as Raymond James.
Shareholders purchasing fund shares through a Raymond James platform or account, or through an introducing broker-dealer or independent registered investment adviser for which Raymond James provides trade execution, clearance, and/or custody services, are eligible only for the following load waivers (front-end sales charge waivers and contingent deferred, or back-end, sales charge waivers) and discounts, which may differ from those disclosed elsewhere in the Funds’ prospectus or Statement of Additional Information.
Front-end Sales Load Waivers on Class A Shares available at Raymond James
•
Shares purchased in an investment advisory program.
•
Shares purchased within the same fund family through a systematic reinvestment of capital gains and dividend distributions.
•
Employees and registered representatives of Raymond James or its affiliates and their family members as designated by Raymond James.
•
Shares purchased from the proceeds of redemptions within the same fund family, provided (1) the repurchase occurs within 90 days following the redemption, (2) the redemption and purchase occur in the same account, and (3) redeemed shares were subject to a front-end or deferred sales load (known as Rights of Reinstatement).
•
A shareholder in a Fund’s Class C Shares will have their shares converted at net asset value to Class A Shares (or the appropriate share class) of the Fund if the shares are no longer subject to a CDSC and the conversion is in line with the policies and procedures of Raymond James.
CDSC Waivers on Class A and Class C Shares available at Raymond James
•
Death or disability of the shareholder.
•
Shares sold as part of a systematic withdrawal plan as described in the Funds’ prospectus.
•
Return of excess contributions from an IRA Account.
•
Shares sold as part of a required minimum distribution for IRA and retirement accounts due to the shareholder reaching the qualified age based on applicable IRS regulations as described in the Funds’ prospectus.
•
Shares sold to pay Raymond James fees but only if the transaction is initiated by Raymond James.
•
Shares acquired through a right of reinstatement.
Front-end Load Discounts available at Raymond James: Breakpoints, Rights of Accumulation, and/or Letters of Intent
•
Breakpoints as described in this prospectus.
126 | J.P. Morgan Municipal Bond Funds
•
Rights of accumulation which entitle shareholders to breakpoint discounts will be automatically calculated based on the aggregated holding of fund family assets held by accounts within the purchaser’s household at Raymond James. Eligible fund family assets not held at Raymond James may be included in the calculation of rights of accumulation only if the shareholder notifies his or her financial advisor about such assets.
•
Letters of intent which allow for breakpoint discounts based on anticipated purchases within a fund family, over a 13-month time period. Eligible fund family assets not held at Raymond James may be included in the calculation of letters of intent only if the shareholder notifies his or her financial advisor about such assets.
WAIVERS APPLICABLE TO PURCHASES THROUGH OPPENHEIMER & CO. INC.
Shareholders purchasing Fund shares through an Oppenheimer & Co. Inc. (“OPCO”) platform or account are eligible only for the following load waivers (front-end sales charge waivers and contingent deferred, or back-end, sales charge waivers) and discounts, which may differ from those disclosed elsewhere in this Fund’s prospectus or SAI.
Front-end sales load waivers on Class A Shares available at OPCO
•
Employer-sponsored retirement, deferred compensation and employee benefit plans (including health savings accounts) and trusts used to fund those plans, provided that the shares are not held in a commission-based brokerage account and shares are held for the benefit of the plan.
•
Shares purchased through a OPCO affiliated investment advisory program.
•
Shares purchased through reinvestment of capital gains distributions and dividend reinvestment when purchasing shares of the same fund (but not any other fund within the fund family).
•
Shares purchased from the proceeds of redemptions within the same fund family, provided (1) the repurchase occurs within 90 days following the redemption, (2) the redemption and purchase occur in the same account, and (3) redeemed shares were subject to a front-end or deferred sales load (known as Rights of Restatement).
•
A shareholder in the Fund’s Class C shares will have their shares exchanged at net asset value to Class A shares (or the appropriate share class) of the Fund if the shares are no longer subject to a CDSC and the exchange is in line with the policies and procedures of OPCO.
•
Employees and registered representatives of OPCO or its affiliates and their family members.
•
Directors or Trustees of the Fund, and employees of the Fund’s investment adviser or any of its affiliates, as described in this prospectus.
CDSC Waivers on Class A and Class C Shares available at OPCO
•
Death or disability of the shareholder.
•
Shares sold as part of a systematic withdrawal plan as described in the Funds’ prospectus.
•
Return of excess contributions from an IRA Account.
•
Shares sold as part of a required minimum distribution for IRA or other qualifying retirement accounts as described in the Funds’ prospectus.
•
Shares sold to pay OPCO fees but only if the transaction is initiated by OPCO.
•
Shares acquired through a right of reinstatement.
Front-end load discounts available at OPCO: breakpoints, rights of accumulation, and/or letters of intent
•
Breakpoints as described in this prospectus.
•
Rights of Accumulation (“ROA”) and Letters of Intent (“LOI”), which entitle shareholders to breakpoint discounts, will be automatically calculated based on the aggregated holding of fund family assets held by accounts within the purchaser’s household at OPCO. Eligible fund family assets not held at OPCO may be included in the ROA or LOI calculation only if the shareholder notifies his or her financial advisor about such assets.
WAIVERS APPLICABLE TO PURCHASES THROUGH ROBERT W. BAIRD & CO. INC.
Shareholders purchasing fund shares through a Robert W. Baird & Co. Inc. (“Baird”) platform or account will only be eligible for the following sales charge waivers (front-end sales charge waivers and CDSC waivers) and discounts, which may differ from those disclosed elsewhere in this prospectus or the SAI.
Front-end sales charge waivers on Class A Shares available at Baird
•
Shares purchased through reinvestment of capital gains distributions and dividend reinvestment when purchasing shares of the same fund.
July 1, 2022 | 127
Appendix A – Financial Intermediary-Specific Sales Charge Waivers (continued)
•
Shares purchased by employees and registers representatives of Baird or its affiliate and their family members as designated by Baird.
•
Shares purchased from the proceeds of redemptions within the same fund family, provided (1) the repurchase occurs within 90 days following the redemption, (2) the redemption and purchase occur in the same account, and (3) redeemed shares were subject to a front-end or deferred sales charge (known as rights of reinstatement).
•
A shareholder in the Fund’s Class C Shares will have their shares exchanged at net asset value to Class A Shares of the fund if the shares are no longer subject to CDSC and the exchange is in line with the policies and procedures of Baird.
•
Employer-sponsored retirement plans or charitable accounts in a transactional brokerage account at Baird, including 401(k) plans, 457 plans, employer-sponsored 403(b) plans, profit sharing and money purchase pension plans and defined benefit plans. For purposes of this provision, employer-sponsored retirement plans do not include SEP IRAs, Simple IRAs or SAR-SEPs.
CDSC Waivers on Class A and Class C Shares available at Baird
•
Shares sold due to death or disability of the shareholder.
•
Shares sold as part of a systematic withdrawal plan as described in the Fund’s Prospectus.
•
Shares bought due to returns of excess contributions from an IRA Account.
•
Shares sold as part of a required minimum distribution for IRA or other qualifying retirement accounts as described in the Fund’s prospectus.
•
Shares sold to pay Baird fees but only if the transaction is initiated by Baird.
•
Shares acquired through a right of reinstatement.
Front-end sales charge discounts available at Baird: breakpoints and/or rights of accumulations
•
Breakpoints as described in this prospectus.
•
Rights of accumulations which entitle shareholders to breakpoint discounts will be automatically calculated based on the aggregated holding of fund family assets held by accounts within the purchaser’s household at Baird. Eligible fund family assets not held at Baird may be included in the rights of accumulations calculation only if the shareholder notifies his or her financial advisor about such assets.
•
Letters of Intent (LOI) allow for breakpoint discounts based on anticipated purchases within a fund family, through Baird, over a 13-month period of time.
WAIVERS APPLICABLE TO PURCHASES THROUGH STIFEL, NICOLAUS & COMPANY, INC.
Shareholders purchasing Fund Shares through a Stifel, Nicolaus & Company(“Stifel”) platform or account or who own shares for which Stifel or an affiliate is the broker-dealer of record are eligible for the following additional sales charge waiver.
Front-End Sales Load Waiver on Class A Shares Available at Stifel
Class C Shares that are no longer subject to a contingent deferred sales charge and that are exchanged to Class A Shares of the same Fund pursuant to Stifel’s policies and procedures.
All other sales charge waivers and reductions described elsewhere in a Fund’s prospectus or Statement of Additional Information still apply.
WAIVERS APPLICABLE TO PURCHASES THROUGH U.S. BANCORP INVESTMENTS
Shareholders purchasing Fund shares through a U.S. Bancorp Investments (USBI) platform or account or who own shares for which USBI is the broker-dealer of record and where the shares are held in an omnibus account at the Fund will be eligible for the following additional sales charge waiver.
Front-end Sales Load Waiver on Class A Shares available at U.S. Bancorp Investments
Class C Shares that are no longer subject to a contingent deferred sales charge and that are exchanged by USBI to the Class A Shares of the same Fund pursuant to USBI’s share class exchange policy.
All other sales charge waivers and reductions described elsewhere in a Fund’s Prospectus or SAI still apply.
128 | J.P. Morgan Municipal Bond Funds
How to Reach Us
MORE INFORMATION
For investors who want more information on these Funds the following documents are available free upon request:
ANNUAL AND SEMI-ANNUAL REPORTS
Our annual and semi-annual reports contain more information about each Fund’s investments and performance. The annual report also includes details about the market conditions and investment strategies that had a significant effect on each Fund’s performance during the last fiscal year.
STATEMENT OF ADDITIONAL INFORMATION (SAI)
The SAI contains more detailed information about the Funds and their policies. It is incorporated by reference into this prospectus. This means, by law, it is considered to be part of this prospectus.
You can get a free copy of these documents and other information, or ask us any questions, by calling us at 1-800-480-4111 or writing to:
J.P. Morgan Funds Services
P.O. Box 219143
Kansas City, MO 64121-9143
P.O. Box 219143
Kansas City, MO 64121-9143
If you buy your shares through a Financial Intermediary, you should contact that Financial Intermediary directly for this information. You can also find information online at www.jpmorganfunds.com.
Reports, a copy of the SAI, and other information about the Funds are also available on the EDGAR Database on the Commission’s Internet site at http://www.sec.gov, and copies of this information may be obtained, after paying a duplicating fee, by electronic request at the following E-mail address: publicinfo@sec.gov.
Investment Company Act File No. for each of the Funds, except the California Tax Free Bond Fund, Intermediate Tax Free Bond Fund and New York Tax Free Bond Fund is 811-4236.
Investment Company Act File No. for the California Tax Free Bond Fund, Intermediate Tax Free Bond Fund and New York Tax Free Bond Fund is 811-21295.
©JPMorgan Chase & Co. 2022. All rights reserved. July 2022.


PR-MBTFACI-722-2
Prospectus
J.P. Morgan Municipal Bond Funds
Class R6 Shares
July 1, 2022, as supplemented March 9, 2023
JPMorgan Sustainable Municipal Income Fund
Class/Ticker: R6/HLTZX
JPMorgan Short-Intermediate Municipal Bond Fund
Class/Ticker: R6/OSTSX
JPMorgan Tax Free Bond Fund
Class/Ticker: R6/RUNFX
JPMorgan California Tax Free Bond Fund
Class/Ticker: R6/JCBSX
JPMorgan High Yield Municipal Fund
Class/Ticker: R6/ JTIRX
JPMorgan Intermediate Tax Free Bond Fund
Class/Ticker: R6/JITZX
JPMorgan New York Tax Free Bond Fund
Class/Ticker: R6/VINRX
The Securities and Exchange Commission and the Commodity Futures Trading Commission have not approved or disapproved of these securities or determined if this prospectus is truthful or complete. Any representation to the contrary is a criminal offense.
Contents
| | |
| 1 | |
| 7 | |
| 13 | |
| 18 | |
| 24 | |
| 30 | |
| 36 | |
| 42 | |
| 42 | |
| 43 | |
| 46 | |
| 55 | |
| 55 | |
| 55 | |
| 55 | |
| 57 | |
| 60 |
| 60 | |
| 62 | |
| 62 | |
| 64 | |
| 66 | |
| 68 | |
| 68 | |
| 69 | |
| 70 | |
| 73 | |
| 73 | |
| 73 | |
| 75 | |
| 76 | |
| 84 | |
| 98 | |
| Back cover |
JPMorgan Sustainable Municipal Income Fund
| | |
| |
Class R6 |
| Management Fees |
|
| Distribution (Rule 12b-1) Fees |
|
| Other Expenses |
|
| Service Fees |
|
| Remainder of Other Expenses |
|
| Total Annual Fund Operating Expenses |
|
| Fee Waivers and/or Expense Reimbursements1 |
- |
| Total Annual Fund Operating Expenses after Fee Waivers and/or Expense Reimbursements1 |
|
1
| | ||||
| |
1 Year |
3 Years |
5 Years |
10 Years |
| CLASS R6 SHARES ($) |
|
|
|
|
July 1, 2022 | 1
JPMorgan Sustainable Municipal Income Fund (continued)
2 | J.P. Morgan Municipal Bond Funds
July 1, 2022 | 3
JPMorgan Sustainable Municipal Income Fund (continued)
4 | J.P. Morgan Municipal Bond Funds
| |
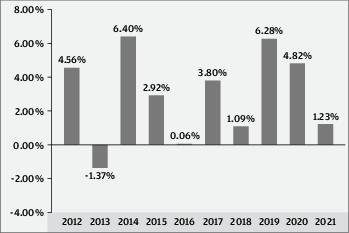
| |
|
|
| |
|
|
| |
|
|
|
|
|
July 1, 2022 | 5
JPMorgan Sustainable Municipal Income Fund (continued)
| | |||
| |
Past 1 Year |
Past 5 Years |
Past 10 Years |
| CLASS R6 SHARES |
|
|
|
| Return Before Taxes |
|
|
|
| Return After Taxes on Distributions |
|
|
|
| Return After Taxes on Distributions and Sale of Fund Shares |
|
|
|
| BLOOMBERG U.S. 1-15 YEAR BLEND (1-17) MUNICIPAL BOND INDEX (Reflects No Deduction for Fees, Expenses, or Taxes) |
|
|
|
Management
J.P. Morgan Investment Management Inc. (the adviser)
| Portfolio Manager |
Managed the Fund Since |
Primary Title with Investment Adviser |
| Kevin M. Ellis |
2020 |
Managing Director |
| Wayne Godlin |
2020 |
Managing Director |
| David Sivinski |
2006 |
Executive Director |
Purchase and Sale of Fund Shares
Purchase minimums
| For Class R6 Shares |
|
| To establish an account |
$5,000,000 for Discretionary Accounts $5,000,000 for Institutional Investors $15,000,000 for Other Investors |
| To add to an account |
No minimum levels |
There is no minimum investment for other eligible Class R6 investors, as described in the “Investing with J.P. Morgan Funds – Choosing a Share Class – Eligibility” section.
In general, you may purchase or redeem shares on any business day:
•
Through your Financial Intermediary or the eligible retirement plan or college savings plan through which you invest in the Fund
•
By writing to J.P. Morgan Funds Services, P.O. Box 219143, Kansas City, MO 64121-9143
•
After you open an account, by calling J.P. Morgan Funds Services at 1-800-480-4111
Tax Information
The Fund’s distributions of interest on municipal bonds generally are not subject to federal income tax; however the Fund may distribute taxable dividends, including distributions of short-term capital gains, and long-term capital gains. In addition, interest on certain bonds may be subject to the federal alternative minimum tax. To the extent that the Fund’s distributions are derived from interest on bonds that are not exempt from applicable state and local taxes, such distributions will be subject to such state and local taxes. When your investment is in a 401(k) plan or other tax-advantaged investment plan, you may be subject to federal income tax on ordinary income or capital gains upon withdrawal from the tax-advantaged investment plan.
Payments to Broker-Dealers and Other Financial Intermediaries
If you purchase shares of the Fund through a broker-dealer or other financial intermediary (such as a bank), the Fund and its related companies may pay the financial intermediary for the sale of Fund shares and related services. These payments may create a conflict of interest by influencing the broker-dealer or financial intermediary and your salesperson to recommend the Fund over another investment. Ask your salesperson or visit your financial intermediary’s website for more information.
6 | J.P. Morgan Municipal Bond Funds
JPMorgan Short-Intermediate Municipal Bond Fund
| | |
| |
Class R6 |
| Management Fees |
|
| Distribution (Rule 12b-1) Fees |
|
| Other Expenses |
|
| Service Fees |
|
| Remainder of Other Expenses |
|
| Acquired Fund Fees and Expenses |
|
| Total Annual Fund Operating Expenses |
|
| Fee Waivers and/or Expense Reimbursements1 |
- |
| Total Annual Fund Operating Expenses after Fee Waivers and/or Expense Reimbursements1 |
|
1
| | ||||
| |
1 Year |
3 Years |
5 Years |
10 Years |
| CLASS R6 SHARES ($) |
|
|
|
|
July 1, 2022 | 7
JPMorgan Short-Intermediate Municipal Bond Fund (continued)
8 | J.P. Morgan Municipal Bond Funds
July 1, 2022 | 9
JPMorgan Short-Intermediate Municipal Bond Fund (continued)
10 | J.P. Morgan Municipal Bond Funds
| |
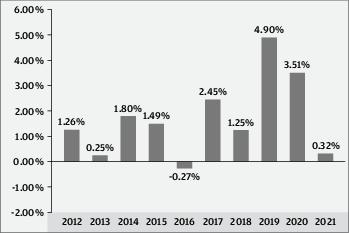
| |
|
|
| |
|
|
| |
|
|
|
|
|
| | |||
| |
Past 1 Year |
Past 5 Years |
Past 10 Years |
| CLASS R6 SHARES |
|
|
|
| Return Before Taxes |
|
|
|
| Return After Taxes on Distributions |
|
|
|
| Return After Taxes on Distributions and Sale of Fund Shares |
|
|
|
| BLOOMBERG U.S. 1-5 YEAR BLEND (1-6) MUNICIPAL BOND INDEX (Reflects No Deduction for Fees, Expenses, or Taxes) |
|
|
|
Management
J.P. Morgan Investment Management Inc. (the adviser)
| Portfolio Manager |
Managed the Fund Since |
Primary Title with Investment Adviser |
| James Ahn |
2006 |
Managing Director |
| Kevin M. Ellis |
2006 |
Managing Director |
July 1, 2022 | 11
JPMorgan Short-Intermediate Municipal Bond Fund (continued)
Purchase and Sale of Fund Shares
Purchase minimums
| For Class R6 Shares |
|
| To establish an account |
$5,000,000 for Discretionary Accounts $5,000,000 for Institutional Investors $15,000,000 for Other Investors |
| To add to an account |
No minimum levels |
There is no minimum investment for other eligible Class R6 investors, as described in the “Investing with J.P. Morgan Funds – Choosing a Share Class – Eligibility” section.
In general, you may purchase or redeem shares on any business day:
•
Through your Financial Intermediary or the eligible retirement plan or college savings plan through which you invest in the Fund
•
By writing to J.P. Morgan Funds Services, P.O. Box 219143, Kansas City, MO 64121-9143
•
After you open an account, by calling J.P. Morgan Funds Services at 1-800-480-4111
Tax Information
The Fund’s distributions of interest on municipal bonds generally are not subject to federal income tax; however the Fund may distribute taxable dividends, including distributions of
short-term capital gains, and long-term capital gains. In addition, interest on certain bonds may be subject to the federal alternative minimum tax. To the extent that the Fund’s distributions are derived from interest on bonds that are not exempt from applicable state and local taxes, such distributions will be subject to such state and local taxes. When your investment is in a 401(k) plan or other tax-advantaged investment plan, you may be subject to federal income tax on ordinary income or capital gains upon withdrawal from the tax-advantaged investment plan.
Payments to Broker-Dealers and Other Financial Intermediaries
If you purchase shares of the Fund through a broker-dealer or other financial intermediary (such as a bank), the Fund and its related companies may pay the financial intermediary for the sale of Fund shares and related services. These payments may create a conflict of interest by influencing the broker-dealer or financial intermediary and your salesperson to recommend the Fund over another investment. Ask your salesperson or visit your financial intermediary’s website for more information.
12 | J.P. Morgan Municipal Bond Funds
JPMorgan Tax Free Bond Fund
| | |
| |
Class R6 |
| Management Fees |
|
| Distribution (Rule 12b-1) Fees |
|
| Other Expenses |
|
| Service Fees |
|
| Remainder of Other Expenses |
|
| Total Annual Fund Operating Expenses |
|
| Fee Waivers and/or Expense Reimbursements1 |
- |
| Total Annual Fund Operating Expenses after Fee Waivers and/or Expense Reimbursements1 |
|
1
| | ||||
| |
1 Year |
3 Years |
5 Years |
10 Years |
| CLASS R6 SHARES ($) |
|
|
|
|
July 1, 2022 | 13
JPMorgan Tax Free Bond Fund (continued)
14 | J.P. Morgan Municipal Bond Funds
July 1, 2022 | 15
JPMorgan Tax Free Bond Fund (continued)
| |
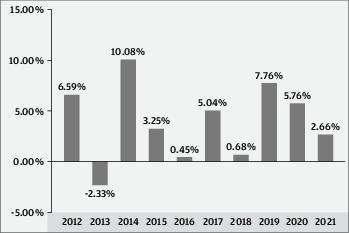
| |
|
|
| |
|
|
16 | J.P. Morgan Municipal Bond Funds
| |
|
|
|
|
|
| | |||
| |
Past 1 Year |
Past 5 Years |
Past 10 Years |
| CLASS R6 SHARES |
|
|
|
| Return Before Taxes |
|
|
|
| Return After Taxes on Distributions |
|
|
|
| Return After Taxes on Distributions and Sale of Fund Shares |
|
|
|
| BLOOMBERG US MUNICIPAL INDEX (Reflects No Deduction for Fees, Expenses, or Taxes) |
|
|
|
Management
J.P. Morgan Investment Management Inc. (the adviser)
| Portfolio Manager |
Managed the Fund Since |
Primary Title with Investment Adviser |
| Richard Taormina |
2005 |
Managing Director |
| Michelle Hallam |
2014 |
Executive Director |
Purchase and Sale of Fund Shares
Purchase minimums
| For Class R6 Shares |
|
| To establish an account |
$5,000,000 for Discretionary Accounts $5,000,000 for Institutional Investors $15,000,000 for Other Investors |
| To add to an account |
No minimum levels |
There is no minimum investment for other eligible Class R6 investors, as described in the “Investing with J.P. Morgan Funds – Choosing a Share Class – Eligibility” section.
In general, you may purchase or redeem shares on any business day:
•
Through your Financial Intermediary or the eligible retirement plan or college savings plan through which you invest in the Fund
•
By writing to J.P. Morgan Funds Services, P.O. Box 219143, Kansas City, MO 64121-9143
•
After you open an account, by calling J.P. Morgan Funds Services at 1-800-480-4111
Tax Information
The Fund’s distributions of interest on municipal bonds generally are not subject to federal income tax; however the Fund may distribute taxable dividends, including distributions of short-term capital gains, and long-term capital gains. In addition, interest on certain bonds may be subject to the federal alternative minimum tax. To the extent that the Fund’s distributions are derived from interest on bonds that are not exempt from applicable state and local taxes, such distributions will be subject to such state and local taxes. When your investment is in a 401(k) plan or other tax-advantaged investment plan, you may be subject to federal income tax on ordinary income or capital gains upon withdrawal from the tax-advantaged investment plan.
Payments to Broker-Dealers and Other Financial Intermediaries
If you purchase shares of the Fund through a broker-dealer or other financial intermediary (such as a bank), the Fund and its related companies may pay the financial intermediary for the sale of Fund shares and related services. These payments may create a conflict of interest by influencing the broker-dealer or financial intermediary and your salesperson to recommend the Fund over another investment. Ask your salesperson or visit your financial intermediary’s website for more information.
July 1, 2022 | 17
JPMorgan California Tax Free Bond Fund
| | |
| |
Class R6 |
| Management Fees |
|
| Distribution (Rule 12b-1) Fees |
|
| Other Expenses |
|
| Service Fees |
|
| Remainder of Other Expenses |
|
| Total Annual Fund Operating Expenses |
|
| Fee Waivers and/or Expense Reimbursements1 |
- |
| Total Annual Fund Operating Expenses after Fee Waivers and/or Expense Reimbursements1 |
|
1
| | ||||
| |
1 Year |
3 Years |
5 Years |
10 Years |
| CLASS R6 SHARES ($) |
|
|
|
|
18 | J.P. Morgan Municipal Bond Funds
July 1, 2022 | 19
JPMorgan California Tax Free Bond Fund (continued)
20 | J.P. Morgan Municipal Bond Funds
July 1, 2022 | 21
JPMorgan California Tax Free Bond Fund (continued)
| |
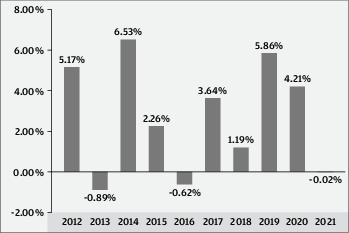
| |
|
|
| |
|
|
| |
|
|
|
|
|
| | |||
| |
Past 1 Year |
Past 5 Years |
Past 10 Years |
| CLASS R6 SHARES |
|
|
|
| Return Before Taxes |
- |
|
|
| Return After Taxes on Distributions |
- |
|
|
| Return After Taxes on Distributions and Sale of Fund Shares |
|
|
|
| BLOOMBERG LB CALIFORNIA 1-17 YEAR MUNI INDEX (Reflects No Deduction for Fees, Expenses, or Taxes) |
|
|
|
Management
J.P. Morgan Investment Management Inc. (the adviser)
| Portfolio Manager |
Managed the Fund Since |
Primary Title with Investment Adviser |
| David Sivinski |
2005 |
Executive Director |
| Michelle Hallam |
2004 |
Executive Director |
22 | J.P. Morgan Municipal Bond Funds
Purchase and Sale of Fund Shares
Purchase minimums
| For Class R6 Shares |
|
| To establish an account |
$5,000,000 for Discretionary Accounts $5,000,000 for Institutional Investors $15,000,000 for Other Investors |
| To add to an account |
No minimum levels |
There is no minimum investment for other eligible Class R6 investors, as described in the “Investing with J.P. Morgan Funds – Choosing a Share Class – Eligibility” section.
In general, you may purchase or redeem shares on any business day:
•
Through your Financial Intermediary or the eligible retirement plan or college savings plan through which you invest in the Fund
•
By writing to J.P. Morgan Funds Services, P.O. Box 219143, Kansas City, MO 64121-9143
•
After you open an account, by calling J.P. Morgan Funds Services at 1-800-480-4111
Tax Information
The Fund’s distributions of interest on municipal bonds generally are not subject to federal income tax; however the Fund may distribute taxable dividends, including distributions of
short-term capital gains, and long-term capital gains. In addition, interest on certain bonds may be subject to the federal alternative minimum tax. To the extent that the Fund’s distributions are derived from interest on bonds that are not exempt from applicable state and local taxes, such distributions will be subject to such state and local taxes. When your investment is in a 401(k) plan or other tax-advantaged investment plan, you may be subject to federal income tax on ordinary income or capital gains upon withdrawal from the tax-advantaged investment plan.
Payments to Broker-Dealers and Other Financial Intermediaries
If you purchase shares of the Fund through a broker-dealer or other financial intermediary (such as a bank), the Fund and its related companies may pay the financial intermediary for the sale of Fund shares and related services. These payments may create a conflict of interest by influencing the broker dealer or financial intermediary and your salesperson to recommend the Fund over another investment. Ask your salesperson or visit your financial intermediary’s website for more information.
July 1, 2022 | 23
JPMorgan High Yield Municipal Fund
| | |
| |
Class R6 |
| Management Fees |
|
| Distribution (Rule 12b-1) Fees |
|
| Other Expenses |
|
| Service Fees |
|
| Remainder of Other Expenses |
|
| Total Annual Fund Operating Expenses |
|
| Fee Waivers and/or Expense Reimbursements1 |
- |
| Total Annual Fund Operating Expenses after Fee Waivers and/or Expense Reimbursements1 |
|
1
| | ||||
| |
1 Year |
3 Years |
5 Years |
10 Years |
| CLASS R6 SHARES ($) |
|
|
|
|
24 | J.P. Morgan Municipal Bond Funds
July 1, 2022 | 25
JPMorgan High Yield Municipal Fund (continued)
26 | J.P. Morgan Municipal Bond Funds
July 1, 2022 | 27
JPMorgan High Yield Municipal Fund (continued)
28 | J.P. Morgan Municipal Bond Funds
| |

| |
|
|
| |
|
|
| |
|
|
|
|
|
| | |||
| |
Past 1 Year |
Past 5 Years |
Past 10 Years |
| CLASS R6 SHARES |
|
|
|
| Return Before Taxes |
|
|
|
| Return After Taxes on Distributions |
|
|
|
| Return After Taxes on Distributions and Sale of Fund Shares |
|
|
|
| BLOOMBERG US MUNICIPAL INDEX (Reflects No Deduction for Fees, Expenses, or Taxes) |
|
|
|
| BLOOMBERG HIGH YIELD MUNICIPAL BOND INDEX (Reflects No Deduction for Fees, Expenses, or Taxes) |
|
|
|
Management
J.P. Morgan Investment Management Inc. (the adviser)
| Portfolio Manager |
Managed the Fund Since |
Primary Title with Investment Adviser |
| Wayne Godlin |
2018 |
Managing Director |
| Richard Taormina |
2007 |
Managing Director |
| Kevin M. Ellis |
2018 |
Managing Director |
Purchase and Sale of Fund Shares
Purchase minimums
| For Class R6 Shares |
|
| To establish an account |
$5,000,000 for Discretionary Accounts $5,000,000 for Institutional Investors $15,000,000 for Other Investors |
| To add to an account |
No minimum levels |
There is no minimum investment for other eligible Class R6 investors, as described in the “Investing with J.P. Morgan Funds – Choosing a Share Class – Eligibility” section.
In general, you may purchase or redeem shares on any business day:
•
Through your Financial Intermediary or the eligible retirement plan or college savings plan through which you invest in the Fund
•
By writing to J.P. Morgan Funds Services, P.O. Box 219143, Kansas City, MO 64121-9143
•
After you open an account, by calling J.P. Morgan Funds Services at 1-800-480-4111
Tax Information
The Fund’s distributions of interest on municipal bonds generally are not subject to federal income tax; however the Fund will distribute taxable dividends, including distributions of short-term gains, and long-term gains. In addition, interest on certain bonds may be subject to the federal alternative minimum tax. To the extent that the Fund’s distributions are derived from interest on bonds that are not exempt from applicable state and local taxes, such distributions will be subject to such state and local taxes.
Payments to Broker-Dealers and Other Financial Intermediaries
If you purchase shares of the Fund through a broker-dealer or other financial intermediary (such as a bank), the Fund and its related companies may pay the financial intermediary for the sale of Fund shares and related services. These payments may create a conflict of interest by influencing the broker-dealer or financial intermediary and your salesperson to recommend the Fund over another investment. Ask your salesperson or visit your financial intermediary’s website for more information.
July 1, 2022 | 29
JPMorgan Intermediate Tax Free Bond Fund
| | |
| |
Class R6 |
| Management Fees |
|
| Distribution (Rule 12b-1) Fees |
|
| Other Expenses |
|
| Service Fees |
|
| Remainder of Other Expenses |
|
| Total Annual Fund Operating Expenses |
|
| Fee Waivers and/or Expense Reimbursements1 |
- |
| Total Annual Fund Operating Expenses after Fee Waivers and/or Expense Reimbursements1 |
|
1
| | ||||
| |
1 Year |
3 Years |
5 Years |
10 Years |
| CLASS R6 SHARES ($) |
|
|
|
|
30 | J.P. Morgan Municipal Bond Funds
July 1, 2022 | 31
JPMorgan Intermediate Tax Free Bond Fund (continued)
32 | J.P. Morgan Municipal Bond Funds
July 1, 2022 | 33
JPMorgan Intermediate Tax Free Bond Fund (continued)
| |
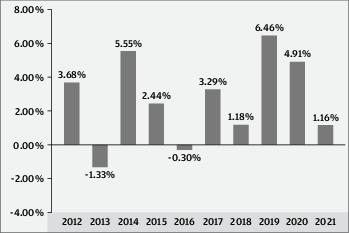
| |
|
|
| |
|
|
| |
|
|
|
|
|
| | |||
| |
Past 1 Year |
Past 5 Years |
Past 10 Years |
| CLASS R6 SHARES |
|
|
|
| Return Before Taxes |
|
|
|
| Return After Taxes on Distributions |
|
|
|
| Return After Taxes on Distributions and Sale of Fund Shares |
|
|
|
| BLOOMBERG U.S. 1-15 YEAR BLEND (1-17) MUNICIPAL BOND INDEX (Reflects No Deduction for Fees, Expenses, or Taxes) |
|
|
|
Management
J.P. Morgan Investment Management Inc. (the adviser)
| Portfolio Managers |
Managed the Fund Since |
Primary Title with Investment Adviser |
| Richard Taormina |
2006 |
Managing Director |
| David Sivinski |
2005 |
Executive Director |
| Kevin M. Ellis |
2014 |
Managing Director |
Purchase and Sale of Fund Shares
Purchase minimums
| For Class R6 Shares |
|
| To establish an account |
$5,000,000 for Discretionary Accounts $5,000,000 for Institutional Investors $15,000,000 for Other Investors |
| To add to an account |
No minimum levels |
There is no minimum investment for other eligible Class R6 investors, as described in the “Investing with J.P. Morgan Funds – Choosing a Share Class – Eligibility” section.
In general, you may purchase or redeem shares on any business day:
•
Through your Financial Intermediary or the eligible retirement plan or college savings plan through which you invest in the Fund
•
By writing to J.P. Morgan Funds Services, P.O. Box 219143, Kansas City, MO 64121-9143
•
After you open an account, by calling J.P. Morgan Funds Services at 1-800-480-4111
Tax Information
The Fund’s distributions of interest on municipal bonds generally are not subject to federal income tax; however the Fund may distribute taxable dividends, including distributions of short-term capital gains, and long-term capital gains. In addition, interest on certain bonds may be subject to the federal alternative minimum tax. To the extent that the Fund’s distributions are derived from interest on bonds that are not exempt from applicable state and local taxes, such distributions will be subject to such state and local taxes. When your investment is in a 401(k) plan or other tax-advantaged investment plan, you may be subject to federal income tax on ordinary income or capital gains upon withdrawal from the tax-advantaged investment plan.
34 | J.P. Morgan Municipal Bond Funds
Payments to Broker-Dealers and Other Financial Intermediaries
If you purchase shares of the Fund through a broker-dealer or other financial intermediary (such as a bank), the Fund and its related companies may pay the financial intermediary for the sale of Fund shares and related services. These payments may
create a conflict of interest by influencing the broker-dealer or financial intermediary and your salesperson to recommend the Fund over another investment. Ask your salesperson or visit your financial intermediary’s website for more information.
July 1, 2022 | 35
JPMorgan New York Tax Free Bond Fund
| | |
| |
Class R6 |
| Management Fees |
|
| Distribution (Rule 12b-1) Fees |
|
| Other Expenses |
|
| Service Fees |
|
| Remainder of Other Expenses |
|
| Total Annual Fund Operating Expenses |
|
| Fee Waivers and/or Expense Reimbursements1 |
- |
| Total Annual Fund Operating Expenses after Fee Waivers and/or Expense Reimbursements1 |
|
1
| | ||||
| |
1 Year |
3 Years |
5 Years |
10 Years |
| CLASS R6 SHARES ($) |
|
|
|
|
36 | J.P. Morgan Municipal Bond Funds
July 1, 2022 | 37
JPMorgan New York Tax Free Bond Fund (continued)
38 | J.P. Morgan Municipal Bond Funds
July 1, 2022 | 39
JPMorgan New York Tax Free Bond Fund (continued)
| |
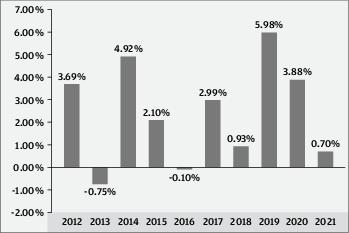
| |
|
|
| |
|
|
| |
|
|
|
|
|
| | |||
| |
Past 1 Year |
Past 5 Years |
Past 10 Years |
| CLASS R6 SHARES |
|
|
|
| Return Before Taxes |
|
|
|
| Return After Taxes on Distributions |
|
|
|
| Return After Taxes on Distributions and Sale of Fund Shares |
|
|
|
| BLOOMBERG NEW YORK INTERMEDI- ATE (1-17 YEAR) MATURITIES INDEX (Reflects No Deduction for Fees, Expenses, or Taxes) |
|
|
|
Management
J.P. Morgan Investment Management Inc. (the adviser)
| Portfolio Manager |
Managed the Fund Since |
Primary Title with Investment Adviser |
| David Sivinski |
2005 |
Executive Director |
| Kevin M. Ellis |
2005 |
Managing Director |
Purchase and Sale of Fund Shares
Purchase minimums
| For Class R6 Shares |
|
| To establish an account |
$5,000,000 for Discretionary Accounts $5,000,000 for Institutional Investors $15,000,000 for Other Investors |
| To add to an account |
No minimum levels |
There is no minimum investment for other eligible Class R6 investors, as described in the “Investing with J.P. Morgan Funds – Choosing a Share Class – Eligibility” section.
In general, you may purchase or redeem shares on any business day:
•
Through your Financial Intermediary or the eligible retirement plan or college savings plan through which you invest in the Fund
•
By writing to J.P. Morgan Funds Services, P.O. Box 219143, Kansas City, MO 64121-9143
40 | J.P. Morgan Municipal Bond Funds
•
After you open an account, by calling J.P. Morgan Funds Services at 1-800-480-4111
Tax Information
The Fund’s distributions of interest on municipal bonds generally are not subject to federal income tax; however the Fund may distribute taxable dividends, including distributions of short-term capital gains, and long-term capital gains. In addition, interest on certain bonds may be subject to the federal alternative minimum tax. To the extent that the Fund’s distributions are derived from interest on bonds that are not exempt from applicable state and local taxes, such distributions will be subject to such state and local taxes. When your investment is in a 401(k) plan or other tax-advantaged investment plan, you may be subject to federal income tax on ordinary income or capital gains upon withdrawal from the tax-advantaged investment plan.
Payments to Broker-Dealers and Other Financial Intermediaries
If you purchase shares of the Fund through a broker-dealer or other financial intermediary (such as a bank), the Fund and its related companies may pay the financial intermediary for the sale of Fund shares and related services. These payments may create a conflict of interest by influencing the broker-dealer or financial intermediary and your salesperson to recommend the Fund over another investment. Ask your salesperson or visit your financial intermediary’s website for more information.
July 1, 2022 | 41
More About the Funds
Additional Information About the Funds’ Investment Strategies
The Funds are managed by J.P. Morgan Investment Management Inc. (JPMIM). The principal types of securities and the main strategies that each Fund currently anticipates using are summarized in its Risk/Return Summary. Additional information about some of each Fund’s main investment strategies are included below. Except as otherwise indicated, the strategies described below are principal investment strategies of a Fund. Where applicable, the following also identifies other strategies that are not anticipated to be main strategies of a Fund but that may become more important to a Fund’s management in the future.
Each Fund may also use other non-principal strategies that are not described herein but which are described in the Statement of Additional Information. Each Fund may utilize these investments and strategies to a greater or lesser degree in the future.
The frequency with which each Fund buys and sells securities will vary from year to year, depending on market conditions.
Each of the Funds
Each Fund’s Board of Trustees may change any of the investment policies (including its investment objective), other than such policies that are designated as fundamental, without shareholder approval.
Credit Quality: Certain Funds may invest all, or are required to invest a certain percentage, of their investments in investment grade securities or the unrated equivalent. Each of the Funds may invest at least a portion of their investments in below investment grade securities, while the High Yield Municipal Fund may invest all of its assets in below investment grade securities. Below investment grade securities are also called “high yield bonds”, “junk bonds” and “non-investment grade bonds.” These securities generally are rated in the fifth or lower rating categories (for example, the equivalent of BB+ or lower). These securities generally offer a higher yield than investment grade securities, but involve a higher degree of risk.
A security’s quality is determined at the time of purchase and securities that are rated investment grade or the unrated equivalent may be downgraded or decline in credit quality such that subsequently they would be deemed to be below investment grade. The adviser will consider such an event in determining whether a Fund should continue to hold the security and is not required to sell a security in the event of a downgrade. The Funds use the methodology described below to determine the credit quality of their investments.
For each Fund, investment grade securities are securities that have been determined to be investment grade (for example, the equivalent of BBB- or higher) based on ratings by the following NRSROs - Moody’s Investors Service Inc. (Moody’s), Standard & Poor’s Corporation (S&P) or Fitch Ratings (Fitch) and the following methodology. If all three of these NRSROs rate the security, the middle rating is used to determine whether the security is investment grade. If only two of the three NRSROs rate the security, the lower rating is used to determine whether the security is investment grade. If only one of the three NRSROs rates a security, that rating will be used to determine if the security is investment grade. If none of these NRSROs rate a security, the adviser must determine that it is of comparable quality to an investment grade security or a non-investment grade security, respectively, in order for such security to be treated as an investment grade or a non-investment grade security, respectively.
| FUNDAMENTAL INVESTMENT OBJECTIVES |
| An investment objective is fundamental if it cannot be changed without the consent of a majority of the outstanding shares of the Fund. The investment objectives for the Short-Intermediate Municipal Bond Fund, Sustainable Municipal Income Fund and Tax Free Bond Fund are fundamental. The investment objectives for the remaining Funds are non-fundamental and can be changed without the consent of a majority of the outstanding shares of that Fund. |
SUSTAINABLE MUNICIPAL INCOME FUND, SHORT-INTERMEDIATE MUNICIPAL BOND FUND, INTERMEDIATE TAX FREE BOND FUND AND NEW YORK TAX FREE BOND FUND
Average Weighted Maturity. These Funds have average weighted maturity requirements. Average weighted maturity is the average of all the current maturities (that is, the term of the securities) of the individual bonds in a Fund calculated so as to count most heavily those securities with the highest dollar value. Average weighted maturity is important to investors as an indication of a Fund’s sensitivity to changes in interest rates. Usually, the longer the average weighted maturity, the more fluctuation in share price you can expect. The terms “Intermediate,” “Short-Intermediate” or “Ultra-Short” in a Fund’s name refer to the average maturity the Fund maintains. Mortgage-related securities are subject to prepayment of principal, which can shorten the average weighted maturity of the Fund’s portfolio. Therefore, in the case of a Fund holding mortgage-backed securities, asset-backed securities and similar types of securities, the average weighted maturity is equivalent to its weighted average life. Weighted average life is the average weighted maturity of the cash flows in the securities held by the Fund given certain prepayment assumptions.
42 | J.P. Morgan Municipal Bond Funds
SHORT-INTERMEDIATE MUNICIPAL BOND FUND AND TAX FREE BOND FUND
The Funds may invest up to 20% of their assets in cash and cash equivalents. See Temporary Defensive and Cash Positions.
HIGH YIELD MUNICIPAL FUND
All of the Fund’s assets may be invested in municipal bonds, the interest on which may be subject to the federal alternative minimum tax for both individuals and corporations. Shareholders who are subject to the federal alternative minimum tax may have all or a portion of their income from the Fund subject to federal income tax. In addition, corporate shareholders may be required to take the interest on municipal bonds into account in determining their alternative minimum taxable income. Any capital gain distributed by the Fund generally will be taxable.
The Fund may invest in inverse floaters. An inverse floater is a derivative instrument, typically created by a trust that divides a municipal security into two securities, a short-term tax-exempt floating rate security (sometimes referred to as a “tender option bond”) and a long-term tax-exempt floating rate security (referred to as a “residual certificate” or “inverse floater”) that pays interest at rates that move in the opposite direction of the yield on the short-term floating rate security. The purchaser of a “tender option bond” has the right to tender the security periodically for repayment of the principal value. As short-term interest rates rise, inverse floaters produce less current income (and, in extreme cases, may pay no income) and as short-term interest rates fall, inverse floaters produce more current income.
To facilitate the creation of inverse floaters, the Fund may purchase a fixed-rate municipal security and subsequently transfer it to a broker-dealer (the sponsor), which deposits the municipal security in a trust. The trust issues the residual certificates and short-term floating rate securities. The trust documents enable the Fund to withdraw the underlying bond to unwind or “collapse” the trust (upon tendering the residual certificate and paying the value of the short-term bonds and certain other costs). The Fund may also purchase inverse floaters created by municipal issuers directly or by other parties that have deposited municipal bonds into a sponsored trust.
Additional Investment Strategies
Each of the Funds
Each Fund has flexibility to invest in derivatives and may use such instruments to manage duration, sector and yield curve exposure, credit and spread volatility and to respond to volatile market conditions. Derivatives, which are instruments that have a value based on another instrument, exchange rate or index, may also be used as substitutes for securities in which each Fund can invest. Although the use of derivatives is not a main strategy of each Fund, each Fund may use futures contracts, options and swaps in connection with its principal strategies in order to hedge various investments, for risk management purposes and/or to increase the Fund’s income or gain to the Fund.
Each Fund may invest in shares of exchange-traded funds (ETFs), affiliated money market funds and other investment companies. ETFs, which are pooled investment vehicles whose ownership interests are purchased and sold on a securities exchange, may be passively or actively managed. Passively managed ETFs generally seek to track the performance of a particular market index, including broad-based market indexes, as well as indexes relating to particular sectors, markets, regions or industries. Actively managed ETFs do not seek to track the performance of a particular market index. Ordinarily, a Fund must limit its investments in a single non-affiliated ETF to 5% of its total assets and in all non-affiliated ETFs to 10% of its total assets. The Securities and Exchange Commission has issued exemptive orders to many ETFs that currently allow any fund investing in such ETFs to disregard these 5% and 10% limitations, subject to certain conditions. If a Fund invests in ETFs that have received such exemptive orders, it may invest any amount of its total assets in a single ETF or in multiple ETFs. ETFs that are not structured as investment companies as defined in the Investment Company Act of 1940 are not subject to these percentage limitations. The price movement of an index-based ETF may not track the underlying index and may result in a loss. In addition, ETFs may trade at a price above (premium) or below (discount) their net asset value, especially during periods of significant market volatility or stress, causing investors to pay or receive significantly more or less than the value of the ETF’s underlying portfolio when they purchase or sell their ETF shares, respectively.
Short-Intermediate Municipal Bond Fund
The adviser buys and sells securities and investments for the Fund based on its view of individual securities and market sectors. Taking a long-term approach, the adviser looks for individual fixed income investments that it believes will perform well over market cycles. The adviser is value oriented and makes decisions to purchase and sell individual securities and instruments after performing a risk/reward analysis that includes an evaluation of interest rate risk, credit risk, duration, liquidity and the complex legal and technical structure of the transaction. The adviser also integrates financially material environmental, social and governance (“ESG”) factors as part of the Fund’s investment process (“ESG Integration”). ESG Integration is the systematic inclusion of ESG issues in
July 1, 2022 | 43
More About the Funds (continued)
investment analysis and investment decisions. In applying ESG Integration in the evaluation of individual municipal issuers, the adviser seeks to assess the impact of environmental, social and governance factors on certain issuers in the universe in which the Fund may invest. The adviser’s assessment is based on an analysis of key opportunities and risks across sectors to identify financially material issues on the Fund’s investments in municipal issues and ascertain key issues that merit engagement with municipal issuers. These assessments may not be conclusive and securities that may be negatively impacted by such factors may be purchased and retained by the Fund while the Fund may divest or not invest in securities that may be positively impacted by such factors.
Tax Free Bond Fund
The adviser buys and sells securities and investments for the Fund based on its view of individual securities and market sectors. Taking a long-term approach, the adviser looks for individual fixed income investments that it believes will perform well over market cycles. The adviser is value oriented and makes decisions to purchase and sell individual securities and instruments after performing a risk/reward analysis that includes an evaluation of interest rate risk, credit risk, duration, liquidity and the complex legal and technical structure of the transaction. The adviser also integrates financially material environmental, social and governance (“ESG”) factors as part of the Fund’s investment process (“ESG Integration”). ESG Integration is the systematic inclusion of ESG issues in investment analysis and investment decisions. In applying ESG Integration in the evaluation of individual municipal issuers, the adviser seeks to assess the impact of environmental, social and governance factors on certain issuers in the universe in which the Fund may invest. The adviser’s assessment is based on an analysis of key opportunities and risks across sectors to identify financially material issues on the Fund’s investments in municipal issues and ascertain key issues that merit engagement with municipal issuers. These assessments may not be conclusive and securities that may be negatively impacted by such factors may be purchased and retained by the Fund while the Fund may divest or not invest in securities that may be positively impacted by such factors.
Ultra-Short Municipal Fund
The adviser buys and sells securities and investments for the Fund based on its view of individual securities and market sectors. The adviser looks for individual fixed income investments that it believes will perform well over market cycles. The adviser is value oriented and makes decisions to purchase and sell individual securities and instruments after performing a risk/reward analysis that includes an evaluation of interest rate risk, credit risk, duration, liquidity and the legal and technical structure of the transaction. The adviser also integrates financially material environmental, social and governance (“ESG”) factors as part of the Fund’s investment process (“ESG Integration”). ESG Integration is the systematic inclusion of ESG issues in investment analysis and investment decisions. In applying ESG Integration in the evaluation of individual municipal issuers, the adviser seeks to assess the impact of environmental, social and governance factors on certain issuers in the universe in which the Fund may invest. The adviser’s assessment is based on an analysis of key opportunities and risks across sectors to identify financially material issues on the Fund’s investments in municipal issues and ascertain key issues that merit engagement with municipal issuers. These assessments may not be conclusive and securities that may be negatively impacted by such factors may be purchased and retained by the Fund while the Fund may divest or not invest in securities that may be positively impacted by such factors.
California Tax Free Bond Fund
The adviser buys and sells securities and investments for the Fund based on its view of individual securities and market sectors. Taking a long-term approach, the adviser looks for individual fixed income investments that it believes will perform well over market cycles. The adviser is value oriented and makes decisions to purchase and sell individual securities and instruments after performing a risk/reward analysis that includes an evaluation of interest rate risk, credit risk, duration, liquidity and the complex legal and technical structure of the transaction. The adviser also integrates financially material environmental, social and governance (“ESG”) factors as part of the Fund’s investment process (“ESG Integration”). ESG Integration is the systematic inclusion of ESG issues in investment analysis and investment decisions. In applying ESG Integration in the evaluation of individual municipal issuers, the adviser seeks to assess the impact of environmental, social and governance factors on certain issuers in the universe in which the Fund may invest. The adviser’s assessment is based on an analysis of key opportunities and risks across sectors to identify financially material issues on the Fund’s investments in municipal issues and ascertain key issues that merit engagement with municipal issuers. These assessments may not be conclusive and securities that may be negatively impacted by such factors may be purchased and retained by the Fund while the Fund may divest or not invest in securities that may be positively impacted by such factors.
High Yield Municipal Fund
The adviser buys and sells securities and investments for the Fund based on its view of individual securities and market sectors. Taking a long-term approach, the adviser primarily looks for individual fixed income investments that it believes will perform well over market cycles. The adviser is value oriented and makes investment decisions after performing a risk/reward analysis that includes an evaluation of interest rate risk, credit risk, duration, liquidity, any security pledge, and a review of the security’s attributes, such as
44 | J.P. Morgan Municipal Bond Funds
the coupon, maturity, and any redemption and tender provisions. The adviser also factors in the overall investment strategy of the Fund, including its duration and its credit strategy, as well as the adviser’s interest rate outlook. The adviser also integrates financially material environmental, social and governance (“ESG”) factors as part of the Fund’s investment process (“ESG Integration”). ESG Integration is the systematic inclusion of ESG issues in investment analysis and investment decisions. In applying ESG Integration in the evaluation of individual municipal issuers, the adviser seeks to assess the impact of environmental, social and governance factors on certain issuers in the universe in which the Fund may invest. The adviser’s assessment is based on an analysis of key opportunities and risks across sectors to identify financially material issues on the Fund’s investments in municipal issues and ascertain key issues that merit engagement with municipal issuers. These assessments may not be conclusive and securities that may be negatively impacted by such factors may be purchased and retained by the Fund while the Fund may divest or not invest in securities that may be positively impacted by such factors.
The Fund may invest in loan assignments and participations (Loans). Loans will typically consist of senior secured floating rate loans, but may also include unsecured loans, second lien loans or more junior and bridge loans as well as commitments to purchase loans. Loans may be issued by obligors in the U.S. or in foreign or emerging markets. When the Fund acquires a loan assignment, the Fund typically will have a direct contractual relationship with the obligor; provided, however, the Fund may only be able to enforce its rights through an administrative agent. When the Fund acquires a loan participation, the Fund typically enters into a contractual relationship with the third party selling such participations, but not the borrower. As a result, the Fund assumes the credit risk of the seller of the loan participation and any other parties interpositioned between the Fund and the borrower. Under a loan participation, the Fund may have no direct rights to enforce the terms of the loan against the borrower. The Fund may not benefit directly from the collateral supporting the loan in which it has purchased the loan participations or assignments.
The Fund may invest in municipal mortgage-backed and asset-backed securities and municipal housing authority obligations. The Fund may also invest in bank obligations.
Intermediate Tax Free Bond Fund
The adviser buys and sells securities and investments for the Fund based on its view of individual securities and market sectors. Taking a long-term approach, the adviser looks for individual fixed income investments that it believes will perform well over market cycles. The adviser is value oriented and makes decisions to purchase and sell individual securities and instruments after performing a risk/reward analysis that includes an evaluation of interest rate risk, credit risk, duration, liquidity and the complex legal and technical structure of the transaction. The adviser also integrates financially material environmental, social and governance (“ESG”) factors as part of the Fund’s investment process (“ESG Integration”). ESG Integration is the systematic inclusion of ESG issues in investment analysis and investment decisions. In applying ESG Integration in the evaluation of individual municipal issuers, the adviser seeks to assess the impact of environmental, social and governance factors on certain issuers in the universe in which the Fund may invest. The adviser’s assessment is based on an analysis of key opportunities and risks across sectors to identify financially material issues on the Fund’s investments in municipal issues and ascertain key issues that merit engagement with municipal issuers. These assessments may not be conclusive and securities that may be negatively impacted by such factors may be purchased and retained by the Fund while the Fund may divest or not invest in securities that may be positively impacted by such factors.
New York Tax Free Bond Fund
The adviser buys and sells securities and investments for the Fund based on its view of individual securities and market sectors. Taking a long-term approach, the adviser looks for individual fixed income investments that it believes will perform well over market cycles. The adviser is value oriented and makes decisions to purchase and sell individual securities and instruments after performing a risk/reward analysis that includes an evaluation of interest rate risk, credit risk, duration, liquidity and the complex legal and technical structure of the transaction. The adviser also integrates financially material environmental, social and governance (“ESG”) factors as part of the Fund’s investment process (“ESG Integration”). ESG Integration is the systematic inclusion of ESG issues in investment analysis and investment decisions. In applying ESG Integration in the evaluation of individual municipal issuers, the adviser seeks to assess the impact of environmental, social and governance factors on certain issuers in the universe in which the Fund may invest. The adviser’s assessment is based on an analysis of key opportunities and risks across sectors to identify financially material issues on the Fund’s investments in municipal issues and ascertain key issues that merit engagement with municipal issuers. These assessments may not be conclusive and securities that may be negatively impacted by such factors may be purchased and retained by the Fund while the Fund may divest or not invest in securities that may be positively impacted by such factors.
Please note that the Funds also may use strategies that are not described in this section, but which are described in the “Investment Practices” section later in the prospectus and in the Statement of Additional Information.
July 1, 2022 | 45
More About the Funds (continued)
Investment Risks
There can be no assurance that the Funds will achieve their investment objectives.
The main risks associated with investing in each Fund are summarized in the “Risk/Return Summaries” at the front of this prospectus. In addition to each Fund’s main risks, each Fund may be subject to additional risks in connection with investments and strategies used by each Fund from time to time. The table below identifies main risks and some of the additional risks for each Fund.
An investment in a Fund or any other fund may not provide a complete investment program. The suitability of an investment in a Fund should be considered based on the investment objective, strategies and risks described in this prospectus, considered in light of all of the other investments in your portfolio, as well as your risk tolerance, financial goals and time horizons. You may want to consult with a financial advisor to determine if a Fund is suitable for you.
The Funds are subject to the main risks designated as such in the table below, any of which may adversely affect a Fund’s net asset value (NAV), performance and ability to meet its investment objective. Each Fund may also be subject to additional risks that are noted in the table below, as well as those that are not described herein but which are described in the Statement of Additional Information.
| |
Sustainable Municipal Income Fund |
Short-Intermediate Municipal Bond Fund |
Tax Free Bond Fund |
California Tax Free Bond Fund |
High Yield Municipal Fund |
Intermediate Tax Free Bond Fund |
New York Tax Free Bond Fund |
| Alternative Minimum Tax Risk |
• |
• |
• |
• |
• |
• |
• |
| Auction Rate Securities Risk |
○ |
• |
○ |
○ |
• |
○ |
○ |
| California Geographic Concentration Risk |
|
|
|
• |
|
|
|
| Credit Risk |
• |
• |
• |
• |
• |
• |
• |
| Debt Securities and Other Callable Securities Risk |
• |
• |
• |
• |
• |
• |
• |
| Derivatives Risk |
○ |
○ |
○ |
○ |
○ |
○ |
○ |
| Exchange-Traded Fund (ETF) and/or Other Investment Company Risk |
○ |
○ |
○ |
○ |
• |
○ |
○ |
| Floating and Variable Rate Securities Risk |
○ |
○ |
○ |
○ |
• |
○ |
○ |
| General Market Risk |
• |
• |
• |
• |
• |
• |
• |
| Government Securities Risk |
○ |
○ |
○ |
• |
• |
• |
• |
| High Yield Securities Risk |
• |
• |
• |
• |
• |
• |
• |
| Industry and Sector Focus Risk |
• |
• |
• |
• |
• |
• |
• |
| Interest Rate Risk |
• |
• |
• |
• |
• |
• |
• |
| Inverse Floating Rate Instrument Risk |
○ |
○ |
○ |
○ |
• |
○ |
○ |
| Loan Risk |
|
|
|
|
○ |
|
|
| Mortgage-Related and Other Asset-Backed Securities Risk |
• |
• |
• |
• |
○ |
• |
• |
| Municipal Obligations Risk |
• |
• |
• |
• |
• |
• |
• |
•
Main Risks
○
Additional Risks
46 | J.P. Morgan Municipal Bond Funds
| |
Sustainable Municipal Income Fund |
Short-Intermediate Municipal Bond Fund |
Tax Free Bond Fund |
California Tax Free Bond Fund |
High Yield Municipal Fund |
Intermediate Tax Free Bond Fund |
New York Tax Free Bond Fund |
| New York Geographic Concentration Risk |
|
|
|
|
|
|
• |
| Pay-In-Kind and Deferred Payment Securities Risk |
○ |
○ |
○ |
○ |
○ |
○ |
○ |
| Restricted Securities Risk |
• |
• |
○ |
○ |
• |
○ |
○ |
| Social or Environmental Investing Risk |
• |
|
|
|
|
|
|
| Structured Product Risk |
○ |
○ |
○ |
○ |
• |
○ |
○ |
| Taxability Risk |
• |
• |
• |
• |
• |
• |
• |
| Risk Associated with the Fund Holding Cash, Money Market Instruments and Other Short- Term Investments |
|
• |
• |
|
|
|
|
| Transactions and Liquidity Risk |
• |
• |
• |
• |
• |
• |
• |
| Cyber Security Risk |
○ |
○ |
○ |
○ |
○ |
○ |
○ |
| Volcker Rule Risk |
○ |
○ |
○ |
○ |
○ |
○ |
○ |
| Zero-Coupon Bond Risk |
• |
• |
• |
• |
• |
• |
• |
•
Main Risks
○
Additional Risks
Municipal Obligations Risk. The risk of a municipal obligation generally depends on the financial and credit status of the issuer. Changes in the financial health of a municipal issuer may make it difficult for the issuer to make interest and principal payments when due. A number of municipalities have had significant financial problems recently, and these and other municipalities could, potentially, continue to experience significant financial problems resulting from lower tax revenues and/or decreased aid from state and local governments in the event of an economic downturn. This could decrease the Funds’ income or hurt its ability to preserve capital and liquidity.
Under some circumstances, municipal obligations might not pay interest unless the state legislature or municipality authorizes money for that purpose. Some securities, including municipal lease obligations, carry additional risks. For example, they may be difficult to trade or interest payments may be tied only to a specific stream of revenue.
Municipal bonds may be more susceptible to downgrades or defaults during recessions or similar periods of economic stress. Factors contributing to the economic stress on municipalities may include lower property tax collections as a result of lower home values, lower sales tax revenue as a result of consumers cutting back spending and lower income tax revenue as a result of a higher unemployment rate. In addition, since some municipal obligations may be secured or guaranteed by banks and other institutions, the risk to a Fund could increase if the banking or financial sector suffers an economic downturn and/or if the credit ratings of the institutions issuing the guarantee are downgraded or at risk of being downgraded by a national rating organization. If such events were to occur, the value of the security could decrease or the value could be lost entirely, and it may be difficult or impossible for a Fund to sell the security at the time and the price that normally prevails in the market.
In addition to being downgraded, an insolvent municipality may file for bankruptcy. For example, Chapter 9 of the Bankruptcy Code provides a financially distressed municipality protection from its creditors while it develops and negotiates a plan for reorganizing its debts. “Municipality” is defined broadly by the Bankruptcy Code as a “political subdivision or public agency or instrumentality of a state” and may include various issuers of securities in which a Fund invests. The reorganization of a municipality’s debts may include
July 1, 2022 | 47
More About the Funds (continued)
extending debt maturities, reducing the amount of principal or interest, refinancing the debt or taking other measures, which may significantly affect the rights of creditors and the value of the securities issued by the municipality and the value of a Fund’s investments. Interest on municipal obligations, while generally exempt from federal income tax, may not be exempt from federal alternative minimum tax.
General Market Risk. Economies and financial markets throughout the world are becoming increasingly interconnected, which increases the likelihood that events or conditions in one country or region will adversely impact markets or issuers in other countries or regions. Securities in the Fund’s portfolio may underperform in comparison to securities in general financial markets, a particular financial market or other asset classes due to a number of factors, including inflation (or expectations for inflation), deflation (or expectations for deflation), interest rates, global demand for particular products or resources, market instability, debt crises and downgrades, embargoes, tariffs, sanctions and other trade barriers, regulatory events, other governmental trade or market control programs and related geopolitical events. In addition, the value of the Fund’s investments may be negatively affected by the occurrence of global events such as war, terrorism, environmental disasters, natural disasters or events, country instability, and infectious disease epidemics or pandemics.
For example, the outbreak of COVID-19 has negatively affected economies, markets and individual companies throughout the world, including those in which the Fund invests. The effects of this pandemic to public health and business and market conditions, including, among other things, reduced consumer demand and economic output, supply chain disruptions and increased government spending, may continue to have a significant negative impact on the performance of the Fund’s investments, increase the Fund’s volatility, exacerbate pre-existing political, social and economic risks to the Fund, and negatively impact broad segments of businesses and populations. In addition, governments, their regulatory agencies, or self-regulatory organizations have taken or may take actions in response to the pandemic that affect the instruments in which the Fund invests, or the issuers of such instruments, in ways that could have a significant negative impact on the Fund’s investment performance. The duration and extent of COVID-19 and associated economic and market conditions and uncertainty over the long-term cannot be reasonably estimated at this time. The ultimate impact of COVID-19 and the extent to which the associated conditions impact a Fund will also depend on future developments, which are highly uncertain, difficult to accurately predict and subject to frequent changes.
Interest Rate Risk. The Fund invests in debt securities that change in value based on changes in interest rates. If rates increase, the value of these investments generally declines. On the other hand, if rates fall, the value of these investments generally increases. Your investment will decline in value if the value of these investments decreases. Securities with greater interest rate sensitivity and longer maturities generally are subject to greater fluctuations in value. Many factors can cause interest rates to rise. Some examples include central bank monetary policy, rising inflation rates and general economic conditions. The Fund may face a heightened level of interest rate risk due to certain changes or uncertainty in monetary policy.
Debt market conditions are highly unpredictable and some parts of the market are subject to dislocations. Beginning in March 2022, the Federal Reserve Board began increasing interest rates and has signaled the possibility of further increases. It is difficult to accurately predict the pace at which the Federal Reserve Board will increase interest rates any further, or the timing, frequency or magnitude of any such increases, and the evaluation of macro-economic and other conditions could cause a change in approach in the future. Any such changes could be sudden and could expose debt markets to significant volatility and reduced liquidity for Fund investments.
Credit Risk. There is a risk that issuers and/or a counterparty to a security, contract, repurchase agreement or other investment will not make payments when due or default completely on securities, repurchase agreements or other investments held by a Fund. The risk of defaults across issuers and/or counterparties increases in adverse market and economic conditions, including the conditions resulting from the COVID-19 pandemic. Such defaults could result in losses to the Fund. In addition, the credit quality of securities held by a Fund may be lowered if an issuer’s or a counterparty’s financial condition changes. Lower credit quality may lead to greater volatility in the price of a security and in shares of a Fund. Lower credit quality also may affect liquidity and make it difficult for a Fund to sell the security. Although U.S. government securities issued directly by the U.S. government are guaranteed by the U.S. Treasury, other U.S. government securities issued by an agency or instrumentality of the U.S. government may not be. No assurance can be given that the U.S. government would provide financial support to its agencies or instrumentalities if not required to do so by law. Prices of the Fund’s investments may be adversely affected if any of the issuers or counterparties it is invested in are subject to an actual or perceived deterioration in their credit quality. Credit spreads may increase, which may reduce the market values of the Fund’s securities. Credit spread risk is the risk that economic and market conditions or any actual or perceived credit deterioration may lead to an increase in the credit spreads (i.e., the difference in yield between two securities of similar maturity but different credit quality) and a decline in price of the issuer’s securities.
48 | J.P. Morgan Municipal Bond Funds
Floating and Variable Rate Securities Risk. Floating and variable rate securities provide for a periodic adjustment in the interest rate paid on the securities. The rate adjustment intervals may be regular and range from daily up to annually, or may be based on an event, such as a change in the prime rate. Floating and variable rate securities may be subject to greater liquidity risk than other debt securities, meaning that there may be limitations on the Fund’s ability to sell the securities at any given time. Such securities also may lose value.
Structured Product Risk. Structured products, such as tender option bonds, involve structural complexities and potential risks that may not be present where a municipal security is owned directly. These enhanced risks may include additional counter-party risk (the risk that the counterparty will not fulfill its contractual obligations) and call risk (the risk that the instruments will be called and the proceeds may need to be reinvested). Additionally, an active trading market for such instruments may not exist. To the extent that a structured product provides a put, the Fund may receive a lower interest rate in return for such feature and will be subject to the risk that the put provider will be unable to honor the put feature (purchase the security). Finally, short-term municipal or tax-exempt structured products may present tax issues not presented by investments in other short-term municipal or tax-exempt securities. These issues might be resolved in a manner adverse to the Fund.
Alternative Minimum Tax Risk. A Fund may invest all of its assets in municipal bonds, the interest on which may be subject to the federal alternative minimum tax. Shareholders who are subject to the federal alternative minimum tax may have all or a portion of their income from the Fund subject to federal income tax. In addition, corporate shareholders will, with limited exceptions, be required to take the interest on municipal bonds into account in determining their alternative minimum taxable income. Any capital gain distributed by a Fund may be taxable.
Restricted Securities Risk.Restricted securities are securities that cannot be offered for public resale unless registered under the applicable securities laws or that have a contractual restriction that prohibits or limits their resale. Restricted securities include private placement securities that have not been registered under the applicable securities laws, such as Rule 144A securities, and securities of U.S. and non-U.S. issuers that are issued pursuant to Regulation S. Private placements are generally subject to strict restrictions on resale. Restricted securities may not be listed on an exchange and may have no active trading market. Restricted securities may be illiquid. The Fund may be unable to sell a restricted security on short notice or may be able to sell them only at a price below current value. It may be more difficult to determine a market value for a restricted security. Also, the Fund may get only limited information about the issuer of a restricted security, so it may be less able to predict a loss. In addition, if Fund management receives material non-public information about the issuer, the Fund may as a result be unable to sell the securities. Certain restricted securities may involve a high degree of business and financial risk and may result in substantial losses.
Mortgage-Related and Other Asset-Backed Securities Risk. Mortgage-related and asset-backed securities, including certain municipal housing authority obligations, differ from conventional debt securities and are subject to certain additional risks because principal is paid back over the life of the security rather than at maturity. The value of these securities will be influenced by the factors affecting the housing market and the assets underlying such securities. As a result, during periods of declining asset values, difficult or frozen credit markets, significant changes in interest rates, or deteriorating economic conditions, mortgage-related and asset-backed securities may decline in value, face valuation difficulties, become more volatile and/or become illiquid. These securities are also subject to prepayment and call risk. Gains and losses associated with prepayments will increase/decrease the income available for distribution by the Fund and the Fund’s yield. In periods of declining interest rates, the Fund may be subject to contraction risk which is the risk that borrowers will increase the rate at which they prepay the maturity value of mortgages and other obligations. When mortgages and other obligations are prepaid and when securities are called, the Fund may have to reinvest in securities with a lower yield or fail to recover additional amounts (i.e., premiums) paid for securities with higher interest rates, resulting in an unexpected capital loss and/or a decrease in the amount of dividends and yield. In periods of either rising or declining interest rates, the Fund may be subject to extension risk which is the risk that the expected maturity of an obligation will lengthen in duration due to a decrease in prepayments. As a result, in certain interest rate environments, the Fund may exhibit additional volatility. The structure of some of these securities may be complex and there may be less available information than for other types of debt securities. Additionally, asset-backed, mortgage-related and mortgage-backed securities are subject to risks associated with their structure and the nature of the assets underlying the securities and the servicing of those assets. Certain asset-backed, mortgage-related and mortgage-backed securities may face valuation difficulties and may be less liquid than other types of asset-backed, mortgage-related and mortgage-backed securities, or debt securities.
The mortgage loans underlying privately issued mortgage-related securities may not be subject to the same underwriting requirements for the underlying mortgages that are applicable to those mortgage-related securities that have government or government-sponsored entity guarantees. As a result, the mortgage loans underlying privately issued mortgage-related securities may have less favorable collateral, credit risk or other underwriting characteristics than government or government-sponsored mortgage-related securities and have wider variances in a number of terms including interest rate, term, size, purpose and borrower characteristics. In addition, certain mortgage-related securities which may include loans that originally qualified under standards established by
July 1, 2022 | 49
More About the Funds (continued)
government-sponsored entities (for example, certain REMICs that include Fannie Mae mortgages) are not considered as government securities for purposes of a Fund’s investment strategies or policies. There is no government or government-sponsored guarantee for such privately issued investments.
A Fund may invest in collateralized mortgage obligations (CMOs). CMOs are debt obligations collateralized by mortgage loans or mortgage pass-through securities. CMOs are issued in multiple classes, and each class may have its own interest rate and/or final payment date. A class with an earlier final payment date may have certain preferences in receiving principal payments or earning interest. As a result, the value of some classes in which the Fund invests may be more volatile and may be subject to higher risk of non-payment.
The values of interest-only (IO) and principal-only (PO) mortgage-backed securities are more volatile than other types of mortgage-related securities. They are very sensitive not only to changes in interest rates, but also to the rate of prepayments. A rapid or unexpected increase in prepayments can significantly depress the price of interest-only securities, while a rapid or unexpected decrease could have the same effect on principal-only securities. In addition, because there may be a drop in trading volume, an inability to find a ready buyer, or the imposition of legal restrictions on the resale of securities, these instruments may be illiquid.
Zero-Coupon, Pay-In-Kind and Deferred Payment Securities Risk. The market value of a zero-coupon bond is generally more volatile than the market value of other fixed income securities with similar maturities that pay interest periodically. In addition, federal income tax law requires that the holder of a zero-coupon bond accrue a portion of the discount at which the bond was purchased as taxable income each year, even though the holder receives no interest payments on the bond during the year. The Fund must distribute substantially all of its net income (including non-cash income attributable to zero-coupon bonds) to its shareholders each year to maintain its status as a regulated investment company and to eliminate tax at the Fund level. Accordingly, such accrued discount must be taken into account in determining the amount of taxable distributions to shareholders. The Fund may consequently have to dispose of portfolio securities under disadvantageous circumstances to generate cash to satisfy such distribution requirements. These actions may reduce the assets to which the Fund’s expenses could otherwise be allocated and may reduce the Fund’s rate of return.
The market value of a zero-coupon, pay-in-kind or deferred payment security is generally more volatile than the market value of interest-paying securities, and is more likely to respond to a greater degree to changes in interest rates and credit quality than other fixed income securities with similar maturities that pay interest periodically. In addition, federal income tax law requires that the holder of a zero-coupon bond accrue a portion of the discount at which the bond was purchased as taxable income each year, even though the holder receives no interest payment on the bond during the year. Each Fund must distribute substantially all of its net income (including non-cash income attributable to zero-coupon bonds) to its shareholders each year to maintain its status as a regulated investment company and to eliminate tax at the Fund level. Accordingly, such accrued discount must be taken into account in determining the amount of taxable distributions to shareholders. A Fund may consequently have to dispose of portfolio securities under disadvantageous circumstances to generate cash to satisfy such distribution requirements. These actions may reduce the assets to which the Fund’s expenses could otherwise be allocated and may reduce the Fund’s rate of return.
In addition, (1) the higher yields and interest rates on certain pay-in-kind securities (PIK) reflect the payment deferral and increased credit risk associated with such instruments and such investments may represent a significantly higher credit risk than coupon loans; (2) PIK securities may have higher price volatility because their continuing accruals require continuing judgments about the collectability of the deferred payments and the value of any associated collateral; (3) PIK interest has the effect of generating investment income and (4) the deferral of PIK interest may also reduce the loan-to-value ratio at a compounding rate.
Risk Associated with the Fund Holding Cash, Money Market Instruments and Other Short-Term Investments. The Fund will, at times, hold assets in cash, money market instruments and other short-term investments, which may hurt the Fund’s performance. These positions may also subject the Fund to additional risks and costs.
Transactions and Liquidity Risk. A Fund could experience a loss when selling securities to meet redemption requests and its liquidity may be negatively impacted. The risk of loss increases if the redemption requests are large or frequent, occur in times of overall market turmoil or declining prices for the securities sold, or when the securities a Fund wishes to, or is required to, sell are illiquid. To the extent a large proportion of shares of a Fund are held by a small number of shareholders (or a single shareholder) including funds or accounts over which the adviser or its affiliates have investment discretion, the Fund is subject to the risk that these shareholders will purchase or redeem Fund shares in large amounts rapidly or unexpectedly, including as a result of an asset allocation decision made by the adviser or its affiliates. In addition to the other risks described in this section, these transactions could adversely affect the ability of the Fund to conduct its investment program. A Fund may be unable to sell illiquid securities at its desired time or price or the price at which the securities have been valued for purposes of the Fund’s net asset value. Illiquidity can be caused by a drop in overall market trading volume, an inability to find a ready buyer, or legal restrictions on the securities’ resale. Other market participants may be attempting to sell debt securities at the same time as a Fund, causing downward pricing pressure and contributing to illiquidity. The capacity for bond dealers to engage in trading or “make a market” in debt securities has not kept
50 | J.P. Morgan Municipal Bond Funds
pace with the growth of bond markets. Liquidity and valuation risk may be magnified in a rising interest rate environment, when credit quality is deteriorating or in other circumstances where investor redemptions from fixed income mutual funds may be higher than normal. Certain securities that were liquid when purchased may later become illiquid, particularly in times of overall economic distress. Similarly, large purchases of Fund shares may adversely affect the Fund’s performance to the extent that the Fund is delayed in investing new cash and is required to maintain a larger cash position than it ordinarily would. Large redemptions also could accelerate the realization of capital gains, increase a Fund’s transaction costs and impact a Fund’s performance.
Industry and Sector Focus Risk. At times the Fund may increase the relative emphasis of its investments in a particular industry or sector. The prices of securities of issuers in a particular industry or sector may be more susceptible to fluctuations due to changes in economic or business conditions, government regulations, availability of basic resources or supplies, or other events that affect that industry or sector more than securities of issuers in other industries and sectors. To the extent that the Fund increases the relative emphasis of its investments in a particular industry or sector, the value of a Fund’s shares may fluctuate in response to events affecting that industry or sector.
Debt Securities and Other Callable Securities Risk. As part of its main investment strategy, each Fund invests in debt securities. The issuers of these securities and other callable securities may be able to repay principal in advance, especially when interest rates fall. Changes in prepayment rates can affect the return on investment and yield of these securities. When debt obligations are prepaid and when securities are called, a Fund may have to reinvest in securities with a lower yield. A Fund also may fail to recover additional amounts (i.e., premiums) paid for securities with higher interest rates, resulting in an unexpected capital loss.
Inverse Floating Rate Instrument Risk. The market value of an inverse floater residual certificate can be more volatile than that of a conventional fixed-rate bond having similar credit quality, maturity and redemption provisions. Inverse floater residual certificates entail a degree of leverage because the trust issues short-term securities in a ratio to the residual certificates with the underlying long-term bond providing collateral for the obligation to pay the principal value of the short-term securities if and when they are tendered. If a Fund has created the inverse floater by depositing a long-term bond into a trust, it may be required to provide additional collateral for the short-term securities if the value of the underlying bond deposited in the trust fails.
An inverse floater that has a higher degree of leverage is typically more volatile with respect to its price and income than an inverse floater having a lower degree of leverage. Under inverse floater arrangements, if the remarketing agent that offers the short-term securities for sale is unable to sell them, or if the holders tender (or put) them for repayment of principal and the remarketing agent is unable to remarket them, the remarketing agent may cause the trust to be collapsed, and in the case of floaters created by the Fund, the Fund will then be required to repay the principal amount of the tendered securities. During times of market volatility, illiquidity or uncertainty, the Fund could be required to sell other portfolio holdings at a disadvantageous time to raise cash to meet that obligation.
Because of the accounting treatment for inverse floaters created by the Fund’s transfer of a municipal bond to a trust, the Fund’s financial statements will reflect these transactions as “secured borrowings,” which affects the Fund’s Statements of Assets and Liabilities and Operations, expense ratios and the Schedule of Investments will include the underlying municipal bond. The Fund’s annual fund operating expenses will include certain expenses and fees related to the Fund’s investments. Some of those expenses may be liabilities with respect to interest paid on short-term floating rate notes issued by the trusts whose inverse floater certificates are held by the Fund. Under accounting rules, the Fund will also recognize additional income in an amount that directly corresponds to these expenses and, as a result the Fund’s net asset values per share and total returns will not be affected by these additional expenses.
Taxability Risk. The Fund’s investments in municipal securities rely on the opinion of the issuer’s bond counsel that the interest paid on those securities will not be subject to federal income tax. Tax opinions are generally provided at the time the municipal security is initially issued. However, after the Fund buys a security, the Internal Revenue Service may determine that a bond issued as tax-exempt should in fact be taxable and the Fund’s dividends with respect to that bond might be subject to federal income tax.
Social or Environmental Investing Risk. The JPMorgan Sustainable Municipal Income Fund’s investment in securities whose use of proceeds, in the Adviser’s opinion, provide positive social or environmental benefits could cause it to perform differently compared to funds that do not have such a policy. Investing in securities whose use of proceeds, in the Adviser’s opinion, provide positive social or environmental benefits may result in the Fund forgoing opportunities to buy certain securities when it might otherwise be advantageous to do so, or selling securities when it might be otherwise disadvantageous for it to do so. In addition, there is a risk that the municipal bonds identified by the Adviser’s use of proceeds determination do not operate as expected when addressing positive social or environmental benefits. The Adviser’s assessment of the positive social or environmental impact of a municipal bond’s proceeds is made at the time of purchase and the actual use of proceeds by the issuer could vary over time, which could cause the Fund to be invested in bonds that do not comply with the Fund’s approach towards considering social or environmental characteristics. The factors that the Adviser considers in evaluating whether a security has positive social or environmental benefits may change over time. There are significant differences in interpretations of what it means to promote positive social or
July 1, 2022 | 51
More About the Funds (continued)
environmental benefits. While the Adviser believes its definitions are reasonable, the portfolio decisions it makes may differ with other’s views. In making investment decisions, the Adviser relies on information and third-party data that could be incomplete or erroneous, which could cause the Adviser to incorrectly assess a municipal bond’s positive social or environmental impact.
High Yield Securities Risk. The Fund invests in instruments including junk bonds, Loans and instruments of municipal issuers that are highly leveraged, less creditworthy or financially distressed. These investments are considered to be speculative and may be subject to greater risk of loss, greater sensitivity to economic changes, valuation difficulties and potential illiquidity. Such investments are subject to additional risks including subordination to other creditors, no collateral or limited rights in collateral, lack of a regular trading market, extended settlement periods, liquidity risks, prepayment risks, potentially less protections under the federal securities laws and lack of publicly available information. High yield securities and Loans that are deemed to be liquid at the time of purchase may become illiquid.
In recent years, there has been a broad trend of weaker or less restrictive covenant protections in the high yield market. Among other things, under such weaker or less restrictive covenants, borrowers might be able to exercise more flexibility with respect to certain activities than borrowers who are subject to stronger or more protective covenants. For example, borrowers might be able to incur more debt, including secured debt, return more capital to shareholders, remove or reduce assets that are designated as collateral securing high yield securities, increase the claims against assets that are permitted against collateral securing high yield securities or otherwise manage their business in ways that could impact creditors negatively. In addition, certain privately held borrowers might be permitted to file less frequent, less detailed or less timely financial reporting or other information, which could negatively impact the value of the high yield securities issued by such borrowers. Each of these factors might negatively impact the high yield instruments held by the Fund.
No active trading market may exist for some instruments and certain investments may be subject to restrictions on resale. In addition, the settlement period for Loans is uncertain as there is no standardized settlement schedule applicable to such investments. The inability to dispose of the Fund’s securities and other investments in a timely fashion could result in losses to the Fund. Because some instruments may have a more limited secondary market, liquidity risk is more pronounced for the Fund than for funds that invest primarily in other types of fixed income instruments or equity securities. When bonds and other instruments securities are prepaid, the Fund may have to reinvest in instruments with a lower yield or fail to recover additional amounts (i.e., premiums) paid for these instruments resulting in an unexpected capital loss and/or a decrease in the amount of dividends and yield.
Government Securities Risk. The Fund invests in securities issued or guaranteed by the U.S. government or its agencies and instrumentalities (such as securities issued by the Government National Mortgage Association (Ginnie Mae), the Federal National Mortgage Association (Fannie Mae) or the Federal Home Loan Mortgage Corporation (Freddie Mac)). U.S. government securities are subject to market risk, interest rate risk and credit risk. Securities, such as those issued or guaranteed by Ginnie Mae or the U.S. Treasury, that are backed by the full faith and credit of the United States are guaranteed only as to the timely payment of interest and principal when held to maturity and the market prices for such securities will fluctuate. Notwithstanding that these securities are backed by the full faith and credit of the United States, circumstances could arise that would prevent the payment of interest or principal. This would result in losses to the Fund. Securities issued or guaranteed by U.S. government related organizations, such as Fannie Mae and Freddie Mac, are not backed by the full faith and credit of the U.S. government and no assurance can be given that the U.S. government will provide financial support. Therefore, U.S. government related organizations may not have the funds to meet their payment obligations in the future. U.S. government securities include zero coupon securities, which tend to be subject to greater market risk than interest-paying securities of similar maturities.
California Geographic Concentration Risk. Because the JPMorgan California Tax Free Bond Fund primarily invests in issuers in the State of California, its political subdivisions, authorities and agencies, its performance will be affected by the fiscal and economic health of that state and its municipalities. Provisions of the California Constitution and state statutes that limit the taxing and spending authority of California’s governmental entities may impair the ability of California issuers to pay principal and/or interest on their obligations. While California’s economy is broad, it does have major concentrations in high technology, manufacturing, entertainment, agriculture, tourism, construction and services, and may be sensitive to economic problems affecting those industries.
Any deterioration of California’s fiscal situation could increase the risk of investing in California municipal securities, including the risk of potential issuer default, and could heighten the risk that the prices of California municipal securities, and the Fund’s net asset value and/or yield, will experience greater volatility. Furthermore, any such deterioration could result in a downgrade of the credit rating of an issuer of California municipal securities. Future downgrades could reduce the market value of the securities held by the Fund, which could adversely affect the Fund’s performance.
New York Geographic Concentration Risk. Because the JPMorgan New York Tax Free Bond Fund invests primarily in municipal obligations issued by the State of New York, New York City, their political subdivisions, authorities and agencies, its performance will be affected by the fiscal and economic health of that state, the city and their political subdivisions. Additionally, as the nation’s financial capital, New York’s and New York City’s economy is heavily dependent on the financial sector and may be sensitive to
52 | J.P. Morgan Municipal Bond Funds
economic problems affecting the sector. New York and New York City also face a particularly large degree of uncertainty from interest rate risk and equity market volatility. The New York and New York City economy tends to be more sensitive to monetary policy actions and to movements in the national and world economies than the economies of other states or cities.
Any deterioration of New York’s fiscal situation could increase the risk of investing in New York municipal securities, including the risk of potential issuer default, and could heighten the risk that the prices of New York municipal securities, and the Fund’s net asset value and/or yield, will experience greater volatility. Furthermore, any such deterioration could result in a downgrade of the credit rating of an issuer of New York municipal securities. Future downgrades could reduce the market value of the securities held by the Fund, which could adversely affect the Fund’s performance.
Derivatives Risk. A Fund may use derivatives in connection with its investment strategies. Derivatives may be riskier than other types of investments because they may be more sensitive to changes in economic or market conditions than other types of investments and could result in losses that significantly exceed a Fund’s original investment. Derivatives are subject to the risk that changes in the value of a derivative may not correlate perfectly with the underlying asset, rate or index. The use of derivatives may not be successful, resulting in losses to the Fund and the cost of such strategies may reduce a Fund’s returns. Certain derivatives also expose the Fund to counterparty risk (which is the risk that the derivative counterparty will not fulfill its contractual obligations), and to the credit risk of the derivative counterparty. In addition, a Fund may use derivatives for non-hedging purposes, which increases the Fund’s potential for loss. Certain derivatives are synthetic instruments that attempt to replicate the performance of certain reference assets. With regard to such derivatives, the Fund does not have a claim on the reference assets and is subject to enhanced counterparty risk.
Investing in derivatives will result in a form of leverage. Leverage involves special risks. A Fund may be more volatile than if the Fund had not been leveraged because the leverage tends to exaggerate any effect on the value of the Fund’s portfolio securities. Registered investment companies are limited in their ability to engage in derivative transactions and are required to identify and earmark assets to provide asset coverage for derivative transactions.
The possible lack of a liquid secondary market for derivatives and the resulting inability of a Fund to sell or otherwise close a derivatives position could expose the Fund to losses and could make derivatives more difficult for the Fund to value accurately.
A Fund’s transactions in futures contracts, swaps and other derivatives could also affect the amount, timing and character of distributions to shareholders which may result in the Fund realizing more short-term capital gain and ordinary income subject to tax at ordinary income tax rates than it would if it did not engage in such transactions, which may adversely impact the Fund’s after-tax return.
| WHAT IS A DERIVATIVE? |
| Derivatives are securities or contracts (for example, futures and options) that derive their value from the performance of underlying assets or securities. |
Exchange-Traded Fund (ETF) and/or Other Investment Company Risk. A Fund may invest in shares of other investment companies and ETFs. Shareholders bear both their proportionate share of a Fund’s expenses and similar expenses of the underlying investment company or ETF when the Fund invests in shares of another investment company or ETF. A Fund is subject to the risks associated with the ETF’s or investment company’s investments. ETFs and companies that invest in commodities or currencies are subject to the risks associated with direct investments in commodities or currencies. The price and movement of an ETF or closed-end fund designed to track an index may not track the index and may result in a loss. In addition, closed-end funds that trade on an exchange often trade at a price below their net asset value (also known as a discount). Certain ETFs or closed-end funds traded on exchanges may be thinly traded and experience large spreads between the “ask” price quoted by a seller and the “bid” price offered by a buyer.
Loan Risk. The Fund may invest in Loans including Loans that are rated below investment grade. Like other high yield, corporate debt instruments, such Loans are subject to an increased risk of default in the payment of principal and interest as well as the other risks described under “Interest Rate Risk,”“Credit Risk” and “High Yield Securities Risk.” Although certain Loans are secured by collateral, the Fund could experience delays or limitations in realizing on such collateral or have its interest subordinated to other indebtedness of the obligor. Loans are vulnerable to market sentiment such that economic conditions or other events may reduce the demand for Loans and cause their value to decline rapidly and unpredictably. Although the Fund limits its investments in illiquid securities to no more than 15% of the Fund’s net assets at the time of purchase, Loans that are deemed to be liquid at the time of purchase may become illiquid. In recent years, there has been a broad trend of weaker or less restrictive covenant protections in the Loan market. Among other things, under such weaker or less restrictive covenants, borrowers might be able to exercise more flexibility with respect to certain activities than borrowers who are subject to stronger or more protective covenants. For example, borrowers might be able to incur more debt, including secured debt, return more capital to shareholders, remove or reduce assets that are designated as collateral securing Loans, increase the claims against assets that are permitted against collateral securing Loans or
July 1, 2022 | 53
More About the Funds (continued)
otherwise manage their business in ways that could impact creditors negatively. In addition, certain privately held borrowers might be permitted to file less frequent, less detailed or less timely financial reporting or other information, which could negatively impact the value of the Loans issued by such borrowers. Each of these factors might negatively impact the Loans held by a Fund. No active trading market may exist for some of the Loans and certain Loans may be subject to restrictions on resale. The inability to dispose of Loans in a timely fashion could result in losses to the Fund. In addition, the settlement period for Loans is uncertain as there is no standardized schedule applicable to such investments. Certain Loans may take more than seven days to settle. Because some Loans that the Fund invests in may have a more limited secondary market, liquidity and valuation risk is more pronounced for the Fund than for funds that invest primarily in other types of fixed income instruments or equity securities. Typically, Loans are not registered securities and are not listed on any national securities exchange. Consequently, there may be less public information available about the Fund’s investments and the market for certain Loans may be subject to irregular trading activity, wide bid/ask spreads and extended trade settlement periods. As a result, the Fund may be more dependent upon the analytical ability of its adviser.
When a Fund acquires a loan participation, the Fund typically enters into a contractual relationship with the lender or third party selling such participations, but not the borrower. As a result, the Fund assumes the credit risk of the seller of the loan participation and any other parties interpositioned between the Fund and the borrower. The Fund may not benefit directly from the collateral supporting the loan in which it has purchased the loan participations or assignments.
Affiliates of the adviser may participate in the primary and secondary market for Loans. Because of limitations imposed by applicable law, the presence of the adviser’s affiliates in the Loan market may restrict the Fund’s ability to acquire some Loans, affect the timing of such acquisition or affect the price at which the Loan is acquired. Also, because the adviser may wish to invest in the publicly traded securities of an obligor, it may not have access to material non-public information regarding the obligor to which other investors have access.
Loans are subject to prepayment risks. Gains and losses associated with prepayments will increase or decrease the Fund’s yield and the income available for distribution by the Fund. When Loans are prepaid, the Fund may have to reinvest in securities with a lower yield or fail to recover additional amounts (i.e. premiums) paid for Loans, resulting in an unexpected capital loss and/or a decrease in the amount of dividends and yields.
Cyber Security Risk. As the use of technology has become more prevalent in the course of business, the Funds have become more susceptible to operational and financial risks associated with cyber security, including: theft, loss, misuse, improper release, corruption and destruction of, or unauthorized access to, confidential or highly restricted data relating to a Fund and its shareholders; and compromises or failures to systems, networks, devices and applications relating to the operations of a Fund and its service providers. Cyber security risks may result in financial losses to a Fund and its shareholders; the inability of a Fund to transact business with its shareholders; delays or mistakes in the calculation of a Fund’s NAV or other materials provided to shareholders; the inability to process transactions with shareholders or other parties; violations of privacy and other laws; regulatory fines, penalties and reputational damage; and compliance and remediation costs, legal fees and other expenses. A Fund’s service providers (including, but not limited to, the adviser, any sub-advisers, administrator, transfer agent, and custodian or their agents), financial intermediaries, companies in which a Fund invests and parties with which a Fund engages in portfolio or other transactions also may be adversely impacted by cyber security risks in their own businesses, which could result in losses to a Fund or its shareholders. While measures have been developed which are designed to reduce the risks associated with cyber security, there is no guarantee that those measures will be effective, particularly since the Funds do not directly control the cyber security defenses or plans of their service providers, financial intermediaries and companies in which they invest or with which they do business.
Volcker Rule Risk. Pursuant to section 619 of the Dodd-Frank Wall Street Reform and Consumer Protection Act and certain rules promulgated thereunder known as the Volcker Rule, if the adviser and/or its affiliates own 25% or more of the outstanding ownership interests of a Fund after the permitted seeding period from the implementation of a Fund’s investment strategy, a Fund could be subject to restrictions on trading that would adversely impact the Fund’s ability to execute its investment strategy. Generally, the permitted seeding period is three years from the implementation of a Fund’s investment strategy. As a result, the adviser and/or its affiliates may be required to reduce their ownership interests in a Fund at a time that is sooner than would otherwise be desirable, which may result in the Fund’s liquidation or, if the Fund is able to continue operating, may result in losses, increased transaction costs and adverse tax consequences as a result of the sale of portfolio securities.
Auction Rate Securities Risk. The auction rate municipal securities the Fund will purchase will typically have a long-term nominal maturity for which the interest rate is regularly reset through a “Dutch” auction. The interest rate set by the auction is the lowest interest rate that covers all securities offered for sale. While this process is designed to permit auction rate securities to be traded at par value, there is a risk that an auction will fail due to insufficient demand for the securities, which may adversely affect the liquidity and price of auction rate securities. Moreover, between auctions, there may be no secondary market for these securities, and sales conducted on a secondary market may not be on terms favorable to the seller. Thus, with respect to liquidity and price stability, auction rate securities may differ substantially from cash equivalents, notwithstanding the frequency of auctions and the credit quality of the security.
54 | J.P. Morgan Municipal Bond Funds
For more information about risks associated with the types of investments that a Fund purchases, please read the “Risk/Return Summary” at the front of this prospectus and “Investment Practices” section later in the prospectus, and the Statement of Additional Information.
Conflicts of Interest
An investment in a Fund is subject to a number of actual or potential conflicts of interest. For example, the Adviser and/or its affiliates provide a variety of different services to a Fund, for which the Fund compensates them. As a result, the Adviser and/or its affiliates have an incentive to enter into arrangements with a Fund, and face conflicts of interest when balancing that incentive against the best interests of a Fund. The Adviser and/or its affiliates also face conflicts of interest in their service as investment adviser to other clients, and, from time to time, make investment decisions that differ from and/or negatively impact those made by the Adviser on behalf of a Fund. In addition, affiliates of the Adviser provide a broad range of services and products to their clients and are major participants in the global currency, equity, commodity, fixed-income and other markets in which a Fund invests or will invest. In certain circumstances, by providing services and products to their clients, these affiliates’ activities will disadvantage or restrict the Funds and/or benefit these affiliates. The Adviser may also acquire material non-public information which would negatively affect the Adviser’s ability to transact in securities for a Fund. JPMorgan and the Funds have adopted policies and procedures reasonably designed to appropriately prevent, limit or mitigate conflicts of interest. In addition, many of the activities that create these conflicts of interest are limited and/or prohibited by law, unless an exception is available. For more information about conflicts of interest, see the Potential Conflicts of Interest section in the Statement of Additional Information.
Temporary Defensive and Cash Positions
For liquidity and to respond to unusual market conditions, the Funds may invest all or most of their total assets in cash and cash equivalents for temporary defensive purposes. In addition, certain Funds may invest in cash and cash equivalents as a principal investment strategy. These investments may result in a lower yield than lower-quality or longer-term investments.
| WHAT IS A CASH EQUIVALENT? |
| Cash equivalents are highly liquid, high-quality instruments with maturities of three months or less on the date they are purchased. They include securities issued by the U.S. government, its agencies and instrumentalities, repurchase agreements, certificates of deposit, bankers’ acceptances, commercial paper, money market mutual funds and bank deposit accounts. |
While the Funds are engaged in a temporary defensive position, they may not meet their investment objectives. These investments may also be inconsistent with a Fund’s main investment strategies. Therefore, the Funds will pursue a temporary defensive position only when market conditions warrant.
Additional Fee Waiver and/or Expense Reimbursement
Service providers to the Funds may, from time to time, voluntarily waive all or a portion of any fees to which they are entitled and/or reimburse certain expenses as they may determine from time to time. The Funds’ service providers may discontinue or modify these voluntary actions at any time without notice. Performance for the Funds will reflect the voluntary waiver of fees and/or the reimbursement of expenses, if any. Without these voluntary waivers and/or expense reimbursements, performance would have been less favorable.
Additional Historical Performance Information
Intermediate Tax Free Bond Fund
The historical performance for the Class R6 Shares in the bar chart prior to 1/1/18 and in the performance table prior to its inception on 11/6/17 is based on the Class I Shares of the Fund, which invest in the same portfolio of securities but are offered in a different prospectus. The actual returns of Class R6 Shares would have been different than those shown because Class R6 have different expenses than Class I Shares.
Sustainable Municipal Income Fund
The historical performance for the Class R6 Shares in the bar chart prior to 1/1/18 and in the performance table prior to its inception on 11/6/17 is based on the Class I Shares of the Fund, which invest in the same portfolio of securities but are offered in a different prospectus. The actual returns of Class R6 Shares would have been different than those shown because Class R6 have different expenses than Class I Shares.
July 1, 2022 | 55
More About the Funds (continued)
Short-Intermediate Municipal Bond Fund
The historical performance for the Class R6 Shares in the bar chart prior to 1/1/19 and in the performance table prior to its inception on 10/1/18 is based on the Class I Shares of the Fund, which invest in the same portfolio of securities but are offered in a different prospectus. The actual returns of Class R6 Shares would have been different than those shown because Class R6 have different expenses than Class I Shares.
Tax Free Bond Fund
The historical performance for the Class R6 Shares in the bar chart prior to 1/1/19 and in the performance table prior to its inception on 10/1/18 is based on the Class I Shares of the Fund, which invest in the same portfolio of securities but are offered in a different prospectus. The actual returns of Class R6 Shares would have been different than those shown because Class R6 have different expenses than Class I Shares.
California Tax Free Bond Fund
The historical performance for the Class R6 Shares in the bar chart prior to 1/1/19 and in the performance table prior to its inception on 10/1/18 is based on the Class I Shares of the Fund, which invest in the same portfolio of securities but are offered in a different prospectus. The actual returns of Class R6 Shares would have been different than those shown because Class R6 have different expenses than Class I Shares.
High Yield Municipal Fund
The historical performance for the Class R6 Shares in the bar chart prior to 1/1/19 and in the performance table prior to its inception on 11/1/18 is based on the Class I Shares of the Fund, which invest in the same portfolio of securities but are offered in a different prospectus. The actual returns of Class R6 Shares would have been different than those shown because Class R6 have different expenses than Class I Shares.
New York Tax Free Bond Fund
The historical performance for the Class R6 Shares in the bar chart prior to 1/1/19 and in the performance table prior to its inception on 10/1/18 is based on the Class I Shares of the Fund, which invest in the same portfolio of securities but are offered in a different prospectus. The actual returns of Class R6 Shares would have been different than those shown because Class R6 have different expenses than Class I Shares.
56 | J.P. Morgan Municipal Bond Funds
The Funds' Management and Administration
The following Funds are series of JPMorgan Trust I (JPMT I), a Delaware statutory trust:
California Tax Free Bond Fund
High Yield Municipal Fund
Intermediate Tax Free Bond Fund
New York Tax Free Bond Fund
High Yield Municipal Fund
Intermediate Tax Free Bond Fund
New York Tax Free Bond Fund
The following Funds are series of JPMorgan Trust II (JPMT II), a Delaware statutory trust:
Sustainable Municipal Income Fund
Short-Intermediate Municipal Bond Fund
Tax Free Bond Fund
Short-Intermediate Municipal Bond Fund
Tax Free Bond Fund
Each Trust is governed by the Board of Trustees, which is responsible for overseeing all business activities of the Funds.
Each of the Funds operates in a multiple class structure. A multiple class fund is an open-end investment company that issues two or more classes of shares representing interests in the same investment portfolio.
Each class in a multiple class fund can set its own transaction minimums and may vary with respect to expenses for distribution, administration and shareholder services. This means that one class could offer access to a Fund on different terms than another class. Certain classes may be more appropriate for a particular investor.
Each Fund may issue other classes of shares that have different expense levels and performance and different requirements for who may invest. Call 1-800-480-4111 to obtain more information concerning all of the Funds’ other share classes. A Financial Intermediary who receives compensation for selling Fund shares may receive a different amount of compensation for sales of different classes of shares.
The Funds' Investment Adviser
J.P. Morgan Investment Management Inc. (JPMIM) is the investment adviser to the Funds and makes the day-to-day investment decisions for the Funds. In rendering investment advisory services to certain Funds, JPMIM uses the portfolio management, research and other resources of a foreign (non-U.S.) affiliate of JPMIM and may provide services to a Fund through a “participating affiliate” arrangement, as that term is used in relief granted by the staff of the SEC. Under this relief, U.S. registered investment advisers are allowed to use portfolio management or research resources of advisory affiliates subject to the regulatory supervision of the registered investment adviser. JPMIM is located at 383 Madison Avenue, New York, NY 10179.
JPMIM is a wholly-owned subsidiary of JPMorgan Asset Management Holdings Inc., which is a wholly-owned subsidiary of JPMorgan Chase & Co. (JPMorgan Chase), a bank holding company.
During the most recent fiscal year ended 2/28/22, JPMIM was paid management fees (net of waivers), as shown below, as a percentage of average daily net assets:
| California Tax Free Bond Fund |
0.28% |
| High Yield Municipal Fund |
0.31 |
| Intermediate Tax Free Bond Fund |
0.24 |
| New York Tax Free Bond Fund |
0.28 |
| Short-Intermediate Municipal Bond Fund |
0.15 |
| Sustainable Municipal Income Fund |
0.23 |
| Tax Free Bond Fund |
0.28 |
A discussion of the basis the Board of Trustees of the Trusts used in reapproving the investment advisory agreement for the Funds is available in the semi-annual reports for the most recent fiscal period ended August 31.
The Portfolio Managers
The lead portfolio managers who are primarily responsible for the day-to-day management of the Funds are listed below. As part of that responsibility, the portfolio managers establish and monitor the overall duration, yield curve, and sector allocation strategies for the Funds. The portfolio managers are assisted by multiple sector and research teams who help formulate duration and allocation recommendations and support the strategies of the Funds within the parameters established by the portfolio managers.
JPMorgan Sustainable Municipal Income Fund. Kevin M. Ellis, CFA charterholder and Managing Director and Wayne Godlin, Managing Director, are the co-lead portfolio managers responsible for the day-to-day management of the JPMorgan Sustainable Municipal Income Fund. An employee of JPMIM and/or its affiliates since May 2003 and portfolio manager of the Fund since 2020, Mr. Ellis is a
July 1, 2022 | 57
The Funds' Management and Administration (continued)
portfolio manager in the U.S. Fixed Income Group and is responsible for managing separate accounts in the Municipal Bond Group. An employee since 2018 and portfolio manager of the Fund since 2020, Mr. Godlin is a senior portfolio manager for the Municipal and Tax Aware Strategies team focusing on high yield municipal bonds. Mr. Godlin has over thirty years of municipal bond market experience in both credit analysis and portfolio management, with a focus on analyzing and managing high yield municipal bond portfolios. Previously, Mr. Godlin was a Consultant, evaluating client municipal bond portfolios, at Herbert J. Sims & Co. from 2017 to 2018 and a senior portfolio manager and a member of the Investment Policy Committee at AllianceBernstein Asset Management from 2009 to 2016. David Sivinski, CFA charterholder and Executive Director, has also participated in the management of the JPMorgan Sustainable Municipal Income Fund since March 2006. In addition to his role as portfolio manager, Mr. Sivinski coordinates municipal management for a number of high net worth clients that focus principally on single state municipal bonds.
JPMorgan Short-Intermediate Municipal Bond Fund. James Ahn has been the lead portfolio manager responsible for the day-to-day management of the JPMorgan Short-Intermediate Municipal Bond Fund since June 2006. Mr. Ahn, Managing Director, is a portfolio manager in the U.S. Fixed Income Group. An employee of JPMIM and/or its affiliates since 1996 and a member of the portfolio management team since February 1999, Mr. Ahn is responsible for strategy formulation and trading short-term tax-aware fixed income strategies for U.S. institutional clients and the Private Bank. Kevin M. Ellis has also participated in the management of the JPMorgan Short-Intermediate Municipal Bond Fund since June 2006. Mr. Ellis, CFA charterholder and Managing Director, is a portfolio manager in the U.S. Fixed Income Group. An employee of JPMIM and/or its affiliates since May 2003, he is responsible for managing separate accounts in the Municipal Bond Group.
JPMorgan Tax Free Bond Fund. Richard Taormina, CFA charterholder and Managing Director, has been the lead portfolio manager responsible for the day-to-day management of the JPMorgan Tax Free Bond Fund since February 2005. Mr. Taormina is a portfolio manager in the Global Fixed Income, Currency & Commodities (GFICC) group. An employee since 1997, Mr. Taormina is responsible for managing municipal and tax-aware mutual funds, high net worth and institutional fixed income accounts, and quantitative analysis. Michelle Hallam has participated in the management of the JPMorgan Tax Free Bond Fund since 2014. Mrs. Hallam, CFA charterholder and Executive Director, is a portfolio manager in the Municipal Group within the GFICC group. An employee of JPMIM since 1999, Mrs. Hallam is responsible for portfolios under the Low Tax Rate Strategy.
JPMorgan California Tax Free Bond Fund and JPMorgan New York Tax Free Bond Fund. David Sivinski, CFA charterholder and Executive Director, has been the lead portfolio manager responsible for the day-to-day management of the JPMorgan California Tax Free Bond Fund and the JPMorgan New York Tax Free Bond Fund since April 2005 and March 2005, respectively. In addition to his role as portfolio manager, Mr. Sivinski coordinates municipal management for a number of high net worth clients that focus principally on single state municipal bonds. Michelle G. Hallam has also participated in the management of the JPMorgan California Tax Free Bond Fund since June 2004. Kevin M. Ellis has also participated in the management of the JPMorgan New York Tax Free Bond Fund since May 2005.
JPMorgan Intermediate Tax Free Bond Fund. Richard Taormina, CFA charterholder and Managing Director, has been the lead portfolio manager responsible for the day-to-day management of the JPMorgan Intermediate Tax Free Bond Fund since February 2006. Biographical information on Mr. Taormina is described under the JPMorgan Tax Free Bond Fund. David Sivinski has also participated in the management of the JPMorgan Intermediate Tax Free Bond Fund since June 2005. In addition to his role as portfolio manager, Mr. Sivinski coordinates municipal management for a number of high net worth clients that focus principally on single state municipal bonds. Mr. Ellis is a portfolio manager in the U.S. Fixed Income Group. An employee of JPMIM and/or its affiliates since May 2003, he is responsible for managing separate accounts in the Municipal Bond Group.
JPMorgan High Yield Municipal Fund. An employee since 2018, Wayne Godlin, CFA charterholder and Managing Director, is a senior portfolio manager for the Municipal and Tax Aware Strategies team focusing on high yield municipal bonds and is the lead portfolio manager responsible for the day-to-day management of the Fund’s investments. Mr. Godlin has over thirty years of municipal bond market experience in both credit analysis and portfolio management, with a focus on analyzing and managing high yield municipal bond portfolios. Previously, Mr. Godlin was a Consultant, evaluating client municipal bond portfolios, at Herbert J. Sims & Co. from 2017 to 2018 and a senior portfolio manager and a member of the Investment Policy Committee at AllianceBernstein Asset Management from 2009 to 2016. Richard Taormina, Managing Director, is a portfolio manager in the Municipal and Tax Aware Fixed Income Group and is responsible for overseeing the Fund’s investments in taxable and tax-exempt securities. An employee since 1997, Mr. Taormina is responsible for managing municipal mutual funds, institutional fixed income accounts, and quantitative analysis. Mr. Ellis, CFA charterholder and Managing Director, is a portfolio manager in the U.S. Fixed Income Group. An employee of JPMIM and/or its affiliates since May 2003, he is responsible for managing separate accounts in the Municipal Bond Group.
The Statement of Additional Information provides additional information about the portfolio managers’ compensation, other accounts managed by the portfolio managers and the portfolio managers’ ownership of securities in the Funds.
58 | J.P. Morgan Municipal Bond Funds
The Funds' Administrator
JPMIM (the Administrator) provides administration services and oversees each Fund's other service providers. The Administrator receives the following annual fee from each Fund for administration services: 0.075% of the first $10 billion of average daily net assets for the Fund, plus 0.050% of average daily net assets of the Fund between $10 billion and $20 billion, plus 0.025% of average daily net assets of the Fund between $20 billion and $25 billion, plus 0.010% of the average daily net assets of the Fund over $25 billion..
The Funds' Distributor
JPMDS (the Distributor) is the distributor for the Funds. The Distributor is an affiliate of JPMIM.
Additional Compensation to Financial Intermediaries
JPMIM, JPMDS and, from time to time, other affiliates of JPMorgan Chase may also, at their own expense and out of their own legitimate profits, provide additional cash payments to Financial Intermediaries whose customers invest in shares of the J.P. Morgan Funds. For this purpose, Financial Intermediaries include financial advisors, investment advisers, brokers, financial planners, banks, insurance companies, retirement or 401(k) plan administrators and others, including various affiliates of JPMorgan Chase, that have entered into agreements with JPMDS. These additional cash payments are payments over and above any sales charges (including Rule 12b-1 fees), service fees (including sub-transfer agency and networking fees) that are paid to such Financial Intermediaries, as described elsewhere in this prospectus. These additional cash payments are generally made to Financial Intermediaries that provide shareholder, sub-transfer agency or administrative services or marketing support. Marketing support may include access to sales meetings, sales representatives and Financial Intermediary management representatives, inclusion of the J.P. Morgan Funds on a sales list, including a preferred or select sales list, or other sales programs and/or for training and educating a Financial Intermediary’s employees. These additional cash payments also may be made as an expense reimbursement in cases where the Financial Intermediary provides shareholder services to J.P. Morgan Fund shareholders. JPMIM and JPMDS may also pay cash compensation in the form of finders’ fees that vary depending on the J.P. Morgan Fund and the dollar amount of shares sold. Such additional compensation may provide such Financial Intermediaries with an incentive to favor sales of shares of the J.P. Morgan Funds over other investment options they make available to their customers. See the Statement of Additional Information for more information.
July 1, 2022 | 59
Investing with J.P. Morgan Funds
Choosing A Share Class
Each share class represents an investment in the same portfolio of securities, but each has different availability and eligibility criteria, expenses, dividends and distributions.
Please read this prospectus carefully, and then select the Fund most appropriate for you and decide how much you want to invest. Each Fund may offer other classes of shares not included in this prospectus that have different expense levels, performance and eligibility requirements from the share classes offered in this prospectus. Call 1-800-480-4111 to obtain more information concerning these or other share classes. A Financial Intermediary may receive different compensation based on the share class sold.
Additional Information that Applies to All Accounts: If your identity or the identity of any other person(s) authorized to act on your behalf cannot be verified, or if potentially criminal activity is identified, the J.P. Morgan Funds and the Distributor reserve the right to reject opening an account for you, close your account, or take such other action they deem reasonable or required by law.
Class R shares are primarily used in Group Retirement Plans. The particular Group Retirement Plan will determine the share class available to its participants.
Shares of the Funds have not been registered for sale outside of the United States. This prospectus is not intended for distribution to prospective investors outside of the United States. The Funds generally do not market or sell shares to investors domiciled outside of the United States, even, with regard to individuals, if they are citizens or lawful permanent residents of the United States.
| |
Class R6 |
| Eligibility1 |
May be purchased by •Group Retirement Plans,1 •Section 529 college savings plans •J.P. Morgan Funds of Funds (to the extent permitted by a Fund’s investment strategies) •Mutual Funds ETFs and other registered investment companies not affiliated with JPMIM •Investors through a fee-based advisory program of a financial intermediary that has entered into a written agreement with the Distributor to offer such shares through an omnibus account held at the Fund. •Certain discretionary accounts at JPMIM or JPMorgan Chase Bank, N.A. or their affiliates (the Investment Manager) as defined below •Institutional Investors as described below •Other Investors, as described below |
| Minimum Investment2 |
$5,000,000 – Discretionary Accounts $5,000,000 – Institutional Investors $15,000,000 – Others Investors. There is no minimum for other Class R6 eligible as investors as described in “Eligibility,” above. |
| Minimum Subsequent Investments |
No minimum |
| Distribution (12b-1) Fee |
None |
| Service Fee |
None |
| Redemption Fee |
None |
1
For more information about eligible Group Retirement Plans, see “Group Retirement Plans” below.
2
Please see “MINIMUM ACCOUNT BALANCE” for more information about minimum balance requirements.
60 | J.P. Morgan Municipal Bond Funds
Financial Intermediaries may include financial advisors, investment advisers, brokers, financial planners, banks, insurance companies, retirement or 401(k) plan administrators and others, including various affiliates of JPMorgan Chase, that have entered into agreements with JPMDS as Distributor and/or shareholder servicing agent.
Accounts may be opened either directly with a Fund’s transfer agent or through Financial Intermediaries. If you have questions about eligibility, please call 1-800-480-4111.
•
Class R6 Shares are not subject to Rule 12b-1 fees.
•
Class R6 Shares have lower annual expense ratios than other share classes, as the Class R6 Shares have no ongoing service fees.
•
A Fund may issue other classes of shares that have different sales charges, expense levels and performance and different requirements for who may invest. Call 1-800-480-4111 to obtain more information concerning all of a Fund’s other share classes. A Financial Intermediary who receives compensation for selling Fund shares may receive different amounts of compensation for sales of different classes of shares.
Group Retirement Plans
The only retirement plans that are eligible to purchase Class R6 Shares are employer-sponsored retirement, deferred compensation and employee benefit plans (including health savings accounts) and trusts used to fund those plans. To satisfy eligibility requirements, the plan must be a group plan (more than one participant), the shares cannot be held in a commission-based brokerage account and the shares must be held a) at a plan level or b) at the Fund level through an omnibus account of a retirement plan recordkeeper. Group Retirement Plans include group employer-sponsored 401(k) plans, 457 plans, employer-sponsored 403(b) plans, profit-sharing and money purchase pension plans, defined benefit plans, retiree health benefit plans, group annuity separate accounts offered to retirement plans, and non-qualified deferred compensation plans. Group Retirement Plans do not include traditional and Roth Individual Retirement Accounts (IRAs), Coverdell Education Savings Accounts, SEPs, SARSEPs, SIMPLE IRAs, KEOGHs, individual 401(k) plans or individual 403(b) plans.
Discretionary Accounts
Class R6 Shares may also be purchased by an account for an investor:
1.
Whose investments in a Fund are made and directed on their behalf by investment representatives at the Investment Manager pursuant to a discretionary investment management agreement or trust agreement that provides for discretionary investment management services between the Investment Manager and the investor (a Discretionary Account), and
2.
Whose account’s initial investment in a Fund is at least $5,000,000. An investor can combine purchases of Class R6 Shares with Class R6 Shares of other JPMorgan Funds in order to meet the applicable minimum investment.
Institutional Investors
Class R6 Shares may also be purchased by institutional investors whose initial investment in a Fund is at least $5,000,000. Institutional investors include, but are not limited to, corporations, qualified non-profit organizations, charitable trusts, foundations and endowments, governmental entities, municipalities, and hospitals investing for their own account. These accounts may not be held for the benefit of multiple underlying, unrelated investors. For these investors, accounts cannot be aggregated at the investor level to meet the initial minimum.
Other Investors
Class R6 Shares also may be purchased in other accounts whose initial investment in a Fund is at least $15,000,000. These accounts may not be held for the benefit of multiple underlying, unrelated investors. For these investors, accounts cannot be aggregated at the investor level to meet the initial minimum.
Certain Financial Intermediaries may not make Class R6 Shares available for purchase.
College Savings Plans
To be eligible to invest in R6 Shares, Section 529 college savings plans must hold their shares through plan level or omnibus accounts held on the books of a Fund.
July 1, 2022 | 61
Investing with J.P. Morgan Funds (continued)
Financial Intermediary Compensation
The following section describes the various fees that you will pay if you purchase shares of the Funds. In addition, it describes the types of compensation paid to Financial Intermediaries for the sale of Fund shares and related services.
Class R6 Shares are only available through a Financial Intermediary if the Financial Intermediary will not receive from the Fund assets or the Distributor’s or an affiliate’s resources any commission payments, service fees (including sub-transfer agent and networking fees), or distribution fees (including Rule 12b-1 fees) directly tied to assets invested in Class R6 Shares. This restriction does not apply to fees paid to a Financial Intermediary by an affiliate of the Distributor from its fees for retirement plan recordkeeping services.
To obtain information, see below, visit www.jpmorganfunds.com or call 1-800-480-4111.
Networking and Sub-Transfer Agency Fees
JPMDS, as shareholder servicing agent, has entered into agreements with Financial Intermediaries pursuant to which the Financial Intermediary is paid for services such as networking or sub-transfer agency (collectively, the “Sub-TA Agreements”). Sub-TA Agreement payments are generally based on either (1) a percentage of the average daily net assets of clients serviced by such Financial Intermediary up to a set maximum dollar amount per shareholder account serviced, or (2) a per account fee based on the number of accounts serviced by such Financial Intermediary. Sub-TA Agreement payments are in addition to, rather than in lieu of, Rule 12b-1 fees the Financial Intermediary may also be receiving pursuant to agreements with the Distributor for classes with Rule 12b-1 fees. Payments to Financial Intermediaries for sub-transfer agency services will be made by JPMDS, as shareholder servicing agent, from the service fee. From time to time, JPMIM or its affiliates may pay a portion of the sub-transfer agency fees at its or their own expense and out of its or their legitimate profits.
Purchasing Fund Shares
You may purchase shares directly from the J.P. Morgan Funds through the Distributor or through your Financial Intermediary.
Purchase and redemption orders will be accepted only on days that J.P. Morgan Funds are open for business. The Funds are open for business on each day the NYSE is open for trading. A purchase or redemption order received by the Funds prior to the close of regular trading on the NYSE (normally 4:00 p.m. ET) (“Fund Close”), on a day the Funds are open for business, will be effected at that day’s NAV. The Funds will not treat an intraday unscheduled disruption or closure in NYSE trading as a closure of the NYSE and will calculate NAV as of 4:00 p.m. ET, if the particular disruption or closure directly affects only the NYSE. An order received after the Fund Close will generally be effected at the NAV determined on the next business day. However, orders received by Financial Intermediaries on a business day prior to the Fund Close and communicated to the Funds prior to such time as agreed upon by the Funds and the Financial Intermediary will be effected at the NAV determined on the business day the order was received by the Financial Intermediary.
A purchase order must be supported by all appropriate documentation and information in the proper form. The Funds may refuse to honor incomplete purchase orders.
Share ownership is electronically recorded; therefore, no certificate will be issued. A shareholder who purchases shares of a Fund that accrues dividends daily will not accrue a dividend on the day of the purchase.
If you purchase shares through your Financial Intermediary, contact your investment representative for its requirements and procedures. If a Financial Intermediary holds your shares, it is the responsibility of the Financial Intermediary to send your purchase order to the Fund. Your Financial Intermediary may have an earlier cut-off time for purchase orders.
If you purchase shares directly with the Funds, see the information below.
62 | J.P. Morgan Municipal Bond Funds
| HOW TO PURCHASE DIRECTLY WITH THE J.P. MORGAN FUNDS | ||
| |
Opening a New Account |
Purchasing into an Existing Account |
| By Phone or Online 1-800-480-4111 Shareholder Services representatives are available Monday through Friday from 8:00 am to 6:00 pm ET. www.jpmorganfunds.com Note: Certain account types are not available for online account access. Please call for additional information. |
A new account may not be opened by phone or online. A new fund position can be added to an existing account by phone or online if you have bank information on file. The minimum initial investment requirement must be met. |
You must already have bank information on file. If we do not have bank information on file, you must submit written instructions. Please call for instructions on how to add bank information to your account. |
| By Mail Regular mailing address: J.P. Morgan Funds Services P.O. Box 219143 Kansas City, MO 64121-9143 Overnight mailing address: J.P. Morgan Funds Services 430 W 7th Street, Suite 219143 Kansas City, MO 64105-1407 |
Mail the completed and signed application with a check to our Regular or Overnight mailing address. Refer to the Additional Information Regarding Purchases section |
Please mail your check and include your name, the Fund name, and your fund account number. |
| All checks must be made payable to one of the following: •J.P. Morgan Funds; or •The specific Fund in which you are investing. Please include your existing account number, if applicable. All checks must be in U.S. dollars. The J.P. Morgan Funds do not accept credit cards, cash, starter checks, money orders or credit card checks. The Funds reserve the right to refuse “third-party” checks and checks drawn on non-U.S. financial institutions even if payment may be effected through a U.S. financial institution. Checks made payable to any individual or company and endorsed to J.P. Morgan Funds or a Fund are considered third-party checks. | ||
| By Wire1 1-800-480-4111 Wire Instructions: DST Asset Manager Solutions, Inc. 2000 Crown Colony Drive Quincy, MA 02169 Attn: J.P. Morgan Funds Services ABA: 021 000 021 DDA: 323 125 832 FBO: Fund Name Fund: Fund # Account: Your Account # and Your Account Registration |
Purchase by Wire: If you choose to pay by wire, please call to notify the Fund of your purchase. You must also initiate the wire with your financial institution. |
Purchase by Wire: If you choose to pay by wire, please call to notify the Fund of your purchase. You must also initiate the wire with your financial institution. |
1
The Funds currently do not charge for these services, but may impose a charge in the future. However, your bank may impose a charge for debiting your bank account.
Transactions by phone, fax or the Internet
You may access your account and conduct certain transactions using phone, fax or the J.P. Morgan Funds website. Phone conversations are recorded. The J.P. Morgan Funds and their agents use reasonable procedures to verify the identity of the shareholder. If these procedures are followed, the J.P. Morgan Funds and their agents are not liable for any losses, liability, cost or expenses (including attorney fees) that may occur from acting on unauthorized or fraudulent instructions. Therefore please take precautions to protect your account information and immediately review account statements or other information provided to you. In addition, a
July 1, 2022 | 63
Investing with J.P. Morgan Funds (continued)
confirmation is sent promptly after a transaction. Please review it carefully and contact J.P. Morgan Funds Services or your Financial Intermediary immediately about any transaction you believe to be unauthorized. You may revoke your right to make purchases over the phone or by mailing written instructions to us.
You may not always reach J.P. Morgan Funds Services by phone or online. This may be true at times of unusual market changes and shareholder activity. You can mail us your instructions or contact your Financial Intermediary. We may modify or cancel the ability to purchase or redeem shares online or by phone without notice.
Additional Information Regarding Purchases
Federal law requires all financial institutions to obtain, verify and record information that identifies each person who opens an account. When you open an account, we will ask for your name, residential or business street address, date of birth (for an individual), and other information that will allow us to identify you, including your social security number, tax identification number or other identifying number. The J.P. Morgan Funds cannot waive these requirements. A Fund is required by law to reject your Account Application if the required identifying information is not provided.
We will attempt to collect any missing information required on the Account Application by contacting either you or your Financial Intermediary. If we cannot obtain this information within the established time frame, your Account Application will be rejected. Amounts received prior to receipt of the required information will be held uninvested and will be returned to you without interest if your Account Application is rejected. If the required information is obtained, your investment will be accepted and you will pay the NAV per share next calculated after all of the required information is received.
Once we have received all of the required information, federal law requires us to verify your identity. After an account is opened, we may restrict your ability to purchase additional shares until your identity is verified. If we are unable to verify your identity within a reasonable time, the Funds and/or the Distributor reserve the right to close your account at the current day’s NAV per share. If your account is closed for this reason, your shares will be redeemed at the NAV per share next calculated after the account is closed, less any applicable fees.
Purchases by wire may be canceled if J.P. Morgan Funds Services does not receive payment by 4:00 p.m. ET on the settlement date. You will be responsible for any expenses and/or losses to the Funds.
Exchanging Fund Shares
An exchange is selling shares of one J.P. Morgan Fund and taking the proceeds to simultaneously purchase shares of another J.P. Morgan Fund. Before making an exchange request, you should read the prospectus of the J.P. Morgan Fund whose shares you would like to purchase by exchange. You can obtain a prospectus for any J.P. Morgan Fund by contacting your Financial Intermediary, by visiting www.jpmorganfunds.com, or by calling 1-800-480-4111.
| EXCHANGE PRIVILEGES |
| Class R6 Shares of a Fund may be exchanged for: |
| •Class R6 Shares of another J.P. Morgan Fund, |
| •Another share class of the same Fund if you are eligible to purchase that class. |
In general, the same rules and procedures that apply to redemptions and purchases apply to exchanges:
•
All exchanges are subject to meeting any investment minimum or eligibility requirements of the new Fund and class.
•
The J.P. Morgan Funds will provide 60 days’ written notice of any termination of or material change to your exchange privilege.
•
All exchanges are based upon the net asset value that is next calculated after the Fund receives your order, provided the exchange out of one Fund must occur before the exchange into the other Fund.
•
In order for an exchange to take place on the date that the order is submitted, the order must be received prior to the close of both the Fund that you wish to exchange into and the Fund that you wish to exchange out of, otherwise, the exchange will occur on the following business day on which both Funds are open.
•
A shareholder that exchanges into shares of a Fund that accrues dividends daily, including a money market fund, will not accrue a dividend on the day of the exchange. A shareholder that exchanges out of shares of a Fund that accrues a daily dividend will accrue a dividend on the day of the exchange.
•
The exchange privilege is not intended as a way for you to speculate on short-term movements in the market. Therefore, to prevent disruptions in the management of J.P. Morgan Funds, certain J.P. Morgan Funds limit excessive exchange activity as described in the “Frequent Trading Policy” section. Your exchange privilege will be limited or revoked if the exchange activity is considered excessive. In addition, any J.P. Morgan Fund may reject any exchange request for any reason, including if it is not in
64 | J.P. Morgan Municipal Bond Funds
Investing with J.P. Morgan Funds (continued)
Tax Consequences on Exchanges
Generally, an exchange between J.P. Morgan Funds is considered a sale and generally results in a capital gain or loss for federal income tax purposes. An exchange between classes of shares of the same Fund is generally not taxable for federal income tax purposes. You should talk to your tax advisor before making an exchange.
Redeeming Fund Shares
If you sell shares through your Financial Intermediary, contact your investment representative for its requirements and procedures. If a Financial Intermediary holds your shares, it is the responsibility of the Financial Intermediary to send your redemption order to the Fund. Your Financial Intermediary may have an earlier cut-off time for redemption orders.
If you sell shares directly with the Fund, see the information below.
Your redemption proceeds may be mailed to you at your address of record1 or wired to a pre-existing bank account on file.
| HOW TO REDEEM | |
| By Phone or Online |
Call us at 1-800-480-4111 Shareholder Services representatives are available Monday through Friday from 8:00 am to 6:00 pm ET. www.jpmorganfunds.com Note: Certain account types are not available for online account access. Please call for additional information. |
| By Mail |
Regular mailing address: J.P. Morgan Funds Services P.O. Box 219143 Kansas City, MO 64121-9143 Overnight mailing address: J.P. Morgan Funds Services 430 W 7th Street, Suite 219143 Kansas City, MO 64105-1407 |
1
You cannot request a redemption by check to be sent to an address updated within 15 days.
You may redeem some or all of your shares on any day that the Funds are open for business. You will not be permitted to enter a redemption order for shares purchased directly through J.P. Morgan Funds Services by check for five business days following the acceptance of a purchase order unless you provide satisfactory proof that your purchase check has cleared (sometimes referred to as uncollected shares).
If a Fund or Financial Intermediary receives your redemption order before the close of the NYSE (normally 4 p.m. ET or before 4:00 p.m. ET, if the NYSE closes before 4:00 p.m. ET), you will receive the NAV per share calculated after your redemption order is received in good order (meaning that it includes the information required by, and complies with security requirements implemented by, the Fund’s transfer agent or the Fund), minus the amount of any applicable fees. Your Financial Intermediary may have an earlier cut-off time for redemption orders and may charge a fee to process redemption of shares. A shareholder that redeems out of shares of a Fund that accrues a daily dividend will accrue a dividend on the day of the redemption.
All redemption requests must be supported by valid identity authentication, the appropriate documentation (if applicable) and any necessary information in good order. Additional information may be required depending on the situation.
For accounts held directly with the Funds, the length of time that the Funds typically expect to pay redemption proceeds depends on whether payment is made by wire or check. The Funds typically expect to make payments of redemption proceeds by wire on the next business day following receipt of the redemption order by the Funds. For payment by check, the Funds typically expect to mail the check on the next business day following receipt of the redemption order by the Funds.
For accounts held through Financial Intermediaries, the length of time that the Funds typically expect to pay redemption proceeds depends on the method of payment and the agreement between the Financial Intermediary and the Funds. For redemption proceeds that are paid directly to you by the Fund, the Fund typically expects to make payments by wire or by
66 | J.P. Morgan Municipal Bond Funds
mailing a check on the next business day following the Fund’s receipt of a redemption order from the Financial Intermediary. For payments that are made to your Financial Intermediary for transmittal to you, the Funds expect to pay redemption proceeds to the Financial Intermediary within 1 to 3 business days following the Fund’s receipt of the redemption order from the Financial Intermediary.
Payment of redemption proceeds may take longer than the time a Fund typically expects and may take up to seven days as permitted by the Investment Company Act of 1940.
Transactions by phone, fax or the Internet
You may access your account and conduct certain transactions using phone, fax or the J.P. Morgan Funds website. Phone conversations are recorded. The J.P. Morgan Funds and their agents use reasonable procedures to verify the identity of the shareholder. If these procedures are followed, the J.P. Morgan Funds and their agents are not liable for any losses, liability, cost or expenses (including attorney fees) that may occur from acting on unauthorized or fraudulent instructions. Therefore please take precautions to protect your account information and immediately review account statements or other information provided to you. In addition, a confirmation is sent promptly after a transaction. Please review it carefully and contact J.P. Morgan Funds Services or your Financial Intermediary immediately about any transaction you believe to be unauthorized. You may revoke your right to make redemptions over the phone or by mailing written instructions to us.
You may not always reach J.P. Morgan Funds Services by phone or online. This may be true at times of unusual market changes and shareholder activity. You can mail us your instructions or contact your Financial Intermediary. We may modify or cancel the ability to purchase or redeem shares online or by phone without notice.
Additional Information Regarding Redemptions
Medallion signature guarantees may be required if:
•
You want to redeem shares with a value of $50,000 or more and you want to receive your proceeds in the form of a check; or
•
You want your payment sent to an address, bank account or payee other than the one currently designated on your Fund account.
The Fund may refuse to honor incomplete redemption orders.
The Fund may suspend your ability to redeem when:
1.
Trading on the NYSE is restricted;
2.
The NYSE is closed (other than weekend and holiday closings);
3.
Federal securities laws permit;
4.
The SEC has permitted a suspension; or
5.
An emergency exists, as determined by the SEC.
You generally will recognize a gain or loss on a redemption for federal income tax purposes. You should talk to your tax advisor before making a redemption.
Generally, all redemptions will be for cash. The J.P. Morgan Funds typically expect to satisfy redemption requests by selling portfolio assets or by using holdings of cash or cash equivalents. On a less regular basis, the Funds may also satisfy redemption requests by borrowing from another Fund, by drawing on a line of credit from a bank, or using other short-term borrowings from its custodian. These methods may be used during both normal and stressed market conditions. In addition to paying redemption proceeds in cash, if you redeem shares worth $250,000 or more, the J.P. Morgan Funds reserve the right to pay part or all of your redemption proceeds in readily marketable securities instead of cash. If payment is made in securities, the Fund will value the securities selected in the same manner in which it computes its NAV. This process minimizes the effect of large redemptions on the Fund and its remaining shareholders. If you receive a redemption in-kind, securities received by you may be subject to market risk and you could incur taxable gains and brokerage or other charges in converting the securities to cash. While the J.P. Morgan Funds do not routinely use redemptions in-kind, the Funds reserve the right to use redemptions in-kind to manage the impact of large redemptions on the Funds. Redemption in-kind proceeds will typically be made by delivering a pro-rata amount of a Fund’s holdings that are readily marketable securities to the redeeming shareholder within seven days after the Fund’s receipt of the redemption order.
July 1, 2022 | 67
Investing with J.P. Morgan Funds (continued)
The Funds and their service providers may temporarily hold redemption proceeds from accounts maintained directly with the Funds if there is a reasonable belief that financial exploitation of a Specified Adult has occurred, is occurring, has been attempted, or will be attempted. For purposes of this paragraph, the term “Specified Adult” refers to an individual who is (A) a natural person age 65 and older; or (B) a natural person age 18 and older who the member reasonably believes has a mental or physical impairment that renders the individual unable to protect his or her own interests.
Minimum Account Balance
If your account value falls below the required minimum balance, the Fund reserves the right to redeem all of the remaining shares in your account and close your account. Before this action is taken, you will be given 60 days advance written notice in order to provide you with time to increase your account balance to the required minimum, by purchasing sufficient shares, in accordance with the terms of this prospectus.
Closings, Reorganizations and Liquidations
To the extent authorized by law, each Fund reserves the right to discontinue offering shares at any time, to merge or reorganize itself or a share class, or to cease operations and liquidate at any time.
Frequent Trading Policy
J.P. Morgan Funds do not authorize market timing and, except for the Funds identified below, use reasonable methods to identify market timers and to prevent such activity. However, there can be no assurance that these methods will prevent market timing or other trading that may be deemed abusive. Market timing is an investment strategy using frequent purchases, redemptions and/or exchanges in an attempt to profit from short-term market movements. Market timing may result in dilution of the value of Fund shares held by long-term shareholders, disrupt portfolio management and increase Fund expenses for all shareholders. Although market timing may affect any Fund, these risks may be higher for Funds that invest significantly in non-U.S. securities or thinly traded securities (e.g., certain small cap securities), such as international, global or emerging market funds or small cap funds. For example, when a Fund invests in securities trading principally in non-U.S. markets that close prior to the close of the NYSE, market timers may seek to take advantage of the difference between the prices of these securities at the close of their non-U.S. markets and the value of such securities when the Fund calculates its net asset value.
J.P. Morgan Funds or the Distributor will prohibit any purchase order (including exchanges) with respect to one investor, a related group of investors or their agent(s) where they detect a pattern of either purchases and sales of one of the J.P. Morgan Funds, or exchanges between or among J.P. Morgan Funds, that indicates market timing or trading that they determine is abusive.
Although J.P. Morgan Funds use a variety of methods to detect and deter market timing, there is no assurance that the Funds’ own operational systems and procedures will identify and eliminate all market timing strategies. For example, certain accounts, which are known as omnibus accounts, include multiple investors and such accounts typically provide the Funds with a net purchase or redemption order on any given day where purchasers of Fund shares and redeemers of Fund shares are netted against one another and the identity of individual purchasers and redeemers are not known by the Funds. While the Funds seek to monitor for market timing activities in omnibus accounts, the netting effect limits the Funds’ ability to locate and eliminate individual market timers. As a result, the Funds are often dependent upon Financial Intermediaries who utilize their own policies and procedures to identify market timers. These policies and procedures may be different than those utilized by the Funds.
The Boards of J.P. Morgan Funds have adopted various policies and procedures to identify market timers, including reviewing “round trips” in and out of J.P. Morgan Funds by investors. A “round trip” includes a purchase or exchange into a Fund followed or preceded by a redemption or exchange out of the same Fund. If the Distributor detects that you have completed two round trips within 60 days in the same Fund, the Distributor will reject your purchase and exchange orders for a period of at least 90 days. For subsequent violations, the Distributor may, in its sole discretion, reject your purchase and exchange orders temporarily or permanently. In identifying market timers, the Distributor may also consider activity of accounts that it believes to be under common ownership or control.
J.P. Morgan Funds have attempted to put safeguards in place to assure that Financial Intermediaries have implemented procedures designed to deter market timing and abusive trading. Despite these safeguards, there is no assurance that the Funds will be able to effectively identify and eliminate market timing and abusive trading in the Funds particularly with respect to omnibus accounts.
J.P. Morgan Funds will seek to apply the Funds’ market timing policies and restrictions as uniformly as practicable to accounts with the Funds, except with respect to the following:
1.
Trades that occur through omnibus accounts at Financial Intermediaries as described above;
2.
Purchases, redemptions and exchanges made on a systematic basis;
68 | J.P. Morgan Municipal Bond Funds
3.
Automatic reinvestments of dividends and distributions;
4.
Purchases, redemptions or exchanges that are part of a rebalancing program, such as a wrap, advisory or bona fide asset allocation program, which includes investment models developed and maintained by a financial intermediary;
5.
Redemptions of shares to pay fund or account fees;
6.
Transactions initiated by the trustee or adviser to a donor-advised charitable gift fund;
7.
Transactions in Section 529 college savings plans;
8.
Transactions in Fund of Fund Products; and
9.
Transactions within a Retirement account such as:
•
Shares redeemed to return an excess contribution;
•
Transactions initiated by sponsors of group employee benefit plans or other related accounts;
•
Retirement plan contributions, loans, distributions, and hardship withdrawals;
•
IRA re-characterizations and conversions; and
•
IRA purchases of shares by asset transfer or direct rollover.
In addition to rejecting purchases in connection with suspected market timing activities, the Distributor can reject a purchase (including purchases for the Funds listed below) for any reason, including purchases that it does not think are in the best interests of a Fund and/or its shareholders or if it determines the trading to be abusive. Your Financial Intermediary may also have additional procedures for identifying market timers and rejecting or otherwise restricting purchases and/or exchanges.
Certain J.P. Morgan Funds are intended for short-term investment horizons and do not monitor for market timers or prohibit such short-term trading activity. Those Funds are the JPMorgan Short Duration Bond Fund, JPMorgan Short Duration Core Plus Fund, JPMorgan Short-Intermediate Municipal Bond Fund, JPMorgan Limited Duration Bond Fund, JPMorgan Managed Income Fund, JPMorgan Ultra-Short Municipal Fund and the J.P. Morgan Money Market Funds. Although these Funds are managed in a manner that is consistent with their investment objectives, frequent trading by shareholders may disrupt their management and increase their expenses.
Valuation
Shares are purchased at NAV per share. This is also known as the offering price. Shares are also redeemed at NAV. The NAV of each class within a Fund varies, primarily because each class has different class-specific expenses such as distribution and service fees.
The NAV per share of a class of a Fund is equal to the value of all the assets attributable to that class, minus the liabilities attributable to that class, divided by the number of outstanding shares of that class. The following is a summary of the procedures generally used to value J.P. Morgan Funds’ investments.
Securities for which market quotations are readily available are generally valued at their current market value. Other securities and assets, including securities for which market quotations are not readily available; market quotations are determined not to be reliable; or, their value has been materially affected by events occurring after the close of trading on the exchange or market on which the security is principally traded but before a Fund’s NAV is calculated, may be valued at fair value in accordance with policies and procedures adopted by the J.P. Morgan Funds’ Board of Trustees. Fair value represents a good faith determination of the value of a security or other asset based upon specifically applied procedures. Fair valuation may require subjective determinations. There can be no assurance that the fair value of an asset is the price at which the asset could have been sold during the period in which the particular fair value was used in determining a Fund’s NAV.
Equity securities listed on a North American, Central American, South American or Caribbean securities exchange are generally valued at the last sale price on the exchange on which the security is principally traded. Other foreign equity securities are fair valued using quotations from an independent pricing service, as applicable. The value of securities listed on the NASDAQ Stock Market, Inc. is generally the NASDAQ official closing price.
Fixed income securities are valued using prices supplied by an approved independent third party or affiliated pricing services or broker/dealers. Those prices are determined using a variety of inputs and factors as more fully described in the Statement of Additional Information.
Assets and liabilities initially expressed in foreign currencies are converted into U.S. dollars at the prevailing market rates from an approved independent pricing service as of 4:00 p.m. ET.
July 1, 2022 | 69
Investing with J.P. Morgan Funds (continued)
Shares of ETFs are generally valued at the last sale price on the exchange on which the ETF is principally traded. Shares of open-end investment companies are valued at their respective NAVs.
Options traded on U.S. securities exchanges are valued at the composite mean price, using the National Best Bid and Offer quotes.
Options traded on foreign exchanges are valued at the settled price, or if no settled price is available, at the last sale price available prior to the calculation of a Fund’s NAV and will be fair valued by applying fair value factors provided by independent pricing services, as applicable, for any options involving equity reference obligations listed on exchanges other than North American, Central American, South American or Caribbean securities exchanges.
Exchange traded futures are valued at the last sale price available prior to the calculation of a Fund’s NAV. Any futures involving equity reference obligations listed on exchanges other than North American, Central American, South American or Caribbean securities exchanges will be fair valued by applying fair value factors provided by independent pricing services, as applicable.
Non-listed over-the-counter options and futures are valued utilizing market quotations provided by approved pricing services.
Swaps and structured notes are priced generally by an approved independent third party or affiliated pricing service or at an evaluated price provided by a counterparty or broker/dealer.
Any derivatives involving equity reference obligations listed on exchanges other than North American, Central American, South American or Caribbean securities exchanges will be fair valued by applying fair value factors provided by independent pricing services, as applicable.
NAV is calculated each business day as of the close of the NYSE, which is typically 4:00 p.m. ET. On occasion, the NYSE will close before 4:00 p.m. ET. When that happens, NAV will be calculated as of the time the NYSE closes. The Funds will not treat an intraday unscheduled disruption or closure in NYSE trading as a closure of the NYSE and will calculate NAV as of 4:00 p.m. ET, if the particular disruption or closure directly affects only the NYSE. The price at which a purchase is effected is based on the next calculation of NAV after the order is received in proper form in accordance with this prospectus. To the extent a Fund invests in securities that are primarily listed on foreign exchanges or other markets that trade on weekends or other days when a Fund does not price its shares, the value of a Fund’s shares may change on days when you will not be able to purchase or redeem your shares.
Distributions and Taxes
Each Fund has elected to be treated and intends to qualify each taxable year as a regulated investment company. A regulated investment company is not subject to tax at the corporate level on income and gains from investments that are distributed to shareholders. Each Fund’s failure to qualify as a regulated investment company would result in corporate-level taxation and, consequently, a reduction in income available for distribution to shareholders.
Each Fund can earn income and realize capital gain. Each Fund deducts any expenses and then pays out the earnings, if any, to shareholders as distributions.
Each Fund generally distributes net investment income, if any, at least on a monthly basis. The Funds will distribute net realized capital gains, if any, at least annually. For each taxable year, each Fund will distribute substantially all of its net investment income and net realized capital gains.
You have the following options for your distributions. You may:
•
Reinvest all distributions in additional Fund shares;
•
Take distributions of net investment income in cash and reinvest distributions of net capital gain in additional shares;
•
Take distributions of net capital gain in cash and reinvest distributions of net investment income; or
•
Take all distributions in cash.
If you do not select an option when you open your account, we will reinvest all distributions. If your distributions are reinvested, they will be in the form of shares of the same class without a sales charge. If you take your distributions in cash, you can choose to have a check mailed to your address of record or you can have them deposited into a pre-assigned bank account. The taxation of the dividends will not be affected whether you have them deposited into a bank account or sent by check.
If, at the close of each quarter of its taxable year, at least 50% of the value of a Fund’s total assets consists of tax-exempt interest obligations, the Fund will be eligible to designate distributions of interest derived from tax-exempt-interest obligations as “exempt interest dividends.” As described in the section entitled “What are the Fund’s main investment strategies?” for each Fund, the Funds invest primarily in various types of municipal bonds, the interest on which is exempt from federal income tax. Distributions that are properly reported as exempt-interest dividends generally are not subject to federal income tax but may be subject to state and local taxes and, in certain instances, may result in liability for the federal alternative minimum tax, both for individual and corporate shareholders. You should consult your tax advisor concerning your own tax situation.
70 | J.P. Morgan Municipal Bond Funds
Shares of the Funds may not be suitable for tax-exempt investors since such investors are generally tax exempt and, therefore, would not gain any additional benefit from the Funds' dividends being tax exempt.
Shareholders who receive social security or railroad retirement benefits should also consult their tax advisors to determine what effect, if any, an investment in any of the Funds may have on the federal taxation of their benefits. Exempt-interest dividends generally are included in income for purposes of determining the amount of benefits that are taxable.
The Funds may invest a portion of their assets in securities that generate income subject to federal, state, and/or local taxes. For Federal income tax purposes, distributions of net investment income that are not properly reported as exempt-interest dividends generally are taxable as ordinary income from dividends. Dividends of net investment income paid to a non-corporate U.S. shareholder that are properly reported as qualified dividend income generally will be taxable to such shareholder at preferential rates. The maximum individual federal income tax rate applicable to “qualified dividend income” is either 15% or 20%, depending on whether the individual’s income exceeds certain threshold amounts. The amount of dividend income that may be so reported by a Fund generally will be limited to the aggregate of the eligible dividends received by each Fund. In addition, a Fund must meet certain holding period and other requirements with respect to the shares on which the Fund received the eligible dividends, and the non-corporate U.S. shareholder must meet certain holding period and other requirements with respect to the Fund. The amount of a Fund’s distributions that would otherwise qualify for this favorable tax treatment may be reduced as a result of the Fund’s securities lending activities or high portfolio turnover rate. Dividends of net investment income that are not reported as either qualified dividend income or exempt-interest dividend income and dividends of net short-term capital gain will be taxable to a U.S. shareholder as ordinary income. It is unlikely that dividends from any of the Funds will qualify to a significant extent for designation as qualified dividend income.
Distributions of net capital gain (that is, the excess of the net gains from the sale of investments that a Fund owned for more than one year over the net losses from investments that the Fund owned for one year or less) that are properly reported by a Fund as capital gain dividends will be taxable as long-term capital gain, regardless of how long you have held your shares in the Fund. The maximum individual federal income tax rate applicable to long-term capital gains is generally either 15% or 20%, depending on whether the individual’s income exceeds certain threshold amounts. Distributions of net short-term capital gain (that is, the excess of any net short-term capital gain over net long-term capital loss), if any, will be taxable to U.S. shareholders as ordinary income. Capital gain of a corporate shareholder is taxed at the same rate as ordinary income.
An additional 3.8% Medicare tax is imposed on certain net investment income (including ordinary dividends and capital gain distributions received from a Fund and net gains from redemptions or other taxable dispositions of Fund shares, but excluding any exempt-interest dividends received from a Fund) of U.S. individuals, estates and trusts to the extent that such person’s “modified adjusted gross income” (in the case of an individual) or “adjusted gross income” (in the case of an estate or trust) exceeds certain threshold amounts.
If you buy shares of a Fund just before a distribution, you will be subject to tax on the entire amount of the taxable distribution you receive. Distributions are taxable to you even if they are paid from income or gains earned by a Fund before your investment (and thus were included in the price you paid for your Fund shares). Any gain resulting from the sale or exchange of Fund shares generally will be taxable as long-term or short-term gain, depending upon how long you have held your shares.
A Fund’s investments in certain debt obligations, mortgage-backed and asset-backed securities, and derivative instruments may require the Fund to accrue and distribute income not yet received. In order to generate sufficient cash to make the requisite distributions, a Fund may be required to liquidate other investments in its portfolio that it otherwise would have continued to hold, including at times when it is not advantageous to do so.
A Fund’s transactions in futures contracts, short sales, swaps and other derivatives will be subject to special tax rules, the effect of which may be to accelerate income to the Fund, defer losses to the Fund, cause adjustments in the holding periods of the Fund’s securities, and convert short-term capital losses into long-term capital losses. These rules could therefore affect the amount, timing and character of distributions to shareholders. A Fund’s use of these types of transactions may result in the Fund realizing more short-term capital gain and ordinary income subject to tax at ordinary income tax rates than it would if it did not engage in such transactions.
Investors should consult their advisers about state and local tax consequences of the investment in the Funds. The information below is only a general summary based on current statutes and regulations as well as current policies of each state, all of which may change possibly with retroactive effect.
California Taxes. California personal income tax law provides that dividends paid by a regulated investment company, or series thereof, are excludable from gross income if (1) at the close of each quarter of such company’s taxable year, at least 50% of the value of its total assets consists of obligations the interest from which would be exempt from California taxation if such obligations were held by an individual and (2) if such dividends are reported by the Fund as exempt interest dividends in written statements furnished
July 1, 2022 | 71
Investing with J.P. Morgan Funds (continued)
to shareholders. Under California law, exempt-interest dividends (including some dividends paid after the close of the year as described in Section 855 of the Internal Revenue Code) may not exceed the excess of (A) the amount of interest received by the Fund which would be tax-exempt interest if the obligations on which the interest was paid were held by an individual over (B) the amount that would be considered expenses related to exempt income and thus would not be deductible under California personal income tax law. Distributions to individual shareholders derived from items other than exempt-interest described above will be subject to California personal income tax. In addition, corporate shareholders should note that dividends will not be exempt from California corporate franchise tax and may not be exempt from California corporate income tax. California has an alternative minimum tax (“AMT”) similar to the federal AMT. However, the California AMT does not include interest from private activity municipal obligations as an item of tax preference. Interest on indebtedness incurred or continued by a shareholder in connection with the purchase of shares of a Fund will generally not be deductible for California personal income tax purposes.
New York Taxes. Dividends paid by the New York Tax Free Bond Fund that are derived from interest attributable to obligations of the State of New York or its political subdivisions or certain other governmental entities (for example, the Commonwealth of Puerto Rico or the U.S. Virgin Islands), the interest on which was excludable from gross income for purposes of both federal income taxation and New York State and City personal income taxation (“New York Tax-Exempt Bonds”) and designated as such, generally are exempt from New York State and New York City personal income tax as well as from the New York City unincorporated business tax (but not the New York State corporation franchise tax or New York City general corporation tax), provided that such dividends constitute exempt-interest dividends under Section 852(b)(5) of the Internal Revenue Code. Dividends and other distributions (aside from exempt-interest dividends derived from New York Tax-Exempt Bonds) generally are not exempt from New York State and City taxes. For New York State and City tax purposes, distributions of net long-term capital gain will be taxable at the same rates as ordinary income. Distributions by the Fund from investment income and capital gain, including exempt -interest dividends, also generally are included in a corporation’s net investment income for purposes of calculating such corporation’s obligations under the New York State corporate franchise tax and the New York City general corporation tax, if received by a corporation subject to those taxes, and will be subject to such taxes to the extent that a corporation’s net investment income is allocated to New York State and/or New York City. To the extent that investors are subject to state and local taxes outside of New York State, all dividends paid by the Fund may be taxable income for purposes thereof. To the extent that the Fund’s dividends are derived from interest attributable to the obligations of any other state or of a political subdivision of any such other state or are derived from capital gains, such dividends will generally not be exempt from New York State or New York City tax. The New York minimum tax for individuals, which excluded tax-exempt interest as an item of tax preference, has been eliminated for tax years beginning on or after January 1, 2014. Interest incurred to buy or carry shares of the Fund generally is not deductible for federal, New York State or New York City personal income tax purposes.
Please see the Statement of Additional Information for additional discussion of the tax consequences of the above-described and other investments to each Fund and its shareholders.
The dates on which net investment income and capital gain dividends, if any, will be distributed are available online at www.jpmorganfunds.com.
Early in each calendar year, each Fund will send you a notice showing the amount of distributions you received during the preceding calendar year and the tax status of those distributions.
The Funds are not intended for foreign shareholders. Any foreign shareholders would generally be subject to U.S. tax-withholding on distributions by the Funds, as discussed in the Statement of Additional Information.
Distributions by a Fund to retirement plans and other entities that qualify for tax-exempt or tax-deferred treatment under federal income tax laws will generally not be taxable. Special tax rules apply to investments through such plans. The tax considerations described in this section do not apply to such tax-exempt or tax-deferred entities or accounts. You should consult your tax advisor to determine the suitability of a Fund as an investment and the tax treatment of distributions.
Any investor for whom a Fund does not have a valid Taxpayer Identification Number may be subject to backup withholding.
The above is a general summary of tax implications of investing in the Funds. Because each investor’s tax consequences are unique, please consult your tax advisor to see how investing in a Fund and, for individuals and S corporations, selection of a particular cost method of accounting will affect your own tax situation.
72 | J.P. Morgan Municipal Bond Funds
IMPORTANT TAX REPORTING CONSIDERATIONS
Your Financial Intermediary or the Fund (if you hold your shares in the Fund direct account) will report gains and losses realized on redemptions of shares for shareholders who are individuals and S corporations purchased after January 1, 2012 to the Internal Revenue Service (IRS). This information will also be reported to you on Form 1099-B and the IRS each year. In calculating the gain or loss on redemptions of shares, the average cost method will be used to determine the cost basis of Fund shares purchased after January 1, 2012 unless you instruct the Fund in writing at J.P. Morgan Funds Services, P.O. Box 219143, Kansas City, MO 64121-9143 that you want to use another available method for cost basis reporting (for example, First In, First Out (FIFO), Last In, First Out (LIFO), Specific Lot Identification (SLID) or High Cost, First Out (HIFO)). If you designate SLID as your cost basis method, you will also need to designate a secondary cost basis method (Secondary Method). If a Secondary Method is not provided, the Fund will designate FIFO as the Secondary Method and will use the Secondary Method with respect to systematic redemptions.
Not all cost basis methods are available. Please contact the Fund at J.P. Morgan Funds Services, P.O. Box 219143, Kansas City, MO 64121-9143 for more information on the available methods for cost basis reporting. To determine which available cost basis method is best for you, you should consult with your tax advisor. Please note that you will be responsible for calculating and reporting gains and losses on redemptions of shares purchased prior to January 1, 2012 to the IRS as such information will not be reported by the Fund and may not be maintained by your Financial Intermediary.
Your Financial Intermediary or the Fund (if you hold your shares in the Fund direct account) is also required to report gains and losses to the IRS in connection with redemptions of shares by S corporations. If a shareholder is a corporation and has not instructed the Fund that it is a C corporation in its account application or by written instruction to J.P. Morgan Funds Services, P.O. Box 219143, Kansas City, MO 64121-9143, the Fund will treat the shareholder as an S corporation and file a Form 1099-B.
Shareholder Statements and Reports
The J.P. Morgan Funds or your Financial Intermediary will send you transaction confirmation statements and quarterly account statements. Please review these statements carefully. The Funds will correct errors if notified within one year of the date printed on the transaction confirmation or account statement. Your Financial Intermediary may have a different cut-off time. J.P. Morgan Funds will charge a fee for requests for statements that are older than two years. Please retain all of your statements, as they could be needed for tax purposes.
To reduce expenses and conserve natural resources, the J.P. Morgan Funds will deliver a single copy of prospectuses and financial reports to individual investors who share a residential address, provided they have the same last name or the J.P. Morgan Funds reasonably believe they are members of the same family. If you would like to receive separate mailings, please call 1-800-480-4111 and the Fund will begin individual delivery within 30 days. If you would like to receive these documents by e-mail, please visit www.jpmorganfunds.com and sign up for electronic delivery.
If you hold your Fund shares directly, you may access your account statements at www.jpmorganfunds.com.
After each fiscal half year you will receive a financial report from the Funds. In addition, the Funds will periodically send you proxy statements and other reports.
If you have any questions or need additional information, please write to J.P. Morgan Funds Services at P.O. Box 219143, Kansas City, MO 64121-9143, call 1-800-480-4111 or visit www.jpmorganfunds.com.
Availability of Proxy Voting Record
The Trustees for each Fund have delegated the authority to vote proxies for securities owned by the Funds to the Funds' adviser. A copy of each Fund’s voting record for the most recent 12-month period ended June 30 is available on the SEC’s website at www.sec.gov or on J.P. Morgan Funds’ website at www.jpmorganfunds.com no later than August 31 of each year. Each Fund’s proxy voting record will include, among other things, a brief description of the matter voted on for each portfolio security, and will state how each vote was cast, for example, for or against the proposal.
Portfolio Holdings Disclosure
No sooner than three calendar days after the end of each month, each Fund will make available upon request the uncertified, complete schedule of its portfolio holdings as of the last day of that month.
Not later than 60 days after the end of each fiscal quarter, each Fund will make available upon request a complete schedule of its portfolio holdings as of the last day of that quarter.
July 1, 2022 | 73
Investing with J.P. Morgan Funds (continued)
Each Fund will post these quarterly schedules on the J.P. Morgan Funds’ website at www.jpmorganfunds.com and on the SEC’s website at www.sec.gov.
The Funds may disclose a Fund’s 10 largest portfolio holdings and the percentage that each of these 10 holdings represent of the Fund’s portfolio as of the most recent month’s end, online at www.jpmorganfunds.com, no sooner than 10 calendar days after month’s end.
Shareholders may request portfolio holdings schedules at no charge by calling 1-800-480-4111. A description of each Fund’s policies and procedures with respect to the disclosure of a Fund’s portfolio holdings is available in the Statement of Additional Information.
74 | J.P. Morgan Municipal Bond Funds
Glossary of Common Investment Terminology
For the purpose of the “INVESTING WITH J.P. MORGAN FUNDS” section, references to “account” and “Fund” are not interchangeable. Fund refers to an individual mutual fund position. An account may be invested in a single Fund or multiple Funds.
Capital Gains Distribution — Payment to mutual fund shareholders of gains realized on securities that a Fund has sold at a profit, minus any realized losses.
Dividend Distribution — Payment to mutual fund shareholders of income from interest or dividends generated by a Fund’s investments.
Financial Intermediaries — Include financial advisors, investment advisers, brokers, financial planners, banks, insurance companies, retirement or 401(k) plan administrators and others, including various affiliates of JPMorgan Chase, that have entered into agreements with the Distributor and/or shareholder servicing agent. Shares purchased this way will typically be held for you by the Financial Intermediary.
Group Retirement Plans — Refers to employer-sponsored retirement, deferred compensation and employee benefit plans (including health savings accounts) and trusts used to fund those plans. To satisfy eligibility requirements, the plan must be a group plan (more than one participant), the shares cannot be held in a commission-based brokerage account and
•
Shares must be held at a plan level or
•
Shares must be held at the Fund level through an omnibus account of a retirement plan recordkeeper.
Group Retirement Plans include group employer-sponsored 401(k) plans, 457 plans, employer-sponsored 403(b) plans, profit-sharing and money purchase pension plans, defined benefit plans, retiree health benefit plans, group annuity separate accounts offered to retirement plans and non-qualified deferred compensation plans. Group Retirement Plans do not include traditional IRAs, Roth IRAs, Coverdell Education Savings Accounts, SEPs, SARSEPs, SIMPLE IRAs, KEOGHs, individual 401(k) or individual 403(b) plans.
Medallion Signature Guarantee — A special stamp used to verify the authenticity of certain documents. It is a guarantee by a financial institution that the signature is genuine and the financial institution accepts liability for any forgery. Medallion signature guarantees protect shareholders by preventing unauthorized transfer of assets that could result in monetary losses to the investor due to fraud. Medallion guarantee stamps can be obtained at many bank branches or brokerage firms.
Uncollected Shares — Shares purchased directly through J.P. Morgan Funds Services by check are not available for redemption for up to five business days following the acceptance of a purchase order unless you provide satisfactory proof that your purchase check has cleared.
Wire — Refers to the method used for payment or redemptions. While J.P. Morgan Funds does not charge to send a wire, your bank may charge a fee for service.
July 1, 2022 | 75
Investment Practices
The table discusses the types of investments which can be held by the Funds. In each case, the related types of risk are also listed.
| FUND NAME |
FUND CODE |
| JPMorgan Sustainable Municipal Income Fund |
1 |
| JPMorgan Short-Intermediate Municipal Bond Fund |
2 |
| JPMorgan Tax Free Bond Fund |
3 |
| JPMorgan California Tax Free Bond Fund |
4 |
| JPMorgan High Yield Municipal Fund |
5 |
| JPMorgan Intermediate Tax Free Bond Fund |
6 |
| JPMorgan New York Tax Free Bond Fund |
7 |
| INSTRUMENT |
FUND CODE |
RISK TYPE |
| Adjustable Rate Mortgage Loans (ARMs): Loans in a mortgage pool which provide for a fixed initial mortgage interest rate for a specified period of time, after which the rate may be subject to periodic adjustments. |
2, 5 |
Credit Interest Rate Liquidity Market Political Prepayment Valuation |
| Asset-Backed Securities: Securities secured by company receivables, home equity loans, truck and auto loans, leases, and credit card receivables or other securities backed by other types of receivables or other assets. |
1–7 |
Credit Interest Rate Liquidity Market Political Prepayment Valuation |
| Auction Rate Securities: Auction rate municipal securities and auction rate preferred securities issued by closed-end investment companies. |
1–7 |
Credit Interest Rate Liquidity Market |
| Bank Obligations: Bankers’ acceptances, certificates of deposit and time deposits. Bankers’ acceptances are bills of exchange or time drafts drawn on and accepted by a commercial bank. Maturities are generally six months or less. Certificates of deposit are negotiable certificates issued by a bank for a specified period of time and earning a specified return. Time deposits are non-negotiable receipts issued by a bank in exchange for the deposit of funds. |
1–7 |
Credit Currency Interest Rate Liquidity Market Political |
| Borrowings: A Fund may borrow for temporary purposes and/or for investment purposes. Such a practice will result in leveraging of the Fund’s assets and may cause a Fund to liquidate portfolio positions when it would not be advantageous to do so. A Fund must maintain continuous asset coverage of 300% of the amount borrowed, with the exception for borrowings not in excess of 5% of the Fund’s total assets made for temporary administrative purposes. |
1–7 |
Credit Interest Rate Market |
| Call and Put Options: A call option gives the buyer the right to buy, and obligates the seller of the option to sell a security at a specified price at a future date. A put option gives the buyer the right to sell, and obligates the seller of the option to buy a security at a specified price at a future date. A Fund will sell only covered call and secured put options. |
1–7 |
Credit Leverage Liquidity Management Market |
76 | J.P. Morgan Municipal Bond Funds
| INSTRUMENT |
FUND CODE |
RISK TYPE |
| Commercial Paper: Secured and unsecured short-term promissory notes issued by corporations and other entities. Maturities generally vary from a few days to nine months. |
1–7 |
Credit Currency Interest Rate Liquidity Market Political Valuation |
| Common Stock Warrants and Rights: Securities, typically issued with preferred stock or bonds, that give the holder the right to buy a proportionate amount of common stock at a specified price. |
3 |
Credit Market |
| Corporate Debt Securities: May include bonds and other debt securities of domestic and foreign issuers, including obligations of industrial, utility, banking and other corporate issuers. |
1–7 |
Credit Currency Interest Rate Liquidity Market Political Prepayment Valuation |
| Credit Default Swaps (CDSs): A swap agreement between two parties pursuant to which one party pays the other a fixed periodic coupon for the specified life of the agreement. The other party makes no payment unless a credit event, relating to a predetermined reference asset, occurs. If such an event occurs, the party will then make a payment to the first party, and the swap will terminate. |
1-7 |
Credit Currency Interest Rate Leverage Liquidity Management Market Political Valuation |
| Custodial Receipts: A Fund may acquire securities in the form of custodial receipts that evidence ownership of future interest payments, principal payments or both on certain U.S. Treasury notes or bonds in connection with programs sponsored by banks and brokerage firms. These are not considered to be U.S. government securities. These notes and bonds are held in custody by a bank on behalf of the owners of the receipts. |
1-7 |
Credit Liquidity Market |
| Demand Features: Securities that are subject to puts and standby commitments to purchase the securities at a fixed price (usually with accrued interest) within a fixed period of time following demand by a Fund. |
1–7 |
Liquidity Management Market |
| Exchange-Traded Funds (ETFs): Ownership interest in unit investment trusts, depositary receipts, and other pooled investment vehicles that hold a portfolio of securities or stocks designed to track the price performance and dividend yield of a particular broad-based, sector or international index. ETFs include a wide range of investments. |
1–7 |
Investment Company Market |
| Foreign Investments: Equity and debt securities (e.g., bonds and commercial paper) of foreign entities and obligations of foreign branches of U.S. banks and foreign banks. Foreign securities may also include American Depositary Receipts (ADRs), Global Depositary Receipts (GDRs), European Depositary Receipts (EDRs) and American Depositary Securities. |
5 |
Foreign Investment Liquidity Market Political Prepayment Valuation |
July 1, 2022 | 77
Investment Practices (continued)
| INSTRUMENT |
FUND CODE |
RISK TYPE |
| High Yield/High Risk Securities/Junk Bonds: Securities that are generally rated below investment grade by the primary rating agencies or are unrated but deemed by a Fund’s adviser to be of comparable quality. |
1-7 |
Credit Currency High Yield Securities Interest Rate Liquidity Market Political Portfolio Quality Valuation |
| Inflation-Linked Debt Securities: Includes fixed and floating rate debt securities of varying maturities issued by the U.S. government as well as securities issued by other entities such as corporations, foreign governments and foreign issuers. |
5 |
Credit Currency Interest Rate Political |
| Interfund Lending: Involves lending money and borrowing money for temporary purposes through a credit facility. |
1-7 |
Credit Interest Rate Market |
| Inverse Floating Rate Instruments: Leveraged variable debt instruments with interest rates that reset in the opposite direction from the market rate of interest to which the inverse floater is indexed. |
1–7 |
Credit Leverage Market |
| Investment Company Securities: Shares of other investment companies, including money market funds for which the adviser and/or its affiliates serve as investment adviser or administrator. The adviser will waive certain fees when investing in funds for which it serves as investment adviser, to the extent required by law or by contract. |
1–6 |
Investment Company Market |
| Loan Assignments and Participations: Assignments of, or participations in all or a portion of loans to corporations or to governments, including governments in less developed countries. |
1–7 |
Credit Currency Extension Foreign Investment Interest Rate Liquidity Market Political Prepayment |
| Master Limited Partnerships: Limited partnerships that are publicly traded on a securities exchange. |
5 |
Market |
| Mortgages (Directly Held): Debt instruments secured by real property. |
5 |
Credit Environmental Extension Interest Rate Liquidity Market Natural Event Political Prepayment Valuation |
78 | J.P. Morgan Municipal Bond Funds
| INSTRUMENT |
FUND CODE |
RISK TYPE |
| Mortgage-Backed Securities: Debt obligations secured by real estate loans and pools of loans such as collateralized mortgage obligations (CMOs), commercial mortgage-backed securities (CMBSs) and other asset-backed structures. |
1–7 |
Credit Currency Extension Interest Rate Leverage Liquidity Market Political Prepayment Tax Valuation |
| Mortgage Dollar Rolls1 : A transaction in which the Fund sells securities for delivery in a current month and simultaneously contracts with the same party to repurchase similar but not identical securities on a specified future date. |
2, 5 |
Currency Extension Interest Rate Leverage Liquidity Market Political Prepayment |
| Municipal Securities: Securities issued by a state or political subdivision to obtain funds for various public purposes. Municipal securities include, among others, private activity bonds and industrial development bonds, as well as general obligation notes, tax anticipation notes, bond anticipation notes, revenue anticipation notes, other short-term tax-exempt obligations, municipal leases, obligations of municipal housing authorities and single family revenue bonds. |
1–7 |
Credit Interest Rate Market Natural Event Political Prepayment Tax Valuation |
| New Financial Products: New options and futures contracts and other financial products continue to be developed and the Fund may invest in such options, contracts and products. |
1–7 |
Credit Liquidity Management Market |
| Obligations of Supranational Agencies: Obligations which are chartered to promote economic development and are supported by various governments and governmental agencies. |
2 |
Credit Foreign Investment Liquidity Political Valuation |
| Options and Futures Transactions: A Fund may purchase and sell (a) exchange traded and over- the-counter put and call options on securities, indexes of securities and futures contracts on securities and indexes of securities, and (b) futures contracts on securities and indexes of securities. |
1–7 |
Credit Leverage Liquidity Management Market |
| Preferred Stock: A class of stock that generally pays a dividend at a specified rate and has preference over common stock in the payment of dividends and in liquidation. |
2, 5 |
Market |
| Private Placements, Restricted Securities and Other Unregistered Securities: Securities not registered under the Securities Act of 1933, such as privately placed commercial paper and Rule 144A securities. |
1–7 |
Liquidity Market Valuation |
1
All forms of borrowing (including mortgage dollar-rolls and reverse repurchase agreements) are limited in the aggregate and may not exceed 33 1∕3% of the Fund’s
total assets except as permitted by law.
July 1, 2022 | 79
Investment Practices (continued)
| INSTRUMENT |
FUND CODE |
RISK TYPE |
| Real Estate Investment Trusts (REITs): Pooled investment vehicles which invest primarily in income producing real estate or real estate related loans or interest. |
5 |
Credit Interest Rate Liquidity Management Market Political Prepayment Tax Valuation |
| Repurchase Agreements: The purchase of a security and the simultaneous commitment to return the security to the seller at an agreed upon price on an agreed upon date. This is treated as a loan. |
1–7 |
Credit Liquidity Market |
| Reverse Repurchase Agreements1: The sale of a security and the simultaneous commitment to buy the security back at an agreed upon price on an agreed upon date. This is treated as borrowing by a Fund. |
1-2, 5-6 |
Credit Leverage Market |
| Securities Issued in Connection with Reorganizations and Corporate Restructurings: In connection with reorganizing or restructuring of an issuer, an issuer may issue common stock or other securities to holders of its debt securities. |
5 |
Market |
| Short Selling: A Fund sells a security it does not own in anticipation of a decline in the market value of the security. To complete the transaction, a Fund must borrow the security to make delivery to the buyer. A Fund is obligated to replace the security borrowed by purchasing it subsequently at the market price at the time of replacement. |
5 |
Credit Liquidity Market |
| Short-Term Funding Agreements: Agreements issued by banks and highly rated U.S. insurance companies such as Guaranteed Investment Contracts (GICs) and Bank Investment Contracts (BICs). |
1–7 |
Credit Liquidity Market |
| Sovereign Obligations: Investments in debt obligations issued or guaranteed by a foreign sovereign government or its agencies, authorities or political subdivisions. |
2, 5 |
Credit Foreign Investment Liquidity Political Valuation |
| Stripped Mortgage-Backed Securities: Derivative multi-class mortgage securities which are usually structured with two classes of shares that receive different proportions of the interest and principal from a pool of mortgage assets. These include Interest Only (IO) and Principal Only (PO) securities issued outside a Real Estate Mortgage Investment Conduit (REMIC) or CMO structure. |
1–7 |
Credit Liquidity Market Political Prepayment Valuation |
| Structured Investments: A security having a return tied to an underlying index or other security or asset class. Structured investments generally are individually negotiated agreements and may be traded over-the-counter. Structured investments are organized and operated to restructure the investment characteristics of the underlying security. |
1–7 |
Credit Foreign Investment Liquidity Management Market Valuation |
1
All forms of borrowing (including mortgage dollar-rolls and reverse repurchase agreements) are limited in the aggregate and may not exceed 33 1∕3% of the Fund’s
total assets except as permitted by law.
80 | J.P. Morgan Municipal Bond Funds
| INSTRUMENT |
FUND CODE |
RISK TYPE |
| Swaps and Related Swap Products: Swaps involve an exchange of obligations by two parties. Caps and floors entitle a purchaser to a principal amount from the seller of the cap or floor to the extent that a specified index exceeds or falls below a predetermined interest rate or amount. A Fund may enter into these transactions to manage its exposure to changing interest rates and other factors. |
1–7 |
Credit Currency Interest Rate Leverage Liquidity Management Market Political Valuation |
| Synthetic Variable Rate Instruments: Instruments that generally involve the deposit of a long- term tax exempt bond in a custody or trust arrangement and the creation of a mechanism to adjust the long-term interest rate on the bond to a variable short-term rate and a right (subject to certain conditions) on the part of the purchaser to tender it periodically to a third party at par. |
1–7 |
Credit Liquidity Market |
| Temporary Defensive Positions: To respond to unusual circumstances a Fund may invest in cash and cash equivalents for temporary defensive purposes. |
1–7 |
Credit Interest Rate Liquidity Market |
| Treasury Receipts: A Fund may purchase interests in separately traded interest and principal component parts of U.S. Treasury obligations that are issued by banks or brokerage firms and that are created by depositing U.S. Treasury notes and U.S. Treasury bonds into a special account at a custodian bank. Receipts include Treasury Receipts (TRs), Treasury Investment Growth Receipts (TIGRs) and Certificates of Accrual on Treasury Securities (CATS). |
1–7 |
Market |
| Trust Preferreds: Securities with characteristics of both subordinated debt and preferred stock. Trust preferreds are generally long term securities that make periodic fixed or variable interest payments. |
5 |
Credit Currency Interest Rate Liquidity Market Political Valuation |
| U.S. Government Agency Securities: Securities issued or guaranteed by agencies and instrumentalities of the U.S. government. These include all types of securities issued by the Government National Mortgage Association (Ginnie Mae), the Federal National Mortgage Association (Fannie Mae) and the Federal Home Loan Mortgage Corporation (Freddie Mac), including funding notes, subordinated benchmark notes, CMOs and Real Estate Mortgage Investment Conduits (REMICs). |
1–7 |
Credit Government Securities Interest Rate Market |
| U.S. Government Obligations: May include direct obligations of the U.S. Treasury, including Treasury bills, notes and bonds, all of which are backed as to principal and interest payments by the full faith and credit of the United States, and separately traded principal and interest component parts of such obligations that are transferable through the Federal book-entry system known as Separate Trading of Registered Interest and Principal of Securities (STRIPS) and Coupons Under Book Entry Safekeeping (CUBES). |
1–7 |
Interest Rate Market |
| Variable and Floating Rate Instruments: Obligations with interest rates which are reset daily, weekly, quarterly or some other frequency and which may be payable to a Fund on demand or at the expiration of a specified term. |
1–7 |
Credit Liquidity Market Valuation |
| When-Issued Securities,Delayed Delivery Securities and Forward Commitments: Purchase or contract to purchase securities at a fixed price for delivery at a future date. |
1–7 |
Credit Leverage Liquidity Market Valuation |
July 1, 2022 | 81
Investment Practices (continued)
| INSTRUMENT |
FUND CODE |
RISK TYPE |
| Zero-Coupon, Pay-in-Kind and Deferred Payment Securities: Zero-coupon securities are securities that are sold at a discount to par value and on which interest payments are not made during the life of the security. Pay-in-kind securities are securities that have interest payable by delivery of additional securities. Deferred payment securities are zero-coupon debt securities which convert on a specified date to interest bearing debt securities. |
1–7 |
Credit Currency Interest Rate Liquidity Market Political Valuation Zero-Coupon Bond |
Risk related to certain investments held by the Funds:
Credit risk The risk that a financial obligation will not be met by the issuer of a security or the counterparty to a contract, resulting in a loss to the purchaser.
Currency risk The risk that currency exchange rate fluctuations may reduce gains or increase losses on foreign investments.
Environmental risk The risk that an owner or operator of real estate may be liable for the costs associated with hazardous or toxic substances located on the property.
Extension risk The risk that a rise in interest rates will extend the life of a mortgage-backed security to a date later than the anticipated prepayment date, causing the value of the investment to fall.
Foreign investment risk The risk associated with higher transaction costs, delayed settlements, currency controls and adverse economic developments. This also includes the risk that fluctuations in the exchange rates between the U.S. dollar and foreign currencies may negatively affect an investment. Adverse changes in exchange rates may erode or reverse any gains produced by foreign currency denominated investments and may widen any losses. Exchange rate volatility also may affect the ability of an issuer to repay U.S. dollar denominated debt, thereby increasing credit risk.
Government securities risk U.S. government securities are subject to market risk, interest rate risk and credit risk. Securities, such as those issued or guaranteed by Ginnie Mae or the U.S. Treasury, that are backed by the full faith and credit of the United States are guaranteed only as to the timely payment of interest and principal when held to maturity and the market prices for such securities will fluctuate. Circumstances could arise that would prevent the payment of interest or principal. Securities issued or guaranteed by certain U.S. government-related organizations, such as Fannie Mae and Freddie Mac, are not backed by the full faith and credit of the U.S. government and no assurance can be given that the U.S. government will provide financial support.
High yield securities risk The risk that the Fund may invest in high yield, high risk securities (also known as junk bonds) which are considered to be speculative. These investments may be issued by companies which are highly leveraged, less creditworthy or financially distressed. Non-investment grade debt securities can be more sensitive to short-term corporate, economic and market developments. During periods of economic uncertainty and change, the market price of the Fund’s investments and the Fund’s net asset value may be volatile. Furthermore, though these investments generally provide a higher yield than higher-rated debt securities, the high degree of risk involved in these investments can result in substantial or total losses. These securities are subject to greater risk of loss, greater sensitivity to economic changes, valuation difficulties, and a potential lack of a secondary or public market for securities. The market price of these securities can change suddenly and unexpectedly.
Interest rate risk The risk that a change in interest rates will adversely affect the value of an investment. The value of fixed income securities generally moves in the opposite direction of interest rates (decreases when interest rates rise and increases when interest rates fall). A Fund may face a heightened level of interest rate risk due to certain changes in monetary policy, such as an interest rate increase by the Federal Reserve.
Investment company risk If a Fund invests in shares of another investment company, shareholders would bear not only their proportionate share of the Fund’s expenses, but also similar expenses of the investment company. The price movement of an investment company that is an ETF may not track the underlying index and may result in a loss.
Leverage risk The risk that gains or losses will be disproportionately higher than the amount invested.
Liquidity risk The risk that the holder may not be able to sell the security at the time or price it desires.
Management risk The risk that a strategy used by a Fund’s management may fail to produce the intended result. This includes the risk that changes in the value of a hedging instrument will not match those of the asset being hedged. Incomplete matching can result in unanticipated risks.
Market risk The risk that when the market as a whole declines, the value of a specific investment will decline proportionately. This systematic risk is common to all investments and the mutual funds that purchase them.
Natural event risk The risk that a natural disaster, such as a hurricane or similar event, will cause severe economic losses and default in payments by the issuer of the security.
Political risk The risk that governmental policies or other political actions will negatively impact the value of the investment.
Portfolio quality risk The risks associated with below investment grade securities including greater risk of default, greater sensitivity to interest rates and economic changes, potential valuation difficulties, and sudden and unexpected changes in credit quality.
Prepayment risk The risk that declining interest rates or other factors will result in unexpected prepayments, causing the value of the investment to fall.
Tax risk The risk that the issuer of the securities will fail to comply with certain requirements of the Internal Revenue Code, which could cause adverse tax consequences. Also the risk that the tax treatment of municipal or other securities could be changed by Congress thereby affecting the value of outstanding securities.
Valuation risk The risk that the estimated value of a security does not match the actual amount that can be realized if the security is sold.
Zero-Coupon Bond Risk The risk that the market value of a zero-coupon bond is generally more volatile than the market value of other fixed income securities with similar maturities that pay interest periodically. In addition, federal income tax law requires that the holder of a zero-coupon bond accrue a portion of the discount at which the bond was purchased as taxable income each year, even though the holder receives no interest payment on the bond during the year. A Fund must distribute substantially all of its net income (including non-cash income attributable to zero-coupon bonds) to its shareholders each year to maintain its status as a regulated investment company and to eliminate tax at the Fund level. Accordingly, such accrued discount must be taken into account in determining the amount of taxable distributions to shareholders. The Fund may consequently have to dispose of portfolio securities under disadvantageous circumstances to generate cash to satisfy such distribution requirements. These actions may reduce the assets to which the Fund’s expenses could otherwise be allocated and may reduce the Fund’s rate of return.
82 | J.P. Morgan Municipal Bond Funds
Financial Highlights
The financial highlights tables are intended to help you understand each Fund’s financial performance for each share class for each of the past one through five fiscal years or periods, as applicable. Certain information reflects financial results for a single Fund share. The total returns in the tables represent the rate that an investor would have earned (or lost) on an investment in a Fund (assuming reinvestment of all dividends and distributions). The information for each period presented has been audited by PricewaterhouseCoopers LLP, whose reports, along with each Fund’s financial statements, are included in the respective Fund’s annual report, which is available upon request.
To the extent a Fund invests in other funds, the Total Annual Operating Expenses included in the Fee Table will not correlate to the ratio of expenses to average net assets in the financial highlights below.
| |
|
Per share operating performance | |||||
| |
|
Investment operations |
Distributions | ||||
| |
Net asset value, beginning of period |
Net investment income (loss) (b) |
Net realized and unrealized gains (losses) on investments |
Total from investment operations |
Net investment income |
Net realized gain |
Total distributions |
| JPMorgan Sustainable Municipal Income Fund |
|
|
|
|
|
|
|
| Class R6 |
|
|
|
|
|
|
|
| Year Ended February 28, 2022 |
$9.88 |
$0.21 |
$(0.29) |
$(0.08) |
$(0.21) |
$— |
$(0.21) |
| Year Ended February 28, 2021 |
9.94 |
0.20 |
(0.06) |
0.14 |
(0.20) |
— |
(0.20) |
| Year Ended February 29, 2020 |
9.48 |
0.23 |
0.46 |
0.69 |
(0.23) |
— |
(0.23) |
| Year Ended February 28, 2019 |
9.45 |
0.25 |
0.08 |
0.33 |
(0.25) |
(0.05) |
(0.30) |
| November 6, 2017 (g) through February 28, 2018 |
9.74 |
0.08 (f) |
(0.21) |
(0.13) |
(0.09) |
(0.07) |
(0.16) |
(a)Annualized for periods less than one year, unless otherwise noted.
(b)
Calculated based upon average shares outstanding.
(c)
Not annualized for periods less than one year.
(d)
Includes adjustments in accordance with accounting principles generally accepted in the United States of America and as such, the net asset values for financial reporting purposes and the returns based upon those net asset values may differ from the net asset values and returns for shareholder transactions.
(e)
Includes earnings credits and interest expense, if applicable, each of which is less than 0.005% unless otherwise noted.
(f)
Net investment income (loss) may appear disproportionate among the classes due to the timing of recognition of income and changes in the relative size of the classes.
(g)
Commencement of offering of class of shares.
84 | J.P. Morgan Municipal Bond Funds
| |
Ratios/Supplemental data | |||||
| |
|
|
Ratios to average net assets (a) |
| ||
| Net asset value, end of period |
Total return (c)(d) |
Net assets, end of period (000’s) |
Net expenses (e) |
Net investment income (loss) |
Expenses without waivers, reimbursements and earnings credits |
Portfolio turnover rate (c) |
| |
|
|
|
|
|
|
| |
|
|
|
|
|
|
| $9.59 |
(0.82)% |
$81,399 |
0.35% |
2.14% |
0.46% |
18% |
| 9.88 |
1.46 |
62,416 |
0.34 |
2.06 |
0.46 |
22 |
| 9.94 |
7.36 |
60,936 |
0.34 |
2.38 |
0.49 |
7 |
| 9.48 |
3.54 |
51,261 |
0.35 |
2.61 |
0.50 |
13 |
| 9.45 |
(1.42) |
64,738 |
0.34 |
2.67 (f) |
0.57 |
21 |
July 1, 2022 | 85
Financial Highlights (continued)
| |
|
Per share operating performance | |||
| |
|
Investment operations |
Distributions | ||
| |
Net asset value, beginning of period |
Net investment income (loss) (b) |
Net realized and unrealized gains (losses) on investments |
Total from investment operations |
Net investment income |
| JPMorgan Short-Intermediate Municipal Bond Fund |
|
|
|
|
|
| Class R6 |
|
|
|
|
|
| Year Ended February 28, 2022 |
$10.83 |
$0.16 |
$(0.31) |
$(0.15) |
$(0.16) |
| Year Ended February 28, 2021 |
10.91 |
0.19 |
(0.09) |
0.10 |
(0.18) |
| Year Ended February 29, 2020 |
10.54 |
0.21 |
0.38 |
0.59 |
(0.22) |
| October 1, 2018 (f) through February 28, 2019 |
10.39 |
0.09 |
0.15 |
0.24 |
(0.09) |
(a)Annualized for periods less than one year, unless otherwise noted.
(b)
Calculated based upon average shares outstanding.
(c)
Not annualized for periods less than one year.
(d)
Includes adjustments in accordance with accounting principles generally accepted in the United States of America and as such, the net asset values for financial reporting purposes and the returns based upon those net asset values may differ from the net asset values and returns for shareholder transactions.
(e)
Includes earnings credits and interest expense, if applicable, each of which is less than 0.005% unless otherwise noted.
(f)
Commencement of offering of class of shares.
86 | J.P. Morgan Municipal Bond Funds
| |
Ratios/Supplemental data | |||||
| |
|
|
Ratios to average net assets (a) |
| ||
| Net asset value, end of period |
Total return (c)(d) |
Net assets, end of period (000’s) |
Net expenses (e) |
Net investment income (loss) |
Expenses without waivers, reimbursements and earnings credits |
Portfolio turnover rate (c) |
| |
|
|
|
|
|
|
| |
|
|
|
|
|
|
| $10.52 |
(1.37)% |
$632,795 |
0.20% |
1.52% |
0.35% |
21% |
| 10.83 |
0.92 |
688,820 |
0.19 |
1.72 |
0.35 |
21 |
| 10.91 |
5.61 |
961,820 |
0.19 |
1.99 |
0.36 |
24 |
| 10.54 |
2.31 |
866,630 |
0.19 |
2.19 |
0.37 |
42 |
July 1, 2022 | 87
Financial Highlights (continued)
| |
|
Per share operating performance | |||
| |
|
Investment operations |
Distributions | ||
| |
Net asset value, beginning of period |
Net investment income (loss) (b) |
Net realized and unrealized gains (losses) on investments |
Total from investment operations |
Net investment income |
| JPMorgan Tax Free Bond Fund |
|
|
|
|
|
| Class R6 |
|
|
|
|
|
| Year Ended February 28, 2022 |
$12.41 |
$0.30 |
$(0.32) |
$(0.02) |
$(0.30) |
| Year Ended February 28, 2021 |
12.60 |
0.31 |
(0.19) |
0.12 |
(0.31) |
| Year Ended February 29, 2020 |
11.72 |
0.35 |
0.88 |
1.23 |
(0.35) |
| October 1, 2018 (f) through February 28, 2019 |
11.61 |
0.17 |
0.11 |
0.28 |
(0.17) |
(a)Annualized for periods less than one year, unless otherwise noted.
(b)
Calculated based upon average shares outstanding.
(c)
Not annualized for periods less than one year.
(d)
Includes adjustments in accordance with accounting principles generally accepted in the United States of America and as such, the net asset values for financial reporting purposes and the returns based upon those net asset values may differ from the net asset values and returns for shareholder transactions.
(e)
Includes earnings credits and interest expense, if applicable, each of which is less than 0.005% unless otherwise noted.
(f)
Commencement of offering of class of shares.
88 | J.P. Morgan Municipal Bond Funds
| |
Ratios/Supplemental data | |||||
| |
|
|
Ratios to average net assets (a) |
| ||
| Net asset value, end of period |
Total return (c)(d) |
Net assets, end of period (000’s) |
Net expenses (e) |
Net investment income (loss) |
Expenses without waivers, reimbursements and earnings credits |
Portfolio turnover rate (c) |
| |
|
|
|
|
|
|
| |
|
|
|
|
|
|
| $12.09 |
(0.22)% |
$153,754 |
0.40% |
2.39% |
0.44% |
16% |
| 12.41 |
1.01 |
134,449 |
0.40 |
2.55 |
0.45 |
23 |
| 12.60 |
10.63 |
115,414 |
0.40 |
2.87 |
0.47 |
31 |
| 11.72 |
2.44 |
86,790 |
0.40 |
3.61 |
0.51 |
53 |
July 1, 2022 | 89
Financial Highlights (continued)
| |
|
Per share operating performance | |||
| |
|
Investment operations |
Distributions | ||
| |
Net asset value, beginning of period |
Net investment income (loss) (b) |
Net realized and unrealized gains (losses) on investments |
Total from investment operations |
Net investment income |
| JPMorgan California Tax Free Bond Fund |
|
|
|
|
|
| Class R6 |
|
|
|
|
|
| Year Ended February 28, 2022 |
$10.80 |
$0.18 |
$(0.37) |
$(0.19) |
$(0.18) |
| Year Ended February 28, 2021 |
10.99 |
0.19 |
(0.19) |
— (f) |
(0.19) |
| Year Ended February 29, 2020 |
10.47 |
0.25 |
0.52 |
0.77 |
(0.25) |
| October 1, 2018 (g) through February 28, 2019 |
10.33 |
0.13 |
0.13 |
0.26 |
(0.12) |
(a)Annualized for periods less than one year, unless otherwise noted.
(b)
Calculated based upon average shares outstanding.
(c)
Not annualized for periods less than one year.
(d)
Includes adjustments in accordance with accounting principles generally accepted in the United States of America and as such, the net asset values for financial reporting purposes and the returns based upon those net asset values may differ from the net asset values and returns for shareholder transactions.
(e)
Includes earnings credits and interest expense, if applicable, each of which is less than 0.005% unless otherwise noted.
(f)
Amount rounds to less than $0.005.
(g)
Commencement of offering of class of shares.
90 | J.P. Morgan Municipal Bond Funds
| |
Ratios/Supplemental data | |||||
| |
|
|
Ratios to average net assets (a) |
| ||
| Net asset value, end of period |
Total return (c)(d) |
Net assets, end of period (000’s) |
Net expenses (e) |
Net investment income (loss) |
Expenses without waivers, reimbursements and earnings credits |
Portfolio turnover rate (c) |
| |
|
|
|
|
|
|
| |
|
|
|
|
|
|
| $10.43 |
$(1.80) |
$144,407 |
0.40% |
1.63% |
0.43% |
11% |
| 10.80 |
0.01 |
137,357 |
0.39 |
1.74 |
0.43 |
6 |
| 10.99 |
7.48 |
127,070 |
0.40 |
2.35 |
0.46 |
8 |
| 10.47 |
2.58 |
80,424 |
0.35 |
2.95 |
0.48 |
17 |
July 1, 2022 | 91
Financial Highlights (continued)
| |
|
Per share operating performance | |||||
| |
|
Investment operations |
Distributions | ||||
| |
Net asset value, beginning of period |
Net investment income (loss) (b) |
Net realized and unrealized gains (losses) on investments |
Total from investment operations |
Net investment income |
Net realized gain |
Total distributions |
| JPMorgan High Yield Municipal Fund |
|
|
|
|
|
|
|
| Class R6 |
|
|
|
|
|
|
|
| Year Ended February 28, 2022 |
$11.50 |
$0.36 |
$(0.17) |
$0.19 |
$(0.36) |
$— |
$(0.36) |
| Year Ended February 28, 2021 |
11.93 |
0.36 |
(0.43) |
(0.07) |
(0.35) |
(0.01) |
(0.36) |
| Year Ended February 29, 2020 |
10.87 |
0.35 |
1.06 |
1.41 |
(0.34) |
(0.01) |
(0.35) |
| November 1, 2018 (f) through February 28, 2019 |
10.53 |
0.14 |
0.33 |
0.47 |
(0.13) |
— |
(0.13) |
(a)Annualized for periods less than one year, unless otherwise noted.
(b)
Calculated based upon average shares outstanding.
(c)
Not annualized for periods less than one year.
(d)
Includes adjustments in accordance with accounting principles generally accepted in the United States of America and as such, the net asset values for financial reporting purposes and the returns based upon those net asset values may differ from the net asset values and returns for shareholder transactions.
(e)
Includes earnings credits and interest expense, if applicable, each of which is less than 0.005% unless otherwise noted.
(f)
Commencement of offering of class of shares.
92 | J.P. Morgan Municipal Bond Funds
| |
Ratios/Supplemental data | |||||
| |
|
|
Ratios to average net assets (a) |
| ||
| Net asset value, end of period |
Total return (c)(d) |
Net assets, end of period (000’s) |
Net expenses (e) |
Net investment income (loss) |
Expenses without waivers, reimbursements and earnings credits |
Portfolio turnover rate (c) |
| |
|
|
|
|
|
|
| |
|
|
|
|
|
|
| $11.33 |
1.60% |
$20,316 |
0.45% |
3.07% |
0.51% |
24% |
| 11.50 |
(0.41) |
21,169 |
0.45 |
3.16 |
0.51 |
39 |
| 11.93 |
13.12 |
6,060 |
0.44 |
3.01 |
0.56 |
18 |
| 10.87 |
4.46 |
1,338 |
0.39 |
4.09 |
1.23 |
130 |
July 1, 2022 | 93
Financial Highlights (continued)
| |
|
Per share operating performance | |||||
| |
|
Investment operations |
Distributions | ||||
| |
Net asset value, beginning of period |
Net investment income (loss) (b) |
Net realized and unrealized gains (losses) on investments |
Total from investment operations |
Net investment income |
Net realized gain |
Total distributions |
| JPMorgan Intermediate Tax Free Bond Fund |
|
|
|
|
|
|
|
| Class R6 |
|
|
|
|
|
|
|
| Year Ended February 28, 2022 |
$11.15 |
$0.27 |
$(0.37) |
$(0.10) |
$(0.27) |
$(0.09) |
$(0.36) |
| Year Ended February 28, 2021 |
11.31 |
0.25 |
(0.16) |
0.09 |
(0.25) |
— |
(0.25) |
| Year Ended February 29, 2020 |
10.71 |
0.28 |
0.60 |
0.88 |
(0.28) |
— |
(0.28) |
| Year Ended February 28, 2019 |
10.60 |
0.28 |
0.11 |
0.39 |
(0.28) |
— |
(0.28) |
| November 6, 2017 (f) through February 28, 2018 |
10.83 |
0.09 |
(0.23) |
(0.14) |
(0.09) |
— |
(0.09) |
(a)Annualized for periods less than one year, unless otherwise noted.
(b)
Calculated based upon average shares outstanding.
(c)
Not annualized for periods less than one year.
(d)
Includes adjustments in accordance with accounting principles generally accepted in the United States of America and as such, the net asset values for financial reporting purposes and the returns based upon those net asset values may differ from the net asset values and returns for shareholder transactions.
(e)
Includes earnings credits and interest expense, if applicable, each of which is less than 0.005% unless otherwise noted.
(f)
Commencement of offering of class of shares.
94 | J.P. Morgan Municipal Bond Funds
| |
Ratios/Supplemental data | |||||
| |
|
|
Ratios to average net assets (a) |
| ||
| Net asset value, end of period |
Total return (c)(d) |
Net assets, end of period (000’s) |
Net expenses (e) |
Net investment income (loss) |
Expenses without waivers, reimbursements and earnings credits |
Portfolio turnover rate (c) |
| |
|
|
|
|
|
|
| |
|
|
|
|
|
|
| $10.69 |
(0.96)% |
$3,503,954 |
0.30% |
2.41% |
0.40% |
12% |
| 11.15 |
0.85 |
3,681,554 |
0.29 |
2.27 |
0.40 |
34 |
| 11.31 |
8.30 |
4,329,545 |
0.30 |
2.52 |
0.39 |
20 |
| 10.71 |
3.77 |
3,911,573 |
0.29 |
2.66 |
0.40 |
48 |
| 10.60 |
(1.26) |
3,497,046 |
0.29 |
2.73 |
0.41 |
30 |
July 1, 2022 | 95
Financial Highlights (continued)
| |
|
Per share operating performance | |||
| |
|
Investment operations |
Distributions | ||
| |
Net asset value, beginning of period |
Net investment income (loss) (b) |
Net realized and unrealized gains (losses) on investments |
Total from investment operations |
Net investment income |
| JPMorgan New York Tax Free Bond Fund |
|
|
|
|
|
| Class R6 |
|
|
|
|
|
| Year Ended February 28, 2022 |
$6.96 |
$0.14 |
$(0.22) |
$(0.08) |
$(0.14) |
| Year Ended February 28, 2021 |
7.09 |
0.15 |
(0.14) |
0.01 |
(0.14) |
| Year Ended February 29, 2020 |
6.75 |
0.16 |
0.34 |
0.50 |
(0.16) |
| October 1, 2018 (f) through February 28, 2019 |
6.64 |
0.08 |
0.11 |
0.19 |
(0.08) |
(a)Annualized for periods less than one year, unless otherwise noted.
(b)
Calculated based upon average shares outstanding.
(c)
Not annualized for periods less than one year.
(d)
Includes adjustments in accordance with accounting principles generally accepted in the United States of America and as such, the net asset values for financial reporting purposes and the returns based upon those net asset values may differ from the net asset values and returns for shareholder transactions.
(e)
Includes earnings credits and interest expense, if applicable, each of which is less than 0.005% unless otherwise noted.
(f)
Commencement of offering of class of shares.
96 | J.P. Morgan Municipal Bond Funds
| |
Ratios/Supplemental data | |||||
| |
|
|
Ratios to average net assets (a) |
| ||
| Net asset value, end of period |
Total return (c)(d) |
Net assets, end of period (000’s) |
Net expenses (e) |
Net investment income (loss) |
Expenses without waivers, reimbursements and earnings credits |
Portfolio turnover rate (c) |
| |
|
|
|
|
|
|
| |
|
|
|
|
|
|
| $6.74 |
(1.20)% |
$127,964 |
0.40% |
1.95% |
0.43% |
10% |
| 6.96 |
0.22 |
122,625 |
0.39 |
2.11 |
0.43 |
5 |
| 7.09 |
7.49 |
119,722 |
0.40 |
2.32 |
0.44 |
13 |
| 6.75 |
2.89 |
91,813 |
0.40 |
2.93 |
0.45 |
21 |
July 1, 2022 | 97
Additional Fee and Expense Information for the JPMT II Funds and Former One Group Mutual Funds
In connection with the 2004 final settlement between Banc One Investment Advisors Corporation (BOIA), subsequently known as JPMorgan Investment Advisors Inc. (JPMIA1), with the New York Attorney General arising out of market timing of certain mutual funds advised by BOIA, BOIA agreed, among other things, to disclose hypothetical information regarding investment and expense information to Fund shareholders. The hypothetical examples are provided for JPMT II Funds or those Funds that have acquired the assets and liabilities of a JPMT II Fund or a series of One Group Mutual Funds.
The “Gross Expense Ratio” includes the contractual expenses that make up the investment advisory, administration and servicing fees, Rule 12b-1 distribution fees, fees paid to vendors not affiliated with JPMIM that provide services to the Funds and other fees and expenses of the Funds. The “Net Expense Ratio” is Gross Expenses less any fee waivers or expense reimbursements memorialized in a written contract between the Funds and JPMIM and/or its affiliates, as applicable.
The table below shows the ratios for Class R6 Shares of the affected Funds offered in this prospectus.
| |
|
|
|
| |
Class |
Net Expense Ratio |
Gross Expense Ratio |
| JPMorgan Sustainable Municipal Income Fund |
R6 |
0.35% |
0.46% |
| JPMorgan Short-Intermediate Municipal Bond Fund |
R6 |
0.20% |
0.36% |
| JPMorgan Tax Free Bond Fund |
R6 |
0.40% |
0.44% |
| JPMorgan Intermediate Tax Free Bond Fund |
R6 |
0.30% |
0.40% |
A Fund’s annual return is reduced by its fees and expenses for that year. The examples below are intended to help you understand the annual and cumulative impact of the Fund’s fees and expenses on your investment through a hypothetical investment of $10,000 held for the next 10 years. The examples assume the following:
•
On 7/1/22, you invest $10,000 in the Fund and you will hold the shares for the entire 10 year period;
•
Your investment has a 5% return each year;
•
The Fund’s operating expenses remain at the levels discussed below and are not affected by increases or decreases in Fund assets over time;
•
At the time of purchase, any applicable initial sales charges (loads) are deducted; and
•
There is no sales charge (load) on reinvested dividends.
•
The annual costs are calculated using the Net Expense Ratios for the period through the expiration of any fee waivers or expense reimbursements memorialized in a written contract between the Funds and JPMIM and/or its affiliates; and the Gross Expense Ratios thereafter.
“Annual Net Return” shows what effect the “Annual Costs” will have on the assumed 5% annual return for each year. “Gross Cumulative Return” shows what the cumulative return on your investment at the end of each 12 month period (year) ended October 31 would be if Fund expenses are not deducted. “Net Cumulative Return” shows what the cumulative return on your investment at the end of each year would be assuming Fund expenses are deducted each year in the amount shown under “Annual Costs.” “Annual Net Return” shows what effect the “Annual Costs” will have on the assumed 5% annual return for each year.
Your actual costs may be higher or lower than those shown.
1
Effective January 1, 2010, the investment advisory business of JPMorgan Investment Advisors Inc. (JPMIA), which was the adviser for certain of the J.P. Morgan Funds, was transferred to JPMIM and JPMIM became the investment adviser for certain J.P. Morgan Funds that were previously advised by JPMIA.
98 | J.P. Morgan Municipal Bond Funds
| JPMorgan Sustainable Municipal Income Fund | ||||
| |
Class R6 | |||
| Period Ended |
Annual Costs |
Gross Cumulative Return |
Net Cumulative Return |
Net Annual Return |
| June 30, 2023 |
$36 |
5.00% |
4.65% |
4.65% |
| June 30, 2024 |
49 |
10.25 |
9.40 |
4.54 |
| June 30, 2025 |
51 |
15.76 |
14.37 |
4.54 |
| June 30, 2026 |
54 |
21.55 |
19.56 |
4.54 |
| June 30, 2027 |
56 |
27.63 |
24.99 |
4.54 |
| June 30, 2028 |
59 |
34.01 |
30.66 |
4.54 |
| June 30, 2029 |
61 |
40.71 |
36.59 |
4.54 |
| June 30, 2030 |
64 |
47.75 |
42.80 |
4.54 |
| June 30, 2031 |
67 |
55.13 |
49.28 |
4.54 |
| June 30, 2032 |
70 |
62.89 |
56.06 |
4.54 |
| JPMorgan Short-Intermediate Municipal Bond Fund | ||||
| |
Class R6 | |||
| Period Ended |
Annual Costs |
Gross Cumulative Return |
Net Cumulative Return |
Net Annual Return |
| June 30, 2023 |
$20 |
5.00% |
4.80% |
4.80% |
| June 30, 2024 |
39 |
10.25 |
9.66 |
4.64 |
| June 30, 2025 |
40 |
15.76 |
14.75 |
4.64 |
| June 30, 2026 |
42 |
21.55 |
20.08 |
4.64 |
| June 30, 2027 |
44 |
27.63 |
25.65 |
4.64 |
| June 30, 2028 |
46 |
34.01 |
31.48 |
4.64 |
| June 30, 2029 |
48 |
40.71 |
37.58 |
4.64 |
| June 30, 2030 |
51 |
47.75 |
43.96 |
4.64 |
| June 30, 2031 |
53 |
55.13 |
50.64 |
4.64 |
| June 30, 2032 |
55 |
62.89 |
57.63 |
4.64 |
| JPMorgan Tax Free Bond Fund | ||||
| |
Class R6 | |||
| Period Ended |
Annual Costs |
Gross Cumulative Return |
Net Cumulative Return |
Net Annual Return |
| June 30, 2023 |
$41 |
5.00% |
4.60% |
4.60% |
| June 30, 2024 |
47 |
10.25 |
9.37 |
4.56 |
| June 30, 2025 |
49 |
15.76 |
14.36 |
4.56 |
| June 30, 2026 |
51 |
21.55 |
19.57 |
4.56 |
| June 30, 2027 |
54 |
27.63 |
25.02 |
4.56 |
| June 30, 2028 |
56 |
34.01 |
30.73 |
4.56 |
| June 30, 2029 |
59 |
40.71 |
36.69 |
4.56 |
| June 30, 2030 |
62 |
47.75 |
42.92 |
4.56 |
| June 30, 2031 |
64 |
55.13 |
49.44 |
4.56 |
| June 30, 2032 |
67 |
62.89 |
56.25 |
4.56 |
July 1, 2022 | 99
Additional Fee and Expense Information for the JPMT II Funds and Former One Group Mutual Funds (continued)
| JPMorgan Intermediate Tax Free Bond Fund | ||||
| |
Class R6 | |||
| Period Ended |
Annual Costs |
Gross Cumulative Return |
Net Cumulative Return |
Net Annual Return |
| June 30, 2023 |
$31 |
5.00% |
4.70% |
4.70% |
| June 30, 2024 |
43 |
10.25 |
9.52 |
4.60 |
| June 30, 2025 |
45 |
15.76 |
14.55 |
4.60 |
| June 30, 2026 |
47 |
21.55 |
19.82 |
4.60 |
| June 30, 2027 |
49 |
27.63 |
25.34 |
4.60 |
| June 30, 2028 |
51 |
34.01 |
31.10 |
4.60 |
| June 30, 2029 |
54 |
40.71 |
37.13 |
4.60 |
| June 30, 2030 |
56 |
47.75 |
43.44 |
4.60 |
| June 30, 2031 |
59 |
55.13 |
50.04 |
4.60 |
| June 30, 2032 |
61 |
62.89 |
56.94 |
4.60 |
100 | J.P. Morgan Municipal Bond Funds
How to Reach Us
MORE INFORMATION
For investors who want more information on these Funds the following documents are available free upon request:
ANNUAL AND SEMI-ANNUAL REPORTS
Our annual and semi-annual reports contain more information about each Fund’s investments and performance. The annual report also includes details about the market conditions and investment strategies that had a significant effect on each Fund’s performance during the last fiscal year.
STATEMENT OF ADDITIONAL INFORMATION (SAI)
The SAI contains more detailed information about the Funds and their policies. It is incorporated by reference into this prospectus. This means, by law, it is considered to be part of this prospectus.
You can get a free copy of these documents and other information, or ask us any questions, by calling us at 1-800-480-4111 or writing to:
J.P. Morgan Funds Services
P.O. Box 219143
Kansas City, MO 64121-9143
P.O. Box 219143
Kansas City, MO 64121-9143
If you buy your shares through a Financial Intermediary, please contact that Financial Intermediary directly for more information. You can also find information online at www.jpmorganfunds.com.
Reports, a copy of the SAI, and other information about the Funds are also available on the EDGAR Database on the Commission’s Internet site at http://www.sec.gov, and copies of this information may be obtained, after paying a duplicating fee, by electronic request at the following E-mail address: publicinfo@sec.gov.
Investment Company Act File No. for each of the Funds, except the California Tax Free Bond Fund, Intermediate Tax Free Bond Fund and New York Tax Free Bond Fund is 811-4236.
Investment Company Act File No. for the California Tax Free Bond Fund, Intermediate Tax Free Bond Fund and New York Tax Free Bond Fund is 811-21295.
©JPMorgan Chase & Co. 2022. All rights reserved. July 2022.
PR-MBTFR6-722-2