As filed with the Securities and Exchange Commission on June 22, 2022
Securities Act File No. 2-95973
Investment Company Act File No. 811-4236
Investment Company Act File No. 811-4236
SECURITIES AND EXCHANGE COMMISSION
WASHINGTON, D.C. 20549
FORM N-1A
REGISTRATION STATEMENT
REGISTRATION STATEMENT
| UNDER THE SECURITIES ACT OF 1933 |
☒ |
| Pre-Effective Amendment No. |
☐ |
| Post-Effective Amendment No. 333 |
☒ |
and/or
REGISTRATION STATEMENT
| UNDER THE INVESTMENT COMPANY ACT OF 1940 |
☒ |
| Amendment No. 334 |
☒ |
(Check appropriate box or boxes)
(Exact Name of Registrant as Specified in Charter)
277 Park Avenue
New York, New York 10172
New York, New York 10172
(Address of Principal Executive Offices)
Registrant’s Telephone Number, including Area Code: (800) 480-4111
Gregory S. Samuels, Esq.
J.P. Morgan Investment Management Inc.
4 New York Plaza
New York, New York 10004
J.P. Morgan Investment Management Inc.
4 New York Plaza
New York, New York 10004
(Name and Address of Agent for Service)
With copies to:
| Matthew J. Beck, Esq. JPMorgan Chase & Co. 1111 Polaris Parkway Columbus, OH 43240 |
Jon S. Rand, Esq. Dechert LLP 1095 Avenue of the Americas New York, NY 10036 |
It is proposed that this filing will become effective (check appropriate box):
| ☐ |
immediately upon filing pursuant to paragraph (b) |
| ☒ |
on July 1, 2022, pursuant to paragraph (b) |
| ☐ |
60 days after filing pursuant to paragraph (a)(1) |
| ☐ |
on (date) pursuant to paragraph (a)(1) |
| ☐ |
75 days after filing pursuant to paragraph (a)(2) |
| ☐ |
on (date) pursuant to paragraph (a)(2) |
If appropriate, check the following box:
| ☐ |
The post-effective amendment designates a new effective date for a previously filed post-effective amendment. |
Prospectus
J.P. Morgan Municipal Bond Funds
Class A, Class C & Class I Shares
July 1, 2022
JPMorgan Sustainable Municipal Income Fund
Class/Ticker: A/OTBAX; C/OMICX; I/HLTAX
JPMorgan Short-Intermediate Municipal Bond Fund
Class/Ticker: A/OSTAX; C/STMCX; I/JIMIX
JPMorgan Tax Free Bond Fund
Class/Ticker: A/PMBAX; C/JTFCX; I/PRBIX
JPMorgan Ultra-Short Municipal Fund
Class/Ticker: A/USMSX; I/USMTX
JPMorgan California Tax Free Bond Fund
Class/Ticker: A/JCBAX; C/JCBCX; I/JPICX
JPMorgan High Yield Municipal Fund
Class/Ticker: A/JTIAX; C/JTICX; I/JTISX
JPMorgan Intermediate Tax Free Bond Fund
Class/Ticker: A/JITAX; C/JITCX; I/JITIX
JPMorgan New York Tax Free Bond Fund
Class/Ticker: A/VANTX; C/JCNTX; I/JNYIX
The Securities and Exchange Commission and the Commodity Futures Trading Commission have not approved or disapproved of these securities or determined if this prospectus is truthful or complete. Any representation to the contrary is a criminal offense.

Contents
| | |
| 1 | |
| 7 | |
| 13 | |
| 19 | |
| 25 | |
| 31 | |
| 38 | |
| 44 | |
| 50 | |
| 50 | |
| 51 | |
| 54 | |
| 63 | |
| 63 | |
| 63 | |
| 64 | |
| 67 | |
| 67 |
| 71 | |
| 78 | |
| 81 | |
| 82 | |
| 84 | |
| 85 | |
| 86 | |
| 87 | |
| 90 | |
| 90 | |
| 90 | |
| 91 | |
| 92 | |
| 100 | |
| 116 | |
| 121 | |
| Back cover |
JPMorgan Sustainable Municipal Income Fund
| | |||
| |
Class A |
Class C |
Class I |
| Maximum Sales Charge (Load) Imposed on Purchases as % of the Offering Price |
|
|
|
| Maximum Deferred Sales Charge (Load) as % of Original Cost of the Shares |
1 |
|
|
1
| | |||
| |
Class A |
Class C |
Class I |
| Management Fees |
|
|
|
| Distribution (Rule 12b-1) Fees |
|
|
|
| Other Expenses |
|
|
|
| Service Fees |
|
|
|
| Remainder of Other Expenses |
|
|
|
| Total Annual Fund Operating Expenses |
|
|
|
| Fee Waivers and/or Expense Reimbursements1 |
- |
- |
- |
| Total Annual Fund Operating Expenses after Fee Waivers and/or Expense Reimburse- ments1 |
|
|
|
1
| | ||||
| |
1 Year |
3 Years |
5 Years |
10 Years |
| CLASS A SHARES ($) |
|
|
|
|
| CLASS C SHARES ($) |
|
|
|
|
| CLASS I SHARES ($) |
|
|
|
|
| | ||||
| |
1 Year |
3 Years |
5 Years |
10 Years |
| CLASS A SHARES ($) |
|
|
|
|
| CLASS C SHARES ($) |
|
|
|
|
| CLASS I SHARES ($) |
|
|
|
|
July 1, 2022 | 1
JPMorgan Sustainable Municipal Income Fund (continued)
2 | J.P. Morgan Municipal Bond Funds
July 1, 2022 | 3
JPMorgan Sustainable Municipal Income Fund (continued)
4 | J.P. Morgan Municipal Bond Funds
July 1, 2022 | 5
JPMorgan Sustainable Municipal Income Fund (continued)
| |
| |
|
|
| |
|
|
| |
|
|
|
|
|
| | |||
| |
Past 1 Year |
Past 5 Years |
Past 10 Years |
| CLASS I SHARES |
|
|
|
| Return Before Taxes |
|
|
|
| Return After Taxes on Distributions |
|
|
|
| Return After Taxes on Distributions and Sale of Fund Shares |
|
|
|
| CLASS A SHARES |
|
|
|
| Return Before Taxes |
- |
|
|
| CLASS C SHARES |
|
|
|
| Return Before Taxes |
- |
|
|
| BLOOMBERG U.S. 1-15 YEAR BLEND (1-17) MUNICIPAL BOND INDEX (Reflects No Deduction for Fees, Expenses, or Taxes) |
|
|
|
Management
J.P. Morgan Investment Management Inc. (the adviser)
| Portfolio Manager |
Managed the Fund Since |
Primary Title with Investment Adviser |
| Kevin M. Ellis |
2020 |
Managing Director |
| Wayne Godlin |
2020 |
Managing Director |
| David Sivinski |
2006 |
Executive Director |
Purchase and Sale of Fund Shares
Purchase minimums
| For Class A and Class C Shares |
|
| To establish an account |
$1,000 |
| To add to an account |
$50 |
| For Class I Shares | |
| To establish an account |
$1,000,000 |
| To add to an account |
No minimum levels |
In general, you may purchase or redeem shares on any business day:
•
Through your Financial Intermediary
•
By writing to J.P. Morgan Funds Services, P.O. Box 219143, Kansas City, MO 64121-9143
•
After you open an account, by calling J.P. Morgan Funds Services at 1-800-480-4111
Tax Information
The Fund’s distributions of interest on municipal bonds generally are not subject to federal income tax; however the Fund may distribute taxable dividends, including distributions of short-term capital gains, and long-term capital gains. In addition, interest on certain bonds may be subject to the federal alternative minimum tax. To the extent that the Fund’s distributions are derived from interest on bonds that are not exempt from applicable state and local taxes, such distributions will be subject to such state and local taxes. When your investment is in an IRA, 401(k) plan or other tax-advantaged investment plan, you may be subject to federal income tax on ordinary income or capital gains upon withdrawal from the tax-advantaged investment plan.
Payments to Broker-Dealers and Other Financial Intermediaries
If you purchase shares of the Fund through a broker-dealer or other financial intermediary (such as a bank), the Fund and its related companies may pay the financial intermediary for the sale of Fund shares and related services. These payments may create a conflict of interest by influencing the broker-dealer or financial intermediary and your salesperson to recommend the Fund over another investment. Ask your salesperson or visit your financial intermediary’s website for more information.
6 | J.P. Morgan Municipal Bond Funds
JPMorgan Short-Intermediate Municipal Bond Fund
| | |||
| |
Class A |
Class C |
Class I |
| Maximum Sales Charge (Load) Imposed on Purchases as % of the Offering Price |
|
|
|
| Maximum Deferred Sales Charge (Load) as % of Original Cost of the Shares |
1 |
|
|
1
| | |||
| |
Class A |
Class C |
Class I |
| Management Fees |
|
|
|
| Distribution (Rule 12b-1) Fees |
|
|
|
| Other Expenses |
|
|
|
| Service Fees |
|
|
|
| Remainder of Other Expenses |
|
|
|
| Acquired Fund Fees and Expenses |
|
|
|
| Total Annual Fund Operating Expenses |
|
|
|
| Fee Waivers and/or Expense Reimbursements1 |
- |
- |
- |
| Total Annual Fund Operating Expenses after Fee Waivers and/or Expense Reimburse- ments1 |
|
|
|
1
July 1, 2022 | 7
JPMorgan Short-Intermediate Municipal Bond Fund (continued)
| | ||||
| |
1 Year |
3 Years |
5 Years |
10 Years |
| CLASS A SHARES ($) |
|
|
|
|
| CLASS C SHARES ($) |
|
|
|
|
| CLASS I SHARES ($) |
|
|
|
|
| | ||||
| |
1 Year |
3 Years |
5 Years |
10 Years |
| CLASS A SHARES ($) |
|
|
|
|
| CLASS C SHARES ($) |
|
|
|
|
| CLASS I SHARES ($) |
|
|
|
|
8 | J.P. Morgan Municipal Bond Funds
July 1, 2022 | 9
JPMorgan Short-Intermediate Municipal Bond Fund (continued)
10 | J.P. Morgan Municipal Bond Funds
| |

| |
|
|
| |
|
|
| |
|
|
|
|
|
July 1, 2022 | 11
JPMorgan Short-Intermediate Municipal Bond Fund (continued)
| | |||
| |
Past 1 Year |
Past 5 Years |
Past 10 Years |
| CLASS I SHARES |
|
|
|
| Return Before Taxes |
|
|
|
| Return After Taxes on Distributions |
|
|
|
| Return After Taxes on Distributions and Sale of Fund Shares |
|
|
|
| CLASS A SHARES |
|
|
|
| Return Before Taxes |
- |
|
|
| CLASS C SHARES |
|
|
|
| Return Before Taxes |
- |
|
|
| BLOOMBERG U.S. 1-5 YEAR BLEND (1-6) MUNICIPAL BOND INDEX (Reflects No Deduction for Fees, Expenses, or Taxes) |
|
|
|
Management
J.P. Morgan Investment Management Inc. (the adviser)
| Portfolio Manager |
Managed the Fund Since |
Primary Title with Investment Adviser |
| James Ahn |
2006 |
Managing Director |
| Kevin M. Ellis |
2006 |
Managing Director |
Purchase and Sale of Fund Shares
Purchase minimums
| For Class A and Class C Shares | |
| To establish an account |
$1,000 |
| To add to an account |
$50 |
| For Class I Shares | |
| To establish an account |
$1,000,000 |
| To add to an account |
No minimum levels |
In general, you may purchase or redeem shares on any business day:
•
Through your Financial Intermediary
•
By writing to J.P. Morgan Funds Services, P.O. Box 219143, Kansas City, MO 64121-9143
•
After you open an account, by calling J.P. Morgan Funds Services at 1-800-480-4111
Tax Information
The Fund’s distributions of interest on municipal bonds generally are not subject to federal income tax; however the Fund may distribute taxable dividends, including distributions of short-term capital gains, and long-term capital gains. In addition, interest on certain bonds may be subject to the federal alternative minimum tax. To the extent that the Fund’s distributions are derived from interest on bonds that are not exempt from applicable state and local taxes, such distributions will be subject to such state and local taxes. When your investment is in an IRA, 401(k) plan or other tax-advantaged investment plan, you may be subject to federal income tax on ordinary income or capital gains upon withdrawal from the tax-advantaged investment plan.
Payments to Broker-Dealers and Other Financial Intermediaries
If you purchase shares of the Fund through a broker-dealer or other financial intermediary (such as a bank), the Fund and its related companies may pay the financial intermediary for the sale of Fund shares and related services. These payments may create a conflict of interest by influencing the broker-dealer or financial intermediary and your salesperson to recommend the Fund over another investment. Ask your salesperson or visit your financial intermediary’s website for more information.
12 | J.P. Morgan Municipal Bond Funds
JPMorgan Tax Free Bond Fund
| | |||
| |
Class A |
Class C |
Class I |
| Maximum Sales Charge (Load) Imposed on Purchases as % of the Offering Price |
|
|
|
| Maximum Deferred Sales Charge (Load) as % of Original Cost of the Shares |
1 |
|
|
1
| | |||
| |
Class A |
Class C |
Class I |
| Management Fees |
|
|
|
| Distribution (Rule 12b-1) Fees |
|
|
|
| Other Expenses |
|
|
|
| Service Fees |
|
|
|
| Remainder of Other Expenses |
|
|
|
| Total Annual Fund Operating Expenses |
|
|
|
| Fee Waivers and/or Expense Reimbursements1 |
- |
- |
- |
| Total Annual Fund Operating Expenses after Fee Waivers and/or Expense Reimburse- ments1 |
|
|
|
1
July 1, 2022 | 13
JPMorgan Tax Free Bond Fund (continued)
| | ||||
| |
1 Year |
3 Years |
5 Years |
10 Years |
| CLASS A SHARES ($) |
|
|
|
|
| CLASS C SHARES ($) |
|
|
|
|
| CLASS I SHARES ($) |
|
|
|
|
| | ||||
| |
1 Year |
3 Years |
5 Years |
10 Years |
| CLASS A SHARES ($) |
|
|
|
|
| CLASS C SHARES ($) |
|
|
|
|
| CLASS I SHARES ($) |
|
|
|
|
14 | J.P. Morgan Municipal Bond Funds
July 1, 2022 | 15
JPMorgan Tax Free Bond Fund (continued)
16 | J.P. Morgan Municipal Bond Funds
| |

| |
|
|
| |
|
|
| |
|
|
|
|
|
| | |||
| |
Past 1 Year |
Past 5 Years |
Past 10 Years |
| CLASS I SHARES |
|
|
|
| Return Before Taxes |
|
|
|
| Return After Taxes on Distributions |
|
|
|
| Return After Taxes on Distributions and Sale of Fund Shares |
|
|
|
| CLASS A SHARES |
|
|
|
| Return Before Taxes |
- |
|
|
| CLASS C SHARES |
|
|
|
| Return Before Taxes |
|
|
|
| BLOOMBERG US MUNICIPAL INDEX (Reflects No Deduction for Fees, Expenses, or Taxes) |
|
|
|
Management
J.P. Morgan Investment Management Inc. (the adviser)
July 1, 2022 | 17
JPMorgan Tax Free Bond Fund (continued)
| Portfolio Manager |
Managed the Fund Since |
Primary Title with Investment Adviser |
| Richard Taormina |
2005 |
Managing Director |
| Michelle Hallam |
2014 |
Executive Director |
Purchase and Sale of Fund Shares
Purchase minimums
| For Class A and Class C Shares | |
| To establish an account |
$1,000 |
| To add to an account |
$50 |
| For Class I Shares | |
| To establish an account |
$1,000,000 |
| To add to an account |
No minimum levels |
In general, you may purchase or redeem shares on any business day:
•
Through your Financial Intermediary
•
By writing to J.P. Morgan Funds Services, P.O. Box 219143, Kansas City, MO 64121-9143
•
After you open an account, by calling J.P. Morgan Funds Services at 1-800-480-4111
Tax Information
The Fund’s distributions of interest on municipal bonds generally are not subject to federal income tax; however the Fund may distribute taxable dividends, including distributions of
short-term capital gains, and long-term capital gains. In addition, interest on certain bonds may be subject to the federal alternative minimum tax. To the extent that the Fund’s distributions are derived from interest on bonds that are not exempt from applicable state and local taxes, such distributions will be subject to such state and local taxes. When your investment is in an IRA, 401(k) plan or other tax-advantaged investment plan, you may be subject to federal income tax on ordinary income or capital gains upon withdrawal from the tax-advantaged investment plan.
Payments to Broker-Dealers and Other Financial Intermediaries
If you purchase shares of the Fund through a broker-dealer or other financial intermediary (such as a bank), the Fund and its related companies may pay the financial intermediary for the sale of Fund shares and related services. These payments may create a conflict of interest by influencing the broker-dealer or financial intermediary and your salesperson to recommend the Fund over another investment. Ask your salesperson or visit your financial intermediary’s website for more information.
18 | J.P. Morgan Municipal Bond Funds
JPMorgan Ultra-Short Municipal Fund
Class/Ticker: A/USMSX; I/USMTX
What is the goal of the Fund?
The Fund seeks as high a level of current income exempt from federal income tax as is consistent with relative stability of principal.
Fees and Expenses of the Fund
The following tables describe the fees and expenses that you may pay if you buy, hold and sell shares of the Fund. You may pay other fees, such as brokerage commissions and other fees to financial intermediaries, which are not reflected in the table and examples below.
| SHAREHOLDER FEES (Fees paid directly from your investment) | ||
| |
Class A |
Class I |
| Maximum Sales Charge (Load) Imposed on Purchases as a % of the Offering Price |
NONE |
NONE |
| Maximum Deferred Sales Charge (Load) as a % of Original Cost of Shares |
NONE |
NONE |
“Acquired Fund Fees and Expenses” are expenses incurred indirectly by the Fund through its ownership of shares in other investment companies, including affiliated money market funds, other mutual funds, exchange-traded funds and business development companies. The impact of Acquired Fund Fees and Expenses is included in the total returns of the Fund. Acquired Fund Fees and Expenses are not direct costs of the Fund, are not used by the Fund to calculate its net asset value per share and are not included in the calculation of the ratio of expenses to average net assets shown in the Financial Highlights section of the Fund’s prospectus.
| ANNUAL FUND OPERATING EXPENSES (Expenses that you pay each year as a percentage of the value of your investment) | ||
| |
Class A |
Class I |
| Management Fees |
0.15% |
0.15% |
| Distribution (Rule 12b-1) Fees |
0.25 |
NONE |
| Other Expenses |
0.35 |
0.35 |
| Service Fees |
0.25 |
0.25 |
| Remainder of Other Expenses |
0.10 |
0.10 |
| Acquired Fund Fees and Expenses |
0.01 |
0.01 |
| Total Annual Fund Operating Expenses |
0.76 |
0.51 |
| Fee Waivers and/or Expense Reimburse- ments1 |
-0.31 |
-0.26 |
| Total Annual Fund Operating Expenses after Fee Waivers and/or Expense Reimbursements1 |
0.45 |
0.25 |
1
The Fund’s adviser and/or its affiliates have contractually agreed to waive fees and/or reimburse expenses to the extent Total Annual Fund Operating Expenses (excluding Acquired Fund Fees and Expenses other than certain
money market fund fees as described below, dividend and interest expenses related to short sales, interest, taxes, expenses related to litigation and potential litigation, expenses related to trustee elections, and extraordinary expenses) exceed 0.45% and 0.25% of the average daily net assets of Class A and Class I Shares, respectively. The Fund may invest in one or more money market funds advised by the adviser or its affiliates (affiliated money market funds). The Fund’s adviser, shareholder servicing agent and/or administrator have contractually agreed to waive fees and/or reimburse expenses in an amount sufficient to offset the respective net fees each collects from the affiliated money market funds on the Fund’s investment in such money market funds for all Share Classes. These waivers are in effect through 6/30/23, at which time it will be determined whether such waivers will be renewed or revised. To the extent that the Fund engages in securities lending, affiliated money market fund fees and expenses resulting from the Fund’s investment of cash received from securities lending borrowers are not included in Total Annual Fund Operating Expenses and therefore, the above waivers do not apply to such investments.
Example
This Example is intended to help you compare the cost of investing in the Fund with the cost of investing in other mutual funds. The Example assumes that you invest $10,000 in the Fund for the time periods indicated. The Example also assumes that your investment has a 5% return each year and that the Fund’s operating expenses are equal to the total annual fund operating expenses after fee waivers and expense reimbursements shown in the fee table through 6/30/23 and total annual fund operating expenses thereafter. Your actual costs may be higher or lower.
| WHETHER OR NOT YOU SELL YOUR SHARES, YOUR COST WOULD BE: | ||||
| |
1 Year |
3 Years |
5 Years |
10 Years |
| CLASS A SHARES ($) |
46 |
212 |
392 |
913 |
| CLASS I SHARES ($) |
26 |
137 |
259 |
615 |
Portfolio Turnover
The Fund pays transaction costs, such as commissions, when it buys and sells securities (or “turns over” its portfolio). A higher portfolio turnover rate may indicate higher transaction costs and may result in higher taxes when Fund shares are held in a taxable account. These costs, which are not reflected in annual fund operating expenses or in the Example, affect the Fund’s performance. During the Fund’s most recent fiscal year, the Fund’s portfolio turnover rate was 33% of the average value of its portfolio.
What are the Fund’s main investment strategies?
Under normal circumstances, the Fund invests at least 80% of its Assets in municipal securities, the income from which is exempt from federal income tax. This is a fundamental policy. For purposes of this policy, “Assets” means net assets, plus the amount of borrowings for investment purposes. The Fund invests in a portfolio of municipal securities with an average weighted maturity of two years or less. Average weighted maturity is the average of all the current maturities (that is, the term of the securities) of the individual securities in the Fund
July 1, 2022 | 19
JPMorgan Ultra-Short Municipal Fund (continued)
calculated so as to count most heavily those securities with the highest dollar value. Average weighted maturity is important to investors as an indication of the Fund’s sensitivity to changes in interest rates. Usually, the longer the average weighted maturity, the more fluctuation in share price you can expect.
Municipal securities are securities issued by or on behalf of states, territories and possessions of the United States, including the District of Columbia, and their respective authorities, political subdivisions, agencies and instrumentalities and other groups with the authority to act for the municipalities, the interest on which is exempt from federal income tax. The securities are issued to raise funds for various public and private purposes. Municipal securities may include, but are not limited to, variable rate demand obligations, short-term municipal notes, municipal bonds, tax exempt commercial paper, private activity and industrial development bonds, tax anticipation notes, and participations in pools of municipal securities.
Municipal securities also include instruments evidencing direct ownership of interest payments or principal payments, or both, on municipal securities, such as tender option bonds and participation interests in all or part of specific holdings of municipal obligations, provided that the applicable issuer receives assurances from legal counsel that the interest payable on the securities is exempt from federal income tax.
Additionally, municipal securities include all other instruments that directly or indirectly provide economic exposure to income which is derived from municipalities (such as municipal leases).
The securities in which the Fund invests may have fixed rates of return or floating or variable rates.
Up to 100% of the Fund’s assets may be invested in short-term municipal instruments such as variable rate demand notes, short-term municipal notes and tax-exempt commercial paper. Their yields will vary as interests rates change.
Up to 100% of the Fund’s assets may be invested in municipal securities, the interest on which may be subject to the federal alternative minimum tax for individuals.
The Fund also invests in municipal mortgage-backed and asset-backed securities, as well as auction rate securities and restricted securities. The Fund may invest a significant portion or all of its assets in municipal mortgage-backed securities at the adviser’s discretion. The Fund may invest more than 25% of its total assets in municipal housing authority obligations.
As part of its investments in municipal securities, the Fund invests primarily in investment grade securities or the unrated equivalent. Investment grade securities carry a minimum rating of Baa3, BBB–, or BBB– by Moody’s Investors Service Inc. (Moody’s), Standard & Poor’s Corporation (S&P), or Fitch Ratings (Fitch), respectively, or are unrated but deemed by the adviser to be of comparable quality. Up to 10% of the Fund’s total assets may be invested in securities rated below investment grade (junk bonds). Junk bonds also include unrated securities that the adviser believes to be of comparable quality to debt securities that are rated below investment grade. Junk
bonds are also called “high yield bonds” and “non-investment grade bonds.” These securities generally are rated in the fifth or lower rating categories (for example, BB+ or lower by S&P and Ba1 or lower by Moody’s). These securities generally offer a higher yield than investment grade securities, but involve a high degree of risk. A security’s quality is determined at the time of purchase and securities that are rated investment grade or the unrated equivalent may be downgraded or decline in credit quality such that subsequently they would be deemed to be below investment grade.
The Fund may also invest in zero-coupon securities.
Up to 20% of the Fund’s net assets may be invested in securities subject to federal income tax.
The Fund is not a money market fund and is not subject to the special regulatory requirements (including maturity and credit quality constraints) designed to enable money market funds to maintain a stable share price.
Investment Process: The adviser buys and sells securities and investments for the Fund based on its view of individual securities and market sectors. The adviser looks for individual fixed income investments that it believes will perform well over market cycles. The adviser is value oriented and makes decisions to purchase and sell individual securities and instruments after performing a risk/reward analysis that includes an evaluation of interest rate risk, credit risk, duration, liquidity and the legal and technical structure of the transaction. As part of its investment process, the adviser seeks to assess the impact of environmental, social and governance factors on certain issuers in the universe in which the Fund may invest. The adviser’s assessment is based on an analysis of key opportunities and risks across sectors to identify financially material issues on the Fund’s investments in municipal issues and ascertain key issues that merit engagement with municipal issuers. These assessments may not be conclusive and securities that may be negatively impacted by such factors may be purchased and retained by the Fund while the Fund may divest or not invest in securities that may be positively impacted by such factors.
The Fund’s Main Investment Risks
The Fund is subject to management risk and may not achieve its objective if the adviser’s expectations regarding particular instruments or markets are not met.
An investment in this Fund or any other fund may not provide a complete investment program. The suitability of an investment in the Fund should be considered based on the investment objective, strategies and risks described in this prospectus, considered in light of all of the other investments in your portfolio, as well as your risk tolerance, financial goals and time horizons. You may want to consult with a financial advisor to determine if this Fund is suitable for you.
20 | J.P. Morgan Municipal Bond Funds
The Fund is subject to the main risks noted below, any of which may adversely affect the Fund’s performance and ability to meet its investment objective.
Interest Rate Risk. The Fund mainly invests in bonds and other debt securities. These securities will increase or decrease in value based on changes in interest rates. If rates increase, the value of the Fund’s investments generally declines. Securities with greater interest rate sensitivity and longer maturities generally are subject to greater fluctuations in value. The Fund may face a heightened level of interest rate risk due to certain changes in monetary policy. During periods when interest rates are low or there are negative interest rates, the Fund’s yield (and total return) also may be low or the Fund may be unable to maintain positive returns.
Municipal Obligations Risk. The risk of a municipal obligation generally depends on the financial and credit status of the issuer. Changes in the financial health of a municipal issuer may make it difficult for the issuer to make interest and principal payments when due. This could decrease the Fund’s income or hurt the ability to preserve capital and liquidity.
Under some circumstances, municipal obligations might not pay interest unless the state legislature or municipality authorizes money for that purpose.
Municipal obligations may be more susceptible to downgrades or defaults during recessions or similar periods of economic stress. In addition, since some municipal obligations may be secured or guaranteed by banks and other institutions, the risk to the Fund could increase if the banking or financial sector suffers an economic downturn and/or if the credit ratings of the institutions issuing the guarantee are downgraded or at risk of being downgraded by a national rating organization. Such a downward revision or risk of being downgraded may have an adverse effect on the market prices of the bonds and thus the value of the Fund’s investments.
In addition to being downgraded, an insolvent municipality may file for bankruptcy. The reorganization of a municipality’s debts may significantly affect the rights of creditors and the value of the securities issued by the municipality and the value of the Fund’s investments.
Credit Risk. The Fund’s investments are subject to the risk that issuers and/or counterparties will fail to make payments when due or default completely. If an issuer’s or a counterparty’s financial condition worsens, the credit quality of the issuer or counterparty may deteriorate. Credit spreads may increase, which may reduce the market values of the Fund’s securities. Credit spread risk is the risk that economic and market conditions or any actual or perceived credit deterioration may lead to an increase in the credit spreads (i.e., the difference in yield between two securities of similar maturity but different credit quality) and a decline in price of the issuer’s securities.
Alternative Minimum Tax Risk. The Fund may invest in securities, the interest on which may be subject to the federal alternative minimum tax.
Floating and Variable Rate Securities Risk. Floating and variable rate securities provide for a periodic adjustment in the interest rate paid on the securities. The rate adjustment intervals may be regular and range from daily up to annually, or may be based on an event, such as a change in the prime rate. Floating and variable rate securities may be subject to greater liquidity risk than other debt securities, meaning that there may be limitations on the Fund’s ability to sell the securities at any given time. Such securities also may lose value.
Structured Product Risk. Structured products, such as tender option bonds, involve structural complexities and potential risks that may not be present where a municipal security is owned directly. These enhanced risks may include additional counter-party risk (the risk that the counterparty will not fulfill its contractual obligations) and call risk (the risk that the instruments will be called and the proceeds may need to be reinvested). Additionally, an active trading market for such instruments may not exist. To the extent that a structured product provides a put, the Fund may receive a lower interest rate in return for such feature and will be subject to the risk that the put provider will be unable to honor the put feature (purchase the security). Finally, short-term municipal or tax-exempt structured products may present tax issues not presented by investments in other short-term municipal or tax-exempt securities. These issues might be resolved in a manner adverse to the Fund.
Mortgage-Related and Other Asset-Backed Securities Risk. Mortgage-related and asset-backed securities, including certain municipal housing authority obligations, are subject to certain other risks. The value of these securities will be influenced by the factors affecting the housing market and the assets underlying such securities. As a result, during periods of declining asset values, difficult or frozen credit markets, significant changes in interest rates, or deteriorating economic conditions, mortgage-related and asset-backed securities may decline in value, face valuation difficulties, become more volatile and/or become illiquid. These securities are also subject to prepayment and call risk. In periods of declining interest rates, the Fund may be subject to contraction risk which is the risk that borrowers will increase the rate at which they prepay the maturity value of mortgages and other obligations. When mortgages and other obligations are prepaid and when securities are called, the Fund may have to reinvest in securities with a lower yield or fail to recover additional amounts (i.e., premiums) paid for securities with higher interest rates, resulting in an unexpected capital loss and/or a decrease in the amount of dividends and yield. In periods of either rising or declining interest rates, the Fund may be subject to extension risk which is the risk that the expected maturity of an obligation will lengthen in duration due to a decrease in prepayments. As a result, in certain interest rate environments, the Fund may exhibit additional volatility. Additionally, asset-backed, mortgage-related and mortgage-backed securities are subject to risks associated with their structure and the nature of the assets underlying the securities and the servicing of those assets. Certain asset-backed,
July 1, 2022 | 21
JPMorgan Ultra-Short Municipal Fund (continued)
mortgage-related and mortgage-backed securities may face valuation difficulties and may be less liquid than other types of asset-backed, mortgage-related and mortgage-backed securities, or debt securities.
Debt Securities and Other Callable Securities Risk. As part of its main investment strategy, the Fund invests in debt securities. The issuers of these securities and other callable securities may be able to repay principal in advance, especially when interest rates fall. Changes in prepayment rates can affect the return on investment and yield of these securities. When debt obligations are prepaid and when securities are called, the Fund may have to reinvest in securities with a lower yield. The Fund also may fail to recover additional amounts (i.e., premiums) paid for securities with higher interest rates, resulting in an unexpected capital loss.
Taxability Risk. The Fund’s investments in municipal securities rely on the opinion of the issuer’s bond counsel that the interest paid on those securities will not be subject to federal income tax. Tax opinions are generally provided at the time the municipal security is initially issued. However, after the Fund buys a security, the Internal Revenue Service may determine that a bond issued as tax-exempt should in fact be taxable and the Fund’s dividends with respect to that bond might be subject to federal income tax.
Municipal Housing Authority Obligations Risk. The Fund may invest more than 25% of its total assets in municipal housing authority obligations. As a result, the Fund could be more susceptible to developments which affect those obligations.
Ultra-Short Fund Risk. The Fund is not a money market fund. Therefore, the Fund does not attempt to maintain a stable net asset value and is not subject to the rules that govern the diversity, quality, maturity, liquidity and other features of securities that money market funds may purchase. Under normal conditions, the Fund’s investment may be more susceptible than a money market fund to interest rate risk, valuation risk, credit risk and other risks relevant to the Fund’s investments. Unlike certain money market funds, the Fund’s net asset value per share will fluctuate.
High Yield Securities Risk. The Fund may invest in securities and instruments of municipal issuers that are highly leveraged, less creditworthy or financially distressed. These investments (known as junk bonds) are considered to be speculative and are subject to greater risk of loss, greater sensitivity to economic changes, valuation difficulties and potential illiquidity.
In recent years, there has been a broad trend of weaker or less restrictive covenant protections in the high yield market. Among other things, under such weaker or less restrictive covenants, borrowers might be able to exercise more flexibility with respect to certain activities than borrowers who are subject to stronger or more protective covenants. For example, borrowers might be able to incur more debt, including secured debt, return more capital to shareholders, remove or reduce assets that are designated as collateral securing high yield
securities, increase the claims against assets that are permitted against collateral securing high yield securities or otherwise manage their business in ways that could impact creditors negatively. In addition, certain privately held borrowers might be permitted to file less frequent, less detailed or less timely financial reporting or other information, which could negatively impact the value of the high yield securities issued by such borrowers.
Each of these factors might negatively impact the high yield instruments held by the Fund. No active trading market may exist for some instruments and certain investments may be subject to restrictions on resale. The inability to dispose of the Fund’s securities and other investments in a timely fashion could result in losses to the Fund. Because some instruments may have a more limited secondary market, liquidity and valuation risk may be more pronounced for the Fund. When instruments are prepaid, the Fund may have to reinvest in instruments with a lower yield or fail to recover additional amounts (i.e., premiums) paid for these instruments, resulting in an unexpected capital loss and/or a decrease in the amount of dividends and yield.
Zero-Coupon Bond Risk. The market value of a zero-coupon bond is generally more volatile than the market value of other fixed income securities with similar maturities that pay interest periodically. In addition, federal income tax law requires that the holder of a zero-coupon bond accrue a portion of the discount at which the bond was purchased as taxable income each year. The Fund may consequently have to dispose of portfolio securities under disadvantageous circumstances to generate cash to satisfy its requirement as a regulated investment company to distribute all of its net income (including non-cash income attributable to zero-coupon securities). These actions may reduce the assets to which the Fund’s expenses could otherwise be allocated and may reduce the Fund’s rate of return.
Restricted Securities Risk. Restricted securities are securities that cannot be offered for public resale unless registered under the applicable securities laws or that have a contractual restriction that prohibits or limits their resale. Restricted securities include private placement securities that have not been registered under the applicable securities laws, such as Rule 144A securities, and securities of U.S. and non-U.S. issuers that are issued pursuant to Regulation S. Private placements are generally subject to strict restrictions on resale. Restricted securities may not be listed on an exchange and may have no active trading market. Restricted securities may be illiquid. The Fund may be unable to sell a restricted security on short notice or may be able to sell them only at a price below current value. It may be more difficult to determine a market value for a restricted security. Also, the Fund may get only limited information about the issuer of a restricted security, so it may be less able to predict a loss. In addition, if Fund management receives material non-public information about the issuer, the Fund may
22 | J.P. Morgan Municipal Bond Funds
as a result be unable to sell the securities. Certain restricted securities may involve a high degree of business and financial risk and may result in substantial losses.
Auction Rate Securities Risk. The auction rate municipal securities the Fund will purchase will typically have a long-term nominal maturity for which the interest rate is regularly reset through a “Dutch” auction. The interest rate set by the auction is the lowest interest rate that covers all securities offered for sale. While this process is designed to permit auction rate securities to be traded at par value, there is a risk that an auction will fail due to insufficient demand for the securities, which may adversely affect the liquidity and price of auction rate securities. Moreover, between auctions, there may be no secondary market for these securities, and sales conducted on a secondary market may not be on terms favorable to the seller. Thus, with respect to liquidity and price stability, auction rate securities may differ substantially from cash equivalents, notwithstanding the frequency of auctions and the credit quality of the security.
Transactions Risk. The Fund could experience a loss and its liquidity may be negatively impacted when selling securities to meet redemption requests. The risk of loss increases if the redemption requests are unusually large or frequent or occur in times of overall market turmoil or declining prices. Similarly, large purchases of Fund shares may adversely affect the Fund’s performance to the extent that the Fund is delayed in investing new cash and is required to maintain a larger cash position than it ordinarily would.
General Market Risk. Economies and financial markets throughout the world are becoming increasingly interconnected, which increases the likelihood that events or conditions in one country or region will adversely impact markets or issuers in other countries or regions. Securities in the Fund’s portfolio may underperform in comparison to securities in general financial markets, a particular financial market or other asset classes due to a number of factors, including inflation (or expectations for inflation), deflation (or expectations for deflation), interest rates, global demand for particular products or resources, market instability, debt crises and downgrades, embargoes, tariffs, sanctions and other trade barriers, regulatory events, other governmental trade or market control programs and related geopolitical events. In addition, the value of the Fund’s investments may be negatively affected by the occurrence of global events such as war, terrorism, environmental disasters, natural disasters or events, country instability, and infectious disease epidemics or pandemics.
For example, the outbreak of COVID-19 has negatively affected economies, markets and individual companies throughout the world, including those in which the Fund invests. The effects of this pandemic to public health and business and market conditions, including, among other things, reduced consumer demand and economic output, supply chain disruptions and increased government spending, may continue to have a significant negative impact on the performance of the Fund’s
investments, increase the Fund’s volatility, exacerbate pre-existing political, social and economic risks to the Fund, and negatively impact broad segments of businesses and populations. In addition, governments, their regulatory agencies, or self-regulatory organizations have taken or may take actions in response to the pandemic that affect the instruments in which the Fund invests, or the issuers of such instruments, in ways that could have a significant negative impact on the Fund’s investment performance. The duration and extent of COVID-19 and associated economic and market conditions and uncertainty over the long-term cannot be reasonably estimated at this time. The ultimate impact of COVID-19 and the extent to which the associated conditions impact a Fund will also depend on future developments, which are highly uncertain, difficult to accurately predict and subject to frequent changes.
Industry and Sector Focus Risk. At times the Fund may increase the relative emphasis of its investments in a particular industry or sector. The prices of securities of issuers in a particular industry or sector may be more susceptible to fluctuations due to changes in economic or business conditions, government regulations, availability of basic resources or supplies, or other events that affect that industry or sector more than securities of issuers in other industries and sectors. To the extent that the Fund increases the relative emphasis of its investments in a particular industry or sector, its shares’ values may fluctuate in response to events affecting that industry or sector.
Investments in the Fund are not deposits or obligations of, or guaranteed or endorsed by, any bank and are not insured or guaranteed by the FDIC, the Federal Reserve Board or any other government agency.
You could lose money investing in the Fund.
The Fund’s Past Performance
This section provides some indication of the risks of investing in the Fund. The bar chart shows how the performance of the Fund’s Class I Shares has varied from year to year for the past five calendar years. The table shows the average annual total returns for the past one year, five years and life of the Fund. The table compares the Fund’s performance to the performance of the Bloomberg 1 Year Municipal Bond Index. Past performance (before and after taxes) is not necessarily an indication of how the Fund will perform in the future. Updated performance information is available by visiting www.jpmorganfunds.com or by calling 1-800-480-4111.
July 1, 2022 | 23
JPMorgan Ultra-Short Municipal Fund (continued)
| YEAR-BY-YEAR RETURNS — CLASS I SHARES |
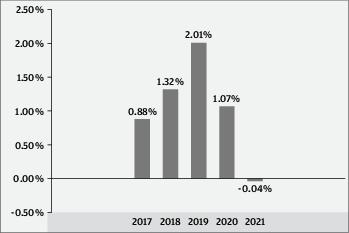
| Best Quarter |
1st quarter, 2019 |
0.68% |
| Worst Quarter |
1st quarter, 2021 |
-0.14% |
| The Fund’s year-to-date total return |
through |
3/31/22 |
was |
-1.11% |
. |
| AVERAGE ANNUAL TOTAL RETURNS (For periods ended December 31, 2021) | |||
| |
Past |
Past |
Life of Fund since |
| |
1 Year |
5 Years |
05/31/2016 |
| CLASS I SHARES |
|
|
|
| Return Before Taxes |
-0.04% |
1.05% |
0.97% |
| Return After Taxes on Distributions |
-0.05 |
1.03 |
0.96 |
| Return After Taxes on Distributions and Sale of Fund Shares |
0.08 |
1.01 |
0.94 |
| CLASS A SHARES |
|
|
|
| Return Before Taxes |
-0.14 |
0.84 |
0.77 |
| BLOOMBERG 1 YEAR MUNICIPAL BOND INDEX (Reflects No Deduction for Fees, Expenses, or Taxes) |
0.31 |
1.44 |
1.25 |
After-tax returns are shown for only the Class I Shares and after-tax returns for the other classes will vary. After-tax returns are calculated using the historical highest individual federal marginal income tax rates and do not reflect the impact of state and local taxes. Actual after-tax returns depend on the investor’s tax situation and may differ from those shown, and the after-tax returns shown are not relevant to investors who hold their shares through tax-deferred arrangements such as 401(k) plans or individual retirement accounts.
Management
J.P. Morgan Investment Management Inc. (the adviser)
| Portfolio Manager |
Managed the Fund Since |
Primary Title with Investment Adviser |
| Richard Taormina |
2016 |
Managing Director |
| James Ahn |
2016 |
Managing Director |
Purchase and Sale of Fund Shares
Purchase minimums
| For Class A Shares | |
| To establish an account |
$1,000 |
| To add to an account |
$50 |
| For Class I Shares | |
| To establish an account |
$1,000,000 |
| To add to an account |
No minimum levels |
In general, you may purchase or redeem shares on any business day:
•
Through your Financial Intermediary
•
By writing to J.P. Morgan Funds Services, P.O. Box 219143, Kansas City, MO 64121-9143
•
After you open an account, by calling J.P. Morgan Funds Services at 1-800-480-4111
Tax Information
The Fund’s distributions of interest on municipal bonds generally are not subject to federal income tax; however the Fund may distribute taxable dividends, including distributions of short-term capital gains, and long-term capital gains. In addition, interest on certain bonds may be subject to the federal alternative minimum tax. To the extent that the Fund’s distributions are derived from interest on bonds that are not exempt from applicable state and local taxes, such distributions will be subject to such state and local taxes. When your investment is in an IRA, 401(k) plan or other tax-advantaged investment plan, you may be subject to federal income tax on ordinary income or capital gains upon withdrawal from the tax-advantaged investment plan.
Payments to Broker-Dealers and Other Financial Intermediaries
If you purchase shares of the Fund through a broker-dealer or other financial intermediary (such as a bank), the Fund and its related companies may pay the financial intermediary for the sale of Fund shares and related services. These payments may create a conflict of interest by influencing the broker-dealer or financial intermediary and your salesperson to recommend the Fund over another investment. Ask your salesperson or visit your financial intermediary’s website for more information.
24 | J.P. Morgan Municipal Bond Funds
JPMorgan California Tax Free Bond Fund
Class/Ticker: A/JCBAX; C/JCBCX; I/JPICX
What is the goal of the Fund?
The Fund seeks to provide high after-tax total return for California residents consistent with moderate risk of capital.
Fees and Expenses of the Fund
The following tables describe the fees and expenses that you may pay if you buy, hold and sell shares of the Fund. You may pay other fees, such as brokerage commissions and other fees to financial intermediaries, which are not reflected in the table and examples below. You may qualify for sales charge discounts on purchases of Class A Shares if you and your family invest, or agree to invest in the future, at least $100,000 in the J.P. Morgan Funds. More information about these and other discounts is available from your financial intermediary and in “Investing with J.P. Morgan Funds — SALES CHARGES AND FINANCIAL INTERMEDIARY COMPENSATION” on page 71 and in “Financial Intermediary — Specific Sales Charge Waivers” in Appendix A of the prospectus and in “PURCHASES, REDEMPTIONS AND EXCHANGES” in Appendix A to Part II of the Statement of Additional Information.
| SHAREHOLDER FEES (Fees paid directly from your investment) | |||
| |
Class A |
Class C |
Class I |
| Maximum Sales Charge (Load) Imposed on Purchases as % of the Offering Price |
3.75% |
NONE |
NONE |
| Maximum Deferred Sales Charge (Load) as % of Original Cost of the Shares |
NONE1 |
1.00% |
NONE |
1
For purchases under $250,000.
| ANNUAL FUND OPERATING EXPENSES (Expenses that you pay each year as a percentage of the value of your investment) | |||
| |
Class A |
Class C |
Class I |
| Management Fees |
0.30% |
0.30% |
0.30% |
| Distribution (Rule 12b-1) Fees |
0.25 |
0.75 |
NONE |
| Other Expenses |
0.39 |
0.38 |
0.38 |
| Service Fees |
0.25 |
0.25 |
0.25 |
| Remainder of Other Expenses |
0.14 |
0.13 |
0.13 |
| Total Annual Fund Operating Expenses |
0.94 |
1.43 |
0.68 |
| Fee Waivers and/or Expense Reimbursements1 |
-0.34 |
-0.33 |
-0.18 |
| Total Annual Fund Operating Expenses after Fee Waivers and/or Expense Reimburse- ments1 |
0.60 |
1.10 |
0.50 |
1
The Fund’s adviser and/or its affiliates have contractually agreed to waive fees and/or reimburse expenses to the extent Total Annual Fund Operating Expenses (excluding acquired fund fees and expenses other than certain money market fund fees as described below, dividend and interest expenses related to short sales, interest, taxes, expenses related to litigation and potential litigation, expenses related to trustee elections, and extraordinary expenses) exceed 0.60%, 1.10% and 0.50% of the average daily net assets of Class A, Class C and Class I Shares, respectively. The Fund may invest in one or more money market funds advised by the adviser or its affiliates (affiliated money market funds). The Fund’s adviser, shareholder servicing agent and/or administrator have contractually agreed to waive fees and/or reimburse expenses in an amount sufficient to offset the respective net fees each collects from the affiliated money market funds on the Fund’s investment in such money market funds for all Share Classes . These waivers are in effect through 6/30/23, at which time it will be determined whether such waivers will be renewed or revised. To the extent that the Fund engages in securities lending, affiliated money market fund fees and expenses resulting from the Fund’s investment of cash received from securities lending borrowers are not included in Total Annual Fund Operating Expenses and therefore, the above waivers do not apply to such investments.
Example
This Example is intended to help you compare the cost of investing in the Fund with the cost of investing in other mutual funds. The Example assumes that you invest $10,000 in the Fund for the time periods indicated. The Example also assumes that your investment has a 5% return each year and that the Fund’s operating expenses are equal to the total annual fund operating expenses after fee waivers and expense reimbursements shown in the fee table through 6/30/23 and total annual fund operating expenses thereafter. Your actual costs may be higher or lower.
| IF YOU SELL YOUR SHARES, YOUR COST WOULD BE: | ||||
| |
1 Year |
3 Years |
5 Years |
10 Years |
| CLASS A SHARES ($) |
434 |
631 |
844 |
1,456 |
| CLASS C SHARES ($) |
212 |
420 |
750 |
1,551 |
| CLASS I SHARES ($) |
51 |
199 |
361 |
830 |
| IF YOU DO NOT SELL YOUR SHARES, YOUR COST WOULD BE: | ||||
| |
1 Year |
3 Years |
5 Years |
10 Years |
| CLASS A SHARES ($) |
434 |
631 |
844 |
1,456 |
| CLASS C SHARES ($) |
112 |
420 |
750 |
1,551 |
| CLASS I SHARES ($) |
51 |
199 |
361 |
830 |
Portfolio Turnover
The Fund pays transaction costs, such as commissions, when it buys and sells securities (or “turns over” its portfolio). A higher portfolio turnover rate may indicate higher transaction costs and may result in higher taxes when Fund shares are held in a taxable account. These costs, which are not reflected in annual fund operating expenses or in the Example, affect the Fund’s performance. During the Fund’s most recent fiscal year, the Fund’s portfolio turnover rate was 11% of the average value of its portfolio.
July 1, 2022 | 25
JPMorgan California Tax Free Bond Fund (continued)
What are the Fund’s main investment strategies?
As a fundamental policy, the Fund normally invests at least 80% of the value of its Assets in municipal securities, the income from which is exempt from federal and state personal income taxes for California residents and not subject to the federal alternative minimum tax on individuals. “Assets” means net assets, plus the amount of borrowings for investment purposes. The Fund seeks investments that also provide high current income. Municipal securities in which the Fund can invest include those issued by the State of California, its political subdivisions, as well as Puerto Rico, other U.S. territories and their political subdivisions. Because the Fund’s objective is high after-tax total return rather than high tax-exempt income, the Fund may invest to a limited extent in securities of other states or territories. To the extent that the Fund invests in municipal securities of other states, the income from such securities would be free from federal personal income taxes for California residents but would be subject to California taxes. For non-California residents, the income from California municipal securities may also be subject to state and local taxes in their jurisdiction of residence.
Under normal circumstances, the Fund reserves the right to invest up to 20% of its Assets in securities that pay interest subject to federal income tax, the federal alternative minimum tax on individuals or California personal income taxes. To defend the value of its assets during unusual market conditions, the Fund may temporarily exceed this limit.
The Fund’s securities may be of any maturity, but under normal circumstances the Fund’s duration will generally range between three and seven years. Duration is a measure of the price sensitivity of a debt security or a portfolio of debt securities to relative changes in interest rates. For instance, a duration of “three” means that a security’s or portfolio’s price would be expected to decrease by approximately 3% with a 1% increase in interest rates (assuming a parallel shift in yield curve). As of February 28, 2022, the duration of the Bloomberg LB California 1-17 Year Muni Index was 4.22 years, although the duration will likely vary in the future.
There may be times when there are not enough municipal securities available to meet the Fund’s needs. On these occasions, the Fund may invest in securities that may be subject to federal income tax.
The Fund may invest in debt securities issued by governmental entities, certain issuers identified with the U.S. government and private issuers. The Fund may invest in municipal mortgage-backed and asset-backed securities. The Fund may invest a significant portion or all of its assets in municipal mortgage-backed securities at the adviser’s discretion.
The Fund may invest up to 20% of its total assets in securities rated below investment grade. Such securities are known as “junk bonds,” “high yield bonds” and “non-investment grade bonds.” Junk bonds also include unrated securities that the adviser believes to be of comparable quality to debt securities
that are rated below investment grade. These securities generally are rated in the fifth or lower rating categories (for example, BB+ or lower by S&P and Ba1 or lower by Moody’s). These securities generally offer a higher yield than investment grade securities, but involve a high degree of risk. A security’s quality is determined at the time of purchase and securities that are rated investment grade or the unrated equivalent may be downgraded or decline in credit quality, such that, following the time of purchase, they would be deemed to be below investment grade. If the quality of an investment grade security is downgraded subsequent to purchase to below investment grade, the Fund may continue to hold the security.
The Fund may also invest in high-quality, short-term money market instruments and repurchase agreements.
The Fund may also invest in zero-coupon securities.
Investment Process: The adviser buys and sells securities and investments for the Fund based on its view of individual securities and market sectors. Taking a long-term approach, the adviser looks for individual fixed income investments that it believes will perform well over market cycles. The adviser is value oriented and makes decisions to purchase and sell individual securities and instruments after performing a risk/reward analysis that includes an evaluation of interest rate risk, credit risk, duration, liquidity and the complex legal and technical structure of the transaction. As part of its investment process, the adviser seeks to assess the impact of environmental, social and governance factors on certain issuers in the universe in which the Fund may invest. The adviser’s assessment is based on an analysis of key opportunities and risks across sectors to identify financially material issues on the Fund’s investments in municipal issues and ascertain key issues that merit engagement with municipal issuers. These assessments may not be conclusive and securities that may be negatively impacted by such factors may be purchased and retained by the Fund while the Fund may divest or not invest in securities that may be positively impacted by such factors.
The Fund’s Main Investment Risks
The Fund is subject to management risk and may not achieve its objective if the adviser’s expectations regarding particular instruments or markets are not met.
An investment in this Fund or any other fund may not provide a complete investment program. The suitability of an investment in the Fund should be considered based on the investment objective, strategies and risks described in this prospectus, considered in light of all of the other investments in your portfolio, as well as your risk tolerance, financial goals and time horizons. You may want to consult with a financial advisor to determine if this Fund is suitable for you.
The Fund is subject to the main risks noted below, any of which may adversely affect the Fund’s performance and ability to meet its investment objective.
26 | J.P. Morgan Municipal Bond Funds
Interest Rate Risk. The Fund mainly invests in bonds and other debt securities. These securities will increase or decrease in value based on changes in interest rates. If rates increase, the value of the Fund’s investments generally declines. Securities with greater interest rate sensitivity and longer maturities generally are subject to greater fluctuations in value. The Fund may face a heightened level of interest rate risk due to certain changes in monetary policy. During periods when interest rates are low or there are negative interest rates, the Fund’s yield (and total return) also may be low or the Fund may be unable to maintain positive returns.
California Geographic Concentration Risk. Because the Fund primarily invests in issuers in the State of California, its performance will be affected by the fiscal and economic health of that state and its municipalities. Provisions of the California Constitution and state statutes that limit the taxing and spending authority of California’s governmental entities may impair the ability of California issuers to pay principal and/or interest on their obligations. While California’s economy is broad, it does have major concentrations in high technology, manufacturing, entertainment, agriculture, tourism, construction and services, and may be sensitive to economic problems affecting those industries.
Municipal Obligations Risk. The risk of a municipal obligation generally depends on the financial and credit status of the issuer. Changes in the financial health of a municipal issuer may make it difficult for the issuer to make interest and principal payments when due. This could decrease the Fund’s income or hurt the ability to preserve capital and liquidity.
Under some circumstances, municipal obligations might not pay interest unless the state legislature or municipality authorizes money for that purpose.
Municipal obligations may be more susceptible to downgrades or defaults during recessions or similar periods of economic stress. In addition, since some municipal obligations may be secured or guaranteed by banks and other institutions, the risk to the Fund could increase if the banking or financial sector suffers an economic downturn and/or if the credit ratings of the institutions issuing the guarantee are downgraded or at risk of being downgraded by a national rating organization. Such a downward revision or risk of being downgraded may have an adverse effect on the market prices of the bonds and thus the value of the Fund’s investments.
In addition to being downgraded, an insolvent municipality may file for bankruptcy. The reorganization of a municipality’s debts may significantly affect the rights of creditors and the value of the securities issued by the municipality and the value of the Fund’s investments.
Credit Risk. The Fund’s investments are subject to the risk that issuers and/or counterparties will fail to make payments when due or default completely. If an issuer’s or a counterparty’s financial condition worsens, the credit quality of the issuer or counterparty may deteriorate. Credit spreads may increase,
which may reduce the market values of the Fund’s securities. Credit spread risk is the risk that economic and market conditions or any actual or perceived credit deterioration may lead to an increase in the credit spreads (i.e., the difference in yield between two securities of similar maturity but different credit quality) and a decline in price of the issuer’s securities.
Government Securities Risk. The Fund invests in securities issued or guaranteed by the U.S. government or its agencies and instrumentalities (such as securities issued by the Government National Mortgage Association (Ginnie Mae), the Federal National Mortgage Association (Fannie Mae), or the Federal Home Loan Mortgage Corporation (Freddie Mac)). U.S. government securities are subject to market risk, interest rate risk and credit risk. Securities, such as those issued or guaranteed by Ginnie Mae or the U.S. Treasury, that are backed by the full faith and credit of the United States are guaranteed only as to the timely payment of interest and principal when held to maturity and the market prices for such securities will fluctuate. Notwithstanding that these securities are backed by the full faith and credit of the United States, circumstances could arise that would prevent the payment of interest or principal. This would result in losses to the Fund. Securities issued or guaranteed by U.S. government related organizations, such as Fannie Mae and Freddie Mac, are not backed by the full faith and credit of the U.S. government and no assurance can be given that the U.S. government will provide financial support. Therefore, U.S. government related organizations may not have the funds to meet their payment obligations in the future. U.S. government securities include zero coupon securities, which tend to be subject to greater market risk than interest-paying securities of similar maturities.
High Yield Securities Risk. The Fund may invest in securities and instruments of municipal issuers that are highly leveraged, less creditworthy or financially distressed. These investments (also known as junk bonds) are considered to be speculative and are subject to greater risk of loss, greater sensitivity to economic changes, valuation difficulties, and potential illiquidity.
In recent years, there has been a broad trend of weaker or less restrictive covenant protections in the high yield market. Among other things, under such weaker or less restrictive covenants, borrowers might be able to exercise more flexibility with respect to certain activities than borrowers who are subject to stronger or more protective covenants. For example, borrowers might be able to incur more debt, including secured debt, return more capital to shareholders, remove or reduce assets that are designated as collateral securing high yield securities, increase the claims against assets that are permitted against collateral securing high yield securities or otherwise manage their business in ways that could impact creditors negatively. In addition, certain privately held borrowers might be permitted to file less frequent, less detailed or less timely financial reporting or other information, which could negatively impact the value of the high yield securities issued by such borrowers.
July 1, 2022 | 27
JPMorgan California Tax Free Bond Fund (continued)
Each of these factors might negatively impact the high yield instruments held by the Fund. No active trading market may exist for some instruments and certain investments may be subject to restrictions on resale. The inability to dispose of the Fund’s securities and other investments in a timely fashion could result in losses to the Fund. Because some instruments may have a more limited secondary market, liquidity and valuation risk may be more pronounced for the Fund. When instruments are prepaid, the Fund may have to reinvest in instruments with a lower yield or fail to recover additional amounts (i.e., premiums) paid for these instruments, resulting in an unexpected capital loss and/or a decrease in the amount of dividends and yield.
Alternative Minimum Tax Risk. The Fund may invest in securities, the interest on which may be subject to the federal alternative minimum tax.
Mortgage-Related and Other Asset-Backed Securities Risk. Mortgage-related and asset-backed securities, including certain municipal housing authority obligations, are subject to certain other risks. The value of these securities will be influenced by the factors affecting the housing market and the assets underlying such securities. As a result, during periods of declining asset values, difficult or frozen credit markets, significant changes in interest rates, or deteriorating economic conditions, mortgage-related and asset-backed securities may decline in value, face valuation difficulties, become more volatile and/or become illiquid. These securities are also subject to prepayment and call risk. In periods of declining interest rates, the Fund may be subject to contraction risk which is the risk that borrowers will increase the rate at which they prepay the maturity value of mortgages and other obligations. When mortgages and other obligations are prepaid and when securities are called, the Fund may have to reinvest in securities with a lower yield or fail to recover additional amounts (i.e., premiums) paid for securities with higher interest rates, resulting in an unexpected capital loss and/or a decrease in the amount of dividends and yield. In periods of either rising or declining interest rates, the Fund may be subject to extension risk which is the risk that the expected maturity of an obligation will lengthen in duration due to a decrease in prepayments. As a result, in certain interest rate environments, the Fund may exhibit additional volatility. Additionally, asset-backed, mortgage-related and mortgage-backed securities are subject to risks associated with their structure and the nature of the assets underlying the securities and the servicing of those assets. Certain asset-backed, mortgage-related and mortgage-backed securities may face valuation difficulties and may be less liquid than other types of asset-backed, mortgage-related and mortgage-backed securities, or debt securities.
Debt Securities and Other Callable Securities Risk. As part of its main investment strategy, the Fund invests in debt securities. The issuers of these securities and other callable securities may be able to repay principal in advance, especially when interest rates fall. Changes in prepayment rates can affect the return on
investment and yield of these securities. When debt obligations are prepaid and when securities are called, the Fund may have to reinvest in securities with a lower yield. The Fund also may fail to recover additional amounts (i.e., premiums) paid for securities with higher interest rates, resulting in an unexpected capital loss.
Taxability Risk. The Fund’s investments in municipal securities rely on the opinion of the issuer’s bond counsel that the interest paid on those securities will not be subject to federal income tax. Tax opinions are generally provided at the time the municipal security is initially issued. However, after the Fund buys a security, the Internal Revenue Service may determine that a bond issued as tax-exempt should in fact be taxable and the Fund’s dividends with respect to that bond might be subject to federal income tax.
Zero-Coupon Bond Risk. The market value of a zero-coupon bond is generally more volatile than the market value of other fixed income securities with similar maturities that pay interest periodically. In addition, federal income tax law requires that the holder of a zero-coupon bond accrue a portion of the discount at which the bond was purchased as taxable income each year. The Fund may consequently have to dispose of portfolio securities under disadvantageous circumstances to generate cash to satisfy its requirement as a regulated investment company to distribute all of its net income (including non-cash income attributable to zero-coupon securities). These actions may reduce the assets to which the Fund’s expenses could otherwise be allocated and may reduce the Fund’s rate of return.
Transactions Risk. The Fund could experience a loss and its liquidity may be negatively impacted when selling securities to meet redemption requests. The risk of loss increases if the redemption requests are unusually large or frequent or occur in times of overall market turmoil or declining prices. Similarly, large purchases of Fund shares may adversely affect the Fund’s performance to the extent that the Fund is delayed in investing new cash and is required to maintain a larger cash position than it ordinarily would.
General Market Risk. Economies and financial markets throughout the world are becoming increasingly interconnected, which increases the likelihood that events or conditions in one country or region will adversely impact markets or issuers in other countries or regions. Securities in the Fund’s portfolio may underperform in comparison to securities in general financial markets, a particular financial market or other asset classes due to a number of factors, including inflation (or expectations for inflation), deflation (or expectations for deflation), interest rates, global demand for particular products or resources, market instability, debt crises and downgrades, embargoes, tariffs, sanctions and other trade barriers, regulatory events, other governmental trade or market control programs and related geopolitical events. In addition, the value of the Fund’s investments may be negatively affected by the
28 | J.P. Morgan Municipal Bond Funds
occurrence of global events such as war, terrorism, environmental disasters, natural disasters or events, country instability, and infectious disease epidemics or pandemics.
For example, the outbreak of COVID-19 has negatively affected economies, markets and individual companies throughout the world, including those in which the Fund invests. The effects of this pandemic to public health and business and market conditions, including, among other things, reduced consumer demand and economic output, supply chain disruptions and increased government spending, may continue to have a significant negative impact on the performance of the Fund’s investments, increase the Fund’s volatility, exacerbate pre-existing political, social and economic risks to the Fund, and negatively impact broad segments of businesses and populations. In addition, governments, their regulatory agencies, or self-regulatory organizations have taken or may take actions in response to the pandemic that affect the instruments in which the Fund invests, or the issuers of such instruments, in ways that could have a significant negative impact on the Fund’s investment performance. The duration and extent of COVID-19 and associated economic and market conditions and uncertainty over the long-term cannot be reasonably estimated at this time. The ultimate impact of COVID-19 and the extent to which the associated conditions impact a Fund will also depend on future developments, which are highly uncertain, difficult to accurately predict and subject to frequent changes.
Industry and Sector Focus Risk. At times the Fund may increase the relative emphasis of its investments in a particular industry or sector. The prices of securities of issuers in a particular industry or sector may be more susceptible to fluctuations due to changes in economic or business conditions, government regulations, availability of basic resources or supplies, or other events that affect that industry or sector more than securities of issuers in other industries and sectors. To the extent that the Fund increases the relative emphasis of its investments in a particular industry or sector, its shares’ values may fluctuate in response to events affecting that industry or sector.
Investments in the Fund are not deposits or obligations of, or guaranteed or endorsed by, any bank and are not insured or guaranteed by the FDIC, the Federal Reserve Board or any other government agency.
You could lose money investing in the Fund.
The Fund’s Past Performance
This section provides some indication of the risks of investing in the Fund. The bar chart shows how the performance of the Fund’s Class I Shares has varied from year to year for the past ten calendar years. The table shows the average annual total returns over the past one year, five years and ten years. The table compares the Fund’s performance to the performance of the Bloomberg LB California 1-17 Year Muni Index. Past performance (before and after taxes) is not necessarily an
indication of how the Fund will perform in the future. Updated performance information is available by visiting www.jpmorganfunds.com or by calling 1-800-480-4111.
| YEAR-BY-YEAR RETURNS - CLASS I SHARES |
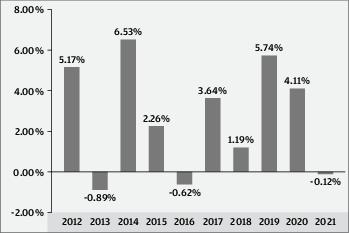
| Best Quarter |
2nd quarter, 2020 |
2.64% |
| Worst Quarter |
4th quarter, 2016 |
-3.39% |
| The Fund’s year-to-date total return |
through |
3/31/22 |
was |
-5.89% |
. |
| AVERAGE ANNUAL TOTAL RETURNS (For periods ended December 31, 2021) | |||
| |
Past 1 Year |
Past 5 Years |
Past 10 Years |
| CLASS I SHARES |
|
|
|
| Return Before Taxes |
-0.12% |
2.89% |
2.67% |
| Return After Taxes on Distributions |
-0.13 |
2.88 |
2.62 |
| Return After Taxes on Distributions and Sale of Fund Shares |
0.54 |
2.74 |
2.63 |
| CLASS A SHARES |
|
|
|
| Return Before Taxes |
-3.97 |
1.99 |
2.17 |
| CLASS C SHARES |
|
|
|
| Return Before Taxes |
-1.73 |
2.27 |
2.16 |
| BLOOMBERG LB CALIFORNIA 1-17 YEAR MUNI INDEX (Reflects No Deduction for Fees, Expenses, or Taxes) |
0.52 |
3.38 |
3.14 |
After-tax returns are shown for only the Class I Shares and after-tax returns for the other classes will vary. After-tax returns are calculated using the historical highest individual federal marginal income tax rates and do not reflect the impact of state and local taxes. Actual after-tax returns depend on the investor’s tax situation and may differ from those shown, and the after-tax returns shown are not relevant to investors who hold their shares through tax-deferred arrangements such as 401(k) plans or individual retirement accounts.
July 1, 2022 | 29
JPMorgan California Tax Free Bond Fund (continued)
Management
J.P. Morgan Investment Management Inc. (the adviser)
| Portfolio Manager |
Managed the Fund Since |
Primary Title with Investment Adviser |
| David Sivinski |
2005 |
Executive Director |
| Michelle Hallam |
2004 |
Executive Director |
Purchase and Sale of Fund Shares
Purchase minimums
| For Class A and Class C Shares | |
| To establish an account |
$1,000 |
| To add to an account |
$50 |
| For Class I Shares | |
| To establish an account |
$1,000,000 |
| To add to an account |
No minimum levels |
In general, you may purchase or redeem shares on any business day:
•
Through your Financial Intermediary
•
By writing to J.P. Morgan Funds Services, P.O. Box 219143, Kansas City, MO 64121-9143
•
After you open an account, by calling J.P. Morgan Funds Services at 1-800-480-4111
Tax Information
The Fund’s distributions of interest on municipal bonds generally are not subject to federal income tax; however the Fund may distribute taxable dividends, including distributions of short-term capital gains, and long-term capital gains. In addition, interest on certain bonds may be subject to the federal alternative minimum tax. To the extent that the Fund’s distributions are derived from interest on bonds that are not exempt from applicable state and local taxes, such distributions will be subject to such state and local taxes. When your investment is in an IRA, 401(k) plan or other tax-advantaged investment plan, you may be subject to federal income tax on ordinary income or capital gains upon withdrawal from the tax-advantaged investment plan.
Payments to Broker-Dealers and Other Financial Intermediaries
If you purchase shares of the Fund through a broker-dealer or other financial intermediary (such as a bank), the Fund and its related companies may pay the financial intermediary for the sale of Fund shares and related services. These payments may create a conflict of interest by influencing the broker dealer or financial intermediary and your salesperson to recommend the Fund over another investment. Ask your salesperson or visit your financial intermediary’s website for more information.
30 | J.P. Morgan Municipal Bond Funds
JPMorgan High Yield Municipal Fund
Class/Ticker: A/JTIAX; C/JTICX; I/JTISX
What is the goal of the Fund?
The Fund seeks a high level of current income exempt from federal income taxes.
Fees and Expenses of the Fund
The following tables describe the fees and expenses that you may pay if you buy, hold and sell shares of the Fund. You may pay other fees, such as brokerage commissions and other fees to financial intermediaries, which are not reflected in the table and examples below. You may qualify for sales charge discounts on purchases of Class A Shares if you and your family invest, or agree to invest in the future, at least $100,000 in the J.P. Morgan Funds. More information about these and other discounts is available from your financial intermediary and in “Investing with J.P. Morgan Funds — SALES CHARGES AND FINANCIAL INTERMEDIARY COMPENSATION” on page 71 and in “Financial Intermediary-Specific Sales Charge Waivers” in Appendix A of the prospectus and in “PURCHASES, REDEMPTIONS AND EXCHANGES” in Appendix A to Part II of the Statement of Additional Information.
| SHAREHOLDER FEES (Fees paid directly from your investment) | |||
| |
Class A |
Class C |
Class I |
| Maximum Sales Charge (Load) Imposed on Purchases as a % of the Offering Price |
3.75% |
NONE |
NONE |
| Maximum Deferred Sales Charge (Load) as a % of Original Cost of the Shares |
NONE1 |
1.00% |
NONE |
1
For purchases under $250,000.
| ANNUAL FUND OPERATING EXPENSES (Expenses that you pay each year as a percentage of the value of your investment) | |||
| |
Class A |
Class C |
Class I |
| Management Fees |
0.35% |
0.35% |
0.35% |
| Distribution (Rule 12b-1) Fees |
0.25 |
0.75 |
NONE |
| Other Expenses |
0.41 |
0.41 |
0.41 |
| Service Fees |
0.25 |
0.25 |
0.25 |
| Remainder of Other Expenses |
0.16 |
0.16 |
0.16 |
| Total Annual Fund Operating Expenses |
1.01 |
1.51 |
0.76 |
| Fee Waivers and/or Expense Reimbursements1 |
-0.36 |
-0.36 |
-0.21 |
| Total Annual Fund Operating Expenses after Fee Waivers and/or Expense Reimburse- ments1 |
0.65 |
1.15 |
0.55 |
1
The Fund’s adviser and/or its affiliates have contractually agreed to waive fees and/or reimburse expenses to the extent Total Annual Fund Operating Expenses (excluding acquired fund fees and expenses other than certain money market fund fees as described below, dividend and interest expenses related to short sales, interest, taxes, expenses related to litigation and potential litigation, expenses related to trustee elections, and extraordinary expenses) exceed 0.65%, 1.15% and 0.55% of the average daily net assets of Class A, Class C and Class I Shares, respectively. The Fund may invest in one or more money market funds advised by the adviser or its affiliates (affiliated money market funds). The Fund’s adviser, shareholder servicing agent and/or administrator have contractually agreed to waive fees and/or reimburse expenses in an amount sufficient to offset the respective net fees each collects from the affiliated money market funds on the Fund’s investment in such money market funds for all Share Classes . These waivers are in effect through 6/30/23, at which time it will be determined whether such waivers will be renewed or revised. To the extent that the Fund engages in securities lending, affiliated money market fund fees and expenses resulting from the Fund’s investment of cash received from securities lending borrowers are not included in Total Annual Fund Operating Expenses and therefore, the above waivers do not apply to such investments.
Example
This Example is intended to help you compare the cost of investing in the Fund with the cost of investing in other mutual funds. The Example assumes that you invest $10,000 in the Fund for the time periods indicated. The Example also assumes that your investment has a 5% return each year and that the Fund’s operating expenses are equal to the total annual fund operating expenses after fee waivers and expense reimbursements shown in the fee table through 6/30/23 and total annual fund operating expenses thereafter. Your actual costs may be higher or lower.
| IF YOU SELL YOUR SHARES, YOUR COST WOULD BE: | ||||
| |
1 Year |
3 Years |
5 Years |
10 Years |
| CLASS A SHARES ($) |
439 |
650 |
878 |
1,533 |
| CLASS C SHARES ($) |
217 |
442 |
790 |
1,636 |
| CLASS I SHARES ($) |
56 |
222 |
402 |
923 |
| IF YOU DO NOT SELL YOUR SHARES, YOUR COST WOULD BE: | ||||
| |
1 Year |
3 Years |
5 Years |
10 Years |
| CLASS A SHARES ($) |
439 |
650 |
878 |
1,533 |
| CLASS C SHARES ($) |
117 |
442 |
790 |
1,636 |
| CLASS I SHARES ($) |
56 |
222 |
402 |
923 |
Portfolio Turnover
The Fund pays transaction costs, such as commissions, when it buys and sells securities (or “turns over” its portfolio). A higher portfolio turnover rate may indicate higher transaction costs and may result in higher taxes when Fund shares are held in a taxable account. These costs, which are not reflected in annual fund operating expenses or in the Example, affect the Fund’s performance. During the Fund’s most recent fiscal year, the Fund’s portfolio turnover rate was 24% of the average value of its portfolio.
July 1, 2022 | 31
JPMorgan High Yield Municipal Fund (continued)
What are the Fund’s main investment strategies?
Under normal circumstances, the Fund invests at least 80% of its Assets in municipal securities, the income from which is exempt from federal income tax. This is a fundamental policy. For purposes of this policy, “Assets” means net assets, plus the amount of borrowings for investment purposes. Municipal securities are securities issued by or on behalf of states, territories and possessions of the United States, including the District of Columbia, and their respective authorities, political subdivisions, agencies and instrumentalities and other groups with the authority to act for the municipalities, the interest on which is exempt from federal income tax. The securities are issued to raise funds for various public and private purposes. Municipal securities may include, but are not limited to, variable rate demand obligations, short-term municipal notes, municipal bonds, tax exempt commercial paper, private activity and industrial development bonds, tax anticipation notes, and participations in pools of municipal securities.
Municipal securities also include instruments evidencing direct ownership of interest payments or principal payments, or both, on municipal securities, such as tender option bonds and participation interests in all or part of specific holdings of municipal obligations, provided that the applicable issuer receives assurances from legal counsel that the interest payable on the securities is exempt from federal income tax. Additionally, municipal securities include all other instruments that directly or indirectly provide economic exposure to income which is derived from municipalities (such as municipal leases). The securities in which the Fund invests may have fixed rates of return or floating or variable rates.
The Fund will invest in municipal securities of any maturity. As part of its investments in municipal securities, the Fund will also have the ability to invest up to 100% of the Fund’s total assets in below investment grade or unrated securities. Such securities are also known as “junk bonds,” “high yield bonds” and “non-investment grade bonds.” Junk bonds also include unrated securities that the Fund’s adviser believes to be of comparable quality to debt securities that are rated below investment grade. Junk bonds are also called “high yield bonds” and “non-investment grade bonds.” These securities generally are rated in the fifth or lower rating categories (for example, BB+ or lower by Standard & Poor’s Corporation (S&P) and Ba1 or lower by Moody’s Investors Service, Inc. (Moody’s)). These securities generally offer a higher yield than investment grade securities, but involve a high degree of risk. A security’s quality is determined at the time of purchase and securities that are rated investment grade or the unrated equivalent may be downgraded or decline in credit quality such that subsequently they would be deemed to be below investment grade.
The Fund will also invest in investment grade securities. Investment grade securities carry a minimum rating of Baa3, BBB–, or BBB– by Moody’s Investors Service Inc. (Moody’s), Standard & Poor’s Corporation (S&P), or Fitch Ratings (Fitch), respectively, or the equivalent by another nationally recognized statistical
rating organization (NRSRO) or are unrated but deemed by the adviser to be of comparable quality. Under normal market conditions, the Fund intends to invest a significant portion of its Assets in securities rated BBB/BB by Standard & Poor’s Corporation (S&P) and Fitch Ratings (Fitch), Baa/Ba by Moody’s Investor Service, Inc. (Moody’s) or unrated securities that the adviser deems to be of equivalent quality.
The Fund may also invest in common shares or preferred shares of unaffiliated closed-end funds. The Fund generally will limit its investments in a single closed-end fund to 5% of its total assets and in all registered investment companies including closed-end funds (other than money market funds) to 10% of its total assets.
The Fund may invest in shares of exchange-traded funds (ETFs). The ETFs in which the Fund may invest include registered investment companies that seek to track the performance of a particular market index or security. These indexes include not only broad-based market indexes but more specific indexes as well, including those relating to particular sectors, markets, regions or industries. Ordinarily, the Fund must limit its investments in any single ETF to 5% of its total assets and in all ETFs and other investment companies to 10% of its total assets. However, the Securities and Exchange Commission (SEC) has issued exemptive orders to many ETFs that currently allow any fund investing in such ETFs to disregard these 5% and 10% limitations. If the Fund invests in ETFs that have received such exemptive orders, it may invest any amount of its total assets in a single ETF or in multiple ETFs, although ordinarily the Fund will limit its investments to no more than 10% of its total assets in a single ETF.
The Fund may invest in obligations of the U.S. Treasury, including Treasury bills, bonds and notes. These investments carry different interest rates, maturities and issue dates. The interest on these securities may be exempt from state and local income taxes.
Up to 100% of the Fund’s assets may be invested in municipal securities, the interest on which may be subject to the federal alternative minimum tax for individuals.
Up to 20% of the Fund’s net assets may be invested in securities subject to federal income tax.
The Fund may also invest in zero-coupon securities.
The Fund also invests in inverse floaters, auction rate securities and restricted securities.
Investment Process
The adviser buys and sells securities and investments for the Fund based on its view of individual securities and market sectors. Taking a long-term approach, the adviser primarily looks for individual fixed income investments that it believes will perform well over market cycles. The adviser is value oriented and makes investment decisions after performing a risk/reward analysis that includes an evaluation of interest rate risk, credit risk, duration, liquidity, any security pledge, and a review of the
32 | J.P. Morgan Municipal Bond Funds
security’s attributes, such as the coupon, maturity, and any redemption and tender provisions. The adviser also factors in the overall investment strategy of the Fund, including its duration and its credit strategy, as well as the adviser’s interest rate outlook. As part of its investment process, the adviser seeks to assess the impact of environmental, social and governance factors on certain issuers in the universe in which the Fund may invest. The adviser’s assessment is based on an analysis of key opportunities and risks across sectors to identify financially material issues on the Fund’s investments in municipal issues and ascertain key issues that merit engagement with municipal issuers. These assessments may not be conclusive and securities that may be negatively impacted by such factors may be purchased and retained by the Fund while the Fund may divest or not invest in securities that may be positively impacted by such factors.
The Fund’s Main Investment Risks
The Fund is subject to management risk. The Fund may not achieve its objective if the adviser’s expectations regarding particular instruments or markets are not met.
An investment in this Fund or any other fund may not provide a complete investment program. The suitability of an investment in the Fund should be considered based on the investment objective, strategies and risks described in this prospectus, considered in light of all of the other investments in your portfolio, as well as your risk tolerance, financial goals and time horizons. You may want to consult with a financial advisor to determine if this Fund is suitable for you.
The Fund is subject to the main risks noted below, any of which may adversely affect the Fund’s performance and ability to meet its investment objective.
Municipal Obligations Risk. The risk of a municipal obligation generally depends on the financial and credit status of the issuer. Changes in the financial health of a municipal issuer may make it difficult for the issuer to make interest and principal payments when due. This could decrease the Fund’s income or hurt the ability to preserve capital and liquidity.
Under some circumstances, municipal obligations might not pay interest unless the state legislature or municipality authorizes money for that purpose.
Municipal obligations may be more susceptible to downgrades or defaults during recessions or similar periods of economic stress. In addition, since some municipal obligations may be secured or guaranteed by banks and other institutions, the risk to the Fund could increase if the banking or financial sector suffers an economic downturn and/or if the credit ratings of the institutions issuing the guarantee are downgraded or at risk of being downgraded by a national rating organization. Such a downward revision or risk of being downgraded may have an adverse effect on the market prices of the bonds and thus the value of the Fund’s investments.
In addition to being downgraded, an insolvent municipality may file for bankruptcy. The reorganization of a municipality’s debts may significantly affect the rights of creditors and the value of the securities issued by the municipality and the value of the Fund’s investments.
General Market Risk. Economies and financial markets throughout the world are becoming increasingly interconnected, which increases the likelihood that events or conditions in one country or region will adversely impact markets or issuers in other countries or regions. Securities in the Fund’s portfolio may underperform in comparison to securities in general financial markets, a particular financial market or other asset classes due to a number of factors, including inflation (or expectations for inflation), deflation (or expectations for deflation), interest rates, global demand for particular products or resources, market instability, debt crises and downgrades, embargoes, tariffs, sanctions and other trade barriers, regulatory events, other governmental trade or market control programs and related geopolitical events. In addition, the value of the Fund’s investments may be negatively affected by the occurrence of global events such as war, terrorism, environmental disasters, natural disasters or events, country instability, and infectious disease epidemics or pandemics.
For example, the outbreak of COVID-19 has negatively affected economies, markets and individual companies throughout the world, including those in which the Fund invests. The effects of this pandemic to public health and business and market conditions, including, among other things, reduced consumer demand and economic output, supply chain disruptions and increased government spending, may continue to have a significant negative impact on the performance of the Fund’s investments, increase the Fund’s volatility, exacerbate pre-existing political, social and economic risks to the Fund, and negatively impact broad segments of businesses and populations. In addition, governments, their regulatory agencies, or self-regulatory organizations have taken or may take actions in response to the pandemic that affect the instruments in which the Fund invests, or the issuers of such instruments, in ways that could have a significant negative impact on the Fund’s investment performance. The duration and extent of COVID-19 and associated economic and market conditions and uncertainty over the long-term cannot be reasonably estimated at this time. The ultimate impact of COVID-19 and the extent to which the associated conditions impact a Fund will also depend on future developments, which are highly uncertain, difficult to accurately predict and subject to frequent changes.
Alternative Minimum Tax Risk. The Fund may invest in securities, the interest on which may be subject to the federal alternative minimum tax.
High Yield Securities Risk. The Fund may invest in securities and instruments of municipal issuers that are highly leveraged, less creditworthy or financially distressed. These investments (also
July 1, 2022 | 33
JPMorgan High Yield Municipal Fund (continued)
known as junk bonds) are considered to be speculative and are subject to greater risk of loss, greater sensitivity to economic changes, valuation difficulties, and potential illiquidity.
In recent years, there has been a broad trend of weaker or less restrictive covenant protections in the high yield market. Among other things, under such weaker or less restrictive covenants, borrowers might be able to exercise more flexibility with respect to certain activities than borrowers who are subject to stronger or more protective covenants. For example, borrowers might be able to incur more debt, including secured debt, return more capital to shareholders, remove or reduce assets that are designated as collateral securing high yield securities, increase the claims against assets that are permitted against collateral securing high yield securities or otherwise manage their business in ways that could impact creditors negatively. In addition, certain privately held borrowers might be permitted to file less frequent, less detailed or less timely financial reporting or other information, which could negatively impact the value of the high yield securities issued by such borrowers.
Each of these factors might negatively impact the high yield instruments held by the Fund. No active trading market may exist for some instruments and certain investments may be subject to restrictions on resale. The inability to dispose of the Fund’s securities and other investments in a timely fashion could result in losses to the Fund. Because some instruments may have a more limited secondary market, liquidity and valuation risk may be more pronounced for the Fund. When instruments are prepaid, the Fund may have to reinvest in instruments with a lower yield or fail to recover additional amounts (i.e., premiums) paid for these instruments, resulting in an unexpected capital loss and/or a decrease in the amount of dividends and yield.
Interest Rate Risk. The Fund mainly invests in bonds and other debt securities. These securities will increase or decrease in value based on changes in interest rates. If rates increase, the value of the Fund’s investments generally declines. Securities with greater interest rate sensitivity and longer maturities generally are subject to greater fluctuations in value. The Fund may face a heightened level of interest rate risk due to certain changes in monetary policy. During periods when interest rates are low or there are negative interest rates, the Fund’s yield (and total return) also may be low or the Fund may be unable to maintain positive returns.
Credit Risk. The Fund’s investments are subject to the risk that issuers and/or counterparties will fail to make payments when due or default completely. If an issuer’s or a counterparty’s financial condition worsens, the credit quality of the issuer or counterparty may deteriorate. Credit spreads may increase, which may reduce the market values of the Fund’s securities. Credit spread risk is the risk that economic and market conditions or any actual or perceived credit deterioration may lead to
an increase in the credit spreads (i.e., the difference in yield between two securities of similar maturity but different credit quality) and a decline in price of the issuer’s securities.
Floating and Variable Rate Securities Risk. Floating and variable rate securities provide for a periodic adjustment in the interest rate paid on the securities. The rate adjustment intervals may be regular and range from daily up to annually, or may be based on an event, such as a change in the prime rate. Floating and variable rate securities may be subject to greater liquidity risk than other debt securities, meaning that there may be limitations on the Fund’s ability to sell the securities at any given time. Such securities also may lose value.
Structured Product Risk. Structured products, such as tender option bonds, involve structural complexities and potential risks that may not be present where a municipal security is owned directly. These enhanced risks may include additional counter-party risk (the risk that the counterparty will not fulfill its contractual obligations) and call risk (the risk that the instruments will be called and the proceeds may need to be reinvested). Additionally, an active trading market for such instruments may not exist. To the extent that a structured product provides a put, the Fund may receive a lower interest rate in return for such feature and will be subject to the risk that the put provider will be unable to honor the put feature (purchase the security). Finally, short-term municipal or tax-exempt structured products may present tax issues not presented by investments in other short-term municipal or tax-exempt securities. These issues might be resolved in a manner adverse to the Fund.
Restricted Securities Risk. Restricted securities are securities that cannot be offered for public resale unless registered under the applicable securities laws or that have a contractual restriction that prohibits or limits their resale. Restricted securities include private placement securities that have not been registered under the applicable securities laws, such as Rule 144A securities, and securities of U.S. and non-U.S. issuers that are issued pursuant to Regulation S. Private placements are generally subject to strict restrictions on resale. Restricted securities may not be listed on an exchange and may have no active trading market. Restricted securities may be illiquid. The Fund may be unable to sell a restricted security on short notice or may be able to sell them only at a price below current value. It may be more difficult to determine a market value for a restricted security. Also, the Fund may get only limited information about the issuer of a restricted security, so it may be less able to predict a loss. In addition, if Fund management receives material non-public information about the issuer, the Fund may as a result be unable to sell the securities. Certain restricted securities may involve a high degree of business and financial risk and may result in substantial losses.
Auction Rate Securities Risk. The auction rate municipal securities the Fund will purchase will typically have a long-term nominal maturity for which the interest rate is regularly reset through a “Dutch” auction. The interest rate set by the auction
34 | J.P. Morgan Municipal Bond Funds
is the lowest interest rate that covers all securities offered for sale. While this process is designed to permit auction rate securities to be traded at par value, there is a risk that an auction will fail due to insufficient demand for the securities, which may adversely affect the liquidity and price of auction rate securities. Moreover, between auctions, there may be no secondary market for these securities, and sales conducted on a secondary market may not be on terms favorable to the seller. Thus, with respect to liquidity and price stability, auction rate securities may differ substantially from cash equivalents, notwithstanding the frequency of auctions and the credit quality of the security.
ETF and Other Investment Company Risk. The Fund may invest in shares of other investment companies and ETFs. Shareholders bear both their proportionate share of Fund’s expenses and similar expenses of the underlying investment company or ETF when the Fund invests in shares of another investment company or ETF. The price movement of an ETF or closed end fund designed to track an index may not track the index and may result in a loss. In addition, ETFs and closed-end investment companies may trade at a price above (premium) or below (discount) their net asset value, especially during periods of significant market volatility or stress, causing investors to pay significantly more or less than the value of the ETF’s underlying portfolio. If the Fund invests in closed-end investment companies, it may incur added expenses such as additional management fees and trading costs.
Government Securities Risk. The Fund invests in securities issued or guaranteed by the U.S. government or its agencies or other Government-Sponsored Enterprises (GSEs). U.S. government securities are subject to market risk, interest rate risk and credit risk. Securities, such as those issued or guaranteed by the U.S. Treasury, that are backed by the full faith and credit of the United States are guaranteed only as to the timely payment of interest and principal when held to maturity and the market prices for such securities will fluctuate. Notwithstanding that these securities are backed by the full faith and credit of the United States, circumstances could arise that would prevent the payment of interest or principal. This would result in losses to the Fund. U.S. government securities include zero coupon securities, which tend to be subject to greater market risk than interest-paying securities of similar maturities.
Debt Securities and Other Callable Securities Risk. As part of its main investment strategy, the Fund invests in debt securities. The issuers of these securities and other callable securities may be able to repay principal in advance, especially when interest rates fall. Changes in prepayment rates can affect the return on investment and yield of these securities. When debt obligations are prepaid and when securities are called, the Fund may have to reinvest in securities with a lower yield. The Fund also may fail to recover additional amounts (i.e., premiums) paid for securities with higher interest rates, resulting in an unexpected capital loss.
Inverse Floating Rate Instrument Risk. The market value of an inverse floater can be more volatile than that of a conventional fixed-rate bond having similar credit quality, maturity and redemption provisions. Inverse floaters involve complex transactions and involve risks in addition to risks associated with more conventional municipal obligations. Inverse floaters may be more sensitive to changes in economic or market conditions than other types of investments and could result in losses that significantly exceed the Fund’s original investment. Inverse floaters can create leverage thereby causing the Fund to be more volatile than it would be if it had not used inverse floaters.
Taxability Risk. The Fund’s investments in municipal securities rely on the opinion of the issuer’s bond counsel that the interest paid on those securities will not be subject to federal income tax. Tax opinions are generally provided at the time the municipal security is initially issued. However, after the Fund buys a security, the Internal Revenue Service may determine that a bond issued as tax-exempt should in fact be taxable and the Fund’s dividends with respect to that bond might be subject to federal income tax.
Zero-Coupon Bond Risk. The market value of a zero-coupon bond is generally more volatile than the market value of other fixed income securities with similar maturities that pay interest periodically. In addition, federal income tax law requires that the holder of a zero-coupon bond accrue a portion of the discount at which the bond was purchased as taxable income each year. The Fund may consequently have to dispose of portfolio securities under disadvantageous circumstances to generate cash to satisfy its requirement as a regulated investment company to distribute all of its net income (including non-cash income attributable to zero-coupon securities). These actions may reduce the assets to which the Fund’s expenses could otherwise be allocated and may reduce the Fund’s rate of return.
Transactions Risk. The Fund could experience a loss and its liquidity may be negatively impacted when selling securities to meet redemption requests. The risk of loss increases if the redemption requests are unusually large or frequent or occur in times of overall market turmoil or declining prices. Similarly, large purchases of Fund shares may adversely affect the Fund’s performance to the extent that the Fund is delayed in investing new cash and is required to maintain a larger cash position than it ordinarily would.
Industry and Sector Focus Risk. At times the Fund may increase the relative emphasis of its investments in a particular industry or sector. The prices of securities of issuers in a particular industry or sector may be more susceptible to fluctuations due to changes in economic or business conditions, government regulations, availability of basic resources or supplies, or other events that affect that industry or sector more than securities of issuers in other industries and sectors. To the extent that the
July 1, 2022 | 35
JPMorgan High Yield Municipal Fund (continued)
Fund increases the relative emphasis of its investments in a particular industry or sector, its shares’ values may fluctuate in response to events affecting that industry or sector.
Investments in the Fund are not deposits or obligations of, or guaranteed or endorsed by, any bank and are not insured or guaranteed by the FDIC, the Federal Reserve Board or any other government agency.
You could lose money investing in the Fund.
The Fund’s Past Performance
This section provides some indication of the risks of investing in the Fund. The bar chart shows how the performance of the Fund’s Class I Shares has varied from year to year for the past ten calendar years. The table shows the average annual total returns for the past one year, five years and ten years. The table compares the Fund’s performance to the performance of the Bloomberg US Municipal Index and the Bloomberg High Yield Municipal Bond Index.Past performance (before and after taxes) is not necessarily an indication of how the Fund will perform in the future. Updated performance information is available by visiting www.jpmorganfunds.com or by calling 1-800-480-4111. Effective November 1, 2018, the Fund’s investment strategies changed. The Fund’s past performance would have been different if the Fund were managed using the current strategies.
| YEAR-BY-YEAR RETURNS — CLASS I SHARES |
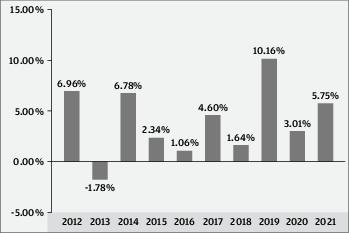
| Best Quarter |
1st quarter, 2019 |
3.81% |
| Worst Quarter |
1st quarter, 2020 |
-6.47% |
| The Fund’s year-to-date total return |
through |
3/31/22 |
was |
-7.16% |
. |
| AVERAGE ANNUAL TOTAL RETURNS (For periods ended December 31, 2021) | |||
| |
Past 1 Year |
Past 5 Years |
Past 10 Years |
| CLASS I SHARES |
|
|
|
| Return Before Taxes |
5.75% |
4.99% |
4.00% |
| Return After Taxes on Distributions |
5.73 |
4.89 |
3.78 |
| Return After Taxes on Distributions and Sale of Fund Shares |
4.63 |
4.47 |
3.56 |
| CLASS A SHARES |
|
|
|
| Return Before Taxes |
1.67 |
4.09 |
3.50 |
| CLASS C SHARES |
|
|
|
| Return Before Taxes |
4.04 |
4.38 |
3.48 |
| BLOOMBERG US MUNICIPAL INDEX (Reflects No Deduction for Fees, Expenses, or Taxes) |
1.52 |
4.17 |
3.72 |
| BLOOMBERG HIGH YIELD MUNICIPAL BOND INDEX (Reflects No Deduction for Fees, Expenses, or Taxes) |
7.77 |
7.53 |
6.72 |
After-tax returns are shown for only the Class I Shares and after-tax returns for the other classes will vary. After-tax returns are calculated using the historical highest individual federal marginal income tax rates and do not reflect the impact of state and local taxes. Actual after-tax returns depend on the investor’s tax situation and may differ from those shown, and the after-tax returns are not relevant to investors who hold their shares through tax-deferred arrangements such as 401(k) plans or individual retirement accounts.
Management
J.P. Morgan Investment Management Inc. (the adviser)
| Portfolio Manager |
Managed the Fund Since |
Primary Title with Investment Adviser |
| Wayne Godlin |
2018 |
Managing Director |
| Richard Taormina |
2007 |
Managing Director |
| Kevin M. Ellis |
2018 |
Managing Director |
Purchase and Sale of Fund Shares
Purchase minimums
| For Class A and Class C Shares | |
| To establish an account |
$1,000 |
| To add to an account |
$50 |
| For Class I Shares | |
| To establish an account |
$1,000,000 |
| To add to an account |
No minimum levels |
36 | J.P. Morgan Municipal Bond Funds
In general, you may purchase or redeem shares on any business day:
•
Through your Financial Intermediary
•
By writing to J.P. Morgan Funds Services, P.O. Box 219143, Kansas City, MO 64121-9143
•
After you open an account, by calling J.P. Morgan Funds Services at 1-800-480-4111
Tax Information
The Fund’s distributions of interest on municipal bonds generally are not subject to federal income tax; however the Fund will distribute taxable dividends, including distributions of short-term gains, and long-term gains. In addition, interest on certain bonds may be subject to the federal alternative minimum tax. To the extent that the Fund’s distributions are derived from
interest on bonds that are not exempt from applicable state and local taxes, such distributions will be subject to such state and local taxes.
Payments to Broker-Dealers and Other Financial Intermediaries
If you purchase shares of the Fund through a broker-dealer or other financial intermediary (such as a bank), the Fund and its related companies may pay the financial intermediary for the sale of Fund shares and related services. These payments may create a conflict of interest by influencing the broker-dealer or financial intermediary and your salesperson to recommend the Fund over another investment. Ask your salesperson or visit your financial intermediary’s website for more information.
July 1, 2022 | 37
JPMorgan Intermediate Tax Free Bond Fund
Class/Ticker: A/JITAX; C/JITCX; I/JITIX
What is the goal of the Fund?
The Fund seeks to provide monthly dividends, which are excluded from gross income, and to protect the value of your investment by investing primarily in municipal obligations. For purposes of the Fund’s investment objective, “gross income” means gross income for federal tax purposes.
Fees and Expenses of the Fund
The following tables describe the fees and expenses that you may pay if you buy, hold and sell shares of the Fund. You may pay other fees, such as brokerage commissions and other fees to financial intermediaries, which are not reflected in the table and examples below. You may qualify for sales charge discounts on purchases of Class A Shares if you and your family invest, or agree to invest in the future, at least $100,000 in the J.P. Morgan Funds. More information about these and other discounts is available from your financial intermediary and in “Investing with J.P. Morgan Funds — SALES CHARGES AND FINANCIAL INTERMEDIARY COMPENSATION” on page 71 and in “Financial Intermediary — Specific Sales Charge Waivers” in Appendix A of the prospectus and in “PURCHASES, REDEMPTIONS AND EXCHANGES” in Appendix A to Part II of the Statement of Additional Information.
| SHAREHOLDER FEES (Fees paid directly from your investment) | |||
| |
Class A |
Class C |
Class I |
| Maximum Sales Charge (Load) Imposed on Purchases as % of the Offering Price |
3.75% |
NONE |
NONE |
| Maximum Deferred Sales Charge (Load) as % of Original Cost of the Shares |
NONE1 |
1.00% |
NONE |
1
For purchases under $250,000.
| ANNUAL FUND OPERATING EXPENSES (Expenses that you pay each year as a percentage of the value of your investment) | |||
| |
Class A |
Class C |
Class I |
| Management Fees |
0.30% |
0.30% |
0.30% |
| Distribution (Rule 12b-1) Fees |
0.25 |
0.75 |
NONE |
| Other Expenses |
0.35 |
0.35 |
0.35 |
| Service Fees |
0.25 |
0.25 |
0.25 |
| Remainder of Other Expenses |
0.10 |
0.10 |
0.10 |
| Total Annual Fund Operating Expenses |
0.90 |
1.40 |
0.65 |
| Fee Waivers and/or Expense Reimbursements1 |
-0.25 |
-0.20 |
-0.25 |
| Total Annual Fund Operating Expenses after Fee Waivers and/or Expense Reimburse- ments1 |
0.65 |
1.20 |
0.40 |
1
The Fund’s adviser and/or its affiliates have contractually agreed to waive fees and/or reimburse expenses to the extent Total Annual Fund Operating Expenses (excluding acquired fund fees and expenses other than certain money market fund fees as described below, dividend and interest expenses related to short sales, interest, taxes, expenses related to litigation and potential litigation, expenses related to trustee elections, and extraordinary expenses) exceed 0.65%, 1.20% and 0.40% of the average daily net assets of Class A, Class C and Class I Shares, respectively. The Fund may invest in one or more money market funds advised by the adviser or its affiliates (affiliated money market funds). The Fund’s adviser, shareholder servicing agent and/or administrator have contractually agreed to waive fees and/or reimburse expenses in an amount sufficient to offset the respective net fees each collects from the affiliated money market funds on the Fund’s investment in such money market funds for all Share Classes . These waivers are in effect through 6/30/23, at which time it will be determined whether such waivers will be renewed or revised. To the extent that the Fund engages in securities lending, affiliated money market fund fees and expenses resulting from the Fund’s investment of cash received from securities lending borrowers are not included in Total Annual Fund Operating Expenses and therefore, the above waivers do not apply to such investments.
Example
This Example is intended to help you compare the cost of investing in the Fund with the cost of investing in other mutual funds. The Example assumes that you invest $10,000 in the Fund for the time periods indicated. The Example also assumes that your investment has a 5% return each year and that the Fund’s operating expenses are equal to the total annual fund operating expenses after fee waivers and expense reimbursements shown in the fee table through 6/30/23 and total annual fund operating expenses thereafter. Your actual costs may be higher or lower.
38 | J.P. Morgan Municipal Bond Funds
| IF YOU SELL YOUR SHARES, YOUR COST WOULD BE: | ||||
| |
1 Year |
3 Years |
5 Years |
10 Years |
| CLASS A SHARES ($) |
439 |
627 |
831 |
1,419 |
| CLASS C SHARES ($) |
222 |
423 |
747 |
1,526 |
| CLASS I SHARES ($) |
41 |
183 |
337 |
787 |
| IF YOU DO NOT SELL YOUR SHARES, YOUR COST WOULD BE: | ||||
| |
1 Year |
3 Years |
5 Years |
10 Years |
| CLASS A SHARES ($) |
439 |
627 |
831 |
1,419 |
| CLASS C SHARES ($) |
122 |
423 |
747 |
1,526 |
| CLASS I SHARES ($) |
41 |
183 |
337 |
787 |
Portfolio Turnover
The Fund pays transaction costs, such as commissions, when it buys and sells securities (or “turns over” its portfolio). A higher portfolio turnover rate may indicate higher transaction costs and may result in higher taxes when Fund shares are held in a taxable account. These costs, which are not reflected in annual fund operating expenses or in the Example, affect the Fund’s performance. During the Fund’s most recent fiscal year, the Fund’s portfolio turnover rate was 12% of the average value of its portfolio.
What are the Fund’s main investment strategies?
As a fundamental policy, the Fund normally invests at least 80% of the value of its Assets in municipal obligations whose interest payments are excluded from gross income for federal income tax purposes and not subject to the federal alternative minimum tax on individuals. “Assets” means net assets, plus the amount of borrowings for investment purposes.
Under normal circumstances, the Fund reserves the right to invest up to 20% of its Assets in securities that pay interest subject to federal income tax or the federal alternative minimum tax on individuals. To defend the value of its assets during unusual market conditions, the Fund may temporarily exceed this limit.
There may be times when there are not enough municipal obligations available to meet the Fund’s needs. On these occasions, the Fund may invest in repurchase agreements or U.S. Treasury securities that may be subject to federal income tax.
The Fund may invest in debt securities issued by governmental entities, certain issuers identified with the U.S. government and private issuers. The Fund may invest in municipal mortgage-backed and asset-backed securities. The Fund may invest a significant portion or all of its assets in municipal mortgage-backed securities at the adviser’s discretion.
The Fund may invest up to 20% of its total assets in securities rated below investment grade. Such securities are known as “junk bonds,” “high yield bonds” and “non-investment grade
bonds.” Junk bonds also include unrated securities that the adviser believes to be of comparable quality to debt securities that are rated below investment grade. These securities generally are rated in the fifth or lower rating categories (for example, BB+ or lower by S&P and Ba1 or lower by Moody’s). These securities generally offer a higher yield than investment grade securities, but involve a high degree of risk. A security’s quality is determined at the time of purchase and securities that are rated investment grade or the unrated equivalent may be downgraded or decline in credit quality, such that, following the time of purchase, they would be deemed to be below investment grade. If the quality of an investment grade security is downgraded subsequent to purchase to below investment grade, the Fund may continue to hold the security.
The Fund may also invest in high-quality, short-term money market instruments and repurchase agreements.
The Fund may also invest in zero-coupon securities and forward commitments.
The average weighted maturity of the Fund’s portfolio will be between three and ten years. Average weighted maturity is the average of all the current maturities (that is, the term of the securities) of the individual bonds in a Fund calculated so as to count most heavily those securities with the highest dollar value. Average weighted maturity is important to investors as an indication of a Fund’s sensitivity to changes in interest rates. Usually, the longer the average weighted maturity, the more fluctuation in share price you can expect.
Investment Process: The adviser buys and sells securities and investments for the Fund based on its view of individual securities and market sectors. Taking a long-term approach, the adviser looks for individual fixed income investments that it believes will perform well over market cycles. The adviser is value oriented and makes decisions to purchase and sell individual securities and instruments after performing a risk/reward analysis that includes an evaluation of interest rate risk, credit risk, duration, liquidity and the complex legal and technical structure of the transaction. As part of its investment process, the adviser seeks to assess the impact of environmental, social and governance factors on certain issuers in the universe in which the Fund may invest. The adviser’s assessment is based on an analysis of key opportunities and risks across sectors to identify financially material issues on the Fund’s investments in municipal issues and ascertain key issues that merit engagement with municipal issuers. These assessments may not be conclusive and securities that may be negatively impacted by such factors may be purchased and retained by the Fund while the Fund may divest or not invest in securities that may be positively impacted by such factors.
The Fund’s Main Investment Risks
The Fund is subject to management risk and may not achieve its objective if the adviser’s expectations regarding particular instruments or markets are not met.
July 1, 2022 | 39
JPMorgan Intermediate Tax Free Bond Fund (continued)
An investment in this Fund or any other fund may not provide a complete investment program. The suitability of an investment in the Fund should be considered based on the investment objective, strategies and risks described in this prospectus, considered in light of all of the other investments in your portfolio, as well as your risk tolerance, financial goals and time horizons. You may want to consult with a financial advisor to determine if this Fund is suitable for you.
The Fund is subject to the main risks noted below, any of which may adversely affect the Fund’s performance and ability to meet its investment objective.
Interest Rate Risk. The Fund mainly invests in bonds and other debt securities. These securities will increase or decrease in value based on changes in interest rates. If rates increase, the value of the Fund’s investments generally declines. Securities with greater interest rate sensitivity and longer maturities generally are subject to greater fluctuations in value. The Fund may face a heightened level of interest rate risk due to certain changes in monetary policy. During periods when interest rates are low or there are negative interest rates, the Fund’s yield (and total return) also may be low or the Fund may be unable to maintain positive returns.
Municipal Obligations Risk. The risk of a municipal obligation generally depends on the financial and credit status of the issuer. Changes in the financial health of a municipal issuer may make it difficult for the issuer to make interest and principal payments when due. This could decrease the Fund’s income or hurt the ability to preserve capital and liquidity.
Under some circumstances, municipal obligations might not pay interest unless the state legislature or municipality authorizes money for that purpose.
Municipal obligations may be more susceptible to downgrades or defaults during recessions or similar periods of economic stress. In addition, since some municipal obligations may be secured or guaranteed by banks and other institutions, the risk to the Fund could increase if the banking or financial sector suffers an economic downturn and/or if the credit ratings of the institutions issuing the guarantee are downgraded or at risk of being downgraded by a national rating organization. Such a downward revision or risk of being downgraded may have an adverse effect on the market prices of the bonds and thus the value of the Fund’s investments.
In addition to being downgraded, an insolvent municipality may file for bankruptcy. The reorganization of a municipality’s debts may significantly affect the rights of creditors and the value of the securities issued by the municipality and the value of the Fund’s investments.
Credit Risk. The Fund’s investments are subject to the risk that issuers and/or counterparties will fail to make payments when due or default completely. If an issuer’s or a counterparty’s financial condition worsens, the credit quality of the issuer or
counterparty may deteriorate. Credit spreads may increase, which may reduce the market values of the Fund’s securities. Credit spread risk is the risk that economic and market conditions or any actual or perceived credit deterioration may lead to an increase in the credit spreads (i.e., the difference in yield between two securities of similar maturity but different credit quality) and a decline in price of the issuer’s securities.
Government Securities Risk. The Fund invests in securities issued or guaranteed by the U.S. government or its agencies and instrumentalities (such as securities issued by the Government National Mortgage Association (Ginnie Mae), the Federal National Mortgage Association (Fannie Mae), or the Federal Home Loan Mortgage Corporation (Freddie Mac)). U.S. government securities are subject to market risk, interest rate risk and credit risk. Securities, such as those issued or guaranteed by Ginnie Mae or the U.S. Treasury, that are backed by the full faith and credit of the United States are guaranteed only as to the timely payment of interest and principal when held to maturity and the market prices for such securities will fluctuate. Notwithstanding that these securities are backed by the full faith and credit of the United States, circumstances could arise that would prevent the payment of interest or principal. This would result in losses to the Fund. Securities issued or guaranteed by U.S. government related organizations, such as Fannie Mae and Freddie Mac, are not backed by the full faith and credit of the U.S. government and no assurance can be given that the U.S. government will provide financial support. Therefore, U.S. government related organizations may not have the funds to meet their payment obligations in the future. U.S. government securities include zero coupon securities, which tend to be subject to greater market risk than interest-paying securities of similar maturities.
High Yield Securities Risk. The Fund may invest in securities and instruments of municipal issuers that are highly leveraged, less creditworthy or financially distressed. These investments (also known as junk bonds) are considered to be speculative and are subject to greater risk of loss, greater sensitivity to economic changes, valuation difficulties, and potential illiquidity.
In recent years, there has been a broad trend of weaker or less restrictive covenant protections in the high yield market. Among other things, under such weaker or less restrictive covenants, borrowers might be able to exercise more flexibility with respect to certain activities than borrowers who are subject to stronger or more protective covenants. For example, borrowers might be able to incur more debt, including secured debt, return more capital to shareholders, remove or reduce assets that are designated as collateral securing high yield securities, increase the claims against assets that are permitted against collateral securing high yield securities or otherwise manage their business in ways that could impact creditors negatively. In addition, certain privately held borrowers might
40 | J.P. Morgan Municipal Bond Funds
be permitted to file less frequent, less detailed or less timely financial reporting or other information, which could negatively impact the value of the high yield securities issued by such borrowers.
Each of these factors might negatively impact the high yield instruments held by the Fund. No active trading market may exist for some instruments and certain investments may be subject to restrictions on resale. The inability to dispose of the Fund’s securities and other investments in a timely fashion could result in losses to the Fund. Because some instruments may have a more limited secondary market, liquidity and valuation risk may be more pronounced for the Fund. When instruments are prepaid, the Fund may have to reinvest in instruments with a lower yield or fail to recover additional amounts (i.e., premiums) paid for these instruments, resulting in an unexpected capital loss and/or a decrease in the amount of dividends and yield.
Alternative Minimum Tax Risk. The Fund may invest in securities, the interest on which may be subject to the federal alternative minimum tax.
Mortgage-Related and Other Asset-Backed Securities Risk. Mortgage-related and asset-backed securities, including certain municipal housing authority obligations, are subject to certain other risks. The value of these securities will be influenced by the factors affecting the housing market and the assets underlying such securities. As a result, during periods of declining asset values, difficult or frozen credit markets, significant changes in interest rates, or deteriorating economic conditions, mortgage-related and asset-backed securities may decline in value, face valuation difficulties, become more volatile and/or become illiquid. These securities are also subject to prepayment and call risk. In periods of declining interest rates, the Fund may be subject to contraction risk which is the risk that borrowers will increase the rate at which they prepay the maturity value of mortgages and other obligations. When mortgages and other obligations are prepaid and when securities are called, the Fund may have to reinvest in securities with a lower yield or fail to recover additional amounts (i.e., premiums) paid for securities with higher interest rates, resulting in an unexpected capital loss and/or a decrease in the amount of dividends and yield. In periods of either rising or declining interest rates, the Fund may be subject to extension risk which is the risk that the expected maturity of an obligation will lengthen in duration due to a decrease in prepayments. As a result, in certain interest rate environments, the Fund may exhibit additional volatility. Additionally, asset-backed, mortgage-related and mortgage-backed securities are subject to risks associated with their structure and the nature of the assets underlying the securities and the servicing of those assets. Certain asset-backed, mortgage-related and mortgage-backed securities may face valuation difficulties and may be less liquid than other types of asset-backed, mortgage-related and mortgage-backed securities, or debt securities.
Debt Securities and Other Callable Securities Risk. As part of its main investment strategy, the Fund invests in debt securities. The issuers of these securities and other callable securities may be able to repay principal in advance, especially when interest rates fall. Changes in prepayment rates can affect the return on investment and yield of these securities. When debt obligations are prepaid and when securities are called, the Fund may have to reinvest in securities with a lower yield. The Fund also may fail to recover additional amounts (i.e., premiums) paid for securities with higher interest rates, resulting in an unexpected capital loss.
Taxability Risk. The Fund’s investments in municipal securities rely on the opinion of the issuer’s bond counsel that the interest paid on those securities will not be subject to federal income tax. Tax opinions are generally provided at the time the municipal security is initially issued. However, after the Fund buys a security, the Internal Revenue Service may determine that a bond issued as tax-exempt should in fact be taxable and the Fund’s dividends with respect to that bond might be subject to federal income tax.
Zero-Coupon Bond Risk. The market value of a zero-coupon bond is generally more volatile than the market value of other fixed income securities with similar maturities that pay interest periodically. In addition, federal income tax law requires that the holder of a zero-coupon bond accrue a portion of the discount at which the bond was purchased as taxable income each year. The Fund may consequently have to dispose of portfolio securities under disadvantageous circumstances to generate cash to satisfy its requirement as a regulated investment company to distribute all of its net income (including non-cash income attributable to zero-coupon securities). These actions may reduce the assets to which the Fund’s expenses could otherwise be allocated and may reduce the Fund’s rate of return.
Transactions Risk. The Fund could experience a loss and its liquidity may be negatively impacted when selling securities to meet redemption requests. The risk of loss increases if the redemption requests are unusually large or frequent or occur in times of overall market turmoil or declining prices. Similarly, large purchases of Fund shares may adversely affect the Fund’s performance to the extent that the Fund is delayed in investing new cash and is required to maintain a larger cash position than it ordinarily would.
General Market Risk. Economies and financial markets throughout the world are becoming increasingly interconnected, which increases the likelihood that events or conditions in one country or region will adversely impact markets or issuers in other countries or regions. Securities in the Fund’s portfolio may underperform in comparison to securities in general financial markets, a particular financial market or other asset classes due to a number of factors, including inflation (or expectations for inflation), deflation (or expectations for deflation), interest rates, global demand for particular products or resources, market instability, debt crises and downgrades,
July 1, 2022 | 41
JPMorgan Intermediate Tax Free Bond Fund (continued)
embargoes, tariffs, sanctions and other trade barriers, regulatory events, other governmental trade or market control programs and related geopolitical events. In addition, the value of the Fund’s investments may be negatively affected by the occurrence of global events such as war, terrorism, environmental disasters, natural disasters or events, country instability, and infectious disease epidemics or pandemics.
For example, the outbreak of COVID-19 has negatively affected economies, markets and individual companies throughout the world, including those in which the Fund invests. The effects of this pandemic to public health and business and market conditions, including, among other things, reduced consumer demand and economic output, supply chain disruptions and increased government spending, may continue to have a significant negative impact on the performance of the Fund’s investments, increase the Fund’s volatility, exacerbate pre-existing political, social and economic risks to the Fund, and negatively impact broad segments of businesses and populations. In addition, governments, their regulatory agencies, or self-regulatory organizations have taken or may take actions in response to the pandemic that affect the instruments in which the Fund invests, or the issuers of such instruments, in ways that could have a significant negative impact on the Fund’s investment performance. The duration and extent of COVID-19 and associated economic and market conditions and uncertainty over the long-term cannot be reasonably estimated at this time. The ultimate impact of COVID-19 and the extent to which the associated conditions impact a Fund will also depend on future developments, which are highly uncertain, difficult to accurately predict and subject to frequent changes.
Industry and Sector Focus Risk. At times the Fund may increase the relative emphasis of its investments in a particular industry or sector. The prices of securities of issuers in a particular industry or sector may be more susceptible to fluctuations due to changes in economic or business conditions, government regulations, availability of basic resources or supplies, or other events that affect that industry or sector more than securities of issuers in other industries and sectors. To the extent that the Fund increases the relative emphasis of its investments in a particular industry or sector, its shares’ values may fluctuate in response to events affecting that industry or sector.
Investments in the Fund are not deposits or obligations of, or guaranteed or endorsed by, any bank and are not insured or guaranteed by the FDIC, the Federal Reserve Board or any other government agency.
You could lose money investing in the Fund.
The Fund’s Past Performance
This section provides some indication of the risks of investing in the Fund. The bar chart shows how the performance of the Fund’s Class I Shares has varied from year to year for the past ten calendar years. The table shows the average annual total
returns over the past one year, five years and ten years. The table compares the Fund’s performance to the performance of the Bloomberg U.S. 1-15 Year Blend (1-17) Municipal Bond Index. Past performance (before and after taxes) is not necessarily an indication of how the Fund will perform in the future. Updated performance information is available by visiting www.jpmorganfunds.com or by calling 1-800-480-4111.
| YEAR-BY-YEAR RETURNS - CLASS I SHARES |
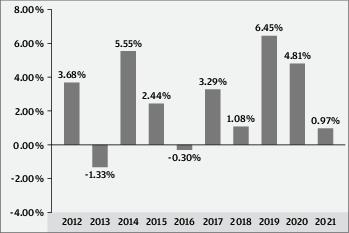
| Best Quarter |
2nd quarter, 2020 |
2.77% |
| Worst Quarter |
4th quarter, 2016 |
-3.11% |
| The Fund’s year-to-date total return |
through |
3/31/22 |
was |
-5.67% |
. |
| AVERAGE ANNUAL TOTAL RETURNS (For periods ended December 31, 2021) | |||
| |
Past 1 Year |
Past 5 Years |
Past 10 Years |
| CLASS I SHARES |
|
|
|
| Return Before Taxes |
0.97% |
3.30% |
2.63% |
| Return After Taxes on Distributions |
0.77 |
3.24 |
2.58 |
| Return After Taxes on Distributions and Sale of Fund Shares |
1.65 |
3.09 |
2.61 |
| CLASS A SHARES |
|
|
|
| Return Before Taxes |
-3.00 |
2.24 |
1.98 |
| CLASS C SHARES |
|
|
|
| Return Before Taxes |
-0.83 |
2.46 |
1.86 |
| BLOOMBERG U.S. 1-15 YEAR BLEND (1-17) MUNICIPAL BOND INDEX (Reflects No Deduction for Fees, Expenses, or Taxes) |
0.86 |
3.57 |
3.05 |
After-tax returns are shown for only the Class I Shares, and after-tax returns for the other classes will vary. After-tax returns are calculated using the historical highest individual federal marginal income tax rates and do not reflect the impact of state and local taxes. Actual after-tax returns depend on the
42 | J.P. Morgan Municipal Bond Funds
investor’s tax situation and may differ from those shown, and the after-tax returns shown are not relevant to investors who hold their shares through tax-deferred arrangements such as 401(k) plans or individual retirement accounts.
Management
J.P. Morgan Investment Management Inc. (the adviser)
| Portfolio Managers |
Managed the Fund Since |
Primary Title with Investment Adviser |
| Richard Taormina |
2006 |
Managing Director |
| David Sivinski |
2005 |
Executive Director |
| Kevin M. Ellis |
2014 |
Managing Director |
Purchase and Sale of Fund Shares
Purchase minimums
| For Class A and Class C Shares | |
| To establish an account |
$1,000 |
| To add to an account |
$50 |
| For Class I Shares | |
| To establish an account |
$1,000,000 |
| To add to an account |
No minimum levels |
In general, you may purchase or redeem shares on any business day:
•
Through your Financial Intermediary
•
By writing to J.P. Morgan Funds Services, P.O. Box 219143, Kansas City, MO 64121-9143
•
After you open an account, by calling J.P. Morgan Funds Services at 1-800-480-4111
Tax Information
The Fund’s distributions of interest on municipal bonds generally are not subject to federal income tax; however the Fund may distribute taxable dividends, including distributions of short-term capital gains, and long-term capital gains. In addition, interest on certain bonds may be subject to the federal alternative minimum tax. To the extent that the Fund’s distributions are derived from interest on bonds that are not exempt from applicable state and local taxes, such distributions will be subject to such state and local taxes. When your investment is in an IRA, 401(k) plan or other tax-advantaged investment plan, you may be subject to federal income tax on ordinary income or capital gains upon withdrawal from the tax-advantaged investment plan.
Payments to Broker-Dealers and Other Financial Intermediaries
If you purchase shares of the Fund through a broker-dealer or other financial intermediary (such as a bank), the Fund and its related companies may pay the financial intermediary for the sale of Fund shares and related services. These payments may create a conflict of interest by influencing the broker-dealer or financial intermediary and your salesperson to recommend the Fund over another investment. Ask your salesperson or visit your financial intermediary’s website for more information.
July 1, 2022 | 43
JPMorgan New York Tax Free Bond Fund
Class/Ticker: A/VANTX; C/JCNTX; I/JNYIX
What is the goal of the Fund?
The Fund seeks to provide monthly dividends that are excluded from gross income for federal income tax purposes and are exempt from New York State and New York City personal income taxes. It also seeks to protect the value of your investment.
Fees and Expenses of the Fund
The following tables describe the fees and expenses that you may pay if you buy, hold and sell shares of the Fund. You may pay other fees, such as brokerage commissions and other fees to financial intermediaries, which are not reflected in the table and examples below. You may qualify for sales charge discounts on purchases of Class A Shares if you and your family invest, or agree to invest in the future, at least $100,000 in the J.P. Morgan Funds. More information about these and other discounts is available from your financial intermediary and in “Investing with J.P. Morgan Funds — SALES CHARGES AND FINANCIAL INTERMEDIARY COMPENSATION” on page 71 and in “Financial Intermediary — Specific Sales Charge Waivers” in Appendix A of the prospectus and in “PURCHASES, REDEMPTIONS AND EXCHANGES” in Appendix A to Part II of the Statement of Additional Information.
| SHAREHOLDER FEES (Fees paid directly from your investment) | |||
| |
Class A |
Class C |
Class I |
| Maximum Sales Charge (Load) Imposed on Purchases as % of the Offering Price |
3.75% |
NONE |
NONE |
| Maximum Deferred Sales Charge (Load) as % of Original Cost of the Shares |
NONE1 |
1.00% |
NONE |
1
For purchases under $250,000.
| ANNUAL FUND OPERATING EXPENSES (Expenses that you pay each year as a percentage of the value of your investment) | |||
| |
Class A |
Class C |
Class I |
| Management Fees |
0.30% |
0.30% |
0.30% |
| Distribution (Rule 12b-1) Fees |
0.25 |
0.75 |
NONE |
| Other Expenses |
0.39 |
0.39 |
0.39 |
| Service Fees |
0.25 |
0.25 |
0.25 |
| Remainder of Other Expenses |
0.14 |
0.14 |
0.14 |
| Total Annual Fund Operating Expenses |
0.94 |
1.44 |
0.69 |
| Fee Waivers and/or Expense Reimbursements1 |
-0.19 |
-0.19 |
-0.19 |
| Total Annual Fund Operating Expenses after Fee Waivers and/or Expense Reimburse- ments1 |
0.75 |
1.25 |
0.50 |
1
The Fund’s adviser and/or its affiliates have contractually agreed to waive fees and/or reimburse expenses to the extent Total Annual Fund Operating Expenses (excluding acquired fund fees and expenses other than certain money market fund fees as described below, dividend and interest expenses related to short sales, interest, taxes, expenses related to litigation and potential litigation, expenses related to trustee elections, and extraordinary expenses) exceed 0.75%, 1.25% and 0.50% of the average daily net assets of Class A, Class C and Class I Shares, respectively. The Fund may invest in one or more money market funds advised by the adviser or its affiliates (affiliated money market funds). The Fund’s adviser, shareholder servicing agent and/or administrator have contractually agreed to waive fees and/or reimburse expenses in an amount sufficient to offset the respective net fees each collects from the affiliated money market funds on the Fund’s investment in such money market funds for all Share Classes . These waivers are in effect through 6/30/23, at which time it will be determined whether such waivers will be renewed or revised. To the extent that the Fund engages in securities lending, affiliated money market fund fees and expenses resulting from the Fund’s investment of cash received from securities lending borrowers are not included in Total Annual Fund Operating Expenses and therefore, the above waivers do not apply to such investments.
Example
This Example is intended to help you compare the cost of investing in the Fund with the cost of investing in other mutual funds. The Example assumes that you invest $10,000 in the Fund for the time periods indicated. The Example also assumes that your investment has a 5% return each year and that the Fund’s operating expenses are equal to the total annual fund operating expenses after fee waivers and expense reimbursements shown in the fee table through 6/30/23 and total annual fund operating expenses thereafter. Your actual costs may be higher or lower.
44 | J.P. Morgan Municipal Bond Funds
| IF YOU SELL YOUR SHARES, YOUR COST WOULD BE: | ||||
| |
1 Year |
3 Years |
5 Years |
10 Years |
| CLASS A SHARES ($) |
449 |
645 |
858 |
1,470 |
| CLASS C SHARES ($) |
227 |
437 |
769 |
1,572 |
| CLASS I SHARES ($) |
51 |
202 |
365 |
841 |
| IF YOU DO NOT SELL YOUR SHARES, YOUR COST WOULD BE: | ||||
| |
1 Year |
3 Years |
5 Years |
10 Years |
| CLASS A SHARES ($) |
449 |
645 |
858 |
1,470 |
| CLASS C SHARES ($) |
127 |
437 |
769 |
1,572 |
| CLASS I SHARES ($) |
51 |
202 |
365 |
841 |
Portfolio Turnover
The Fund pays transaction costs, such as commissions, when it buys and sells securities (or “turns over” its portfolio). A higher portfolio turnover rate may indicate higher transaction costs and may result in higher taxes when Fund shares are held in a taxable account. These costs, which are not reflected in annual fund operating expenses or in the Example, affect the Fund’s performance. During the Fund’s most recent fiscal year, the Fund’s portfolio turnover rate was 10% of the average value of its portfolio.
What are the Fund’s main investment strategies?
As a fundamental policy, the Fund normally invests at least 80% of the value of its Assets in municipal obligations whose interest payments are excluded from gross income for federal income tax purposes and exempt from New York State and New York City personal income taxes, and not subject to the federal alternative minimum tax on individuals. “Assets” means net assets, plus the amount of borrowings for investment purposes.
The Fund may invest in municipal obligations issued by the State of New York, New York City, their political subdivisions, as well as Puerto Rico, other U.S. territories and their political subdivisions.
Under normal circumstances, the Fund reserves the right to invest up to 20% of its Assets in securities that pay interest subject to federal income tax, the federal alternative minimum tax on individuals or New York State and New York City personal income taxes. To defend the value of its assets during unusual market conditions, the Fund may temporarily exceed this limit.
There may be times when there are not enough municipal obligations available to meet the Fund’s needs. On these occasions, the Fund may invest in repurchase agreements or U.S. Treasury securities that may be subject to federal income tax.
The Fund may invest in debt securities issued by governmental entities, certain issuers identified with the U.S. government and private issuers. The Fund may invest in municipal mortgage-
backed and asset-backed securities. The Fund may invest a significant portion or all of its assets in municipal mortgage-backed securities at the adviser’s discretion.
The Fund may invest up to 20% of its total assets in securities rated below investment grade. Such securities are known as “junk bonds,” “high yield bonds” and “non-investment grade bonds.” Junk bonds also include unrated securities that the adviser believes to be of comparable quality to debt securities that are rated below investment grade. These securities generally are rated in the fifth or lower rating categories (for example, BB+ or lower by S&P and Ba1 or lower by Moody’s). These securities generally offer a higher yield than investment grade securities, but involve a high degree of risk. A security’s quality is determined at the time of purchase and securities that are rated investment grade or the unrated equivalent may be downgraded or decline in credit quality, such that, following the time of purchase, they would be deemed to be below investment grade. If the quality of an investment grade security is downgraded subsequent to purchase to below investment grade, the Fund may continue to hold the security.
The Fund may also invest in high-quality, short-term money market instruments and repurchase agreements.
The Fund may also invest in zero-coupon securities and forward commitments.
The average weighted maturity of the Fund’s portfolio will be between three and twelve years. Average weighted maturity is the average of all the current maturities (that is, the term of the securities) of the individual bonds in a Fund calculated so as to count most heavily those securities with the highest dollar value. Average weighted maturity is important to investors as an indication of a Fund’s sensitivity to changes in interest rates. Usually, the longer the average weighted maturity, the more fluctuation in share price you can expect.
Investment Process: The adviser buys and sells securities and investments for the Fund based on its view of individual securities and market sectors. Taking a long-term approach, the adviser looks for individual fixed income investments that it believes will perform well over market cycles. The adviser is value oriented and makes decisions to purchase and sell individual securities and instruments after performing a risk/reward analysis that includes an evaluation of interest rate risk, credit risk, duration, liquidity and the complex legal and technical structure of the transaction. As part of its investment process, the adviser seeks to assess the impact of environmental, social and governance factors on certain issuers in the universe in which the Fund may invest. The adviser’s assessment is based on an analysis of key opportunities and risks across sectors to identify financially material issues on the Fund’s investments in municipal issues and ascertain key issues that merit engagement with municipal issuers. These assessments may not be conclusive and securities that may be negatively impacted by such factors may be purchased and retained by the Fund while the Fund may divest or not invest in securities that may be positively impacted by such factors.
July 1, 2022 | 45
JPMorgan New York Tax Free Bond Fund (continued)
The Fund’s Main Investment Risks
The Fund is subject to management risk and may not achieve its objective if the adviser’s expectations regarding particular instruments or markets are not met.
An investment in this Fund or any other fund may not provide a complete investment program. The suitability of an investment in the Fund should be considered based on the investment objective, strategies and risks described in this prospectus, considered in light of all of the other investments in your portfolio, as well as your risk tolerance, financial goals and time horizons. You may want to consult with a financial advisor to determine if this Fund is suitable for you.
The Fund is subject to the main risks noted below, any of which may adversely affect the Fund’s performance and ability to meet its investment objective.
Interest Rate Risk. The Fund mainly invests in bonds and other debt securities. These securities will increase or decrease in value based on changes in interest rates. If rates increase, the value of the Fund’s investments generally declines. Securities with greater interest rate sensitivity and longer maturities generally are subject to greater fluctuations in value. The Fund may face a heightened level of interest rate risk due to certain changes in monetary policy. During periods when interest rates are low or there are negative interest rates, the Fund’s yield (and total return) also may be low or the Fund may be unable to maintain positive returns.
New York Geographic Concentration Risk. Because the Fund invests primarily in municipal obligations issued by the State of New York and New York City, their political subdivisions, authorities, and agencies, its performance will be affected by the fiscal and economic health of that state, the city and their political subdivisions. As the nation’s financial capital, New York’s and New York City’s economy is heavily dependent on the financial sector, and may be sensitive to economic problems affecting the sector.
Municipal Obligations Risk. The risk of a municipal obligation generally depends on the financial and credit status of the issuer. Changes in the financial health of a municipal issuer may make it difficult for the issuer to make interest and principal payments when due. This could decrease the Fund’s income or hurt the ability to preserve capital and liquidity.
Under some circumstances, municipal obligations might not pay interest unless the state legislature or municipality authorizes money for that purpose.
Municipal obligations may be more susceptible to downgrades or defaults during recessions or similar periods of economic stress. In addition, since some municipal obligations may be secured or guaranteed by banks and other institutions, the risk to the Fund could increase if the banking or financial sector suffers an economic downturn and/or if the credit ratings of the institutions issuing the guarantee are downgraded or at risk of
being downgraded by a national rating organization. Such a downward revision or risk of being downgraded may have an adverse effect on the market prices of the bonds and thus the value of the Fund’s investments.
In addition to being downgraded, an insolvent municipality may file for bankruptcy. The reorganization of a municipality’s debts may significantly affect the rights of creditors and the value of the securities issued by the municipality and the value of the Fund’s investments.
Credit Risk. The Fund’s investments are subject to the risk that issuers and/or counterparties will fail to make payments when due or default completely. If an issuer’s or a counterparty’s financial condition worsens, the credit quality of the issuer or counterparty may deteriorate. Credit spreads may increase, which may reduce the market values of the Fund’s securities. Credit spread risk is the risk that economic and market conditions or any actual or perceived credit deterioration may lead to an increase in the credit spreads (i.e., the difference in yield between two securities of similar maturity but different credit quality) and a decline in price of the issuer’s securities.
Government Securities Risk. The Fund invests in securities issued or guaranteed by the U.S. government or its agencies and instrumentalities (such as securities issued by the Government National Mortgage Association (Ginnie Mae), the Federal National Mortgage Association (Fannie Mae), or the Federal Home Loan Mortgage Corporation (Freddie Mac)).
U.S. government securities are subject to market risk, interest rate risk and credit risk. Securities, such as those issued or guaranteed by Ginnie Mae or the U.S. Treasury, that are backed by the full faith and credit of the United States are guaranteed only as to the timely payment of interest and principal when held to maturity and the market prices for such securities will fluctuate. Notwithstanding that these securities are backed by the full faith and credit of the United States, circumstances could arise that would prevent the payment of interest or principal. This would result in losses to the Fund. Securities issued or guaranteed by U.S. government related organizations, such as Fannie Mae and Freddie Mac, are not backed by the full faith and credit of the U.S. government and no assurance can be given that the U.S. government will provide financial support. Therefore, U.S. government related organizations may not have the funds to meet their payment obligations in the future. U.S. government securities include zero coupon securities, which tend to be subject to greater market risk than interest-paying securities of similar maturities.
Alternative Minimum Tax Risk. The Fund may invest in securities, the interest on which may be subject to the federal alternative minimum tax.
High Yield Securities Risk. The Fund may invest in securities and instruments of municipal issuers that are highly leveraged, less creditworthy or financially distressed. These investments (also
46 | J.P. Morgan Municipal Bond Funds
known as junk bonds) are considered to be speculative and are subject to greater risk of loss, greater sensitivity to economic changes, valuation difficulties and potential illiquidity.
In recent years, there has been a broad trend of weaker or less restrictive covenant protections in the high yield market. Among other things, under such weaker or less restrictive covenants, borrowers might be able to exercise more flexibility with respect to certain activities than borrowers who are subject to stronger or more protective covenants. For example, borrowers might be able to incur more debt, including secured debt, return more capital to shareholders, remove or reduce assets that are designated as collateral securing high yield securities, increase the claims against assets that are permitted against collateral securing high yield securities or otherwise manage their business in ways that could impact creditors negatively. In addition, certain privately held borrowers might be permitted to file less frequent, less detailed or less timely financial reporting or other information, which could negatively impact the value of the high yield securities issued by such borrowers.
Each of these factors might negatively impact the high yield instruments held by the Fund. No active trading market may exist for some instruments and certain investments may be subject to restrictions on resale. The inability to dispose of the Fund’s securities and other investments in a timely fashion could result in losses to the Fund. Because some instruments may have a more limited secondary market, liquidity and valuation risk may be more pronounced for the Fund. When instruments are prepaid, the Fund may have to reinvest in instruments with a lower yield or fail to recover additional amounts (i.e., premiums) paid for these instruments, resulting in an unexpected capital loss and/or a decrease in the amount of dividends and yield.
Mortgage-Related and Other Asset-Backed Securities Risk. Mortgage-related and asset-backed securities, including certain municipal housing authority obligations, are subject to certain other risks. The value of these securities will be influenced by the factors affecting the housing market and the assets underlying such securities. As a result, during periods of declining asset values, difficult or frozen credit markets, significant changes in interest rates, or deteriorating economic conditions, mortgage-related and asset-backed securities may decline in value, face valuation difficulties, become more volatile and/or become illiquid. These securities are also subject to prepayment and call risk. In periods of declining interest rates, the Fund may be subject to contraction risk which is the risk that borrowers will increase the rate at which they prepay the maturity value of mortgages and other obligations. When mortgages and other obligations are prepaid and when securities are called, the Fund may have to reinvest in securities with a lower yield or fail to recover additional amounts (i.e., premiums) paid for securities with higher interest rates, resulting in an unexpected capital loss and/or a decrease in the amount of dividends and yield. In periods of either rising or declining interest rates, the
Fund may be subject to extension risk which is the risk that the expected maturity of an obligation will lengthen in duration due to a decrease in prepayments. As a result, in certain interest rate environments, the Fund may exhibit additional volatility. Additionally, asset-backed, mortgage-related and mortgage-backed securities are subject to risks associated with their structure and the nature of the assets underlying the securities and the servicing of those assets. Certain asset-backed, mortgage-related and mortgage-backed securities may face valuation difficulties and may be less liquid than other types of asset-backed, mortgage-related and mortgage-backed securities, or debt securities.
Debt Securities and Other Callable Securities Risk. As part of its main investment strategy, the Fund invests in debt securities. The issuers of these securities and other callable securities may be able to repay principal in advance, especially when interest rates fall. Changes in prepayment rates can affect the return on investment and yield of these securities. When debt obligations are prepaid and when securities are called, the Fund may have to reinvest in securities with a lower yield. The Fund also may fail to recover additional amounts (i.e., premiums) paid for securities with higher interest rates, resulting in an unexpected capital loss.
Taxability Risk. The Fund’s investments in municipal securities rely on the opinion of the issuer’s bond counsel that the interest paid on those securities will not be subject to federal income tax. Tax opinions are generally provided at the time the municipal security is initially issued. However, after the Fund buys a security, the Internal Revenue Service may determine that a bond issued as tax-exempt should in fact be taxable and the Fund’s dividends with respect to that bond might be subject to federal income tax.
Zero-Coupon Bond Risk. The market value of a zero-coupon bond is generally more volatile than the market value of other fixed income securities with similar maturities that pay interest periodically. In addition, federal income tax law requires that the holder of a zero-coupon bond accrue a portion of the discount at which the bond was purchased as taxable income each year. The Fund may consequently have to dispose of portfolio securities under disadvantageous circumstances to generate cash to satisfy its requirement as a regulated investment company to distribute all of its net income (including non-cash income attributable to zero-coupon securities). These actions may reduce the assets to which the Fund’s expenses could otherwise be allocated and may reduce the Fund’s rate of return.
Transactions Risk. The Fund could experience a loss and its liquidity may be negatively impacted when selling securities to meet redemption requests. The risk of loss increases if the redemption requests are unusually large or frequent or occur in times of overall market turmoil or declining prices. Similarly, large purchases of Fund shares may adversely affect the Fund’s
July 1, 2022 | 47
JPMorgan New York Tax Free Bond Fund (continued)
performance to the extent that the Fund is delayed in investing new cash and is required to maintain a larger cash position than it ordinarily would.
General Market Risk. Economies and financial markets throughout the world are becoming increasingly interconnected, which increases the likelihood that events or conditions in one country or region will adversely impact markets or issuers in other countries or regions. Securities in the Fund’s portfolio may underperform in comparison to securities in general financial markets, a particular financial market or other asset classes due to a number of factors, including inflation (or expectations for inflation), deflation (or expectations for deflation), interest rates, global demand for particular products or resources, market instability, debt crises and downgrades, embargoes, tariffs, sanctions and other trade barriers, regulatory events, other governmental trade or market control programs and related geopolitical events. In addition, the value of the Fund’s investments may be negatively affected by the occurrence of global events such as war, terrorism, environmental disasters, natural disasters or events, country instability, and infectious disease epidemics or pandemics.
For example, the outbreak of COVID-19 has negatively affected economies, markets and individual companies throughout the world, including those in which the Fund invests. The effects of this pandemic to public health and business and market conditions, including, among other things, reduced consumer demand and economic output, supply chain disruptions and increased government spending, may continue to have a significant negative impact on the performance of the Fund’s investments, increase the Fund’s volatility, exacerbate pre-existing political, social and economic risks to the Fund, and negatively impact broad segments of businesses and populations. In addition, governments, their regulatory agencies, or self-regulatory organizations have taken or may take actions in response to the pandemic that affect the instruments in which the Fund invests, or the issuers of such instruments, in ways that could have a significant negative impact on the Fund’s investment performance. The duration and extent of COVID-19 and associated economic and market conditions and uncertainty over the long-term cannot be reasonably estimated at this time. The ultimate impact of COVID-19 and the extent to which the associated conditions impact a Fund will also depend on future developments, which are highly uncertain, difficult to accurately predict and subject to frequent changes.
Industry and Sector Focus Risk. At times the Fund may increase the relative emphasis of its investments in a particular industry or sector. The prices of securities of issuers in a particular industry or sector may be more susceptible to fluctuations due to changes in economic or business conditions, government regulations, availability of basic resources or supplies, or other events that affect that industry or sector more than securities of issuers in other industries and sectors. To the extent that the
Fund increases the relative emphasis of its investments in a particular industry or sector, its shares’ values may fluctuate in response to events affecting that industry or sector.
Investments in the Fund are not deposits or obligations of, or guaranteed or endorsed by, any bank and are not insured or guaranteed by the FDIC, the Federal Reserve Board or any other government agency.
You could lose money investing in the Fund.
The Fund’s Past Performance
This section provides some indication of the risks of investing in the Fund. The bar chart shows how the performance of the Fund’s Class I Shares has varied from year to year for the past ten calendar years. The table shows the average annual total returns over the past one year, five years and ten years. The table compares the Fund’s performance to the performance of the Bloomberg New York Intermediate (1–17 Year) Maturities Index. Past performance (before and after taxes) is not necessarily an indication of how the Fund will perform in the future. Updated performance information is available by visiting www.jpmorganfunds.com or by calling 1-800-480-4111.
| YEAR-BY-YEAR RETURNS - CLASS I SHARES |
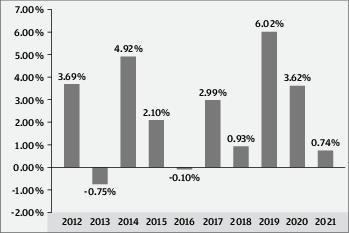
| Best Quarter |
1st quarter, 2019 |
2.46% |
| Worst Quarter |
4th quarter, 2016 |
-2.73% |
| The Fund’s year-to-date total return |
through |
3/31/22 |
was |
-5.27% |
. |
48 | J.P. Morgan Municipal Bond Funds
| AVERAGE ANNUAL TOTAL RETURNS (For periods ended December 31, 2021) | |||
| |
Past 1 Year |
Past 5 Years |
Past 10 Years |
| CLASS I SHARES |
|
|
|
| Return Before Taxes |
0.74% |
2.84% |
2.40% |
| Return After Taxes on Distributions |
0.73 |
2.84 |
2.32 |
| Return After Taxes on Distributions and Sale of Fund Shares |
1.19 |
2.76 |
2.47 |
| CLASS A SHARES |
|
|
|
| Return Before Taxes |
-3.23 |
1.78 |
1.76 |
| CLASS C SHARES |
|
|
|
| Return Before Taxes |
-1.01 |
2.08 |
1.65 |
| BLOOMBERG NEW YORK INTERMEDI- ATE (1-17 YEAR) MATURITIES INDEX (Reflects No Deduction for Fees, Expenses, or Taxes) |
1.17 |
3.32 |
2.90 |
After-tax returns are shown for only the Class I Shares, and after-tax returns for the other classes will vary. After-tax returns are calculated using the historical highest individual federal marginal income tax rates and do not reflect the impact of state and local taxes. Actual after-tax returns depend on the investor’s tax situation and may differ from those shown, and the after-tax returns shown are not relevant to investors who hold their shares through tax-deferred arrangements such as 401(k) plans or individual retirement accounts.
Management
J.P. Morgan Investment Management Inc. (the adviser)
| Portfolio Manager |
Managed the Fund Since |
Primary Title with Investment Adviser |
| David Sivinski |
2005 |
Executive Director |
| Kevin M. Ellis |
2005 |
Managing Director |
Purchase and Sale of Fund Shares
Purchase minimums
| For Class A and Class C Shares | |
| To establish an account |
$1,000 |
| To add to an account |
$50 |
| For Class I Shares | |
| To establish an account |
$1,000,000 |
| To add to an account |
No minimum levels |
In general, you may purchase or redeem shares on any business day:
•
Through your Financial Intermediary
•
By writing to J.P. Morgan Funds Services, P.O. Box 219143, Kansas City, MO 64121-9143
•
After you open an account, by calling J.P. Morgan Funds Services at 1-800-480-4111
Tax Information
The Fund’s distributions of interest on municipal bonds generally are not subject to federal income tax; however the Fund may distribute taxable dividends, including distributions of short-term capital gains, and long-term capital gains. In addition, interest on certain bonds may be subject to the federal alternative minimum tax. To the extent that the Fund’s distributions are derived from interest on bonds that are not exempt from applicable state and local taxes, such distributions will be subject to such state and local taxes. When your investment is in an IRA, 401(k) plan or other tax-advantaged investment plan, you may be subject to federal income tax on ordinary income or capital gains upon withdrawal from the tax-advantaged investment plan.
Payments to Broker-Dealers and Other Financial Intermediaries
If you purchase shares of the Fund through a broker-dealer or other financial intermediary (such as a bank), the Fund and its related companies may pay the financial intermediary for the sale of Fund shares and related services. These payments may create a conflict of interest by influencing the broker-dealer or financial intermediary and your salesperson to recommend the Fund over another investment. Ask your salesperson or visit your financial intermediary’s website for more information.
July 1, 2022 | 49
More About the Funds
Additional Information About the Funds’ Investment Strategies
The Funds are managed by J.P. Morgan Investment Management Inc. (JPMIM). The principal types of securities and the main strategies that each Fund currently anticipates using are summarized in its Risk/Return Summary. Additional information about some of each Fund’s main investment strategies are included below. Except as otherwise indicated, the strategies described below are principal investment strategies of a Fund. Where applicable, the following also identifies other strategies that are not anticipated to be main strategies of a Fund but that may become more important to a Fund’s management in the future.
Each Fund may also use other non-principal strategies that are not described herein but which are described in the Statement of Additional Information. Each Fund may utilize these investments and strategies to a greater or lesser degree in the future.
The frequency with which each Fund buys and sells securities will vary from year to year, depending on market conditions.
Each of the Funds
Each Fund’s Board of Trustees may change any of the investment policies (including its investment objective), other than such policies that are designated as fundamental, without shareholder approval.
Credit Quality: Certain Funds may invest all, or are required to invest a certain percentage, of their investments in investment grade securities or the unrated equivalent. Each of the Funds may invest at least a portion of their investments in below investment grade securities, while the High Yield Municipal Fund may invest all of its assets in below investment grade securities. Below investment grade securities are also called “high yield bonds”, “junk bonds” and “non-investment grade bonds.” These securities generally are rated in the fifth or lower rating categories (for example, the equivalent of BB+ or lower). These securities generally offer a higher yield than investment grade securities, but involve a higher degree of risk.
A security’s quality is determined at the time of purchase and securities that are rated investment grade or the unrated equivalent may be downgraded or decline in credit quality such that subsequently they would be deemed to be below investment grade. The adviser will consider such an event in determining whether a Fund should continue to hold the security and is not required to sell a security in the event of a downgrade. The Funds use the methodology described below to determine the credit quality of their investments.
For each Fund, investment grade securities are securities that have been determined to be investment grade (for example, the equivalent of BBB- or higher) based on ratings by the following NRSROs - Moody’s Investors Service Inc. (Moody’s), Standard & Poor’s Corporation (S&P) or Fitch Ratings (Fitch) and the following methodology. If all three of these NRSROs rate the security, the middle rating is used to determine whether the security is investment grade. If only two of the three NRSROs rate the security, the lower rating is used to determine whether the security is investment grade. If only one of the three NRSROs rates a security, that rating will be used to determine if the security is investment grade. If none of these NRSROs rate a security, the adviser must determine that it is of comparable quality to an investment grade security or a non-investment grade security, respectively, in order for such security to be treated as an investment grade or a non-investment grade security, respectively.
| FUNDAMENTAL INVESTMENT OBJECTIVES |
| An investment objective is fundamental if it cannot be changed without the consent of a majority of the outstanding shares of the Fund. The investment objectives for the Short-Intermediate Municipal Bond Fund, Sustainable Municipal Income Fund and Tax Free Bond Fund are fundamental. The investment objectives for the remaining Funds are non-fundamental and can be changed without the consent of a majority of the outstanding shares of that Fund. |
SUSTAINABLE MUNICIPAL INCOME FUND, SHORT-INTERMEDIATE MUNICIPAL BOND FUND, ULTRA-SHORT MUNICIPAL FUND, INTERMEDIATE TAX FREE BOND FUND AND NEW YORK TAX FREE BOND FUND
Average Weighted Maturity. These Funds have average weighted maturity requirements. Average weighted maturity is the average of all the current maturities (that is, the term of the securities) of the individual bonds in a Fund calculated so as to count most heavily those securities with the highest dollar value. Average weighted maturity is important to investors as an indication of a Fund’s sensitivity to changes in interest rates. Usually, the longer the average weighted maturity, the more fluctuation in share price you can expect. The terms “Intermediate,” “Short-Intermediate” or “Ultra-Short” in a Fund’s name refer to the average maturity the Fund maintains. Mortgage-related securities are subject to prepayment of principal, which can shorten the average weighted maturity of the Fund’s portfolio. Therefore, in the case of a Fund holding mortgage-backed securities, asset-backed securities and similar types of securities, the average weighted maturity is equivalent to its weighted average life. Weighted average life is the average weighted maturity of the cash flows in the securities held by the Fund given certain prepayment assumptions.
50 | J.P. Morgan Municipal Bond Funds
SHORT-INTERMEDIATE MUNICIPAL BOND FUND AND TAX FREE BOND FUND
The Funds may invest up to 20% of their assets in cash and cash equivalents. See Temporary Defensive and Cash Positions.
HIGH YIELD MUNICIPAL FUND
All of the Fund’s assets may be invested in municipal bonds, the interest on which may be subject to the federal alternative minimum tax for both individuals and corporations. Shareholders who are subject to the federal alternative minimum tax may have all or a portion of their income from the Fund subject to federal income tax. In addition, corporate shareholders may be required to take the interest on municipal bonds into account in determining their alternative minimum taxable income. Any capital gain distributed by the Fund generally will be taxable.
The Fund may invest in inverse floaters. An inverse floater is a derivative instrument, typically created by a trust that divides a municipal security into two securities, a short-term tax-exempt floating rate security (sometimes referred to as a “tender option bond”) and a long-term tax-exempt floating rate security (referred to as a “residual certificate” or “inverse floater”) that pays interest at rates that move in the opposite direction of the yield on the short-term floating rate security. The purchaser of a “tender option bond” has the right to tender the security periodically for repayment of the principal value. As short-term interest rates rise, inverse floaters produce less current income (and, in extreme cases, may pay no income) and as short-term interest rates fall, inverse floaters produce more current income.
To facilitate the creation of inverse floaters, the Fund may purchase a fixed-rate municipal security and subsequently transfer it to a broker-dealer (the sponsor), which deposits the municipal security in a trust. The trust issues the residual certificates and short-term floating rate securities. The trust documents enable the Fund to withdraw the underlying bond to unwind or “collapse” the trust (upon tendering the residual certificate and paying the value of the short-term bonds and certain other costs). The Fund may also purchase inverse floaters created by municipal issuers directly or by other parties that have deposited municipal bonds into a sponsored trust.
Additional Investment Strategies
Each of the Funds
Each Fund has flexibility to invest in derivatives and may use such instruments to manage duration, sector and yield curve exposure, credit and spread volatility and to respond to volatile market conditions. Derivatives, which are instruments that have a value based on another instrument, exchange rate or index, may also be used as substitutes for securities in which each Fund can invest. Although the use of derivatives is not a main strategy of each Fund, each Fund may use futures contracts, options and swaps in connection with its principal strategies in order to hedge various investments, for risk management purposes and/or to increase the Fund’s income or gain to the Fund.
Each Fund may invest in shares of exchange-traded funds (ETFs), affiliated money market funds and other investment companies. ETFs, which are pooled investment vehicles whose ownership interests are purchased and sold on a securities exchange, may be passively or actively managed. Passively managed ETFs generally seek to track the performance of a particular market index, including broad-based market indexes, as well as indexes relating to particular sectors, markets, regions or industries. Actively managed ETFs do not seek to track the performance of a particular market index. Ordinarily, a Fund must limit its investments in a single non-affiliated ETF to 5% of its total assets and in all non-affiliated ETFs to 10% of its total assets. The Securities and Exchange Commission has issued exemptive orders to many ETFs that currently allow any fund investing in such ETFs to disregard these 5% and 10% limitations, subject to certain conditions. If a Fund invests in ETFs that have received such exemptive orders, it may invest any amount of its total assets in a single ETF or in multiple ETFs. ETFs that are not structured as investment companies as defined in the Investment Company Act of 1940 are not subject to these percentage limitations. The price movement of an index-based ETF may not track the underlying index and may result in a loss. In addition, ETFs may trade at a price above (premium) or below (discount) their net asset value, especially during periods of significant market volatility or stress, causing investors to pay or receive significantly more or less than the value of the ETF’s underlying portfolio when they purchase or sell their ETF shares, respectively.
Short-Intermediate Municipal Bond Fund
The adviser buys and sells securities and investments for the Fund based on its view of individual securities and market sectors. Taking a long-term approach, the adviser looks for individual fixed income investments that it believes will perform well over market cycles. The adviser is value oriented and makes decisions to purchase and sell individual securities and instruments after performing a risk/reward analysis that includes an evaluation of interest rate risk, credit risk, duration, liquidity and the complex legal and technical structure of the transaction. The adviser also integrates financially material environmental, social and governance (“ESG”) factors as part of the Fund’s investment process (“ESG Integration”). ESG Integration is the systematic inclusion of ESG issues in
July 1, 2022 | 51
More About the Funds (continued)
investment analysis and investment decisions. In applying ESG Integration in the evaluation of individual municipal issuers, the adviser seeks to assess the impact of environmental, social and governance factors on certain issuers in the universe in which the Fund may invest. The adviser’s assessment is based on an analysis of key opportunities and risks across sectors to identify financially material issues on the Fund’s investments in municipal issues and ascertain key issues that merit engagement with municipal issuers. These assessments may not be conclusive and securities that may be negatively impacted by such factors may be purchased and retained by the Fund while the Fund may divest or not invest in securities that may be positively impacted by such factors.
Tax Free Bond Fund
The adviser buys and sells securities and investments for the Fund based on its view of individual securities and market sectors. Taking a long-term approach, the adviser looks for individual fixed income investments that it believes will perform well over market cycles. The adviser is value oriented and makes decisions to purchase and sell individual securities and instruments after performing a risk/reward analysis that includes an evaluation of interest rate risk, credit risk, duration, liquidity and the complex legal and technical structure of the transaction. The adviser also integrates financially material environmental, social and governance (“ESG”) factors as part of the Fund’s investment process (“ESG Integration”). ESG Integration is the systematic inclusion of ESG issues in investment analysis and investment decisions. In applying ESG Integration in the evaluation of individual municipal issuers, the adviser seeks to assess the impact of environmental, social and governance factors on certain issuers in the universe in which the Fund may invest. The adviser’s assessment is based on an analysis of key opportunities and risks across sectors to identify financially material issues on the Fund’s investments in municipal issues and ascertain key issues that merit engagement with municipal issuers. These assessments may not be conclusive and securities that may be negatively impacted by such factors may be purchased and retained by the Fund while the Fund may divest or not invest in securities that may be positively impacted by such factors.
Ultra-Short Municipal Fund
The adviser buys and sells securities and investments for the Fund based on its view of individual securities and market sectors. The adviser looks for individual fixed income investments that it believes will perform well over market cycles. The adviser is value oriented and makes decisions to purchase and sell individual securities and instruments after performing a risk/reward analysis that includes an evaluation of interest rate risk, credit risk, duration, liquidity and the legal and technical structure of the transaction. The adviser also integrates financially material environmental, social and governance (“ESG”) factors as part of the Fund’s investment process (“ESG Integration”). ESG Integration is the systematic inclusion of ESG issues in investment analysis and investment decisions. In applying ESG Integration in the evaluation of individual municipal issuers, the adviser seeks to assess the impact of environmental, social and governance factors on certain issuers in the universe in which the Fund may invest. The adviser’s assessment is based on an analysis of key opportunities and risks across sectors to identify financially material issues on the Fund’s investments in municipal issues and ascertain key issues that merit engagement with municipal issuers. These assessments may not be conclusive and securities that may be negatively impacted by such factors may be purchased and retained by the Fund while the Fund may divest or not invest in securities that may be positively impacted by such factors.
California Tax Free Bond Fund
The adviser buys and sells securities and investments for the Fund based on its view of individual securities and market sectors. Taking a long-term approach, the adviser looks for individual fixed income investments that it believes will perform well over market cycles. The adviser is value oriented and makes decisions to purchase and sell individual securities and instruments after performing a risk/reward analysis that includes an evaluation of interest rate risk, credit risk, duration, liquidity and the complex legal and technical structure of the transaction. The adviser also integrates financially material environmental, social and governance (“ESG”) factors as part of the Fund’s investment process (“ESG Integration”). ESG Integration is the systematic inclusion of ESG issues in investment analysis and investment decisions. In applying ESG Integration in the evaluation of individual municipal issuers, the adviser seeks to assess the impact of environmental, social and governance factors on certain issuers in the universe in which the Fund may invest. The adviser’s assessment is based on an analysis of key opportunities and risks across sectors to identify financially material issues on the Fund’s investments in municipal issues and ascertain key issues that merit engagement with municipal issuers. These assessments may not be conclusive and securities that may be negatively impacted by such factors may be purchased and retained by the Fund while the Fund may divest or not invest in securities that may be positively impacted by such factors.
High Yield Municipal Fund
The adviser buys and sells securities and investments for the Fund based on its view of individual securities and market sectors. Taking a long-term approach, the adviser primarily looks for individual fixed income investments that it believes will perform well over market cycles. The adviser is value oriented and makes investment decisions after performing a risk/reward analysis that includes an evaluation of interest rate risk, credit risk, duration, liquidity, any security pledge, and a review of the security’s attributes, such as
52 | J.P. Morgan Municipal Bond Funds
the coupon, maturity, and any redemption and tender provisions. The adviser also factors in the overall investment strategy of the Fund, including its duration and its credit strategy, as well as the adviser’s interest rate outlook. The adviser also integrates financially material environmental, social and governance (“ESG”) factors as part of the Fund’s investment process (“ESG Integration”). ESG Integration is the systematic inclusion of ESG issues in investment analysis and investment decisions. In applying ESG Integration in the evaluation of individual municipal issuers, the adviser seeks to assess the impact of environmental, social and governance factors on certain issuers in the universe in which the Fund may invest. The adviser’s assessment is based on an analysis of key opportunities and risks across sectors to identify financially material issues on the Fund’s investments in municipal issues and ascertain key issues that merit engagement with municipal issuers. These assessments may not be conclusive and securities that may be negatively impacted by such factors may be purchased and retained by the Fund while the Fund may divest or not invest in securities that may be positively impacted by such factors.
The Fund may invest in loan assignments and participations (Loans). Loans will typically consist of senior secured floating rate loans, but may also include unsecured loans, second lien loans or more junior and bridge loans as well as commitments to purchase loans. Loans may be issued by obligors in the U.S. or in foreign or emerging markets. When the Fund acquires a loan assignment, the Fund typically will have a direct contractual relationship with the obligor; provided, however, the Fund may only be able to enforce its rights through an administrative agent. When the Fund acquires a loan participation, the Fund typically enters into a contractual relationship with the third party selling such participations, but not the borrower. As a result, the Fund assumes the credit risk of the seller of the loan participation and any other parties interpositioned between the Fund and the borrower. Under a loan participation, the Fund may have no direct rights to enforce the terms of the loan against the borrower. The Fund may not benefit directly from the collateral supporting the loan in which it has purchased the loan participations or assignments.
The Fund may invest in municipal mortgage-backed and asset-backed securities and municipal housing authority obligations. The Fund may also invest in bank obligations.
Intermediate Tax Free Bond Fund
The adviser buys and sells securities and investments for the Fund based on its view of individual securities and market sectors. Taking a long-term approach, the adviser looks for individual fixed income investments that it believes will perform well over market cycles. The adviser is value oriented and makes decisions to purchase and sell individual securities and instruments after performing a risk/reward analysis that includes an evaluation of interest rate risk, credit risk, duration, liquidity and the complex legal and technical structure of the transaction. The adviser also integrates financially material environmental, social and governance (“ESG”) factors as part of the Fund’s investment process (“ESG Integration”). ESG Integration is the systematic inclusion of ESG issues in investment analysis and investment decisions. In applying ESG Integration in the evaluation of individual municipal issuers, the adviser seeks to assess the impact of environmental, social and governance factors on certain issuers in the universe in which the Fund may invest. The adviser’s assessment is based on an analysis of key opportunities and risks across sectors to identify financially material issues on the Fund’s investments in municipal issues and ascertain key issues that merit engagement with municipal issuers. These assessments may not be conclusive and securities that may be negatively impacted by such factors may be purchased and retained by the Fund while the Fund may divest or not invest in securities that may be positively impacted by such factors.
New York Tax Free Bond Fund
The adviser buys and sells securities and investments for the Fund based on its view of individual securities and market sectors. Taking a long-term approach, the adviser looks for individual fixed income investments that it believes will perform well over market cycles. The adviser is value oriented and makes decisions to purchase and sell individual securities and instruments after performing a risk/reward analysis that includes an evaluation of interest rate risk, credit risk, duration, liquidity and the complex legal and technical structure of the transaction. The adviser also integrates financially material environmental, social and governance (“ESG”) factors as part of the Fund’s investment process (“ESG Integration”). ESG Integration is the systematic inclusion of ESG issues in investment analysis and investment decisions. In applying ESG Integration in the evaluation of individual municipal issuers, the adviser seeks to assess the impact of environmental, social and governance factors on certain issuers in the universe in which the Fund may invest. The adviser’s assessment is based on an analysis of key opportunities and risks across sectors to identify financially material issues on the Fund’s investments in municipal issues and ascertain key issues that merit engagement with municipal issuers. These assessments may not be conclusive and securities that may be negatively impacted by such factors may be purchased and retained by the Fund while the Fund may divest or not invest in securities that may be positively impacted by such factors.
Please note that the Funds also may use strategies that are not described in this section, but which are described in the “Investment Practices” section later in the prospectus and in the Statement of Additional Information.
July 1, 2022 | 53
More About the Funds (continued)
Investment Risks
There can be no assurance that the Funds will achieve their investment objectives.
The main risks associated with investing in each Fund are summarized in the “Risk/Return Summaries” at the front of this prospectus. In addition to each Fund’s main risks, each Fund may be subject to additional risks in connection with investments and strategies used by each Fund from time to time. The table below identifies main risks and some of the additional risks for each Fund.
An investment in a Fund or any other fund may not provide a complete investment program. The suitability of an investment in a Fund should be considered based on the investment objective, strategies and risks described in this prospectus, considered in light of all of the other investments in your portfolio, as well as your risk tolerance, financial goals and time horizons. You may want to consult with a financial advisor to determine if a Fund is suitable for you.
The Funds are subject to the main risks designated as such in the table below, any of which may adversely affect a Fund’s net asset value (NAV), performance and ability to meet its investment objective. Each Fund may also be subject to additional risks that are noted in the table below, as well as those that are not described herein but which are described in the Statement of Additional Information.
| |
Sustainable Municipal Income Fund |
Short-Intermediate Municipal Bond Fund |
Tax Free Bond Fund |
Ultra-Short Municipal Fund |
California Tax Free Bond Fund |
High Yield Municipal Fund |
Intermediate Tax Free Bond Fund |
New York Tax Free Bond Fund |
| Alternative Minimum Tax Risk |
• |
• |
• |
• |
• |
• |
• |
• |
| Auction Rate Securities Risk |
○ |
• |
○ |
• |
○ |
• |
○ |
○ |
| California Geographic Concentration Risk |
|
|
|
|
• |
|
|
|
| Credit Risk |
• |
• |
• |
• |
• |
• |
• |
• |
| Debt Securities and Other Callable Securities Risk |
• |
• |
• |
• |
• |
• |
• |
• |
| Derivatives Risk |
○ |
○ |
○ |
○ |
○ |
○ |
○ |
○ |
| Exchange-Traded Fund (ETF) and/or Other Investment Company Risk |
○ |
○ |
○ |
○ |
○ |
• |
○ |
○ |
| Floating and Variable Rate Securities Risk |
○ |
○ |
○ |
• |
○ |
• |
○ |
○ |
| General Market Risk |
• |
• |
• |
• |
• |
• |
• |
• |
| Government Securities Risk |
○ |
○ |
○ |
○ |
• |
• |
• |
• |
| High Yield Securities Risk |
• |
• |
• |
• |
• |
• |
• |
• |
| Industry and Sector Focus Risk |
• |
• |
• |
• |
• |
• |
• |
• |
| Interest Rate Risk |
• |
• |
• |
• |
• |
• |
• |
• |
| Inverse Floating Rate Instrument Risk |
○ |
○ |
○ |
○ |
○ |
• |
○ |
○ |
| Loan Risk |
|
|
|
|
|
○ |
|
|
| Mortgage-Related and Other Asset-Backed Securities Risk |
• |
• |
• |
• |
• |
○ |
• |
• |
| Municipal Housing Authority Obligations Risk |
• |
• |
○ |
• |
○ |
○ |
○ |
○ |
•
Main Risks
○
Additional Risks
54 | J.P. Morgan Municipal Bond Funds
| |
Sustainable Municipal Income Fund |
Short-Intermediate Municipal Bond Fund |
Tax Free Bond Fund |
Ultra-Short Municipal Fund |
California Tax Free Bond Fund |
High Yield Municipal Fund |
Intermediate Tax Free Bond Fund |
New York Tax Free Bond Fund |
| Municipal Obligations Risk |
• |
• |
• |
• |
• |
• |
• |
• |
| New York Geographic Concentration Risk |
|
|
|
|
|
|
|
• |
| Pay-In-Kind and Deferred Payment Securities Risk |
○ |
○ |
○ |
○ |
○ |
○ |
○ |
○ |
| Restricted Securities Risk |
• |
• |
○ |
• |
○ |
• |
○ |
○ |
| Social or Environmental Investing Risk |
• |
|
|
|
|
|
|
|
| Structured Product Risk |
○ |
○ |
○ |
• |
○ |
• |
○ |
○ |
| Taxability Risk |
• |
• |
• |
• |
• |
• |
• |
• |
| Risk Associated with the Fund Holding Cash, Money Market Instruments and Other Short-Term Investments |
|
• |
• |
|
|
|
|
|
| Transactions and Liquidity Risk |
• |
• |
• |
• |
• |
• |
• |
• |
| Ultra-Short Fund Risk |
|
|
|
• |
|
|
|
|
| Cyber Security Risk |
○ |
○ |
○ |
○ |
○ |
○ |
○ |
○ |
| Volcker Rule Risk |
○ |
○ |
○ |
○ |
○ |
○ |
○ |
○ |
| Zero-Coupon Bond Risk |
• |
• |
• |
• |
• |
• |
• |
• |
•
Main Risks
○
Additional Risks
Municipal Obligations Risk. The risk of a municipal obligation generally depends on the financial and credit status of the issuer. Changes in the financial health of a municipal issuer may make it difficult for the issuer to make interest and principal payments when due. A number of municipalities have had significant financial problems recently, and these and other municipalities could, potentially, continue to experience significant financial problems resulting from lower tax revenues and/or decreased aid from state and local governments in the event of an economic downturn. This could decrease the Funds’ income or hurt its ability to preserve capital and liquidity.
Under some circumstances, municipal obligations might not pay interest unless the state legislature or municipality authorizes money for that purpose. Some securities, including municipal lease obligations, carry additional risks. For example, they may be difficult to trade or interest payments may be tied only to a specific stream of revenue.
Municipal bonds may be more susceptible to downgrades or defaults during recessions or similar periods of economic stress. Factors contributing to the economic stress on municipalities may include lower property tax collections as a result of lower home values, lower sales tax revenue as a result of consumers cutting back spending and lower income tax revenue as a result of a higher unemployment rate. In addition, since some municipal obligations may be secured or guaranteed by banks and other institutions, the risk to a Fund could increase if the banking or financial sector suffers an economic downturn and/or if the credit ratings of the institutions issuing the guarantee are downgraded or at risk of being downgraded by a national rating organization. If such events were to occur, the value of the security could decrease or the value could be lost entirely, and it may be difficult or impossible for a Fund to sell the security at the time and the price that normally prevails in the market.
July 1, 2022 | 55
More About the Funds (continued)
In addition to being downgraded, an insolvent municipality may file for bankruptcy. For example, Chapter 9 of the Bankruptcy Code provides a financially distressed municipality protection from its creditors while it develops and negotiates a plan for reorganizing its debts. “Municipality” is defined broadly by the Bankruptcy Code as a “political subdivision or public agency or instrumentality of a state” and may include various issuers of securities in which a Fund invests. The reorganization of a municipality’s debts may include extending debt maturities, reducing the amount of principal or interest, refinancing the debt or taking other measures, which may significantly affect the rights of creditors and the value of the securities issued by the municipality and the value of a Fund’s investments. Interest on municipal obligations, while generally exempt from federal income tax, may not be exempt from federal alternative minimum tax.
General Market Risk. Economies and financial markets throughout the world are becoming increasingly interconnected, which increases the likelihood that events or conditions in one country or region will adversely impact markets or issuers in other countries or regions. Securities in the Fund’s portfolio may underperform in comparison to securities in general financial markets, a particular financial market or other asset classes due to a number of factors, including inflation (or expectations for inflation), deflation (or expectations for deflation), interest rates, global demand for particular products or resources, market instability, debt crises and downgrades, embargoes, tariffs, sanctions and other trade barriers, regulatory events, other governmental trade or market control programs and related geopolitical events. In addition, the value of the Fund’s investments may be negatively affected by the occurrence of global events such as war, terrorism, environmental disasters, natural disasters or events, country instability, and infectious disease epidemics or pandemics.
For example, the outbreak of COVID-19 has negatively affected economies, markets and individual companies throughout the world, including those in which the Fund invests. The effects of this pandemic to public health and business and market conditions, including, among other things, reduced consumer demand and economic output, supply chain disruptions and increased government spending, may continue to have a significant negative impact on the performance of the Fund’s investments, increase the Fund’s volatility, exacerbate pre-existing political, social and economic risks to the Fund, and negatively impact broad segments of businesses and populations. In addition, governments, their regulatory agencies, or self-regulatory organizations have taken or may take actions in response to the pandemic that affect the instruments in which the Fund invests, or the issuers of such instruments, in ways that could have a significant negative impact on the Fund’s investment performance. The duration and extent of COVID-19 and associated economic and market conditions and uncertainty over the long-term cannot be reasonably estimated at this time. The ultimate impact of COVID-19 and the extent to which the associated conditions impact a Fund will also depend on future developments, which are highly uncertain, difficult to accurately predict and subject to frequent changes.
Interest Rate Risk. The Fund invests in debt securities that change in value based on changes in interest rates. If rates increase, the value of these investments generally declines. On the other hand, if rates fall, the value of these investments generally increases. Your investment will decline in value if the value of these investments decreases. Securities with greater interest rate sensitivity and longer maturities generally are subject to greater fluctuations in value. Many factors can cause interest rates to rise. Some examples include central bank monetary policy, rising inflation rates and general economic conditions. The Fund may face a heightened level of interest rate risk due to certain changes or uncertainty in monetary policy.
Debt market conditions are highly unpredictable and some parts of the market are subject to dislocations. Beginning in March 2022, the Federal Reserve Board began increasing interest rates and has signaled the possibility of further increases. It is difficult to accurately predict the pace at which the Federal Reserve Board will increase interest rates any further, or the timing, frequency or magnitude of any such increases, and the evaluation of macro-economic and other conditions could cause a change in approach in the future. Any such changes could be sudden and could expose debt markets to significant volatility and reduced liquidity for Fund investments.
Credit Risk. There is a risk that issuers and/or a counterparty to a security, contract, repurchase agreement or other investment will not make payments when due or default completely on securities, repurchase agreements or other investments held by a Fund. The risk of defaults across issuers and/or counterparties increases in adverse market and economic conditions, including the conditions resulting from the COVID-19 pandemic. Such defaults could result in losses to the Fund. In addition, the credit quality of securities held by a Fund may be lowered if an issuer’s or a counterparty’s financial condition changes. Lower credit quality may lead to greater volatility in the price of a security and in shares of a Fund. Lower credit quality also may affect liquidity and make it difficult for a Fund to sell the security. Although U.S. government securities issued directly by the U.S. government are guaranteed by the U.S. Treasury, other U.S. government securities issued by an agency or instrumentality of the U.S. government may not be. No assurance can be given that the U.S. government would provide financial support to its agencies or instrumentalities if not required to do so by law. Prices of the Fund’s investments may be adversely affected if any of the issuers or counterparties it is invested in are subject to an actual or perceived deterioration in their credit quality. Credit spreads may increase, which may reduce the market values of the Fund’s securities. Credit spread risk is the risk that economic and market conditions or any actual or perceived credit deterioration may lead to an increase in the credit spreads (i.e., the difference in yield between two securities of similar maturity but different credit quality) and a decline in price of the issuer’s securities.
56 | J.P. Morgan Municipal Bond Funds
Floating and Variable Rate Securities Risk. Floating and variable rate securities provide for a periodic adjustment in the interest rate paid on the securities. The rate adjustment intervals may be regular and range from daily up to annually, or may be based on an event, such as a change in the prime rate. Floating and variable rate securities may be subject to greater liquidity risk than other debt securities, meaning that there may be limitations on a Fund’s ability to sell the securities at any given time. Such securities also may lose value.
Structured Product Risk. Structured products, such as tender option bonds, involve structural complexities and potential risks that may not be present where a municipal security is owned directly. These enhanced risks may include additional counter-party risk (the risk that the counterparty will not fulfill its contractual obligations) and call risk (the risk that the instruments will be called and the proceeds may need to be reinvested). Additionally, an active trading market for such instruments may not exist. To the extent that a structured product provides a put, the Fund may receive a lower interest rate in return for such feature and will be subject to the risk that the put provider will be unable to honor the put feature (purchase the security). Finally, short-term municipal or tax-exempt structured products may present tax issues not presented by investments in other short-term municipal or tax-exempt securities. These issues might be resolved in a manner adverse to the Fund.
Alternative Minimum Tax Risk. A Fund may invest all of its assets in municipal bonds, the interest on which may be subject to the federal alternative minimum tax. Shareholders who are subject to the federal alternative minimum tax may have all or a portion of their income from the Fund subject to federal income tax. In addition, corporate shareholders will, with limited exceptions, be required to take the interest on municipal bonds into account in determining their alternative minimum taxable income. Any capital gain distributed by a Fund may be taxable.
Restricted Securities Risk.Restricted securities are securities that cannot be offered for public resale unless registered under the applicable securities laws or that have a contractual restriction that prohibits or limits their resale. Restricted securities include private placement securities that have not been registered under the applicable securities laws, such as Rule 144A securities, and securities of U.S. and non-U.S. issuers that are issued pursuant to Regulation S. Private placements are generally subject to strict restrictions on resale. Restricted securities may not be listed on an exchange and may have no active trading market. Restricted securities may be illiquid. The Fund may be unable to sell a restricted security on short notice or may be able to sell them only at a price below current value. It may be more difficult to determine a market value for a restricted security. Also, the Fund may get only limited information about the issuer of a restricted security, so it may be less able to predict a loss. In addition, if Fund management receives material non-public information about the issuer, the Fund may as a result be unable to sell the securities. Certain restricted securities may involve a high degree of business and financial risk and may result in substantial losses.
Mortgage-Related and Other Asset-Backed Securities Risk. Mortgage-related and asset-backed securities, including certain municipal housing authority obligations, differ from conventional debt securities and are subject to certain additional risks because principal is paid back over the life of the security rather than at maturity. The value of these securities will be influenced by the factors affecting the housing market and the assets underlying such securities. As a result, during periods of declining asset values, difficult or frozen credit markets, significant changes in interest rates, or deteriorating economic conditions, mortgage-related and asset-backed securities may decline in value, face valuation difficulties, become more volatile and/or become illiquid. These securities are also subject to prepayment and call risk. Gains and losses associated with prepayments will increase/decrease the income available for distribution by the Fund and the Fund’s yield. In periods of declining interest rates, the Fund may be subject to contraction risk which is the risk that borrowers will increase the rate at which they prepay the maturity value of mortgages and other obligations. When mortgages and other obligations are prepaid and when securities are called, the Fund may have to reinvest in securities with a lower yield or fail to recover additional amounts (i.e., premiums) paid for securities with higher interest rates, resulting in an unexpected capital loss and/or a decrease in the amount of dividends and yield. In periods of either rising or declining interest rates, the Fund may be subject to extension risk which is the risk that the expected maturity of an obligation will lengthen in duration due to a decrease in prepayments. As a result, in certain interest rate environments, the Fund may exhibit additional volatility. The structure of some of these securities may be complex and there may be less available information than for other types of debt securities. Additionally, asset-backed, mortgage-related and mortgage-backed securities are subject to risks associated with their structure and the nature of the assets underlying the securities and the servicing of those assets. Certain asset-backed, mortgage-related and mortgage-backed securities may face valuation difficulties and may be less liquid than other types of asset-backed, mortgage-related and mortgage-backed securities, or debt securities.
The mortgage loans underlying privately issued mortgage-related securities may not be subject to the same underwriting requirements for the underlying mortgages that are applicable to those mortgage-related securities that have government or government-sponsored entity guarantees. As a result, the mortgage loans underlying privately issued mortgage-related securities may have less favorable collateral, credit risk or other underwriting characteristics than government or government-sponsored mortgage-related securities and have wider variances in a number of terms including interest rate, term, size, purpose and borrower characteristics. In addition, certain mortgage-related securities which may include loans that originally qualified under standards established by
July 1, 2022 | 57
More About the Funds (continued)
government-sponsored entities (for example, certain REMICs that include Fannie Mae mortgages) are not considered as government securities for purposes of a Fund’s investment strategies or policies. There is no government or government-sponsored guarantee for such privately issued investments.
A Fund may invest in collateralized mortgage obligations (CMOs). CMOs are debt obligations collateralized by mortgage loans or mortgage pass-through securities. CMOs are issued in multiple classes, and each class may have its own interest rate and/or final payment date. A class with an earlier final payment date may have certain preferences in receiving principal payments or earning interest. As a result, the value of some classes in which the Fund invests may be more volatile and may be subject to higher risk of non-payment.
The values of interest-only (IO) and principal-only (PO) mortgage-backed securities are more volatile than other types of mortgage-related securities. They are very sensitive not only to changes in interest rates, but also to the rate of prepayments. A rapid or unexpected increase in prepayments can significantly depress the price of interest-only securities, while a rapid or unexpected decrease could have the same effect on principal-only securities. In addition, because there may be a drop in trading volume, an inability to find a ready buyer, or the imposition of legal restrictions on the resale of securities, these instruments may be illiquid.
Zero-Coupon, Pay-In-Kind and Deferred Payment Securities Risk. The market value of a zero-coupon bond is generally more volatile than the market value of other fixed income securities with similar maturities that pay interest periodically. In addition, federal income tax law requires that the holder of a zero-coupon bond accrue a portion of the discount at which the bond was purchased as taxable income each year, even though the holder receives no interest payments on the bond during the year. The Fund must distribute substantially all of its net income (including non-cash income attributable to zero-coupon bonds) to its shareholders each year to maintain its status as a regulated investment company and to eliminate tax at the Fund level. Accordingly, such accrued discount must be taken into account in determining the amount of taxable distributions to shareholders. The Fund may consequently have to dispose of portfolio securities under disadvantageous circumstances to generate cash to satisfy such distribution requirements. These actions may reduce the assets to which the Fund’s expenses could otherwise be allocated and may reduce the Fund’s rate of return.
The market value of a zero-coupon, pay-in-kind or deferred payment security is generally more volatile than the market value of interest-paying securities, and is more likely to respond to a greater degree to changes in interest rates and credit quality than other fixed income securities with similar maturities that pay interest periodically. In addition, federal income tax law requires that the holder of a zero-coupon bond accrue a portion of the discount at which the bond was purchased as taxable income each year, even though the holder receives no interest payment on the bond during the year. Each Fund must distribute substantially all of its net income (including non-cash income attributable to zero-coupon bonds) to its shareholders each year to maintain its status as a regulated investment company and to eliminate tax at the Fund level. Accordingly, such accrued discount must be taken into account in determining the amount of taxable distributions to shareholders. A Fund may consequently have to dispose of portfolio securities under disadvantageous circumstances to generate cash to satisfy such distribution requirements. These actions may reduce the assets to which the Fund’s expenses could otherwise be allocated and may reduce the Fund’s rate of return.
In addition, (1) the higher yields and interest rates on certain pay-in-kind securities (PIK) reflect the payment deferral and increased credit risk associated with such instruments and such investments may represent a significantly higher credit risk than coupon loans; (2) PIK securities may have higher price volatility because their continuing accruals require continuing judgments about the collectability of the deferred payments and the value of any associated collateral; (3) PIK interest has the effect of generating investment income and (4) the deferral of PIK interest may also reduce the loan-to-value ratio at a compounding rate.
Risk Associated with the Fund Holding Cash, Money Market Instruments and Other Short-Term Investments. The Fund will, at times, hold assets in cash, money market instruments and other short-term investments, which may hurt the Fund’s performance. These positions may also subject the Fund to additional risks and costs.
Transactions and Liquidity Risk. A Fund could experience a loss when selling securities to meet redemption requests and its liquidity may be negatively impacted. The risk of loss increases if the redemption requests are large or frequent, occur in times of overall market turmoil or declining prices for the securities sold, or when the securities a Fund wishes to, or is required to, sell are illiquid. To the extent a large proportion of shares of a Fund are held by a small number of shareholders (or a single shareholder) including funds or accounts over which the adviser or its affiliates have investment discretion, the Fund is subject to the risk that these shareholders will purchase or redeem Fund shares in large amounts rapidly or unexpectedly, including as a result of an asset allocation decision made by the adviser or its affiliates. In addition to the other risks described in this section, these transactions could adversely affect the ability of the Fund to conduct its investment program. A Fund may be unable to sell illiquid securities at its desired time or price or the price at which the securities have been valued for purposes of the Fund’s net asset value. Illiquidity can be caused by a drop in overall market trading volume, an inability to find a ready buyer, or legal restrictions on the securities’ resale. Other market participants may be attempting to sell debt securities at the same time as a Fund, causing downward pricing pressure and contributing to illiquidity. The capacity for bond dealers to engage in trading or “make a market” in debt securities has not kept
58 | J.P. Morgan Municipal Bond Funds
pace with the growth of bond markets. Liquidity and valuation risk may be magnified in a rising interest rate environment, when credit quality is deteriorating or in other circumstances where investor redemptions from fixed income mutual funds may be higher than normal. Certain securities that were liquid when purchased may later become illiquid, particularly in times of overall economic distress. Similarly, large purchases of Fund shares may adversely affect the Fund’s performance to the extent that the Fund is delayed in investing new cash and is required to maintain a larger cash position than it ordinarily would. Large redemptions also could accelerate the realization of capital gains, increase a Fund’s transaction costs and impact a Fund’s performance.
Industry and Sector Focus Risk. At times the Fund may increase the relative emphasis of its investments in a particular industry or sector. The prices of securities of issuers in a particular industry or sector may be more susceptible to fluctuations due to changes in economic or business conditions, government regulations, availability of basic resources or supplies, or other events that affect that industry or sector more than securities of issuers in other industries and sectors. To the extent that the Fund increases the relative emphasis of its investments in a particular industry or sector, the value of a Fund’s shares may fluctuate in response to events affecting that industry or sector.
Debt Securities and Other Callable Securities Risk. As part of its main investment strategy, each Fund invests in debt securities. The issuers of these securities and other callable securities may be able to repay principal in advance, especially when interest rates fall. Changes in prepayment rates can affect the return on investment and yield of these securities. When debt obligations are prepaid and when securities are called, a Fund may have to reinvest in securities with a lower yield. A Fund also may fail to recover additional amounts (i.e., premiums) paid for securities with higher interest rates, resulting in an unexpected capital loss.
Inverse Floating Rate Instrument Risk. The market value of an inverse floater residual certificate can be more volatile than that of a conventional fixed-rate bond having similar credit quality, maturity and redemption provisions. Inverse floater residual certificates entail a degree of leverage because the trust issues short-term securities in a ratio to the residual certificates with the underlying long-term bond providing collateral for the obligation to pay the principal value of the short-term securities if and when they are tendered. If a Fund has created the inverse floater by depositing a long-term bond into a trust, it may be required to provide additional collateral for the short-term securities if the value of the underlying bond deposited in the trust fails.
An inverse floater that has a higher degree of leverage is typically more volatile with respect to its price and income than an inverse floater having a lower degree of leverage. Under inverse floater arrangements, if the remarketing agent that offers the short-term securities for sale is unable to sell them, or if the holders tender (or put) them for repayment of principal and the remarketing agent is unable to remarket them, the remarketing agent may cause the trust to be collapsed, and in the case of floaters created by the Fund, the Fund will then be required to repay the principal amount of the tendered securities. During times of market volatility, illiquidity or uncertainty, the Fund could be required to sell other portfolio holdings at a disadvantageous time to raise cash to meet that obligation.
Because of the accounting treatment for inverse floaters created by the Fund’s transfer of a municipal bond to a trust, the Fund’s financial statements will reflect these transactions as “secured borrowings,” which affects the Fund’s Statements of Assets and Liabilities and Operations, expense ratios and the Schedule of Investments will include the underlying municipal bond. The Fund’s annual fund operating expenses will include certain expenses and fees related to the Fund’s investments. Some of those expenses may be liabilities with respect to interest paid on short-term floating rate notes issued by the trusts whose inverse floater certificates are held by the Fund. Under accounting rules, the Fund will also recognize additional income in an amount that directly corresponds to these expenses and, as a result the Fund’s net asset values per share and total returns will not be affected by these additional expenses.
Taxability Risk. The Fund’s investments in municipal securities rely on the opinion of the issuer’s bond counsel that the interest paid on those securities will not be subject to federal income tax. Tax opinions are generally provided at the time the municipal security is initially issued. However, after the Fund buys a security, the Internal Revenue Service may determine that a bond issued as tax-exempt should in fact be taxable and the Fund’s dividends with respect to that bond might be subject to federal income tax.
Social or Environmental Investing Risk. The JPMorgan Sustainable Municipal Income Fund’s investment in securities whose use of proceeds, in the Adviser’s opinion, provide positive social or environmental benefits could cause it to perform differently compared to funds that do not have such a policy. Investing in securities whose use of proceeds, in the Adviser’s opinion, provide positive social or environmental benefits may result in the Fund forgoing opportunities to buy certain securities when it might otherwise be advantageous to do so, or selling securities when it might be otherwise disadvantageous for it to do so. In addition, there is a risk that the municipal bonds identified by the Adviser’s use of proceeds determination do not operate as expected when addressing positive social or environmental benefits. The Adviser’s assessment of the positive social or environmental impact of a municipal bond’s proceeds is made at the time of purchase and the actual use of proceeds by the issuer could vary over time, which could cause the Fund to be invested in bonds that do not comply with the Fund’s approach towards considering social or environmental characteristics. The factors that the Adviser considers in evaluating whether a security has positive social or environmental benefits may change over time. There are significant differences in interpretations of what it means to promote positive social or
July 1, 2022 | 59
More About the Funds (continued)
environmental benefits. While the Adviser believes its definitions are reasonable, the portfolio decisions it makes may differ with other’s views. In making investment decisions, the Adviser relies on information and third-party data that could be incomplete or erroneous, which could cause the Adviser to incorrectly assess a municipal bond’s positive social or environmental impact.
High Yield Securities Risk. The Fund invests in instruments including junk bonds, Loans and instruments of municipal issuers that are highly leveraged, less creditworthy or financially distressed. These investments are considered to be speculative and may be subject to greater risk of loss, greater sensitivity to economic changes, valuation difficulties and potential illiquidity. Such investments are subject to additional risks including subordination to other creditors, no collateral or limited rights in collateral, lack of a regular trading market, extended settlement periods, liquidity risks, prepayment risks, potentially less protections under the federal securities laws and lack of publicly available information. High yield securities and Loans that are deemed to be liquid at the time of purchase may become illiquid.
In recent years, there has been a broad trend of weaker or less restrictive covenant protections in the high yield market. Among other things, under such weaker or less restrictive covenants, borrowers might be able to exercise more flexibility with respect to certain activities than borrowers who are subject to stronger or more protective covenants. For example, borrowers might be able to incur more debt, including secured debt, return more capital to shareholders, remove or reduce assets that are designated as collateral securing high yield securities, increase the claims against assets that are permitted against collateral securing high yield securities or otherwise manage their business in ways that could impact creditors negatively. In addition, certain privately held borrowers might be permitted to file less frequent, less detailed or less timely financial reporting or other information, which could negatively impact the value of the high yield securities issued by such borrowers. Each of these factors might negatively impact the high yield instruments held by the Fund.
No active trading market may exist for some instruments and certain investments may be subject to restrictions on resale. In addition, the settlement period for Loans is uncertain as there is no standardized settlement schedule applicable to such investments. The inability to dispose of the Fund’s securities and other investments in a timely fashion could result in losses to the Fund. Because some instruments may have a more limited secondary market, liquidity risk is more pronounced for the Fund than for funds that invest primarily in other types of fixed income instruments or equity securities. When bonds and other instruments securities are prepaid, the Fund may have to reinvest in instruments with a lower yield or fail to recover additional amounts (i.e., premiums) paid for these instruments resulting in an unexpected capital loss and/or a decrease in the amount of dividends and yield.
Government Securities Risk. The Fund invests in securities issued or guaranteed by the U.S. government or its agencies and instrumentalities (such as securities issued by the Government National Mortgage Association (Ginnie Mae), the Federal National Mortgage Association (Fannie Mae) or the Federal Home Loan Mortgage Corporation (Freddie Mac)). U.S. government securities are subject to market risk, interest rate risk and credit risk. Securities, such as those issued or guaranteed by Ginnie Mae or the U.S. Treasury, that are backed by the full faith and credit of the United States are guaranteed only as to the timely payment of interest and principal when held to maturity and the market prices for such securities will fluctuate. Notwithstanding that these securities are backed by the full faith and credit of the United States, circumstances could arise that would prevent the payment of interest or principal. This would result in losses to the Fund. Securities issued or guaranteed by U.S. government related organizations, such as Fannie Mae and Freddie Mac, are not backed by the full faith and credit of the U.S. government and no assurance can be given that the U.S. government will provide financial support. Therefore, U.S. government related organizations may not have the funds to meet their payment obligations in the future. U.S. government securities include zero coupon securities, which tend to be subject to greater market risk than interest-paying securities of similar maturities.
California Geographic Concentration Risk. Because the JPMorgan California Tax Free Bond Fund primarily invests in issuers in the State of California, its political subdivisions, authorities and agencies, its performance will be affected by the fiscal and economic health of that state and its municipalities. Provisions of the California Constitution and state statutes that limit the taxing and spending authority of California’s governmental entities may impair the ability of California issuers to pay principal and/or interest on their obligations. While California’s economy is broad, it does have major concentrations in high technology, manufacturing, entertainment, agriculture, tourism, construction and services, and may be sensitive to economic problems affecting those industries.
Any deterioration of California’s fiscal situation could increase the risk of investing in California municipal securities, including the risk of potential issuer default, and could heighten the risk that the prices of California municipal securities, and the Fund’s net asset value and/or yield, will experience greater volatility. Furthermore, any such deterioration could result in a downgrade of the credit rating of an issuer of California municipal securities. Future downgrades could reduce the market value of the securities held by the Fund, which could adversely affect the Fund’s performance.
New York Geographic Concentration Risk. Because the JPMorgan New York Tax Free Bond Fund invests primarily in municipal obligations issued by the State of New York, New York City, their political subdivisions, authorities and agencies, its performance will be affected by the fiscal and economic health of that state, the city and their political subdivisions. Additionally, as the nation’s financial capital, New York’s and New York City’s economy is heavily dependent on the financial sector and may be sensitive to
60 | J.P. Morgan Municipal Bond Funds
economic problems affecting the sector. New York and New York City also face a particularly large degree of uncertainty from interest rate risk and equity market volatility. The New York and New York City economy tends to be more sensitive to monetary policy actions and to movements in the national and world economies than the economies of other states or cities.
Any deterioration of New York’s fiscal situation could increase the risk of investing in New York municipal securities, including the risk of potential issuer default, and could heighten the risk that the prices of New York municipal securities, and the Fund’s net asset value and/or yield, will experience greater volatility. Furthermore, any such deterioration could result in a downgrade of the credit rating of an issuer of New York municipal securities. Future downgrades could reduce the market value of the securities held by the Fund, which could adversely affect the Fund’s performance.
Derivatives Risk. A Fund may use derivatives in connection with its investment strategies. Derivatives may be riskier than other types of investments because they may be more sensitive to changes in economic or market conditions than other types of investments and could result in losses that significantly exceed a Fund’s original investment. Derivatives are subject to the risk that changes in the value of a derivative may not correlate perfectly with the underlying asset, rate or index. The use of derivatives may not be successful, resulting in losses to the Fund and the cost of such strategies may reduce a Fund’s returns. Certain derivatives also expose the Fund to counterparty risk (which is the risk that the derivative counterparty will not fulfill its contractual obligations), and to the credit risk of the derivative counterparty. In addition, a Fund may use derivatives for non-hedging purposes, which increases the Fund’s potential for loss. Certain derivatives are synthetic instruments that attempt to replicate the performance of certain reference assets. With regard to such derivatives, the Fund does not have a claim on the reference assets and is subject to enhanced counterparty risk.
Investing in derivatives will result in a form of leverage. Leverage involves special risks. A Fund may be more volatile than if the Fund had not been leveraged because the leverage tends to exaggerate any effect on the value of the Fund’s portfolio securities. Registered investment companies are limited in their ability to engage in derivative transactions and are required to identify and earmark assets to provide asset coverage for derivative transactions.
The possible lack of a liquid secondary market for derivatives and the resulting inability of a Fund to sell or otherwise close a derivatives position could expose the Fund to losses and could make derivatives more difficult for the Fund to value accurately.
A Fund’s transactions in futures contracts, swaps and other derivatives could also affect the amount, timing and character of distributions to shareholders which may result in the Fund realizing more short-term capital gain and ordinary income subject to tax at ordinary income tax rates than it would if it did not engage in such transactions, which may adversely impact the Fund’s after-tax return.
| WHAT IS A DERIVATIVE? |
| Derivatives are securities or contracts (for example, futures and options) that derive their value from the performance of underlying assets or securities. |
Exchange-Traded Fund (ETF) and/or Other Investment Company Risk. A Fund may invest in shares of other investment companies and ETFs. Shareholders bear both their proportionate share of a Fund’s expenses and similar expenses of the underlying investment company or ETF when the Fund invests in shares of another investment company or ETF. A Fund is subject to the risks associated with the ETF’s or investment company’s investments. ETFs and companies that invest in commodities or currencies are subject to the risks associated with direct investments in commodities or currencies. The price and movement of an ETF or closed-end fund designed to track an index may not track the index and may result in a loss. In addition, closed-end funds that trade on an exchange often trade at a price below their net asset value (also known as a discount). Certain ETFs or closed-end funds traded on exchanges may be thinly traded and experience large spreads between the “ask” price quoted by a seller and the “bid” price offered by a buyer.
Loan Risk. The Fund may invest in Loans including Loans that are rated below investment grade. Like other high yield, corporate debt instruments, such Loans are subject to an increased risk of default in the payment of principal and interest as well as the other risks described under “Interest Rate Risk,”“Credit Risk” and “High Yield Securities Risk.” Although certain Loans are secured by collateral, the Fund could experience delays or limitations in realizing on such collateral or have its interest subordinated to other indebtedness of the obligor. Loans are vulnerable to market sentiment such that economic conditions or other events may reduce the demand for Loans and cause their value to decline rapidly and unpredictably. Although the Fund limits its investments in illiquid securities to no more than 15% of the Fund’s net assets at the time of purchase, Loans that are deemed to be liquid at the time of purchase may become illiquid. In recent years, there has been a broad trend of weaker or less restrictive covenant protections in the Loan market. Among other things, under such weaker or less restrictive covenants, borrowers might be able to exercise more flexibility with respect to certain activities than borrowers who are subject to stronger or more protective covenants. For example, borrowers might be able to incur more debt, including secured debt, return more capital to shareholders, remove or reduce assets that are designated as collateral securing Loans, increase the claims against assets that are permitted against collateral securing Loans or
July 1, 2022 | 61
More About the Funds (continued)
otherwise manage their business in ways that could impact creditors negatively. In addition, certain privately held borrowers might be permitted to file less frequent, less detailed or less timely financial reporting or other information, which could negatively impact the value of the Loans issued by such borrowers. Each of these factors might negatively impact the Loans held by a Fund. No active trading market may exist for some of the Loans and certain Loans may be subject to restrictions on resale. The inability to dispose of Loans in a timely fashion could result in losses to the Fund. In addition, the settlement period for Loans is uncertain as there is no standardized schedule applicable to such investments. Certain Loans may take more than seven days to settle. Because some Loans that the Fund invests in may have a more limited secondary market, liquidity and valuation risk is more pronounced for the Fund than for funds that invest primarily in other types of fixed income instruments or equity securities. Typically, Loans are not registered securities and are not listed on any national securities exchange. Consequently, there may be less public information available about the Fund’s investments and the market for certain Loans may be subject to irregular trading activity, wide bid/ask spreads and extended trade settlement periods. As a result, the Fund may be more dependent upon the analytical ability of its adviser.
When a Fund acquires a loan participation, the Fund typically enters into a contractual relationship with the lender or third party selling such participations, but not the borrower. As a result, the Fund assumes the credit risk of the seller of the loan participation and any other parties interpositioned between the Fund and the borrower. The Fund may not benefit directly from the collateral supporting the loan in which it has purchased the loan participations or assignments.
Affiliates of the adviser may participate in the primary and secondary market for Loans. Because of limitations imposed by applicable law, the presence of the adviser’s affiliates in the Loan market may restrict the Fund’s ability to acquire some Loans, affect the timing of such acquisition or affect the price at which the Loan is acquired. Also, because the adviser may wish to invest in the publicly traded securities of an obligor, it may not have access to material non-public information regarding the obligor to which other investors have access.
Loans are subject to prepayment risks. Gains and losses associated with prepayments will increase or decrease the Fund’s yield and the income available for distribution by the Fund. When Loans are prepaid, the Fund may have to reinvest in securities with a lower yield or fail to recover additional amounts (i.e. premiums) paid for Loans, resulting in an unexpected capital loss and/or a decrease in the amount of dividends and yields.
Ultra-Short Fund Risk. The JPMorgan Ultra-Short Municipal Fund is not a money market fund. Therefore, the Fund does not attempt to maintain a stable net asset value and is not subject to the rules that govern the diversity, quality, maturity, liquidity and other features of securities that money market funds may purchase. Under normal conditions, the Fund’s investment may be more susceptible than a money market fund to interest rate risk, valuation risk, credit risk and other risks relevant to the Fund’s investments. Unlike certain money market funds, the Fund’s net asset value per share will fluctuate. Because the Fund is not a money market fund, it does not qualify for the special money market fund tax treatment or tax accounting methods under Treasury regulations.
Cyber Security Risk. As the use of technology has become more prevalent in the course of business, the Funds have become more susceptible to operational and financial risks associated with cyber security, including: theft, loss, misuse, improper release, corruption and destruction of, or unauthorized access to, confidential or highly restricted data relating to a Fund and its shareholders; and compromises or failures to systems, networks, devices and applications relating to the operations of a Fund and its service providers. Cyber security risks may result in financial losses to a Fund and its shareholders; the inability of a Fund to transact business with its shareholders; delays or mistakes in the calculation of a Fund’s NAV or other materials provided to shareholders; the inability to process transactions with shareholders or other parties; violations of privacy and other laws; regulatory fines, penalties and reputational damage; and compliance and remediation costs, legal fees and other expenses. A Fund’s service providers (including, but not limited to, the adviser, any sub-advisers, administrator, transfer agent, and custodian or their agents), financial intermediaries, companies in which a Fund invests and parties with which a Fund engages in portfolio or other transactions also may be adversely impacted by cyber security risks in their own businesses, which could result in losses to a Fund or its shareholders. While measures have been developed which are designed to reduce the risks associated with cyber security, there is no guarantee that those measures will be effective, particularly since the Funds do not directly control the cyber security defenses or plans of their service providers, financial intermediaries and companies in which they invest or with which they do business.
Volcker Rule Risk. Pursuant to section 619 of the Dodd-Frank Wall Street Reform and Consumer Protection Act and certain rules promulgated thereunder known as the Volcker Rule, if the adviser and/or its affiliates own 25% or more of the outstanding ownership interests of a Fund after the permitted seeding period from the implementation of a Fund’s investment strategy, a Fund could be subject to restrictions on trading that would adversely impact the Fund’s ability to execute its investment strategy. Generally, the permitted seeding period is three years from the implementation of a Fund’s investment strategy. As a result, the adviser and/or its affiliates may be required to reduce their ownership interests in a Fund at a time that is sooner than would otherwise be desirable, which may result in the Fund’s liquidation or, if the Fund is able to continue operating, may result in losses, increased transaction costs and adverse tax consequences as a result of the sale of portfolio securities.
62 | J.P. Morgan Municipal Bond Funds
Auction Rate Securities Risk. The auction rate municipal securities the Fund will purchase will typically have a long-term nominal maturity for which the interest rate is regularly reset through a “Dutch” auction. The interest rate set by the auction is the lowest interest rate that covers all securities offered for sale. While this process is designed to permit auction rate securities to be traded at par value, there is a risk that an auction will fail due to insufficient demand for the securities, which may adversely affect the liquidity and price of auction rate securities. Moreover, between auctions, there may be no secondary market for these securities, and sales conducted on a secondary market may not be on terms favorable to the seller. Thus, with respect to liquidity and price stability, auction rate securities may differ substantially from cash equivalents, notwithstanding the frequency of auctions and the credit quality of the security.
For more information about risks associated with the types of investments that a Fund purchases, please read the “Risk/Return Summary” at the front of this prospectus and “Investment Practices” section later in the prospectus, and the Statement of Additional Information.
Conflicts of Interest
An investment in a Fund is subject to a number of actual or potential conflicts of interest. For example, the Adviser and/or its affiliates provide a variety of different services to a Fund, for which the Fund compensates them. As a result, the Adviser and/or its affiliates have an incentive to enter into arrangements with a Fund, and face conflicts of interest when balancing that incentive against the best interests of a Fund. The Adviser and/or its affiliates also face conflicts of interest in their service as investment adviser to other clients, and, from time to time, make investment decisions that differ from and/or negatively impact those made by the Adviser on behalf of a Fund. In addition, affiliates of the Adviser provide a broad range of services and products to their clients and are major participants in the global currency, equity, commodity, fixed-income and other markets in which a Fund invests or will invest. In certain circumstances, by providing services and products to their clients, these affiliates’ activities will disadvantage or restrict the Funds and/or benefit these affiliates. The Adviser may also acquire material non-public information which would negatively affect the Adviser’s ability to transact in securities for a Fund. JPMorgan and the Funds have adopted policies and procedures reasonably designed to appropriately prevent, limit or mitigate conflicts of interest. In addition, many of the activities that create these conflicts of interest are limited and/or prohibited by law, unless an exception is available. For more information about conflicts of interest, see the Potential Conflicts of Interest section in the Statement of Additional Information.
Temporary Defensive and Cash Positions
For liquidity and to respond to unusual market conditions, the Funds may invest all or most of their total assets in cash and cash equivalents for temporary defensive purposes. In addition, certain Funds may invest in cash and cash equivalents as a principal investment strategy. These investments may result in a lower yield than lower-quality or longer-term investments.
| WHAT IS A CASH EQUIVALENT? |
| Cash equivalents are highly liquid, high-quality instruments with maturities of three months or less on the date they are purchased. They include securities issued by the U.S. government, its agencies and instrumentalities, repurchase agreements, certificates of deposit, bankers’ acceptances, commercial paper, money market mutual funds and bank deposit accounts. |
While the Funds are engaged in a temporary defensive position, they may not meet their investment objectives. These investments may also be inconsistent with a Fund’s main investment strategies. Therefore, the Funds will pursue a temporary defensive position only when market conditions warrant.
Additional Fee Waiver and/or Expense Reimbursement
Service providers to the Funds may, from time to time, voluntarily waive all or a portion of any fees to which they are entitled and/or reimburse certain expenses as they may determine from time to time. The Funds’ service providers may discontinue or modify these voluntary actions at any time without notice. Performance for the Funds will reflect the voluntary waiver of fees and/or the reimbursement of expenses, if any. Without these voluntary waivers and/or expense reimbursements, performance would have been less favorable.
July 1, 2022 | 63
The Funds' Management and Administration
The following Funds are series of JPMorgan Trust I (JPMT I), a Delaware statutory trust:
California Tax Free Bond Fund
High Yield Municipal Fund
Intermediate Tax Free Bond Fund
New York Tax Free Bond Fund
High Yield Municipal Fund
Intermediate Tax Free Bond Fund
New York Tax Free Bond Fund
The following Funds are series of JPMorgan Trust II (JPMT II), a Delaware statutory trust:
Sustainable Municipal Income Fund
Short-Intermediate Municipal Bond Fund
Tax Free Bond Fund
Short-Intermediate Municipal Bond Fund
Tax Free Bond Fund
The following Fund is a series of JPMorgan Trust IV (JPMT IV), a Delaware statutory trust:
Ultra-Short Municipal Fund
Each Trust is governed by the Board of Trustees, which is responsible for overseeing all business activities of the Funds.
Each of the Funds operates in a multiple class structure. A multiple class fund is an open-end investment company that issues two or more classes of shares representing interests in the same investment portfolio.
Each class in a multiple class fund can set its own transaction minimums and may vary with respect to expenses for distribution, administration and shareholder services. This means that one class could offer access to a Fund on different terms than another class. Certain classes may be more appropriate for a particular investor.
Each Fund may issue other classes of shares that have different expense levels and performance and different requirements for who may invest. Call 1-800-480-4111 to obtain more information concerning all of the Funds’ other share classes. A Financial Intermediary who receives compensation for selling Fund shares may receive a different amount of compensation for sales of different classes of shares.
The Funds' Investment Adviser
J.P. Morgan Investment Management Inc. (JPMIM) is the investment adviser to the Funds and makes the day-to-day investment decisions for the Funds. In rendering investment advisory services to certain Funds, JPMIM uses the portfolio management, research and other resources of a foreign (non-U.S.) affiliate of JPMIM and may provide services to a Fund through a “participating affiliate” arrangement, as that term is used in relief granted by the staff of the SEC. Under this relief, U.S. registered investment advisers are allowed to use portfolio management or research resources of advisory affiliates subject to the regulatory supervision of the registered investment adviser. JPMIM is located at 383 Madison Avenue, New York, NY 10179.
JPMIM is a wholly-owned subsidiary of JPMorgan Asset Management Holdings Inc., which is a wholly-owned subsidiary of JPMorgan Chase & Co. (JPMorgan Chase), a bank holding company.
During the most recent fiscal year ended 2/28/22, JPMIM was paid management fees (net of waivers), as shown below, as a percentage of average daily net assets:
| California Tax Free Bond Fund |
0.28% |
| High Yield Municipal Fund |
0.31 |
| Intermediate Tax Free Bond Fund |
0.24 |
| New York Tax Free Bond Fund |
0.28 |
| Short-Intermediate Municipal Bond Fund |
0.15 |
| Sustainable Municipal Income Fund |
0.23 |
| Tax Free Bond Fund |
0.28 |
| Ultra-Short Municipal Fund |
0.00 |
A discussion of the basis the Board of Trustees of the Trusts used in reapproving the investment advisory agreement for the Funds is available in the semi-annual reports for the most recent fiscal period ended August 31.
64 | J.P. Morgan Municipal Bond Funds
The Portfolio Managers
The lead portfolio managers who are primarily responsible for the day-to-day management of the Funds are listed below. As part of that responsibility, the portfolio managers establish and monitor the overall duration, yield curve, and sector allocation strategies for the Funds. The portfolio managers are assisted by multiple sector and research teams who help formulate duration and allocation recommendations and support the strategies of the Funds within the parameters established by the portfolio managers.
JPMorgan Sustainable Municipal Income Fund. Kevin M. Ellis, CFA charterholder and Managing Director and Wayne Godlin, Managing Director, are the co-lead portfolio managers responsible for the day-to-day management of the JPMorgan Sustainable Municipal Income Fund. An employee of JPMIM and/or its affiliates since May 2003 and portfolio manager of the Fund since 2020, Mr. Ellis is a portfolio manager in the U.S. Fixed Income Group and is responsible for managing separate accounts in the Municipal Bond Group. An employee since 2018 and portfolio manager of the Fund since 2020, Mr. Godlin is a senior portfolio manager for the Municipal and Tax Aware Strategies team focusing on high yield municipal bonds. Mr. Godlin has over thirty years of municipal bond market experience in both credit analysis and portfolio management, with a focus on analyzing and managing high yield municipal bond portfolios. Previously, Mr. Godlin was a Consultant, evaluating client municipal bond portfolios, at Herbert J. Sims & Co. from 2017 to 2018 and a senior portfolio manager and a member of the Investment Policy Committee at AllianceBernstein Asset Management from 2009 to 2016. David Sivinski, CFA charterholder and Executive Director, has also participated in the management of the JPMorgan Sustainable Municipal Income Fund since March 2006. In addition to his role as portfolio manager, Mr. Sivinski coordinates municipal management for a number of high net worth clients that focus principally on single state municipal bonds.
JPMorgan Short-Intermediate Municipal Bond Fund. James Ahn has been the lead portfolio manager responsible for the day-to-day management of the JPMorgan Short-Intermediate Municipal Bond Fund since June 2006. Mr. Ahn, Managing Director, is a portfolio manager in the U.S. Fixed Income Group. An employee of JPMIM and/or its affiliates since 1996 and a member of the portfolio management team since February 1999, Mr. Ahn is responsible for strategy formulation and trading short-term tax-aware fixed income strategies for U.S. institutional clients and the Private Bank. Kevin M. Ellis has also participated in the management of the JPMorgan Short-Intermediate Municipal Bond Fund since June 2006. Mr. Ellis, CFA charterholder and Managing Director, is a portfolio manager in the U.S. Fixed Income Group. An employee of JPMIM and/or its affiliates since May 2003, he is responsible for managing separate accounts in the Municipal Bond Group. Previously, Mr. Ellis worked at Alliance Capital/Sanford Bernstein from 1995 through 2003 as a municipal bond trader.
JPMorgan Tax Free Bond Fund. Richard Taormina, Managing Director, has been the lead portfolio manager responsible for the day-to-day management of the JPMorgan Tax Free Bond Fund since February 2005. Mr. Taormina is a portfolio manager in the Global Fixed Income, Currency & Commodities (GFICC) group. An employee since 1997, Mr. Taormina is responsible for managing municipal and tax-aware mutual funds, high net worth and institutional fixed income accounts, and quantitative analysis. Michelle Hallam has participated in the management of the JPMorgan Tax Free Bond Fund since 2014. Mrs. Hallam, CFA charterholder and Executive Director, is a portfolio manager in the Municipal Group within the GFICC group. An employee of JPMIM since 1999, Mrs. Hallam is responsible for portfolios under the Low Tax Rate Strategy. She began her career at JPMIM in July 1999 as an analyst in the Internal Consulting Services program where she worked on projects in Investment Management and Financial Risk Management.
JPMorgan Ultra-Short Municipal Fund. Richard Taormina, Managing Director, and James Ahn, Managing Director, are the lead portfolio managers responsible for the day-to-day management of the JPMorgan Ultra-Short Municipal Fund. Mr. Taormina has been an employee of JPMIM 1997. Mr. Taormina is responsible for managing municipal mutual funds, institutional fixed income accounts and quantitative analysis. Mr. Ahn is a portfolio manager in the U.S. Fixed Income Group. An employee of JPMIM and/or its affiliates since 1996, Mr. Ahn is responsible for strategy formulation and trading short-term tax-aware fixed income strategies for U.S. institutional clients and the Private Bank.
JPMorgan California Tax Free Bond Fund and JPMorgan New York Tax Free Bond Fund. David Sivinski, CFA charterholder and Executive Director, has been the lead portfolio manager responsible for the day-to-day management of the JPMorgan California Tax Free Bond Fund and the JPMorgan New York Tax Free Bond Fund since April 2005 and March 2005, respectively. In addition to his role as portfolio manager, Mr. Sivinski coordinates municipal management for a number of high net worth clients that focus principally on single state municipal bonds. Michelle G. Hallam has also participated in the management of the JPMorgan California Tax Free Bond Fund since June 2004. Biographical information on Mrs. Hallam is described under the JPMorgan Tax Free Bond Fund. Kevin M. Ellis has also participated in the management of the JPMorgan New York Tax Free Bond Fund since May 2005. Biographical information on Mr. Ellis is described under the JPMorgan Short-Intermediate Municipal Bond Fund.
JPMorgan Intermediate Tax Free Bond Fund. Richard Taormina has been the lead portfolio manager responsible for the day-to-day management of the JPMorgan Intermediate Tax Free Bond Fund since February 2006. Biographical information on Mr. Taormina is described under the JPMorgan Tax Free Bond Fund. David Sivinski has also participated in the management of the JPMorgan Intermediate Tax Free Bond Fund since June 2005. In addition to his role as portfolio manager, Mr. Sivinski coordinates municipal
July 1, 2022 | 65
The Funds' Management and Administration (continued)
management for a number of high net worth clients that focus principally on single state municipal bonds. Kevin M. Ellis has also participated in the management of the JPMorgan Intermediate Tax Free Bond Fund since 2014. Biographical information on Mr. Ellis is described under the JPMorgan Short-Intermediate Municipal Bond Fund.
JPMorgan High Yield Municipal Fund. An employee since 2018, Wayne Godlin, Managing Director, is a senior portfolio manager for the Municipal and Tax Aware Strategies team focusing on high yield municipal bonds and is the lead portfolio manager responsible for the day-to-day management of the Fund’s investments. Mr. Godlin has over thirty years of municipal bond market experience in both credit analysis and portfolio management, with a focus on analyzing and managing high yield municipal bond portfolios. Previously, Mr. Godlin was a Consultant, evaluating client municipal bond portfolios, at Herbert J. Sims & Co. from 2017 to 2018 and a senior portfolio manager and a member of the Investment Policy Committee at AllianceBernstein Asset Management from 2009 to 2016. Richard Taormina, Managing Director, is a portfolio manager in the Municipal and Tax Aware Fixed Income Group and is responsible for overseeing the Fund’s investments in taxable and tax-exempt securities. An employee since 1997, Mr. Taormina is responsible for managing municipal mutual funds, institutional fixed income accounts, and quantitative analysis. Mr. Ellis, CFA charterholder and Managing Director, is a portfolio manager in the U.S. Fixed Income Group. An employee of JPMIM and/or its affiliates since May 2003, he is responsible for managing separate accounts in the Municipal Bond Group.
The Statement of Additional Information provides additional information about the portfolio managers’ compensation, other accounts managed by the portfolio managers and the portfolio managers’ ownership of securities in the Funds.
The Funds' Administrator
JPMIM (the Administrator) provides administration services and oversees each Fund's other service providers. The Administrator receives the following annual fee from each Fund for administration services: 0.075% of the first $10 billion of average daily net assets for the Fund, plus 0.050% of average daily net assets of the Fund between $10 billion and $20 billion, plus 0.025% of average daily net assets of the Fund between $20 billion and $25 billion, plus 0.010% of the average daily net assets of the Fund over $25 billion.
The Funds' Shareholder Servicing Agent
The Trusts, on behalf of the Funds, have entered into shareholder servicing agreements with JPMorgan Distribution Services, Inc. (JPMDS) under which JPMDS has agreed to provide certain support services to the Funds’ shareholders. For performing these services, JPMDS, as shareholder servicing agent, receives an annual fee of up to 0.25% of the average daily net assets of the Class A, Class C and Class I Shares of each Fund. JPMDS may enter into service agreements with Financial Intermediaries under which it will pay all or a portion of the annual fee to such Financial Intermediaries for performing shareholder and administrative services.
The Funds' Distributor
JPMDS (the Distributor) is the distributor for the Funds. The Distributor is an affiliate of JPMIM.
Additional Compensation to Financial Intermediaries
JPMIM, JPMDS and, from time to time, other affiliates of JPMorgan Chase may also, at their own expense and out of their own legitimate profits, provide additional cash payments to Financial Intermediaries whose customers invest in shares of the J.P. Morgan Funds. For this purpose, Financial Intermediaries include financial advisors, investment advisers, brokers, financial planners, banks, insurance companies, retirement or 401(k) plan administrators and others, including various affiliates of JPMorgan Chase, that have entered into agreements with JPMDS. These additional cash payments are payments over and above any sales charges (including Rule 12b-1 fees), service fees (including sub-transfer agency and networking fees) that are paid to such Financial Intermediaries, as described elsewhere in this prospectus. These additional cash payments are generally made to Financial Intermediaries that provide shareholder, sub-transfer agency or administrative services or marketing support. Marketing support may include access to sales meetings, sales representatives and Financial Intermediary management representatives, inclusion of the J.P. Morgan Funds on a sales list, including a preferred or select sales list, or other sales programs and/or for training and educating a Financial Intermediary’s employees. These additional cash payments also may be made as an expense reimbursement in cases where the Financial Intermediary provides shareholder services to J.P. Morgan Fund shareholders. JPMIM and JPMDS may also pay cash compensation in the form of finders’ fees that vary depending on the J.P. Morgan Fund and the dollar amount of shares sold. Such additional compensation may provide such Financial Intermediaries with an incentive to favor sales of shares of the J.P. Morgan Funds over other investment options they make available to their customers. See the Statement of Additional Information for more information.
66 | J.P. Morgan Municipal Bond Funds
Investing with J.P. Morgan Funds
Choosing A Share Class
Each share class represents an investment in the same portfolio of securities, but each has different availability and eligibility criteria, sales charges, expenses, dividends and distributions. These arrangements allow you to choose the available class that best meets your needs. You should read this section carefully to determine which share class is best for you. Factors you should consider in choosing a share class include:
•
The amount you plan to invest;
•
The length of time you expect to hold your investment;
•
The total costs associated with your investment, including any sales charges that you pay when you buy or sell your Fund shares and expenses that are paid out of Fund assets over time;
•
Whether you qualify for any reduction or waiver of sales charges;
•
Whether you plan to take any distributions in the near future;
•
The availability of the share class;
•
The services that will be available to you;
•
The amount of compensation that your Financial Intermediary will receive; and
•
The advantages and disadvantages of each share class.
Please read this prospectus carefully, and then select the Fund and share class most appropriate for you and decide how much you want to invest. Each Fund may offer other classes of shares not included in this prospectus that have different expense levels, performance and eligibility requirements from the share classes offered in this prospectus. Call 1-800-480-4111 to obtain more information concerning these or other share classes. A Financial Intermediary may receive different compensation based on the share class sold.
Additional Information that Applies to All Accounts: If your identity or the identity of any other person(s) authorized to act on your behalf cannot be verified, or if potentially criminal activity is identified, the J.P. Morgan Funds and the Distributor reserve the right to reject opening an account for you, close your account, or take such other action they deem reasonable or required by law.
Shares of the Funds have not been registered for sale outside of the United States. This prospectus is not intended for distribution to prospective investors outside of the United States. The Funds generally do not market or sell shares to investors domiciled outside of the United States, even, with regard to individuals, if they are citizens or lawful permanent residents of the United States.
July 1, 2022 | 67
Investing with J.P. Morgan Funds (continued)
| |
Class A |
Class C |
Class I |
| Eligibility1,2 |
May be purchased by the general public |
May be purchased by the general public3 |
May be purchased by: •Institutional Investors who meet the minimum investment requirements; •Individuals purchasing directly from the Fund through JPMorgan Distribution Services, Inc. (the “Distributor”) and meeting the investment minimum requirements; •Financial Intermediaries or any other organization, including affiliates of JPMorgan Chase & Co. (JPMorgan Chase), authorized to act in a fiduciary, advisory or custodial capacity for its clients or customers; •Brokerage program of a Financial Intermediary that has entered into a written agreement with the Distributor to offer such shares (“Eligible Brokerage Program”); and •Employees of JPMorgan Chase and its affiliates and officers or trustees of the JPMorgan Funds.4 |
| Minimum Investment1,5,6 |
$1,000 for each Fund or $50, if establishing a monthly $50 Systematic Investment Plan7 |
$1,000 for each Fund or $50, if establishing a monthly $50 Systematic Investment Plan7 |
$1,000,000 – An investor can combine purchases of Class I Shares of other J.P. Morgan Funds in order to meet the minimum. $1,000 for each Fund or $50, if establishing a monthly $50 Systematic Investment Plan for investments through an Eligible Brokerage Program. $1,000 for each Fund or $50 if establishing a monthly $50 Systematic Investment Plan7for investments by employees of JPMorgan Chase and its affiliates and officers or trustees of the J.P. Morgan Funds.4 |
68 | J.P. Morgan Municipal Bond Funds
| |
Class A |
Class C |
Class I |
| Minimum Subsequent Investments1 |
$508 |
$508 |
No minimum except $50 for investments by employees of JPMorgan Chase and its affiliates and officers or trustees of the J.P. Morgan Funds and investments through an Eligible Brokerage Program. |
| Systematic Investment Plan |
Yes |
Yes |
No except for investments by employees of JPMorgan Chase and its affiliates and officers or trustees of the J.P. Morgan Funds and investments through an Eligible Brokerage Program. |
| Systematic Redemption Plan |
Yes |
Yes |
No except for investments by employees of JPMorgan Chase and its affiliates and officers or trustees of the JPMorgan Funds. |
| Front-End Sales Charge (refer to Sales Charges and Financial Intermediary Compensation Section for more details) |
Up to 2.25% reduced or waived for large purchases and certain investors, eliminated for purchases of $250,000 or more for Short-Intermediate Municipal Bond Fund and all purchases of the Ultra-Short Municipal Fund. Up to 3.75% reduced or waived for large purchases and certain investors, eliminated for purchases of $250,000 or more for Funds (other than Short- Intermediate Municipal Bond Fund and Ultra-Short Municipal Fund) |
None |
None |
| Contingent Deferred Sales Charge (CDSC) (refer to Sales Charges and Financial Intermediary Compensation Section for more details) |
None for purchases of Ultra- Short Municipal Fund. On purchases of $250,000 or more of Short-Intermediate Municipal Bond Fund. •0.75% on redemptions made within 18 months after purchase. On purchases of $250,000 or more for Funds (other than Ultra-Short Municipal Fund or Short-Intermediate Municipal Bond Fund) •0.75% on redemptions made within 18 months after purchase. Waived under certain circumstances. |
•1.00% on redemptions made within 12 months after purchase. Waived under certain circumstances. |
None |
| Distribution (12b-1) Fee |
0.25% of the average daily net assets. |
0.75% of the average daily net assets. |
None |
July 1, 2022 | 69
Investing with J.P. Morgan Funds (continued)
| |
Class A |
Class C |
Class I |
| Service Fee |
0.25% of the average daily net assets. |
0.25% of the average daily net assets. |
0.25% of the average daily net assets. |
| Redemption Fee |
None |
None |
None |
| Conversion Feature9 |
None |
Class C Shares will be converted to Class A Shares in the following instances: •If an investor is eligible to purchase Class A Shares, then their Class C Share positions will convert to Class A Shares after 8 years, calculated from the first day of the month of purchase and processed on the tenth business day of the anniversary month. •If Class C Shares held in an account with a third party broker of record are transferred to an account with the Distributor, those Class C Shares will be converted to Class A Shares on the tenth business day of the month following the transfer. |
None |
| Advantages |
If you are eligible to have the sales charge reduced or eliminated or you have a long- term investment horizon, these shares have lower distribution fees over a longer term investment horizon than Class C Shares. |
No front-end sales charge is assessed so you own more shares initially. These shares may make sense for investors who have a shorter investment horizon relative to Class A Shares. |
No front-end sales charge or CDSC is assessed so you own more shares initially. In addition, Class I Shares have lower fees than Class A and Class C Shares. |
| Disadvantages |
A front-end sales charge is generally assessed, diminishing the number of shares owned. If you are eligible to have the sales charge reduced or eliminated, you may be subject to a CDSC. Class A Shares may not make sense for investors who have a shorter investment horizon relative to Class C Shares. |
Shares are subject to CDSC and have higher ongoing distribution fees. This means that over the long term Class C Shares accrue higher fees than Class A Shares. |
Limited availability and higher minimum initial investment than Class A and Class C Shares. |
1
Financial Intermediaries or other organizations making the Funds available to their clients or customers may impose minimums which may be different from the requirements for investors purchasing directly from the Funds.
2
Certain Retirement Plans may purchase Shares. For more information, see “ELIGIBLE RETIREMENT PLANS” below.
3
Investors who hold shares in accounts where the Distributor is broker of record are no longer eligible to purchase Class C Shares. In addition, shareholders are ineligible to hold Class C Shares if they are eligible for conversion to Class A Shares.
4
Must be purchased directly from the Funds or on an approved JPMorgan Chase & Co. affiliated platforms. Employees for this purpose include officers, directors, trustees, retirees and employees and their immediate family members (i.e., spouses, domestic partners, children, grandchildren, parents, grandparents and any dependent of the person, as defined in section 152 of the Internal Revenue Code) of J.P. Morgan Funds or JPMorgan Chase and its subsidiaries and affiliates. Approved affiliated platforms may impose minimums which may be different from the requirements for investors purchasing directly from the Funds.
5
Investment minimums may be waived for certain types of Group Retirement Plans, as well as for certain fee-based programs. The JPMorgan Funds and/or the
70 | J.P. Morgan Municipal Bond Funds
Distributor reserve the right to waive any initial or subsequent investment minimum.
6
Please see “MINIMUM ACCOUNT BALANCE” for more information about minimum balance requirements.
7
You are eligible for the lower $50 initial investment amount as long as you agree to make regular monthly investments of at least $50 until you reach the required $1,000 investment amount per fund. Once the required amount is reached, you must maintain the minimum $1,000 investment in the Fund.
8
Minimum subsequent investment amount for Systematic Investment Plans established before 3/1/15 is $25.
9
Please see “Class C Shares Conversion Feature” for more information about the conversion feature.
ELIGIBLE RETIREMENT PLANS
The only retirement plans that are eligible to purchase Class Class A, Class C and Class I Shares are the following:
•
Employer sponsored retirement, deferred compensation, employee benefit plans (including health savings accounts) and trusts used to fund those plans held directly at a broker dealer or financial intermediary (that is outside of retirement plan record keeping or third party administrator platform). Employer sponsored plans include 401(k) plans, 457 plans, 403(b) plans, profit-sharing and money purchase pension plans, defined benefit plans, retiree health benefit plans, group annuity separate accounts offered to retirement plans, and non-qualified deferred compensation plans. Purchases may be subject to applicable sales charges as described in this prospectus.
•
Group Retirement Plans (and their successor, related, and affiliated plans) which have these share classes available to participants on or before 4/3/2017, may continue to open accounts for new participants in such share classes of the Fund and purchase additional shares in existing participant accounts.
•
Group Retirement Plans (or financial intermediary platforms available to Group Retirement Plans) that were approved by a Fund and the Distributor after 4/3/2017 and before 12/31/18 because the particular Group Retirement Plan had operational difficulties in implementing the eligibility restrictions may continue to purchase Class A, Class C, Class I or Class L Shares of the Funds.
•
Select Financial Intermediaries, which have received written approval from a Fund on behalf of existing Group Retirement Plan Participants that hold Class C shares, may purchase Class A shares.
All other new Group Retirement Plans are no longer eligible to purchase these share classes.
Sales Charges and Financial Intermediary Compensation
The following section describes the various sales charges and other fees that you will pay if you purchase shares of the Funds. In addition, it describes the types of compensation paid to Financial Intermediaries for the sale of Fund shares and related services. The Funds and/or the Distributor reserve the right to change sales charges, commissions and finder’s fees at any time.
To obtain information regarding sales charges and the reduction, and elimination or waiver of sales charges on Class A and Class C Shares of the J.P. Morgan Funds, see below, visit www.jpmorganfunds.com or call 1-800-480-4111. You may contact your Financial Intermediary about the reduction, elimination or waiver of sales charges. You may also contact your Financial Intermediary about any commissions charged by them on your purchase of Class I Shares
Class A Shares
The public offering price of Class A Shares of each Fund is the net asset value (NAV) per share plus the applicable sales charge, unless you qualify for a waiver of the sales charge. The sales charge is allocated between your Financial Intermediary and the Distributor as shown in the tables below, except if the Distributor, in its discretion, re-allows the entire amount to your Financial Intermediary. In those instances in which the entire amount is re-allowed, such Financial Intermediaries may be deemed to be underwriters under the Securities Act of 1933.
The table below shows the front-end sales charge you would pay at different levels of investment, the commission paid to Financial Intermediaries, any finder’s fees paid to Financial Intermediaries and any applicable CDSC. Purchases at certain dollar levels, known as “breakpoints,” allow for a reduction in the front-end sales charge.
For the JPMorgan Ultra-Short Municipal Fund:
July 1, 2022 | 71
Investing with J.P. Morgan Funds (continued)
| Class A Shares Amount of Investment |
Sales Charge as a % of Offering Price |
Sales Charge as a % of your Investment |
Commission as a % of Offering Price2 |
CDSC |
| Less than $50,000 |
0.00 |
0.00 |
0.00 |
0.00 |
| $50,000 to $99,999 |
0.00 |
0.00 |
0.00 |
0.00 |
| $100,000 to $249,999 |
0.00 |
0.00 |
0.00 |
0.00 |
| $250,000 or more |
0.00 |
0.00 |
0.00 |
0.00 |
For the JPMorgan Short-Intermediate Municipal Bond Fund:
| Class A Shares Amount of Investment |
Sales Charge as a % of Offering Price |
Sales Charge as a % of your Investment1 |
Commission as a % of Offering Price2 |
CDSC |
| Less than $50,000 |
2.25 |
2.30 |
2.00 |
0.00 |
| $50,000 to $99,999 |
2.00 |
2.04 |
1.50 |
0.00 |
| $100,000 to $249,999 |
1.25 |
1.27 |
1.00 |
0.00 |
| |
|
|
|
|
| Amount of Investment |
Sales Charge as a % of Offering Price |
Sales Charge as a % of your Investment |
Finder’s Fee as a % of your Investment4 |
CDSC as a % of your Redemption3 |
| $250,000 to $3,999,999 |
0.00 |
0.00 |
0.75 |
0-18 months – 0.75% |
| $4,000,000 to $9,999,999 |
0.00 |
0.00 |
0.50 | |
| $10,000,000 or more |
0.00 |
0.00 |
0.25 |
For the JPMorgan Tax Free Bond Fund, the JPMorgan California Tax Free Bond Fund, the JPMorgan High Yield Municipal Fund the JPMorgan Intermediate Tax Free Bond Fund, the JPMorgan Sustainable Municipal Income Fund and the JPMorgan New York Tax Free Bond Fund:
| Class A Shares Amount of Investment |
Sales Charge as a % of Offering Price |
Sales Charge as a % of your Investment1 |
Commission as a % of Offering Price2 |
CDSC |
| Less than $100,000 |
3.75 |
3.90 |
3.25 |
0.00 |
| $100,000 to $249,999 |
3.25 |
3.36 |
2.75 |
0.00 |
| |
|
|
|
|
| Amount of Investment |
Sales Charge as a % of Offering Price |
Sales Charge as a % of your Investment |
Finder’s Fee as a % of your Investment4 |
CDSC as a % of your Redemption3 |
| $250,000 to $3,999,999 |
0.00 |
0.00 |
0.75 |
0-18 months — 0.75% |
| $4,000,000 to $49,999,999 |
0.00 |
0.00 |
0.50 | |
| $50,000,000 or more |
0.00 |
0.00 |
0.25 |
1
The actual sales charge you pay may differ slightly from the rates disclosed above due to rounding calculations.
2
The sales charge is allocated between your Financial Intermediary and the Distributor. The Distributor, at its discretion, may re-allow the entire sales charge to your Financial Intermediary; in those instances such Financial Intermediaries may be deemed to be underwriters under the Securities Act of 1933.
3
Please see the “Exchanging Fund Shares” section for details regarding CDSC and exchanges.
The Distributor may also pay Financial Intermediaries a finder’s fee on sales to defined contribution plans with no minimum investment amount.
Finder’s Fee Schedule for Defined Contribution Plans
For the JPMorgan Short-Intermediate Municipal Bond Fund:
72 | J.P. Morgan Municipal Bond Funds
| Class A Shares Amount of Investment |
Sales Charge as a % of Offering Price |
Sales Charge as a % of your Investment |
Finder’s Fee as a % of your Investment |
CDSC as a % of your Redemption1 |
| $0 to $3,999,999 |
0.00 |
0.00 |
0.75 |
0.00 |
| $4,000,000 to $9,999,999 |
0.00 |
0.00 |
0.50 |
0.00 |
| $10,000,000 or more |
0.00 |
0.00 |
0.25 |
0.00 |
For the JPMorgan Tax Free Bond Fund, the JPMorgan California Tax Free Bond Fund, the JPMorgan High Yield Municipal Fund, the JPMorgan Intermediate Tax Free Bond Fund, the JPMorgan Sustainable Municipal Income Fund and the JPMorgan New York Tax Free Bond Fund:
| Class A Shares Amount of Investment |
Sales Charge as a % of Offering Price |
Sales Charge as a % of your Investment |
Finder’s Fee as a % of your Investment |
CDSC as a % of your Redemption1 |
| $0 to $3,999,999 |
0.00 |
0.00 |
0.75 |
0.00 |
| $4,000,000 to $49,999,999 |
0.00 |
0.00 |
0.50 |
0.00 |
| $50,000,000 or more |
0.00 |
0.00 |
0.25 |
0.00 |
1
If a plan redeems the shares for which a finder’s fee has been paid within 18 months of the purchase date, no CDSC is charged; however, the Distributor reserves the right to reclaim the finder’s fee paid to the Financial Intermediary.
Class C Shares
The table below shows the amount of sales charge, commission paid and any CDSC that may be charged.
| Class C Shares Amount of Investment |
Sales Charge as a % of Offering Price |
Sales Charge as a % of your Investment |
Commission as a % of Offering Price |
CDSC as a % of your Redemption |
| All Investments |
0.00 |
0.00 |
1.00 |
0-12 months —1.00% |
Class I Shares
There is no sales charge, commission or CDSC associated with Class I Shares.
Reducing Your Class A Sales Charges
Each Fund permits you to reduce the front-end sales charge you pay on Class A Shares by exercising your Rights of Accumulation or Letter of Intent privileges. Both of these are described below.
Rights of Accumulation: For Class A Shares, a front-end sales charge can be reduced by breakpoint discounts based on the amount of a single purchase or through Rights of Accumulation. By using Rights of Accumulation, you may combine the current market value of any existing qualifying holdings and account types (as described below) with the amount of the current purchase to qualify for a breakpoint and reduced sales charge on the current purchase.
The amount of the sales charge will be calculated based on the higher of (a) the market value of your qualified holdings as of the last calculated NAV prior to your investment or (b) if you purchased shares after July 3, 2017, the initial value of total share purchases, or if you already held shares on July 3, 2017, the market value of the shares on that date, provided that, in either case, the value will be reduced by the market value on the applicable redemption date of any shares you have redeemed. Depending on their operational capabilities, Financial Intermediaries may utilize one or both of the methods described above so your holdings could be valued differently depending on where you hold your shares.
Letter of Intent: By signing a Letter of Intent, you may combine the current market value of any existing qualifying holdings and account types with the value that you intend to buy over a 13 month period to calculate the front-end sales charge and any breakpoint discounts. Each purchase that you make during that 13 month period will receive the sales charge and breakpoint discount that applies to the total amount. The 13 month Letter of Intent period commences on the day that the Letter of Intent is received by the J.P. Morgan Funds or your Financial Intermediary, and you must inform your Financial Intermediary or the J.P. Morgan
July 1, 2022 | 73
Investing with J.P. Morgan Funds (continued)
Funds that you have a Letter of Intent each time you make an investment. Purchases submitted prior to the date on which the Letter of Intent is received by the J.P. Morgan Funds or your Financial Intermediary are considered only in determining the level of sales charge that will be paid. The Letter of Intent will not result in a reduction in the amount of any previously paid sales charges.
A percentage of your investment will be held in escrow until the full amount covered by the Letter of Intent has been invested. If the terms of the Letter of Intent are not fulfilled by the end of the 13th month, you must pay the Distributor the difference between the sales charges applicable to the purchases at the time they were made and the reduced sales charges previously paid or the Distributor will liquidate sufficient escrowed shares to obtain the difference and/or adjust the shareholder’s account to reflect the correct number of shares that would be held after deduction of the sales charge. The Letter of Intent will be considered completed if the shareholder dies within the 13 month period covered by the Letter of Intent. Commissions to dealers will not be adjusted or paid on the difference between the Letter of Intent amount and the amount actually invested before the shareholder’s death. Calculations made to determine whether a Letter of Intent commitment has been fulfilled will be made on the basis of the amount invested prior to the deduction of any applicable sales charge.
Below are the qualifying holdings and account types that may be aggregated in order to exercise your Rights of Accumulation and Letter of Intent privileges to qualify for a reduced front-end sales charge on Class A Shares.
Qualifying Holdings: Class A, Class C, Class I, Class L Shares and Class R6 Shares (only when used in advisory programs) of the J.P. Morgan Funds and Class A, Class C and the Advisor Class units in New York’s 529 Advisor-Guided College Savings Program (NY 529 Advisor-Guided Plan). Investments in the JPMorgan 529 U.S. Government Money Market Portfolio are not included.
Qualifying Accounts:
1.
Your account(s);
2.
Account(s) of your spouse or domestic partner;
3.
Account(s) of children under the age of 21 who share your residential address;
4.
Trust accounts established by any of the individuals in items (1) through (3) above. If the person(s) who established the trust is deceased, the trust account may be aggregated with the account(s) of the primary beneficiary of the trust;
5.
Solely controlled business accounts; and
6.
Single-participant retirement plans of any of the individuals in items (1) through (3) above.
You may use your qualifying holdings and account types even if they are held at different Financial Intermediaries. In order to obtain any reduction in the sales charge by utilizing either the Rights of Accumulation or Letter of Intent privileges, you must, before each purchase of Class A Shares, inform your Financial Intermediary or the J.P. Morgan Funds if you have any existing holdings that may be aggregated with your current purchase in order to qualify for a reduced front-end sales charge.
In order to verify your eligibility for a reduced sales charge, you may be required to provide appropriate documentation, such as an account statement or the social security or tax identification number on an account, so that J.P. Morgan Funds may confirm (1) the value of each of your accounts invested in J.P. Morgan Funds or in the NY 529 Advisor-Guided Plan and (2) the value of the accounts owned by your spouse or domestic partner and by children under the age of 21 who share your residential address.
Certain Financial Intermediaries may not participate in extending the Rights of Accumulation or Letter of Intent privileges to your holdings in the NY 529 Advisor-Guided Plan. Please check with your Financial Intermediary to determine whether the Financial Intermediary makes these privileges available with respect to NY 529 Advisor-Guided Plan investments.
Additional information regarding the reduction of Class A sales charges is available in each Fund's Statement of Additional Information. To determine if you are eligible for Rights of Accumulation or Letter of Intent privileges or to request a copy of the Statement of Additional Information, call 1-800-480-4111. These programs may be terminated or amended at any time.
Sales Charge Waivers
The availability of certain sales charge waivers and discounts will depend on whether you purchase your shares directly from a Fund or on a Financial Intermediary platform. Financial Intermediaries may have different policies and procedures regarding the availability of front-end sales load waivers or contingent deferred (back-end) sales load (“CDSC”) waivers, which are discussed in Appendix A. Except as described in Appendix A, purchases will be subject to the waivers or discounts discussed below.
Waiver of the Class A Sales Charge
No sales charge is imposed on Class A Shares of the Funds if the shares were:
1.
Bought with the reinvestment of dividends and capital gains distributions.
74 | J.P. Morgan Municipal Bond Funds
2.
Acquired in exchange for shares of another J.P. Morgan Fund if a comparable sales charge has been paid for the exchanged shares.
3.
Bought through a Financial Intermediary and not directly from the Funds by officers, directors, trustees, retirees and employees, and their immediate family members (i.e., spouses, domestic partners, children, grandchildren, parents, grandparents and any dependent of the person, as defined in Section 152 of the Internal Revenue Code) of:
•
J.P. Morgan Funds.
•
JPMorgan Chase and its subsidiaries and affiliates.
Former employees and their immediate family members can make subsequent purchases in accounts established during the employees’ employment. Officers, directors, trustees, retirees and employees, and their immediate family members of J.P. Morgan Funds and JPMorgan Chase and its subsidiaries and affiliates may open new Class I Share accounts subject to a $1,000 minimum investment requirement provided such accounts are opened directly from the Funds and not through a Financial Intermediary. Class I Shares have lower expenses than Class A Shares. Please call 1-800-480-4111 for more information concerning all of the Funds’ other share classes.
4.
Bought by employees of:
•
DST Asset Manager Solutions, Inc. and its subsidiaries and affiliates.
•
Financial Intermediaries or financial institutions that have entered into dealer agreements with the Funds or the Distributor and their subsidiaries and affiliates (or otherwise have an arrangement with a Financial Intermediary or financial institution with respect to sales of Fund shares). This waiver includes the employees’ immediate family members (i.e., spouses, domestic partners, children, grandchildren, parents, grandparents and any dependent of the employee, as defined in Section 152 of the Internal Revenue Code).
5.
Bought by:
•
Employer sponsored retirement, deferred compensation, employee benefit plans (including health savings accounts) and trusts used to fund those plans. Employer sponsored plans include 401(k) plans, 457 plans, 403(b) plans, profit-sharing and money purchase pension plans, defined benefit plans, retiree health benefit plans and non-qualified deferred compensation plans. Traditional IRAs, Roth IRAs, Coverdell Education Savings Accounts, SEPs, SARSEPs, SIMPLE IRAs and KEOGHs plans do not qualify under this waiver.
•
Financial Intermediaries, including affiliates of JPMorgan Chase, who have a dealer arrangement with the Distributor, act in a custodial capacity, or who place trades for their own accounts or for the accounts of their clients and who charge a management, asset allocation, consulting, or other fee for their services.
•
Financial Intermediaries who have entered into an agreement with the Distributor and have been approved by the Distributor to offer Fund shares to investment brokerage programs in which the end shareholder makes investment decisions independent of a financial advisor; these programs may or may not charge a transaction fee.
•
Tuition programs that qualify under Section 529 of the Internal Revenue Code.
•
A bank, trust company or thrift institution which is acting as a fiduciary exercising investment discretion, provided that appropriate notification of such fiduciary relationship is reported at the time of the investment to the Fund or the Fund’s Distributor.
6.
Bought in connection with plans of reorganization of a J.P. Morgan Fund, such as mergers, asset acquisitions and exchange offers to which the Fund is a party. However, you may pay a CDSC when you redeem the Fund shares you received in connection with the plan of reorganization.
7.
Purchased in Individual Retirement Accounts (IRAs) established prior to September 2, 2014:
i.
That were established through a rollover from a qualified retirement plan for which J.P. Morgan Retirement Plan Services LLC had a contractual relationship to provide recordkeeping for the plan (an “RPS Rollover IRA”) or an IRA that was subsequently established in connection with the RPS Rollover IRA;
ii.
Where JPMorgan Institutional Investments Inc. continues to be the broker of record for the IRA; and
iii.
Where UMB Bank, n.a. continues to serve as custodian for the IRA.
8. Purchased in an account where the Distributor is the broker of record as of April 10, 2017.
July 1, 2022 | 75
Investing with J.P. Morgan Funds (continued)
To determine if you qualify for a sales charge waiver, call 1-800-480-4111 or contact your Financial Intermediary. These waivers may not continue indefinitely and may be discontinued at any time without notice.
Contingent Deferred Sales Charge (CDSC)
Certain redemptions of Class A and Class C Shares are subject to a CDSC. Please see “SALES CHARGES AND FINANCIAL INTERMEDIARY COMPENSATION” for the amount of the applicable CDSC. The CDSC is calculated by multiplying the original cost of the shares by the CDSC rate. For Class A Shares, the CDSC is calculated from the date of the purchase of the applicable shares. For Class C Shares, the Funds assume that all purchases made in a given month were made on the first day of the month.
No CDSC is imposed on share appreciation, nor is a CDSC imposed on shares acquired through reinvestment of dividends or capital gains distributions.
To keep your CDSC as low as possible, the Funds will first redeem any shares that are not subject to a CDSC (i.e., shares that have been held for longer than the CDSC period or shares acquired through reinvestment of dividends or capital gains distributions), followed by the shares held for the longest time. You should retain any records necessary to substantiate historical costs because the Distributor, the Funds, the transfer agent and your Financial Intermediary may not maintain such information.
If you received Fund shares in connection with a fund reorganization, the CDSC applicable to your original shares (including the period of time you have held those shares) will be applied to the shares received in the reorganization.
Waiver of the Class A and Class C CDSC
No CDSC is imposed on redemptions of shares:
1.
If you participate in a Systematic Redemption Plan and withdraw no more than the amount permitted to be withdrawn without a CDSC. Please refer to Systematic Redemption Plan in the “HOW TO REDEEM” table below.
2.
Made due to the death or disability of a shareholder. For shareholders that become disabled, the redemption must be made within one year of initial qualification for Social Security disability payments or within one year of becoming disabled as defined in section 72(m)(7) of the Internal Revenue Code. This waiver is only available for accounts opened prior to the shareholder’s disability. In order to qualify for the waiver, the Distributor must be notified of the death or disability at the time of the redemption order and be provided with satisfactory evidence of such death or disability.
3.
That represent a Required Minimum Distribution from your IRA Account or other qualifying retirement plan. The waiver only applies to the pro rata required minimum distribution amount from the assets invested in one or more of the J.P. Morgan Funds.
4.
That are part of a J.P. Morgan Fund-initiated event, such as mergers, liquidations, asset acquisitions, and exchange offers to which the Fund is a party, or result from a failure to maintain the required minimum balance in an account. However, you may pay a sales charge when you redeem the Fund shares you received in connection with the Fund-initiated event.
5.
Exchanged into the same share class of other J.P. Morgan Funds. Your new Fund will be subject to the CDSC of the Fund from which you exchanged and the current holding period is carried over to your new shares. Please read “Exchanging Fund Shares” for more information.
6.
For Class C Shares only, if your Financial Intermediary has notified the Distributor before you invest that it is waiving its commission.
7.
Sold as a return of excess contributions from an IRA Account.
8.
Sold to pay the Distributor or a Financial Intermediary account-related fees (only if the transaction is initiated by the Distributor or the Financial Intermediary).
To see if you qualify for a CDSC waiver, call 1-800-480-4111 or contact your Financial Intermediary. These waivers may not continue indefinitely and may be discontinued at any time without notice.
Repurchase Rights
If you redeem shares in a mutual fund, Repurchase Rights may allow you to reinvest all or a portion of the redemption proceeds or repurchase shares at NAV if the purchase is made within 90 days of the sale or distribution. In order to take advantage of Repurchase Rights, you must inform your Financial Intermediary or J.P. Morgan Funds you wish to do so at the time of purchase. This policy does not apply to systematic purchases.
There is no sales charge on:
76 | J.P. Morgan Municipal Bond Funds
•
Class A Shares if they are bought with proceeds from the sale of Class A Shares of a J.P. Morgan Fund
•
Class A Shares if they are bought with proceeds from the sale of Class I Shares or Class L Shares of a J.P. Morgan Fund
•
Class A Shares if they are bought with proceeds from the sale of Class R6 Shares of a J.P. Morgan Fund held in a fee-based advisory account
•
Class A Shares if they are bought with proceeds from the sale of Morgan Shares of a J.P. Morgan Money Market Fund, provided that the Morgan Shares were acquired from Class A Shares where a sales charge was paid or waived
In addition, if you repurchase Class C Shares within 90 days of a redemption, there will be no CDSC on the new Class C Shares.
Rule 12b–1 Fees
Each Fund described in this prospectus has adopted a Distribution Plan under Rule 12b-1 with respect to Class A and Class C Shares that allows it to pay distribution fees for the sale and distribution of these shares of the Funds. These fees are called “Rule 12b-1 fees.” Rule 12b-1 fees are paid by the Funds to the Distributor as compensation for its services and expenses in connection with the sale and distribution of Fund shares. The Distributor in turn pays all or part of these Rule 12b-1 fees to Financial Intermediaries that have agreements with the Distributor to sell shares of the Funds. The Distributor may pay Rule 12b-1 fees to its affiliates. Payments are not tied to actual expenses incurred.
The Rule 12b-1 fees (based on average daily net assets of the share class) vary by share class as follows:
| Class |
Rule 12b-1 Fee |
| Class A |
0.25% |
| Class C |
0.75% |
| Class I |
None |
Rule 12b-1 fees, together with the CDSC, help the Distributor sell Class C Shares without an upfront sales charge by defraying the costs of advancing brokerage commissions and other expenses paid to Financial Intermediaries.
Because Rule 12b-1 fees are paid out of Fund assets on an ongoing basis, over time these fees will increase the cost of your investment and may cost you more than paying other types of sales charges.
With respect to Class A Shares transactions, for purchases at NAV where the Distributor paid a finder’s fee at the time of the purchase, the selling Financial Intermediary will start to receive the applicable Rule 12b-1 fee in the 13th month after the sale and the Distributor will retain the Rule 12b-1 fees during such period.
Networking and Sub-Transfer Agency Fees
JPMDS, as shareholder servicing agent, has entered into agreements with Financial Intermediaries pursuant to which the Financial Intermediary is paid for services such as networking or sub-transfer agency (collectively, the “Sub-TA Agreements”). Sub-TA Agreement payments are generally based on either (1) a percentage of the average daily net assets of clients serviced by such Financial Intermediary up to a set maximum dollar amount per shareholder account serviced, or (2) a per account fee based on the number of accounts serviced by such Financial Intermediary. Sub-TA Agreement payments are in addition to, rather than in lieu of, Rule 12b-1 fees the Financial Intermediary may also be receiving pursuant to agreements with the Distributor for classes with Rule 12b-1 fees. Payments to Financial Intermediaries for sub-transfer agency services will be made by JPMDS, as shareholder servicing agent, from the service fee. From time to time, JPMIM or its affiliates may pay a portion of the sub-transfer agency fees at its or their own expense and out of its or their legitimate profits.
Service Fees
JPMDS, as shareholder servicing agent, receives an annual fee of up to the following fee (based on the average daily net assets of the applicable class of a Fund).
| Class |
Service Fee |
| Class A |
0.25% |
| Class C |
0.25% |
| Class I |
0.25% |
JPMDS may enter into service agreements with Financial Intermediaries under which it will pay all or a portion of that fee to such Financial Intermediaries for performing shareholder and administrative services.
July 1, 2022 | 77
Investing with J.P. Morgan Funds (continued)
Conversion Feature for Certain Class A Shares Held by Employees
Employees will no longer be eligible to hold Class A Shares directly with the Funds. Therefore, Class A Shares held by employees purchased directly from the Funds were converted to Class I Shares beginning on November 6, 2020. Employees include officers, directors, trustees, retirees and employees, and their immediate family members (i.e., spouses, domestic partners, children, grandchildren, parents, grandparents and any dependent of the person, as defined in Section 152 of the Internal Revenue Code) of J.P. Morgan Funds and JPMorgan Chase and its subsidiaries and affiliates.
Because the share price of the Class I Shares may be higher than that of the Class A Shares at the time of conversion, you may receive fewer Class I Shares; however, the dollar value will be the same. After conversion, your new shares will no longer be subject to Rule 12b-1 fees charged on Class A Shares. You will not be assessed any sales charges, fees or other charges for the conversion of the shares, nor will you be subject to any federal income tax as a result of the conversion.
Class C Shares Conversion Feature
Class C Shares will be converted to Class A Shares in the following instances:
•
If an investor is eligible to purchase Class A Shares, then their Class C Share positions will convert to Class A Shares after 8 years, calculated from the first day of the month of purchase and processed on the tenth business day of the anniversary month.
•
If Class C Shares held in an account with a third party broker of record are transferred to an account with the Distributor, those Class C Shares will be converted to Class A Shares on the tenth business day of the month following the transfer.
Because the share price of the Class A Shares may be higher than that of the Class C Shares at the time of conversion, you may receive fewer Class A Shares; however, the dollar value will be the same.
After conversion, your new shares will be subject to the lower Rule 12b-1 fees charged on Class A Shares. You will not be assessed any sales charges, fees or other charges for the conversion of shares, nor will you be subject to any federal income tax as a result of the conversion. You will not pay any CDSC when you sell Class A Shares that have converted from Class C Shares.
Purchasing Fund Shares
You may purchase shares directly from the J.P. Morgan Funds through the Distributor or through your Financial Intermediary.
This prospectus offers multiple share classes. Each share class has different sales charges and/or expenses. When deciding what share class to buy, you should consider the amount of your investment, the length of time you intend to hold the shares, the sales charges and expenses applicable to each share class and whether you qualify for any sales charge discounts. Please refer to “Choos- ing a Share Class” for investment minimums for initial and subsequent purchases and to help you determine which share class would be best for you.
Purchase and redemption orders will be accepted only on days that J.P. Morgan Funds are open for business. The Funds are open for business on each day the NYSE is open for trading. A purchase or redemption order received by the Funds prior to the close of regular trading on the NYSE (normally 4:00 p.m. ET) (“Fund Close”), on a day the Funds are open for business, will be effected at that day’s NAV. The Funds will not treat an intraday unscheduled disruption or closure in NYSE trading as a closure of the NYSE and will calculate NAV as of 4:00 p.m. ET, if the particular disruption or closure directly affects only the NYSE. An order received after the Fund Close will generally be effected at the NAV determined on the next business day. However, orders received by Financial Intermediaries on a business day prior to the Fund Close and communicated to the Funds prior to such time as agreed upon by the Funds and the Financial Intermediary will be effected at the NAV determined on the business day the order was received by the Financial Intermediary.
A purchase order must be supported by all appropriate documentation and information in the proper form. The Funds may refuse to honor incomplete purchase orders.
Share ownership is electronically recorded; therefore, no certificate will be issued. A shareholder who purchases shares of a Fund that accrues dividends daily will not accrue a dividend on the day of the purchase.
If you purchase shares through your Financial Intermediary, contact your investment representative for its requirements and procedures. If a Financial Intermediary holds your shares, it is the responsibility of the Financial Intermediary to send your purchase order to the Fund. Your Financial Intermediary may have an earlier cut-off time for purchase orders.
If you purchase shares directly with the Funds, see the information below.
78 | J.P. Morgan Municipal Bond Funds
| HOW TO PURCHASE DIRECTLY WITH THE J.P. MORGAN FUNDS | ||
| |
Opening a New Account |
Purchasing into an Existing Account |
| By Phone or Online 1-800-480-4111 Shareholder Services representatives are available Monday through Friday from 8:00 am to 6:00 pm ET. www.jpmorganfunds.com Note: Certain account types are not available for online account access. Please call for additional information. |
A new account generally may not be opened by phone or online. Employees of JPMorgan Chase & Co. may open a new account online. A new fund position can be added to an existing account by phone or online if you have bank information on file. The minimum initial investment requirement must be met. |
You must already have bank information on file. If we do not have bank information on file, you must submit written instructions. Please call for instructions on how to add bank information to your account. |
| By Mail Regular mailing address: J.P. Morgan Funds Services P.O. Box 219143 Kansas City, MO 64121-9143 Overnight mailing address: J.P. Morgan Funds Services 430 W 7th Street, Suite 219143 Kansas City, MO 64105-1407 |
Mail the completed and signed application with a check to our Regular or Overnight mailing address. Refer to the Additional Information Regarding Purchases section. |
Please mail your check and include your name, the Fund name, and your fund account number. |
| All checks must be made payable to one of the following: •J.P. Morgan Funds; or •The specific Fund in which you are investing. Please include your existing account number, if applicable. All checks must be in U.S. dollars. The J.P. Morgan Funds do not accept credit cards, cash, starter checks, money orders or credit card checks. The Funds and/or the Distributor reserve the right to refuse “third-party” checks and checks drawn on non- U.S. financial institutions even if payment may be effected through a U.S. financial institution. Checks made payable to any individual or company and endorsed to J.P. Morgan Funds or a Fund are considered third-party checks. | ||
| By ACH or Wire1 1-800-480-4111 Wire Instructions: DST Asset Manager Solutions, Inc. 2000 Crown Colony Drive Quincy, MA 02169 Attn: J.P. Morgan Funds Services ABA: 021 000 021 DDA: 323 125 832 FBO: Fund Name Fund: Fund # Account: Your Account # and Your Account Registration |
You may include bank information on your application for your initial purchase to be processed via Automated Clearing House (ACH) rather than sending a check. New accounts cannot be opened by wire purchase. |
Purchase by ACH: To process a purchase via ACH using bank information on file you may call us or process the purchase online. Purchase by Wire: If you choose to pay by wire, please call to notify the Fund of your purchase. You must also initiate the wire with your financial institution. |
July 1, 2022 | 79
Investing with J.P. Morgan Funds (continued)
| HOW TO PURCHASE DIRECTLY WITH THE J.P. MORGAN FUNDS | ||
| |
Opening a New Account |
Purchasing into an Existing Account |
| Systematic Investment Plan1 |
You may include instructions to set up a Systematic Investment Plan on your application. Bank Information must be included. Refer to Choosing A Share Class for fund minimums. |
If bank information is on file, you may call, go online or mail written instructions to start, edit or delete a Systematic Investment Plan. You cannot have a Systematic Investment Plan and a Systematic Redemption Plan or Systematic Exchange Plan on the same fund account. If bank information is not on file, you will be required to submit a completed form with your bank information and Systematic Investment Plan details. |
1
The Funds currently do not charge for these services, but may impose a charge in the future. However, your bank may impose a charge for debiting your bank account.
Transactions by phone, fax or the Internet
You may access your account and conduct certain transactions using phone, fax or the J.P. Morgan Funds website. Phone conversations are recorded. The J.P. Morgan Funds and their agents use reasonable procedures to verify the identity of the shareholder. If these procedures are followed, the J.P. Morgan Funds and their agents are not liable for any losses, liability, cost or expenses (including attorney fees) that may occur from acting on unauthorized or fraudulent instructions. Therefore please take precautions to protect your account information and immediately review account statements or other information provided to you. In addition, a confirmation is sent promptly after a transaction. Please review it carefully and contact J.P. Morgan Funds Services or your Financial Intermediary immediately about any transaction you believe to be unauthorized. You may revoke your right to make purchases over the phone or by mailing written instructions to us.
You may not always reach J.P. Morgan Funds Services by phone or online. This may be true at times of unusual market changes and shareholder activity. You can mail us your instructions or contact your Financial Intermediary. We may modify or cancel the ability to purchase or redeem shares online or by phone without notice.
Additional Information Regarding Purchases
Federal law requires all financial institutions to obtain, verify and record information that identifies each person who opens an account. When you open an account, we will ask for your name, residential or business street address, date of birth (for an individual), and other information that will allow us to identify you, including your social security number, tax identification number or other identifying number. The J.P. Morgan Funds cannot waive these requirements. A Fund is required by law to reject your Account Application if the required identifying information is not provided.
We will attempt to collect any missing information required on the Account Application by contacting either you or your Financial Intermediary. If we cannot obtain this information within the established time frame, your Account Application will be rejected. Amounts received prior to receipt of the required information will be held uninvested and will be returned to you without interest if your Account Application is rejected. If the required information is obtained, your investment will be accepted and you will pay the NAV per share next calculated after all of the required information is received, plus any applicable sales charge.
Once we have received all of the required information, federal law requires us to verify your identity. After an account is opened, we may restrict your ability to purchase additional shares until your identity is verified. If we are unable to verify your identity within a reasonable time, the Funds and/or the Distributor reserve the right to close your account at the current day’s NAV per share. If your account is closed for this reason, your shares will be redeemed at the NAV per share next calculated after the account is closed, less any applicable CDSC are fees. In addition, you will not be entitled to recoup any sales charges paid to a Fund in connection with your purchase of Fund shares.
Purchases by wire may be canceled if J.P. Morgan Funds Services does not receive payment by 4:00 p.m. ET on the settlement date. You will be responsible for any expenses and/or losses to the Funds.
80 | J.P. Morgan Municipal Bond Funds
Exchanging Fund Shares
An exchange is selling shares of one J.P. Morgan Fund and taking the proceeds to simultaneously purchase shares of another J.P. Morgan Fund. Before making an exchange request, you should read the prospectus of the J.P. Morgan Fund whose shares you would like to purchase by exchange. You can obtain a prospectus for any J.P. Morgan Fund by contacting your Financial Intermediary, by visiting www.jpmorganfunds.com, or by calling 1-800-480-4111.
| EXCHANGE PRIVILEGES |
| Class A Shares of a Fund may be exchanged for: |
| •Class A Shares of another J.P. Morgan Fund, |
| •Morgan Shares of a J.P. Morgan money market fund (except for JPMorgan Prime Money Market Fund), or |
| •Another share class of the same Fund if you are eligible to purchase that class. |
| Class C Shares of a Fund may be exchanged for: |
| •Class C Shares of another J.P. Morgan Fund (except for JPMorgan Prime Money Market Fund). Your new Class C Shares will be subject to the CDSC of the Fund from which you exchanged, and the current holding period for your exchanged Class C Shares is carried over to your new shares. |
| •Class I, Class L or Class R6 Shares, if available, of the same Fund, provided you meet the eligibility requirements for the class you are exchanging into. In addition, the Class C Shares that you wish to exchange must not currently be subject to any CDSC. |
| Class I Shares of a Fund may be exchanged for: |
| •Class I Shares of another J.P. Morgan Fund, |
| •Morgan Shares of a J.P. Morgan money market fund (except for JPMorgan Prime Money Market Fund), or |
| •Another share class of the same Fund if you are eligible to purchase that class. |
The following rules and procedures apply to exchanges:
•
All exchanges are subject to meeting any investment minimum or eligibility requirements of the new Fund and class.
•
The J.P. Morgan Funds will provide 60 days’ written notice of any termination of or material change to your exchange privilege.
•
All exchanges are based upon the net asset value that is next calculated after the Fund receives your order, provided the exchange out of one Fund must occur before the exchange into the other Fund.
•
In order for an exchange to take place on the date that the order is submitted, the order must be received prior to the close of both the Fund that you wish to exchange into and the Fund that you wish to exchange out of, otherwise, the exchange will occur on the following business day on which both Funds are open.
•
A shareholder that exchanges into shares of a Fund that accrues dividends daily, including a money market fund, will not accrue a dividend on the day of the exchange. A shareholder that exchanges out of shares of a Fund that accrues a daily dividend will accrue a dividend on the day of the exchange.
•
The exchange privilege is not intended as a way for you to speculate on short-term movements in the market. Therefore, to prevent disruptions in the management of J.P. Morgan Funds, certain J.P. Morgan Funds limit excessive exchange activity as described in the “Frequent Trading Policy” section. Your exchange privilege will be limited or revoked if the exchange activity is considered excessive. In addition, any J.P. Morgan Fund may reject any exchange request for any reason, including if it is not in the best interests of the Fund and/or its shareholders to accept the exchange.
•
For Class A and Class C Shares only, you can set up a systematic exchange program to automatically exchange shares on a regular basis. However, you cannot have simultaneous systematic investment plans for the same Fund. You may call 1-800-480-4111 for complete instructions.
Generally, you will not pay a sales charge on an exchange except as specified below.
If you exchange Class A or Class C Shares of a Fund that are subject to a CDSC for Class A (Morgan Shares of a J.P. Morgan money market fund) or Class C Shares, respectively, of another Fund, you will not pay a CDSC at the time of the exchange, however:
1.
Your new Class A (Morgan Shares of a J.P. Morgan money market fund) or Class C Shares will be subject to the CDSC of the Fund from which you exchanged, and
2.
The current holding period for your exchanged Class A (Morgan Shares of a J.P. Morgan money market fund) or Class C Shares, is carried over to your new shares.
Following an exchange, the fees and expenses of the new share class may be higher than those of the class you previously held. You should carefully review the prospectus for the new share class, including information on the fees, expenses and exchange features of the new share class, or contact your Financial Intermediary for more information.
July 1, 2022 | 81
Investing with J.P. Morgan Funds (continued)
Tax Consequences on Exchanges
Generally, an exchange between J.P. Morgan Funds is considered a sale and generally results in a capital gain or loss for federal income tax purposes. An exchange between classes of shares of the same Fund is generally not taxable for federal income tax purposes. You should talk to your tax advisor before making an exchange.
Redeeming Fund Shares
If you sell shares through your Financial Intermediary, contact your investment representative for its requirements and procedures. If a Financial Intermediary holds your shares, it is the responsibility of the Financial Intermediary to send your redemption order to the Fund. Your Financial Intermediary may have an earlier cut-off time for redemption orders.
If you sell shares directly with a Fund, see the information below.
Your redemption proceeds may be mailed to you at your address of record1, wired, or sent by ACH to a pre-existing bank account on file.
| HOW TO REDEEM | |
| By Phone or Online Note: Certain account types are not available for online account access. |
Call us at 1-800-480-4111 Shareholder Services representatives are available Monday through Friday from 8:00 am to 6:00 pm ET. www.jpmorganfunds.com |
| By Mail |
Regular mailing address: J.P. Morgan Funds Services P.O. Box 219143 Kansas City, MO 64121-9143 Overnight mailing address: J.P. Morgan Funds Services 430 W 7th Street, Suite 219143 Kansas City, MO 64105-1407 |
| Systematic Redemption Plan2, 3 Note:The Funds currently do not charge for this service, but may impose a charge in the future. |
You may include instructions to set up a Systematic Redemption Plan on your application. Payment instructions must be included. You may call, or mail written instructions to start, edit or delete a Systematic Redemption Plan. You may send a written redemption request to your Financial Intermediary, if applicable, or to the Fund at the following address: J.P. Morgan Funds Services P.O. Box 219143 Kansas City, MO 64121-9143 You may redeem over the phone. Please see “Can I redeem by phone?” for more information. If you own Class A or Class C Shares, the applicable CDSC will be deducted from those payments unless such payments are made: 4 •Monthly and constitute no more than 1/12 of 10% of your then-current balance in the Fund each month; or •Quarterly and constitute no more than ¼ of 10% of your then-current balance in the Fund each quarter. It may not be in your best interest to buy additional Class A Shares while participating in a Systematic Redemption Plan. This is because Class A Shares have an upfront sales charge. |
1
You cannot request a redemption by check to be sent to an address updated within 15 days.
2
If the amount of the systematic payment exceeds the income earned by your account since the previous payment under the Systematic Redemption Plan, payments will be made by redeeming some of your shares. This will reduce the amount of your investment, up to possibly closing your account.
82 | J.P. Morgan Municipal Bond Funds
3
The Funds currently do not charge for these services, but may impose a charge in the future. However, your bank may impose a charge for crediting your bank account.
4
Your current balance in the Fund for purposes of these calculations will be determined by multiplying the number of shares held by the last calculated NAV per share of the applicable class.
You may redeem some or all of your shares on any day that the Funds are open for business. You will not be permitted to enter a redemption order for shares purchased directly through J.P. Morgan Funds Services by check or through an ACH transaction for five business days following the acceptance of a purchase order unless you provide satisfactory proof that your purchase check or ACH transaction has cleared (sometimes referred to as uncollected shares).
If a Fund or Financial Intermediary receives your redemption order before the close of the NYSE (normally 4 p.m. ET or before 4:00 p.m. ET, if the NYSE closes before 4:00 p.m. ET), you will receive the NAV per share calculated after your redemption order is received in good order (meaning that it includes the information required by, and complies with security requirements implemented by, the Fund’s transfer agent or the Fund), minus the amount of any applicable CDSC are fees. Your Financial Intermediary may have an earlier cut-off time for redemption orders and may charge a fee to process redemption of shares. A shareholder that redeems out of shares of a Fund that accrues a daily dividend will accrue a dividend on the day of the redemption.
All redemption requests must be supported by valid identity authentication, the appropriate documentation (if applicable) and any necessary information in good order. Additional information may be required depending on the situation.
For accounts held directly with the Funds, the length of time that the Funds typically expect to pay redemption proceeds depends on whether payment is made by ACH, wire or check. The Funds typically expect to make payments of redemption proceeds by wire or ACH on the next business day following receipt of the redemption order by the Funds. For payment by check, the Funds typically expect to mail the check on the next business day following receipt of the redemption order by the Funds.
For accounts held through Financial Intermediaries, the length of time that the Funds typically expect to pay redemption proceeds depends on the method of payment and the agreement between the Financial Intermediary and the Funds. For redemption proceeds that are paid directly to you by the Fund, the Fund typically expects to make payments by wire or ACH or by mailing a check on the next business day following the Fund’s receipt of a redemption order from the Financial Intermediary. For payments that are made to your Financial Intermediary for transmittal to you, the Funds expect to pay redemption proceeds to the Financial Intermediary within 1 to 3 business days following the Fund’s receipt of the redemption order from the Financial Intermediary.
Payment of redemption proceeds may take longer than the time a Fund typically expects and may take up to seven days as permitted by the Investment Company Act of 1940.
Transactions by phone, fax or the Internet
You may access your account and conduct certain transactions using phone, fax or the J.P. Morgan Funds website. Phone conversations are recorded. The J.P. Morgan Funds and their agents use reasonable procedures to verify the identity of the shareholder. If these procedures are followed, the J.P. Morgan Funds and their agents are not liable for any losses, liability, cost or expenses (including attorney fees) that may occur from acting on unauthorized or fraudulent instructions. Therefore please take precautions to protect your account information and immediately review account statements or other information provided to you. In addition, a confirmation is sent promptly after a transaction. Please review it carefully and contact J.P. Morgan Funds Services or your Financial Intermediary immediately about any transaction you believe to be unauthorized. You may revoke your right to make redemptions over the phone or by mailing written instructions to us.
You may not always reach J.P. Morgan Funds Services by phone or online. This may be true at times of unusual market changes and shareholder activity. You can mail us your instructions or contact your Financial Intermediary. We may modify or cancel the ability to purchase or redeem shares online or by phone without notice.
Additional Information Regarding Redemptions
Medallion signature guarantees may be required if:
•
You want to redeem shares with a value of $50,000 or more and you want to receive your proceeds in the form of a check; or
•
You want your payment sent to an address, bank account or payee other than the one currently designated on your Fund account.
The Fund may refuse to honor incomplete redemption orders.
The Fund may suspend your ability to redeem when:
1.
Trading on the NYSE is restricted;
July 1, 2022 | 83
Investing with J.P. Morgan Funds (continued)
2.
The NYSE is closed (other than weekend and holiday closings);
3.
Federal securities laws permit;
4.
The SEC has permitted a suspension; or
5.
An emergency exists, as determined by the SEC.
You generally will recognize a gain or loss on a redemption for federal income tax purposes. You should talk to your tax advisor before making a redemption.
Generally, all redemptions will be for cash. The J.P. Morgan Funds typically expect to satisfy redemption requests by selling portfolio assets or by using holdings of cash or cash equivalents. On a less regular basis, the Funds may also satisfy redemption requests by borrowing from another Fund, by drawing on a line of credit from a bank, or using other short-term borrowings from its custodian. These methods may be used during both normal and stressed market conditions. In addition to paying redemption proceeds in cash, if you redeem shares worth $250,000 or more, the J.P. Morgan Funds reserve the right to pay part or all of your redemption proceeds in readily marketable securities instead of cash. If payment is made in securities, the Fund will value the securities selected in the same manner in which it computes its NAV. This process minimizes the effect of large redemptions on the Fund and its remaining shareholders. If you receive a redemption in-kind, securities received by you may be subject to market risk and you could incur taxable gains and brokerage or other charges in converting the securities to cash. While the J.P. Morgan Funds do not routinely use redemptions in-kind, the Funds reserve the right to use redemptions in-kind to manage the impact of large redemptions on the Funds. Redemption in-kind proceeds will typically be made by delivering a pro-rata amount of a Fund’s holdings that are readily marketable securities to the redeeming shareholder within seven days after the Fund’s receipt of the redemption order.
The Funds and their service providers may temporarily hold redemption proceeds from accounts maintained directly with the Funds if there is a reasonable belief that financial exploitation of a Specified Adult has occurred, is occurring, has been attempted, or will be attempted. For purposes of this paragraph, the term “Specified Adult” refers to an individual who is (A) a natural person age 65 and older; or (B) a natural person age 18 and older who the member reasonably believes has a mental or physical impairment that renders the individual unable to protect his or her own interests.
Minimum Account Balance
Due to the relatively high cost associated with maintaining small accounts J.P. Morgan Funds has established minimum balance requirements for each Fund held in your accounts. Minimum investment amounts per Fund are described earlier within the Investing with J.P. Morgan Funds section of this prospectus. If a shareholder does not maintain the required minimum balance in each Fund, J.P. Morgan Funds may either 1) redeem all remaining shares in that Fund or 2) charge a $10 below minimum balance fee per Fund. To collect the fee, the Fund will redeem $10 worth of shares from your account. The Funds and/or the Distributor reserve the right to determine whether we redeem all remaining shares and close your account or charge the annual below minimum account fee. You will not be charged a CDSC, if applicable, for these actions. Shareholders will receive written notice and be given 60 days to bring Fund balances above minimum requirements before action is taken on your account.
If your account is below the minimum balance, you are participating in a systematic investment plan, and you are not actively selling shares, it will be excluded from the minimum balance requirements as long as the systematic payments will increase your Fund value above the required minimum balance within 18 months of the date that the account was established. Once the required minimum account balance is reached, you must maintain the minimum investment amount in that Fund.
Investors in Class A or Class C Shares, employees investing in Class I Shares, as well as investors in the Premier and Morgan share classes of the J.P. Morgan Money Market Funds cannot combine investments for purposes of meeting the minimum.
Certain Financial Intermediaries or other organizations making the J.P. Morgan Funds available to their clients or customers impose minimum account balances that may be different than the requirements for investors purchasing directly from the Funds. If a shareholder purchases shares through such an intermediary and does not maintain the required minimum balance imposed by that intermediary, the intermediary may redeem the investor’s shares or impose a fee consistent with the terms of the investment arrangement with the investor. Please contact your intermediary for more information.
Closings, Reorganizations and Liquidations
To the extent authorized by law, each Fund reserves the right to discontinue offering shares at any time, to merge or reorganize itself or a share class, or to cease operations and liquidate at any time.
84 | J.P. Morgan Municipal Bond Funds
Frequent Trading Policy
J.P. Morgan Funds do not authorize market timing and, except for the Funds identified below, use reasonable methods to identify market timers and to prevent such activity. However, there can be no assurance that these methods will prevent market timing or other trading that may be deemed abusive. Market timing is an investment strategy using frequent purchases, redemptions and/or exchanges in an attempt to profit from short-term market movements. Market timing may result in dilution of the value of Fund shares held by long-term shareholders, disrupt portfolio management and increase Fund expenses for all shareholders. Although market timing may affect any Fund, these risks may be higher for Funds that invest significantly in non-U.S. securities or thinly traded securities (e.g., certain small cap securities), such as international, global or emerging market funds or small cap funds. For example, when a Fund invests in securities trading principally in non-U.S. markets that close prior to the close of the NYSE, market timers may seek to take advantage of the difference between the prices of these securities at the close of their non-U.S. markets and the value of such securities when the Fund calculates its net asset value.
J.P. Morgan Funds or the Distributor will prohibit any purchase order (including exchanges) with respect to one investor, a related group of investors or their agent(s) where they detect a pattern of either purchases and sales of one of the J.P. Morgan Funds, or exchanges between or among J.P. Morgan Funds, that indicates market timing or trading that they determine is abusive.
Although J.P. Morgan Funds use a variety of methods to detect and deter market timing, there is no assurance that the Funds’ own operational systems and procedures will identify and eliminate all market timing strategies. For example, certain accounts, which are known as omnibus accounts, include multiple investors and such accounts typically provide the Funds with a net purchase or redemption order on any given day where purchasers of Fund shares and redeemers of Fund shares are netted against one another and the identity of individual purchasers and redeemers are not known by the Funds. While the Funds seek to monitor for market timing activities in omnibus accounts, the netting effect limits the Funds’ ability to locate and eliminate individual market timers. As a result, the Funds are often dependent upon Financial Intermediaries who utilize their own policies and procedures to identify market timers. These policies and procedures may be different than those utilized by the Funds.
The Boards of J.P. Morgan Funds have adopted various policies and procedures to identify market timers, including reviewing “round trips” in and out of J.P. Morgan Funds by investors. A “round trip” includes a purchase or exchange into a Fund followed or preceded by a redemption or exchange out of the same Fund. If the Distributor detects that you have completed two round trips within 60 days in the same Fund, the Distributor will reject your purchase and exchange orders for a period of at least 90 days. For subsequent violations, the Distributor may, in its sole discretion, reject your purchase and exchange orders temporarily or permanently. In identifying market timers, the Distributor may also consider activity of accounts that it believes to be under common ownership or control.
J.P. Morgan Funds have attempted to put safeguards in place to assure that Financial Intermediaries have implemented procedures designed to deter market timing and abusive trading. Despite these safeguards, there is no assurance that the Funds will be able to effectively identify and eliminate market timing and abusive trading in the Funds particularly with respect to omnibus accounts.
J.P. Morgan Funds will seek to apply the Funds’ market timing policies and restrictions as uniformly as practicable to accounts with the Funds, except with respect to the following:
1.
Trades that occur through omnibus accounts at Financial Intermediaries as described above;
2.
Purchases, redemptions and exchanges made on a systematic basis;
3.
Automatic reinvestments of dividends and distributions;
4.
Purchases, redemptions or exchanges that are part of a rebalancing program, such as a wrap, advisory or bona fide asset allocation program, which includes investment models developed and maintained by a financial intermediary;
5.
Redemptions of shares to pay fund or account fees;
6.
Transactions initiated by the trustee or adviser to a donor-advised charitable gift fund;
7.
Transactions in Section 529 college savings plans;
8.
Transactions in Fund of Fund Products; and
9.
Transactions within a Retirement account such as:
•
Shares redeemed to return an excess contribution;
•
Transactions initiated by sponsors of group employee benefit plans or other related accounts;
•
Retirement plan contributions, loans, distributions, and hardship withdrawals;
July 1, 2022 | 85
Investing with J.P. Morgan Funds (continued)
•
IRA re-characterizations and conversions; and
•
IRA purchases of shares by asset transfer or direct rollover.
In addition to rejecting purchases in connection with suspected market timing activities, the Distributor can reject a purchase (including purchases for the Funds listed below) for any reason, including purchases that it does not think are in the best interests of a Fund and/or its shareholders or if it determines the trading to be abusive. Your Financial Intermediary may also have additional procedures for identifying market timers and rejecting or otherwise restricting purchases and/or exchanges.
Certain J.P. Morgan Funds are intended for short-term investment horizons and do not monitor for market timers or prohibit such short-term trading activity. Those Funds are the JPMorgan Short Duration Bond Fund, JPMorgan Short Duration Core Plus Fund, JPMorgan Short-Intermediate Municipal Bond Fund, JPMorgan Limited Duration Bond Fund, JPMorgan Managed Income Fund, JPMorgan Ultra-Short Municipal Fund and the J.P. Morgan Money Market Funds. Although these Funds are managed in a manner that is consistent with their investment objectives, frequent trading by shareholders may disrupt their management and increase their expenses.
Valuation
Shares are purchased at NAV per share, plus a sales charge, if any. This is also known as the offering price. Shares are also redeemed at NAV, minus any applicable CDSC. The NAV of each class within a Fund varies, primarily because each class has different class-specific expenses such as distribution and service fees.
The NAV per share of a class of a Fund is equal to the value of all the assets attributable to that class, minus the liabilities attributable to that class, divided by the number of outstanding shares of that class. The following is a summary of the procedures generally used to value J.P. Morgan Funds’ investments.
Securities for which market quotations are readily available are generally valued at their current market value. Other securities and assets, including securities for which market quotations are not readily available; market quotations are determined not to be reliable; or, their value has been materially affected by events occurring after the close of trading on the exchange or market on which the security is principally traded but before a Fund’s NAV is calculated, may be valued at fair value in accordance with policies and procedures adopted by the J.P. Morgan Funds’ Board of Trustees. Fair value represents a good faith determination of the value of a security or other asset based upon specifically applied procedures. Fair valuation may require subjective determinations. There can be no assurance that the fair value of an asset is the price at which the asset could have been sold during the period in which the particular fair value was used in determining a Fund’s NAV.
Equity securities listed on a North American, Central American, South American or Caribbean securities exchange are generally valued at the last sale price on the exchange on which the security is principally traded. Other foreign equity securities are fair valued using quotations from an independent pricing service, as applicable. The value of securities listed on the NASDAQ Stock Market, Inc. is generally the NASDAQ official closing price.
Fixed income securities are valued using prices supplied by an approved independent third party or affiliated pricing services or broker/dealers. Those prices are determined using a variety of inputs and factors as more fully described in the Statement of Additional Information.
Assets and liabilities initially expressed in foreign currencies are converted into U.S. dollars at the prevailing market rates from an approved independent pricing service as of 4:00 p.m. ET.
Shares of ETFs are generally valued at the last sale price on the exchange on which the ETF is principally traded. Shares of open-end investment companies are valued at their respective NAVs.
Options traded on U.S. securities exchanges are valued at the composite mean price, using the National Best Bid and Offer quotes.
Options traded on foreign exchanges are valued at the settled price, or if no settled price is available, at the last sale price available prior to the calculation of a Fund’s NAV and will be fair valued by applying fair value factors provided by independent pricing services, as applicable, for any options involving equity reference obligations listed on exchanges other than North American, Central American, South American or Caribbean securities exchanges.
Exchange traded futures are valued at the last sale price available prior to the calculation of a Fund’s NAV. Any futures involving equity reference obligations listed on exchanges other than North American, Central American, South American or Caribbean securities exchanges will be fair valued by applying fair value factors provided by independent pricing services, as applicable.
Non-listed over-the-counter options and futures are valued utilizing market quotations provided by approved pricing services.
Swaps and structured notes are priced generally by an approved independent third party or affiliated pricing service or at an evaluated price provided by a counterparty or broker/dealer.
86 | J.P. Morgan Municipal Bond Funds
Any derivatives involving equity reference obligations listed on exchanges other than North American, Central American, South American or Caribbean securities exchanges will be fair valued by applying fair value factors provided by independent pricing services, as applicable.
NAV is calculated each business day as of the close of the NYSE, which is typically 4:00 p.m. ET. On occasion, the NYSE will close before 4:00 p.m. ET. When that happens, NAV will be calculated as of the time the NYSE closes. The Funds will not treat an intraday unscheduled disruption or closure in NYSE trading as a closure of the NYSE and will calculate NAV as of 4:00 p.m. ET, if the particular disruption or closure directly affects only the NYSE. The price at which a purchase is effected is based on the next calculation of NAV after the order is received in proper form in accordance with this prospectus. To the extent a Fund invests in securities that are primarily listed on foreign exchanges or other markets that trade on weekends or other days when a Fund does not price its shares, the value of a Fund’s shares may change on days when you will not be able to purchase or redeem your shares.
Distributions and Taxes
Each Fund has elected to be treated and intends to qualify each taxable year as a regulated investment company. A regulated investment company is not subject to tax at the corporate level on income and gains from investments that are distributed to shareholders. Each Fund’s failure to qualify as a regulated investment company would result in corporate-level taxation and, consequently, a reduction in income available for distribution to shareholders.
Each Fund can earn income and realize capital gain. Each Fund deducts any expenses and then pays out the earnings, if any, to shareholders as distributions.
Each Fund generally distributes net investment income, if any, at least on a monthly basis. The Funds will distribute net realized capital gains, if any, at least annually. For each taxable year, each Fund will distribute substantially all of its net investment income and net realized capital gains.
You have the following options for your distributions. You may:
•
Reinvest all distributions in additional Fund shares;
•
Take distributions of net investment income in cash and reinvest distributions of net capital gain in additional shares;
•
Take distributions of net capital gain in cash and reinvest distributions of net investment income; or
•
Take all distributions in cash.
If you do not select an option when you open your account, we will reinvest all distributions. If your distributions are reinvested, they will be in the form of shares of the same class without a sales charge. If you take your distributions in cash, you can choose to have a check mailed to your address of record or you can have them deposited into a pre-assigned bank account. The taxation of the dividends will not be affected whether you have them deposited into a bank account or sent by check.
If, at the close of each quarter of its taxable year, at least 50% of the value of a Fund’s total assets consists of tax-exempt interest obligations, the Fund will be eligible to designate distributions of interest derived from tax-exempt-interest obligations as “exempt interest dividends.” As described in the section entitled “What are the Fund’s main investment strategies?” for each Fund, the Funds invest primarily in various types of municipal bonds, the interest on which is exempt from federal income tax. Distributions that are properly reported as exempt-interest dividends generally are not subject to federal income tax but may be subject to state and local taxes and, in certain instances, may result in liability for the federal alternative minimum tax, both for individual and corporate shareholders. You should consult your tax advisor concerning your own tax situation.
Shares of the Funds may not be suitable for tax-exempt investors since such investors are generally tax exempt and, therefore, would not gain any additional benefit from the Funds' dividends being tax exempt.
Shareholders who receive social security or railroad retirement benefits should also consult their tax advisors to determine what effect, if any, an investment in any of the Funds may have on the federal taxation of their benefits. Exempt-interest dividends generally are included in income for purposes of determining the amount of benefits that are taxable.
The Funds may invest a portion of their assets in securities that generate income subject to federal, state, and/or local taxes. For Federal income tax purposes, distributions of net investment income that are not properly reported as exempt-interest dividends generally are taxable as ordinary income from dividends. Dividends of net investment income paid to a non-corporate U.S. shareholder that are properly reported as qualified dividend income generally will be taxable to such shareholder at preferential rates. The maximum individual federal income tax rate applicable to “qualified dividend income” is either 15% or 20%, depending on whether the individual’s income exceeds certain threshold amounts. The amount of dividend income that may be so reported by a Fund generally will be limited to the aggregate of the eligible dividends received by each Fund. In addition, a Fund must meet certain holding period and other requirements with respect to the shares on which the Fund received the eligible dividends, and the non-corporate U.S. shareholder must meet certain holding period and other requirements with respect to the Fund. The amount of a
July 1, 2022 | 87
Investing with J.P. Morgan Funds (continued)
Fund’s distributions that would otherwise qualify for this favorable tax treatment may be reduced as a result of the Fund’s securities lending activities or high portfolio turnover rate. Dividends of net investment income that are not reported as either qualified dividend income or exempt-interest dividend income and dividends of net short-term capital gain will be taxable to a U.S. shareholder as ordinary income. It is unlikely that dividends from any of the Funds will qualify to a significant extent for designation as qualified dividend income.
Distributions of net capital gain (that is, the excess of the net gains from the sale of investments that a Fund owned for more than one year over the net losses from investments that the Fund owned for one year or less) that are properly reported by a Fund as capital gain dividends will be taxable as long-term capital gain, regardless of how long you have held your shares in the Fund. The maximum individual federal income tax rate applicable to long-term capital gains is generally either 15% or 20%, depending on whether the individual’s income exceeds certain threshold amounts. Distributions of net short-term capital gain (that is, the excess of any net short-term capital gain over net long-term capital loss), if any, will be taxable to U.S. shareholders as ordinary income. Capital gain of a corporate shareholder is taxed at the same rate as ordinary income.
An additional 3.8% Medicare tax is imposed on certain net investment income (including ordinary dividends and capital gain distributions received from a Fund and net gains from redemptions or other taxable dispositions of Fund shares, but excluding any exempt-interest dividends received from a Fund) of U.S. individuals, estates and trusts to the extent that such person’s “modified adjusted gross income” (in the case of an individual) or “adjusted gross income” (in the case of an estate or trust) exceeds certain threshold amounts.
If you buy shares of a Fund just before a distribution, you will be subject to tax on the entire amount of the taxable distribution you receive. Distributions are taxable to you even if they are paid from income or gains earned by a Fund before your investment (and thus were included in the price you paid for your Fund shares). Any gain resulting from the sale or exchange of Fund shares generally will be taxable as long-term or short-term gain, depending upon how long you have held your shares.
A Fund’s investments in certain debt obligations, mortgage-backed and asset-backed securities, and derivative instruments may require the Fund to accrue and distribute income not yet received. In order to generate sufficient cash to make the requisite distributions, a Fund may be required to liquidate other investments in its portfolio that it otherwise would have continued to hold, including at times when it is not advantageous to do so.
A Fund’s transactions in futures contracts, short sales, swaps and other derivatives will be subject to special tax rules, the effect of which may be to accelerate income to the Fund, defer losses to the Fund, cause adjustments in the holding periods of the Fund’s securities, and convert short-term capital losses into long-term capital losses. These rules could therefore affect the amount, timing and character of distributions to shareholders. A Fund’s use of these types of transactions may result in the Fund realizing more short-term capital gain and ordinary income subject to tax at ordinary income tax rates than it would if it did not engage in such transactions.
Investors should consult their advisers about state and local tax consequences of the investment in the Funds. The information below is only a general summary based on current statutes and regulations as well as current policies of each state, all of which may change possibly with retroactive effect.
California Taxes. California personal income tax law provides that dividends paid by a regulated investment company, or series thereof, are excludable from gross income if (1) at the close of each quarter of such company’s taxable year, at least 50% of the value of its total assets consists of obligations the interest from which would be exempt from California taxation if such obligations were held by an individual and (2) if such dividends are reported by the Fund as exempt interest dividends in written statements furnished to shareholders. Under California law, exempt-interest dividends (including some dividends paid after the close of the year as described in Section 855 of the Internal Revenue Code) may not exceed the excess of (A) the amount of interest received by the Fund which would be tax-exempt interest if the obligations on which the interest was paid were held by an individual over (B) the amount that would be considered expenses related to exempt income and thus would not be deductible under California personal income tax law. Distributions to individual shareholders derived from items other than exempt-interest described above will be subject to California personal income tax. In addition, corporate shareholders should note that dividends will not be exempt from California corporate franchise tax and may not be exempt from California corporate income tax. California has an alternative minimum tax (“AMT”) similar to the federal AMT. However, the California AMT does not include interest from private activity municipal obligations as an item of tax preference. Interest on indebtedness incurred or continued by a shareholder in connection with the purchase of shares of a Fund will generally not be deductible for California personal income tax purposes.
New York Taxes. Dividends paid by the New York Tax Free Bond Fund that are derived from interest attributable to obligations of the State of New York or its political subdivisions or certain other governmental entities (for example, the Commonwealth of Puerto Rico or the U.S. Virgin Islands), the interest on which was excludable from gross income for purposes of both federal income taxation and New York State and City personal income taxation (“New York Tax-Exempt Bonds”) and designated as such, generally are exempt from New York State and New York City personal income tax as well as from the New York City unincorporated business tax (but not
88 | J.P. Morgan Municipal Bond Funds
the New York State corporation franchise tax or New York City general corporation tax), provided that such dividends constitute exempt-interest dividends under Section 852(b)(5) of the Internal Revenue Code. Dividends and other distributions (aside from exempt-interest dividends derived from New York Tax-Exempt Bonds) generally are not exempt from New York State and City taxes. For New York State and City tax purposes, distributions of net long-term capital gain will be taxable at the same rates as ordinary income. Distributions by the Fund from investment income and capital gain, including exempt -interest dividends, also generally are included in a corporation’s net investment income for purposes of calculating such corporation’s obligations under the New York State corporate franchise tax and the New York City general corporation tax, if received by a corporation subject to those taxes, and will be subject to such taxes to the extent that a corporation’s net investment income is allocated to New York State and/or New York City. To the extent that investors are subject to state and local taxes outside of New York State, all dividends paid by the Fund may be taxable income for purposes thereof. To the extent that the Fund’s dividends are derived from interest attributable to the obligations of any other state or of a political subdivision of any such other state or are derived from capital gains, such dividends will generally not be exempt from New York State or New York City tax. The New York minimum tax for individuals, which excluded tax-exempt interest as an item of tax preference, has been eliminated for tax years beginning on or after January 1, 2014. Interest incurred to buy or carry shares of the Fund generally is not deductible for federal, New York State or New York City personal income tax purposes.
Please see the Statement of Additional Information for additional discussion of the tax consequences of the above-described and other investments to each Fund and its shareholders.
The dates on which net investment income and capital gain dividends, if any, will be distributed are available online at www.jpmorganfunds.com.
Early in each calendar year, each Fund will send you a notice showing the amount of distributions you received during the preceding calendar year and the tax status of those distributions.
The Funds are not intended for foreign shareholders. Any foreign shareholders would generally be subject to U.S. tax-withholding on distributions by the Funds, as discussed in the Statement of Additional Information.
Distributions by a Fund to retirement plans and other entities that qualify for tax-exempt or tax-deferred treatment under federal income tax laws will generally not be taxable. Special tax rules apply to investments through such plans. The tax considerations described in this section do not apply to such tax-exempt or tax-deferred entities or accounts. You should consult your tax advisor to determine the suitability of a Fund as an investment and the tax treatment of distributions.
Any investor for whom a Fund does not have a valid Taxpayer Identification Number may be subject to backup withholding.
The above is a general summary of tax implications of investing in the Funds. Because each investor’s tax consequences are unique, please consult your tax advisor to see how investing in a Fund and, for individuals and S corporations, selection of a particular cost method of accounting will affect your own tax situation.
IMPORTANT TAX REPORTING CONSIDERATIONS
Your Financial Intermediary or the Fund (if you hold your shares in the Fund direct account) will report gains and losses realized on redemptions of shares for shareholders who are individuals and S corporations purchased after January 1, 2012 to the Internal Revenue Service (IRS). This information will also be reported to you on Form 1099-B and the IRS each year. In calculating the gain or loss on redemptions of shares, the average cost method will be used to determine the cost basis of Fund shares purchased after January 1, 2012 unless you instruct the Fund in writing at J.P. Morgan Funds Services, P.O. Box 219143, Kansas City, MO 64121-9143 that you want to use another available method for cost basis reporting (for example, First In, First Out (FIFO), Last In, First Out (LIFO), Specific Lot Identification (SLID) or High Cost, First Out (HIFO)). If you designate SLID as your cost basis method, you will also need to designate a secondary cost basis method (Secondary Method). If a Secondary Method is not provided, the Fund will designate FIFO as the Secondary Method and will use the Secondary Method with respect to systematic redemptions.
Not all cost basis methods are available. Please contact the Fund at J.P. Morgan Funds Services, P.O. Box 219143, Kansas City, MO 64121-9143 for more information on the available methods for cost basis reporting. To determine which available cost basis method is best for you, you should consult with your tax advisor. Please note that you will be responsible for calculating and reporting gains and losses on redemptions of shares purchased prior to January 1, 2012 to the IRS as such information will not be reported by the Fund and may not be maintained by your Financial Intermediary.
Your Financial Intermediary or the Fund (if you hold your shares in the Fund direct account) is also required to report gains and losses to the IRS in connection with redemptions of shares by S corporations. If a shareholder is a corporation and has not instructed the Fund that it is a C corporation in its account application or by written instruction to J.P. Morgan Funds Services, P.O. Box 219143, Kansas City, MO 64121-9143, the Fund will treat the shareholder as an S corporation and file a Form 1099-B.
July 1, 2022 | 89
Investing with J.P. Morgan Funds (continued)
Shareholder Statements and Reports
The J.P. Morgan Funds or your Financial Intermediary will send you transaction confirmation statements and quarterly account statements. Please review these statements carefully. The Funds will correct errors if notified within one year of the date printed on the transaction confirmation or account statement. Your Financial Intermediary may have a different cut-off time. J.P. Morgan Funds will charge a fee for requests for statements that are older than two years. Please retain all of your statements, as they could be needed for tax purposes.
To reduce expenses and conserve natural resources, the J.P. Morgan Funds will deliver a single copy of prospectuses and financial reports to individual investors who share a residential address, provided they have the same last name or the J.P. Morgan Funds reasonably believe they are members of the same family. If you would like to receive separate mailings, please call 1-800-480-4111 and the Fund will begin individual delivery within 30 days. If you would like to receive these documents by e-mail, please visit www.jpmorganfunds.com and sign up for electronic delivery.
If you hold your Fund shares directly, you may access your account statements at www.jpmorganfunds.com.
After each fiscal half year you will receive a financial report from the Funds. In addition, the Funds will periodically send you proxy statements and other reports.
If you have any questions or need additional information, please write to J.P. Morgan Funds Services at P.O. Box 219143, Kansas City, MO 64121-9143, call 1-800-480-4111 or visit www.jpmorganfunds.com.
Availability of Proxy Voting Record
The Trustees for each Fund have delegated the authority to vote proxies for securities owned by the Funds to the Funds' adviser. A copy of each Fund’s voting record for the most recent 12-month period ended June 30 is available on the SEC’s website at www.sec.gov or on J.P. Morgan Funds’ website at www.jpmorganfunds.com no later than August 31 of each year. Each Fund’s proxy voting record will include, among other things, a brief description of the matter voted on for each portfolio security, and will state how each vote was cast, for example, for or against the proposal.
Portfolio Holdings Disclosure
No sooner than three calendar days after the end of each month, each Fund will make available upon request the uncertified, complete schedule of its portfolio holdings as of the last day of that month.
Not later than 60 days after the end of each fiscal quarter, each Fund will make available upon request a complete schedule of its portfolio holdings as of the last day of that quarter.
Each Fund will post these quarterly schedules on the J.P. Morgan Funds’ website at www.jpmorganfunds.com and on the SEC’s website at www.sec.gov.
The Funds may disclose a Fund’s 10 largest portfolio holdings and the percentage that each of these 10 holdings represent of the Fund’s portfolio as of the most recent month’s end, online at www.jpmorganfunds.com, no sooner than 10 calendar days after month’s end.
Shareholders may request portfolio holdings schedules at no charge by calling 1-800-480-4111. A description of each Fund’s policies and procedures with respect to the disclosure of a Fund’s portfolio holdings is available in the Statement of Additional Information.
90 | J.P. Morgan Municipal Bond Funds
Glossary of Common Investment Terminology
For the purpose of the “INVESTING WITH J.P. MORGAN FUNDS” section, references to “account” and “Fund” are not interchangeable. Fund refers to an individual mutual fund position. An account may be invested in a single Fund or multiple Funds.
Breakpoints — Differences in sales charges that are assessed based on the amount of purchases. The larger the investment, the lower the sales charge.
Capital Gains Distribution — Payment to mutual fund shareholders of gains realized on securities that a Fund has sold at a profit, minus any realized losses.
Contingent Deferred Sales Charge (CDSC) — A back-end sales charge imposed when shares are redeemed from a Fund. This fee usually declines over time.
Dividend Distribution — Payment to mutual fund shareholders of income from interest or dividends generated by a Fund’s investments.
Financial Intermediaries — Include financial advisors, investment advisers, brokers, financial planners, banks, insurance companies, retirement or 401(k) plan administrators and others, including various affiliates of JPMorgan Chase, that have entered into agreements with the Distributor and/or shareholder servicing agent. Shares purchased this way will typically be held for you by the Financial Intermediary.
Group Retirement Plans — Refers to employer-sponsored retirement, deferred compensation and employee benefit plans (including health savings accounts) and trusts used to fund those plans. To satisfy eligibility requirements, the plan must be a group plan (more than one participant), the shares cannot be held in a commission-based brokerage account and
•
Shares must be held at a plan level or
•
Shares must be held at the Fund level through an omnibus account of a retirement plan recordkeeper.
Group Retirement Plans include group employer-sponsored 401(k) plans, 457 plans, employer-sponsored 403(b) plans, profit-sharing and money purchase pension plans, defined benefit plans, retiree health benefit plans, group annuity separate accounts offered to retirement plans and non-qualified deferred compensation plans. Group Retirement Plans do not include traditional IRAs, Roth IRAs, Coverdell Education Savings Accounts, SEPs, SARSEPs, SIMPLE IRAs, KEOGHs, individual 401(k) or individual 403(b) plans.
Institutional Investors — Include fee-based “wrap” account sponsors (provided they have an agreement covering the arrangement with the Distributor), corporations, qualified nonprofit organizations, charitable trusts, foundations and endowments, state, county, city or any instrumentality, department, authority or agency thereof, and banks, trust companies or other depository institutions investing for their own account or on behalf of their clients.
Letter of Intent (LOI) — A Letter of Intent is signed by an investor stating the investor’s intention to buy a specified amount over a period of 13 months in order to receive a reduced front-end sales charge. Each purchase the investor makes during the 13 month period will receive the sales charge and breakpoint discount that applies to the total amount specified in the Letter of Intent. If the amount is not met within the 13 month period, the investor must pay the Distributor the difference between the sales charges applicable to the purchases at the time they were made and the reduced sales charges previously paid. A Letter of Intent shall be based on the sales charge and breakpoint schedules in effect when the initial shares were purchased.
Medallion Signature Guarantee — A special stamp used to verify the authenticity of certain documents. It is a guarantee by a financial institution that the signature is genuine and the financial institution accepts liability for any forgery. Medallion signature guarantees protect shareholders by preventing unauthorized transfer of assets that could result in monetary losses to the investor due to fraud. Medallion guarantee stamps can be obtained at many bank branches or brokerage firms.
Required Minimum Distribution (RMD) — Refers to the annual amounts that must be withdrawn from pre-tax retirement accounts (such as Traditional, SEP, and SIMPLE IRAs) in or after the year the shareholder reaches the qualified age based on applicable IRS regulations.
Rights of Accumulation (ROA) — When utilizing “rights of accumulation,” the investor can combine the current market value of any existing qualifying holdings and account types with the amount of the current purchase to qualify for a breakpoint and reduced front-end sales charge on the current purchase. Rights of Accumulation shall be based on the sales charge and breakpoint schedules in effect when the initial shares were purchased.
Uncollected Shares — Shares purchased directly through J.P. Morgan Funds Services by check or through an ACH transaction are not available for redemption for up to five business days following the acceptance of a purchase order unless you provide satisfactory proof that your purchase check or ACH transaction has cleared.
Wire or ACH — Refers to the method used for payment or redemptions. Movement of money by wire is typically faster than money sent by ACH (Automated Clearing House). While J.P. Morgan Funds does not charge for either method, your bank may charge a fee for these services.
July 1, 2022 | 91
Investment Practices
The table discusses the types of investments which can be held by the Funds. In each case, the related types of risk are also listed.
| FUND NAME |
FUND CODE |
| JPMorgan Sustainable Municipal Income Fund |
1 |
| JPMorgan Short-Intermediate Municipal Bond Fund |
2 |
| JPMorgan Tax Free Bond Fund |
3 |
| JPMorgan Ultra-Short Municipal Fund |
4 |
| JPMorgan California Tax Free Bond Fund |
5 |
| JPMorgan High Yield Municipal Fund |
6 |
| JPMorgan Intermediate Tax Free Bond Fund |
7 |
| JPMorgan New York Tax Free Bond Fund |
8 |
| INSTRUMENT |
FUND CODE |
RISK TYPE |
| Adjustable Rate Mortgage Loans (ARMs): Loans in a mortgage pool which provide for a fixed initial mortgage interest rate for a specified period of time, after which the rate may be subject to periodic adjustments. |
2, 6 |
Credit Interest Rate Liquidity Market Political Prepayment Valuation |
| Asset-Backed Securities: Securities secured by company receivables, home equity loans, truck and auto loans, leases, and credit card receivables or other securities backed by other types of receivables or other assets. |
1–8 |
Credit Interest Rate Liquidity Market Political Prepayment Valuation |
| Auction Rate Securities: Auction rate municipal securities and auction rate preferred securities issued by closed-end investment companies. |
1–8 |
Credit Interest Rate Liquidity Market |
| Bank Obligations: Bankers’ acceptances, certificates of deposit and time deposits. Bankers’ acceptances are bills of exchange or time drafts drawn on and accepted by a commercial bank. Maturities are generally six months or less. Certificates of deposit are negotiable certificates issued by a bank for a specified period of time and earning a specified return. Time deposits are non-negotiable receipts issued by a bank in exchange for the deposit of funds. |
1–8 |
Credit Currency Interest Rate Liquidity Market Political |
| Borrowings: A Fund may borrow for temporary purposes and/or for investment purposes. Such a practice will result in leveraging of the Fund’s assets and may cause a Fund to liquidate portfolio positions when it would not be advantageous to do so. A Fund must maintain continuous asset coverage of 300% of the amount borrowed, with the exception for borrowings not in excess of 5% of the Fund’s total assets made for temporary administrative purposes. |
1–8 |
Credit Interest Rate Market |
| Call and Put Options: A call option gives the buyer the right to buy, and obligates the seller of the option to sell a security at a specified price at a future date. A put option gives the buyer the right to sell, and obligates the seller of the option to buy a security at a specified price at a future date. A Fund will sell only covered call and secured put options. |
1–8 |
Credit Leverage Liquidity Management Market |
92 | J.P. Morgan Municipal Bond Funds
| INSTRUMENT |
FUND CODE |
RISK TYPE |
| Commercial Paper: Secured and unsecured short-term promissory notes issued by corporations and other entities. Maturities generally vary from a few days to nine months. |
1–8 |
Credit Currency Interest Rate Liquidity Market Political Valuation |
| Common Stock Warrants and Rights: Securities, typically issued with preferred stock or bonds, that give the holder the right to buy a proportionate amount of common stock at a specified price. |
3 |
Credit Market |
| Corporate Debt Securities: May include bonds and other debt securities of domestic and foreign issuers, including obligations of industrial, utility, banking and other corporate issuers. |
1–8 |
Credit Currency Interest Rate Liquidity Market Political Prepayment Valuation |
| Credit Default Swaps (CDSs): A swap agreement between two parties pursuant to which one party pays the other a fixed periodic coupon for the specified life of the agreement. The other party makes no payment unless a credit event, relating to a predetermined reference asset, occurs. If such an event occurs, the party will then make a payment to the first party, and the swap will terminate. |
1–3, 5–8 |
Credit Currency Interest Rate Leverage Liquidity Management Market Political Valuation |
| Custodial Receipts: A Fund may acquire securities in the form of custodial receipts that evidence ownership of future interest payments, principal payments or both on certain U.S. Treasury notes or bonds in connection with programs sponsored by banks and brokerage firms. These are not considered to be U.S. government securities. These notes and bonds are held in custody by a bank on behalf of the owners of the receipts. |
1–3, 5–8 |
Credit Liquidity Market |
| Demand Features: Securities that are subject to puts and standby commitments to purchase the securities at a fixed price (usually with accrued interest) within a fixed period of time following demand by a Fund. |
1–8 |
Liquidity Management Market |
| Exchange-Traded Funds (ETFs): Ownership interest in unit investment trusts, depositary receipts, and other pooled investment vehicles that hold a portfolio of securities or stocks designed to track the price performance and dividend yield of a particular broad-based, sector or international index. ETFs include a wide range of investments. |
1–3, 5–8 |
Investment Company Market |
| Foreign Investments: Equity and debt securities (e.g., bonds and commercial paper) of foreign entities and obligations of foreign branches of U.S. banks and foreign banks. Foreign securities may also include American Depositary Receipts (ADRs), Global Depositary Receipts (GDRs), European Depositary Receipts (EDRs) and American Depositary Securities. |
6 |
Foreign Investment Liquidity Market Political Prepayment Valuation |
July 1, 2022 | 93
Investment Practices (continued)
| INSTRUMENT |
FUND CODE |
RISK TYPE |
| High Yield/High Risk Securities/Junk Bonds: Securities that are generally rated below investment grade by the primary rating agencies or are unrated but deemed by a Fund’s adviser to be of comparable quality. |
1-8 |
Credit Currency High Yield Securities Interest Rate Liquidity Market Political Portfolio Quality Valuation |
| Inflation-Linked Debt Securities: Includes fixed and floating rate debt securities of varying maturities issued by the U.S. government as well as securities issued by other entities such as corporations, foreign governments and foreign issuers. |
4, 6 |
Credit Currency Interest Rate Political |
| Interfund Lending: Involves lending money and borrowing money for temporary purposes through a credit facility. |
1–8 |
Credit Interest Rate Market |
| Inverse Floating Rate Instruments: Leveraged variable debt instruments with interest rates that reset in the opposite direction from the market rate of interest to which the inverse floater is indexed. |
1–8 |
Credit Leverage Market |
| Investment Company Securities: Shares of other investment companies, including money market funds for which the adviser and/or its affiliates serve as investment adviser or administrator. The adviser will waive certain fees when investing in funds for which it serves as investment adviser, to the extent required by law or by contract. |
1–8 |
Investment Company Market |
| Loan Assignments and Participations: Assignments of, or participations in all or a portion of loans to corporations or to governments, including governments in less developed countries. |
1–3, 5–8 |
Credit Currency Extension Foreign Investment Interest Rate Liquidity Market Political Prepayment |
| Master Limited Partnerships: Limited partnerships that are publicly traded on a securities exchange. |
6 |
Market |
| Mortgages (Directly Held): Debt instruments secured by real property. |
6 |
Credit Environmental Extension Interest Rate Liquidity Market Natural Event Political Prepayment Valuation |
94 | J.P. Morgan Municipal Bond Funds
| INSTRUMENT |
FUND CODE |
RISK TYPE |
| Mortgage-Backed Securities: Debt obligations secured by real estate loans and pools of loans such as collateralized mortgage obligations (CMOs), commercial mortgage-backed securities (CMBSs) and other asset-backed structures. |
1–8 |
Credit Currency Extension Interest Rate Leverage Liquidity Market Political Prepayment Tax Valuation |
| Mortgage Dollar Rolls1 : A transaction in which the Fund sells securities for delivery in a current month and simultaneously contracts with the same party to repurchase similar but not identical securities on a specified future date. |
2, 6 |
Currency Extension Interest Rate Leverage Liquidity Market Political Prepayment |
| Municipal Securities: Securities issued by a state or political subdivision to obtain funds for various public purposes. Municipal securities include, among others, private activity bonds and industrial development bonds, as well as general obligation notes, tax anticipation notes, bond anticipation notes, revenue anticipation notes, other short-term tax-exempt obligations, municipal leases, obligations of municipal housing authorities and single family revenue bonds. |
1–8 |
Credit Interest Rate Market Natural Event Political Prepayment Tax Valuation |
| New Financial Products: New options and futures contracts and other financial products continue to be developed and the Fund may invest in such options, contracts and products. |
1–8 |
Credit Liquidity Management Market |
| Obligations of Supranational Agencies: Obligations which are chartered to promote economic development and are supported by various governments and governmental agencies. |
2 |
Credit Foreign Investment Liquidity Political Valuation |
| Options and Futures Transactions: A Fund may purchase and sell (a) exchange traded and over- the-counter put and call options on securities, indexes of securities and futures contracts on securities and indexes of securities, and (b) futures contracts on securities and indexes of securities. |
1–8 |
Credit Leverage Liquidity Management Market |
| Preferred Stock: A class of stock that generally pays a dividend at a specified rate and has preference over common stock in the payment of dividends and in liquidation. |
2, 6 |
Market |
| Private Placements, Restricted Securities and Other Unregistered Securities: Securities not registered under the Securities Act of 1933, such as privately placed commercial paper and Rule 144A securities. |
1–8 |
Liquidity Market Valuation |
1
All forms of borrowing (including mortgage dollar-rolls and reverse repurchase agreements) are limited in the aggregate and may not exceed 33 1∕3% of the Fund’s
total assets except as permitted by law.
July 1, 2022 | 95
Investment Practices (continued)
| INSTRUMENT |
FUND CODE |
RISK TYPE |
| Real Estate Investment Trusts (REITs): Pooled investment vehicles which invest primarily in income producing real estate or real estate related loans or interest. |
6 |
Credit Interest Rate Liquidity Management Market Political Prepayment Tax Valuation |
| Repurchase Agreements: The purchase of a security and the simultaneous commitment to return the security to the seller at an agreed upon price on an agreed upon date. This is treated as a loan. |
1–8 |
Credit Liquidity Market |
| Reverse Repurchase Agreements1: The sale of a security and the simultaneous commitment to buy the security back at an agreed upon price on an agreed upon date. This is treated as borrowing by a Fund. |
1, 4, 6 |
Credit Leverage Market |
| Securities Issued in Connection with Reorganizations and Corporate Restructurings: In connection with reorganizing or restructuring of an issuer, an issuer may issue common stock or other securities to holders of its debt securities. |
6 |
Market |
| Short Selling: A Fund sells a security it does not own in anticipation of a decline in the market value of the security. To complete the transaction, a Fund must borrow the security to make delivery to the buyer. A Fund is obligated to replace the security borrowed by purchasing it subsequently at the market price at the time of replacement. |
6 |
Credit Liquidity Market |
| Short-Term Funding Agreements: Agreements issued by banks and highly rated U.S. insurance companies such as Guaranteed Investment Contracts (GICs) and Bank Investment Contracts (BICs). |
1–8 |
Credit Liquidity Market |
| Sovereign Obligations: Investments in debt obligations issued or guaranteed by a foreign sovereign government or its agencies, authorities or political subdivisions. |
2, 6 |
Credit Foreign Investment Liquidity Political Valuation |
| Stripped Mortgage-Backed Securities: Derivative multi-class mortgage securities which are usually structured with two classes of shares that receive different proportions of the interest and principal from a pool of mortgage assets. These include Interest Only (IO) and Principal Only (PO) securities issued outside a Real Estate Mortgage Investment Conduit (REMIC) or CMO structure. |
1–3, 5–8 |
Credit Liquidity Market Political Prepayment Valuation |
| Structured Investments: A security having a return tied to an underlying index or other security or asset class. Structured investments generally are individually negotiated agreements and may be traded over-the-counter. Structured investments are organized and operated to restructure the investment characteristics of the underlying security. |
1–8 |
Credit Foreign Investment Liquidity Management Market Valuation |
1
All forms of borrowing (including mortgage dollar-rolls and reverse repurchase agreements) are limited in the aggregate and may not exceed 33 1∕3% of the Fund’s
total assets except as permitted by law.
96 | J.P. Morgan Municipal Bond Funds
| INSTRUMENT |
FUND CODE |
RISK TYPE |
| Swaps and Related Swap Products: Swaps involve an exchange of obligations by two parties. Caps and floors entitle a purchaser to a principal amount from the seller of the cap or floor to the extent that a specified index exceeds or falls below a predetermined interest rate or amount. A Fund may enter into these transactions to manage its exposure to changing interest rates and other factors. |
1–8 |
Credit Currency Interest Rate Leverage Liquidity Management Market Political Valuation |
| Synthetic Variable Rate Instruments: Instruments that generally involve the deposit of a long- term tax exempt bond in a custody or trust arrangement and the creation of a mechanism to adjust the long-term interest rate on the bond to a variable short-term rate and a right (subject to certain conditions) on the part of the purchaser to tender it periodically to a third party at par. |
1–8 |
Credit Liquidity Market |
| Temporary Defensive Positions: To respond to unusual circumstances a Fund may invest in cash and cash equivalents for temporary defensive purposes. |
1–8 |
Credit Interest Rate Liquidity Market |
| Treasury Receipts: A Fund may purchase interests in separately traded interest and principal component parts of U.S. Treasury obligations that are issued by banks or brokerage firms and that are created by depositing U.S. Treasury notes and U.S. Treasury bonds into a special account at a custodian bank. Receipts include Treasury Receipts (TRs), Treasury Investment Growth Receipts (TIGRs) and Certificates of Accrual on Treasury Securities (CATS). |
1–8 |
Market |
| Trust Preferreds: Securities with characteristics of both subordinated debt and preferred stock. Trust preferreds are generally long term securities that make periodic fixed or variable interest payments. |
6 |
Credit Currency Interest Rate Liquidity Market Political Valuation |
| U.S. Government Agency Securities: Securities issued or guaranteed by agencies and instrumentalities of the U.S. government. These include all types of securities issued by the Government National Mortgage Association (Ginnie Mae), the Federal National Mortgage Association (Fannie Mae) and the Federal Home Loan Mortgage Corporation (Freddie Mac), including funding notes, subordinated benchmark notes, CMOs and Real Estate Mortgage Investment Conduits (REMICs). |
1–8 |
Credit Government Securities Interest Rate Market |
| U.S. Government Obligations: May include direct obligations of the U.S. Treasury, including Treasury bills, notes and bonds, all of which are backed as to principal and interest payments by the full faith and credit of the United States, and separately traded principal and interest component parts of such obligations that are transferable through the Federal book-entry system known as Separate Trading of Registered Interest and Principal of Securities (STRIPS) and Coupons Under Book Entry Safekeeping (CUBES). |
1–8 |
Interest Rate Market |
| Variable and Floating Rate Instruments: Obligations with interest rates which are reset daily, weekly, quarterly or some other frequency and which may be payable to a Fund on demand or at the expiration of a specified term. |
1–8 |
Credit Liquidity Market Valuation |
| When-Issued Securities, Delayed Delivery Securities and Forward Commitments: Purchase or contract to purchase securities at a fixed price for delivery at a future date. |
1–8 |
Credit Leverage Liquidity Market Valuation |
July 1, 2022 | 97
Investment Practices (continued)
| INSTRUMENT |
FUND CODE |
RISK TYPE |
| Zero-Coupon, Pay-in-Kind and Deferred Payment Securities: Zero-coupon securities are securities that are sold at a discount to par value and on which interest payments are not made during the life of the security. Pay-in-kind securities are securities that have interest payable by delivery of additional securities. Deferred payment securities are zero-coupon debt securities which convert on a specified date to interest bearing debt securities. |
1–8 |
Credit Currency Interest Rate Liquidity Market Political Valuation Zero-Coupon Bond |
Risk related to certain investments held by the Funds:
Credit risk The risk that a financial obligation will not be met by the issuer of a security or the counterparty to a contract, resulting in a loss to the purchaser.
Currency risk The risk that currency exchange rate fluctuations may reduce gains or increase losses on foreign investments.
Environmental risk The risk that an owner or operator of real estate may be liable for the costs associated with hazardous or toxic substances located on the property.
Extension risk The risk that a rise in interest rates will extend the life of a mortgage-backed security to a date later than the anticipated prepayment date, causing the value of the investment to fall.
Foreign investment risk The risk associated with higher transaction costs, delayed settlements, currency controls and adverse economic developments. This also includes the risk that fluctuations in the exchange rates between the U.S. dollar and foreign currencies may negatively affect an investment. Adverse changes in exchange rates may erode or reverse any gains produced by foreign currency denominated investments and may widen any losses. Exchange rate volatility also may affect the ability of an issuer to repay U.S. dollar denominated debt, thereby increasing credit risk.
Government securities risk U.S. government securities are subject to market risk, interest rate risk and credit risk. Securities, such as those issued or guaranteed by Ginnie Mae or the U.S. Treasury, that are backed by the full faith and credit of the United States are guaranteed only as to the timely payment of interest and principal when held to maturity and the market prices for such securities will fluctuate. Circumstances could arise that would prevent the payment of interest or principal. Securities issued or guaranteed by certain U.S. government-related organizations, such as Fannie Mae and Freddie Mac, are not backed by the full faith and credit of the U.S. government and no assurance can be given that the U.S. government will provide financial support.
High yield securities risk The risk that the Fund may invest in high yield, high risk securities (also known as junk bonds) which are considered to be speculative. These investments may be issued by companies which are highly leveraged, less creditworthy or financially distressed. Non-investment grade debt securities can be more sensitive to short-term corporate, economic and market developments. During periods of economic uncertainty and change, the market price of the Fund’s investments and the Fund’s net asset value may be volatile. Furthermore, though these investments generally provide a higher yield than higher-rated debt securities, the high degree of risk involved in these investments can result in substantial or total losses. These securities are subject to greater risk of loss, greater sensitivity to economic changes, valuation difficulties, and a potential lack of a secondary or public market for securities. The market price of these securities can change suddenly and unexpectedly.
Interest rate risk The risk that a change in interest rates will adversely affect the value of an investment. The value of fixed income securities generally moves in the opposite direction of interest rates (decreases when interest rates rise and increases when interest rates fall). A Fund may face a heightened level of interest rate risk due to certain changes in monetary policy, such as an interest rate increase by the Federal Reserve.
Investment company risk If a Fund invests in shares of another investment company, shareholders would bear not only their proportionate share of the Fund’s expenses, but also similar expenses of the investment company. The price movement of an investment company that is an ETF may not track the underlying index and may result in a loss.
Leverage risk The risk that gains or losses will be disproportionately higher than the amount invested.
Liquidity risk The risk that the holder may not be able to sell the security at the time or price it desires.
Management risk The risk that a strategy used by a Fund’s management may fail to produce the intended result. This includes the risk that changes in the value of a hedging instrument will not match those of the asset being hedged. Incomplete matching can result in unanticipated risks.
Market risk The risk that when the market as a whole declines, the value of a specific investment will decline proportionately. This systematic risk is common to all investments and the mutual funds that purchase them.
Natural event risk The risk that a natural disaster, such as a hurricane or similar event, will cause severe economic losses and default in payments by the issuer of the security.
Political risk The risk that governmental policies or other political actions will negatively impact the value of the investment.
Portfolio quality risk The risks associated with below investment grade securities including greater risk of default, greater sensitivity to interest rates and economic changes, potential valuation difficulties, and sudden and unexpected changes in credit quality.
Prepayment risk The risk that declining interest rates or other factors will result in unexpected prepayments, causing the value of the investment to fall.
Tax risk The risk that the issuer of the securities will fail to comply with certain requirements of the Internal Revenue Code, which could cause adverse tax consequences. Also the risk that the tax treatment of municipal or other securities could be changed by Congress thereby affecting the value of outstanding securities.
Valuation risk The risk that the estimated value of a security does not match the actual amount that can be realized if the security is sold.
Zero-Coupon Bond Risk The risk that the market value of a zero-coupon bond is generally more volatile than the market value of other fixed income securities with similar maturities that pay interest periodically. In addition, federal income tax law requires that the holder of a zero-coupon bond accrue a portion of the discount at which the bond was purchased as taxable income each year, even though the holder receives no interest payment on the bond during the year. A Fund must distribute substantially all of its net income (including non-cash income attributable to zero-coupon bonds) to its shareholders each year to maintain its status as a regulated investment company and to eliminate tax at the Fund level. Accordingly, such accrued discount must be taken into account in determining the amount of taxable distributions to shareholders. The Fund may consequently have to dispose of portfolio securities under disadvantageous circumstances to generate cash to satisfy such distribution requirements. These actions may reduce the assets to which the Fund’s expenses could otherwise be allocated and may reduce the Fund’s rate of return.
98 | J.P. Morgan Municipal Bond Funds
Financial Highlights
The financial highlights tables are intended to help you understand each Fund’s financial performance for each share class for each of the past one through five fiscal years or periods, as applicable. Certain information reflects financial results for a single Fund share. The total returns in the tables represent the rate that an investor would have earned (or lost) on an investment in a Fund (assuming reinvestment of all dividends and distributions). The information for each period presented has been audited by PricewaterhouseCoopers LLP, whose reports, along with each Fund’s financial statements, are included in the respective Fund’s annual report, which is available upon request.
To the extent a Fund invests in other Funds, the Total Annual Operating Expenses included in the Fee Table will not correlate to the ratio of expenses to average net assets in the financial highlights below.
| |
|
Per share operating performance | |||||
| |
|
Investment operations |
Distributions | ||||
| |
Net asset value, beginning of period |
Net investment income (loss) (a) |
Net realized and unrealized gains (losses) on investments |
Total from investment operations |
Net investment income |
Net realized gain |
Total distributions |
| JPMorgan Sustainable Municipal Income Fund |
|
|
|
|
|
|
|
| Class A |
|
|
|
|
|
|
|
| Year Ended February 28, 2022 |
$9.96 |
$0.18 |
$(0.29) |
$(0.11) |
$(0.18) |
$— |
$(0.18) |
| Year Ended February 28, 2021 |
10.02 |
0.17 |
(0.06) |
0.11 |
(0.17) |
— |
(0.17) |
| Year Ended February 29, 2020 |
9.55 |
0.20 |
0.47 |
0.67 |
(0.20) |
— |
(0.20) |
| Year Ended February 28, 2019 |
9.52 |
0.21 |
0.08 |
0.29 |
(0.21) |
(0.05) |
(0.26) |
| Year Ended February 28, 2018 |
9.70 |
0.23 (d) |
(0.11) |
0.12 |
(0.23) |
(0.07) |
(0.30) |
| Class C |
|
|
|
|
|
|
|
| Year Ended February 28, 2022 |
9.86 |
0.12 |
(0.30) |
(0.18) |
(0.12) |
— |
(0.12) |
| Year Ended February 28, 2021 |
9.92 |
0.11 |
(0.06) |
0.05 |
(0.11) |
— |
(0.11) |
| Year Ended February 29, 2020 |
9.45 |
0.14 |
0.47 |
0.61 |
(0.14) |
— |
(0.14) |
| Year Ended February 28, 2019 |
9.42 |
0.16 |
0.08 |
0.24 |
(0.16) |
(0.05) |
(0.21) |
| Year Ended February 28, 2018 |
9.61 |
0.17 (d) |
(0.12) |
0.05 |
(0.17) |
(0.07) |
(0.24) |
| Class I |
|
|
|
|
|
|
|
| Year Ended February 28, 2022 |
9.88 |
0.20 |
(0.29) |
(0.09) |
(0.20) |
— |
(0.20) |
| Year Ended February 28, 2021 |
9.95 |
0.19 |
(0.07) |
0.12 |
(0.19) |
— |
(0.19) |
| Year Ended February 29, 2020 |
9.48 |
0.22 |
0.47 |
0.69 |
(0.22) |
— |
(0.22) |
| Year Ended February 28, 2019 |
9.45 |
0.24 |
0.08 |
0.32 |
(0.24) |
(0.05) |
(0.29) |
| Year Ended February 28, 2018 |
9.63 |
0.25 (d) |
(0.11) |
0.14 |
(0.25) |
(0.07) |
(0.32) |
(a)
Calculated based upon average shares outstanding.
(b)
Includes adjustments in accordance with accounting principles generally accepted in the United States of America and as such, the net asset values for financial reporting purposes and the returns based upon those net asset values may differ from the net asset values and returns for shareholder transactions.
(c)
Includes earnings credits and interest expense, if applicable, each of which is less than 0.005% unless otherwise noted.
(d)
Net investment income (loss) may appear disproportionate among the classes due to the timing of recognition of income and changes in the relative size of the classes.
100 | J.P. Morgan Municipal Bond Funds
| |
Ratios/Supplemental data | |||||
| |
|
|
Ratios to average net assets |
| ||
| Net asset value, end of period |
Total return (excludes sales charge) (b) |
Net assets, end of period (000’s) |
Net expenses (c) |
Net investment income (loss) |
Expenses without waivers, reimbursements and earnings credits |
Portfolio turnover rate |
| |
|
|
|
|
|
|
| |
|
|
|
|
|
|
| $9.67 |
(1.16)% |
$107,969 |
0.70% |
1.79% |
0.96% |
18% |
| 9.96 |
1.09 |
125,754 |
0.69 |
1.71 |
0.96 |
22 |
| 10.02 |
7.04 |
96,844 |
0.70 |
2.02 |
0.99 |
7 |
| 9.55 |
3.15 |
60,078 |
0.70 |
2.26 |
1.01 |
13 |
| 9.52 |
1.16 |
66,258 |
0.69 |
2.33 (d) |
1.01 |
21 |
| |
|
|
|
|
|
|
| 9.56 |
(1.82) |
7,156 |
1.25 |
1.24 |
1.46 |
18 |
| 9.86 |
0.54 |
9,178 |
1.24 |
1.16 |
1.46 |
22 |
| 9.92 |
6.52 |
12,868 |
1.25 |
1.49 |
1.51 |
7 |
| 9.45 |
2.61 |
12,833 |
1.25 |
1.71 |
1.51 |
13 |
| 9.42 |
0.51 |
15,138 |
1.24 |
1.78 (d) |
1.51 |
21 |
| |
|
|
|
|
|
|
| 9.59 |
(0.92) |
116,395 |
0.45 |
2.04 |
0.71 |
18 |
| 9.88 |
1.25 |
111,724 |
0.44 |
1.96 |
0.71 |
22 |
| 9.95 |
7.36 |
114,772 |
0.44 |
2.28 |
0.74 |
7 |
| 9.48 |
3.43 |
74,386 |
0.45 |
2.51 |
0.76 |
13 |
| 9.45 |
1.42 |
71,161 |
0.44 |
2.57 (d) |
0.74 |
21 |
July 1, 2022 | 101
Financial Highlights (continued)
| |
|
Per share operating performance | |||
| |
|
Investment operations |
Distributions | ||
| |
Net asset value, beginning of period |
Net investment income (loss) (a) |
Net realized and unrealized gains (losses) on investments |
Total from investment operations |
Net investment income |
| JPMorgan Short-Intermediate Municipal Bond Fund |
|
|
|
|
|
| Class A |
|
|
|
|
|
| Year Ended February 28, 2022 |
$10.78 |
$0.11 |
$(0.32) |
$(0.21) |
$(0.11) |
| Year Ended February 28, 2021 |
10.86 |
0.13 |
(0.08) |
0.05 |
(0.13) |
| Year Ended February 29, 2020 |
10.49 |
0.16 |
0.37 |
0.53 |
(0.16) |
| Year Ended February 28, 2019 |
10.39 |
0.16 |
0.10 |
0.26 |
(0.16) |
| Year Ended February 28, 2018 |
10.48 |
0.12 |
(0.09) |
0.03 |
(0.12) |
| Class C |
|
|
|
|
|
| Year Ended February 28, 2022 |
10.88 |
0.06 |
(0.32) |
(0.26) |
(0.06) |
| Year Ended February 28, 2021 |
10.96 |
0.08 |
(0.09) |
(0.01) |
(0.07) |
| Year Ended February 29, 2020 |
10.59 |
0.11 |
0.37 |
0.48 |
(0.11) |
| Year Ended February 28, 2019 |
10.48 |
0.11 |
0.11 |
0.22 |
(0.11) |
| Year Ended February 28, 2018 |
10.56 |
0.06 |
(0.08) |
(0.02) |
(0.06) |
| Class I |
|
|
|
|
|
| Year Ended February 28, 2022 |
10.84 |
0.16 |
(0.32) |
(0.16) |
(0.16) |
| Year Ended February 28, 2021 |
10.92 |
0.18 |
(0.09) |
0.09 |
(0.17) |
| Year Ended February 29, 2020 |
10.55 |
0.21 |
0.37 |
0.58 |
(0.21) |
| Year Ended February 28, 2019 |
10.44 |
0.21 |
0.11 |
0.32 |
(0.21) |
| Year Ended February 28, 2018 |
10.53 |
0.16 |
(0.09) |
0.07 |
(0.16) |
(a)
Calculated based upon average shares outstanding.
(b)
Includes adjustments in accordance with accounting principles generally accepted in the United States of America and as such, the net asset values for financial reporting purposes and the returns based upon those net asset values may differ from the net asset values and returns for shareholder transactions.
(c)
Includes earnings credits and interest expense, if applicable, each of which is less than 0.005% unless otherwise noted.
102 | J.P. Morgan Municipal Bond Funds
| |
Ratios/Supplemental data | |||||
| |
|
|
Ratios to average net assets |
| ||
| Net asset value, end of period |
Total return (excludes sales charge) (b) |
Net assets, end of period (000’s) |
Net expenses (c) |
Net investment income (loss) |
Expenses without waivers, reimbursements and earnings credits |
Portfolio turnover rate |
| |
|
|
|
|
|
|
| |
|
|
|
|
|
|
| $10.46 |
(1.96)% |
$93,976 |
0.70% |
1.02% |
0.85% |
21% |
| 10.78 |
0.43 |
80,956 |
0.69 |
1.20 |
0.86 |
21 |
| 10.86 |
5.12 |
53,408 |
0.70 |
1.48 |
0.86 |
24 |
| 10.49 |
2.55 |
33,554 |
0.70 |
1.54 |
0.86 |
42 |
| 10.39 |
0.26 |
32,373 |
0.69 |
1.10 |
0.86 |
73 |
| |
|
|
|
|
|
|
| 10.56 |
(2.45) |
3,473 |
1.20 |
0.52 |
1.36 |
21 |
| 10.88 |
(0.09) |
4,626 |
1.19 |
0.72 |
1.36 |
21 |
| 10.96 |
4.52 |
4,303 |
1.20 |
0.99 |
1.36 |
24 |
| 10.59 |
2.10 |
4,590 |
1.20 |
1.03 |
1.38 |
42 |
| 10.48 |
(0.19) |
6,406 |
1.19 |
0.56 |
1.37 |
73 |
| |
|
|
|
|
|
|
| 10.52 |
(1.51) |
823,600 |
0.25 |
1.47 |
0.60 |
21 |
| 10.84 |
0.87 |
829,847 |
0.24 |
1.66 |
0.60 |
21 |
| 10.92 |
5.56 |
641,836 |
0.24 |
1.94 |
0.61 |
24 |
| 10.55 |
3.09 |
573,350 |
0.25 |
1.97 |
0.61 |
42 |
| 10.44 |
0.70 |
1,680,807 |
0.24 |
1.53 |
0.60 |
73 |
July 1, 2022 | 103
Financial Highlights (continued)
| |
|
Per share operating performance | |||
| |
|
Investment operations |
Distributions | ||
| |
Net asset value, beginning of period |
Net investment income (loss) (a) |
Net realized and unrealized gains (losses) on investments |
Total from investment operations |
Net investment income |
| JPMorgan Tax Free Bond Fund |
|
|
|
|
|
| Class A |
|
|
|
|
|
| Year Ended February 28, 2022 |
$12.46 |
$0.27 |
$(0.31) |
$(0.04) |
$(0.27) |
| Year Ended February 28, 2021 |
12.66 |
0.28 |
(0.20) |
0.08 |
(0.28) |
| Year Ended February 29, 2020 |
11.77 |
0.32 |
0.89 |
1.21 |
(0.32) |
| Year Ended February 28, 2019 |
11.82 |
0.40 |
(0.05) |
0.35 |
(0.40) |
| Year Ended February 28, 2018 |
11.93 |
0.39 |
(0.11) |
0.28 |
(0.39) |
| Class C |
|
|
|
|
|
| Year Ended February 28, 2022 |
12.35 |
0.19 |
(0.31) |
(0.12) |
(0.19) |
| Year Ended February 28, 2021 |
12.55 |
0.21 |
(0.21) |
— (d) |
(0.20) |
| Year Ended February 29, 2020 |
11.67 |
0.25 |
0.87 |
1.12 |
(0.24) |
| Year Ended February 28, 2019 |
11.72 |
0.33 |
(0.05) |
0.28 |
(0.33) |
| Year Ended February 28, 2018 |
11.84 |
0.32 |
(0.12) |
0.20 |
(0.32) |
| Class I |
|
|
|
|
|
| Year Ended February 28, 2022 |
12.41 |
0.29 |
(0.32) |
(0.03) |
(0.29) |
| Year Ended February 28, 2021 |
12.61 |
0.31 |
(0.21) |
0.10 |
(0.30) |
| Year Ended February 29, 2020 |
11.72 |
0.34 |
0.89 |
1.23 |
(0.34) |
| Year Ended February 28, 2019 |
11.77 |
0.42 |
(0.05) |
0.37 |
(0.42) |
| Year Ended February 28, 2018 |
11.88 |
0.42 |
(0.11) |
0.31 |
(0.42) |
(a)
Calculated based upon average shares outstanding.
(b)
Includes adjustments in accordance with accounting principles generally accepted in the United States of America and as such, the net asset values for financial reporting purposes and the returns based upon those net asset values may differ from the net asset values and returns for shareholder transactions.
(c)
Includes earnings credits and interest expense, if applicable, each of which is less than 0.005% unless otherwise noted.
(d)
Amount rounds to less than $0.005.
104 | J.P. Morgan Municipal Bond Funds
| |
Ratios/Supplemental data | |||||
| |
|
|
Ratios to average net assets |
| ||
| Net asset value, end of period |
Total return (excludes sales charge) (b) |
Net assets, end of period (000’s) |
Net expenses (c) |
Net investment income (loss) |
Expenses without waivers, reimbursements and earnings credits |
Portfolio turnover rate |
| |
|
|
|
|
|
|
| |
|
|
|
|
|
|
| $12.15 |
(0.40)% |
$330,640 |
0.67% |
2.12% |
0.94% |
16% |
| 12.46 |
0.66 |
302,134 |
0.66 |
2.28 |
0.95 |
23 |
| 12.66 |
10.37 |
231,815 |
0.67 |
2.58 |
0.97 |
31 |
| 11.77 |
3.00 |
132,813 |
0.67 |
3.40 |
1.00 |
53 |
| 11.82 |
2.36 |
130,462 |
0.66 |
3.27 |
0.98 |
39 |
| |
|
|
|
|
|
|
| 12.04 |
(0.99) |
12,535 |
1.25 |
1.54 |
1.44 |
16 |
| 12.35 |
0.07 |
16,524 |
1.24 |
1.70 |
1.45 |
23 |
| 12.55 |
9.73 |
26,965 |
1.25 |
2.05 |
1.48 |
31 |
| 11.67 |
2.43 |
27,701 |
1.25 |
2.81 |
1.49 |
53 |
| 11.72 |
1.70 |
25,172 |
1.24 |
2.69 |
1.48 |
39 |
| |
|
|
|
|
|
|
| 12.09 |
(0.27) |
173,023 |
0.45 |
2.34 |
0.69 |
16 |
| 12.41 |
0.88 |
176,073 |
0.45 |
2.50 |
0.70 |
23 |
| 12.61 |
10.66 |
177,584 |
0.45 |
2.82 |
0.72 |
31 |
| 11.72 |
3.24 |
135,295 |
0.45 |
3.61 |
0.74 |
53 |
| 11.77 |
2.60 |
160,391 |
0.44 |
3.49 |
0.72 |
39 |
July 1, 2022 | 105
Financial Highlights (continued)
| |
|
Per share operating performance | |||
| |
|
Investment operations |
Distributions | ||
| |
Net asset value, beginning of period |
Net investment income (loss) (a) |
Net realized and unrealized gains (losses) on investments |
Total from investment operations |
Net investment income |
| JPMorgan Ultra-Short Municipal Fund |
|
|
|
|
|
| Class A |
|
|
|
|
|
| Year Ended February 28, 2022 |
$10.07 |
$0.01 |
$(0.09) |
$(0.08) |
$(0.01) |
| Year Ended February 28, 2021 |
10.08 |
0.03 |
— (d) |
0.03 |
(0.04) |
| Year Ended February 29, 2020 |
10.03 |
0.12 |
0.06 |
0.18 |
(0.13) |
| Year Ended February 28, 2019 |
10.01 |
0.13 |
— (d) |
0.13 |
(0.11) |
| Year Ended February 28, 2018 |
10.02 |
0.07 |
(0.02) |
0.05 |
(0.06) |
| Class I |
|
|
|
|
|
| Year Ended February 28, 2022 |
10.06 |
0.03 |
(0.08) |
(0.05) |
(0.03) |
| Year Ended February 28, 2021 |
10.07 |
0.05 |
— (d) |
0.05 |
(0.06) |
| Year Ended February 29, 2020 |
10.02 |
0.14 |
0.05 |
0.19 |
(0.14) |
| Year Ended February 28, 2019 |
10.00 |
0.14 |
0.02 |
0.16 |
(0.14) |
| Year Ended February 28, 2018 |
10.02 |
0.09 |
(0.03) |
0.06 |
(0.08) |
(a)
Calculated based upon average shares outstanding.
(b)
Includes adjustments in accordance with accounting principles generally accepted in the United States of America and as such, the net asset values for financial reporting purposes and the returns based upon those net asset values may differ from the net asset values and returns for shareholder transactions.
(c)
Includes earnings credits and interest expense, if applicable, each of which is less than 0.005% unless otherwise noted.
(d)
Amount rounds to less than $0.005.
(e)
Certain non-recurring expenses incurred by the Fund were not annualized for the period indicated.
106 | J.P. Morgan Municipal Bond Funds
| |
Ratios/Supplemental data | |||||
| |
|
|
Ratios to average net assets |
| ||
| Net asset value, end of period |
Total return (excludes sales charge) (b) |
Net assets, end of period (000’s) |
Net expenses (c) |
Net investment income (loss) |
Expenses without waivers, reimbursements and earnings credits |
Portfolio turnover rate |
| |
|
|
|
|
|
|
| |
|
|
|
|
|
|
| $9.98 |
(0.83)% |
$72,506 |
0.45% |
0.06% |
0.75% |
33% |
| 10.07 |
0.30 |
143,944 |
0.44 |
0.35 |
0.75 |
71 |
| 10.08 |
1.76 |
106,625 |
0.45 |
1.23 |
0.76 |
48 |
| 10.03 |
1.33 |
67,256 |
0.44 |
1.32 |
0.77 |
50 |
| 10.01 |
0.47 |
772 |
0.44 (e) |
0.67 (e) |
0.85 (e) |
71 |
| |
|
|
|
|
|
|
| 9.98 |
(0.53) |
3,984,195 |
0.25 |
0.26 |
0.50 |
33 |
| 10.06 |
0.51 |
6,666,678 |
0.24 |
0.53 |
0.50 |
71 |
| 10.07 |
1.96 |
4,050,886 |
0.25 |
1.43 |
0.50 |
48 |
| 10.02 |
1.60 |
3,021,190 |
0.24 |
1.42 |
0.52 |
50 |
| 10.00 |
0.63 |
2,064,297 |
0.24 (e) |
0.90 (e) |
0.56 (e) |
71 |
July 1, 2022 | 107
Financial Highlights (continued)
| |
|
Per share operating performance | |||
| |
|
Investment operations |
Distributions | ||
| |
Net asset value, beginning of period |
Net investment income (loss) (a) |
Net realized and unrealized gains (losses) on investments |
Total from investment operations |
Net investment income |
| JPMorgan California Tax Free Bond Fund |
|
|
|
|
|
| Class A |
|
|
|
|
|
| Year Ended February 28, 2022 |
$11.06 |
$0.16 |
$(0.38) |
$(0.22) |
$(0.16) |
| Year Ended February 28, 2021 |
11.25 |
0.17 |
(0.19) |
(0.02) |
(0.17) |
| Year Ended February 29, 2020 |
10.71 |
0.23 |
0.54 |
0.77 |
(0.23) |
| Year Ended February 28, 2019 |
10.64 |
0.28 |
0.07 |
0.35 |
(0.28) |
| Year Ended February 28, 2018 |
10.78 |
0.28 |
(0.14) |
0.14 |
(0.28) |
| Class C |
|
|
|
|
|
| Year Ended February 28, 2022 |
10.96 |
0.10 |
(0.37) |
(0.27) |
(0.10) |
| Year Ended February 28, 2021 |
11.15 |
0.12 |
(0.20) |
(0.08) |
(0.11) |
| Year Ended February 29, 2020 |
10.62 |
0.18 |
0.53 |
0.71 |
(0.18) |
| Year Ended February 28, 2019 |
10.55 |
0.22 |
0.07 |
0.29 |
(0.22) |
| Year Ended February 28, 2018 |
10.69 |
0.22 |
(0.14) |
0.08 |
(0.22) |
| Class I |
|
|
|
|
|
| Year Ended February 28, 2022 |
10.80 |
0.17 |
(0.37) |
(0.20) |
(0.17) |
| Year Ended February 28, 2021 |
10.99 |
0.18 |
(0.19) |
(0.01) |
(0.18) |
| Year Ended February 29, 2020 |
10.47 |
0.24 |
0.52 |
0.76 |
(0.24) |
| Year Ended February 28, 2019 |
10.41 |
0.28 |
0.07 |
0.35 |
(0.29) |
| Year Ended February 28, 2018 |
10.55 |
0.29 |
(0.14) |
0.15 |
(0.29) |
(a)
Calculated based upon average shares outstanding.
(b)
Includes adjustments in accordance with accounting principles generally accepted in the United States of America and as such, the net asset values for financial reporting purposes and the returns based upon those net asset values may differ from the net asset values and returns for shareholder transactions.
(c)
Includes earnings credits and interest expense, if applicable, each of which is less than 0.005% unless otherwise noted.
108 | J.P. Morgan Municipal Bond Funds
| |
Ratios/Supplemental data | |||||
| |
|
|
Ratios to average net assets |
| ||
| Net asset value, end of period |
Total return (excludes sales charge) (b) |
Net assets, end of period (000’s) |
Net expenses (c) |
Net investment income (loss) |
Expenses without waivers, reimbursements and earnings credits |
Portfolio turnover rate |
| |
|
|
|
|
|
|
| |
|
|
|
|
|
|
| $10.68 |
(2.05)% |
$136,939 |
0.60% |
1.43% |
0.94% |
11% |
| 11.06 |
(0.19) |
154,108 |
0.59 |
1.54 |
0.93 |
6 |
| 11.25 |
7.29 |
126,253 |
0.60 |
2.13 |
0.96 |
8 |
| 10.71 |
3.31 |
67,275 |
0.60 |
2.63 |
0.97 |
17 |
| 10.64 |
1.27 |
69,092 |
0.60 |
2.58 |
0.98 |
8 |
| |
|
|
|
|
|
|
| 10.59 |
(2.47) |
24,442 |
1.10 |
0.93 |
1.43 |
11 |
| 10.96 |
(0.70) |
33,234 |
1.09 |
1.07 |
1.43 |
6 |
| 11.15 |
6.72 |
52,168 |
1.10 |
1.66 |
1.47 |
8 |
| 10.62 |
2.82 |
46,950 |
1.10 |
2.13 |
1.48 |
17 |
| 10.55 |
0.78 |
54,655 |
1.10 |
2.08 |
1.48 |
8 |
| |
|
|
|
|
|
|
| 10.43 |
(1.90) |
80,566 |
0.50 |
1.53 |
0.68 |
11 |
| 10.80 |
(0.09) |
100,163 |
0.49 |
1.62 |
0.68 |
6 |
| 10.99 |
7.37 |
60,122 |
0.50 |
2.26 |
0.71 |
8 |
| 10.47 |
3.39 |
62,069 |
0.50 |
2.72 |
0.72 |
17 |
| 10.41 |
1.41 |
143,734 |
0.50 |
2.68 |
0.71 |
8 |
July 1, 2022 | 109
Financial Highlights (continued)
| |
|
Per share operating performance | |||||
| |
|
Investment operations |
Distributions | ||||
| |
Net asset value, beginning of period |
Net investment income (loss) (a) |
Net realized and unrealized gains (losses) on investments |
Total from investment operations |
Net investment income |
Net realized gain |
Total distributions |
| JPMorgan High Yield Municipal Fund |
|
|
|
|
|
|
|
| Class A |
|
|
|
|
|
|
|
| Year Ended February 28, 2022 |
$11.50 |
$0.34 |
$(0.17) |
$0.17 |
$(0.34) |
$— |
$(0.34) |
| Year Ended February 28, 2021 |
11.93 |
0.33 |
(0.42) |
(0.09) |
(0.33) |
(0.01) |
(0.34) |
| Year Ended February 29, 2020 |
10.88 |
0.32 |
1.05 |
1.37 |
(0.31) |
(0.01) |
(0.32) |
| Year Ended February 28, 2019 |
10.78 |
0.36 |
0.09 |
0.45 |
(0.35) |
— |
(0.35) |
| Year Ended February 28, 2018 |
10.82 |
0.28 |
(0.04) |
0.24 |
(0.28) |
— |
(0.28) |
| Class C |
|
|
|
|
|
|
|
| Year Ended February 28, 2022 |
11.47 |
0.28 |
(0.17) |
0.11 |
(0.28) |
— |
(0.28) |
| Year Ended February 28, 2021 |
11.90 |
0.28 |
(0.43) |
(0.15) |
(0.27) |
(0.01) |
(0.28) |
| Year Ended February 29, 2020 |
10.85 |
0.27 |
1.05 |
1.32 |
(0.26) |
(0.01) |
(0.27) |
| Year Ended February 28, 2019 |
10.76 |
0.30 |
0.09 |
0.39 |
(0.30) |
— |
(0.30) |
| Year Ended February 28, 2018 |
10.80 |
0.22 |
(0.03) |
0.19 |
(0.23) |
— |
(0.23) |
| Class I |
|
|
|
|
|
|
|
| Year Ended February 28, 2022 |
11.50 |
0.35 |
(0.17) |
0.18 |
(0.35) |
— |
(0.35) |
| Year Ended February 28, 2021 |
11.93 |
0.34 |
(0.42) |
(0.08) |
(0.34) |
(0.01) |
(0.35) |
| Year Ended February 29, 2020 |
10.87 |
0.34 |
1.06 |
1.40 |
(0.33) |
(0.01) |
(0.34) |
| Year Ended February 28, 2019 |
10.78 |
0.37 |
0.08 |
0.45 |
(0.36) |
— |
(0.36) |
| Year Ended February 28, 2018 |
10.82 |
0.29 |
(0.03) |
0.26 |
(0.30) |
— |
(0.30) |
(a)
Calculated based upon average shares outstanding.
(b)
Includes adjustments in accordance with accounting principles generally accepted in the United States of America and as such, the net asset values for financial reporting purposes and the returns based upon those net asset values may differ from the net asset values and returns for shareholder transactions.
(c)
Includes earnings credits and interest expense, if applicable, each of which is less than 0.005% unless otherwise noted.
110 | J.P. Morgan Municipal Bond Funds
| |
Ratios/Supplemental data | |||||
| |
|
|
Ratios to average net assets |
| ||
| Net asset value, end of period |
Total return (excludes sales charge) (b) |
Net assets, end of period (000’s) |
Net expenses (c) |
Net investment income (loss) |
Expenses without waivers, reimbursements and earnings credits |
Portfolio turnover rate |
| |
|
|
|
|
|
|
| |
|
|
|
|
|
|
| $11.33 |
1.39% |
$195,574 |
0.65% |
2.87% |
1.01% |
24% |
| 11.50 |
(0.61) |
179,459 |
0.65 |
2.99 |
1.02 |
39 |
| 11.93 |
12.81 |
194,623 |
0.64 |
2.80 |
1.06 |
18 |
| 10.88 |
4.28 |
43,565 |
0.64 |
3.32 |
1.22 |
130 |
| 10.78 |
2.25 |
35,071 |
0.64 |
2.56 |
1.20 |
17 |
| |
|
|
|
|
|
|
| 11.30 |
0.89 |
28,844 |
1.15 |
2.37 |
1.51 |
24 |
| 11.47 |
(1.11) |
32,499 |
1.14 |
2.50 |
1.51 |
39 |
| 11.90 |
12.29 |
37,623 |
1.14 |
2.34 |
1.57 |
18 |
| 10.85 |
3.67 |
17,929 |
1.14 |
2.82 |
1.71 |
130 |
| 10.76 |
1.74 |
18,675 |
1.14 |
2.06 |
1.70 |
17 |
| |
|
|
|
|
|
|
| 11.33 |
1.50 |
247,902 |
0.55 |
2.97 |
0.76 |
24 |
| 11.50 |
(0.51) |
256,624 |
0.55 |
3.09 |
0.76 |
39 |
| 11.93 |
13.02 |
296,450 |
0.54 |
2.92 |
0.81 |
18 |
| 10.87 |
4.29 |
95,662 |
0.54 |
3.45 |
0.97 |
130 |
| 10.78 |
2.36 |
51,274 |
0.54 |
2.66 |
0.95 |
17 |
July 1, 2022 | 111
Financial Highlights (continued)
| |
|
Per share operating performance | |||||
| |
|
Investment operations |
Distributions | ||||
| |
Net asset value, beginning of period |
Net investment income (loss) (a) |
Net realized and unrealized gains (losses) on investments |
Total from investment operations |
Net investment income |
Net realized gain |
Total distributions |
| JPMorgan Intermediate Tax Free Bond Fund |
|
|
|
|
|
|
|
| Class A |
|
|
|
|
|
|
|
| Year Ended February 28, 2022 |
$11.37 |
$0.23 |
$(0.37) |
$(0.14) |
$(0.23) |
$(0.09) |
$(0.32) |
| Year Ended February 28, 2021 |
11.52 |
0.22 |
(0.16) |
0.06 |
(0.21) |
— |
(0.21) |
| Year Ended February 29, 2020 |
10.91 |
0.24 |
0.61 |
0.85 |
(0.24) |
— |
(0.24) |
| Year Ended February 28, 2019 |
10.80 |
0.25 |
0.11 |
0.36 |
(0.25) |
— |
(0.25) |
| Year Ended February 28, 2018 |
10.94 |
0.24 |
(0.15) |
0.09 |
(0.23) |
— |
(0.23) |
| Class C |
|
|
|
|
|
|
|
| Year Ended February 28, 2022 |
11.07 |
0.17 |
(0.36) |
(0.19) |
(0.17) |
(0.09) |
(0.26) |
| Year Ended February 28, 2021 |
11.23 |
0.15 |
(0.16) |
(0.01) |
(0.15) |
— |
(0.15) |
| Year Ended February 29, 2020 |
10.63 |
0.18 |
0.60 |
0.78 |
(0.18) |
— |
(0.18) |
| Year Ended February 28, 2019 |
10.53 |
0.18 |
0.11 |
0.29 |
(0.19) |
— |
(0.19) |
| Year Ended February 28, 2018 |
10.68 |
0.18 |
(0.15) |
0.03 |
(0.18) |
— |
(0.18) |
| Class I |
|
|
|
|
|
|
|
| Year Ended February 28, 2022 |
11.15 |
0.26 |
(0.37) |
(0.11) |
(0.26) |
(0.09) |
(0.35) |
| Year Ended February 28, 2021 |
11.31 |
0.24 |
(0.16) |
0.08 |
(0.24) |
— |
(0.24) |
| Year Ended February 29, 2020 |
10.71 |
0.27 |
0.60 |
0.87 |
(0.27) |
— |
(0.27) |
| Year Ended February 28, 2019 |
10.61 |
0.27 |
0.10 |
0.37 |
(0.27) |
— |
(0.27) |
| Year Ended February 28, 2018 |
10.75 |
0.27 |
(0.14) |
0.13 |
(0.27) |
— |
(0.27) |
(a)
Calculated based upon average shares outstanding.
(b)
Includes adjustments in accordance with accounting principles generally accepted in the United States of America and as such, the net asset values for financial reporting purposes and the returns based upon those net asset values may differ from the net asset values and returns for shareholder transactions.
(c)
Includes earnings credits and interest expense, if applicable, each of which is less than 0.005% unless otherwise noted.
112 | J.P. Morgan Municipal Bond Funds
| |
Ratios/Supplemental data | |||||
| |
|
|
Ratios to average net assets |
| ||
| Net asset value, end of period |
Total return (excludes sales charge) (b) |
Net assets, end of period (000’s) |
Net expenses (c) |
Net investment income (loss) |
Expenses without waivers, reimbursements and earnings credits |
Portfolio turnover rate |
| |
|
|
|
|
|
|
| |
|
|
|
|
|
|
| $10.91 |
(1.29)% |
$341,321 |
0.65% |
2.06% |
0.90% |
12% |
| 11.37 |
0.57 |
308,709 |
0.64 |
1.93 |
0.90 |
34 |
| 11.52 |
7.86 |
250,087 |
0.65 |
2.17 |
0.90 |
20 |
| 10.91 |
3.34 |
222,295 |
0.64 |
2.32 |
0.90 |
48 |
| 10.80 |
0.83 |
174,653 |
0.71 |
2.17 |
0.91 |
30 |
| |
|
|
|
|
|
|
| 10.62 |
(1.77) |
14,423 |
1.20 |
1.51 |
1.40 |
12 |
| 11.07 |
(0.07) |
19,061 |
1.19 |
1.38 |
1.40 |
34 |
| 11.23 |
7.38 |
29,173 |
1.20 |
1.63 |
1.40 |
20 |
| 10.63 |
2.76 |
37,603 |
1.19 |
1.76 |
1.40 |
48 |
| 10.53 |
0.24 |
50,481 |
1.22 |
1.65 |
1.41 |
30 |
| |
|
|
|
|
|
|
| 10.69 |
(1.06) |
655,190 |
0.40 |
2.31 |
0.65 |
12 |
| 11.15 |
0.75 |
622,009 |
0.39 |
2.17 |
0.65 |
34 |
| 11.31 |
8.19 |
660,041 |
0.40 |
2.42 |
0.64 |
20 |
| 10.71 |
3.57 |
523,544 |
0.39 |
2.57 |
0.65 |
48 |
| 10.61 |
1.17 |
770,626 |
0.39 |
2.45 |
0.64 |
30 |
July 1, 2022 | 113
Financial Highlights (continued)
| |
|
Per share operating performance | |||
| |
|
Investment operations |
Distributions | ||
| |
Net asset value, beginning of period |
Net investment income (loss) (a) |
Net realized and unrealized gains (losses) on investments |
Total from investment operations |
Net investment income |
| JPMorgan New York Tax Free Bond Fund |
|
|
|
|
|
| Class A |
|
|
|
|
|
| Year Ended February 28, 2022 |
$6.93 |
$0.11 |
$(0.21) |
$(0.10) |
$(0.12) |
| Year Ended February 28, 2021 |
7.06 |
0.12 |
(0.13) |
(0.01) |
(0.12) |
| Year Ended February 29, 2020 |
6.71 |
0.14 |
0.35 |
0.49 |
(0.14) |
| Year Ended February 28, 2019 |
6.70 |
0.18 |
0.01 |
0.19 |
(0.18) |
| Year Ended February 28, 2018 |
6.84 |
0.20 |
(0.14) |
0.06 |
(0.20) |
| Class C |
|
|
|
|
|
| Year Ended February 28, 2022 |
6.93 |
0.08 |
(0.22) |
(0.14) |
(0.08) |
| Year Ended February 28, 2021 |
7.05 |
0.09 |
(0.13) |
(0.04) |
(0.08) |
| Year Ended February 29, 2020 |
6.71 |
0.10 |
0.34 |
0.44 |
(0.10) |
| Year Ended February 28, 2019 |
6.69 |
0.14 |
0.02 |
0.16 |
(0.14) |
| Year Ended February 28, 2018 |
6.84 |
0.16 |
(0.15) |
0.01 |
(0.16) |
| Class I |
|
|
|
|
|
| Year Ended February 28, 2022 |
6.96 |
0.13 |
(0.21) |
(0.08) |
(0.13) |
| Year Ended February 28, 2021 |
7.09 |
0.14 |
(0.13) |
0.01 |
(0.14) |
| Year Ended February 29, 2020 |
6.75 |
0.15 |
0.34 |
0.49 |
(0.15) |
| Year Ended February 28, 2019 |
6.73 |
0.20 |
0.01 |
0.21 |
(0.19) |
| Year Ended February 28, 2018 |
6.87 |
0.21 |
(0.14) |
0.07 |
(0.21) |
(a)
Calculated based upon average shares outstanding.
(b)
Includes adjustments in accordance with accounting principles generally accepted in the United States of America and as such, the net asset values for financial reporting purposes and the returns based upon those net asset values may differ from the net asset values and returns for shareholder transactions.
(c)
Includes earnings credits and interest expense, if applicable, each of which is less than 0.005% unless otherwise noted.
114 | J.P. Morgan Municipal Bond Funds
| |
Ratios/Supplemental data | |||||
| |
|
|
Ratios to average net assets |
| ||
| Net asset value, end of period |
Total return (excludes sales charge) (b) |
Net assets, end of period (000’s) |
Net expenses (c) |
Net investment income (loss) |
Expenses without waivers, reimbursements and earnings credits |
Portfolio turnover rate |
| |
|
|
|
|
|
|
| |
|
|
|
|
|
|
| $6.71 |
(1.55)% |
$143,940 |
0.75% |
1.60% |
0.94% |
10% |
| 6.93 |
(0.13) |
166,435 |
0.74 |
1.77 |
0.93 |
5 |
| 7.06 |
7.31 |
164,358 |
0.75 |
1.96 |
0.95 |
13 |
| 6.71 |
2.86 |
120,371 |
0.75 |
2.66 |
0.96 |
21 |
| 6.70 |
0.81 |
128,973 |
0.75 |
2.85 |
0.96 |
8 |
| |
|
|
|
|
|
|
| 6.71 |
(2.05) |
24,776 |
1.25 |
1.10 |
1.44 |
10 |
| 6.93 |
(0.51) |
31,173 |
1.24 |
1.26 |
1.43 |
5 |
| 7.05 |
6.62 |
57,781 |
1.25 |
1.49 |
1.45 |
13 |
| 6.71 |
2.50 |
67,242 |
1.25 |
2.16 |
1.45 |
21 |
| 6.69 |
0.15 |
83,807 |
1.25 |
2.35 |
1.45 |
8 |
| |
|
|
|
|
|
|
| 6.75 |
(1.16) |
76,802 |
0.50 |
1.85 |
0.69 |
10 |
| 6.96 |
0.12 |
87,928 |
0.49 |
2.02 |
0.68 |
5 |
| 7.09 |
7.38 |
105,497 |
0.50 |
2.22 |
0.70 |
13 |
| 6.75 |
3.26 |
87,158 |
0.50 |
2.92 |
0.70 |
21 |
| 6.73 |
1.06 |
163,141 |
0.50 |
3.10 |
0.69 |
8 |
July 1, 2022 | 115
Additional Fee and Expense Information for the JPMT II Funds and Former One Group Mutual Funds
In connection with the 2004 final settlement between Banc One Investment Advisors Corporation (BOIA), subsequently known as JPMorgan Investment Advisors Inc. (JPMIA1), with the New York Attorney General arising out of market timing of certain mutual funds advised by BOIA, BOIA agreed, among other things, to disclose hypothetical information regarding investment and expense information to Fund shareholders. The hypothetical examples are provided for JPMT II Funds or those Funds that have acquired the assets and liabilities of a JPMT II Fund or a series of One Group Mutual Funds.
The “Gross Expense Ratio” includes the contractual expenses that make up the investment advisory, administration and servicing fees, Rule 12b-1 distribution fees, fees paid to vendors not affiliated with JPMIM that provide services to the Funds and other fees and expenses of the Funds. The “Net Expense Ratio” is Gross Expenses less any fee waivers or expense reimbursements memorialized in a written contract between the Funds and JPMIM and/or its affiliates, as applicable.
The table below shows the ratios for Class A, Class C and Class I Shares of the affected Funds offered in this prospectus.
| |
|
|
|
| |
Class |
Net Expense Ratio |
Gross Expense Ratio |
| JPMorgan Sustainable Municipal Income Fund |
A |
0.70% |
0.96% |
| |
C |
1.25% |
1.46% |
| |
I |
0.45% |
0.71% |
| JPMorgan Short-Intermediate Municipal Bond Fund |
A |
0.70% |
0.86% |
| |
C |
1.20% |
1.37% |
| |
I |
0.25% |
0.61% |
| JPMorgan Tax Free Bond Fund |
A |
0.67% |
0.94% |
| |
C |
1.25% |
1.44% |
| |
I |
0.45% |
0.69% |
| JPMorgan Intermediate Tax Free Bond Fund |
A |
0.65% |
0.90% |
| |
C |
1.20% |
1.40% |
| |
I |
0.40% |
0.65% |
A Fund’s annual return is reduced by its fees and expenses for that year. The examples below are intended to help you understand the annual and cumulative impact of the Fund’s fees and expenses on your investment through a hypothetical investment of $10,000 held for the next 10 years. The examples assume the following:
•
On 7/1/22, you invest $10,000 in the Fund and you will hold the shares for the entire 10 year period;
•
Your investment has a 5% return each year;
•
The Fund’s operating expenses remain at the levels discussed below and are not affected by increases or decreases in Fund assets over time;
•
At the time of purchase, any applicable initial sales charges (loads) are deducted; and
•
There is no sales charge (load) on reinvested dividends.
•
The annual costs are calculated using the Net Expense Ratios for the period through the expiration of any fee waivers or expense reimbursements memorialized in a written contract between the Funds and JPMIM and/or its affiliates; and the Gross Expense Ratios thereafter.
“Annual Net Return” shows what effect the “Annual Costs” will have on the assumed 5% annual return for each year. “Gross Cumulative Return” shows what the cumulative return on your investment at the end of each 12 month period (year) ended October 31 would be if Fund expenses are not deducted. “Net Cumulative Return” shows what the cumulative return on your investment at the end of each year would be assuming Fund expenses are deducted each year in the amount shown under “Annual Costs.” “Annual Net Return” shows what effect the “Annual Costs” will have on the assumed 5% annual return for each year.
Your actual costs may be higher or lower than those shown.
1
Effective January 1, 2010, the investment advisory business of JPMorgan Investment Advisors Inc. (JPMIA), which was the adviser for certain of the J.P. Morgan Funds, was transferred to JPMIM and JPMIM became the investment adviser for certain J.P. Morgan Funds that were previously advised by JPMIA.
116 | J.P. Morgan Municipal Bond Funds
| JPMorgan Sustainable Municipal Income Fund | ||||||||
| |
Class A |
Class C1 | ||||||
| Period Ended |
Annual Costs |
Gross Cumulative Return |
Net Cumulative Return |
Net Annual Return |
Annual Costs |
Gross Cumulative Return |
Net Cumulative Return |
Net Annual Return |
| June 30, 2023 |
$444 |
1.06% |
0.39% |
0.39% |
$127 |
5.00% |
3.75% |
3.75% |
| June 30, 2024 |
98 |
6.12 |
4.44 |
4.04 |
154 |
10.25 |
7.42 |
3.54 |
| June 30, 2025 |
102 |
11.42 |
8.66 |
4.04 |
160 |
15.76 |
11.23 |
3.54 |
| June 30, 2026 |
106 |
16.99 |
13.05 |
4.04 |
165 |
21.55 |
15.16 |
3.54 |
| June 30, 2027 |
111 |
22.84 |
17.62 |
4.04 |
171 |
27.63 |
19.24 |
3.54 |
| June 30, 2028 |
115 |
28.98 |
22.37 |
4.04 |
177 |
34.01 |
23.46 |
3.54 |
| June 30, 2029 |
120 |
35.43 |
27.32 |
4.04 |
183 |
40.71 |
27.83 |
3.54 |
| June 30, 2030 |
125 |
42.21 |
32.46 |
4.04 |
190 |
47.75 |
32.36 |
3.54 |
| June 30, 2031 |
130 |
49.32 |
37.81 |
4.04 |
130 |
55.13 |
37.70 |
4.04 |
| June 30, 2032 |
135 |
56.78 |
43.38 |
4.04 |
135 |
62.89 |
43.27 |
4.04 |
1
The disclosure and numbers for Class C Shares shown above assume that the shareholder did not redeem the shares.With redemption, the numbers for Class C Shares for the first year (period ended June 30, 2023) would be as follows:
| |
Annual Costs |
Gross Cumulative Return |
Net Cumulative Return |
Net Annual Return |
|
| |
$227 |
4.00% |
2.75% |
2.75% |
|
| | ||||
| |
Class I | |||
| Period Ended |
Annual Costs |
Gross Cumulative Return |
Net Cumulative Return |
Net Annual Return |
| June 30, 2023 |
$46 |
5.00% |
4.55% |
4.55% |
| June 30, 2024 |
76 |
10.25 |
9.04 |
4.29 |
| June 30, 2025 |
79 |
15.76 |
13.71 |
4.29 |
| June 30, 2026 |
82 |
21.55 |
18.59 |
4.29 |
| June 30, 2027 |
86 |
27.63 |
23.68 |
4.29 |
| June 30, 2028 |
90 |
34.01 |
28.98 |
4.29 |
| June 30, 2029 |
94 |
40.71 |
34.52 |
4.29 |
| June 30, 2030 |
98 |
47.75 |
40.29 |
4.29 |
| June 30, 2031 |
102 |
55.13 |
46.31 |
4.29 |
| June 30, 2032 |
106 |
62.89 |
52.58 |
4.29 |
July 1, 2022 | 117
Additional Fee and Expense Information for the JPMT II Funds and Former One Group Mutual Funds (continued)
| JPMorgan Short-Intermediate Municipal Bond Fund | ||||||||
| |
Class A |
Class C1 | ||||||
| Period Ended |
Annual Costs |
Gross Cumulative Return |
Net Cumulative Return |
Net Annual Return |
Annual Costs |
Gross Cumulative Return |
Net Cumulative Return |
Net Annual Return |
| June 30, 2023 |
$295 |
2.64% |
1.95% |
1.95% |
$122 |
5.00% |
3.80% |
3.80% |
| June 30, 2024 |
89 |
7.77 |
6.17 |
4.14 |
145 |
10.25 |
7.57 |
3.63 |
| June 30, 2025 |
93 |
13.16 |
10.57 |
4.14 |
150 |
15.76 |
11.47 |
3.63 |
| June 30, 2026 |
97 |
18.82 |
15.15 |
4.14 |
155 |
21.55 |
15.52 |
3.63 |
| June 30, 2027 |
101 |
24.76 |
19.91 |
4.14 |
161 |
27.63 |
19.71 |
3.63 |
| June 30, 2028 |
105 |
30.99 |
24.88 |
4.14 |
167 |
34.01 |
24.06 |
3.63 |
| June 30, 2029 |
110 |
37.54 |
30.05 |
4.14 |
173 |
40.71 |
28.56 |
3.63 |
| June 30, 2030 |
114 |
44.42 |
35.43 |
4.14 |
179 |
47.75 |
33.23 |
3.63 |
| June 30, 2031 |
119 |
51.64 |
41.04 |
4.14 |
117 |
55.13 |
38.74 |
4.14 |
| June 30, 2032 |
124 |
59.22 |
46.88 |
4.14 |
122 |
62.89 |
44.49 |
4.14 |
1
The disclosure and numbers for Class C Shares shown above assume that the shareholder did not redeem the shares.With redemption, the numbers for Class C Shares for the first year (period ended June 30, 2023) would be as follows:
| |
Annual Costs |
Gross Cumulative Return |
Net Cumulative Return |
Net Annual Return |
|
| |
$222 |
4.00% |
2.80% |
2.80% |
|
| | ||||
| |
Class I | |||
| Period Ended |
Annual Costs |
Gross Cumulative Return |
Net Cumulative Return |
Net Annual Return |
| June 30, 2023 |
$26 |
5.00% |
4.75% |
4.75% |
| June 30, 2024 |
65 |
10.25 |
9.35 |
4.39 |
| June 30, 2025 |
68 |
15.76 |
14.15 |
4.39 |
| June 30, 2026 |
71 |
21.55 |
19.16 |
4.39 |
| June 30, 2027 |
74 |
27.63 |
24.39 |
4.39 |
| June 30, 2028 |
78 |
34.01 |
29.85 |
4.39 |
| June 30, 2029 |
81 |
40.71 |
35.55 |
4.39 |
| June 30, 2030 |
85 |
47.75 |
41.50 |
4.39 |
| June 30, 2031 |
88 |
55.13 |
47.72 |
4.39 |
| June 30, 2032 |
92 |
62.89 |
54.20 |
4.39 |
118 | J.P. Morgan Municipal Bond Funds
| JPMorgan Tax Free Bond Fund | ||||||||
| |
Class A |
Class C1 | ||||||
| Period Ended |
Annual Costs |
Gross Cumulative Return |
Net Cumulative Return |
Net Annual Return |
Annual Costs |
Gross Cumulative Return |
Net Cumulative Return |
Net Annual Return |
| June 30, 2023 |
$441 |
1.06% |
0.42% |
0.42% |
$127 |
5.00% |
3.75% |
3.75% |
| June 30, 2024 |
96 |
6.12 |
4.49 |
4.06 |
152 |
10.25 |
7.44 |
3.56 |
| June 30, 2025 |
100 |
11.42 |
8.74 |
4.06 |
157 |
15.76 |
11.27 |
3.56 |
| June 30, 2026 |
104 |
16.99 |
13.15 |
4.06 |
163 |
21.55 |
15.23 |
3.56 |
| June 30, 2027 |
109 |
22.84 |
17.75 |
4.06 |
169 |
27.63 |
19.33 |
3.56 |
| June 30, 2028 |
113 |
28.98 |
22.53 |
4.06 |
175 |
34.01 |
23.58 |
3.56 |
| June 30, 2029 |
118 |
35.43 |
27.50 |
4.06 |
181 |
40.71 |
27.98 |
3.56 |
| June 30, 2030 |
122 |
42.21 |
32.68 |
4.06 |
188 |
47.75 |
32.54 |
3.56 |
| June 30, 2031 |
127 |
49.32 |
38.06 |
4.06 |
127 |
55.13 |
37.92 |
4.06 |
| June 30, 2032 |
132 |
56.78 |
43.67 |
4.06 |
132 |
62.89 |
43.52 |
4.06 |
1
The disclosure and numbers for Class C Shares shown above assume that the shareholder did not redeem the shares.With redemption, the numbers for Class C Shares for the first year (period ended June 30, 2023) would be as follows:
| |
Annual Costs |
Gross Cumulative Return |
Net Cumulative Return |
Net Annual Return |
|
| |
$227 |
4.00% |
2.75% |
2.75% |
|
| | ||||
| |
Class I | |||
| Period Ended |
Annual Costs |
Gross Cumulative Return |
Net Cumulative Return |
Net Annual Return |
| June 30, 2023 |
$46 |
5.00% |
4.55% |
4.55% |
| June 30, 2024 |
74 |
10.25 |
9.06 |
4.31 |
| June 30, 2025 |
77 |
15.76 |
13.76 |
4.31 |
| June 30, 2026 |
80 |
21.55 |
18.66 |
4.31 |
| June 30, 2027 |
84 |
27.63 |
23.77 |
4.31 |
| June 30, 2028 |
87 |
34.01 |
29.11 |
4.31 |
| June 30, 2029 |
91 |
40.71 |
34.67 |
4.31 |
| June 30, 2030 |
95 |
47.75 |
40.48 |
4.31 |
| June 30, 2031 |
99 |
55.13 |
46.53 |
4.31 |
| June 30, 2032 |
103 |
62.89 |
52.85 |
4.31 |
July 1, 2022 | 119
Additional Fee and Expense Information for the JPMT II Funds and Former One Group Mutual Funds (continued)
| JPMorgan Intermediate Tax Free Bond Fund | ||||||||
| |
Class A |
Class C1 | ||||||
| Period Ended |
Annual Costs |
Gross Cumulative Return |
Net Cumulative Return |
Net Annual Return |
Annual Costs |
Gross Cumulative Return |
Net Cumulative Return |
Net Annual Return |
| June 30, 2023 |
$439 |
1.06% |
0.44% |
0.44% |
$122 |
5.00% |
3.80% |
3.80% |
| June 30, 2024 |
92 |
6.12 |
4.55 |
4.10 |
148 |
10.25 |
7.54 |
3.60 |
| June 30, 2025 |
96 |
11.42 |
8.84 |
4.10 |
153 |
15.76 |
11.41 |
3.60 |
| June 30, 2026 |
100 |
16.99 |
13.30 |
4.10 |
159 |
21.55 |
15.42 |
3.60 |
| June 30, 2027 |
104 |
22.84 |
17.95 |
4.10 |
164 |
27.63 |
19.57 |
3.60 |
| June 30, 2028 |
108 |
28.98 |
22.79 |
4.10 |
170 |
34.01 |
23.88 |
3.60 |
| June 30, 2029 |
113 |
35.43 |
27.82 |
4.10 |
177 |
40.71 |
28.34 |
3.60 |
| June 30, 2030 |
117 |
42.21 |
33.06 |
4.10 |
183 |
47.75 |
32.96 |
3.60 |
| June 30, 2031 |
122 |
49.32 |
38.52 |
4.10 |
122 |
55.13 |
38.41 |
4.10 |
| June 30, 2032 |
127 |
56.78 |
44.19 |
4.10 |
127 |
62.89 |
44.08 |
4.10 |
1
The disclosure and numbers for Class C Shares shown above assume that the shareholder did not redeem the shares.With redemption, the numbers for Class C Shares for the first year (period ended June 30, 2023) would be as follows:
| |
Annual Costs |
Gross Cumulative Return |
Net Cumulative Return |
Net Annual Return |
|
| |
$222 |
4.00% |
2.80% |
2.80% |
|
| | ||||
| |
Class I | |||
| Period Ended |
Annual Costs |
Gross Cumulative Return |
Net Cumulative Return |
Net Annual Return |
| June 30, 2023 |
$41 |
5.00% |
4.60% |
4.60% |
| June 30, 2024 |
69 |
10.25 |
9.15 |
4.35 |
| June 30, 2025 |
72 |
15.76 |
13.90 |
4.35 |
| June 30, 2026 |
76 |
21.55 |
18.85 |
4.35 |
| June 30, 2027 |
79 |
27.63 |
24.02 |
4.35 |
| June 30, 2028 |
82 |
34.01 |
29.42 |
4.35 |
| June 30, 2029 |
86 |
40.71 |
35.05 |
4.35 |
| June 30, 2030 |
90 |
47.75 |
40.92 |
4.35 |
| June 30, 2031 |
94 |
55.13 |
47.05 |
4.35 |
| June 30, 2032 |
98 |
62.89 |
53.45 |
4.35 |
120 | J.P. Morgan Municipal Bond Funds
Appendix A – Financial Intermediary-Specific Sales Charge Waivers
Each Financial Intermediary below is responsible for the implementation or administration of the applicable waivers, discounts, and/or other platform or account features on its platform or for its accounts, as described below.
WAIVERS APPLICABLE TO PURCHASES THROUGH AMERIPRISE FINANCIAL
Front-end Sales Charge Waivers on Class A Shares available at Ameriprise Financial
The following information applies to Class A shares purchases if you have an account with or otherwise purchase Fund shares through Ameriprise Financial:
Shareholders purchasing Fund shares through an Ameriprise Financial retail brokerage account are eligible for the following front-end sales charge waivers, which may differ from those disclosed elsewhere in this Fund’s prospectus or Statement of Additional Information (“SAI”):
•
Employer-sponsored retirement plans (e.g., 401(k) plans, 457 plans, employer-sponsored 403(b) plans, profit sharing and money purchase pension plans and defined benefit plans). For purposes of this provision, employer-sponsored retirement plans do not include SEP IRAs, Simple IRAs or SAR-SEPs.
•
Shares purchased through reinvestment of capital gains distributions and dividend reinvestment when purchasing shares of the same Fund (but not any other fund within the same fund family).
•
Shares exchanged by Ameriprise Financial from Class C Shares of the same Fund in the month of or following the 7-year anniversary of the purchase date. To the extent that this prospectus elsewhere provides for a waiver with respect to exchanges of Class C Shares or conversion of Class C Shares following a shorter holding period, that waiver will apply.
•
Employees and registered representatives of Ameriprise Financial or its affiliates and their immediate family members.
•
Shares purchased by or through qualified accounts (including IRAs, Coverdell Education Savings Accounts, 401(k)s, 403(b) TSCAs subject to ERISA and defined benefit plans) that are held by a covered family member, defined as an Ameriprise financial advisor and/or the advisor’s spouse, advisor’s lineal ascendant (mother, father, grandmother, grandfather, great grandmother, great grandfather), advisor’s lineal descendant (son, step-son, daughter, step-daughter, grandson, granddaughter, great grandson, great granddaughter) or any spouse of a covered family member who is a lineal descendant.
•
Shares purchased from the proceeds of redemptions within the same fund family, provided (1) the repurchase occurs within 90 days following the redemption, (2) the redemption and purchase occur in the same account, and (3) redeemed shares were subject to a front-end or deferred sales load (i.e. Rights of Reinstatement.)
WAIVERS APPLICABLE TO PURCHASES THROUGH D.A. DAVIDSON
Shareholders purchasing Fund shares including existing Fund shareholders through a D.A. Davidson &. Co. (“D.A. Davidson”) platform or account, or through an introducing broker-dealer or independent registered investment advisor for which D.A. Davidson provides trade execution, clearance, and/or custody services, where the account is held omnibus at the Fund, will be eligible for the following sales charge waivers (front-end sales charge waivers and contingent deferred, or back-end, sales charge waivers) and discounts, which may differ from those disclosed elsewhere in this prospectus or Statement of Additional Information.
Front-end sales charge waivers on Class A Shares available at D.A. Davidson
•
Shares purchased within the same fund family through a systematic reinvestment of capital gains and dividend distributions.
•
Employees and registered representatives of D.A. Davidson or its affiliates and their family members as designated by D.A. Davidson.
•
Shares purchased from the proceeds of redemptions within the same fund family, provided (1) the repurchase occurs within 90 days following the redemption, (2) the redemption and purchase occur in the same account, and (3) redeemed shares were subject to a front-end or deferred sales charge (known as Rights of Reinstatement).
•
A shareholder in a Fund’s Class C Shares will have their shares exchanged at net asset value to Class A Shares (or the appropriate share class) of the Fund if the shares are no longer subject to a CDSC and the exchange is consistent with D.A. Davidson’s policies and procedures.
CDSC Waivers on Class A and C Shares available at D.A. Davidson
•
Death or disability of the shareholder.
•
Shares sold as part of a systematic withdrawal plan as described in the fund’s prospectus.
•
Return of excess contributions from an IRA Account.
•
Shares sold as part of a required minimum distribution for IRA or other qualifying retirement accounts as described in the fund’s prospectus.
July 1, 2022 | 121
Appendix A – Financial Intermediary-Specific Sales Charge Waivers (continued)
•
Shares acquired through a right of reinstatement.
Front-end sales charge discounts available at D.A. Davidson: breakpoints, rights of accumulation and/or letters of intent
•
Breakpoints as described in this prospectus.
•
Rights of accumulation which entitle shareholders to breakpoint discounts will be automatically calculated based on the aggregated holding of fund family assets held by accounts within the purchaser’s household at D.A. Davidson. Eligible fund family assets not held at D.A. Davidson may be included in the calculation of rights of accumulation only if the shareholder notifies his or her financial advisor about such assets.
•
Letters of intent which allow for breakpoint discounts based on anticipated purchases within a fund family, over a 13-month time period. Eligible fund family assets not held at D.A. Davidson may be included in the calculation of letters of intent only if the shareholder notifies his or her financial advisor about such assets.
POLICIES REGARDING TRANSACTIONS THROUGH EDWARD JONES
Effective on or after January 15, 2021, the following information supersedes prior information with respect to transactions and positions held in fund shares through an Edward Jones system. Clients of Edward Jones (also referred to as “shareholders”) purchasing fund shares on the Edward Jones commission and fee-based platforms are eligible only for the following sales charge discounts (also referred to as “breakpoints”) and waivers, which can differ from discounts and waivers described elsewhere in this Fund prospectus or statement of additional information (“SAI”) or through another broker-dealer. In all instances, it is the shareholder’s responsibility to inform Edward Jones at the time of purchase of any relationship, holdings of J.P. Morgan Funds, or other facts qualifying the purchaser for discounts or waivers. Edward Jones can ask for documentation of such circumstance. Shareholders should contact Edward Jones if they have questions regarding their eligibility for these discounts and waivers.
Breakpoints
•
Breakpoint pricing, otherwise known as volume pricing, at dollar thresholds as described in the prospectus.
Rights of Accumulation (“ROA”)
•
The applicable sales charge on a purchase of Class A Shares is determined by taking into account all share classes (except certain money market funds and any assets held in group retirement plans) of the J.P. Morgan Funds held by the shareholder or in an account grouped by Edward Jones with other accounts for the purpose of providing certain pricing considerations (“pricing groups”). If grouping assets as a shareholder, this includes all share classes held on the Edward Jones platform and/or held on another platform. The inclusion of eligible fund family assets in the ROA calculation is dependent on the shareholder notifying Edward Jones of such assets at the time of calculation. Money market funds are included only if such shares were sold with a sales charge at the time of purchase or acquired in exchange for shares purchased with a sales charge.
•
The employer maintaining a SEP IRA plan and/or SIMPLE IRA plan may elect to establish or change ROA for the IRA accounts associated with the plan to a plan-level grouping as opposed to including all share classes at a shareholder or pricing group level.
•
ROA is determined by calculating the higher of cost minus redemptions or market value (current shares x NAV).
Letter of Intent (“LOI”)
•
Through a LOI, shareholders can receive the sales charge and breakpoint discounts for purchases shareholders intend to make over a 13-month period from the date Edward Jones receives the LOI. The LOI is determined by calculating the higher of cost or market value of qualifying holdings at LOI initiation in combination with the value that the shareholder intends to buy over a 13-month period to calculate the front-end sales charge and any breakpoint discounts. Each purchase the shareholder makes during that 13-month period will receive the sales charge and breakpoint discount that applies to the total amount. The inclusion of eligible fund family assets in the LOI calculation is dependent on the shareholder notifying Edward Jones of such assets at the time of calculation. Purchases made before the LOI is received by Edward Jones are not adjusted under the LOI and will not reduce the sales charge previously paid. Sales charges will be adjusted if LOI is not met.
•
If the employer maintaining a SEP IRA plan and/or SIMPLE IRA plan has elected to establish or change ROA for the IRA accounts associated with the plan to a plan-level grouping, LOIs will also be at the plan-level and may only be established by the employer.
Front-End Sales Charge Waivers
Sales charges are waived for the following shareholders and in the following situations:
•
Associates of Edward Jones and its affiliates and their family members who are in the same pricing group (as determined by Edward Jones under its policies and procedures) as the associate. This waiver will continue for the remainder of the associate’s life if the associate retires from Edward Jones in good-standing and remains in good standing pursuant to Edward Jones’ policies and procedures.
122 | J.P. Morgan Municipal Bond Funds
•
Shares purchased in an Edward Jones fee-based program.
•
Shares purchased through reinvestment of capital gains distributions and dividend reinvestment.
•
Shares purchased from the proceeds of redeemed shares of the same fund family so long as the following conditions are met: 1) the proceeds are from the sale of shares within 60 days of the purchase, and 2) the sale and purchase are made in the same share class and the same account or the purchase is made in an individual retirement account with proceeds from liquidations in a non-retirement account.
•
Shares exchanged into Class A Shares from another share class so long as the exchange is into the same Fund and was initiated at the discretion of Edward Jones. Edward Jones is responsible for any remaining CDSC due to the fund company, if applicable. Any future purchases are subject to the applicable sales charge as disclosed in a Fund’s prospectus.
•
Exchanges from Class C Shares to Class A Shares of the same Fund, generally, in the 84th month following the anniversary of the purchase date or earlier at the discretion of Edward Jones.
Contingent Deferred Sales Charge (“CDSC”) Waivers
If the shareholder purchases shares that are subject to a CDSC and those shares are redeemed before the CDSC is expired, the shareholder is responsible to pay the CDSC except in the following conditions:
•
The death or disability of the shareholder.
•
Systematic withdrawals with up to 10% per year of the account value.
•
Return of excess contributions from an Individual Retirement Account (IRA).
•
Shares sold as part of a required minimum distribution for IRA and retirement accounts if the redemption is taken in or after the year the shareholder reaches qualified age based on applicable IRS regulations.
•
Shares sold to pay Edward Jones fees or costs in such cases where the transaction is initiated by Edward Jones.
•
Shares exchanged in an Edward Jones fee-based program. Edward Jones is responsible for any remaining CDSC due to the fund company, if applicable.
•
Shares acquired through NAV reinstatement.
•
Shares redeemed at the discretion of Edward Jones for Minimum Balances, as described below.
Other Important Information Regarding Transactions Through Edward Jones
Minimum Purchase Amounts
•
Initial purchase minimum: $250
•
Subsequent purchase minimum: none
Minimum Balances
Edward Jones has the right to redeem at its discretion fund holdings with a balance of $250 or less. The following are examples of accounts that are not included in this policy:
•
A fee-based account held on an Edward Jones platform
•
A 529 account held on an Edward Jones platform
•
An account with an active systematic investment plan or LOI
Exchanging Share Classes
•
At any time it deems necessary, Edward Jones has the authority to exchange at NAV a shareholder’s holdings in a Fund to Class A Shares of the same Fund.
WAIVERS APPLICABLE TO PURCHASES THROUGH JANNEY MONTGOMERY SCOTT LLC
Effective May 1, 2020, if you purchase Fund shares through a Janney Montgomery Scott LLC (“Janney”) brokerage account where the shares are held in an omnibus account at the Fund, you will be eligible for the following load waivers (front-end sales charge waivers and contingent deferred sales charge (“CDSC”), or back-end sales charge, waivers) and discounts, which may differ from those disclosed elsewhere in the Funds’ prospectus or Statement of Additional Information.
Front-end sales charge waivers on Class A Shares available at Janney
•
Shares purchased through reinvestment of capital gains distributions and dividend reinvestment when purchasing shares of the same Fund (but not any other Fund within the fund family).
•
Shares purchased by employees and registered representatives of Janney or its affiliates and their family members as designated by Janney.
July 1, 2022 | 123
Appendix A – Financial Intermediary-Specific Sales Charge Waivers (continued)
•
Shares purchased from the proceeds of redemptions within the same fund family, provided (1) the repurchase occurs within ninety (90) days following the redemption, (2) the redemption and purchase occur in the same account, and (3) redeemed shares were subject to a front-end or deferred sales load (i.e., right of reinstatement).
•
Shares purchased through Employer-sponsored retirement plans (e.g., 401(k) plans, 457 plans, employer-sponsored 403(b) plans, profit sharing and money purchase pension plans and defined benefit plans). For purposes of this provision, employer-sponsored retirement plans do not include SEP IRAs, Simple IRAs, SAR-SEPs or Keogh plans.
•
Shares acquired through a right of reinstatement.
•
Class C Shares that are no longer subject to a contingent deferred sales charge and are exchanged into Class A Shares of the same Fund pursuant to Janney’s policies and procedures.
CDSC waivers on Class A and C Shares available at Janney
•
Shares sold upon the death or disability of the shareholder.
•
Shares sold as part of a systematic withdrawal plan as described in a Fund’s Prospectus.
•
Shares purchased in connection with a return of excess contributions from an IRA account.
•
Shares sold as part of a required minimum distribution for IRA and other retirement accounts as described in a Fund’s Prospectus.
•
Shares sold to pay Janney fees but only if the transaction is initiated by Janney.
•
Shares acquired through a right of reinstatement.
•
Shares exchanged into the same share class of a different Fund within the fund family.
Front-end sales charge discounts available at Janney: breakpoints, rights of accumulation, and/or letters of intent
•
Breakpoints as described in a Fund’s Prospectus.
•
Rights of accumulation (“ROA”), which entitle shareholders to breakpoint discounts, will be automatically calculated based on the aggregated holding of fund family assets held by accounts within the purchaser’s household at Janney. Eligible fund family assets not held at Janney may be included in the ROA calculation only if the shareholder notifies his or her financial advisor about such assets.
•
Letters of intent which allow for breakpoint discounts based on anticipated purchases within a fund family, over a 13-month time period. Eligible fund family assets not held at Janney may be included in the calculation of letters of intent only if the shareholder notifies his or her financial advisor about such assets.
WAIVERS APPLICABLE TO PURCHASES THROUGH LPL FINANCIAL
Shareholders purchasing Fund shares through LPL Financial’s Mutual Fund Only Platform are eligible only for the following front-end sales charge waivers for Class A Shares, which differ from those disclosed elsewhere in this Fund’s prospectus or Statement of Additional Information:
Sales charges will be waived for Class A Shares bought by clients of LPL Financial who are accessing the J.P. Morgan Funds through LPL Financial’s mutual fund only platform.
For accounts where LPL Financial is listed as the broker dealer, the following waiver replaces the first bullet point under item five in “Waiver of the Class A Sales Charge” under the “Sales Charges and Financial Intermediary Compensation” section of each prospectus:
Class A Shares may be purchased without a sales charge by Group Retirement Plans (as defined in the Glossary) which are employer sponsored retirement, deferred compensation, employee benefit plans (including health savings accounts) and trusts used to fund those plans. Please note that no new Group Retirement Plans will be permitted to invest in Class A Shares after April 3, 2017.
WAIVERS APPLICABLE TO PURCHASES THROUGH MERRILL LYNCH
Shareholders purchasing Fund shares through a Merrill Lynch platform or account are eligible only for the following load waivers (front-end sales charge waivers and contingent deferred, or back-end, sales charge waivers) and discounts, which may differ from those disclosed elsewhere in this Fund’s prospectus or Statement of Additional Information. In all instances, it is the purchaser’s responsibility to notify Merrill Lynch at the time of purchase of any relationship or other facts qualifying the purchaser for sales charge waivers or discounts. With regard to these waivers and discounts, Merrill Lynch is responsible for the implementation on the Merrill Lynch platform or accounts.
124 | J.P. Morgan Municipal Bond Funds
Front-end Sales Load Waivers on Class A Shares available at Merrill Lynch
Employer-sponsored retirement, deferred compensation and employee benefit plans (including health savings accounts) and trusts used to fund those plans, provided that the shares are not held in a commission-based brokerage account and shares are held for the benefit of the plan.
Shares purchased by a 529 Plan (does not include 529 Plan units or 529-specific share classes or equivalents).
Exchanges as described in this prospectus.
Shares purchased through a Merrill Lynch affiliated investment advisory program.
Shares exchanged due to the holdings moving from a Merrill Lynch affiliated investment advisory program to a Merrill Lynch brokerage (non-advisory) account pursuant to Merrill Lynch’s policies relating to sales load discounts and waivers.
Shares purchased by third party investment advisors on behalf of their advisory clients through Merrill Lynch’s platform.
Shares of funds purchased through the Merrill Edge Self-Directed platform.
Shares purchased through reinvestment of capital gains distributions and dividend reinvestment when purchasing shares of the same Fund (but not any other Fund within the fund family).
Shares exchanged from Class C (i.e. level-load) shares of the same Fund pursuant to Merrill Lynch’s policies relating to sales load discounts and waivers.
Employees and registered representatives of Merrill Lynch or its affiliates and their family members as defined by Merrill Lynch.
Directors or Trustees of the Fund, and employees of the Fund’s investment adviser or any of its affiliates, as described in this prospectus.
Eligible shares purchased from the proceeds of redemptions within the same fund family, provided (1) the repurchase occurs within 90 days following the redemption, (2) the redemption and purchase occur in the same account, and (3) redeemed shares were subject to a front-end or deferred sales load (known as Rights of Reinstatement). Automated transactions (i.e. systematic purchases and withdrawals) and purchases made after shares are automatically sold to pay Merrill Lynch’s account maintenance fees are not eligible for reinstatement.
CDSC Waivers on Class A and Class C Shares available at Merrill Lynch
Death or disability of the shareholder.
Shares sold as part of a systematic withdrawal plan as described in the Fund’s prospectus.
Return of excess contributions from an IRA Account.
Shares sold as part of a required minimum distribution for IRA and retirement accounts pursuant to the Internal Revenue Code.
Shares sold to pay Merrill Lynch fees but only if the transaction is initiated by Merrill Lynch.
Shares acquired through a right of reinstatement.
Shares held in retirement brokerage accounts, that are exchanged for a lower cost share class due to transfer to certain fee based accounts or platforms.
Shares received through an exchange due to the holdings moving from a Merrill Lynch affiliated investment advisory program to a Merrill Lynch brokerage (non-advisory) account pursuant to Merrill Lynch’s policies relating to sales load discounts and waivers.
Front-end Load Discounts available at Merrill Lynch: Breakpoints, Rights of Accumulation and Letters of Intent
Breakpoints as described in this prospectus.
Rights of Accumulation (ROA) which entitle shareholders to breakpoint discounts as described in the Fund’s prospectus will be automatically calculated based on the aggregated holding of fund family assets held by accounts (including 529 program holdings, where applicable) within the purchaser’s household at Merrill Lynch. Eligible fund family assets not held at Merrill Lynch may be included in the ROA calculation only if the shareholder notifies his or her financial advisor about such assets.
Letters of Intent (LOI) which allow for breakpoint discounts based on anticipated purchases within a fund family, through Merrill Lynch, over a 13-month period of time.
July 1, 2022 | 125
Appendix A – Financial Intermediary-Specific Sales Charge Waivers (continued)
WAIVERS APPLICABLE TO PURCHASES THROUGH TRANSACTIONAL BROKERAGE ACCOUNTS AT MORGAN STANLEY WEALTH MANAGEMENT
Front-end Sales Charge Waivers on Class A Shares available at Morgan Stanley Wealth Management
Shareholders purchasing Fund shares through a Morgan Stanley Wealth Management transactional brokerage account are eligible only for the following front-end sales charge waivers with respect to Class A Shares, which may differ from and may be more limited than those disclosed elsewhere in a Fund’s Prospectus or Statement of Additional Information.
•
Employer-sponsored retirement plans (e.g., 401(k) plans, 457 plans, employer-sponsored 403(b) plans, profit sharing and money purchase pension plans and defined benefit plans). For purposes of this provision, employer-sponsored retirement plans do not include SEPs, Simple IRAs, SARSEPs or Keogh plans.
•
Morgan Stanley employees and employee-related accounts according to Morgan Stanley’s account linking rules.
•
Shares purchased through reinvestment of dividends and capital gains distributions when purchasing shares of the same fund.
•
Shares purchased through a Morgan Stanley self-directed brokerage account.
•
Class C (i.e., level-load) shares that are no longer subject to a contingent deferred sales charge and are exchanged into Class A Shares of the same fund pursuant to Morgan Stanley Wealth Management’s share class conversion program.
•
Shares purchased from the proceeds of redemptions within the same fund family, provided (i) the repurchase occurs within 90 days following the redemption, (ii) the redemption and purchase occur in the same account, and (iii) redeemed shares were subject to a front-end or deferred sales charge.
WAIVERS APPLICABLE TO PURCHASES THROUGH RAYMOND JAMES
Raymond James & Associates, Inc., Raymond James Financial Services, Inc. and each entity’s affiliates are defined as Raymond James.
Shareholders purchasing fund shares through a Raymond James platform or account, or through an introducing broker-dealer or independent registered investment adviser for which Raymond James provides trade execution, clearance, and/or custody services, are eligible only for the following load waivers (front-end sales charge waivers and contingent deferred, or back-end, sales charge waivers) and discounts, which may differ from those disclosed elsewhere in the Funds’ prospectus or Statement of Additional Information.
Front-end Sales Load Waivers on Class A Shares available at Raymond James
•
Shares purchased in an investment advisory program.
•
Shares purchased within the same fund family through a systematic reinvestment of capital gains and dividend distributions.
•
Employees and registered representatives of Raymond James or its affiliates and their family members as designated by Raymond James.
•
Shares purchased from the proceeds of redemptions within the same fund family, provided (1) the repurchase occurs within 90 days following the redemption, (2) the redemption and purchase occur in the same account, and (3) redeemed shares were subject to a front-end or deferred sales load (known as Rights of Reinstatement).
•
A shareholder in a Fund’s Class C Shares will have their shares converted at net asset value to Class A Shares (or the appropriate share class) of the Fund if the shares are no longer subject to a CDSC and the conversion is in line with the policies and procedures of Raymond James.
CDSC Waivers on Class A and Class C Shares available at Raymond James
•
Death or disability of the shareholder.
•
Shares sold as part of a systematic withdrawal plan as described in the Funds’ prospectus.
•
Return of excess contributions from an IRA Account.
•
Shares sold as part of a required minimum distribution for IRA and retirement accounts due to the shareholder reaching the qualified age based on applicable IRS regulations as described in the Funds’ prospectus.
•
Shares sold to pay Raymond James fees but only if the transaction is initiated by Raymond James.
•
Shares acquired through a right of reinstatement.
Front-end Load Discounts available at Raymond James: Breakpoints, Rights of Accumulation, and/or Letters of Intent
•
Breakpoints as described in this prospectus.
126 | J.P. Morgan Municipal Bond Funds
•
Rights of accumulation which entitle shareholders to breakpoint discounts will be automatically calculated based on the aggregated holding of fund family assets held by accounts within the purchaser’s household at Raymond James. Eligible fund family assets not held at Raymond James may be included in the calculation of rights of accumulation only if the shareholder notifies his or her financial advisor about such assets.
•
Letters of intent which allow for breakpoint discounts based on anticipated purchases within a fund family, over a 13-month time period. Eligible fund family assets not held at Raymond James may be included in the calculation of letters of intent only if the shareholder notifies his or her financial advisor about such assets.
WAIVERS APPLICABLE TO PURCHASES THROUGH OPPENHEIMER & CO. INC.
Shareholders purchasing Fund shares through an Oppenheimer & Co. Inc. (“OPCO”) platform or account are eligible only for the following load waivers (front-end sales charge waivers and contingent deferred, or back-end, sales charge waivers) and discounts, which may differ from those disclosed elsewhere in this Fund’s prospectus or SAI.
Front-end sales load waivers on Class A Shares available at OPCO
•
Employer-sponsored retirement, deferred compensation and employee benefit plans (including health savings accounts) and trusts used to fund those plans, provided that the shares are not held in a commission-based brokerage account and shares are held for the benefit of the plan.
•
Shares purchased through a OPCO affiliated investment advisory program.
•
Shares purchased through reinvestment of capital gains distributions and dividend reinvestment when purchasing shares of the same fund (but not any other fund within the fund family).
•
Shares purchased from the proceeds of redemptions within the same fund family, provided (1) the repurchase occurs within 90 days following the redemption, (2) the redemption and purchase occur in the same account, and (3) redeemed shares were subject to a front-end or deferred sales load (known as Rights of Restatement).
•
A shareholder in the Fund’s Class C shares will have their shares exchanged at net asset value to Class A shares (or the appropriate share class) of the Fund if the shares are no longer subject to a CDSC and the exchange is in line with the policies and procedures of OPCO.
•
Employees and registered representatives of OPCO or its affiliates and their family members.
•
Directors or Trustees of the Fund, and employees of the Fund’s investment adviser or any of its affiliates, as described in this prospectus.
CDSC Waivers on Class A and Class C Shares available at OPCO
•
Death or disability of the shareholder.
•
Shares sold as part of a systematic withdrawal plan as described in the Funds’ prospectus.
•
Return of excess contributions from an IRA Account.
•
Shares sold as part of a required minimum distribution for IRA or other qualifying retirement accounts as described in the Funds’ prospectus.
•
Shares sold to pay OPCO fees but only if the transaction is initiated by OPCO.
•
Shares acquired through a right of reinstatement.
Front-end load discounts available at OPCO: breakpoints, rights of accumulation, and/or letters of intent
•
Breakpoints as described in this prospectus.
•
Rights of Accumulation (“ROA”) and Letters of Intent (“LOI”), which entitle shareholders to breakpoint discounts, will be automatically calculated based on the aggregated holding of fund family assets held by accounts within the purchaser’s household at OPCO. Eligible fund family assets not held at OPCO may be included in the ROA or LOI calculation only if the shareholder notifies his or her financial advisor about such assets.
WAIVERS APPLICABLE TO PURCHASES THROUGH ROBERT W. BAIRD & CO. INC.
Shareholders purchasing fund shares through a Robert W. Baird & Co. Inc. (“Baird”) platform or account will only be eligible for the following sales charge waivers (front-end sales charge waivers and CDSC waivers) and discounts, which may differ from those disclosed elsewhere in this prospectus or the SAI.
Front-end sales charge waivers on Class A Shares available at Baird
•
Shares purchased through reinvestment of capital gains distributions and dividend reinvestment when purchasing shares of the same fund.
July 1, 2022 | 127
Appendix A – Financial Intermediary-Specific Sales Charge Waivers (continued)
•
Shares purchased by employees and registers representatives of Baird or its affiliate and their family members as designated by Baird.
•
Shares purchased from the proceeds of redemptions within the same fund family, provided (1) the repurchase occurs within 90 days following the redemption, (2) the redemption and purchase occur in the same account, and (3) redeemed shares were subject to a front-end or deferred sales charge (known as rights of reinstatement).
•
A shareholder in the Fund’s Class C Shares will have their shares exchanged at net asset value to Class A Shares of the fund if the shares are no longer subject to CDSC and the exchange is in line with the policies and procedures of Baird.
•
Employer-sponsored retirement plans or charitable accounts in a transactional brokerage account at Baird, including 401(k) plans, 457 plans, employer-sponsored 403(b) plans, profit sharing and money purchase pension plans and defined benefit plans. For purposes of this provision, employer-sponsored retirement plans do not include SEP IRAs, Simple IRAs or SAR-SEPs.
CDSC Waivers on Class A and Class C Shares available at Baird
•
Shares sold due to death or disability of the shareholder.
•
Shares sold as part of a systematic withdrawal plan as described in the Fund’s Prospectus.
•
Shares bought due to returns of excess contributions from an IRA Account.
•
Shares sold as part of a required minimum distribution for IRA or other qualifying retirement accounts as described in the Fund’s prospectus.
•
Shares sold to pay Baird fees but only if the transaction is initiated by Baird.
•
Shares acquired through a right of reinstatement.
Front-end sales charge discounts available at Baird: breakpoints and/or rights of accumulations
•
Breakpoints as described in this prospectus.
•
Rights of accumulations which entitle shareholders to breakpoint discounts will be automatically calculated based on the aggregated holding of fund family assets held by accounts within the purchaser’s household at Baird. Eligible fund family assets not held at Baird may be included in the rights of accumulations calculation only if the shareholder notifies his or her financial advisor about such assets.
•
Letters of Intent (LOI) allow for breakpoint discounts based on anticipated purchases within a fund family, through Baird, over a 13-month period of time.
WAIVERS APPLICABLE TO PURCHASES THROUGH STIFEL, NICOLAUS & COMPANY, INC.
Shareholders purchasing Fund Shares through a Stifel, Nicolaus & Company(“Stifel”) platform or account or who own shares for which Stifel or an affiliate is the broker-dealer of record are eligible for the following additional sales charge waiver.
Front-End Sales Load Waiver on Class A Shares Available at Stifel
Class C Shares that are no longer subject to a contingent deferred sales charge and that are exchanged to Class A Shares of the same Fund pursuant to Stifel’s policies and procedures.
All other sales charge waivers and reductions described elsewhere in a Fund’s prospectus or Statement of Additional Information still apply.
WAIVERS APPLICABLE TO PURCHASES THROUGH U.S. BANCORP INVESTMENTS
Shareholders purchasing Fund shares through a U.S. Bancorp Investments (USBI) platform or account or who own shares for which USBI is the broker-dealer of record and where the shares are held in an omnibus account at the Fund will be eligible for the following additional sales charge waiver.
Front-end Sales Load Waiver on Class A Shares available at U.S. Bancorp Investments
Class C Shares that are no longer subject to a contingent deferred sales charge and that are exchanged by USBI to the Class A Shares of the same Fund pursuant to USBI’s share class exchange policy.
All other sales charge waivers and reductions described elsewhere in a Fund’s Prospectus or SAI still apply.
128 | J.P. Morgan Municipal Bond Funds
How to Reach Us
MORE INFORMATION
For investors who want more information on these Funds the following documents are available free upon request:
ANNUAL AND SEMI-ANNUAL REPORTS
Our annual and semi-annual reports contain more information about each Fund’s investments and performance. The annual report also includes details about the market conditions and investment strategies that had a significant effect on each Fund’s performance during the last fiscal year.
STATEMENT OF ADDITIONAL INFORMATION (SAI)
The SAI contains more detailed information about the Funds and their policies. It is incorporated by reference into this prospectus. This means, by law, it is considered to be part of this prospectus.
You can get a free copy of these documents and other information, or ask us any questions, by calling us at 1-800-480-4111 or writing to:
J.P. Morgan Funds Services
P.O. Box 219143
Kansas City, MO 64121-9143
P.O. Box 219143
Kansas City, MO 64121-9143
If you buy your shares through a Financial Intermediary, you should contact that Financial Intermediary directly for this information. You can also find information online at www.jpmorganfunds.com.
Reports, a copy of the SAI, and other information about the Funds are also available on the EDGAR Database on the Commission’s Internet site at http://www.sec.gov, and copies of this information may be obtained, after paying a duplicating fee, by electronic request at the following E-mail address: publicinfo@sec.gov.
Investment Company Act File No. for each of the Funds, except the California Tax Free Bond Fund, Intermediate Tax Free Bond Fund and New York Tax Free Bond Fund is 811-4236.
Investment Company Act File No. for the California Tax Free Bond Fund, Intermediate Tax Free Bond Fund and New York Tax Free Bond Fund is 811-21295.
©JPMorgan Chase & Co. 2022. All rights reserved. July 2022.

PR-MBTFACI-722
Prospectus
J.P. Morgan Municipal Bond Funds
Class R6 Shares
July 1, 2022
JPMorgan Sustainable Municipal Income Fund
Class/Ticker: R6/HLTZX
JPMorgan Short-Intermediate Municipal Bond Fund
Class/Ticker: R6/OSTSX
JPMorgan Tax Free Bond Fund
Class/Ticker: R6/RUNFX
JPMorgan California Tax Free Bond Fund
Class/Ticker: R6/JCBSX
JPMorgan High Yield Municipal Fund
Class/Ticker: R6/ JTIRX
JPMorgan Intermediate Tax Free Bond Fund
Class/Ticker: R6/JITZX
JPMorgan New York Tax Free Bond Fund
Class/Ticker: R6/VINRX
The Securities and Exchange Commission and the Commodity Futures Trading Commission has not approved or disapproved of these securities or determined if this prospectus is truthful or complete. Any representation to the contrary is a criminal offense.
Contents
| | |
| 1 | |
| 7 | |
| 13 | |
| 18 | |
| 24 | |
| 30 | |
| 36 | |
| 42 | |
| 42 | |
| 43 | |
| 46 | |
| 55 | |
| 55 | |
| 55 | |
| 55 | |
| 57 | |
| 60 |
| 60 | |
| 62 | |
| 62 | |
| 64 | |
| 66 | |
| 68 | |
| 68 | |
| 69 | |
| 70 | |
| 73 | |
| 73 | |
| 73 | |
| 75 | |
| 76 | |
| 84 | |
| 98 | |
| Back cover |
JPMorgan Sustainable Municipal Income Fund
| | |
| |
Class R6 |
| Management Fees |
|
| Distribution (Rule 12b-1) Fees |
|
| Other Expenses |
|
| Service Fees |
|
| Remainder of Other Expenses |
|
| Total Annual Fund Operating Expenses |
|
| Fee Waivers and/or Expense Reimbursements1 |
- |
| Total Annual Fund Operating Expenses after Fee Waivers and/or Expense Reimbursements1 |
|
1
| | ||||
| |
1 Year |
3 Years |
5 Years |
10 Years |
| CLASS R6 SHARES ($) |
|
|
|
|
July 1, 2022 | 1
JPMorgan Sustainable Municipal Income Fund (continued)
2 | J.P. Morgan Municipal Bond Funds
July 1, 2022 | 3
JPMorgan Sustainable Municipal Income Fund (continued)
4 | J.P. Morgan Municipal Bond Funds
| |
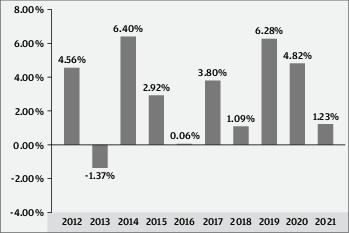
| |
|
|
| |
|
|
| |
|
|
|
|
|
July 1, 2022 | 5
JPMorgan Sustainable Municipal Income Fund (continued)
| | |||
| |
Past 1 Year |
Past 5 Years |
Past 10 Years |
| CLASS R6 SHARES |
|
|
|
| Return Before Taxes |
|
|
|
| Return After Taxes on Distributions |
|
|
|
| Return After Taxes on Distributions and Sale of Fund Shares |
|
|
|
| BLOOMBERG U.S. 1-15 YEAR BLEND (1-17) MUNICIPAL BOND INDEX (Reflects No Deduction for Fees, Expenses, or Taxes) |
|
|
|
Management
J.P. Morgan Investment Management Inc. (the adviser)
| Portfolio Manager |
Managed the Fund Since |
Primary Title with Investment Adviser |
| Kevin M. Ellis |
2020 |
Managing Director |
| Wayne Godlin |
2020 |
Managing Director |
| David Sivinski |
2006 |
Executive Director |
Purchase and Sale of Fund Shares
Purchase minimums
| For Class R6 Shares |
|
| To establish an account |
$5,000,000 for Discretionary Accounts $5,000,000 for Institutional Investors $15,000,000 for Other Investors |
| To add to an account |
No minimum levels |
There is no minimum investment for other eligible Class R6 investors, as described in the “Investing with J.P. Morgan Funds – Choosing a Share Class – Eligibility” section.
In general, you may purchase or redeem shares on any business day:
•
Through your Financial Intermediary or the eligible retirement plan or college savings plan through which you invest in the Fund
•
By writing to J.P. Morgan Funds Services, P.O. Box 219143, Kansas City, MO 64121-9143
•
After you open an account, by calling J.P. Morgan Funds Services at 1-800-480-4111
Tax Information
The Fund’s distributions of interest on municipal bonds generally are not subject to federal income tax; however the Fund may distribute taxable dividends, including distributions of short-term capital gains, and long-term capital gains. In addition, interest on certain bonds may be subject to the federal alternative minimum tax. To the extent that the Fund’s distributions are derived from interest on bonds that are not exempt from applicable state and local taxes, such distributions will be subject to such state and local taxes. When your investment is in a 401(k) plan or other tax-advantaged investment plan, you may be subject to federal income tax on ordinary income or capital gains upon withdrawal from the tax-advantaged investment plan.
Payments to Broker-Dealers and Other Financial Intermediaries
If you purchase shares of the Fund through a broker-dealer or other financial intermediary (such as a bank), the Fund and its related companies may pay the financial intermediary for the sale of Fund shares and related services. These payments may create a conflict of interest by influencing the broker-dealer or financial intermediary and your salesperson to recommend the Fund over another investment. Ask your salesperson or visit your financial intermediary’s website for more information.
6 | J.P. Morgan Municipal Bond Funds
JPMorgan Short-Intermediate Municipal Bond Fund
| | |
| |
Class R6 |
| Management Fees |
|
| Distribution (Rule 12b-1) Fees |
|
| Other Expenses |
|
| Service Fees |
|
| Remainder of Other Expenses |
|
| Acquired Fund Fees and Expenses |
|
| Total Annual Fund Operating Expenses |
|
| Fee Waivers and/or Expense Reimbursements1 |
- |
| Total Annual Fund Operating Expenses after Fee Waivers and/or Expense Reimbursements1 |
|
1
| | ||||
| |
1 Year |
3 Years |
5 Years |
10 Years |
| CLASS R6 SHARES ($) |
|
|
|
|
July 1, 2022 | 7
JPMorgan Short-Intermediate Municipal Bond Fund (continued)
8 | J.P. Morgan Municipal Bond Funds
July 1, 2022 | 9
JPMorgan Short-Intermediate Municipal Bond Fund (continued)
10 | J.P. Morgan Municipal Bond Funds
| |
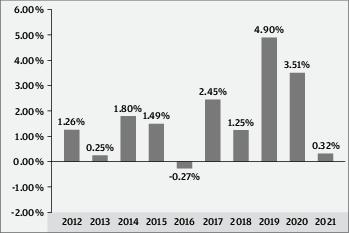
| |
|
|
| |
|
|
| |
|
|
|
|
|
| | |||
| |
Past 1 Year |
Past 5 Years |
Past 10 Years |
| CLASS R6 SHARES |
|
|
|
| Return Before Taxes |
|
|
|
| Return After Taxes on Distributions |
|
|
|
| Return After Taxes on Distributions and Sale of Fund Shares |
|
|
|
| BLOOMBERG U.S. 1-5 YEAR BLEND (1-6) MUNICIPAL BOND INDEX (Reflects No Deduction for Fees, Expenses, or Taxes) |
|
|
|
Management
J.P. Morgan Investment Management Inc. (the adviser)
| Portfolio Manager |
Managed the Fund Since |
Primary Title with Investment Adviser |
| James Ahn |
2006 |
Managing Director |
| Kevin M. Ellis |
2006 |
Managing Director |
July 1, 2022 | 11
JPMorgan Short-Intermediate Municipal Bond Fund (continued)
Purchase and Sale of Fund Shares
Purchase minimums
| For Class R6 Shares |
|
| To establish an account |
$5,000,000 for Discretionary Accounts $5,000,000 for Institutional Investors $15,000,000 for Other Investors |
| To add to an account |
No minimum levels |
There is no minimum investment for other eligible Class R6 investors, as described in the “Investing with J.P. Morgan Funds – Choosing a Share Class – Eligibility” section.
In general, you may purchase or redeem shares on any business day:
•
Through your Financial Intermediary or the eligible retirement plan or college savings plan through which you invest in the Fund
•
By writing to J.P. Morgan Funds Services, P.O. Box 219143, Kansas City, MO 64121-9143
•
After you open an account, by calling J.P. Morgan Funds Services at 1-800-480-4111
Tax Information
The Fund’s distributions of interest on municipal bonds generally are not subject to federal income tax; however the Fund may distribute taxable dividends, including distributions of
short-term capital gains, and long-term capital gains. In addition, interest on certain bonds may be subject to the federal alternative minimum tax. To the extent that the Fund’s distributions are derived from interest on bonds that are not exempt from applicable state and local taxes, such distributions will be subject to such state and local taxes. When your investment is in a 401(k) plan or other tax-advantaged investment plan, you may be subject to federal income tax on ordinary income or capital gains upon withdrawal from the tax-advantaged investment plan.
Payments to Broker-Dealers and Other Financial Intermediaries
If you purchase shares of the Fund through a broker-dealer or other financial intermediary (such as a bank), the Fund and its related companies may pay the financial intermediary for the sale of Fund shares and related services. These payments may create a conflict of interest by influencing the broker-dealer or financial intermediary and your salesperson to recommend the Fund over another investment. Ask your salesperson or visit your financial intermediary’s website for more information.
12 | J.P. Morgan Municipal Bond Funds
JPMorgan Tax Free Bond Fund
| | |
| |
Class R6 |
| Management Fees |
|
| Distribution (Rule 12b-1) Fees |
|
| Other Expenses |
|
| Service Fees |
|
| Remainder of Other Expenses |
|
| Total Annual Fund Operating Expenses |
|
| Fee Waivers and/or Expense Reimbursements1 |
- |
| Total Annual Fund Operating Expenses after Fee Waivers and/or Expense Reimbursements1 |
|
1
| | ||||
| |
1 Year |
3 Years |
5 Years |
10 Years |
| CLASS R6 SHARES ($) |
|
|
|
|
July 1, 2022 | 13
JPMorgan Tax Free Bond Fund (continued)
14 | J.P. Morgan Municipal Bond Funds
July 1, 2022 | 15
JPMorgan Tax Free Bond Fund (continued)
| |
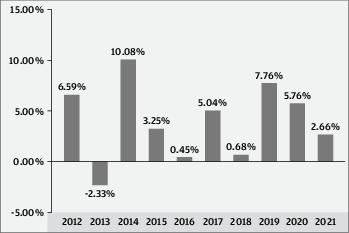
| |
|
|
| |
|
|
16 | J.P. Morgan Municipal Bond Funds
| |
|
|
|
|
|
| | |||
| |
Past 1 Year |
Past 5 Years |
Past 10 Years |
| CLASS R6 SHARES |
|
|
|
| Return Before Taxes |
|
|
|
| Return After Taxes on Distributions |
|
|
|
| Return After Taxes on Distributions and Sale of Fund Shares |
|
|
|
| BLOOMBERG US MUNICIPAL INDEX (Reflects No Deduction for Fees, Expenses, or Taxes) |
|
|
|
Management
J.P. Morgan Investment Management Inc. (the adviser)
| Portfolio Manager |
Managed the Fund Since |
Primary Title with Investment Adviser |
| Richard Taormina |
2005 |
Managing Director |
| Michelle Hallam |
2014 |
Executive Director |
Purchase and Sale of Fund Shares
Purchase minimums
| For Class R6 Shares |
|
| To establish an account |
$5,000,000 for Discretionary Accounts $5,000,000 for Institutional Investors $15,000,000 for Other Investors |
| To add to an account |
No minimum levels |
There is no minimum investment for other eligible Class R6 investors, as described in the “Investing with J.P. Morgan Funds – Choosing a Share Class – Eligibility” section.
In general, you may purchase or redeem shares on any business day:
•
Through your Financial Intermediary or the eligible retirement plan or college savings plan through which you invest in the Fund
•
By writing to J.P. Morgan Funds Services, P.O. Box 219143, Kansas City, MO 64121-9143
•
After you open an account, by calling J.P. Morgan Funds Services at 1-800-480-4111
Tax Information
The Fund’s distributions of interest on municipal bonds generally are not subject to federal income tax; however the Fund may distribute taxable dividends, including distributions of short-term capital gains, and long-term capital gains. In addition, interest on certain bonds may be subject to the federal alternative minimum tax. To the extent that the Fund’s distributions are derived from interest on bonds that are not exempt from applicable state and local taxes, such distributions will be subject to such state and local taxes. When your investment is in a 401(k) plan or other tax-advantaged investment plan, you may be subject to federal income tax on ordinary income or capital gains upon withdrawal from the tax-advantaged investment plan.
Payments to Broker-Dealers and Other Financial Intermediaries
If you purchase shares of the Fund through a broker-dealer or other financial intermediary (such as a bank), the Fund and its related companies may pay the financial intermediary for the sale of Fund shares and related services. These payments may create a conflict of interest by influencing the broker-dealer or financial intermediary and your salesperson to recommend the Fund over another investment. Ask your salesperson or visit your financial intermediary’s website for more information.
July 1, 2022 | 17
JPMorgan California Tax Free Bond Fund
Class/Ticker: R6/JCBSX
What is the goal of the Fund?
The Fund seeks to provide high after-tax total return for California residents consistent with moderate risk of capital.
Fees and Expenses of the Fund
The following tables describe the fees and expenses that you may pay if you buy, hold and sell shares of the Fund. You may pay other fees, such as brokerage commissions and other fees to financial intermediaries, which are not reflected in the table and examples below.
| ANNUAL FUND OPERATING EXPENSES (Expenses that you pay each year as a percentage of the value of your investment) | |
| |
Class R6 |
| Management Fees |
0.30% |
| Distribution (Rule 12b-1) Fees |
NONE |
| Other Expenses |
0.13 |
| Service Fees |
NONE |
| Remainder of Other Expenses |
0.13 |
| Total Annual Fund Operating Expenses |
0.43 |
| Fee Waivers and/or Expense Reimbursements1 |
-0.03 |
| Total Annual Fund Operating Expenses after Fee Waivers and/or Expense Reimbursements1 |
0.40 |
1
The Fund’s adviser and/or its affiliates have contractually agreed to waive fees and/or reimburse expenses to the extent Total Annual Fund Operating Expenses (excluding acquired fund fees and expenses other than certain money market fund fees as described below, dividend and interest expenses related to short sales, interest, taxes, expenses related to litigation and potential litigation, expenses related to trustee elections, and extraordinary expenses) exceed 0.40% of the average daily net assets of Class R6 Shares. The Fund may invest in one or more money market funds advised by the adviser or its affiliates (affiliated money market funds). The Fund’s adviser, shareholder servicing agent and/or administrator have contractually agreed to waive fees and/or reimburse expenses in an amount sufficient to offset the respective net fees each collects from the affiliated money market funds on the Fund’s investment in such money market funds for this Share Class. These waivers are in effect through 6/30/23, at which time it will be determined whether such waivers will be renewed or revised. To the extent that the Fund engages in securities lending, affiliated money market fund fees and expenses resulting from the Fund’s investment of cash received from securities lending borrowers are not included in Total Annual Fund Operating Expenses and therefore, the above waivers do not apply to such investments.
Example
This Example is intended to help you compare the cost of investing in the Fund with the cost of investing in other mutual funds. The Example assumes that you invest $10,000 in the Fund for the time periods indicated. The Example also assumes that your investment has a 5% return each year and that the Fund’s operating expenses are equal to the total annual fund operating expenses after fee waivers and expense reimburse
ments shown in the fee table through 6/30/23 and total annual fund operating expenses thereafter. Your actual costs may be higher or lower.
| WHETHER OR NOT YOU SELL YOUR SHARES, YOUR COST WOULD BE: | ||||
| |
1 Year |
3 Years |
5 Years |
10 Years |
| CLASS R6 SHARES ($) |
41 |
135 |
238 |
539 |
Portfolio Turnover
The Fund pays transaction costs, such as commissions, when it buys and sells securities (or “turns over” its portfolio). A higher portfolio turnover rate may indicate higher transaction costs and may result in higher taxes when Fund shares are held in a taxable account. These costs, which are not reflected in annual fund operating expenses or in the Example, affect the Fund’s performance. During the Fund’s most recent fiscal year, the Fund’s portfolio turnover rate was 11% of the average value of its portfolio.
What are the Fund’s main investment strategies?
As a fundamental policy, the Fund normally invests at least 80% of the value of its Assets in municipal securities, the income from which is exempt from federal and state personal income taxes for California residents and not subject to the federal alternative minimum tax on individuals. “Assets” means net assets, plus the amount of borrowings for investment purposes. The Fund seeks investments that also provide high current income. Municipal securities in which the Fund can invest include those issued by the State of California, its political subdivisions, as well as Puerto Rico, other U.S. territories and their political subdivisions. Because the Fund’s objective is high after-tax total return rather than high tax-exempt income, the Fund may invest to a limited extent in securities of other states or territories. To the extent that the Fund invests in municipal securities of other states, the income from such securities would be free from federal personal income taxes for California residents but would be subject to California taxes. For non-California residents, the income from California municipal securities may also be subject to state and local taxes in their jurisdiction of residence.
Under normal circumstances, the Fund reserves the right to invest up to 20% of its Assets in securities that pay interest subject to federal income tax, the federal alternative minimum tax on individuals or California personal income taxes. To defend the value of its assets during unusual market conditions, the Fund may temporarily exceed this limit.
The Fund’s securities may be of any maturity, but under normal circumstances the Fund’s duration will generally range between three and seven years. Duration is a measure of the price sensitivity of a debt security or a portfolio of debt securities to relative changes in interest rates. For instance, a duration of “three” means that a security’s or portfolio’s price would be
18 | J.P. Morgan Municipal Bond Funds
expected to decrease by approximately 3% with a 1% increase in interest rates (assuming a parallel shift in yield curve). As of February 28, 2022, the duration of the Bloomberg LB California 1-17 Year Muni Index was 4.22 years, although the duration will likely vary in the future.
There may be times when there are not enough municipal securities available to meet the Fund’s needs. On these occasions, the Fund may invest in securities that may be subject to federal income tax.
The Fund may invest in debt securities issued by governmental entities, certain issuers identified with the U.S. government and private issuers. The Fund may invest in municipal mortgage-backed and asset-backed securities. The Fund may invest a significant portion or all of its assets in municipal mortgage-backed securities at the adviser’s discretion.
The Fund may invest up to 20% of its total assets in securities rated below investment grade. Such securities are known as “junk bonds,” “high yield bonds” and “non-investment grade bonds.” Junk bonds also include unrated securities that the adviser believes to be of comparable quality to debt securities that are rated below investment grade. These securities generally are rated in the fifth or lower rating categories (for example, BB+ or lower by S&P and Ba1 or lower by Moody’s). These securities generally offer a higher yield than investment grade securities, but involve a high degree of risk. A security’s quality is determined at the time of purchase and securities that are rated investment grade or the unrated equivalent may be downgraded or decline in credit quality, such that, following the time of purchase, they would be deemed to be below investment grade. If the quality of an investment grade security is downgraded subsequent to purchase to below investment grade, the Fund may continue to hold the security.
The Fund may also invest in high-quality, short-term money market instruments and repurchase agreements.
The Fund may also invest in zero-coupon securities.
Investment Process: The adviser buys and sells securities and investments for the Fund based on its view of individual securities and market sectors. Taking a long-term approach, the adviser looks for individual fixed income investments that it believes will perform well over market cycles. The adviser is value oriented and makes decisions to purchase and sell individual securities and instruments after performing a risk/reward analysis that includes an evaluation of interest rate risk, credit risk, duration, liquidity and the complex legal and technical structure of the transaction. As part of its investment process, the adviser seeks to assess the impact of environmental, social and governance factors on certain issuers in the universe in which the Fund may invest. The adviser’s assessment is based on an analysis of key opportunities and risks across sectors to identify financially material issues on the Fund’s investments in municipal issues and ascertain key issues that merit engagement with municipal issuers. These assessments may not be conclusive and securities that may be
negatively impacted by such factors may be purchased and retained by the Fund while the Fund may divest or not invest in securities that may be positively impacted by such factors.
The Fund’s Main Investment Risks
The Fund is subject to management risk and may not achieve its objective if the adviser’s expectations regarding particular instruments or markets are not met.
An investment in this Fund or any other fund may not provide a complete investment program. The suitability of an investment in the Fund should be considered based on the investment objective, strategies and risks described in this prospectus, considered in light of all of the other investments in your portfolio, as well as your risk tolerance, financial goals and time horizons. You may want to consult with a financial advisor to determine if this Fund is suitable for you.
The Fund is subject to the main risks noted below, any of which may adversely affect the Fund’s performance and ability to meet its investment objective.
Interest Rate Risk. The Fund mainly invests in bonds and other debt securities. These securities will increase or decrease in value based on changes in interest rates. If rates increase, the value of the Fund’s investments generally declines. Securities with greater interest rate sensitivity and longer maturities generally are subject to greater fluctuations in value. The Fund may face a heightened level of interest rate risk due to certain changes in monetary policy. During periods when interest rates are low or there are negative interest rates, the Fund’s yield (and total return) also may be low or the Fund may be unable to maintain positive returns.
California Geographic Concentration Risk. Because the Fund primarily invests in issuers in the State of California, its performance will be affected by the fiscal and economic health of that state and its municipalities. Provisions of the California Constitution and state statutes that limit the taxing and spending authority of California’s governmental entities may impair the ability of California issuers to pay principal and/or interest on their obligations. While California’s economy is broad, it does have major concentrations in high technology, manufacturing, entertainment, agriculture, tourism, construction and services, and may be sensitive to economic problems affecting those industries.
Municipal Obligations Risk. The risk of a municipal obligation generally depends on the financial and credit status of the issuer. Changes in the financial health of a municipal issuer may make it difficult for the issuer to make interest and principal payments when due. This could decrease the Fund’s income or hurt the ability to preserve capital and liquidity.
Under some circumstances, municipal obligations might not pay interest unless the state legislature or municipality authorizes money for that purpose.
July 1, 2022 | 19
JPMorgan California Tax Free Bond Fund (continued)
Municipal obligations may be more susceptible to downgrades or defaults during recessions or similar periods of economic stress. In addition, since some municipal obligations may be secured or guaranteed by banks and other institutions, the risk to the Fund could increase if the banking or financial sector suffers an economic downturn and/or if the credit ratings of the institutions issuing the guarantee are downgraded or at risk of being downgraded by a national rating organization. Such a downward revision or risk of being downgraded may have an adverse effect on the market prices of the bonds and thus the value of the Fund’s investments.
In addition to being downgraded, an insolvent municipality may file for bankruptcy. The reorganization of a municipality’s debts may significantly affect the rights of creditors and the value of the securities issued by the municipality and the value of the Fund’s investments.
Credit Risk. The Fund’s investments are subject to the risk that issuers and/or counterparties will fail to make payments when due or default completely. If an issuer’s or a counterparty’s financial condition worsens, the credit quality of the issuer or counterparty may deteriorate. Credit spreads may increase, which may reduce the market values of the Fund’s securities. Credit spread risk is the risk that economic and market conditions or any actual or perceived credit deterioration may lead to an increase in the credit spreads (i.e., the difference in yield between two securities of similar maturity but different credit quality) and a decline in price of the issuer’s securities.
Government Securities Risk. The Fund invests in securities issued or guaranteed by the U.S. government or its agencies and instrumentalities (such as securities issued by the Government National Mortgage Association (Ginnie Mae), the Federal National Mortgage Association (Fannie Mae), or the Federal Home Loan Mortgage Corporation (Freddie Mac)). U.S. government securities are subject to market risk, interest rate risk and credit risk. Securities, such as those issued or guaranteed by Ginnie Mae or the U.S. Treasury, that are backed by the full faith and credit of the United States are guaranteed only as to the timely payment of interest and principal when held to maturity and the market prices for such securities will fluctuate. Notwithstanding that these securities are backed by the full faith and credit of the United States, circumstances could arise that would prevent the payment of interest or principal. This would result in losses to the Fund. Securities issued or guaranteed by U.S. government related organizations, such as Fannie Mae and Freddie Mac, are not backed by the full faith and credit of the U.S. government and no assurance can be given that the U.S. government will provide financial support. Therefore, U.S. government related organizations may not have the funds to meet their payment obligations in the future. U.S. government securities include zero coupon securities, which tend to be subject to greater market risk than interest-paying securities of similar maturities.
High Yield Securities Risk. The Fund may invest in securities and instruments of municipal issuers that are highly leveraged, less creditworthy or financially distressed. These investments (also known as junk bonds) are considered to be speculative and are subject to greater risk of loss, greater sensitivity to economic changes, valuation difficulties, and potential illiquidity.
In recent years, there has been a broad trend of weaker or less restrictive covenant protections in the high yield market. Among other things, under such weaker or less restrictive covenants, borrowers might be able to exercise more flexibility with respect to certain activities than borrowers who are subject to stronger or more protective covenants. For example, borrowers might be able to incur more debt, including secured debt, return more capital to shareholders, remove or reduce assets that are designated as collateral securing high yield securities, increase the claims against assets that are permitted against collateral securing high yield securities or otherwise manage their business in ways that could impact creditors negatively. In addition, certain privately held borrowers might be permitted to file less frequent, less detailed or less timely financial reporting or other information, which could negatively impact the value of the high yield securities issued by such borrowers.
Each of these factors might negatively impact the high yield instruments held by the Fund. No active trading market may exist for some instruments and certain investments may be subject to restrictions on resale. The inability to dispose of the Fund’s securities and other investments in a timely fashion could result in losses to the Fund. Because some instruments may have a more limited secondary market, liquidity and valuation risk may be more pronounced for the Fund. When instruments are prepaid, the Fund may have to reinvest in instruments with a lower yield or fail to recover additional amounts (i.e., premiums) paid for these instruments, resulting in an unexpected capital loss and/or a decrease in the amount of dividends and yield.
Alternative Minimum Tax Risk. The Fund may invest in securities, the interest on which may be subject to the federal alternative minimum tax.
Mortgage-Related and Other Asset-Backed Securities Risk. Mortgage-related and asset-backed securities, including certain municipal housing authority obligations, are subject to certain other risks. The value of these securities will be influenced by the factors affecting the housing market and the assets underlying such securities. As a result, during periods of declining asset values, difficult or frozen credit markets, significant changes in interest rates, or deteriorating economic conditions, mortgage-related and asset-backed securities may decline in value, face valuation difficulties, become more volatile and/or become illiquid. These securities are also subject to prepayment and call risk. In periods of declining interest rates, the Fund may be subject to contraction risk which is the risk that borrowers will increase the rate at which they prepay the maturity value of mortgages and other obligations. When mortgages and
20 | J.P. Morgan Municipal Bond Funds
other obligations are prepaid and when securities are called, the Fund may have to reinvest in securities with a lower yield or fail to recover additional amounts (i.e., premiums) paid for securities with higher interest rates, resulting in an unexpected capital loss and/or a decrease in the amount of dividends and yield. In periods of either rising or declining interest rates, the Fund may be subject to extension risk which is the risk that the expected maturity of an obligation will lengthen in duration due to a decrease in prepayments. As a result, in certain interest rate environments, the Fund may exhibit additional volatility. Additionally, asset-backed, mortgage-related and mortgage-backed securities are subject to risks associated with their structure and the nature of the assets underlying the securities and the servicing of those assets. Certain asset-backed, mortgage-related and mortgage-backed securities may face valuation difficulties and may be less liquid than other types of asset-backed, mortgage-related and mortgage-backed securities, or debt securities.
Debt Securities and Other Callable Securities Risk. As part of its main investment strategy, the Fund invests in debt securities. The issuers of these securities and other callable securities may be able to repay principal in advance, especially when interest rates fall. Changes in prepayment rates can affect the return on investment and yield of these securities. When debt obligations are prepaid and when securities are called, the Fund may have to reinvest in securities with a lower yield. The Fund also may fail to recover additional amounts (i.e., premiums) paid for securities with higher interest rates, resulting in an unexpected capital loss.
Taxability Risk. The Fund’s investments in municipal securities rely on the opinion of the issuer’s bond counsel that the interest paid on those securities will not be subject to federal income tax. Tax opinions are generally provided at the time the municipal security is initially issued. However, after the Fund buys a security, the Internal Revenue Service may determine that a bond issued as tax-exempt should in fact be taxable and the Fund’s dividends with respect to that bond might be subject to federal income tax.
Zero-Coupon Bond Risk. The market value of a zero-coupon bond is generally more volatile than the market value of other fixed income securities with similar maturities that pay interest periodically. In addition, federal income tax law requires that the holder of a zero-coupon bond accrue a portion of the discount at which the bond was purchased as taxable income each year. The Fund may consequently have to dispose of portfolio securities under disadvantageous circumstances to generate cash to satisfy its requirement as a regulated investment company to distribute all of its net income (including non-cash income attributable to zero-coupon securities). These actions may reduce the assets to which the Fund’s expenses could otherwise be allocated and may reduce the Fund’s rate of return.
Transactions Risk. The Fund could experience a loss and its liquidity may be negatively impacted when selling securities to meet redemption requests. The risk of loss increases if the redemption requests are unusually large or frequent or occur in times of overall market turmoil or declining prices. Similarly, large purchases of Fund shares may adversely affect the Fund’s performance to the extent that the Fund is delayed in investing new cash and is required to maintain a larger cash position than it ordinarily would.
General Market Risk. Economies and financial markets throughout the world are becoming increasingly interconnected, which increases the likelihood that events or conditions in one country or region will adversely impact markets or issuers in other countries or regions. Securities in the Fund’s portfolio may underperform in comparison to securities in general financial markets, a particular financial market or other asset classes due to a number of factors, including inflation (or expectations for inflation), deflation (or expectations for deflation), interest rates, global demand for particular products or resources, market instability, debt crises and downgrades, embargoes, tariffs, sanctions and other trade barriers, regulatory events, other governmental trade or market control programs and related geopolitical events. In addition, the value of the Fund’s investments may be negatively affected by the occurrence of global events such as war, terrorism, environmental disasters, natural disasters or events, country instability, and infectious disease epidemics or pandemics.
For example, the outbreak of COVID-19 has negatively affected economies, markets and individual companies throughout the world, including those in which the Fund invests. The effects of this pandemic to public health and business and market conditions, including, among other things, reduced consumer demand and economic output, supply chain disruptions and increased government spending, may continue to have a significant negative impact on the performance of the Fund’s investments, increase the Fund’s volatility, exacerbate pre-existing political, social and economic risks to the Fund, and negatively impact broad segments of businesses and populations. In addition, governments, their regulatory agencies, or self-regulatory organizations have taken or may take actions in response to the pandemic that affect the instruments in which the Fund invests, or the issuers of such instruments, in ways that could have a significant negative impact on the Fund’s investment performance. The duration and extent of COVID-19 and associated economic and market conditions and uncertainty over the long-term cannot be reasonably estimated at this time. The ultimate impact of COVID-19 and the extent to which the associated conditions impact a Fund will also depend on future developments, which are highly uncertain, difficult to accurately predict and subject to frequent changes.
Industry and Sector Focus Risk. At times the Fund may increase the relative emphasis of its investments in a particular industry or sector. The prices of securities of issuers in a particular industry or sector may be more susceptible to fluctuations due
July 1, 2022 | 21
JPMorgan California Tax Free Bond Fund (continued)
to changes in economic or business conditions, government regulations, availability of basic resources or supplies, or other events that affect that industry or sector more than securities of issuers in other industries and sectors. To the extent that the Fund increases the relative emphasis of its investments in a particular industry or sector, its shares’ values may fluctuate in response to events affecting that industry or sector.
Investments in the Fund are not deposits or obligations of, or guaranteed or endorsed by, any bank and are not insured or guaranteed by the FDIC, the Federal Reserve Board or any other government agency.
You could lose money investing in the Fund.
The Fund’s Past Performance
This section provides some indication of the risks of investing in the Fund. The bar chart shows how the performance of the Fund’s Class R6 Shares has varied from year to year for the past ten calendar years. The table shows the average annual total returns over the past one year, five years and ten years. The table compares the Fund’s performance to the performance of the Bloomberg LB California 1-17 Year Muni Index. The performance of the Class R6 Shares prior to their inception are based on Class I Shares (which are not offered in this prospectus). The actual returns of the Class R6 Shares would be substantially similar to the performance of Class I Shares because the Fund is invested in the same group of securities and the annual returns would differ only to the extent that the Classes do not have the same expenses. Past performance (before and after taxes) is not necessarily an indication of how the Fund will perform in the future. Updated performance information is available by visitingwww.jpmorganfunds.com or by calling 1-800-480-4111.
| YEAR-BY-YEAR RETURNS — CLASS R6 SHARES |

| Best Quarter |
2nd quarter, 2020 |
2.67% |
| Worst Quarter |
4th quarter, 2016 |
-3.39% |
| The Fund’s year-to-date total return |
through |
3/31/22 |
was |
-5.87% |
. |
| AVERAGE ANNUAL TOTAL RETURNS (For periods ended December 31, 2021) | |||
| |
Past 1 Year |
Past 5 Years |
Past 10 Years |
| CLASS R6 SHARES |
|
|
|
| Return Before Taxes |
-0.02% |
2.96% |
2.70% |
| Return After Taxes on Distributions |
-0.03 |
2.95 |
2.66 |
| Return After Taxes on Distributions and Sale of Fund Shares |
0.64 |
2.81 |
2.66 |
| BLOOMBERG LB CALIFORNIA 1-17 YEAR MUNI INDEX (Reflects No Deduction for Fees, Expenses, or Taxes) |
0.52 |
3.38 |
3.14 |
After-tax returns are calculated using the historical highest individual federal marginal income tax rates and do not reflect the impact of state and local taxes. Actual after-tax returns depend on the investor’s tax situation and may differ from those shown, and the after-tax returns shown are not relevant to investors who hold their shares through tax-deferred arrangements such as 401(k) plans or individual retirement accounts.
Management
J.P. Morgan Investment Management Inc. (the adviser)
| Portfolio Manager |
Managed the Fund Since |
Primary Title with Investment Adviser |
| David Sivinski |
2005 |
Executive Director |
| Michelle Hallam |
2004 |
Executive Director |
22 | J.P. Morgan Municipal Bond Funds
Purchase and Sale of Fund Shares
Purchase minimums
| For Class R6 Shares |
|
| To establish an account |
$5,000,000 for Discretionary Accounts $5,000,000 for Institutional Investors $15,000,000 for Other Investors |
| To add to an account |
No minimum levels |
There is no minimum investment for other eligible Class R6 investors, as described in the “Investing with J.P. Morgan Funds – Choosing a Share Class – Eligibility” section.
In general, you may purchase or redeem shares on any business day:
•
Through your Financial Intermediary or the eligible retirement plan or college savings plan through which you invest in the Fund
•
By writing to J.P. Morgan Funds Services, P.O. Box 219143, Kansas City, MO 64121-9143
•
After you open an account, by calling J.P. Morgan Funds Services at 1-800-480-4111
Tax Information
The Fund’s distributions of interest on municipal bonds generally are not subject to federal income tax; however the Fund may distribute taxable dividends, including distributions of
short-term capital gains, and long-term capital gains. In addition, interest on certain bonds may be subject to the federal alternative minimum tax. To the extent that the Fund’s distributions are derived from interest on bonds that are not exempt from applicable state and local taxes, such distributions will be subject to such state and local taxes. When your investment is in a 401(k) plan or other tax-advantaged investment plan, you may be subject to federal income tax on ordinary income or capital gains upon withdrawal from the tax-advantaged investment plan.
Payments to Broker-Dealers and Other Financial Intermediaries
If you purchase shares of the Fund through a broker-dealer or other financial intermediary (such as a bank), the Fund and its related companies may pay the financial intermediary for the sale of Fund shares and related services. These payments may create a conflict of interest by influencing the broker dealer or financial intermediary and your salesperson to recommend the Fund over another investment. Ask your salesperson or visit your financial intermediary’s website for more information.
July 1, 2022 | 23
JPMorgan High Yield Municipal Fund
Class/Ticker: R6/RUNFX
What is the goal of the Fund?
The Fund seeks a high level of current income exempt from federal income taxes.
Fees and Expenses of the Fund
The following tables describe the fees and expenses that you may pay if you buy, hold and sell shares of the Fund. You may pay other fees, such as brokerage commissions and other fees to financial intermediaries, which are not reflected in the table and examples below.
| ANNUAL FUND OPERATING EXPENSES (Expenses that you pay each year as a percentage of the value of your investment) | |
| |
Class R6 |
| Management Fees |
0.35% |
| Distribution (Rule 12b-1) Fees |
NONE |
| Other Expenses |
0.16 |
| Service Fees |
NONE |
| Remainder of Other Expenses |
0.16 |
| Total Annual Fund Operating Expenses |
0.51 |
| Fee Waivers and/or Expense Reimbursements1 |
-0.06 |
| Total Annual Fund Operating Expenses after Fee Waivers and/or Expense Reimbursements1 |
0.45 |
1
The Fund’s adviser and/or its affiliates have contractually agreed to waive fees and/or reimburse expenses to the extent Total Annual Fund Operating Expenses (excluding acquired fund fees and expenses other than certain money market fund fees as described below, dividend and interest expenses related to short sales, interest, taxes, expenses related to litigation and potential litigation, expenses related to trustee elections, and extraordinary expenses) exceed 0.45% of the average daily net assets of Class R6 Shares. The Fund may invest in one or more money market funds advised by the adviser or its affiliates (affiliated money market funds). The Fund’s adviser, shareholder servicing agent and/or administrator have contractually agreed to waive fees and/or reimburse expenses in an amount sufficient to offset the respective net fees each collects from the affiliated money market funds on the Fund’s investment in such money market funds for this Share Class. These waivers are in effect through 6/30/23, at which time it will be determined whether such waivers will be renewed or revised. To the extent that the Fund engages in securities lending, affiliated money market fund fees and expenses resulting from the Fund’s investment of cash received from securities lending borrowers are not included in Total Annual Fund Operating Expenses and therefore, the above waivers do not apply to such investments.
Example
This Example is intended to help you compare the cost of investing in the Fund with the cost of investing in other mutual funds. The Example assumes that you invest $10,000 in the Fund for the time periods indicated. The Example also assumes that your investment has a 5% return each year and that the Fund’s operating expenses are equal to the total annual fund operating expenses after fee waivers and expense reimburse
ments shown in the fee table through 6/30/23 and total annual fund operating expenses thereafter. Your actual costs may be higher or lower.
| WHETHER OR NOT YOU SELL YOUR SHARES, YOUR COST WOULD BE: | ||||
| |
1 Year |
3 Years |
5 Years |
10 Years |
| CLASS R6 SHARES ($) |
46 |
158 |
279 |
635 |
Portfolio Turnover
The Fund pays transaction costs, such as commissions, when it buys and sells securities (or “turns over” its portfolio). A higher portfolio turnover rate may indicate higher transaction costs and may result in higher taxes when Fund shares are held in a taxable account. These costs, which are not reflected in annual fund operating expenses or in the Example, affect the Fund’s performance. During the Fund’s most recent fiscal year, the Fund’s portfolio turnover rate was 24% of the average value of its portfolio.
What are the Fund’s main investment strategies?
Under normal circumstances, the Fund invests at least 80% of its Assets in municipal securities, the income from which is exempt from federal income tax. This is a fundamental policy. For purposes of this policy, “Assets” means net assets, plus the amount of borrowings for investment purposes. Municipal securities are securities issued by or on behalf of states, territories and possessions of the United States, including the District of Columbia, and their respective authorities, political subdivisions, agencies and instrumentalities and other groups with the authority to act for the municipalities, the interest on which is exempt from federal income tax. The securities are issued to raise funds for various public and private purposes. Municipal securities may include, but are not limited to, variable rate demand obligations, short-term municipal notes, municipal bonds, tax exempt commercial paper, private activity and industrial development bonds, tax anticipation notes, and participations in pools of municipal securities.
Municipal securities also include instruments evidencing direct ownership of interest payments or principal payments, or both, on municipal securities, such as tender option bonds and participation interests in all or part of specific holdings of municipal obligations, provided that the applicable issuer receives assurances from legal counsel that the interest payable on the securities is exempt from federal income tax. Additionally, municipal securities include all other instruments that directly or indirectly provide economic exposure to income which is derived from municipalities (such as municipal leases). The securities in which the Fund invests may have fixed rates of return or floating or variable rates.
The Fund will invest in municipal securities of any maturity. As part of its investments in municipal securities, the Fund will also have the ability to invest up to 100% of the Fund’s total assets
24 | J.P. Morgan Municipal Bond Funds
in below investment grade or unrated securities. Such securities are also known as “junk bonds,” “high yield bonds” and “non-investment grade bonds.” Junk bonds also include unrated securities that the Fund’s adviser believes to be of comparable quality to debt securities that are rated below investment grade. Junk bonds are also called “high yield bonds” and “non-investment grade bonds.” These securities generally are rated in the fifth or lower rating categories (for example, BB+ or lower by Standard & Poor’s Corporation (S&P) and Ba1 or lower by Moody’s Investors Service, Inc. (Moody’s)). These securities generally offer a higher yield than investment grade securities, but involve a high degree of risk. A security’s quality is determined at the time of purchase and securities that are rated investment grade or the unrated equivalent may be downgraded or decline in credit quality such that subsequently they would be deemed to be below investment grade.
The Fund will also invest in investment grade securities. Investment grade securities carry a minimum rating of Baa3, BBB–, or BBB– by Moody’s Investors Service Inc. (Moody’s), Standard & Poor’s Corporation (S&P), or Fitch Ratings (Fitch), respectively, or the equivalent by another nationally recognized statistical rating organization (NRSRO) or are unrated but deemed by the adviser to be of comparable quality. Under normal market conditions, the Fund intends to invest a significant portion of its Assets in securities rated BBB/BB by Standard & Poor’s Corporation (S&P) and Fitch Ratings (Fitch), Baa/Ba by Moody’s Investor Service, Inc. (Moody’s) or unrated securities that the adviser deems to be of equivalent quality.
The Fund may also invest in common shares or preferred shares of unaffiliated closed-end funds. The Fund generally will limit its investments in a single closed-end fund to 5% of its total assets and in all registered investment companies including closed-end funds (other than money market funds) to 10% of its total assets.
The Fund may invest in shares of exchange-traded funds (ETFs). The ETFs in which the Fund may invest include registered investment companies that seek to track the performance of a particular market index or security. These indexes include not only broad-based market indexes but more specific indexes as well, including those relating to particular sectors, markets, regions or industries. Ordinarily, the Fund must limit its investments in any single ETF to 5% of its total assets and in all ETFs and other investment companies to 10% of its total assets. However, the Securities and Exchange Commission (SEC) has issued exemptive orders to many ETFs that currently allow any fund investing in such ETFs to disregard these 5% and 10% limitations. If the Fund invests in ETFs that have received such exemptive orders, it may invest any amount of its total assets in a single ETF or in multiple ETFs, although ordinarily the Fund will limit its investments to no more than 10% of its total assets in a single ETF.
The Fund may invest in obligations of the U.S. Treasury, including Treasury bills, bonds and notes. These investments carry different interest rates, maturities and issue dates. The interest on these securities may be exempt from state and local income taxes.
Up to 100% of the Fund’s assets may be invested in municipal securities, the interest on which may be subject to the federal alternative minimum tax for individuals.
Up to 20% of the Fund’s net assets may be invested in securities subject to federal income tax.
The Fund may also invest in zero-coupon securities.
The Fund also invests in inverse floaters, auction rate securities and restricted securities.
Investment Process
The adviser buys and sells securities and investments for the Fund based on its view of individual securities and market sectors. Taking a long-term approach, the adviser primarily looks for individual fixed income investments that it believes will perform well over market cycles. The adviser is value oriented and makes investment decisions after performing a risk/reward analysis that includes an evaluation of interest rate risk, credit risk, duration, liquidity, any security pledge, and a review of the security’s attributes, such as the coupon, maturity, and any redemption and tender provisions. The adviser also factors in the overall investment strategy of the Fund, including its duration and its credit strategy, as well as the adviser’s interest rate outlook. As part of its investment process, the adviser seeks to assess the impact of environmental, social and governance factors on certain issuers in the universe in which the Fund may invest. The adviser’s assessment is based on an analysis of key opportunities and risks across sectors to identify financially material issues on the Fund’s investments in municipal issues and ascertain key issues that merit engagement with municipal issuers. These assessments may not be conclusive and securities that may be negatively impacted by such factors may be purchased and retained by the Fund while the Fund may divest or not invest in securities that may be positively impacted by such factors.
The Fund’s Main Investment Risks
The Fund is subject to management risk. The Fund may not achieve its objective if the adviser’s expectations regarding particular instruments or markets are not met.
July 1, 2022 | 25
JPMorgan High Yield Municipal Fund (continued)
An investment in this Fund or any other fund may not provide a complete investment program. The suitability of an investment in the Fund should be considered based on the investment objective, strategies and risks described in this prospectus, considered in light of all of the other investments in your portfolio, as well as your risk tolerance, financial goals and time horizons. You may want to consult with a financial advisor to determine if this Fund is suitable for you.
The Fund is subject to the main risks noted below, any of which may adversely affect the Fund’s performance and ability to meet its investment objective.
Municipal Obligations Risk. The risk of a municipal obligation generally depends on the financial and credit status of the issuer. Changes in the financial health of a municipal issuer may make it difficult for the issuer to make interest and principal payments when due. This could decrease the Fund’s income or hurt the ability to preserve capital and liquidity.
Under some circumstances, municipal obligations might not pay interest unless the state legislature or municipality authorizes money for that purpose.
Municipal obligations may be more susceptible to downgrades or defaults during recessions or similar periods of economic stress. In addition, since some municipal obligations may be secured or guaranteed by banks and other institutions, the risk to the Fund could increase if the banking or financial sector suffers an economic downturn and/or if the credit ratings of the institutions issuing the guarantee are downgraded or at risk of being downgraded by a national rating organization. Such a downward revision or risk of being downgraded may have an adverse effect on the market prices of the bonds and thus the value of the Fund’s investments.
In addition to being downgraded, an insolvent municipality may file for bankruptcy. The reorganization of a municipality’s debts may significantly affect the rights of creditors and the value of the securities issued by the municipality and the value of the Fund’s investments.
General Market Risk. Economies and financial markets throughout the world are becoming increasingly interconnected, which increases the likelihood that events or conditions in one country or region will adversely impact markets or issuers in other countries or regions. Securities in the Fund’s portfolio may underperform in comparison to securities in general financial markets, a particular financial market or other asset classes due to a number of factors, including inflation (or expectations for inflation), deflation (or expectations for deflation), interest rates, global demand for particular products or resources, market instability, debt crises and downgrades, embargoes, tariffs, sanctions and other trade barriers, regulatory events, other governmental trade or market control programs and related geopolitical events. In addition, the value of the Fund’s investments may be negatively affected by the
occurrence of global events such as war, terrorism, environmental disasters, natural disasters or events, country instability, and infectious disease epidemics or pandemics.
For example, the outbreak of COVID-19 has negatively affected economies, markets and individual companies throughout the world, including those in which the Fund invests. The effects of this pandemic to public health and business and market conditions, including, among other things, reduced consumer demand and economic output, supply chain disruptions and increased government spending, may continue to have a significant negative impact on the performance of the Fund’s investments, increase the Fund’s volatility, exacerbate pre-existing political, social and economic risks to the Fund, and negatively impact broad segments of businesses and populations. In addition, governments, their regulatory agencies, or self-regulatory organizations have taken or may take actions in response to the pandemic that affect the instruments in which the Fund invests, or the issuers of such instruments, in ways that could have a significant negative impact on the Fund’s investment performance. The duration and extent of COVID-19 and associated economic and market conditions and uncertainty over the long-term cannot be reasonably estimated at this time. The ultimate impact of COVID-19 and the extent to which the associated conditions impact a Fund will also depend on future developments, which are highly uncertain, difficult to accurately predict and subject to frequent changes.
Alternative Minimum Tax Risk. The Fund may invest in securities, the interest on which may be subject to the federal alternative minimum tax.
High Yield Securities Risk. The Fund may invest in securities and instruments of municipal issuers that are highly leveraged, less creditworthy or financially distressed. These investments (also known as junk bonds) are considered to be speculative and are subject to greater risk of loss, greater sensitivity to economic changes, valuation difficulties, and potential illiquidity.
In recent years, there has been a broad trend of weaker or less restrictive covenant protections in the high yield market. Among other things, under such weaker or less restrictive covenants, borrowers might be able to exercise more flexibility with respect to certain activities than borrowers who are subject to stronger or more protective covenants. For example, borrowers might be able to incur more debt, including secured debt, return more capital to shareholders, remove or reduce assets that are designated as collateral securing high yield securities, increase the claims against assets that are permitted against collateral securing high yield securities or otherwise manage their business in ways that could impact creditors negatively. In addition, certain privately held borrowers might be permitted to file less frequent, less detailed or less timely financial reporting or other information, which could negatively impact the value of the high yield securities issued by such borrowers.
26 | J.P. Morgan Municipal Bond Funds
Each of these factors might negatively impact the high yield instruments held by the Fund. No active trading market may exist for some instruments and certain investments may be subject to restrictions on resale. The inability to dispose of the Fund’s securities and other investments in a timely fashion could result in losses to the Fund. Because some instruments may have a more limited secondary market, liquidity and valuation risk may be more pronounced for the Fund. When instruments are prepaid, the Fund may have to reinvest in instruments with a lower yield or fail to recover additional amounts (i.e., premiums) paid for these instruments, resulting in an unexpected capital loss and/or a decrease in the amount of dividends and yield.
Interest Rate Risk. The Fund mainly invests in bonds and other debt securities. These securities will increase or decrease in value based on changes in interest rates. If rates increase, the value of the Fund’s investments generally declines. Securities with greater interest rate sensitivity and longer maturities generally are subject to greater fluctuations in value. The Fund may face a heightened level of interest rate risk due to certain changes in monetary policy. During periods when interest rates are low or there are negative interest rates, the Fund’s yield (and total return) also may be low or the Fund may be unable to maintain positive returns.
Credit Risk. The Fund’s investments are subject to the risk that issuers and/or counterparties will fail to make payments when due or default completely. If an issuer’s or a counterparty’s financial condition worsens, the credit quality of the issuer or counterparty may deteriorate. Credit spreads may increase, which may reduce the market values of the Fund’s securities. Credit spread risk is the risk that economic and market conditions or any actual or perceived credit deterioration may lead to an increase in the credit spreads (i.e., the difference in yield between two securities of similar maturity but different credit quality) and a decline in price of the issuer’s securities.
Floating and Variable Rate Securities Risk. Floating and variable rate securities provide for a periodic adjustment in the interest rate paid on the securities. The rate adjustment intervals may be regular and range from daily up to annually, or may be based on an event, such as a change in the prime rate. Floating and variable rate securities may be subject to greater liquidity risk than other debt securities, meaning that there may be limitations on the Fund’s ability to sell the securities at any given time. Such securities also may lose value.
Structured Product Risk. Structured products, such as tender option bonds, involve structural complexities and potential risks that may not be present where a municipal security is owned directly. These enhanced risks may include additional counter-party risk (the risk that the counterparty will not fulfill its contractual obligations) and call risk (the risk that the instruments will be called and the proceeds may need to be reinvested). Additionally, an active trading market for such instruments may not exist. To the extent that a structured product provides a put, the Fund may receive a lower interest
rate in return for such feature and will be subject to the risk that the put provider will be unable to honor the put feature (purchase the security). Finally, short-term municipal or tax-exempt structured products may present tax issues not presented by investments in other short-term municipal or tax-exempt securities. These issues might be resolved in a manner adverse to the Fund.
Restricted Securities Risk. Restricted securities are securities that cannot be offered for public resale unless registered under the applicable securities laws or that have a contractual restriction that prohibits or limits their resale. Restricted securities include private placement securities that have not been registered under the applicable securities laws, such as Rule 144A securities, and securities of U.S. and non-U.S. issuers that are issued pursuant to Regulation S. Private placements are generally subject to strict restrictions on resale. Restricted securities may not be listed on an exchange and may have no active trading market. Restricted securities may be illiquid. The Fund may be unable to sell a restricted security on short notice or may be able to sell them only at a price below current value. It may be more difficult to determine a market value for a restricted security. Also, the Fund may get only limited information about the issuer of a restricted security, so it may be less able to predict a loss. In addition, if Fund management receives material non-public information about the issuer, the Fund may as a result be unable to sell the securities. Certain restricted securities may involve a high degree of business and financial risk and may result in substantial losses.
Auction Rate Securities Risk. The auction rate municipal securities the Fund will purchase will typically have a long-term nominal maturity for which the interest rate is regularly reset through a “Dutch” auction. The interest rate set by the auction is the lowest interest rate that covers all securities offered for sale. While this process is designed to permit auction rate securities to be traded at par value, there is a risk that an auction will fail due to insufficient demand for the securities, which may adversely affect the liquidity and price of auction rate securities. Moreover, between auctions, there may be no secondary market for these securities, and sales conducted on a secondary market may not be on terms favorable to the seller. Thus, with respect to liquidity and price stability, auction rate securities may differ substantially from cash equivalents, notwithstanding the frequency of auctions and the credit quality of the security.
ETF and Other Investment Company Risk. The Fund may invest in shares of other investment companies and ETFs. Shareholders bear both their proportionate share of Fund’s expenses and similar expenses of the underlying investment company or ETF when the Fund invests in shares of another investment company or ETF. The price movement of an ETF or closed end fund designed to track an index may not track the index and may result in a loss. In addition, ETFs and closed-end investment companies may trade at a price above (premium) or below (discount) their net asset value, especially during periods
July 1, 2022 | 27
JPMorgan High Yield Municipal Fund (continued)
of significant market volatility or stress, causing investors to pay significantly more or less than the value of the ETF’s underlying portfolio. If the Fund invests in closed-end investment companies, it may incur added expenses such as additional management fees and trading costs.
Government Securities Risk. The Fund invests in securities issued or guaranteed by the U.S. government or its agencies or other Government-Sponsored Enterprises (GSEs). U.S. government securities are subject to market risk, interest rate risk and credit risk. Securities, such as those issued or guaranteed by the U.S. Treasury, that are backed by the full faith and credit of the United States are guaranteed only as to the timely payment of interest and principal when held to maturity and the market prices for such securities will fluctuate. Notwithstanding that these securities are backed by the full faith and credit of the United States, circumstances could arise that would prevent the payment of interest or principal. This would result in losses to the Fund. U.S. government securities include zero coupon securities, which tend to be subject to greater market risk than interest-paying securities of similar maturities.
Debt Securities and Other Callable Securities Risk. As part of its main investment strategy, the Fund invests in debt securities. The issuers of these securities and other callable securities may be able to repay principal in advance, especially when interest rates fall. Changes in prepayment rates can affect the return on investment and yield of these securities. When debt obligations are prepaid and when securities are called, the Fund may have to reinvest in securities with a lower yield. The Fund also may fail to recover additional amounts (i.e., premiums) paid for securities with higher interest rates, resulting in an unexpected capital loss.
Inverse Floating Rate Instrument Risk. The market value of an inverse floater can be more volatile than that of a conventional fixed-rate bond having similar credit quality, maturity and redemption provisions. Inverse floaters involve complex transactions and involve risks in addition to risks associated with more conventional municipal obligations. Inverse floaters may be more sensitive to changes in economic or market conditions than other types of investments and could result in losses that significantly exceed the Fund’s original investment. Inverse floaters can create leverage thereby causing the Fund to be more volatile than it would be if it had not used inverse floaters.
Taxability Risk. The Fund’s investments in municipal securities rely on the opinion of the issuer’s bond counsel that the interest paid on those securities will not be subject to federal income tax. Tax opinions are generally provided at the time the municipal security is initially issued. However, after the Fund buys a security, the Internal Revenue Service may determine that a bond issued as tax-exempt should in fact be taxable and the Fund’s dividends with respect to that bond might be subject to federal income tax.
Zero-Coupon Bond Risk. The market value of a zero-coupon bond is generally more volatile than the market value of other fixed income securities with similar maturities that pay interest periodically. In addition, federal income tax law requires that the holder of a zero-coupon bond accrue a portion of the discount at which the bond was purchased as taxable income each year. The Fund may consequently have to dispose of portfolio securities under disadvantageous circumstances to generate cash to satisfy its requirement as a regulated investment company to distribute all of its net income (including non-cash income attributable to zero-coupon securities). These actions may reduce the assets to which the Fund’s expenses could otherwise be allocated and may reduce the Fund’s rate of return.
Transactions Risk. The Fund could experience a loss and its liquidity may be negatively impacted when selling securities to meet redemption requests. The risk of loss increases if the redemption requests are unusually large or frequent or occur in times of overall market turmoil or declining prices. Similarly, large purchases of Fund shares may adversely affect the Fund’s performance to the extent that the Fund is delayed in investing new cash and is required to maintain a larger cash position than it ordinarily would.
Industry and Sector Focus Risk. At times the Fund may increase the relative emphasis of its investments in a particular industry or sector. The prices of securities of issuers in a particular industry or sector may be more susceptible to fluctuations due to changes in economic or business conditions, government regulations, availability of basic resources or supplies, or other events that affect that industry or sector more than securities of issuers in other industries and sectors. To the extent that the Fund increases the relative emphasis of its investments in a particular industry or sector, its shares’ values may fluctuate in response to events affecting that industry or sector.
Investments in the Fund are not deposits or obligations of, or guaranteed or endorsed by, any bank and are not insured or guaranteed by the FDIC, the Federal Reserve Board or any other government agency.
You could lose money investing in the Fund.
The Fund’s Past Performance
This section provides some indication of the risks of investing in the Fund. The bar chart shows how the performance of the Fund’s Class R6 Shares has varied from year to year for the past ten calendar years. The table shows the average annual total returns for the past one year, five years and ten years. The table compares the Fund’s performance to the performance of the Bloomberg US Municipal Index and the Bloomberg High Yield Municipal Bond Index. The performance of the Class R6 Shares prior to their inception are based on Class I Shares (which are not offered in this prospectus). The actual returns of the Class R6 Shares would be different than those shown because Class
28 | J.P. Morgan Municipal Bond Funds
R6 Shares have different expenses than Class I Shares. Past performance (before and after taxes) is not necessarily an indication of how the Fund will perform in the future. Updated performance information is available by visiting www.jpmorganfunds.com or by calling 1-800-480-4111.
| YEAR-BY-YEAR RETURNS — CLASS R6 SHARES |

| Best Quarter |
1st quarter, 2019 |
3.84% |
| Worst Quarter |
1st quarter, 2020 |
-6.44% |
| The Fund’s year-to-date total return |
through |
3/31/22 |
was |
-7.14% |
. |
| AVERAGE ANNUAL TOTAL RETURNS (For periods ended December 31, 2021) | |||
| |
Past 1 Year |
Past 5 Years |
Past 10 Years |
| CLASS R6 SHARES |
|
|
|
| Return Before Taxes |
5.86% |
5.06% |
4.03% |
| Return After Taxes on Distributions |
5.84 |
4.96 |
3.82 |
| Return After Taxes on Distributions and Sale of Fund Shares |
4.73 |
4.53 |
3.59 |
| BLOOMBERG US MUNICIPAL INDEX (Reflects No Deduction for Fees, Expenses, or Taxes) |
1.52 |
4.17 |
3.72 |
| BLOOMBERG HIGH YIELD MUNICIPAL BOND INDEX (Reflects No Deduction for Fees, Expenses, or Taxes) |
7.77 |
7.53 |
6.72 |
After-tax returns are calculated using the historical highest individual federal marginal income tax rates and do not reflect the impact of state and local taxes. Actual after-tax returns depend on the investor’s tax situation and may differ from those shown, and the after-tax returns are not relevant to investors who hold their shares through tax-deferred arrangements such as 401(k) plans or individual retirement accounts.
Management
J.P. Morgan Investment Management Inc. (the adviser)
| Portfolio Manager |
Managed the Fund Since |
Primary Title with Investment Adviser |
| Wayne Godlin |
2018 |
Managing Director |
| Richard Taormina |
2007 |
Managing Director |
| Kevin M. Ellis |
2018 |
Managing Director |
Purchase and Sale of Fund Shares
Purchase minimums
| For Class R6 Shares |
|
| To establish an account |
$5,000,000 for Discretionary Accounts $5,000,000 for Institutional Investors $15,000,000 for Other Investors |
| To add to an account |
No minimum levels |
There is no minimum investment for other eligible Class R6 investors, as described in the “Investing with J.P. Morgan Funds – Choosing a Share Class – Eligibility” section.
In general, you may purchase or redeem shares on any business day:
•
Through your Financial Intermediary or the eligible retirement plan or college savings plan through which you invest in the Fund
•
By writing to J.P. Morgan Funds Services, P.O. Box 219143, Kansas City, MO 64121-9143
•
After you open an account, by calling J.P. Morgan Funds Services at 1-800-480-4111
Tax Information
The Fund’s distributions of interest on municipal bonds generally are not subject to federal income tax; however the Fund will distribute taxable dividends, including distributions of short-term gains, and long-term gains. In addition, interest on certain bonds may be subject to the federal alternative minimum tax. To the extent that the Fund’s distributions are derived from interest on bonds that are not exempt from applicable state and local taxes, such distributions will be subject to such state and local taxes.
Payments to Broker-Dealers and Other Financial Intermediaries
If you purchase shares of the Fund through a broker-dealer or other financial intermediary (such as a bank), the Fund and its related companies may pay the financial intermediary for the sale of Fund shares and related services. These payments may create a conflict of interest by influencing the broker-dealer or financial intermediary and your salesperson to recommend the Fund over another investment. Ask your salesperson or visit your financial intermediary’s website for more information.
July 1, 2022 | 29
JPMorgan Intermediate Tax Free Bond Fund
Class/Ticker: R6/JITZX
What is the goal of the Fund?
The Fund seeks to provide monthly dividends, which are excluded from gross income, and to protect the value of your investment by investing primarily in municipal obligations. For purposes of the Fund’s investment objective, “gross income” means gross income for federal tax purposes.
Fees and Expenses of the Fund
The following tables describe the fees and expenses that you may pay if you buy, hold and sell shares of the Fund. You may pay other fees, such as brokerage commissions and other fees to financial intermediaries, which are not reflected in the table and examples below.
| ANNUAL FUND OPERATING EXPENSES (Expenses that you pay each year as a percentage of the value of your investment) | |
| |
Class R6 |
| Management Fees |
0.30% |
| Distribution (Rule 12b-1) Fees |
NONE |
| Other Expenses |
0.10 |
| Service Fees |
NONE |
| Remainder of Other Expenses |
0.10 |
| Total Annual Fund Operating Expenses |
0.40 |
| Fee Waivers and/or Expense Reimbursements1 |
-0.10 |
| Total Annual Fund Operating Expenses after Fee Waivers and/or Expense Reimbursements1 |
0.30 |
1
The Fund’s adviser and/or its affiliates have contractually agreed to waive fees and/or reimburse expenses to the extent Total Annual Fund Operating Expenses (excluding acquired fund fees and expenses other than certain money market fund fees as described below, dividend and interest expenses related to short sales, interest, taxes, expenses related to litigation and potential litigation, expenses related to trustee elections, and extraordinary expenses) exceed 0.30% of the average daily net assets of Class R6 Shares. The Fund may invest in one or more money market funds advised by the adviser or its affiliates (affiliated money market funds). The Fund’s adviser, shareholder servicing agent and/or administrator have contractually agreed to waive fees and/or reimburse expenses in an amount sufficient to offset the respective net fees each collects from the affiliated money market funds on the Fund’s investment in such money market funds for this Share Class. These waivers are in effect through 6/30/23, at which time it will be determined whether such waivers will be renewed or revised. To the extent that the Fund engages in securities lending, affiliated money market fund fees and expenses resulting from the Fund’s investment of cash received from securities lending borrowers are not included in Total Annual Fund Operating Expenses and therefore, the above waivers do not apply to such investments.
Example
This Example is intended to help you compare the cost of investing in the Fund with the cost of investing in other mutual funds. The Example assumes that you invest $10,000 in the Fund for the time periods indicated. The Example also assumes that your investment has a 5% return each year and that the
Fund’s operating expenses are equal to the total annual fund operating expenses after fee waivers and expense reimbursements shown in the fee table through 6/30/23 and total annual fund operating expenses thereafter. Your actual costs may be higher or lower.
| WHETHER OR NOT YOU SELL YOUR SHARES, YOUR COST WOULD BE: | ||||
| |
1 Year |
3 Years |
5 Years |
10 Years |
| CLASS R6 SHARES ($) |
31 |
118 |
214 |
495 |
Portfolio Turnover
The Fund pays transaction costs, such as commissions, when it buys and sells securities (or “turns over” its portfolio). A higher portfolio turnover rate may indicate higher transaction costs and may result in higher taxes when Fund shares are held in a taxable account. These costs, which are not reflected in annual fund operating expenses or in the Example, affect the Fund’s performance. During the Fund’s most recent fiscal year, the Fund’s portfolio turnover rate was 12% of the average value of its portfolio.
What are the Fund’s main investment strategies?
As a fundamental policy, the Fund normally invests at least 80% of the value of its Assets in municipal obligations whose interest payments are excluded from gross income for federal income tax purposes and not subject to the federal alternative minimum tax on individuals. “Assets” means net assets, plus the amount of borrowings for investment purposes.
Under normal circumstances, the Fund reserves the right to invest up to 20% of its Assets in securities that pay interest subject to federal income tax or the federal alternative minimum tax on individuals. To defend the value of its assets during unusual market conditions, the Fund may temporarily exceed this limit.
There may be times when there are not enough municipal obligations available to meet the Fund’s needs. On these occasions, the Fund may invest in repurchase agreements or U.S. Treasury securities that may be subject to federal income tax.
The Fund may invest in debt securities issued by governmental entities, certain issuers identified with the U.S. government and private issuers. The Fund may invest in municipal mortgage-backed and asset-backed securities. The Fund may invest a significant portion or all of its assets in municipal mortgage-backed securities at the adviser’s discretion.
The Fund may invest up to 20% of its total assets in securities rated below investment grade. Such securities are known as “junk bonds,” “high yield bonds” and “non-investment grade bonds.” Junk bonds also include unrated securities that the adviser believes to be of comparable quality to debt securities that are rated below investment grade. These securities generally are rated in the fifth or lower rating categories (for
30 | J.P. Morgan Municipal Bond Funds
example, BB+ or lower by S&P and Ba1 or lower by Moody’s). These securities generally offer a higher yield than investment grade securities, but involve a high degree of risk. A security’s quality is determined at the time of purchase and securities that are rated investment grade or the unrated equivalent may be downgraded or decline in credit quality, such that, following the time of purchase, they would be deemed to be below investment grade. If the quality of an investment grade security is downgraded subsequent to purchase to below investment grade, the Fund may continue to hold the security.
The Fund may also invest in high-quality, short-term money market instruments and repurchase agreements.
The Fund may also invest in zero-coupon securities and forward commitments.
The average weighted maturity of the Fund’s portfolio will be between three and ten years. Average weighted maturity is the average of all the current maturities (that is, the term of the securities) of the individual bonds in a Fund calculated so as to count most heavily those securities with the highest dollar value. Average weighted maturity is important to investors as an indication of a Fund’s sensitivity to changes in interest rates. Usually, the longer the average weighted maturity, the more fluctuation in share price you can expect.
Investment Process: The adviser buys and sells securities and investments for the Fund based on its view of individual securities and market sectors. Taking a long-term approach, the adviser looks for individual fixed income investments that it believes will perform well over market cycles. The adviser is value oriented and makes decisions to purchase and sell individual securities and instruments after performing a risk/reward analysis that includes an evaluation of interest rate risk, credit risk, duration, liquidity and the complex legal and technical structure of the transaction. As part of its investment process, the adviser seeks to assess the impact of environmental, social and governance factors on certain issuers in the universe in which the Fund may invest. The adviser’s assessment is based on an analysis of key opportunities and risks across sectors to identify financially material issues on the Fund’s investments in municipal issues and ascertain key issues that merit engagement with municipal issuers. These assessments may not be conclusive and securities that may be negatively impacted by such factors may be purchased and retained by the Fund while the Fund may divest or not invest in securities that may be positively impacted by such factors.
The Fund’s Main Investment Risks
The Fund is subject to management risk and may not achieve its objective if the adviser’s expectations regarding particular instruments or markets are not met.
An investment in this Fund or any other fund may not provide a complete investment program. The suitability of an investment in the Fund should be considered based on the investment objective, strategies and risks described in this prospectus, considered in light of all of the other investments in your portfolio, as well as your risk tolerance, financial goals and time horizons. You may want to consult with a financial advisor to determine if this Fund is suitable for you.
The Fund is subject to the main risks noted below, any of which may adversely affect the Fund’s performance and ability to meet its investment objective.
Interest Rate Risk. The Fund mainly invests in bonds and other debt securities. These securities will increase or decrease in value based on changes in interest rates. If rates increase, the value of the Fund’s investments generally declines. Securities with greater interest rate sensitivity and longer maturities generally are subject to greater fluctuations in value. The Fund may face a heightened level of interest rate risk due to certain changes in monetary policy. During periods when interest rates are low or there are negative interest rates, the Fund’s yield (and total return) also may be low or the Fund may be unable to maintain positive returns.
Municipal Obligations Risk. The risk of a municipal obligation generally depends on the financial and credit status of the issuer. Changes in the financial health of a municipal issuer may make it difficult for the issuer to make interest and principal payments when due. This could decrease the Fund’s income or hurt the ability to preserve capital and liquidity.
Under some circumstances, municipal obligations might not pay interest unless the state legislature or municipality authorizes money for that purpose.
Municipal obligations may be more susceptible to downgrades or defaults during recessions or similar periods of economic stress. In addition, since some municipal obligations may be secured or guaranteed by banks and other institutions, the risk to the Fund could increase if the banking or financial sector suffers an economic downturn and/or if the credit ratings of the institutions issuing the guarantee are downgraded or at risk of being downgraded by a national rating organization. Such a downward revision or risk of being downgraded may have an adverse effect on the market prices of the bonds and thus the value of the Fund’s investments.
In addition to being downgraded, an insolvent municipality may file for bankruptcy. The reorganization of a municipality’s debts may significantly affect the rights of creditors and the value of the securities issued by the municipality and the value of the Fund’s investments.
Credit Risk. The Fund’s investments are subject to the risk that issuers and/or counterparties will fail to make payments when due or default completely. If an issuer’s or a counterparty’s financial condition worsens, the credit quality of the issuer or
July 1, 2022 | 31
JPMorgan Intermediate Tax Free Bond Fund (continued)
counterparty may deteriorate. Credit spreads may increase, which may reduce the market values of the Fund’s securities. Credit spread risk is the risk that economic and market conditions or any actual or perceived credit deterioration may lead to an increase in the credit spreads (i.e., the difference in yield between two securities of similar maturity but different credit quality) and a decline in price of the issuer’s securities.
Government Securities Risk. The Fund invests in securities issued or guaranteed by the U.S. government or its agencies and instrumentalities (such as securities issued by the Government National Mortgage Association (Ginnie Mae), the Federal National Mortgage Association (Fannie Mae), or the Federal Home Loan Mortgage Corporation (Freddie Mac)). U.S. government securities are subject to market risk, interest rate risk and credit risk. Securities, such as those issued or guaranteed by Ginnie Mae or the U.S. Treasury, that are backed by the full faith and credit of the United States are guaranteed only as to the timely payment of interest and principal when held to maturity and the market prices for such securities will fluctuate. Notwithstanding that these securities are backed by the full faith and credit of the United States, circumstances could arise that would prevent the payment of interest or principal. This would result in losses to the Fund. Securities issued or guaranteed by U.S. government related organizations, such as Fannie Mae and Freddie Mac, are not backed by the full faith and credit of the U.S. government and no assurance can be given that the U.S. government will provide financial support. Therefore, U.S. government related organizations may not have the funds to meet their payment obligations in the future. U.S. government securities include zero coupon securities, which tend to be subject to greater market risk than interest-paying securities of similar maturities.
High Yield Securities Risk. The Fund may invest in securities and instruments of municipal issuers that are highly leveraged, less creditworthy or financially distressed. These investments (also known as junk bonds) are considered to be speculative and are subject to greater risk of loss, greater sensitivity to economic changes, valuation difficulties, and potential illiquidity.
In recent years, there has been a broad trend of weaker or less restrictive covenant protections in the high yield market. Among other things, under such weaker or less restrictive covenants, borrowers might be able to exercise more flexibility with respect to certain activities than borrowers who are subject to stronger or more protective covenants. For example, borrowers might be able to incur more debt, including secured debt, return more capital to shareholders, remove or reduce assets that are designated as collateral securing high yield securities, increase the claims against assets that are permitted against collateral securing high yield securities or otherwise manage their business in ways that could impact creditors negatively. In addition, certain privately held borrowers might
be permitted to file less frequent, less detailed or less timely financial reporting or other information, which could negatively impact the value of the high yield securities issued by such borrowers.
Each of these factors might negatively impact the high yield instruments held by the Fund. No active trading market may exist for some instruments and certain investments may be subject to restrictions on resale. The inability to dispose of the Fund’s securities and other investments in a timely fashion could result in losses to the Fund. Because some instruments may have a more limited secondary market, liquidity and valuation risk may be more pronounced for the Fund. When instruments are prepaid, the Fund may have to reinvest in instruments with a lower yield or fail to recover additional amounts (i.e., premiums) paid for these instruments, resulting in an unexpected capital loss and/or a decrease in the amount of dividends and yield.
Alternative Minimum Tax Risk. The Fund may invest in securities, the interest on which may be subject to the federal alternative minimum tax.
Mortgage-Related and Other Asset-Backed Securities Risk. Mortgage-related and asset-backed securities, including certain municipal housing authority obligations, are subject to certain other risks. The value of these securities will be influenced by the factors affecting the housing market and the assets underlying such securities. As a result, during periods of declining asset values, difficult or frozen credit markets, significant changes in interest rates, or deteriorating economic conditions, mortgage-related and asset-backed securities may decline in value, face valuation difficulties, become more volatile and/or become illiquid. These securities are also subject to prepayment and call risk. In periods of declining interest rates, the Fund may be subject to contraction risk which is the risk that borrowers will increase the rate at which they prepay the maturity value of mortgages and other obligations. When mortgages and other obligations are prepaid and when securities are called, the Fund may have to reinvest in securities with a lower yield or fail to recover additional amounts (i.e., premiums) paid for securities with higher interest rates, resulting in an unexpected capital loss and/or a decrease in the amount of dividends and yield. In periods of either rising or declining interest rates, the Fund may be subject to extension risk which is the risk that the expected maturity of an obligation will lengthen in duration due to a decrease in prepayments. As a result, in certain interest rate environments, the Fund may exhibit additional volatility. Additionally, asset-backed, mortgage-related and mortgage-backed securities are subject to risks associated with their structure and the nature of the assets underlying the securities and the servicing of those assets. Certain asset-backed, mortgage-related and mortgage-backed securities may face valuation difficulties and may be less liquid than other types of asset-backed, mortgage-related and mortgage-backed securities, or debt securities.
32 | J.P. Morgan Municipal Bond Funds
Debt Securities and Other Callable Securities Risk. As part of its main investment strategy, the Fund invests in debt securities. The issuers of these securities and other callable securities may be able to repay principal in advance, especially when interest rates fall. Changes in prepayment rates can affect the return on investment and yield of these securities. When debt obligations are prepaid and when securities are called, the Fund may have to reinvest in securities with a lower yield. The Fund also may fail to recover additional amounts (i.e., premiums) paid for securities with higher interest rates, resulting in an unexpected capital loss.
Taxability Risk. The Fund’s investments in municipal securities rely on the opinion of the issuer’s bond counsel that the interest paid on those securities will not be subject to federal income tax. Tax opinions are generally provided at the time the municipal security is initially issued. However, after the Fund buys a security, the Internal Revenue Service may determine that a bond issued as tax-exempt should in fact be taxable and the Fund’s dividends with respect to that bond might be subject to federal income tax.
Zero-Coupon Bond Risk. The market value of a zero-coupon bond is generally more volatile than the market value of other fixed income securities with similar maturities that pay interest periodically. In addition, federal income tax law requires that the holder of a zero-coupon bond accrue a portion of the discount at which the bond was purchased as taxable income each year. The Fund may consequently have to dispose of portfolio securities under disadvantageous circumstances to generate cash to satisfy its requirement as a regulated investment company to distribute all of its net income (including non-cash income attributable to zero-coupon securities). These actions may reduce the assets to which the Fund’s expenses could otherwise be allocated and may reduce the Fund’s rate of return.
Transactions Risk. The Fund could experience a loss and its liquidity may be negatively impacted when selling securities to meet redemption requests. The risk of loss increases if the redemption requests are unusually large or frequent or occur in times of overall market turmoil or declining prices. Similarly, large purchases of Fund shares may adversely affect the Fund’s performance to the extent that the Fund is delayed in investing new cash and is required to maintain a larger cash position than it ordinarily would.
General Market Risk. Economies and financial markets throughout the world are becoming increasingly interconnected, which increases the likelihood that events or conditions in one country or region will adversely impact markets or issuers in other countries or regions. Securities in the Fund’s portfolio may underperform in comparison to securities in general financial markets, a particular financial market or other asset classes due to a number of factors, including inflation (or expectations for inflation), deflation (or expectations for deflation), interest rates, global demand for particular products or resources, market instability, debt crises and downgrades,
embargoes, tariffs, sanctions and other trade barriers, regulatory events, other governmental trade or market control programs and related geopolitical events. In addition, the value of the Fund’s investments may be negatively affected by the occurrence of global events such as war, terrorism, environmental disasters, natural disasters or events, country instability, and infectious disease epidemics or pandemics.
For example, the outbreak of COVID-19 has negatively affected economies, markets and individual companies throughout the world, including those in which the Fund invests. The effects of this pandemic to public health and business and market conditions, including, among other things, reduced consumer demand and economic output, supply chain disruptions and increased government spending, may continue to have a significant negative impact on the performance of the Fund’s investments, increase the Fund’s volatility, exacerbate pre-existing political, social and economic risks to the Fund, and negatively impact broad segments of businesses and populations. In addition, governments, their regulatory agencies, or self-regulatory organizations have taken or may take actions in response to the pandemic that affect the instruments in which the Fund invests, or the issuers of such instruments, in ways that could have a significant negative impact on the Fund’s investment performance. The duration and extent of COVID-19 and associated economic and market conditions and uncertainty over the long-term cannot be reasonably estimated at this time. The ultimate impact of COVID-19 and the extent to which the associated conditions impact a Fund will also depend on future developments, which are highly uncertain, difficult to accurately predict and subject to frequent changes.
Industry and Sector Focus Risk. At times the Fund may increase the relative emphasis of its investments in a particular industry or sector. The prices of securities of issuers in a particular industry or sector may be more susceptible to fluctuations due to changes in economic or business conditions, government regulations, availability of basic resources or supplies, or other events that affect that industry or sector more than securities of issuers in other industries and sectors. To the extent that the Fund increases the relative emphasis of its investments in a particular industry or sector, its shares’ values may fluctuate in response to events affecting that industry or sector.
Investments in the Fund are not deposits or obligations of, or guaranteed or endorsed by, any bank and are not insured or guaranteed by the FDIC, the Federal Reserve Board or any other government agency.
You could lose money investing in the Fund.
The Fund’s Past Performance
This section provides some indication of the risks of investing in the Fund. The bar chart shows how the performance of the Fund’s Class R6 Shares has varied from year to year for the past ten calendar years. The table shows the average annual total
July 1, 2022 | 33
JPMorgan Intermediate Tax Free Bond Fund (continued)
returns over the past one year, five years and ten years. The table compares the Fund’s performance to the performance of the Bloomberg U.S. 1-15 Year Blend (1-17) Municipal Bond Index. The performance of the Class R6 Shares prior to their inception are based on Class I Shares (which are not offered in this prospectus). The actual returns of the Class R6 Shares would be substantially similar to the performance of Class I Shares because the Fund is invested in the same group of securities and the annual returns would differ only to the extent that the Classes do not have the same expenses. Past performance (before and after taxes) is not necessarily an indication of how the Fund will perform in the future. Updated performance information is available by visiting www.jpmorganfunds.com or by calling 1-800-480-4111.
| YEAR-BY-YEAR RETURNS — CLASS R6 SHARES |
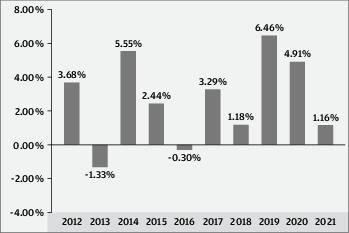
| Best Quarter |
2nd quarter, 2020 |
2.79% |
| Worst Quarter |
4th quarter, 2016 |
-3.11% |
| The Fund’s year-to-date total return |
through |
3/31/22 |
was |
-5.74% |
. |
| AVERAGE ANNUAL TOTAL RETURNS (For periods ended December 31, 2021) | |||
| |
Past 1 Year |
Past 5 Years |
Past 10 Years |
| CLASS R6 SHARES |
|
|
|
| Return Before Taxes |
1.16% |
3.39% |
2.68% |
| Return After Taxes on Distributions |
0.96 |
3.33 |
2.62 |
| Return After Taxes on Distributions and Sale of Fund Shares |
1.80 |
3.18 |
2.65 |
| BLOOMBERG U.S. 1-15 YEAR BLEND (1-17) MUNICIPAL BOND INDEX (Reflects No Deduction for Fees, Expenses, or Taxes) |
0.86 |
3.57 |
3.05 |
After-tax returns are calculated using the historical highest individual federal marginal income tax rates and do not reflect the impact of state and local taxes. Actual after-tax returns
depend on the investor’s tax situation and may differ from those shown, and the after-tax returns shown are not relevant to investors who hold their shares through tax-deferred arrangements such as 401(k) plans or individual retirement accounts.
Management
J.P. Morgan Investment Management Inc. (the adviser)
| Portfolio Managers |
Managed the Fund Since |
Primary Title with Investment Adviser |
| Richard Taormina |
2006 |
Managing Director |
| David Sivinski |
2005 |
Executive Director |
| Kevin M. Ellis |
2014 |
Managing Director |
Purchase and Sale of Fund Shares
Purchase minimums
| For Class R6 Shares |
|
| To establish an account |
$5,000,000 for Discretionary Accounts $5,000,000 for Institutional Investors $15,000,000 for Other Investors |
| To add to an account |
No minimum levels |
There is no minimum investment for other eligible Class R6 investors, as described in the “Investing with J.P. Morgan Funds – Choosing a Share Class – Eligibility” section.
In general, you may purchase or redeem shares on any business day:
•
Through your Financial Intermediary or the eligible retirement plan or college savings plan through which you invest in the Fund
•
By writing to J.P. Morgan Funds Services, P.O. Box 219143, Kansas City, MO 64121-9143
•
After you open an account, by calling J.P. Morgan Funds Services at 1-800-480-4111
Tax Information
The Fund’s distributions of interest on municipal bonds generally are not subject to federal income tax; however the Fund may distribute taxable dividends, including distributions of short-term capital gains, and long-term capital gains. In addition, interest on certain bonds may be subject to the federal alternative minimum tax. To the extent that the Fund’s distributions are derived from interest on bonds that are not exempt from applicable state and local taxes, such distributions will be subject to such state and local taxes. When your investment is in a 401(k) plan or other tax-advantaged investment plan, you may be subject to federal income tax on ordinary income or capital gains upon withdrawal from the tax-advantaged investment plan.
34 | J.P. Morgan Municipal Bond Funds
Payments to Broker-Dealers and Other Financial Intermediaries
If you purchase shares of the Fund through a broker-dealer or other financial intermediary (such as a bank), the Fund and its related companies may pay the financial intermediary for the sale of Fund shares and related services. These payments may
create a conflict of interest by influencing the broker-dealer or financial intermediary and your salesperson to recommend the Fund over another investment. Ask your salesperson or visit your financial intermediary’s website for more information.
July 1, 2022 | 35
JPMorgan New York Tax Free Bond Fund
Class/Ticker: R6/VINRX
What is the goal of the Fund?
The Fund seeks to provide monthly dividends that are excluded from gross income for federal income tax purposes and are exempt from New York State and New York City personal income taxes. It also seeks to protect the value of your investment.
Fees and Expenses of the Fund
The following tables describe the fees and expenses that you may pay if you buy, hold and sell shares of the Fund. You may pay other fees, such as brokerage commissions and other fees to financial intermediaries, which are not reflected in the table and examples below.
| ANNUAL FUND OPERATING EXPENSES (Expenses that you pay each year as a percentage of the value of your investment) | |
| |
Class R6 |
| Management Fees |
0.30% |
| Distribution (Rule 12b-1) Fees |
NONE |
| Other Expenses |
0.13 |
| Service Fees |
NONE |
| Remainder of Other Expenses |
0.13 |
| Total Annual Fund Operating Expenses |
0.43 |
| Fee Waivers and/or Expense Reimbursements1 |
-0.03 |
| Total Annual Fund Operating Expenses after Fee Waivers and/or Expense Reimbursements1 |
0.40 |
1
The Fund’s adviser and/or its affiliates have contractually agreed to waive fees and/or reimburse expenses to the extent Total Annual Fund Operating Expenses (excluding acquired fund fees and expenses other than certain money market fund fees as described below, dividend and interest expenses related to short sales, interest, taxes, expenses related to litigation and potential litigation, expenses related to trustee elections, and extraordinary expenses) exceed 0.40% of the average daily net assets of Class R6 Shares. The Fund may invest in one or more money market funds advised by the adviser or its affiliates (affiliated money market funds). The Fund’s adviser, shareholder servicing agent and/or administrator have contractually agreed to waive fees and/or reimburse expenses in an amount sufficient to offset the respective net fees each collects from the affiliated money market funds on the Fund’s investment in such money market funds for this Share Class. These waivers are in effect through 6/30/23, at which time it will be determined whether such waivers will be renewed or revised. To the extent that the Fund engages in securities lending, affiliated money market fund fees and expenses resulting from the Fund’s investment of cash received from securities lending borrowers are not included in Total Annual Fund Operating Expenses and therefore, the above waivers do not apply to such investments.
Example
This Example is intended to help you compare the cost of investing in the Fund with the cost of investing in other mutual funds. The Example assumes that you invest $10,000 in the Fund for the time periods indicated. The Example also assumes that your investment has a 5% return each year and that the
Fund’s operating expenses are equal to the total annual fund operating expenses after fee waivers and expense reimbursements shown in the fee table through 6/30/23 and total annual fund operating expenses thereafter. Your actual costs may be higher or lower.
| WHETHER OR NOT YOU SELL YOUR SHARES, YOUR COST WOULD BE: | ||||
| |
1 Year |
3 Years |
5 Years |
10 Years |
| CLASS R6 SHARES ($) |
41 |
135 |
238 |
539 |
Portfolio Turnover
The Fund pays transaction costs, such as commissions, when it buys and sells securities (or “turns over” its portfolio). A higher portfolio turnover rate may indicate higher transaction costs and may result in higher taxes when Fund shares are held in a taxable account. These costs, which are not reflected in annual fund operating expenses or in the Example, affect the Fund’s performance. During the Fund’s most recent fiscal year, the Fund’s portfolio turnover rate was 10% of the average value of its portfolio.
What are the Fund’s main investment strategies?
As a fundamental policy, the Fund normally invests at least 80% of the value of its Assets in municipal obligations whose interest payments are excluded from gross income for federal income tax purposes and exempt from New York State and New York City personal income taxes, and not subject to the federal alternative minimum tax on individuals. “Assets” means net assets, plus the amount of borrowings for investment purposes.
The Fund may invest in municipal obligations issued by the State of New York, New York City, their political subdivisions, as well as Puerto Rico, other U.S. territories and their political subdivisions.
Under normal circumstances, the Fund reserves the right to invest up to 20% of its Assets in securities that pay interest subject to federal income tax, the federal alternative minimum tax on individuals or New York State and New York City personal income taxes. To defend the value of its assets during unusual market conditions, the Fund may temporarily exceed this limit.
There may be times when there are not enough municipal obligations available to meet the Fund’s needs. On these occasions, the Fund may invest in repurchase agreements or U.S. Treasury securities that may be subject to federal income tax.
The Fund may invest in debt securities issued by governmental entities, certain issuers identified with the U.S. government and private issuers. The Fund may invest in municipal mortgage-backed and asset-backed securities. The Fund may invest a significant portion or all of its assets in municipal mortgage-backed securities at the adviser’s discretion.
36 | J.P. Morgan Municipal Bond Funds
The Fund may invest up to 20% of its total assets in securities rated below investment grade. Such securities are known as “junk bonds,” “high yield bonds” and “non-investment grade bonds.” Junk bonds also include unrated securities that the adviser believes to be of comparable quality to debt securities that are rated below investment grade. These securities generally are rated in the fifth or lower rating categories (for example, BB+ or lower by S&P and Ba1 or lower by Moody’s). These securities generally offer a higher yield than investment grade securities, but involve a high degree of risk. A security’s quality is determined at the time of purchase and securities that are rated investment grade or the unrated equivalent may be downgraded or decline in credit quality, such that, following the time of purchase, they would be deemed to be below investment grade. If the quality of an investment grade security is downgraded subsequent to purchase to below investment grade, the Fund may continue to hold the security.
The Fund may also invest in high-quality, short-term money market instruments and repurchase agreements.
The Fund may also invest in zero-coupon securities and forward commitments.
The average weighted maturity of the Fund’s portfolio will be between three and twelve years. Average weighted maturity is the average of all the current maturities (that is, the term of the securities) of the individual bonds in a Fund calculated so as to count most heavily those securities with the highest dollar value. Average weighted maturity is important to investors as an indication of a Fund’s sensitivity to changes in interest rates. Usually, the longer the average weighted maturity, the more fluctuation in share price you can expect.
Investment Process: The adviser buys and sells securities and investments for the Fund based on its view of individual securities and market sectors. Taking a long-term approach, the adviser looks for individual fixed income investments that it believes will perform well over market cycles. The adviser is value oriented and makes decisions to purchase and sell individual securities and instruments after performing a risk/reward analysis that includes an evaluation of interest rate risk, credit risk, duration, liquidity and the complex legal and technical structure of the transaction. As part of its investment process, the adviser seeks to assess the impact of environmental, social and governance factors on certain issuers in the universe in which the Fund may invest. The adviser’s assessment is based on an analysis of key opportunities and risks across sectors to identify financially material issues on the Fund’s investments in municipal issues and ascertain key issues that merit engagement with municipal issuers. These assessments may not be conclusive and securities that may be negatively impacted by such factors may be purchased and retained by the Fund while the Fund may divest or not invest in securities that may be positively impacted by such factors.
The Fund’s Main Investment Risks
The Fund is subject to management risk and may not achieve its objective if the adviser’s expectations regarding particular instruments or markets are not met.
An investment in this Fund or any other fund may not provide a complete investment program. The suitability of an investment in the Fund should be considered based on the investment objective, strategies and risks described in this prospectus, considered in light of all of the other investments in your portfolio, as well as your risk tolerance, financial goals and time horizons. You may want to consult with a financial advisor to determine if this Fund is suitable for you.
The Fund is subject to the main risks noted below, any of which may adversely affect the Fund’s performance and ability to meet its investment objective.
Interest Rate Risk. The Fund mainly invests in bonds and other debt securities. These securities will increase or decrease in value based on changes in interest rates. If rates increase, the value of the Fund’s investments generally declines. Securities with greater interest rate sensitivity and longer maturities generally are subject to greater fluctuations in value. The Fund may face a heightened level of interest rate risk due to certain changes in monetary policy. During periods when interest rates are low or there are negative interest rates, the Fund’s yield (and total return) also may be low or the Fund may be unable to maintain positive returns.
New York Geographic Concentration Risk. Because the Fund invests primarily in municipal obligations issued by the State of New York and New York City, their political subdivisions, authorities, and agencies, its performance will be affected by the fiscal and economic health of that state, the city and their political subdivisions. As the nation’s financial capital, New York’s and New York City’s economy is heavily dependent on the financial sector, and may be sensitive to economic problems affecting the sector.
Municipal Obligations Risk. The risk of a municipal obligation generally depends on the financial and credit status of the issuer. Changes in the financial health of a municipal issuer may make it difficult for the issuer to make interest and principal payments when due. This could decrease the Fund’s income or hurt the ability to preserve capital and liquidity.
Under some circumstances, municipal obligations might not pay interest unless the state legislature or municipality authorizes money for that purpose.
Municipal obligations may be more susceptible to downgrades or defaults during recessions or similar periods of economic stress. In addition, since some municipal obligations may be secured or guaranteed by banks and other institutions, the risk to the Fund could increase if the banking or financial sector suffers an economic downturn and/or if the credit ratings of the institutions issuing the guarantee are downgraded or at risk of
July 1, 2022 | 37
JPMorgan New York Tax Free Bond Fund (continued)
being downgraded by a national rating organization. Such a downward revision or risk of being downgraded may have an adverse effect on the market prices of the bonds and thus the value of the Fund’s investments.
In addition to being downgraded, an insolvent municipality may file for bankruptcy. The reorganization of a municipality’s debts may significantly affect the rights of creditors and the value of the securities issued by the municipality and the value of the Fund’s investments.
Credit Risk. The Fund’s investments are subject to the risk that issuers and/or counterparties will fail to make payments when due or default completely. If an issuer’s or a counterparty’s financial condition worsens, the credit quality of the issuer or counterparty may deteriorate. Credit spreads may increase, which may reduce the market values of the Fund’s securities. Credit spread risk is the risk that economic and market conditions or any actual or perceived credit deterioration may lead to an increase in the credit spreads (i.e., the difference in yield between two securities of similar maturity but different credit quality) and a decline in price of the issuer’s securities.
Government Securities Risk. The Fund invests in securities issued or guaranteed by the U.S. government or its agencies and instrumentalities (such as securities issued by the Government National Mortgage Association (Ginnie Mae), the Federal National Mortgage Association (Fannie Mae), or the Federal Home Loan Mortgage Corporation (Freddie Mac)).
U.S. government securities are subject to market risk, interest rate risk and credit risk. Securities, such as those issued or guaranteed by Ginnie Mae or the U.S. Treasury, that are backed by the full faith and credit of the United States are guaranteed only as to the timely payment of interest and principal when held to maturity and the market prices for such securities will fluctuate. Notwithstanding that these securities are backed by the full faith and credit of the United States, circumstances could arise that would prevent the payment of interest or principal. This would result in losses to the Fund. Securities issued or guaranteed by U.S. government related organizations, such as Fannie Mae and Freddie Mac, are not backed by the full faith and credit of the U.S. government and no assurance can be given that the U.S. government will provide financial support. Therefore, U.S. government related organizations may not have the funds to meet their payment obligations in the future. U.S. government securities include zero coupon securities, which tend to be subject to greater market risk than interest-paying securities of similar maturities.
Alternative Minimum Tax Risk. The Fund may invest in securities, the interest on which may be subject to the federal alternative minimum tax.
High Yield Securities Risk. The Fund may invest in securities and instruments of municipal issuers that are highly leveraged, less creditworthy or financially distressed. These investments (also
known as junk bonds) are considered to be speculative and are subject to greater risk of loss, greater sensitivity to economic changes, valuation difficulties and potential illiquidity.
In recent years, there has been a broad trend of weaker or less restrictive covenant protections in the high yield market. Among other things, under such weaker or less restrictive covenants, borrowers might be able to exercise more flexibility with respect to certain activities than borrowers who are subject to stronger or more protective covenants. For example, borrowers might be able to incur more debt, including secured debt, return more capital to shareholders, remove or reduce assets that are designated as collateral securing high yield securities, increase the claims against assets that are permitted against collateral securing high yield securities or otherwise manage their business in ways that could impact creditors negatively. In addition, certain privately held borrowers might be permitted to file less frequent, less detailed or less timely financial reporting or other information, which could negatively impact the value of the high yield securities issued by such borrowers.
Each of these factors might negatively impact the high yield instruments held by the Fund. No active trading market may exist for some instruments and certain investments may be subject to restrictions on resale. The inability to dispose of the Fund’s securities and other investments in a timely fashion could result in losses to the Fund. Because some instruments may have a more limited secondary market, liquidity and valuation risk may be more pronounced for the Fund. When instruments are prepaid, the Fund may have to reinvest in instruments with a lower yield or fail to recover additional amounts (i.e., premiums) paid for these instruments, resulting in an unexpected capital loss and/or a decrease in the amount of dividends and yield.
Mortgage-Related and Other Asset-Backed Securities Risk. Mortgage-related and asset-backed securities, including certain municipal housing authority obligations, are subject to certain other risks. The value of these securities will be influenced by the factors affecting the housing market and the assets underlying such securities. As a result, during periods of declining asset values, difficult or frozen credit markets, significant changes in interest rates, or deteriorating economic conditions, mortgage-related and asset-backed securities may decline in value, face valuation difficulties, become more volatile and/or become illiquid. These securities are also subject to prepayment and call risk. In periods of declining interest rates, the Fund may be subject to contraction risk which is the risk that borrowers will increase the rate at which they prepay the maturity value of mortgages and other obligations. When mortgages and other obligations are prepaid and when securities are called, the Fund may have to reinvest in securities with a lower yield or fail to recover additional amounts (i.e., premiums) paid for securities with higher interest rates, resulting in an unexpected capital loss and/or a decrease in the amount of dividends and yield. In periods of either rising or declining interest rates, the
38 | J.P. Morgan Municipal Bond Funds
Fund may be subject to extension risk which is the risk that the expected maturity of an obligation will lengthen in duration due to a decrease in prepayments. As a result, in certain interest rate environments, the Fund may exhibit additional volatility. Additionally, asset-backed, mortgage-related and mortgage-backed securities are subject to risks associated with their structure and the nature of the assets underlying the securities and the servicing of those assets. Certain asset-backed, mortgage-related and mortgage-backed securities may face valuation difficulties and may be less liquid than other types of asset-backed, mortgage-related and mortgage-backed securities, or debt securities.
Debt Securities and Other Callable Securities Risk. As part of its main investment strategy, the Fund invests in debt securities. The issuers of these securities and other callable securities may be able to repay principal in advance, especially when interest rates fall. Changes in prepayment rates can affect the return on investment and yield of these securities. When debt obligations are prepaid and when securities are called, the Fund may have to reinvest in securities with a lower yield. The Fund also may fail to recover additional amounts (i.e., premiums) paid for securities with higher interest rates, resulting in an unexpected capital loss.
Taxability Risk. The Fund’s investments in municipal securities rely on the opinion of the issuer’s bond counsel that the interest paid on those securities will not be subject to federal income tax. Tax opinions are generally provided at the time the municipal security is initially issued. However, after the Fund buys a security, the Internal Revenue Service may determine that a bond issued as tax-exempt should in fact be taxable and the Fund’s dividends with respect to that bond might be subject to federal income tax.
Zero-Coupon Bond Risk. The market value of a zero-coupon bond is generally more volatile than the market value of other fixed income securities with similar maturities that pay interest periodically. In addition, federal income tax law requires that the holder of a zero-coupon bond accrue a portion of the discount at which the bond was purchased as taxable income each year. The Fund may consequently have to dispose of portfolio securities under disadvantageous circumstances to generate cash to satisfy its requirement as a regulated investment company to distribute all of its net income (including non-cash income attributable to zero-coupon securities). These actions may reduce the assets to which the Fund’s expenses could otherwise be allocated and may reduce the Fund’s rate of return.
Transactions Risk. The Fund could experience a loss and its liquidity may be negatively impacted when selling securities to meet redemption requests. The risk of loss increases if the redemption requests are unusually large or frequent or occur in times of overall market turmoil or declining prices. Similarly, large purchases of Fund shares may adversely affect the Fund’s
performance to the extent that the Fund is delayed in investing new cash and is required to maintain a larger cash position than it ordinarily would.
General Market Risk. Economies and financial markets throughout the world are becoming increasingly interconnected, which increases the likelihood that events or conditions in one country or region will adversely impact markets or issuers in other countries or regions. Securities in the Fund’s portfolio may underperform in comparison to securities in general financial markets, a particular financial market or other asset classes due to a number of factors, including inflation (or expectations for inflation), deflation (or expectations for deflation), interest rates, global demand for particular products or resources, market instability, debt crises and downgrades, embargoes, tariffs, sanctions and other trade barriers, regulatory events, other governmental trade or market control programs and related geopolitical events. In addition, the value of the Fund’s investments may be negatively affected by the occurrence of global events such as war, terrorism, environmental disasters, natural disasters or events, country instability, and infectious disease epidemics or pandemics.
For example, the outbreak of COVID-19 has negatively affected economies, markets and individual companies throughout the world, including those in which the Fund invests. The effects of this pandemic to public health and business and market conditions, including, among other things, reduced consumer demand and economic output, supply chain disruptions and increased government spending, may continue to have a significant negative impact on the performance of the Fund’s investments, increase the Fund’s volatility, exacerbate pre-existing political, social and economic risks to the Fund, and negatively impact broad segments of businesses and populations. In addition, governments, their regulatory agencies, or self-regulatory organizations have taken or may take actions in response to the pandemic that affect the instruments in which the Fund invests, or the issuers of such instruments, in ways that could have a significant negative impact on the Fund’s investment performance. The duration and extent of COVID-19 and associated economic and market conditions and uncertainty over the long-term cannot be reasonably estimated at this time. The ultimate impact of COVID-19 and the extent to which the associated conditions impact a Fund will also depend on future developments, which are highly uncertain, difficult to accurately predict and subject to frequent changes.
Industry and Sector Focus Risk. At times the Fund may increase the relative emphasis of its investments in a particular industry or sector. The prices of securities of issuers in a particular industry or sector may be more susceptible to fluctuations due to changes in economic or business conditions, government regulations, availability of basic resources or supplies, or other events that affect that industry or sector more than securities of issuers in other industries and sectors. To the extent that the
July 1, 2022 | 39
JPMorgan New York Tax Free Bond Fund (continued)
Fund increases the relative emphasis of its investments in a particular industry or sector, its shares’ values may fluctuate in response to events affecting that industry or sector.
Investments in the Fund are not deposits or obligations of, or guaranteed or endorsed by, any bank and are not insured or guaranteed by the FDIC, the Federal Reserve Board or any other government agency.
You could lose money investing in the Fund.
The Fund’s Past Performance
This section provides some indication of the risks of investing in the Fund. The bar chart shows how the performance of the Fund’s Class R6 Shares has varied from year to year for the past ten calendar years. The table shows the average annual total returns over the past one year, five years and ten years. The table compares the Fund’s performance to the performance of the Bloomberg New York Intermediate (1-17 Year) Maturities Index. The performance of the Class R6 Shares prior to their inception are based on Class I Shares (which are not offered in this prospectus). The actual returns of the Class R6 Shares would be substantially similar to the performance of Class I Shares because the Fund is invested in the same group of securities and the annual returns would differ only to the extent that the Classes do not have the same expenses. Past performance (before and after taxes) is not necessarily an indication of how the Fund will perform in the future. Updated performance information is available by visiting www.jpmorganfunds.com or by calling 1-800-480-4111.
| YEAR-BY-YEAR RETURNS — CLASS R6 SHARES |

| Best Quarter |
1st quarter, 2019 |
2.49% |
| Worst Quarter |
4th quarter, 2016 |
-2.73% |
| The Fund’s year-to-date total return |
through |
3/31/22 |
was |
-5.11% |
. |
| AVERAGE ANNUAL TOTAL RETURNS (For periods ended December 31, 2021) | |||
| |
Past 1 Year |
Past 5 Years |
Past 10 Years |
| CLASS R6 SHARES |
|
|
|
| Return Before Taxes |
0.70% |
2.88% |
2.41% |
| Return After Taxes on Distributions |
0.68 |
2.88 |
2.34 |
| Return After Taxes on Distributions and Sale of Fund Shares |
1.21 |
2.80 |
2.49 |
| BLOOMBERG NEW YORK INTERMEDI- ATE (1-17 YEAR) MATURITIES INDEX (Reflects No Deduction for Fees, Expenses, or Taxes) |
1.17 |
3.32 |
2.90 |
After-tax returns are calculated using the historical highest individual federal marginal income tax rates and do not reflect the impact of state and local taxes. Actual after-tax returns depend on the investor’s tax situation and may differ from those shown, and the after-tax returns shown are not relevant to investors who hold their shares through tax-deferred arrangements such as 401(k) plans or individual retirement accounts.
Management
J.P. Morgan Investment Management Inc. (the adviser)
| Portfolio Manager |
Managed the Fund Since |
Primary Title with Investment Adviser |
| David Sivinski |
2005 |
Executive Director |
| Kevin M. Ellis |
2005 |
Managing Director |
Purchase and Sale of Fund Shares
Purchase minimums
| For Class R6 Shares |
|
| To establish an account |
$5,000,000 for Discretionary Accounts $5,000,000 for Institutional Investors $15,000,000 for Other Investors |
| To add to an account |
No minimum levels |
There is no minimum investment for other eligible Class R6 investors, as described in the “Investing with J.P. Morgan Funds – Choosing a Share Class – Eligibility” section.
In general, you may purchase or redeem shares on any business day:
•
Through your Financial Intermediary or the eligible retirement plan or college savings plan through which you invest in the Fund
•
By writing to J.P. Morgan Funds Services, P.O. Box 219143, Kansas City, MO 64121-9143
40 | J.P. Morgan Municipal Bond Funds
•
After you open an account, by calling J.P. Morgan Funds Services at 1-800-480-4111
Tax Information
The Fund’s distributions of interest on municipal bonds generally are not subject to federal income tax; however the Fund may distribute taxable dividends, including distributions of short-term capital gains, and long-term capital gains. In addition, interest on certain bonds may be subject to the federal alternative minimum tax. To the extent that the Fund’s distributions are derived from interest on bonds that are not exempt from applicable state and local taxes, such distributions will be subject to such state and local taxes. When your investment is in a 401(k) plan or other tax-advantaged investment plan, you may be subject to federal income tax on ordinary income or capital gains upon withdrawal from the tax-advantaged investment plan.
Payments to Broker-Dealers and Other Financial Intermediaries
If you purchase shares of the Fund through a broker-dealer or other financial intermediary (such as a bank), the Fund and its related companies may pay the financial intermediary for the sale of Fund shares and related services. These payments may create a conflict of interest by influencing the broker-dealer or financial intermediary and your salesperson to recommend the Fund over another investment. Ask your salesperson or visit your financial intermediary’s website for more information.
July 1, 2022 | 41
More About the Funds
Additional Information About the Funds’ Investment Strategies
The Funds are managed by J.P. Morgan Investment Management Inc. (JPMIM). The principal types of securities and the main strategies that each Fund currently anticipates using are summarized in its Risk/Return Summary. Additional information about some of each Fund’s main investment strategies are included below. Except as otherwise indicated, the strategies described below are principal investment strategies of a Fund. Where applicable, the following also identifies other strategies that are not anticipated to be main strategies of a Fund but that may become more important to a Fund’s management in the future.
Each Fund may also use other non-principal strategies that are not described herein but which are described in the Statement of Additional Information. Each Fund may utilize these investments and strategies to a greater or lesser degree in the future.
The frequency with which each Fund buys and sells securities will vary from year to year, depending on market conditions.
Each of the Funds
Each Fund’s Board of Trustees may change any of the investment policies (including its investment objective), other than such policies that are designated as fundamental, without shareholder approval.
Credit Quality: Certain Funds may invest all, or are required to invest a certain percentage, of their investments in investment grade securities or the unrated equivalent. Each of the Funds may invest at least a portion of their investments in below investment grade securities, while the High Yield Municipal Fund may invest all of its assets in below investment grade securities. Below investment grade securities are also called “high yield bonds”, “junk bonds” and “non-investment grade bonds.” These securities generally are rated in the fifth or lower rating categories (for example, the equivalent of BB+ or lower). These securities generally offer a higher yield than investment grade securities, but involve a higher degree of risk.
A security’s quality is determined at the time of purchase and securities that are rated investment grade or the unrated equivalent may be downgraded or decline in credit quality such that subsequently they would be deemed to be below investment grade. The adviser will consider such an event in determining whether a Fund should continue to hold the security and is not required to sell a security in the event of a downgrade. The Funds use the methodology described below to determine the credit quality of their investments.
For each Fund, investment grade securities are securities that have been determined to be investment grade (for example, the equivalent of BBB- or higher) based on ratings by the following NRSROs - Moody’s Investors Service Inc. (Moody’s), Standard & Poor’s Corporation (S&P) or Fitch Ratings (Fitch) and the following methodology. If all three of these NRSROs rate the security, the middle rating is used to determine whether the security is investment grade. If only two of the three NRSROs rate the security, the lower rating is used to determine whether the security is investment grade. If only one of the three NRSROs rates a security, that rating will be used to determine if the security is investment grade. If none of these NRSROs rate a security, the adviser must determine that it is of comparable quality to an investment grade security or a non-investment grade security, respectively, in order for such security to be treated as an investment grade or a non-investment grade security, respectively.
| FUNDAMENTAL INVESTMENT OBJECTIVES |
| An investment objective is fundamental if it cannot be changed without the consent of a majority of the outstanding shares of the Fund. The investment objectives for the Short-Intermediate Municipal Bond Fund, Sustainable Municipal Income Fund and Tax Free Bond Fund are fundamental. The investment objectives for the remaining Funds are non-fundamental and can be changed without the consent of a majority of the outstanding shares of that Fund. |
SUSTAINABLE MUNICIPAL INCOME FUND, SHORT-INTERMEDIATE MUNICIPAL BOND FUND, INTERMEDIATE TAX FREE BOND FUND AND NEW YORK TAX FREE BOND FUND
Average Weighted Maturity. These Funds have average weighted maturity requirements. Average weighted maturity is the average of all the current maturities (that is, the term of the securities) of the individual bonds in a Fund calculated so as to count most heavily those securities with the highest dollar value. Average weighted maturity is important to investors as an indication of a Fund’s sensitivity to changes in interest rates. Usually, the longer the average weighted maturity, the more fluctuation in share price you can expect. The terms “Intermediate,” “Short-Intermediate” or “Ultra-Short” in a Fund’s name refer to the average maturity the Fund maintains. Mortgage-related securities are subject to prepayment of principal, which can shorten the average weighted maturity of the Fund’s portfolio. Therefore, in the case of a Fund holding mortgage-backed securities, asset-backed securities and similar types of securities, the average weighted maturity is equivalent to its weighted average life. Weighted average life is the average weighted maturity of the cash flows in the securities held by the Fund given certain prepayment assumptions.
42 | J.P. Morgan Municipal Bond Funds
SHORT-INTERMEDIATE MUNICIPAL BOND FUND AND TAX FREE BOND FUND
The Funds may invest up to 20% of their assets in cash and cash equivalents. See Temporary Defensive and Cash Positions.
HIGH YIELD MUNICIPAL FUND
All of the Fund’s assets may be invested in municipal bonds, the interest on which may be subject to the federal alternative minimum tax for both individuals and corporations. Shareholders who are subject to the federal alternative minimum tax may have all or a portion of their income from the Fund subject to federal income tax. In addition, corporate shareholders may be required to take the interest on municipal bonds into account in determining their alternative minimum taxable income. Any capital gain distributed by the Fund generally will be taxable.
The Fund may invest in inverse floaters. An inverse floater is a derivative instrument, typically created by a trust that divides a municipal security into two securities, a short-term tax-exempt floating rate security (sometimes referred to as a “tender option bond”) and a long-term tax-exempt floating rate security (referred to as a “residual certificate” or “inverse floater”) that pays interest at rates that move in the opposite direction of the yield on the short-term floating rate security. The purchaser of a “tender option bond” has the right to tender the security periodically for repayment of the principal value. As short-term interest rates rise, inverse floaters produce less current income (and, in extreme cases, may pay no income) and as short-term interest rates fall, inverse floaters produce more current income.
To facilitate the creation of inverse floaters, the Fund may purchase a fixed-rate municipal security and subsequently transfer it to a broker-dealer (the sponsor), which deposits the municipal security in a trust. The trust issues the residual certificates and short-term floating rate securities. The trust documents enable the Fund to withdraw the underlying bond to unwind or “collapse” the trust (upon tendering the residual certificate and paying the value of the short-term bonds and certain other costs). The Fund may also purchase inverse floaters created by municipal issuers directly or by other parties that have deposited municipal bonds into a sponsored trust.
Additional Investment Strategies
Each of the Funds
Each Fund has flexibility to invest in derivatives and may use such instruments to manage duration, sector and yield curve exposure, credit and spread volatility and to respond to volatile market conditions. Derivatives, which are instruments that have a value based on another instrument, exchange rate or index, may also be used as substitutes for securities in which each Fund can invest. Although the use of derivatives is not a main strategy of each Fund, each Fund may use futures contracts, options and swaps in connection with its principal strategies in order to hedge various investments, for risk management purposes and/or to increase the Fund’s income or gain to the Fund.
Each Fund may invest in shares of exchange-traded funds (ETFs), affiliated money market funds and other investment companies. ETFs, which are pooled investment vehicles whose ownership interests are purchased and sold on a securities exchange, may be passively or actively managed. Passively managed ETFs generally seek to track the performance of a particular market index, including broad-based market indexes, as well as indexes relating to particular sectors, markets, regions or industries. Actively managed ETFs do not seek to track the performance of a particular market index. Ordinarily, a Fund must limit its investments in a single non-affiliated ETF to 5% of its total assets and in all non-affiliated ETFs to 10% of its total assets. The Securities and Exchange Commission has issued exemptive orders to many ETFs that currently allow any fund investing in such ETFs to disregard these 5% and 10% limitations, subject to certain conditions. If a Fund invests in ETFs that have received such exemptive orders, it may invest any amount of its total assets in a single ETF or in multiple ETFs. ETFs that are not structured as investment companies as defined in the Investment Company Act of 1940 are not subject to these percentage limitations. The price movement of an index-based ETF may not track the underlying index and may result in a loss. In addition, ETFs may trade at a price above (premium) or below (discount) their net asset value, especially during periods of significant market volatility or stress, causing investors to pay or receive significantly more or less than the value of the ETF’s underlying portfolio when they purchase or sell their ETF shares, respectively.
Short-Intermediate Municipal Bond Fund
The adviser buys and sells securities and investments for the Fund based on its view of individual securities and market sectors. Taking a long-term approach, the adviser looks for individual fixed income investments that it believes will perform well over market cycles. The adviser is value oriented and makes decisions to purchase and sell individual securities and instruments after performing a risk/reward analysis that includes an evaluation of interest rate risk, credit risk, duration, liquidity and the complex legal and technical structure of the transaction. The adviser also integrates financially material environmental, social and governance (“ESG”) factors as part of the Fund’s investment process (“ESG Integration”). ESG Integration is the systematic inclusion of ESG issues in
July 1, 2022 | 43
More About the Funds (continued)
investment analysis and investment decisions. In applying ESG Integration in the evaluation of individual municipal issuers, the adviser seeks to assess the impact of environmental, social and governance factors on certain issuers in the universe in which the Fund may invest. The adviser’s assessment is based on an analysis of key opportunities and risks across sectors to identify financially material issues on the Fund’s investments in municipal issues and ascertain key issues that merit engagement with municipal issuers. These assessments may not be conclusive and securities that may be negatively impacted by such factors may be purchased and retained by the Fund while the Fund may divest or not invest in securities that may be positively impacted by such factors.
Tax Free Bond Fund
The adviser buys and sells securities and investments for the Fund based on its view of individual securities and market sectors. Taking a long-term approach, the adviser looks for individual fixed income investments that it believes will perform well over market cycles. The adviser is value oriented and makes decisions to purchase and sell individual securities and instruments after performing a risk/reward analysis that includes an evaluation of interest rate risk, credit risk, duration, liquidity and the complex legal and technical structure of the transaction. The adviser also integrates financially material environmental, social and governance (“ESG”) factors as part of the Fund’s investment process (“ESG Integration”). ESG Integration is the systematic inclusion of ESG issues in investment analysis and investment decisions. In applying ESG Integration in the evaluation of individual municipal issuers, the adviser seeks to assess the impact of environmental, social and governance factors on certain issuers in the universe in which the Fund may invest. The adviser’s assessment is based on an analysis of key opportunities and risks across sectors to identify financially material issues on the Fund’s investments in municipal issues and ascertain key issues that merit engagement with municipal issuers. These assessments may not be conclusive and securities that may be negatively impacted by such factors may be purchased and retained by the Fund while the Fund may divest or not invest in securities that may be positively impacted by such factors.
Ultra-Short Municipal Fund
The adviser buys and sells securities and investments for the Fund based on its view of individual securities and market sectors. The adviser looks for individual fixed income investments that it believes will perform well over market cycles. The adviser is value oriented and makes decisions to purchase and sell individual securities and instruments after performing a risk/reward analysis that includes an evaluation of interest rate risk, credit risk, duration, liquidity and the legal and technical structure of the transaction. The adviser also integrates financially material environmental, social and governance (“ESG”) factors as part of the Fund’s investment process (“ESG Integration”). ESG Integration is the systematic inclusion of ESG issues in investment analysis and investment decisions. In applying ESG Integration in the evaluation of individual municipal issuers, the adviser seeks to assess the impact of environmental, social and governance factors on certain issuers in the universe in which the Fund may invest. The adviser’s assessment is based on an analysis of key opportunities and risks across sectors to identify financially material issues on the Fund’s investments in municipal issues and ascertain key issues that merit engagement with municipal issuers. These assessments may not be conclusive and securities that may be negatively impacted by such factors may be purchased and retained by the Fund while the Fund may divest or not invest in securities that may be positively impacted by such factors.
California Tax Free Bond Fund
The adviser buys and sells securities and investments for the Fund based on its view of individual securities and market sectors. Taking a long-term approach, the adviser looks for individual fixed income investments that it believes will perform well over market cycles. The adviser is value oriented and makes decisions to purchase and sell individual securities and instruments after performing a risk/reward analysis that includes an evaluation of interest rate risk, credit risk, duration, liquidity and the complex legal and technical structure of the transaction. The adviser also integrates financially material environmental, social and governance (“ESG”) factors as part of the Fund’s investment process (“ESG Integration”). ESG Integration is the systematic inclusion of ESG issues in investment analysis and investment decisions. In applying ESG Integration in the evaluation of individual municipal issuers, the adviser seeks to assess the impact of environmental, social and governance factors on certain issuers in the universe in which the Fund may invest. The adviser’s assessment is based on an analysis of key opportunities and risks across sectors to identify financially material issues on the Fund’s investments in municipal issues and ascertain key issues that merit engagement with municipal issuers. These assessments may not be conclusive and securities that may be negatively impacted by such factors may be purchased and retained by the Fund while the Fund may divest or not invest in securities that may be positively impacted by such factors.
High Yield Municipal Fund
The adviser buys and sells securities and investments for the Fund based on its view of individual securities and market sectors. Taking a long-term approach, the adviser primarily looks for individual fixed income investments that it believes will perform well over market cycles. The adviser is value oriented and makes investment decisions after performing a risk/reward analysis that includes an evaluation of interest rate risk, credit risk, duration, liquidity, any security pledge, and a review of the security’s attributes, such as
44 | J.P. Morgan Municipal Bond Funds
the coupon, maturity, and any redemption and tender provisions. The adviser also factors in the overall investment strategy of the Fund, including its duration and its credit strategy, as well as the adviser’s interest rate outlook. The adviser also integrates financially material environmental, social and governance (“ESG”) factors as part of the Fund’s investment process (“ESG Integration”). ESG Integration is the systematic inclusion of ESG issues in investment analysis and investment decisions. In applying ESG Integration in the evaluation of individual municipal issuers, the adviser seeks to assess the impact of environmental, social and governance factors on certain issuers in the universe in which the Fund may invest. The adviser’s assessment is based on an analysis of key opportunities and risks across sectors to identify financially material issues on the Fund’s investments in municipal issues and ascertain key issues that merit engagement with municipal issuers. These assessments may not be conclusive and securities that may be negatively impacted by such factors may be purchased and retained by the Fund while the Fund may divest or not invest in securities that may be positively impacted by such factors.
The Fund may invest in loan assignments and participations (Loans). Loans will typically consist of senior secured floating rate loans, but may also include unsecured loans, second lien loans or more junior and bridge loans as well as commitments to purchase loans. Loans may be issued by obligors in the U.S. or in foreign or emerging markets. When the Fund acquires a loan assignment, the Fund typically will have a direct contractual relationship with the obligor; provided, however, the Fund may only be able to enforce its rights through an administrative agent. When the Fund acquires a loan participation, the Fund typically enters into a contractual relationship with the third party selling such participations, but not the borrower. As a result, the Fund assumes the credit risk of the seller of the loan participation and any other parties interpositioned between the Fund and the borrower. Under a loan participation, the Fund may have no direct rights to enforce the terms of the loan against the borrower. The Fund may not benefit directly from the collateral supporting the loan in which it has purchased the loan participations or assignments.
The Fund may invest in municipal mortgage-backed and asset-backed securities and municipal housing authority obligations. The Fund may also invest in bank obligations.
Intermediate Tax Free Bond Fund
The adviser buys and sells securities and investments for the Fund based on its view of individual securities and market sectors. Taking a long-term approach, the adviser looks for individual fixed income investments that it believes will perform well over market cycles. The adviser is value oriented and makes decisions to purchase and sell individual securities and instruments after performing a risk/reward analysis that includes an evaluation of interest rate risk, credit risk, duration, liquidity and the complex legal and technical structure of the transaction. The adviser also integrates financially material environmental, social and governance (“ESG”) factors as part of the Fund’s investment process (“ESG Integration”). ESG Integration is the systematic inclusion of ESG issues in investment analysis and investment decisions. In applying ESG Integration in the evaluation of individual municipal issuers, the adviser seeks to assess the impact of environmental, social and governance factors on certain issuers in the universe in which the Fund may invest. The adviser’s assessment is based on an analysis of key opportunities and risks across sectors to identify financially material issues on the Fund’s investments in municipal issues and ascertain key issues that merit engagement with municipal issuers. These assessments may not be conclusive and securities that may be negatively impacted by such factors may be purchased and retained by the Fund while the Fund may divest or not invest in securities that may be positively impacted by such factors.
New York Tax Free Bond Fund
The adviser buys and sells securities and investments for the Fund based on its view of individual securities and market sectors. Taking a long-term approach, the adviser looks for individual fixed income investments that it believes will perform well over market cycles. The adviser is value oriented and makes decisions to purchase and sell individual securities and instruments after performing a risk/reward analysis that includes an evaluation of interest rate risk, credit risk, duration, liquidity and the complex legal and technical structure of the transaction. The adviser also integrates financially material environmental, social and governance (“ESG”) factors as part of the Fund’s investment process (“ESG Integration”). ESG Integration is the systematic inclusion of ESG issues in investment analysis and investment decisions. In applying ESG Integration in the evaluation of individual municipal issuers, the adviser seeks to assess the impact of environmental, social and governance factors on certain issuers in the universe in which the Fund may invest. The adviser’s assessment is based on an analysis of key opportunities and risks across sectors to identify financially material issues on the Fund’s investments in municipal issues and ascertain key issues that merit engagement with municipal issuers. These assessments may not be conclusive and securities that may be negatively impacted by such factors may be purchased and retained by the Fund while the Fund may divest or not invest in securities that may be positively impacted by such factors.
Please note that the Funds also may use strategies that are not described in this section, but which are described in the “Investment Practices” section later in the prospectus and in the Statement of Additional Information.
July 1, 2022 | 45
More About the Funds (continued)
Investment Risks
There can be no assurance that the Funds will achieve their investment objectives.
The main risks associated with investing in each Fund are summarized in the “Risk/Return Summaries” at the front of this prospectus. In addition to each Fund’s main risks, each Fund may be subject to additional risks in connection with investments and strategies used by each Fund from time to time. The table below identifies main risks and some of the additional risks for each Fund.
An investment in a Fund or any other fund may not provide a complete investment program. The suitability of an investment in a Fund should be considered based on the investment objective, strategies and risks described in this prospectus, considered in light of all of the other investments in your portfolio, as well as your risk tolerance, financial goals and time horizons. You may want to consult with a financial advisor to determine if a Fund is suitable for you.
The Funds are subject to the main risks designated as such in the table below, any of which may adversely affect a Fund’s net asset value (NAV), performance and ability to meet its investment objective. Each Fund may also be subject to additional risks that are noted in the table below, as well as those that are not described herein but which are described in the Statement of Additional Information.
| |
Sustainable Municipal Income Fund |
Short-Intermediate Municipal Bond Fund |
Tax Free Bond Fund |
California Tax Free Bond Fund |
High Yield Municipal Fund |
Intermediate Tax Free Bond Fund |
New York Tax Free Bond Fund |
| Alternative Minimum Tax Risk |
• |
• |
• |
• |
• |
• |
• |
| Auction Rate Securities Risk |
○ |
• |
○ |
○ |
• |
○ |
○ |
| California Geographic Concentration Risk |
|
|
|
• |
|
|
|
| Credit Risk |
• |
• |
• |
• |
• |
• |
• |
| Debt Securities and Other Callable Securities Risk |
• |
• |
• |
• |
• |
• |
• |
| Derivatives Risk |
○ |
○ |
○ |
○ |
○ |
○ |
○ |
| Exchange-Traded Fund (ETF) and/or Other Investment Company Risk |
○ |
○ |
○ |
○ |
• |
○ |
○ |
| Floating and Variable Rate Securities Risk |
○ |
○ |
○ |
○ |
• |
○ |
○ |
| General Market Risk |
• |
• |
• |
• |
• |
• |
• |
| Government Securities Risk |
○ |
○ |
○ |
• |
• |
• |
• |
| High Yield Securities Risk |
• |
• |
• |
• |
• |
• |
• |
| Industry and Sector Focus Risk |
• |
• |
• |
• |
• |
• |
• |
| Interest Rate Risk |
• |
• |
• |
• |
• |
• |
• |
| Inverse Floating Rate Instrument Risk |
○ |
○ |
○ |
○ |
• |
○ |
○ |
| Loan Risk |
|
|
|
|
○ |
|
|
| Mortgage-Related and Other Asset-Backed Securities Risk |
• |
• |
• |
• |
○ |
• |
• |
| Municipal Obligations Risk |
• |
• |
• |
• |
• |
• |
• |
•
Main Risks
○
Additional Risks
46 | J.P. Morgan Municipal Bond Funds
| |
Sustainable Municipal Income Fund |
Short-Intermediate Municipal Bond Fund |
Tax Free Bond Fund |
California Tax Free Bond Fund |
High Yield Municipal Fund |
Intermediate Tax Free Bond Fund |
New York Tax Free Bond Fund |
| New York Geographic Concentration Risk |
|
|
|
|
|
|
• |
| Pay-In-Kind and Deferred Payment Securities Risk |
○ |
○ |
○ |
○ |
○ |
○ |
○ |
| Restricted Securities Risk |
• |
• |
○ |
○ |
• |
○ |
○ |
| Social or Environmental Investing Risk |
• |
|
|
|
|
|
|
| Structured Product Risk |
○ |
○ |
○ |
○ |
• |
○ |
○ |
| Taxability Risk |
• |
• |
• |
• |
• |
• |
• |
| Risk Associated with the Fund Holding Cash, Money Market Instruments and Other Short- Term Investments |
|
• |
• |
|
|
|
|
| Transactions and Liquidity Risk |
• |
• |
• |
• |
• |
• |
• |
| Cyber Security Risk |
○ |
○ |
○ |
○ |
○ |
○ |
○ |
| Volcker Rule Risk |
○ |
○ |
○ |
○ |
○ |
○ |
○ |
| Zero-Coupon Bond Risk |
• |
• |
• |
• |
• |
• |
• |
•
Main Risks
○
Additional Risks
Municipal Obligations Risk. The risk of a municipal obligation generally depends on the financial and credit status of the issuer. Changes in the financial health of a municipal issuer may make it difficult for the issuer to make interest and principal payments when due. A number of municipalities have had significant financial problems recently, and these and other municipalities could, potentially, continue to experience significant financial problems resulting from lower tax revenues and/or decreased aid from state and local governments in the event of an economic downturn. This could decrease the Funds’ income or hurt its ability to preserve capital and liquidity.
Under some circumstances, municipal obligations might not pay interest unless the state legislature or municipality authorizes money for that purpose. Some securities, including municipal lease obligations, carry additional risks. For example, they may be difficult to trade or interest payments may be tied only to a specific stream of revenue.
Municipal bonds may be more susceptible to downgrades or defaults during recessions or similar periods of economic stress. Factors contributing to the economic stress on municipalities may include lower property tax collections as a result of lower home values, lower sales tax revenue as a result of consumers cutting back spending and lower income tax revenue as a result of a higher unemployment rate. In addition, since some municipal obligations may be secured or guaranteed by banks and other institutions, the risk to a Fund could increase if the banking or financial sector suffers an economic downturn and/or if the credit ratings of the institutions issuing the guarantee are downgraded or at risk of being downgraded by a national rating organization. If such events were to occur, the value of the security could decrease or the value could be lost entirely, and it may be difficult or impossible for a Fund to sell the security at the time and the price that normally prevails in the market.
In addition to being downgraded, an insolvent municipality may file for bankruptcy. For example, Chapter 9 of the Bankruptcy Code provides a financially distressed municipality protection from its creditors while it develops and negotiates a plan for reorganizing its debts. “Municipality” is defined broadly by the Bankruptcy Code as a “political subdivision or public agency or instrumentality of a state” and may include various issuers of securities in which a Fund invests. The reorganization of a municipality’s debts may include
July 1, 2022 | 47
More About the Funds (continued)
extending debt maturities, reducing the amount of principal or interest, refinancing the debt or taking other measures, which may significantly affect the rights of creditors and the value of the securities issued by the municipality and the value of a Fund’s investments. Interest on municipal obligations, while generally exempt from federal income tax, may not be exempt from federal alternative minimum tax.
General Market Risk. Economies and financial markets throughout the world are becoming increasingly interconnected, which increases the likelihood that events or conditions in one country or region will adversely impact markets or issuers in other countries or regions. Securities in the Fund’s portfolio may underperform in comparison to securities in general financial markets, a particular financial market or other asset classes due to a number of factors, including inflation (or expectations for inflation), deflation (or expectations for deflation), interest rates, global demand for particular products or resources, market instability, debt crises and downgrades, embargoes, tariffs, sanctions and other trade barriers, regulatory events, other governmental trade or market control programs and related geopolitical events. In addition, the value of the Fund’s investments may be negatively affected by the occurrence of global events such as war, terrorism, environmental disasters, natural disasters or events, country instability, and infectious disease epidemics or pandemics.
For example, the outbreak of COVID-19 has negatively affected economies, markets and individual companies throughout the world, including those in which the Fund invests. The effects of this pandemic to public health and business and market conditions, including, among other things, reduced consumer demand and economic output, supply chain disruptions and increased government spending, may continue to have a significant negative impact on the performance of the Fund’s investments, increase the Fund’s volatility, exacerbate pre-existing political, social and economic risks to the Fund, and negatively impact broad segments of businesses and populations. In addition, governments, their regulatory agencies, or self-regulatory organizations have taken or may take actions in response to the pandemic that affect the instruments in which the Fund invests, or the issuers of such instruments, in ways that could have a significant negative impact on the Fund’s investment performance. The duration and extent of COVID-19 and associated economic and market conditions and uncertainty over the long-term cannot be reasonably estimated at this time. The ultimate impact of COVID-19 and the extent to which the associated conditions impact a Fund will also depend on future developments, which are highly uncertain, difficult to accurately predict and subject to frequent changes.
Interest Rate Risk. The Fund invests in debt securities that change in value based on changes in interest rates. If rates increase, the value of these investments generally declines. On the other hand, if rates fall, the value of these investments generally increases. Your investment will decline in value if the value of these investments decreases. Securities with greater interest rate sensitivity and longer maturities generally are subject to greater fluctuations in value. Many factors can cause interest rates to rise. Some examples include central bank monetary policy, rising inflation rates and general economic conditions. The Fund may face a heightened level of interest rate risk due to certain changes or uncertainty in monetary policy.
Debt market conditions are highly unpredictable and some parts of the market are subject to dislocations. Beginning in March 2022, the Federal Reserve Board began increasing interest rates and has signaled the possibility of further increases. It is difficult to accurately predict the pace at which the Federal Reserve Board will increase interest rates any further, or the timing, frequency or magnitude of any such increases, and the evaluation of macro-economic and other conditions could cause a change in approach in the future. Any such changes could be sudden and could expose debt markets to significant volatility and reduced liquidity for Fund investments.
Credit Risk. There is a risk that issuers and/or a counterparty to a security, contract, repurchase agreement or other investment will not make payments when due or default completely on securities, repurchase agreements or other investments held by a Fund. The risk of defaults across issuers and/or counterparties increases in adverse market and economic conditions, including the conditions resulting from the COVID-19 pandemic. Such defaults could result in losses to the Fund. In addition, the credit quality of securities held by a Fund may be lowered if an issuer’s or a counterparty’s financial condition changes. Lower credit quality may lead to greater volatility in the price of a security and in shares of a Fund. Lower credit quality also may affect liquidity and make it difficult for a Fund to sell the security. Although U.S. government securities issued directly by the U.S. government are guaranteed by the U.S. Treasury, other U.S. government securities issued by an agency or instrumentality of the U.S. government may not be. No assurance can be given that the U.S. government would provide financial support to its agencies or instrumentalities if not required to do so by law. Prices of the Fund’s investments may be adversely affected if any of the issuers or counterparties it is invested in are subject to an actual or perceived deterioration in their credit quality. Credit spreads may increase, which may reduce the market values of the Fund’s securities. Credit spread risk is the risk that economic and market conditions or any actual or perceived credit deterioration may lead to an increase in the credit spreads (i.e., the difference in yield between two securities of similar maturity but different credit quality) and a decline in price of the issuer’s securities.
48 | J.P. Morgan Municipal Bond Funds
Floating and Variable Rate Securities Risk. Floating and variable rate securities provide for a periodic adjustment in the interest rate paid on the securities. The rate adjustment intervals may be regular and range from daily up to annually, or may be based on an event, such as a change in the prime rate. Floating and variable rate securities may be subject to greater liquidity risk than other debt securities, meaning that there may be limitations on the Fund’s ability to sell the securities at any given time. Such securities also may lose value.
Structured Product Risk. Structured products, such as tender option bonds, involve structural complexities and potential risks that may not be present where a municipal security is owned directly. These enhanced risks may include additional counter-party risk (the risk that the counterparty will not fulfill its contractual obligations) and call risk (the risk that the instruments will be called and the proceeds may need to be reinvested). Additionally, an active trading market for such instruments may not exist. To the extent that a structured product provides a put, the Fund may receive a lower interest rate in return for such feature and will be subject to the risk that the put provider will be unable to honor the put feature (purchase the security). Finally, short-term municipal or tax-exempt structured products may present tax issues not presented by investments in other short-term municipal or tax-exempt securities. These issues might be resolved in a manner adverse to the Fund.
Alternative Minimum Tax Risk. A Fund may invest all of its assets in municipal bonds, the interest on which may be subject to the federal alternative minimum tax. Shareholders who are subject to the federal alternative minimum tax may have all or a portion of their income from the Fund subject to federal income tax. In addition, corporate shareholders will, with limited exceptions, be required to take the interest on municipal bonds into account in determining their alternative minimum taxable income. Any capital gain distributed by a Fund may be taxable.
Restricted Securities Risk.Restricted securities are securities that cannot be offered for public resale unless registered under the applicable securities laws or that have a contractual restriction that prohibits or limits their resale. Restricted securities include private placement securities that have not been registered under the applicable securities laws, such as Rule 144A securities, and securities of U.S. and non-U.S. issuers that are issued pursuant to Regulation S. Private placements are generally subject to strict restrictions on resale. Restricted securities may not be listed on an exchange and may have no active trading market. Restricted securities may be illiquid. The Fund may be unable to sell a restricted security on short notice or may be able to sell them only at a price below current value. It may be more difficult to determine a market value for a restricted security. Also, the Fund may get only limited information about the issuer of a restricted security, so it may be less able to predict a loss. In addition, if Fund management receives material non-public information about the issuer, the Fund may as a result be unable to sell the securities. Certain restricted securities may involve a high degree of business and financial risk and may result in substantial losses.
Mortgage-Related and Other Asset-Backed Securities Risk. Mortgage-related and asset-backed securities, including certain municipal housing authority obligations, differ from conventional debt securities and are subject to certain additional risks because principal is paid back over the life of the security rather than at maturity. The value of these securities will be influenced by the factors affecting the housing market and the assets underlying such securities. As a result, during periods of declining asset values, difficult or frozen credit markets, significant changes in interest rates, or deteriorating economic conditions, mortgage-related and asset-backed securities may decline in value, face valuation difficulties, become more volatile and/or become illiquid. These securities are also subject to prepayment and call risk. Gains and losses associated with prepayments will increase/decrease the income available for distribution by the Fund and the Fund’s yield. In periods of declining interest rates, the Fund may be subject to contraction risk which is the risk that borrowers will increase the rate at which they prepay the maturity value of mortgages and other obligations. When mortgages and other obligations are prepaid and when securities are called, the Fund may have to reinvest in securities with a lower yield or fail to recover additional amounts (i.e., premiums) paid for securities with higher interest rates, resulting in an unexpected capital loss and/or a decrease in the amount of dividends and yield. In periods of either rising or declining interest rates, the Fund may be subject to extension risk which is the risk that the expected maturity of an obligation will lengthen in duration due to a decrease in prepayments. As a result, in certain interest rate environments, the Fund may exhibit additional volatility. The structure of some of these securities may be complex and there may be less available information than for other types of debt securities. Additionally, asset-backed, mortgage-related and mortgage-backed securities are subject to risks associated with their structure and the nature of the assets underlying the securities and the servicing of those assets. Certain asset-backed, mortgage-related and mortgage-backed securities may face valuation difficulties and may be less liquid than other types of asset-backed, mortgage-related and mortgage-backed securities, or debt securities.
The mortgage loans underlying privately issued mortgage-related securities may not be subject to the same underwriting requirements for the underlying mortgages that are applicable to those mortgage-related securities that have government or government-sponsored entity guarantees. As a result, the mortgage loans underlying privately issued mortgage-related securities may have less favorable collateral, credit risk or other underwriting characteristics than government or government-sponsored mortgage-related securities and have wider variances in a number of terms including interest rate, term, size, purpose and borrower characteristics. In addition, certain mortgage-related securities which may include loans that originally qualified under standards established by
July 1, 2022 | 49
More About the Funds (continued)
government-sponsored entities (for example, certain REMICs that include Fannie Mae mortgages) are not considered as government securities for purposes of a Fund’s investment strategies or policies. There is no government or government-sponsored guarantee for such privately issued investments.
A Fund may invest in collateralized mortgage obligations (CMOs). CMOs are debt obligations collateralized by mortgage loans or mortgage pass-through securities. CMOs are issued in multiple classes, and each class may have its own interest rate and/or final payment date. A class with an earlier final payment date may have certain preferences in receiving principal payments or earning interest. As a result, the value of some classes in which the Fund invests may be more volatile and may be subject to higher risk of non-payment.
The values of interest-only (IO) and principal-only (PO) mortgage-backed securities are more volatile than other types of mortgage-related securities. They are very sensitive not only to changes in interest rates, but also to the rate of prepayments. A rapid or unexpected increase in prepayments can significantly depress the price of interest-only securities, while a rapid or unexpected decrease could have the same effect on principal-only securities. In addition, because there may be a drop in trading volume, an inability to find a ready buyer, or the imposition of legal restrictions on the resale of securities, these instruments may be illiquid.
Zero-Coupon, Pay-In-Kind and Deferred Payment Securities Risk. The market value of a zero-coupon bond is generally more volatile than the market value of other fixed income securities with similar maturities that pay interest periodically. In addition, federal income tax law requires that the holder of a zero-coupon bond accrue a portion of the discount at which the bond was purchased as taxable income each year, even though the holder receives no interest payments on the bond during the year. The Fund must distribute substantially all of its net income (including non-cash income attributable to zero-coupon bonds) to its shareholders each year to maintain its status as a regulated investment company and to eliminate tax at the Fund level. Accordingly, such accrued discount must be taken into account in determining the amount of taxable distributions to shareholders. The Fund may consequently have to dispose of portfolio securities under disadvantageous circumstances to generate cash to satisfy such distribution requirements. These actions may reduce the assets to which the Fund’s expenses could otherwise be allocated and may reduce the Fund’s rate of return.
The market value of a zero-coupon, pay-in-kind or deferred payment security is generally more volatile than the market value of interest-paying securities, and is more likely to respond to a greater degree to changes in interest rates and credit quality than other fixed income securities with similar maturities that pay interest periodically. In addition, federal income tax law requires that the holder of a zero-coupon bond accrue a portion of the discount at which the bond was purchased as taxable income each year, even though the holder receives no interest payment on the bond during the year. Each Fund must distribute substantially all of its net income (including non-cash income attributable to zero-coupon bonds) to its shareholders each year to maintain its status as a regulated investment company and to eliminate tax at the Fund level. Accordingly, such accrued discount must be taken into account in determining the amount of taxable distributions to shareholders. A Fund may consequently have to dispose of portfolio securities under disadvantageous circumstances to generate cash to satisfy such distribution requirements. These actions may reduce the assets to which the Fund’s expenses could otherwise be allocated and may reduce the Fund’s rate of return.
In addition, (1) the higher yields and interest rates on certain pay-in-kind securities (PIK) reflect the payment deferral and increased credit risk associated with such instruments and such investments may represent a significantly higher credit risk than coupon loans; (2) PIK securities may have higher price volatility because their continuing accruals require continuing judgments about the collectability of the deferred payments and the value of any associated collateral; (3) PIK interest has the effect of generating investment income and (4) the deferral of PIK interest may also reduce the loan-to-value ratio at a compounding rate.
Risk Associated with the Fund Holding Cash, Money Market Instruments and Other Short-Term Investments. The Fund will, at times, hold assets in cash, money market instruments and other short-term investments, which may hurt the Fund’s performance. These positions may also subject the Fund to additional risks and costs.
Transactions and Liquidity Risk. A Fund could experience a loss when selling securities to meet redemption requests and its liquidity may be negatively impacted. The risk of loss increases if the redemption requests are large or frequent, occur in times of overall market turmoil or declining prices for the securities sold, or when the securities a Fund wishes to, or is required to, sell are illiquid. To the extent a large proportion of shares of a Fund are held by a small number of shareholders (or a single shareholder) including funds or accounts over which the adviser or its affiliates have investment discretion, the Fund is subject to the risk that these shareholders will purchase or redeem Fund shares in large amounts rapidly or unexpectedly, including as a result of an asset allocation decision made by the adviser or its affiliates. In addition to the other risks described in this section, these transactions could adversely affect the ability of the Fund to conduct its investment program. A Fund may be unable to sell illiquid securities at its desired time or price or the price at which the securities have been valued for purposes of the Fund’s net asset value. Illiquidity can be caused by a drop in overall market trading volume, an inability to find a ready buyer, or legal restrictions on the securities’ resale. Other market participants may be attempting to sell debt securities at the same time as a Fund, causing downward pricing pressure and contributing to illiquidity. The capacity for bond dealers to engage in trading or “make a market” in debt securities has not kept
50 | J.P. Morgan Municipal Bond Funds
pace with the growth of bond markets. Liquidity and valuation risk may be magnified in a rising interest rate environment, when credit quality is deteriorating or in other circumstances where investor redemptions from fixed income mutual funds may be higher than normal. Certain securities that were liquid when purchased may later become illiquid, particularly in times of overall economic distress. Similarly, large purchases of Fund shares may adversely affect the Fund’s performance to the extent that the Fund is delayed in investing new cash and is required to maintain a larger cash position than it ordinarily would. Large redemptions also could accelerate the realization of capital gains, increase a Fund’s transaction costs and impact a Fund’s performance.
Industry and Sector Focus Risk. At times the Fund may increase the relative emphasis of its investments in a particular industry or sector. The prices of securities of issuers in a particular industry or sector may be more susceptible to fluctuations due to changes in economic or business conditions, government regulations, availability of basic resources or supplies, or other events that affect that industry or sector more than securities of issuers in other industries and sectors. To the extent that the Fund increases the relative emphasis of its investments in a particular industry or sector, the value of a Fund’s shares may fluctuate in response to events affecting that industry or sector.
Debt Securities and Other Callable Securities Risk. As part of its main investment strategy, each Fund invests in debt securities. The issuers of these securities and other callable securities may be able to repay principal in advance, especially when interest rates fall. Changes in prepayment rates can affect the return on investment and yield of these securities. When debt obligations are prepaid and when securities are called, a Fund may have to reinvest in securities with a lower yield. A Fund also may fail to recover additional amounts (i.e., premiums) paid for securities with higher interest rates, resulting in an unexpected capital loss.
Inverse Floating Rate Instrument Risk. The market value of an inverse floater residual certificate can be more volatile than that of a conventional fixed-rate bond having similar credit quality, maturity and redemption provisions. Inverse floater residual certificates entail a degree of leverage because the trust issues short-term securities in a ratio to the residual certificates with the underlying long-term bond providing collateral for the obligation to pay the principal value of the short-term securities if and when they are tendered. If a Fund has created the inverse floater by depositing a long-term bond into a trust, it may be required to provide additional collateral for the short-term securities if the value of the underlying bond deposited in the trust fails.
An inverse floater that has a higher degree of leverage is typically more volatile with respect to its price and income than an inverse floater having a lower degree of leverage. Under inverse floater arrangements, if the remarketing agent that offers the short-term securities for sale is unable to sell them, or if the holders tender (or put) them for repayment of principal and the remarketing agent is unable to remarket them, the remarketing agent may cause the trust to be collapsed, and in the case of floaters created by the Fund, the Fund will then be required to repay the principal amount of the tendered securities. During times of market volatility, illiquidity or uncertainty, the Fund could be required to sell other portfolio holdings at a disadvantageous time to raise cash to meet that obligation.
Because of the accounting treatment for inverse floaters created by the Fund’s transfer of a municipal bond to a trust, the Fund’s financial statements will reflect these transactions as “secured borrowings,” which affects the Fund’s Statements of Assets and Liabilities and Operations, expense ratios and the Schedule of Investments will include the underlying municipal bond. The Fund’s annual fund operating expenses will include certain expenses and fees related to the Fund’s investments. Some of those expenses may be liabilities with respect to interest paid on short-term floating rate notes issued by the trusts whose inverse floater certificates are held by the Fund. Under accounting rules, the Fund will also recognize additional income in an amount that directly corresponds to these expenses and, as a result the Fund’s net asset values per share and total returns will not be affected by these additional expenses.
Taxability Risk. The Fund’s investments in municipal securities rely on the opinion of the issuer’s bond counsel that the interest paid on those securities will not be subject to federal income tax. Tax opinions are generally provided at the time the municipal security is initially issued. However, after the Fund buys a security, the Internal Revenue Service may determine that a bond issued as tax-exempt should in fact be taxable and the Fund’s dividends with respect to that bond might be subject to federal income tax.
Social or Environmental Investing Risk. The JPMorgan Sustainable Municipal Income Fund’s investment in securities whose use of proceeds, in the Adviser’s opinion, provide positive social or environmental benefits could cause it to perform differently compared to funds that do not have such a policy. Investing in securities whose use of proceeds, in the Adviser’s opinion, provide positive social or environmental benefits may result in the Fund forgoing opportunities to buy certain securities when it might otherwise be advantageous to do so, or selling securities when it might be otherwise disadvantageous for it to do so. In addition, there is a risk that the municipal bonds identified by the Adviser’s use of proceeds determination do not operate as expected when addressing positive social or environmental benefits. The Adviser’s assessment of the positive social or environmental impact of a municipal bond’s proceeds is made at the time of purchase and the actual use of proceeds by the issuer could vary over time, which could cause the Fund to be invested in bonds that do not comply with the Fund’s approach towards considering social or environmental characteristics. The factors that the Adviser considers in evaluating whether a security has positive social or environmental benefits may change over time. There are significant differences in interpretations of what it means to promote positive social or
July 1, 2022 | 51
More About the Funds (continued)
environmental benefits. While the Adviser believes its definitions are reasonable, the portfolio decisions it makes may differ with other’s views. In making investment decisions, the Adviser relies on information and third-party data that could be incomplete or erroneous, which could cause the Adviser to incorrectly assess a municipal bond’s positive social or environmental impact.
High Yield Securities Risk. The Fund invests in instruments including junk bonds, Loans and instruments of municipal issuers that are highly leveraged, less creditworthy or financially distressed. These investments are considered to be speculative and may be subject to greater risk of loss, greater sensitivity to economic changes, valuation difficulties and potential illiquidity. Such investments are subject to additional risks including subordination to other creditors, no collateral or limited rights in collateral, lack of a regular trading market, extended settlement periods, liquidity risks, prepayment risks, potentially less protections under the federal securities laws and lack of publicly available information. High yield securities and Loans that are deemed to be liquid at the time of purchase may become illiquid.
In recent years, there has been a broad trend of weaker or less restrictive covenant protections in the high yield market. Among other things, under such weaker or less restrictive covenants, borrowers might be able to exercise more flexibility with respect to certain activities than borrowers who are subject to stronger or more protective covenants. For example, borrowers might be able to incur more debt, including secured debt, return more capital to shareholders, remove or reduce assets that are designated as collateral securing high yield securities, increase the claims against assets that are permitted against collateral securing high yield securities or otherwise manage their business in ways that could impact creditors negatively. In addition, certain privately held borrowers might be permitted to file less frequent, less detailed or less timely financial reporting or other information, which could negatively impact the value of the high yield securities issued by such borrowers. Each of these factors might negatively impact the high yield instruments held by the Fund.
No active trading market may exist for some instruments and certain investments may be subject to restrictions on resale. In addition, the settlement period for Loans is uncertain as there is no standardized settlement schedule applicable to such investments. The inability to dispose of the Fund’s securities and other investments in a timely fashion could result in losses to the Fund. Because some instruments may have a more limited secondary market, liquidity risk is more pronounced for the Fund than for funds that invest primarily in other types of fixed income instruments or equity securities. When bonds and other instruments securities are prepaid, the Fund may have to reinvest in instruments with a lower yield or fail to recover additional amounts (i.e., premiums) paid for these instruments resulting in an unexpected capital loss and/or a decrease in the amount of dividends and yield.
Government Securities Risk. The Fund invests in securities issued or guaranteed by the U.S. government or its agencies and instrumentalities (such as securities issued by the Government National Mortgage Association (Ginnie Mae), the Federal National Mortgage Association (Fannie Mae) or the Federal Home Loan Mortgage Corporation (Freddie Mac)). U.S. government securities are subject to market risk, interest rate risk and credit risk. Securities, such as those issued or guaranteed by Ginnie Mae or the U.S. Treasury, that are backed by the full faith and credit of the United States are guaranteed only as to the timely payment of interest and principal when held to maturity and the market prices for such securities will fluctuate. Notwithstanding that these securities are backed by the full faith and credit of the United States, circumstances could arise that would prevent the payment of interest or principal. This would result in losses to the Fund. Securities issued or guaranteed by U.S. government related organizations, such as Fannie Mae and Freddie Mac, are not backed by the full faith and credit of the U.S. government and no assurance can be given that the U.S. government will provide financial support. Therefore, U.S. government related organizations may not have the funds to meet their payment obligations in the future. U.S. government securities include zero coupon securities, which tend to be subject to greater market risk than interest-paying securities of similar maturities.
California Geographic Concentration Risk. Because the JPMorgan California Tax Free Bond Fund primarily invests in issuers in the State of California, its political subdivisions, authorities and agencies, its performance will be affected by the fiscal and economic health of that state and its municipalities. Provisions of the California Constitution and state statutes that limit the taxing and spending authority of California’s governmental entities may impair the ability of California issuers to pay principal and/or interest on their obligations. While California’s economy is broad, it does have major concentrations in high technology, manufacturing, entertainment, agriculture, tourism, construction and services, and may be sensitive to economic problems affecting those industries.
Any deterioration of California’s fiscal situation could increase the risk of investing in California municipal securities, including the risk of potential issuer default, and could heighten the risk that the prices of California municipal securities, and the Fund’s net asset value and/or yield, will experience greater volatility. Furthermore, any such deterioration could result in a downgrade of the credit rating of an issuer of California municipal securities. Future downgrades could reduce the market value of the securities held by the Fund, which could adversely affect the Fund’s performance.
New York Geographic Concentration Risk. Because the JPMorgan New York Tax Free Bond Fund invests primarily in municipal obligations issued by the State of New York, New York City, their political subdivisions, authorities and agencies, its performance will be affected by the fiscal and economic health of that state, the city and their political subdivisions. Additionally, as the nation’s financial capital, New York’s and New York City’s economy is heavily dependent on the financial sector and may be sensitive to
52 | J.P. Morgan Municipal Bond Funds
economic problems affecting the sector. New York and New York City also face a particularly large degree of uncertainty from interest rate risk and equity market volatility. The New York and New York City economy tends to be more sensitive to monetary policy actions and to movements in the national and world economies than the economies of other states or cities.
Any deterioration of New York’s fiscal situation could increase the risk of investing in New York municipal securities, including the risk of potential issuer default, and could heighten the risk that the prices of New York municipal securities, and the Fund’s net asset value and/or yield, will experience greater volatility. Furthermore, any such deterioration could result in a downgrade of the credit rating of an issuer of New York municipal securities. Future downgrades could reduce the market value of the securities held by the Fund, which could adversely affect the Fund’s performance.
Derivatives Risk. A Fund may use derivatives in connection with its investment strategies. Derivatives may be riskier than other types of investments because they may be more sensitive to changes in economic or market conditions than other types of investments and could result in losses that significantly exceed a Fund’s original investment. Derivatives are subject to the risk that changes in the value of a derivative may not correlate perfectly with the underlying asset, rate or index. The use of derivatives may not be successful, resulting in losses to the Fund and the cost of such strategies may reduce a Fund’s returns. Certain derivatives also expose the Fund to counterparty risk (which is the risk that the derivative counterparty will not fulfill its contractual obligations), and to the credit risk of the derivative counterparty. In addition, a Fund may use derivatives for non-hedging purposes, which increases the Fund’s potential for loss. Certain derivatives are synthetic instruments that attempt to replicate the performance of certain reference assets. With regard to such derivatives, the Fund does not have a claim on the reference assets and is subject to enhanced counterparty risk.
Investing in derivatives will result in a form of leverage. Leverage involves special risks. A Fund may be more volatile than if the Fund had not been leveraged because the leverage tends to exaggerate any effect on the value of the Fund’s portfolio securities. Registered investment companies are limited in their ability to engage in derivative transactions and are required to identify and earmark assets to provide asset coverage for derivative transactions.
The possible lack of a liquid secondary market for derivatives and the resulting inability of a Fund to sell or otherwise close a derivatives position could expose the Fund to losses and could make derivatives more difficult for the Fund to value accurately.
A Fund’s transactions in futures contracts, swaps and other derivatives could also affect the amount, timing and character of distributions to shareholders which may result in the Fund realizing more short-term capital gain and ordinary income subject to tax at ordinary income tax rates than it would if it did not engage in such transactions, which may adversely impact the Fund’s after-tax return.
| WHAT IS A DERIVATIVE? |
| Derivatives are securities or contracts (for example, futures and options) that derive their value from the performance of underlying assets or securities. |
Exchange-Traded Fund (ETF) and/or Other Investment Company Risk. A Fund may invest in shares of other investment companies and ETFs. Shareholders bear both their proportionate share of a Fund’s expenses and similar expenses of the underlying investment company or ETF when the Fund invests in shares of another investment company or ETF. A Fund is subject to the risks associated with the ETF’s or investment company’s investments. ETFs and companies that invest in commodities or currencies are subject to the risks associated with direct investments in commodities or currencies. The price and movement of an ETF or closed-end fund designed to track an index may not track the index and may result in a loss. In addition, closed-end funds that trade on an exchange often trade at a price below their net asset value (also known as a discount). Certain ETFs or closed-end funds traded on exchanges may be thinly traded and experience large spreads between the “ask” price quoted by a seller and the “bid” price offered by a buyer.
Loan Risk. The Fund may invest in Loans including Loans that are rated below investment grade. Like other high yield, corporate debt instruments, such Loans are subject to an increased risk of default in the payment of principal and interest as well as the other risks described under “Interest Rate Risk,”“Credit Risk” and “High Yield Securities Risk.” Although certain Loans are secured by collateral, the Fund could experience delays or limitations in realizing on such collateral or have its interest subordinated to other indebtedness of the obligor. Loans are vulnerable to market sentiment such that economic conditions or other events may reduce the demand for Loans and cause their value to decline rapidly and unpredictably. Although the Fund limits its investments in illiquid securities to no more than 15% of the Fund’s net assets at the time of purchase, Loans that are deemed to be liquid at the time of purchase may become illiquid. In recent years, there has been a broad trend of weaker or less restrictive covenant protections in the Loan market. Among other things, under such weaker or less restrictive covenants, borrowers might be able to exercise more flexibility with respect to certain activities than borrowers who are subject to stronger or more protective covenants. For example, borrowers might be able to incur more debt, including secured debt, return more capital to shareholders, remove or reduce assets that are designated as collateral securing Loans, increase the claims against assets that are permitted against collateral securing Loans or
July 1, 2022 | 53
More About the Funds (continued)
otherwise manage their business in ways that could impact creditors negatively. In addition, certain privately held borrowers might be permitted to file less frequent, less detailed or less timely financial reporting or other information, which could negatively impact the value of the Loans issued by such borrowers. Each of these factors might negatively impact the Loans held by a Fund. No active trading market may exist for some of the Loans and certain Loans may be subject to restrictions on resale. The inability to dispose of Loans in a timely fashion could result in losses to the Fund. In addition, the settlement period for Loans is uncertain as there is no standardized schedule applicable to such investments. Certain Loans may take more than seven days to settle. Because some Loans that the Fund invests in may have a more limited secondary market, liquidity and valuation risk is more pronounced for the Fund than for funds that invest primarily in other types of fixed income instruments or equity securities. Typically, Loans are not registered securities and are not listed on any national securities exchange. Consequently, there may be less public information available about the Fund’s investments and the market for certain Loans may be subject to irregular trading activity, wide bid/ask spreads and extended trade settlement periods. As a result, the Fund may be more dependent upon the analytical ability of its adviser.
When a Fund acquires a loan participation, the Fund typically enters into a contractual relationship with the lender or third party selling such participations, but not the borrower. As a result, the Fund assumes the credit risk of the seller of the loan participation and any other parties interpositioned between the Fund and the borrower. The Fund may not benefit directly from the collateral supporting the loan in which it has purchased the loan participations or assignments.
Affiliates of the adviser may participate in the primary and secondary market for Loans. Because of limitations imposed by applicable law, the presence of the adviser’s affiliates in the Loan market may restrict the Fund’s ability to acquire some Loans, affect the timing of such acquisition or affect the price at which the Loan is acquired. Also, because the adviser may wish to invest in the publicly traded securities of an obligor, it may not have access to material non-public information regarding the obligor to which other investors have access.
Loans are subject to prepayment risks. Gains and losses associated with prepayments will increase or decrease the Fund’s yield and the income available for distribution by the Fund. When Loans are prepaid, the Fund may have to reinvest in securities with a lower yield or fail to recover additional amounts (i.e. premiums) paid for Loans, resulting in an unexpected capital loss and/or a decrease in the amount of dividends and yields.
Cyber Security Risk. As the use of technology has become more prevalent in the course of business, the Funds have become more susceptible to operational and financial risks associated with cyber security, including: theft, loss, misuse, improper release, corruption and destruction of, or unauthorized access to, confidential or highly restricted data relating to a Fund and its shareholders; and compromises or failures to systems, networks, devices and applications relating to the operations of a Fund and its service providers. Cyber security risks may result in financial losses to a Fund and its shareholders; the inability of a Fund to transact business with its shareholders; delays or mistakes in the calculation of a Fund’s NAV or other materials provided to shareholders; the inability to process transactions with shareholders or other parties; violations of privacy and other laws; regulatory fines, penalties and reputational damage; and compliance and remediation costs, legal fees and other expenses. A Fund’s service providers (including, but not limited to, the adviser, any sub-advisers, administrator, transfer agent, and custodian or their agents), financial intermediaries, companies in which a Fund invests and parties with which a Fund engages in portfolio or other transactions also may be adversely impacted by cyber security risks in their own businesses, which could result in losses to a Fund or its shareholders. While measures have been developed which are designed to reduce the risks associated with cyber security, there is no guarantee that those measures will be effective, particularly since the Funds do not directly control the cyber security defenses or plans of their service providers, financial intermediaries and companies in which they invest or with which they do business.
Volcker Rule Risk. Pursuant to section 619 of the Dodd-Frank Wall Street Reform and Consumer Protection Act and certain rules promulgated thereunder known as the Volcker Rule, if the adviser and/or its affiliates own 25% or more of the outstanding ownership interests of a Fund after the permitted seeding period from the implementation of a Fund’s investment strategy, a Fund could be subject to restrictions on trading that would adversely impact the Fund’s ability to execute its investment strategy. Generally, the permitted seeding period is three years from the implementation of a Fund’s investment strategy. As a result, the adviser and/or its affiliates may be required to reduce their ownership interests in a Fund at a time that is sooner than would otherwise be desirable, which may result in the Fund’s liquidation or, if the Fund is able to continue operating, may result in losses, increased transaction costs and adverse tax consequences as a result of the sale of portfolio securities.
Auction Rate Securities Risk. The auction rate municipal securities the Fund will purchase will typically have a long-term nominal maturity for which the interest rate is regularly reset through a “Dutch” auction. The interest rate set by the auction is the lowest interest rate that covers all securities offered for sale. While this process is designed to permit auction rate securities to be traded at par value, there is a risk that an auction will fail due to insufficient demand for the securities, which may adversely affect the liquidity and price of auction rate securities. Moreover, between auctions, there may be no secondary market for these securities, and sales conducted on a secondary market may not be on terms favorable to the seller. Thus, with respect to liquidity and price stability, auction rate securities may differ substantially from cash equivalents, notwithstanding the frequency of auctions and the credit quality of the security.
54 | J.P. Morgan Municipal Bond Funds
For more information about risks associated with the types of investments that a Fund purchases, please read the “Risk/Return Summary” at the front of this prospectus and “Investment Practices” section later in the prospectus, and the Statement of Additional Information.
Conflicts of Interest
An investment in a Fund is subject to a number of actual or potential conflicts of interest. For example, the Adviser and/or its affiliates provide a variety of different services to a Fund, for which the Fund compensates them. As a result, the Adviser and/or its affiliates have an incentive to enter into arrangements with a Fund, and face conflicts of interest when balancing that incentive against the best interests of a Fund. The Adviser and/or its affiliates also face conflicts of interest in their service as investment adviser to other clients, and, from time to time, make investment decisions that differ from and/or negatively impact those made by the Adviser on behalf of a Fund. In addition, affiliates of the Adviser provide a broad range of services and products to their clients and are major participants in the global currency, equity, commodity, fixed-income and other markets in which a Fund invests or will invest. In certain circumstances, by providing services and products to their clients, these affiliates’ activities will disadvantage or restrict the Funds and/or benefit these affiliates. The Adviser may also acquire material non-public information which would negatively affect the Adviser’s ability to transact in securities for a Fund. JPMorgan and the Funds have adopted policies and procedures reasonably designed to appropriately prevent, limit or mitigate conflicts of interest. In addition, many of the activities that create these conflicts of interest are limited and/or prohibited by law, unless an exception is available. For more information about conflicts of interest, see the Potential Conflicts of Interest section in the Statement of Additional Information.
Temporary Defensive and Cash Positions
For liquidity and to respond to unusual market conditions, the Funds may invest all or most of their total assets in cash and cash equivalents for temporary defensive purposes. In addition, certain Funds may invest in cash and cash equivalents as a principal investment strategy. These investments may result in a lower yield than lower-quality or longer-term investments.
| WHAT IS A CASH EQUIVALENT? |
| Cash equivalents are highly liquid, high-quality instruments with maturities of three months or less on the date they are purchased. They include securities issued by the U.S. government, its agencies and instrumentalities, repurchase agreements, certificates of deposit, bankers’ acceptances, commercial paper, money market mutual funds and bank deposit accounts. |
While the Funds are engaged in a temporary defensive position, they may not meet their investment objectives. These investments may also be inconsistent with a Fund’s main investment strategies. Therefore, the Funds will pursue a temporary defensive position only when market conditions warrant.
Additional Fee Waiver and/or Expense Reimbursement
Service providers to the Funds may, from time to time, voluntarily waive all or a portion of any fees to which they are entitled and/or reimburse certain expenses as they may determine from time to time. The Funds’ service providers may discontinue or modify these voluntary actions at any time without notice. Performance for the Funds will reflect the voluntary waiver of fees and/or the reimbursement of expenses, if any. Without these voluntary waivers and/or expense reimbursements, performance would have been less favorable.
Additional Historical Performance Information
Intermediate Tax Free Bond Fund
The historical performance for the Class R6 Shares in the bar chart prior to 1/1/18 and in the performance table prior to its inception on 11/6/17 is based on the Class I Shares of the Fund, which invest in the same portfolio of securities but are offered in a different prospectus. The actual returns of Class R6 Shares would have been different than those shown because Class R6 have different expenses than Class I Shares.
Sustainable Municipal Income Fund
The historical performance for the Class R6 Shares in the bar chart prior to 1/1/18 and in the performance table prior to its inception on 11/6/17 is based on the Class I Shares of the Fund, which invest in the same portfolio of securities but are offered in a different prospectus. The actual returns of Class R6 Shares would have been different than those shown because Class R6 have different expenses than Class I Shares.
July 1, 2022 | 55
More About the Funds (continued)
Short-Intermediate Municipal Bond Fund
The historical performance for the Class R6 Shares in the bar chart prior to 1/1/19 and in the performance table prior to its inception on 10/1/18 is based on the Class I Shares of the Fund, which invest in the same portfolio of securities but are offered in a different prospectus. The actual returns of Class R6 Shares would have been different than those shown because Class R6 have different expenses than Class I Shares.
Tax Free Bond Fund
The historical performance for the Class R6 Shares in the bar chart prior to 1/1/19 and in the performance table prior to its inception on 10/1/18 is based on the Class I Shares of the Fund, which invest in the same portfolio of securities but are offered in a different prospectus. The actual returns of Class R6 Shares would have been different than those shown because Class R6 have different expenses than Class I Shares.
California Tax Free Bond Fund
The historical performance for the Class R6 Shares in the bar chart prior to 1/1/19 and in the performance table prior to its inception on 10/1/18 is based on the Class I Shares of the Fund, which invest in the same portfolio of securities but are offered in a different prospectus. The actual returns of Class R6 Shares would have been different than those shown because Class R6 have different expenses than Class I Shares.
High Yield Municipal Fund
The historical performance for the Class R6 Shares in the bar chart prior to 1/1/19 and in the performance table prior to its inception on 11/1/18 is based on the Class I Shares of the Fund, which invest in the same portfolio of securities but are offered in a different prospectus. The actual returns of Class R6 Shares would have been different than those shown because Class R6 have different expenses than Class I Shares.
New York Tax Free Bond Fund
The historical performance for the Class R6 Shares in the bar chart prior to 1/1/19 and in the performance table prior to its inception on 10/1/18 is based on the Class I Shares of the Fund, which invest in the same portfolio of securities but are offered in a different prospectus. The actual returns of Class R6 Shares would have been different than those shown because Class R6 have different expenses than Class I Shares.
56 | J.P. Morgan Municipal Bond Funds
The Funds' Management and Administration
The following Funds are series of JPMorgan Trust I (JPMT I), a Delaware statutory trust:
California Tax Free Bond Fund
High Yield Municipal Fund
Intermediate Tax Free Bond Fund
New York Tax Free Bond Fund
High Yield Municipal Fund
Intermediate Tax Free Bond Fund
New York Tax Free Bond Fund
The following Funds are series of JPMorgan Trust II (JPMT II), a Delaware statutory trust:
Sustainable Municipal Income Fund
Short-Intermediate Municipal Bond Fund
Tax Free Bond Fund
Short-Intermediate Municipal Bond Fund
Tax Free Bond Fund
Each Trust is governed by the Board of Trustees, which is responsible for overseeing all business activities of the Funds.
Each of the Funds operates in a multiple class structure. A multiple class fund is an open-end investment company that issues two or more classes of shares representing interests in the same investment portfolio.
Each class in a multiple class fund can set its own transaction minimums and may vary with respect to expenses for distribution, administration and shareholder services. This means that one class could offer access to a Fund on different terms than another class. Certain classes may be more appropriate for a particular investor.
Each Fund may issue other classes of shares that have different expense levels and performance and different requirements for who may invest. Call 1-800-480-4111 to obtain more information concerning all of the Funds’ other share classes. A Financial Intermediary who receives compensation for selling Fund shares may receive a different amount of compensation for sales of different classes of shares.
The Funds' Investment Adviser
J.P. Morgan Investment Management Inc. (JPMIM) is the investment adviser to the Funds and makes the day-to-day investment decisions for the Funds. In rendering investment advisory services to certain Funds, JPMIM uses the portfolio management, research and other resources of a foreign (non-U.S.) affiliate of JPMIM and may provide services to a Fund through a “participating affiliate” arrangement, as that term is used in relief granted by the staff of the SEC. Under this relief, U.S. registered investment advisers are allowed to use portfolio management or research resources of advisory affiliates subject to the regulatory supervision of the registered investment adviser. JPMIM is located at 383 Madison Avenue, New York, NY 10179.
JPMIM is a wholly-owned subsidiary of JPMorgan Asset Management Holdings Inc., which is a wholly-owned subsidiary of JPMorgan Chase & Co. (JPMorgan Chase), a bank holding company.
During the most recent fiscal year ended 2/28/22, JPMIM was paid management fees (net of waivers), as shown below, as a percentage of average daily net assets:
| California Tax Free Bond Fund |
0.28% |
| High Yield Municipal Fund |
0.31 |
| Intermediate Tax Free Bond Fund |
0.24 |
| New York Tax Free Bond Fund |
0.28 |
| Short-Intermediate Municipal Bond Fund |
0.15 |
| Sustainable Municipal Income Fund |
0.23 |
| Tax Free Bond Fund |
0.28 |
A discussion of the basis the Board of Trustees of the Trusts used in reapproving the investment advisory agreement for the Funds is available in the semi-annual reports for the most recent fiscal period ended August 31.
The Portfolio Managers
The lead portfolio managers who are primarily responsible for the day-to-day management of the Funds are listed below. As part of that responsibility, the portfolio managers establish and monitor the overall duration, yield curve, and sector allocation strategies for the Funds. The portfolio managers are assisted by multiple sector and research teams who help formulate duration and allocation recommendations and support the strategies of the Funds within the parameters established by the portfolio managers.
JPMorgan Sustainable Municipal Income Fund. Kevin M. Ellis, CFA charterholder and Managing Director and Wayne Godlin, Managing Director, are the co-lead portfolio managers responsible for the day-to-day management of the JPMorgan Sustainable Municipal Income Fund. An employee of JPMIM and/or its affiliates since May 2003 and portfolio manager of the Fund since 2020, Mr. Ellis is a
July 1, 2022 | 57
The Funds' Management and Administration (continued)
portfolio manager in the U.S. Fixed Income Group and is responsible for managing separate accounts in the Municipal Bond Group. An employee since 2018 and portfolio manager of the Fund since 2020, Mr. Godlin is a senior portfolio manager for the Municipal and Tax Aware Strategies team focusing on high yield municipal bonds. Mr. Godlin has over thirty years of municipal bond market experience in both credit analysis and portfolio management, with a focus on analyzing and managing high yield municipal bond portfolios. Previously, Mr. Godlin was a Consultant, evaluating client municipal bond portfolios, at Herbert J. Sims & Co. from 2017 to 2018 and a senior portfolio manager and a member of the Investment Policy Committee at AllianceBernstein Asset Management from 2009 to 2016. David Sivinski, CFA charterholder and Executive Director, has also participated in the management of the JPMorgan Sustainable Municipal Income Fund since March 2006. In addition to his role as portfolio manager, Mr. Sivinski coordinates municipal management for a number of high net worth clients that focus principally on single state municipal bonds.
JPMorgan Short-Intermediate Municipal Bond Fund. James Ahn has been the lead portfolio manager responsible for the day-to-day management of the JPMorgan Short-Intermediate Municipal Bond Fund since June 2006. Mr. Ahn, Managing Director, is a portfolio manager in the U.S. Fixed Income Group. An employee of JPMIM and/or its affiliates since 1996 and a member of the portfolio management team since February 1999, Mr. Ahn is responsible for strategy formulation and trading short-term tax-aware fixed income strategies for U.S. institutional clients and the Private Bank. Kevin M. Ellis has also participated in the management of the JPMorgan Short-Intermediate Municipal Bond Fund since June 2006. Mr. Ellis, CFA charterholder and Managing Director, is a portfolio manager in the U.S. Fixed Income Group. An employee of JPMIM and/or its affiliates since May 2003, he is responsible for managing separate accounts in the Municipal Bond Group.
JPMorgan Tax Free Bond Fund. Richard Taormina, CFA charterholder and Managing Director, has been the lead portfolio manager responsible for the day-to-day management of the JPMorgan Tax Free Bond Fund since February 2005. Mr. Taormina is a portfolio manager in the Global Fixed Income, Currency & Commodities (GFICC) group. An employee since 1997, Mr. Taormina is responsible for managing municipal and tax-aware mutual funds, high net worth and institutional fixed income accounts, and quantitative analysis. Michelle Hallam has participated in the management of the JPMorgan Tax Free Bond Fund since 2014. Mrs. Hallam, CFA charterholder and Executive Director, is a portfolio manager in the Municipal Group within the GFICC group. An employee of JPMIM since 1999, Mrs. Hallam is responsible for portfolios under the Low Tax Rate Strategy.
JPMorgan California Tax Free Bond Fund and JPMorgan New York Tax Free Bond Fund. David Sivinski, CFA charterholder and Executive Director, has been the lead portfolio manager responsible for the day-to-day management of the JPMorgan California Tax Free Bond Fund and the JPMorgan New York Tax Free Bond Fund since April 2005 and March 2005, respectively. In addition to his role as portfolio manager, Mr. Sivinski coordinates municipal management for a number of high net worth clients that focus principally on single state municipal bonds. Michelle G. Hallam has also participated in the management of the JPMorgan California Tax Free Bond Fund since June 2004. Kevin M. Ellis has also participated in the management of the JPMorgan New York Tax Free Bond Fund since May 2005.
JPMorgan Intermediate Tax Free Bond Fund. Richard Taormina, CFA charterholder and Managing Director, has been the lead portfolio manager responsible for the day-to-day management of the JPMorgan Intermediate Tax Free Bond Fund since February 2006. Biographical information on Mr. Taormina is described under the JPMorgan Tax Free Bond Fund. David Sivinski has also participated in the management of the JPMorgan Intermediate Tax Free Bond Fund since June 2005. In addition to his role as portfolio manager, Mr. Sivinski coordinates municipal management for a number of high net worth clients that focus principally on single state municipal bonds. Mr. Ellis is a portfolio manager in the U.S. Fixed Income Group. An employee of JPMIM and/or its affiliates since May 2003, he is responsible for managing separate accounts in the Municipal Bond Group.
JPMorgan High Yield Municipal Fund. An employee since 2018, Wayne Godlin, CFA charterholder and Managing Director, is a senior portfolio manager for the Municipal and Tax Aware Strategies team focusing on high yield municipal bonds and is the lead portfolio manager responsible for the day-to-day management of the Fund’s investments. Mr. Godlin has over thirty years of municipal bond market experience in both credit analysis and portfolio management, with a focus on analyzing and managing high yield municipal bond portfolios. Previously, Mr. Godlin was a Consultant, evaluating client municipal bond portfolios, at Herbert J. Sims & Co. from 2017 to 2018 and a senior portfolio manager and a member of the Investment Policy Committee at AllianceBernstein Asset Management from 2009 to 2016. Richard Taormina, Managing Director, is a portfolio manager in the Municipal and Tax Aware Fixed Income Group and is responsible for overseeing the Fund’s investments in taxable and tax-exempt securities. An employee since 1997, Mr. Taormina is responsible for managing municipal mutual funds, institutional fixed income accounts, and quantitative analysis. Mr. Ellis, CFA charterholder and Managing Director, is a portfolio manager in the U.S. Fixed Income Group. An employee of JPMIM and/or its affiliates since May 2003, he is responsible for managing separate accounts in the Municipal Bond Group.
The Statement of Additional Information provides additional information about the portfolio managers’ compensation, other accounts managed by the portfolio managers and the portfolio managers’ ownership of securities in the Funds.
58 | J.P. Morgan Municipal Bond Funds
The Funds' Administrator
JPMIM (the Administrator) provides administration services and oversees each Fund's other service providers. The Administrator receives the following annual fee from each Fund for administration services: 0.075% of the first $10 billion of average daily net assets for the Fund, plus 0.050% of average daily net assets of the Fund between $10 billion and $20 billion, plus 0.025% of average daily net assets of the Fund between $20 billion and $25 billion, plus 0.010% of the average daily net assets of the Fund over $25 billion..
The Funds' Distributor
JPMDS (the Distributor) is the distributor for the Funds. The Distributor is an affiliate of JPMIM.
Additional Compensation to Financial Intermediaries
JPMIM, JPMDS and, from time to time, other affiliates of JPMorgan Chase may also, at their own expense and out of their own legitimate profits, provide additional cash payments to Financial Intermediaries whose customers invest in shares of the J.P. Morgan Funds. For this purpose, Financial Intermediaries include financial advisors, investment advisers, brokers, financial planners, banks, insurance companies, retirement or 401(k) plan administrators and others, including various affiliates of JPMorgan Chase, that have entered into agreements with JPMDS. These additional cash payments are payments over and above any sales charges (including Rule 12b-1 fees), service fees (including sub-transfer agency and networking fees) that are paid to such Financial Intermediaries, as described elsewhere in this prospectus. These additional cash payments are generally made to Financial Intermediaries that provide shareholder, sub-transfer agency or administrative services or marketing support. Marketing support may include access to sales meetings, sales representatives and Financial Intermediary management representatives, inclusion of the J.P. Morgan Funds on a sales list, including a preferred or select sales list, or other sales programs and/or for training and educating a Financial Intermediary’s employees. These additional cash payments also may be made as an expense reimbursement in cases where the Financial Intermediary provides shareholder services to J.P. Morgan Fund shareholders. JPMIM and JPMDS may also pay cash compensation in the form of finders’ fees that vary depending on the J.P. Morgan Fund and the dollar amount of shares sold. Such additional compensation may provide such Financial Intermediaries with an incentive to favor sales of shares of the J.P. Morgan Funds over other investment options they make available to their customers. See the Statement of Additional Information for more information.
July 1, 2022 | 59
Investing with J.P. Morgan Funds
Choosing A Share Class
Each share class represents an investment in the same portfolio of securities, but each has different availability and eligibility criteria, expenses, dividends and distributions.
Please read this prospectus carefully, and then select the Fund most appropriate for you and decide how much you want to invest. Each Fund may offer other classes of shares not included in this prospectus that have different expense levels, performance and eligibility requirements from the share classes offered in this prospectus. Call 1-800-480-4111 to obtain more information concerning these or other share classes. A Financial Intermediary may receive different compensation based on the share class sold.
Additional Information that Applies to All Accounts: If your identity or the identity of any other person(s) authorized to act on your behalf cannot be verified, or if potentially criminal activity is identified, the J.P. Morgan Funds and the Distributor reserve the right to reject opening an account for you, close your account, or take such other action they deem reasonable or required by law.
Class R shares are primarily used in Group Retirement Plans. The particular Group Retirement Plan will determine the share class available to its participants.
Shares of the Funds have not been registered for sale outside of the United States. This prospectus is not intended for distribution to prospective investors outside of the United States. The Funds generally do not market or sell shares to investors domiciled outside of the United States, even, with regard to individuals, if they are citizens or lawful permanent residents of the United States.
| |
Class R6 |
| Eligibility1 |
May be purchased by •Group Retirement Plans,1 •Section 529 college savings plans •J.P. Morgan Funds of Funds (to the extent permitted by a Fund’s investment strategies) •Mutual Funds ETFs and other registered investment companies not affiliated with JPMIM •Investors through a fee-based advisory program of a financial intermediary that has entered into a written agreement with the Distributor to offer such shares through an omnibus account held at the Fund. •Certain discretionary accounts at JPMIM or JPMorgan Chase Bank, N.A. or their affiliates (the Investment Manager) as defined below •Institutional Investors as described below •Other Investors, as described below |
| Minimum Investment2 |
$5,000,000 – Discretionary Accounts $5,000,000 – Institutional Investors $15,000,000 – Others Investors. There is no minimum for other Class R6 eligible as investors as described in “Eligibility,” above. |
| Minimum Subsequent Investments |
No minimum |
| Distribution (12b-1) Fee |
None |
| Service Fee |
None |
| Redemption Fee |
None |
1
For more information about eligible Group Retirement Plans, see “Group Retirement Plans” below.
2
Please see “MINIMUM ACCOUNT BALANCE” for more information about minimum balance requirements.
60 | J.P. Morgan Municipal Bond Funds
Financial Intermediaries may include financial advisors, investment advisers, brokers, financial planners, banks, insurance companies, retirement or 401(k) plan administrators and others, including various affiliates of JPMorgan Chase, that have entered into agreements with JPMDS as Distributor and/or shareholder servicing agent.
Accounts may be opened either directly with a Fund’s transfer agent or through Financial Intermediaries. If you have questions about eligibility, please call 1-800-480-4111.
•
Class R6 Shares are not subject to Rule 12b-1 fees.
•
Class R6 Shares have lower annual expense ratios than other share classes, as the Class R6 Shares have no ongoing service fees.
•
A Fund may issue other classes of shares that have different sales charges, expense levels and performance and different requirements for who may invest. Call 1-800-480-4111 to obtain more information concerning all of a Fund’s other share classes. A Financial Intermediary who receives compensation for selling Fund shares may receive different amounts of compensation for sales of different classes of shares.
Group Retirement Plans
The only retirement plans that are eligible to purchase Class R6 Shares are employer-sponsored retirement, deferred compensation and employee benefit plans (including health savings accounts) and trusts used to fund those plans. To satisfy eligibility requirements, the plan must be a group plan (more than one participant), the shares cannot be held in a commission-based brokerage account and the shares must be held a) at a plan level or b) at the Fund level through an omnibus account of a retirement plan recordkeeper. Group Retirement Plans include group employer-sponsored 401(k) plans, 457 plans, employer-sponsored 403(b) plans, profit-sharing and money purchase pension plans, defined benefit plans, retiree health benefit plans, group annuity separate accounts offered to retirement plans, and non-qualified deferred compensation plans. Group Retirement Plans do not include traditional and Roth Individual Retirement Accounts (IRAs), Coverdell Education Savings Accounts, SEPs, SARSEPs, SIMPLE IRAs, KEOGHs, individual 401(k) plans or individual 403(b) plans.
Discretionary Accounts
Class R6 Shares may also be purchased by an account for an investor:
1.
Whose investments in a Fund are made and directed on their behalf by investment representatives at the Investment Manager pursuant to a discretionary investment management agreement or trust agreement that provides for discretionary investment management services between the Investment Manager and the investor (a Discretionary Account), and
2.
Whose account’s initial investment in a Fund is at least $5,000,000. An investor can combine purchases of Class R6 Shares with Class R6 Shares of other JPMorgan Funds in order to meet the applicable minimum investment.
Institutional Investors
Class R6 Shares may also be purchased by institutional investors whose initial investment in a Fund is at least $5,000,000. Institutional investors include, but are not limited to, corporations, qualified non-profit organizations, charitable trusts, foundations and endowments, governmental entities, municipalities, and hospitals investing for their own account. These accounts may not be held for the benefit of multiple underlying, unrelated investors. For these investors, accounts cannot be aggregated at the investor level to meet the initial minimum.
Other Investors
Class R6 Shares also may be purchased in other accounts whose initial investment in a Fund is at least $15,000,000. These accounts may not be held for the benefit of multiple underlying, unrelated investors. For these investors, accounts cannot be aggregated at the investor level to meet the initial minimum.
Certain Financial Intermediaries may not make Class R6 Shares available for purchase.
College Savings Plans
To be eligible to invest in R6 Shares, Section 529 college savings plans must hold their shares through plan level or omnibus accounts held on the books of a Fund.
July 1, 2022 | 61
Investing with J.P. Morgan Funds (continued)
Financial Intermediary Compensation
The following section describes the various fees that you will pay if you purchase shares of the Funds. In addition, it describes the types of compensation paid to Financial Intermediaries for the sale of Fund shares and related services.
Class R6 Shares are only available through a Financial Intermediary if the Financial Intermediary will not receive from the Fund assets or the Distributor’s or an affiliate’s resources any commission payments, service fees (including sub-transfer agent and networking fees), or distribution fees (including Rule 12b-1 fees) directly tied to assets invested in Class R6 Shares. This restriction does not apply to fees paid to a Financial Intermediary by an affiliate of the Distributor from its fees for retirement plan recordkeeping services.
To obtain information, see below, visit www.jpmorganfunds.com or call 1-800-480-4111.
Networking and Sub-Transfer Agency Fees
JPMDS, as shareholder servicing agent, has entered into agreements with Financial Intermediaries pursuant to which the Financial Intermediary is paid for services such as networking or sub-transfer agency (collectively, the “Sub-TA Agreements”). Sub-TA Agreement payments are generally based on either (1) a percentage of the average daily net assets of clients serviced by such Financial Intermediary up to a set maximum dollar amount per shareholder account serviced, or (2) a per account fee based on the number of accounts serviced by such Financial Intermediary. Sub-TA Agreement payments are in addition to, rather than in lieu of, Rule 12b-1 fees the Financial Intermediary may also be receiving pursuant to agreements with the Distributor for classes with Rule 12b-1 fees. Payments to Financial Intermediaries for sub-transfer agency services will be made by JPMDS, as shareholder servicing agent, from the service fee. From time to time, JPMIM or its affiliates may pay a portion of the sub-transfer agency fees at its or their own expense and out of its or their legitimate profits.
Purchasing Fund Shares
You may purchase shares directly from the J.P. Morgan Funds through the Distributor or through your Financial Intermediary.
Purchase and redemption orders will be accepted only on days that J.P. Morgan Funds are open for business. The Funds are open for business on each day the NYSE is open for trading. A purchase or redemption order received by the Funds prior to the close of regular trading on the NYSE (normally 4:00 p.m. ET) (“Fund Close”), on a day the Funds are open for business, will be effected at that day’s NAV. The Funds will not treat an intraday unscheduled disruption or closure in NYSE trading as a closure of the NYSE and will calculate NAV as of 4:00 p.m. ET, if the particular disruption or closure directly affects only the NYSE. An order received after the Fund Close will generally be effected at the NAV determined on the next business day. However, orders received by Financial Intermediaries on a business day prior to the Fund Close and communicated to the Funds prior to such time as agreed upon by the Funds and the Financial Intermediary will be effected at the NAV determined on the business day the order was received by the Financial Intermediary.
A purchase order must be supported by all appropriate documentation and information in the proper form. The Funds may refuse to honor incomplete purchase orders.
Share ownership is electronically recorded; therefore, no certificate will be issued. A shareholder who purchases shares of a Fund that accrues dividends daily will not accrue a dividend on the day of the purchase.
If you purchase shares through your Financial Intermediary, contact your investment representative for its requirements and procedures. If a Financial Intermediary holds your shares, it is the responsibility of the Financial Intermediary to send your purchase order to the Fund. Your Financial Intermediary may have an earlier cut-off time for purchase orders.
If you purchase shares directly with the Funds, see the information below.
62 | J.P. Morgan Municipal Bond Funds
| HOW TO PURCHASE DIRECTLY WITH THE J.P. MORGAN FUNDS | ||
| |
Opening a New Account |
Purchasing into an Existing Account |
| By Phone or Online 1-800-480-4111 Shareholder Services representatives are available Monday through Friday from 8:00 am to 6:00 pm ET. www.jpmorganfunds.com Note: Certain account types are not available for online account access. Please call for additional information. |
A new account may not be opened by phone or online. A new fund position can be added to an existing account by phone or online if you have bank information on file. The minimum initial investment requirement must be met. |
You must already have bank information on file. If we do not have bank information on file, you must submit written instructions. Please call for instructions on how to add bank information to your account. |
| By Mail Regular mailing address: J.P. Morgan Funds Services P.O. Box 219143 Kansas City, MO 64121-9143 Overnight mailing address: J.P. Morgan Funds Services 430 W 7th Street, Suite 219143 Kansas City, MO 64105-1407 |
Mail the completed and signed application with a check to our Regular or Overnight mailing address. Refer to the Additional Information Regarding Purchases section |
Please mail your check and include your name, the Fund name, and your fund account number. |
| All checks must be made payable to one of the following: •J.P. Morgan Funds; or •The specific Fund in which you are investing. Please include your existing account number, if applicable. All checks must be in U.S. dollars. The J.P. Morgan Funds do not accept credit cards, cash, starter checks, money orders or credit card checks. The Funds reserve the right to refuse “third-party” checks and checks drawn on non-U.S. financial institutions even if payment may be effected through a U.S. financial institution. Checks made payable to any individual or company and endorsed to J.P. Morgan Funds or a Fund are considered third-party checks. | ||
| By Wire1 1-800-480-4111 Wire Instructions: DST Asset Manager Solutions, Inc. 2000 Crown Colony Drive Quincy, MA 02169 Attn: J.P. Morgan Funds Services ABA: 021 000 021 DDA: 323 125 832 FBO: Fund Name Fund: Fund # Account: Your Account # and Your Account Registration |
Purchase by Wire: If you choose to pay by wire, please call to notify the Fund of your purchase. You must also initiate the wire with your financial institution. |
Purchase by Wire: If you choose to pay by wire, please call to notify the Fund of your purchase. You must also initiate the wire with your financial institution. |
1
The Funds currently do not charge for these services, but may impose a charge in the future. However, your bank may impose a charge for debiting your bank account.
Transactions by phone, fax or the Internet
You may access your account and conduct certain transactions using phone, fax or the J.P. Morgan Funds website. Phone conversations are recorded. The J.P. Morgan Funds and their agents use reasonable procedures to verify the identity of the shareholder. If these procedures are followed, the J.P. Morgan Funds and their agents are not liable for any losses, liability, cost or expenses (including attorney fees) that may occur from acting on unauthorized or fraudulent instructions. Therefore please take precautions to protect your account information and immediately review account statements or other information provided to you. In addition, a
July 1, 2022 | 63
Investing with J.P. Morgan Funds (continued)
confirmation is sent promptly after a transaction. Please review it carefully and contact J.P. Morgan Funds Services or your Financial Intermediary immediately about any transaction you believe to be unauthorized. You may revoke your right to make purchases over the phone or by mailing written instructions to us.
You may not always reach J.P. Morgan Funds Services by phone or online. This may be true at times of unusual market changes and shareholder activity. You can mail us your instructions or contact your Financial Intermediary. We may modify or cancel the ability to purchase or redeem shares online or by phone without notice.
Additional Information Regarding Purchases
Federal law requires all financial institutions to obtain, verify and record information that identifies each person who opens an account. When you open an account, we will ask for your name, residential or business street address, date of birth (for an individual), and other information that will allow us to identify you, including your social security number, tax identification number or other identifying number. The J.P. Morgan Funds cannot waive these requirements. A Fund is required by law to reject your Account Application if the required identifying information is not provided.
We will attempt to collect any missing information required on the Account Application by contacting either you or your Financial Intermediary. If we cannot obtain this information within the established time frame, your Account Application will be rejected. Amounts received prior to receipt of the required information will be held uninvested and will be returned to you without interest if your Account Application is rejected. If the required information is obtained, your investment will be accepted and you will pay the NAV per share next calculated after all of the required information is received.
Once we have received all of the required information, federal law requires us to verify your identity. After an account is opened, we may restrict your ability to purchase additional shares until your identity is verified. If we are unable to verify your identity within a reasonable time, the Funds and/or the Distributor reserve the right to close your account at the current day’s NAV per share. If your account is closed for this reason, your shares will be redeemed at the NAV per share next calculated after the account is closed, less any applicable fees.
Purchases by wire may be canceled if J.P. Morgan Funds Services does not receive payment by 4:00 p.m. ET on the settlement date. You will be responsible for any expenses and/or losses to the Funds.
Exchanging Fund Shares
An exchange is selling shares of one J.P. Morgan Fund and taking the proceeds to simultaneously purchase shares of another J.P. Morgan Fund. Before making an exchange request, you should read the prospectus of the J.P. Morgan Fund whose shares you would like to purchase by exchange. You can obtain a prospectus for any J.P. Morgan Fund by contacting your Financial Intermediary, by visiting www.jpmorganfunds.com, or by calling 1-800-480-4111.
| EXCHANGE PRIVILEGES |
| Class R6 Shares of a Fund may be exchanged for: |
| •Class R6 Shares of another J.P. Morgan Fund, |
| •Another share class of the same Fund if you are eligible to purchase that class. |
In general, the same rules and procedures that apply to redemptions and purchases apply to exchanges:
•
All exchanges are subject to meeting any investment minimum or eligibility requirements of the new Fund and class.
•
The J.P. Morgan Funds will provide 60 days’ written notice of any termination of or material change to your exchange privilege.
•
All exchanges are based upon the net asset value that is next calculated after the Fund receives your order, provided the exchange out of one Fund must occur before the exchange into the other Fund.
•
In order for an exchange to take place on the date that the order is submitted, the order must be received prior to the close of both the Fund that you wish to exchange into and the Fund that you wish to exchange out of, otherwise, the exchange will occur on the following business day on which both Funds are open.
•
A shareholder that exchanges into shares of a Fund that accrues dividends daily, including a money market fund, will not accrue a dividend on the day of the exchange. A shareholder that exchanges out of shares of a Fund that accrues a daily dividend will accrue a dividend on the day of the exchange.
•
The exchange privilege is not intended as a way for you to speculate on short-term movements in the market. Therefore, to prevent disruptions in the management of J.P. Morgan Funds, certain J.P. Morgan Funds limit excessive exchange activity as described in the “Frequent Trading Policy” section. Your exchange privilege will be limited or revoked if the exchange activity is considered excessive. In addition, any J.P. Morgan Fund may reject any exchange request for any reason, including if it is not in
64 | J.P. Morgan Municipal Bond Funds
Investing with J.P. Morgan Funds (continued)
Tax Consequences on Exchanges
Generally, an exchange between J.P. Morgan Funds is considered a sale and generally results in a capital gain or loss for federal income tax purposes. An exchange between classes of shares of the same Fund is generally not taxable for federal income tax purposes. You should talk to your tax advisor before making an exchange.
Redeeming Fund Shares
If you sell shares through your Financial Intermediary, contact your investment representative for its requirements and procedures. If a Financial Intermediary holds your shares, it is the responsibility of the Financial Intermediary to send your redemption order to the Fund. Your Financial Intermediary may have an earlier cut-off time for redemption orders.
If you sell shares directly with the Fund, see the information below.
Your redemption proceeds may be mailed to you at your address of record1 or wired to a pre-existing bank account on file.
| HOW TO REDEEM | |
| By Phone or Online |
Call us at 1-800-480-4111 Shareholder Services representatives are available Monday through Friday from 8:00 am to 6:00 pm ET. www.jpmorganfunds.com Note: Certain account types are not available for online account access. Please call for additional information. |
| By Mail |
Regular mailing address: J.P. Morgan Funds Services P.O. Box 219143 Kansas City, MO 64121-9143 Overnight mailing address: J.P. Morgan Funds Services 430 W 7th Street, Suite 219143 Kansas City, MO 64105-1407 |
1
You cannot request a redemption by check to be sent to an address updated within 15 days.
You may redeem some or all of your shares on any day that the Funds are open for business. You will not be permitted to enter a redemption order for shares purchased directly through J.P. Morgan Funds Services by check for five business days following the acceptance of a purchase order unless you provide satisfactory proof that your purchase check has cleared (sometimes referred to as uncollected shares).
If a Fund or Financial Intermediary receives your redemption order before the close of the NYSE (normally 4 p.m. ET or before 4:00 p.m. ET, if the NYSE closes before 4:00 p.m. ET), you will receive the NAV per share calculated after your redemption order is received in good order (meaning that it includes the information required by, and complies with security requirements implemented by, the Fund’s transfer agent or the Fund), minus the amount of any applicable fees. Your Financial Intermediary may have an earlier cut-off time for redemption orders and may charge a fee to process redemption of shares. A shareholder that redeems out of shares of a Fund that accrues a daily dividend will accrue a dividend on the day of the redemption.
All redemption requests must be supported by valid identity authentication, the appropriate documentation (if applicable) and any necessary information in good order. Additional information may be required depending on the situation.
For accounts held directly with the Funds, the length of time that the Funds typically expect to pay redemption proceeds depends on whether payment is made by wire or check. The Funds typically expect to make payments of redemption proceeds by wire on the next business day following receipt of the redemption order by the Funds. For payment by check, the Funds typically expect to mail the check on the next business day following receipt of the redemption order by the Funds.
For accounts held through Financial Intermediaries, the length of time that the Funds typically expect to pay redemption proceeds depends on the method of payment and the agreement between the Financial Intermediary and the Funds. For redemption proceeds that are paid directly to you by the Fund, the Fund typically expects to make payments by wire or by
66 | J.P. Morgan Municipal Bond Funds
mailing a check on the next business day following the Fund’s receipt of a redemption order from the Financial Intermediary. For payments that are made to your Financial Intermediary for transmittal to you, the Funds expect to pay redemption proceeds to the Financial Intermediary within 1 to 3 business days following the Fund’s receipt of the redemption order from the Financial Intermediary.
Payment of redemption proceeds may take longer than the time a Fund typically expects and may take up to seven days as permitted by the Investment Company Act of 1940.
Transactions by phone, fax or the Internet
You may access your account and conduct certain transactions using phone, fax or the J.P. Morgan Funds website. Phone conversations are recorded. The J.P. Morgan Funds and their agents use reasonable procedures to verify the identity of the shareholder. If these procedures are followed, the J.P. Morgan Funds and their agents are not liable for any losses, liability, cost or expenses (including attorney fees) that may occur from acting on unauthorized or fraudulent instructions. Therefore please take precautions to protect your account information and immediately review account statements or other information provided to you. In addition, a confirmation is sent promptly after a transaction. Please review it carefully and contact J.P. Morgan Funds Services or your Financial Intermediary immediately about any transaction you believe to be unauthorized. You may revoke your right to make redemptions over the phone or by mailing written instructions to us.
You may not always reach J.P. Morgan Funds Services by phone or online. This may be true at times of unusual market changes and shareholder activity. You can mail us your instructions or contact your Financial Intermediary. We may modify or cancel the ability to purchase or redeem shares online or by phone without notice.
Additional Information Regarding Redemptions
Medallion signature guarantees may be required if:
•
You want to redeem shares with a value of $50,000 or more and you want to receive your proceeds in the form of a check; or
•
You want your payment sent to an address, bank account or payee other than the one currently designated on your Fund account.
The Fund may refuse to honor incomplete redemption orders.
The Fund may suspend your ability to redeem when:
1.
Trading on the NYSE is restricted;
2.
The NYSE is closed (other than weekend and holiday closings);
3.
Federal securities laws permit;
4.
The SEC has permitted a suspension; or
5.
An emergency exists, as determined by the SEC.
You generally will recognize a gain or loss on a redemption for federal income tax purposes. You should talk to your tax advisor before making a redemption.
Generally, all redemptions will be for cash. The J.P. Morgan Funds typically expect to satisfy redemption requests by selling portfolio assets or by using holdings of cash or cash equivalents. On a less regular basis, the Funds may also satisfy redemption requests by borrowing from another Fund, by drawing on a line of credit from a bank, or using other short-term borrowings from its custodian. These methods may be used during both normal and stressed market conditions. In addition to paying redemption proceeds in cash, if you redeem shares worth $250,000 or more, the J.P. Morgan Funds reserve the right to pay part or all of your redemption proceeds in readily marketable securities instead of cash. If payment is made in securities, the Fund will value the securities selected in the same manner in which it computes its NAV. This process minimizes the effect of large redemptions on the Fund and its remaining shareholders. If you receive a redemption in-kind, securities received by you may be subject to market risk and you could incur taxable gains and brokerage or other charges in converting the securities to cash. While the J.P. Morgan Funds do not routinely use redemptions in-kind, the Funds reserve the right to use redemptions in-kind to manage the impact of large redemptions on the Funds. Redemption in-kind proceeds will typically be made by delivering a pro-rata amount of a Fund’s holdings that are readily marketable securities to the redeeming shareholder within seven days after the Fund’s receipt of the redemption order.
July 1, 2022 | 67
Investing with J.P. Morgan Funds (continued)
The Funds and their service providers may temporarily hold redemption proceeds from accounts maintained directly with the Funds if there is a reasonable belief that financial exploitation of a Specified Adult has occurred, is occurring, has been attempted, or will be attempted. For purposes of this paragraph, the term “Specified Adult” refers to an individual who is (A) a natural person age 65 and older; or (B) a natural person age 18 and older who the member reasonably believes has a mental or physical impairment that renders the individual unable to protect his or her own interests.
Minimum Account Balance
If your account value falls below the required minimum balance, the Fund reserves the right to redeem all of the remaining shares in your account and close your account. Before this action is taken, you will be given 60 days advance written notice in order to provide you with time to increase your account balance to the required minimum, by purchasing sufficient shares, in accordance with the terms of this prospectus.
Closings, Reorganizations and Liquidations
To the extent authorized by law, each Fund reserves the right to discontinue offering shares at any time, to merge or reorganize itself or a share class, or to cease operations and liquidate at any time.
Frequent Trading Policy
J.P. Morgan Funds do not authorize market timing and, except for the Funds identified below, use reasonable methods to identify market timers and to prevent such activity. However, there can be no assurance that these methods will prevent market timing or other trading that may be deemed abusive. Market timing is an investment strategy using frequent purchases, redemptions and/or exchanges in an attempt to profit from short-term market movements. Market timing may result in dilution of the value of Fund shares held by long-term shareholders, disrupt portfolio management and increase Fund expenses for all shareholders. Although market timing may affect any Fund, these risks may be higher for Funds that invest significantly in non-U.S. securities or thinly traded securities (e.g., certain small cap securities), such as international, global or emerging market funds or small cap funds. For example, when a Fund invests in securities trading principally in non-U.S. markets that close prior to the close of the NYSE, market timers may seek to take advantage of the difference between the prices of these securities at the close of their non-U.S. markets and the value of such securities when the Fund calculates its net asset value.
J.P. Morgan Funds or the Distributor will prohibit any purchase order (including exchanges) with respect to one investor, a related group of investors or their agent(s) where they detect a pattern of either purchases and sales of one of the J.P. Morgan Funds, or exchanges between or among J.P. Morgan Funds, that indicates market timing or trading that they determine is abusive.
Although J.P. Morgan Funds use a variety of methods to detect and deter market timing, there is no assurance that the Funds’ own operational systems and procedures will identify and eliminate all market timing strategies. For example, certain accounts, which are known as omnibus accounts, include multiple investors and such accounts typically provide the Funds with a net purchase or redemption order on any given day where purchasers of Fund shares and redeemers of Fund shares are netted against one another and the identity of individual purchasers and redeemers are not known by the Funds. While the Funds seek to monitor for market timing activities in omnibus accounts, the netting effect limits the Funds’ ability to locate and eliminate individual market timers. As a result, the Funds are often dependent upon Financial Intermediaries who utilize their own policies and procedures to identify market timers. These policies and procedures may be different than those utilized by the Funds.
The Boards of J.P. Morgan Funds have adopted various policies and procedures to identify market timers, including reviewing “round trips” in and out of J.P. Morgan Funds by investors. A “round trip” includes a purchase or exchange into a Fund followed or preceded by a redemption or exchange out of the same Fund. If the Distributor detects that you have completed two round trips within 60 days in the same Fund, the Distributor will reject your purchase and exchange orders for a period of at least 90 days. For subsequent violations, the Distributor may, in its sole discretion, reject your purchase and exchange orders temporarily or permanently. In identifying market timers, the Distributor may also consider activity of accounts that it believes to be under common ownership or control.
J.P. Morgan Funds have attempted to put safeguards in place to assure that Financial Intermediaries have implemented procedures designed to deter market timing and abusive trading. Despite these safeguards, there is no assurance that the Funds will be able to effectively identify and eliminate market timing and abusive trading in the Funds particularly with respect to omnibus accounts.
J.P. Morgan Funds will seek to apply the Funds’ market timing policies and restrictions as uniformly as practicable to accounts with the Funds, except with respect to the following:
1.
Trades that occur through omnibus accounts at Financial Intermediaries as described above;
2.
Purchases, redemptions and exchanges made on a systematic basis;
68 | J.P. Morgan Municipal Bond Funds
3.
Automatic reinvestments of dividends and distributions;
4.
Purchases, redemptions or exchanges that are part of a rebalancing program, such as a wrap, advisory or bona fide asset allocation program, which includes investment models developed and maintained by a financial intermediary;
5.
Redemptions of shares to pay fund or account fees;
6.
Transactions initiated by the trustee or adviser to a donor-advised charitable gift fund;
7.
Transactions in Section 529 college savings plans;
8.
Transactions in Fund of Fund Products; and
9.
Transactions within a Retirement account such as:
•
Shares redeemed to return an excess contribution;
•
Transactions initiated by sponsors of group employee benefit plans or other related accounts;
•
Retirement plan contributions, loans, distributions, and hardship withdrawals;
•
IRA re-characterizations and conversions; and
•
IRA purchases of shares by asset transfer or direct rollover.
In addition to rejecting purchases in connection with suspected market timing activities, the Distributor can reject a purchase (including purchases for the Funds listed below) for any reason, including purchases that it does not think are in the best interests of a Fund and/or its shareholders or if it determines the trading to be abusive. Your Financial Intermediary may also have additional procedures for identifying market timers and rejecting or otherwise restricting purchases and/or exchanges.
Certain J.P. Morgan Funds are intended for short-term investment horizons and do not monitor for market timers or prohibit such short-term trading activity. Those Funds are the JPMorgan Short Duration Bond Fund, JPMorgan Short Duration Core Plus Fund, JPMorgan Short-Intermediate Municipal Bond Fund, JPMorgan Limited Duration Bond Fund, JPMorgan Managed Income Fund, JPMorgan Ultra-Short Municipal Fund and the J.P. Morgan Money Market Funds. Although these Funds are managed in a manner that is consistent with their investment objectives, frequent trading by shareholders may disrupt their management and increase their expenses.
Valuation
Shares are purchased at NAV per share. This is also known as the offering price. Shares are also redeemed at NAV. The NAV of each class within a Fund varies, primarily because each class has different class-specific expenses such as distribution and service fees.
The NAV per share of a class of a Fund is equal to the value of all the assets attributable to that class, minus the liabilities attributable to that class, divided by the number of outstanding shares of that class. The following is a summary of the procedures generally used to value J.P. Morgan Funds’ investments.
Securities for which market quotations are readily available are generally valued at their current market value. Other securities and assets, including securities for which market quotations are not readily available; market quotations are determined not to be reliable; or, their value has been materially affected by events occurring after the close of trading on the exchange or market on which the security is principally traded but before a Fund’s NAV is calculated, may be valued at fair value in accordance with policies and procedures adopted by the J.P. Morgan Funds’ Board of Trustees. Fair value represents a good faith determination of the value of a security or other asset based upon specifically applied procedures. Fair valuation may require subjective determinations. There can be no assurance that the fair value of an asset is the price at which the asset could have been sold during the period in which the particular fair value was used in determining a Fund’s NAV.
Equity securities listed on a North American, Central American, South American or Caribbean securities exchange are generally valued at the last sale price on the exchange on which the security is principally traded. Other foreign equity securities are fair valued using quotations from an independent pricing service, as applicable. The value of securities listed on the NASDAQ Stock Market, Inc. is generally the NASDAQ official closing price.
Fixed income securities are valued using prices supplied by an approved independent third party or affiliated pricing services or broker/dealers. Those prices are determined using a variety of inputs and factors as more fully described in the Statement of Additional Information.
Assets and liabilities initially expressed in foreign currencies are converted into U.S. dollars at the prevailing market rates from an approved independent pricing service as of 4:00 p.m. ET.
July 1, 2022 | 69
Investing with J.P. Morgan Funds (continued)
Shares of ETFs are generally valued at the last sale price on the exchange on which the ETF is principally traded. Shares of open-end investment companies are valued at their respective NAVs.
Options traded on U.S. securities exchanges are valued at the composite mean price, using the National Best Bid and Offer quotes.
Options traded on foreign exchanges are valued at the settled price, or if no settled price is available, at the last sale price available prior to the calculation of a Fund’s NAV and will be fair valued by applying fair value factors provided by independent pricing services, as applicable, for any options involving equity reference obligations listed on exchanges other than North American, Central American, South American or Caribbean securities exchanges.
Exchange traded futures are valued at the last sale price available prior to the calculation of a Fund’s NAV. Any futures involving equity reference obligations listed on exchanges other than North American, Central American, South American or Caribbean securities exchanges will be fair valued by applying fair value factors provided by independent pricing services, as applicable.
Non-listed over-the-counter options and futures are valued utilizing market quotations provided by approved pricing services.
Swaps and structured notes are priced generally by an approved independent third party or affiliated pricing service or at an evaluated price provided by a counterparty or broker/dealer.
Any derivatives involving equity reference obligations listed on exchanges other than North American, Central American, South American or Caribbean securities exchanges will be fair valued by applying fair value factors provided by independent pricing services, as applicable.
NAV is calculated each business day as of the close of the NYSE, which is typically 4:00 p.m. ET. On occasion, the NYSE will close before 4:00 p.m. ET. When that happens, NAV will be calculated as of the time the NYSE closes. The Funds will not treat an intraday unscheduled disruption or closure in NYSE trading as a closure of the NYSE and will calculate NAV as of 4:00 p.m. ET, if the particular disruption or closure directly affects only the NYSE. The price at which a purchase is effected is based on the next calculation of NAV after the order is received in proper form in accordance with this prospectus. To the extent a Fund invests in securities that are primarily listed on foreign exchanges or other markets that trade on weekends or other days when a Fund does not price its shares, the value of a Fund’s shares may change on days when you will not be able to purchase or redeem your shares.
Distributions and Taxes
Each Fund has elected to be treated and intends to qualify each taxable year as a regulated investment company. A regulated investment company is not subject to tax at the corporate level on income and gains from investments that are distributed to shareholders. Each Fund’s failure to qualify as a regulated investment company would result in corporate-level taxation and, consequently, a reduction in income available for distribution to shareholders.
Each Fund can earn income and realize capital gain. Each Fund deducts any expenses and then pays out the earnings, if any, to shareholders as distributions.
Each Fund generally distributes net investment income, if any, at least on a monthly basis. The Funds will distribute net realized capital gains, if any, at least annually. For each taxable year, each Fund will distribute substantially all of its net investment income and net realized capital gains.
You have the following options for your distributions. You may:
•
Reinvest all distributions in additional Fund shares;
•
Take distributions of net investment income in cash and reinvest distributions of net capital gain in additional shares;
•
Take distributions of net capital gain in cash and reinvest distributions of net investment income; or
•
Take all distributions in cash.
If you do not select an option when you open your account, we will reinvest all distributions. If your distributions are reinvested, they will be in the form of shares of the same class without a sales charge. If you take your distributions in cash, you can choose to have a check mailed to your address of record or you can have them deposited into a pre-assigned bank account. The taxation of the dividends will not be affected whether you have them deposited into a bank account or sent by check.
If, at the close of each quarter of its taxable year, at least 50% of the value of a Fund’s total assets consists of tax-exempt interest obligations, the Fund will be eligible to designate distributions of interest derived from tax-exempt-interest obligations as “exempt interest dividends.” As described in the section entitled “What are the Fund’s main investment strategies?” for each Fund, the Funds invest primarily in various types of municipal bonds, the interest on which is exempt from federal income tax. Distributions that are properly reported as exempt-interest dividends generally are not subject to federal income tax but may be subject to state and local taxes and, in certain instances, may result in liability for the federal alternative minimum tax, both for individual and corporate shareholders. You should consult your tax advisor concerning your own tax situation.
70 | J.P. Morgan Municipal Bond Funds
Shares of the Funds may not be suitable for tax-exempt investors since such investors are generally tax exempt and, therefore, would not gain any additional benefit from the Funds' dividends being tax exempt.
Shareholders who receive social security or railroad retirement benefits should also consult their tax advisors to determine what effect, if any, an investment in any of the Funds may have on the federal taxation of their benefits. Exempt-interest dividends generally are included in income for purposes of determining the amount of benefits that are taxable.
The Funds may invest a portion of their assets in securities that generate income subject to federal, state, and/or local taxes. For Federal income tax purposes, distributions of net investment income that are not properly reported as exempt-interest dividends generally are taxable as ordinary income from dividends. Dividends of net investment income paid to a non-corporate U.S. shareholder that are properly reported as qualified dividend income generally will be taxable to such shareholder at preferential rates. The maximum individual federal income tax rate applicable to “qualified dividend income” is either 15% or 20%, depending on whether the individual’s income exceeds certain threshold amounts. The amount of dividend income that may be so reported by a Fund generally will be limited to the aggregate of the eligible dividends received by each Fund. In addition, a Fund must meet certain holding period and other requirements with respect to the shares on which the Fund received the eligible dividends, and the non-corporate U.S. shareholder must meet certain holding period and other requirements with respect to the Fund. The amount of a Fund’s distributions that would otherwise qualify for this favorable tax treatment may be reduced as a result of the Fund’s securities lending activities or high portfolio turnover rate. Dividends of net investment income that are not reported as either qualified dividend income or exempt-interest dividend income and dividends of net short-term capital gain will be taxable to a U.S. shareholder as ordinary income. It is unlikely that dividends from any of the Funds will qualify to a significant extent for designation as qualified dividend income.
Distributions of net capital gain (that is, the excess of the net gains from the sale of investments that a Fund owned for more than one year over the net losses from investments that the Fund owned for one year or less) that are properly reported by a Fund as capital gain dividends will be taxable as long-term capital gain, regardless of how long you have held your shares in the Fund. The maximum individual federal income tax rate applicable to long-term capital gains is generally either 15% or 20%, depending on whether the individual’s income exceeds certain threshold amounts. Distributions of net short-term capital gain (that is, the excess of any net short-term capital gain over net long-term capital loss), if any, will be taxable to U.S. shareholders as ordinary income. Capital gain of a corporate shareholder is taxed at the same rate as ordinary income.
An additional 3.8% Medicare tax is imposed on certain net investment income (including ordinary dividends and capital gain distributions received from a Fund and net gains from redemptions or other taxable dispositions of Fund shares, but excluding any exempt-interest dividends received from a Fund) of U.S. individuals, estates and trusts to the extent that such person’s “modified adjusted gross income” (in the case of an individual) or “adjusted gross income” (in the case of an estate or trust) exceeds certain threshold amounts.
If you buy shares of a Fund just before a distribution, you will be subject to tax on the entire amount of the taxable distribution you receive. Distributions are taxable to you even if they are paid from income or gains earned by a Fund before your investment (and thus were included in the price you paid for your Fund shares). Any gain resulting from the sale or exchange of Fund shares generally will be taxable as long-term or short-term gain, depending upon how long you have held your shares.
A Fund’s investments in certain debt obligations, mortgage-backed and asset-backed securities, and derivative instruments may require the Fund to accrue and distribute income not yet received. In order to generate sufficient cash to make the requisite distributions, a Fund may be required to liquidate other investments in its portfolio that it otherwise would have continued to hold, including at times when it is not advantageous to do so.
A Fund’s transactions in futures contracts, short sales, swaps and other derivatives will be subject to special tax rules, the effect of which may be to accelerate income to the Fund, defer losses to the Fund, cause adjustments in the holding periods of the Fund’s securities, and convert short-term capital losses into long-term capital losses. These rules could therefore affect the amount, timing and character of distributions to shareholders. A Fund’s use of these types of transactions may result in the Fund realizing more short-term capital gain and ordinary income subject to tax at ordinary income tax rates than it would if it did not engage in such transactions.
Investors should consult their advisers about state and local tax consequences of the investment in the Funds. The information below is only a general summary based on current statutes and regulations as well as current policies of each state, all of which may change possibly with retroactive effect.
California Taxes. California personal income tax law provides that dividends paid by a regulated investment company, or series thereof, are excludable from gross income if (1) at the close of each quarter of such company’s taxable year, at least 50% of the value of its total assets consists of obligations the interest from which would be exempt from California taxation if such obligations were held by an individual and (2) if such dividends are reported by the Fund as exempt interest dividends in written statements furnished
July 1, 2022 | 71
Investing with J.P. Morgan Funds (continued)
to shareholders. Under California law, exempt-interest dividends (including some dividends paid after the close of the year as described in Section 855 of the Internal Revenue Code) may not exceed the excess of (A) the amount of interest received by the Fund which would be tax-exempt interest if the obligations on which the interest was paid were held by an individual over (B) the amount that would be considered expenses related to exempt income and thus would not be deductible under California personal income tax law. Distributions to individual shareholders derived from items other than exempt-interest described above will be subject to California personal income tax. In addition, corporate shareholders should note that dividends will not be exempt from California corporate franchise tax and may not be exempt from California corporate income tax. California has an alternative minimum tax (“AMT”) similar to the federal AMT. However, the California AMT does not include interest from private activity municipal obligations as an item of tax preference. Interest on indebtedness incurred or continued by a shareholder in connection with the purchase of shares of a Fund will generally not be deductible for California personal income tax purposes.
New York Taxes. Dividends paid by the New York Tax Free Bond Fund that are derived from interest attributable to obligations of the State of New York or its political subdivisions or certain other governmental entities (for example, the Commonwealth of Puerto Rico or the U.S. Virgin Islands), the interest on which was excludable from gross income for purposes of both federal income taxation and New York State and City personal income taxation (“New York Tax-Exempt Bonds”) and designated as such, generally are exempt from New York State and New York City personal income tax as well as from the New York City unincorporated business tax (but not the New York State corporation franchise tax or New York City general corporation tax), provided that such dividends constitute exempt-interest dividends under Section 852(b)(5) of the Internal Revenue Code. Dividends and other distributions (aside from exempt-interest dividends derived from New York Tax-Exempt Bonds) generally are not exempt from New York State and City taxes. For New York State and City tax purposes, distributions of net long-term capital gain will be taxable at the same rates as ordinary income. Distributions by the Fund from investment income and capital gain, including exempt -interest dividends, also generally are included in a corporation’s net investment income for purposes of calculating such corporation’s obligations under the New York State corporate franchise tax and the New York City general corporation tax, if received by a corporation subject to those taxes, and will be subject to such taxes to the extent that a corporation’s net investment income is allocated to New York State and/or New York City. To the extent that investors are subject to state and local taxes outside of New York State, all dividends paid by the Fund may be taxable income for purposes thereof. To the extent that the Fund’s dividends are derived from interest attributable to the obligations of any other state or of a political subdivision of any such other state or are derived from capital gains, such dividends will generally not be exempt from New York State or New York City tax. The New York minimum tax for individuals, which excluded tax-exempt interest as an item of tax preference, has been eliminated for tax years beginning on or after January 1, 2014. Interest incurred to buy or carry shares of the Fund generally is not deductible for federal, New York State or New York City personal income tax purposes.
Please see the Statement of Additional Information for additional discussion of the tax consequences of the above-described and other investments to each Fund and its shareholders.
The dates on which net investment income and capital gain dividends, if any, will be distributed are available online at www.jpmorganfunds.com.
Early in each calendar year, each Fund will send you a notice showing the amount of distributions you received during the preceding calendar year and the tax status of those distributions.
The Funds are not intended for foreign shareholders. Any foreign shareholders would generally be subject to U.S. tax-withholding on distributions by the Funds, as discussed in the Statement of Additional Information.
Distributions by a Fund to retirement plans and other entities that qualify for tax-exempt or tax-deferred treatment under federal income tax laws will generally not be taxable. Special tax rules apply to investments through such plans. The tax considerations described in this section do not apply to such tax-exempt or tax-deferred entities or accounts. You should consult your tax advisor to determine the suitability of a Fund as an investment and the tax treatment of distributions.
Any investor for whom a Fund does not have a valid Taxpayer Identification Number may be subject to backup withholding.
The above is a general summary of tax implications of investing in the Funds. Because each investor’s tax consequences are unique, please consult your tax advisor to see how investing in a Fund and, for individuals and S corporations, selection of a particular cost method of accounting will affect your own tax situation.
72 | J.P. Morgan Municipal Bond Funds
IMPORTANT TAX REPORTING CONSIDERATIONS
Your Financial Intermediary or the Fund (if you hold your shares in the Fund direct account) will report gains and losses realized on redemptions of shares for shareholders who are individuals and S corporations purchased after January 1, 2012 to the Internal Revenue Service (IRS). This information will also be reported to you on Form 1099-B and the IRS each year. In calculating the gain or loss on redemptions of shares, the average cost method will be used to determine the cost basis of Fund shares purchased after January 1, 2012 unless you instruct the Fund in writing at J.P. Morgan Funds Services, P.O. Box 219143, Kansas City, MO 64121-9143 that you want to use another available method for cost basis reporting (for example, First In, First Out (FIFO), Last In, First Out (LIFO), Specific Lot Identification (SLID) or High Cost, First Out (HIFO)). If you designate SLID as your cost basis method, you will also need to designate a secondary cost basis method (Secondary Method). If a Secondary Method is not provided, the Fund will designate FIFO as the Secondary Method and will use the Secondary Method with respect to systematic redemptions.
Not all cost basis methods are available. Please contact the Fund at J.P. Morgan Funds Services, P.O. Box 219143, Kansas City, MO 64121-9143 for more information on the available methods for cost basis reporting. To determine which available cost basis method is best for you, you should consult with your tax advisor. Please note that you will be responsible for calculating and reporting gains and losses on redemptions of shares purchased prior to January 1, 2012 to the IRS as such information will not be reported by the Fund and may not be maintained by your Financial Intermediary.
Your Financial Intermediary or the Fund (if you hold your shares in the Fund direct account) is also required to report gains and losses to the IRS in connection with redemptions of shares by S corporations. If a shareholder is a corporation and has not instructed the Fund that it is a C corporation in its account application or by written instruction to J.P. Morgan Funds Services, P.O. Box 219143, Kansas City, MO 64121-9143, the Fund will treat the shareholder as an S corporation and file a Form 1099-B.
Shareholder Statements and Reports
The J.P. Morgan Funds or your Financial Intermediary will send you transaction confirmation statements and quarterly account statements. Please review these statements carefully. The Funds will correct errors if notified within one year of the date printed on the transaction confirmation or account statement. Your Financial Intermediary may have a different cut-off time. J.P. Morgan Funds will charge a fee for requests for statements that are older than two years. Please retain all of your statements, as they could be needed for tax purposes.
To reduce expenses and conserve natural resources, the J.P. Morgan Funds will deliver a single copy of prospectuses and financial reports to individual investors who share a residential address, provided they have the same last name or the J.P. Morgan Funds reasonably believe they are members of the same family. If you would like to receive separate mailings, please call 1-800-480-4111 and the Fund will begin individual delivery within 30 days. If you would like to receive these documents by e-mail, please visit www.jpmorganfunds.com and sign up for electronic delivery.
If you hold your Fund shares directly, you may access your account statements at www.jpmorganfunds.com.
After each fiscal half year you will receive a financial report from the Funds. In addition, the Funds will periodically send you proxy statements and other reports.
If you have any questions or need additional information, please write to J.P. Morgan Funds Services at P.O. Box 219143, Kansas City, MO 64121-9143, call 1-800-480-4111 or visit www.jpmorganfunds.com.
Availability of Proxy Voting Record
The Trustees for each Fund have delegated the authority to vote proxies for securities owned by the Funds to the Funds' adviser. A copy of each Fund’s voting record for the most recent 12-month period ended June 30 is available on the SEC’s website at www.sec.gov or on J.P. Morgan Funds’ website at www.jpmorganfunds.com no later than August 31 of each year. Each Fund’s proxy voting record will include, among other things, a brief description of the matter voted on for each portfolio security, and will state how each vote was cast, for example, for or against the proposal.
Portfolio Holdings Disclosure
No sooner than three calendar days after the end of each month, each Fund will make available upon request the uncertified, complete schedule of its portfolio holdings as of the last day of that month.
Not later than 60 days after the end of each fiscal quarter, each Fund will make available upon request a complete schedule of its portfolio holdings as of the last day of that quarter.
July 1, 2022 | 73
Investing with J.P. Morgan Funds (continued)
Each Fund will post these quarterly schedules on the J.P. Morgan Funds’ website at www.jpmorganfunds.com and on the SEC’s website at www.sec.gov.
The Funds may disclose a Fund’s 10 largest portfolio holdings and the percentage that each of these 10 holdings represent of the Fund’s portfolio as of the most recent month’s end, online at www.jpmorganfunds.com, no sooner than 10 calendar days after month’s end.
Shareholders may request portfolio holdings schedules at no charge by calling 1-800-480-4111. A description of each Fund’s policies and procedures with respect to the disclosure of a Fund’s portfolio holdings is available in the Statement of Additional Information.
74 | J.P. Morgan Municipal Bond Funds
Glossary of Common Investment Terminology
For the purpose of the “INVESTING WITH J.P. MORGAN FUNDS” section, references to “account” and “Fund” are not interchangeable. Fund refers to an individual mutual fund position. An account may be invested in a single Fund or multiple Funds.
Capital Gains Distribution — Payment to mutual fund shareholders of gains realized on securities that a Fund has sold at a profit, minus any realized losses.
Dividend Distribution — Payment to mutual fund shareholders of income from interest or dividends generated by a Fund’s investments.
Financial Intermediaries — Include financial advisors, investment advisers, brokers, financial planners, banks, insurance companies, retirement or 401(k) plan administrators and others, including various affiliates of JPMorgan Chase, that have entered into agreements with the Distributor and/or shareholder servicing agent. Shares purchased this way will typically be held for you by the Financial Intermediary.
Group Retirement Plans — Refers to employer-sponsored retirement, deferred compensation and employee benefit plans (including health savings accounts) and trusts used to fund those plans. To satisfy eligibility requirements, the plan must be a group plan (more than one participant), the shares cannot be held in a commission-based brokerage account and
•
Shares must be held at a plan level or
•
Shares must be held at the Fund level through an omnibus account of a retirement plan recordkeeper.
Group Retirement Plans include group employer-sponsored 401(k) plans, 457 plans, employer-sponsored 403(b) plans, profit-sharing and money purchase pension plans, defined benefit plans, retiree health benefit plans, group annuity separate accounts offered to retirement plans and non-qualified deferred compensation plans. Group Retirement Plans do not include traditional IRAs, Roth IRAs, Coverdell Education Savings Accounts, SEPs, SARSEPs, SIMPLE IRAs, KEOGHs, individual 401(k) or individual 403(b) plans.
Medallion Signature Guarantee — A special stamp used to verify the authenticity of certain documents. It is a guarantee by a financial institution that the signature is genuine and the financial institution accepts liability for any forgery. Medallion signature guarantees protect shareholders by preventing unauthorized transfer of assets that could result in monetary losses to the investor due to fraud. Medallion guarantee stamps can be obtained at many bank branches or brokerage firms.
Uncollected Shares — Shares purchased directly through J.P. Morgan Funds Services by check are not available for redemption for up to five business days following the acceptance of a purchase order unless you provide satisfactory proof that your purchase check has cleared.
Wire — Refers to the method used for payment or redemptions. While J.P. Morgan Funds does not charge to send a wire, your bank may charge a fee for service.
July 1, 2022 | 75
Investment Practices
The table discusses the types of investments which can be held by the Funds. In each case, the related types of risk are also listed.
| FUND NAME |
FUND CODE |
| JPMorgan Sustainable Municipal Income Fund |
1 |
| JPMorgan Short-Intermediate Municipal Bond Fund |
2 |
| JPMorgan Tax Free Bond Fund |
3 |
| JPMorgan California Tax Free Bond Fund |
4 |
| JPMorgan High Yield Municipal Fund |
5 |
| JPMorgan Intermediate Tax Free Bond Fund |
6 |
| JPMorgan New York Tax Free Bond Fund |
7 |
| INSTRUMENT |
FUND CODE |
RISK TYPE |
| Adjustable Rate Mortgage Loans (ARMs): Loans in a mortgage pool which provide for a fixed initial mortgage interest rate for a specified period of time, after which the rate may be subject to periodic adjustments. |
2, 5 |
Credit Interest Rate Liquidity Market Political Prepayment Valuation |
| Asset-Backed Securities: Securities secured by company receivables, home equity loans, truck and auto loans, leases, and credit card receivables or other securities backed by other types of receivables or other assets. |
1–7 |
Credit Interest Rate Liquidity Market Political Prepayment Valuation |
| Auction Rate Securities: Auction rate municipal securities and auction rate preferred securities issued by closed-end investment companies. |
1–7 |
Credit Interest Rate Liquidity Market |
| Bank Obligations: Bankers’ acceptances, certificates of deposit and time deposits. Bankers’ acceptances are bills of exchange or time drafts drawn on and accepted by a commercial bank. Maturities are generally six months or less. Certificates of deposit are negotiable certificates issued by a bank for a specified period of time and earning a specified return. Time deposits are non-negotiable receipts issued by a bank in exchange for the deposit of funds. |
1–7 |
Credit Currency Interest Rate Liquidity Market Political |
| Borrowings: A Fund may borrow for temporary purposes and/or for investment purposes. Such a practice will result in leveraging of the Fund’s assets and may cause a Fund to liquidate portfolio positions when it would not be advantageous to do so. A Fund must maintain continuous asset coverage of 300% of the amount borrowed, with the exception for borrowings not in excess of 5% of the Fund’s total assets made for temporary administrative purposes. |
1–7 |
Credit Interest Rate Market |
| Call and Put Options: A call option gives the buyer the right to buy, and obligates the seller of the option to sell a security at a specified price at a future date. A put option gives the buyer the right to sell, and obligates the seller of the option to buy a security at a specified price at a future date. A Fund will sell only covered call and secured put options. |
1–7 |
Credit Leverage Liquidity Management Market |
76 | J.P. Morgan Municipal Bond Funds
| INSTRUMENT |
FUND CODE |
RISK TYPE |
| Commercial Paper: Secured and unsecured short-term promissory notes issued by corporations and other entities. Maturities generally vary from a few days to nine months. |
1–7 |
Credit Currency Interest Rate Liquidity Market Political Valuation |
| Common Stock Warrants and Rights: Securities, typically issued with preferred stock or bonds, that give the holder the right to buy a proportionate amount of common stock at a specified price. |
3 |
Credit Market |
| Corporate Debt Securities: May include bonds and other debt securities of domestic and foreign issuers, including obligations of industrial, utility, banking and other corporate issuers. |
1–7 |
Credit Currency Interest Rate Liquidity Market Political Prepayment Valuation |
| Credit Default Swaps (CDSs): A swap agreement between two parties pursuant to which one party pays the other a fixed periodic coupon for the specified life of the agreement. The other party makes no payment unless a credit event, relating to a predetermined reference asset, occurs. If such an event occurs, the party will then make a payment to the first party, and the swap will terminate. |
1-7 |
Credit Currency Interest Rate Leverage Liquidity Management Market Political Valuation |
| Custodial Receipts: A Fund may acquire securities in the form of custodial receipts that evidence ownership of future interest payments, principal payments or both on certain U.S. Treasury notes or bonds in connection with programs sponsored by banks and brokerage firms. These are not considered to be U.S. government securities. These notes and bonds are held in custody by a bank on behalf of the owners of the receipts. |
1-7 |
Credit Liquidity Market |
| Demand Features: Securities that are subject to puts and standby commitments to purchase the securities at a fixed price (usually with accrued interest) within a fixed period of time following demand by a Fund. |
1–7 |
Liquidity Management Market |
| Exchange-Traded Funds (ETFs): Ownership interest in unit investment trusts, depositary receipts, and other pooled investment vehicles that hold a portfolio of securities or stocks designed to track the price performance and dividend yield of a particular broad-based, sector or international index. ETFs include a wide range of investments. |
1–7 |
Investment Company Market |
| Foreign Investments: Equity and debt securities (e.g., bonds and commercial paper) of foreign entities and obligations of foreign branches of U.S. banks and foreign banks. Foreign securities may also include American Depositary Receipts (ADRs), Global Depositary Receipts (GDRs), European Depositary Receipts (EDRs) and American Depositary Securities. |
5 |
Foreign Investment Liquidity Market Political Prepayment Valuation |
July 1, 2022 | 77
Investment Practices (continued)
| INSTRUMENT |
FUND CODE |
RISK TYPE |
| High Yield/High Risk Securities/Junk Bonds: Securities that are generally rated below investment grade by the primary rating agencies or are unrated but deemed by a Fund’s adviser to be of comparable quality. |
1-7 |
Credit Currency High Yield Securities Interest Rate Liquidity Market Political Portfolio Quality Valuation |
| Inflation-Linked Debt Securities: Includes fixed and floating rate debt securities of varying maturities issued by the U.S. government as well as securities issued by other entities such as corporations, foreign governments and foreign issuers. |
5 |
Credit Currency Interest Rate Political |
| Interfund Lending: Involves lending money and borrowing money for temporary purposes through a credit facility. |
1-7 |
Credit Interest Rate Market |
| Inverse Floating Rate Instruments: Leveraged variable debt instruments with interest rates that reset in the opposite direction from the market rate of interest to which the inverse floater is indexed. |
1–7 |
Credit Leverage Market |
| Investment Company Securities: Shares of other investment companies, including money market funds for which the adviser and/or its affiliates serve as investment adviser or administrator. The adviser will waive certain fees when investing in funds for which it serves as investment adviser, to the extent required by law or by contract. |
1–6 |
Investment Company Market |
| Loan Assignments and Participations: Assignments of, or participations in all or a portion of loans to corporations or to governments, including governments in less developed countries. |
1–7 |
Credit Currency Extension Foreign Investment Interest Rate Liquidity Market Political Prepayment |
| Master Limited Partnerships: Limited partnerships that are publicly traded on a securities exchange. |
5 |
Market |
| Mortgages (Directly Held): Debt instruments secured by real property. |
5 |
Credit Environmental Extension Interest Rate Liquidity Market Natural Event Political Prepayment Valuation |
78 | J.P. Morgan Municipal Bond Funds
| INSTRUMENT |
FUND CODE |
RISK TYPE |
| Mortgage-Backed Securities: Debt obligations secured by real estate loans and pools of loans such as collateralized mortgage obligations (CMOs), commercial mortgage-backed securities (CMBSs) and other asset-backed structures. |
1–7 |
Credit Currency Extension Interest Rate Leverage Liquidity Market Political Prepayment Tax Valuation |
| Mortgage Dollar Rolls1 : A transaction in which the Fund sells securities for delivery in a current month and simultaneously contracts with the same party to repurchase similar but not identical securities on a specified future date. |
2, 5 |
Currency Extension Interest Rate Leverage Liquidity Market Political Prepayment |
| Municipal Securities: Securities issued by a state or political subdivision to obtain funds for various public purposes. Municipal securities include, among others, private activity bonds and industrial development bonds, as well as general obligation notes, tax anticipation notes, bond anticipation notes, revenue anticipation notes, other short-term tax-exempt obligations, municipal leases, obligations of municipal housing authorities and single family revenue bonds. |
1–7 |
Credit Interest Rate Market Natural Event Political Prepayment Tax Valuation |
| New Financial Products: New options and futures contracts and other financial products continue to be developed and the Fund may invest in such options, contracts and products. |
1–7 |
Credit Liquidity Management Market |
| Obligations of Supranational Agencies: Obligations which are chartered to promote economic development and are supported by various governments and governmental agencies. |
2 |
Credit Foreign Investment Liquidity Political Valuation |
| Options and Futures Transactions: A Fund may purchase and sell (a) exchange traded and over- the-counter put and call options on securities, indexes of securities and futures contracts on securities and indexes of securities, and (b) futures contracts on securities and indexes of securities. |
1–7 |
Credit Leverage Liquidity Management Market |
| Preferred Stock: A class of stock that generally pays a dividend at a specified rate and has preference over common stock in the payment of dividends and in liquidation. |
2, 5 |
Market |
| Private Placements, Restricted Securities and Other Unregistered Securities: Securities not registered under the Securities Act of 1933, such as privately placed commercial paper and Rule 144A securities. |
1–7 |
Liquidity Market Valuation |
1
All forms of borrowing (including mortgage dollar-rolls and reverse repurchase agreements) are limited in the aggregate and may not exceed 33 1∕3% of the Fund’s
total assets except as permitted by law.
July 1, 2022 | 79
Investment Practices (continued)
| INSTRUMENT |
FUND CODE |
RISK TYPE |
| Real Estate Investment Trusts (REITs): Pooled investment vehicles which invest primarily in income producing real estate or real estate related loans or interest. |
5 |
Credit Interest Rate Liquidity Management Market Political Prepayment Tax Valuation |
| Repurchase Agreements: The purchase of a security and the simultaneous commitment to return the security to the seller at an agreed upon price on an agreed upon date. This is treated as a loan. |
1–7 |
Credit Liquidity Market |
| Reverse Repurchase Agreements1: The sale of a security and the simultaneous commitment to buy the security back at an agreed upon price on an agreed upon date. This is treated as borrowing by a Fund. |
1-2, 5-6 |
Credit Leverage Market |
| Securities Issued in Connection with Reorganizations and Corporate Restructurings: In connection with reorganizing or restructuring of an issuer, an issuer may issue common stock or other securities to holders of its debt securities. |
5 |
Market |
| Short Selling: A Fund sells a security it does not own in anticipation of a decline in the market value of the security. To complete the transaction, a Fund must borrow the security to make delivery to the buyer. A Fund is obligated to replace the security borrowed by purchasing it subsequently at the market price at the time of replacement. |
5 |
Credit Liquidity Market |
| Short-Term Funding Agreements: Agreements issued by banks and highly rated U.S. insurance companies such as Guaranteed Investment Contracts (GICs) and Bank Investment Contracts (BICs). |
1–7 |
Credit Liquidity Market |
| Sovereign Obligations: Investments in debt obligations issued or guaranteed by a foreign sovereign government or its agencies, authorities or political subdivisions. |
2, 5 |
Credit Foreign Investment Liquidity Political Valuation |
| Stripped Mortgage-Backed Securities: Derivative multi-class mortgage securities which are usually structured with two classes of shares that receive different proportions of the interest and principal from a pool of mortgage assets. These include Interest Only (IO) and Principal Only (PO) securities issued outside a Real Estate Mortgage Investment Conduit (REMIC) or CMO structure. |
1–7 |
Credit Liquidity Market Political Prepayment Valuation |
| Structured Investments: A security having a return tied to an underlying index or other security or asset class. Structured investments generally are individually negotiated agreements and may be traded over-the-counter. Structured investments are organized and operated to restructure the investment characteristics of the underlying security. |
1–7 |
Credit Foreign Investment Liquidity Management Market Valuation |
1
All forms of borrowing (including mortgage dollar-rolls and reverse repurchase agreements) are limited in the aggregate and may not exceed 33 1∕3% of the Fund’s
total assets except as permitted by law.
80 | J.P. Morgan Municipal Bond Funds
| INSTRUMENT |
FUND CODE |
RISK TYPE |
| Swaps and Related Swap Products: Swaps involve an exchange of obligations by two parties. Caps and floors entitle a purchaser to a principal amount from the seller of the cap or floor to the extent that a specified index exceeds or falls below a predetermined interest rate or amount. A Fund may enter into these transactions to manage its exposure to changing interest rates and other factors. |
1–7 |
Credit Currency Interest Rate Leverage Liquidity Management Market Political Valuation |
| Synthetic Variable Rate Instruments: Instruments that generally involve the deposit of a long- term tax exempt bond in a custody or trust arrangement and the creation of a mechanism to adjust the long-term interest rate on the bond to a variable short-term rate and a right (subject to certain conditions) on the part of the purchaser to tender it periodically to a third party at par. |
1–7 |
Credit Liquidity Market |
| Temporary Defensive Positions: To respond to unusual circumstances a Fund may invest in cash and cash equivalents for temporary defensive purposes. |
1–7 |
Credit Interest Rate Liquidity Market |
| Treasury Receipts: A Fund may purchase interests in separately traded interest and principal component parts of U.S. Treasury obligations that are issued by banks or brokerage firms and that are created by depositing U.S. Treasury notes and U.S. Treasury bonds into a special account at a custodian bank. Receipts include Treasury Receipts (TRs), Treasury Investment Growth Receipts (TIGRs) and Certificates of Accrual on Treasury Securities (CATS). |
1–7 |
Market |
| Trust Preferreds: Securities with characteristics of both subordinated debt and preferred stock. Trust preferreds are generally long term securities that make periodic fixed or variable interest payments. |
5 |
Credit Currency Interest Rate Liquidity Market Political Valuation |
| U.S. Government Agency Securities: Securities issued or guaranteed by agencies and instrumentalities of the U.S. government. These include all types of securities issued by the Government National Mortgage Association (Ginnie Mae), the Federal National Mortgage Association (Fannie Mae) and the Federal Home Loan Mortgage Corporation (Freddie Mac), including funding notes, subordinated benchmark notes, CMOs and Real Estate Mortgage Investment Conduits (REMICs). |
1–7 |
Credit Government Securities Interest Rate Market |
| U.S. Government Obligations: May include direct obligations of the U.S. Treasury, including Treasury bills, notes and bonds, all of which are backed as to principal and interest payments by the full faith and credit of the United States, and separately traded principal and interest component parts of such obligations that are transferable through the Federal book-entry system known as Separate Trading of Registered Interest and Principal of Securities (STRIPS) and Coupons Under Book Entry Safekeeping (CUBES). |
1–7 |
Interest Rate Market |
| Variable and Floating Rate Instruments: Obligations with interest rates which are reset daily, weekly, quarterly or some other frequency and which may be payable to a Fund on demand or at the expiration of a specified term. |
1–7 |
Credit Liquidity Market Valuation |
| When-Issued Securities, Delayed Delivery Securities and Forward Commitments: Purchase or contract to purchase securities at a fixed price for delivery at a future date. |
1–7 |
Credit Leverage Liquidity Market Valuation |
July 1, 2022 | 81
Investment Practices (continued)
| INSTRUMENT |
FUND CODE |
RISK TYPE |
| Zero-Coupon, Pay-in-Kind and Deferred Payment Securities: Zero-coupon securities are securities that are sold at a discount to par value and on which interest payments are not made during the life of the security. Pay-in-kind securities are securities that have interest payable by delivery of additional securities. Deferred payment securities are zero-coupon debt securities which convert on a specified date to interest bearing debt securities. |
1–7 |
Credit Currency Interest Rate Liquidity Market Political Valuation Zero-Coupon Bond |
Risk related to certain investments held by the Funds:
Credit risk The risk that a financial obligation will not be met by the issuer of a security or the counterparty to a contract, resulting in a loss to the purchaser.
Currency risk The risk that currency exchange rate fluctuations may reduce gains or increase losses on foreign investments.
Environmental risk The risk that an owner or operator of real estate may be liable for the costs associated with hazardous or toxic substances located on the property.
Extension risk The risk that a rise in interest rates will extend the life of a mortgage-backed security to a date later than the anticipated prepayment date, causing the value of the investment to fall.
Foreign investment risk The risk associated with higher transaction costs, delayed settlements, currency controls and adverse economic developments. This also includes the risk that fluctuations in the exchange rates between the U.S. dollar and foreign currencies may negatively affect an investment. Adverse changes in exchange rates may erode or reverse any gains produced by foreign currency denominated investments and may widen any losses. Exchange rate volatility also may affect the ability of an issuer to repay U.S. dollar denominated debt, thereby increasing credit risk.
Government securities risk U.S. government securities are subject to market risk, interest rate risk and credit risk. Securities, such as those issued or guaranteed by Ginnie Mae or the U.S. Treasury, that are backed by the full faith and credit of the United States are guaranteed only as to the timely payment of interest and principal when held to maturity and the market prices for such securities will fluctuate. Circumstances could arise that would prevent the payment of interest or principal. Securities issued or guaranteed by certain U.S. government-related organizations, such as Fannie Mae and Freddie Mac, are not backed by the full faith and credit of the U.S. government and no assurance can be given that the U.S. government will provide financial support.
High yield securities risk The risk that the Fund may invest in high yield, high risk securities (also known as junk bonds) which are considered to be speculative. These investments may be issued by companies which are highly leveraged, less creditworthy or financially distressed. Non-investment grade debt securities can be more sensitive to short-term corporate, economic and market developments. During periods of economic uncertainty and change, the market price of the Fund’s investments and the Fund’s net asset value may be volatile. Furthermore, though these investments generally provide a higher yield than higher-rated debt securities, the high degree of risk involved in these investments can result in substantial or total losses. These securities are subject to greater risk of loss, greater sensitivity to economic changes, valuation difficulties, and a potential lack of a secondary or public market for securities. The market price of these securities can change suddenly and unexpectedly.
Interest rate risk The risk that a change in interest rates will adversely affect the value of an investment. The value of fixed income securities generally moves in the opposite direction of interest rates (decreases when interest rates rise and increases when interest rates fall). A Fund may face a heightened level of interest rate risk due to certain changes in monetary policy, such as an interest rate increase by the Federal Reserve.
Investment company risk If a Fund invests in shares of another investment company, shareholders would bear not only their proportionate share of the Fund’s expenses, but also similar expenses of the investment company. The price movement of an investment company that is an ETF may not track the underlying index and may result in a loss.
Leverage risk The risk that gains or losses will be disproportionately higher than the amount invested.
Liquidity risk The risk that the holder may not be able to sell the security at the time or price it desires.
Management risk The risk that a strategy used by a Fund’s management may fail to produce the intended result. This includes the risk that changes in the value of a hedging instrument will not match those of the asset being hedged. Incomplete matching can result in unanticipated risks.
Market risk The risk that when the market as a whole declines, the value of a specific investment will decline proportionately. This systematic risk is common to all investments and the mutual funds that purchase them.
Natural event risk The risk that a natural disaster, such as a hurricane or similar event, will cause severe economic losses and default in payments by the issuer of the security.
Political risk The risk that governmental policies or other political actions will negatively impact the value of the investment.
Portfolio quality risk The risks associated with below investment grade securities including greater risk of default, greater sensitivity to interest rates and economic changes, potential valuation difficulties, and sudden and unexpected changes in credit quality.
Prepayment risk The risk that declining interest rates or other factors will result in unexpected prepayments, causing the value of the investment to fall.
Tax risk The risk that the issuer of the securities will fail to comply with certain requirements of the Internal Revenue Code, which could cause adverse tax consequences. Also the risk that the tax treatment of municipal or other securities could be changed by Congress thereby affecting the value of outstanding securities.
Valuation risk The risk that the estimated value of a security does not match the actual amount that can be realized if the security is sold.
Zero-Coupon Bond Risk The risk that the market value of a zero-coupon bond is generally more volatile than the market value of other fixed income securities with similar maturities that pay interest periodically. In addition, federal income tax law requires that the holder of a zero-coupon bond accrue a portion of the discount at which the bond was purchased as taxable income each year, even though the holder receives no interest payment on the bond during the year. A Fund must distribute substantially all of its net income (including non-cash income attributable to zero-coupon bonds) to its shareholders each year to maintain its status as a regulated investment company and to eliminate tax at the Fund level. Accordingly, such accrued discount must be taken into account in determining the amount of taxable distributions to shareholders. The Fund may consequently have to dispose of portfolio securities under disadvantageous circumstances to generate cash to satisfy such distribution requirements. These actions may reduce the assets to which the Fund’s expenses could otherwise be allocated and may reduce the Fund’s rate of return.
82 | J.P. Morgan Municipal Bond Funds
Financial Highlights
The financial highlights tables are intended to help you understand each Fund’s financial performance for each share class for each of the past one through five fiscal years or periods, as applicable. Certain information reflects financial results for a single Fund share. The total returns in the tables represent the rate that an investor would have earned (or lost) on an investment in a Fund (assuming reinvestment of all dividends and distributions). The information for each period presented has been audited by PricewaterhouseCoopers LLP, whose reports, along with each Fund’s financial statements, are included in the respective Fund’s annual report, which is available upon request.
To the extent a Fund invests in other funds, the Total Annual Operating Expenses included in the Fee Table will not correlate to the ratio of expenses to average net assets in the financial highlights below.
| |
|
Per share operating performance | |||||
| |
|
Investment operations |
Distributions | ||||
| |
Net asset value, beginning of period |
Net investment income (loss) (b) |
Net realized and unrealized gains (losses) on investments |
Total from investment operations |
Net investment income |
Net realized gain |
Total distributions |
| JPMorgan Sustainable Municipal Income Fund |
|
|
|
|
|
|
|
| Class R6 |
|
|
|
|
|
|
|
| Year Ended February 28, 2022 |
$9.88 |
$0.21 |
$(0.29) |
$(0.08) |
$(0.21) |
$— |
$(0.21) |
| Year Ended February 28, 2021 |
9.94 |
0.20 |
(0.06) |
0.14 |
(0.20) |
— |
(0.20) |
| Year Ended February 29, 2020 |
9.48 |
0.23 |
0.46 |
0.69 |
(0.23) |
— |
(0.23) |
| Year Ended February 28, 2019 |
9.45 |
0.25 |
0.08 |
0.33 |
(0.25) |
(0.05) |
(0.30) |
| November 6, 2017 (g) through February 28, 2018 |
9.74 |
0.08 (f) |
(0.21) |
(0.13) |
(0.09) |
(0.07) |
(0.16) |
(a)
Annualized for periods less than one year, unless otherwise noted.
(b)
Calculated based upon average shares outstanding.
(c)
Not annualized for periods less than one year.
(d)
Includes adjustments in accordance with accounting principles generally accepted in the United States of America and as such, the net asset values for financial reporting purposes and the returns based upon those net asset values may differ from the net asset values and returns for shareholder transactions.
(e)
Includes earnings credits and interest expense, if applicable, each of which is less than 0.005% unless otherwise noted.
(f)
Net investment income (loss) may appear disproportionate among the classes due to the timing of recognition of income and changes in the relative size of the classes.
(g)
Commencement of offering of class of shares.
84 | J.P. Morgan Municipal Bond Funds
| |
Ratios/Supplemental data | |||||
| |
|
|
Ratios to average net assets (a) |
| ||
| Net asset value, end of period |
Total return (c)(d) |
Net assets, end of period (000’s) |
Net expenses (e) |
Net investment income (loss) |
Expenses without waivers, reimbursements and earnings credits |
Portfolio turnover rate (c) |
| |
|
|
|
|
|
|
| |
|
|
|
|
|
|
| $9.59 |
(0.82)% |
$81,399 |
0.35% |
2.14% |
0.46% |
18% |
| 9.88 |
1.46 |
62,416 |
0.34 |
2.06 |
0.46 |
22 |
| 9.94 |
7.36 |
60,936 |
0.34 |
2.38 |
0.49 |
7 |
| 9.48 |
3.54 |
51,261 |
0.35 |
2.61 |
0.50 |
13 |
| 9.45 |
(1.42) |
64,738 |
0.34 |
2.67 (f) |
0.57 |
21 |
July 1, 2022 | 85
Financial Highlights (continued)
| |
|
Per share operating performance | |||
| |
|
Investment operations |
Distributions | ||
| |
Net asset value, beginning of period |
Net investment income (loss) (b) |
Net realized and unrealized gains (losses) on investments |
Total from investment operations |
Net investment income |
| JPMorgan Short-Intermediate Municipal Bond Fund |
|
|
|
|
|
| Class R6 |
|
|
|
|
|
| Year Ended February 28, 2022 |
$10.83 |
$0.16 |
$(0.31) |
$(0.15) |
$(0.16) |
| Year Ended February 28, 2021 |
10.91 |
0.19 |
(0.09) |
0.10 |
(0.18) |
| Year Ended February 29, 2020 |
10.54 |
0.21 |
0.38 |
0.59 |
(0.22) |
| October 1, 2018 (f) through February 28, 2019 |
10.39 |
0.09 |
0.15 |
0.24 |
(0.09) |
(a)
Annualized for periods less than one year, unless otherwise noted.
(b)
Calculated based upon average shares outstanding.
(c)
Not annualized for periods less than one year.
(d)
Includes adjustments in accordance with accounting principles generally accepted in the United States of America and as such, the net asset values for financial reporting purposes and the returns based upon those net asset values may differ from the net asset values and returns for shareholder transactions.
(e)
Includes earnings credits and interest expense, if applicable, each of which is less than 0.005% unless otherwise noted.
(f)
Commencement of offering of class of shares.
86 | J.P. Morgan Municipal Bond Funds
| |
Ratios/Supplemental data | |||||
| |
|
|
Ratios to average net assets (a) |
| ||
| Net asset value, end of period |
Total return (c)(d) |
Net assets, end of period (000’s) |
Net expenses (e) |
Net investment income (loss) |
Expenses without waivers, reimbursements and earnings credits |
Portfolio turnover rate (c) |
| |
|
|
|
|
|
|
| |
|
|
|
|
|
|
| $10.52 |
(1.37)% |
$632,795 |
0.20% |
1.52% |
0.35% |
21% |
| 10.83 |
0.92 |
688,820 |
0.19 |
1.72 |
0.35 |
21 |
| 10.91 |
5.61 |
961,820 |
0.19 |
1.99 |
0.36 |
24 |
| 10.54 |
2.31 |
866,630 |
0.19 |
2.19 |
0.37 |
42 |
July 1, 2022 | 87
Financial Highlights (continued)
| |
|
Per share operating performance | |||
| |
|
Investment operations |
Distributions | ||
| |
Net asset value, beginning of period |
Net investment income (loss) (b) |
Net realized and unrealized gains (losses) on investments |
Total from investment operations |
Net investment income |
| JPMorgan Tax Free Bond Fund |
|
|
|
|
|
| Class R6 |
|
|
|
|
|
| Year Ended February 28, 2022 |
$12.41 |
$0.30 |
$(0.32) |
$(0.02) |
$(0.30) |
| Year Ended February 28, 2021 |
12.60 |
0.31 |
(0.19) |
0.12 |
(0.31) |
| Year Ended February 29, 2020 |
11.72 |
0.35 |
0.88 |
1.23 |
(0.35) |
| October 1, 2018 (f) through February 28, 2019 |
11.61 |
0.17 |
0.11 |
0.28 |
(0.17) |
(a)
Annualized for periods less than one year, unless otherwise noted.
(b)
Calculated based upon average shares outstanding.
(c)
Not annualized for periods less than one year.
(d)
Includes adjustments in accordance with accounting principles generally accepted in the United States of America and as such, the net asset values for financial reporting purposes and the returns based upon those net asset values may differ from the net asset values and returns for shareholder transactions.
(e)
Includes earnings credits and interest expense, if applicable, each of which is less than 0.005% unless otherwise noted.
(f)
Commencement of offering of class of shares.
88 | J.P. Morgan Municipal Bond Funds
| |
Ratios/Supplemental data | |||||
| |
|
|
Ratios to average net assets (a) |
| ||
| Net asset value, end of period |
Total return (c)(d) |
Net assets, end of period (000’s) |
Net expenses (e) |
Net investment income (loss) |
Expenses without waivers, reimbursements and earnings credits |
Portfolio turnover rate (c) |
| |
|
|
|
|
|
|
| |
|
|
|
|
|
|
| $12.09 |
(0.22)% |
$153,754 |
0.40% |
2.39% |
0.44% |
16% |
| 12.41 |
1.01 |
134,449 |
0.40 |
2.55 |
0.45 |
23 |
| 12.60 |
10.63 |
115,414 |
0.40 |
2.87 |
0.47 |
31 |
| 11.72 |
2.44 |
86,790 |
0.40 |
3.61 |
0.51 |
53 |
July 1, 2022 | 89
Financial Highlights (continued)
| |
|
Per share operating performance | |||
| |
|
Investment operations |
Distributions | ||
| |
Net asset value, beginning of period |
Net investment income (loss) (b) |
Net realized and unrealized gains (losses) on investments |
Total from investment operations |
Net investment income |
| JPMorgan California Tax Free Bond Fund |
|
|
|
|
|
| Class R6 |
|
|
|
|
|
| Year Ended February 28, 2022 |
$10.80 |
$0.18 |
$(0.37) |
$(0.19) |
$(0.18) |
| Year Ended February 28, 2021 |
10.99 |
0.19 |
(0.19) |
— (f) |
(0.19) |
| Year Ended February 29, 2020 |
10.47 |
0.25 |
0.52 |
0.77 |
(0.25) |
| October 1, 2018 (g) through February 28, 2019 |
10.33 |
0.13 |
0.13 |
0.26 |
(0.12) |
(a)
Annualized for periods less than one year, unless otherwise noted.
(b)
Calculated based upon average shares outstanding.
(c)
Not annualized for periods less than one year.
(d)
Includes adjustments in accordance with accounting principles generally accepted in the United States of America and as such, the net asset values for financial reporting purposes and the returns based upon those net asset values may differ from the net asset values and returns for shareholder transactions.
(e)
Includes earnings credits and interest expense, if applicable, each of which is less than 0.005% unless otherwise noted.
(f)
Amount rounds to less than $0.005.
(g)
Commencement of offering of class of shares.
90 | J.P. Morgan Municipal Bond Funds
| |
Ratios/Supplemental data | |||||
| |
|
|
Ratios to average net assets (a) |
| ||
| Net asset value, end of period |
Total return (c)(d) |
Net assets, end of period (000’s) |
Net expenses (e) |
Net investment income (loss) |
Expenses without waivers, reimbursements and earnings credits |
Portfolio turnover rate (c) |
| |
|
|
|
|
|
|
| |
|
|
|
|
|
|
| $10.43 |
$(1.80) |
$144,407 |
0.40% |
1.63% |
0.43% |
11% |
| 10.80 |
0.01 |
137,357 |
0.39 |
1.74 |
0.43 |
6 |
| 10.99 |
7.48 |
127,070 |
0.40 |
2.35 |
0.46 |
8 |
| 10.47 |
2.58 |
80,424 |
0.35 |
2.95 |
0.48 |
17 |
July 1, 2022 | 91
Financial Highlights (continued)
| |
|
Per share operating performance | |||||
| |
|
Investment operations |
Distributions | ||||
| |
Net asset value, beginning of period |
Net investment income (loss) (b) |
Net realized and unrealized gains (losses) on investments |
Total from investment operations |
Net investment income |
Net realized gain |
Total distributions |
| JPMorgan High Yield Municipal Fund |
|
|
|
|
|
|
|
| Class R6 |
|
|
|
|
|
|
|
| Year Ended February 28, 2022 |
$11.50 |
$0.36 |
$(0.17) |
$0.19 |
$(0.36) |
$— |
$(0.36) |
| Year Ended February 28, 2021 |
11.93 |
0.36 |
(0.43) |
(0.07) |
(0.35) |
(0.01) |
(0.36) |
| Year Ended February 29, 2020 |
10.87 |
0.35 |
1.06 |
1.41 |
(0.34) |
(0.01) |
(0.35) |
| November 1, 2018 (f) through February 28, 2019 |
10.53 |
0.14 |
0.33 |
0.47 |
(0.13) |
— |
(0.13) |
(a)
Annualized for periods less than one year, unless otherwise noted.
(b)
Calculated based upon average shares outstanding.
(c)
Not annualized for periods less than one year.
(d)
Includes adjustments in accordance with accounting principles generally accepted in the United States of America and as such, the net asset values for financial reporting purposes and the returns based upon those net asset values may differ from the net asset values and returns for shareholder transactions.
(e)
Includes earnings credits and interest expense, if applicable, each of which is less than 0.005% unless otherwise noted.
(f)
Commencement of offering of class of shares.
92 | J.P. Morgan Municipal Bond Funds
| |
Ratios/Supplemental data | |||||
| |
|
|
Ratios to average net assets (a) |
| ||
| Net asset value, end of period |
Total return (c)(d) |
Net assets, end of period (000’s) |
Net expenses (e) |
Net investment income (loss) |
Expenses without waivers, reimbursements and earnings credits |
Portfolio turnover rate (c) |
| |
|
|
|
|
|
|
| |
|
|
|
|
|
|
| $11.33 |
1.60% |
$20,316 |
0.45% |
3.07% |
0.51% |
24% |
| 11.50 |
(0.41) |
21,169 |
0.45 |
3.16 |
0.51 |
39 |
| 11.93 |
13.12 |
6,060 |
0.44 |
3.01 |
0.56 |
18 |
| 10.87 |
4.46 |
1,338 |
0.39 |
4.09 |
1.23 |
130 |
July 1, 2022 | 93
Financial Highlights (continued)
| |
|
Per share operating performance | |||||
| |
|
Investment operations |
Distributions | ||||
| |
Net asset value, beginning of period |
Net investment income (loss) (b) |
Net realized and unrealized gains (losses) on investments |
Total from investment operations |
Net investment income |
Net realized gain |
Total distributions |
| JPMorgan Intermediate Tax Free Bond Fund |
|
|
|
|
|
|
|
| Class R6 |
|
|
|
|
|
|
|
| Year Ended February 28, 2022 |
$11.15 |
$0.27 |
$(0.37) |
$(0.10) |
$(0.27) |
$(0.09) |
$(0.36) |
| Year Ended February 28, 2021 |
11.31 |
0.25 |
(0.16) |
0.09 |
(0.25) |
— |
(0.25) |
| Year Ended February 29, 2020 |
10.71 |
0.28 |
0.60 |
0.88 |
(0.28) |
— |
(0.28) |
| Year Ended February 28, 2019 |
10.60 |
0.28 |
0.11 |
0.39 |
(0.28) |
— |
(0.28) |
| November 6, 2017 (f) through February 28, 2018 |
10.83 |
0.09 |
(0.23) |
(0.14) |
(0.09) |
— |
(0.09) |
(a)
Annualized for periods less than one year, unless otherwise noted.
(b)
Calculated based upon average shares outstanding.
(c)
Not annualized for periods less than one year.
(d)
Includes adjustments in accordance with accounting principles generally accepted in the United States of America and as such, the net asset values for financial reporting purposes and the returns based upon those net asset values may differ from the net asset values and returns for shareholder transactions.
(e)
Includes earnings credits and interest expense, if applicable, each of which is less than 0.005% unless otherwise noted.
(f)
Commencement of offering of class of shares.
94 | J.P. Morgan Municipal Bond Funds
| |
Ratios/Supplemental data | |||||
| |
|
|
Ratios to average net assets (a) |
| ||
| Net asset value, end of period |
Total return (c)(d) |
Net assets, end of period (000’s) |
Net expenses (e) |
Net investment income (loss) |
Expenses without waivers, reimbursements and earnings credits |
Portfolio turnover rate (c) |
| |
|
|
|
|
|
|
| |
|
|
|
|
|
|
| $10.69 |
(0.96)% |
$3,503,954 |
0.30% |
2.41% |
0.40% |
12% |
| 11.15 |
0.85 |
3,681,554 |
0.29 |
2.27 |
0.40 |
34 |
| 11.31 |
8.30 |
4,329,545 |
0.30 |
2.52 |
0.39 |
20 |
| 10.71 |
3.77 |
3,911,573 |
0.29 |
2.66 |
0.40 |
48 |
| 10.60 |
(1.26) |
3,497,046 |
0.29 |
2.73 |
0.41 |
30 |
July 1, 2022 | 95
Financial Highlights (continued)
| |
|
Per share operating performance | |||
| |
|
Investment operations |
Distributions | ||
| |
Net asset value, beginning of period |
Net investment income (loss) (b) |
Net realized and unrealized gains (losses) on investments |
Total from investment operations |
Net investment income |
| JPMorgan New York Tax Free Bond Fund |
|
|
|
|
|
| Class R6 |
|
|
|
|
|
| Year Ended February 28, 2022 |
$6.96 |
$0.14 |
$(0.22) |
$(0.08) |
$(0.14) |
| Year Ended February 28, 2021 |
7.09 |
0.15 |
(0.14) |
0.01 |
(0.14) |
| Year Ended February 29, 2020 |
6.75 |
0.16 |
0.34 |
0.50 |
(0.16) |
| October 1, 2018 (f) through February 28, 2019 |
6.64 |
0.08 |
0.11 |
0.19 |
(0.08) |
(a)
Annualized for periods less than one year, unless otherwise noted.
(b)
Calculated based upon average shares outstanding.
(c)
Not annualized for periods less than one year.
(d)
Includes adjustments in accordance with accounting principles generally accepted in the United States of America and as such, the net asset values for financial reporting purposes and the returns based upon those net asset values may differ from the net asset values and returns for shareholder transactions.
(e)
Includes earnings credits and interest expense, if applicable, each of which is less than 0.005% unless otherwise noted.
(f)
Commencement of offering of class of shares.
96 | J.P. Morgan Municipal Bond Funds
| |
Ratios/Supplemental data | |||||
| |
|
|
Ratios to average net assets (a) |
| ||
| Net asset value, end of period |
Total return (c)(d) |
Net assets, end of period (000’s) |
Net expenses (e) |
Net investment income (loss) |
Expenses without waivers, reimbursements and earnings credits |
Portfolio turnover rate (c) |
| |
|
|
|
|
|
|
| |
|
|
|
|
|
|
| $6.74 |
(1.20)% |
$127,964 |
0.40% |
1.95% |
0.43% |
10% |
| 6.96 |
0.22 |
122,625 |
0.39 |
2.11 |
0.43 |
5 |
| 7.09 |
7.49 |
119,722 |
0.40 |
2.32 |
0.44 |
13 |
| 6.75 |
2.89 |
91,813 |
0.40 |
2.93 |
0.45 |
21 |
July 1, 2022 | 97
Additional Fee and Expense Information for the JPMT II Funds and Former One Group Mutual Funds
In connection with the 2004 final settlement between Banc One Investment Advisors Corporation (BOIA), subsequently known as JPMorgan Investment Advisors Inc. (JPMIA1), with the New York Attorney General arising out of market timing of certain mutual funds advised by BOIA, BOIA agreed, among other things, to disclose hypothetical information regarding investment and expense information to Fund shareholders. The hypothetical examples are provided for JPMT II Funds or those Funds that have acquired the assets and liabilities of a JPMT II Fund or a series of One Group Mutual Funds.
The “Gross Expense Ratio” includes the contractual expenses that make up the investment advisory, administration and servicing fees, Rule 12b-1 distribution fees, fees paid to vendors not affiliated with JPMIM that provide services to the Funds and other fees and expenses of the Funds. The “Net Expense Ratio” is Gross Expenses less any fee waivers or expense reimbursements memorialized in a written contract between the Funds and JPMIM and/or its affiliates, as applicable.
The table below shows the ratios for Class R6 Shares of the affected Funds offered in this prospectus.
| |
|
|
|
| |
Class |
Net Expense Ratio |
Gross Expense Ratio |
| JPMorgan Sustainable Municipal Income Fund |
R6 |
0.35% |
0.46% |
| JPMorgan Short-Intermediate Municipal Bond Fund |
R6 |
0.20% |
0.36% |
| JPMorgan Tax Free Bond Fund |
R6 |
0.40% |
0.44% |
| JPMorgan Intermediate Tax Free Bond Fund |
R6 |
0.30% |
0.40% |
A Fund’s annual return is reduced by its fees and expenses for that year. The examples below are intended to help you understand the annual and cumulative impact of the Fund’s fees and expenses on your investment through a hypothetical investment of $10,000 held for the next 10 years. The examples assume the following:
•
On 7/1/22, you invest $10,000 in the Fund and you will hold the shares for the entire 10 year period;
•
Your investment has a 5% return each year;
•
The Fund’s operating expenses remain at the levels discussed below and are not affected by increases or decreases in Fund assets over time;
•
At the time of purchase, any applicable initial sales charges (loads) are deducted; and
•
There is no sales charge (load) on reinvested dividends.
•
The annual costs are calculated using the Net Expense Ratios for the period through the expiration of any fee waivers or expense reimbursements memorialized in a written contract between the Funds and JPMIM and/or its affiliates; and the Gross Expense Ratios thereafter.
“Annual Net Return” shows what effect the “Annual Costs” will have on the assumed 5% annual return for each year. “Gross Cumulative Return” shows what the cumulative return on your investment at the end of each 12 month period (year) ended October 31 would be if Fund expenses are not deducted. “Net Cumulative Return” shows what the cumulative return on your investment at the end of each year would be assuming Fund expenses are deducted each year in the amount shown under “Annual Costs.” “Annual Net Return” shows what effect the “Annual Costs” will have on the assumed 5% annual return for each year.
Your actual costs may be higher or lower than those shown.
1
Effective January 1, 2010, the investment advisory business of JPMorgan Investment Advisors Inc. (JPMIA), which was the adviser for certain of the J.P. Morgan Funds, was transferred to JPMIM and JPMIM became the investment adviser for certain J.P. Morgan Funds that were previously advised by JPMIA.
98 | J.P. Morgan Municipal Bond Funds
| JPMorgan Sustainable Municipal Income Fund | ||||
| |
Class R6 | |||
| Period Ended |
Annual Costs |
Gross Cumulative Return |
Net Cumulative Return |
Net Annual Return |
| June 30, 2023 |
$36 |
5.00% |
4.65% |
4.65% |
| June 30, 2024 |
49 |
10.25 |
9.40 |
4.54 |
| June 30, 2025 |
51 |
15.76 |
14.37 |
4.54 |
| June 30, 2026 |
54 |
21.55 |
19.56 |
4.54 |
| June 30, 2027 |
56 |
27.63 |
24.99 |
4.54 |
| June 30, 2028 |
59 |
34.01 |
30.66 |
4.54 |
| June 30, 2029 |
61 |
40.71 |
36.59 |
4.54 |
| June 30, 2030 |
64 |
47.75 |
42.80 |
4.54 |
| June 30, 2031 |
67 |
55.13 |
49.28 |
4.54 |
| June 30, 2032 |
70 |
62.89 |
56.06 |
4.54 |
| JPMorgan Short-Intermediate Municipal Bond Fund | ||||
| |
Class R6 | |||
| Period Ended |
Annual Costs |
Gross Cumulative Return |
Net Cumulative Return |
Net Annual Return |
| June 30, 2023 |
$20 |
5.00% |
4.80% |
4.80% |
| June 30, 2024 |
39 |
10.25 |
9.66 |
4.64 |
| June 30, 2025 |
40 |
15.76 |
14.75 |
4.64 |
| June 30, 2026 |
42 |
21.55 |
20.08 |
4.64 |
| June 30, 2027 |
44 |
27.63 |
25.65 |
4.64 |
| June 30, 2028 |
46 |
34.01 |
31.48 |
4.64 |
| June 30, 2029 |
48 |
40.71 |
37.58 |
4.64 |
| June 30, 2030 |
51 |
47.75 |
43.96 |
4.64 |
| June 30, 2031 |
53 |
55.13 |
50.64 |
4.64 |
| June 30, 2032 |
55 |
62.89 |
57.63 |
4.64 |
| JPMorgan Tax Free Bond Fund | ||||
| |
Class R6 | |||
| Period Ended |
Annual Costs |
Gross Cumulative Return |
Net Cumulative Return |
Net Annual Return |
| June 30, 2023 |
$41 |
5.00% |
4.60% |
4.60% |
| June 30, 2024 |
47 |
10.25 |
9.37 |
4.56 |
| June 30, 2025 |
49 |
15.76 |
14.36 |
4.56 |
| June 30, 2026 |
51 |
21.55 |
19.57 |
4.56 |
| June 30, 2027 |
54 |
27.63 |
25.02 |
4.56 |
| June 30, 2028 |
56 |
34.01 |
30.73 |
4.56 |
| June 30, 2029 |
59 |
40.71 |
36.69 |
4.56 |
| June 30, 2030 |
62 |
47.75 |
42.92 |
4.56 |
| June 30, 2031 |
64 |
55.13 |
49.44 |
4.56 |
| June 30, 2032 |
67 |
62.89 |
56.25 |
4.56 |
July 1, 2022 | 99
Additional Fee and Expense Information for the JPMT II Funds and Former One Group Mutual Funds (continued)
| JPMorgan Intermediate Tax Free Bond Fund | ||||
| |
Class R6 | |||
| Period Ended |
Annual Costs |
Gross Cumulative Return |
Net Cumulative Return |
Net Annual Return |
| June 30, 2023 |
$31 |
5.00% |
4.70% |
4.70% |
| June 30, 2024 |
43 |
10.25 |
9.52 |
4.60 |
| June 30, 2025 |
45 |
15.76 |
14.55 |
4.60 |
| June 30, 2026 |
47 |
21.55 |
19.82 |
4.60 |
| June 30, 2027 |
49 |
27.63 |
25.34 |
4.60 |
| June 30, 2028 |
51 |
34.01 |
31.10 |
4.60 |
| June 30, 2029 |
54 |
40.71 |
37.13 |
4.60 |
| June 30, 2030 |
56 |
47.75 |
43.44 |
4.60 |
| June 30, 2031 |
59 |
55.13 |
50.04 |
4.60 |
| June 30, 2032 |
61 |
62.89 |
56.94 |
4.60 |
100 | J.P. Morgan Municipal Bond Funds
How to Reach Us
MORE INFORMATION
For investors who want more information on these Funds the following documents are available free upon request:
ANNUAL AND SEMI-ANNUAL REPORTS
Our annual and semi-annual reports contain more information about each Fund’s investments and performance. The annual report also includes details about the market conditions and investment strategies that had a significant effect on each Fund’s performance during the last fiscal year.
STATEMENT OF ADDITIONAL INFORMATION (SAI)
The SAI contains more detailed information about the Funds and their policies. It is incorporated by reference into this prospectus. This means, by law, it is considered to be part of this prospectus.
You can get a free copy of these documents and other information, or ask us any questions, by calling us at 1-800-480-4111 or writing to:
J.P. Morgan Funds Services
P.O. Box 219143
Kansas City, MO 64121-9143
P.O. Box 219143
Kansas City, MO 64121-9143
If you buy your shares through a Financial Intermediary, please contact that Financial Intermediary directly for more information. You can also find information online at www.jpmorganfunds.com.
Reports, a copy of the SAI, and other information about the Funds are also available on the EDGAR Database on the Commission’s Internet site at http://www.sec.gov, and copies of this information may be obtained, after paying a duplicating fee, by electronic request at the following E-mail address: publicinfo@sec.gov.
Investment Company Act File No. for each of the Funds, except the California Tax Free Bond Fund, Intermediate Tax Free Bond Fund and New York Tax Free Bond Fund is 811-4236.
Investment Company Act File No. for the California Tax Free Bond Fund, Intermediate Tax Free Bond Fund and New York Tax Free Bond Fund is 811-21295.
©JPMorgan Chase & Co. 2022. All rights reserved. July 2022.
PR-MBTFR6-722
J.P. Morgan Municipal Bond Funds
STATEMENT OF ADDITIONAL INFORMATION
PART I
July 1, 2022
JPMORGAN TRUST I (“JPMT I”)
| Fund Name |
A |
C |
I |
R6 |
| JPMorgan California Tax Free Bond Fund (the “California Tax Free Bond Fund”) |
JCBAX |
JCBCX |
JPICX |
JCBSX |
| JPMorgan High Yield Municipal Fund (the “High Yield Municipal Fund”) |
JTIAX |
JTICX |
JTISX |
JTIRX |
| JPMorgan Intermediate Tax Free Bond Fund (the “Intermediate Tax Free Bond Fund”) |
JITAX |
JITCX |
JITIX |
JITZX |
| JPMorgan New York Tax Free Bond Fund (the “New York Tax Free Bond Fund”) |
VANTX |
JCNTX |
JNYIX |
VINRX |
JPMORGAN TRUST II (“JPMT II”)
| Fund Name |
A |
C |
I |
R6 |
| JPMorgan Sustainable Municipal Income Fund (the “Sustainable Municipal Income Fund”) |
OTBAX |
OMICX |
HLTAX |
HLTZX |
| JPMorgan Short-Intermediate Municipal Bond Fund (the “Short- Intermediate Municipal Bond Fund”) |
OSTAX |
STMCX |
JIMIX |
OSTSX |
| JPMorgan Tax Free Bond Fund (the “Tax Free Bond Fund”) |
PMBAX |
JTFCX |
PRBIX |
RUNFX |
JPMORGAN TRUST IV (“JPMT IV”)
| Fund Name |
A |
C |
I |
|
| JPMorgan Ultra-Short Municipal Fund (the “Ultra-Short Municipal Fund”) |
USMSX |
|
USMTX |
|
(each, a “Fund” and collectively, the “Funds”)
This Statement of Additional Information (“SAI”) is not a prospectus but contains additional information which should be read in conjunction with the prospectuses for the Funds dated July 1, 2022, as supplemented from time to time (“Prospectuses”). Additionally, this SAI incorporates by reference the financial statements included in the annual Shareholder Reports relating to the Funds, dated February 28, 2022 (collectively, “Financial Statements”). The Prospectuses and the Financial Statements, including the Independent Registered Public Accounting Firm’s Reports, are available without charge upon request by contacting JPMorgan Distribution Services, Inc. (“JPMDS” or the “Distributor”), the Funds’ distributor, at 1111 Polaris Parkway, Columbus, OH 43240.
This SAI is divided into two Parts – Part I and Part II. Part I of this SAI contains information that is particular to each Fund. Part II of this SAI contains information that generally applies to the Funds and other J.P. Morgan Funds.
For more information about the Funds or the Financial Statements, simply write or call:
J.P. Morgan Funds Services
P.O. Box 219143
Kansas City, MO 64121-9143
1-800-480-4111
P.O. Box 219143
Kansas City, MO 64121-9143
1-800-480-4111
SAI-MBTF-722
Part I
Table of Contents
Table of Contents
| 1 | |
| 1 | |
| 2 | |
| 2 | |
| 3 | |
| 9 | |
| 14 | |
| 26 | |
| 26 | |
| 26 | |
| 27 | |
| 27 | |
| 28 | |
| 29 | |
| 31 | |
| 31 | |
| 31 | |
| 31 | |
| 32 | |
| 33 | |
| 34 | |
| 34 | |
| 34 | |
| 34 | |
| 34 | |
| 34 | |
| 35 | |
| 35 | |
| 35 | |
| 36 | |
| 36 | |
| 37 | |
| 37 | |
| 37 | |
| 37 | |
| 37 | |
| 38 | |
| 38 | |
| 40 | |
| 40 | |
| 40 | |
| 40 | |
| 40 | |
| 41 | |
| 42 |
PLEASE SEE PART II OF THIS SAI FOR ITS TABLE OF CONTENTS
GENERAL
The Trusts and the Funds
The California Tax Free Bond Fund, the High Yield Municipal Fund, the Intermediate Tax Free Bond Fund and the New York Tax Free Bond Fund are series of JPMorgan Trust I (“JPMT I”), an open-end, management investment company formed as a statutory trust under the laws of the State of Delaware on November 12, 2004, pursuant to a Declaration of Trust dated November 5, 2004, as subsequently amended. The California Tax Free Bond Fund, the Intermediate Tax Free Bond Fund and the New York Tax Free Bond Fund are successor mutual funds to J.P. Morgan Funds that were series of J.P. Morgan Series Trust or J.P. Morgan Mutual Fund Select Trust (“Predecessor Funds”) prior to February 18, 2005.
The Funds (other than the California Tax Free Bond Fund, the Intermediate Tax Free Bond Fund, the New York Tax Free Bond Fund and Ultra-Short Municipal Fund) are series of JPMorgan Trust II (“JPMT II”), an open-end, management investment company formed as a statutory trust under the laws of the State of Delaware on November 12, 2004, pursuant to a Declaration of Trust dated November 5, 2004, as subsequently amended. The Funds were formerly series of One Group Mutual Funds, a Massachusetts business trust which was formed on May 23, 1985.
The Fund is a series of JPMorgan Trust IV (“JPMT IV”), an open-end, management investment company formed as a statutory trust under the laws of the State of Delaware on November 12, 2015, pursuant to a Declaration of Trust dated November 12, 2015, as subsequently amended. In addition to the Fund, the Trust consists of other series representing separate investment funds (each a “J.P. Morgan Fund”).
Municipal Bond Funds: The Sustainable Municipal Income Fund, the Ultra-Short Municipal Fund, the Short-Intermediate Municipal Bond Fund and the Tax Free Bond Fund are collectively referred to as the “Municipal Bond Funds”.
Tax Free Bond Funds: The California Tax Free Bond Fund, the Intermediate Tax Free Bond Fund and the New York Tax Free Bond Fund are collectively referred to as the “Tax Free Funds”.
Fund Names.
Prior to September 15, 2020, the JPMorgan Sustainable Municipal Income Fund was named the JPMorgan Municipal Income Fund.
Prior to November 1, 2018, the JPMorgan High Yield Municipal Fund was named the JPMorgan Tax Aware High Income Fund.
Prior to February 19, 2005, certain of the Municipal Bond Funds had the following names listed below corresponding to their current names:
| Former One Group Name |
Current Name |
| One Group Short-Term Municipal Bond Fund |
JPMorgan Short-Intermediate Municipal Bond Fund |
| One Group Tax-Free Bond Fund |
JPMorgan Tax Free Bond Fund |
| One Group Municipal Income Fund |
JPMorgan Sustainable Municipal Income Fund |
| |
|
The Predecessor Funds were formerly series of the following business trusts (the “Predecessor Trusts”):
J.P. Morgan Series Trust (“JPMST”)
JPMorgan California Tax Free Bond Fund
JPMorgan California Tax Free Bond Fund
J.P. Morgan Mutual Fund Select Trust (“JPMMFST”)
JPMorgan Intermediate Tax Free Bond Fund
JPMorgan New York Tax Free Bond Fund
JPMorgan Intermediate Tax Free Bond Fund
JPMorgan New York Tax Free Bond Fund
Shareholders of each of the Predecessor Funds approved an Agreement and Plan of Reorganization and Redomiciliation (“Shell Reorganization Agreements”) between the Predecessor Trusts, on behalf of the Predecessor Funds, and JPMMFS, on behalf of its series. Pursuant to the Shell Reorganization Agreements, the Predecessor Funds were reorganized into the corresponding series of JPMMFS effective
Part I - 1
after the close of business on February 18, 2005 (“Closing Date”). With respect to events that occurred or payments that were made prior to the Closing Date, any reference to Fund(s) in this SAI prior to the Closing Date refers to the Predecessor Funds.
On January 20, 2005, shareholders of JPMMFS approved the redomiciliation of JPMMFS as a Delaware statutory trust to be called “JPMorgan Trust I” (“Redomiciliation”). The Redomiciliation took place after the close of business on the Closing Date, at which time each Fund became a series of JPMorgan Trust I. The Redomiciliation was effective after each of the reorganizations pursuant to the Shell Reorganization Agreements.
JPMST. Prior to February 19, 2005, the California Tax Free Bond Fund was a series of JPMST, an open-end management investment company which was organized as a Massachusetts business trust on August 15, 1996.
JPMMFST. Prior to February 19, 2005, the Intermediate Tax Free Bond Fund and the New York Tax Free Bond Fund were series of JPMMFST, an open-end management investment company which was organized as a Massachusetts business trust on October 1, 1996.
After the close of business on February 18, 2005, the JPMorgan Intermediate Tax Free Income Fund acquired all of the assets and liabilities of One Group Intermediate Tax-Free Bond Fund pursuant to an Agreement and Plan of Reorganization dated November 22, 2004 between JPMMFST, on behalf of JPMorgan Intermediate Tax Free Income Fund, and One Group Mutual Funds, on behalf of One Group Intermediate Tax-Free Bond Fund (“Merger Agreement”). Following the merger, the terms of which were set forth in the Merger Agreement, the JPMorgan Intermediate Tax Free Income adopted the name “JPMorgan Intermediate Tax Free Bond Fund” effective February 19, 2005.
Fund Names. Effective February 19, 2005, the following Predecessor Funds were renamed with the approval of the Board of Trustees of JPMST or JPMMFST, as applicable:
| New Name |
Former Name |
| JPMorgan California Tax Free Bond Fund |
JPMorgan California Bond Fund |
| JPMorgan Intermediate Tax Free Bond Fund |
JPMorgan Intermediate Tax Free Income Fund |
| JPMorgan New York Tax Free Bond Fund |
JPMorgan New York Intermediate Tax Free Income Fund |
| JPMorgan Short Term Municipal Bond Fund |
One Group Short-Term Municipal Bond Fund |
Effective April 30, 2009, the JPMorgan Short Term Municipal Bond Fund (formerly the One Group Short-Term Municipal Bond Fund) was renamed, with the approval of the Board of Trustees of JPMT II, to the JPMorgan Short-Intermediate Municipal Bond Fund. For ease of reference, throughout this SAI, the Board of Trustees of JPMT I, the Board of Trustees of JPMT II and the Boards of Trustees of the Predecessor Trusts are referred to herein collectively as the “Board of Trustees.”
Share Classes
Shares in the Funds of the Trusts are generally offered in multiple classes. The Board of Trustees of JPMT I and JPMT II has authorized the issuance and sale of the following share classes of the Funds:
| Fund |
Class A |
Class C |
Class I |
Class R6 |
| Sustainable Municipal Income Fund |
X |
X |
X |
X |
| Short-Intermediate Municipal Bond Fund |
X |
X |
X |
X |
| Tax Free Bond Fund |
X |
X |
X |
X |
| Ultra-Short Municipal Fund |
X |
|
X |
|
| California Tax Free Bond Fund |
X |
X |
X |
X |
| High Yield Municipal Fund |
X |
X |
X |
X |
| Intermediate Tax Free Bond Fund |
X |
X |
X |
X |
| New York Tax Free Bond Fund |
X |
X |
X |
X |
The shares of the Funds are collectively referred to in this SAI as the “Shares.” This SAI applies only to Class A, Class C, Class I Shares and Class R6 Shares of the Funds.
Miscellaneous
This SAI describes the financial history, investment strategies and policies, management and operation of each of the Funds in order to enable investors to select the Fund or Funds which best suit their needs.
Part I - 2
This SAI provides additional information with respect to the Funds and should be read in conjunction with the relevant Fund’s current Prospectuses. Capitalized terms not otherwise defined herein have the meanings accorded to them in the applicable Prospectuses. The Funds' executive offices are located at 277 Park Avenue, New York, NY 10172.
This SAI is divided into two Parts – Part I and Part II. Part I of this SAI contains information that is particular to each Fund. Part II of this SAI contains information that generally applies to the Funds and other series representing separate investment funds or portfolios of JPMT I, JPMT II, JPMorgan Trust IV (“JPMT IV”), J.P. Morgan Mutual Fund Investment Trust (“JPMMFIT”), J.P. Morgan Fleming Mutual Fund Group, Inc. (“JPMFMFG”) and Undiscovered Managers Funds (“UMF”) (each a “J.P. Morgan Fund,” and together with the Funds, the “J.P. Morgan Funds”). Throughout this SAI, JPMT I, JPMT II, JPMT IV, JPMMFIT, JPMFMFG and UMF are each referred to as a “Trust” and collectively, as the “Trusts.” Each Trust’s Board of Trustees, or Board of Directors in the case of JPMFMFG, is referred to herein as the “Board of Trustees” and each trustee or director is referred to as a “Trustee.”
The Funds are advised by J.P. Morgan Investment Management Inc. (“JPMIM”). Certain other of the J.P. Morgan Funds are sub-advised by J.P. Morgan Private Investments Inc. (“JPMPI”) or Fuller & Thaler Asset Management, Inc. (“Fuller & Thaler”). JPMIM is also referred to herein as the “Adviser.” JPMPI and Fuller & Thaler are also referred to herein as the “Sub-Advisers” and, individually, as the “Sub-Adviser.”
Investments in the Funds are not deposits or obligations of, nor guaranteed or endorsed by, JPMorgan Chase Bank, N.A. (“JPMorgan Chase Bank”), an affiliate of the Adviser, or any other bank. Shares of the Funds are not federally insured or guaranteed by the Federal Deposit Insurance Corporation, the Federal Reserve Board or any other governmental agency. An investment in the Funds is subject to risk that may cause the value of the investment to fluctuate, and when the investment is redeemed, the value may be higher or lower than the amount originally invested by the investor.
The Adviser, with respect to each Fund, has filed a notice of eligibility with the National Futures Association (“NFA”) claiming an exclusion from the definition of the term Commodity Pool Operator (“CPO”) with respect to the Fund’s operations. Therefore, each Fund and the Adviser with respect to each such Fund are not subject to registration or regulation as a commodity pool or CPO under the Commodity Exchange Act, as amended. Changes to a Fund’s investment strategies or investments may cause the Fund to lose the benefits of this exclusion and may trigger additional CFTC requirements. If the Adviser or a Fund becomes subject to these requirements, as well as related NFA rules, the Fund may incur additional compliance and other expenses.
INVESTMENT POLICIES
The following investment policies have been adopted by the Trusts with respect to the applicable Funds. The investment restrictions listed below under the heading “Fundamental Investment Policies” are “fundamental” policies which, under the Investment Company Act of 1940, as amended (the “1940 Act”), may not be changed without the vote of a majority of the outstanding voting securities of a Fund, as such term is defined in “Additional Information” in Part II of this SAI. All other investment policies of a Fund (including its investment objectives) are non-fundamental, unless otherwise designated in the Prospectuses or herein, and may be changed by the Trustees of the Fund without shareholder approval.
Except for the restrictions on borrowings set forth below, the percentage limitations contained in the policies below apply at the time of purchase of the securities. If a percentage or rating restriction on investment or use of assets set forth in a fundamental investment policy or a non-fundamental investment policy or in a Prospectus is adhered to at the time of investment, later changes in percentage resulting from any cause other than actions by the Fund will not be considered a violation. If the value of the Fund’s holdings of illiquid securities at any time exceeds the percentage limitation applicable at the time of acquisition due to subsequent fluctuations in value or other reasons, the Fund’s Adviser will consider what actions, if any, are appropriate to maintain adequate liquidity. With respect to each fundamental investment policy regarding borrowing, the 1940 Act generally limits a Fund’s ability to borrow money on a non-temporary basis if such borrowings constitute “senior securities.” As noted in “Investment Strategies and Policies — Miscellaneous Investment Strategies and Risks — Borrowings” in the SAI Part II, in addition to temporary borrowing, a Fund may borrow from any bank, provided that immediately after any such borrowing there is an asset coverage of at least 300% for all borrowings by a Fund and provided further, that in the event that such asset coverage shall at any time fall below 300%, a Fund shall, within three days (not including Sundays and holidays) thereafter or such longer period as the U.S. Securities and Exchange Commission (“SEC”) may prescribe by rules and regulations, reduce the amount of its borrowings to such an extent that the asset coverage of such borrowing shall be at least 300%.
Part I - 3
For purposes of the Ultra-Short Municipal Fund’s fundamental investment policy regarding industry concentration, “to concentrate” generally means to invest more than 25% of a Fund’s total assets, taken at market value at the time of investment. This fundamental investment policy regarding industry concentration does not apply to securities issued by other investment companies, securities issued or guaranteed by the U.S. government, any state or territory of the U.S., its agencies, instrumentalities, or political subdivisions, or repurchase agreements secured thereby.
For purposes of fundamental investment policies regarding industry concentration, the Adviser may classify issuers by industry in accordance with classifications set forth in the Directory of Companies Filing Annual Reports with the SEC or other sources. In the absence of such classification or if the Adviser determines in good faith based on its own information that the economic characteristics affecting a particular issuer make it more appropriate to be considered engaged in a different industry, the Adviser may classify an issuer accordingly. Accordingly, the composition of an industry or group of industries may change from time to time.
With respect to Ultra-Short Municipal Fund, for purposes of fundamental investment policies involving industry concentration, “group of industries” means a group of related industries, as determined in good faith by the Adviser, based on published classifications or other sources. With respect to investments by the Fund in an underlying fund in the J.P. Morgan Funds Complex (i) that has a name suggesting it focuses its investments in a particular industry and a disclosed policy to invest at least 80% of its assets in that industry, the Fund will deem 80% of its investment in the Fund to be invested in that industry or (ii) that does not have a disclosed 80% policy to invest in a particular industry but has a disclosed fundamental policy to concentrate its investments in a particular industry, the Fund will deem 25% of its investment in the fund to be invested in that industry; provided this approach is deemed by the Fund to be consistent with guidance from the SEC or its staff.
INVESTMENT RESTRICTIONS AND POLICIES OF THE FUNDS THAT ARE SERIES OF JPMT I
Fundamental Investment Policies.
(1) (a) The California Tax Free Bond Fund may not purchase any security which would cause the Fund to concentrate its investments in the securities of issuers primarily engaged in any particular industry except as permitted by the SEC;
(b) The Intermediate Tax Free Bond Fund and the New York Tax Free Bond Fund may not purchase the securities of any issuer (other than securities issued or guaranteed by the U.S. government or any of its agencies or instrumentalities, or repurchase agreements secured thereby) if, as a result, more than 25% of the Fund’s total assets would be invested in the securities of companies whose principal business activities are in the same industry. Notwithstanding the foregoing, with respect to a Fund’s permissible futures and options transactions in U.S. government securities, positions in options and futures shall not be subject to this restriction. Industrial development bonds, where the payment of principal and interest is the ultimate responsibility of companies within the same industry, are grouped together as an “industry.” However, it is not applicable to investments by a Fund in municipal obligations where the issuer is regarded as a state, city, municipality or other public authority since such entities are not members of an “industry.” Supranational organizations are collectively considered to be members of any “industry”;
(c) The High Yield Municipal Fund may not purchase the securities of any issuer if, as a result more than 25% of the Fund’s total assets would be invested in securities of one or more issuers whose principal business activities are in the same industry, except as permitted by the SEC. This restriction does not apply to investments in securities issued or guaranteed by the U.S. government or any of its agencies or instrumentalities, or repurchase agreements secured thereby, and futures and options transactions issued or guaranteed by the U.S. government or any of its agencies or instrumentalities;
(2) (a) The California Tax Free Bond Fund may not issue senior securities, except as permitted under the 1940 Act or any rule, order or interpretation thereunder;
(b) The Intermediate Tax Free Bond Fund and the New York Tax Free Bond Fund may not issue any senior security (as defined in the 1940 Act), except that (i) a Fund may engage in transactions that may result in the issuance of senior securities to the extent permitted under applicable regulations and interpretations of the 1940 Act or an exemptive order; (ii) a Fund may acquire other securities, the acquisition of which may result in the issuance of a senior security, to the extent permitted under applicable regulations or interpretations of the 1940 Act; and (iii) subject to the restrictions set forth
Part I - 4
above, a Fund may borrow money as authorized by the 1940 Act. For purposes of this restriction, collateral arrangements with respect to a Fund’s permissible options and futures transactions, including deposits of initial and variation margin, are not considered to be the issuance of a senior security;
(c) The High Yield Municipal Fund may not issue senior securities (as defined in the 1940 Act) except with respect to any permissible borrowings;
(3) (a) The California Tax Free Bond Fund, High Yield Municipal Fund, Intermediate Tax Free Bond Fund and the New York Tax Free Bond Fund may not borrow money, except to the extent permitted by applicable law;
(b) The High Yield Municipal Fund may not borrow money, except to the extent permitted under the 1940 Act or the rules or regulations thereunder, as such statute, rules or regulation may be amended from time to time or as permitted by order or interpretation of the SEC;
(4) (a) The Tax Free Funds may not underwrite securities of other issuers, except to the extent that the Fund, in disposing of portfolio securities, may be deemed an underwriter within the meaning of the 1933 Act;
(b) The High Yield Municipal Fund may not underwrite securities of other issuers, except to the extent that the Fund may be deemed an underwriter under certain securities laws in the disposition of “restricted securities”;
(5) (a) The California Tax Free Bond Fund may not purchase or sell real estate, except that, to the extent permitted by applicable law, the Fund may (a) invest in securities or other instruments directly or indirectly secured by real estate, (b) invest in securities or other instruments issued by issuers that invest in real estate and (c) may make direct investments in mortgages;
(b) The Intermediate Tax Free Bond Fund and the New York Tax Free Bond Fund may not purchase or sell real estate unless acquired as a result of ownership of securities or other instruments (but this shall not prevent a Fund from investing in securities or other instruments backed by real estate or securities of companies engaged in the real estate business). Investments by a Fund in securities backed by mortgages on real estate or in marketable securities of companies engaged in such activities are not hereby precluded. Real estate includes Real Estate Limited Partnerships;
(c) The High Yield Municipal Fund may not purchase or sell real estate unless acquired as a result of ownership of securities or other instruments. This restriction does not prevent the Fund from investing in securities issued by companies in an industry or group of industries in the real estate sector;
(6) (a) The California Tax Free Bond Fund may not purchase or sell commodities or commodity contracts unless acquired as a result of ownership of securities or other instruments issued by persons that purchase or sell commodities or commodities contracts; but this shall not prevent the Fund from purchasing, selling and entering into financial futures contracts (including futures contracts on indices of securities, interest rates and currencies), options on financial futures contracts (including futures contracts on indices of securities, interest rates and currencies), warrants, swaps, forward contracts, foreign currency spot and forward contracts or other derivative instruments that are not related to physical commodities;
(b) The Intermediate Tax Free Bond Fund and the New York Tax Free Bond Fund may not purchase or sell physical commodities unless acquired as a result of ownership of securities or other instruments but this shall not prevent a Fund from (i) purchasing or selling options and futures contracts or from investing in securities or other instruments backed by physical commodities or (ii) engaging in forward purchases or sales of foreign currencies or securities;
(c) The High Yield Municipal Fund may not purchase physical commodities or contracts relating to physical commodities, except as permitted under the 1940 Act, or operate as a commodity pool, in each case as interpreted or modified by the regulatory authority having jurisdiction, from time to time;
(7) The Funds may make loans to other persons, in accordance with the Fund’s investment objective and policies and to the extent permitted by applicable law; and
Part I - 5
(8) (a) Each Fund, except the High Yield Municipal Fund, has an 80% investment policy which is fundamental and may not be changed without shareholder approval;
(b) Under normal market circumstances, at least 80% of the assets of the High Yield Municipal Fund will be invested in municipal securities, the income from which is exempt from federal income tax.
The following policy applies to the California Tax Free Bond Fund:
As a fundamental policy, the Fund normally invests at least 80% of the value of its Assets in municipal securities, the income from which is exempt from federal and state personal income taxes for California residents and not subject to the federal alternative minimum tax on individuals. “Assets” means net assets, plus the amount of borrowings for investment purposes.
The following policy applies to the High Yield Municipal Fund:
In addition, as a matter of fundamental policy, notwithstanding any other investment policy or restriction, the Fund may seek to achieve its investment objective by investing all of its investable assets in another investment company having substantially the same investment objective and policies as the Fund.
The following policy applies to the New York Tax Free Bond Fund:
As a fundamental policy, the Fund normally invests at least 80% of the value of its Assets in municipal obligations whose interest payments are excluded from gross income for federal income tax purposes and exempt from New York State and New York City personal income taxes, and not subject to the federal alternative minimum tax on individuals. “Assets” means net assets, plus the amount of borrowings for investment purposes.
In addition, as a matter of fundamental policy, notwithstanding any other investment policy or restriction, each of the Intermediate Tax Free Bond Fund and the New York Tax Free Bond Fund may seek to achieve its investment objective by investing all of its investable assets in another investment company having substantially the same investment objective and policies as the Fund.
Non-Fundamental Investment Policies. The investment policies described below are not fundamental policies of the Tax Free Funds and may be changed by the Trustees of the Funds without shareholder approval. These non-fundamental investment policies require that:
(1) The Tax Free Funds may not purchase securities on margin, make short sales of securities, or maintain a short position, provided that this restriction shall not be deemed to be applicable to the purchase or sale of when-issued or delayed delivery securities, or to short sales that are covered in accordance with SEC rules;
(2) The Tax Free Funds and High Yield Municipal Fund may not acquire securities of other investment companies, except as permitted by the 1940 Act or any order pursuant thereto;
(3) The Intermediate Tax Free Bond Fund and the New York Tax Free Bond Fund may not, with respect to 50% of its total assets, hold more than 10% of the outstanding voting securities of any issuer;
(4) The Intermediate Tax Free Bond Fund and the New York Tax Free Bond Fund may not purchase or sell interests in oil, gas or mineral leases;
(5) The Intermediate Tax Free Bond Fund and the New York Tax Free Bond Fund may not write, purchase or sell any put or call option or any combination thereof, provided that this shall not prevent (i) the writing, purchasing or selling of puts, calls or combinations thereof with respect to portfolio securities or (ii) with respect to a Fund’s permissible futures and options transactions, the writing, purchasing, ownership, holding or selling of futures and options positions or of puts, calls or combinations thereof with respect to futures.
(6) The Tax Free Funds and High Yield Municipal Fund may not acquire the securities of registered open-end investment companies or registered unit investment trusts in reliance on Section 12(d)(1)(F) or 12(d)(1)(G) of the 1940 Act.
For purposes of the Tax Free Funds’ investment policies, the issuer of a tax-exempt security is deemed to be the entity (public or private) ultimately responsible for the payment of the principal of and interest on the security.
Part I - 6
INVESTMENT RESTRICTIONS AND POLICIES OF THE FUNDS THAT ARE SERIES OF JPMT II
Fundamental Investment Policies.
The Sustainable Municipal Income Fund, the Tax Free Bond Fund and the Short-Intermediate Municipal Bond Fund may not:
1. Purchase securities of any issuer if such purchase would not be consistent with the maintenance of the Fund’s status as a diversified company under the 1940 Act, or the rules or regulations thereunder, as such statute, rules or regulations may be amended from time to time.
2. Purchase any securities that would cause more than 25% of the total assets of a Fund to be invested in the securities of one or more issuers conducting their principal business activities in the same industry, provided that this limitation does not apply to Municipal Securities or governmental guarantees of Municipal Securities, and with respect to Sustainable Municipal Income Fund, housing authority obligations. For purposes of this limitation (i) utilities will be divided according to their services (for example, gas, gas transmission, electric and telephone will each be considered a separate industry); and (ii) wholly-owned finance companies will be considered to be in the industries of their parents if their activities are primarily related to financing the activities of their parents.
As used in these fundamental investment policies by the Sustainable Municipal Income Fund, the Tax Free Bond Fund and the Short-Intermediate Municipal Bond Fund, the term “Municipal Securities” means securities issued by or on behalf of states, territories and possessions of the United States, including the District of Columbia, and their respective authorities, political subdivisions, agencies and instrumentalities, the interest on which is exempt from federal income tax.
The following policy applies to Sustainable Municipal Income Fund, the Short-Intermediate Municipal Bond Fund and the Tax Free Bond Fund:
Under normal circumstances, the Fund will invest at least 80% of its net assets in municipal bonds, the income from which is exempt from federal income tax. For purposes of this policy, the Fund’s net assets include borrowings by the Fund for investment purposes.
The following policy applies to the Sustainable Municipal Income Fund:
Under normal market circumstances, at least 80% of the assets of the Fund will be invested in Municipal Securities.
None of the Funds may:
1. Make loans, except that a Fund may (i) purchase or hold debt instruments in accordance with its investment objective and policies; (ii) enter into repurchase agreements; (iii) engage in securities lending as described in this Prospectus and in the Statement of Additional Information and (iv) make loans to the extent permitted by an order issued by the SEC.
2. Purchase securities on margin or sell securities short except, in the case of the Municipal Bond Funds, for use of short-term credit necessary for clearance of purchases of portfolio securities.
3. Underwrite the securities of other issuers except to the extent that a Fund may be deemed to be an underwriter under certain securities laws in the disposition of “restricted securities.”
4. Purchase physical commodities or contracts relating to physical commodities, except as permitted under the 1940 Act, or operate as a commodity pool, in each case as interpreted or modified by the regulatory authority having jurisdiction, from time to time.
5. Purchase participation or other direct interests in oil, gas or mineral exploration or development programs (although investments by all Funds in marketable securities of companies engaged in such activities are not hereby precluded).
6. Borrow money, except to the extent permitted under the 1940 Act, or the rules or regulations thereunder, as such statute, rules or regulations may be amended from time to time.
7. Purchase securities of other investment companies except as permitted by the 1940 Act and rules, regulations and applicable exemptive relief thereunder.
8. Issue senior securities except with respect to any permissible borrowings.
Part I - 7
9. Purchase or sell real estate (however, each Fund may, to the extent appropriate to its investment objective, purchase securities secured by real estate or interests therein or securities issued by companies investing in real estate or interests therein).
Non-Fundamental Policies. The following investment policies are not fundamental policies of the Funds and therefore can be changed by the Board of Trustees without prior shareholder approval.
No Fund may:
1. Acquire the securities of registered open-end investment companies or registered unit investment trusts in reliance on Section 12(d)(1)(F) or 12(d)(1)(G) of the 1940 Act.
INVESTMENT RESTRICTIONS AND POLICIES OF THE FUNDS THAT ARE SERIES OF JPMT IV
Fundamental Investment Policies
The Ultra-Short Municipal Fund:
(1)
May not make any investment inconsistent with the Fund’s classification as a diversified investment company under the 1940 Act.
(2)
May not purchase any security which would cause the Fund to concentrate more than 25% of the Fund’s investments in the securities of issuers primarily engaged in any particular industry or group of industries, provided that this limitation does not apply to Municipal Securities where the issuer is regarded as a state, city, municipality or other public authority or to governmental guarantees of Municipal Securities or to housing authority obligations.
(3)
May not issue senior securities, except as permitted by the 1940 Act or any rule, order or interpretation thereunder;
(4)
May not borrow money, except to the extent permitted by applicable law;
(5)
May not underwrite the securities of other issuers, except to the extent that the Fund, in disposing of portfolio securities, may be deemed an underwriter under certain securities laws;
(6)
May not invest directly in real estate unless it is acquired as a result of ownership of securities or other instruments. This restriction shall not prevent the Fund from investing in securities or other instruments (a) issued by companies that invest, deal or otherwise engage in transactions in real estate, or (b) backed or secured by real estate or interests in real estate;
(7)
May not purchase or sell commodities or commodity contracts except as may be permitted by the 1940 Act or unless acquired as a result of ownership of securities or other instruments issued by persons that purchase or sell commodities or commodities contracts; but this shall not prevent the Fund from purchasing, selling and entering into financial futures contracts (including futures contracts on indices of securities, interest rates and currencies), options on financial futures contracts (including futures contracts on indices of securities, interest rates and currencies), warrants, swaps, forward contracts, foreign currency spot and forward contracts or other derivative instruments including derivatives related to physical commodities; and
(8)
May make loans to other persons, in accordance with the Fund’s investment objective and policies and to the extent permitted by applicable law.
(9)
Under normal market circumstances, at least 80% of the assets of the Fund will be invested in municipal securities, the income from which is exempt from federal income tax.
Fundamental investment policy (3) shall be interpreted based upon no-action letters and other pronouncements of the staff of the SEC. Generally, the 1940 Act limits the Fund’s ability to borrow money on a non-temporary basis if such borrowings constitute “senior securities.” As noted above and in “Investment Strategies and Policies —Miscellaneous Investment Strategies and Risks — Borrowings” in SAI Part II, in addition to temporary borrowing, the Fund may borrow from any bank, provided that immediately after any such borrowing there is asset coverage of at least 300% for all borrowings by the Fund. The Fund may also borrow money or engage in economically similar transactions if those transactions do not constitute “senior securities” under the 1940 Act. Under current pronouncements, certain Fund positions (e.g. reverse repurchase agreements) are excluded from the definition of “senior security” so long as the Fund maintains adequate cover, segregation of assets or otherwise. Similarly, a short sale will not be considered a senior security if the Fund takes certain steps contemplated by SEC staff pronouncements, such as ensuring the short sale transaction is adequately covered.
Part I - 8
Non-Fundamental Investment Policies. The investment policies described below are non-fundamental policies of the Fund and may be changed by the Trustees of the Fund without shareholder approval.
The Ultra-Short Municipal Fund:
(1)
May not acquire securities of other investment companies, except as permitted by the 1940 Act or any order pursuant thereto; and
(2)
May not acquire the securities of registered open-end investment companies or registered unit investment trusts in reliance on Section 12(d)(1)(F) or 12(d)(1)(G) of the 1940 Act.
INVESTMENT PRACTICES
The Funds invest in a variety of securities and employ a number of investment techniques. What follows is a list of some of the securities and techniques which may be utilized by the Funds. For a more complete discussion, see the “Investment Strategies and Policies” section in Part II of this SAI.
| FUND NAME |
FUND CODE |
| Sustainable Municipal Income Fund |
1 |
| Short-Intermediate Municipal Bond Fund |
2 |
| Tax Free Bond Fund |
3 |
| Ultra-Short Municipal Fund |
4 |
| California Tax Free Bond Fund |
5 |
| High Yield Municipal Fund |
6 |
| Intermediate Tax Free Bond Fund |
7 |
| New York Tax Free Bond Fund |
8 |
| Instrument |
Fund Code |
Part II Section Reference |
| Adjustable Rate Mortgage Loans (“ARMs”): Loans in a mortgage pool which provide for a fixed initial mortgage interest rate for a specified period of time, after which the rate may be subject to periodic adjustments. |
2, 6 |
Mortgage-Related Securities |
| Asset-Backed Securities: Securities secured by company receivables, home equity loans, truck and auto loans, leases, and credit card receivables or other securities backed by other types of receivables or other assets. |
1-8 |
Asset-Backed Securities |
| Auction Rate Securities: Auction rate municipal securities and auction rate preferred securities issued by closed-end investment companies. |
1-8 |
Auction Rate Securities |
| Bank Obligations: Bankers’ acceptances, certificates of deposit and time deposits. Bankers’ acceptances are bills of exchange or time drafts drawn on and accepted by a commercial bank. Maturities are generally six months or less. Certificates of deposit are negotiable certificates issued by a bank for a specified period of time and earning a specified return. Time deposits are non-negotiable receipts issued by a bank in exchange for the deposit of funds. |
1-8 |
Bank Obligations |
| Borrowings: A Fund may borrow for temporary purposes and/or for investment purposes. Such a practice will result in leveraging of a Fund’s assets and may cause a Fund to liquidate portfolio positions when it would not be advantageous to do so. A Fund must maintain continuous asset coverage of 300% of the amount borrowed, with the exception for borrowings not in excess of 5% of the Fund’s total assets made for temporary administrative purposes. |
1-8 |
Miscellaneous Investment Strategies and Risks |
Part I - 9
| Instrument |
Fund Code |
Part II Section Reference |
| Call and Put Options: A call option gives the buyer the right to buy, and obligates the seller of the option to sell a security at a specified price at a future date. A put option gives the buyer the right to sell, and obligates the seller of the option to buy a security at a specified price at a future date. The Ultra-Short Municipal Fund will sell only covered call and secured put options. |
1-8 |
Options and Futures Transactions |
| Commercial Paper: Secured and unsecured short-term promissory notes issued by corporations and other entities. Maturities generally vary from a few days to nine months. |
1-8 |
Commercial Paper |
| Common Stock Warrants and Rights: Securities, typically issued with preferred stock or bonds, that give the holder the right to buy a proportionate amount of common stock at a specified price. |
3 |
Equity Securities Warrants and Rights |
| Corporate Debt Securities: May include bonds and other debt securities of domestic and foreign issuers, including obligations of industrial, utility, banking and other corporate issuers. |
1-8 |
Debt Instruments |
| Credit Default Swap (“CDS”): A swap agreement between two parties pursuant to which one party pays the other a fixed periodic coupon for the specified life of the agreement. The other party makes no payment unless a credit event, relating to a predetermined reference asset, occurs. If such an event occurs, the party will then make a payment to the first party, and the swap will terminate. |
1-3, 5-8 |
Swaps and Related Swap Products |
| Custodial Receipts: A Fund may acquire securities in the form of custodial receipts that evidence ownership of future interest payments, principal payments or both on certain U.S. Treasury notes or bonds in connection with programs sponsored by banks and brokerage firms. These are not considered to be U.S. government securities. These notes and bonds are held in custody by a bank on behalf of the owners of the receipts. |
1-3, 5-8 |
Custodial Receipts |
| Demand Features: Securities that are subject to puts and standby commitments to purchase the securities at a fixed price (usually with accrued interest) within a fixed period of time following demand by a Fund. |
1-8 |
Demand Features |
| Exchange-Traded Funds (“ETFs”): Ownership interest in unit investment trusts, depositary receipts, and other pooled investment vehicles that hold a portfolio of securities or stocks designed to track the price performance and dividend yield of a particular broad based, sector or international index. ETFs include a wide range of investments. |
1-3, 5-8 |
Investment Company Securities and Exchange Traded Funds |
| Foreign Investments: Equity and debt securities (e.g., bonds and commercial paper) of foreign entities and obligations of foreign branches of U.S. banks and foreign banks. Foreign securities may also include American Depositary Receipts (“ADRs”), Global Depositary Receipts (“GDRs”), European Depositary Receipts (“EDRs”) and American Depositary Securities. |
6 |
Foreign Investments (including Foreign Currencies) |
| High Yield/High Risk Securities/Junk Bonds: Securities that are generally rated below investment grade by the primary rating agencies or are unrated but deemed by a Fund’s adviser to be of comparable quality. |
1-8 |
Debt Instruments |
Part I - 10
| Instrument |
Fund Code |
Part II Section Reference |
| Inflation-Linked Debt Securities: Includes fixed and floating rate debt securities of varying maturities issued by the U.S. government as well as securities issued by other entities such as corporations, foreign governments and foreign issuers. |
4, 6 |
Debt Instruments |
| Interfund Lending: Involves lending money and borrowing money for temporary purposes through a credit facility. |
1-8 |
Miscellaneous Investment Strategies and Risks |
| Inverse Floating Rate Instruments: Leveraged variable debt instruments with interest rates that reset in the opposite direction from the market rate of interest to which the inverse floater is indexed. |
1-8 |
Inverse Floating and Interest Rate Caps |
| Investment Company Securities: Shares of other investment companies, including money market funds for which the adviser and/or its affiliates serve as investment adviser or administrator. The adviser will waive certain fees when investing in funds for which it serves as investment adviser, to the extent required by law or by contract. |
1-8 |
Investment Company Securities and Exchange Traded Funds |
| Loan Assignments and Participations: Assignments of, or participations in, all or a portion of loans to corporations or to governments, including governments in less developed countries. |
1-3, 5-8 |
Loans |
| Master Limited Partnerships(“MLPs”): Limited partnerships that are publicly traded on a securities exchange. |
6 |
Master Limited Partnerships |
| Mortgages (Directly Held): Debt instruments secured by real property. |
6 |
Mortgage-Related Securities |
| Mortgage-Backed Securities: Debt obligations secured by real estate loans and pools of loans such as collateralized mortgage obligations (“CMOs”), commercial mortgage- backed securities (“CMBSs”) and other asset-backed structures. |
1-8 |
Mortgage-Related Securities |
| Mortgage Dollar Rolls: A transaction in which a Fund sells securities for delivery in a current month and simultaneously contracts with the same party to repurchase similar but not identical securities on a specified future date. |
2, 6 |
Mortgage-Related Securities |
| Municipal Securities: Securities issued by a state or political subdivision to obtain funds for various public purposes. Municipal securities include, among others, private activity bonds and industrial development bonds, as well as general obligation notes, tax anticipation notes, bond anticipation notes, revenue anticipation notes, other short-term tax- exempt obligations, municipal leases, obligations of municipal housing authorities and single family revenue bonds. |
1-8 |
Municipal Securities |
| New Financial Products: New options and futures contracts and other financial products continue to be developed and a Fund may invest in such options, contracts and products. |
1-8 |
Miscellaneous Investment Strategies and Risks |
| Obligations of Supranational Agencies: Obligations which are chartered to promote economic development and are supported by various governments and governmental agencies. |
2 |
Foreign Investments (including Foreign Currencies) |
| Options and Futures Transactions: A Fund may purchase and sell (a) exchange traded and over the counter put and call options on securities, indexes of securities and futures contracts on securities and indexes of securities, and (b) futures contracts on securities and indexes of securities. |
1-8 |
Options and Futures Transactions |
Part I - 11
| Instrument |
Fund Code |
Part II Section Reference |
| Preferred Stock: A class of stock that generally pays a dividend at a specified rate and has preference over common stock in the payment of dividends and in liquidation. |
2, 6 |
Equity Securities, Warrants and Rights |
| Private Placements, Restricted Securities and Other Unregistered Securities: Securities not registered under the Securities Act of 1933 such as privately placed commercial paper and Rule 144A securities. |
1-8 |
Miscellaneous Investment Strategies and Risks |
| Real Estate Investment Trusts (“REITs”): Pooled investment vehicles which invest primarily in income producing real estate or real estate related loans or interest. |
6 |
Real Estate Investment Trusts |
| Repurchase Agreements: The purchase of a security and the simultaneous commitment to return the security to the seller at an agreed upon price on an agreed upon date. This is treated as a loan. |
1-8 |
Repurchase Agreements |
| Reverse Repurchase Agreements: The sale of a security and the simultaneous commitment to buy the security back at an agreed upon price on an agreed upon date. This is treated as borrowing by a Fund. |
1, 4, 6 |
Reverse Repurchase Agreements |
| Securities Issued in Connection with Reorganizations and Corporate Restructurings: In connection with reorganizing or restructuring of an issuer, an issuer may issue common stock or other securities to holders of its debt securities. |
6 |
Miscellaneous Investment Strategies and Risks |
| Short Selling: The Fund sells a security it does not own in anticipation of a decline in the market value of the security. To complete the transaction, the Fund must borrow the security to make delivery to the buyer. The Fund is obligated to replace the security borrowed by purchasing it subsequently at the market price at the time of replacement. |
6 |
Short Selling |
| Short-Term Funding Agreements: Agreements issued by banks and highly rated U.S. insurance companies such as Guaranteed Investment Contracts (“GICs”) and Bank Investment Contracts (“BICs”). |
1-8 |
Short-Term Funding Agreements |
| Sovereign Obligations: Investments in debt obligations issued or guaranteed by a foreign sovereign government or its agencies, authorities or political subdivisions. |
2, 6 |
Foreign Investments (including Foreign Currencies) |
| Stripped Mortgage-Backed Securities: Derivative multi- class mortgage securities which are usually structured with two classes of shares that receive different proportions of the interest and principal from a pool of mortgage assets. These include Interest Only (“IO”) and Principal Only (“PO”) securities issued outside a Real Estate Mortgage Investment Conduit (“REMIC”) or CMO structure. |
1-3, 5-8 |
Mortgage-Related Securities |
| Structured Investments: A security having a return tied to an underlying index or other security or asset class. Structured investments generally are individually negotiated agreements and may be traded over-the-counter. Structured investments are organized and operated to restructure the investment characteristics of the underlying security. |
1-8 |
Structured Investments |
| Swaps and Related Swap Products: Swaps involve an exchange of obligations by two parties. Caps and floors entitle a purchaser to a principal amount from the seller of the cap or floor to the extent that a specified index exceeds or falls below a predetermined interest rate or amount. A Fund may enter into these transactions to manage its exposure to changing interest rates and other factors. |
1-8 |
Swaps and Related Swap Products |
Part I - 12
| Instrument |
Fund Code |
Part II Section Reference |
| Synthetic Variable Rate Instruments: Instruments that generally involve the deposit of a long-term tax exempt bond in a custody or trust arrangement and the creation of a mechanism to adjust the long-term interest rate on the bond to a variable short-term rate and a right (subject to certain conditions) on the part of the purchaser to tender it periodically to a third party at par. |
1-8 |
Swaps and Related Swap Products |
| Temporary Defensive Positions: To respond to unusual circumstances a Fund may invest in cash and cash equivalents for temporary defensive purposes. |
1-8 |
Miscellaneous Investment Strategies and Risks |
| Treasury Receipts: A Fund may purchase interests in separately traded interest and principal component parts of U.S. Treasury obligations that are issued by banks or brokerage firms and that are created by depositing U.S. Treasury notes and U.S. Treasury bonds into a special account at a custodian bank. Receipts include Treasury Receipts (“TRs”), Treasury Investment Growth Receipts (“TIGRs”), and Certificates of Accrual on Treasury Securities (“CATS”). |
1-8 |
Treasury Receipts |
| Trust Preferreds: Securities with characteristics of both subordinated debt and preferred stock. Trust preferreds are generally long term securities that make periodic fixed or variable interest payments. |
6 |
Trust Preferreds |
| U.S. Government Agency Securities: Securities issued by agencies and instrumentalities of the U.S. government. These include all types of securities issued or guaranteed by the Government National Mortgage Association (“Ginnie Mae”), the Federal National Mortgage Association (“Fannie Mae”) and the Federal Home Loan Mortgage Corporation (“Freddie Mac”), including funding notes, subordinated benchmark notes, CMOs and REMICs. |
1-8 |
Mortgage-Related Securities |
| U.S. Government Obligations: May include direct obligations of the U.S. Treasury, including Treasury bills, notes and bonds, all of which are backed as to principal and interest payments by the full faith and credit of the United States, and separately traded principal and interest component parts of such obligations that are transferable through the Federal book-entry system known as Separate Trading of Registered Interest and Principal of Securities (“STRIPS”) and Coupons Under Book Entry Safekeeping (“CUBES”). |
1-8 |
U.S. Government Obligations |
| Variable and Floating Rate Instruments: Obligations with interest rates which are reset daily, weekly, quarterly or some other frequency and which may be payable to a Fund on demand or at the expiration of a specified term. |
1-8 |
Debt Instruments |
| When-Issued Securities, Delayed Delivery Securities and Forward Commitments: Purchase or contract to purchase securities at a fixed price for delivery at a future date. |
1-8 |
When-Issued Securities, Delayed Delivery Securities and Forward Commitments |
| Zero-Coupon, Pay-in-Kind and Deferred Payment Securities: Zero-coupon securities are securities that are sold at a discount to par value and on which interest payments are not made during the life of the security. Pay- in-kind securities are securities that have interest payable by delivery of additional securities. Deferred payment securities are zero-coupon debt securities which convert on a specified date to interest bearing debt securities. |
1-8 |
Debt Instruments |
Part I - 13
ADDITIONAL INFORMATION REGARDING INVESTMENT PRACTICES
The following information is a summary of special factors that may affect any Fund invested in municipal securities from the States of California, New York and the Commonwealth of Puerto Rico, and is derived from public official documents relating to securities offerings of state issuers, which generally are available to investors. The following information constitutes only a brief summary of the information in such public official documents; it has not been independently verified and does not purport to be a complete description of all considerations regarding investment in the municipal securities discussed below. Information provided herein may not be current and is subject to change rapidly, substantially and without notice. Especially with respect to Puerto Rico’s debt restructuring process, events could occur rapidly that significantly affect the value of municipal securities of Puerto Rico.
The value of the shares of the Funds discussed in this section may fluctuate more widely than the value of shares of a portfolio investing in securities relating to a number of different states. The ability of state, county or other local governments to meet their obligations will depend primarily on the availability of tax and other revenues to those governments and on their fiscal conditions generally.
Further, downgrades of certain municipal securities insurers during the 2007-09 recession negatively impacted the price of certain insured municipal securities. Given the large number of potential claims against municipal securities insurers, there is a risk that they will be unable to meet all future claims. Given the recent bankruptcy-type proceedings by the Commonwealth of Puerto Rico, risks associated with municipal securities insurers are heightened. The perceived increased likelihood of default among municipal issuers resulted in constrained liquidity, increased price volatility and credit downgrades of municipal issuers. Local and national market forces, such as declines in real estate prices and general business activity, may result in decreasing tax bases, fluctuations in interest rates, and increasing construction costs, all of which could reduce the ability of certain municipal issuers to repay their obligations. Certain municipal issuers have also been unable to obtain additional financing through, or must pay higher interest rates on, new issues, which may reduce revenues available for municipal issuers to pay existing obligations. In addition, in certain circumstances it may be difficult for investors to obtain reliable information on the obligations underlying municipal securities. Adverse developments in the municipal securities market, such as the recent bankruptcy-type proceedings by the Commonwealth of Puerto Rico, may negatively affect the value of all or a substantial portion of a Fund’s municipal securities.
California Municipal Securities
Under normal circumstances, the California Tax Free Bond Fund invests at least 80% of its total assets in municipal securities. For purposes of this policy, “municipal securities” has the same meaning as California Municipal Securities. California Municipal Securities are obligations of any duration (or maturity) issued by California, its political subdivisions and their agencies, authorities and instrumentalities and any other obligations, the interest from which is exempt from California personal income tax. The interest from many but not all California Municipal Securities also is exempt from federal income tax. The California Tax Free Bond Fund may also invest in debt obligations of state and municipal issuers outside of California. In general, the interest on such securities is exempt from federal income tax but subject to California income tax. A portion of the Fund’s distributions from interest on California Municipal Securities and other municipal securities in which the California Tax Free Bond Fund invests may under certain circumstances be subject to federal alternative minimum tax. See “Tax Matters.”
Additional Information Regarding California Municipal Securities
As used in this section, “municipal securities” refers to municipal securities, the interest of which is exempt from gross income for federal income tax purposes, exempt from California personal income taxes and is not subject to the federal alternative minimum tax on individuals.
Risk Factors Affecting California Municipal Securities. Given that the California Tax Free Bond Fund is invested primarily in California Municipal Securities, the Fund is subject to risks relating to the economy of the state of California (as used in this section, the “State”) and the financial condition of the State and local governments and their agencies.
Overview of State Economy. California’s economy, the largest among the 50 states, has major components in high technology, trade, entertainment, manufacturing, government, tourism, construction and services. As a result, economic problems or factors that negatively impact these sectors may have a negative effect on the value of California Municipal Securities.
Part I - 14
The State's revenues have historically been volatile and, while correlated to overall economic conditions, are also heavily dependent on revenues related to stock market appreciation. The State faces fiscal challenges including significant unfunded liabilities of the State’s two main retirement systems and post-employment health care and dental benefits for eligible retired employees of the State. From year-to-year, the State may experience a number of political, social and economic circumstances that influence its economic and fiscal condition. Such circumstances may include: rising debt levels; revenue volatility; tax base erosion; developments in the U.S. and world economies; and changes to U.S. federal economic and fiscal policies, including the amount of federal aid provided to the State and its municipalities.
In addition, the spread of an infectious respiratory illness caused by a novel strain of coronavirus (known as COVID-19), which began in early 2020, has created financial and economic challenges for the State. In response to the pandemic, the State and many local governments ordered the closure of non-essential businesses and recommended or required social-distancing, instituted “shelter-in-place” policies and limited the size of gatherings. The pandemic and the related responses materially and adversely impacted the State’s economy. While the economy has improved since the second half of 2020 and while California real GDP has recovered to pre-pandemic levels in the second quarter of 2021, recovery of nonfarm employment for the State is not expected until the second half of 2022.
In addition, although vaccines for COVID-19 have been approved for emergency use in the United States, the timing of the administration of vaccines and the continued risk of variants or mutations of COVID-19, among other factors, make it impossible to predict the timing of an end to the pandemic. As a result, the full potential impact of COVID-19 on the State is uncertain, and it is possible that reasonable expectations about the State’s economic recovery could prove inaccurate. The State and local governments may take further action to contain or mitigate the spread of COVID-19 including the spread of new COVID-19 variants, which could further reduce or disrupt business operations and have long-term negative economic effects on the State’s economy and State and local government budgets.
There can be no assurances that the State will not face additional fiscal stress or that such circumstances will not become more difficult in the future. Moreover, there can be no guarantee that other changes in the State or national economies will not have a materially adverse impact on the State’s financial condition. Any deterioration in the State’s financial condition may have a negative effect on the value of the securities issued by the State and its municipalities, which could reduce the performance of the Fund.
In addition, the pension funds managed by the State’s principal retirement systems, the California Public Employees’ Retirement System (“CalPERS”) and the California State Teachers’ Retirement System (“CalSTRS”), face significant unfunded actuarial liabilities that will require increased contributions from the State’s General Fund (as used in this section, “General Fund”) in future years.
The most recent actuarial estimate of CalPERS showed an accrued unfunded liability allocable to state employees (excluding pension liabilities for judges and elected officials) of $63.0 billion (an increase of $1.6 billion from June 30, 2019). According to the most recent actuarial estimate of CalSTRS, the State’s proportionate unfunded liability was $32.9 billion at June 30, 2020, an increase of $1.6 billion from June 30, 2019. The State also has significant unfunded liabilities relating to retirees’ post-employment healthcare and dental benefits. As of June 30, 2020, the State’s unfunded actuarial accrued liability for other post-employment benefits was approximately $97.9 billion.
There can be no assurance that any issuer of a California Municipal Security will make full or timely payments of principal or interest or remain solvent. However, it should be noted that the creditworthiness of obligations issued by local California issuers may be unrelated to the creditworthiness of obligations issued by the State, and there is no obligation on the part of the State to make payment on such local obligations in the event of default.
General Risks. Many complex political, social and economic factors influence the State’s economy and finances, which may affect the State’s budget unpredictably from year to year. Such factors include, but are not limited to: (i) the performance of the national and State economies; (ii) the receipt of revenues below projections; (iii) a delay in or an inability of the State to implement budget solutions as a result of current or future litigation; (iv) an inability to implement all planned expenditure reductions; (v) extreme weather events, wildfires, pandemics, drought or earthquakes; and (vi) actions taken by the federal government, including audits, disallowances, and changes in aid levels.
These factors are continually changing, and no assurances can be given with respect to how these factors or other factors will materialize in the future or what impact they will have on the State’s fiscal and economic condition. Such factors could have an adverse impact on the State’s budget and could result in declines, possibly severe, in the value of the State’s outstanding obligations. These factors may also lead to
Part I - 15
an increase in the State’s future borrowing costs and could impair the State’s ability to make timely payments of interest and principal on its obligations. These factors may also impact the ability of California’s municipal issuers to issue new debt or service their outstanding obligations.
In addition, the State is subject to episodic water shortages owing to drought conditions. At the beginning of 2014, then-Governor Jerry Brown announced a state of emergency as a result of severe drought conditions in the State that persisted into 2017. The State Water Resources Control Board and Governor Jerry Brown took significant steps to deal with the drought. Future droughts may require the use of significant funding from the State’s budget. While the drought was one of the most severe in the State’s history and the subsequent rainfall caused damage, the drought did not impact any sectors of the State economy beyond the agricultural sector and the rainfall did not affect materially the State’s economy or budget. More recently, the Governor declared a drought emergency on April 21, 2021, and subsequently expanded the drought proclamation to cover all 58 counties in California. Current and future drought conditions could have a severe impact on the State’s economy and, consequently, on State and local governmental budgets, which could affect any California municipal securities held by a Fund.
Moreover, the State is within a region subject to major seismic activity and has experienced major earthquakes in the past that caused significant damage. Although the federal government has provided aid in the aftermath of previous major earthquakes, there is no guarantee that it will do so in the future. An obligation in the Fund could be impacted by interruption in revenues as a result of damage caused by earthquakes or as a result of income tax deductions for casualty losses or property tax assessment reductions.
Over the past several years, California has experienced unprecedented wildfire activity with increases in the number and severity of wildfires. Ten of the most destructive fires have occurred since 2015, and 2020 was the worst wildfire season in the State’s history. The damage caused by past, current and future wildfires, and related economic cost caused by power outages, could have long-term negative economic effects on the State’s economy and, consequently, on State and local governmental budgets, which could affect any California municipal securities held by a Fund.
Budget for Fiscal Year 2021-22. On June 28, 2021, Governor Gavin Newsom signed the 2021 Budget Act, which includes a multi-year forecast that reflects a budget roughly in balance. The Enacted Budget projected total budget reserves of $28.3 billion at the end of fiscal year 2021-22, including the addition $3.4 billion to the State’s rainy day fund.
When the 2021 Budget Act was enacted, it projected General Fund revenues and transfers of $175.3 billion for fiscal year 2021-22 (a decrease of $13.5 billion from revised estimates for the prior fiscal year), which included estimated personal income tax receipts of $123.3 billion, sales tax receipts of $29 billion and corporation tax receipts of $18.1 billion. General Fund expenditures for fiscal year 2021-22 were projected to be $196.4 billion, which constitutes a increase of $30.3 billion compared to the revised estimates for prior fiscal year 2021-22. The 2021 Budget Act contains initiatives to fund State programs. As part of these initiatives, the 2021 Budget Act includes General Fund funding of $65.5 billion for K-12 education, $21.2 billion for higher education, $57.5 billion for health and human services expenditures, as well as $13.9 billion for corrections and rehabilitation.
Proposed Budget for Fiscal Year 2022-23. On January 10, 2022, Governor Gavin Newsom proposed a budget for fiscal year 2022-23 (“Proposed Budget”). The Proposed Budget estimates that the General Fund will receive $195.7 billion in revenues and transfers, which would represent a $1 billion decrease from revised fiscal year 2021-22 estimates. Against these revenues, the Proposed Budget calls for approximately $213.1 billion in General Fund expenditures, which would be an increase of approximately $13.1 billion from revised fiscal year 2021-22 estimates. The Proposed Budget contains initiatives to fund State programs. As part of these initiatives, the Proposed Budget includes General Fund funding of $70.5 billion for K-12 education, $21.8 billion for higher education, $64.7 billion for health and human services expenditures, as well as $15 billion for corrections and rehabilitation. The Proposed Budget estimates that by end of fiscal 2022 the State will have $20.9 billion in its constitutionally-established rainy day fund, as well as an estimated $3.1 billion in operating reserves.
LAO Report. On January 13, 2022, the Legislative Analyst’s Office (“LAO”), a nonpartisan fiscal and policy advisor to the State, released its analysis of the Proposed Budget. In reaching its conclusions, the LAO performs an independent assessment of the outlook for California’s economy, demographics, revenues and expenditures. In the report, the LAO noted that the Governor's Budget was less cautious with respect to potential outcomes compared to previous budgets, and that assumptions in the Budget that revenues will be higher than anticipated carried considerable risks. In addition, the LAO noted that certain State’s budget reserves were below their respective pre-pandemic shares, and therefore advised the
Part I - 16
Legislature to consider increasing general purpose reserves above the level proposed by the Governor. Moreover, the LAO advised that, in light of the scale of last year’s budget initiatives, the Legislature should be cautious in creating new programs or expanding the scope of existing programs. Finally, the LAO recommended that the Legislature consider longer-term COVID-19 planning in light of the fact that the Omicron variant emerged in the State after the Governor’s Budget was likely developed.
May Revision. On May 13, 2022, Governor Newsom revised the Proposed Budget (“May Revision”). Compared to the Proposed Budget, the May Revision reflects a $23.9 billion increase in estimated General Fund revenue even after the restoration of temporary business tax credits earlier in the year and an increase of $14.2 billion in total expenditures. The Proposed Budget under the May Revision does not exceed constitutionally mandated limits on State spending.
Limitation on Property Taxes. Certain State debt obligations may be obligations of issuers that rely in whole or in part, directly or indirectly, on ad valorem property taxes as a source of revenue. The taxing powers of State local governments and districts are limited by Article XIIIA of the State Constitution, enacted by the voters in 1978 and commonly known as “Proposition 13.” Article XIIIA limits the rate of ad valorem property taxes to 1% of full cash value of real property and generally restricts the reassessment of property to 2% per year, except upon new construction or change of ownership (subject to a number of exemptions). Taxing entities may, however, raise ad valorem taxes above the 1% limit to pay debt service on voter-approved bonded indebtedness. Under Article XIIIA, the basic 1% ad valorem tax levy is applied against the assessed value of property as of the owner’s date of acquisition (or as of March 1, 1975, if acquired earlier), subject to certain adjustments. This system has resulted in widely varying amounts of tax on similarly situated properties. Article XIIIA prohibits local governments from raising revenues through ad valorem taxes above the 1% limit. Article XIIIA also requires voters of any governmental unit to give two-thirds approval to levy any “special tax” (i.e., a tax devoted to a specific purpose). In November 2020, voters approved an initiative measure that will allow certain homeowners to transfer their tax base to a replacement residence and will modify the taxation of certain inherited properties. The impact of this measure on local property taxes is unknown and could have an adverse impact on the ability of municipal issuers to satisfy their debt obligations.
Limitations on Other Taxes, Fees and Charges. On November 5, 1996, the voters of the State approved Proposition 218. Proposition 218 added Articles XIIIC and XIIID to the State Constitution, which contain a number of provisions affecting the ability of local agencies to levy and collect both existing and future taxes, assessments, fees and charges. Article XIIIC requires that all new or increased local taxes be submitted to the voters before they become effective. Taxes for general governmental purposes require a majority vote and taxes for specific purposes require a two-thirds vote. Article XIIID contains several provisions that make it generally more difficult for local agencies to levy and maintain “assessments” for municipal services and programs. Article XIIID also contains several provisions affecting “fees” and “charges,” defined for purposes of Article XIIID to mean “any levy other than an ad valorem tax, a special tax, or an assessment, imposed by a local government upon a parcel or upon a person as an incident of property ownership, including a user fee or charge for a property related service.” All new and existing property related fees and charges must conform to requirements prohibiting, among other things, fees and charges that generate revenues exceeding the funds required to provide the property related service or are used for unrelated purposes. There are notice, hearing and protest procedures for levying or increasing property related fees and charges, and, except for fees or charges for sewer, water and refuse collection services (or fees for electrical and gas service, which are not treated as “property related” for purposes of Article XIIID), no property related fee or charge may be imposed or increased without majority approval by the property owners subject to the fee or charge or, at the option of the local agency, two-thirds voter approval by the electorate residing in the affected area.
Appropriations Limits. The State and its local governments are subject to an annual “appropriations limit” imposed by Article XIIIB of the California Constitution, enacted by the voters in 1979 and significantly amended by Propositions 98 and 111 in 1988 and 1990, respectively. Article XIIIB prohibits the State or any covered local government from spending “appropriations subject to limitation” in excess of the appropriations limit imposed. “Appropriations subject to limitation” are authorizations to spend “proceeds of taxes,” which consist of tax revenues and certain other funds, including proceeds from regulatory licenses, user charges or other fees, to the extent that such proceeds exceed the cost of providing the product or service, but “proceeds of taxes” exclude most State subventions to local governments. No limit is imposed on appropriations of funds that are not “proceeds of taxes,” such as reasonable user charges or fees, and certain other non-tax funds, including bond proceeds. The appropriations limit for each year is adjusted annually to reflect changes in cost of living and population, and any transfers of service responsibilities between government units. The definitions for such adjustments were liberalized in
Part I - 17
1990 to follow more closely growth in the State’s economy. “Excess” revenues are measured over a two-year cycle. Local governments must return any excess to taxpayers by rate reductions. The State must refund 50% of any excess, with the other 50% paid to schools and community colleges. Local governments may exceed their spending limits for up to four years by voter approval.
Because of the complex nature of Articles XIIIA, XIIIB, XIIIC and XIIID of the California Constitution, the ambiguities and possible inconsistencies in their terms, the impossibility of predicting future appropriations or changes in population and cost of living and the probability of continuing legal challenges, it is not currently possible to determine fully the impact of these Articles on California debt obligations or on the ability of the State or local governments to pay debt service on such California debt obligations. It is not possible, at the present time, to predict the outcome of any pending litigation with respect to the ultimate scope, impact or constitutionality of these Articles or the impact of any such determinations upon State agencies or local governments, or upon their ability to pay debt service on their obligations. Further initiatives or legislative changes in laws or the California Constitution may also affect the ability of the State or local issuers to repay their obligations.
State Debt. California has a substantial amount of debt outstanding. As of January 1, 2022, the State had approximately $69.7 billion of general obligations bonds and $8.5 billion of lease-revenue bonds outstanding. These obligations are payable principally from the State’s General Fund or from lease payments paid from the operating budget of the respective lessees, which operating budgets are primarily, but not exclusively, derived from the General Fund. Additionally, as of January 1, 2022, there were approximately $33.6 billion of authorized and unissued voter-approved general obligation bonds and approximately $7.2 billion of authorized and unissued lease revenue bonds.
Based on estimates from the Department of Finance and updates from the State Treasurer’s Office, approximately $7.6 billion of new money general obligation bonds and approximately $1 billion of lease-revenue bonds are expected to be issued in fiscal year 2022-23.
Because the State plans to issue authorized, but unused, new bond sales in the future, the ratio of debt service on general obligation, lease-revenue bonds supported by the General Fund to annual General Fund revenues and transfers (“General Fund Debt Ratio”) can be expected to fluctuate from year to year. Based on the revenue estimates contained in the Proposed Budget and the bond issuance estimates noted above, the General Fund Debt Ratio had been estimated to equal approximately 3.99% and 3.98% in fiscal years 2021-22 and 2022-23, respectively.
In addition to general obligation bonds, lease-revenue bonds, and other types of debt, the State may issue certain short-term obligations such as revenue anticipation notes (“RANs”) and revenue anticipation warrants (“RAWs”). Due to the timing differences between when the State receives General Fund receipts and when it makes General Fund disbursements, the State regularly issues short-term obligations to meet its cash flow needs. By law, RANs must mature prior to the end of the fiscal year in which they are issued, while RAWs may mature in a subsequent fiscal year.
In fiscal year 2021-22, the State did not plan to issue RANs. Furthermore, for fiscal year 2022-23, the State does not plan to issue RANs. If cash resources become inadequate, other cash management techniques may be employed to meet the State’s cash requirements.
Rainy Day Fund Amendment. In November 2014, voters approved Proposition 2, a constitutional amendment that provides for a “rainy day” reserve called the Budget Stabilization Account (“BSA”) that requires both paying down liabilities and saving for a rainy day by making specified deposits into a special reserve by using spikes in capital gains to save money. Capital gains are the state’s most volatile revenue source, and absent a recession, a stock market correction could significantly affect the State. Based on the May Revision, the BSA is projected to have a balance of $23.3 billion by the end of fiscal year 2022-23.
State-Local Fiscal Relations. In November 2004, voters approved Proposition 1A, which made significant changes to the fiscal relationship between the State and California’s local governments by, among other things, reducing the State Legislature’s authority over local government revenue sources by restricting the State’s access to local governments’ property, sales and vehicle license fee revenues without meeting certain conditions. Proposition 22, adopted on November 2, 2010, supersedes some parts of Proposition 1A of 2004 and completely prohibits any future borrowing by the State from local government funds. Additionally, Proposition 22 generally prohibits the State Legislature from making changes in local government funding sources.
Proposition 1A also prohibits the State from requiring localities to comply with certain unfunded mandates. Under the law, if the State does not provide the funding necessary to implement the mandate, the mandate is suspended and the locality is relieved from compliance.
Part I - 18
State-Federal Fiscal Relations. California receives substantial federal aid for various governmental purposes, including funds to support state-level health care, education and transportation initiatives. California also receives federal funding to help the State respond to, and recover from, severe weather events and other natural disasters. In addition, on March 11, 2021, the United States enacted the American Rescue Plan Act of 2021 (ARPA) to address public health and economic impacts of COVID-19. As of January 2022, total federal funding relating to the COVID-19 pandemic allocated to State programs was approximately $251 billion, including $27 billion from ARPA in state fiscal recovery funds that may be used to respond to the public health emergency or its negative economic impacts, replace lost revenue and to make necessary investments in water, sewer, or broadband infrastructure. Of the $27 billion in state fiscal recovery funds, approximately $9.2 billion was appropriated to the Enacted Budget.. There can be no assurance that the State will be reimbursed by the federal government for these costs or that financial assistance from the federal government will continue in the future. The federal government may enact other budgetary changes or take other actions that could adversely affect California’s finances.
Municipal Downgrades and Bankruptcies. Municipal bonds may be more susceptible to being downgraded, and issuers of municipal bonds may be more susceptible to default and bankruptcy, during recessions or similar periods of economic stress. Factors contributing to the economic stress on municipalities may include lower property tax collections as a result of lower home values, lower sales tax revenue as a result of consumers cutting back from spending and lower income tax revenue as a result of a high unemployment rate. In addition, as certain municipal obligations may be secured or guaranteed by banks and other institutions, the risk to the Fund could increase if the banking or financial sector suffers an economic downturn and/or if the credit ratings of the institutions issuing the guarantee are downgraded or at risk of being downgraded by a national rating organization. Such a downward revision or risk of being downgraded may have an adverse effect on the market prices of the bonds and thus the value of the Fund’s investments.
Downgrades of certain municipal securities insurers have in the past negatively impacted the price of certain insured municipal securities. Given the large number of potential claims against municipal securities insurers, there is a risk that they will be unable to meet all future claims. In the past, certain municipal issuers either have been unable to issue bonds or access the market to sell their issues or, if able to access the market, have issued bonds at much higher rates, which may reduce revenues available for municipal issuers to pay existing obligations. Should the State or municipalities fail to sell bonds when and at the rates projected, the State could experience significantly increased costs in the General Fund and a weakened overall cash position in the current fiscal year.
Further, an insolvent municipality may file for bankruptcy. For example, Chapter 9 of the U.S. Bankruptcy Code provides a financially distressed municipality protection from its creditors while it develops and negotiates a plan for reorganizing its debts. “Municipality” is defined broadly by the U.S. Bankruptcy Code as a “political subdivision or public agency or instrumentality of a state” and may include various issuers of securities in which the Fund invests. The reorganization of a municipality’s debts may be accomplished by extending debt maturities, reducing the amount of principal or interest, refinancing the debt or other measures, which may significantly affect the rights of creditors and the value of the securities issued by the municipality. Because the Fund’s performance depends, in part, on the ability of issuers to make principal and interest payments on their debt, any actions to avoid making these payments could reduce the Fund’s returns.
In the past, as a result of financial and economic difficulties, several California municipalities filed for bankruptcy protection under Chapter 9. Additional municipalities could file for bankruptcy protection in the future. Any such action could negatively impact the value of the Fund’s investments in the securities of those issuers or other issuers in the State.
Litigation. The State is a party to numerous legal proceedings, many of which normally occur in government operations. In addition, the State is involved in certain other legal proceedings (described in the State’s recent financial statements) that, if decided against the State, might require the State to make significant future expenditures or substantially impair future revenue sources. Because of the prospective nature of these proceedings, it is not presently possible to predict the outcome of such litigation, estimate the potential impact on the ability of the State to pay debt service costs on its obligations, or determine what impact, if any, such proceedings may have on a Fund’s investments.
Bond Ratings. As of June 1, 2022, California’s general obligation debt was assigned a rating of Aa2 by Moody’s, AA- by S&P, and AA by Fitch. These ratings reflect only the views of the respective rating agency, an explanation of which may be obtained from each such rating agency. There is no assurance that these ratings will continue for any given period of time or that they will not be revised or withdrawn
Part I - 19
entirely by the rating agency if, in the judgment of such rating agency, circumstances so warrant. A downward revision or withdrawal of any such rating may have an adverse effect on the market prices of the securities issued by the State, its municipalities, and their political subdivisions, instrumentalities and authorities.
Additional Information Regarding New York Municipal Securities
As used in this section, the term “New York Municipal Securities” refers to municipal securities, the interest on which is excluded from gross income for federal income tax purposes, exempt from New York State and New York City personal income taxes and is not subject to the federal alternative minimum tax on individuals.
Risk Factors Regarding Investments in New York Municipal Securities. Given that the New York Tax Free Bond Fund is invested primarily in New York Municipal Securities, the Fund is subject to risks relating to the economy of the state of New York (as used in this section, the “State”) and the financial condition of the State and local governments and their agencies.
Overview of State Economy. Although New York has a diverse economy, it is heavily dependent on the financial sector, in part, because New York City is the nation’s leading center of banking and finance. Even though the financial sector accounts for a small proportion of all non-agricultural jobs in the State, it contributes a significant amount of total wages in New York. In addition to the financial sector, the State has a comparatively large share of the nation’s information, education and health services employment. Travel and tourism also constitute an important part of the economy. As a result, economic problems or factors that negatively impact these sectors may have a negative effect on the value of New York Municipal Securities.
The State continues to face significant fiscal challenges, including budget deficits. Moreover, the level of public debt in the State may affect long-term growth prospects and could cause some municipalities to experience financial hardship. The State's economic condition has been and may continue to be volatile due to its dependence on the financial activities sector.
In addition, the spread of COVID-19, which began in early 2020, created financial and economic challenges for the State. In response to the pandemic, the State and many local governments ordered the closure of non-essential businesses and recommended or required social-distancing, instituted “shelter-in-place” policies and limited the size of gatherings. The pandemic and the related responses materially and adversely impacted the State’s economy. While the economy has improved since the second half of 2020, the State’s recovery has been incomplete and uneven. In addition, although vaccines for COVID-19 have been approved for emergency use in the United States, the timing of the administration of vaccines and the continued risk of variants or mutations of COVID-19, among other factors, make it impossible to predict the timing of an end to the pandemic. As a result, the full potential impact of COVID-19 on the State is uncertain, and it is possible that reasonable expectations about the State’s economic recovery could prove inaccurate. The State and local governments may take further action to contain or mitigate the spread of COVID-19 including the spread of new COVID-19 variants, which could further reduce or disrupt business operations and have long-term negative economic effects on the State’s economy and State and local government budgets.
Other substantial risks remain that could undermine the State’s financial and economic projections. For example, federal spending cuts, modifications to the federal tax structure, tax base erosion, uncertainty regarding the Federal Reserve’s policies, national and international events, climate change and extreme weather events, regulatory changes concerning financial sector activities, major policy changes under the current presidential administration, changes concerning financial sector bonus payouts, economic events in Europe, and volatility in commodity prices, among others, could contribute to weakened economic growth, which could reduce State revenues. As the nation’s financial capital, the volatility in financial markets poses a particularly large degree of uncertainty for the State. In addition, financial markets have demonstrated a sensitivity to recent events that include shifting expectations surrounding energy prices, Federal Reserve policy, and global growth, and the resulting market variations are likely to have a larger impact on the State’s economy than on the nation as a whole.
Accordingly, there can be no assurances that the State will not face fiscal stress or that the State’s circumstances will not become more difficult in the future. Moreover, there can be no guarantee that other changes in the State or national economies will not have a materially adverse impact on the State’s financial condition. Any deterioration in the State’s financial condition may have a negative effect on the value of the securities issued by the State and its municipalities, which could reduce the performance of a Fund.
Part I - 20
Furthermore, there can be no assurance that any issuer of a New York Municipal Security will make full or timely payments of principal or interest or remain solvent. However, it should be noted that the creditworthiness of obligations issued by local New York issuers may be unrelated to the creditworthiness of obligations issued by the State, and there may be no obligation on the part of the State to make payment on such local obligations in the event of default.
General Risks. Many complex political, social and economic factors influence the State’s economy and finances, which may affect the State’s budget unpredictably from year to year. Such factors include, but are not limited to: (i) the performance of the national and State economies; (ii) the volatility in energy markets; (iii) the impact of changes concerning financial sector bonus payouts, as well as any future legislation governing the structure of compensation; (iv) the impact of shifts in monetary policy on interest rates and the financial markets; (v) the impact of financial and real estate market developments on bonus income and capital gains realizations; (vi) the impact of household deleveraging on consumer spending and the impact of that activity on State tax collections; (vii) increased demand in entitlement and claims based programs such as Medicaid, public assistance and general public health; (viii) access to the capital markets in light of disruptions in the municipal bond market; (ix) litigation against the State; (x) actions taken by the federal government, including audits, disallowances, changes in aid levels, and changes to Medicaid rules; (xi) the impact of federal statutory and regulatory changes concerning financial sector activities; and (xii) extreme weather events and pandemics, including potential long term risks stemming from COVID-19.
These factors are continually changing, and no assurances can be given with respect to how these factors or other factors will materialize in the future or what impact they will have on the State’s fiscal and economic condition. Such factors could have an adverse impact on the State’s budget and could result in declines, possibly severe, in the value of the State’s outstanding obligations. These factors may also lead to an increase in the State’s future borrowing costs and could impair the State’s ability to make timely payments of interest and principal on its obligations. These factors may also impact the ability of New York’s municipal issuers to issue new debt or service their outstanding obligations.
Between 2011 and 2012, New York sustained damage from three powerful storms that caused widespread damage within the State and the region: Hurricanes Irene and Sandy as well as Tropical Storm Lee. The State’s rebuilding efforts have partly been dependent on federal aid: the State and its municipalities have received tens of billions of dollars in federal aid to assist with recovery efforts. There can be no assurance that all anticipated federal disaster aid will be provided to the State, that such aid will be provided on any expected timeline or that similar aid will be provided for damage sustained from subsequent storms. Any significant additional State obligations and expenditures associated with Sandy rebuilding efforts could negatively affect the State’s ability to honor its outstanding obligations, which could have a negative effect on the value of New York’s municipal securities.
Budget for Fiscal Year 2022. On April 9, 2022, the Governor finalized the enactment of the budget for fiscal year 2023. The budget calls for approximately $95.6 billion in the State’s General Fund (as used in this section, “General Fund”) expenditures for fiscal year 2023, which represents an increase of 5.4% from estimated expenditures in fiscal year 2022, which includes $64.9 billion in local assistance grants (an increase of 6%) and $21.6 billion for State operations (a decrease of 0.6%). The budget assumes that the General Fund will receive tax receipts of nearly $92.7 billion (a decrease of 17.3%) in fiscal year 2022, which includes $67.5 billion (an increase of 15%) in personal income tax revenues, $9.6 billion in business tax receipts (an increase of 17.3%), and $16.3 billion consumption/use tax receipts (a decrease of 0.7%), among others. As a result of these projections, the DOB estimates that the State will end fiscal year 2023 with a General Fund balance of approximately $27.7 billion.
Public Authorities. Public authorities are created pursuant to State law, are not subject to the constitutional restrictions on the incurrence of debt that apply to the State itself and may issue bonds and notes subject to restrictions set forth in legislative authorization. The State’s access to the public credit markets could be impaired and the market price of its outstanding debt may be materially and adversely affected if certain of its public authorities were to default on their respective obligations.
The State has numerous public authorities with various responsibilities, including those that finance, construct and/or operate revenue-producing public facilities. Public authorities generally pay their operating expenses and debt service costs from revenues generated by the projects they finance or operate, such as tolls charged for the use of highways, bridges or tunnels, charges for public power, electric and gas utility services, rentals charged for housing units, and charges for occupancy at medical care facilities. Because of the structure of these public authorities, they may also suffer in poor economic environments.
Part I - 21
In addition, there are statutory arrangements providing for State local assistance payments otherwise payable to localities to be made instead to the issuing public authorities in order to secure the payment of debt service on their revenue bonds and notes. However, the State has no obligation to provide additional assistance to localities beyond any amounts that have been appropriated in a given year. Some authorities also receive funds from State appropriations to pay for the operating costs of certain programs.
State Debt. At the end of fiscal year 2022, total State-related debt outstanding was approximately $41.9 billion, equal to approximately 2.74% of New York personal income. State-related debt is a broad measure of State debt that includes general obligation debt, State-guaranteed debt, moral obligation financing and contingent-contractual obligations.
In 2000, the State Legislature passed the Debt Reform Act of 2000 (the “Debt Reform Act”), which allows the issuance of State-supported debt only for capital purposes and limits the maximum term of any such debt to 30 years. The Debt Reform Act also limits the amount of new State-supported debt to 4% of State personal income and new State-supported debt service costs to 5% of all State funds receipts. Once these caps are met, the State is prohibited from issuing any new State-supported debt until such time as the State’s debt is found to be within the applicable limits. For fiscal year 2021, outstanding State-supported debt was below these limits. The fiscal year 2021 enacted budget provided for a one-year suspension of the Debt Reform Act provisions covering all issuances in fiscal year 2021 as part of the State’s response to the COVID-19 pandemic. The Legislature authorized the continuation of the suspension of the Debt Reform Act provisions covering all issuances in fiscal year 2022. As a result, any State-supported debt issued in fiscal years 2021 and 2022 is not limited to capital purposes and is not counted towards the statutory caps on debt outstanding and debt service.
As part of its cash management program, the General Fund is generally authorized to borrow resources temporarily from other available funds in the State’s short-term investment pool (“STIP”) for up to four months, or until the end of the fiscal year, whichever period is shorter. The fiscal year 2021 enacted budget amended the statute to permit the borrowings until the end of the fiscal year. The amount of resources that can be borrowed by the General Fund is limited to the available balances in STIP, as determined by the State Comptroller.
Localities. In the past, slow economic growth and reduced State spending have increased the fiscal pressure on municipal issuers in the State, though such impacts have had wide variability. Local governments derive revenues from sales tax, real property tax, transfer tax and fees relating to real property transactions. Revenue losses caused by a slower real estate market and declining real property value, among other reasons, could make it difficult for local governments to address their various economic, social and health care obligations.
New York City. The fiscal demands on the State may be affected by the fiscal condition of New York City, which relies on State aid to balance its budget and meet its cash requirements. It is also possible that the State’s finances may be affected by the ability of the City, and certain entities issuing debt for the benefit of the City, to market securities successfully in the public credit markets. Conversely, the City’s finances, and thus its ability to market its securities successfully, could be negatively affected by delays or reductions in projected State aid. In addition, the City is the recipient of certain federal grants that, if reduced or delayed, could negatively affect the City’s finances. Further, the City, like the State, may be party to litigation that may be resolved in a manner that negatively affects the City’s finances. As of December 2021, New York City’s total outstanding debt is projected to be approximately $94.2 billion at the end of fiscal year 2021 and increase to $111.76 billion by the end of fiscal year 2025. Moreover, the percentage of total debt outstanding as a percentage of total New York City personal income was as of December 2021 projected to average about 12.9% in fiscal year 2021 before increasing to 13.8% in fiscal year 2025.
Other Localities. Certain localities outside New York City have experienced financial problems and have requested and received additional State assistance in the past. The State has periodically enacted legislation to create oversight boards in order to address deteriorating fiscal conditions within a locality. The potential impact on the State of any future requests by localities for additional oversight or financial assistance is not included in the projections of the State’s receipts and disbursements for the State’s budget.
Like the State, local governments must respond to changing political, economic and financial influences over which they have little or no control. Such changes may adversely affect the financial condition of certain local governments. For example, the State or federal government may reduce (or in some cases eliminate) funding of some local programs or disallow certain claims which, in turn, may require local governments to fund these expenditures from their own resources. The loss of federal
Part I - 22
funding, recent State aide trends, new constraints for certain localities on raising property tax revenue and significant upfront costs for some communities affected by natural disasters, among other things, may have an impact on the fiscal condition of local governments and school districts in the State.
Localities may also face unanticipated problems resulting from certain pending litigation, judicial decisions and long-term economic trends. Other large-scale potential problems, such as declining urban populations, declines in the real property tax base, increasing pension, health care and other fixed costs and the loss of skilled manufacturing jobs, may also adversely affect localities and necessitate State assistance.
Ultimately, localities as well as local public authorities may suffer serious financial difficulties that could jeopardize local access to the public credit markets, which may adversely affect the marketability of notes and bonds issued by localities within the State. As a result, one or more of these localities could file for bankruptcy protection under Chapter 9 of the U.S. Bankruptcy Code in the future.
State-Federal Fiscal Relations. New York receives substantial federal aid for various governmental purposes, including, among other things, to support state-level health care, education and transportation initiatives. There can be no assurance that such financial assistance from the federal government will continue in the future. In addition, as of January 19, 2021, the State has been awarded over $27 billion of funding as a result of several federal bills for expenses related to COVID-19. For a majority of the enacted legislation, the economic benefits do not flow to or through the State’s budget, but instead flow directly to individuals in the form of tax rebates, and to large and small businesses in the form of loans or grants. In addition, on May 18, 2021, the State received $12.75 billion in federal aid from the American Rescue Plan Act of 2021, to help bolster the State’s financial position. In addition, the federal government may enact other budgetary changes or take other actions that could adversely affect New York’s finances.
Municipal Downgrades and Bankruptcies. Municipal bonds may be more susceptible to being downgraded, and issuers of municipal bonds may be more susceptible to default and bankruptcy, during recessions or similar periods of economic stress. Factors contributing to the economic stress on municipalities may include lower property tax collections as a result of lower home values, lower sales tax revenue as a result of consumers cutting back from spending and lower income tax revenue as a result of a high unemployment rate. In addition, as certain municipal obligations may be secured or guaranteed by banks and other institutions, the risk to a Fund could increase if the banking or financial sector suffers an economic downturn and/or if the credit ratings of the institutions issuing the guarantee are downgraded or at risk of being downgraded by a national rating organization. Such a downward revision or risk of being downgraded may have an adverse effect on the market prices of the bonds and thus the value of a Fund’s investments.
Downgrades of certain municipal securities insurers have in the past negatively impacted the price of certain insured municipal securities. Given the large number of potential claims against municipal securities insurers, there is a risk that they will be unable to meet all future claims. In the past, certain municipal issuers either have been unable to issue bonds or access the market to sell their issues or, if able to access the market, have issued bonds at much higher rates, which may reduce revenues available for municipal issuers to pay existing obligations. Should the State or municipalities fail to sell bonds when and at the rates projected, the State could experience significantly increased costs in the General Fund and a weakened overall cash position in the current fiscal year.
Further, an insolvent municipality may file for bankruptcy. For example, Chapter 9 of the Bankruptcy Code provides a financially distressed municipality protection from its creditors while it develops and negotiates a plan for reorganizing its debts. “Municipality” is defined broadly by the Bankruptcy Code as a “political subdivision or public agency or instrumentality of a state” and may include various issuers of securities in which a Fund invests
The reorganization of a municipality’s debts may be accomplished by extending debt maturities, reducing the amount of principal or interest, refinancing the debt or other measures, which may significantly affect the rights of creditors and the value of the securities issued by the municipality. Because a Fund’s performance depends, in part, on the ability of issuers to make principal and interest payments on their debt, any actions to avoid making these payments could reduce a Fund’s returns.
Litigation. The State and its officers and employees are parties to numerous legal proceedings, many of which normally occur in government operations. In addition, the State is involved in certain other legal proceedings (described in the State’s official statements) that, if decided against the State, might require the State to make significant future expenditures or substantially impair future revenue sources. Because
Part I - 23
of the prospective nature of these proceedings, this document does not attempt to predict the outcome of such litigation, estimate the potential impact on the ability of the State to pay debt service costs on its obligations, or determine what impact, if any, such proceedings may have on a Fund’s investments.
Bond Ratings. As of June 1, 2022, New York’s general obligation debt was assigned a rating of Aa1 by Moody’s and AA+ by both S&P and Fitch. These ratings reflect only the views of the respective rating agency, an explanation of which may be obtained from each such rating agency. There is no assurance that these ratings will continue for any given period of time or that they will not be revised or withdrawn entirely by the rating agency if, in the judgment of such rating agency, circumstances so warrant. A downward revision or withdrawal of any such rating may have an adverse effect on the market prices of the securities issued by the State, its municipalities, and their political subdivisions, instrumentalities and authorities.
Special Considerations Relating to Municipal Obligations from the Commonwealth of Puerto Rico
The following information is a summary of special factors that may affect a Fund invested in municipal securities of the Commonwealth of Puerto Rico (“Puerto Rico”) and is derived from public official documents relating to securities offerings of state issuers, which generally are available to investors. The following information constitutes only a brief summary of the information in such public official documents; it has not been independently verified and does not purport to be a complete description of all considerations regarding investment in the municipal securities discussed below. Information provided herein may not be current and is subject to change rapidly, substantially and without notice. Events could occur rapidly that significantly affect the value of municipal securities of Puerto Rico and its political subdivisions, instrumentalities and authorities (collectively, “Puerto Rico Securities”).
The ability of Puerto Rico and its political subdivisions, instrumentalities and authorities to meet their obligations depends primarily on the availability of tax and other revenues to those governments and on their fiscal conditions generally. Local and national market forces, such as population decline due to outmigration and other factors, declines in real estate prices and general business activity, may result in decreasing tax bases, fluctuations in interest rates, and increasing construction costs, all of which could reduce the ability of municipal issuers to repay their obligations. Certain municipal issuers may be unable to obtain additional financing through, or must pay higher interest rates on, new issues, which may reduce revenues available for municipal issuers to pay existing obligations. In addition, in certain circumstances it may be difficult for investors to obtain reliable information on the obligations underlying municipal securities. These and other adverse developments in the municipal securities market may negatively affect the value of Puerto Rico Securities, which could have a negative effect on the performance of a Fund.
The spread of COVID-19 and the related governmental and public responses have had, and may continue to have, an adverse effect on Puerto Rico’s economy. Preventative or protective actions that governments have taken, and may continue to take, as a result of the pandemic has resulted in, and may continue to result in, periods of business disruption and reduced or disrupted operations, which could have negative effects on Puerto Rico’s economy and Puerto Rico and local government budgets. Although vaccines for COVID-19 have been approved for emergency use, the timing of the administration of vaccines and the continued risk of variants or mutations of COVID-19, among other factors, make it impossible to predict the timing of an end to the pandemic.
Since 2000, Puerto Rico has faced a number of significant fiscal challenges, including a structural imbalance between its General Fund revenues and expenditures. Between 2008 and 2020, Puerto Rico's gross national product shrank by 17%, its labor force participation fell to a record low of 39% and its population has declined by 15%. In June 2016, the U.S. Congress passed the Puerto Rico Oversight Management, and Economic Stability Act (“PROMESA”), which establishes a federally-appointed fiscal oversight board (“Oversight Board”) to oversee Puerto Rico’s financial operations and possible debt restructuring. On May 3, 2017, the Oversight Board filed a debt restructuring petition in the U.S. District Court in Puerto Rico to seek bankruptcy-type protections from, at the time the petition was filed, approximately $74 billion in debt and approximately $48 billion in unfunded pension obligations. In addition to the debt restructuring petition filed on behalf of Puerto Rico, in May 2017, the Oversight Board separately filed debt restructuring petitions for certain Puerto Rico instrumentalities, including the Puerto Rico Highways and Transportation Authority (“HTA”), Puerto Rico Sales Tax Financing Corporation (“COFINA”), Puerto Rico Electric and Power Authority (“PREPA”) and Employee Retirement System (“ERS”). In February 2019, a federal judge approved a Plan of Adjustment reducing COFINA debt from $18 billion to $12 billion. More recently, on January 18, 2022, a federal judge approved a Plan of Adjustment under which the largest portion of Puerto Rico’s debt would be reduced from $33 billion to $7.4 billion. There continue to be ongoing efforts to restructure the debt of certain Puerto Rico
Part I - 24
instrumentalities, including $6 billion of HTA debt and $9 billion of PREPA debt or that Puerto Rico will be able to service debt payments following the completion of any debt restructuring. In addition, any restructurings approved by a federal courts could be appealed and overturned. There can be no assurances that these debt restructuring efforts will be effective.
Furthermore, there can be no guarantee that future developments will not have a materially adverse impact on Puerto Rico’s finances. A future economic downturn in the United States could significantly impact Puerto Rico’s finances and, consequently, its municipal securities. Moreover, the high level of public debt in Puerto Rico affects long-term growth prospects, especially if any of the aforementioned debt restructuring efforts are unsuccessful. Further deterioration in Puerto Rico’s financial condition may have a negative effect on the marketability, liquidity or value of Puerto Rico Securities, which could have a negative effect on the performance of a Fund.
Fiscal Plan. On January 27, 2022, the Oversight Board certified the 2022 fiscal plan (“Fiscal Plan”) for Puerto Rico that includes a number of structural reforms and fiscal measures intended to improve the territory’s economy, including human capital and welfare reform, education reforms, energy reforms, doing business reforms and infrastructure reforms. The Fiscal Plan projections reflect $25.3 billion of revenues (post-measures and structural reforms) for fiscal year 2022, which include estimated personal income tax receipts of $2.3 billion, sales and use receipts of $2.5 billion and corporation tax receipts of $2.2 billion and federal transfers of $7.6 billion. Against these revenues, the Fiscal Plan projections reflect $22.6 billion of expenditures (post-measures and structural reforms and exclusive of debt service and pension contributions) for fiscal year 2022. The Fiscal Plan projects a $200 million surplus after accounting for costs associated with debt service and pension contributions under confirmed Plans of Adjustment, excluding one-time cash payments. If Puerto Rico is unable to achieve the measures and structural reforms reflected in the 2022 Fiscal Plan, or if actual revenues fall short of estimates, Puerto Rico could be forced to take measures to cover any resulting budget gaps, which could add significant pressure to Puerto Rico’s financial condition. The Fiscal Plan projects Puerto Rico’s real gross national product to grow 2.6% in fiscal year 2022 and 5.2% after adjustments for income effects of federal COVID and income support programs. As a result of the COVID-19 pandemic, Puerto Rico’s unemployment rate peaked in May 2020 at a high of 41%, subsequently falling to 20% as of December 2020. As of January 2022, Puerto Rico’s unemployment rate was 7.1%. The Oversight Board projects that Puerto Rico’s population will decrease by 5% between fiscal years 2021 and 2026 and by 25% by fiscal year 2051.
Puerto Rico relies heavily on transfers from the federal government related to specific programs and activities in Puerto Rico. These transfers include, among others, entitlements for previously performed services, or those resulting from contributions to programs such as Social Security, Veterans’ Benefits, Medicare, Medicaid and U.S. Civil Service retirement pensions, as well as grants such as Nutritional Assistance Program grants and Pell Grant scholarships for higher education. Due to Puerto Rico’s dependence on federal transfers, any actions by the federal government to reduce or alter these transfers may cause increased fiscal stress in Puerto Rico, which could have a negative effect on the value of Puerto Rico Securities held by a Fund.
Puerto Rico’s unfunded pension obligations add significant stress to Puerto Rico’s fiscal condition. Recent Fiscal Plans attempted to address Puerto Rico’s pension obligations by taking a variety of measures and adjusting retirement benefits. There can be no guarantee that Puerto Rico will be able to meet its obligations under the current Fiscal Plan or that the fiscal condition of Puerto Rico’s retirement systems will not deteriorate further in the future.
Litigation. Puerto Rico, its officials and employees are named as defendants in legal proceedings that occur in the normal course of governmental operations. Some of these proceedings involve claims for substantial amounts, which if decided against Puerto Rico might require Puerto Rico to make significant future expenditures or substantially impair future revenue sources. Because of the prospective nature of these proceedings, it is not presently possible to predict the ultimate outcome of such proceedings, estimate the impact such proceedings may have on the ability of Puerto Rico to service its debt obligations, or determine what impact, if any, such proceedings may have on Puerto Rico Securities held by a Fund.
Credit rating. As of June 1, 2022, Moody’s Investors Service, Inc., Fitch, Inc. and Standard & Poor’s Rating Services have discontinued or withdrawn their ratings of Puerto Rico’s general obligation debt. The discontinuance or withdrawal of such ratings may have an adverse effect on the market prices of the Puerto Rico Securities held by a Fund.
Natural Disasters. Puerto Rico has experienced multiple natural disasters in recent years. In 2017, Hurricanes Irma and Maria caused unprecedented damage to Puerto Rico. The damage caused by Hurricanes Irma and Maria had a substantially adverse effect on Puerto Rico’s economy. The 2022 Fiscal
Part I - 25
Plan projects that approximately $84 billion of private and public disaster relief funding for reconstruction efforts and other disaster relief will be disbursed for reconstruction efforts over a period of 18 years through 2035, including $47 billion from the Federal Emergency Management Agency, $20 billion from Housing and Urban Development, $7 billion from private and business insurance pay outs and $8 billion is related to other sources of federal funding. There can be no assurance that all anticipated disaster relief funding will be provided to Puerto Rico, or that such aid will be provided on any expected timeline. Any significant additional Commonwealth obligations and expenditures associated with Irma, Maria or future hurricanes could impair Puerto Rico’s ability to service its debt obligations, which could have a negative effect on the market prices of Puerto Rico Securities held by a Fund.
Additionally, in late 2019 and early 2020, Puerto Rico experienced serious earthquakes, the aftershocks of which persisted for several months. These earthquakes have resulted in significant structural damage, including damage to infrastructure, as well business disruptions more broadly. Moreover, according to a January 29, 2020 report published by the United States Geological Survey, there is a high likelihood of continued, material aftershocks, placing Puerto Rico at continued risk of potentially catastrophic earthquakes.
QUALITY DESCRIPTION
Various Nationally Recognized Statistical Rating Organizations (“NRSROs”) assign ratings to securities. Generally, ratings are divided into two main categories: “Investment Grade Securities” and “Non-Investment Grade Securities.” Although there is always a risk of default, rating agencies believe that issuers of Investment Grade Securities have a high probability of making payments on such securities. Non-Investment Grade Securities include securities that, in the opinion of the rating agencies, are more likely to default than Investment Grade Securities.
The Funds only purchase securities that meet the rating criteria described below or in a Prospectus. The Adviser will look at a security’s rating at the time of investment. If the securities are unrated, the Adviser must determine that they are of comparable quality to rated securities. Subsequent to its purchase by a Fund, a security may cease to be rated or its rating may be reduced below the minimum rating required for purchase by a Fund. The Adviser will consider such an event in determining whether a Fund should continue to hold the security and is not required to sell a security in the event of a downgrade. Securities issued by the U.S. Government and its agencies and instrumentalities are not rated by NRSROs and so the rating of such securities is determined based on the ratings assigned to the issuer by the NRSRO(s) or if unrated, based on the Adviser’s determination of the issuer’s credit quality. The Adviser may also use the ratings assigned by NRSROs to issuers that are issued by non-U.S. governments and their agencies and instrumentalities to determine the rating of such securities.
From time to time, NRSROs may not agree on the credit quality of a security and issuer and assign different ratings. The Funds use the NRSROs and methodology described in their prospectuses to determine the credit quality of their investments including whether a security is in a particular rating category for purposes of the credit quality requirements. For securities that are not rated by the applicable NRSROs, the Adviser must determine that they are of comparable quality to rated securities.
Limitations on the Use of Municipal Securities
The Funds may not be a desirable investment for “substantial users” of facilities financed by private activity bonds or industrial development bonds or for “related persons” of substantial users.
DIVERSIFICATION
JPMT I, JPMT II and JPMT IV are each a registered open-end investment company. The California Tax Free Bond Fund, the High Yield Municipal Fund, the Intermediate Tax Free Bond Fund and the New York Tax Free Bond Fund are diversified series of JPMT I. The Sustainable Municipal Income Fund, the Short-Intermediate Municipal Bond Fund and the Tax Free Bond Fund are diversified series of JPMT II. The Ultra-Short Municipal Fund is a diversified series of JPMT IV.
For a more complete discussion, see the “Diversification” section in Part II of this SAI.
PORTFOLIO TURNOVER
A portfolio turnover rate is, in summary, the percentage computed by dividing the lesser of a Fund’s purchases or sales of securities (excluding short-term securities) by the average market value of the Fund. The Adviser intends to manage each Fund’s assets by buying and selling securities to help attain its investment objective. A rate of 100% indicates that the equivalent of all of a Fund’s assets have been sold
Part I - 26
and reinvested in a year. Higher portfolio turnover may affect the amount, timing and character of distributions, and, as a result, may increase the amount of taxes payable by shareholders. High portfolio turnover also results in higher transaction costs. To the extent that net short-term capital gains are realized by a Fund, any distributions resulting from such gains are considered ordinary income for federal income tax purposes. For a more complete discussion, see the “Distributions and Tax Matters” section in Part II of this SAI.
The table below sets forth the Fund's portfolio turnover rate for the two most recently completed fiscal years:
| |
Fiscal Year Ended February 28, | |
| Fund |
2021 |
2022 |
| California Tax Free Bond Fund |
6% |
11% |
| High Yield Municipal Fund |
39% |
24% |
| Intermediate Tax Free Bond Fund |
34% |
12% |
| New York Tax Free Bond Fund |
5% |
10% |
| Short-Intermediate Municipal Bond Fund |
21% |
21% |
| Sustainable Municipal Income Fund |
22% |
18% |
| Tax Free Bond Fund |
23% |
16% |
| Ultra-Short Municipal Fund |
71% |
33% |
The significant variation in the High Yield Municipal Fund's portfolio turnover rates over the last two fiscal years is attributable to changes made to the Fund's portfolio during the fiscal year ended February 28, 2019 following changes made to the Fund's investment strategies during that fiscal year.
TRUSTEES
Effective January 1, 2022, the Boards of Trustees/Directors of JPMorgan Trust I, JPMorgan Trust II, JPMorgan Trust IV, J.P. Morgan Fleming Mutual Fund Group, Inc., J.P. Morgan Institutional Trust, J.P. Morgan Insurance Trust, J.P. Morgan Mutual Fund Investment Trust and Undiscovered Managers Funds (the “Mutual Fund Board”) were unified with the Board of Trustees of J.P. Morgan Exchange-Traded Fund Trust (the “ETF Board”). As a result, the Board members of the Mutual Fund Board became Board members of the ETF Board, and the Board members of the ETF Board became Board members of the Mutual Fund Board. The unified Board is referred to herein as the “Unified J.P. Morgan Funds Board.”
Standing Committees
For the fiscal year ended February 28, 2022, there were seven standing committees of the Mutual Fund Board of Trustees: (i) the Audit and Valuation Committee, (ii) the Compliance Committee, (iii) the Governance Committee, (iv) the Equity Committee, (v) the ETF Committee, (vi) the Fixed Income Committee, and (vii) the Money Market and Alternative Products Committee. The following table shows how often each Committee met during the fiscal year ended February 28, 2022:
| Committee |
Fiscal Year Ended February 28, 2022 |
| Audit and Valuation Committee |
5 |
| Compliance Committee |
7 |
| Governance Committee |
6 |
| Equity Committee |
6 |
| ETF Committee* |
1 |
| Fixed Income Committee |
6 |
| Money Market and Alternative Products Committee |
9 |
*
Effective January 13, 2022.
For a more complete discussion, see the “Trustees” section in Part II of this SAI.
Part I - 27
Ownership of Securities
The following table shows the dollar range of each Trustee’s beneficial ownership of equity securities in the Funds and each Trustee’s aggregate dollar range of ownership in the J.P. Morgan Funds that the Trustee (each of whom is an Independent Trustee) oversees in the Family of Investment Companies as of December 31, 2021.
| Name of Trustee |
Dollar Range of Equity Securities in California Tax Free Bond Fund |
Dollar Range of Equity Securities in High Yield Municipal Fund |
Dollar Range of Equity Securities in Intermediate Tax Free Bond Fund |
Dollar Range of Equity Securities in New York Tax Free Bond Fund |
Dollar Range of Equity Securities in Short- Intermediate Municipal Bond Fund |
| Independent Trustees |
|
|
|
|
|
| John F. Finn |
None |
None |
None |
None |
None |
| Stephen P. Fisher |
None |
None |
None |
None |
None |
| Gary L. French3 |
None |
None |
None |
None |
None |
| Kathleen M. Gallagher |
None |
None |
None |
None |
None |
| Robert J. Grassi3 |
None |
None |
None |
None |
None |
| Frankie D. Hughes |
None |
None |
None |
None |
None |
| Raymond Kanner |
None |
None |
None |
None |
None |
| Thomas P. Lemke3 |
None |
None |
None |
None |
None |
| Lawrence R. Maffia3 |
None |
None |
None |
None |
None |
| Mary E. Martinez |
None |
None |
None |
None |
None |
| Marilyn McCoy |
None |
None |
None |
None |
None |
| Dr. Robert A. Oden, Jr. |
None |
None |
None |
None |
None |
| Marian U. Pardo |
None |
None |
None |
None |
None |
| Emily A. Youssouf3 |
None |
None |
None |
None |
None |
| Interested Trustees |
|
|
|
|
|
| Robert Deutsch3 |
None |
None |
None |
None |
None |
| Nina O. Shenker3 |
None |
None |
None |
None |
None |
| Name of Trustee |
Dollar Range of Equity Securities in Sustainable Municipal Income Fund |
Dollar Range of Equity Securities in Tax Free Bond Fund |
Dollar Range of Equity Securities in Ultra-Short Municipal Fund |
Aggregate Dollar Range of Equity Securities in All Registered Investment Companies Overseen by the Trustee in Family of Investment Companies1,2 |
| Independent Trustees |
|
|
|
|
| John F. Finn |
None |
None |
None |
Over $100,000 |
| Stephen P. Fisher |
None |
None |
None |
Over $100,000 |
| Gary L. French3 |
None |
None |
None |
Over $100,000 |
| Kathleen M. Gallagher |
None |
None |
None |
Over $100,000 |
| Robert J. Grassi3 |
None |
None |
None |
Over $100,000 |
| Frankie D. Hughes |
None |
None |
None |
Over $100,000 |
| Raymond Kanner |
None |
None |
None |
Over $100,000 |
| Thomas P. Lemke3 |
None |
None |
None |
Over $100,000 |
| Lawrence R. Maffia3 |
None |
None |
None |
Over $100,000 |
| Mary E. Martinez |
None |
None |
None |
Over $100,000 |
| Marilyn McCoy |
None |
None |
None |
Over $100,000 |
| Dr. Robert A. Oden, Jr. |
None |
None |
None |
Over $100,000 |
| Marian U. Pardo |
None |
None |
None |
Over $100,000 |
| Emily A. Youssouf3 |
None |
None |
None |
$10,001– $50,000 |
| Interested Trustees |
|
|
|
|
Part I - 28
| Name of Trustee |
Dollar Range of Equity Securities in Sustainable Municipal Income Fund |
Dollar Range of Equity Securities in Tax Free Bond Fund |
Dollar Range of Equity Securities in Ultra-Short Municipal Fund |
Aggregate Dollar Range of Equity Securities in All Registered Investment Companies Overseen by the Trustee in Family of Investment Companies1,2 |
| Robert Deutsch3 |
None |
None |
None |
Over $100,000 |
| Nina O. Shenker3 |
None |
None |
None |
None |
1
A Family of Investment Companies means any two or more registered investment companies that share the same investment adviser or principal underwriter and hold themselves out to investors as related companies for purposes of investment and investor services. The Family of Investment Companies for which the Board of Trustees currently serves includes nine registered investment companies (168 J.P. Morgan Funds).
2
For Mses. Gallagher and McCoy and Messrs. Finn, Fisher, Kanner and Oden, these amounts include deferred compensation balances, as of 12/31/21, through participation in the J.P. Morgan Funds’ Deferred Compensation Plan for Eligible Trustees. For a more complete discussion, see the “Trustee Compensation” section in Part II of this SAI.
3
Mses. Shenker and Youssouf and Messrs. Deutsch, French, Grassi, Lemke and Maffia became Trustees of the Mutual Fund Board effective 1/1/22.
Except as noted below, as of December 31, 2021, none of the Independent Trustees or their immediate family members owned securities of the Adviser or JPMDS or a person (other than a registered investment company) directly or indirectly controlling, controlled by or under common control with the Adviser or JPMDS. As of December 31, 2021, Mr. Finn’s spouse and a family trust unknowingly owned 93 shares of JPMorgan Chase & Co. common stock, the indirect parent of JPMIM, in discretionary accounts fully managed by investment managers under the direction of a financial adviser. As of the date of this SAI, all such shares have been sold.
Trustee Compensation
The Trustees are paid an annual fee of $395,000 (with any new trustees receiving a pro rata portion of the base fee depending on when each became a trustee) and are reimbursed for expenses incurred in connection with service as a Trustee. Committee chairs who are not already receiving an additional fee are each paid $50,000 annually in addition to their base fee. In addition to the base fee, the funds pay the Chair $225,000 annually and reimburse expenses of the Chair in the amount of $4,000 per month. The Chair receives no additional compensation for service as committee chair. In addition to the base fee, the Funds pay the Vice Chair $125,000 annually. The Trustees may hold various other directorships unrelated to the Trust.
For funds that are series of the J.P. Morgan Exchange-Traded Fund Trust and which have a unitary management fee, Trustee compensation for the Funds is paid from the management fee by JPMIM. For all other funds, Trustee compensation is paid by the fund. Aggregate Trustee compensation for each Trustee by a Fund and all funds in the Fund Complex for the calendar year ended December 31, 2021, is set forth below:
| Name of Trustee |
California Tax Free Bond Fund |
High Yield Municipal Fund |
Intermediate Tax Free Bond Fund |
New York Tax Free Bond Fund |
Short- Intermediate Municipal Bond Fund |
| Independent Trustees |
|
|
|
|
|
| John F. Finn |
$2,441 |
$2,471 |
$3,949 |
$2,435 |
$2,886 |
| Stephen P. Fisher |
2,362 |
2,377 |
3,079 |
2,360 |
2,574 |
| Gary L. French3 |
0 |
0 |
0 |
0 |
0 |
| Kathleen M. Gallagher |
2,356 |
2,370 |
3,008 |
2,354 |
2,550 |
| Robert J. Grassi3 |
0 |
0 |
0 |
0 |
0 |
| Dennis P. Harrington5 |
2,346 |
2,357 |
2,901 |
2,344 |
2,509 |
| Frankie D. Hughes |
2,340 |
2,350 |
2,830 |
2,338 |
2,485 |
| Raymond Kanner |
2,362 |
2,377 |
3,079 |
2,360 |
2,574 |
| Thomas P. Lemke3 |
0 |
0 |
0 |
0 |
0 |
| Lawrence R. Maffia3 |
0 |
0 |
0 |
0 |
0 |
| Mary E. Martinez |
2,395 |
2,417 |
3,434 |
2,392 |
2,703 |
| Marilyn McCoy |
2,340 |
2,350 |
2,830 |
2,338 |
2,485 |
Part I - 29
| Name of Trustee |
California Tax Free Bond Fund |
High Yield Municipal Fund |
Intermediate Tax Free Bond Fund |
New York Tax Free Bond Fund |
Short- Intermediate Municipal Bond Fund |
| Mitchell M. Merin7 |
$2,340 |
$2,350 |
$2,830 |
$2,338 |
$2,485 |
| Dr. Robert A. Oden, Jr. |
2,362 |
2,377 |
3,079 |
2,360 |
2,574 |
| Marian U. Pardo |
2,362 |
2,377 |
3,079 |
2,360 |
2,574 |
| Emily A. Youssouf3 |
0 |
0 |
0 |
0 |
0 |
| Interested Trustees |
|
|
|
|
|
| Robert Deutsch3 |
0 |
0 |
0 |
0 |
0 |
| Nina O. Shenker3 |
0 |
0 |
0 |
0 |
0 |
| Name of Trustee |
Sustainable Municipal Income Fund |
Tax Free Bond Fund |
Ultra-Short Municipal Fund |
Total Compensation Paid From Fund Complex1 |
| Independent Trustees |
|
|
|
|
| John F. Finn |
$2,403 |
$2,521 |
$4,418 |
$620,000 |
| Stephen P. Fisher |
2,345 |
2,401 |
3,302 |
445,0002 |
| Gary L. French3 |
0 |
0 |
0 |
157,500 |
| Kathleen M. Gallagher |
2,340 |
2,392 |
3,207 |
432,5004 |
| Robert J. Grassi3 |
0 |
0 |
0 |
156,000 |
| Dennis P. Harrington5 |
2,332 |
2,375 |
3,078 |
407,500 |
| Frankie D. Hughes |
2,328 |
2,366 |
2,983 |
395,000 |
| Raymond Kanner |
2,345 |
2,401 |
3,302 |
445,0002 |
| Thomas P. Lemke3 |
0 |
0 |
0 |
158,000 |
| Lawrence R. Maffia3 |
0 |
0 |
0 |
156,000 |
| Mary E. Martinez |
2,369 |
2,452 |
3,770 |
520,000 |
| Marilyn McCoy |
2,328 |
2,366 |
2,983 |
395,0006 |
| Mitchell M. Merin7 |
2,328 |
2,366 |
2,983 |
395,000 |
| Dr. Robert A. Oden, Jr. |
2,345 |
2,401 |
3,302 |
445,000 |
| Marian U. Pardo |
2,345 |
2,401 |
3,302 |
445,000 |
| Emily A. Youssouf3 |
0 |
0 |
0 |
156,000 |
| Interested Trustees |
|
|
|
|
| Robert Deutsch3 |
0 |
0 |
0 |
150,000 |
| Nina O. Shenker3 |
0 |
0 |
0 |
0 |
1
A Fund Complex means two or more registered investment companies that (i) hold themselves out to investors as related companies for purposes of investment and investor services or (ii) have a common investment adviser or have an investment adviser that is an affiliated person of the investment adviser of any of the other registered investment companies. The J.P. Morgan Funds Complex for which the Board of Trustees currently serves includes nine registered investment companies (168 Funds).
2
Includes $445,000 of Deferred Compensation.
3
Prior to 1/1/22, Ms. Youssouf and Messrs. Deutsch, French, Grassi, Lemke and Maffia were members of the ETF Board and became Trustees of the Mutual Fund Board effective 1/1/22. As a result, their total compensation for the calendar year ended 12/31/21 reflects compensation received for their service on the ETF Board. Ms. Shenker became a Trustee of the Unified J.P. Morgan Funds Board effective 1/1/22, and received no compensation from the Fund Complex for the calendar year ended 12/31/21. The compensation Ms. Shenker receives from the Funds beginning 1/1/22 will be reimbursed by JPMIM.
4
Includes $129,750 of Deferred Compensation.
5
Mr. Harrington retired as Trustee of the Trusts, effective 7/31/21. Mr. Harrington served as a consultant to the Board of Trustees until 12/31/21 and, in that role, received a fee equivalent to the pro rata portion, for that period, of the annual base fee payable to Trustees.
6
Includes $395,000 of Deferred Compensation.
7
Mr. Merin retired as Trustee of the Trusts, effective 2/1/21. Mr. Merin served as a consultant to the Board of Trustees until 12/31/21 and, in that role, received a fee equivalent to the pro rata portion, for that period, of the annual base fee payable to Trustees.
For a more complete discussion, see the “Trustee Compensation” section in Part II of this SAI.
Part I - 30
INVESTMENT ADVISER
Investment Advisory Fees
The table below sets forth the investment advisory fees paid by the following Funds to JPMIM (waived amounts are in parentheses), with respect to the fiscal years indicated (amounts in thousands):
| |
Fiscal Year Ended | |||||
| |
February 29, 2020 |
February 28, 2021 |
February 28, 2022 | |||
| Fund |
Paid |
Waived |
Paid |
Waived |
Paid |
Waived |
| California Tax Free Bond Fund |
$786 |
$(125) |
$1,095 |
$(104) |
$1,163 |
$(93) |
| High Yield Municipal Fund |
899 |
(255) |
1,492 |
(208) |
1,616 |
(192) |
| Intermediate Tax Free Bond Fund |
11,946 |
(2,841) |
13,240 |
(3,638) |
11,010 |
(2,820) |
| New York Tax Free Bond Fund |
1,108 |
(127) |
1,141 |
(92) |
1,131 |
(86) |
| Short-Intermediate Municipal Bond Fund |
2,397 |
(1,580) |
2,510 |
(1,682) |
2,578 |
(1,594) |
| Sustainable Municipal Income Fund |
487 |
(208) |
666 |
(217) |
757 |
(212) |
| Tax Free Bond Fund |
1,164 |
(205) |
1,508 |
(176) |
1,864 |
(165) |
| Ultra-Short Municipal Fund |
— |
(5,036) |
— |
(7,939) |
— |
(8,140) |
For a more complete discussion, see the “Investment Advisers and Sub-Advisers” section in Part II of this SAI.
PORTFOLIO MANAGERS
Portfolio Managers' Other Accounts Managed*
The following table shows information regarding all of the other accounts for which advisory fees are not based on the performance of the accounts managed by each portfolio manager as of February 28, 2022:
| |
Non-Performance Based Fee Advisory Accounts | |||||
| |
Registered Investment Companies |
Other Pooled Investment Vehicles |
Other Accounts | |||
| Number of Accounts |
Total Assets ($thousands) |
Number of Accounts |
Total Assets ($thousands) |
Number of Accounts |
Total Assets ($thousands) | |
| Sustainable Municipal Income Fund |
| |||||
| Kevin M. Ellis |
6 |
$7,074,474 |
0 |
$0 |
124 |
$3,671,917 |
| Wayne Godlin |
1 |
493,002 |
0 |
0 |
0 |
0 |
| David Sivinski |
3 |
5,276,592 |
0 |
0 |
9 |
429,507 |
| Short-Intermediate Municipal Bond Fund |
|
|
|
|
|
|
| James Ahn |
1 |
4,058,059 |
0 |
0 |
23 |
2,677,037 |
| Kevin M. Ellis |
6 |
5,833,615 |
0 |
0 |
124 |
3,671,917 |
| Tax Free Bond Fund |
| |||||
| Richard Taormina |
7 |
12,901,842 |
0 |
0 |
4 |
1,752,741 |
| Michelle Hallam |
2 |
487,399 |
0 |
0 |
96 |
3,608,574 |
| Ultra-Short Municipal Fund |
|
|
|
|
|
|
| Richard Taormina |
7 |
9,514,421 |
0 |
0 |
4 |
1,752,741 |
| James Ahn |
1 |
1,554,175 |
0 |
0 |
23 |
2,677,037 |
| California Tax Free Bond Fund |
|
|
|
|
|
|
| David Sivinski |
3 |
5,203,167 |
0 |
0 |
9 |
429,507 |
| Michelle Hallam |
2 |
771,295 |
0 |
0 |
96 |
3,608,574 |
| High Yield Municipal Fund |
|
|
|
|
|
|
| Wayne Godlin |
1 |
313,316 |
0 |
0 |
0 |
0 |
| Richard Taormina |
7 |
13,079,477 |
0 |
0 |
4 |
1,752,741 |
| Kevin Ellis |
6 |
6,894,787 |
0 |
0 |
124 |
3,671,917 |
| Intermediate Tax Free Bond Fund |
|
|
|
|
|
|
| Richard Taormina |
7 |
9,056,231 |
0 |
0 |
4 |
1,752,741 |
| David Sivinski |
3 |
1,073,660 |
0 |
0 |
9 |
429,507 |
| Kevin M. Ellis |
6 |
2,871,542 |
0 |
0 |
124 |
3,671,917 |
| New York Tax Free Bond Fund |
|
|
|
|
|
|
Part I - 31
| |
Non-Performance Based Fee Advisory Accounts | |||||
| |
Registered Investment Companies |
Other Pooled Investment Vehicles |
Other Accounts | |||
| Number of Accounts |
Total Assets ($thousands) |
Number of Accounts |
Total Assets ($thousands) |
Number of Accounts |
Total Assets ($thousands) | |
| David Sivinski |
3 |
$5,216,304 |
0 |
$0 |
9 |
$429,507 |
| Kevin M. Ellis |
6 |
7,014,186 |
0 |
0 |
124 |
3,671,917 |
The following table shows information on the other accounts managed by each portfolio manager that have advisory fees wholly or partly based on performance as of February 28, 2022:
| |
Performance Based Fee Advisory Accounts | |||||
| |
Registered Investment Companies |
Other Pooled Investment Vehicles |
Other Accounts | |||
| Number of Accounts |
Total Assets ($thousands) |
Number of Accounts |
Total Assets ($thousands) |
Number of Accounts |
Total Assets ($thousands) | |
| Sustainable Municipal Income Fund |
| |||||
| Kevin M. Ellis |
0 |
$0 |
0 |
$0 |
0 |
$0 |
| Wayne Godlin |
0 |
0 |
0 |
0 |
0 |
0 |
| David Sivinski |
0 |
0 |
0 |
0 |
0 |
0 |
| Short-Intermediate Municipal Bond Fund |
|
|
|
|
|
|
| James Ahn |
0 |
0 |
0 |
0 |
0 |
0 |
| Kevin M. Ellis |
0 |
0 |
0 |
0 |
0 |
0 |
| Tax Free Bond Fund |
|
|
|
|
|
|
| Richard Taormina |
0 |
0 |
0 |
0 |
0 |
0 |
| Michelle Hallam |
0 |
0 |
0 |
0 |
0 |
0 |
| Ultra-Short Municipal Fund |
|
|
|
|
|
|
| Richard Taormina |
0 |
0 |
0 |
0 |
0 |
0 |
| James Ahn |
0 |
0 |
0 |
0 |
0 |
0 |
| California Tax Free Bond Fund |
|
|
|
|
|
|
| David Sivinski |
0 |
0 |
0 |
0 |
0 |
0 |
| Michelle Hallam |
0 |
0 |
0 |
0 |
0 |
0 |
| High Yield Municipal Fund |
|
|
|
|
|
|
| Wayne Godlin |
0 |
0 |
0 |
0 |
0 |
0 |
| Richard Taormina |
0 |
0 |
0 |
0 |
0 |
0 |
| Kevin Ellis |
0 |
0 |
0 |
0 |
0 |
0 |
| Intermediate Tax Free Bond Fund |
|
|
|
|
|
|
| Richard Taormina |
0 |
0 |
0 |
0 |
0 |
0 |
| David Sivinski |
0 |
0 |
0 |
0 |
0 |
0 |
| Kevin M. Ellis |
0 |
0 |
0 |
0 |
0 |
0 |
| New York Tax Free Bond Fund |
|
|
|
|
|
|
| David Sivinski |
0 |
0 |
0 |
0 |
0 |
0 |
| Kevin M. Ellis |
0 |
0 |
0 |
0 |
0 |
0 |
*The total value and number of accounts managed by a portfolio manager may include subaccounts of asset allocation, multi-managed and other accounts.
Portfolio Managers' Ownership of Securities
The following table indicates the dollar range of securities of each Fund beneficially owned by each portfolio manager of each Fund, as of February 28, 2022. Aggregate Dollar Range, if applicable, includes each portfolio manager’s deferred compensation balance attributable to the Fund through participation in the Adviser’s deferred compensation plan. If applicable, this reflects an obligation of the Adviser to pay deferred compensation to the portfolio manager at a future date in an amount based on the performance of that Fund and accordingly, is the economic equivalent of an investment in Fund shares.
| |
Dollar Range of Securities in the Fund | ||||||
| Fund |
None |
$1-$10,000 |
$ 10,001- $50,000 |
$50,001- $100,000 |
$100,001- $500,000 |
$500,001- $1,000,000 |
Over $1,000,000 |
| Sustainable Municipal Income Fund |
|
|
|
|
|
|
|
| Kevin M. Ellis |
X |
|
|
|
|
|
|
Part I - 32
| |
Dollar Range of Securities in the Fund | ||||||
| Fund |
None |
$1-$10,000 |
$ 10,001- $50,000 |
$50,001- $100,000 |
$100,001- $500,000 |
$500,001- $1,000,000 |
Over $1,000,000 |
| Wayne Godlin |
|
|
|
X |
|
|
|
| David Sivinski |
X |
|
|
|
|
|
|
| Short-Intermediate Municipal Bond Fund |
|
|
|
|
| ||
| James Ahn |
X |
|
|
|
|
|
|
| Kevin M. Ellis |
X |
|
|
|
|
|
|
| Tax Free Bond Fund |
|
|
|
|
|
|
|
| Richard Taormina |
|
|
X |
|
|
|
|
| Michelle Hallam |
X |
|
|
|
|
|
|
| California Tax Free Bond Fund |
|
|
|
|
|
|
|
| David Sivinski |
X |
|
|
|
|
|
|
| Michelle Hallam |
X |
|
|
|
|
|
|
| Ultra-Short Municipal Fund |
|
|
|
|
|
|
|
| Richard Taormina |
|
|
X |
|
|
|
|
| James Ahn |
X |
|
|
|
|
|
|
| High Yield Municipal Fund |
|
|
|
|
|
|
|
| Wayne Godlin |
|
|
|
X |
|
|
|
| Richard Taormina |
|
X |
|
|
|
|
|
| Kevin M. Ellis |
X |
|
|
|
|
|
|
| Intermediate Tax Free Bond Fund |
|
|
|
|
|
|
|
| Richard Taormina |
|
X |
|
|
|
|
|
| David Sivinski |
X |
|
|
|
|
|
|
| Kevin M. Ellis |
|
X |
|
|
|
|
|
| New York Tax Free Bond Fund |
|
|
|
|
|
|
|
| David Sivinski |
X |
|
|
|
|
|
|
| Kevin M. Ellis |
X |
|
|
|
|
|
|
Portfolio Managers' Compensation
In evaluating each portfolio manager’s performance with respect to the mutual funds he or she manages, the Adviser uses the following indices as benchmarks to evaluate the performance of the portfolio manager with respect to the Funds:
| Name of Fund |
Benchmark |
| Sustainable Municipal Income Fund |
Bloomberg U.S. 1-15 Year Blend (1-17) Municipal Bond Index |
| Short-Intermediate Municipal Bond Fund |
Bloomberg U.S. 1-5 Year Blend (1-6) Municipal Bond Index |
| Tax Free Bond Fund |
Bloomberg U.S. Municipal Index |
| Ultra-Short Municipal Fund |
Bloomberg 1 Year Municipal Bond Index |
| California Tax Free Bond Fund |
Bloomberg LB California 1-17 Year Muni Index |
| High Yield Municipal Fund |
Bloomberg US Municipal Index |
| Intermediate Tax Free Bond Fund |
Bloomberg U.S. 1-15 Year Blend (1-17) Municipal Bond Index |
| New York Tax Free Bond Fund |
Bloomberg New York Competitive Intermediate (1-17 Year) Maturities Index |
Please see “Portfolio Manager Compensation” section in Part II of this SAI for a description of the structure and method of determining the compensation of the portfolio managers identified above.
Part I - 33
ADMINISTRATOR
Administrator Fees
The table below sets forth the administration, administrative services and co-administration fees paid by the Funds to JPMIM (the amounts waived are in parentheses) for the fiscal years indicated (amounts in thousands).
| |
Fiscal Year Ended | |||||
| |
February 29, 2020 |
February 28, 2021 |
February 28, 2022 | |||
| Fund |
Paid |
Waived |
Paid |
Waived |
Paid |
Waived |
| California Tax Free Bond Fund |
$154 |
$(74) |
$249 |
$(51) |
$259 |
$(55) |
| High Yield Municipal Fund |
99 |
(148) |
237 |
(127) |
264 |
(123) |
| Intermediate Tax Free Bond Fund |
1,888 |
(1,809) |
1,996 |
(2,224) |
1,644 |
(1,814) |
| New York Tax Free Bond Fund |
239 |
(70) |
259 |
(49) |
251 |
(53) |
| Short-Intermediate Municipal Bond Fund |
204 |
(989) |
220 |
(1,038) |
232 |
(1,020) |
| Sustainable Municipal Income Fund |
44 |
(130) |
87 |
(134) |
105 |
(137) |
| Tax Free Bond Fund |
221 |
(121) |
317 |
(104) |
414 |
(93) |
| Ultra-Short Municipal Fund |
— |
(2,518) |
— |
(3,970) |
— |
(4,070) |
For a more complete discussion, see the “Administrator” section in Part II of this SAI.
FUND ACCOUNTING AGENT
Fund Accounting Fees
The table below sets forth the fund accounting fees paid by the Funds to JPMorgan Chase Bank, N.A. for the fiscal years indicated (amounts in thousands):
| |
Fiscal Year Ended | ||
| Fund |
February 29, 2020 |
February 28, 2021 |
February 28, 2022 |
| California Tax Free Bond Fund |
$20 |
$20 |
$20 |
| High Yield Municipal Fund |
20 |
20 |
20 |
| Intermediate Tax Free Bond Fund |
103 |
147 |
114 |
| New York Tax Free Bond Fund |
20 |
20 |
20 |
| Short-Intermediate Municipal Bond Fund |
33 |
44 |
41 |
| Sustainable Municipal Income Fund |
20 |
20 |
20 |
| Tax Free Bond Fund |
20 |
20 |
20 |
| Ultra-Short Municipal Fund |
71 |
141 |
132 |
For more information, see the “Custody and Fund Accounting Fees and Expenses” section in Part II of this SAI.
DISTRIBUTOR
Compensation Paid to JPMDS
The following table describes the compensation paid to the principal underwriter, JPMDS, for the fiscal year ended February 28, 2022 (amounts have been rounded to the nearest whole number):
| Fund |
Total Underwriting Discounts and Commissions |
Compensation on Redemptions and Repurchases |
Brokerage Commissions |
Other Compensation* |
| California Tax Free Bond Fund |
$4,194 |
$25,308 |
$— |
$605,210 |
| High Yield Municipal Fund |
12,615 |
31,273 |
— |
726,980 |
| Intermediate Tax Free Bond Fund |
34,617 |
108,543 |
— |
982,518 |
| New York Tax Free Bond Fund |
4,184 |
33,337 |
42 |
619,747 |
| Short-Intermediate Municipal Bond Fund |
15,167 |
16,991 |
— |
261,207 |
| Sustainable Municipal Income Fund |
6,771 |
31,853 |
— |
373,966 |
| Tax Free Bond Fund |
20,369 |
72,983 |
— |
938,612 |
| Ultra-Short Municipal Fund |
— |
3,750 |
— |
250,131 |
*
Fees paid by the Fund pursuant to Rule 12b-1 are provided in the “Distribution Fees” section below.
Part I - 34
The following table sets forth the aggregate amount of underwriting commissions retained by JPMDS from the Funds with respect to the fiscal years indicated:
| Fund |
Fiscal Year Ended 2/29/20 |
Fiscal Year Ended 2/28/21 |
Fiscal Year Ended 2/28/22 |
| Sustainable Municipal Income Fund |
$11,751 |
$8,605 |
$6,771 |
| Short-Intermediate Municipal Bond Fund |
4,781 |
18,220 |
15,167 |
| Tax Free Bond Fund |
25,582 |
21,519 |
20,369 |
| Ultra-Short Municipal Fund |
- |
610 |
- |
| California Tax Free Bond Fund |
12,628 |
5,263 |
4,194 |
| High Yield Municipal Fund |
33,710 |
10,690 |
12,615 |
| Intermediate Tax Free Bond Fund |
17,259 |
29,823 |
34,617 |
| New York Tax Free Bond Fund |
5,922 |
3,522 |
4,184 |
For more information on JPMDS, see the “Distributor” section in Part II of this SAI.
Distribution Fees
The table below sets forth the Rule 12b-1 fees that the Funds paid to or that were accrued by JPMDS (waived amounts are in parentheses) with respect to the fiscal periods indicated (amounts in thousands).
| |
Fiscal Year Ended | |||||
| |
February 29, 2020 |
February 28, 2021 |
February 28, 2022 | |||
| Fund |
Paid |
Waived |
Paid |
Waived |
Paid |
Waived |
| California Tax Free Bond Fund | ||||||
| Class A Shares |
$225 |
$— |
$351 |
$— |
$384 |
$— |
| Class C Shares |
370 |
— |
317 |
— |
221 |
— |
| High Yield Municipal Fund | ||||||
| Class A Shares |
268 |
— |
420 |
— |
489 |
— |
| Class C Shares |
203 |
— |
262 |
— |
238 |
— |
| Intermediate Tax Free Bond Fund | ||||||
| Class A Shares |
597 |
— |
648 |
— |
856 |
— |
| Class C Shares |
243 |
— |
180 |
— |
126 |
— |
| New York Tax Free Bond Fund | ||||||
| Class A Shares |
363 |
— |
401 |
— |
405 |
— |
| Class C Shares |
468 |
— |
327 |
— |
215 |
— |
| Short-Intermediate Municipal Bond Fund | ||||||
| Class A Shares |
106 |
— |
168 |
— |
230 |
— |
| Class C Shares |
32 |
— |
38 |
— |
31 |
— |
| Sustainable Municipal Income Fund | ||||||
| Class A Shares |
187 |
— |
283 |
— |
311 |
— |
| Class C Shares |
97 |
— |
83 |
— |
63 |
— |
| Tax Free Bond Fund | ||||||
| Class A Shares |
435 |
— |
638 |
— |
826 |
— |
| Class C Shares |
208 |
— |
162 |
— |
113 |
— |
| Ultra-Short Municipal Fund | ||||||
| Class A Shares |
137 |
— |
382 |
— |
250 |
— |
SHAREHOLDER SERVICING
Service Fees
Under the Shareholder Servicing Agreement, each Fund has agreed to pay JPMDS, for providing shareholder services and other related services, a fee at the following annual rates (expressed as a percentage of the average daily net asset value (“NAV”) of Fund shares owned by or for shareholders):
| Class A and Class C |
Up to 0.25% |
| Class I |
Up to 0.25% |
| Class R6 |
NONE |
Part I - 35
The table below sets forth the fees paid to JPMorgan Chase Bank or JPMDS (the amounts waived are in parentheses) for the fiscal years indicated (amounts in thousands).
| |
Fiscal Year Ended | |||||
| |
February 29, 2020 |
February 28, 2021 |
February 28, 2022 | |||
| Fund |
Paid |
Waived |
Paid |
Waived |
Paid |
Waived |
| California Tax Free Bond Fund | ||||||
| Class A Shares |
$— |
$(225) |
$— |
$(351) |
$— |
$(384) |
| Class C Shares |
— |
(123) |
1 |
(105) |
— |
(74) |
| Class I Shares |
72 |
(110) |
80 |
(123) |
88 |
(134) |
| High Yield Municipal Fund | ||||||
| Class A Shares |
— |
(268) |
— |
(420) |
— |
(489) |
| Class C Shares |
— |
(68) |
— |
(87) |
— |
(79) |
| Class I Shares |
192 |
(287) |
267 |
(406) |
266 |
(404) |
| Intermediate Tax Free Bond Fund | ||||||
| Class A Shares |
232 |
(365) |
252 |
(396) |
335 |
(521) |
| Class C Shares |
48 |
(33) |
35 |
(25) |
25 |
(17) |
| Class I Shares |
592 |
(881) |
709 |
(1,068) |
625 |
(950) |
| New York Tax Free Bond Fund | ||||||
| Class A Shares |
137 |
(226) |
151 |
(250) |
154 |
(251) |
| Class C Shares |
61 |
(95) |
43 |
(66) |
28 |
(44) |
| Class I Shares |
98 |
(156) |
86 |
(135) |
83 |
(130) |
| Short-Intermediate Municipal Bond Fund | ||||||
| Class A Shares |
103 |
(3) |
164 |
(4) |
230 |
—* |
| Class C Shares |
11 |
—* |
12 |
(1) |
10 |
—* |
| Class I Shares |
304 |
(1,243) |
354 |
(1,436) |
438 |
(1,784) |
| Sustainable Municipal Income Fund | ||||||
| Class A Shares |
73 |
(114) |
111 |
(172) |
120 |
(191) |
| Class C Shares |
17 |
(15) |
16 |
(12) |
13 |
(8) |
| Class I Shares |
89 |
(134) |
106 |
(162) |
118 |
(179) |
| Tax Free Bond Fund | ||||||
| Class A Shares |
26 |
(409) |
40 |
(598) |
57 |
(769) |
| Class C Shares |
26 |
(43) |
21 |
(33) |
15 |
(23) |
| Class I Shares |
75 |
(315) |
82 |
(337) |
87 |
(359) |
| Ultra-Short Municipal Fund | ||||||
| Class A Shares |
96 |
(41) |
271 |
(111) |
177 |
(73) |
| Class I Shares |
7,278 |
(979) |
11,658 |
(1,191) |
11,904 |
(1,412) |
*
Amount rounds to less than $500.
For a more complete discussion, see the “Shareholder Servicing” section in Part II of this SAI.
BROKERAGE AND RESEARCH SERVICES
Brokerage Commissions
The Funds paid the following brokerage commissions for the indicated fiscal periods:
| |
Fiscal Year Ended | ||
| Fund |
February 29, 2020 |
February 28, 2021 |
February 28, 2022 |
| California Tax Free Bond Fund | |||
| Total Brokerage Commissions |
$— |
$— |
$— |
| Brokerage Commissions to Affiliated Broker/ Dealers |
— |
— |
— |
| High Yield Municipal Fund | |||
| Total Brokerage Commissions |
— |
— |
— |
| Brokerage Commissions to Affiliated Broker/ Dealers |
— |
— |
— |
| Intermediate Tax Free Bond Fund | |||
| Total Brokerage Commissions |
4,979 |
2,365 |
20,173 |
| Brokerage Commissions to Affiliated Broker/ Dealers |
— |
— |
— |
Part I - 36
| |
Fiscal Year Ended | ||
| Fund |
February 29, 2020 |
February 28, 2021 |
February 28, 2022 |
| New York Tax Free Bond Fund | |||
| Total Brokerage Commissions |
$— |
$— |
$460 |
| Brokerage Commissions to Affiliated Broker/ Dealers |
— |
— |
— |
| Short-Intermediate Municipal Bond Fund | |||
| Total Brokerage Commissions |
— |
— |
— |
| Brokerage Commissions to Affiliated Broker/ Dealers |
— |
— |
— |
| Sustainable Municipal Income Fund | |||
| Total Brokerage Commissions |
— |
— |
173 |
| Brokerage Commissions to Affiliated Broker/ Dealers |
— |
— |
— |
| Tax Free Bond Fund | |||
| Total Brokerage Commissions |
2,465 |
1,108 |
3,151 |
| Brokerage Commissions to Affiliated Broker/ Dealers |
— |
— |
— |
| Ultra-Short Municipal Fund | |||
| Total Brokerage Commissions |
— |
— |
— |
| Brokerage Commissions to Affiliated Broker/ Dealers |
— |
— |
— |
Broker Research
For the fiscal year ended February 28, 2022, the Adviser allocated brokerage commissions to brokers who provided broker research including third party research for the Funds as follows:
| Fund Name |
Amount |
| Sustainable Municipal Income Fund |
$0 |
| Short-Intermediate Municipal Bond Fund |
0 |
| Tax Free Bond Fund |
0 |
| Ultra-Short Municipal Fund |
0 |
| California Tax Free Bond Fund |
0 |
| High Yield Municipal Fund |
0 |
| Intermediate Tax Free Bond Fund |
0 |
| New York Tax Free Bond Fund |
0 |
Securities of Regular Broker-Dealers
As of February 28, 2022, the Funds did not own securities of their regular broker-dealers.
For a more complete discussion, see the “Portfolio Transactions” section in Part II of this SAI.
FINANCIAL INTERMEDIARIES
Other Cash Compensation Payments
During the fiscal year ended February 28, 2022, JPMIM paid approximately $307,048,313 for all the J.P. Morgan Funds pursuant to written agreements with Financial Intermediaries (including both FINRA members and non-members) including written agreements for sub-transfer agency and/or omnibus accounting services (collectively, “Omnibus Sub-Accounting”) and networking.
For a more complete discussion, see the “Additional Compensation to Financial Intermediaries” section in Part II of this SAI.
Finder’s Fee Commissions
Financial Intermediaries who sell $250,000 or more of Class A Shares in the aggregate of certain J.P. Morgan Income Funds, the J.P. Morgan Investor Funds and certain other J.P. Morgan Funds or $1 million or more of Class A Shares in the aggregate of the J.P. Morgan Equity Funds, the J.P. Morgan Specialty Funds, the J.P. Morgan International Funds, the JPMorgan SmartRetirement Funds, the other J.P. Morgan Income Funds and certain other J.P. Morgan Funds may receive finders’ fees.
Part I - 37
There are no Finder’s fees paid with respect to the Ultra-Short Municipal Fund for sales of Class A Shares on or after March 31, 2018.
With respect to sales of Class A Shares of the Short-Intermediate Municipal Bond Fund, such fees are paid in accordance with the following schedule:
| Amount of Purchases |
Finder’s Fees |
| $250,000 – $3,999,999* |
0.75% |
| $4,000,000 – $9,999,999 |
0.50% |
| $10,000,000 or more |
0.25% |
*
If the total sale of Class A Shares of Qualifying Funds is $250,000 or more but the amount of the sale applicable to the Short Intermediate Municipal Bond Fund is less than $250,000, the Financial Intermediary will receive a finder’s fee equal to 0.75% of the sale of the Class A Shares of the Short-Intermediate Municipal Bond Fund. The Finders’ Fee Schedule for other Qualifying Funds can be found in the Statement of Additional Information for such Qualifying Funds.
With respect to sales of Class A Shares of the other Municipal Bond Funds, such fees are paid in accordance with the following schedule:
| Amount of Purchases |
Finder’s Fees |
| $250,000 – $3,999,999* |
0.75% |
| $4,000,000 – $49,999,999 |
0.50% |
| $50,000,000 or more |
0.25% |
*
If the total sale of Class A shares of Qualifying Funds is $250,000 or more but the amount of the sale applicable to a Fund (other than Class A Shares of the Short-Intermediate Municipal Bond Fund) is less than $250,000, the Financial Intermediary will receive a finder’s fee equal to 0.75% of the sale of the Class A Shares of the Fund (other than the Short-Intermediate Municipal Bond Fund). The Finders’ Fee Schedule for other Qualifying Funds can be found in the Statement of Additional Information for such Qualifying Funds.
The Distributor may also pay Financial Intermediaries a finder’s fee commission on sales of Class A Shares to certain defined contribution plans.
If a plan redeems the shares of certain Funds for which a finder’s fee has been paid within 18 months of the purchase date (12 months for Market Expansion Enhanced Index Fund and Mortgage-Backed Securities Fund), no CDSC is charged. However, JPMDS reserves the right to reclaim the finder’s fee paid to the Financial Intermediary. JPMDS reserves the right to alter or change the finder’s fee policy on these plans at any time at its own discretion.
For a more complete discussion, see the “Cash Compensation to Financial Intermediaries” section in Part II of this SAI.
Finder’s Fees Paid By Distributor
During the fiscal year ended February 28, 2022, JPMDS paid approximately $58,872,258 in finder’s fees for all J.P. Morgan Funds.
For a more complete discussion, see the “Additional Cash Compensation to Financial Intermediaries” section in Part II of this SAI.
TAX MATTERS
The Funds intend to minimize the payment of taxable income to shareholders by investing in tax-exempt or municipal securities in reliance at the time of purchase on an opinion of bond counsel to the issuer that the interest paid on those securities will be excludable from gross income for Federal income tax purposes. Such securities, however, may be determined to pay, or have paid, taxable income subsequent to the Fund’s acquisition of the securities. In that event, the Internal Revenue Service may demand that the Fund pay Federal income taxes on the affected interest income, and, if the Fund agrees to do so, the Fund’s yield could be adversely affected. In addition, the treatment of dividends previously paid or to be paid by the Fund as “exempt interest dividends” could be adversely affected, subjecting the Fund’s shareholders to increased Federal income tax liabilities. In addition, the treatment of dividends previously paid or to be paid by the Fund as “exempt interest dividends” could be adversely affected, subjecting the Fund’s shareholders to increased Federal income tax liabilities. In addition, future laws, regulations, rulings or court decisions may cause interest on municipal securities to be subject, directly or indirectly, to Federal income taxation or interest on state municipal securities to be subject to state or local income taxation, or the value of state municipal securities to be subject to state or local intangible personal property tax, or
Part I - 38
may otherwise prevent the Fund from realizing the full current benefit of the tax-exempt status of such securities. Any such change could also affect the market price of such securities, and thus the value of an investment in the Fund.
The exemption from federal income tax for exempt-interest dividends does not necessarily result in exemption for such dividends under the income or other tax laws of any state or local authority. Shareholders are advised to consult with their own tax advisors about state and local tax matters. Following is a brief discussion of treatment of exempt-interest dividends by certain states.
California Taxes. In general, as long as the California Tax Free Bond Fund continues to qualify as a regulated investment company under the federal Internal Revenue Code of 1986, as amended (the “Code”), it will incur no California income or franchise tax liability on income and capital gains distributed to shareholders.
California personal income tax law provides that dividends paid by a regulated investment company, or series thereof, from interest on obligations that would be exempt from California personal income tax if held directly by an individual, are excludable from gross income if such dividends are reported by the Fund as such exempt-interest dividends in written statements furnished to shareholders. In general, such exempt obligations will include California exempt and U.S. exempt obligations. Moreover, for a fund to qualify to pay such exempt-interest dividends under California law, at least 50% of the value of its assets must consist of such exempt obligations at the close of each quarter of its fiscal year and such fund must be qualified as a regulated investment company. Under California law, exempt-interest dividends (including some dividends paid after the close of the year as described in Section 855 of the Code) may not exceed the excess of (A) the amount of interest received by the fund which would be tax-exempt interest if the obligations on which the interest was paid were held by an individual over (B) the amount that would be considered expenses related to exempt income and thus would not be deductible under California personal income tax law.
Distributions to individual shareholders derived from items other than exempt-interest described above will be subject to California personal income tax. In addition, corporate shareholders should note that dividends will not be exempt from California corporate franchise tax and may not be exempt from California corporate income tax.
California has an alternative minimum tax (“AMT”) similar to the federal AMT. However, the California AMT does not include interest from private activity municipal obligations as an item of tax preference. Interest on indebtedness incurred or continued by a shareholder in connection with the purchase of shares of a fund will not be deductible for California personal income tax purposes.
Investors should consult their advisers about other state and local tax consequences of the investment in the fund as well as about any California tax consequences related to any special tax status or considerations applicable to such investors.
New York Taxes. Distributions received from the New York Tax Free Bond Fund that are derived from interest attributable to obligations of the State of New York or its political subdivisions or certain other governmental entities (for example, the Commonwealth of Puerto Rico or the U.S. Virgin Islands), the interest on which was excludable from gross income for purposes of both federal income taxation and New York State and City personal income taxation (“New York Tax-Exempt Bonds”) and designated as such, generally are exempt from New York State and New York City personal income tax as well as from the New York City unincorporated business tax (but not the New York State corporation franchise tax or New York City general corporation tax), provided that such dividends constitute exempt-interest dividends under Section 852(b)(5) of the Code. Dividends and other distributions (aside from exempt-interest dividends derived from New York Tax-Exempt Bonds) generally are not exempt from New York State and City taxes. For New York State and City tax purposes, distributions of net long-term capital gain will be taxable at the same rates as ordinary income.
Distributions by the Fund from investment income and capital gains, including exempt-interest dividends, also generally are included in a corporation’s net investment income for purposes of calculating such corporation’s obligations under the New York State corporate franchise tax and the New York City general corporation tax, if received by a corporation subject to those taxes, and will be subject to such taxes to the extent that a corporation’s net investment income is allocated to New York State and/or New York City. To the extent that investors are subject to state and local taxes outside of New York State, all dividends paid by the Fund may be taxable income for purposes thereof. To the extent that the Fund’s dividends are derived from interest attributable to the obligations of any other state or of a political subdivision of any such other state or are derived from capital gains, such dividends will generally not be exempt from New York State or New York City tax. The New York AMT for individuals, which excluded
Part I - 39
tax-exempt interest as an item of tax preference, has been eliminated for tax years beginning on or after January 1, 2014. Interest incurred to buy or carry shares of the Fund generally is not deductible for federal, New York State or New York City personal income tax purposes. Investors should consult their advisers about New York and other state and local tax consequences of the investment in the Fund.
Capital Loss Carryforwards
As of February 28, 2022, the following Funds had net capital loss carryforwards (amounts in thousands):
| |
Capital Loss Carryforward Character | |
| Fund |
Short-Term |
Long-Term |
| California Tax Free Bond Fund |
$2,805 |
$227 |
| High Yield Municipal Fund |
877 |
— |
| New York Tax Free Bond Fund |
2,305 |
145 |
| Short-Intermediate Municipal Bond Fund |
10,792 |
154 |
| Sustainable Municipal Income Fund |
— |
162 |
| Tax Free Bond Fund |
6,486 |
3,884 |
| Ultra-Short Municipal Fund |
6,206 |
845 |
For a more complete discussion, see the “Distributions and Tax Matters” section in Part II of this SAI.
PORTFOLIO HOLDINGS DISCLOSURE
A list of the entities that receive the Funds’ portfolio holdings information, the frequency with which it is provided to them and the length of the lag between the date of the information and the date it is disclosed is provided below:
| All Funds |
|
|
| Vickers Stock Research Corp. |
Monthly |
30 days after month end |
| MorningStar Inc. |
Monthly |
30 days after month end |
| Lipper, Inc. |
Monthly |
30 days after month end |
| Bloomberg LP |
Monthly |
30 days after month end |
| JPMorgan Chase & Co. |
Monthly |
30 days after month end |
| The McGraw-Hill Companies, Inc. — Standard & Poor’s |
Monthly |
30 days after month end |
| Factset |
Monthly |
5 days after month end |
| All Funds except Ultra-Short Municipal Fund and High Yield Municipal Fund |
|
|
| JPMorgan Private Bank |
Monthly |
30 days after month end |
| Tax Free Bond Fund |
|
|
| ManagersInvest |
Quarterly |
30 days after month end |
| Intermediate Tax Free Bond Fund |
|
|
| ManagersInvest |
Quarterly |
30 days after month end |
| Morgan Stanley Smith Barney |
Quarterly |
30 days after month end |
| Ultra-Short Municipal Fund |
|
|
| Casey, Quirk & Associates |
Monthly |
30 days after month end |
For a more complete discussion, see the “Portfolio Holdings Disclosure” section in Part II of this SAI.
SHARE OWNERSHIP
Trustees and Officers
As of December 31, 2021, the officers and Trustees, as a group, owned less than 1% of the shares of any class of each Fund.
Principal Holders
As of May 31, 2022, the persons who owned of record, or were known by the Trusts to own beneficially, 5% or more of the outstanding shares of any class of the Funds included in this SAI are shown in Attachment I-A, Principal Shareholders.
Part I - 40
FINANCIAL STATEMENTS
The Financial Statements of the Funds are incorporated by reference into this SAI. The Financial Statements for the fiscal year ended February 28, 2022, have been audited by PricewaterhouseCoopers LLP, an independent registered public accounting firm to the Funds, as indicated in its report with respect thereto, and are incorporated herein by reference in reliance on the report of said firm, given on the authority of said firm as experts in accounting and auditing. These Financial Statements are available without charge upon request by calling J.P. Morgan Funds Services at 1-800-480-4111.
Part I - 41
Attachment I-A
PRINCIPAL SHAREHOLDERS
Persons who beneficially own 25% or more of the outstanding shares of a Fund are presumed to “control” (as that term is defined in the 1940 Act) such Funds. As a result, those persons may have the ability to control the outcome on any matter requiring the approval of shareholders of such Funds. The list below includes record owners of over 5% of the share classes specified below based on the Funds' books and records. Such shareholders may hold their shares on behalf of other beneficial owners and may not be beneficial owners of the share classes identified.
| Name of Fund |
Name and Address of Shareholder |
Percentage Held |
| JPMORGAN CALIFORNIA TAX FREE BOND FUND | ||
| CLASS A SHARES |
J. P. MORGAN SECURITIES LLC* FOR EXCLUSIVE BENEFIT OF CUSTOMERS 4 CHASE METROTECH CTR BROOKLYN NY 11245-0003 |
50.21% |
| |
|
|
| |
EDWARD D JONES & CO FOR THE BENEFIT OF CUSTOMERS 12555 MANCHESTER RD SAINT LOUIS MO 63131-3710 |
21.63% |
| |
|
|
| |
WELLS FARGO CLEARING SERVICES LLC SPECIAL CUSTODY ACCT FOR THE EXCLUSIVE BENEFIT OF CUSTOMER 2801 MARKET STREET ST LOUIS MO 63103-2523 |
11.18% |
| |
|
|
| CLASS C SHARES |
J. P. MORGAN SECURITIES LLC* FOR EXCLUSIVE BENEFIT OF CUSTOMERS 4 CHASE METROTECH CTR BROOKLYN NY 11245-0003 |
72.62% |
| |
|
|
| |
WELLS FARGO CLEARING SERVICES LLC SPECIAL CUSTODY ACCT FOR THE EXCLUSIVE BENEFIT OF CUSTOMER 2801 MARKET STREET ST LOUIS MO 63103-2523 |
8.29% |
| |
|
|
| CLASS I SHARES |
J. P. MORGAN SECURITIES LLC* FOR EXCLUSIVE BENEFIT OF CUSTOMERS 4 CHASE METROTECH CTR BROOKLYN NY 11245-0003 |
61.19% |
| |
|
|
| |
TD AMERITRADE INC FOR THE EXCLUSIVE BENEFIT OF OUR CLIENTS PO BOX 2226 OMAHA NE 68103-2226 |
10.05% |
| |
|
|
| CLASS R6 SHARES |
J. P. MORGAN SECURITIES LLC* 4 CHASE METROTECH CTR BROOKLYN NY 11245-0003 |
92.76% |
Part I - 42
| Name of Fund |
Name and Address of Shareholder |
Percentage Held |
| |
|
|
| |
EDWARD D JONES & CO FOR THE BENEFIT OF CUSTOMERS 12555 MANCHESTER RD SAINT LOUIS MO 63131-3710 |
7.24% |
| JPMORGAN HIGH YIELD MUNICIPAL FUND | ||
| CLASS A SHARES |
EDWARD D JONES & CO FOR THE BENEFIT OF CUSTOMERS 12555 MANCHESTER RD SAINT LOUIS MO 63131-3710 |
45.47% |
| |
|
|
| |
J. P. MORGAN SECURITIES LLC* FOR EXCLUSIVE BENEFIT OF CUSTOMERS 4 CHASE METROTECH CTR BROOKLYN NY 11245-0003 |
19.14% |
| |
|
|
| |
NATIONAL FINANCIAL SERVICES LLC FOR EXCLUSIVE BENEFIT OF OUR CUSTOMERS 499 WASHINGTON BLVD ATTN MUTUAL FUNDS DEPT 4TH FLOOR JERSEY CITY NJ 07310-1995 |
8.66% |
| |
|
|
| |
WELLS FARGO CLEARING SERVICES LLC SPECIAL CUSTODY ACCT FOR THE EXCLUSIVE BENEFIT OF CUSTOMER 2801 MARKET STREET ST LOUIS MO 63103-2523 |
6.46% |
| |
|
|
| CLASS C SHARES |
J. P. MORGAN SECURITIES LLC* FOR EXCLUSIVE BENEFIT OF CUSTOMERS 4 CHASE METROTECH CTR BROOKLYN NY 11245-0003 |
26.06% |
| |
|
|
| |
NATIONAL FINANCIAL SERVICES LLC FOR EXCLUSIVE BENEFIT OF OUR CUSTOMERS 499 WASHINGTON BLVD ATTN MUTUAL FUNDS DEPT 4TH FLOOR JERSEY CITY NJ 07310-1995 |
21.15% |
| |
|
|
| |
WELLS FARGO CLEARING SERVICES LLC SPECIAL CUSTODY ACCT FOR THE EXCLUSIVE BENEFIT OF CUSTOMER 2801 MARKET STREET ST LOUIS MO 63103-2523 |
14.02% |
| |
|
|
| |
AMERICAN ENTERPRISE INVESTMENT SVC 707 2ND AVE S MINNEAPOLIS MN 55402-2405 |
8.44% |
Part I - 43
| Name of Fund |
Name and Address of Shareholder |
Percentage Held |
| |
|
|
| |
RAYMOND JAMES OMNIBUS FOR MUTUAL FUNDS ATTN COURTNEY WALLER 880 CARILLON PKWY ST PETERSBURG FL 33716-1100 |
7.72% |
| |
|
|
| CLASS I SHARES |
NATIONAL FINANCIAL SERVICES LLC FOR THE EXCLUSIVE BENEFIT OF OUR CUSTOMERS ATTN MUTUAL FUNDS DEPT 4TH FL 499 WASHINGTON BLVD JERSEY CITY NJ 07310-1995 |
26.39% |
| |
|
|
| |
UBS WM USA OMNI ACCOUNT M/F SPEC CDY A/C EBOC UBSFSI 1000 HARBOR BLVD WEEHAWKEN NJ 07086-6761 |
23.50% |
| |
|
|
| |
PERSHING LLC P.O. BOX 2052 JERSEY CITY NJ 07303-2052 |
10.58% |
| |
|
|
| |
AMERICAN ENTERPRISE INVESTMENT SVC 707 2ND AVE S MINNEAPOLIS MN 55402-2405 |
7.92% |
| |
|
|
| |
J. P. MORGAN SECURITIES LLC* FOR EXCLUSIVE BENEFIT OF CUSTOMERS 4 CHASE METROTECH CTR BROOKLYN NY 11245-0003 |
5.53% |
| |
|
|
| |
CHARLES SCHWAB & CO INC SPECIAL CUSTODY ACCOUNT FOR BENEFIT OF CUSTOMERS ATTN: MUTUAL FUNDS 211 MAIN ST SAN FRANCISCO CA 94105-1901 |
5.21% |
| |
|
|
| |
RAYMOND JAMES OMNIBUS FOR MUTUAL FUNDS ATTN COURTNEY WALLER 880 CARILLON PKWY ST PETERSBURG FL 33716-1100 |
5.04% |
| |
|
|
| CLASS R6 SHARES |
JPMIM AS AGENT FOR* THE WW GRAINGER INC GROUP BENEFIT PLAN I ATTN CLIENT SERVICES 1111 POLARIS PKWY OH1-0084 COLUMBUS OH 43240-2031 |
56.32% |
Part I - 44
| Name of Fund |
Name and Address of Shareholder |
Percentage Held |
| |
|
|
| |
EDWARD D JONES & CO FOR THE BENEFIT OF CUSTOMERS 12555 MANCHESTER RD SAINT LOUIS MO 63131-3710 |
43.24% |
| JPMORGAN INTERMEDIATE TAX FREE BOND FUND | ||
| CLASS A SHARES |
EDWARD D JONES & CO FOR THE BENEFIT OF CUSTOMERS 12555 MANCHESTER RD SAINT LOUIS MO 63131-3710 |
56.35% |
| |
|
|
| |
J. P. MORGAN SECURITIES LLC* FOR EXCLUSIVE BENEFIT OF CUSTOMERS 4 CHASE METROTECH CTR BROOKLYN NY 11245-0003 |
27.56% |
| |
|
|
| CLASS C SHARES |
J. P. MORGAN SECURITIES LLC* FOR EXCLUSIVE BENEFIT OF CUSTOMERS 4 CHASE METROTECH CTR BROOKLYN NY 11245-0003 |
52.41% |
| |
|
|
| |
MORGAN STANLEY SMITH BARNEY LLC FOR THE EXCLUSIVE BENE OF ITS CUST 1 NEW YORK PLZ FL 12 NEW YORK NY 10004-1932 |
10.87% |
| |
|
|
| |
NATIONAL FINANCIAL SERVICES LLC FOR EXCLUSIVE BENEFIT OF OUR CUSTOMERS 499 WASHINGTON BLVD ATTN MUTUAL FUNDS DEPT 4TH FLOOR JERSEY CITY NJ 07310-1995 |
6.27% |
| |
|
|
| |
EDWARD D JONES & CO FOR THE BENEFIT OF CUSTOMERS 12555 MANCHESTER RD SAINT LOUIS MO 63131-3710 |
5.86% |
| |
|
|
| |
WELLS FARGO CLEARING SERVICES LLC SPECIAL CUSTODY ACCT FOR THE EXCLUSIVE BENEFIT OF CUSTOMER 2801 MARKET STREET ST LOUIS MO 63103-2523 |
5.54% |
| |
|
|
| CLASS I SHARES |
NATIONAL FINANCIAL SERVICES LLC FOR THE EXCLUSIVE BENEFIT OF OUR CUSTOMERS ATTN MUTUAL FUNDS DEPT 4TH FL 499 WASHINGTON BLVD JERSEY CITY NJ 07310-1995 |
26.84% |
| |
|
|
| |
J. P. MORGAN SECURITIES LLC* FOR EXCLUSIVE BENEFIT OF CUSTOMERS 4 CHASE METROTECH CTR BROOKLYN NY 11245-0003 |
24.80% |
Part I - 45
| Name of Fund |
Name and Address of Shareholder |
Percentage Held |
| |
|
|
| |
PERSHING LLC P.O. BOX 2052 JERSEY CITY NJ 07303-2052 |
9.56% |
| |
|
|
| |
LPL FINANCIAL OMNIBUS CUSTOMER ACCOUNT ATTN MUTUAL FUND TRADING 4707 EXECUTIVE DR SAN DIEGO CA 92121-3091 |
9.03% |
| |
|
|
| |
CAPINCO C/O US BANK NA PO BOX 1787 MILWAUKEE WI 53201-1787 |
8.17% |
| |
|
|
| |
MORGAN STANLEY SMITH BARNEY LLC FOR THE EXCLUSIVE BENE OF ITS CUST 1 NEW YORK PLZ FL 12 NEW YORK NY 10004-1932 |
5.78% |
| |
|
|
| CLASS R6 SHARES |
J. P. MORGAN SECURITIES LLC* FOR EXCLUSIVE BENEFIT OF CUSTOMERS 4 CHASE METROTECH CTR BROOKLYN NY 11245-0003 |
95.12% |
| JPMORGAN NEW YORK TAX FREE BOND FUND | ||
| CLASS A SHARES |
J. P. MORGAN SECURITIES LLC* FOR EXCLUSIVE BENEFIT OF CUSTOMERS 4 CHASE METROTECH CTR BROOKLYN NY 11245-0003 |
76.74% |
| |
|
|
| CLASS C SHARES |
J. P. MORGAN SECURITIES LLC* FOR EXCLUSIVE BENEFIT OF CUSTOMERS 4 CHASE METROTECH CTR BROOKLYN NY 11245-0003 |
83.22% |
| |
|
|
| |
PERSHING LLC P.O. BOX 2052 JERSEY CITY NJ 07303-2052 |
5.55% |
| |
|
|
| CLASS I SHARES |
J. P. MORGAN SECURITIES LLC* FOR EXCLUSIVE BENEFIT OF CUSTOMERS 4 CHASE METROTECH CTR BROOKLYN NY 11245-0003 |
44.76% |
| |
|
|
| |
CHARLES SCHWAB & CO INC SPECIAL CUSTODY ACCOUNT FOR BENEFIT OF CUSTOMERS ATTN MUTUAL FUNDS 211 MAIN ST SAN FRANCISCO CA 94105-1901 |
17.23% |
Part I - 46
| Name of Fund |
Name and Address of Shareholder |
Percentage Held |
| |
|
|
| |
NATIONAL FINANCIAL SERVICES LLC FOR THE EXCLUSIVE BENEFIT OF OUR CUSTOMERS ATTN MUTUAL FUNDS DEPT 4TH FL 499 WASHINGTON BLVD JERSEY CITY NJ 07310-1995 |
16.89% |
| |
|
|
| CLASS R6 SHARES |
J. P. MORGAN SECURITIES LLC* 4 CHASE METROTECH CTR BROOKLYN NY 11245-0003 |
97.52% |
| JPMORGAN SUSTAINABLE MUNICIPAL INCOME FUND | ||
| CLASS A SHARES |
EDWARD D JONES & CO FOR THE BENEFIT OF CUSTOMERS 12555 MANCHESTER RD SAINT LOUIS MO 63131-3710 |
47.51% |
| |
|
|
| |
J. P. MORGAN SECURITIES LLC* FOR EXCLUSIVE BENEFIT OF CUSTOMERS 4 CHASE METROTECH CTR BROOKLYN NY 11245-0003 |
35.79% |
| |
|
|
| CLASS C SHARES |
J. P. MORGAN SECURITIES LLC* FOR EXCLUSIVE BENEFIT OF CUSTOMERS 4 CHASE METROTECH CTR BROOKLYN NY 11245-0003 |
59.89% |
| |
|
|
| |
AMERICAN ENTERPRISE INVESTMENT SVC 707 2ND AVE S MINNEAPOLIS MN 55402-2405 |
10.70% |
| |
|
|
| |
WELLS FARGO CLEARING SERVICES LLC SPECIAL CUSTODY ACCT FOR THE EXCLUSIVE BENEFIT OF CUSTOMER 2801 MARKET STREET ST LOUIS MO 63103-2523 |
6.08% |
| |
|
|
| |
EDWARD D JONES & CO FOR THE BENEFIT OF CUSTOMERS 12555 MANCHESTER RD SAINT LOUIS MO 63131-3710 |
6.01% |
| |
|
|
| CLASS I SHARES |
NATIONAL FINANCIAL SERVICES LLC FOR EXCLUSIVE BENEFIT OF OUR CUSTOMERS ATTN MUTUAL FUNDS DEPT 4TH FL 499 WASHINGTON BLVD JERSEY CITY NJ 07310-1995 |
34.83% |
| |
|
|
| |
CHARLES SCHWAB & CO INC SPECIAL CUSTODY ACCOUNT FOR THE BENEFIT OF CUSTOMERS ATTN: MUTUAL FUNDS 211 MAIN ST SAN FRANCISCO CA 94105-1901 |
17.95% |
Part I - 47
| Name of Fund |
Name and Address of Shareholder |
Percentage Held |
| |
|
|
| |
J. P. MORGAN SECURITIES LLC* FOR EXCLUSIVE BENEFIT OF CUSTOMERS 4 CHASE METROTECH CTR BROOKLYN NY 11245-0003 |
17.83% |
| |
|
|
| |
TD AMERITRADE INC FOR THE EXCLUSIVE BENEFIT OF OUR CLIENTS PO BOX 2226 OMAHA NE 68103-2226 |
8.18% |
| |
|
|
| |
PERSHING LLC P.O. BOX 2052 JERSEY CITY NJ 07303-2052 |
5.42% |
| |
|
|
| CLASS R6 SHARES |
J. P. MORGAN SECURITIES LLC* FOR EXCLUSIVE BENEFIT OF CUSTOMERS 4 CHASE METROTECH CTR BROOKLYN NY 11245-0003 |
91.21% |
| |
|
|
| |
EDWARD D JONES & CO FOR THE BENEFIT OF CUSTOMERS 12555 MANCHESTER RD SAINT LOUIS MO 63131-3710 |
8.51% |
| JPMORGAN SHORT-INTERMEDIATE MUNICIPAL BOND FUND | ||
| CLASS A SHARES |
EDWARD D JONES & CO FOR THE BENEFIT OF CUSTOMERS 12555 MANCHESTER RD SAINT LOUIS MO 63131-3710 |
65.37% |
| |
|
|
| |
J. P. MORGAN SECURITIES LLC* FOR EXCLUSIVE BENEFIT OF CUSTOMERS 4 CHASE METROTECH CTR BROOKLYN NY 11245-0003 |
20.45% |
| |
|
|
| CLASS C SHARES |
J. P. MORGAN SECURITIES LLC* FOR EXCLUSIVE BENEFIT OF CUSTOMERS 4 CHASE METROTECH CTR BROOKLYN NY 11245-0003 |
45.08% |
| |
|
|
| |
WELLS FARGO CLEARING SERVICES LLC SPECIAL CUSTODY ACCT FOR THE EXCLUSIVE BENEFIT OF CUSTOMER 2801 MARKET STREET ST LOUIS MO 63103-2523 |
17.58% |
| |
|
|
| |
NATIONAL FINANCIAL SERVICES LLC FOR EXCLUSIVE BENEFIT OF OUR CUSTOMERS 499 WASHINGTON BLVD ATTN MUTUAL FUNDS DEPT 4TH FLOOR JERSEY CITY NJ 07310-1995 |
9.86% |
Part I - 48
| Name of Fund |
Name and Address of Shareholder |
Percentage Held |
| |
|
|
| |
EDWARD D JONES & CO FOR THE BENEFIT OF CUSTOMERS 12555 MANCHESTER RD SAINT LOUIS MO 63131-3710 |
9.64% |
| |
|
|
| |
UBS WM USA OMNI ACCOUNT M/F SPEC CDY A/C EBOC UBSFSI 1000 HARBOR BLVD WEEHAWKEN NJ 07086-6761 |
5.48% |
| |
|
|
| CLASS I SHARES |
J. P. MORGAN SECURITIES LLC* FOR EXCLUSIVE BENEFIT OF CUSTOMERS 4 CHASE METROTECH CTR BROOKLYN NY 11245-0003 |
69.14% |
| |
|
|
| |
NATIONAL FINANCIAL SERVICES LLC FOR EXCLUSIVE BENEFIT OF OUR CUSTOMERS ATTN MUTUAL FUNDS DEPT 4TH FL 499 WASHINGTON BLVD JERSEY CITY NJ 07310-1995 |
18.51% |
| |
|
|
| CLASS R6 SHARES |
J. P. MORGAN SECURITIES LLC* FOR EXCLUSIVE BENEFIT OF CUSTOMERS 4 CHASE METROTECH CTR BROOKLYN NY 11245-0003 |
96.05% |
| JPMORGAN TAX FREE BOND FUND | ||
| CLASS A SHARES |
EDWARD D JONES & CO FOR THE BENEFIT OF CUSTOMERS 12555 MANCHESTER RD SAINT LOUIS MO 63131-3710 |
55.84% |
| |
|
|
| |
J. P. MORGAN SECURITIES LLC* FOR EXCLUSIVE BENEFIT OF CUSTOMERS 4 CHASE METROTECH CTR BROOKLYN NY 11245-0003 |
25.58% |
| |
|
|
| CLASS C SHARES |
J. P. MORGAN SECURITIES LLC* FOR EXCLUSIVE BENEFIT OF CUSTOMERS 4 CHASE METROTECH CTR BROOKLYN NY 11245-0003 |
63.56% |
| |
|
|
| |
EDWARD D JONES & CO FOR THE BENEFIT OF CUSTOMERS 12555 MANCHESTER RD SAINT LOUIS MO 63131-3710 |
11.82% |
| |
|
|
| |
LPL FINANCIAL OMNIBUS CUSTOMER ACCOUNT ATTN MUTUAL FUND TRADING 4707 EXECUTIVE DR SAN DIEGO CA 92121-3091 |
5.04% |
Part I - 49
| Name of Fund |
Name and Address of Shareholder |
Percentage Held |
| |
|
|
| CLASS I SHARES |
J. P. MORGAN SECURITIES LLC* FOR EXCLUSIVE BENEFIT OF CUSTOMERS 4 CHASE METROTECH CTR BROOKLYN NY 11245-0003 |
33.74% |
| |
|
|
| |
NATIONAL FINANCIAL SERVICES LLC FOR EXCLUSIVE BENEFIT OF OUR CUSTOMERS ATTN MUTUAL FUNDS DEPT 4TH FL 499 WASHINGTON BLVD JERSEY CITY NJ 07310-1995 |
22.28% |
| |
|
|
| |
LPL FINANCIAL OMNIBUS CUSTOMER ACCOUNT ATTN MUTUAL FUND TRADING 4707 EXECUTIVE DR SAN DIEGO CA 92121-3091 |
10.92% |
| |
|
|
| |
THE FULTON COMPANY C/O FULTON FINANCIAL ADVISORS PO BOX 3215 LANCASTER PA 17604-3215 |
9.24% |
| |
|
|
| CLASS R6 SHARES |
J. P. MORGAN SECURITIES LLC* 4 CHASE METROTECH CTR BROOKLYN NY 11245-0003 |
92.64% |
| |
|
|
| |
EDWARD D JONES & CO FOR THE BENEFIT OF CUSTOMERS 12555 MANCHESTER RD SAINT LOUIS MO 63131-3710 |
6.19% |
| JPMORGAN ULTRA-SHORT MUNICIPAL FUND | ||
| CLASS A SHARES |
J. P. MORGAN SECURITIES LLC* FOR EXCLUSIVE BENEFIT OF CUSTOMERS 4 CHASE METROTECH CTR BROOKLYN NY 11245-0003 |
54.64% |
| |
|
|
| |
MORGAN STANLEY SMITH BARNEY LLC FOR THE EXCLUSIVE BENE OF ITS CUST 1 NEW YORK PLZ FL 12 NEW YORK NY 10004-1932 |
39.28% |
| |
|
|
| CLASS I SHARES |
J. P. MORGAN SECURITIES LLC* FOR EXCLUSIVE BENEFIT OF CUSTOMERS 4 CHASE METROTECH CTR BROOKLYN NY 11245-0003 |
79.16% |
Part I - 50
| Name of Fund |
Name and Address of Shareholder |
Percentage Held |
| |
|
|
| |
NATIONAL FINANCIAL SERVICES LLC FOR THE EXCLUSIVE BENEFIT OF OUR CUSTOMERS ATTN MUTUAL FUNDS DEPT 4TH FL 499 WASHINGTON BLVD JERSEY CITY NJ 07310-1995 |
14.32% |
*
The shareholder of record is a subsidiary or affiliate of JPMorgan Chase & Co. (a “JPMorgan Affiliate”). Typically, the shares are held for the benefit of underlying accounts for which the JPMorgan Affiliate may have voting or investment power. To the extent that JPMorgan Affiliates own 25% or more of a class of shares of a Fund, JPMorgan Chase & Co. may be deemed to be a “controlling person” of such shares under the 1940 Act.
Part I - 51
J.P. Morgan Funds
STATEMENT OF ADDITIONAL INFORMATION
PART II
Part II of this SAI describes policies and practices that apply to each of the J.P. Morgan Funds discussed in Part I of this SAI, which, precedes this Part II. This Part II is not a standalone document and must be read in conjunction with Part I. References in this Part II to a “Fund” mean each J.P. Morgan Fund, unless noted otherwise. Capitalized terms used and not otherwise defined in this Part II have the meanings given to them in Part I of this SAI.
As of July 1, 2022
Part II
Table of Contents
Table of Contents
| 5 | |
| 5 | |
| 7 | |
| 7 | |
| 8 | |
| 8 | |
| 9 | |
| 9 | |
| 9 | |
| 9 | |
| 9 | |
| 10 | |
| 11 | |
| 13 | |
| 13 | |
| 13 | |
| 14 | |
| 14 | |
| 14 | |
| 14 | |
| 15 | |
| 15 | |
| 15 | |
| 15 | |
| 17 | |
| 17 | |
| 17 | |
| 17 | |
| 18 | |
| 19 | |
| 19 | |
| 23 | |
| 24 | |
| 25 | |
| 25 | |
| 25 | |
| 26 | |
| 27 | |
| 31 | |
| 31 | |
| 32 | |
| 32 | |
| 32 | |
| 33 | |
| 33 | |
| 34 | |
| 34 | |
| 34 | |
| 35 | |
| 35 |
Part II - i
| 35 | |
| 36 | |
| 36 | |
| 37 | |
| 37 | |
| 37 | |
| 38 | |
| 38 | |
| 38 | |
| 38 | |
| 38 | |
| 39 | |
| 42 | |
| 42 | |
| 42 | |
| 42 | |
| 43 | |
| 44 | |
| 45 | |
| 47 | |
| 48 | |
| 50 | |
| 51 | |
| 51 | |
| 52 | |
| 52 | |
| 53 | |
| 53 | |
| 54 | |
| 54 | |
| 55 | |
| 55 | |
| 55 | |
| 55 | |
| 56 | |
| 56 | |
| 56 | |
| 56 | |
| 56 | |
| 57 | |
| 57 | |
| 58 | |
| 58 | |
| 59 | |
| 60 | |
| 60 | |
| 61 | |
| 61 | |
| 62 | |
| 62 | |
| 63 | |
| 64 |
Part II - ii
| 65 | |
| 66 | |
| 67 | |
| 67 | |
| 67 | |
| 68 | |
| 69 | |
| 69 | |
| 69 | |
| 69 | |
| 70 | |
| 71 | |
| 80 | |
| 81 | |
| 81 | |
| 83 | |
| 84 | |
| 86 | |
| 86 | |
| 86 | |
| 87 | |
| 87 | |
| 87 | |
| 87 | |
| 89 | |
| 89 | |
| 91 | |
| 92 | |
| 96 | |
| 96 | |
| 97 | |
| 98 | |
| 99 | |
| 99 | |
| 100 | |
| 100 | |
| 100 | |
| 106 | |
| 110 | |
| 110 | |
| 113 | |
| 113 | |
| 114 | |
| 115 | |
| 116 | |
| 117 | |
| 117 | |
| 123 | |
| 124 | |
| 124 | |
| 124 | |
| 125 |
Part II - iii
| 128 | |
| 128 | |
| 130 | |
| 130 | |
| 132 | |
| 132 | |
| 132 | |
| 133 | |
| 134 | |
| 134 | |
| 135 | |
| 136 | |
| 137 | |
| 137 | |
| 141 | |
| 141 | |
| 141 | |
| 141 | |
| 143 | |
| 144 | |
| 145 | |
| 145 | |
| 145 | |
| 146 | |
| 148 | |
| 148 | |
| 150 | |
| 159 | |
| A-1 | |
| B-1 |
Part II - iv
INVESTMENT STRATEGIES AND POLICIES
As noted in the applicable Prospectuses for each of the Funds, in addition to the investment strategies and the investment risks described in the Prospectuses, each Fund may employ other investment strategies and may be subject to other risks, which are described below. Each Fund may engage in the practices described below to the extent consistent with its investment objectives, strategies, policies and restrictions. However, no Fund is required to engage in any particular transaction or purchase any particular type of securities or investment even if to do so might benefit the Fund. Because the following is a combined description of investment strategies of all of the Funds, (i) certain matters described herein may not apply to particular Funds and (ii) certain references to the Adviser may also include a Sub-Adviser, as the context requires.
An investment in a Fund or any other fund may not provide a complete investment program. The suitability of an investment in a Fund should be considered based on the investment objective, strategies and risks described in the Fund’s prospectus and this SAI, considered in light of all of the other investments in your portfolio, as well as your risk tolerance, financial goals and time horizons. You may want to consult with a financial advisor to determine if a Fund is suitable for you. The value of your investment in a Fund will fluctuate in response to movements in the market. Fund performance also will depend on the effectiveness of the Adviser’s research and the management team’s investment decisions. Tax considerations may limit a Fund’s ability to pursue an investment opportunity or influence portfolio management decisions for the Fund. Future legislative and regulatory determinations may adversely affect the overall market for an instrument in which a Fund may invest and the Fund itself. There is no assurance that any Fund investment can be successfully employed. An investment in a Fund involves risk of a total loss.
For a list of investment strategies and policies employed by each Fund, see “INVESTMENT PRACTICES” in Part I of this SAI.
Asset-Backed Securities
Asset-backed securities consist of securities secured by company receivables, home equity loans, truck and auto loans, leases, or credit card receivables. Asset-backed securities also include other securities backed by other types of receivables or other assets, including collateralized debt obligations (“CDOs”), asset-backed commercial paper (“ABCP”) and other similarly structured securities. CDOs include collateralized loan obligations (“CLOs”) and collateral bond obligations (“CBOs”). Such assets are generally securitized through the use of trusts or special purpose corporations. Asset-backed securities are backed by a pool of assets representing the obligations often of a number of different parties. Certain of these securities may be illiquid.
Asset-backed securities are generally subject to the risks of the underlying assets. In addition, asset-backed securities, in general, are subject to certain additional risks including depreciation, damage or loss of the collateral backing the security, failure of the collateral to generate the anticipated cash flow or in certain cases more rapid prepayment because of events affecting the collateral, such as accelerated prepayment of loans backing these securities or destruction of equipment subject to equipment trust certificates. In addition, the underlying assets (for example, underlying home equity loans) may be refinanced or paid off prior to maturity during periods of increasing or declining interest rates. During periods of declining interest rates, prepayment of loans underlying asset-backed securities can be expected to accelerate. Changes in prepayment rates can result in greater price and yield volatility. If asset-backed securities are pre-paid, a Fund may have to reinvest the proceeds from the securities at a lower rate. Potential market gains on a security subject to prepayment risk may be more limited than potential market gains on a comparable security that is not subject to prepayment risk. Under certain prepayment rate scenarios, a Fund may fail to recover additional amounts paid (i.e., premiums) for securities with higher interest rates, resulting in an unexpected loss.
A CBO is a trust or other special purpose entity (“SPE”) which is typically backed by a diversified pool of fixed income securities (which may include high risk, below investment grade securities). A CLO is a trust or other SPE that is typically collateralized by a pool of loans, which may include, among others, domestic and non-U.S. senior secured loans, senior unsecured loans, and subordinate corporate loans, including loans that may be rated below investment grade or equivalent unrated loans. While many CDOs may receive credit enhancement in the form of a senior-subordinate structure, over-collateralization or bond insurance, such enhancement may not always be present and may fail to protect a Fund against the risk of loss on default of the collateral. Certain CDOs may use derivatives contracts to create “synthetic”
Part II - 5
exposure to assets rather than holding such assets directly, which entails the risks of derivative instruments described elsewhere in this SAI. CDOs may charge management fees and administrative expenses, which are in addition to those of a Fund.
The cash flows for CDOs from the SPE usually are split into two or more portions, called tranches, varying in risk and yield. The riskiest portion is the “equity” tranche, which bears the first loss from defaults from the bonds or loans in the SPE and serves to protect the other, more senior tranches from default (though such protection is not complete). Since it is partially protected from defaults, a senior tranche from a CDO typically has higher ratings and lower yields than its underlying securities, and may be rated investment grade. Despite the protection from the equity tranche, CDO tranches can experience substantial losses due to actual defaults, downgrades of the underlying collateral by rating agencies, forced liquidation of the collateral pool due to a failure of coverage tests, increased sensitivity to defaults due to collateral default and disappearance of protecting tranches, market anticipation of defaults, as well as investor aversion to CDO securities as a class. Interest on certain tranches of a CDO may be paid in kind or deferred and capitalized (paid in the form of obligations of the same type rather than cash), which involves continued exposure to default risk with respect to such payments.
The risks of an investment in a CDO depend largely on the type of the collateral or securities and the class of the CDO in which a Fund invests. CDO tranches often have credit ratings and are typically issued in classes with various priorities. Normally, CDOs are privately offered and sold (that is, they are not registered under the securities laws), and may be subject to additional liquidity risks. However, an active dealer market may exist for CDOs, allowing a CDO to be sold pursuant to Rule 144A. In addition to the risks typically associated with fixed income securities and asset-backed securities generally discussed elsewhere in this SAI, CDOs carry additional risks including, but not limited to: (i) the possibility that distributions from collateral securities will not be adequate to make interest or other payments; (ii) the risk that the collateral may default or decline in value or be downgraded, if rated by a nationally recognized statistical rating organization (“NRSRO”); (iii) a Fund may invest in tranches of CDOs that are subordinate to other tranches; (iv) the structure and complexity of the transaction and the legal documents could lead to disputes among investors regarding the characterization of proceeds; (v) the investment return achieved by the Fund could be significantly different than those predicted by financial models; (vi) the lack of a readily available secondary market for CDOs; (vii) risk of forced “fire sale” liquidation due to technical defaults such as coverage test failures; (viii) values may be volatile; (ix) disputes with the issuer may produce unexpected results; and (x) the CDO’s manager may perform poorly.
Certain Funds may purchase ABCP that is issued by conduits sponsored by banks, mortgage companies, investment banking firms, finance companies, hedge funds, private equity firms and special purpose finance entities. ABCP typically refers to a debt security with an original term to maturity of up to 270 days, the payment of which is supported from underlying assets, or one or more liquidity or credit support providers, or both. Assets backing ABCP, which may be included in revolving pools of assets with large numbers of obligors, include credit card, car loan and other consumer receivables and home or commercial mortgages, including subprime mortgages. To protect investors from the risk of non-payment, ABCP programs are generally structured with various protections, such as credit enhancement, liquidity support, and commercial paper stop issuance and wind-down triggers. There can be no guarantee that these protections will be sufficient to prevent losses to investors in ABCP. The repayment of ABCP issued by a conduit depends primarily on the conduit’s ability to issue new ABCP, access to the liquidity or credit support and, to a lesser extent, cash collections received from the conduit’s underlying asset portfolio. There could be losses to a Fund’s investing in ABCP in the event that: (i) the Fund is unable to access the liquidity or credit support for the ABCP; (ii) the conduit is unable to issue new ABCP; (iii) there is credit or market deterioration in the conduit’s underlying portfolio; and (iv) there are mismatches in the timing of the cash flows of the underlying asset interests and the repayment obligations of maturing ABCP.
Some ABCP programs historically have provided for an extension of the maturity date of the ABCP if, on the related maturity date, the conduit is unable to access sufficient liquidity by issuing additional ABCP. This may delay the sale of the underlying collateral and a Fund may incur a loss if the value of the collateral deteriorates during the extension period. Alternatively, if collateral for ABCP deteriorates in value, the collateral may be required to be sold at inopportune times or at prices insufficient to repay the principal and interest on the ABCP. ABCP programs may provide for the issuance of subordinated notes as an additional form of credit enhancement. The subordinated notes are typically of a lower credit quality and have a higher risk of default. A Fund purchasing these subordinated notes will therefore have a higher likelihood of loss than investors in the senior notes.
Part II - 6
Total Annual Fund Operating Expenses set forth in the fee table and Financial Highlights section of each Fund’s Prospectuses do not include any expenses associated with any Fund investments in certain structured or synthetic products that may rely on the exception for the definition of “investment company” provided by Section 3(c)(1) or 3(c)(7) of the Investment Company Act of 1940, as amended (the “1940 Act”).
Auction Rate Securities
Auction rate securities consist of auction rate municipal securities and auction rate preferred securities sold through an auction process issued by closed-end investment companies, municipalities and governmental agencies. For more information on risks associated with municipal securities, see “Municipal Securities” below.
Provided that the auction mechanism is successful, auction rate securities usually permit the holder to sell the securities in an auction at par value at specified intervals. The dividend is reset by “Dutch” auction in which bids are made by broker-dealers and other institutions for a certain amount of securities at a specified minimum yield. The dividend rate set by the auction is the lowest interest or dividend rate that covers all securities offered for sale. While this process is designed to permit auction rate securities to be traded at par value, there is the risk that an auction will fail due to insufficient demand for the securities. Failed auctions may adversely impact the liquidity of auction rate securities investments. There is no guarantee that a liquid market will exist for a Fund’s investments in auction rate securities at a time when the Fund wishes to dispose of such securities.
Dividends on auction rate preferred securities issued by a closed-end fund may be designated as exempt from federal income tax to the extent they are attributable to tax-exempt interest income earned by the closed-end fund on the securities in its portfolio and distributed to holders of the preferred securities. However, such designation may be made only if the closed-end fund treats preferred securities as equity securities for federal income tax purposes and the closed-end fund complies with certain requirements under the Internal Revenue Code of 1986, as amended (the “Code”).
A Fund’s investment in auction rate preferred securities of closed-end funds is subject to limitations on investments in other U.S. registered investment companies, which limitations are prescribed under the 1940 Act. A Fund is generally prohibited from acquiring more than 3% of the voting securities of any other such investment company, and investing more than 5% of a Fund’s total assets in securities of any one such investment company or more than 10% of its total assets in securities of all such investment companies. A Fund will indirectly bear its proportionate share of any management fees paid by such closed-end funds in addition to the advisory fee payable directly by the Fund.
Bank Obligations
Bank obligations include bankers’ acceptances, certificates of deposit, bank notes and time deposits.
Bankers’ acceptances are negotiable drafts or bills of exchange typically drawn by an importer or exporter to pay for specific merchandise, which are “accepted” by a bank, meaning, in effect, that the bank unconditionally agrees to pay the face value of the instrument on maturity.
Certificates of deposit are negotiable certificates issued against funds deposited in a commercial bank or a savings and loan association for a definite period of time and earning a specified return. Certificates of deposit may also include those issued by foreign banks outside the United States (“U.S.”). Such certificates of deposit include Eurodollar and Yankee certificates of deposit. Eurodollar certificates of deposit are U.S. dollar-denominated certificates of deposit issued by branches of foreign and domestic banks located outside the U.S. Yankee certificates of deposit are certificates of deposit issued by a U.S. branch of a foreign bank denominated in U.S. dollars and held in the U.S. Certain Funds may also invest in obligations (including bankers’ acceptances and certificates of deposit) denominated in foreign currencies (see “Foreign Investments (including Foreign Currencies)”) herein. With regard to certificates of deposit issued by U.S. banks and savings and loan associations, to be eligible for purchase by a Fund, a certificate of deposit must be issued by (i) a domestic or foreign branch of a U.S. commercial bank which is a member of the Federal Reserve System or the deposits of which are insured by the Federal Deposit Insurance Corporation, or (ii) a domestic savings and loan association, the deposits of which are insured by the Federal Deposit Insurance Corporation.
Time deposits are interest-bearing non-negotiable deposits at a bank or a savings and loan association that have a specific maturity date. A time deposit earns a specific rate of interest over a definite period of time. Time deposits cannot be traded on the secondary market.
Part II - 7
The Funds will not invest in obligations for which the Adviser, or any of its affiliated persons, is the ultimate obligor or accepting bank, provided, however, that the Funds maintain demand deposits at their affiliated custodian, JPMorgan Chase Bank, N.A. (“JPMorgan Chase Bank”).
Subject to a Fund’s limitations on concentration in a particular industry, there is no limitation on the amount of a Fund’s assets which may be invested in obligations of banks which meet the conditions set forth herein.
Commercial Paper
Commercial paper is a short-term obligation, generally with a maturity from 1 to 270 days, issued by a bank or bank holding company, corporation or finance company. Although commercial paper is generally unsecured, the Funds may also purchase secured commercial paper. In the event of a default of an issuer of secured commercial paper, a Fund may hold the securities and other investments that were pledged as collateral even if it does not invest in such securities or investments. In such a case, the Fund would take steps to dispose of such securities or investments in a commercially reasonable manner. Commercial paper includes master demand obligations. See “Variable and Floating Rate Instruments” below.
Certain Funds may also invest in Canadian commercial paper, which is commercial paper issued by a Canadian corporation or a Canadian counterpart of a U.S. corporation, and in Europaper, which is U.S. dollar denominated commercial paper of a foreign issuer. See “Risk Factors of Foreign Investments” below. Certain Funds may purchase commercial paper that is issued by conduits, including ABCP. Additional information about ABCP is included under “Asset-Backed Securities.”
Convertible Securities
Certain Funds may invest in convertible securities. Convertible securities include any debt securities or preferred stock which may be converted into common stock or which carry the right to purchase common stock. Generally, convertible securities entitle the holder to exchange the securities for a specified number of shares of common stock, usually of the same company, at specified prices within a certain period of time.
The terms of any convertible security determine its ranking in a company’s capital structure. In the case of subordinated convertible debentures, the holders’ claims on assets and earnings are subordinated to the claims of other creditors, and are senior to the claims of preferred and common shareholders. In the case of convertible preferred stock, the holders’ claims on assets and earnings are subordinated to the claims of all creditors and are senior to the claims of common shareholders.
Convertible securities have characteristics similar to both debt and equity securities. Due to the conversion feature, the market value of convertible securities tends to move together with the market value of the underlying common stock. As a result, selection of convertible securities, to a great extent, is based on the potential for capital appreciation that may exist in the underlying stock. The value of convertible securities is also affected by prevailing interest rates, the credit quality of the issuer, and any call provisions. In some cases, the issuer may cause a convertible security to convert to common stock. In other situations, it may be advantageous for a Fund to cause the conversion of convertible securities to common stock. If a convertible security converts to common stock, a Fund may hold such common stock in its portfolio even if it does not ordinarily invest in common stock.
Certain Funds invest in contingent securities structured as contingent convertible securities also known as CoCos. Contingent convertible securities are typically issued by non-U.S. banks and are designed to behave like bonds in times of economic health yet absorb losses when a pre-determined trigger event occurs. A contingent convertible security is a hybrid debt security either convertible into equity at a predetermined share price or written down in value based on the specific terms of the individual security if a pre-specified trigger event occurs (the “Trigger Event”). Unlike traditional convertible securities, the conversion of a contingent convertible security from debt to equity is “contingent” and will occur only in the case of a Trigger Event. Trigger Events vary by instrument and are defined by the documents governing the contingent convertible security. Such Trigger Events may include a decline in the issuer’s capital below a specified threshold level, increase in the issuer’s risk weighted assets, the share price of the issuer falling to a particular level for a certain period of time and certain regulatory events.
Contingent convertible securities are subject to the credit, interest rate, high yield security, foreign security and markets risks associated with bonds and equities, and to the risks specific to convertible securities in general. Contingent convertible securities are also subject to additional risks specific to their
Part II - 8
structure including conversion risk. Because Trigger Events are not consistently defined among contingent convertible securities, this risk is greater for contingent convertible securities that are issued by banks with capital ratios close to the level specified in the Trigger Event.
In addition, coupon payments on contingent convertible securities are discretionary and may be cancelled by the issuer at any point, for any reason, and for any length of time. The discretionary cancellation of payments is not an event of default and there are no remedies to require re-instatement of coupon payments or payment of any past missed payments. Coupon payments may also be subject to approval by the issuer’s regulator and may be suspended in the event there are insufficient distributable reserves. Due to uncertainty surrounding coupon payments, contingent convertible securities may be volatile and their price may decline rapidly in the event that coupon payments are suspended.
Contingent convertible securities typically are structurally subordinated to traditional convertible bonds in the issuer’s capital structure. In certain scenarios, investors in contingent convertible securities may suffer a loss of capital ahead of equity holders or when equity holders do not. Contingent convertible securities are also subject to extension risk. Contingent convertible securities are perpetual instruments and may only be callable at pre-determined dates upon approval of the applicable regulatory authority. There is no guarantee that a Fund will receive return of principal on contingent convertible securities.
Convertible contingent securities are a newer form of instrument and the regulatory environment for these instruments continues to evolve. Because the market for contingent convertible securities is evolving, it is uncertain how the larger market for contingent convertible securities would react to a Trigger Event or coupon suspension applicable to a single issuer.
The value of contingent convertible securities is unpredictable and will be influenced by many factors such as: (i) the creditworthiness of the issuer and/or fluctuations in such issuer’s applicable capital ratios; (ii) supply and demand for contingent convertible securities; (iii) general market conditions and available liquidity; and (iv) economic, financial and political events that affect the issuer, its particular market or the financial markets in general.
Custodial Receipts
Certain Funds may acquire securities in the form of custodial receipts that evidence ownership of future interest payments, principal payments or both on certain U.S. Treasury notes or bonds in connection with programs sponsored by banks and brokerage firms. These are not considered U.S. government securities and are not backed by the full faith and credit of the U.S. government. These notes and bonds are held in custody by a bank on behalf of the owners of the receipts.
Debt Instruments
Below Investment Grade Securities. Securities that were rated investment grade at the time of purchase may subsequently be rated below investment grade (BB+ or lower by Standard & Poor’s Corporation (“S&P”) and Bal or lower by Moody’s Investors Service, Inc. (“Moody’s”)). Certain Funds that do not invest in below investment grade securities as a main investment strategy may nonetheless continue to hold such securities if the Adviser believes it is advantageous for the Fund to do so. The high degree of risk involved in these investments can result in substantial or total losses. These securities are subject to greater risk of loss, greater sensitivity to interest rate and economic changes, valuation difficulties, and a potential lack of a secondary or public market for securities. The market price of these securities also can change suddenly and unexpectedly.
Corporate Debt Securities. Corporate debt securities may include bonds and other debt securities of U.S. and non-U.S. issuers, including obligations of industrial, utility, banking and other corporate issuers. All debt securities are subject to the risk of an issuer’s inability to meet principal and interest payments on the obligation and may also be subject to price volatility due to such factors as market interest rates, market perception of the creditworthiness of the issuer and general market liquidity.
High Yield/High Risk Securities/Junk Bonds. Certain Funds may invest in high yield securities, to varying degrees. High yield, high risk bonds are securities that are generally rated below investment grade by the primary rating agencies (BB+ or lower by S&P and Bal or lower by Moody’s) or unrated but determined by the Adviser to be of comparable quality. Other terms used to describe such securities include “lower rated bonds,” “non-investment grade bonds,” “below investment grade bonds,” and “junk bonds.” These securities are considered to be high-risk investments.
Part II - 9
High yield securities are regarded as predominately speculative. There is a greater risk that issuers of lower rated securities will default than issuers of higher rated securities. Issuers of lower rated securities generally are less creditworthy and may be highly indebted, financially distressed, or bankrupt. These issuers are more vulnerable to real or perceived economic changes, political changes or adverse industry developments. In addition, high yield securities are frequently subordinated to the prior payment of senior indebtedness. If an issuer fails to pay principal or interest, a Fund would experience a decrease in income and a decline in the market value of its investments. A Fund may also incur additional expenses in seeking recovery from the issuer.
The income and market value of lower rated securities may fluctuate more than higher rated securities. Non-investment grade securities are more sensitive to short-term corporate, economic and market developments. During periods of economic uncertainty and change, the market price of the investments in lower rated securities may be volatile. The default rate for high yield bonds tends to be cyclical, with defaults rising in periods of economic downturn.
It is often more difficult to value lower rated securities than higher rated securities. If an issuer’s financial condition deteriorates, accurate financial and business information may be limited or unavailable. The lower rated investments may be thinly traded and there may be no established secondary market. Because of the lack of market pricing and current information for investments in lower rated securities, valuation of such investments is much more dependent on the judgment of the Adviser than is the case with higher rated securities. In addition, relatively few institutional purchasers may hold a major portion of an issue of lower-rated securities at times. As a result, a Fund that invests in lower rated securities may be required to sell investments at substantial losses or retain them indefinitely even where an issuer’s financial condition is deteriorating.
Credit quality of non-investment grade securities can change suddenly and unexpectedly, and even recently issued credit ratings may not fully reflect the actual risks posed by a particular high-yield security.
Future legislation may have a possible negative impact on the market for high yield, high risk bonds. As an example, in the late 1980’s, legislation required federally-insured savings and loan associations to divest their investments in high yield, high risk bonds. New legislation, if enacted, could have a material negative effect on a Fund’s investments in lower rated securities.
Inflation-Linked Debt Securities. Inflation-linked securities include fixed and floating rate debt securities of varying maturities issued by the U.S. government, its agencies and instrumentalities, such as Treasury Inflation Protected Securities (“TIPS”), as well as securities issued by other entities such as corporations, municipalities, foreign governments and foreign issuers, including foreign issuers from emerging markets. See also “Foreign Investments (including Foreign Currencies).” Typically, such securities are structured as fixed income investments whose principal value is periodically adjusted according to the rate of inflation. The U.S. Treasury, among some other issuers, issues inflation-linked securities that accrue inflation into the principal value of the security and other issuers may pay out the Consumer Price Index (“CPI”) accruals as part of a semi-annual coupon. Other types of inflation-linked securities exist which use an inflation index other than the CPI.
Inflation-linked securities issued by the U.S. Treasury, such as TIPS, have maturities of approximately five, ten or thirty years, although it is possible that securities with other maturities will be issued in the future. Typically, TIPS pay interest on a semi-annual basis equal to a fixed percentage of the inflation-adjusted principal amount. For example, if a Fund purchased an inflation-indexed bond with a par value of $1,000 and a 3% real rate of return coupon (payable 1.5% semi-annually), and the rate of inflation over the first six months was 1%, the mid-year par value of the bond would be $1,010 and the first semi-annual interest payment would be $15.15 ($1,010 times 1.5%). If inflation during the second half of the year resulted in the whole year’s inflation of 3%, the end-of-year par value of the bond would be $1,030 and the second semi-annual interest payment would be $15.45 ($1,030 times 1.5%).
If the periodic adjustment rate measuring inflation falls, the principal value of inflation-indexed bonds will be adjusted downward, and consequently the interest payable on these securities (calculated with respect to a smaller principal amount) will be reduced. Repayment of the original bond principal upon maturity (as adjusted for inflation) is guaranteed in the case of TIPS, even during a period of deflation, although the inflation-adjusted principal received could be less than the inflation-adjusted principal that had accrued to the bond at the time of purchase. However, the current market value of the bonds is not guaranteed and will fluctuate. Other inflation-related bonds may not provide a similar guarantee. If a guarantee of principal is not provided, the adjusted principal value of the bond repaid at maturity may be less than the original principal.
Part II - 10
The value of inflation-linked securities is expected to change in response to changes in real interest rates. Real interest rates in turn are tied to the relationship between nominal interest rates and the rate of inflation. Therefore, if the rate of inflation rises at a faster rate than nominal interest rates, real interest rates might decline, leading to an increase in value of inflation-linked securities.
While inflation-linked securities are expected to be protected from long-term inflationary trends, short-term increases in inflation may lead to a decline in value. If interest rates rise due to reasons other than inflation (for example, due to changes in currency exchange rates), investors in these securities may not be protected to the extent that the increase is not reflected in the bond’s inflation measure.
The periodic adjustment of U.S. inflation-linked securities is tied to the Consumer Price Index for All Urban Consumers (“CPI-U”), which is not seasonally adjusted and which is calculated monthly by the U.S. Bureau of Labor Statistics. The CPI-U is a measurement of changes in the cost of living, made up of components such as housing, food, transportation and energy. Inflation-linked securities issued by a foreign government are generally adjusted to reflect a comparable inflation index calculated by that government. There can be no assurance that the CPI-U or a foreign inflation index will accurately measure the real rate of inflation in the prices of goods and services. Moreover, there can be no assurance that the rate of inflation in a foreign country will be correlated to the rate of inflation in the U.S.
Any increase in the principal amount of an inflation-linked security will be considered taxable ordinary income, even though investors do not receive their principal until maturity.
Variable and Floating Rate Instruments. Certain obligations purchased by the Funds may carry variable or floating rates of interest, may involve a conditional or unconditional demand feature and may include variable amount master demand notes. Variable and floating rate instruments are issued by a wide variety of issuers and may be issued for a wide variety of purposes, including as a method of reconstructing cash flows.
Subject to their investment objective policies and restrictions, certain Funds may acquire variable and floating rate instruments. A variable rate instrument has terms that provide for the adjustment of its interest rate on set dates and which, upon such adjustment, can reasonably be expected to have a market value that approximates its par value. Certain Funds may purchase extendable commercial notes. Extendable commercial notes are variable rate notes which typically mature within a short period of time (e.g., 1 month) but which may be extended by the issuer for a maximum maturity of thirteen months.
A floating rate instrument has terms that provide for the adjustment of its interest rate whenever a specified interest rate changes and which, at any time, can reasonably be expected to have a market value that approximates its par value. Floating rate instruments are frequently not rated by credit rating agencies; however, unrated variable and floating rate instruments purchased by a Fund will be determined by the Fund’s Adviser to be of comparable quality at the time of purchase to rated instruments eligible for purchase under the Fund’s investment policies. In making such determinations, a Fund’s Adviser will consider the earning power, cash flow and other liquidity ratios of the issuers of such instruments (such issuers include financial, merchandising, bank holding and other companies) and will continuously monitor their financial condition. There may be no active secondary market with respect to a particular variable or floating rate instrument purchased by a Fund. The absence of such an active secondary market could make it difficult for the Fund to dispose of the variable or floating rate instrument involved in the event the issuer of the instrument defaulted on its payment obligations, and the Fund could, for this or other reasons, suffer a loss to the extent of the default. Variable or floating rate instruments may be secured by bank letters of credit or other assets. A Fund may purchase a variable or floating rate instrument to facilitate portfolio liquidity or to permit investment of the Fund’s assets at a favorable rate of return.
As a result of the floating and variable rate nature of these investments, the Funds’ yields may decline, and they may forego the opportunity for capital appreciation during periods when interest rates decline; however, during periods when interest rates increase, the Funds’ yields may increase, and they may have reduced risk of capital depreciation.
Past periods of high inflation, together with the fiscal measures adopted to attempt to deal with it, have seen wide fluctuations in interest rates, particularly “prime rates” charged by banks. While the value of the underlying floating or variable rate securities may change with changes in interest rates generally, the nature of the underlying floating or variable rate should minimize changes in value of the instruments. Accordingly, as interest rates decrease or increase, the potential for capital appreciation and the risk of potential capital depreciation is less than would be the case with a portfolio of fixed rate securities. A Fund’s portfolio may contain floating or variable rate securities on which stated minimum or maximum rates, or maximum rates set by state law limit the degree to which interest on such floating or variable rate
Part II - 11
securities may fluctuate; to the extent it does, increases or decreases in value may be somewhat greater than would be the case without such limits. Because the adjustment of interest rates on the floating or variable rate securities is made in relation to movements of the applicable banks’ “prime rates” or other short-term rate securities adjustment indices, the floating or variable rate securities are not comparable to long-term fixed rate securities. Accordingly, interest rates on the floating or variable rate securities may be higher or lower than current market rates for fixed rate obligations of comparable quality with similar maturities.
Variable Amount Master Notes. Variable amount master notes are notes, which may possess a demand feature, that permit the indebtedness to vary and provide for periodic adjustments in the interest rate according to the terms of the instrument. Variable amount master notes may not be secured by collateral. To the extent that variable amount master notes are secured by collateral, they are subject to the risks described under the section “Loans—Collateral and Subordination Risk.”
Because master notes are direct lending arrangements between a Fund and the issuer of the notes, they are not typically traded. Although there is no secondary market in the notes, a Fund may demand payment of principal and accrued interest. If the Fund is not repaid such principal and accrued interest, the Fund may not be able to dispose of the notes due to the lack of a secondary market.
While master notes are not typically rated by credit rating agencies, issuers of variable amount master notes (which are typically manufacturing, retail, financial, brokerage, investment banking and other business concerns) must satisfy the same criteria as those set forth with respect to commercial paper, if any, in Part I of this SAI under the heading “Credit Quality.” A Fund’s Adviser will consider the credit risk of the issuers of such notes, including its earning power, cash flow, and other liquidity ratios of such issuers and will continuously monitor their financial status and ability to meet payment on demand. In determining average weighted portfolio maturity, a variable amount master note will be deemed to have a maturity equal to the period of time remaining until the principal amount can be recovered from the issuer.
Variable Rate Instruments and Money Market Funds. Variable or floating rate instruments with stated maturities of more than 397 days may, under the SEC’s rule applicable to money market funds, Rule 2a-7 under the 1940 Act, be deemed to have shorter maturities (other than in connection with the calculation of dollar-weighted average life to maturity of a portfolio) as follows:
(1) Adjustable Rate Government Securities. A Government Security which is a variable rate security where the variable rate of interest is readjusted no less frequently than every 397 days shall be deemed to have a maturity equal to the period remaining until the next readjustment of the interest rate. A Government Security which is a floating rate security shall be deemed to have a remaining maturity of one day.
(2) Short-Term Variable Rate Securities. A variable rate security, the principal amount of which, in accordance with the terms of the security, must unconditionally be paid in 397 calendar days or less shall be deemed to have maturity equal to the earlier of the period remaining until the next readjustment of the interest rate or the period remaining until the principal amount can be recovered through demand.
(3) Long-Term Variable Rate Securities. A variable rate security, the principal amount of which is scheduled to be paid in more than 397 days, that is subject to a demand feature shall be deemed to have a maturity equal to the longer of the period remaining until the next readjustment of the interest rate or the period remaining until the principal amount can be recovered through demand.
(4) Short-Term Floating Rate Securities. A floating rate security, the principal amount of which, in accordance with the terms of the security, must unconditionally be paid in 397 calendar days or less shall be deemed to have a maturity of one day.
(5) Long-Term Floating Rate Securities. A floating rate security, the principal amount of which is scheduled to be paid in more than 397 days, that is subject to a demand feature, shall be deemed to have a maturity equal to the period remaining until the principal amount can be recovered through demand.
Limitations on the Use of Variable and Floating Rate Notes. Variable and floating rate instruments for which no readily available market exists will be purchased in an amount which, together with securities with legal or contractual restrictions on resale or for which no readily available market exists (including repurchase agreements providing for settlement more than seven days after notice), exceeds 5% of total assets for the J.P. Morgan Funds which are money market funds (the “Money Market Funds”) only if such instruments are subject to a demand feature that will permit the Fund to demand payment of the principal
Part II - 12
within seven days after demand by the Fund. Funds other than Money Market Funds may not invest in Illiquid Investments (defined herein) (including variable and floating rate notes that are determined to be Illiquid Investments) in excess of the 15% Illiquid Limit (defined herein). Please see the “Liquidity Risk Management Program” section for more details. There is no limit on the extent to which a Fund may purchase demand instruments that are not illiquid or deemed to be liquid in accordance with the Adviser’s liquidity determination procedures (except, with regard to the Money Market Funds, as provided under Rule 2a-7 under the 1940 Act). If not rated, such instruments must be found by the Adviser to be of comparable quality to instruments in which a Fund may invest. A rating may be relied upon only if it is provided by an NRSRO that is not affiliated with the issuer or guarantor of the instruments.
Zero-Coupon, Pay-in-Kind and Deferred Payment Securities. Zero-coupon securities are securities that are sold at a discount to par value and on which interest payments are not made during the life of the security. Upon maturity, the holder is entitled to receive the par value of the security. Pay-in-kind securities are securities that have interest payable by delivery of additional securities. Upon maturity, the holder is entitled to receive the aggregate par value of the securities. A Fund accrues income with respect to zero-coupon and pay-in-kind securities prior to the receipt of cash payments. Deferred payment securities are securities that remain zero-coupon securities until a predetermined date, at which time the stated coupon rate becomes effective and interest becomes payable at regular intervals. While interest payments are not made on such securities, holders of such securities are deemed to have received “phantom income.” Because a Fund will distribute “phantom income” to shareholders, to the extent that shareholders elect to receive dividends in cash rather than reinvesting such dividends in additional shares, the applicable Fund will have fewer assets with which to purchase income-producing securities. Zero-coupon, pay-in-kind and deferred payment securities may be subject to greater fluctuation in value and lesser liquidity in the event of adverse market conditions than comparably rated securities paying cash interest at regular interest payment periods.
Negative Interest Rates. In a low or negative interest rate environment, debt instruments may trade at negative yields, which means the purchaser of the instrument may receive at maturity less than the total amount invested. In addition, in a negative interest rate environment, if a bank charges negative interest, instead of receiving interest on deposits, a depositor must pay the bank fees to keep money with the bank. To the extent a Fund holds a negatively-yielding debt instrument or has a bank deposit with a negative interest rate, the Fund would generate a negative return on that investment.
If negative interest rates become more prevalent in the market and/or if low or negative interest rates persist for a sustained period of time, some investors may seek to reallocate assets to other income-producing assets, such as investment-grade and higher-yield debt instruments, or equity investments that pay a dividend, absent other market risks that may make such alternative investments unattractive. This increased demand for higher yielding assets may cause the price of such instruments to rise while triggering a corresponding decrease in yield over time, thus reducing the value of such alternative investments. In addition, a move to higher yielding investments may cause investors, including a Fund (to the extent permitted by its investment objective and strategies), to seek fixed-income investments with longer maturities and/or potentially reduced credit quality in order to seek the desired level of yield. These considerations may limit a Fund’s ability to locate fixed-income instruments containing the desired risk/return profile. Changing interest rates, including, but not limited to, rates that fall below zero, could have unpredictable effects on the markets and may expose fixed-income and related markets to heightened volatility and potential illiquidity.
For a Fund that operates as a money market fund and seeks to maintain a stable $1.00 price per share, a low or negative interest rate environment could impact the Fund’s ability to maintain a stable $1.00 share price. During a low or negative interest rate environment, such a Fund may reduce the number of shares outstanding on a pro rata basis through reverse stock splits, negative dividends or other mechanisms to seek to maintain a stable $1.00 price per share, to the extent permissible by applicable law and its organizational documents. Alternatively, the Fund may discontinue using the amortized cost method of valuation to maintain a stable $1.00 price per share and establish a fluctuating NAV per share rounded to four decimal places by using available market quotations or equivalents.
Impact of Market Conditions on the Risks associated with Debt Securities
Investments in certain debt securities will be especially subject to the risk that, during certain periods, the liquidity of particular issuers or industries, or all securities within a particular investment category, may shrink or disappear suddenly and without warning as a result of adverse economic, market or political events, or adverse investor perceptions, whether or not accurate.
Part II - 13
Current market conditions pose heightened risks for Funds that invest in debt securities given the current interest rate environment. Any future interest rate increases or other adverse conditions (e.g., inflation/deflation, increased selling of certain fixed-income investments across other pooled investment vehicles or accounts, changes in investor perception, or changes in government intervention in the markets) could cause the value of any Fund that invests in debt securities to decrease. As such, debt securities markets may experience heightened levels of interest rate and liquidity risk, as well as increased volatility. If rising interest rates cause a Fund to lose value, the Fund could also face increased shareholder redemptions, which would further impair the Fund’s ability to achieve its investment objectives.
The capacity for traditional dealers to engage in fixed-income trading for certain fixed income instruments has not kept pace with the growth of the fixed income market, and in some cases has decreased. As a result, because dealers acting as market makers provide stability to a market, the significant reduction in certain dealer inventories could potentially lead to decreased liquidity and increased volatility in the fixed income markets. Such issues may be exacerbated during periods of economic uncertainty or market volatility.
Debt market conditions are highly unpredictable and some parts of the market are subject to dislocations. In response to the outbreak of COVID-19, as with other serious economic disruptions, governmental authorities and regulators have enacted significant fiscal and monetary policy changes. These actions present heightened risks to debt instruments, and such risks could be even further heightened if these actions are unexpectedly or suddenly reversed or are ineffective in achieving their desired outcomes. In light of these actions and current conditions, the current environment is exposing debt markets to significant volatility and reduced liquidity for Fund investments.
Demand Features
Certain Funds may acquire securities that are subject to puts and standby commitments (“Demand Features”) to purchase the securities at their principal amount (usually with accrued interest) within a fixed period (usually seven days) following a demand by the Fund. Demand Features may be issued by the issuer of the underlying securities, a dealer in the securities or by another third party and may not be transferred separately from the underlying security. The underlying securities subject to a put may be sold at any time at market rates. To the extent that a Fund invests in such securities, the Fund expects that it will acquire puts only where the puts are available without the payment of any direct or indirect consideration. However, if determined by the Adviser to be advisable or necessary, a premium may be paid for put features. A premium paid will have the effect of reducing the yield otherwise payable on the underlying security. Demand Features provided by foreign banks involve certain risks associated with foreign investments. See “Foreign Investments (including Foreign Currencies)” for more information on these risks.
Under a “stand-by commitment,” a dealer would agree to purchase, at a Fund’s option, specified securities at a specified price. A Fund will acquire these commitments solely to facilitate portfolio liquidity and does not intend to exercise its rights thereunder for trading purposes. Stand-by commitments may also be referred to as put options.
The purpose of engaging in transactions involving puts is to maintain flexibility and liquidity to permit a Fund to meet redemption requests and remain as fully invested as possible.
Equity Securities, Warrants and Rights
Common Stock. Common stock represents a share of ownership in a company and usually carries voting rights and may earn dividends. Unlike preferred stock, common stock dividends are not fixed but are declared at the discretion of the issuer’s board of directors. Common stock occupies the most junior position in a company’s capital structure. As with all equity securities, the price of common stock fluctuates based on changes in a company’s financial condition, including those that result from management’s performance or changes to the business of the company, and overall market and economic conditions.
Common Stock Warrants and Rights. Common stock warrants entitle the holder to buy common stock from the issuer of the warrant at a specific price (the “strike price”) for a specific period of time. The market price of warrants may be substantially lower than the current market price of the underlying common stock, yet warrants are subject to similar price fluctuations. As a result, warrants may be more volatile investments than the underlying common stock. If a warrant is exercised, a Fund may hold common stock in its portfolio even if it does not ordinarily invest in common stock.
Part II - 14
Rights are similar to warrants but normally have a shorter duration and are typically distributed directly by the issuers to existing shareholders, while warrants are typically attached to new debt or preferred stock issuances.
Warrants and rights generally do not entitle the holder to dividends or voting rights with respect to the underlying common stock and do not represent any rights in the assets of the issuer. Warrants and rights will expire if not exercised on or prior to the expiration date.
Preferred Stock. Preferred stock is a class of stock that generally pays dividends at a specified rate and has preference over common stock in the payment of dividends and during a liquidation. Preferred stock generally does not carry voting rights. Outside of the United States, preferred stock may carry different rights or obligations. In some jurisdictions, preferred stocks may have different voting rights and there may be more robust trading markets and liquidity in preferred stock than the common or ordinary stock of the company. As with all equity securities, the price of preferred stock fluctuates based on changes in a company’s financial condition and on overall market and economic conditions. Because preferred stocks generally pay dividends only after the issuing company makes required payments to holders of its bonds and other debt, the value of preferred stocks is more sensitive than bonds and other debt to actual or perceived changes in the company’s financial condition or prospects. Similar to common stock rights described above, rights may also be issued to holders of preferred stock.
Initial Public Offerings (“IPOs”). Certain Funds may purchase securities in IPOs. These securities are subject to many of the same risks as investing in companies with smaller market capitalizations. Securities issued in IPOs have no trading history, and there may be limited information about the companies. The prices of securities sold in IPOs may be highly volatile. At any particular time or from time to time, a Fund may not be able to invest in securities issued in IPOs, or invest to the extent desired, because, for example, only a small portion (if any) of the securities being offered in an IPO may be made available to the Fund. In addition, under certain market conditions, a relatively small number of companies may issue securities in IPOs. Similarly, as the number of Funds to which IPO securities are allocated increases, the number of securities issued to any one Fund may decrease. The investment performance of a Fund during periods when it is unable to invest significantly or at all in IPOs may be lower than during periods when the Fund is able to do so. In addition, as a Fund increases in size, the impact of IPOs on the Fund’s performance will generally decrease.
Foreign Investments (including Foreign Currencies)
Some of the Funds may invest in certain obligations or securities of foreign issuers. For purposes of a non-Money Market Fund’s investment policies and unless described otherwise in a Fund’s prospectus, an issuer of a security will be deemed to be located in a particular country if: (i) the principal trading market for the security is in such country, (ii) the issuer is organized under the laws of such country or (iii) the issuer derives at least 50% of its revenues or profits from such country or has at least 50% of its total assets situated in such country. Possible investments include equity securities and debt securities (e.g., bonds and commercial paper) of foreign entities, obligations of foreign branches of U.S. banks and of foreign banks, including, without limitation, eurodollar certificates of deposit, eurodollar time deposits, eurodollar bankers’ acceptances, Canadian time deposits and yankee certificates of deposit, and investments in Canadian commercial paper, and europaper. Securities of foreign issuers may include sponsored and unsponsored American Depositary Receipts (“ADRs”), European Depositary Receipts (“EDRs”), and Global Depositary Receipts (“GDRs”). Sponsored ADRs are listed on the New York Stock Exchange; unsponsored ADRs are not. Therefore, there may be less information available about the issuers of unsponsored ADRs than the issuers of sponsored ADRs. Unsponsored ADRs are restricted securities. EDRs and GDRs are not listed on the New York Stock Exchange. As a result, it may be difficult to obtain information about EDRs and GDRs.
The Money Market Funds may only invest in U.S. dollar-denominated securities.
Risk Factors of Foreign Investments. The following is a summary of certain risks associated with foreign investments:
Political and Exchange Risks. Foreign investments may subject a Fund to investment risks that differ in some respects from those related to investments in obligations of U.S. domestic issuers. Such risks include potential future adverse political and economic developments, sanctions or other measures by the United States or other governments, possible imposition of withholding taxes on interest or other income, possible seizure, nationalization or expropriation of foreign deposits, possible establishment of exchange
Part II - 15
controls or taxation at the source, greater fluctuations in value due to changes in exchange rates, or the adoption of other foreign governmental restrictions which might adversely affect the payment of principal and interest on such obligations.
Higher Transaction Costs. Foreign investments may entail higher custodial fees and sales commissions than domestic investments.
Accounting and Regulatory Differences. Foreign issuers of securities or obligations are often subject to accounting treatment and engage in business practices different from those of domestic issuers of similar securities or obligations. In addition, foreign issuers are usually not subject to the same degree of regulation as domestic issuers, and their securities may trade on relatively small markets, causing their securities to experience potentially higher volatility and more limited liquidity than securities of domestic issuers. Foreign branches of U.S. banks and foreign banks are not regulated by U.S. banking authorities and may be subject to less stringent reserve requirements than those applicable to domestic branches of U.S. banks. In addition, foreign banks generally are not bound by accounting, auditing, and financial reporting standards comparable to those applicable to U.S. banks. Dividends and interest paid by foreign issuers may be subject to withholding and other foreign taxes which may decrease the net return on foreign investments as compared to dividends and interest paid to a Fund by domestic companies.
Currency Risk. Foreign securities may be denominated in foreign currencies, although foreign issuers may also issue securities denominated in U.S. dollars. The value of a Fund’s investments denominated in foreign currencies and any funds held in foreign currencies will be affected by changes in currency exchange rates, the relative strength of those currencies and the U.S. dollar, and exchange-control regulations. Changes in the foreign currency exchange rates also may affect the value of dividends and interest earned, gains and losses realized on the sale of securities and net investment income and gains, if any, to be distributed to shareholders by a Fund. The exchange rates between the U.S. dollar and other currencies are determined by the forces of supply and demand in foreign exchange markets and the relative merits of investments in different countries, actual or anticipated changes in interest rates and other complex factors, as seen from an international perspective. Currency exchange rates may fluctuate significantly over short periods of time. Currency exchange rates also can be affected by intervention (or lack of intervention) by the United States or foreign governments or central banks or by currency controls or political developments in the United States or elsewhere.
Accordingly, the ability of a Fund that invests in foreign securities as part of its principal investment strategy to achieve its investment objective may depend, to a certain extent, on exchange rate movements. In addition, while the volume of transactions effected on foreign stock exchanges has increased in recent years, in most cases it remains appreciably below that of domestic securities exchanges. Accordingly, a Fund’s foreign investments may be less liquid and their prices may be more volatile than comparable investments in securities of U.S. companies. In buying and selling securities on foreign exchanges, purchasers normally pay fixed commissions that are generally higher than the negotiated commissions charged in the U.S. In addition, there is generally less government supervision and regulation of securities exchanges, brokers and issuers located in foreign countries than in the U.S.
Settlement Risk. The settlement periods for foreign securities and instruments are often longer than those for securities or obligations of U.S. issuers or instruments denominated in U.S. dollars. Delayed settlement may affect the liquidity of a Fund’s holdings. Certain types of securities and other instruments are not traded “delivery versus payment” in certain markets (e.g., government bonds in Russia) meaning that a Fund may deliver securities or instruments before payment is received from the counterparty. In such markets, the Fund may not receive timely payment for securities or other instruments it has delivered and may be subject to increased risk that the counterparty will fail to make payments when due or default completely. Foreign markets also have different clearance and settlement procedures, and in certain markets there have been times when settlements have been unable to keep pace with the volume of securities transactions, making it difficult to conduct such transactions. Such delays in settlement could result in temporary periods when a portion of the assets of a Fund remains uninvested and no return is earned on such assets. The inability of the Fund to make intended security purchases or sales due to settlement problems could result either in losses to the Fund due to subsequent declines in value of the portfolio securities, in the Fund deeming those securities to be illiquid, or, if the Fund has entered into a contract to sell the securities, in possible liability to the purchaser.
A Fund’s income and, in some cases, capital gains from foreign stocks and securities, will be subject to applicable taxation in certain of the countries in which it invests and treaties between the U.S. and such countries may not be available in some cases to reduce the otherwise applicable tax rates.
Part II - 16
Brady Bonds. Brady bonds are securities created through the exchange of existing commercial bank loans to public and private entities in certain emerging markets for new bonds in connection with debt restructurings. In light of the history of defaults of countries issuing Brady bonds on their commercial bank loans, investments in Brady bonds may be viewed as speculative and subject to the same risks as emerging market securities. Brady bonds may be fully or partially collateralized or uncollateralized, are issued in various currencies (but primarily the U.S. dollar) and are actively traded in over-the-counter (“OTC”) secondary markets. Incomplete collateralization of interest or principal payment obligations results in increased credit risk. Dollar-denominated collateralized Brady bonds, which may be either fixed-rate or floating rate bonds, are generally collateralized by U.S. Treasury securities.
Global Depositary Notes. Foreign securities and emerging markets securities include Global Depositary Notes (“GDNs”). A GDN is a debt instrument created by a bank that evidences ownership of local currency-denominated debt securities. GDNs reflect the terms of particular local currency-denominated bonds. GDNs trade, settle, and pay interest and principal in U.S. dollars but typically are restricted securities that do not trade on an exchange. Any distributions paid to the holders of GDNs are usually subject to a fee charged by the depositary bank. In addition to the risks associated with foreign investments, a Fund’s investments in GDNs is subject to the risks associated with the underlying local currency-denominated bond and derivative instruments including credit risk, default or similar event risk, counterparty risk, interest rate risk, leverage risk, liquidity risk, and management risk. Holders of GDNs may have limited rights, and investment restrictions in certain countries may adversely impact the value of GDNs because such restrictions may limit the ability to convert the bonds into GDNs and vice versa. Such restrictions may cause bonds of the underlying issuer to trade at a discount or premium to the market price of the GDN.
Obligations of Supranational Entities. Obligations of supranational entities include securities designated or supported by governmental entities to promote economic reconstruction or development of international banking institutions and related government agencies, such as the International Bank for Reconstruction and Development. Each supranational entity’s lending activities are limited to a percentage of its total capital (including “callable capital” contributed by its governmental members at the entity’s call), reserves and net income. There is no assurance that participating governments will be able or willing to honor their commitments to make capital contributions to a supranational entity.
Sukuk. Foreign securities and emerging market securities include sukuk. Sukuk are certificates, similar to bonds, issued by the issuer to obtain an upfront payment in exchange for an income stream. Sukuks are also known as Islamic financial certificates that are designed to comply with Islamic religious law commonly known as Sharia. Such income stream may or may not be linked to a tangible asset. For sukuk that are not linked to a tangible asset, the sukuk represents a contractual payment obligation of the issuer or issuing vehicle to pay income or periodic payments to the investor, and such contractual payment obligation is linked to the issuer or issuing vehicle and not from interest on the investor’s money for the sukuk. For sukuk linked to a tangible asset, the Fund will not have a direct interest in the underlying asset or pool of assets. The issuer also makes a contractual promise to buy back the certificate at a future date at par value. Even when the certificate is linked to the returns generated by certain assets of the issuer, the underlying assets are not pledged as security for the certificates, and the Fund (as the investor) is relying on the creditworthiness of the issuer for all payments required by the sukuk. The issuer may be a special purpose vehicle (“SPV”) with no other assets. Investors do not have direct legal ownership of any underlying assets. In the event of default, the process may take longer to resolve than conventional bonds. Changing interpretations of Islamic law by courts or prominent scholars may affect the free transferability of sukuk in ways that cannot now be foreseen. In such an event, the Fund may be required to hold its sukuk for longer than intended, even if their condition is deteriorating.
Issuers of sukuk may include international financial institutions, foreign governments and agencies of foreign governments. Underlying assets may include, without limitation, real estate (developed and undeveloped), lease contracts and machinery and equipment. Although the sukuk market has grown significantly in recent years, there may be times when the market is illiquid and where it is difficult for a Fund to make an investment in or dispose of sukuk at the Fund’s desired time. Furthermore, the global sukuk market is significantly smaller than conventional bond markets, and restrictions imposed by the Shariah board of the issuing entity may limit the number of investors who are interested in investing in particular sukuk. The unique characteristics of sukuk may lead to uncertainties regarding their tax treatment within a Fund.
Part II - 17
A Fund’s ability to pursue and enforce actions with respect to these payment obligations or to otherwise enforce the terms of the sukuk, restructure the sukuk, obtain a judgment in a court of competent jurisdiction, and/or attach assets of the obligor may be limited. Sukuk are also subject to the risks associated with developing and emerging market economies, which include, among others, the risk of sanctions and inconsistent accounting and legal principles.
Emerging Market Securities. Investing in companies domiciled in emerging market countries (i.e., emerging market securities) may be subject to potentially higher risks than investments in companies in developed countries. These risks include the risk that there is, or there may likely be: (i) less social, political, and economic stability; (ii) greater illiquidity and price volatility due to smaller or limited local capital markets for such securities, or low non-existent trading volumes; (iii) less scrutiny and regulation by local authorities of the foreign exchanges and broker-dealers; (iv) the seizure or confiscation by local governments of securities held by foreign investors, and the possible suspension or limiting by local governments of an issuer’s ability to make dividend or interest payments; (v) limiting or entirely restricting repatriation of invested capital, profits, and dividends by local governments; (vi) local taxation of capital gains, including on a retroactive basis; (vii) the attempt by issuers facing restrictions on dollar or euro payments imposed by local governments to make dividend or interest payments to foreign investors in the local currency; (viii) difficulty in enforcing legal claims related to the securities and/or local judges favoring the interests of the issuer over those of foreign investors; (ix) bankruptcy judgments being paid in the local currency; and (x) greater difficulty in determining market valuations of the securities due to limited public information regarding the issuer. Additionally, certain emerging market countries may be subject to less stringent requirements regarding accounting, auditing, financial reporting and record keeping and therefore, all material information may not be available or reliable. In addition, a Fund is limited in its ability to exercise its legal rights or enforce a counterparty's legal obligations in certain jurisdictions outside of the United States, in particular, in emerging market countries. In addition, due to jurisdictional limitations, U.S. regulators may be limited in their ability to enforce regulatory or legal obligations in emerging market countries. Also, U.S. regulators may not have sufficient access to adequately audit and oversee issuers. For example, the Public Company Accounting Oversight Board (the “PCAOB”) is responsible for inspecting and auditing the accounting practices and products of U.S.-listed companies, regardless of the issuer’s domicile. However, certain emerging market countries, including China, do not provide sufficient access to the PCAOB to conduct its inspections and audits. As a result, U.S. investors, including the Funds, may be subject to risks associated with less stringent accounting oversight.
Emerging market securities markets are typically marked by a high concentration of market capitalization and trading volume in a small number of issuers representing a limited number of industries, as well as a high concentration of ownership of such securities by a limited number of investors. Although some emerging markets have become more established and issuers in such markets tend to issue securities of higher credit quality, the markets for securities in other emerging countries are in the earliest stages of their development, and these countries issue securities across the credit spectrum. Even the markets for relatively widely traded securities in emerging countries may not be able to absorb, without price disruptions, a significant increase in trading volume or trades of a size customarily undertaken by institutional investors in the securities markets of developed countries. The limited size of many of these securities markets can cause prices to be erratic for various reasons. For example, prices may be unduly influenced by traders who control large positions in these markets. Additionally, market making and arbitrage activities are generally less extensive in such markets, which may contribute to increased volatility and reduced liquidity of such markets. The limited liquidity of emerging country securities may also affect a Fund’s ability to accurately value its portfolio securities or to acquire or dispose of securities at the price and time it wishes to do so or in order to meet redemption requests.
Many emerging market countries suffer from uncertainty and corruption in their legal frameworks. Legislation may be difficult to interpret and laws may be too new to provide any precedential value. Laws regarding foreign investment and private property may be weak or non-existent. Sudden changes in governments may result in policies which are less favorable to investors, such as policies designed to expropriate or nationalize “sovereign” assets. In the past, some emerging market countries have expropriated large amounts of private property, in many cases with little or no compensation, and there can be no assurance that such expropriation will not occur in the future.
Foreign investment in certain emerging market securities is restricted or controlled to varying degrees, which may limit a Fund’s investment in such securities and may increase the expenses of the Fund. Certain countries require governmental approval prior to investments by foreign persons or limit investment by
Part II - 18
foreign persons to only a specified percentage of an issuer’s outstanding securities or to a specific class of securities, which may have less advantageous terms (including price) than securities of the company available for purchase by nationals.
Many emerging market countries lack the same social, political, and economic stability characteristics of the U.S. Political instability among emerging market countries can be common and may be caused by an uneven distribution of wealth, social unrest, labor strikes, civil wars, and religious oppression. Economic instability in emerging market countries may take the form of: (i) high interest rates; (ii) high levels of inflation, including hyperinflation; (iii) high levels of unemployment or underemployment; (iv) changes in government economic and tax policies, including confiscatory taxation; and (v) imposition of trade barriers.
Currencies of emerging market countries are subject to significantly greater risks than currencies of developed countries. Many emerging market countries have experienced steady declines or even sudden devaluations of their currencies relative to the U.S. dollar. Some emerging market currencies may not be internationally traded or may be subject to strict controls by local governments, resulting in undervalued or overvalued currencies.
Some emerging market countries have experienced balance of payment deficits and shortages in foreign exchange reserves. Governments have responded by restricting currency conversions. Future restrictive exchange controls could prevent or restrict a company’s ability to make dividend or interest payments in the original currency of the obligation (usually U.S. dollars). In addition, even though the currencies of some emerging market countries may be convertible into U.S. dollars, the conversion rates may be artificial to their actual market values.
In the past, governments within the emerging markets have become overly reliant on the international capital markets and other forms of foreign credit to finance large public spending programs which cause huge budget deficits. Often, interest payments have become too overwhelming for a government to meet, representing a large percentage of total gross domestic product (“GDP”). Some foreign governments were forced to seek a restructuring of their loan and/or bond obligations, have declared a temporary suspension of interest payments or have defaulted. These events have adversely affected the values of securities issued by foreign governments and corporations domiciled in emerging market countries and have negatively affected not only their cost of borrowing, but their ability to borrow in the future as well.
Sovereign Obligations. Sovereign debt includes investments in securities issued or guaranteed by a foreign sovereign government or its agencies, authorities or political subdivisions. An investment in sovereign debt obligations involves special risks not present in corporate debt obligations. The issuer of the sovereign debt or the governmental authorities that control the repayment of the debt may be unable or unwilling to repay principal or interest when due, and a Fund may have limited recourse in the event of a default. During periods of economic uncertainty, the market prices of sovereign debt may be more volatile than prices of U.S. debt obligations. In the past, certain emerging markets have encountered difficulties in servicing their debt obligations, withheld payments of principal and interest and declared moratoria on the payment of principal and interest on their sovereign debts.
A sovereign debtor’s willingness or ability to repay principal and pay interest in a timely manner may be affected by, among other factors, its cash flow situation, the extent of its foreign currency reserves, the availability of sufficient foreign exchange, the relative size of the debt service burden, the sovereign debtor’s policy toward principal international lenders and local political constraints. Sovereign debtors may also be dependent on expected disbursements from foreign governments, multilateral agencies and other entities to reduce principal and interest arrearages on their debt. The failure of a sovereign debtor to implement economic reforms, achieve specified levels of economic performance or repay principal or interest when due may result in the cancellation of third-party commitments to lend funds to the sovereign debtor, which may further impair such debtor’s ability or willingness to service its debts.
Foreign Currency Transactions. Certain Funds may engage in foreign currency transactions which include the following, some of which also have been described elsewhere in this SAI: options on currencies, currency futures, options on such futures, forward foreign currency transactions, forward rate agreements and currency swaps, caps and floors. Certain Funds may engage in such transactions in both U.S. and non-U.S. markets. To the extent a Fund enters into such transactions in markets other than in the U.S., the Fund may be subject to certain currency, settlement, liquidity, trading and other risks similar to those described in this SAI with respect to the Fund’s investments in foreign securities, including emerging markets securities. Certain Funds may engage in such transactions to hedge against currency risks as a substitute for securities in which the Fund invests, to increase or decrease exposure to a foreign currency,
Part II - 19
to shift exposure from one foreign currency to another, for risk management purposes or to increase income or gain to the Fund. To the extent that a Fund uses foreign currency transactions for hedging purposes (as described herein), the Fund may hedge either specific transactions or portfolio positions.
While a Fund’s use of hedging strategies is intended to reduce the volatility of the net asset value of Fund shares, the net asset value of the Fund will fluctuate. There can be no assurance that a Fund’s hedging transactions will be effective. Furthermore, a Fund may only engage in hedging activities from time to time and may not necessarily be engaging in hedging activities when movements in currency exchange rates occur.
Certain Funds are authorized to deal in forward foreign exchange between currencies of the different countries in which the Fund will invest and multi-national currency units as a hedge against possible variations in the foreign exchange rate between these currencies. This is accomplished through contractual agreements entered into in the interbank market to purchase or sell one specified currency for another currency at a specified future date (up to one year) and price at the time of the contract.
Transaction Hedging. Generally, when a Fund engages in foreign currency transaction hedging, it enters into transactions with respect to specific receivables or payables of the Fund generally arising in connection with the purchase or sale of its portfolio securities. A Fund may engage in transaction hedging when it desires to “lock in” the U.S. dollar price (or a non-U.S. dollar currency (“reference currency”)) of a security it has agreed to purchase or sell, or the U.S. dollar equivalent of a dividend or interest payment in a foreign currency. By transaction hedging, a Fund attempts to protect itself against a possible loss resulting from an adverse change in the relationship between the U.S. dollar or other reference currency and the applicable foreign currency during the period between the date on which the security is purchased or sold, or on which the dividend or interest payment is declared, and the date on which such payments are made or received.
A Fund may purchase or sell a foreign currency on a spot (or cash) basis at the prevailing spot rate in connection with the settlement of transactions in portfolio securities denominated in that foreign currency. Certain Funds reserve the right to purchase and sell foreign currency futures contracts traded in the U.S. and subject to regulation by the Commodity Futures Trading Commission (“CFTC”).
For transaction hedging purposes, a Fund may also purchase U.S. exchange-listed call and put options on foreign currency futures contracts and on foreign currencies. A put option on a futures contract gives a Fund the right to assume a short position in the foreign currency futures contract until expiration of the option. A put option on currency gives a Fund the right to sell a currency at an exercise price until the expiration of the option. A call option on a futures contract gives a Fund the right to assume a long position in the futures contract until the expiration of the option. A call option on currency gives a Fund the right to purchase a currency at the exercise price until the expiration of the option.
Position Hedging. When engaging in position hedging, a Fund will enter into foreign currency exchange transactions to protect against a decline in the values of the foreign currencies in which their portfolio securities are denominated or an increase in the value of currency for securities which the Adviser expects to purchase. In connection with the position hedging, the Fund may purchase or sell foreign currency forward contracts or foreign currency on a spot basis. A Fund may purchase U.S. exchange-listed put or call options on foreign currency and foreign currency futures contracts and buy or sell foreign currency futures contracts traded in the U.S. and subject to regulation by the CFTC.
The precise matching of the amounts of foreign currency exchange transactions and the value of the portfolio securities involved will not generally be possible because the future value of such securities in foreign currencies will change as a consequence of market movements in the value of those securities between the dates the currency exchange transactions are entered into and the dates they mature.
Forward Foreign Currency Exchange Contracts. Certain Funds may purchase forward foreign currency exchange contracts, sometimes referred to as “currency forwards” (“Forward Contracts”), which involve an obligation to purchase or sell a specific currency at a future date, which may be any fixed number of days from the date of the contract as agreed by the parties in an amount and at a price set at the time of the contract. In the case of a cancelable Forward Contract, the holder has the unilateral right to cancel the contract at maturity by paying a specified fee. The contracts are traded in the interbank market conducted directly between currency traders (usually large commercial banks) and their customers, so no intermediary is required. A Forward Contract generally has no deposit requirement, and no commissions are charged at any stage for trades.
Part II - 20
At the maturity of a Forward Contract, a Fund may either accept or make delivery of the currency specified in the contract or, at or prior to maturity, enter into a closing transaction involving the purchase or sale of an offsetting contract. Closing transactions with respect to forward contracts are usually effected with the currency trader who is a party to the original forward contract. For forward foreign currency contracts (other than Non-Deliverable Forwards) that require physical settlement, under current SEC and staff requirements the Funds will segregate or earmark liquid assets equal to the current notional value of each contract. In calculating the notional value, the Funds may net long and short contracts with the same currency and the same settlement date. With respect to trades that do not settle through CLS Bank International, the Funds may only net long and short contracts if the contracts are with the same counterparty. Certain Funds may also engage in non-deliverable forwards which are cash settled and which do not involve delivery of the currency specified in the contract. For more information on Non-Deliverable Forwards, see “Non-Deliverable Forwards” below.
Foreign Currency Futures Contracts. Certain Funds may purchase foreign currency futures contracts. Foreign currency futures contracts traded in the U.S. are designed by and traded on exchanges regulated by the CFTC, such as the New York Mercantile Exchange. A Fund may enter into foreign currency futures contracts for hedging purposes and other risk management purposes as defined in CFTC regulations. Certain Funds may also enter into foreign currency futures transactions to increase exposure to a foreign currency, to shift exposure from one foreign currency to another or to increase income or gain to the Fund.
At the maturity of a futures contract, the Fund may either accept or make delivery of the currency specified in the contract, or at or prior to maturity enter into a closing transaction involving the purchase or sale of an offsetting contract. Closing transactions with respect to futures contracts are effected on a commodities exchange; a clearing corporation associated with the exchange assumes responsibility for closing out such contracts.
Positions in the foreign currency futures contracts may be closed out only on an exchange or board of trade which provides a secondary market in such contracts. There is no assurance that a secondary market on an exchange or board of trade will exist for any particular contract or at any particular time. In such event, it may not be possible to close a futures position; in the event of adverse price movements, the Fund would continue to be required to make daily cash payments of variation margin.
For more information on futures contracts, see “Futures Contracts” under the heading “Options and Futures Transactions” below.
Foreign Currency Options. Certain Funds may purchase and sell U.S. exchange-listed and OTC call and put options on foreign currencies. Such options on foreign currencies operate similarly to options on securities. When a Fund purchases a put option, the Fund has the right but not the obligation to exchange money denominated in one currency into another currency at a pre-agreed exchange rate on a specified date. When a Fund sells or writes a call option, the Fund has the obligation to exchange money denominated in one currency into another currency at a pre-agreed exchange rate if the buyer exercises option. Some of the Funds may also purchase and sell non-deliverable currency options (“Non-Deliverable Options”). Non-Deliverable Options are cash-settled, options on foreign currencies (each a “Option Reference Currency”) that are non-convertible and that may be thinly traded or illiquid. Non-Deliverable Options involve an obligation to pay an amount in a deliverable currency (such as U.S. Dollars, Euros, Japanese Yen, or British Pounds Sterling) equal to the difference between the prevailing market exchange rate for the Option Reference Currency and the agreed upon exchange rate (the “Non-Deliverable Option Rate”), with respect to an agreed notional amount. Options on foreign currencies are affected by all of those factors which influence foreign exchange rates and investments generally.
A Fund is authorized to purchase or sell listed foreign currency options and currency swap contracts as a short or long hedge against possible variations in foreign exchange rates, as a substitute for securities in which a Fund may invest, and for risk management purposes. Such transactions may be effected with respect to hedges on non-U.S. dollar denominated securities (including securities denominated in the Euro) owned by the Fund, sold by the Fund but not yet delivered, committed or anticipated to be purchased by the Fund, or in transaction or cross-hedging strategies. As an illustration, a Fund may use such techniques to hedge the stated value in U.S. dollars of an investment in a Japanese yen-dominated security. In such circumstances, the Fund may purchase a foreign currency put option enabling it to sell a specified amount of yen for dollars at a specified price by a future date. To the extent the hedge is successful, a loss in the value of the dollar relative to the yen will tend to be offset by an increase in the value of the put option. To offset, in whole or in part, the cost of acquiring such a put option, the Fund also may sell a call option which, if exercised, requires it to sell a specified amount of yen for dollars at a specified price by a future date (a technique called a “collar”). By selling the call option in this illustration, the Fund gives up the
Part II - 21
opportunity to profit without limit from increases in the relative value of the yen to the dollar. Certain Funds may also enter into foreign currency futures transactions for non-hedging purposes including to increase or decrease exposure to a foreign currency, to shift exposure from one foreign currency to another or to increase income or gain to the Fund.
Certain differences exist among these foreign currency instruments. Foreign currency options provide the holder thereof the right to buy or to sell a currency at a fixed price on a future date. Listed options are third-party contracts which are issued by a clearing corporation, traded on an exchange and have standardized strike prices and expiration dates. Performance of the parties’ obligations is guaranteed by an exchange or clearing corporation. OTC options are two-party contracts and have negotiated strike prices and expiration dates. Options on futures contracts are traded on boards of trade or futures exchanges. Currency swap contracts are negotiated two-party agreements entered into in the interbank market whereby the parties exchange two foreign currencies at the inception of the contract and agree to reverse the exchange at a specified future time and at a specified exchange rate.
The JPMorgan Emerging Markets Debt Fund may also purchase and sell barrier/“touch” options (“Barrier Options”), including knock-in options (“Knock-In Options”) and knock-out options (“Knock-Out Options”). A Barrier Option is a type of exotic option that gives an investor a payout once the price of the underlying currency reaches or surpasses (or falls below) a predetermined barrier. This type of option allows the buyer of the option to set the position of the barrier, the length of time until expiration and the payout to be received once the barrier is broken. It is possible for an investor to lose the premium paid for the option. There are two kinds of Knock-In Options, (i) “up and in” and (ii) “down and in”. With Knock-In Options, if the buyer has selected an upper price barrier, and the currency hits that level, the Knock-In Option turns into a more traditional option (“Vanilla Option”) whereby the owner has the right but not the obligation to exchange money denominated in one currency into another currency at a pre-agreed exchange rate on a specified date. This type of Knock-In Option is called “up and in”. The “down and in” Knock-In Option is the same as the “up and in”, except the currency has to reach a lower barrier. Upon hitting the chosen lower price level, the “down and in” Knock-In Option turns into a Vanilla Option. As in the Knock-In Option, there are two kinds of Knock-Out Options, ( i) “up and out” and (ii) “down and out”. However, in a Knock-Out Option, the buyer begins with a Vanilla Option, and if the predetermined price barrier is hit, the Vanilla Option is cancelled and the seller has no further obligation. If the option hits the upper barrier, the option is cancelled and the investor loses the premium paid, thus, “up and out”. If the option hits the lower price barrier, the option is cancelled, thus, “down and out”. Barrier Options usually call for delivery of the underlying currency.
The value of a foreign currency option is dependent upon the value of the foreign currency and the U.S. dollar and may have no relationship to the investment merits of a foreign security. Because foreign currency transactions occurring in the interbank market involve substantially larger amounts than those that may be involved in the use of foreign currency options, investors may be disadvantaged by having to deal in an odd lot market for the underlying foreign currencies at prices that are less favorable than those for round lots.
There is no systematic reporting of last sale information for foreign currencies and there is no regulatory requirement that quotations available through dealer or other market sources be firm or revised on a timely basis. Available quotation information is generally representative of very large transactions in the interbank market and thus may not reflect relatively smaller transactions (less than $1 million) where rates may be less favorable. The interbank market in foreign currencies is a global, around-the-clock market. To the extent that the U.S. options markets are closed while the markets for the underlying currencies remain open, significant price and rate movements may take place in the underlying markets that cannot be reflected in the options market.
The Funds may write call options on currencies as long as, under current SEC and staff requirements, the Fund segregates cash or liquid assets that, when added to the amounts deposited with a futures commission merchant or a broker as margin, equal the obligation under the call option (but not less than the strike price of the call option). The Funds may also cover a written call option by owning a separate call option permitting the Fund to purchase the reference currency at a price no higher than the strike price of the call option sold by the Fund. In addition, a Fund may write a non-deliverable call option if, under current SEC and staff requirements, the Fund segregates an amount equal to the current amount it is obligated to pay. Netting of long and short positions of a specific country (assuming long and short contracts are similar) is generally permitted. If there are securities or currency held in that specific country at least equal to the current notional value of the net currency positions, no segregation is required.
Part II - 22
Non-Deliverable Forwards. Some of the Funds may also invest in non-deliverable forwards (“NDFs”). NDFs are cash-settled, short-term forward contracts on foreign currencies (each a “Reference Currency”) that are non-convertible and that may be thinly traded or illiquid. NDFs involve an obligation to pay an amount (the “settlement amount”) equal to the difference between the prevailing market exchange rate for the Reference Currency and the agreed upon exchange rate (the “NDF Rate”), with respect to an agreed notional amount. NDFs have a fixing date and a settlement (delivery) date. The fixing date is the date and time at which the difference between the prevailing market exchange rate and the agreed upon exchange rate is calculated. The settlement (delivery) date is the date by which the payment of the settlement amount is due to the party receiving payment.
Although NDFs are similar to forward foreign currency exchange contracts, NDFs do not require physical delivery of the Reference Currency on the settlement date. Rather, on the settlement date, the only transfer between the counterparties is the monetary settlement amount representing the difference between the NDF Rate and the prevailing market exchange rate. NDFs typically may have terms from one month up to two years and are settled in U.S. dollars.
NDFs are subject to many of the risks associated with derivatives in general and forward currency transactions including risks associated with fluctuations in foreign currency and the risk that the counterparty will fail to fulfill its obligations. Under current SEC and staff requirements, the Funds will segregate or earmark liquid assets in an amount equal to the marked to market value of each NDF contract on a daily basis of the NDF. In calculating the mark-to-market value, the Funds may net opposing NDF contracts with the same currency and the same settlement date. With respect to trades that do not settle through CLS Bank International, the Funds may only net opposing NDF contracts if the contracts are with the same counterparty.
The Funds will typically use NDFs for hedging purposes, but may also, use such instruments to increase income or gain. The use of NDFs for hedging or to increase income or gain may not be successful, resulting in losses to the Fund, and the cost of such strategies may reduce the Funds’ respective returns.
NDFs are regulated as swaps and are subject to rules requiring central clearing and mandatory trading on an exchange or facility that is regulated by the CFTC for certain swaps. NDFs traded in the OTC market are subject to initial and variation margin requirements. Implementation of and on-going compliance with the regulations regarding clearing, mandatory trading and margining of NDFs may increase the cost to the Fund of hedging currency risk and, as a result, may affect returns to investors in the Fund.
Foreign Currency Conversion. Although foreign exchange dealers do not charge a fee for currency conversion, they do realize a profit based on the difference (the “spread”) between prices at which they are buying and selling various currencies. Thus, a dealer may offer to sell a foreign currency to a Fund at one rate while offering a lesser rate of exchange should the Fund desire to resell that currency to the dealer.
Other Foreign Currency Hedging Strategies. New options and futures contracts and other financial products, and various combinations thereof, continue to be developed, and certain Funds may invest in any such options, contracts and products as may be developed to the extent consistent with the Funds’ respective investment objectives and the regulatory requirements applicable to investment companies, and subject to the supervision of each Trust’s Board of Trustees.
Risk Factors in Foreign Currency Transactions. The following is a summary of certain risks associated with foreign currency transactions:
Imperfect Correlation. Foreign currency transactions present certain risks. In particular, the variable degree of correlation between price movements of the instruments used in hedging strategies and price movements in a security being hedged creates the possibility that losses on the hedging transaction may be greater than gains in the value of a Fund’s securities.
Liquidity. Hedging instruments may not be liquid in all circumstances. As a result, in volatile markets, the Funds may not be able to dispose of or offset a transaction without incurring losses. Although foreign currency transactions used for hedging purposes may reduce the risk of loss due to a decline in the value of the hedged security, at the same time the use of these instruments could tend to limit any potential gain which might result from an increase in the value of such security.
Leverage and Volatility Risk. Derivative instruments, including foreign currency derivatives, may sometimes increase or leverage a Fund’s exposure to a particular market risk. Leverage enhances the price volatility of derivative instruments held by a Fund.
Part II - 23
Strategy Risk. Certain Funds may use foreign currency derivatives for hedging as well as non-hedging purposes including to gain or adjust exposure to currencies and securities markets or to increase income or gain to a Fund. There is no guarantee that these strategies will succeed and their use may subject a Fund to greater volatility and loss. Foreign currency transactions involve complex securities transactions that involve risks in addition to direct investments in securities including leverage risk and the risks associated with derivatives in general, currencies, and investments in foreign and emerging markets.
Judgment of the Adviser. Successful use of foreign currency transactions by a Fund depends upon the ability of the Adviser to predict correctly movements in the direction of interest and currency rates and other factors affecting markets for securities. If the expectations of the Adviser are not met, a Fund would be in a worse position than if a foreign currency transaction had not been pursued. For example, if a Fund has hedged against the possibility of an increase in interest rates which would adversely affect the price of securities in its portfolio and the price of such securities increases instead, the Fund will lose part or all of the benefit of the increased value of its securities because it will have offsetting losses in its hedging positions. In addition, when utilizing instruments that require variation margin payments, if the Fund has insufficient cash to meet daily variation margin requirements, it may have to sell securities to meet such requirements.
Other Risks. A Fund may have to sell securities at a time when it is disadvantageous to do so. It is impossible to forecast with precision the market value of portfolio securities at the expiration or maturity of a forward contract or futures contract. Accordingly, a Fund may have to purchase additional foreign currency on the spot market (and bear the expense of such purchase) if the market value of the security or securities being hedged is less than the amount of foreign currency a Fund is obligated to deliver and if a decision is made to sell the security or securities and make delivery of the foreign currency. Conversely, it may be necessary to sell on the spot market some of the foreign currency received upon the sale of the portfolio security or securities if the market value of such security or securities exceeds the amount of foreign currency the Fund is obligated to deliver.
Transaction and position hedging do not eliminate fluctuations in the underlying prices of the securities which a Fund owns or expects to purchase or sell. Rather, the Adviser may employ these techniques in an effort to maintain an investment portfolio that is relatively neutral to fluctuations in the value of the U.S. dollar relative to major foreign currencies and establish a rate of exchange which one can achieve at some future point in time. Additionally, although these techniques tend to minimize the risk of loss due to a decline in the value of the hedged currency, they also tend to limit any potential gain which might result from the increase in the value of such currency. Moreover, it may not be possible for a Fund to hedge against a devaluation that is so generally anticipated that the Fund is not able to contract to sell the currency at a price above the anticipated devaluation level.
Insurance-Linked Securities
The JPMorgan Strategic Income Opportunities Fund and JPMorgan Total Return Fund may invest in debt instruments or equity securities structured as event-driven, event-linked or insurance-linked notes or catastrophe bonds (collectively, “catastrophe bonds”) and related instruments such as (re)insurance sidecars (collectively with catastrophe bonds, “Insurance-Linked Securities”). Insurance-Linked Securities are generally debt obligations or equity securities for which the return of principal and the payment of interest or dividends typically are contingent on the non-occurrence of a specific “trigger” event(s) that lead to economic and/or human loss, such as a hurricane of a specific category, earthquake of a particular magnitude, or other physical or weather-related phenomena. For some Insurance-Linked Securities, the magnitude of the effect of the trigger event on the security may be based on losses to a company or industry, modeled losses to a notional portfolio, industry indexes, readings of scientific instruments, or certain other parameters associated with a catastrophe rather than actual losses. If a trigger event, as defined within the terms of each Insurance-Linked Security, occurs, a Fund may lose a portion or all of its accrued interest, dividends and/or principal invested in such Insurance-Linked Security. In addition, if there is a dispute regarding a trigger event, there may be delays in the payment of principal, interest and dividends. A Fund is entitled to receive principal, interest and dividends payments so long as no trigger event occurs of the description and magnitude specified by the Insurance-Linked Security.
Insurance-Linked Securities may be sponsored by government agencies, insurance companies or reinsurers and issued by special purpose corporations or other off-shore or on-shore entities (such special purpose entities are created to accomplish a narrow and well-defined objective, such as the issuance of a note in connection with a specific reinsurance transaction). Typically, Insurance-Linked Securities are issued by off-shore entities including entities in emerging markets and may be non-dollar denominated. As a result, the Funds will be subject to currency and foreign and emerging markets risk including the risks
Part II - 24
described in Foreign Investments. Often, catastrophe bonds provide for extensions of maturity that are mandatory, or optional at the discretion of the issuer or sponsor, in order to process and audit loss claims in those cases where a trigger event has, or possibly has, occurred. An extension of maturity may increase volatility.
Industry loss warranties are a type of Insurance-Linked Securities that are designed to protect insurers or reinsurers from severe losses due to significant catastrophic events. The buyer pays the seller a premium at the inception of the contract, and in return the buyer can make a claim if losses due to a certain class of catastrophic event (for example, Florida hurricanes), as estimated by a third-party, exceed an agreed trigger level. Industry loss warranties have standard terms and conditions and are collateralized. These contracts are evaluated using detailed underwriting information on the applicable exposures provided by the reinsurers or their intermediaries.
Insurance-Linked Securities also may expose a Fund to certain unanticipated risks, including but not limited to issuer risk, credit risk, counterparty risk, adverse regulatory or jurisdictional interpretations, and adverse tax consequences. Additionally, Insurance-Linked Securities are subject to the risk that modeling used to calculate the probability of a trigger event may not be accurate and/or underestimate the likelihood of a trigger event. This may result in more frequent and greater than expected losses including loss of principal and/or interest with respect to catastrophic bonds and dividends with respect to (re)insurance sidecars.
Insurance-Linked Securities are relatively new types of financial instruments and have relatively a limited trading history. There can be no assurance that markets for these instruments will be liquid at all times, and lack of a liquid market may impose the risk of higher transaction costs and the possibility that a Fund may be forced to liquidate positions when it would not be advantageous to do so. Insurance-Linked Securities are generally rated below investment grade or the unrated equivalent and have the same or similar risks as high yield debt securities (also known as junk bonds).
Insurance-Linked Securities typically are restricted to qualified institutional buyers and, therefore, are not subject to registration with the Securities and Exchange Commission (“SEC”) or any state securities commission, and generally are not listed on any national securities exchange. The amount of public information available with respect to Insurance-Linked Securities is generally less extensive than that which is available for exchange listed securities. There can be no assurance that future regulatory determinations will not adversely affect the overall market for Insurance-Linked Securities.
Inverse Floaters and Interest Rate Caps
Inverse floaters are instruments whose interest rates bear an inverse relationship to the interest rate on another security or the value of an index. The market value of an inverse floater will vary inversely with changes in market interest rates and will be more volatile in response to interest rate changes than that of a fixed rate obligation. Interest rate caps are financial instruments under which payments occur if an interest rate index exceeds a certain predetermined interest rate level, known as the cap rate, which is tied to a specific index. These financial products will be more volatile in price than securities which do not include such a structure.
Investments in inverse floaters and similar instruments expose a Fund to the same risks as investments in debt securities and derivatives, as well as other risks, including those associated with leverage and increased volatility. An investment in these securities typically will involve greater risk than an investment in a fixed rate security. Inverse floaters may be considered to be leveraged, including if their interest rates vary by a magnitude that exceeds the magnitude of a change in a reference rate of interest (typically a short-term interest rate), and the market prices of inverse floaters may as a result be highly sensitive to changes in interest rates and in prepayment rates on the underlying securities, and may decrease significantly when interest rates increase or prepayment rates change. Investments in inverse floaters and similar instruments that have asset-backed, mortgage-backed or mortgage-related securities underlying them will expose a Fund to the risks associated with those asset-backed, mortgage-backed and mortgage-related securities and the values of those investments may be especially sensitive to changes in prepayment rates on the underlying asset-backed, mortgage-backed or mortgage-related securities.
Investment Company Securities and Exchange-Traded Funds
Investment Company Securities. A Fund may acquire the securities of other investment companies (“acquired funds”) to the extent permitted under the 1940 Act and consistent with its investment objective and strategies. As a shareholder of another investment company, a Fund would bear, along with other shareholders, its pro rata portion of the other investment company’s expenses, including advisory fees.
Part II - 25
These expenses would be in addition to the advisory and other expenses that a Fund bears directly in connection with its own operations. Except as described below, the 1940 Act currently requires that, as determined immediately after a purchase is made, (i) not more than 5% of the value of a fund’s total assets will be invested in the securities of any one acquired fund, (ii) not more than 10% of the value of its total assets will be invested in the aggregate in securities of acquired funds as a group and (iii) not more than 3% of the outstanding voting stock of any one acquired fund will be owned by a fund.
In addition, Section 17 of the 1940 Act prohibits a Fund from investing in another J.P. Morgan Fund except as permitted by Section 12 of the 1940 Act, by rule, or by exemptive order.
The limitations described above do not apply to investments in money market funds subject to certain conditions. All of the J.P. Morgan Funds may invest in affiliated and unaffiliated money market funds without limit under Rule 12d1-1 under the 1940 Act subject to the acquiring fund’s investment policies and restrictions and the conditions of the Rule.
In addition, the 1940 Act’s limits and restrictions summarized above do not apply to J.P. Morgan Funds that invest in other J.P. Morgan Funds in reliance on Section 12(d)(1)(G) of the 1940 Act, SEC rule, or an exemptive order issued by the SEC (each, a “Fund of Funds”; collectively, “Funds of Funds”). Such Funds of Funds include JPMorgan Investor Funds (the “Investor Funds”), the JPMorgan SmartRetirement Funds and the JPMorgan SmartRetirement Blend Funds (collectively, the “JPMorgan SmartRetirement Funds”), JPMorgan Access Funds, JPMorgan Diversified Fund, and such other J.P. Morgan Funds that invest in other J.P. Morgan Funds in reliance on Section 12(d)(G) of the 1940 Act, Rule 12d1-4 or other rules issued Section 12.
Section 12(d)(1)(G) of the 1940 Act permits a fund to invest in acquired funds in the “same group of investment companies” (“affiliated funds”), government securities and short-term paper. In order to be an eligible investment under Section 12(d)(1)(G), an affiliated acquired fund must have a policy prohibiting it from investing in other registered open-end funds under Section 12(d)(1)(F) or (G) of the 1940 Act and, under certain circumstances, limit itself from investing in other investment companies and private funds.
Rule 12d1-4 allows a fund to acquire shares of an acquired fund in excess of the limitations currently imposed by the 1940 Act. Fund of funds arrangements relying on Rule 12d1-4 will be subject to several conditions, certain of which are specific to a fund’s position in the arrangement (i.e., as an acquiring or acquired fund). Notable conditions include those relating to: (i) control and voting that prohibit an acquiring fund, its investment adviser (or a sub-adviser) and their respective affiliates from beneficially owning more than 25% of the outstanding voting securities of an unaffiliated acquired fund; (ii) certain required findings relating to complexity, fees and undue influence (among other things); (iii) fund of funds investment agreements; and (iv) general limitations on an acquired fund’s investments in other investment companies and private funds to no more than 10% of the acquired fund’s asset, except in certain circumstances. The limitations placed on acquired funds under Rule 12d1-4 may impact the ability of a fund to invest in an acquired fund or may impact the investments made by the acquired fund.
Exchange-Traded Funds (“ETFs”). ETFs are pooled investment vehicles whose ownership interests are purchased and sold on a securities exchange. ETFs may be structured investment companies, depositary receipts or other pooled investment vehicles. As shareholders of an ETF, the Funds will bear their pro rata portion of any fees and expenses of the ETFs. Although shares of ETFs are traded on an exchange, shares of certain ETFs may not be redeemable by the ETF. In addition, ETFs may trade at a price below their net asset value (also known as a discount).
Certain Funds may use ETFs to gain exposure to various asset classes and markets or types of strategies and investments. By way of example, ETFs may be structured as broad based ETFs that invest in a broad group of stocks from different industries and market sectors; select sector; or market ETFs that invest in debt securities from a select sector of the economy, a single industry or related industries; or ETFs that invest in foreign and emerging markets securities. Other types of ETFs continue to be developed and the Fund may invest in them to the extent consistent with such Funds’ investment objectives, policies and restrictions. The ETFs in which the Funds invest are subject to the risks applicable to the types of securities and investments used by the ETFs (e.g., debt securities are subject to risks like credit and interest rate risks; emerging markets securities are subject risks like currency risks and foreign and emerging markets risk; derivatives are subject to leverage and counterparty risk).
ETFs may be actively managed or index-based. Actively managed ETFs are subject to management risk and may not achieve their objective if the ETF’s manager’s expectations regarding particular securities or markets are not met. Generally, an index based ETF’s objective is to track the performance of a specified index. Index based ETFs may invest in a securities portfolio that includes substantially all of the
Part II - 26
securities in substantially the same amount as the securities included in the designated index or a representative sample. Because passively managed ETFs are designed to track an index, securities may be purchased, retained and sold at times when an actively managed ETF would not do so. As a result, shareholders of a Fund that invest in such an ETF can expect greater risk of loss (and a correspondingly greater prospect of gain) from changes in the value of securities that are heavily weighted in the index than would be the case if ETF were not fully invested in such securities. This risk is increased if a few component securities represent a highly concentrated weighting in the designated index.
Unless permitted by the 1940 Act or an order or rule issued by the SEC (see “Investment Company Securities” above for more information), the Fund’s investments in unaffiliated ETFs that are structured as investment companies as defined in the 1940 Act are subject to certain percentage limitations of the 1940 Act regarding investments in other investment companies. ETFs that are not structured as investment companies as defined in the 1940 Act are not subject to these percentage limitations.
Loans
Some of the Funds may invest in fixed and floating rate loans (“Loans”). Loans may include senior floating rate loans (“Senior Loans”) and secured and unsecured loans, second lien or more junior loans (“Junior Loans”) and bridge loans or bridge facilities (“Bridge Loans”). Loans are typically arranged through private negotiations between borrowers in the U.S. or in foreign or emerging markets which may be corporate issuers or issuers of sovereign debt obligations (“Obligors”) and one or more financial institutions and other lenders (“Lenders”). Generally, the Funds invest in Loans by purchasing assignments of all or a portion of Loans (“Assignments”) or Loan participations (“Participations”) from third parties although certain Funds may originate Loans.
A Fund has direct rights against the Obligor on the Loan when it purchases an Assignment. Because Assignments are arranged through private negotiations between potential assignees and potential assignors, however, the rights and obligations acquired by a Fund as the purchaser of an Assignment may differ from, and be more limited than, those held by the assigning Lender. With respect to Participations, typically, a Fund will have a contractual relationship only with the Lender and not with the Obligor. The agreement governing Participations may limit the rights of a Fund to vote on certain changes which may be made to the Loan agreement, such as waiving a breach of a covenant. However, the holder of a Participation will generally have the right to vote on certain fundamental issues such as changes in principal amount, payment dates and interest rate. Participations may entail certain risks relating to the creditworthiness of the parties from which the participations are obtained.
A Loan is typically originated, negotiated and structured by a U.S. or foreign commercial bank, insurance company, finance company or other financial institution (the “Agent”) for a group of Loan investors. The Agent typically administers and enforces the Loan on behalf of the other Loan investors in the syndicate. The Agent’s duties may include responsibility for the collection of principal and interest payments from the Obligor and the apportionment of these payments to the credit of all Loan investors. The Agent is also typically responsible for monitoring compliance with the covenants contained in the Loan agreement based upon reports prepared by the Obligor. In addition, an institution, typically but not always the Agent, holds any collateral on behalf of the Loan investors. In the event of a default by the Obligor, it is possible, though unlikely, that the Fund could receive a portion of the borrower’s collateral. If the Fund receives collateral other than cash, any proceeds received from liquidation of such collateral will be available for investment as part of the Fund’s portfolio.
In the process of buying, selling and holding Loans, a Fund may receive and/or pay certain fees. These fees are in addition to interest payments received and may include facility fees, commitment fees, commissions and prepayment penalty fees. When a Fund buys or sells a Loan it may pay a fee. In certain circumstances, a Fund may receive a prepayment penalty fee upon prepayment of a Loan.
Additional Information concerning Senior Loans. Senior Loans typically hold the most senior position in the capital structure of the Obligor, are typically secured with specific collateral and have a claim on the assets and/or stock of the Obligor that is senior to that held by subordinated debtholders and shareholders of the Obligor. Collateral for Senior Loans may include (i) working capital assets, such as accounts receivable and inventory; (ii) tangible fixed assets, such as real property, buildings and equipment; (iii) intangible assets, such as trademarks and patent rights; and/or (iv) security interests in shares of stock of subsidiaries or affiliates.
Additional Information concerning Junior Loans. Junior Loans include secured and unsecured loans including subordinated loans, second lien and more junior loans, and bridge loans. Second lien and more junior loans (“Junior Lien Loans”) are generally second or further in line in terms of repayment priority. In
Part II - 27
addition, Junior Lien Loans may have a claim on the same collateral pool as the first lien or other more senior liens or may be secured by a separate set of assets. Junior Loans generally give investors priority over general unsecured creditors in the event of an asset sale.
Additional Information concerning Bridge Loans. Bridge Loans are short-term loan arrangements (e.g., 12 to 36 months) typically made by an Obligor in anticipation of intermediate-term or long-term permanent financing. Most Bridge Loans are structured as floating-rate debt with step-up provisions under which the interest rate on the Bridge Loan rises the longer the Loan remains outstanding. In addition, Bridge Loans commonly contain a conversion feature that allows the Bridge Loan investor to convert its Loan interest to senior exchange notes if the Loan has not been prepaid in full on or prior to its maturity date. Bridge Loans typically are structured as Senior Loans but may be structured as Junior Loans.
Additional Information concerning Unfunded Commitments. Unfunded commitments are contractual obligations pursuant to which the Fund agrees to invest in a Loan at a future date. Typically, the Fund receives a commitment fee for entering into the Unfunded Commitment.
Additional Information concerning Synthetic Letters of Credit. Loans include synthetic letters of credit. In a synthetic letter of credit transaction, the Lender typically creates a special purpose entity or a credit-linked deposit account for the purpose of funding a letter of credit to the borrower. When a Fund invests in a synthetic letter of credit, the Fund is typically paid a rate based on the Lender’s borrowing costs and the terms of the synthetic letter of credit. Synthetic letters of credit are typically structured as Assignments with the Fund acquiring direct rights against the Obligor.
Additional Information concerning Loan Originations. In addition to investing in loan assignments and participations, the Strategic Income Opportunities Fund, Global Bond Opportunities Fund, Unconstrained Debt Fund and Income Fund may originate Loans in which the Fund would lend money directly to a borrower by investing in limited liability companies or corporations that make loans directly to borrowers. The terms of the Loans are negotiated with borrowers in private transactions. Such Loans would be collateralized, typically with tangible fixed assets such as real property or interests in real property. Such Loans may also include mezzanine loans. Unlike Loans secured by a mortgage on real property, mezzanine loans are collateralized by an equity interest in an SPV that owns the real property.
Limitations on Investments in Loan Assignments and Participations. If a government entity is a borrower on a Loan, the Fund will consider the government to be the issuer of an Assignment or Participation for purposes of a Fund’s fundamental investment policy that it will not invest 25% or more of its total assets in securities of issuers conducting their principal business activities in the same industry (i.e., foreign government).
Limited Federal Securities Law Protections. Certain Loans may not be considered securities under the federal securities laws. In such circumstances, fewer legal protections may be available with respect to a Fund’s investment in those Loans. In particular, if a Loan is not considered a security under the federal securities laws, certain legal protections normally available to investors under the federal securities laws, such as those against fraud and misrepresentation, may not be available.
Multiple Lender Risk. There may be additional risks associated with Loans, including loan originations, when there are Lenders or other participants in addition to the Fund. For example, a Fund could lose the ability to consent to certain actions taken by the Borrower if certain conditions are not met. In addition, for example, certain governing agreements that provide the Fund with the right to consent to certain actions taken by a Borrower may provide that the Fund will no longer have the right to provide such consent if another Lender makes a subsequent advance to the Borrower.
Risk Factors of Loans. Loans are subject to the risks associated with debt obligations in general including interest rate risk, credit risk and market risk. When a Loan is acquired from a Lender, the risk includes the credit risk associated with the Obligor of the underlying Loan. The Fund may incur additional credit risk when the Fund acquires a participation in a Loan from another lender because the Fund must assume the risk of insolvency or bankruptcy of the other lender from which the Loan was acquired. To the extent that Loans involve Obligors in foreign or emerging markets, such Loans are subject to the risks associated with foreign investments or investments in emerging markets in general. The following outlines some of the additional risks associated with Loans.
High Yield Securities Risk. The Loans that a Fund invests in may not be rated by an NRSRO, will not be registered with the SEC or any state securities commission and will not be listed on any national securities exchange. To the extent that such high yield Loans are rated, they typically will be rated below investment grade and are subject to an increased risk of default in the payment of
Part II - 28
principal and interest as well as the other risks described under “High Yield/High Risk Securities/Junk Bonds.” Loans are vulnerable to market sentiment such that economic conditions or other events may reduce the demand for Loans and cause their value to decline rapidly and unpredictably.
Liquidity Risk. Loans that are deemed to be liquid at the time of purchase may become illiquid or less liquid. No active trading market may exist for certain Loans and certain Loans may be subject to restrictions on resale or have a limited secondary market. Certain Loans may be subject to irregular trading activity, wide bid/ask spreads and extended trade settlement periods. The inability to dispose of certain Loans in a timely fashion or at a favorable price could result in losses to a Fund. Also, to the extent that a Fund needs to satisfy redemption requests or cover unanticipated cash shortfalls, the Fund may seek to engage in borrowing under a credit facility or enter into lending agreements under which the Fund would borrow money for temporary purposes directly from another J.P. Morgan Fund (please see “Interfund Lending”). Certain Money Market Funds also use an interest bearing deposit facility to set aside cash at a level estimated to meet the Money Market Fund’s next business day’s intraday redemption orders. See “Interest Bearing Deposit Facility” for more information.
Collateral and Subordination Risk. With respect to Loans that are secured, a Fund is subject to the risk that collateral securing the Loan will decline in value or have no value or that the Fund’s lien is or will become junior in payment to other liens. A decline in value of the collateral, whether as a result of market value declines, bankruptcy proceedings or otherwise, could cause the Loan to be under collateralized or unsecured. In such event, the Fund may have the ability to require that the Obligor pledge additional collateral. The Fund, however, is subject to the risk that the Obligor may not pledge such additional collateral or a sufficient amount of collateral. In some cases (for example, in the case of non-recourse Loans), there may be no formal requirement for the Obligor to pledge additional collateral. In addition, collateral may consist of assets that may not be readily liquidated, and there is no assurance that the liquidation of such assets would satisfy an Obligor’s obligation on a Loan. If the Fund were unable to obtain sufficient proceeds upon a liquidation of such assets, this could negatively affect Fund performance.
If an Obligor becomes involved in bankruptcy proceedings, a court may restrict the ability of the Fund to demand immediate repayment of the Loan by the Obligor or otherwise liquidate the collateral. A court may also invalidate the Loan or the Fund’s security interest in collateral or subordinate the Fund’s rights under a Senior Loan or Junior Loan to the interest of the Obligor’s other creditors, including unsecured creditors, or cause interest or principal previously paid to be refunded to the Obligor. If a court required interest or principal to be refunded, it could negatively affect Fund performance. Such action by a court could be based, for example, on a “fraudulent conveyance” claim to the effect that the Obligor did not receive fair consideration for granting the security interest in the Loan collateral to a Fund. For Senior Loans made in connection with a highly leveraged transaction, consideration for granting a security interest may be deemed inadequate if the proceeds of the Loan were not received or retained by the Obligor, but were instead paid to other persons (such as shareholders of the Obligor) in an amount which left the Obligor insolvent or without sufficient working capital. There are also other events, such as the failure to perfect a security interest due to faulty documentation or faulty official filings, which could lead to the invalidation of a Fund’s security interest in Loan collateral. If the Fund’s security interest in Loan collateral is invalidated or a Senior Loan were subordinated to other debt of an Obligor in bankruptcy or other proceedings, the Fund would have substantially lower recovery, and perhaps no recovery on the full amount of the principal and interest due on the Loan, or the Fund could have to refund interest. Lenders and investors in Loans can be sued by other creditors and shareholders of the Obligors. Losses can be greater than the original Loan amount and occur years after the principal and interest on the Loan have been repaid.
Agent Risk. Selling Lenders, Agents and other entities who may be positioned between a Fund and the Obligor will likely conduct their principal business activities in the banking, finance and financial services industries. Investments in Loans may be more impacted by a single economic, political or regulatory occurrence affecting such industries than other types of investments. Entities engaged in such industries may be more susceptible to, among other things, fluctuations in interest rates, changes in monetary policies, government regulations concerning such industries and concerning capital raising activities generally and fluctuations in the financial markets generally. An Agent, Lender or other entity positioned between a Fund and the Obligor may become insolvent or enter Federal Deposit Insurance Corporation (“FDIC”) receivership or bankruptcy. The Fund might
Part II - 29
incur certain costs and delays in realizing payment on a Loan or suffer a loss of principal and/ or interest if assets or interests held by the Agent, Lender or other party positioned between the Fund and the Obligor are determined to be subject to the claims of the Agent’s, Lender’s or such other party’s creditors.
Regulatory Changes. To the extent that legislation or state or federal regulators that regulate certain financial institutions impose additional requirements or restrictions with respect to the ability of such institutions to make Loans, particularly in connection with highly leveraged transactions, the availability of Loans for investment may be adversely affected. Furthermore, such legislation or regulation could depress the market value of Loans held by the Fund.
Inventory Risk. Affiliates of the Adviser may participate in the primary and secondary market for Loans. Because of limitations imposed by applicable law, the presence of the Adviser’s affiliates in the Loan market may restrict a Fund’s ability to acquire some Loans, affect the timing of such acquisition or affect the price at which the Loan is acquired.
Information Risk. There is typically less publicly available information concerning Loans than other types of fixed income investments. As a result, a Fund generally will be dependent on reports and other information provided by the Obligor, either directly or through an Agent, to evaluate the Obligor’s creditworthiness or to determine the Obligor’s compliance with the covenants and other terms of the Loan Agreement. Such reliance may make investments in Loans more susceptible to fraud than other types of investments. In addition, because the Adviser may wish to invest in the publicly traded securities of an Obligor, it may not have access to material non-public information regarding the Obligor to which other Loan investors have access.
Junior Loan Risk. Junior Loans are subject to the same general risks inherent to any Loan investment. Due to their lower place in the Obligor’s capital structure and possible unsecured status, Junior Loans involve a higher degree of overall risk than Senior Loans of the same Obligor. Junior Loans that are Bridge Loans generally carry the expectation that the Obligor will be able to obtain permanent financing in the near future. Any delay in obtaining permanent financing subjects the Bridge Loan investor to increased risk. An Obligor’s use of Bridge Loans also involves the risk that the Obligor may be unable to locate permanent financing to replace the Bridge Loan, which may impair the Obligor’s perceived creditworthiness.
Mezzanine Loan Risk. In addition to the risk factors described above, mezzanine loans are subject to additional risks. Unlike conventional mortgage loans, mezzanine loans are not secured by a mortgage on the underlying real property but rather by a pledge of equity interests (such as a partnership or limited liability company membership) in the property owner or another company in the ownership structures that has control over the property. Such companies are typically structured as special purpose entities. Generally, mezzanine loans may be more highly leveraged than other types of Loans and subordinate in the capital structure of the Obligor. While foreclosure of a mezzanine loan generally takes substantially less time than foreclosure of a traditional mortgage, the holders of a mezzanine loan have different remedies available versus the holder of a first lien mortgage loan. In addition, a sale of the underlying real property would not be unencumbered, and thus would be subject to encumbrances by more senior mortgages and liens of other creditors. Upon foreclosure of a mezzanine loan, the holder of the mezzanine loan acquires an equity interest in the Obligor. However, because of the subordinate nature of a mezzanine loan, the real property continues to be subject to the lien of the mortgage and other liens encumbering the real estate. In the event the holder of a mezzanine loan forecloses on its equity collateral, the holder may need to cure the Obligor’s existing mortgage defaults or, to the extent permissible under the governing agreements, sell the property to pay off other creditors. To the extent that the amount of mortgages and senior indebtedness and liens exceed the value of the real estate, the collateral underlying the mezzanine loan may have little or no value.
Foreclosure Risk. There may be additional costs associated with enforcing a Fund’s remedies under a Loan including additional legal costs and payment of real property transfer taxes upon foreclosure in certain jurisdictions or legal costs and expenses associated with operating real property. As a result of these additional costs, the Fund may determine that pursuing foreclosure on the Loan collateral is not worth the associated costs. In addition, if the Fund incurs costs and the collateral loses value or is not recovered by the Fund in foreclosure, the Fund could lose more than its original investment in the Loan. Foreclosure risk is heightened for Junior Loans, including certain mezzanine loans.
Part II - 30
Covenant-Lite Obligations. A Fund may invest in or be exposed to floating rate loans and other similar debt obligations that are sometimes referred to as “covenant-lite” loans or obligations (“covenant-lite obligations”), which are loans or other similar debt obligations that lack financial maintenance covenants or possess fewer or contingent financial maintenance covenants and other financial protections for lenders and investors. A Fund may obtain exposure to covenant-lite obligations through investment in securitization vehicles and other structured products. In current market conditions, many new, restructured or reissued loans and similar debt obligations do not feature traditional financial maintenance covenants, which are intended to protect lenders and investors by imposing certain restrictions and other limitations on a borrower’s operations or assets and by providing certain information and consent rights to lenders. Covenant-lite obligations allow borrowers to exercise more flexibility with respect to certain activities that may otherwise be limited or prohibited under similar loan obligations that are not covenant-lite. In an investment with a traditional financial maintenance covenant, the borrower is required to meet certain regular, specific financial tests over the term of the investment; in a covenant-lite obligation, the borrower would only be required to satisfy certain financial tests at the time it proposes to take a specific action or engage in a specific transaction (e.g., issuing additional debt, paying a dividend, or making an acquisition) or at a time when another financial criteria has been met (e.g., reduced availability under a revolving credit facility, or asset value falling below a certain percentage of outstanding debt obligations). In addition, in a loan with traditional covenants, the borrower is required to provide certain periodic financial reporting that typically includes a detailed calculation of certain financial metrics; in a covenant-lite obligation, certain detailed financial information is only required to be provided when a financial metric is required to be calculated, which may result in more limited access to financial information, difficulty evaluating the borrower’s financial performance over time and delays in exercising rights and remedies in the event of a significant financial decline. In addition, in the event of default, covenant-lite obligations may exhibit diminished recovery values as the lender may not have the opportunity to negotiate with the borrower or take other measures intended to mitigate losses prior to default. Accordingly, a Fund may have fewer rights with respect to covenant-lite obligations, including fewer protections against the possibility of default and fewer remedies, and may experience losses or delays in enforcing its rights on covenant-lite obligations. As a result, investments in or exposure to covenant-lite obligations are generally subject to more risk than investments that contain traditional financial maintenance covenants and financial reporting requirements.
Miscellaneous Investment Strategies and Risks
Borrowings. A Fund may borrow for temporary purposes and/or for investment purposes. Such a practice will result in leveraging of a Fund’s assets and may cause a Fund to liquidate portfolio positions when it would not be advantageous to do so. This borrowing may be secured or unsecured. If a Fund utilizes borrowings, for investment purposes or otherwise, it may pledge up to 33 1/3% of its total assets to secure such borrowings. A Fund must maintain continuous asset coverage (that is, total assets including borrowings, less liabilities exclusive of borrowings) of at least 300% of the amount borrowed, with an exception for borrowings not in excess of 5% of the Fund’s total assets made for temporary administrative or emergency purposes. Any borrowings for temporary administrative purposes in excess of 5% of the Fund’s total assets must maintain continuous asset coverage. If the 300% asset coverage should decline as a result of market fluctuations or other reasons, a Fund may be required to sell some of its portfolio holdings within three days to reduce the debt and restore the 300% asset coverage, even though it may be disadvantageous from an investment standpoint to sell securities at that time. Borrowing will tend to exaggerate the effect on net asset value of any increase or decrease in the market value of a Fund’s portfolio. Money borrowed will be subject to interest costs which may or may not be recovered by appreciation of any securities that may have been purchased during the time of the borrowing. A Fund also may be required to maintain minimum average balances in connection with such borrowing or to pay a commitment or other fee to maintain a line of credit, either of which would increase the cost of borrowing over the stated interest rate.
Certain Trusts, on behalf of certain Funds (“Borrowers”) entered into a joint syndicated senior unsecured revolving credit facility totaling $1.5 billion, which terminates on August 9, 2022 unless otherwise extended or renewed (“Credit Facility”), with various lenders and The Bank of New York Mellon, as administrative agent for the lenders. This Credit Facility provides a source of funds to the Borrowers for temporary and emergency purposes, including the meeting of redemption requests that otherwise might require the untimely disposition of securities. Under the terms of the Credit Facility, a borrowing Fund must meet certain requirements, including a minimum adjusted net asset value amount and certain adjusted net asset coverage rations prior to and during the time in which any borrowings are outstanding. If a Fund does not comply with these requirements, the lenders may terminate the Credit
Part II - 31
Facility and declare any outstanding borrowings to be due and payable immediately. Interest associated with any borrowing under the Credit Facility is charged to the borrowing Fund at a variable rate. In addition, each participating Fund is charged an annual commitment fee, which is incurred on the unused portion of the Credit Facility and is allocated to all participating Funds pro rata based on their respective net assets.
Certain types of investments are considered to be borrowings under precedents issued by the SEC. Such investments are subject to the limitations as well as, under current SEC and staff requirements, asset segregation requirements. In addition, each Fund may enter into Interfund Lending Arrangements. Please see “Interfund Lending.”
LIBOR Discontinuance or Unavailability Risk. The London Interbank Offering Rate ("LIBOR") is intended to represent the rate at which contributing banks may obtain short-term borrowings from each other in the London interbank market. On March 5, 2021, the U.K. Financial Conduct Authority (“FCA”) publicly announced that (i) immediately after December 31, 2021, publication of the 1-week and 2-month U.S. Dollar LIBOR settings will permanently cease; (ii) immediately after June 30, 2023, publication of the overnight and 12-month U.S. Dollar LIBOR settings will permanently cease; and (iii) immediately after June 30, 2023, the 1-month, 3-month and 6-month U.S. Dollar LIBOR settings will cease to be provided or, subject to the FCA’s consideration of the case, be provided on a synthetic basis and no longer be representative of the underlying market and economic reality they are intended to measure and that representativeness will not be restored. There is no assurance that the dates announced by the FCA will not change or that the administrator of LIBOR and/or regulators will not take further action that could impact the availability, composition or characteristics of LIBOR or the currencies and/or tenors for which LIBOR is published, and we recommend that you consult your advisors to stay informed of any such developments. In addition, certain regulated entities ceased entering into most new LIBOR contracts in connection with regulatory guidance or prohibitions. Public and private sector industry initiatives are currently underway to implement new or alternative reference rates to be used in place of LIBOR. There is no assurance that any such alternative reference rate will be similar to or produce the same value or economic equivalence as LIBOR or that it will have the same volume or liquidity as did LIBOR prior to its discontinuance, unavailability or replacement, all of which may affect the value, volatility, liquidity or return on certain of a Fund’s loans, notes, derivatives and other instruments or investments comprising some or all of a Fund’s investments and result in costs incurred in connection with changing reference rates used for positions, closing out positions and entering into new trades. Certain of the Fund’s investments may transition from LIBOR prior to the dates announced by the FCA. The transition from LIBOR to alternative reference rates may result in operational issues for the Fund or its investments. No assurances can be given as to the impact of the LIBOR transition (and the timing of any such impact) on the Fund and its investments. These risks may also apply with respect to changes in connection with other interbank offering rates (e.g., Euribor) and a wide range of other index levels, rates and values that are treated as “benchmarks” and are the subject of recent regulatory reform.
Commodity-Linked Derivatives. Commodity-linked derivatives are derivative instruments the value of which is linked to the value of a commodity, commodity index or commodity futures contract. A Fund’s investment in commodity-linked derivative instruments may subject the Fund to greater volatility than investments in traditional securities, particularly if the instruments involve leverage. The value of commodity-linked derivative instruments may be affected by changes in overall market movements, commodity index volatility, changes in interest rates, or factors affecting a particular industry or commodity, such as drought, floods, weather, livestock disease, embargoes, tariffs and international economic, political and regulatory developments. Use of leveraged commodity-linked derivatives creates the possibility for greater loss (including the likelihood of greater volatility of the Fund’s net asset value), and there can be no assurance that a Fund’s use of leverage will be successful. Tax considerations may limit a Fund’s ability to pursue investments in commodity-linked derivatives.
Commodity-Related Pooled Investment Vehicles. Commodity-related pooled investment vehicles include ownership interests in grantor trusts and other pooled investment vehicles that hold tangible assets such as gold, silver or other commodities or invest in commodity futures. Grantor trusts are typically traded on an exchange.
Investors do not have the rights normally associated with ownership of other types of shares when they invest in pooled investment vehicles holding commodities or commodity futures, including those structured as limited partnerships or grantor trusts holding commodities. For example, the owners of these commodity-related grantor trusts or limited partnerships do not have the right to elect directors, receive dividends or take other actions normally associated with the ownership of shares of a corporation. Holders of a certain percentage of shares in a grantor trust may have the right to terminate the trust or exercise
Part II - 32
other rights which would not be available to small investors. If investors other than a Fund exercise their right to terminate, a Fund that wishes to invest in the underlying commodity through the pooled investment vehicle will have to find another investment and may not be able to find another vehicle that offers the same investment features. In the event that one or more participants holding a substantial interest in these pooled investment vehicles withdraw from participation, the liquidity of the pooled investment vehicle will likely decrease which could adversely affect the market price of the pooled investment vehicle and result in a Fund incurring a loss on its investments.
These pooled investment vehicles are not registered investment companies, and many are not commodity pools, and therefore, do not have the protections available to those types of investments under federal securities or commodities laws. For example, unlike registered investment companies, these vehicles are not subject to federal securities laws that limit transactions with affiliates, require redemption of shares, or limit sales load. Although shares of these vehicles may be traded on an exchange, there may be no active market for such shares and such shares may be highly illiquid.
These vehicles are subject to the risks associated with direct investments in commodities. The market price of shares of these vehicles will be as unpredictable as the price of the underlying commodity. Many factors can cause a decline in the prices of commodities including a change in economic conditions, such as a recession. This risk is magnified when the commodity is used in manufacturing. In addition, the prices of commodities may be adversely impacted by a change in the attitude of speculators and investors toward the applicable commodity, or a significant increase in commodity price hedging activity. In addition, the value of the shares will be adversely affected if the assets owned by the trust are lost, damaged or of inferior quality.
The commodities represented by shares of a grantor trust will decrease over the life of the trust due to sales of the underlying commodities necessary to pay trust fees and expenses, including expenses associated with indemnification of certain service providers to the pooled investment vehicle. Without increases in the price of the underlying commodity sufficient to compensate for that decrease, the price of the investment will decline and a Fund will incur a loss on its investment.
Commodity-related grantor trusts are passive investment vehicles. This means that the value of the investment in a grantor trust may be adversely affected by trust losses that, if the trust had been actively managed, it might have been possible to avoid. A Fund’s intention to qualify as a regulated investment company under Subchapter M of the Code may limit its ability to make investments in grantor trusts or limited partnerships that invest in commodities or commodity futures.
Cyber Security Risk. As the use of technology has become more prevalent in the course of business, the Funds have become more susceptible to operational and financial risks associated with cyber security, including: theft, loss, misuse, improper release, corruption and destruction of, or unauthorized access to, confidential or highly restricted data relating to a Fund and its shareholders; and compromises or failures to systems, networks, devices and applications relating to the operations of a Fund and its service providers. Cyber security risks may result in financial losses to a Fund and its shareholders; the inability of a Fund to transact business with its shareholders; delays or mistakes in the calculation of a Fund’s net asset value (“NAV”) or other materials provided to shareholders; the inability to process transactions with shareholders or other parties; violations of privacy and other laws; regulatory fines, penalties and reputational damage; and compliance and remediation costs, legal fees and other expenses. A Fund’s service providers (including, but not limited to, the Adviser, any sub-advisers, administrator, transfer agent, and custodian or their agents), financial intermediaries, companies in which a Fund invests and parties with which a Fund engages in portfolio or other transactions also may be adversely impacted by cyber security risks in their own businesses, which could result in losses to a Fund or its shareholders. While measures have been developed which are designed to reduce the risks associated with cyber security, there is no guarantee that those measures will be effective, particularly since the Funds do not directly control the cyber security defenses or plans of their service providers, financial intermediaries and companies in which they invest or with which they do business.
Volcker Rule Risk. Section 619 of the Dodd-Frank Wall Street Reform and Consumer Protection Act (“Dodd-Frank”) and certain rules promulgated thereunder (known as the Volcker Rule) places restrictions on the activities of banking entities, including the Adviser and its affiliates, and may impact the long-term viability of a Fund. Under the Volcker Rule, if the Adviser or its affiliates own 25% or more of the ownership interests of a Fund outside of the permitted seeding time period, a Fund could be subject to restrictions on trading that would adversely impact a Fund’s ability to execute its investment strategy. Generally, the permitted seeding period is three years from the implementation of a Fund’s investment strategy. As a result, the Adviser and/or its affiliates may be required to reduce their ownership interests in
Part II - 33
a Fund at a time that is sooner than would otherwise be desirable. This may require the sale of Fund securities, which may result in losses, increased transaction costs and adverse tax consequences. In addition, the ongoing viability of a Fund may be adversely impacted by the anticipated or actual redemption of Fund shares owned by the Adviser and its affiliates and could result in a Fund’s liquidation.
Exchange-Traded Notes (“ETNs”) are senior, unsecured notes linked to an index. Like ETFs, they may be bought and sold like shares of stock on an exchange (e.g., the New York Stock Exchange) during normal trading hours. However, ETNs have a different underlying structure and may be held until their maturity. While ETF shares represent an interest in a portfolio of securities, ETNs are structured products that are an obligation of the issuing bank, whereby the bank agrees to pay a return based on the target index less any fees. Essentially, these notes allow individual investors to have access to derivatives linked to commodities and assets such as oil, currencies and foreign stock indexes. ETNs combine certain aspects of bonds and ETFs. At maturity, the issuer of a ETN pays to the investor a cash amount equal to principal amount, subject to the day’s index factor. ETN returns are based upon the performance of a market index minus applicable fees. ETNs do not make periodic coupon payments and provide no principal protection. The value of an ETN may be influenced by time to maturity, level of supply and demand for the ETN, volatility and lack of liquidity in underlying commodities markets, changes in the applicable interest rates, changes in the issuer’s credit rating and economic, legal, political or geographic events that affect the referenced commodity. The timing and character of income and gains derived from ETNs is under consideration by the U.S. Treasury and Internal Revenue Service and may also be affected by future legislation.
Impact of Large Redemptions and Purchases of Fund Shares. Shareholders of a Fund (which may include the Adviser or affiliates of the Adviser or accounts for which the Adviser or its affiliates serve as investment adviser or trustee or, for certain Funds, affiliated and/or non-affiliated registered investment companies that invest in a Fund) may make relatively large redemptions or purchases of Fund shares. In addition, certain circumstances that may cause a Fund to experience large redemptions include, but are not limited to: the occurrence of significant events affecting investor demand for securities or asset classes in which the Fund invests; changes in the eligibility criteria for the Fund or share class of the Fund or other J.P. Morgan Funds; personnel changes relating to the management of the Fund; index rebalancings; announced liquidations of the Fund; announced reorganizations of the Fund; or other announcements relating to the Fund, including changes in investment objectives, strategies, policies or risks. In addition, under applicable regulations, the Adviser or an affiliate of the Adviser may be required to reduce its seed investment or other ownership interest in a Fund at a time that is sooner than the Adviser or its affiliate otherwise would. Any large redemption and purchase transactions may cause a Fund to have to sell securities, or invest additional cash, as the case may be. While it is impossible to predict the overall impact of these transactions over time, there could be adverse effects on a Fund’s performance to the extent that the Fund is required to sell securities or invest cash at times when it would not otherwise do so, which may result in a loss to the Fund. These transactions may result in higher portfolio turnover, accelerate the realization of taxable income if sales of securities resulted in capital gains or other income (which particularly would impact shareholders who do not hold their Fund shares in an IRA, 401(k) plan or other tax-advantaged investment plan), and/or increase transaction costs, which may impact the Fund’s expense ratio. Additionally, a significant reduction in Fund assets would result in Fund expenses being spread over a small asset base, potentially causing an increase in the Fund’s expense ratio. To the extent that such transactions result in short-term capital gains, such gains will generally be taxed at the ordinary income tax rate for shareholders who hold Fund shares in a taxable account. In addition to the above information, the SAI includes disclosure of accounts holding more than 5% of a Fund’s voting securities.
Capital Gains. A Fund may sell securities and subsequently repurchase the same securities in an effort to manage capital gains distributions. This may occur if a Fund’s unrealized and/or realized capital gains represent a significant portion of its net assets. If this occurs, this will change the timing, amount and/or character of capital gains to be distributed and therefore the amount and timing of tax paid by Fund shareholders will change. In addition, shareholders may experience corresponding tax implications upon redemption as reinvested distributions will generally increase the cost basis of their Fund share position, potentially changing the amount of realized gain or loss. Accordingly, a redeeming shareholder’s total tax liability from distributions and redemptions for a year may be impacted by the character of the distributions and whether or not shares are redeemed in the same year. In addition, a Fund’s repurchased securities when subsequently sold may cause the Fund to realize short-term capital gains or losses rather than long-term capital gains or losses. Repurchases of substantially identical securities within 30 days before or after the securities are sold at a loss will result in the application of the wash sale rules. The Fund would incur additional transaction costs from the selling and repurchasing of securities, and the value of the securities sold may change. An increase or decrease in the value of securities sold prior to being
Part II - 34
repurchased may impact Fund performance. Additionally, unless otherwise disclosed in a Fund’s prospectus, the Funds are not managed to maximize after-tax returns or tax efficiency for taxable shareholder accounts. As a result, large redemptions could accelerate the realization of capital gains for a shareholder of those Funds. Investors should consider whether a Fund is an appropriate investment in light of their current financial position and retirement needs.
Government Intervention in Financial Markets. Events in the financial sector resulted in reduced liquidity in credit and fixed income markets and a higher degree of volatility in the financial markets, both domestically and internationally. While entire markets were, and may continue to be, impacted, issuers that have exposure to the real estate, mortgage and credit markets were, and may continue to be, particularly affected. Future market turbulence may have an adverse effect on the Funds’ investments.
Instability in the financial markets has previously led, and could lead, governments and regulators around the world to take a number of actions designed to support certain financial institutions and segments of the financial markets that have experienced extreme volatility, a lack of liquidity or other adverse conditions. Governments, their regulatory agencies, or self-regulatory organizations may take actions that affect the regulation of the instruments in which the Funds invest, or the issuers of such instruments, in ways that are unforeseeable. Legislation or regulation may also change the way in which the Funds themselves are regulated. For instance, in 2016, the SEC adopted rules that regulate the Funds’ management of liquidity risk. Such legislation or regulation could limit or preclude a Fund’s ability to achieve its investment objective. Further, in response to the outbreak of COVID-19, a novel coronavirus disease, the U.S. Government passed the Coronavirus Aid, Relief and Economic Security Act (CARES Act) in March 2020, which established loan programs for certain issuers impacted by COVID-19. Among other conditions, borrowers under these loan programs are generally restricted from paying dividends. The adoption of any future legislation could further limit or restrict the ability of issuers to pay dividends. The ongoing effects of COVID-19 could result in continuing volatility in the market, which may negatively impact the performance of the Funds.
Governments or their agencies may also acquire distressed assets from financial institutions and acquire ownership interests in those institutions. The implications of government ownership and disposition of these assets are unclear, and such a program may have positive or negative effects on the liquidity, valuation and performance of a Fund’s portfolio holdings. Furthermore, volatile financial markets can expose the Funds to greater market and liquidity risk and potential difficulty in valuing portfolio instruments held by the Funds.
Interest Bearing Deposit Facility. As part of seeking to provide intraday liquidity, certain Money Market Funds generally set aside cash in an interest bearing deposit facility (“IBDF”) at a level estimated to meet the Money Market Fund’s next business day’s intraday redemption orders. Under the IBDF, each Money Market Fund expects to retain a balance (“designated balance”) overnight in its custodial cash deposit account with JPMorgan Chase Bank at a level estimated to meet its next business day’s intraday redemption orders. As redemption payments are processed for the Money Market Fund on the next business day, outgoing wires are debited from its account. At the end of that day, the Money Market Fund seeks to allocate cash to the account to restore the designated balance. A Money Market Fund receives interest overnight on the designated balance.
Interfund Lending. To satisfy redemption requests or to cover unanticipated cash shortfalls, a Fund may enter into lending agreements (“Interfund Lending Agreements”) under which the Fund would lend money and borrow money for temporary purposes directly to and from another J.P. Morgan Fund through a credit facility (“Interfund Loan”), subject to meeting the conditions of an SEC exemptive order granted to the Funds or other relief provided by the SEC or its staff permitting such interfund lending. No Fund may borrow more than the lesser of the amount permitted by Section 18 of the 1940 Act or the amount permitted by its investment limitations. All Interfund Loans will consist only of uninvested cash reserves that the Fund otherwise would invest in short-term repurchase agreements or other short-term instruments.
If a Fund has outstanding borrowings, any Interfund Loans to the Fund will (a) be at an interest rate equal to or lower than any outstanding bank loan, (b) be secured at least on an equal priority basis with at least an equivalent percentage of collateral to loan value as any outstanding bank loan that requires collateral, (c) have a maturity no longer than any outstanding bank loan (and in any event not over seven days) and (d) provide that, if an event of default occurs under any agreement evidencing an outstanding bank loan to the Fund, the event of default will automatically (without need for action or notice by the
Part II - 35
lending Fund) constitute an immediate event of default under an Interfund Lending Agreement entitling the lending Fund to call the Interfund Loan (and exercise all rights with respect to any collateral), and such call will be made if the lending bank exercises its right to call its loan under its agreement with the borrowing Fund.
A Fund may make an unsecured borrowing through the credit facility if its outstanding borrowings from all sources immediately after the interfund borrowing total 10% or less of its total assets; provided, that if the Fund has a secured loan outstanding from any other lender, including but not limited to another J.P. Morgan Fund, the Fund’s interfund borrowing will be secured on at least an equal priority basis with at least an equivalent percentage of collateral to loan value as any outstanding loan that requires collateral. If a Fund’s total outstanding borrowings immediately after an interfund borrowing would be greater than 10% of its total assets, the Fund may borrow through the credit facility on a secured basis only. A Fund may not borrow through the credit facility nor from any other source if its total outstanding borrowings immediately after the interfund borrowing would exceed the limits imposed by Section 18 of the 1940 Act.
No Fund may lend to another Fund through the interfund lending credit facility if the loan would cause its aggregate outstanding loans through the credit facility to exceed 15% of the lending Fund’s net assets at the time of the loan. A Fund’s Interfund Loans to any one Fund shall not exceed 5% of the lending Fund’s net assets. The duration of Interfund Loans is limited to the time required to receive payment for securities sold, but in no event may the duration exceed seven days. Loans effected within seven days of each other will be treated as separate loan transactions for purposes of this condition. Each Interfund Loan may be called on one business day’s notice by a lending Fund and may be repaid on any day by a borrowing Fund.
The limitations detailed above and the other conditions of the SEC exemptive order permitting interfund lending are designed to minimize the risks associated with interfund lending for both the lending fund and the borrowing fund. However, no borrowing or lending activity is without risk. When a Fund borrows money from another Fund, there is a risk that the loan could be called on one day’s notice or not renewed, in which case the Fund may have to borrow from a bank at higher rates if an Interfund Loan were not available from another Fund. A delay in repayment to a lending Fund could result in a lost opportunity or additional lending costs.
Master Limited Partnerships. Certain companies are organized as master limited partnerships (“MLPs”) in which ownership interests are publicly traded. MLPs often own several properties or businesses (or directly own interests) that are related to real estate development and oil and gas industries, but they also may finance motion pictures, research and development and other projects or provide financial services. Generally, an MLP is operated under the supervision of one or more managing general partners. Limited partners (like a Fund that invests in an MLP) are not involved in the day-to-day management of the partnership. They are allocated income and capital gains associated with the partnership project in accordance with the terms established in the partnership agreement.
The risks of investing in an MLP are generally those inherent in investing in a partnership as opposed to a corporation. For example, state law governing partnerships is often less restrictive than state law governing corporations. Accordingly, there may be fewer protections afforded investors in an MLP than investors in a corporation. Additional risks involved with investing in an MLP are risks associated with the specific industry or industries in which the partnership invests, such as the risks of investing in real estate, or oil and gas industries.
YieldCos. A YieldCo is a dividend growth-oriented company, created by a parent company (the “YieldCo Sponsor”), that bundles operating assets in order to generate systematic cash flows. YieldCos are not limited by asset or income composition, but they are generally tied to the energy industry, including, for example, renewable energy projects, that offer predictable cash flows. YieldCos generally serve a similar purpose as MLPs and REITs, which most energy companies cannot establish due to regulatory reasons.
The risks of investing in YieldCos involve risks that differ from investments in traditional operating companies, including risks related to the relationship between the YieldCo and the YieldCo Sponsor. A YieldCo is usually dependent on the management of the YieldCo Sponsor and may be impacted by the development capabilities and financial health of its YieldCo Sponsor. Additionally, a YieldCo Sponsor may have interests of its YieldCo and may retain control of the YieldCo through classes of stock held by the YieldCo Sponsor.
Part II - 36
A YieldCo’s share price is typically a multiple of its distributable cash flow. Therefore, any event that limits a YieldCo’s ability to maintain or grow its distributable cash flow would likely have a negative impact on the YieldCo’s share price. The share price of a YieldCo can be affected by fundamentals unique to the YieldCo, including the robustness and consistency of its earnings and its ability to meet debt obligations including the payment of interest and principle to creditors. A YieldCo may distribute all or substantially all of the cash available for distribution, which may limit new acquisitions and future growth. A YieldCo may finance its growth strategy with debt, which may increase the YieldCo’s leverage and the risk associated with the YieldCo. The ability of a YieldCo to maintain or grow its dividend distributions may depend on the YieldCo’s ability to minimize its tax liabilities through the use of accelerated depreciation schedule, tax loss carryforwards, and tax incentives. Changes to the current tax code could result in greater tax liabilities, which would reduce a YieldCo’s distributable cash flow.
New Financial Products. New options and futures contracts and other financial products, and various combinations thereof, including over-the-counter products, continue to be developed. These various products may be used to adjust the risk and return characteristics of certain Funds’ investments. These various products may increase or decrease exposure to security prices, interest rates, commodity prices, or other factors that affect security values, regardless of the issuer’s credit risk. If market conditions do not perform as expected, the performance of a Fund would be less favorable than it would have been if these products were not used. In addition, losses may occur if counterparties involved in transactions do not perform as promised. These products may expose the Fund to potentially greater return as well as potentially greater risk of loss than more traditional fixed income investments.
Private Placements, Restricted Securities and Other Unregistered Securities. Subject to its investment policies, a Fund may acquire investments such as obligations issued in reliance on the so-called “private placement” exemption from registration afforded by Section 4(a)(2) under the Securities Act of 1933, as amended (the “1933 Act”), which cannot be offered for public sale in the U.S. without first being registered under the 1933 Act. These securities may be subject to liquidity risks and certain private placements may be determined to be Illiquid Investments under the Liquidity Risk Management Program applicable to the Funds (other than Money Market Funds).
A Fund is subject to a risk that should the Fund decide to sell such securities when a ready buyer is not available at a price the Fund deems representative of their value, the value of the Fund’s net assets could be adversely affected. In addition, information about the issuers whose securities are not publicly traded may not be subject to the disclosure and other investor protection requirements that may be applicable if their securities were publicly traded. As a result, prices of such securities may be difficult to value and highly volatile, which could impact the value of the Fund’s net assets. Where a security must be registered under the 1933 Act before it may be sold, a Fund may be obligated to pay all or part of the registration expenses, and a considerable period may elapse between the time of the decision to sell and the time the Fund may be permitted to sell a security under an effective registration statement. If, during such a period, adverse market conditions were to develop, a Fund might obtain a less favorable price than prevailed when it decided to sell.
The Funds may invest in commercial paper issued in reliance on the exemption from registration afforded by Section 4(a)(2) of the 1933 Act and other restricted securities (i.e., other securities subject to restrictions on resale). Section 4(a)(2) commercial paper (“4(a)(2) paper”) is restricted as to disposition under federal securities law and is generally sold to institutional investors, such as the Funds, that agree that they are purchasing the paper for investment purposes and not with a view to public distribution. Any resale by the purchaser must be in an exempt transaction. 4(a)(2) paper is normally resold to other institutional investors through or with the assistance of the issuer or investment dealers who make a market in 4(a)(2) paper, thus providing liquidity.
Certain investments in private placements may consist of direct investments and may include investments in smaller, less seasoned issuers, which may involve greater risks. These issuers may have limited product lines, markets or financial resources, or they may be dependent on a limited management group. In making investments in such securities, a Fund may obtain access to material non-public information, which may restrict the Fund’s ability to conduct portfolio transactions in such securities.
Securities Issued in Connection with Reorganizations and Corporate Restructuring. Debt securities may be downgraded and issuers of debt securities including investment grade securities may default in the payment of principal or interest or be subject to bankruptcy proceedings. In connection with reorganizing or restructuring of an issuer, an issuer may issue common stock or other securities to holders
Part II - 37
of its debt securities. A Fund may hold such common stock and other securities even though it does not ordinarily invest in such securities and such common stock or other securities may be denominated in currencies that a Fund may not ordinarily hold.
Stapled Securities. From time to time, the Funds may invest in stapled securities to gain exposure to companies. A stapled security is a security that is comprised of two or more parts that cannot be separated from one another. The resulting security is influenced by both parts, and must be treated as one unit at all times, such as when buying or selling a security. The value of stapled securities and the income derived from them may fall as well as rise. Stapled securities are not obligations of, deposits in, or guaranteed by, the Fund. The listing of stapled securities on a domestic or foreign exchange does not guarantee a liquid market for stapled securities.
Temporary Defensive Positions. To respond to unusual market conditions, all of the Funds may invest their assets in cash or cash equivalents. Cash equivalents are highly liquid, high quality instruments with maturities of three months or less on the date they are purchased (“Cash Equivalents”) for temporary defensive purposes. These investments may result in a lower yield than lower-quality or longer term investments and may prevent the Funds from meeting their investment objectives. The percentage of Fund’s total assets that a Fund may invest in cash or cash equivalents is described in the applicable Fund’s Prospectuses. They include securities issued by the U.S. government, its agencies, Government-Sponsored Enterprises (“GSEs”) and instrumentalities, repurchase agreements with maturities of 7 days or less, certificates of deposit, bankers’ acceptances, commercial paper, money market mutual funds, and bank deposit accounts. In order to invest in repurchase agreements with the Federal Reserve Bank of New York for temporary defensive purposes, certain Funds may engage in periodic “test” trading in order to assess operational abilities at times when the Fund would otherwise not enter into such a position. These exercises may vary in size and frequency.
Infectious Disease Risk. A worldwide outbreak of COVID-19 has negatively affected economies, markets and individual companies throughout the world. The effects of this COVID-19 pandemic to public health, and business and market conditions, including, among other things, reduced consumer demand and economic output, supply chain disruptions and increased government spending, may continue to have a significant negative impact on the performance of a Fund’s investments, increase a Fund’s volatility and exacerbate other pre-existing political, social and economic risks to the Funds.
The risk of further spreading of COVID-19 has led to significant uncertainty and volatility in the financial markets. The impacts of COVID-19, and other epidemics and pandemics that may arise in the future, could adversely affect the economies of many nations, particular regions, or the entire global economy, individual companies and investment products, and the market in general. The full extent of such impacts cannot necessarily be foreseen. The impacts may be short term or may last for an extended period of time, and may exacerbate other pre-existing political, social and economic risks. The value of a Fund and the securities in which a Fund invests may be adversely affected by impacts caused by COVID-19 and other epidemics and pandemics that may arise in the future. The impact of a pandemic may also negatively affect the liquidity of certain of a Fund’s portfolio holdings and may make it more difficult to value such holdings. Because epidemics and pandemics (such as COVID-19) impact broad segments of businesses and populations at the same time or in close succession, often in unpredictable and significant ways, they create the risk that a Fund’s operations may be interrupted, which may have a significant negative impact on investment performance. Governments, their regulatory agencies, or self-regulatory organizations have taken or may take actions that affect the instruments in which a Fund invests, or the issuers of such instruments, in ways that could also have a significant negative impact on a Fund’s investment performance. The duration and extent of COVID-19 and associated economic and market conditions and uncertainty over the long-term cannot be reasonably estimated at this time. The ultimate impact of COVID-19 and the extent to which the associated conditions impact a Fund will also depend on future developments, which are highly uncertain, difficult to accurately predict and subject to frequent changes.
Mortgage-Related Securities
Mortgages (Directly Held). Mortgages are debt instruments secured by real property. Unlike mortgage-backed securities, which generally represent an interest in a pool of mortgages, direct investments in mortgages involve prepayment and credit risks of an individual issuer and real property. Consequently, these investments require different investment and credit analysis by a Fund’s Adviser.
Directly placed mortgages may include residential mortgages, multifamily mortgages, mortgages on cooperative apartment buildings, commercial mortgages, and sale-leasebacks. These investments are backed by assets such as office buildings, shopping centers, retail stores, warehouses, apartment buildings
Part II - 38
and single-family dwellings. In the event that a Fund forecloses on any non-performing mortgage, and acquires a direct interest in the real property, such Fund will be subject to the risks generally associated with the ownership of real property. There may be fluctuations in the market value of the foreclosed property and its occupancy rates, rent schedules and operating expenses. There may also be adverse changes in local, regional or general economic conditions, deterioration of the real estate market and the financial circumstances of tenants and sellers, unfavorable changes in zoning, building, environmental and other laws, increased real property taxes, rising interest rates, reduced availability and increased cost of mortgage borrowings, the need for unanticipated renovations, unexpected increases in the cost of energy, environmental factors, acts of God and other factors which are beyond the control of a Fund or the Adviser. Hazardous or toxic substances may be present on, at or under the mortgaged property and adversely affect the value of the property. In addition, the owners of property containing such substances may be held responsible, under various laws, for containing, monitoring, removing or cleaning up such substances. The presence of such substances may also provide a basis for other claims by third parties. Costs of clean up or of liabilities to third parties may exceed the value of the property. In addition, these risks may be uninsurable. In light of these and similar risks, it may be impossible to dispose profitably of properties in foreclosure.
Mortgage-Backed Securities. A Fund may invest in mortgage-backed securities (“MBS”), which are securities that represent pools of mortgage loans assembled and/or securitized for sale to investors. MBS include mortgage pass-through securities and collateralized mortgage obligations (“CMOs”). MBS may be arranged by various governmental agencies, such as the Government National Mortgage Association (“Ginnie Mae”); government sponsored enterprises (“GSEs”), such as the Federal National Mortgage Association (“Fannie Mae”) and the Federal Home Loan Mortgage Corporation (“Freddie Mac”); and private issuers, such as commercial banks, savings and loan institutions, mortgage bankers, and private mortgage insurance companies.
A mortgage pass-through security is a pro rata interest in a pool of mortgages where the cash flow generated from the mortgage collateral is passed through to the security holder after paying servicing and guarantee fees.
CMOs are debt securities that are fully collateralized by a portfolio of mortgages or MBS, or re-securitized or reorganized MBS. Unlike mortgage pass-through securities, CMOs may be organized in a variety of different ways to create customized cash flows in different tranches and may offer certain protections against prepayment risk, such as creating more definite maturities. CMOs may pay fixed or variable rates of interest, and certain CMOs have priority over others with respect to the receipt of prepayments. CMOs may be structured as Real Estate Mortgage Investment Conduits (“REMICs”) which are federally tax-exempt entities that may be organized as trusts, partnerships, corporations or other types of associations.
CMOs are also subject to cash flow uncertainty and price volatility. Stripped mortgage securities (a type of potentially high-risk CMO) are created by separating the interest and principal payments generated by a pool of MBS or a CMO to create additional classes of securities. CMOs are subject to principal prepayments on the underlying mortgages and, thus, may be retired earlier than scheduled.
MBS are subject to scheduled and unscheduled principal payments as homeowners pay down or prepay their mortgages. As these payments are received, they must be reinvested when interest rates may be higher or lower than on the original mortgage security. Therefore, these securities may not be an effective means of locking in long-term interest rates. In addition, when interest rates fall, the pace of mortgage prepayments increase, sometimes rapidly. These refinanced mortgages are paid off at face value (par), causing a loss for any investor who may have purchased the MBS at a price above par. In such an environment, this risk limits the potential price appreciation of these securities and can negatively affect a Fund’s NAV. When rates rise, the prices of mortgage-backed securities can be expected to decline, although historically these securities have experienced smaller price declines than comparable quality bonds. In addition, when rates rise and prepayments slow, the effective duration of MBS extends, resulting in increased volatility. A decline or flattening of housing values may cause delinquencies in the mortgages (especially sub-prime or non-prime mortgages) underlying MBS and thereby adversely affect the ability of the MBS issuer to make principal payments to MBS holders.
MBS issued by the U.S. government and its agencies and instrumentalities may be backed by the full faith and credit of the U.S. government or may be guaranteed as to principal and interest payments. There are a number of important differences among the agencies, GSEs and instrumentalities of the U.S. government that issue MBS and among the securities that they issue.
Part II - 39
Ginnie Mae Securities. MBS issued by Ginnie Mae include Ginnie Mae Mortgage Pass-Through Certificates and CMOs which are guaranteed as to the timely payment of principal and interest by Ginnie Mae. Ginnie Mae’s guarantee is backed by the full faith and credit of the U.S. government. Ginnie Mae is a wholly-owned U.S. government corporation within the Department of Housing and Urban Development. Ginnie Mae certificates also are supported by the authority of Ginnie Mae to borrow funds from the U.S. Treasury to make payments under its guarantee.
Fannie Mae and Freddie Mac Securities. MBS issued by Fannie Mae include Fannie Mae Guaranteed Mortgage Pass-Through Certificates which are solely the obligations of Fannie Mae and are not backed by or entitled to the full faith and credit of the U.S. government. Fannie Mae is a government-sponsored enterprise, which is chartered by Congress but owned by private shareholders. Fannie Mae Certificates are guaranteed as to timely payment of the principal and interest by Fannie Mae. MBS issued by Freddie Mac include Freddie Mac Mortgage Participation Certificates and CMOs. Like Fannie Mae, Freddie Mac is a government-sponsored enterprise, which is chartered by Congress but owned by private shareholders. Freddie Mac Certificates are not guaranteed by the U.S. government and do not constitute a debt or obligation of the U.S. government. Freddie Mac Certificates entitle the holder to timely payment of interest, which is guaranteed by Freddie Mac. Freddie Mac guarantees either ultimate collection or timely payment of all principal payments on the underlying mortgage loans. When Freddie Mac does not guarantee timely payment of principal, Freddie Mac may remit the amount due on account of its guarantee of ultimate payment of principal at any time after default on an underlying mortgage, but in no event later than one year after it becomes payable.
On June 3, 2019, under the FHFA’s “Single Security Initiative,” Fannie Mae and Freddie Mac began issuing uniform mortgage-backed securities (“UMBS”). UMBS are eligible for delivery into the TBA market. Each UMBS has a 55-day remittance cycle and can be used as collateral in either a Fannie Mae or Freddie Mac security or held for investment. Freddie Mac’s legacy TBA-eligible securities have a 45-day remittance cycle and will not be directly eligible for delivery in settlement of a UMBS trade. Freddie Mac will offer investors the opportunity to exchange outstanding legacy mortgage-backed securities for mirror UMBS with a 55-day remittance period. The exchange offer includes compensation for the 10-day delay in receipt of payments. A Fund’s ability to invest in UMBS to the same degree that the Fund currently invests in Fannie Mae and Freddie Mac mortgage-backed securities is uncertain.
While Fannie Mae and Freddie Mac have taken steps for a smooth transition to the issuance of UMBS, the effects of the issuance of UMBS on the MBS and TBA markets are uncertain and there may be factors that affect the timing of the transition to UMBS or the ability of market participants, including a Fund, to adapt to the issuance of UMBS. A Fund may need to consider the tax and accounting issues raised by investments in UMBS and/or the exchange of legacy Freddie Mac securities for UMBS. Additionally, there could be divergence in prepayment rates of UMBS issued by Fannie Mae and Freddie Mac, which could lead to differences in the prices of Fannie Mae- and Freddie Mac-issued UMBS if Fannie Mae and Freddie Mac fail to align programs, policies and practices that affect prepayments. The initial effects of the issuance of UMBS on the market for mortgage-related securities have been relatively minimal, however the long-term effects are still uncertain.
For more information on recent events impacting Fannie Mae and Freddie Mac securities, see “Recent Events Regarding Fannie Mae and Freddie Mac Securities” under the heading “Risk Factors of Mortgage-Related Securities” below.
CMOs and guaranteed REMIC pass-through certificates (“REMIC Certificates”) issued by Fannie Mae, Freddie Mac, Ginnie Mae and private issuers are types of multiple class pass-through securities. Investors may purchase beneficial interests in REMICs, which are known as “regular” interests or “residual” interests. The Funds do not currently intend to purchase residual interests in REMICs. The REMIC Certificates represent beneficial ownership interests in a REMIC Trust, generally consisting of mortgage loans or Fannie Mae, Freddie Mac or Ginnie Mae guaranteed mortgage pass-through certificates (the “Mortgage Assets”). The obligations of Fannie Mae, Freddie Mac or Ginnie Mae under their respective guaranty of the REMIC Certificates are obligations solely of Fannie Mae, Freddie Mac or Ginnie Mae, respectively.
Fannie Mae REMIC Certificates. Fannie Mae REMIC Certificates are issued and guaranteed as to timely distribution of principal and interest by Fannie Mae. In addition, Fannie Mae will be obligated to distribute the principal balance of each class of REMIC Certificates in full, whether or not sufficient funds are otherwise available.
Part II - 40
Freddie Mac REMIC Certificates. Freddie Mac guarantees the timely payment of interest, and also guarantees the payment of principal as payments are required to be made on the underlying mortgage participation certificates (“PCs”). PCs represent undivided interests in specified residential mortgages or participation therein purchased by Freddie Mac and placed in a PC pool. With respect to principal payments on PCs, Freddie Mac generally guarantees ultimate collection of all principal of the related mortgage loans without offset or deduction. Freddie Mac also guarantees timely payment of principal on certain PCs referred to as “Gold PCs.”
Ginnie Mae REMIC Certificates. Ginnie Mae guarantees the full and timely payment of interest and principal on each class of securities (in accordance with the terms of those classes as specified in the related offering circular supplement). The Ginnie Mae guarantee is backed by the full faith and credit of the U.S.
REMIC Certificates issued by Fannie Mae, Freddie Mac and Ginnie Mae are treated as U.S. Government securities for purposes of investment policies.
CMOs and REMIC Certificates provide for the redistribution of cash flow to multiple classes. Each class of CMOs or REMIC Certificates, often referred to as a “tranche,” is issued at a specific adjustable or fixed interest rate and must be fully retired no later than its final distribution date. This reallocation of interest and principal results in the redistribution of prepayment risk across different classes. This allows for the creation of bonds with more or less risk than the underlying collateral exhibits. Principal prepayments on the mortgage loans or the Mortgage Assets underlying the CMOs or REMIC Certificates may cause some or all of the classes of CMOs or REMIC Certificates to be retired substantially earlier than their final distribution dates. Generally, interest is paid or accrues on all classes of CMOs or REMIC Certificates on a monthly basis.
The principal of and interest on the Mortgage Assets may be allocated among the several classes of CMOs or REMIC Certificates in various ways. In certain structures (known as “sequential pay” CMOs or REMIC Certificates), payments of principal, including any principal prepayments, on the Mortgage Assets generally are applied to the classes of CMOs or REMIC Certificates in the order of their respective final distribution dates. Thus, no payment of principal will be made on any class of sequential pay CMOs or REMIC Certificates until all other classes having an earlier final distribution date have been paid in full.
Additional structures of CMOs and REMIC Certificates include, among others, principal only structures, interest only structures, inverse floaters and “parallel pay” CMOs and REMIC Certificates. Certain of these structures may be more volatile than other types of CMO and REMIC structures. Parallel pay CMOs or REMIC Certificates are those which are structured to apply principal payments and prepayments of the Mortgage Assets to two or more classes concurrently on a proportionate or disproportionate basis. These simultaneous payments are taken into account in calculating the final distribution date of each class.
A wide variety of REMIC Certificates may be issued in the parallel pay or sequential pay structures. These securities include accrual certificates (also known as “Z-Bonds”), which only accrue interest at a specified rate until all other certificates having an earlier final distribution date have been retired and are converted thereafter to an interest-paying security, and planned amortization class (“PAC”) certificates, which are parallel pay REMIC Certificates which generally require that specified amounts of principal be applied on each payment date to one or more classes of REMIC Certificates (the “PAC Certificates”), even though all other principal payments and prepayments of the Mortgage Assets are then required to be applied to one or more other classes of the certificates. The scheduled principal payments for the PAC Certificates generally have the highest priority on each payment date after interest due has been paid to all classes entitled to receive interest currently. Shortfalls, if any, are added to the amount of principal payable on the next payment date. The PAC Certificate payment schedule is taken into account in calculating the final distribution date of each class of PAC. In order to create PAC tranches, one or more tranches generally must be created that absorb most of the volatility in the underlying Mortgage Assets. These tranches tend to have market prices and yields that are much more volatile than the PAC classes. The Z-Bonds in which the Funds may invest may bear the same non-credit-related risks as do other types of Z-Bonds. Z-Bonds in which the Fund may invest will not include residual interest.
Total Annual Fund Operating Expenses set forth in the fee table and Financial Highlights section of each Fund’s Prospectuses do not include any expenses associated with investments in certain structured or synthetic products that may rely on the exception for the definition of “investment company” provided by section 3(c)(1) or 3(c)(7) of the 1940 Act.
Part II - 41
GSE Credit Risk Transfer Securities and GSE Credit-Linked Notes. GSE Credit risk transfer securities are notes issued directly by a GSE, such as Fannie Mae and Freddie Mac, and GSE credit-linked notes are notes issued by a SPV sponsored by a GSE. Investors in these notes provide credit protection for the applicable GSE’s mortgage-related securities guarantee obligations. In this regard, a noteholder receives compensation for providing credit protection to the GSE and, when a specified level of losses on the relevant mortgage loans occurs, the principal balance and certain payments owed to the noteholder may be reduced. In addition, noteholders may receive a return of principal prior to the stated maturity date reflecting prepayment on the underlying mortgage loans and in any other circumstances that may be set forth in the applicable loan agreement. The notes may be issued in different tranches representing the issuance of different levels of credit risk protection to the GSE on the underlying mortgage loans and the notes are not secured by the reference mortgage loans. There are important differences between the structure of GSE credit risk transfer securities and GSE credit-linked notes.
GSE Credit Risk Transfer Securities Structure. In this structure, the GSE receives the note sale proceeds. The GSE pays noteholders monthly interest payments and a return of principal on the stated maturity date based on the initial investment amount, as reduced by any covered losses on the reference mortgage loans.
GSE Credit-Linked Notes Structure. In this structure, the SPV receives the note sale proceeds and the SPV’s obligations to the noteholder are collateralized by the note sale proceeds. The SPV invests the proceeds in cash or other short-term assets. The SPV also enters into a credit protection agreement with the GSE pursuant to which the GSE pays the SPV monthly premium payments and the SPV compensates the GSE for covered losses on the reference mortgage loans. The SPV pays noteholders monthly interest payments based on the premium payments paid by the GSE and the performance on the invested note sale proceeds. The noteholders also receive a return of principal on a stated maturity date based on the initial investment amount, as reduced by any covered losses on the reference mortgage loans paid by the SPV or the GSE.
Mortgage TBAs. A Fund may invest in mortgage pass-through securities eligible to be sold in the “to-be-announced” or TBA market (“Mortgage TBAs”). Mortgage TBAs provide for the forward or delayed delivery of the underlying instrument with settlement up to 180 days. The term TBA comes from the fact that the actual mortgage-backed security that will be delivered to fulfill a TBA trade is not designated at the time the trade is made, but rather is generally announced 48 hours before the settlement date. Mortgage TBAs are subject to the risks described in the “When-Issued Securities, Delayed Delivery Securities and Forward Commitments” section. Additionally, amendments to applicable rolls include certain mandatory margin requirements for the TBA market, which may require the Funds to pay collateral in connection with their TBA transactions. The required margin could increase the cost of the Funds and add additional complexity for Funds engaging in these transactions.
Mortgage Dollar Rolls. In a mortgage dollar roll transaction, one party sells mortgage-backed securities, principally Mortgage TBAs, for delivery in the current month and simultaneously contracts with the same counterparty to repurchase similar (same type, coupon and maturity) but not identical securities on a specified future date. When a Fund enters into TBAs/mortgage dollar rolls, under current SEC and staff requirements the Fund will segregate or earmark until the settlement date liquid assets, in an amount equal to the agreed-upon purchase price of each long and short position. Economically offsetting TBA positions with the same agency, coupon, and maturity date, are generally permitted to be netted if the short position settles on the same date or before the long position. During the period between the sale and repurchase in a mortgage dollar roll transaction, the Fund will not be entitled to receive interest and principal payments on securities sold. Losses may arise due to changes in the value of the securities or if the counterparty does not perform under the terms of the agreement. If the counterparty files for bankruptcy or becomes insolvent, the Fund’s right to repurchase or sell securities may be limited. Mortgage dollar rolls may be subject to leverage risks. In addition, mortgage dollar rolls may increase interest rate risk and result in an increased portfolio turnover rate which increases costs and may increase taxable gains. The benefits of mortgage dollar rolls may depend upon a Fund’s Adviser’s ability to predict mortgage prepayments and interest rates. There is no assurance that mortgage dollar rolls can be successfully employed. For purposes of diversification and investment limitations, mortgage dollar rolls are considered to be mortgage-backed securities.
Stripped Mortgage-Backed Securities. Stripped Mortgage-Backed Securities (“SMBS”) are derivative multi-class mortgage securities issued outside the REMIC or CMO structure. SMBS may be issued by agencies or instrumentalities of the U.S. Government, or by private originators of, or investors in, mortgage loans, including savings and loan associations, mortgage banks, commercial banks, investment banks and special purpose entities. SMBS are usually structured with two classes that receive different
Part II - 42
proportions of the interest and principal distributions from a pool of mortgage assets. A common type of SMBS will have one class receiving all of the interest from the mortgage assets (“IOs”), while the other class will receive all of the principal (“POs”). Mortgage IOs receive monthly interest payments based upon a notional amount that declines over time as a result of the normal monthly amortization and unscheduled prepayments of principal on the associated mortgage POs.
In addition to the risks applicable to Mortgage-Related Securities in general, SMBS are subject to the following additional risks:
Prepayment/Interest Rate Sensitivity. SMBS are extremely sensitive to changes in prepayments and interest rates. Even though these securities have been guaranteed by an agency or instrumentality of the U.S. government, under certain interest rate or prepayment rate scenarios, the Funds may lose money on investments in SMBS.
Interest Only SMBS. Changes in prepayment rates can cause the return on investment in IOs to be highly volatile. Under extremely high prepayment conditions, IOs can incur significant losses.
Principal Only SMBS. POs are bought at a discount to the ultimate principal repayment value. The rate of return on a PO will vary with prepayments, rising as prepayments increase and falling as prepayments decrease. Generally, the market value of these securities is unusually volatile in response to changes in interest rates.
Yield Characteristics. Although SMBS may yield more than other mortgage-backed securities, their cash flow patterns are more volatile and there is a greater risk that any premium paid will not be fully recouped. A Fund’s Adviser will seek to manage these risks (and potential benefits) by investing in a variety of such securities and by using certain analytical and hedging techniques.
Privately Issued Mortgage-Related Securities. Non-government issuers, including commercial banks, savings and loan institutions, private mortgage insurance companies, mortgage bankers and other secondary market issuers, also create pass-through pools of conventional residential mortgage loans. Such issuers may be the originators and/or servicers of the underlying mortgage loans as well as the guarantors of the mortgage-related securities. Mortgage pools created by non-governmental issuers generally offer a higher rate of interest than government and government-related pools because there are no direct or indirect government or agency guarantees of payments in the former pools. However, timely payment of interest and principal of these pools may be supported by various forms of insurance of guarantees, including individual loan, title, pool and hazard insurance and letters of credit, which may be issued by governmental entities or private insurers. Such insurance and guarantees and the creditworthiness of the issuers thereof may be considered in determining whether a mortgage-related security meets a Fund’s investment quality standards. There can be no assurance that insurers or guarantors can meet their obligations under the insurance policies or guarantee arrangements.
Privately issued mortgage-related securities may not be subject to the same underwriting requirements for the underlying mortgages that are applicable to those mortgage-related securities that have a government or government-sponsored entity guarantee. As a result, the mortgage loans underlying privately issued mortgage-related securities may have less favorable collateral, credit risk or other underwriting characteristics than government or government-sponsored mortgage-related securities and have wider variances in a number of terms including interest rate, term, size, purpose and borrower characteristics. Mortgage pools underlying privately issued mortgage-related securities may include second mortgages, high loan-to-value ratio mortgages where a government or government-sponsored entity guarantee is not available. The coupon rates and maturities of the underlying mortgage loans in a privately-issued mortgage-related securities pool may vary to a greater extent than those included in a government guaranteed pool, and the pool may include subprime mortgage loans. Subprime loans are loans made to borrowers with low credit ratings or other factors that increase the risk of default. For these reasons, the loans underlying these securities historically have had higher default rates than those loans that meet government underwriting requirements.
The risk of non-payment is greater for mortgage-related securities that are backed by loans that were originated under weak underwriting standards, including loans made to borrowers with limited means to make repayment. A level of risk exists for all loans, although, historically, the poorest performing loans have been those classified as subprime. Other types of privately issued mortgage-related securities, such as those classified as pay-option adjustable rate or Alt-A, at times, have also performed poorly. Even loans classified as prime may experience higher levels of delinquencies and defaults. A decline in real property
Part II - 43
values across the U.S. may exacerbate the level of losses that investors in privately issued mortgage-related securities have experienced. Market factors that may adversely affect mortgage loan repayment include adverse economic conditions, unemployment, a decline in the value of real property, or an increase in interest rates.
Privately issued mortgage-related securities are not traded on an exchange and there may be a limited market for these securities, especially when there is a perceived weakness in the mortgage and real estate market sectors. Without an active trading market, mortgage-related securities held in a Fund’s portfolio may be particularly difficult to value because of the complexities involved in assessing the value of the underlying mortgage loans.
The Funds may purchase privately issued mortgage-related securities that are originated, packaged and serviced by third party entities. Such third parties may have obligations to investors of mortgage-related securities under trust or other documents. For example, loan servicers may be liable to the holder of the mortgage-related securities for negligence or willful misconduct in carrying out their servicing duties. Similarly, loan originators/servicers may make certain representations and warranties regarding the quality of the mortgages and properties underlying a mortgage-related security, which if untrue, may trigger an obligation of the originator/service or its affiliates, as applicable, to repurchase the mortgages from the issuing trust. Although trust and other documents may include protective provisions, investors in certain mortgage-related securities have had limited success in enforcing terms or such agreements against such third parties. In addition, such third parties may have had interests that are in conflict with those holders of the mortgage-related.
For example, to the extent third party entities are involved in litigation relating to the securities, actions may be taken by such third parties that are adverse to the interest of the holders of the mortgage-related securities, including the Funds, such as withholding proceeds due to holders of the mortgage-related securities, to cover legal or related costs. Any such action could result in losses to the Funds.
In addition, certain mortgage-related securities, which may include loans that originally qualified under standards established by government-sponsored entities (for example, certain REMICs that include Fannie Mae mortgages), are not considered as government securities for purposes of a Fund’s investment strategies or policies and may be subject to the same risks as privately-issued mortgage-related securities. There is no government or government-sponsored guarantee for such privately issued investments.
Adjustable Rate Mortgage Loans. Certain Funds may invest in adjustable rate mortgage loans (“ARMs”). ARMs eligible for inclusion in a mortgage pool will generally provide for a fixed initial mortgage interest rate for a specified period of time. Thereafter, the interest rates (the “Mortgage Interest Rates”) may be subject to periodic adjustment based on changes in the applicable index rate (the “Index Rate”). The adjusted rate would be equal to the Index Rate plus a gross margin, which is a fixed percentage spread over the Index Rate established for each ARM at the time of its origination.
Adjustable interest rates can cause payment increases that some borrowers may find difficult to make. However, certain ARMs may provide that the Mortgage Interest Rate may not be adjusted to a rate above an applicable lifetime maximum rate or below an applicable lifetime minimum rate for such ARM. Certain ARMs may also be subject to limitations on the maximum amount by which the Mortgage Interest Rate may adjust for any single adjustment period (the “Maximum Adjustment”). Other ARMs (“Negatively Amortizing ARMs”) may provide instead or as well for limitations on changes in the monthly payment on such ARMs. Limitations on monthly payments can result in monthly payments which are greater or less than the amount necessary to amortize a Negatively Amortizing ARM by its maturity at the Mortgage Interest Rate in effect in any particular month. In the event that a monthly payment is not sufficient to pay the interest accruing on a Negatively Amortizing ARM, any such excess interest is added to the principal balance of the loan, causing negative amortization and will be repaid through future monthly payments. It may take borrowers under Negatively Amortizing ARMs longer periods of time to achieve equity and may increase the likelihood of default by such borrowers. In the event that a monthly payment exceeds the sum of the interest accrued at the applicable Mortgage Interest Rate and the principal payment which would have been necessary to amortize the outstanding principal balance over the remaining term of the loan, the excess (or “accelerated amortization”) further reduces the principal balance of the ARM. Negatively Amortizing ARMs do not provide for the extension of their original maturity to accommodate changes in their Mortgage Interest Rate. As a result, unless there is a periodic recalculation of the payment amount (which there generally is), the final payment may be substantially larger than the other payments. These limitations on periodic increases in interest rates and on changes in monthly payments protect borrowers from unlimited interest rate and payment increases.
Part II - 44
Certain ARMs may provide for periodic adjustments of scheduled payments in order to amortize fully the mortgage loan by its stated maturity. Other ARMs may permit their stated maturity to be extended or shortened in accordance with the portion of each payment that is applied to interest as affected by the periodic interest rate adjustments.
There are two main categories of indices which provide the basis for rate adjustments on ARMs: those based on U.S. Treasury securities and those derived from a calculated measure such as a cost of funds index or a moving average of mortgage rates. Commonly utilized indices include the one-year, three-year and five-year constant maturity Treasury bill rates, the three-month Treasury bill rate, the 180-day Treasury bill rate, rates on longer-term Treasury securities, the 11th District Federal Home Loan Bank Cost of Funds, the National Median Cost of Funds, the one-month, three-month, six-month or one-year LIBOR, the prime rate of a specific bank, or commercial paper rates. Some indices, such as the one-year constant maturity Treasury rate, closely mirror changes in market interest rate levels. Others, such as the 11th District Federal Home Loan Bank Cost of Funds index, tend to lag behind changes in market rate levels and tend to be somewhat less volatile. The degree of volatility in the market value of the Fund’s portfolio and therefore in the net asset value of the Fund’s shares will be a function of the length of the interest rate reset periods and the degree of volatility in the applicable indices.
In general, changes in both prepayment rates and interest rates will change the yield on Mortgage-Backed Securities. The rate of principal prepayments with respect to ARMs has fluctuated in recent years. As is the case with fixed mortgage loans, ARMs may be subject to a greater rate of principal prepayments in a declining interest rate environment. For example, if prevailing interest rates fall significantly, ARMs could be subject to higher prepayment rates than if prevailing interest rates remain constant because the availability of fixed rate mortgage loans at competitive interest rates may encourage mortgagors to refinance their ARMs to “lock-in” a lower fixed interest rate. Conversely, if prevailing interest rates rise significantly, ARMs may prepay at lower rates than if prevailing rates remain at or below those in effect at the time such ARMs were originated. As with fixed rate mortgages, there can be no certainty as to the rate of prepayments on the ARMs in either stable or changing interest rate environments. In addition, there can be no certainty as to whether increases in the principal balances of the ARMs due to the addition of deferred interest may result in a default rate higher than that on ARMs that do not provide for negative amortization.
Other factors affecting prepayment of ARMs include changes in mortgagors’ housing needs, job transfers, unemployment, mortgagors’ net equity in the mortgage properties and servicing decisions.
Risk Factors of Mortgage-Related Securities. The following is a summary of certain risks associated with Mortgage-Related Securities:
Guarantor Risk. There can be no assurance that the U.S. government would provide financial support to Fannie Mae or Freddie Mac if necessary in the future. Although certain mortgage-related securities are guaranteed by a third party or otherwise similarly secured, the market value of the security, which may fluctuate, is not so secured.
Interest Rate Sensitivity. If a Fund purchases a mortgage-related security at a premium, that portion may be lost if there is a decline in the market value of the security whether resulting from changes in interest rates or prepayments in the underlying mortgage collateral. As with other interest-bearing securities, the prices of such securities are inversely affected by changes in interest rates. Although the value of a mortgage-related security may decline when interest rates rise, the converse is not necessarily true since in periods of declining interest rates the mortgages underlying the securities are prone to prepayment. For this and other reasons, a mortgage-related security’s stated maturity may be shortened by unscheduled prepayments on the underlying mortgages and, therefore, it is not possible to predict accurately the security’s return to the Fund. In addition, regular payments received in respect of mortgage-related securities include both interest and principal. No assurance can be given as to the return the Fund will receive when these amounts are reinvested.
Liquidity. The liquidity of certain mortgage-backed securities varies by type of security; at certain times the Fund may encounter difficulty in disposing of such investments. In the past, in stressed markets, certain types of mortgage-backed securities suffered periods of illiquidity when disfavored by the market. It is possible that the Fund may be unable to sell a mortgage-backed security at a desirable time or at the value the Fund has placed on the investment.
Part II - 45
Market Value. The market value of the Fund’s adjustable rate Mortgage-Backed Securities may be adversely affected if interest rates increase faster than the rates of interest payable on such securities or by the adjustable rate mortgage loans underlying such securities. Furthermore, adjustable rate Mortgage-Backed Securities or the mortgage loans underlying such securities may contain provisions limiting the amount by which rates may be adjusted upward and downward and may limit the amount by which monthly payments may be increased or decreased to accommodate upward and downward adjustments in interest rates. When the market value of the properties underlying the Mortgage-Backed Securities suffer broad declines on a regional or national level, the values of the corresponding Mortgage-Backed Securities or Mortgage-Backed Securities as a whole, may be adversely affected as well.
Prepayments. Adjustable rate Mortgage-Backed Securities have less potential for capital appreciation than fixed rate Mortgage-Backed Securities because their coupon rates will decline in response to market interest rate declines. The market value of fixed rate Mortgage-Backed Securities may be adversely affected as a result of increases in interest rates and, because of the risk of unscheduled principal prepayments, may benefit less than other fixed rate securities of similar maturity from declining interest rates. Finally, to the extent Mortgage-Backed Securities are purchased at a premium, mortgage foreclosures and unscheduled principal prepayments may result in some loss of the Fund’s principal investment to the extent of the premium paid. On the other hand, if such securities are purchased at a discount, both a scheduled payment of principal and an unscheduled prepayment of principal will increase current and total returns and will accelerate the recognition of income.
Yield Characteristics. The yield characteristics of Mortgage-Backed Securities differ from those of traditional fixed income securities. The major differences typically include more frequent interest and principal payments, usually monthly, and the possibility that prepayments of principal may be made at any time. Prepayment rates are influenced by changes in current interest rates and a variety of economic, geographic, social and other factors and cannot be predicted with certainty. As with fixed rate mortgage loans, adjustable rate mortgage loans may be subject to a greater prepayment rate in a declining interest rate environment. The yields to maturity of the Mortgage-Backed Securities in which the Funds invest will be affected by the actual rate of payment (including prepayments) of principal of the underlying mortgage loans. The mortgage loans underlying such securities generally may be prepaid at any time without penalty. In a fluctuating interest rate environment, a predominant factor affecting the prepayment rate on a pool of mortgage loans is the difference between the interest rates on the mortgage loans and prevailing mortgage loan interest rates taking into account the cost of any refinancing. In general, if mortgage loan interest rates fall sufficiently below the interest rates on fixed rate mortgage loans underlying mortgage pass-through securities, the rate of prepayment would be expected to increase. Conversely, if mortgage loan interest rates rise above the interest rates on the fixed rate mortgage loans underlying the mortgage pass-through securities, the rate of prepayment may be expected to decrease.
Recent Events Regarding Fannie Mae and Freddie Mac Securities. On September 6, 2008, the Federal Housing Finance Agency (“FHFA”) placed Fannie Mae and Freddie Mac into conservatorship. As the conservator, FHFA succeeded to all rights, titles, powers and privileges of Fannie Mae and Freddie Mac and of any stockholder, officer or director of Fannie Mae and Freddie Mac with respect to Fannie Mae and Freddie Mac and the assets of Fannie Mae and Freddie Mac. In connection with the conservatorship, the U.S. Treasury entered into a Senior Preferred Stock Purchase Agreement (“SPA”) with each of Fannie Mae and Freddie Mac pursuant to which the U.S. Treasury agreed to purchase 1,000,000 shares of senior preferred stock with an initial liquidation preference of $1 billion and obtained warrants and options to for the purchase of common stock of each of Fannie Mae and Freddie Mac. Under the SPAs as currently amended, the U.S. Treasury has pledged to provide financial support to a GSE in any quarter in which the GSE has a net worth deficit as defined in the respective SPA. The SPAs contain various covenants that severely limit each enterprise’s operations.
The conditions attached to entering into the SPAs place significant restrictions on the activities of Freddie Mac and Fannie Mae. Freddie Mac and Fannie Mae must obtain the consent of the U.S. Treasury to, among other things, (i) make any payment to purchase or redeem its capital stock or pay any dividend other than in respect of the senior preferred stock, (ii) issue capital stock of any kind, (iii) terminate the conservatorship of the FHFA except in connection with a receivership, or (iv) increase its debt beyond certain specified levels. Under a letter agreement entered into in January 2021, each enterprise is permitted to retain earnings and raise private capital to enable them to meet the minimum capital requirements under the FHFA’s Enterprise Regulatory Capital Framework. The letter agreement also permits each enterprise to develop a plan to exit conservatorship, but may not do so until litigation involving the conservatorships is resolved and each enterprise has the minimum capital required by FHFA’s rules. In addition, significant restrictions are placed on the maximum size of each of Freddie Mac’s
Part II - 46
and Fannie Mae’s respective portfolios of mortgages and MBS, and the purchase agreements entered into by Freddie Mac and Fannie Mae provide that the maximum size of their portfolios of these assets must decrease by a specified percentage each year. The future status and role of Freddie Mac and Fannie Mae could be impacted by (among other things) the actions taken and restrictions placed on Freddie Mac and Fannie Mae by the FHFA in its role as conservator, the restrictions placed on Freddie Mac’s and Fannie Mae’s operations and activities as a result of the senior preferred stock investment made by the U.S. Treasury, market responses to developments at Freddie Mac and Fannie Mae, and future legislative and regulatory action that alters the operations, ownership, structure and/or mission of these institutions, each of which may, in turn, impact the value of, and cash flows on, any MBS guaranteed by Freddie Mac and Fannie Mae, including any such MBS held by a Fund.
Fannie Mae and Freddie Mac are continuing to operate as going concerns while in conservatorship and each remains liable for all of its obligations, including its guaranty obligations, associated with its mortgage-backed securities. The SPAs are intended to enhance each of Fannie Mae’s and Freddie Mac’s ability to meet its obligations. The FHFA has indicated that the conservatorship of each enterprise will end when the director of FHFA determines that FHFA’s plan to restore the enterprise to a safe and solvent condition has been completed. The FHFA recently announced plans to consider taking Fannie Mae and Freddie Mac out of conservatorship and has begun a multi-step process, including its first pricing review of Fannie Mae and Freddie Mac products since 2015, to unwind the GSEs from government control. Should Fannie Mae and Freddie Mac be taken out of conservatorship, it is unclear whether the U.S. Treasury would continue to enforce its rights or perform its obligations under the Senior Preferred Stock Purchase Agreement. It is also unclear how the capital structure of Fannie Mae and Freddie Mac would be constructed post-conservatorship, and what effects, if any, the privatization of Fannie Mae and Freddie Mac will have on their creditworthiness and guarantees of certain mortgage-backed securities. Accordingly, should the FHFA take Fannie Mae and Freddie Mac out of conservatorship, there could be an adverse impact on the value of their securities, which could cause a Fund’s investments to lose value.
Risks Related to GSE Credit Risk Transfer Securities and GSE Credit-Linked Notes. GSE Credit risk transfer securities are general obligations issued by a GSE and are unguaranteed and unsecured. GSE Credit-linked notes are similar, except that the notes are issued by an SPV, rather than by a GSE, and the obligations of the SPV are collateralized by the note proceeds as invested by the SPV, which are invested in cash or short-term securities. Although both GSE credit risk transfer securities and GSE credit-linked notes are unguaranteed, obligations of an SPV are also not backstopped by the Department of Treasury or an obligation of a GSE.
The risks associated with these investments are different than the risks associated with an investment in mortgage-backed securities issued by GSEs or a private issuer. For example, in the event of a default on the obligations to noteholders, noteholders such as the Funds have no recourse to the underlying mortgage loans. In addition, some or all of the mortgage default risk associated with the underlying mortgage loans is transferred to noteholders. As a result, there can be no assurance that losses will not occur on an investment in GSE credit risk transfer securities or GSE credit-linked notes and Funds investing in these instruments may be exposed to the risk of loss on their investment. In addition, these investments are subject to prepayment risk.
In the case of GSE credit-linked notes, if a GSE fails to make a premium or other required payment to the SPV, the SPV may be unable to pay a noteholder the entire amount of interest or principal payable to the noteholder. In the event of a default on the obligations to noteholders, the SPV’s principal and interest payment obligations to noteholders will be subordinated to the SPV’s credit protection payment obligations to the GSE. Payment of such amounts to noteholders depends on the cash available in the trust from the loan proceeds and the GSE’s premium payments.
Any income earned by the SPV on investments of loan proceeds is expected to be less than the interest payments amounts to be paid to noteholders of the GSE credit-linked notes and interest payments to noteholders will be reduced if the GSE fails to make premium payments to the SPV. An SPV’s investment of loan proceeds may also be concentrated in the securities of a few number of issuers. A noteholder bears any investment losses on the allocable portion of the loan proceeds.
An SPV that issues GSE credit-linked notes may fall within the definition of a “commodity pool” under the Commodity Exchange Act. Certain GSEs are not registered as commodity pool operators in reliance on CFTC no-action relief, subject to certain conditions similar to those under CFTC Rule 4.13(a)(3), which respect to the operation of the SPV. If the GSE or SPV fails to comply with such conditions, noteholders that are investment vehicles, such as the Funds, may need to register as a CPO, which could cause such a Fund to incur increased costs.
Part II - 47
Municipal Securities
Municipal Securities are issued to obtain funds for a wide variety of reasons. For example, municipal securities may be issued to obtain funding for the construction of a wide range of public facilities such as:
1.
bridges;
2.
highways;
3.
roads;
4.
schools;
5.
waterworks and sewer systems; and
6.
other utilities.
Other public purposes for which Municipal Securities may be issued include:
1.
refunding outstanding obligations;
2.
obtaining funds for general operating expenses; and
3.
obtaining funds to lend to other public institutions and facilities.
In addition, certain debt obligations known as “Private Activity Bonds” may be issued by or on behalf of municipalities and public authorities to obtain funds to provide:
1.
water, sewage and solid waste facilities;
2.
qualified residential rental projects;
3.
certain local electric, gas and other heating or cooling facilities;
4.
qualified hazardous waste facilities;
5.
high-speed intercity rail facilities;
6.
governmentally-owned airports, docks and wharves and mass transportation facilities;
7.
qualified mortgages;
8.
student loan and redevelopment bonds; and
9.
bonds used for certain organizations exempt from Federal income taxation.
Certain debt obligations known as “Industrial Development Bonds” under prior Federal tax law may have been issued by or on behalf of public authorities to obtain funds to provide:
1.
privately operated housing facilities;
2.
sports facilities;
3.
industrial parks;
4.
convention or trade show facilities;
5.
airport, mass transit, port or parking facilities;
6.
air or water pollution control facilities;
7.
sewage or solid waste disposal facilities; and
8.
facilities for water supply.
Other private activity bonds and industrial development bonds issued to fund the construction, improvement, equipment or repair of privately-operated industrial, distribution, research, or commercial facilities may also be Municipal Securities, however the size of such issues is limited under current and prior Federal tax law. The aggregate amount of most private activity bonds and industrial development bonds is limited (except in the case of certain types of facilities) under Federal tax law by an annual “volume cap.” The volume cap limits the annual aggregate principal amount of such obligations issued by or on behalf of all governmental instrumentalities in the state.
Part II - 48
The two principal classifications of Municipal Securities consist of “general obligation” and “limited” (or revenue) issues. General obligation bonds are obligations involving the credit of an issuer possessing taxing power and are payable from the issuer’s general unrestricted revenues and not from any particular fund or source. The characteristics and method of enforcement of general obligation bonds vary according to the law applicable to the particular issuer, and payment may be dependent upon appropriation by the issuer’s legislative body. Limited obligation bonds are payable only from the revenues derived from a particular facility or class of facilities or, in some cases, from the proceeds of a special excise or other specific revenue source. Private activity bonds and industrial development bonds generally are revenue bonds and thus not payable from the unrestricted revenues of the issuer. The credit and quality of such bonds is generally related to the credit of the bank selected to provide the letter of credit underlying the bond. Payment of principal of and interest on industrial development revenue bonds is the responsibility of the corporate user (and any guarantor).
The Funds may also acquire “moral obligation” issues, which are normally issued by special purpose authorities, and in other tax-exempt investments including pollution control bonds and tax-exempt commercial paper. Each Fund that may purchase municipal bonds may purchase:
1.
Short-term tax-exempt General Obligations Notes;
2.
Tax Anticipation Notes;
3.
Bond Anticipation Notes;
4.
Revenue Anticipation Notes;
5.
Project Notes; and
6.
Other forms of short-term tax-exempt loans.
Such notes are issued with a short-term maturity in anticipation of the receipt of tax funds, the proceeds of bond placements, or other revenues. Project Notes are issued by a state or local housing agency and are sold by the Department of Housing and Urban Development. While the issuing agency has the primary obligation with respect to its Project Notes, they are also secured by the full faith and credit of the U.S. through agreements with the issuing authority which provide that, if required, the Federal government will lend the issuer an amount equal to the principal of and interest on the Project Notes.
There are, of course, variations in the quality of Municipal Securities, both within a particular classification and between classifications. Also, the yields on Municipal Securities depend upon a variety of factors, including:
1.
general money market conditions;
2.
coupon rate;
3.
the financial condition of the issuer;
4.
general conditions of the municipal bond market;
5.
the size of a particular offering;
6.
the maturity of the obligations; and
7.
the rating of the issue.
The ratings of Moody’s and S&P represent their opinions as to the quality of Municipal Securities. However, ratings are general and are not absolute standards of quality. Municipal Securities with the same maturity, interest rate and rating may have different yields while Municipal Securities of the same maturity and interest rate with different ratings may have the same yield. Subsequent to its purchase by a Fund, an issue of Municipal Securities may cease to be rated or its rating may be reduced below the minimum rating required for purchase by the Fund. The Adviser will consider such an event in determining whether the Fund should continue to hold the obligations.
Municipal Securities may include obligations of municipal housing authorities and single-family mortgage revenue bonds. Weaknesses in Federal housing subsidy programs and their administration may result in a decrease of subsidies available for payment of principal and interest on housing authority bonds. Economic developments, including fluctuations in interest rates and increasing construction and operating costs, may also adversely impact revenues of housing authorities. In the case of some housing authorities, inability to obtain additional financing could also reduce revenues available to pay existing obligations.
Part II - 49
Single-family mortgage revenue bonds are subject to extraordinary mandatory redemption at par in whole or in part from the proceeds derived from prepayments of underlying mortgage loans and also from the unused proceeds of the issue within a stated period which may be within a year from the date of issue.
Municipal leases are obligations issued by state and local governments or authorities to finance the acquisition of equipment and facilities. They may take the form of a lease, an installment purchase contract, a conditional sales contract, or a participation interest in any of the above.
Premium Securities. During a period of declining interest rates, many Municipal Securities in which the Funds invest likely will bear coupon rates higher than current market rates, regardless of whether the securities were initially purchased at a premium.
Risk Factors in Municipal Securities. The following is a summary of certain risks associated with Municipal Securities
Tax Risk. The Code imposes certain continuing requirements on issuers of tax-exempt bonds regarding the use, expenditure and investment of bond proceeds and the payment of rebates to the U.S. Failure by the issuer to comply subsequent to the issuance of tax-exempt bonds with certain of these requirements could cause interest on the bonds to become includable in gross income retroactive to the date of issuance.
Housing Authority Tax Risk. The exclusion from gross income for Federal income tax purposes for certain housing authority bonds depends on qualification under relevant provisions of the Code and on other provisions of Federal law. These provisions of Federal law contain requirements relating to the cost and location of the residences financed with the proceeds of the single-family mortgage bonds and the income levels of tenants of the rental projects financed with the proceeds of the multi-family housing bonds. Typically, the issuers of the bonds, and other parties, including the originators and servicers of the single-family mortgages and the owners of the rental projects financed with the multi-family housing bonds, covenant to meet these requirements. However, there is no assurance that the requirements will be met. If such requirements are not met:
•
the interest on the bonds may become taxable, possibly retroactively from the date of issuance;
•
the value of the bonds may be reduced;
•
you and other Shareholders may be subject to unanticipated tax liabilities;
•
a Fund may be required to sell the bonds at the reduced value;
•
it may be an event of default under the applicable mortgage;
•
the holder may be permitted to accelerate payment of the bond; and
•
the issuer may be required to redeem the bond.
In addition, if the mortgage securing the bonds is insured by the Federal Housing Administration (“FHA”), the consent of the FHA may be required before insurance proceeds would become payable.
Information Risk. Information about the financial condition of issuers of Municipal Securities may be less available than that of corporations having a class of securities registered under the SEC.
State and Federal Laws. An issuer’s obligations under its Municipal Securities are subject to the provisions of bankruptcy, insolvency, and other laws affecting the rights and remedies of creditors. These laws may extend the time for payment of principal or interest, or restrict the Fund’s ability to collect payments due on Municipal Securities. In addition, recent amendments to some statutes governing security interests (e.g., Revised Article 9 of the Uniform Commercial Code (“UCC”)) change the way in which security interests and liens securing Municipal Securities are perfected. These amendments may have an adverse impact on existing Municipal Securities (particularly issues of Municipal Securities that do not have a corporate trustee who is responsible for filing UCC financing statements to continue the security interest or lien).
Litigation and Current Developments. Litigation or other conditions may materially and adversely affect the power or ability of an issuer to meet its obligations for the payment of interest on and principal of its Municipal Securities. Such litigation or conditions may from time to time have the effect of introducing uncertainties in the market for tax-exempt obligations, or may materially affect the credit risk with respect
Part II - 50
to particular bonds or notes. Adverse economic, business, legal or political developments might affect all or a substantial portion of a Fund’s Municipal Securities in the same manner. Given the recent bankruptcy-type proceedings by the Commonwealth of Puerto Rico, risks associated with municipal obligations are heightened.
New Legislation. From time to time, proposals have been introduced before Congress for the purpose of restricting or eliminating the federal income tax exemption for interest on tax exempt bonds, and similar proposals may be introduced in the future. The Supreme Court has held that Congress has the constitutional authority to enact such legislation. It is not possible to determine what effect the adoption of such proposals could have on (i) the availability of Municipal Securities for investment by the Funds, and (ii) the value of the investment portfolios of the Funds.
Limitations on the Use of Municipal Securities. Certain Funds may invest in Municipal Securities if the Adviser determines that such Municipal Securities offer attractive yields. The Funds may invest in Municipal Securities either by purchasing them directly or by purchasing certificates of accrual or similar instruments evidencing direct ownership of interest payments or principal payments, or both, on Municipal Securities, provided that, in the opinion of counsel to the initial seller of each such certificate or instrument, any discount accruing on such certificate or instrument that is purchased at a yield not greater than the coupon rate of interest on the related Municipal Securities will to the same extent as interest on such Municipal Securities be exempt from federal income tax and state income tax (where applicable) and not be treated as a preference item for individuals for purposes of the federal alternative minimum tax. The Funds may also invest in Municipal Securities by purchasing from banks participation interests in all or part of specific holdings of Municipal Securities. Such participation interests may be backed in whole or in part by an irrevocable letter of credit or guarantee of the selling bank. The selling bank may receive a fee from a Fund in connection with the arrangement. Each Fund will limit its investment in municipal leases to no more than 5% of its total assets.
Options and Futures Transactions
A Fund may purchase and sell (a) exchange traded and OTC put and call options on securities, on indexes of securities and other types of instruments, and on futures contracts on securities and indexes of securities and other instruments such as interest rate futures and global interest rate futures and (b) futures contracts on securities and other types of instruments and on indexes of securities and other types of instruments. Each of these instruments is a derivative instrument as its value derives from the underlying asset or index.
Subject to its investment objective and policies, a Fund may use futures contracts and options for hedging and risk management purposes and to seek to enhance portfolio performance.
Options and futures contracts may be used to manage a Fund’s exposure to changing interest rates and/or security prices. Some options and futures strategies, including selling futures contracts and buying puts, tend to hedge a Fund’s investments against price fluctuations. Other strategies, including buying futures contracts and buying calls, tend to increase market exposure. Options and futures contracts may be combined with each other or with forward contracts in order to adjust the risk and return characteristics of a Fund’s overall strategy in a manner deemed appropriate by the Fund’s Adviser and consistent with the Fund’s objective and policies. Because combined options positions involve multiple trades, they result in higher transaction costs and may be more difficult to open and close out.
The use of options and futures is a highly specialized activity which involves investment strategies and risks different from those associated with ordinary portfolio securities transactions, and there can be no guarantee that their use will increase a Fund’s return. While the use of these instruments by a Fund may reduce certain risks associated with owning its portfolio securities, these techniques themselves entail certain other risks. If a Fund’s Adviser applies a strategy at an inappropriate time or judges market conditions or trends incorrectly, options and futures strategies may lower a Fund’s return. Certain strategies limit a Fund’s possibilities to realize gains, as well as its exposure to losses. A Fund could also experience losses if the prices of its options and futures positions were poorly correlated with its other investments, or if it could not close out its positions because of an illiquid secondary market. In addition, the Fund will incur transaction costs, including trading commissions and option premiums, in connection with its futures and options transactions, and these transactions could significantly increase the Fund’s turnover rate.
Certain Funds have filed a notice under the Commodity Exchange Act under Regulation 4.5 and are operated by a person that has claimed an exclusion from the definition of the term “commodity pool operator” under the Commodity Exchange Act and, therefore, is not subject to registration or regulation as a commodity pool operator under the Commodity Exchange Act. Certain other Funds may rely on no
Part II - 51
action relief issued by the CFTC. For Funds that cannot rely on an exclusion from the definition of commodity pool operator, or no action relief from the CFTC, the Adviser is subject to regulation as a commodity pool operator.
Purchasing Put and Call Options. By purchasing a put option, a Fund obtains the right (but not the obligation) to sell the instrument underlying the option at a fixed strike price. In return for this right, a Fund pays the current market price for the option (known as the option premium). Options have various types of underlying instruments, including specific securities, indexes of securities, indexes of securities prices, and futures contracts. A Fund may terminate its position in a put option it has purchased by allowing it to expire or by exercising the option. A Fund may also close out a put option position by entering into an offsetting transaction, if a liquid market exists. If the option is allowed to expire, a Fund will lose the entire premium it paid. If a Fund exercises a put option on a security, it will sell the instrument underlying the option at the strike price. If a Fund exercises an option on an index, settlement is in cash and does not involve the actual purchase or sale of securities. If an option is American style, it may be exercised on any day up to its expiration date. A European style option may be exercised only on its expiration date.
The buyer of a typical put option can expect to realize a gain if the value of the underlying instrument falls substantially. However, if the price of the instrument underlying the option does not fall enough to offset the cost of purchasing the option, a put buyer can expect to suffer a loss (limited to the amount of the premium paid, plus related transaction costs).
The features of call options are essentially the same as those of put options, except that the purchaser of a call option obtains the right to purchase, rather than sell, the instrument underlying the option at the option’s strike price. A call buyer typically attempts to participate in potential price increases of the instrument underlying the option with risk limited to the cost of the option if security prices fall. At the same time, the buyer can expect to suffer a loss if security prices do not rise sufficiently to offset the cost of the option.
Selling (Writing) Put and Call Options on Securities. When a Fund writes a put option on a security, it takes the opposite side of the transaction from the option’s purchaser. In return for the receipt of the premium, a Fund assumes the obligation to pay the strike price for the security underlying the option if the other party to the option chooses to exercise it. A Fund may seek to terminate its position in a put option it writes before exercise by purchasing an offsetting option in the market at its current price. If the market is not liquid for a put option a Fund has written, however, it must continue to be prepared to pay the strike price while the option is outstanding, regardless of price changes, and must continue to post margin as discussed below. If the market value of the underlying securities does not move to a level that would make exercise of the option profitable to its holder, the option will generally expire unexercised, and the Fund will realize as profit the premium it received.
If the price of the underlying securities rises, a put writer would generally expect to profit, although its gain would be limited to the amount of the premium it received. If security prices remain the same over time, it is likely that the writer will also profit, because it should be able to close out the option at a lower price. If security prices fall, the put writer would expect to suffer a loss. This loss should be less than the loss from purchasing and holding the underlying security directly, however, because the premium received for writing the option should offset a portion of the decline.
Writing a call option obligates a Fund to sell or deliver the option’s underlying security in return for the strike price upon exercise of the option. The characteristics of writing call options are similar to those of writing put options, except that writing calls generally is a profitable strategy if prices remain the same or fall. Through receipt of the option premium a call writer offsets part of the effect of a price decline. At the same time, because a call writer must be prepared to deliver the underlying instrument in return for the strike price, even if its current value is greater, a call writer gives up some ability to participate in security price increases.
When a Fund writes an exchange traded put or call option on a security, it will be required to deposit cash or securities or a letter of credit as margin and to make mark to market payments of variation margin as the position becomes unprofitable.
Certain Funds will usually sell covered call options or cash-secured put options on securities. A call option is covered if the writer either owns the underlying security (or comparable securities satisfying the cover requirements of the securities exchanges) or has the right to acquire such securities. Alternatively, a Fund will segregate or earmark liquid assets (i) in an amount equal to the Fund’s obligation under the contract with respect to call options or (ii) an amount greater of the market value of the instrument
Part II - 52
underlying the option or the strike price of the contract with respect to call options. A call option is also covered if a Fund (i) acquires a call option on the same security with a strike price equal to or lower than the strike price of the written call or (ii) acquires a call option on the same security with a strike price higher than the strike price of the written call and segregates liquid assets in an amount equal to the difference between the strike price of the two options. As the writer of a covered call option, the Fund foregoes, during the option’s life, the opportunity to profit from increases in the market value of the security covering the call option above the sum of the premium and the strike price of the call, but has retained the risk of loss should the price of the underlying security decline. As the Fund writes covered calls over more of its portfolio, its ability to benefit from capital appreciation becomes more limited. The writer of an option has no control over the time when it may be required to fulfill its obligation, but may terminate its position by entering into an offsetting option. Once an option writer has received an exercise notice, it cannot effect an offsetting transaction in order to terminate its obligation under the option and must deliver the underlying security at the exercise price.
A put option is cash-secured if the writer segregates cash, high-grade short-term debt obligations, or other permissible collateral equity to the exercise price. Alternatively, a put option is covered if a Fund (i) acquires a put option on the same security with a strike price equal to or higher than the strike price of written put or (ii) acquires a put option on the same security with a strike price lower than the strike price of the written put and segregates liquid assets in the amount equal to the difference between the strike price of the two options. When the Fund writes cash-secured put options, it bears the risk of loss if the value of the underlying stock declines below the exercise price minus the put premium. If the option is exercised, the Fund could incur a loss if it is required to purchase the stock underlying the put option at a price greater than the market price of the stock at the time of exercise plus the put premium the Fund received when it wrote the option. While the Fund’s potential gain in writing a cash-secured put option is limited to distributions earned on the liquid assets securing the put option plus the premium received from the purchaser of the put option, the Fund risks a loss equal to the entire exercise price of the option minus the put premium.
Engaging in Straddles and Spreads. In a straddle transaction, a Fund either buys a call and a put or sells a call and a put on the same security. In a spread, a Fund purchases and sells a call or a put. A Fund will sell a straddle when the Fund’s Adviser believes the price of a security will be stable. The Fund will receive a premium on the sale of the put and the call. A spread permits a Fund to make a hedged investment that the price of a security will increase or decline.
Options on Indexes. Certain Funds may purchase and sell options on securities indexes and other types of indexes. Options on indexes are similar to options on securities, except that the exercise of index options may be settled by cash payments (or in some instances by a futures contract) and does not involve the actual purchase or sale of securities or the instruments in the index. In addition, these options are designed to reflect price fluctuations in a group of securities or instruments or segment of the securities’ or instruments’ market rather than price fluctuations in a single security or instrument. A Fund, in purchasing or selling index options, is subject to the risk that the value of its portfolio may not change as much as an index because a Fund’s investments generally will not match the composition of an index. Unlike call options on securities, index options are cash settled, or settled with a futures contract in some instances, rather than settled by delivery of the underlying index securities or instruments.
Certain Funds purchase and sell credit options which are options on indexes of derivative instruments such as credit default swap indexes. Like other index options, credit options can be cash settled or settled with a futures contract in some instances. In addition, credit options can also be settled in some instances by delivery of the underlying index instrument. Credit options may be used for a variety of purposes including hedging, risk management such as positioning a portfolio for anticipated volatility or increasing income or gain to a Fund. There is no guarantee that the strategy of using options on indexes or credit options in particular will be successful.
Under current SEC and staff requirements, Funds that sell (write) call and put options on indexes are required to segregate or earmark liquid assets in the amount equal to the market value of the obligation. Alternatively, written call options on indexes may be covered if a Fund (i) acquires a call option for the same securities indexes with a strike price equal to or lower than the strike price of the written call or (ii) acquires a call option on the same securities indexes with a strike price higher than the strike price of the written call and segregates liquid assets in an amount equal to the difference between the strike price of the two options. Written put options on indexes may be covered if a Fund (i) acquires a put option for the same
Part II - 53
securities indexes with a strike price equal to or higher than the strike price of the written put or (ii) acquires a put option on the same securities indexes with a strike price lower than the strike price of the written put and segregates liquid assets in the amount equal to the difference between the strike price of the two options.
For a number of reasons, a liquid market may not exist and thus a Fund may not be able to close out an option position that it has previously entered into. When a Fund purchases an OTC option (as defined below), it will be relying on its counterparty to perform its obligations and the Fund may incur additional losses if the counterparty is unable to perform.
Exchange-Traded and OTC Options. All options purchased or sold by a Fund will be traded on a securities exchange or will be purchased or sold by securities dealers (“OTC options”) that meet the Fund’s creditworthiness standards. While exchange-traded options are obligations of the Options Clearing Corporation, in the case of OTC options, a Fund relies on the dealer from which it purchased the option to perform if the option is exercised. Thus, when a Fund purchases an OTC option, it relies on the dealer from which it purchased the option to make or take delivery of the underlying securities. Failure by the dealer to do so would result in the loss of the premium paid by a Fund as well as loss of the expected benefit of the transaction. Accordingly, these OTC options are subject to heightened credit risk, as well as liquidity and valuation risk depending upon the type of OTC options in which the Fund invests.
Futures Contracts. When a Fund purchases a futures contract, it agrees to purchase a specified quantity of an underlying instrument at a specified future date or, in the case of an index futures contract, to make a cash payment based on the value of a securities index. When a Fund sells a futures contract, it agrees to sell a specified quantity of the underlying instrument at a specified future date or, in the case of an index futures contract, to receive a cash payment based on the value of a securities index. The price at which the purchase and sale will take place is fixed when a Fund enters into the contract. Futures can be held until their delivery dates or the position can be (and normally is) closed out before then. There is no assurance, however, that a liquid market will exist when the Fund wishes to close out a particular position.
When a Fund purchases a futures contract, the value of the futures contract tends to increase and decrease in tandem with the value of its underlying instrument. Therefore, purchasing futures contracts will tend to increase a Fund’s exposure to positive and negative price fluctuations in the underlying instrument, much as if it had purchased the underlying instrument directly. When a Fund sells a futures contract, by contrast, the value of its futures position will tend to move in a direction contrary to the value of the underlying instrument. Selling futures contracts, therefore, will tend to offset both positive and negative market price changes, much as if the underlying instrument had been sold.
The purchaser or seller of a futures contract is not required to deliver or pay for the underlying instrument unless the contract is held until the delivery date. However, when a Fund buys or sells a futures contract, it will be required to deposit “initial margin” with a futures commission merchant (“FCM”). Initial margin deposits are typically equal to a small percentage of the contract’s value. If the value of either party’s position declines, that party will be required to make additional “variation margin” payments equal to the change in value on a daily basis.
The party that has a gain may be entitled to receive all or a portion of this amount. A Fund may be obligated to make payments of variation margin at a time when it is disadvantageous to do so. Furthermore, it may not always be possible for a Fund to close out its futures positions. Until it closes out a futures position, a Fund will be obligated to continue to pay variation margin. Initial and variation margin payments do not constitute purchasing on margin for purposes of a Fund’s investment restrictions. In the event of the bankruptcy of an FCM that holds margin on behalf of a Fund, the Fund may be entitled to return of margin owed to it only in proportion to the amount received by the FCM’s other customers, potentially resulting in losses to the Fund. Under current SEC and staff requirements for cash-settled futures, the Fund will segregate or earmark liquid assets in an amount equal to the mark-to-market value. For physically settled futures, the Funds generally will earmark or segregate liquid assets in an amount equal to the notional value. Futures contracts will be treated as cash-settled for asset segregation purposes when a Fund and/or its Cayman subsidiary have entered into a contractual arrangement (each, a “side letter”) with a third party FCM or other counterparty to off-set the Fund’s or Subsidiary’s exposure under the contract and, failing that, to assign its delivery obligation under the contract to the FCM or counterparty. In calculating the segregation amount, netting of similar contracts is generally permitted. Such assets cannot be sold while the futures contract or option is outstanding unless they are replaced with other suitable assets. By setting aside assets equal only to its net obligation under cash-settled futures or under physically-settled futures for which a Fund and/or its Cayman subsidiary have entered into a side letter, a Fund will have the ability to have exposure to such instruments to a greater extent than if a Fund
Part II - 54
were required to set aside assets equal to the full notional value of such contracts. There is a possibility that earmarking and reservation of a large percentage of a Fund’s assets could impede portfolio management or a Fund’s ability to meet redemption requests or other current obligations.
The Funds only invest in futures contracts on securities to the extent they could invest in the underlying securities directly. Certain Funds may also invest in index futures where the underlying securities or instruments are not available for direct investments by the Funds.
Cash Equitization. The objective where equity futures are used to “equitize” cash is to match the notional value of all futures contracts to a Fund’s cash balance. The notional values of the futures contracts and of the cash are monitored daily. As the cash is invested in securities and/or paid out to participants in redemptions, the Adviser simultaneously adjusts the futures positions. Through such procedures, a Fund not only gains equity exposure from the use of futures, but also benefits from increased flexibility in responding to client cash flow needs. Additionally, because it can be less expensive to trade a list of securities as a package or program trade rather than as a group of individual orders, futures provide a means through which transaction costs can be reduced. Such non-hedging risk management techniques involve leverage, and thus present, as do all leveraged transactions, the possibility of losses as well as gains that are greater than if these techniques involved the purchase and sale of the securities themselves rather than their synthetic derivatives.
Options on Futures Contracts. Futures contracts obligate the buyer to take and the seller to make delivery at a future date of a specified quantity of a financial instrument or an amount of cash based on the value of a securities or other index. Currently, futures contracts are available on various types of securities, including but not limited to U.S. Treasury bonds, notes and bills, Eurodollar certificates of deposit and on indexes of securities. Unlike a futures contract, which requires the parties to buy and sell a security or make a cash settlement payment based on changes in a financial instrument or securities or other index on an agreed date, an option on a futures contract entitles its holder to decide on or before a future date whether to enter into such a contract. If the holder decides not to exercise its option, the holder may close out the option position by entering into an offsetting transaction or may decide to let the option expire and forfeit the premium thereon. The purchaser of an option on a futures contract pays a premium for the option but makes no initial margin payments or daily payments of cash in the nature of “variation margin” payments to reflect the change in the value of the underlying contract as does a purchaser or seller of a futures contract. The seller of an option on a futures contract receives the premium paid by the purchaser and may be required to pay initial margin.
Combined Positions. Certain Funds may purchase and write options in combination with futures or forward contracts, to adjust the risk and return characteristics of the overall position. For example, a Fund may purchase a put option and write a call option on the same underlying instrument, in order to construct a combined position whose risk and return characteristics are similar to selling a futures contract. Another possible combined position would involve writing a call option at one strike price and buying a call option at a lower price, in order to reduce the risk of the written call option in the event of a substantial price increase. Because combined options positions involve multiple trades, they result in higher transaction costs and may be more difficult to open and close out.
Correlation of Price Changes. Because there are a limited number of types of exchange-traded options and futures contracts, it is likely that the standardized options and futures contracts available will not match a Fund’s current or anticipated investments exactly. A Fund may invest in futures and options contracts based on securities or instruments with different issuers, maturities, or other characteristics from the securities in which it typically invests, which involves a risk that the options or futures position will not track the performance of a Fund’s other investments.
Options and futures contracts prices can also diverge from the prices of their underlying instruments, even if the underlying instruments match the Fund’s investments well. Options and futures contracts prices are affected by such factors as current and anticipated short term interest rates, changes in volatility of the underlying instrument, and the time remaining until expiration of the contract, which may not affect security prices the same way. Imperfect correlation may also result from differing levels of demand in the options and futures markets and the securities markets, from structural differences in how options and futures and securities are traded, or from imposition of daily price fluctuation limits or trading halts. A Fund may purchase or sell options and futures contracts with a greater or lesser value than the securities it wishes to hedge or intends to purchase in order to attempt to compensate for differences in volatility between the contract and the securities, although this may not be successful in all cases. If price changes in a Fund’s options or futures positions are poorly correlated with its other investments, the positions may fail to produce anticipated gains or result in losses that are not offset by gains in other investments.
Part II - 55
Liquidity of Options and Futures Contracts. There is no assurance that a liquid market will exist for any particular option or futures contract at any particular time even if the contract is traded on an exchange. In addition, exchanges may establish daily price fluctuation limits for options and futures contracts and may halt trading if a contract’s price moves up or down more than the limit in a given day. On volatile trading days when the price fluctuation limit is reached or a trading halt is imposed, it may be impossible for a Fund to enter into new positions or close out existing positions. If the market for a contract is not liquid because of price fluctuation limits or otherwise, it could prevent prompt liquidation of unfavorable positions, and could potentially require a Fund to continue to hold a position until delivery or expiration regardless of changes in its value. As a result, a Fund’s access to other assets held to cover its options or futures positions could also be impaired. (See “Exchange-Traded and OTC Options” above for a discussion of the liquidity of options not traded on an exchange.)
Foreign Investment Risk. Certain Funds may buy and sell options on interest rate futures including global interest rate futures in which the reference interest rate is tied to currencies other than the U.S. dollar. Such investments are subject to additional risks including the risks associated with foreign investment and currency risk. See “Foreign Investments (including Foreign Currencies)” in this SAI Part II.
Position Limits. Futures exchanges can limit the number of futures and options on futures contracts that can be held or controlled by an entity. If an adequate exemption cannot be obtained, a Fund or the Fund’s Adviser may be required to reduce the size of its futures and options positions or may not be able to trade a certain futures or options contract in order to avoid exceeding such limits.
Asset Coverage for Futures Contracts and Options Positions. A Fund will comply with currently applicable guidelines established by the SEC with respect to coverage of options and futures contracts by mutual funds, and if the guidelines so require, will set aside or earmark appropriate liquid assets in the amount prescribed. For cash settled futures contracts and options on futures contracts, a Fund will segregate an amount equal to the mark-to-market value of the obligation. For physically settled futures contracts and options on futures contracts, a Fund will segregate an amount equal to the current notional value of the contract or underlying futures contracts, as applicable. Netting is generally permitted of similar contracts. Such assets cannot be sold while the futures contract or option is outstanding, unless they are replaced with other suitable assets. As a result, there is a possibility that the reservation of a large percentage of a Fund’s assets could impede portfolio management or a Fund’s ability to meet redemption requests or other current obligations. The Funds may also enter into offsetting transactions on futures contracts and options on futures in accordance with guidelines established by the SEC, similar to the transactions as described above in “Selling (Writing) Put and Call Options on Securities.”
Real Estate Investment Trusts (“REITs”)
Certain of the Funds may invest in equity interests or debt obligations issued by REITs. REITs are pooled investment vehicles which invest primarily in income producing real estate or real estate related loans or interest. REITs are generally classified as equity REITs, mortgage REITs or a combination of equity and mortgage REITs. Equity REITs invest the majority of their assets directly in real property and derive income primarily from the collection of rents. Equity REITs can also realize capital gains by selling property that has appreciated in value. Mortgage REITs invest the majority of their assets in real estate mortgages and derive income from the collection of interest payments. Similar to investment companies, REITs are not taxed on income distributed to shareholders provided they comply with several requirements of the Code. A Fund will indirectly bear its proportionate share of expenses incurred by REITs in which a Fund invests in addition to the expenses incurred directly by a Fund.
Investing in REITs involves certain unique risks in addition to those risks associated with investing in the real estate industry in general. Equity REITs may be affected by changes in the value of the underlying property owned by the REITs, while mortgage REITs may be affected by the quality of any credit extended. REITs are dependent upon management skills and on cash flows, are not diversified, and are subject to default by borrowers and self-liquidation. REITs are also subject to the possibilities of failing to qualify for tax free pass-through of income under the Code and failing to maintain their exemption from registration under the 1940 Act.
REITs (especially mortgage REITs) are also subject to interest rate risks. When interest rates decline, the value of a REIT’s investment in fixed rate obligations can be expected to rise. Conversely, when interest rates rise, the value of a REIT’s investment in fixed rate obligations can be expected to decline. In
Part II - 56
contrast, as interest rates on adjustable rate mortgage loans are reset periodically, yields on a REIT’s investment in such loans will gradually align themselves to fluctuate less dramatically in response to interest rate fluctuations than would investments in fixed rate obligations.
Investment in REITs involves risks similar to those associated with investing in small capitalization companies. These risks include:
•
limited financial resources;
•
infrequent or limited trading; and
•
more abrupt or erratic price movements than larger company securities.
In addition, small capitalization stocks, such as certain REITs, historically have been more volatile in price than the larger capitalization stocks included in the S&P 500 Index.
Recent Events Relating to the Overall Economy
The U.S. Government, the Federal Reserve, the Treasury, the SEC, the FDIC and other governmental and regulatory bodies have taken actions to address the 2008-2009 financial crisis and the recent disruption to economies and markets due to the COVID-19 pandemic. These actions included, in part, the enactment by the United States Congress of the “Dodd-Frank Wall Street Reform and Consumer Protection Act,” which was signed into law on July 21, 2010 and imposed a new regulatory framework over the U.S. financial services industry and the consumer credit markets in general, and proposed and final regulations by the SEC. Given the broad scope, sweeping nature, and relatively recent enactment of some of these regulatory measures, the potential impact they could have on securities held by the Funds is unknown. There can be no assurance that these measures will not have an adverse effect on the value or marketability of securities held by the Funds. Furthermore, no assurance can be made that the U.S. Government or any U.S. regulatory body (or other authority or regulatory body) will not continue to take further legislative or regulatory action, and the effect of such actions, if taken, cannot be known. However, current efforts by the U.S. Government to reduce the impact of regulations on the U.S. financial services industry could lead to the repeal of certain elements of the regulatory framework.
Additionally, COVID-19 has resulted in a global pandemic and major disruption to economies and markets around the world, including the United States. Financial markets have experienced extreme volatility and severe losses, and trading in many instruments has been disrupted. Liquidity for many instruments has been greatly reduced for periods of time. Some interest rates are very low and in some cases yields are negative. Some sectors of the economy and individual issuers have experienced particularly large losses. These circumstances may continue for an extended period of time, and may continue to affect adversely the value and liquidity of a Fund’s investments. The ultimate economic fallout from the pandemic, and the long-term impact on economies, markets, industries and individual issuers, are not known. Governments and central banks, including the Federal Reserve in the U.S., have taken extraordinary and unprecedented actions to support local and global economies and the financial markets. The impact of these measures, and whether they will be effective to mitigate the economic and market disruption, will not be known for some time.
Derivatives
In October 2020, the SEC adopted a final rule related to the use of derivatives, short sales, reverse repurchase agreements and certain other transactions by registered investment companies that will rescind and withdraw the guidance of the SEC and its staff regarding asset segregation and cover transactions discussed herein. The final rule requires the Funds to trade derivatives and other transactions that create future payment or delivery obligations (except reverse repurchase agreements and similar financing transactions) subject to a value-at-risk (“VaR”) leverage limit and certain derivatives risk management program and reporting requirements. Generally, these requirements apply unless a Fund qualifies as a “limited derivatives user,” as defined in the final rule. Under the final rule, when a Fund trades reverse repurchase agreements or similar financing transactions, including certain tender option bonds, it needs to aggregate the amount of indebtedness associated with the reverse repurchase agreements or similar financing transactions with the aggregate amount of any other senior securities representing indebtedness when calculating the Fund’s asset coverage ratio or treat all such transactions as derivatives transactions. Reverse repurchase agreements or similar financing transactions aggregated with other indebtedness do not need to be included in the calculation of whether a Fund is a limited derivatives user, but for Funds subject to the VaR testing, reverse repurchase agreements and similar financing transactions must be included for purposes of such testing whether treated as derivatives transactions or not. Compliance with
Part II - 57
these new requirements will be required by August 19, 2022. Following the compliance date, these requirements may limit the ability of a Fund to use derivatives and reverse repurchase agreements and similar financing transactions as part of its investment strategies. These requirements may increase the cost of a Fund’s investments and cost of doing business, which could adversely affect investors.
Repurchase Agreements
Repurchase agreements may be entered into with brokers, dealers or banks or other entities that meet the Adviser’s credit guidelines. A Fund will enter into repurchase agreements only with member banks of the Federal Reserve System and securities dealers or other entities believed by the Adviser to be creditworthy. The Adviser may consider the collateral received and any applicable guarantees in making its determination. In a repurchase agreement, a Fund buys a security from a seller that has agreed to repurchase the same security at a mutually agreed upon date and price. The resale price normally is in excess of the purchase price, reflecting an agreed upon interest rate. This interest rate is effective for the period of time a Fund is invested in the agreement and is not related to the coupon rate on the underlying security. A repurchase agreement may also be viewed as a fully collateralized loan of money by a Fund to the seller. The maximum maturity permitted for a non-“putable” repurchase agreement will be (i) 95 days for a Money Market Fund for certain counterparties and 45 days for others and (ii) 190 days for any Fund that is not a Money Market Fund. The maximum notice period permitted for a “putable” or “open” repurchase agreement (i.e., where the Fund has a right to put the repurchase agreement to the counterparty or terminate the transaction at par plus accrued interest at a specified notice period) will be (i) 95 days for a Money Market Fund for certain counterparties and 45 days for others and (ii) 190 days for any Fund that is not a Money Market Fund. The securities which are subject to repurchase agreements, however, may have maturity dates in excess of 190 days from the effective date of the repurchase agreement. In addition, the maturity of a “putable” or “open” repurchase agreement may be in excess of 190 days. A Fund will always receive securities as collateral during the term of the agreement whose market value is at least equal to 100% of the dollar amount invested by the Fund in each agreement plus accrued interest. The repurchase agreements further authorize the Fund to demand additional collateral in the event that the dollar value of the collateral falls below 100%. A Fund will make payment for such securities only upon physical delivery or upon evidence of book entry transfer to the account of the custodian. Repurchase agreements are considered under the 1940 Act to be loans collateralized by the underlying securities.
All of the Funds that are permitted to invest in repurchase agreements may engage in repurchase agreement transactions that are collateralized fully as defined in Rule 5b-3(c)(1) of the 1940 Act (except that Rule 5b-3(c)(1)(iv)(C) under the 1940 Act shall not apply for the Money Market Funds), which has the effect of enabling a Fund to look to the collateral, rather than the counterparty, for determining whether its assets are “diversified” for 1940 Act purposes. With respect to the Money Market Funds, in accordance with Rule 2a-7 under the 1940 Act, the Adviser evaluates the creditworthiness of each counterparty. The Adviser may consider the collateral received and any applicable guarantees in making its determination. Certain Funds may, in addition, engage in repurchase agreement transactions that are collateralized by money market instruments, debt securities, loan participations, equity securities or other securities including securities that are rated below investment grade by the requisite NRSROs or unrated securities of comparable quality. For these types of repurchase agreement transactions, the Fund would look to the counterparty, and not the collateral, for determining such diversification.
A repurchase agreement is subject to the risk that the seller may fail to repurchase the security. In the event of default by the seller under a repurchase agreement construed to be a collateralized loan, the underlying securities would not be owned by the Fund, but would only constitute collateral for the seller’s obligation to pay the repurchase price. Therefore, a Fund may suffer time delays and incur costs in connection with the disposition of the collateral. The collateral underlying repurchase agreements may be more susceptible to claims of the seller’s creditors than would be the case with securities owned by the Fund.
Under existing guidance from the SEC, certain Funds may transfer uninvested cash balances into a joint account, along with cash of other Funds and certain other accounts. These balances may be invested in one or more repurchase agreements and/or short-term money market instruments.
Reverse Repurchase Agreements
In a reverse repurchase agreement, a Fund sells a security and agrees to repurchase the same security at a mutually agreed upon date and price reflecting the interest rate effective for the term of the agreement. For purposes of the 1940 Act, a reverse repurchase agreement is considered borrowing by a Fund and, therefore, a form of leverage. Leverage may cause any gains or losses for a Fund to be magnified. The
Part II - 58
Funds will invest the proceeds of borrowings under reverse repurchase agreements. In addition, except for liquidity purposes, a Fund will enter into a reverse repurchase agreement only when the expected return from the investment of the proceeds is greater than the expense of the transaction. A Fund will not invest the proceeds of a reverse repurchase agreement for a period which exceeds the duration of the reverse repurchase agreement. A Fund would be required to pay interest on amounts obtained through reverse repurchase agreements, which are considered borrowings under federal securities laws. The repurchase price is generally equal to the original sales price plus interest. Reverse repurchase agreements are usually for seven days or less and cannot be repaid prior to their expiration dates. Each Fund will earmark and reserve Fund assets, in cash or liquid securities, in an amount at least equal to its purchase obligations under its reverse repurchase agreements. Reverse repurchase agreements involve the risk that the market value of the portfolio securities transferred may decline below the price at which a Fund is obliged to purchase the securities. All forms of borrowing (including reverse repurchase agreements) are limited in the aggregate and may not exceed 33 1∕3% of a Fund’s total assets, except as permitted by law.
Securities Lending
To generate additional income, certain Funds may lend up to 33 1∕3% of such Fund’s total assets pursuant to agreements requiring that the loan be continuously secured by collateral equal to at least 100% of the market value plus accrued interest on the securities lent. The Funds use Citibank, N.A. (“Citibank”) as their securities lending agent. Pursuant to a Third Party Securities Lending Rider to the Custody Agreement between JPMorgan Chase Bank, Citibank and the Funds (the “Third Party Securities Lending Rider”) approved by the Board of Trustees, Citibank compensates JPMorgan Chase Bank for certain custodial services provided by JPMorgan Chase Bank in connection with the Funds’ use of Citibank as securities lending agent.
Pursuant to the Global Securities Lending Agency Agreement approved by the Board of Trustees between Citibank and the Trust on behalf of the applicable Funds, severally and not jointly (the “Securities Lending Agency Agreement”), collateral for loans will consist only of cash. The Funds receive payments from the borrowers equivalent to the dividends and interest that would have been earned on the securities lent. For loans secured by cash, the Funds seek to earn interest on the investment of cash collateral in investments permitted by the Securities Lending Agency Agreement. Under the Securities Lending Agency Agreement, cash collateral may be invested in IM Shares of JPMorgan Prime Money Market Fund, JPMorgan U.S. Government Money Market Fund, and Class Agency SL Shares of the JPMorgan Securities Lending Money Market Fund.
Under the Securities Lending Agency Agreement, Citibank marks to market the loaned securities on a daily basis. In the event the cash received from the borrower is less than 102% of the value of the loaned securities (105% for non-U.S. securities), Citibank requests additional cash from the borrower so as to maintain a collateralization level of at least 102% of the value of the loaned securities plus accrued interest (105% for non-U.S. securities) subject to certain de minimis amounts. Loans are subject to termination by a Fund or the borrower at any time, and are therefore not considered to be illiquid investments. The Fund does not have the right to vote proxies for securities on loans over a record date of such proxies. However, if the Fund’s Adviser has notice of the proxy in advance of the record date, a Fund’s Adviser may terminate a loan in advance of the record date if the Fund’s Adviser determines the vote is considered material with respect to an investment.
Securities lending involves counterparty risk, including the risk that the loaned securities may not be returned or returned in a timely manner and/or a loss of rights in the collateral if the borrower or the lending agent defaults or fails financially. This risk is increased when a Fund’s loans are concentrated with a single or limited number of borrowers. The earnings on the collateral invested may not be sufficient to pay fees incurred in connection with the loan. Also, the principal value of the collateral invested may decline and may not be sufficient to pay back the borrower for the amount of collateral posted. There are no limits on the number of borrowers a Fund may use and a Fund may lend securities to only one or a small group of borrowers. In addition, loans may be made to affiliates of Citibank. Funds participating in securities lending bear the risk of loss in connection with investments of the cash collateral received from the borrowers, which do not trigger additional collateral requirements from the borrower.
To the extent that the value or return of a Fund’s investments of the cash collateral declines below the amount owed to a borrower, the Fund may incur losses that exceed the amount it earned on lending the security. In situations where the Adviser does not believe that it is prudent to sell the cash collateral investments in the market, a Fund may borrow money to repay the borrower the amount of cash collateral
Part II - 59
owed to the borrower upon return of the loaned securities. This will result in financial leverage, which may cause the Fund to be more volatile because financial leverage tends to exaggerate the effect of any increase or decrease in the value of the Fund’s portfolio securities.
Short Selling
In short selling transactions, a Fund sells a security it does not own in anticipation of a decline in the market value of the security. To complete the transaction, a Fund must borrow the security to make delivery to the buyer. A Fund is obligated to replace the security borrowed by purchasing it subsequently at the market price at the time of replacement. The price at such time may be more or less than the price at which the security was sold by a Fund, which may result in a loss or gain, respectively. Unlike taking a long position in a security by purchasing the security, where potential losses are limited to the purchase price, short sales have no cap on maximum losses, and gains are limited to the price of the security at the time of the short sale.
Short sales of forward commitments and derivatives do not involve borrowing a security. These types of short sales may include futures, options, contracts for differences, forward contracts on financial instruments and options such as contracts, credit linked instruments, and swap contracts.
A Fund may not always be able to borrow a security it wants to sell short. A Fund also may be unable to close out an established short position at an acceptable price and may have to sell long positions at disadvantageous times to cover its short positions. The value of your investment in a Fund will fluctuate in response to movements in the market. Fund performance also will depend on the effectiveness of the Adviser’s research and the management team’s investment decisions. The SEC and financial industry regulatory authorities in other countries may impose prohibitions, restrictions or other regulatory requirements on short sales, which could inhibit the ability of the Adviser to sell securities short on behalf of the Fund. For example, in September 2008, in response to spreading turmoil in the financial markets, the SEC temporarily banned short selling in the stocks of numerous financial services companies, and also promulgated new disclosure requirements with respect to short positions held by investment managers. The SEC’s temporary ban on short selling of such stocks has since expired, but should similar restrictions and/or additional disclosure requirements be promulgated, especially if market turmoil occurs, a Fund may be forced to cover short positions more quickly than otherwise intended and may suffer losses as a result. Such restrictions may also adversely affect the ability of a Fund (especially if a Fund utilizes short selling as a significant portion of its investment strategy) to execute its investment strategies generally.
Short sales also involve other costs. A Fund must repay to the lender an amount equal to any dividends or interest that accrues while the loan is outstanding. To borrow the security, a Fund may be required to pay a premium. A Fund also will incur transaction costs in effecting short sales. The amount of any ultimate gain for a Fund resulting from a short sale will be decreased and the amount of any ultimate loss will be increased by the amount of premiums, interest or expenses a Fund may be required to pay in connection with the short sale. Until a Fund closes the short position, it will earmark and reserve Fund assets, in cash or liquid securities, in amount at least equal to the current market value of the securities sold short unless the Fund holds the securities sold short. Realized gains from short sales are typically treated as short-term gains/losses.
Certain of a Fund’s service providers may have agreed to waive fees and reimburse expenses to limit the Fund’s operating expenses in the amount and for the time period specified in the Fund’s prospectuses. The expense limitation does not include certain expenses including, to the extent indicated in the Fund’s prospectuses, dividend and interest expense on short sales. In calculating the interest expense on short sales for purposes of this exclusion, the Fund will recognize all economic elements of interest costs, including premium and discount adjustments.
Short-Term Funding Agreements
Short-term funding agreements issued by insurance companies are sometimes referred to as Guaranteed Investment Contracts (“GICs”), while those issued by banks are referred to as Bank Investment Contracts (“BICs”). Pursuant to such agreements, a Fund makes cash contributions to a deposit account at a bank or insurance company. The bank or insurance company then credits to the Fund on a monthly basis guaranteed interest at either a fixed, variable or floating rate. These contracts are general obligations of the issuing bank or insurance company (although they may be the obligations of an insurance company separate account) and are paid from the general assets of the issuing entity.
Generally, there is no active secondary market in short-term funding agreements. Therefore, short-term funding agreements may be considered by a Fund to be illiquid investments.
Part II - 60
Special Purpose Acquisition Companies
A Fund may invest in stocks, warrants, rights, debt and other securities of special purpose acquisition companies (“SPACs”) or similar special purpose entities in a private placement transaction or as part of a public offering. A SPAC is a publicly traded company that raises investment capital for the purpose of acquiring or merging with an existing company. The shares of a SPAC are typically issued in “units.” Units include one share of common stock and one right or warrant (or partial right or warrant) conveying the right to purchase additional shares of common stock. At a specified time, the rights and warrants may be separated from the common stock at the election of the holder, after which each security typically is freely tradeable. An alternative to private companies making an initial public offering (“IPO”) can be combining with a SPAC, which permits the private company to go public by taking the SPAC's place on an exchange. Until an acquisition or merger is completed, a SPAC generally invests its assets, less a portion retained to cover expenses, in U.S. government securities, money market securities and cash and does not typically pay dividends in respect of its common stock. In addition, a Fund may elect not to participate in a proposed SPAC transaction or may be required to divest its interests in the SPAC due to regulatory or other considerations. As a result, it is possible that an investment in a SPAC may lose value.
If an acquisition or merger that meets the requirements of the SPAC is not completed within a pre-established period of time (typically, two years), the funds invested in the SPAC (less any permitted expenses and any losses experienced by the SPAC) are returned to its shareholders. Any warrants or other rights with respect to a SPAC held by a Fund may expire worthless or may be repurchased or retired by the SPAC.
Because SPACs and similar entities are blank check companies and do not have any operating history or ongoing business other than seeking acquisitions, the value of their securities is particularly dependent on the ability of the SPAC’s management to identify a merger target and complete an acquisition. Some SPACs pursue acquisitions only within certain industries or regions, which may increase the volatility of their prices and the risks associated with these investments. In addition, the securities issued by a SPAC may be classified as illiquid and/or be subject to restrictions on resale, which may be for an extended time, and may only be traded in the over-the-counter market. If there is no market for the shares of the SPAC or only a thinly traded market for shares or interests in the SPAC develops, a Fund may not be able to sell its interest in a SPAC or to sell its interest only at a price below what the Fund believes is the SPAC interest's value. If not subject to a restriction on resale, a Fund may sell its investments in a SPAC at any time, including before, at or after the time of an acquisition or merger.
An investment in a SPAC may be diluted by additional, later offerings of securities by the SPAC or by other investors exercising existing rights to purchase securities of the SPAC. Generally, SPACs provide the opportunity for common shareholders to have some or all of their shares of common stock redeemed by the SPAC at or around the time of a proposed acquisition or merger. An investment in a SPAC is subject to the risks that any proposed acquisition or merger may not obtain the requisite approval of SPAC shareholders or that an acquisition or merger may prove unsuccessful and lose value. An investment in a SPAC is also subject to the risk that a significant portion of the funds raised by the SPAC may be expended during the search for a target acquisition or merger. The values of investments in SPACs may be highly volatile and may depreciate over time.
In addition, investments in SPACs may be subject to the risks of investing in an IPO. These risks include risks associated with companies that have little or no operating history as public companies, unseasoned trading and small number of shares available for trading and limited information about the issuer. Additionally, investments in SPACs may be subject to the risks inherent in those sectors of the market where these new issuers operate. The market for IPO issuers may be volatile, and share prices of newly-public companies have fluctuated significantly over short periods of time. Although some IPOs may produce high, double-digit returns, such returns are highly unusual and may not be sustainable.
Structured Investments
A structured investment is a security having a return tied to an underlying index or other security or asset class. Structured investments generally are individually negotiated agreements and may be traded over-the-counter. Structured investments are organized and operated to restructure the investment characteristics of the underlying security. This restructuring involves the deposit with or purchase by an entity, such as a corporation or trust, or specified instruments (such as commercial bank loans) and the issuance by that entity or one or more classes of securities (“structured securities”) backed by, or representing interests in, the underlying instruments. The cash flow on the underlying instruments may be apportioned among the newly issued structured securities to create securities with different investment
Part II - 61
characteristics, such as varying maturities, payment priorities and interest rate provisions, and the extent of such payments made with respect to structured securities is dependent on the extent of the cash flow on the underlying instruments. Because structured securities typically involve no credit enhancement, their credit risk generally will be equivalent to that of the underlying instruments. Investments in structured securities are generally of a class of structured securities that is either subordinated or unsubordinated to the right of payment of another class. Subordinated structured securities typically have higher yields and present greater risks than unsubordinated structured securities. Structured instruments include structured notes. In addition to the risks applicable to investments in structured investments and debt securities in general, structured notes bear the risk that the issuer may not be required to pay interest on the structured note if the index rate rises above or falls below a certain level. Structured securities are typically sold in private placement transactions, and there currently is no active trading market for structured securities. Investments in government and government-related restructured debt instruments are subject to special risks, including the inability or unwillingness to repay principal and interest, requests to reschedule or restructure outstanding debt and requests to extend additional loan amounts. Structured investments include a wide variety of instruments including, without limitation, CDOs, credit linked notes, and participation notes and participatory notes. Additional information including risk information is included under Asset-Backed Securities.
Total Annual Fund Operating Expenses set forth in the fee table and Financial Highlights section of each Fund’s Prospectuses do not include any expenses associated with investments in certain structured or synthetic products that may rely on the exception for the definition of “investment company” provided by section 3(c)(1) or 3(c)(7) of the 1940 Act.
Credit Linked Notes. Certain Funds may invest in structured instruments known as credit linked securities or credit linked notes (“CLNs”). CLNs are typically issued by a limited purpose trust or other vehicle (the “CLN trust”) that, in turn, invests in a derivative or basket of derivatives instruments, such as credit default swaps, interest rate swaps and/or other securities, in order to provide exposure to certain high yield, sovereign debt, emerging markets, or other fixed income markets. Generally, investments in CLNs represent the right to receive periodic income payments (in the form of distributions) and payment of principal at the end of the term of the CLN. However, these payments are conditioned on the CLN trust’s receipt of payments from, and the CLN trust’s potential obligations, to the counterparties to the derivative instruments and other securities in which the CLN trust invests. For example, the CLN trust may sell one or more credit default swaps, under which the CLN trust would receive a stream of payments over the term of the swap agreements provided that no event of default has occurred with respect to the referenced debt obligation upon which the swap is based. If a default were to occur, the stream of payments may stop and the CLN trust would be obligated to pay the counterparty the par (or other agreed upon value) of the referenced debt obligation. This, in turn, would reduce the amount of income and principal that a Fund would receive as an investor in the CLN trust.
Certain Funds may enter into CLNs structured as “First-to-Default” CLNs. In a First-to-Default CLN, the CLN trust enters into a credit default swap on a portfolio of a specified number of individual securities pursuant to which the CLN trust sells protection to a counterparty. The CLN trust uses the proceeds of issuing investments in the CLN trust to purchase securities, which are selected by the counterparty and the total return of which is paid to the counterparty. Upon the occurrence of a default or credit event involving any one of the individual securities, the credit default swaps terminate and the Fund’s investment in the CLN trust is redeemed for an amount equal to “par” minus the amount paid to the counterparty under the credit default swap.
Certain Funds may also enter in CLNs to gain access to sovereign debt and securities in emerging market particularly in markets where the Fund is not able to purchase securities directly due to domicile restrictions or tax restrictions or tariffs. In such an instance, the issuer of the CLN may purchase the reference security directly and/or gain exposure through a credit default swap or other derivative.
A Fund’s investments in CLNs is subject to the risks associated with the underlying reference obligations and derivative instruments, including, among others, credit risk, default or similar event risk, counterparty risk, interest rate risk, leverage risk and management risk.
Equity-Linked Notes. Certain funds may invest in structured investments known as equity-linked notes (“ELNs”). ELNs are hybrid derivative-type instruments that are designed to combine the characteristics of one or more reference securities (e.g., a single stock, a stock index or a basket of stocks (“underlying securities”)) and a related equity derivative. ELNs are structured as notes that are issued by
Part II - 62
counterparties, including banks, broker-dealers or their affiliates, and are designed to offer a return linked to the underlying securities within the ELN. ELNs can provide a Fund with an efficient investment tool that may be less expensive than investing directly in the underlying securities and the related equity derivative.
Generally, when purchasing an ELN, a Fund pays the counterparty the current value of the underlying securities plus a commission. Upon the maturity of the note, the Fund generally receives the par value of the note plus a return based on the appreciation of the underlying securities. If the underlying securities have depreciated in value or if their price fluctuates outside of a preset range, depending on the type of ELN in which the Fund invested, the Fund may receive only the principal amount of the note, or may lose the principal invested in the ELN entirely.
ELNs are available with an assortment of features, such as periodic coupon payments (e.g., monthly, quarterly or semiannually), varied participation rates (the rate at which a Fund participates in the appreciation of the underlying securities), limitations on the appreciation potential of the underlying securities by a maximum payment or call right, and different protection levels on a Fund’s principal investment. In addition, when the underlying securities are foreign securities or indices, an ELN may be priced with or without currency exposure. A Fund may engage in all types of ELNs, including those that: (1) provide for protection of the Fund’s principal in exchange for limited participation in the appreciation of the underlying securities, and (2) do not provide for such protection and subject the Fund to the risk of loss of the Fund’s principal investment.
Investing in ELNs may be more costly to a Fund than if the Fund had invested in the underlying instruments directly. Investments in ELNs often have risks similar to the underlying instruments, which include market risk and, as applicable, foreign securities and currency risk. In addition, since ELNs are in note form, ELNs are also subject to certain debt securities risks, such as credit or counterparty risk. Should the prices of the underlying instruments move in an unexpected manner, a Fund may not achieve the anticipated benefits of an investment in an ELN, and may realize losses, which could be significant and could include the entire principal investment. Investments in ELNs are also subject to liquidity risk, which may make ELNs difficult to sell and value. A lack of liquidity may also cause the value of the ELN to decline. In addition, ELNs may exhibit price behavior that does not correlate with the underlying securities.
ELN investments are subject to the risk that issuers and/or counterparties will fail to make payments when due or default completely. Prices of these investments may be adversely affected if any of the issuers or counterparties it is invested in are subject to an actual or perceived deterioration in their credit quality.
If the ELN is held to maturity, the issuer would pay to the purchaser the underlying instrument’s value at maturity with any necessary adjustments. The holder of an ELN that is linked to a particular underlying security or instrument may be entitled to receive dividends paid in connection with that underlying equity security, but typically does not receive voting rights as it would if it directly owned the underlying equity security. In addition, there can be no assurance that there will be a trading market for an ELN or that the trading price of the ELN will equal the underlying value of the instruments that it seeks to replicate. Unlike a direct investment in equity securities, ELNs typically involve a term or expiration date, potentially increasing the Fund’s turnover rate, transaction costs and tax liability.
Participation Notes and Participatory Notes. Certain Funds may invest in instruments that have similar economic characteristics to equity securities, such as participation notes (also known as participatory notes (“P-notes”)) or other structured instruments that may be developed from time to time (“structured instruments”). Structured instruments are notes that are issued by banks, broker-dealers or their affiliates and are designed to offer a return linked to a particular underlying equity or market.
If the structured instrument were held to maturity, the issuer would pay to the purchaser the underlying instrument’s value at maturity with any necessary adjustments. The holder of a structured instrument that is linked to a particular underlying security or instrument may be entitled to receive dividends paid in connection with that underlying security or instrument, but typically does not receive voting rights as it would if it directly owned the underlying security or instrument. Structured instruments have transaction costs. In addition, there can be no assurance that there will be a trading market for a structured instrument or that the trading price of a structured instrument will equal the underlying value of the security, instrument or market that it seeks to replicate. Unlike a direct investment in equity securities, structured instruments typically involve a term or expiration date, potentially increasing the Fund’s turnover rate, transaction costs and tax liability.
Part II - 63
Due to transfer restrictions, the secondary markets on which a structured instrument is traded may be less liquid than the market for other securities, or may be completely illiquid, which may expose the Fund to risks of mispricing or improper valuation. Structured instruments typically constitute general unsecured contractual obligations of the banks, broker-dealers or their relevant affiliates that issue them, which subjects the Fund to counterparty risk (and this risk may be amplified if the Fund purchases structured instruments from only a small number of issuers). Structured instruments also have the same risks associated with a direct investment in the underlying securities, instruments or markets that they seek to replicate.
Swaps and Related Swap Products
Swap transactions may include, but are not limited to, interest rate swaps, currency swaps, cross-currency interest rate swaps, forward rate agreements, contracts for differences, total return swaps, index swaps, basket swaps, specific security swaps, fixed income sectors swaps, commodity swaps, asset-backed swaps (ABX), commercial mortgage-backed securities (CMBS) and indexes of CMBS (CMBX), credit default swaps, interest rate caps, price lock swaps, floors and collars and swaptions (collectively defined as “swap transactions”).
A Fund may enter into swap transactions for any legal purpose consistent with its investment objective and policies, such as for the purpose of attempting to obtain or preserve a particular return or spread at a lower cost than obtaining that return or spread through purchases and/or sales of instruments in cash markets, to protect against currency fluctuations, to protect against any increase in the price of securities a Fund anticipates purchasing at a later date, or to gain exposure to certain markets in the most economical way possible.
Swap agreements are two-party contracts entered into primarily by institutional counterparties for periods ranging from a few weeks to several years. They may be bilaterally negotiated between the two parties (referred to as OTC swaps) or traded over an exchange. In a standard swap transaction, two parties agree to exchange the returns (or differentials in rates of return) that would be earned or realized on specified notional investments or instruments. The gross returns to be exchanged or “swapped” between the parties are calculated by reference to a “notional amount,” i.e., the return on or increase in value of a particular dollar amount invested at a particular interest rate, in a particular foreign currency or commodity, or in a “basket” of securities representing a particular index. The purchaser of an interest rate cap or floor, upon payment of a fee, has the right to receive payments (and the seller of the cap or floor is obligated to make payments) to the extent a specified interest rate exceeds (in the case of a cap) or is less than (in the case of a floor) a specified level over a specified period of time or at specified dates. The purchaser of an interest rate collar, upon payment of a fee, has the right to receive payments (and the seller of the collar is obligated to make payments) to the extent that a specified interest rate falls outside an agreed upon range over a specified period of time or at specified dates. The purchaser of an option on an interest rate swap, also known as a “swaption,” upon payment of a fee (either at the time of purchase or in the form of higher payments or lower receipts within an interest rate swap transaction) has the right, but not the obligation, to initiate a new swap transaction of a pre-specified notional amount with pre-specified terms with the seller of the swaption as the counterparty.
The “notional amount” of a swap transaction is the agreed upon basis for calculating the payments that the parties have agreed to exchange. For example, one swap counterparty may agree to pay a floating rate of interest (e.g., 3 month LIBOR) calculated based on a $10 million notional amount on a quarterly basis in exchange for receipt of payments calculated based on the same notional amount and a fixed rate of interest on a semi-annual basis. In the event a Fund is obligated to make payments more frequently than it receives payments from the other party, it will incur incremental credit exposure to that swap counterparty. This risk may be mitigated somewhat by the use of swap agreements which call for a net payment to be made by the party with the larger payment obligation when the obligations of the parties fall due on the same date. Under most swap agreements entered into by a Fund, payments by the parties will be exchanged on a “net basis,” and a Fund will receive or pay, as the case may be, only the net amount of the two payments.
The amount of a Fund’s potential gain or loss on any swap transaction is not subject to any fixed limit. Nor is there any fixed limit on a Fund’s potential loss if it sells a cap or collar. If a Fund buys a cap, floor or collar, however, the Fund’s potential loss is limited to the amount of the fee that it has paid. When measured against the initial amount of cash required to initiate the transaction, which is typically zero in the case of most conventional swap transactions, swaps, caps, floors and collars tend to be more volatile than many other types of instruments.
Part II - 64
The use of swap transactions, caps, floors and collars involves investment techniques and risks that are different from those associated with portfolio security transactions. If a Fund’s Adviser is incorrect in its forecasts of market values, interest rates, and other applicable factors, the investment performance of the Fund will be less favorable than if these techniques had not been used. These instruments are typically not traded on exchanges. Accordingly, there is a risk that the other party to certain of these instruments will not perform its obligations to a Fund or that a Fund may be unable to enter into offsetting positions to terminate its exposure or liquidate its position under certain of these instruments when it wishes to do so. Such occurrences could result in losses to a Fund. A Fund’s Adviser will consider such risks and will enter into swap and other derivatives transactions only when it believes that the risks are not unreasonable.
A Fund will earmark and reserve Fund assets, in cash or liquid securities, in an amount sufficient at all times to cover its current obligations under its swap transactions, caps, floors and collars. If a Fund enters into a swap agreement on a net basis, it will earmark and reserve assets with a daily value at least equal to the excess, if any, of a Fund’s accrued obligations under the swap agreement over the accrued amount a Fund is entitled to receive under the agreement. If a Fund enters into a swap agreement on other than a net basis, or sells a cap, floor or collar, it will earmark and reserve assets with a daily value at least equal to the full amount of a Fund’s accrued obligations under the agreement. A Fund will not enter into any swap transaction, cap, floor, or collar, unless the counterparty to the transaction is deemed creditworthy by the Fund’s Adviser. If a counterparty defaults, a Fund may have contractual remedies pursuant to the agreements related to the transaction. The swap markets in which many types of swap transactions are traded have grown substantially in recent years, with a large number of banks and investment banking firms acting both as principals and as agents utilizing standardized swap documentation. As a result, the markets for certain types of swaps (e.g., interest rate swaps) have become relatively liquid. The markets for some types of caps, floors and collars are less liquid.
The liquidity of swap transactions, caps, floors and collars will be as set forth in guidelines established by a Fund’s Adviser and approved by the Trustees which are based on various factors, including: (1) the availability of dealer quotations and the estimated transaction volume for the instrument, (2) the number of dealers and end users for the instrument in the marketplace, (3) the level of market making by dealers in the type of instrument, (4) the nature of the instrument (including any right of a party to terminate it on demand) and (5) the nature of the marketplace for trades (including the ability to assign or offset a Fund’s rights and obligations relating to the instrument). Such determination will govern whether the instrument will be deemed within the applicable liquidity restriction on investments in securities that are not readily marketable.
During the term of a swap, cap, floor or collar, changes in the value of the instrument are recognized as unrealized gains or losses by marking to market to reflect the market value of the instrument. When the instrument is terminated, a Fund will record a realized gain or loss equal to the difference, if any, between the proceeds from (or cost of) the closing transaction and a Fund’s basis in the contract.
The federal income tax treatment with respect to swap transactions, caps, floors, and collars may impose limitations on the extent to which a Fund may engage in such transactions.
Under the Dodd-Frank Act, certain swaps that were historically traded OTC must now be traded on an exchange or facility regulated by the CFTC and/or centrally cleared (central clearing interposes a central clearing house to each participant’s swap). Exchange trading and central clearing are intended to reduce counterparty credit risk and increase liquidity and transparency, but they do not make swap transactions risk-free. Moving trading to an exchange-type system may increase market transparency and liquidity but may require Funds to incur increased expenses to access the same types of cleared and uncleared swaps. Moreover, depending on the size of a Fund and other factors, the margin required under the clearinghouse rules and by a clearing member may be in excess of the collateral required to be posted by the Fund to support its obligations under a similar uncleared swap. But applicable regulators have also adopted rules imposing margin requirements, including minimums, on uncleared swaps, which may result in a Fund and its counterparties posting higher margin amounts for uncleared swaps as well. Recently adopted rules also require centralized reporting of detailed information about many types of cleared and uncleared swaps. Swaps data reporting may result in greater market transparency, but may subject a Fund to additional administrative burdens, and the safeguards established to protect trader anonymity may not function as expected. Implementing these new exchange trading, central clearing, margin and data reporting regulations may increase Fund’s cost of hedging risk and, as a result, may affect returns to Fund investors.
Credit Default Swaps. As described above, swap agreements are two party contracts entered into primarily by institutional investors for periods ranging from a few weeks to more than one year. In the case of a credit default swap (“CDS”), the contract gives one party (the buyer) the right to recoup the economic
Part II - 65
value of a decline in the value of debt securities of the reference issuer if the credit event (a downgrade or default) occurs. This value is obtained by delivering a debt security of the reference issuer to the party in return for a previously agreed payment from the other party (frequently, the par value of the debt security). CDS include credit default swaps, which are contracts on individual securities, and credit default swap indices (“CDX”), which are contracts on baskets or indices of securities.
Credit default swaps may require initial premium (discount) payments as well as periodic payments (receipts) related to the interest leg of the swap or to the default of a reference obligation. Under current SEC and staff requirements, in cases where a Fund is a seller of a CDS contract including a CDX contract, the Fund will segregate or earmark liquid assets equal the notional amount of the contract. Furthermore, a Fund will segregate or earmark liquid assets to cover any accrued payment obligations when it is the buyer of a CDS including CDX. In calculating the amount to be segregated for this purpose, the Fund is not considered to have an accrued payment obligation when it is the buyer of a CDS including a CDX when the contract is in a gain position as no additional amounts are owed to the counterparty. In cases where a Fund is a buyer of a CDS contract including a CDX contract, the Fund will segregate or earmark liquid assets equal to the mark-to-market value when the contract is in a loss position.
If a Fund is a seller of protection under a CDS contract, the Fund would be required to pay the par (or other agreed upon) value of a referenced debt obligation to the counterparty in the event of a default or other credit event by the reference issuer, such as a U.S. or foreign corporate issuer, with respect to such debt obligations. In return, a Fund would receive from the counterparty a periodic stream of payments over the term of the contract provided that no event of default has occurred. If no default occurs, a Fund would keep the stream of payments and would have no payment obligations. As the seller, a Fund would be subject to investment exposure on the notional amount of the swap.
If a Fund is a buyer of protection under a CDS contract, the Fund would have the right to deliver a referenced debt obligation and receive the par (or other agreed-upon) value of such debt obligation from the counterparty in the event of a default or other credit event (such as a downgrade in credit rating) by the reference issuer, such as a U.S. or foreign corporation, with respect to its debt obligations. In return, the Fund would pay the counterparty a periodic stream of payments over the term of the contract provided that no event of default has occurred. If no default occurs, the counterparty would keep the stream of payments and would have no further obligations to the Fund.
The use of CDSs, like all swap agreements, is subject to certain risks. If a counterparty’s creditworthiness declines, the value of the swap would likely decline. Moreover, there is no guarantee that a Fund could eliminate its exposure under an outstanding swap agreement by entering into an offsetting swap agreement with the same or another party. In addition to general market risks, CDSs involve liquidity, credit and counterparty risks. The recent increase in corporate defaults further raises these liquidity and credit risks, increasing the possibility that sellers will not have sufficient funds to make payments. As unregulated instruments, CDSs are difficult to value and are therefore susceptible to liquidity and credit risks. Counterparty risks also stem from the lack of regulation of CDSs. Collateral posting requirements are individually negotiated between counterparties and there is no regulatory requirement concerning the amount of collateral that a counterparty must post to secure its obligations under a CDS. Because they are unregulated, there is no requirement that parties to a contract be informed in advance when a CDS is sold. As a result, investors may have difficulty identifying the party responsible for payment of their claims.
If a counterparty’s credit becomes significantly impaired, multiple requests for collateral posting in a short period of time could increase the risk that the Fund may not receive adequate collateral. There is no readily available market for trading out of CDS contracts. In order to eliminate a position it has taken in a CDS, the Fund must terminate the existing CDS contract or enter into an offsetting trade. The Fund may only exit its obligations under a CDS contract by terminating the contract and paying applicable breakage fees, which could result in additional losses to the Fund. Furthermore, the cost of entering into an offsetting CDS position could cause the Fund to incur losses.
Under the Dodd-Frank Act, certain CDS indices are subject to mandatory central cleaning and exchange trading, which may reduce counterparty credit risk and increase liquidity compared to other credit default swap or CDS index transactions.
Synthetic Variable Rate Instruments
Synthetic variable rate instruments generally involve the deposit of a long-term tax exempt bond in a custody or trust arrangement and the creation of a mechanism to adjust the long-term interest rate on the bond to a variable short-term rate and a right (subject to certain conditions) on the part of the purchaser to
Part II - 66
tender it periodically to a third party at par. A Fund’s Adviser reviews the structure of synthetic variable rate instruments to identify credit and liquidity risks (including the conditions under which the right to tender the instrument would no longer be available) and will monitor those risks. In the event that the right to tender the instrument is no longer available, the risk to the Fund will be that of holding the long-term bond. In the case of some types of instruments credit enhancement is not provided, and if certain events occur, which may include (a) default in the payment of principal or interest on the underlying bond, (b) downgrading of the bond below investment grade or (c) a loss of the bond’s tax exempt status, then the put will terminate and the risk to the Fund will be that of holding a long-term bond.
Total Annual Fund Operating Expenses set forth in the fee table and Financial Highlights section of each Fund’s Prospectuses do not include any expenses associated with investments in certain structured or synthetic products that may rely on the exception for the definition of “investment company” provided by section 3(c)(1) or 3(c)(7) of the 1940 Act.
Treasury Receipts
A Fund may purchase interests in separately traded interest and principal component parts of U.S. Treasury obligations that are issued by banks or brokerage firms and are created by depositing U.S. Treasury notes and U.S. Treasury bonds into a special account at a custodian bank. Receipts include Treasury Receipts (“TRs”), Treasury Investment Growth Receipts (“TIGRs”), and Certificates of Accrual on Treasury Securities (“CATS”). Receipts in which an entity other than the government separates the interest and principal components are not considered government securities unless such securities are issued through the Treasury Separate Trading of Registered Interest and Principal of Securities (“STRIPS”) program.
Trust Preferred Securities
Certain Funds may purchase trust preferred securities, also known as “trust preferreds,” which are preferred stocks issued by a special purpose trust subsidiary backed by subordinated debt of the corporate parent. An issuer creates trust preferred securities by creating a trust and issuing debt to the trust. The trust in turn issues trust preferred securities. Trust preferred securities are hybrid securities with characteristics of both subordinated debt and preferred stock. Such characteristics include long maturities (typically 30 years or more), early redemption by the issuer, periodic fixed or variable interest payments, and maturities at face value. In addition, trust preferred securities issued by a bank holding company may allow deferral of interest payments for up to 5 years. Holders of trust preferred securities have limited voting rights to control the activities of the trust and no voting rights with respect to the parent company.
U.S. Government Obligations
U.S. government obligations may include direct obligations of the U.S. Treasury, including Treasury bills, notes and bonds, all of which are backed as to principal and interest payments by the full faith and credit of the U.S., and separately traded principal and interest component parts of such obligations that are transferable through the Federal book-entry system known as STRIPS and Coupons Under Book Entry Safekeeping (“CUBES”). The Funds may also invest in TIPS. U.S. government obligations are subject to market risk, interest rate risk and credit risk.
The principal and interest components of U.S. Treasury bonds with remaining maturities of longer than ten years are eligible to be traded independently under the STRIPS program. Under the STRIPS program, the principal and interest components are separately issued by the U.S. Treasury at the request of depository financial institutions, which then trade the component parts separately. The interest component of STRIPS may be more volatile than that of U.S. Treasury bills with comparable maturities.
Other obligations include those issued or guaranteed by U.S. government agencies, GSEs or instrumentalities. These obligations may or may not be backed by the “full faith and credit” of the U.S. Securities which are backed by the full faith and credit of the U.S. include obligations of the Government National Mortgage Association, the Farmers Home Administration, and the Export-Import Bank. In the case of securities not backed by the full faith and credit of the U.S., the Funds must look principally to the federal agency issuing or guaranteeing the obligation for ultimate repayment and may not be able to assert a claim against the U.S. itself in the event the agency or instrumentality does not meet its commitments. Securities in which the Funds may invest that are not backed by the full faith and credit of the U.S. include, but are not limited to: (i) obligations of the Tennessee Valley Authority, the Federal Home Loan Banks and the U.S. Postal Service, each of which has the right to borrow from the U.S. Treasury to meet its obligations; (ii) securities issued by Freddie Mac and Fannie Mae, which are supported only by the credit
Part II - 67
of such securities, but for which the Secretary of the Treasury has discretionary authority to purchase limited amounts of the agency’s obligations; and (iii) obligations of the Federal Farm Credit System and the Student Loan Marketing Association, each of whose obligations may be satisfied only by the individual credits of the issuing agency.
The total public debt of the United States and other countries around the globe as a percent of gross domestic product has grown rapidly since the beginning of the 2008 financial downturn and has accelerated in connection with the U.S. government's response to the COVID-19 pandemic. Although high debt levels do not necessarily indicate or cause economic problems, they may create certain systemic risks if sound debt management practices are not implemented. A high national debt level may increase market pressures to meet government funding needs, which may drive debt cost higher and cause a country to sell additional debt, thereby increasing refinancing risk. A high national debt also raises concerns that a government will not be able to make principal or interest payments when they are due. Unsustainable debt levels can cause devaluations of currency, prevent a government from implementing effective counter-cyclical fiscal policy in economic downturns, and contribute to market volatility. In addition, the high and rising national debt may adversely impact the U.S. economy and securities in which the Fund may invest. From time to time, uncertainty regarding the status of negotiations in the U.S. government to increase the statutory debt ceiling could: increase the risk that the U.S. government may default on payments on certain U.S. government securities; cause the credit rating of the U.S. government to be downgraded or increase volatility in both stock and bond markets; result in higher interest rates; reduce prices of U.S. Treasury securities; and/or increase the costs of certain kinds of debt.
In the past, U.S. sovereign credit has experienced downgrades and there can be no guarantee that it will not experience further downgrades in the future by rating agencies. The market prices and yields of securities supported by the full faith and credit of the U.S. Government may be adversely affected by a rating agency’s decision to downgrade the sovereign credit rating of the United States.
When-Issued Securities, Delayed Delivery Securities and Forward Commitments
Securities may be purchased on a when-issued or delayed delivery basis. For example, delivery of and payment for these securities can take place a month or more after the date of the purchase commitment. The purchase price and the interest rate payable, if any, on the securities are fixed on the purchase commitment date or at the time the settlement date is fixed. The value of such securities is subject to market fluctuation, and for money market instruments and other fixed income securities, no interest accrues to a Fund until settlement takes place. At the time a Fund makes the commitment to purchase securities on a when-issued or delayed delivery basis, it will record the transaction, reflect the value each day of such securities in determining its NAV and, if applicable, calculate the maturity for the purposes of average maturity from that date. At the time of settlement, a when-issued security may be valued at less than the purchase price. To facilitate such acquisitions, each Fund will earmark and reserve Fund assets, in cash or liquid securities, in an amount at least equal to such commitments. On delivery dates for such transactions, each Fund will meet its obligations from maturities or sales of the securities earmarked and reserved for such purpose and/or from cash flow. If a Fund chooses to dispose of the right to acquire a when-issued security prior to its acquisition, it could, as with the disposition of any other portfolio obligation, incur a gain or loss due to market fluctuation. Also, a Fund may be disadvantaged if the other party to the transaction defaults.
Forward Commitments. Securities may be purchased for delivery at a future date, which may increase their overall investment exposure and involves a risk of loss if the value of the securities declines prior to the settlement date. In order to invest a Fund’s assets immediately, while awaiting delivery of securities purchased on a forward commitment basis, short-term obligations that offer same-day settlement and earnings will normally be purchased. When a Fund makes a commitment to purchase a security on a forward commitment basis, cash or liquid securities equal to the amount of such Fund’s commitments will be reserved for payment of the commitment. For the purpose of determining the adequacy of the securities reserved for payment of commitments, the reserved securities will be valued at market value. If the market value of such securities declines, additional cash, cash equivalents or highly liquid securities will be reserved for payment of the commitment so that the value of the Fund’s assets reserved for payment of the commitments will equal the amount of such commitments purchased by the respective Fund.
Purchases of securities on a forward commitment basis may involve more risk than other types of purchases. Securities purchased on a forward commitment basis and the securities held in the respective Fund’s portfolio are subject to changes in value based upon the public’s perception of the issuer and changes, real or anticipated, in the level of interest rates. Purchasing securities on a forward commitment basis can involve the risk that the yields available in the market when the delivery takes place may actually
Part II - 68
be higher or lower than those obtained in the transaction itself. On the settlement date of the forward commitment transaction, the respective Fund will meet its obligations from then-available cash flow, sale of securities reserved for payment of the commitment, sale of other securities or, although it would not normally expect to do so, from sale of the forward commitment securities themselves (which may have a value greater or lesser than such Fund’s payment obligations). The sale of securities to meet such obligations may result in the realization of capital gains or losses. Purchasing securities on a forward commitment basis can also involve the risk of default by the other party on its obligation, delaying or preventing the Fund from recovering the collateral or completing the transaction.
To the extent a Fund engages in forward commitment transactions, it will do so for the purpose of acquiring securities consistent with its investment objective and policies and not for the purpose of investment leverage.
ADDITIONAL INFORMATION REGARDING FUND INVESTMENT PRACTICES
ESG Integration
Certain Funds disclose in their prospectuses that the adviser integrates financially material environmental, social, and governance (“ESG”) factors as part of the Fund’s investment process (“ESG Integration”). ESG Integration is the systematic inclusion of ESG issues in investment analysis and investment decisions. ESG Integration does not change a Fund’s investment objective, exclude specific types of companies or constrain a Fund’s investable universe. Environmental issues are defined as issues related to the quality and function of the natural environment and natural systems. Some examples include greenhouse gas emissions, climate change resilience, pollution (air, water, noise, and light), biodiversity/habitat protection and waste management. Social issues are defined as issues related to the rights, wellbeing and interests of people and communities. Some examples include workplace safety, cybersecurity and data privacy, human rights, local stakeholder relationships, and discrimination prevention. Governance issues are issues related to the way companies are managed and overseen. Some examples include independence of chair/board, fiduciary duty, board diversity, executive compensation and bribery and corruption. These examples of ESG issues are provided for illustrative purposes only and are not exhaustive. In addition, as ESG Integration focuses on financial materiality, not all ESG factors are relevant to a particular investment, asset class, or Fund.
ESG Integration for a Fund is dependent upon the availability of sufficient ESG information on the Fund’s investment universe. In addition, in order for a Fund to be considered ESG integrated, JPMIM requires: (1) portfolio management teams to consider proprietary research on the financial materiality of ESG issues on the Fund’s investments; (2) documentation of the adviser’s research views and methodology throughout the investment process; and (3) appropriate monitoring of ESG considerations in ongoing risk management and portfolio monitoring. ESG determinations may not be conclusive and securities of companies /issuers may be purchased and retained, without limit, by the adviser regardless of potential ESG impact. The impact of ESG Integration on a Fund’s performance is not specifically measurable as investment decisions are discretionary regardless of ESG considerations.
Investments in the Asia Pacific Region
The economies in the Asia Pacific region are in all stages of economic development and may be intertwined. The small size of securities markets and the low trading volume in some countries in the Asia Pacific region may lead to a lack of liquidity. The share prices of companies in the region tend to be volatile and there is a significant possibility of loss. Many of the countries in the region are developing, both politically and economically, and as a result companies in the region may be subject to risks like nationalization or other forms of government interference, and/or may be heavily reliant on only a few industries or commodities. Investments in the region may also be subject to currency risks, such as restrictions on the flow of money in and out of the country, extreme volatility relative to the U.S. dollar, and devaluation, all of which could decrease the value of a Fund.
Investments in the European Market
Some of the Funds may invest in securities in the European Market. A Fund’s performance will be affected by political, social and economic conditions in Europe, such as growth of the economic output (the gross national product), the rate of inflation, the rate at which capital is reinvested into European economies, the success of governmental actions to reduce budget deficits, the resource self-sufficiency of European countries and interest and monetary exchange rates between European countries. European financial markets may experience volatility due to concerns about high government debt levels, credit
Part II - 69
rating downgrades, rising unemployment, the future of the euro as a common currency, possible restructuring of government debt and other government measures responding to those concerns, and fiscal and monetary controls imposed on member countries of the European Union. The risk of investing in Europe may be heightened due to steps taken by the United Kingdom to exit the European Union. On January 31, 2020, the United Kingdom officially withdrew from the European Union. On December 30, 2020, the European Union and the United Kingdom signed the EU-UK Trade and Cooperation Agreement (“TCA”), an agreement on the terms governing certain aspects of the European Union’s and the United Kingdom’s relationship, many of which are still to be determined, including those related to financial services. Notwithstanding the TCA, significant uncertainty remains in the market regarding the ramifications of the United Kingdom’s withdrawal from the European Union. The impact on the United Kingdom and European economies and the broader global economy could be significant, resulting in increased volatility and illiquidity, currency fluctuations, impacts on arrangements for trading and on other existing cross-border cooperation arrangements (whether economic, tax, fiscal, legal, regulatory or otherwise), and in potentially lower growth for companies in the United Kingdom, Europe and globally, which could have an adverse effect on the value of a Fund’s investments. In addition, if one or more other countries were to exit the European Union or abandon the use of the euro as a currency, the value of investments tied to those countries or the euro could decline significantly and unpredictably.
Investments in the Commonwealth of Puerto Rico
The Commonwealth of Puerto Rico and certain of its instrumentalities are currently experiencing financial difficulties, including persistent government budget deficits, significant debt service obligations, underfunded government retirement systems, a high unemployment rate and tax erosion from significant out-migration. Since 2017, the Commonwealth of Puerto Rico has received bankruptcy-like protections from debt and unfunded pension obligations. In addition, Puerto Rico is prone to severe weather events and natural disasters. In September 2017, Hurricane Maria struck Puerto Rico, causing major damage to its water, power, and telecommunications infrastructure. Hurricane Maria and other severe weather events or natural disasters that may occur in the future could have a significant and long-lasting adverse impact on Puerto Rico’s economy.
The COVID-19 pandemic and the related governmental and public responses have had, and may continue to have, an adverse effect on Puerto Rico’s economy. Preventative or protective actions that governments have taken, and may continue to take, as a result of the pandemic has resulted in, and may continue to result in, periods of business disruption and reduced or disrupted operations, which could have long-term negative economic effects on Puerto Rico’s economy and Puerto Rico and local government budgets. Although vaccines for COVID-19 have been approved for emergency use, the timing of the administration of vaccines and the continued risk of variants or mutations of COVID-19, among other factors, make it impossible to predict the timing of an end to the pandemic.
A Fund’s investments in municipal securities may be affected by political and economic developments within the applicable municipality and by the financial condition of the municipality. Certain of the issuers in which a Fund may invest have recently experienced, or may experience, significant financial difficulties. For example, Puerto Rico, in particular, has been experiencing significant financial difficulties and has entered bankruptcy-like proceedings allowing it to halt debt payments pending the restructuring of its debt. A default by issuers of Puerto Rico municipal securities on their obligations under securities held by a Fund may adversely affect the Fund and cause the Fund to lose the value of its investment in such securities.
An insolvent municipality may take steps to reorganize its debt, which might include extending debt maturities, reducing the amount of principal or interest, refinancing the debt or taking other measures that may significantly affect the rights of creditors and the value of the securities issued by the municipality and the value of a Fund’s investments in those securities. Pursuant to Chapter 9 of the U.S. Bankruptcy Code, certain municipalities that meet specific conditions may be provided protection from creditors while they develop and negotiate plans for reorganizing their debts. The U.S. Bankruptcy Code provides that individual U.S. states are not permitted to pass their own laws purporting to bind non-consenting creditors to a restructuring of a municipality’s indebtedness, and thus all such restructurings must be pursuant to Chapter 9 of the Bankruptcy Code.
Municipal bankruptcies are relatively rare, and certain provisions of the U.S. Bankruptcy Code governing such bankruptcies are unclear and remain untested. Although Puerto Rico is a U.S. Territory, neither Puerto Rico nor its subdivisions or agencies are eligible to file under the U.S. Bankruptcy Code in order to seek protection from creditors or restructure their debt. In June 2016, the U.S. Supreme Court ruled that Puerto Rico legislation that would have allowed certain Puerto Rico public corporations to seek
Part II - 70
protection from creditors and to restructure their debt was unconstitutional. In the same month, the U.S. Congress passed the Puerto Rico Oversight, Management and Economic Stability Act (“PROMESA”), which established a federally-appointed fiscal oversight board (“Oversight Board”) to oversee Puerto Rico’s financial operations and possible debt restructuring. On May 3, 2017, the Oversight Board filed a debt restructuring petition in the U.S. District Court in Puerto Rico to seek bankruptcy-like protections from, at the time of the filing, approximately $74 billion in debt and approximately $48 billion in unfunded pension obligations. In addition to the debt restructuring petition filed on behalf of Puerto Rico, in May 2017, the Oversight Board separately filed debt restructuring petitions for certain Puerto Rico instrumentalities, including the Puerto Rico Highways and Transportation Authority (“HTA”), Puerto Rico Sales Tax Financing Corporation (“COFINA”), Puerto Rico Electric and Power Authority (“PREPA”) and Employee Retirement System. In February 2019, a federal judge approved a Plan of Adjustment reducing COFINA debt from $18 billion to $6 billion. More recently, on January 18, 2022, a federal judge approved a Plan of Adjustment under which the largest portion of Puerto Rico’s debt would be reduced from $33 billion to $7.4 billion. There continue to be ongoing efforts to restructure the debt of certain Puerto Rico instrumentalities, including $6 billion of HTA debt and $9 billion of PREPA debt. There can be no assurances that these debt restructuring efforts will be effective or that Puerto Rico will be able to service debt payments following the completion of the debt restructuring. In addition, any restructurings approved by a federal court could be appealed and overturned. The mediation process and certain litigation is ongoing with respect to certain municipal securities issued by Puerto Rico and its political subdivisions, instrumentalities and authorities. It is not presently possible to predict the results of this mediation and litigation, but such outcomes will have a significant impact on bondholders of those municipal securities. Further legislation by the U.S. Congress, or actions by the oversight board established by PROMESA, or court approval of an unfavorable debt restructuring deal could have a negative impact on the marketability, liquidity or value of certain investments held by a Fund and could reduce a Fund’s performance.
Investments in the Greater China Region
Investing in Mainland China, Hong Kong and Taiwan (collectively, “the China Region”) involves a high degree of risk and special considerations not typically associated with investing in other more established economies or securities markets. Such risks may include: (a) the risk of nationalization or expropriation of assets or confiscatory taxation; (b) greater social, economic and political uncertainty (including the risk of war); (c) dependency on exports and the corresponding importance of international trade; (d) the increasing competition from Asia’s other low-cost emerging economies; (e) greater price volatility and significantly smaller market capitalization of securities markets, particularly in Mainland China; (f) substantially less liquidity, particularly of certain share classes of Mainland Chinese securities; (g) currency exchange rate fluctuations and the lack of available currency hedging instruments; (h) higher rates of inflation; (i) controls on foreign investment and limitations on repatriation of invested capital and on a Fund’s ability to exchange local currencies for U.S. dollars; (j) greater governmental involvement in and control over the economy; (k) the risk that the Mainland Chinese government may decide not to continue to support the economic reform programs implemented since 1978 and could return to the prior, completely centrally planned, economy; (l) the fact that China Region companies, particularly those located in Mainland China, may be smaller, less seasoned and newly organized companies; (m) the difference in, or lack of, auditing and financial reporting standards which may result in unavailability of material information about issuers, particularly in Mainland China; (n) the fact that statistical information regarding the economy of Mainland China may be inaccurate or not comparable to statistical information regarding the U.S. or other economies; (o) the less extensive, and still developing, regulation of the securities markets, business entities and commercial transactions; (p) the fact that the settlement period of securities transactions in foreign markets may be longer; (q) the willingness and ability of the Mainland Chinese government to support the Mainland Chinese and Hong Kong economies and markets is uncertain; (r) the risk that it may be more difficult, or impossible, to obtain and/or enforce a judgment than in other countries; (s) the rapidity and erratic nature of growth, particularly in Mainland China, resulting in inefficiencies and dislocations; (t) the risk of embargoes, sanctions, investment restrictions and other trade limitations, including that certain securities are, or may in the future, become restricted, and a Fund may be forced to sell such restricted security and incur a loss as a result; and (u) the risk that, because of the degree of interconnectivity between the economies and financial markets of Mainland China, Hong Kong and Taiwan, any sizable reduction in the demand for goods from Mainland China, or an economic downturn in Mainland China, could negatively affect the economies and financial markets of Hong Kong and Taiwan, as well.
Investment in the China Region is subject to certain political risks. Following the establishment of the People’s Republic of China (“PRC”) by the Communist Party in 1949, the Mainland Chinese government renounced various debt obligations incurred by Mainland China’s predecessor governments, which
Part II - 71
obligations remain in default, and expropriated assets without compensation. There can be no assurance that the Mainland Chinese government will not take similar action in the future. An investment in a Fund involves risk of a total loss. The political reunification of Mainland China and Taiwan is a highly problematic issue and is unlikely to be settled in the near future. This situation poses a threat to Taiwan’s economy and could negatively affect its stock market. Mainland China has committed by treaty to preserve Hong Kong’s autonomy and its economic, political and social freedoms for fifty years from the July 1, 1997 transfer of sovereignty from Great Britain to Mainland China. However, if Mainland China would exert its authority so as to alter the economic, political or legal structures or the existing social policy of Hong Kong, investor and business confidence in Hong Kong could be negatively affected, which in turn could negatively affect markets and business performance.
As with all transition economies, Mainland China’s ability to develop and sustain a credible legal, regulatory, monetary, and socioeconomic system could influence the course of outside investment. Hong Kong is closely tied to Mainland China, economically and through China’s 1997 acquisition of the country as a Special Autonomous Region (SAR). Hong Kong’s success depends, in large part, on its ability to retain the legal, financial, and monetary systems that allow economic freedom and market expansion. In addition to the risks inherent in investing in the emerging markets, the risks of investing in Mainland China, Hong Kong, and Taiwan merit special consideration.
People’s Republic of China. The government of the PRC is dominated by the one-party rule of the Chinese Communist Party.
Mainland China’s economy has transitioned from a rigidly central-planned state-run economy to one that has been only partially reformed by more market-oriented policies. Although the Mainland Chinese government has implemented economic reform measures, reduced state ownership of companies and established better corporate governance practices, a substantial portion of productive assets in Mainland China are still owned by the Mainland Chinese government. The government continues to exercise significant control over regulating industrial development and, ultimately, control over Mainland China’s economic growth through the allocation of resources, controlling payment of foreign currency denominated obligations, setting monetary policy and providing preferential treatment to particular industries or companies.
Following years of steady growth, the pace of growth of Mainland China’s economy has relatively slowed, partly as a result of the government’s attempts to shift the economy away from export manufacturing and towards domestic consumption and to prevent the overheating of certain sectors. The slow down subjects Mainland China’s economy to significant risks, including economic, social, and political risks. Additionally, Mainland China’s economy remains heavily dependent on exports. The imposition of tariffs or other trade barriers or a downturn in the economy of a significant trading partner could adversely impact Mainland Chinese companies. Over the long term, Mainland China’s major challenges include dealing with its aging infrastructure, worsening environmental conditions and rapidly widening urban and rural income gap.
As with all transition economies, Mainland China’s ability to develop and sustain a credible legal, regulatory, monetary, and socioeconomic system could influence the course of outside investment. The Mainland Chinese legal system, in particular, constitutes a significant risk factor for investors. The Mainland Chinese legal system is based on statutes. Since the late 1970s, Chinese legislative bodies have promulgated laws and regulations dealing with various economic matters such as foreign investment, corporate organization and governance, commerce, taxation, and trade. However, despite the expanding body of law in Mainland China, legal precedent and published court decisions based on these laws are limited and non-binding. The interpretation and enforcement of these laws and regulations are uncertain.
Hong Kong. In 1997, Great Britain handed over control of Hong Kong to the Chinese mainland government. Since that time, Hong Kong has been governed by a semi-constitution known as the Basic Law, which guarantees a high degree of autonomy in certain matters until 2047, while defense and foreign affairs are the responsibility of the central government in Beijing. The chief executive of Hong Kong is appointed by the Mainland Chinese government. Hong Kong is able to participate in international organizations and agreements and it continues to function as an international financial center, with no exchange controls, free convertibility of the Hong Kong dollar and free inward and outward movement of capital. The Basic Law guarantees existing freedoms, including free speech and assembly, press, religion, and the right to strike and travel. Business ownership, private property, the right of inheritance and foreign investment are also protected by law. Mainland China has committed by treaty to preserve Hong Kong’s autonomy until 2047. However, as of July 2020, the Chinese Standing Committee of the National People’s Congress enacted the law of the PRC on Safeguarding National Security in the Hong Kong Special
Part II - 72
Administrative Region. As of the same month, Hong Kong is no longer afforded preferential economic treatment by the United States under U.S. law, and there is uncertainty as to how the economy of Hong Kong will be affected. If Mainland China were to exert its authority so as to alter the economic, political, or legal structures or the existing social policy of Hong Kong, investor and business confidence in Hong Kong could be negatively affected, which in turn could negatively affect markets and business performance.
Taiwan. For decades, a state of hostility has existed between Taiwan and the PRC. Beijing has long deemed Taiwan a part of the “one China” and has made a nationalist cause of recovering it. In the past, Mainland China has staged frequent military provocations off the coast of Taiwan and made threats of full-scale military action. Foreign trade has been the engine of rapid growth in Taiwan and has transformed the island into one of Asia’s great exporting nations. However, investing in Taiwan involves the possibility of the imposition of exchange controls, such as restrictions on the repatriation of Fund investments or on the conversion of local currency into foreign currencies. As an export-oriented economy, Taiwan depends on an open world trade regime and remains vulnerable to downturns in the world economy. Taiwanese companies continue to compete mostly on price, producing generic products or branded merchandise on behalf of multinational companies. Accordingly, these businesses can be particularly vulnerable to currency volatility and increasing competition from neighboring lower-cost countries. Moreover, many Taiwanese companies are heavily invested in Mainland China and other countries throughout Southeast Asia, making them susceptible to political events and economic crises in these parts of the region.
Mainland Chinese operating companies sometimes rely on variable interest entity (“VIE”) structures to raise capital from non-Chinese investors. In a VIE structure, a Mainland China-based operating company establishes an entity (typically offshore) that enters into service and other contracts with the Mainland Chinese company designed to provide economic exposure to the company. The offshore entity then issues exchange-traded shares that are sold to the public, including non-Chinese investors (such as a Fund). Shares of the offshore entity are not equity ownership interests in the Mainland Chinese operating company and therefore the ability of the offshore entity to control the activities at the Mainland Chinese company are limited and the Mainland Chinese company may engage in activities that negatively impact investment value. The VIE structure is designed to provide the offshore entity (and in turn, investors in the entity) with economic exposure to the Mainland Chinese company that replicates equity ownership, without actual equity ownership. VIE structures are used due to Mainland Chinese government prohibitions on foreign ownership of companies in certain industries and it is not clear that the contracts are enforceable or that the structures will otherwise work as intended.
On December 24, 2021, the China Securities Regulatory Commission (“CSRC”) published for consultation the Provisions of the State Council on the Administration of Overseas Securities Offering and Listing by Domestic Companies (Draft for Comments) and Administrative Measures for the Filing of Overseas Securities Offering and Listing by Domestic Companies (Draft for Comments) (together, the “Draft Rules”), which, in effect, require Chinese companies that pursue listings outside of Mainland China, including those that do so using the VIE structure, to make a filing with the CSRC. The Draft Rules propose that companies that are already listed using an existing VIE structure will be grandfathered. Although the Draft Rules effectively signal the CSRC’s acknowledgment of the VIE structure, they are not an endorsement. Further, there is no guarantee that the Draft Rules will ultimately be enacted in their current form and the final version of the Draft Rules may set out more stringent requirements that interfere with the operation of VIE structures by listed Chinese companies. Finally, it is unclear how the Draft Rules, and other laws and regulations promulgated by the CSRC and other government authorities from time to time, might impact Chinese companies that are currently using VIE structures, including how companies operating in "prohibited industries" will be affected, as well as investor appetite for such companies. Despite the Draft Rules and the CSRC’s publications that they do not object to the use of VIE structures for Mainland Chinese companies to raise capital from non-Chinese investors, there is no guarantee that the Mainland Chinese government or a Mainland Chinese regulator will not otherwise interfere with the operation of VIE structures.
Intervention by the Mainland Chinese government with respect to VIE structures could adversely affect the Mainland Chinese operating company’s performance, the enforceability of the offshore entity’s contractual arrangements with the Mainland Chinese company and the value of the offshore entity’s shares. Further, if the Mainland Chinese government determines that the agreements establishing the VIE structure do not comply with Mainland Chinese law and regulations, including those related to prohibitions on foreign ownership, the Mainland Chinese government could subject the Mainland Chinese company to penalties, revocation of business and operating licenses or forfeiture of ownership interests. The offshore entity’s control over the Mainland Chinese company may also be jeopardized if certain legal
Part II - 73
formalities are not observed in connection with the agreements, if the agreements are breached or if the agreements are otherwise determined not to be enforceable. If any of the foregoing were to occur, the market value of a Fund’s associated portfolio holdings would likely fall, causing substantial investment losses for the Fund.
In addition, Mainland Chinese companies listed on U.S. exchanges, including ADRs and companies that rely on VIE structures, may be delisted if they do not meet U.S. accounting standards and auditor oversight requirements. Delisting could significantly decrease the liquidity and value of the securities of these companies, decrease the ability of a Fund to invest in such securities and increase the cost of the Fund if it is required to seek alternative markets in which to invest in such securities.
Securities are listed on either the Shanghai and/or Shenzhen stock exchanges. Securities listed on these exchanges are divided into two classes, A shares, which are mostly limited to domestic investors, and B shares, which are allocated for both international and domestic investors. A Fund’s exposure to securities listed on either the Shanghai or Shenzhen exchanges will initially be through B shares. The government of Mainland China has announced plans to exchange B shares for A shares and to merge the two markets. Such an event may produce greater liquidity and stability for the combined markets. However, it is uncertain whether or the extent to which these plans will be implemented. In addition to B shares, a Fund may also invest in Hong Kong listed H shares, Hong Kong listed Red chips (which are companies owned by Mainland China enterprises, but are listed in Hong Kong), and companies that meet one of the following categories: the company is organized under the laws of, or has a principal office in China (including Hong Kong and Macau) or Taiwan; the principal securities market for the issuer is Mainland China or Taiwan; the issuer derives at least 50% of its total revenues or profits from goods that are produced or sold, investments made, or services performed in Mainland China or Taiwan; or at least 50% of the issuer’s assets are located in Mainland China or Taiwan.
Shanghai-Hong Kong Stock Connect and Shenzhen-Hong Kong Stock Connect. The Funds may invest in certain China A-Shares through the Shanghai-Hong Kong Stock Connect program or the Shenzhen-Hong Kong Stock Connect Program (the “Programs”). The Programs are securities trading and clearing linked programs developed by Hong Kong Exchanges and Clearing Limited (“HKEx”), the Hong Kong Securities Clearing Company Limited (“HKSCC”), Shanghai Stock Exchange (“SSE”), Shenzhen Stock Exchange (“SZSE”) and China Securities Depository and Clearing Corporation Limited (“ChinaClear”) with an objective to achieve mutual stock market access between Mainland China and Hong Kong. The Programs will allow foreign investors to trade certain SSE and SZSE listed China A-Shares through Hong Kong based brokers.
Trading through the Programs are subject to various risks described below, including liquidity risk, currency risk, legal and regulatory uncertainty risk, execution risk, operational risk, tax risk, counterparty risk and credit risk.
Securities purchased under each Program generally may not be sold, purchased or otherwise transferred other than through that Program in accordance with applicable rules. While each Program is not subject to individual investment quotas, daily investment quotas apply to all Program participants, which may restrict or preclude the Fund’s ability to purchase particular securities at a particular time. In addition, securities purchased through the Programs are subject to Mainland Chinese securities regulations that restrict the levels of foreign ownership in local securities which could require a Fund to sell securities if ownership of the securities exceeds applicable quotas. Furthermore, additional restrictions may preclude a Fund from being eligible to invest in certain securities traded through a Program. Because all trades in the Programs must be settled in Renminbi (“RMB”), the Mainland Chinese currency, investors must have timely access to a reliable supply of offshore RMB, which cannot be guaranteed. Trades through each Program are subject to certain requirements prior to trading which may limit the number of brokers that a Fund may use. This may affect the quality of execution received by a Fund. In addition, applicable laws may, under certain circumstances, require an investor to return profits obtained from the purchase and sale of shares.
The HKSCC provides clearing, settlement, nominee functions and other related services of the trades executed by Hong Kong market participants through an arrangement with ChinaClear. The PRC regulations, which include certain restrictions on selling and buying, will apply to all market participants. In the case of a sale, brokers must have access to certain information about the transaction prior to execution. Because of the various requirements and restrictions applicable to the Programs, a Fund may not be able to purchase and/or dispose of holdings of China A-Shares in a timely manner.
Part II - 74
To the extent that HKSCC is deemed to be performing safekeeping functions with respect to assets held through it, it should be noted that the Fund will have no legal relationship with HKSCC and no direct legal recourse against HKSCC in the event that the Fund suffers losses resulting from the performance or insolvency of HKSCC.
The Shanghai-Hong Kong Stock Connect Program began operation in November 2014 and the Shenzhen-Hong Kong Stock Connect Program began operation in December 2016. The relevant regulations relating to the Programs are untested and subject to change. There is no certainty as to how they will be applied which could adversely affect a Fund. The Programs require use of new information technology systems which may be subject to operational risk due to its cross-border nature. If the relevant systems fail to function properly, trading in the Shanghai and Shenzhen markets through the Programs could be disrupted.
As in other emerging and less developed markets, the legislative framework is only beginning to develop the concept of legal/formal ownership and of beneficial ownership or interest in securities in Mainland China. Consequently the applicable courts may consider that any nominee or custodian as registered holder of securities would have full ownership thereof and that a beneficial owner may have no rights whatsoever in respect thereof and may be limited in its ability to pursue claims against the issuer of a security. Additionally, the securities that a Fund may invest in through the Programs may present illiquidity and price volatility concerns and difficulty in determining market valuations of securities due to limited public information on issuers. Such securities may also be subject to limited regulatory oversight and an increased risk of being delisted or suspended. Suspensions or delistings may become widespread, and the length of suspension may be significant and difficult to predict. The Programs utilize an omnibus clearing structure, and a Fund’s shares will be registered in its custodian’s, subcustodian’s or clearing broker’s name on the HKSCC system and in HKSCC’s name on the ChinaClear system. This may limit a Fund’s adviser’s or subadviser’s ability to effectively manage a Fund, and may expose a Fund to the credit risk of its custodian or subcustodian or to greater risk of expropriation.
Similarly, HKSCC would be responsible for the exercise of shareholder rights with respect to corporate actions (including all dividends, rights issues, merger proposals or other shareholder votes). While HKSCC may provide investors with the opportunity to provide voting instructions, investors may not have sufficient time or the opportunity to consider proposals or provide instructions.
The Hong Kong Investor Compensation Fund covers losses in relation to defaults occurring on or after January 1, 2020 by securities brokers in Hong Kong on securities traded on a stock market operated by the SSE or the SZSE and in respect of which an order for sale or purchase is routed through the Programs. Otherwise, defaults with respect to investments in the Programs may not be covered by the China Securities Investor Protection Fund and, without the protection of such programs, will be subject to the risk of default by a broker in Mainland China. In the event ChinaClear defaults, HKSCC’s liabilities under its market contracts with clearing participants will be limited to assisting clearing participants with claims. While it is anticipated that HKSCC will act in good faith to seek recovery of the outstanding stocks and monies from ChinaClear through available legal channels or the liquidation of ChinaClear, there can be no assurances that it will do so, or that it will be successful in doing so. In this event, the Fund may not fully recover its losses and the process could be delayed.
The Programs will only operate on days when both the PRC and Hong Kong markets are open for trading and when banks in each applicable market are open on the corresponding settlement days and the Funds will only trade through each Program on days that they are open. There may be occasions when it is a normal trading day for the PRC market but the Fund cannot carry out any China A-Shares trading. A Fund may be subject to risks of price fluctuations in China A-Shares during the time when each Program is not trading as a result. Additionally, different fees and costs are imposed on foreign investors acquiring China A-Shares acquired through the Programs, and these fees and costs may be higher than comparable fees and costs imposed on owners of other securities providing similar investment exposure. There is uncertainty of whether and how certain gains on PRC securities will to be taxed, the possibility of the rules being changed and the possibility of taxes being applied retrospectively. Consequently, investors may be advantaged or disadvantaged depending upon the final outcome of how such gains will be taxed and when they subscribed and/or redeemed their shares.
Because the Programs are relatively new, the actual effect on the market for trading China A-Shares with the introduction of large numbers of foreign investors is unknown. The Programs are subject to regulations promulgated by regulatory authorities for the applicable exchanges and further regulations or
Part II - 75
restrictions, such as limitations on redemptions or suspension of trading, may adversely impact the Programs, if the authorities believe it necessary to assure orderly markets or for other reasons. There is no guarantee that the exchanges will continue to support the Programs in the future.
China Interbank Bond Market. The China Interbank Bond Market (“CIBM”) is an OTC market established in 1997, and accounts for approximately 90% of outstanding bond values of the total trading volume in the PRC. On CIBM, domestic institutional investors and certain foreign institutional investors can trade, on a one-to-one quote-driven basis, sovereign bonds, government bonds, corporate bonds, bond repos, bond lending, bills issued by the People’s Bank of China (“PBOC”) and other financial debt instruments. CIBM is regulated and supervised by the PBOC. The PBOC is responsible for, among others, promulgating the applicable CIBM listing, trading and operating rules, and supervising the market operators of CIBM. CIBM provides for two trading models: (i) bilateral negotiation and (ii) “click-and-deal.” The China Foreign Exchange Trading System (“CFETS”) is the unified trading platform for CIBM, on which all products are traded through independent bilateral negotiation on a transaction by transaction basis. A market-making mechanism has also been introduced to improve market liquidity and enhance efficiency with respect to trading on CIBM.
Once a transaction is agreed, the parties will, in accordance with the terms of the transaction, promptly send instructions for the delivery of bonds and funds. Parties are required to have sufficient bonds and funds for delivery on the agreed delivery date. China Central Depository & Clearing Co., Ltd (“CCDC”) will deliver bonds according to the instructions sent by the parties. Clearing banks will handle the transfer of funds and settlement of the payments of the bonds on behalf of the parties.
Certain Funds, including the Global Bond Opportunities Fund, Income Fund, Unconstrained Debt Fund, Emerging Markets Strategic Debt Fund, Global Allocation Fund, Emerging Markets Debt Fund, Core Plus Bond Fund, Short Duration Core Plus Fund, and JPMorgan Insurance Trust Global Allocation Portfolio, may invest in certain Chinese fixed income products traded on the CIBM through the “Mutual Bond Market Access between Mainland China and Hong Kong” (“Bond Connect”) program. The Bond Connect program is a new initiative launched in July 2017 established by CFETS, CCDC, Shanghai Clearing House (“SHCH”), and Hong Kong Exchanges and Clearing Limited (“HKEx”) and Central Moneymarkets Unit (“CMU”) of the Hong Kong Monetary Authority (“HKMA”) to facilitate investors from Mainland China and Hong Kong to trade in each other’s bond markets through connection between the Mainland China and Hong Kong financial institutions.
Under the prevailing PRC regulations, eligible foreign investors are allowed to invest in the bonds available on the CIBM through the northbound trading of Bond Connect (“Northbound Trading Link”). There is no investment quota for the Northbound Trading Link. Under the Northbound Trading Link, eligible foreign investors are required to appoint the CFETS or other institutions recognized by the PBOC as registration agents to apply for registration with the PBOC.
Cash deposited in the cash account of a Fund with the relevant onshore settlement agent will not be segregated. In the event of the bankruptcy or liquidation of the onshore settlement agent, the Fund will not have any proprietary rights to the cash deposited in such cash account and may face difficulty and/or encounter delays in recovering such assets, or may not be able to recover it in full or at all, in which case the Fund will suffer losses.
Market volatility and potential lack of liquidity due to low trading volume of certain debt securities in the China interbank bond market may result in prices of certain debt securities traded on such market to fluctuate significantly. A Fund is therefore subject to liquidity and volatility risks. The bid and offer spreads of the prices of such securities may be large, and the Fund may therefore incur significant trading and realization costs and may even suffer losses when selling such investments.
A Fund is also exposed to risks associated with settlement procedures and default of counterparties. The counterparty which has entered into a transaction with the Fund may default in its obligation to settle the transaction by delivery of the relevant security or by payment for value.
The Northbound Trading Link refers to the trading platform that is located outside of Mainland China and is connected to CFETS for eligible foreign investors to submit their trade requests for bonds circulated in the CIBM through Bond Connect. HKEx and CFETS will work together with offshore electronic bond trading platforms to provide electronic trading services and platforms to allow direct trading between eligible foreign investors and approved onshore dealers in Mainland China through CFETS.
Part II - 76
Eligible foreign investors may submit trade requests for bonds circulated in the CIBM through the Northbound Trading Link provided by offshore electronic bond trading platforms, which will in turn transmit their requests for quotation to CFETS. CFETS will send the requests for quotation to a number of approved onshore dealers (including market makers and others engaged in the market making business) in Mainland China. The approved onshore dealers will respond to the requests for quotation via CFETS, and CFETS will send its responses to those eligible foreign investors through the same offshore electronic bond trading platforms. Once the eligible foreign investor accepts the quotation, the trade is concluded on CFETS.
On the other hand, the settlement and custody of bond securities traded in the CIBM under Bond Connect are conducted through the settlement and custody link between the CMU, as an offshore custody agent, and the CCDC and the SHCH, as onshore custodian and clearing institutions in Mainland China. Under this settlement and custody link, CCDC or the SHCH will effect gross settlement of confirmed trades onshore and the CMU will process bond settlement instructions from the CMU members on behalf of eligible foreign investors in accordance with its relevant rules.
Pursuant to the prevailing regulations in Mainland China, the CMU, being the offshore custody agent recognized by the HKMA, opens omnibus nominee accounts with the onshore custody agent recognized by the PBOC (i.e., the CCDC and Interbank Clearing Company Limited). All bonds traded by eligible foreign investors will be registered in the name of the CMU, which will hold such bonds as a nominee owner.
A Fund’s investments in bonds through Bond Connect will be subject to a number of additional risks and restrictions that may affect the Fund’s investments and returns. Bond Connect is relatively new. Laws, rules, regulations, policies, notices, circulars or guidelines relating to Bond Connect (the “Applicable Bond Connect Regulations”) as published or applied by any of Bond Connect Authorities (as defined below) are untested and are subject to change from time to time. There can be no assurance that Bond Connect will not be restricted, suspended or abolished. If such event occurs, a Fund’s ability to invest in the CIBM through Bond Connect will be adversely affected. “Bond Connect Authorities” refers to the exchanges, trading systems, settlement systems, governmental, regulatory or tax bodies which provide services and/or regulate Bond Connect and activities relating to Bond Connect, including, without limitation, the PBOC, the HKMA, the HKEx, the CFETS, the CMU, the CCDC and the SHCH and any other regulator, agency or authority with jurisdiction, authority or responsibility in respect of Bond Connect.
Hedging activities under Bond Connect are subject to the Applicable Bond Connect Regulations and any prevailing market practice. There is no guarantee that a Fund will be able to carry out hedging transactions at terms which are satisfactory to the investment manager of the Fund and to the best interest of the Fund. A Fund may also be required to unwind its hedge in unfavorable market conditions.
Potential lack of liquidity due to low trading volume of certain fixed income securities in the CIBM may result in prices of certain fixed income securities traded on such market fluctuating significantly, which may expose a Fund to liquidity risks. In addition, the fixed income securities traded in the CIBM may be difficult or impossible to sell, and this would affect a Fund’s ability to acquire or dispose of such securities at their intrinsic value.
Although delivery-versus-payment (“DVP”) settlement (e.g., simultaneous delivery of security and payment) is the dominant settlement method adopted by CCDC and SHCH for all bond transactions in the CIBM, there is no assurance that settlement risks can be eliminated. In addition, DVP settlement practices in the PRC may differ from practices in developed markets. In particular, such settlement may not be instantaneous and be subject to a delay of a period of hours. Where the counterparty does not perform its obligations under a transaction or there is otherwise a failure due to CCDC or SHCH (as applicable), a Fund may sustain losses.
It is contemplated that the mainland Chinese authorities will reserve the right to suspend Northbound trading of Bond Connect, if necessary for ensuring an orderly and fair market and that risks are managed prudently. The relevant PRC government authority may also impose “circuit breakers” and other measures to halt or suspend Northbound trading. Where a suspension in the Northbound trading through Bond Connect is effected, a Fund’s ability to access the CIBM bond market will be adversely affected.
Under the prevailing Applicable Bond Connect Regulations, eligible foreign investors who wish to participate in Bond Connect may do so through an onshore settlement agent, offshore custody agent, registration agent or other third parties (as the case may be), who would be responsible for making the relevant filings and account opening with the relevant authorities. A Fund is therefore subject to the risk of default or errors on the part of such agents.
Part II - 77
Trading through Bond Connect is performed through newly developed trading platforms and operational systems. There is no assurance that such systems will function properly (in particular, under extreme market conditions) or will continue to be adapted to changes and developments in the market. In the event that the relevant systems fails to function properly, trading through Bond Connect may be disrupted. A Fund’s ability to trade through Bond Connect (and hence to pursue its investment strategy) may therefore be adversely affected. In addition, where a Fund invests in the CIBM through Bond Connect, it may be subject to risks of delays inherent in the order placing and/or settlement.
For a Fund’s investment under Bond Connect, although there is no quota restriction under the Applicable Bond Connect Regulations, relevant information about the Fund’s investments needs to be filed with PBOC and an updating filing may be required if there is any significant change to the filed information. It cannot be predicted whether PBOC will make any comments on or require any changes with respect to such information for the purpose of filing. If so required, a Fund will need to follow PBOC instructions and make the relevant changes accordingly, which, may not be in the best interests of the Fund and the Fund’s investors from a commercial perspective.
The CMU is the “nominee holder” of the bonds acquired by a Fund through Bond Connect. Although the Applicable Bond Connect Regulations expressly provide that investors enjoy the rights and interests of the bonds acquired through Bond Connect in accordance with applicable laws, how a beneficial owner (such as a Fund) of the relevant bonds exercises and enforces its rights over such securities in the courts in China is yet to be tested. Even if the concept of beneficial ownership is recognized under Chinese law, those securities may form part of the pool of assets of such nominee holder, which may be available for distribution to creditors upon liquidation of such nominee holder, and accordingly a beneficial owner may have no rights whatsoever in respect thereof.
Northbound trading through Bond Connect is able to be undertaken on days upon which the CIBM is open to trade, regardless of whether they are a public holiday in the domicile of a Fund. Accordingly, it is possible that bonds traded through Bond Connect may be subject to fluctuation at times when a Fund is unable to buy or sell bonds, as its globally-based intermediaries are not available to assist with trades. Accordingly, this may cause a Fund to be unable to realize gains, avoid losses or to benefit from an opportunity to invest in mainland CIBM bonds at an attractive price.
CIBM bonds under Northbound Trading of Bond Connect will be traded and settled in RMB. If a Fund issues classes denominated in a currency other than RMB, the Fund will be exposed to currency risk if the Fund invests in a RMB product due to the need for the conversion of the currency into RMB. A Fund will also incur currency conversion costs. Even if the price of the RMB asset remains the same when a Fund purchases and redeems, the Fund will still incur a loss when it converts the redemption proceeds into local currency if RMB has depreciated. Also, as a Fund may either settle CIBM bonds using offshore RMB (“CNH”) or by converting offshore currency into onshore RMB (“CNY”), any divergence between CNH and CNY may adversely impact investors.
People’s Republic of China Tax Considerations
Corporate Income Tax
If the Fund is considered a tax resident enterprise of the PRC, it will be subject to PRC corporate income tax (“CIT”) at 25% on its worldwide taxable income. If the Fund is considered a non-tax resident enterprise with a permanent establishment or place or establishment of business (“PE”) in the PRC, the profits attributable to that PE would be subject to CIT at 25%. Under the PRC CIT Law effective from January 1, 2008 and its implementation rules, a non-PRC tax resident enterprise without a PE in the PRC will generally be subject to withholding income tax (“WIT”) of 10% on its PRC sourced income, including but not limited to passive income (e.g. dividends, interest, gains arising from transfer of assets, etc.).
The Fund is intended to be managed and operated in such a manner that the Fund should not be treated as a tax resident enterprise of the PRC or a non-PRC tax resident enterprise with a PE in the PRC for CIT purposes, although due to uncertainty in tax laws and practices in the PRC, this result cannot be guaranteed.
Interest
Except for interest income from certain bonds (i.e., government bonds, local government bonds and railway bonds which are entitled to a 100% PRC CIT exemption and 50% PC CIT exemption respectively in accordance with the Implementation Rules to the Enterprise Income Tax Law and a circular dated March 19, 2016 on the Circular on Income Tax Policies on Interest Income from Railway Bonds under Caishui [2016] No. 30), non-PRC tax resident enterprises are subject to PRC WIT on the payment of
Part II - 78
interests on debt instruments issued by PRC tax resident enterprises, including bonds issued by enterprises established within the PRC. The general WIT rate applicable is 10%, subject to reduction under an applicable double tax treaty and agreement by the PRC tax authorities. Interest derived from government bonds issued by the in-charge Finance Bureau of the State Council and/or local government bonds approved by the State Council is exempt from PRC CIT under the PRC CIT Law.
On November 22, 2021, the Ministry of Finance and State Administration of Taxation jointly issued Circular 2021 No. 34 (“Circular 34”) to clarify that foreign institutional investors (including foreign institutional investors under Bond Connect) are temporarily exempt from PRC WIT and value-added tax (“VAT”) with respect to bond interest income derived in the PRC bond market for the period from November 7, 2021 to December 31, 2025. As this exemption is only temporary according to Circular 34, it remains unclear whether such an exemption will also apply after December 31, 2025 or what the PRC tax treatment will be after this date. It still remains to be confirmed as to the PRC WIT and VAT treatment with respect to non-government bond interest derived prior to November 7, 2018, being the date on which the WIT and VAT exemption for foreign institutional investors with respect to bond interest income derived from PRC bonds was first introduced.
Dividend
Under the current PRC CIT Law and its implementation rules, non-PRC tax resident enterprises are subject to PRC WIT on cash dividends and bonus distributions from PRC tax resident enterprises. The general WIT rate applicable is 10%, subject to reduction under an applicable double tax treaty and agreement by the PRC tax authorities.
Capital Gain
Based on the CIT Law and its implementation rules, “income from the transfer of property” sourced from the PRC by non-PRC tax resident enterprises should be subject to 10% PRC WIT unless exempt or reduced under an applicable tax treaty and agreement by the PRC tax authorities. The Ministry of Finance (“MoF”), State Administration of Taxation (“SAT”) and the CSRC issued joint circulars to clarify the taxation of the Programs, in which capital gain realized from the transfer of A-Shares is temporarily exempt from PRC WIT. The MoF, the SAT and the CSRC issued joint circulars Caishui [2014] No. 81 and Caishui [2016] No. 127 to clarify the taxation of the Programs, in which capital gain realized from the transfer of A-Shares via the Programs is temporarily exempt from PRC WIT.
Capital gains derived by non-resident institutional investors (with no place or establishment or permanent establishment in the PRC) from the trading of bonds through the Bond Connect are technically non-PRC-sourced income under the current CIT law and regulations, therefore, not subject to PRC CIT. While the PRC tax authorities are currently enforcing such non-taxable treatment in practice, there is a lack of clarity on such non-taxable treatment under the current CIT regulations.
VAT and Other Surcharges
According to the Circular Caishui [2016] 36 (“Circular 36”), VAT at 6% shall be levied on the difference between the selling and buying prices of those marketable securities.
The gains derived from trading of marketable securities (including A-Shares and other PRC listed securities) are exempted from VAT in the PRC under Circular 36 and Caishui [2016] No. 70. In addition, deposit interest income and interest received from government bonds and local government bonds are also exempt from VAT.
According to Circular 34, the foreign institutional investors are temporarily exempt from VAT with respect to bond interest income derived in the PRC bond market for the period from November 7, 2021 to December 31, 2025. However, there is no guarantee that such temporary tax exemption will continue to apply, will not be repealed and re-imposed retrospective, or that no new tax regulations and practice in China specifically relating to the PRC bond market will not be promulgated in the future. Dividend income or profit distributions on equity investment derived from PRC are not included in the taxable scope of VAT.
In addition, urban maintenance and construction tax (currently at the rate ranging from 1% to 7%), educational surcharge (currently at the rate of 3%) and local educational surcharge (currently at the rate of 2%) are imposed based on the VAT liabilities.
Stamp Duty
Part II - 79
Stamp duty under the PRC laws generally applies to the execution and receipt of all taxable documents listed in the PRC’s Provisional Rules on Stamp Duty. Stamp duty is generally imposed on the sale of PRC-listed shares at a rate of 0.1% of the sales consideration. The relevant Fund will be subject to this tax on each disposal of PRC listed shares. No stamp duty is expected to be imposed on non-PRC tax resident holders of government and corporate bonds, either upon issuance or upon a subsequent transfer of such bonds. Non-PRC tax resident shareholders will not be subject to PRC tax on distributions received from the Company or the relevant Fund, or on gains derived from the disposal of shares.
There can be no guarantee that no new tax laws, regulations and practice in the PRC specifically relating to the Programs or CIBM regime (as the case may be) may be promulgated in the future and may be applied retrospectively. The promulgation of such new laws, regulations and practice may operate to the advantage or disadvantage of the Shareholders due to the Company or the relevant Fund’s investments in the PRC market.
Investors should inform themselves of, and where appropriate consult their professional advisors on, the possible tax consequences of subscribing for, buying, holding, converting, redeeming or otherwise disposing of Shares under the laws of their country of citizenship, residence, or domicile or incorporation.
Investments in India
Securities of many issuers in the Indian market may be less liquid and more volatile than securities of comparable U.S. domestic issuers, but may offer the potential for higher returns over the long term. Indian securities will generally be denominated in foreign currency, mainly the rupee. Accordingly, the value of the Fund will fluctuate depending on the rate of exchange between the U.S. dollar and such foreign currency. India has less developed clearance and settlement procedures, and there have been times when settlements have been unable to keep pace with the volume of securities and have been significantly delayed. The Indian stock exchanges have in the past been subject to closure, broker defaults and broker strikes, and there can be no certainty that this will not recur. In addition, significant delays are common in registering transfers of securities and the Fund may be unable to sell securities until the registration process is completed and may experience delays in receipt of dividends and other entitlements.
The value of investments in Indian securities may also be affected by political and economic developments, social, religious or regional tensions, changes in government regulation and government intervention, high rates of inflation or interest rates and withholding tax affecting India. The risk of loss may also be increased because there may be less information available about Indian issuers since they are not subject to the extensive accounting, auditing and financial reporting standards and practices which are applicable in North America. There is also a lower level of regulation and monitoring of the Indian securities market and its participants than in other more developed markets.
Foreign investment in the securities of issuers in India is usually restricted or controlled to some degree. In addition, the availability of financial instruments with exposure to Indian financial markets may be substantially limited by the restrictions on investments by persons resident outside of India under the Foreign Portfolio Investment regime.
India’s guidelines under which foreign investors may invest in Indian securities are evolving. There can be no assurance that these investment control regimes will not change in a way that makes it more difficult or impossible for a Fund to implement investment objective or repatriate its income, gains and initial capital from these countries. Similar risks and considerations will be applicable to the extent that a Fund invests in other countries. Recently, certain policies have served to restrict foreign investment, and such policies may have the effect of reducing demand for such investments.
India may require withholding on dividends paid on portfolio securities and on realized capital gains. In the past, these taxes have sometimes been substantial. There can be no assurance that restrictions on repatriation of a Fund’s income, gains or initial capital from India will not occur.
A high proportion of the shares of many issuers in India may be held by a limited number of persons and financial institutions, which may limit the number of shares available for investment. In addition, further issuances, or the perception that such issuances may occur, of securities by Indian issuers in which a Fund has invested could dilute the earnings per share of a Fund’s investment and could adversely affect the market price of such securities. Sales of securities by such issuer’s major shareholders, or the perception that such sales may occur, may also significantly and adversely affect the market price of such securities and, in turn, a Fund’s investment. The prices at which investments may be acquired may be affected by trading by persons with material non-public information and by securities transactions by brokers in anticipation of transactions by a Fund in particular securities. Similarly, volume and liquidity in
Part II - 80
the bond markets in India are less than in the United States and, at times, price volatility can be greater than in the United States. The limited liquidity of securities markets in India may also affect a Fund’s ability to acquire or dispose of securities at the price and time it wishes to do so. In addition, India’s securities markets are susceptible to being influenced by large investors trading significant blocks of securities.
Political and economic structures in India are undergoing significant evolution and rapid development, and may lack the social, political and economic stability characteristic of the United States. The risks described above, including the risks of nationalization or expropriation of assets, may be heightened. In addition, unanticipated political or social developments may affect the values of investments in India and the availability of additional investments. The laws in India relating to limited liability of corporate shareholders, fiduciary duties of officers and directors, and the bankruptcy of state enterprises are generally less well developed than or different from such laws in the United States. It may be more difficult to obtain or enforce a judgment in the courts in India than it is in the United States. Monsoons and natural disasters also can affect the value of investments.
Religious and border disputes persist in India. Moreover, India has from time to time experienced civil unrest and hostilities with neighboring countries such as Pakistan. The Indian government has confronted separatist movements in several Indian states. The longstanding dispute with Pakistan over the bordering Indian state of Jammu and Kashmir, a majority of whose population is Muslim, remains unresolved. If the Indian government is unable to control the violence and disruption associated with these tensions, the results could destabilize the economy and consequently, adversely affect the Fund’s investments.
A Fund may use P-notes. Indian-based brokerages may buy Indian-based securities and then issue P-notes to foreign investors. Any dividends or capital gains collected from the underlying securities may be remitted to the foreign investors. However, unlike ADRs, notes are subject to credit risk based on the uncertainty of the counterparty’s (i.e., the Indian-based brokerage’s) ability to meet its obligations.
Investments in Japan
The Japanese economy may be subject to economic, political and social instability, which could have a negative impact on Japanese securities. In the past, Japan’s economic growth rate has remained relatively low, and it may remain low in the future. Furthermore, the Japanese economic growth rate could be impacted by Bank of Japan monetary policies, rising interest rates, tax increases, budget deficits, consumer confidence and volatility in the Japanese yen. At times, the Japanese economy has been adversely impacted by government intervention and protectionism, changes in its labor market, and an unstable financial services sector. International trade, government support of the financial services sector and other troubled sectors, government policy, natural disasters, an aging demographic and declining population and/or geopolitical developments associated with actual or potential conflicts with one or more countries in Asia could significantly affect the Japanese economy. Strained foreign relations with neighboring countries (China, South Korea, North Korea and Russia) may not only negatively impact the Japanese economy but also the geographic region as well as globally. A significant portion of Japan’s trade is conducted with developing nations and can be affected by conditions in these nations or by currency fluctuations. Japan is an island state with few natural resources and limited land area and is reliant on imports for its commodity needs. Any fluctuations or shortages in the commodity markets could have a negative impact on the Japanese economy. In addition, Japan's economy has in the past and could in the future be significantly impacted by natural disasters.
Investments in the Middle East and Africa
Certain countries in the region are in early stages of development. As a result, there may be a high concentration of market capitalization and trading volume in a small number of issuers representing a limited number of industries, as well as a high concentration of investors and financial intermediaries. Brokers may be fewer in number and less well capitalized than brokers in more developed regions. Certain economies in the region depend to a significant degree upon exports of commodities and are vulnerable to changes in commodity prices, which in turn may be affected by a variety of factors. In addition, certain governments in the region have exercised substantial influence over the private sector, including ownership or control of companies. Governmental actions in the future could have a significant economic impact. In particular, changes in investment policies or shifts in the prevailing political climate could result in the introduction of changes to Government regulations with respect to price controls, export and import controls, income and other taxes, foreign ownership restrictions, foreign exchange and currency controls and labor and welfare benefit policies. Unexpected changes in these policies or regulations could lead to increased investment, operating or compliance expenses. Any such changes could have a material adverse
Part II - 81
effect on the Fund and the Fund manager’s business, financial condition and results of operations. Certain armed conflict, territorial disputes, historical animosities, regional instability, terrorist activities and religious, ethnic and/or socioeconomic unrest. Such developments could have a negative effect on economic growth and could result in significant disruptions in the securities markets, including securities held by a Fund. Specific country risks that may have a material adverse effect on the Fund’s business, financial condition and results of operations are: potential political instability, riots or other forms of civil disturbance or violence; war, terrorism, invasion, rebellion or revolution; Government interventions, including expropriation or nationalization of assets, increased protectionism and the introduction of tariffs or subsidies; changing fiscal and regulatory regimes; arbitrary or inconsistent Government action; inflation in local economies; cancellation, nullification or unenforceability of contractual rights; and underdeveloped industrial and economic infrastructure. In particular, since late 2010, there have been significant civil disturbances and events resulting from political turmoil affecting several countries in the Middle East and North Africa ("MENA") Region, which to date have led to the collapse, or near collapse, of the political regimes of Syria, Tunisia, Egypt and Libya. There are on-going protests in other countries in the MENA Region, including strikes, demonstrations, marches and rallies. In addition, since late 2011 tensions between western nations and Iran in respect of Iran’s nuclear program have escalated, with Iran threatening to block the Strait of Hormuz and western nations implementing more severe economic sanctions against Iran. Such continuing instability and unrest in the MENA Region may significantly impact economies in the region. Such impacts could occur through a lower flow of foreign direct investment into the region, the outflow of expatriate residents or capital, or increased volatility in the global and regional financial markets. Certain Middle Eastern and African countries have currencies pegged to the U.S. dollar, which, if abandoned, could cause sudden and significant currency adjustments, which could impact the Fund’s investment returns in those countries. The legal systems, and the unpredictability thereof, in certain countries in the region also may have an adverse impact on the Fund and may expose the Fund to significant or unlimited liabilities. Investment in certain countries in the region by the Fund may be restricted or prohibited under applicable regulation, and the Fund, as a foreign investor, may be required to obtain approvals and may have to invest on less advantageous terms (including price) than nationals. A Fund’s investments in securities of a country in the region may be subject to economic sanctions or other government restrictions, which may negatively impact the value or liquidity of the Fund’s investments. Investments in the region may adversely impact the operations of the Fund through the delay of the Fund’s ability to exercise its rights as a security holder. Substantial limitations may exist in the region with respect to the Fund’s ability to repatriate investment income, capital gains or its investment. Securities which are subject to material legal restrictions on repatriation of assets will be considered illiquid securities by the Fund and subject to the limitations on illiquid investments.
Saudi Arabia. To the extent a Fund invests in securities issued by Saudi Arabian issuers, the Fund may be subject to the risk of investing in those issuers. Saudi Arabian issuers may be impacted by the Saudi Arabian economy, which is significantly tied to petroleum exports. As a result, a reduction in petroleum exports with key partners or in petroleum prices could have an overall impact on the Saudi Arabian economy. The Saudi Arabian economy also relies heavily on cheap, foreign labor, and changes in the availability of this labor supply could have an adverse effect on the economy.
Although liberalization in the wider Saudi Arabian economy is underway, the government of Saudi Arabia exercises substantial influence over many aspects of the private sector. Political instability in Saudi Arabia or instability in the larger Middle East region could adversely impact the economy of Saudi Arabia. Instability may be caused by, among other things: military developments; government interventions in the marketplace; terrorism; extremist attitudes; attempted social or political reforms; religious differences; and other factors. Additionally, anti-Western views held by certain groups in the Middle East may influence the government of Saudi Arabia’s policies regarding foreign investment. In addition, certain issuers located in Saudi Arabia may operate in, or have dealings with, countries subject to sanctions and/or embargoes imposed by the U.S. government and the United Nations and/or countries identified by the U.S. government as state sponsors of terrorism. As a result, an issuer may sustain damage to its reputation if it is identified as an issuer that operates in, or has dealings with, such countries. A Fund, as an investor in such issuers, will be indirectly subject to those risks. A Fund is also subject to the risk of expropriation or nationalization of assets and property or the risk of restrictions on foreign investments and repatriation of capital.
The ability of foreign investors, including the Funds, to invest in Saudi Arabian issuers is relatively new and untested, and such ability may be revoked or restricted by the government of Saudi Arabia in the future, which may materially affect a Fund. A Fund may be unable to obtain or maintain the required licenses, which would affect the Fund’s ability to buy and sell securities at full value. Additionally, a Fund’s
Part II - 82
ownership of any single issuer listed on the Saudi Arabian Stock Exchange may be limited by the Saudi Arabia Capital Market Authority (“CMA”). Major disruptions or regulatory changes may occur in the Saudi Arabian market, which could negatively impact the Funds.
The securities markets in Saudi Arabia may not be as developed as those in other countries. As a result, securities markets in Saudi Arabia are subject to greater risks associated with market volatility, lower market capitalization, lower trading volume, illiquidity, inflation, greater price fluctuations, uncertainty regarding the existence of trading markets, governmental control and heavy regulation of labor and industry. Shares of certain Saudi Arabian companies tend to trade less frequently than those of companies on exchanges in more developed markets, which may adversely affect the pricing of these securities and a Fund’s ability to sell these securities in the future. Current regulations in the Saudi Arabian securities markets may require a Fund to execute trades of securities through a single broker. As a result, the investment adviser will have less flexibility to choose among brokers on behalf of a Fund than is typically the case for investment managers.
A Fund’s ability to achieve its investment objective depends on the ability of the investment adviser to maintain its status as a Qualified Foreign Investor (“QFI”) with the CMA and the Fund as a client of a QFI who has been approved by the CMA (“QFI Client”). Even if a Fund obtains QFI Client status, the Fund may not have an exclusive investment quota and will be subject to foreign investment limitations and other regulations imposed by the CMA on QFIs and QFI Clients (individually and in the aggregate), as well as local market participants. QFI regulations and local market infrastructure are relatively new and have not been tested and the CMA may discontinue the QFI regime at any time. Any change in the QFI system generally, including the possibility of the investment adviser or a Fund losing its QFI or QFI Client status, respectively, may adversely affect the Fund.
A Fund is required to use a trading account to buy and sell securities in Saudi Arabia. This trading account can be held directly with a broker or a custodian. Under the Independent Custody Model (“ICM”), securities are under the control of the custodian and would be recoverable in the event of the bankruptcy of the custodian. When a Fund utilizes the ICM approach, the Fund relies on a broker standing instruction letter to authorize the Fund’s sub-custodian to move securities to a trading account for settlement based on the details supplied by the broker. The risk of a fraudulent or erroneous transaction through the ICM approach is mitigated by the short trading hours in Saudi Arabia, a manual pre-matching process conducted by the custodian, which validates a Fund’s settlement instructions with the local broker contract note, and the transaction report from the depository. When a Fund utilizes a direct broker trading account, the account is set up in the Fund’s name and the assets are likely to be separated from any other accounts at the broker. However, if the broker defaults, there may be a delay to recovering the Fund’s assets that are held in the broker account and legal proceedings may need to be initiated in order to do so.
Investments in Latin America
As an emerging market, Latin America has long suffered from political, economic, and social instability. For investors, this has meant additional risk caused by periods of regional conflict, political corruption, totalitarianism, protectionist measures, nationalization, hyperinflation, debt crises, sudden and large currency devaluation, and intervention by the military in civilian and economic spheres. However, democracy is beginning to become well established in some countries. A move to a more mature and accountable political environment is well under way. Domestic economies have been deregulated, privatization of state-owned companies is almost completed and foreign trade restrictions have been relaxed. Nonetheless, to the extent that events such as those listed above continue in the future, they could reverse favorable trends toward market and economic reform, privatization, and removal of trade barriers, and result in significant disruption in securities markets in the region. Investors in the region continue to face a number of potential risks. Governments of many Latin American countries have exercised and continue to exercise substantial influence over many aspects of the private sector. Governmental actions and political instability in the future could have a significant effect on economic conditions in Latin American countries, which could affect the companies in which a Fund invests and, therefore, the value of Fund shares. Other Latin American investment risks may include inadequate investor protection, less developed regulatory, accounting, auditing and financial standards, unfavorable changes in laws or regulations, pandemics, natural disasters, corruption and military activity.
Certain Latin American countries may experience sudden and large adjustments in their currency which, in turn, can have a disruptive and negative effect on foreign investors. In addition, some Latin American currencies have experienced steady devaluations relative to the U.S. dollar and certain Latin American countries have had to make major adjustments in their currencies from time to time. Certain Latin American countries may impose restrictions on the free conversion of their currency into foreign
Part II - 83
currencies, including the U.S. dollar. There is no significant foreign exchange market for many currencies and it would, as a result, be difficult for certain Funds to engage in foreign currency transactions designed to protect the value of the Funds’ interests in securities denominated in such currencies.
International economic conditions, particularly those in the United States, as well as world prices for oil and other commodities may also influence certain Latin American economies. Because commodities such as oil, gas, minerals and metals represent a significant percentage of the region’s exports, the economies of Latin American countries are particularly sensitive to fluctuations in commodity prices. As a result, the economies in many of these countries can experience significant volatility.
Almost all of the region’s economies have become highly dependent upon foreign credit and loans from external sources to fuel their state-sponsored economic plans. Government profligacy and ill-conceived plans for modernization have exhausted these resources with little benefit accruing to the economy and most countries have been forced to restructure their loans or risk default on their debt obligations. In addition, interest on the debt is subject to market conditions and may reach levels that would impair economic activity and create a difficult and costly environment for borrowers. Accordingly, these governments may be forced to reschedule or freeze their debt repayment, which could negatively affect the stock market. Latin American economies that depend on foreign credit and loans could fall into recession because of tighter international credit supplies in a global economic crisis.
Substantial limitations may exist in certain countries with respect to a Fund’s ability to repatriate investment income, capital or the proceeds of sales of securities. A Fund could be adversely affected by delays in, or a refusal to grant, any required governmental approval for repatriation of capital, as well as by the application to the Fund of any restrictions on investments.
Certain Latin American countries have entered into regional trade agreements that are designed to, among other things, reduce barriers between countries, increase competition among companies and reduce government subsidies in certain industries. No assurance can be given that these changes will be successful in the long term, or that these changes will result in the economic stability intended. There is a possibility that these trade arrangements will not be fully implemented, or will be partially or completely unwound. It is also possible that a significant participant could choose to abandon a trade agreement, which could diminish its credibility and influence. Any of these occurrences could have adverse effects on the markets of both participating and non-participating countries, including sharp appreciation or depreciation of participants’ national currencies and a significant increase in exchange rate volatility, a resurgence in economic protectionism, an undermining of confidence in the Latin American markets, an undermining of Latin American economic stability, the collapse or slowdown of the drive towards Latin American economic unity, and/or reversion of the attempts to lower government debt and inflation rates that were introduced in anticipation of such trade agreements. Such developments could have an adverse impact on a Fund’s investments in Latin America generally or in specific countries participating in such trade agreements.
Terrorism and related geo-political risks have led, and may in the future lead, to increased short-term market volatility and may have adverse long-term effects on world economies and markets generally.
Investments in Russia
Investing in Russian securities is highly speculative and involves significant risks and special considerations not typically associated with investing in the securities markets of the U.S. and most other developed countries.
Over the past century, Russia has experienced political, social and economic turbulence and has endured decades of communist rule under which the property of tens of millions of its citizens was collectivized into state agricultural and industrial enterprises. Since the collapse of the Soviet Union, Russia’s government has been faced with the daunting task of stabilizing its domestic economy, while transforming it into a modern and efficient structure able to compete in international markets and respond to the needs of its citizens. However, to date, many of the country’s economic reform initiatives have not been successful. In this environment, there is the risk that the Russian government will alter its political and economic policies in ways that would be detrimental to the interests of foreign investors.
Recently, the Russian government has asserted its regional geopolitical influence, including through military measures, which has increased tensions both with Russia’s neighbors and with other countries. Further possible actions by Russia could lead to greater adverse impact for the Russian economy.
Part II - 84
Many of Russia’s businesses have failed to mobilize the available factors of production because the country’s privatization program virtually ensured the predominance of the old management teams that are largely non-market-oriented in their management approach. Poor accounting standards, inept management, pervasive corruption, insider trading and crime, and inadequate regulatory protection for the rights of investors all pose a significant risk, particularly to foreign investors. In addition, there is the risk that the Russian tax system will be enforced inconsistently or in an arbitrary manner or that exorbitant taxes will be imposed.
Compared to most national stock markets, the Russian securities market suffers from a variety of problems not encountered in more developed markets. There is little long-term historical data on the Russian securities market because it is relatively new and a substantial proportion of securities transactions in Russia are privately negotiated outside of stock exchanges. The inexperience of the Russian securities market and the limited volume of trading in securities in the market may make obtaining accurate prices on portfolio securities from independent sources more difficult than in more developed markets. Additionally, because of less stringent auditing and financial reporting standards that apply to companies operating in Russia, there is little solid corporate information available to investors. As a result, it may be difficult to assess the value or prospects of an investment in Russian companies. Stocks of Russian companies also may experience greater price volatility than stocks of U.S. companies.
Settlement, clearing and registration of securities transactions in Russia are subject to additional risks because of the recent formation of the Russian securities market, the underdeveloped state of the banking and telecommunications systems, and the overall legal and regulatory framework. Prior to 2013, there was no central registration system for equity share registration in Russia and registration was carried out by either the issuers themselves or by registrars located throughout Russia. Such registrars were not necessarily subject to effective state supervision nor were they licensed with any governmental entity, thereby increasing the risk that a Fund could lose ownership of its securities through fraud, negligence, or even mere oversight. With the implementation of the National Settlement Depository (“NSD”) in Russia as a recognized central securities depository, title to Russian equities is now based on the records of the Depository and not the registrars. Although the implementation of the NSD has enhanced the efficiency and transparency of the Russian securities market, issues resulting in loss still might occur. In addition, issuers and registrars are still prominent in the validation and approval of documentation requirements for corporate action processing in Russia. Because the documentation requirements and approval criteria vary between registrars and/or issuers, there remain unclear and inconsistent market standards in the Russian market with respect to the completion and submission of corporate action elections. To the extent that a Fund suffers a loss relating to title or corporate actions relating to its portfolio securities, it may be difficult for the Fund to enforce its rights or otherwise remedy the loss.
The Russian economy is heavily dependent upon the export of a range of commodities including most industrial metals, forestry products, oil, and gas. Accordingly, it is strongly affected by international commodity prices and is particularly vulnerable to any weakening in global demand for these products. Over the long-term, Russia faces challenges including a shrinking workforce, high levels of corruption, difficulty in accessing capital for smaller, non-energy companies, and poor infrastructure in need of large investments.
Foreign investors also face a high degree of currency risk when investing in Russian securities and a lack of available currency hedging instruments. In addition, there is a risk that the government may impose capital controls on foreign portfolio investments in the event of extreme financial or political crisis. Such capital controls would prevent the sale of a portfolio of foreign assets and the repatriation of investment income and capital. These risks may cause flight from the ruble into U.S. dollars and other currencies.
The United States and the European Union have in the past, and may in the future, impose sanctions on certain Russian entities and individuals and certain sectors of Russia’s economy, which may result in, among other things, the devaluation of Russian currency, a downgrade in the country’s credit rating, and/or a decline in the value and liquidity of Russian securities, property or interests. The United States and other nations or international organizations may impose additional economic sanctions or take other actions that may adversely affect Russia-exposed issuers and companies in various sectors of the Russian economy, including, but not limited to, the financials, energy, metals and mining, engineering, and defense and defense-related materials sectors. These sanctions, or even the threat of further sanctions, may result in the decline of the value and liquidity of Russian securities, a weakening of the ruble or other adverse consequences to the Russian economy. These sanctions could also result in the immediate freeze of Russian securities and/or funds invested in prohibited assets, impairing the ability of a Fund to buy, sell, receive or deliver those securities and/or assets.
Part II - 85
Sanctions could also result in Russia taking counter measures or retaliatory actions which may further impair the value and liquidity of Russian securities. In February 2022, Russia launched a large-scale invasion of Ukraine and has been the subject of economic sanctions imposed by countries throughout the world, including the United States. Any retaliatory actions by Russia may further impair the value and liquidity of a Fund’s portfolio and potentially disrupt its operations. Uncertainty as to future relations between Russia and the United States or the European Union may also cause a decline in the value of a Fund’s shares.
Terrorism and related geo-political risks have led, and may in the future lead, to increased short-term market volatility and may have adverse long-term effects on world economies and markets generally.
RISK MANAGEMENT
Each Fund may employ non-hedging risk management techniques. Risk management strategies are used to keep the Funds fully invested and to reduce the transaction costs associated with cash flows into and out of a Fund. The Funds use a wide variety of instruments and strategies for risk management and the examples below are not meant to be exhaustive.
Examples of risk management strategies include synthetically altering the duration of a portfolio or the mix of securities in a portfolio. For example, if the Adviser wishes to extend maturities in a fixed income portfolio in order to take advantage of an anticipated decline in interest rates, but does not wish to purchase the underlying long-term securities, it might cause a Fund to purchase futures contracts on long term debt securities. Likewise, if the Adviser wishes to gain exposure to an instrument but does not wish to purchase the instrument it may use swaps and related instruments. Similarly, if the Adviser wishes to decrease exposure to fixed income securities or purchase equities, it could cause the Fund to sell futures contracts on debt securities and purchase futures contracts on a stock index. Such non-hedging risk management techniques involve leverage, and thus, present, as do all leveraged transactions, the possibility of losses as well as gains that are greater than if these techniques involved the purchase and sale of the securities themselves rather than their synthetic derivatives.
LIQUIDITY RISK MANAGEMENT PROGRAM
The Funds (other than the Money Market Funds), have adopted a Liquidity Risk Management Program (the “Program”) under Rule 22e-4 under the Investment Company Act of 1940 (the “Liquidity Risk Management Rule”). Effective October 31, 2021, the Program has been amended for all non-Money Market Funds with the exception of the Access Balanced Fund and Access Growth Fund (collectively, the “Access Funds”) to reflect the exemptions from certain provisions of the Liquidity Risk Management Rule and certain reporting requirements as permitted by the Exemptive Order issued by the SEC to the Funds on January 21, 2021 (the “Exemptive Order”). Under the Program, the Funds limit Illiquid Investments that are assets to 15% of the Fund’s net assets (“Illiquid Limit”) and report to the Board and SEC within specified time periods of a Fund exceeding its 15% Illiquid Limit. For the Access Funds, “Illiquid Investments” are defined under the Liquidity Risk Management Rule as any investment the Fund reasonably expects cannot be sold or disposed of in current market conditions in 7 calendar days or less without the sale or disposition significantly changing the market value of the investment. For purposes of determining compliance with the Illiquid Limit, only Illiquid Investments that have positive values are used in the numerator, and Illiquid Investments with negative values should not be netted against Illiquid Investments with positive values. For all other Funds, an “Illiquid Investment” is defined pursuant to the Exemptive Order as any portfolio investment that the Fund reasonably expects could not be sold within three trading days without the sale or disposition significantly changing the market value of the investment.
SPECIAL FACTORS AFFECTING CERTAIN FUNDS
In addition to the investment strategies and policies described above, certain Funds may employ other investment strategies and policies, or similar strategies and policies to a greater extent, and, therefore, may be subject to additional risks or similar risks to a greater extent. For instance, certain Funds which invest in certain state specific securities may be subject to special considerations regarding such investments. For a description of such additional investment strategies and policies as well as corresponding risks for such Funds, see Part I of this SAI.
Part II - 86
RISK RELATED TO MANAGEMENT OF CERTAIN SIMILAR FUNDS
The name, investment objective and policies of certain Funds are similar to other funds advised by the adviser or its affiliates. However, the investment results of the Fund may be higher or lower than, and there is no guarantee that the investment results of the Fund will be comparable to, any other of the funds.
DIVERSIFICATION
Certain Funds are diversified funds and as such intend to meet the diversification requirements of the 1940 Act. Please refer to the Funds’ SAI Part I for information about whether a Fund is a diversified or non-diversified Fund. Current 1940 Act diversification requirements require that with respect to 75% of the assets of a Fund, the Fund may not invest more than 5% of its total assets in the securities of any one issuer or own more than 10% of the outstanding voting securities of any one issuer, except cash or cash items, obligations of the U.S. government, its agencies and instrumentalities, and securities of other investment companies. As for the other 25% of a Fund’s assets not subject to the limitation described above, there is no limitation on investment of these assets under the 1940 Act, so that all of such assets may be invested in securities of any one issuer. Investments not subject to the limitations described above could involve an increased risk to a Fund should an issuer be unable to make interest or principal payments or should the market value of such securities decline.
Each of the Money Market Funds intends to comply with the diversification requirements imposed by Rule 2a-7 of the 1940 Act.
Certain other Funds are registered as non-diversified investment companies. A Fund is considered “non-diversified” because a relatively high percentage of the Fund’s assets may be invested in the securities of a single issuer or a limited number of issuers, primarily within the same economic sector. A non-diversified Fund’s portfolio securities, therefore, may be more susceptible to any single economic, political, or regulatory occurrence than the portfolio securities of a more diversified investment company.
Regardless of whether a Fund is diversified under the 1940 Act, all of the Funds will comply with the diversification requirements imposed by the Code for qualification as a regulated investment company. See “Distributions and Tax Matters.”
DISTRIBUTIONS AND TAX MATTERS
The following discussion is a brief summary of some of the important federal (and, where noted, state) income tax consequences affecting each Fund and its shareholders. There may be other tax considerations applicable to particular shareholders. Except as otherwise noted in a Fund’s Prospectus, the Funds are not intended for foreign shareholders. As a result, this section does not address in detail the tax consequences affecting any shareholder who, as to the U.S., is a nonresident alien individual, foreign trust or estate, foreign corporation, or foreign partnership. This section is based on the Code, the regulations thereunder, published rulings and court decisions, all as currently in effect. These laws are subject to change, possibly on a retroactive basis. The following tax discussion is very general; therefore, prospective investors are urged to consult their tax advisors about the impact an investment in a Fund may have on their own tax situations and the possible application of foreign, state and local law.
Each Fund generally will be treated as a separate entity for federal income tax purposes, and thus the provisions of the Code generally will be applied to each Fund separately. Net long-term and short-term capital gain, net income and operating expenses therefore will be determined separately for each Fund.
Special tax rules apply to investments held through defined contribution plans and other tax-qualified plans. Shareholders should consult their tax advisors to determine the suitability of shares of the Fund as an investment through such plans.
Qualification as a Regulated Investment Company
Each Fund intends to elect to be treated and qualify each year as a regulated investment company under Subchapter M of the Code. In order to qualify for the special tax treatment accorded regulated investment companies and their shareholders, each Fund must, among other things:
(a)
derive at least 90% of its gross income for each taxable year from (i) dividends, interest, payments with respect to certain securities loans, and gain from the sale or other disposition of stock, securities, or foreign currencies, or other income (including, but not limited to, gain from
Part II - 87
options, swaps, futures, or forward contracts) derived with respect to its business of investing in such stock, securities, or currencies and (ii) net income derived from interests in “qualified publicly traded partnerships” (“QPTPs,” defined below);
(b)
diversify its holdings so that, at the end of each quarter of the Fund’s taxable year, (i) at least 50% of the market value of the Fund’s total assets is represented by cash and cash items, U.S. government securities, securities of other regulated investment companies, and other securities, limited in respect of any one issuer to an amount not greater than 5% of the value of the Fund’s total assets and not more than 10% of the outstanding voting securities of such issuer, and (ii) not more than 25% of the value of the Fund’s total assets is invested (x) in the securities (other than cash or cash items, or securities issued by the U.S. government or other regulated investment companies) of any one issuer or of two or more issuers that the Fund controls and that are engaged in the same, similar, or related trades or businesses, or (y) in the securities of one or more QPTPs. In the case of a Fund’s investments in loan participations, the Fund shall treat both the financial intermediary and the issuer of the underlying loan as an issuer for the purposes of meeting this diversification requirement; and
(c)
distribute with respect to each taxable year at least 90% of the sum of its investment company taxable income (as that term is defined in the Code, without regard to the deduction for dividends paid — generally, taxable ordinary income and any excess of net short-term capital gain over net long-term capital loss) and net tax-exempt interest income, for such taxable year.
In general, for purposes of the 90% gross income requirement described in paragraph (a) above, income derived from a partnership will be treated as qualifying income only to the extent such income is attributable to items of income of the partnership which would be qualifying income if realized by the regulated investment company. However, 100% of the net income derived from an interest in a “qualified publicly traded partnership” (defined as a partnership (x) interests in which are traded on an established securities markets or readily tradable on a secondary market as the substantial equivalents thereof, (y) that derives at least 90% of its income from passive income sources defined in Section 7704(d) of the Code, and (z) that derives less than 90% of its income from the qualifying income described in (a)(i) above) will be treated as qualifying income. Although income from a QPTP is qualifying income, as discussed above, investments in QPTPs cannot exceed 25% of the Fund’s assets. In addition, although in general the passive loss rules of the Code do not apply to regulated investment companies, such rules do apply to a regulated investment company with respect to items attributable to an interest in a QPTP.
Gains from foreign currencies (including foreign currency options, foreign currency swaps, foreign currency futures and foreign currency forward contracts) currently constitute qualifying income for purposes of the 90% test, described in paragraph (a) above. However, the Treasury Department has the authority to issue regulations (possibly with retroactive effect) excluding from the definition of “qualifying income” a fund’s foreign currency gains to the extent that such income is not directly related to the fund’s principal business of investing in stock or securities.
For purposes of paragraph (b) above, the term “outstanding voting securities of such issuer” will include the equity securities of a QPTP. A Fund’s investment in MLPs may qualify as an investment in (1) a QPTP, (2) a “regular” partnership, (3) a “passive foreign investment company” (a “PFIC”) or (4) a corporation for U.S. federal income tax purposes. The treatment of particular MLPs for U.S. federal income tax purposes will affect the extent to which a Fund can invest in MLPs. The U.S. federal income tax consequences of a Fund’s investments in “PFICs” and “regular” partnerships are discussed in greater detail below.
If a Fund qualifies for a taxable year as a regulated investment company that is accorded special tax treatment, the Fund will not be subject to federal income tax on income distributed in a timely manner to its shareholders in the form of dividends (including Capital Gain Dividends, defined below). If a Fund were to fail to qualify as a regulated investment company accorded special tax treatment in any taxable year, the Fund would be subject to taxation on its taxable income at corporate rates, and all distributions from earnings and profits, including any distributions of net tax-exempt income and net long-term capital gain, would be taxable to shareholders as ordinary income. Some portions of such distributions may be eligible for the dividends-received deduction in the case of corporate shareholders and for treatment as qualified dividend income in the case of individual shareholders. In addition, the Fund could be required to recognize unrealized gain, pay substantial taxes and interest, and make substantial distributions before re-qualifying as a regulated investment company that is accorded special tax treatment.
Part II - 88
Each Fund intends to distribute at least annually to its shareholders all or substantially all of its investment company taxable income (computed without regard to the dividends-paid deduction) and may distribute its net capital gain (that is the excess of net long-term capital gain over net short-term capital loss). Investment company taxable income which is retained by a Fund will be subject to tax at regular corporate tax rates. A Fund might also retain for investment its net capital gain. If a Fund does retain such net capital gain, such gain will be subject to tax at regular corporate rates on the amount retained, but the Fund may designate the retained amount as undistributed capital gain in a notice to its shareholders who (i) will be required to include in income for federal income tax purposes, as long-term capital gain, their respective shares of the undistributed amount, and (ii) will be entitled to credit their respective shares of the tax paid by the Fund on such undistributed amount against their federal income tax liabilities, if any, and to claim refunds to the extent the credit exceeds such liabilities. For federal income tax purposes, the tax basis of shares owned by a shareholder of a Fund will be increased by an amount equal under current law to the difference between the amount of undistributed capital gain included in the shareholder’s gross income and the tax deemed paid by the shareholder under clause (ii) of the preceding sentence.
In determining its net capital gain, including in connection with determining the amount available to support a Capital Gain Dividend, its taxable income and its earnings and profits, a Fund may elect to treat part or all of any post-October capital loss (defined as any net capital loss attributable to the portion of the taxable year after October 31, or if there is no net capital loss, any net long-term capital loss or any net short-term capital loss attributable to the portion of the taxable year after that date) or late-year ordinary loss (generally, (i) net ordinary loss from the sale, exchange or other taxable disposition of property, attributable to the portion of the taxable year after October 31, plus (ii) other net ordinary loss attributable to the portion of the taxable year after December 31) as if incurred in the succeeding taxable year.
Excise Tax on Regulated Investment Companies
If a Fund fails to distribute in a calendar year an amount at least equal to the sum of 98% of its ordinary income (taking into account certain deferrals and elections) for such year and 98.2% of its capital gain net income (adjusted for certain ordinary losses) for the one-year period ending October 31 (or later if the Fund is permitted to elect and so elects), plus any retained amount from the prior year, the Fund will be subject to a nondeductible 4% excise tax on the undistributed amounts. The Funds intend to make distributions sufficient to avoid imposition of the 4% excise tax, although each Fund reserves the right to pay an excise tax rather than make an additional distribution when circumstances warrant (e.g., the excise tax amount is deemed by a Fund to be de minimis). Certain derivative instruments give rise to ordinary income and loss. If a Fund has a taxable year that begins in one calendar year and ends in the next calendar year, the Fund will be required to make this excise tax distribution during its taxable year. There is a risk that a Fund could recognize income prior to making this excise tax distribution and could recognize losses after making this distribution. As a result, all or a portion of an excise tax distribution could constitute a return of capital (see discussion below).
Fund Distributions
The Funds anticipate distributing substantially all of their net investment income for each taxable year. Distributions are taxable to shareholders even if they are paid from income or gain earned by the Fund before a shareholder’s investment (and thus were included in the price the shareholder paid). Distributions are taxable whether shareholders receive them in cash or reinvest them in additional shares. A shareholder whose distributions are reinvested in shares will be treated as having received a dividend equal to the amount of cash that the shareholder would have received if such shareholder had elected to receive the distribution in cash.
Dividends and distributions on a Fund’s shares generally are subject to federal income tax as described herein to the extent they do not exceed the Fund’s realized income and gains, even though such dividends and distributions may represent economically a return of a particular shareholder’s investment. Such dividends and distributions are likely to occur in respect of shares purchased at a time when the Fund’s net asset value reflects gains that are either (i) unrealized, or (ii) realized but not distributed.
For federal income tax purposes, distributions of net investment income generally are taxable as ordinary income. Taxes on distributions of capital gain are determined by how long a Fund owned the investment that generated it, rather than how long a shareholder may have owned shares in the Fund. Distributions of net capital gain from the sale of investments that a Fund owned for more than one year and that are properly reported by the Fund as capital gain dividends (“Capital Gain Dividends”) will be taxable as long-term capital gain. Distributions of capital gain generally are made after applying any available capital loss carryovers. The maximum individual rate applicable to long-term capital gains is either 15% or
Part II - 89
20%, depending on whether the individual’s income exceeds certain threshold amounts. A distribution of gain from the sale of investments that a Fund owned for one year or less will be taxable as ordinary income. Distributions attributable to gain from the sale of MLPs that is characterized as ordinary income under the Code’s recapture provisions will be taxable as ordinary income.
Distributions of investment income reported by a Fund as derived from “qualified dividend income” will be taxed in the hands of individuals at the rates applicable to long-term capital gain. In order for some portion of the dividends received by a Fund shareholder to be qualified dividend income, the Fund must meet certain holding-period and other requirements with respect to some portion of the dividend-paying stocks in its portfolio, and the shareholder must meet certain holding-period and other requirements with respect to the Fund’s shares. A dividend will not be treated as qualified dividend income (at either the Fund or shareholder level) (i) if the dividend is received with respect to any share of stock held for fewer than 61 days during the 121-day period beginning on the date which is 60 days before the date on which such share becomes ex-dividend with respect to such dividend (or, in the case of certain preferred stock, 91 days during the 181-day period beginning 90 days before such date), (ii) to the extent that the recipient is under an obligation (whether pursuant to a short sale or otherwise) to make related payments with respect to positions in substantially similar or related property, (iii) if the recipient elects to have the dividend income treated as investment interest for purposes of the limitation on deductibility of investment interest, or (iv) if the dividend is received from a foreign corporation that is (a) not eligible for the benefits of a comprehensive income tax treaty with the U.S. (with the exception of dividends paid on stock of such a foreign corporation readily tradable on an established securities market in the U.S.) or (b) treated as a PFIC. The amount of a Fund’s distributions that would otherwise qualify for this favorable tax treatment may be reduced as a result of a fund’s securities lending activities or high portfolio turnover rate.
In general, distributions of investment income reported by a Fund as derived from qualified dividend income will be treated as qualified dividend income by a non-corporate taxable shareholder so long as the shareholder meets the holding period and other requirements described above with respect to the Fund’s shares. In any event, if the qualified dividend income received by each Fund during any taxable year is equal to or greater than 95% of its “gross income,” then 100% of the Fund’s dividends (other than dividends that are properly reported as Capital Gain Dividends) will be eligible to be treated as qualified dividend income. For this purpose, the only gain included in the term “gross income” is the excess of net short-term capital gain over net long-term capital loss.
If a Fund receives dividends from an underlying fund, and the underlying fund reports such dividends as “qualified dividend income,” then the Fund may, in turn, report a portion of its distributions as “qualified dividend income” as well, provided the Fund meets the holding-period and other requirements with respect to shares of the underlying fund.
Under recently issued Treasury regulations, certain distributions reported by a Fund as section 163(j) interest dividends may be treated as interest income by shareholders for purposes of the tax rules applicable to interest expense limitations under Code section 163(j). Such treatment by the shareholder is generally subject to holding period requirements and other potential limitations, although the holding period requirements are generally not applicable to dividends declared by money market funds and certain other funds that declare dividends daily and pay such dividends on a monthly or more frequent basis. The amount that a Fund is eligible to report as a Section 163(j) dividend for a tax year is generally limited to the excess of the Fund’s business interest income over the sum of the Fund’s (i) business interest expense and (ii) other deductions properly allocable to the Fund’s business interest income.
Any loss realized upon a taxable disposition of shares held for six months or less will be treated as long-term capital loss to the extent of any Capital Gain Dividends received by the shareholder with respect to those shares. All or a portion of any loss realized upon a taxable disposition of Fund shares will be disallowed if other shares of such Fund are purchased within 30 days before or after the disposition. In such a case, the basis of the newly purchased shares will be adjusted to reflect the disallowed loss.
A distribution paid to shareholders by a Fund in January of a year generally is deemed to have been received by shareholders on December 31 of the preceding year, if the distribution was declared and payable to shareholders of record on a date in October, November, or December of that preceding year. The Funds will provide federal tax information annually, including information about dividends and distributions paid during the preceding year to taxable investors and others requesting such information.
Part II - 90
If a Fund makes a distribution to its shareholders in excess of its current and accumulated “earnings and profits” in any taxable year, the excess distribution will be treated as a return of capital to the extent of each shareholder’s basis (for tax purposes) in its shares, and any distribution in excess of basis will be treated as capital gain. A return of capital is not taxable, but it reduces the shareholder’s basis in its shares, which reduces the loss (or increases the gain) on a subsequent taxable disposition by such shareholder of the shares.
Dividends of net investment income received by corporate shareholders (other than shareholders that are S corporations) of a Fund will qualify for the 70% dividends-received deduction generally available to corporations to the extent of the amount of qualifying dividends received by the Fund from domestic corporations for the taxable year. A dividend received by a Fund will not be treated as a qualifying dividend (1) if the stock on which the dividend is paid is considered to be “debt-financed” (generally, acquired with borrowed funds), (2) if it has been received with respect to any share of stock that the Fund has held less than 46 days (91 days in the case of certain preferred stock) during the 91-day period beginning on the date which is 45 days before the date on which such share becomes ex-dividend with respect to such dividend (during the 181-day period beginning 90 days before such date in the case of certain preferred stock) or (3) to the extent that the Fund is under an obligation (pursuant to a short sale or otherwise) to make related payments with respect to positions in substantially similar or related property. Moreover, the dividends-received deduction may be disallowed or reduced (1) if the corporate shareholder fails to satisfy the foregoing requirements with respect to its shares of a Fund or (2) by application of the Code. However, any distributions received by a Fund from REITs and PFICs will not qualify for the corporate dividends-received deduction. The amount eligible for the dividends received deduction may also be reduced as a result of a Fund’s securities lending activities or high portfolio turnover rate.
Certain distributions reported by a Fund as section 163(j) interest dividends may be treated as interest income by shareholders for purposes of the tax rules applicable to interest expense limitations under Code section 163(j). Such treatment by the shareholder is generally subject to holding period requirements and other potential limitations, although the holding period requirements are generally not applicable to dividends declared by money market funds and certain other funds that declare dividends daily and pay such dividends on a monthly or more frequent basis. The amount that a Fund is eligible to report as a Section 163(j) dividend for a tax year is generally limited to the excess of the Fund’s business interest income over the sum of the Fund’s (i) business interest expense and (ii) other deductions properly allocable to the Fund’s business interest income.
An additional 3.8% Medicare tax is imposed on certain net investment income (including ordinary dividends and capital gain distributions received from a Fund and net gains from redemptions or other taxable dispositions of Fund shares, but excluding any exempt interest dividends from a Fund) of U.S. individuals, estates and trusts to the extent that such person’s “modified adjusted gross income” (in the case of an individual) or “adjusted gross income” (in the case of an estate or trust) exceeds certain threshold amounts.
Sale or Redemption of Shares
The sale, exchange, or redemption of Fund shares may give rise to a gain or loss. In general, any gain or loss arising from (or treated as arising from) the sale or redemption of shares of the Fund will be considered capital gain or loss and will be long-term capital gain or loss if the shares were held for more than one year. However, any capital loss arising from the sale or redemption of shares held for six months or less will be treated as a long-term capital loss to the extent of the amount of capital gain dividends received on (or undistributed capital gains credited with respect to) such shares. Additionally, any loss realized upon the sale or exchange of Fund shares with a tax holding period of six months or less may be disallowed to the extent of any distributions treated as exempt interest dividends with respect to such shares. The maximum individual rate applicable to long-term capital gains is either 15% or 20%, depending on whether the individual’s income exceeds certain threshold amounts. Capital gain of a corporate shareholder is taxed at the same rate as ordinary income.
With respect to the Prime Money Market Fund, shareholders may elect to adopt a simplified “NAV method” for computing gains and losses from taxable sales, exchanges or redemptions of Fund shares. Under the NAV method, rather than computing gain or loss separately for each taxable disposition of Fund shares as described above, a shareholder would determine gain or loss based on the change in the aggregate value of the shareholder’s Fund shares during a computation period (which could be the shareholder’s taxable year or certain shorter periods), reduced by the shareholder’s net investment
Part II - 91
(purchases minus taxable sales, exchanges, or redemptions or exchanges) in those Fund shares during that period. Under the NAV method, if a shareholder holds the shares as a capital asset, any resulting net gain or loss would be treated as short-term capital gain or loss.
Fund Investments
Certain investments of the Funds, including transactions in options, swaptions, futures contracts, forward contracts, straddles, swaps, short sales, foreign currencies, inflation-linked securities and foreign securities, including for hedging purposes, will be subject to special tax rules (including mark-to-market, constructive sale, straddle, wash sale and short sale rules). In a given case, these rules may accelerate income to a Fund, defer losses to a Fund, cause adjustments in the holding periods of a Fund’s securities, convert long-term capital gain into short-term capital gain, convert short-term capital losses into long-term capital loss, or otherwise affect the character of a Fund’s income. These rules could therefore affect the amount, timing and character of distributions to shareholders and cause differences between a Fund’s book income and its taxable income. If a Fund’s book income exceeds its taxable income, the distribution (if any) of such excess generally will be treated as (i) a dividend to the extent of the Fund’s remaining earnings and profits (including earnings and profits arising from tax-exempt income), (ii) thereafter, as a return of capital to the extent of the recipient’s basis in its shares, and (iii) thereafter, as gain from the sale or exchange of a capital asset. If a Fund’s book income is less than taxable income, the Fund could be required to make distributions exceeding book income to qualify as a regulated investment company that is accorded special tax treatment. Income earned as a result of these transactions would, in general, not be eligible for the dividends-received deduction or for treatment as exempt-interest dividends when distributed to shareholders. The Funds will endeavor to make any available elections pertaining to such transactions in a manner believed to be in the best interest of each Fund and its shareholders.
The Fund’s participation in loans of securities may affect the amount, timing, and character of distributions to shareholders. With respect to any security subject to a securities loan, any (i) amounts received by the Fund in place of dividends earned on the security during the period that such security was not directly held by the Fund will not give rise to qualified dividend income and (ii) withholding taxes accrued on dividends during the period that such security was not directly held by the Fund will not qualify as a foreign tax paid by the Fund and therefore cannot be passed through to shareholders even if the Fund meets the requirements described in “Foreign Taxes,” below.
Certain debt securities purchased by the Funds are sold at an original issue discount and thus do not make periodic cash interest payments. Similarly, zero-coupon bonds do not make periodic interest payments. Generally, the amount of the original issue discount is treated as interest income and is included in taxable income (and required to be distributed) over the term of the debt security even though payment of that amount is not received until a later time, usually when the debt security matures. In addition, payment-in-kind securities will give rise to income that is required to be distributed and is taxable even though the Fund holding the security receives no interest payment in cash on the security during the year. Because each Fund distributes substantially all of its net investment income to its shareholders (including such imputed interest), a Fund may have to sell portfolio securities in order to generate the cash necessary for the required distributions. Such sales may occur at a time when the Adviser would not otherwise have chosen to sell such securities and may result in a taxable gain or loss. Some of the Funds may invest in inflation-linked debt securities. Any increase in the principal amount of an inflation-linked debt security will be original issue discount, which is taxable as ordinary income and is required to be distributed, even though the Fund will not receive the principal, including any increase thereto, until maturity. A Fund investing in such securities may be required to liquidate other investments, including at times when it is not advantageous to do so, in order to satisfy its distribution requirements and to eliminate any possible taxation at the Fund level. Certain debt securities that may be acquired by a Fund in the secondary market may be treated as having market discount. Generally, any gain recognized on the disposition of, and any partial payment of principal on, a debt security having market discount is treated as ordinary income to the extent the gain, or principal payment, does not exceed the “accrued market discount” on such debt security. Market discount generally accrues in equal daily installments. A Fund may make one or more of the elections applicable to debt securities having market discount, which could affect the character and timing of recognition of income.
A Fund may invest to a significant extent in debt obligations that are in the lowest rated categories (or are unrated), including debt obligations of issuers that are not currently paying interest or that are in default. Investments in debt obligations that are at risk of being in default (or are presently in default) present special tax issues for a Fund. Tax rules are not entirely clear about issues such as when a Fund may cease to accrue interest, original issue discount or market discount, when and to what extent deductions
Part II - 92
may be taken for bad debts or worthless securities and how payments received on obligations in default should be allocated between principal and income. These and other related issues will be addressed by each Fund when, as and if it invests in such securities, in order to seek to ensure that it distributes sufficient income to preserve its status as a regulated investment company and does not become subject to U.S. federal income taxation or any excise tax.
A Fund’s investments in foreign currencies, foreign currency denominated debt securities and certain options, futures or forward foreign currency contracts (and similar instruments) will be subject to special tax rules. Generally, transactions in foreign currencies give rise to ordinary income or loss. An election under Section 988(a)(1)(B) may be available to treat foreign currency gain or loss attributable to certain forward, futures and option contracts as capital, including certain “foreign currency contracts.” A “foreign currency contract” is a contract that (1) requires delivery of, or settlement of, a foreign currency that is a currency in which positions are also traded through regulated futures contracts, (2) is traded in the interbank market, and (3) is entered into at an arm’s-length price determined by reference to the price in the interbank market. If this Section 988(a)(1)(B) election is made, foreign currency contracts are treated as 60% long-term capital gain or loss and 40% short-term capital gain or loss under the Section 1256 mark-to-market rules. All other forward contracts under this 988(a)(1)(B) election would be characterized as capital and generally gain or loss would be recognized when the contract is closed and completed. Other rules apply to options, futures or forward foreign currency contracts that may be part of a straddle or a Section 988 hedging transaction within the meaning of Code Section 988(d). Proposed regulations also permit an election to use a mark-to-market method of accounting for currency gains and losses with respect to certain transactions. The elective method of accounting takes into account currently only changes in the value of the transaction attributable to exchange rate fluctuations and does not take into account changes in value due to other factors, such as changes in market interest rates. The election does not apply in certain cases, including with respect to any securities that are marked to market under any other provision.
Special tax considerations apply if a Fund invests in investment companies that are taxable as partnerships for federal income tax purposes. In general, the Fund will not recognize income earned by such an investment company until the close of the investment company’s taxable year. But the Fund will recognize such income as it is earned by the investment company for purposes of determining whether it is subject to the 4% excise tax. Therefore, if the Fund and such an investment company have different taxable years, the Fund may be compelled to make distributions in excess of the income recognized from such an investment company in order to avoid the imposition of the 4% excise tax. A Fund’s receipt of a non-liquidating cash distribution from an investment company taxable as a partnership generally will result in recognized gain (but not loss) only to the extent that the amount of the distribution exceeds the Fund’s adjusted basis in shares of such investment company before the distribution. A Fund that receives a liquidating cash distribution from an investment company taxable as a partnership will recognize capital gain or loss to the extent of the difference between the proceeds received by the Fund and the Fund’s adjusted tax basis in shares of such investment company; however, the Fund will recognize ordinary income, rather than capital gain, to the extent that the Fund’s allocable share of “unrealized receivables” (including any accrued but untaxed market discount) exceeds the shareholder’s share of the basis in those unrealized receivables.
Some amounts received by each Fund with respect to its investments in MLPs will likely be treated as a return of capital because of accelerated deductions available with respect to the activities of such MLPs. On the disposition of an investment in such an MLP, the Fund will likely realize taxable income in excess of economic gain with respect to that asset (or, if the Fund does not dispose of the MLP, the Fund likely will realize taxable income in excess of cash flow with respect to the MLP in a later period), and the Fund must take such income into account in determining whether the Fund has satisfied its distribution requirements. The Fund may have to borrow or liquidate securities to satisfy its distribution requirements and to meet its redemption requests, even though investment considerations might otherwise make it undesirable for the Fund to sell securities or borrow money at such time.
Some of the Funds may invest in REITs. Such investments in REIT equity securities may require a Fund to accrue and distribute income not yet received. In order to generate sufficient cash to make the requisite distributions, the Fund may be required to sell securities in its portfolio (including when it is not advantageous to do so) that it otherwise would have continued to hold. A Fund’s investments in REIT equity securities may at other times result in the Fund’s receipt of cash in excess of the REIT’s earnings; if the Fund distributes such amounts, such distribution could constitute a return of capital to Fund shareholders for federal income tax purposes. Dividends received by a Fund from a REIT generally will not constitute qualified dividend income.
Part II - 93
Tax reform legislation established a 20% deduction for qualified business income. Under this provision, which is effective for taxable years beginning in 2018 and, without further legislation, will sunset for taxable years beginning after 2025, individuals, trusts, and estates generally may deduct (the “Deduction”) 20% of “qualified business income,” which includes all ordinary REIT dividends (“Qualifying REIT Dividends”) and certain income from investments in MLPs (“MLP Income”). Treasury regulations permit a RIC to pass through to its shareholders Qualifying REIT Dividends eligible for the deduction. However, the regulations do not provide a mechanism for a RIC to pass through to its shareholders MLP Income that would be eligible for such deduction. It is uncertain whether future legislation or other guidance will enable a RIC to pass through the special character of MLP Income to the RIC’s shareholders.
A Fund might invest directly or indirectly in residual interests in real estate mortgage investment conduits (“REMICs”) or equity interests in taxable mortgage pools (“TMPS”). Under a notice issued by the IRS in October 2006 and Treasury regulations that have not yet been issued (but may apply with retroactive effect) a portion of a Fund’s income from a REIT that is attributable to the REIT’s residual interest in a REMIC or a TMP (referred to in the Code as an “excess inclusion”) will be subject to federal income taxation in all events. This notice also provides, and the regulations are expected to provide, that excess inclusion income of a regulated investment company, such as each of the Funds, will generally be allocated to shareholders of the regulated investment company in proportion to the dividends received by such shareholders, with the same consequences as if the shareholders held the related REMIC or TMP residual interest directly.
In general, excess inclusion income allocated to shareholders (i) cannot be offset by net operating losses (subject to a limited exception for certain thrift institutions) and (ii) will constitute unrelated business taxable income (“UBTI”) to entities (including a qualified pension plan, an individual retirement account, a 401(k) plan, a Keogh plan or other tax-exempt entity) subject to tax on UBTI, thereby potentially requiring such an entity that is allocated excess inclusion income, and otherwise might not be required to file a tax return, to file a tax return and pay tax on such income. In addition, because the Code provides that excess inclusion income is ineligible for treaty benefits, a regulated investment company must withhold tax on excess inclusions attributable to its foreign shareholders at a 30% rate of withholding, regardless of any treaty benefits for which a shareholder is otherwise eligible.
Any investment in residual interests of a CMO that has elected to be treated as a REMIC can create complex tax problems, especially if the Fund has state or local governments or other tax-exempt organizations as shareholders. Under current law, the Fund serves to block UBTI from being realized by its tax-exempt shareholders. Notwithstanding the foregoing, a tax-exempt shareholder will recognize UBTI by virtue of its investment in the Fund if shares in the Fund constitute debt-financed property in the hands of the tax-exempt shareholder within the meaning of Section 514(b) of the Code. Furthermore, a tax-exempt shareholder may recognize UBTI if the Fund recognizes “excess inclusion income” derived from direct or indirect investments in REMIC residual interests or TMPs if the amount of such income recognized by the Fund exceeds the Fund’s investment company taxable income (after taking into account deductions for dividends paid by the Fund).
In addition, special tax consequences apply to charitable remainder trusts (“CRTs”) that invest in regulated investment companies that invest directly or indirectly in residual interests in REMICs or in TMPs. Under legislation enacted in December 2006, a CRT, as defined in Section 664 of the Code, that realizes UBTI for a taxable year must pay an excise tax annually of an amount equal to such UBTI. Under IRS guidance issued in October 2006, a CRT will not recognize UBTI solely as a result of investing in a Fund that recognizes “excess inclusion income.” Rather, if at any time during any taxable year a CRT (or one of certain other tax-exempt shareholders, such as the U.S., a state or political subdivision, or an agency or instrumentality thereof, and certain energy cooperatives) is a record holder of a share in a Fund that recognizes “excess inclusion income,” then the Fund will be subject to a tax on that portion of its “excess inclusion income” for the taxable year that is allocable to such shareholders at the highest federal corporate income tax rate. The extent to which this IRS guidance remains applicable in light of the December 2006 legislation is unclear. To the extent permitted under the 1940 Act, each Fund may elect to specially allocate any such tax to the applicable CRT, or other shareholder, and thus reduce such shareholder’s distributions for the year by the amount of the tax that relates to such shareholder’s interest in the Fund. The Funds have not yet determined whether such an election will be made. CRTs are urged to consult their tax advisors concerning the consequences of investing in a Fund.
If a Fund invests in PFICs, certain special tax consequences may apply. A PFIC is any foreign corporation in which (i) 75% or more of the gross income for the taxable year is passive income, or (ii) the average percentage of the assets (generally by value, but by adjusted tax basis in certain cases) that
Part II - 94
produce or are held for the production of passive income is at least 50%. Generally, passive income for this purpose includes dividends, interest (including income equivalent to interest), royalties, rents, annuities, the excess of gains over losses from certain property transactions and commodities transactions, and foreign currency gains. Passive income for this purpose does not include rents and royalties received by the foreign corporation from active business and certain income received from related persons. A Fund’s investments in certain PFICs could subject the Fund to a U.S. federal income tax (including interest charges) on distributions received from the company or on proceeds received from the disposition of shares in the company. This tax cannot be eliminated by making distributions to Fund shareholders. In addition, certain interest charges may be imposed on the Fund as a result of such distributions.
If a Fund is in a position to treat a PFIC as a “qualified electing fund” (“QEF”), the Fund will be required to include in its gross income its share of the company’s income and net capital gain annually, regardless of whether it receives any distributions from the company. Alternately, a Fund may make an election to mark the gains (and to a limited extent losses) in such holdings “to the market” as though it had sold and repurchased its holdings in those PFICs on the last day of the Fund’s taxable year. Such gain and loss are treated as ordinary income and loss. The QEF and mark-to-market elections may have the effect of accelerating the recognition of income (without the receipt of cash) and increasing the amount required to be distributed by the Fund to avoid taxation. Making either of these elections, therefore, may require the Fund to liquidate other investments (including when it is not advantageous to do so) to meet its distribution requirement, which also may accelerate the recognition of gain and affect the Fund’s total return. A Fund that invests indirectly in PFICs by virtue of the Fund’s investment in other investment companies that qualify as “U.S. persons” within the meaning of the Code may not make a QEF election; rather, such underlying investment companies investing directly in the PFICs would decide whether to make such election. Furthermore, the IRS recently issued final regulations that generally treat a Fund’s income inclusion with respect to a PFIC with respect to which the Fund has made a qualified electing fund, or “QEF,” election, as qualifying income for purposes of determining the Fund’s ability to be subject to tax as a RIC if either if (A) there is a current distribution out of the earnings and profits of the PFIC that are attributable to such income inclusion or (B) such inclusion is derived with respect to the Fund’s business of investing in stock, securities, or currencies. Dividends paid by PFICs will not be eligible to be treated as “qualified dividend income.”
Certain Funds have wholly-owned subsidiaries organized under the laws of the Cayman Islands, which are classified as corporations for U.S. federal income tax purposes (each, a “Subsidiary”). With respect to such Funds, a Fund may invest a portion of its assets in its Subsidiary. A foreign corporation, such as a Subsidiary, will generally not be subject to U.S. federal income taxation unless it is deemed to be engaged in a U.S. trade or business. It is expected that each Subsidiary will conduct its activities in a manner so as to meet the requirements of a safe harbor provided under Section 864(b)(2) of the Code under which the Subsidiary may engage in trading in stocks or securities or certain commodities without being deemed to be engaged in a U.S. trade or business. However, if certain of a Subsidiary’s activities were determined not to be of the type described in the safe harbor (which is not expected), then the activities of the Subsidiary may constitute a U.S. trade or business, and subject to U.S. taxation as such.
In general, a foreign corporation, such as a Subsidiary, that does not conduct a U.S. trade or business is nonetheless subject to tax at a flat rate of 30 percent (or lower tax treaty rate), generally payable through withholding, on the gross amount of certain U.S.-source income that is not effectively connected with a U.S. trade or business. There is presently no tax treaty in force between the U.S. and the Cayman Islands that would reduce this rate of withholding tax. It is not expected that a Subsidiary will derive meaningful income subject to such withholding tax.
Each Subsidiary will be treated as a controlled foreign corporation (“CFC”) and the Fund investing in its Subsidiary will be treated as a “U.S. shareholder” of that Subsidiary. As a result, a Fund will be required to include in gross income for U.S. federal income tax purposes all of its Subsidiary’s “subpart F income,” whether or not such income is distributed by the Subsidiary. It is expected that all of the Subsidiary’s income will be “subpart F income.” A Fund’s recognition of its Subsidiary’s “subpart F income” will increase the Fund’s tax basis in the Subsidiary. Distributions by the Subsidiary to a Fund will be tax-free, to the extent of its previously undistributed “subpart F income,” and will correspondingly reduce the Fund’s tax basis in the Subsidiary. “Subpart F income” is generally treated as ordinary income, regardless of the character of the Subsidiary’s underlying income. If a net loss is realized by the Subsidiary, such loss is not generally available to offset the income earned by a Fund and such loss cannot be carried forward to offset taxable income of a Fund or the Subsidiary in future periods. The IRS recently issued final regulations that generally treat a Fund’s income inclusion with respect to a CFC as qualifying income for
Part II - 95
purposes of determining the Fund’s ability to be subject to tax as a RIC either if (A) there is a distribution out of the earnings and profits of the CFC that are attributable to such income inclusion or (B) such inclusion is derived with respect to the Fund’s business of investing in stock, securities, or currencies.
The ability of a Fund to invest directly in commodities, and in certain commodity-related securities and other instruments, is subject to significant limitations in order to enable a Fund to maintain its status as a regulated investment company under the Code.
Investment in Other Funds
If a Fund invests in shares of other mutual funds, ETFs or other companies that are taxable as regulated investment companies, as well as certain investments in REITs (collectively, “underlying funds”), its distributable income and gains will normally consist, in part, of distributions from the underlying funds and gains and losses on the disposition of shares of the underlying funds. To the extent that an underlying fund realizes net losses on its investments for a given taxable year, the Fund will not be able to recognize its share of those losses (so as to offset distributions of net income or capital gains from other underlying funds) until it disposes of shares of the underlying fund. Moreover, even when the Fund does make such a disposition, a portion of its loss may be recognized as a long-term capital loss, which will not be treated as favorably for federal income tax purposes as a short-term capital loss or an ordinary deduction. In particular, the Fund will not be able to offset any capital losses from its dispositions of underlying fund shares against its ordinary income (including distributions of any net short-term capital gain realized by an underlying fund).
In addition, in certain circumstances, the “wash sale” rules under Section 1091 of the Code may apply to a Fund’s sales of underlying fund shares that have generated losses. A wash sale occurs if shares of an underlying fund are sold by the Fund at a loss and the Fund acquires substantially identical shares of that same underlying fund 30 days before or after the date of the sale. The wash-sale rules could defer losses in the Fund’s hands on sales of underlying fund shares (to the extent such sales are wash sales) for extended (and, in certain cases, potentially indefinite) periods of time.
As a result of the foregoing rules, and certain other special rules, the amount of net investment income and net capital gain that each Fund will be required to distribute to shareholders may be greater than what such amounts would have been had the Fund directly invested in the securities held by the underlying funds, rather than investing in shares of the underlying funds. For similar reasons, the character of distributions from the Fund (e.g., long-term capital gain, exempt interest, eligibility for dividends-received deduction, etc.) will not necessarily be the same as it would have been had the Fund invested directly in the securities held by the underlying funds.
If a Fund received dividends from an underlying fund that qualifies as a regulated investment company, and the underlying fund reports such dividends as “qualified dividend income,” then the Fund is permitted in turn to designate a portion of its distributions as “qualified dividend income,” provided the Fund meets holding period and other requirements with respect to shares of the underlying fund.
Depending on a Fund’s percentage ownership in an underlying fund, both before and after a redemption, a redemption of shares of an underlying fund by a Fund may cause the Fund to be treated as distribution taxable as a dividend under the Code, to the extent of its allocable shares of earnings and profits, on the full amount of the distribution instead of receiving capital gain income on the shares of the underlying fund. Such a distribution may be treated as qualified dividend income and thus eligible to be taxed at the rates applicable to long-term capital gain. If qualified dividend income treatment is not available, the distribution may be taxed as ordinary income. This could cause shareholders of the Fund to recognize higher amounts of ordinary income than if the shareholders had held the shares of the underlying funds directly.
A Fund may elect to pass through to shareholders foreign tax credits from an underlying fund and exempt-interest dividends from an underlying fund, provided that at least 50% of the Fund’s total assets are invested in other regulated investment companies at the end of each quarter of the taxable year.
Backup Withholding
Each Fund generally is required to backup withhold and remit to the U.S. Treasury a percentage of the taxable dividends and other distributions paid to, and the proceeds of share sales, exchanges, or redemptions made by, any individual shareholder who fails to properly furnish the Fund with a correct taxpayer identification number (“TIN”), who has under-reported dividend or interest income, or who fails
Part II - 96
to certify to the Fund that he or she is not subject to backup withholding. The backup withholding rules may also apply to distributions that are properly reported as exempt-interest dividends. The backup withholding tax rate is 24%.
Foreign Shareholders
Shares of the Funds have not been registered for sale outside of the United States. This SAI is not intended for distribution to prospective investors outside of the United States. The Funds generally do not market or sell shares to investors domiciled outside of the United States, even, with regard to individuals, if they are citizens or lawful permanent residents of the United States.
Distributions properly reported as Capital Gain Dividends and exempt-interest dividends generally will not be subject to withholding of federal income tax. However, exempt-interest dividends may be subject to backup withholding (as discussed above). In general, dividends other than Capital Gain Dividends and exempt-interest dividends paid by a Fund to a shareholder that is not a “U.S. person” within the meaning of the Code (a “foreign person”) are subject to withholding of U.S. federal income tax at a rate of 30% (or lower applicable treaty rate) even if they are funded by income or gains (such as portfolio interest, short-term capital gains, or foreign-source dividend and interest income) that, if paid to a foreign person directly, would not be subject to withholding. However, the Fund will not be required to withhold any amounts (i) with respect to distributions (other than distributions to a foreign person (w) that has not provided a satisfactory statement that the beneficial owner is not a U.S. person, (x) to the extent that the dividend is attributable to certain interest on an obligation if the foreign person is the issuer or is a 10% shareholder of the issuer, (y) that is within certain foreign countries that have inadequate information exchange with the United States, or (z) to the extent the dividend is attributable to interest paid by a person that is a related person of the foreign person and the foreign person is a controlled foreign corporation) from U.S.-source interest income of types similar to those not subject to U.S. federal income tax if earned directly by an individual foreign person, to the extent such distributions are properly reported by the Fund (“interest-related dividends”), and (ii) with respect to distributions (other than (a) distributions to an individual foreign person who is present in the United States for a period or periods aggregating 183 days or more during the year of the distribution and (b) distributions subject to special rules regarding the disposition of U.S. real property interests (as described below)) of net short-term capital gains in excess of net long-term capital losses to the extent such distributions are properly reported by the Fund (“short-term capital gain dividends”). Depending on the circumstances, a Fund may make reporting of interest-related and/or short-term capital gain dividends with respect to all, some or none of its potentially eligible dividends and/or treat such dividends, in whole or in part, as ineligible for these exemptions from withholding. In the case of shares held through an intermediary, the intermediary may withhold even if a Fund reports with respect to a payment. Foreign persons should contact their intermediaries regarding the application of these rules to their accounts.
A beneficial holder of shares who is a foreign person is not, in general, subject to U.S. federal income tax on gains (and is not allowed a deduction for losses) realized on the sale of shares of the Fund or on Capital Gain Dividends or exempt-interest dividends unless (i) such gain or dividend is effectively connected with the conduct of a trade or business carried on by such holder within the United States or (ii) in the case of an individual holder, the holder is present in the United States for a period or periods aggregating 183 days or more during the year of the sale or the receipt of the Capital Gain Dividend and certain other conditions are met or (iii) the shares constitute “U.S. real property interests” (“USRPIs”) or the Capital Gain Dividends are attributable to gains from the sale or exchange of USRPIs in accordance with the rules set forth below.
Special rules apply to distributions to foreign shareholders from a Fund that is either a “U.S. real property holding corporation” (“USRPHC”) or would be a USRPHC but for the operation of the exceptions to the definition thereof described below. Additionally, special rules apply to the sale of shares in a Fund that is a USRPHC. Very generally, a USRPHC is a domestic corporation that holds U.S. real property interests (“USRPIs”) — USRPIs are defined as any interest in U.S. real property or any equity interest in a USRPHC — the fair market value of which equals or exceeds 50% of the sum of the fair market values of the corporation’s USRPIs, interests in real property located outside the United States and certain other assets. A Fund that holds (directly or indirectly) significant interests in REITs may be a USRPHC. The special rules discussed in the next paragraph will also generally apply to distributions from a Fund that would be a USRPHC absent exclusions from USRPI treatment for interests in domestically controlled REITs or regulated investment companies and not-greater-than-10% or interests in publicly traded classes of stock in REITs or regulated investment companies, respectively.
Part II - 97
In the case of a Fund that is a USRPHC or would be a USRPHC but for the exceptions from the definition of USRPI (described immediately above), distributions by the Fund that are attributable to (a) gains realized on the disposition of USRPIs by the Fund and (b) distributions received by the Fund from a lower-tier regulated investment company or REIT that the Fund is required to treat as USRPI gain in its hands will retain their character as gains realized from USRPIs in the hands of the Fund’s foreign shareholders. If the foreign shareholder holds (or has held in the prior year) more than a 5% interest in the Fund, such distributions will be treated as gains “effectively connected” with the conduct of a “U.S. trade or business,” and subject to tax at graduated rates. Moreover, such shareholders will be required to file a U.S. income tax return for the year in which the gain was recognized and the Fund will be required to withhold 21% of the amount of such distribution. In the case of all other foreign shareholders (i.e., those whose interest in the Fund did not exceed 5% at any time during the prior year), the USRPI distribution will be treated as ordinary income (regardless of any reporting by the Fund that such distribution is a short-term capital gain dividend or a Capital Gain Dividend), and the Fund must withhold 30% (or a lower applicable treaty rate) of the amount of the distribution paid to such foreign shareholder. Foreign shareholders of a Fund are also subject to “wash sale” rules to prevent the avoidance of the tax-filing and -payment obligations discussed above through the sale and repurchase of Fund shares.
In addition, a Fund that is a USRPHC must typically withhold 15% of the amount realized in a redemption by a greater-than-5% foreign shareholder, and that shareholder must file a U.S. income tax return for the year of the disposition of the USRPI and pay any additional tax due on the gain. No withholding is generally required with respect to amounts paid in redemption of shares of a Fund if the Fund is a domestically controlled USRPHC or, in certain limited cases, if the Fund (whether or not domestically controlled) holds substantial investments in regulated investment companies that are domestically controlled USRPHCs.
In order to qualify for any exemptions from withholding described above or for lower withholding tax rates under income tax treaties, or to establish an exemption from backup withholding, the foreign investor must comply with special certification and filing requirements relating to its non-US status (including, in general, furnishing an applicable IRS Form W-8 or substitute form). Foreign investors in a Fund should consult their tax advisers in this regard.
If a shareholder is eligible for the benefits of a tax treaty, any effectively connected income or gain will generally be subject to U.S. federal income tax on a net basis only if it is also attributable to a permanent establishment maintained by the shareholder in the United States.
A beneficial holder of shares who is a foreign person may be subject to state and local tax and to the U.S. federal estate tax in addition to the federal tax on income referred to above. Foreign shareholders in a Fund should consult their tax advisors with respect to the potential application of the above rules.
A Fund is required to withhold U.S. tax (at a 30% rate) on payments of taxable dividends made to certain non-U.S. entities that fail to comply (or be deemed compliant) with extensive new reporting and withholding requirements designed to inform the U.S. Department of the Treasury of U.S.-owned foreign investment accounts. Shareholders may be requested to provide additional information to a Fund to enable the Fund to determine whether withholding is required.
Foreign Taxes
Certain Funds may be subject to foreign withholding taxes or other foreign taxes with respect to income (possibly including, in some cases, capital gain) received from sources within foreign countries. Tax conventions between certain countries and the U.S. may reduce or eliminate such taxes. If more than 50% of a Fund’s assets at year-end consists of the securities of foreign corporations, the Fund may elect to permit shareholders to claim a credit or deduction on their income tax returns for their pro rata portion of qualified taxes paid by the Fund to foreign countries in respect of foreign securities the Fund has held for at least the minimum period specified in the Code. In such a case, shareholders will include in gross income from foreign sources their pro rata shares of such taxes. A shareholder’s ability to claim a foreign tax credit or deduction in respect of foreign taxes paid by a Fund may be subject to certain limitations imposed by the Code and the Treasury Regulations issued thereunder, as a result of which a shareholder may not get a full credit or deduction for the amount of such taxes. In particular, shareholders must hold their Fund shares (without protection from risk of loss) on the ex-dividend date and for at least 15 additional days during the 30-day period surrounding the ex-dividend date to be eligible to claim a foreign tax credit with respect to a given dividend. Shareholders who do not itemize on their federal income tax
Part II - 98
returns may claim a credit (but no deduction) for such foreign taxes. Any foreign taxes withheld on payments made “in lieu of” dividends or interest with respect to loaned securities will not qualify for the pass-through of foreign tax credits to shareholders.
If a Fund does not make the above election or if more than 50% of its assets at the end of the year do not consist of securities of foreign corporations, the Fund’s net income will be reduced by the foreign taxes paid or withheld. In such cases, shareholders will not be entitled to claim a credit or deduction with respect to foreign taxes.
The foregoing is only a general description of the treatment of foreign source income or foreign taxes under the U.S. federal income tax laws. Because the availability of a credit or deduction depends on the particular circumstances of each shareholder, shareholders are advised to consult their own tax advisors.
Exempt-Interest Dividends
Some of the Funds intend to qualify to pay exempt-interest dividends to their respective shareholders. In order to qualify to pay exempt-interest dividends, at least 50% of the value of a Fund’s total assets must consist of tax-exempt municipal bonds at the close of each quarter of the Fund’s taxable year. An exempt-interest dividend is that part of a dividend that is properly designated as an exempt-interest dividend and that consists of interest received by a Fund on such tax-exempt securities. Shareholders of Funds that pay exempt-interest dividends would not incur any regular federal income tax on the amount of exempt-interest dividends received by them from a Fund, but an investment in such a Fund may result in liability for federal and state alternative minimum taxation and may be subject to state and local taxes.
Interest on indebtedness incurred or continued by a shareholder, whether a corporation or an individual, to purchase or carry shares of a Fund is not deductible to the extent it relates to exempt-interest dividends received by the shareholder from that Fund. Any loss incurred on the sale or redemption of a Fund’s shares held for six months or less may be disallowed to the extent of exempt-interest dividends received with respect to such shares.
Interest on certain tax-exempt bonds that are private activity bonds within the meaning of the Code is treated as a tax preference item for purposes of the alternative minimum tax, and any such interest received by a Fund and distributed to shareholders will be so treated for purposes of any alternative minimum tax liability of shareholders to the extent of the dividend’s proportionate share of a Fund’s income consisting of such interest.
The exemption from federal income tax for exempt-interest dividends does not necessarily result in exemption for such dividends under the income or other tax laws of any state or local authority. Shareholders that receive social security or railroad retirement benefits should consult their tax advisors to determine what effect, if any, an investment in a Fund may have on the federal taxation of their benefits.
From time to time legislation may be introduced or litigation may arise that would change the tax treatment of exempt-interest dividends. Such legislation or litigation may have the effect of raising the state or other taxes payable by shareholders on such dividends. Shareholders should consult their tax advisors for the current federal, state and local law on exempt-interest dividends.
State and Local Tax Matters
Depending on the residence of the shareholders for tax purposes, distributions may also be subject to state and local taxation. Rules of state and local taxation regarding qualified dividend income, ordinary income dividends and capital gain dividends from regulated investment companies may differ from the rules of U.S. federal income tax in many respects. Shareholders are urged to consult their tax advisors as to the consequences of these and other state and local tax rules affecting investment in the Funds.
Most states provide that a regulated investment company may pass through (without restriction) to its shareholders state and local income tax exemptions available to direct owners of certain types of U.S. government securities (such as U.S. Treasury obligations). Thus, for residents of these states, distributions derived from a Fund’s investment in certain types of U.S. government securities should be free from state and local income taxation to the extent that the interest income from such investments would have been exempt from state and local taxes if such securities had been held directly by the respective shareholders. Certain states, however, do not allow a regulated investment company to pass through to its shareholders the state and local income tax exemptions available to direct owners of certain types of U.S. government securities unless a Fund holds at least a required amount of U.S. government securities. Accordingly, for residents of these states, distributions derived from a Fund’s investment in certain types of U.S.
Part II - 99
government securities may not be entitled to the exemptions from state and local income taxes that would be available if the shareholders had purchased U.S. government securities directly. The exemption from state and local income taxes does not preclude states from asserting other taxes on the ownership of U.S. government securities. To the extent that a Fund invests to a substantial degree in U.S. government securities which are subject to favorable state and local tax treatment, shareholders of the Fund will be notified as to the extent to which distributions from the Fund are attributable to interest on such securities.
Tax Shelter Reporting Regulations
If a shareholder realizes a loss on disposition of a Fund’s shares of $2 million or more for an individual shareholder or $10 million or more for a corporate shareholder, the shareholder must file with the Internal Revenue Service a disclosure statement on Form 8886. Direct shareholders of portfolio securities are in many cases excepted from this reporting requirement, but under current guidance, shareholders of a regulated investment company are not excepted. Future guidance may extend the current exception from this reporting requirement to shareholders of most or all regulated investment companies. The fact that a loss is reportable under these regulations does not affect the legal determination whether the taxpayer’s treatment of the loss is proper. Shareholders should consult their tax advisers to determine the applicability of these regulations in light of their individual circumstances.
General Considerations
The federal income tax discussion set forth above is for general information only. Prospective investors should consult their tax advisers regarding the specific federal tax consequences of purchasing, holding, and disposing of shares of each of the Funds, as well as the effects of state, local and foreign tax law and any proposed tax law changes.
TRUSTEES
The names of the Trustees of the Trusts, together with information regarding their year of birth, the year each Trustee first became a Board member of any of the Funds overseen by the Unified J.P. Morgan Funds Board or any of the heritage J.P. Morgan Funds or heritage One Group Mutual Funds (as defined below), principal occupations and other board memberships, including those in any company with a class of securities registered pursuant to Section 12 of the Securities Exchange Act of 1934, as amended (the “Securities Exchange Act”) or subject to the requirements of Section 15(d) of the Securities Exchange Act or any company registered as an investment company under the 1940 Act, are shown below. The contact address for each of the Trustees is 277 Park Avenue, New York, NY 10172.
Part II - 100
| Name (Year of Birth; Term of Office, and Length of Time Served)(1) |
Principal Occupation(s) During Past 5 Years |
Number of Funds in Fund Complex Overseen by Trustee(1) |
Other Trusteeships/ Directorships Held During the Past 5 Years |
| Independent Trustees |
|
|
|
| John F. Finn (1947); Chair since 2020; Trustee, since 1998. |
Chairman, Gardner, Inc. (supply chain management company serving industrial and consumer markets) (serving in various roles 1974–present). |
168 |
Director, Greif, Inc. (GEF) (industrial package products and services) (2007–present); Trustee, Columbus Association for the Performing Arts (1988- present). |
| Stephen P. Fisher (1959); Trustee, since 2018. |
Retired; Chairman and Chief Executive Officer, NYLIFE Distributors LLC (registered broker- dealer) (serving in various roles 2008- 2013); Chairman, NYLIM Service Company LLC (transfer agent) (2008- 2017); New York Life Investment Management LLC (registered investment adviser) (serving in various roles 2005- 2017); Chairman, IndexIQ Advisors LLC (registered investment adviser for ETFs) (2014-2017); President, MainStay VP Funds Trust (2007-2017), MainStay DefinedTerm Municipal Opportunities Fund (2011-2017) and Main- Stay Funds Trust (2007-2017) (registered investment companies). |
168 |
Honors Program Advisory Board Member, The Zicklin School of Business, Baruch College, The City University of New York (2017-present). |
| Gary L. French (1951); Trustee, since 2014. |
Real Estate Investor (2011-2020); Investment management industry Consultant and Expert Witness (2011-present); Senior Consultant for The Regulatory Fundamentals Group LLC (2011-2017). |
168 |
Independent Trustee, The China Fund, Inc. (2013- 2019); Exchange Traded Concepts Trust II (2012- 2014); Exchange Traded Concepts Trust I (2011- 2014). |
Part II - 101
| Name (Year of Birth; Term of Office, and Length of Time Served)(1) |
Principal Occupation(s) During Past 5 Years |
Number of Funds in Fund Complex Overseen by Trustee(1) |
Other Trusteeships/ Directorships Held During the Past 5 Years |
| Kathleen M. Gallagher (1958); Trustee, since 2018. |
Retired; Chief Investment Officer – Benefit Plans, Ford Motor Company (serving in various roles 1985-2016). |
168 |
Non-Executive Director, Legal & General Investment Management (Holdings) (2018- present); Non-Executive Director, Legal & General Investment Management America (U.S. Holdings) (financial services and insurance) (2017- present); Advisory Board Member, State Street Global Advisors Total Portfolio Solutions (2017-present); Member, Client Advisory Council, Financial Engines, LLC (registered investment adviser) (2011-2016); Director, Ford Pension Funds Investment Management Ltd. (2007- 2016). |
| Robert J. Grassi (1957); Trustee, since 2014. |
Sole Proprietor, Academy Hills Advisors LLC (2012- present); Pension Director, Corning Incorporated (2002- 2012). |
168 |
None. |
| Frankie D. Hughes (1952); Trustee, since 2008. |
President, Ashland Hughes Properties (property management) (2014–present); President and Chief Investment Officer, Hughes Capital Management, Inc. (fixed income asset management) (1993– 2014). |
168 |
None. |
Part II - 102
| Name (Year of Birth; Term of Office, and Length of Time Served)(1) |
Principal Occupation(s) During Past 5 Years |
Number of Funds in Fund Complex Overseen by Trustee(1) |
Other Trusteeships/ Directorships Held During the Past 5 Years |
| Raymond Kanner (1953); Trustee, since 2017. |
Retired; Managing Director and Chief Investment Officer, IBM Retirement Funds (2007–2016). |
168 |
Advisory Board Member, Penso Advisors, LLC (2020- present); Advisory Board Member, Los Angeles Capital (2018-present); Advisory Board Member, State Street Global Advisors Total Portfolio Solutions (2017-present); Acting Executive Director, Committee on Investment of Employee Benefit Assets (CIEBA) (2016-2017); Advisory Board Member, Betterment for Business (robo advisor) (2016– 2017); Advisory Board Member, BlueStar Indexes (index creator) (2013–2017); Director, Emerging Markets Growth Fund (registered investment company) (1997-2016); Member, Russell Index Client Advisory Board (2001- 2015). |
| Thomas P. Lemke (1954); Trustee, since 2014. |
Retired since 2013. |
168 |
(1) Independent Trustee of Advisors’ Inner Circle III fund platform, consisting of the following: (i) the Advisors’ Inner Circle Fund III, (ii) the Gallery Trust, (iii) the Schroder Series Trust, (iv) the Delaware Wilshire Private Markets Fund (since 2020), (v) Chiron Capital Allocation Fund Ltd., and (vi) formerly the Winton Diversified Opportunities Fund (2014-2018); and (2) Independent Trustee of the Symmetry Panoramic Trust (since 2018). |
| Lawrence R. Maffia (1950); Trustee, since 2014. |
Retired; Director and President, ICI Mutual Insurance Company (2006-2013). |
168 |
Director, ICI Mutual Insurance Company (1999-2013). |
Part II - 103
| Name (Year of Birth; Term of Office, and Length of Time Served)(1) |
Principal Occupation(s) During Past 5 Years |
Number of Funds in Fund Complex Overseen by Trustee(1) |
Other Trusteeships/ Directorships Held During the Past 5 Years |
| Mary E. Martinez (1960); Vice Chair since 2021; Trustee, since 2013. |
Associate, Special Properties, a Christie’s International Real Estate Affiliate (2010– present); Managing Director, Bank of America (asset management) (2007– 2008); Chief Operating Officer, U.S. Trust Asset Management, U.S. Trust Company (asset management) (2003–2007); President, Excelsior Funds (registered investment companies) (2004–2005). |
168 |
None. |
| Marilyn McCoy (1948); Trustee, since 1999. |
Vice President of Administration and Planning, Northwestern University (1985– present). |
168 |
None. |
| Dr. Robert A. Oden, Jr. (1946); Trustee, since 1997. |
Retired; President, Carleton College (2002–2010); President, Kenyon College (1995–2002). |
168 |
Trustee, The Coldwater Conservation Fund; Trustee, American Museum of Fly Fishing (2013–present); Trustee and Vice Chair, Trout Unlimited (2017-2021); Trustee, Dartmouth- Hitchcock Medical Center (2011–2020). |
| Marian U. Pardo (1946); Trustee, since 2013. |
Managing Director and Founder, Virtual Capital Management LLC (investment consulting) (2007– present); Managing Director, Credit Suisse Asset Management (portfolio manager) (2003–2006). |
168 |
Board Chair and Member, Board of Governors, Columbus Citizens Foundation (not-for-profit supporting philanthropic and cultural programs) (2006–present). |
Part II - 104
| Name (Year of Birth; Term of Office, and Length of Time Served)(1) |
Principal Occupation(s) During Past 5 Years |
Number of Funds in Fund Complex Overseen by Trustee(1) |
Other Trusteeships/ Directorships Held During the Past 5 Years |
| Emily A. Youssouf (1951); Trustee, since 2014. |
Adjunct Professor (2011-present) and Clinical Professor (2009-2011), NYU Schack Institute of Real Estate; Board Member and Member of the Audit Committee (2013-present), Chair of Finance Committee (2019-present), Member of Related Parties Committee (2013-2018) and Member of the Enterprise Risk Committee (2015- 2018), PennyMac Financial Services, Inc.; Board Member (2005-2018), Chair of Capital Committee (2006-2016), Chair of Audit Committee (2005-2018), Member of Finance Committee (2005-2018) and Chair of IT Committee (2016-2018), NYC Health and Hospitals Corporation. |
168 |
Trustee, NYC School Construction Authority (2009-present); Board Member, NYS Job Development Authority (2008-present); Trustee and Chair of the Audit Committee of the Transit Center Foundation (2015-2019). |
| Interested Trustees |
|
|
|
| Robert F. Deutsch(3) (1957); Trustee, since 2014. |
Retired; Head of ETF Business for JPMorgan Asset Management (2013-2017); Head of Global Liquidity Business for JPMorgan Asset Management (2003-2013). |
168 |
Treasurer and Director of the JUST Capital Foundation (2017- present). |
| Nina O. Shenker(3) (1957); Trustee, since 2022. |
Vice Chair (2017- 2021), General Counsel and Managing Director (2008-2016), Associate General Counsel and Managing Director (2004-2008), J.P. Morgan Asset & Wealth Management. |
168 |
Director and Member of Legal and Human Resources Subcommittees, American Jewish Joint Distribution Committee (2018-present). |
(1)
Trustees serve an indefinite term, until resignation, retirement, removal or death. The Board’s current retirement policy sets retirement at the end of the calendar year in which the Trustee attains the age of 75, provided that any Board member who was a member of the Mutual Fund Board prior to January 1, 2022 and was born prior to January 1, 1950 shall retire from the Board at the end of the calendar year in which the Trustee attains the age of 78.
Part II - 105
(2)
A Fund Complex means two or more registered investment companies that hold themselves out to investors as related companies for purposes of investment and investor services or have a common investment adviser or have an investment adviser that is an affiliated person of the investment adviser of any of the other registered investment companies. The J.P. Morgan Funds Complex for which the Board of Trustees serves currently includes nine registered investment companies (168 J.P. Morgan Funds).
(3)
Designation as an “Interested Trustee” is based on prior employment by the Adviser or an affiliate of the Adviser or interests in a control person of the Adviser.
The Board of Trustees decides upon general policies and is responsible for overseeing the business affairs of the Trusts.
Qualifications of Trustees
The Governance Committee and the Board consider the experience, qualifications, attributes, and skills of each Trustee to determine whether the person should serve as a Trustee of the Trusts. The Governance Committee and the Board consider the commitment that each Trustee has demonstrated in serving on the Board, including the significant time each Trustee devotes to preparing for meetings and active engagement and participation at Board meetings. The Governance Committee and the Board consider the character of each Trustee and each Trustee’s commitment to executing his or her duties as a Trustee with diligence, honesty and integrity. The Governance Committee and the Board consider the contributions that each Trustee makes to the Board in terms of experience, leadership, independence and the ability to work effectively and collaboratively with other Board members.
The Governance Committee also considers each Trustee’s significant and relevant experience and knowledge with respect to registered investment companies and asset management, including the additional experience that each of the Trustees has gained as a result of his or her service on the Unified J.P. Morgan Funds Board. Additionally, the Governance Committee and the Board consider each Trustee’s experience with respect to reviewing the Funds’ agreements with service providers, including the Funds’ investment advisers, custodian, and fund accountant.
The Governance Committee and the Board consider the experience and contribution of each Trustee in the context of the Board’s leadership and committee structure. The Board has seven committees including: the Audit and Valuation Committee, the Compliance Committee, the Governance Committee, the Equity Committee, the Money Market and Alternative Products Committee, the Fixed Income Committee, and the ETF Committee. The Equity Committee, the Money Market and Alternative Products Committee and the Fixed Income Committee are collectively referred to as the “Investment Committees.” Each Trustee, except the Chairman of the Board, serves on one of the Board’s investment committees, allowing the Board to effectively evaluate information for the Funds in the complex in a focused and disciplined manner.
The Governance Committee also considers the overall diversity of the Board’s composition. The Governance Committee believes the Board generally benefits from diversity of backgrounds, experiences and views among its members, and considers this a factor in evaluating the composition of the Board and potential nominees. In considering potential nominees, the Committee values diversity based on race, ethnicity, national origin, gender, gender identity, sexual orientation, veteran status, and other attributes. The Governance Committee expects to assess the effectiveness of the policy as part of the annual self-assessment process of the Board.
The Governance Committee also considers the operational efficiencies achieved by having a single Board for the Funds and the other registered investment companies overseen by the Adviser and its affiliates, as well as the extensive experience of certain Trustees in serving on Boards for registered investment companies advised by subsidiaries or affiliates of JPMorgan Chase & Co. and/or Bank One Corporation (known as “heritage J.P. Morgan Funds” or “heritage One Group Mutual Funds”).
In reaching its conclusion that each Trustee should serve as a Trustee of the Trusts, the Board also considered the following additional specific qualifications, contributions and experience of the following Trustees:
Independent Trustees
John F. Finn. Mr. Finn has served as the Chair of the Unified J.P. Morgan Funds Board since January 2022 and previously served as Chair of the Mutual Fund Board since January 2020 and is also Chair of the Governance Committee and a member of the ETF Committee and Audit and Valuation Committee. He has served as a member of the Mutual Fund Board since 2005 and previously was a member of the heritage One Group Mutual Funds Board since 1998. Mr. Finn is the Chairman at Gardner, Inc., a supply chain management company that serves industrial and consumer markets. Mr. Finn has experience with board
Part II - 106
functions through his current positions as a Director for Greif, Inc. (industrial package products and services) and as a Trustee for Columbus Association for the Performing Arts. Until June 2014, Mr. Finn was the head of the Mutual Fund Board’s Strategic Planning Working Group, comprised of Independent Trustees, which worked with the administrator to the Trusts on initiatives related to efficiency and effectiveness of Board materials and meetings.
Stephen P. Fisher. Mr. Fisher has served on the Unified J.P. Morgan Funds Board since January 2022 and previously served on the Mutual Fund Board since 2018 and is also Chair of the Money Market and Alternative Products Committee. Mr. Fisher is a member of the Compliance Committee. He retired after a 30-year career in the investment management industry, including most recently serving as President of New York Life Investment Management LLC (NYLIM) and the MainStay Funds group. In addition, until his retirement, he served as Chairman of NYLIM Service Company LLC (a transfer agent), Chairman and CEO of NYLIFE Distributor LLC (a registered broker-dealer) and Chairman of IndexIQ Advisors LLC (an investment adviser for the IndexIQ ETFs). As President of NYLIM, Mr. Fisher oversaw all operational aspects of NYLIM’s mutual fund and ETF clients, which included functioning as a liaison to the boards of the funds. Prior to his retirement, Mr. Fisher was involved in governance matters at NYLIM, including serving on the NYLIM Investment Governance Committee, the NYLIM Risk Steering Committee and the NYLIM Compliance Committee.
Gary L. French. Mr. French has served on the Unified J.P. Morgan Funds Board since January 2022 and previously served on the ETF Board since 2014. Mr. French is a member of the Audit and Valuation Committee and the Equity Committee. Mr. French has over 35 years of experience in the financial services industry and related fields, including serving in various leadership roles with large financial institutions that operated and administered services to investment companies. He has familiarity with a variety of financial, accounting, investment, regulatory and operational matters through his prior experience (including as Senior Vice President and Business Head in the Fund Administration Division at State Street Bank) and through other positions held during his career in the investment management industry. He also gained experience serving as an independent director and officer of several other registered investment companies.
Kathleen M. Gallagher. Ms. Gallagher has served on the Unified J.P. Morgan Funds Board since January 2022 and previously served on the Mutual Fund Board since 2018. Ms. Gallagher is Chair of the Audit and Valuation Committee and a member of the Money Market and Alternative Products Committee. She retired after a 30-year career as a finance professional in the automotive industry, including most recently as the Chief Investment Officer – Benefit Plans at Ford Motor Company (Ford), where she led Ford’s global pension de-risking investment strategy. In addition, Ms. Gallagher served as the Director of Global Risk Management, Corporate Treasury at Ford and as the Vice President of Finance at Ford Australia. During Ms. Gallagher’s career at Ford, she gained experience managing investment management and service provider relationships, and she frequently worked with Ford’s Board of Directors to recommend investment strategies and review performance. She also serves as a Non-Executive Director for Legal & General Investment Management (Holdings) and for Legal & General Investment Management America (U.S. Holdings) and as an advisory board member for State Street Global Advisors’ Total Portfolio Solutions business. She previously served as a member of the Client Advisory Council for Financial Engines, LLC and as a director of Ford Pension Funds Investment Management Ltd.
Robert J. Grassi. Mr. Grassi has served on the Unified J.P. Morgan Funds Board since January 2022 and previously served on the ETF Board since 2014. Mr. Grassi is a member of the ETF Committee and the Fixed Income Committee. Mr. Grassi has over 30 years of experience in a variety of business and financial matters, including experience in senior management positions. He has familiarity with a variety of financial, accounting, investment and regulatory matters through his prior experience (including as Director of Pensions and Investments at Corning Incorporated) and through his current position as Sole Proprietor of Academy Hills Advisors LLC, an investment consulting firm. Mr. Grassi is licensed as an Investment Advisory Representative and is a Certified Employee Benefit Specialist.
Frankie D. Hughes. Ms. Hughes has served on the Unified J.P. Morgan Funds Board since January 2022 and previously served on the Mutual Fund Board since 2008. Ms. Hughes is a member of the Compliance Committee and the Fixed Income Committee. Ms. Hughes has significant experience in the asset management industry, previously serving as President and Chief Investment Officer of Hughes Capital Management, Inc. from 1993-2014. Ms. Hughes is currently the President of Ashland Hughes Properties, a property management company, and she has held such position since 2014.
Part II - 107
Raymond Kanner. Mr. Kanner has served on the Unified J.P. Morgan Funds Board since January 2022 and previously served on the Mutual Fund Board since 2017. Mr. Kanner is Chair of the Equity Committee and a member of the Audit and Valuation Committee. Mr. Kanner retired after a 31-year career in the finance industry including most recently as the Chief Investment Officer for the IBM Retirement Funds. He started his career with IBM in 1978, joined IBM’s Credit Corporation in 1985 and moved to the Retirement Funds in 1993. During his career at IBM, Mr. Kanner gained experience overseeing substantial investments in all asset classes, including equities, fixed income and alternatives. Since his retirement and until 2017, he served as the Acting Executive Director of the Committee on Investment of Employee Benefit Assets (CIEBA). He previously served as a director of an emerging markets equity fund and as an advisory board member to Betterment for Business and to BlueStar Indexes. He currently serves as an advisory board member for State Street Global Advisors’ Total Portfolio Solutions business, Los Angeles Capital and Penso Advisors. Mr. Kanner served as a member of the Compliance Committee and the Money Market and Alternative Products Committee until December 31, 2018.
Thomas P. Lemke. Mr. Lemke has served on the Unified J.P. Morgan Funds Board since January 2022 and previously served on the ETF Board since 2014. Mr. Lemke is a member of the Compliance Committee and the Money Market and Alternative Products Committee. Mr. Lemke has over 35 years of experience in the financial services industry, including experience in various senior management positions with financial services firms in addition to multiple years of service with a regulatory agency and a major law firm. In addition, he has a background in internal controls, including legal, compliance, internal audit, risk management, and fund administration. He has also gained experience as an independent director of other registered investment companies, including his current position with each of The Advisors’ Inner Circle III and Symmetry Panoramic Trust. Mr. Lemke also is co-author of a number of treatises on the regulation of the investment management industry.
Lawrence R. Maffia. Mr. Maffia has served on the Unified J.P. Morgan Funds Board since January 2022 and previously served on the ETF Board since 2014. Mr. Maffia is a member of the ETF Committee and the Equity Committee. Mr. Maffia has over 30 years of experience in the financial services industry, including positions held at a public auditing firm and various other positions in the mutual fund industry. He has familiarity with a variety of financial, accounting, investment and regulatory matters through his prior experience (including as President and Company Director at ICI Mutual Insurance Company, a provider of D&O/E&O liability insurance and fidelity bonding for the U.S. mutual fund industry, and his prior positions as chief financial officer of Stein Roe & Farnham Mutual Funds and chief operations officer of Stein Roe & Farnham Mutual Funds’ transfer agent).
Mary E. Martinez. Ms. Martinez has served as Vice-Chair of the Unified J.P. Morgan Funds Board since January 2022 and previously served as the Vice-Chair of the Mutual Fund Board since January 2021 and is a member of the ETF Committee, the Governance Committee and the Fixed Income Committee. She has served as a member of the Mutual Fund Board since January 2013. She has over 25 years of experience in asset management, wealth management and private banking services. She served as Managing Director of Asset Management at Bank of America (which acquired U.S. Trust Company (“U.S. Trust”) in 2007). Ms. Martinez served in various roles at U.S. Trust, including President of the Excelsior Funds, member of U.S. Trust’s Executive Management Committee, Chief Executive Officer and President of U.S. Trust Private Bank, and Chief Operating Officer of Asset Management where she had responsibility for product development, management, infrastructure and operating oversight. Prior to that she was Head of Products/Services/Strategic-Planning-Alternative & Asset/Wealth Management at Bessemer Trust Company and a member of their Executive Management Committee. Ms. Martinez is a real estate investor/adviser and a Realtor Associate with Special Properties, a Christie’s International Real Estate Affiliate.
Marilyn McCoy. Ms. McCoy has served on the Unified J.P. Morgan Funds Board since January 2022 and previously served on the Mutual Fund Board since 2005 and previously was a member of the heritage One Group Mutual Funds Board since 1999. She has served on the boards of the Pegasus Funds and the Prairie Funds. Ms. McCoy is a member of the Money Market and Alternative Products Committee and the Governance Committee. Ms. McCoy has served as the Vice President of Administration and Planning at Northwestern University for over 30 years, where she manages strategic planning, program review, information and analytics, executive level searches, and other programs and initiatives. Ms. McCoy also oversees Northwestern University’s Board of Trustees function and supports the University’s President.
Dr. Robert A. Oden Jr. Dr. Oden has served on the Unified J.P. Morgan Funds Board since January 2022 and previously served on the Mutual Fund Board since 2005 and previously was a member of the heritage One Group Mutual Funds Board since 1997. Dr. Oden is the Chair of the Fixed Income Committee and a member of the Governance Committee. He retired after a long career in the education
Part II - 108
industry, previously serving as the President of Carleton College from 2002 to 2010 and as the President of Kenyon College from 1995 to 2002. Prior to that, Dr. Oden was the Headmaster of the Hotchkiss School from 1989 to 1995 and a Professor at Dartmouth College from 1975 to 1989. Dr. Oden currently serves as a Trustee of The Coldwater Conservation Fund, as Vice Chair of the American Museum of Fly Fishing and as a member of the Dartmouth-Hitchcock Medical Center Advancement Committee, and he previously served as a Trustee of American University in Cairo, Dartmouth-Hitchcock Medical Center and Trout Unlimited.
Marian U. Pardo. Ms. Pardo has served on the Unified J.P. Morgan Funds Board since January 2022 and previously served on the Mutual Fund Board since February 2013. Ms. Pardo is Chair of the Compliance Committee and a member of the Equity Committee. Ms. Pardo has been in the financial services industry since 1968, with experience in investment management, banking and lending. She is a Managing Director and founder of Virtual Capital Management LLC, an investment consulting firm. She has extensive experience with respect to portfolio management, the J.P. Morgan Funds’ investment advisory business and banking and investment management, and previously served as a portfolio manager for equity funds across the capitalization spectrum. In connection with prior employment with JPMorgan Chase, Ms. Pardo was the recipient of non-qualified pension plan payments from JPMorgan Chase in the amount of approximately $2,055 per month, which she irrevocably waived effective January 1, 2013, and deferred compensation payments from JPMorgan Chase in the amount of approximately $7,294 per year, which ended in January 2013. In addition, Ms. Pardo receives payments from a fully-funded qualified plan, which is not an obligation of JPMorgan Chase.
Emily A. Youssouf. Ms. Youssouf has served on the Unified J.P. Morgan Funds Board since January 2022 and previously served on the ETF Board since 2014. Ms. Youssouf is a member of the ETF Committee and the Fixed Income Committee. Ms. Youssouf has extensive experience in strategic planning, financial analysis and regulatory matters from her over 30 years of business experience in the financial services and housing finance industries and related fields. She currently serves on the Board of PennyMac Financial Services, Inc. (where she serves as Chair of the Finance Committee and a member of the Audit Committee), the NYC School Construction Authority, and the NYS Job Development Authority (where she also serves as a member of the Audit Committee) and as an Adjunct Professor at the NYU Schack Institute of Real Estate. Her prior business experience includes executive level positions at Merrill Lynch, Prudential Securities and Credit Suisse. She also served as President of the New York City Housing Development Corporation, Vice Chair of the New York City Housing Authority, a Board Member of the NYC Health and Hospitals Corporation (where she served as the Chair of the Audit Committee, Chair of the IT Committee and Member of the Finance Committee) and as a Trustee of the Transit Center Foundation (where she served as Chair of the Audit Committee).
Interested Trustees
Robert F. Deutsch. Mr. Deutsch has served on the Unified J.P. Morgan Funds Board since January 2022 and previously served on the ETF Board since 2014. Mr. Deutsch is Chair of the ETF Committee and a member of the Money Market and Alternative Products Committee. Mr. Deutsch has over 30 years of experience in the financial services industry. He has substantial mutual fund background and is experienced with financial, accounting, investment and regulatory matters through his tenure at J.P. Morgan Asset Management1 (“JPMAM”) including his prior positions as head of the ETF Business and as head of the Global Liquidity Business. Prior roles also include National Sales Manager for the J.P. Morgan Mutual Funds and Client Advisor at Goldman Sachs Asset Management. Mr. Deutsch is considered an “interested” Trustee based on interests in JPMorgan Chase resulting from his prior employment at JPMAM.
Nina O. Shenker. Ms. Shenker has served on the Unified J.P. Morgan Funds Board since January 2022. Ms. Shenker is a member of the ETF Committee and the Fixed Income Committee. Ms. Shenker has over 35 years of experience in the financial services industry. She has substantial experience and expertise with mutual funds and ETFs across legal, compliance, operations, risk and controls, fiduciary, governance, product and business strategy and government and regulatory affairs. She has served as Vice Chair and as global General Counsel for J.P. Morgan Asset & Wealth Management (“JPMAWM”). Prior to joining the JPMorgan Legal Department in 2001, Ms. Shenker was President of the Pierpont Group, the independent staff for the JPMorgan Mutual Funds Trustees and, prior to that, she was General Counsel and Senior Vice President at J. & W. Seligman & Co., an investment management firm. Ms. Shenker has also been actively
1
J.P. Morgan Asset Management is the marketing name for the asset management businesses of JPMorgan Chase & Co. Those businesses include, but are not limited to, J.P. Morgan Investment Management Inc.
Part II - 109
engaged with industry associations. She also is actively engaged in supporting not-for-profit organizations’ governance and oversight. Ms. Shenker is considered an “interested” Trustee based on her prior employment at J.P. Morgan.
Board Leadership Structure
The Board decides upon general policies and is responsible for overseeing the business affairs of the Funds.
The Board currently has structured itself in a manner that allows it to effectively perform its oversight function. The Chair of the Board is an Independent Trustee, which allows him to carry out his leadership duties as Chair with objectivity.
In addition, the Board has adopted a committee structure that allows it to effectively perform its oversight function for all of the Funds. As described under “Qualifications of Trustees” and “Standing Committees,” the Board currently has seven committees: the Audit and Valuation Committee, the Compliance Committee, the Governance Committee, the ETF Committee, the Equity Committee, the Fixed Income Committee and the Money Market and Alternative Products Committee. The Board has determined that the current leadership and committee structure is appropriate for the Funds and allows the Board to effectively and efficiently evaluate issues that impact the Funds as a whole as well as issues that are unique to each Fund.
The Board and the Committees take an active role in overseeing the risk associated with registered investment companies including investment risk, compliance and valuation. In addition, the Board receives regular reports from the Chief Compliance Officer (“CCO”), JPMIM in its capacity both as administrator for the Funds and as investment adviser to the Funds (“Administrator” and “Adviser”, as applicable), and the internal audit department of JPMorgan Chase & Co. The Board also receives periodic reports from the Chief Risk Officer of Investment Management Americas and Alternatives of JPMAM including reports concerning operational controls that are designed to address market risk, credit risk, and liquidity risk among others. The Board also receives regular reports from personnel responsible for JPMAM’s business resiliency and disaster recovery.
In addition, the Board, the Equity Committee, the Fixed Income Committee, and the Money Market and Alternative Products Committee meet regularly with representatives of the Adviser and an independent consultant to review and evaluate the ongoing performance of the Funds. Each of these three Committees reports these reviews to the full Board. The Audit and Valuation Committee is responsible for oversight of the performance of the Fund’s audit, accounting and financial reporting policies, practices and internal controls and valuation policies, assisting the Board in its oversight of the valuation of the Funds’ securities by the Adviser, overseeing the quality and objectivity of the Funds’ independent audit and the financial statements of the Funds, and acting as a liaison between the Funds’ independent registered public accounting firm and the full Board. The Compliance Committee is responsible for oversight of the Funds’ compliance with legal, regulatory and contractual requirements and compliance with policy and procedures. The Governance Committee is responsible for, among other things, oversight of matters relating to the Funds’ corporate governance obligations, Fund service providers and litigation. The ETF Committee is responsible for, among other things, oversight of the J.P. Morgan ETFs with regard to the J.P. Morgan ETFs’ operational, legal, regulatory and contractual requirements relating to or impacting J.P. Morgan ETFs. At each quarterly meeting, each of the Governance Committee, the ETF Committee, the Audit and Valuation Committee and the Compliance Committee report their committee proceedings to the full Board. This Committee structure allows the Board to efficiently evaluate a large amount of material and effectively fulfill its oversight function. Annually, the Board considers the efficiency of this committee structure.
Additional information about each of the Committees is included below in “Standing Committees.”
Standing Committees
The Board of Trustees has seven standing committees: (i) the Audit and Valuation Committee, (ii) the Compliance Committee, (iii) the Governance Committee, (iv) the Equity Committee, (v) the ETF Committee, (vi) the Fixed Income Committee, and (vii) the Money Market and Alternative Products Committee.
Part II - 110
The members of each Committee are set forth below:
| Name of Committee |
Members |
Committee Chair |
| Audit and Valuation Committee |
Ms. Gallagher Mr. Finn Mr. French Mr. Kanner |
Ms. Gallagher |
| Compliance Committee |
Ms. Pardo Mr. Fisher Ms. Hughes Mr. Lemke |
Ms. Pardo |
| Governance Committee |
Mr. Finn Ms. Martinez Ms. McCoy Dr. Oden |
Mr. Finn |
| ETF Committee |
Mr. Deutsch Mr. Finn Mr. Grassi Mr. Maffia Ms. Martinez Ms. Shenker Ms. Youssouf |
Mr. Deutsch |
| Equity Committee |
Mr. Kanner Mr. French Mr. Maffia Ms. Pardo |
Mr. Kanner |
| Fixed Income Committee |
Dr. Oden Mr. Grassi Ms. Hughes Ms. Martinez Ms. Shenker Ms. Youssouf |
Dr. Oden |
| Money Market and Alternative Products Committee |
Mr. Fisher Mr. Deutsch Ms. Gallagher Mr. Lemke Ms. McCoy |
Mr. Fisher |
Audit and Valuation Committee. The Audit and Valuation Committee operates pursuant to a written charter. It is composed entirely of Independent Trustees. The purposes of the Audit and Valuation Committee are to: (i) appoint and determine compensation of the Funds’ independent accountants; (ii) evaluate the independence of the Funds’ independent accountants; (iii) oversee the performance of the Funds’ audit, accounting and financial reporting policies, practices and internal controls and valuation policies; (iv) approve non-audit services, as required by the statutes and regulations administered by the SEC, including the 1940 Act and the Sarbanes-Oxley Act of 2002; (v) assist the Board in its oversight of the valuation of the Funds’ securities by the Administrator and Adviser, as applicable, and any sub-adviser, as applicable; (vi) oversee the quality and objectivity of the Funds’ independent audit and the financial statements of the Funds; and (vii) act as a liaison between the Funds’ independent registered public accounting firm and the full Board. The Audit and Valuation Committee has delegated responsibilities to the Chair of the Committee or any designated member of the Committee to respond to inquiries on valuation matters and that occur between meetings of the Committee when the Funds’ valuation procedures or law require Board or Committee action, but it is impracticable or impossible to hold a meeting of the entire Board or Committee.
Compliance Committee. The Compliance Committee operates pursuant to a written charter. The primary purposes of the Compliance Committee are to (i) oversee the Funds’ compliance with legal and regulatory and contractual requirements and the Funds’ compliance policies and procedures; and (ii) consider the appointment, compensation and removal of the Funds’ Chief Compliance Officer.
Governance Committee. The Governance Committee operates pursuant to a written charter. The duties of the Governance Committee include, but are not limited to, (i) selection and nomination of persons for election or appointment as Trustees; (ii) periodic review of the compensation payable to the Independent Trustees; (iii) establishment of Independent Trustee expense policies; (iv) periodic review and
Part II - 111
evaluation of the functioning of the Board and its committees; (v) with respect to certain registrants, appointment and removal of the applicable funds’ Senior Officer, and approval of compensation for the funds’ Senior Officer and retention and compensation of the Senior Officer’s staff and consultants; (vi) selection of independent legal counsel to the Independent Trustees and legal counsel to the Funds; (vii) oversight of ongoing litigation affecting the Funds, the Adviser or the Independent Trustees; (viii) oversight of regulatory issues or deficiencies affecting the Funds (except financial matters considered by the Audit and Valuation Committee); and (ix) oversight and review of matters with respect to service providers to the Funds (except the Funds’ independent registered public accounting firm). When evaluating a person as a potential nominee to serve as an Independent Trustee, the Governance Committee may consider, among other factors, (i) whether or not the person is “independent” and whether the person is otherwise qualified under applicable laws and regulations to serve as a Trustee; (ii) whether or not the person is willing to serve, and willing and able to commit the time necessary for the performance of the duties of an Independent Trustee; (iii) the contribution that the person can make to the Board and the J.P. Morgan Funds, with consideration being given to the person’s business experience, education and such other factors as the Committee may consider relevant; (iv) the character and integrity of the person; (v) the desirable personality traits, including independence, leadership and the ability to work with the other members of the Board; and (vi) to the extent consistent with the 1940 Act, such recommendations from management as are deemed appropriate. The process of identifying nominees involves the consideration of candidates recommended by one or more of the following: current Independent Trustees, officers, shareholders and other sources that the Governance Committee deems appropriate, including the Mutual Fund Directors Forum. The Governance Committee will review nominees recommended to the Board by shareholders and will evaluate such nominees in the same manner as it evaluates nominees identified by the Governance Committee. Nominee recommendations may be submitted to the Secretary of the Trusts at each Trust’s principal business address.
ETF Committee. The ETF Committee operates pursuant to a written charter. The duties of the ETF Committee include, but are not limited to, (i) monitoring significant industry, legal and regulatory developments relating to ETFs; (ii) receiving reports from fund management and reviewing secondary market trading in J.P. Morgan ETF shares; (iii) receiving reports on and reviewing with fund management matters related to the listing of J.P. Morgan ETF’s shares on various exchanges; (iv) receiving reports on and reviewing with fund management matters related to self-indexing and third-party indexing; (v) receiving reports on and reviewing with fund management transaction fees charged in connection with J.P. Morgan ETF creation and redemption transactions; (vi) recommending action to the full Boards in regard to proposed changes to basket construction and custom basket policies and procedures; (vii) reviewing with fund management authorized participant relationships and agreements; (viii) receiving and reviewing reports with fund management related to J.P. Morgan ETF distribution matters; (ix) receiving reports from fund management on the investment performance of J.P. Morgan ETFs; (x) receiving reports from fund management on J.P. Morgan ETF risk matters; (xi) considering ETF-specific proposals and recommending action to the appropriate committee or the full boards in connection with the Trust’s ETFs; and (xii) assisting the compliance committee with its oversight responsibility related to J.P. Morgan ETFs.
Equity Committee, Fixed Income Committee and Money Market and Alternative Products Committee. Each member of the Board, other than Mr. Finn, serves on one of the following committees, which are divided by asset type: the Equity Committee, the Fixed Income Committee or the Money Market and Alternative Products Committee. The function of the Committees is to assist the Board in the oversight of the investment management services provided by the Adviser to the Funds, as well as any sub-adviser to the Funds. The primary purposes of each Committee are to (i) assist the Board in its oversight of the investment management services provided by the Adviser to the Funds designated for review by each Committee; and (ii) review and make recommendations to the Board concerning the approval of proposed new or continued advisory and distribution arrangements for the Funds or for new funds. The full Board may delegate to the applicable Committee from time to time the authority to make Board level decisions on an interim basis when it is impractical to convene a meeting of the full Board. Each of the Committees receives reports concerning investment management topics, concerns or exceptions with respect to particular Funds that the Committee is assigned to oversee, and works to facilitate the understanding by the Board of particular issues related to investment management of Funds reviewed by the applicable Committee.
For details of the number of times each of the standing committees met during the most recent fiscal year, see “TRUSTEES — Standing Committees” in Part I of this SAI.
For details of the dollar range of equity securities owned by each Trustee in the Funds, see “TRUSTEES — Ownership of Securities” in Part I of this SAI.
Part II - 112
Trustee Compensation
The Trustees instituted a Deferred Compensation Plan for Eligible Trustees (the “Deferred Compensation Plan”) pursuant to which the Trustees are permitted to defer part or all of their compensation. Amounts deferred are deemed invested in shares of one or more series of JPMT I, JPMT II, JPMT IV, Undiscovered Managers Funds, JPMFMFG, and JPMMFIT, as selected by the Trustee from time to time, to be used to measure the performance of a Trustee’s deferred compensation account. Amounts deferred under the Deferred Compensation Plan will be deemed to be invested in Class I Shares of the identified funds, unless Class I Shares are not available, in which case the amounts will be deemed to be invested in Class A Shares. A Trustee’s deferred compensation account will be paid at such times as elected by the Trustee, subject to certain mandatory payment provisions in the Deferred Compensation Plan (e.g., death of a Trustee). Deferral and payment elections under the Deferred Compensation Plan are subject to strict requirements for modification.
The Declarations of Trust provide that the Trusts will indemnify its Trustees and officers against liabilities and expenses incurred in connection with litigation in which they may be involved because of their offices with the Trusts, unless, as to liability to the Trusts or their shareholders, it is finally adjudicated that they engaged in willful misfeasance, bad faith, gross negligence or reckless disregard of the duties involved in their offices (collectively, “disabling conduct”). In the case of settlement, such indemnification will not be provided unless it has been determined by a court or other body approving the settlement or disposition, or in the absence of such a determination, there has been a dismissal of the proceeding by the court or other body before it was brought for insufficiency of evidence of any disabling conduct with which the Trustee or officer has been charged, or by a reasonable determination based upon a review of readily available facts, by vote of a majority of disinterested Trustees or in a written opinion of independent counsel, that such officers or Trustees did not engage in disabling conduct.
For details of Trustee compensation paid by the Funds, including deferred compensation, see “TRUSTEES — Trustee Compensation” in Part I of this SAI.
OFFICERS
The Trusts' executive officers (listed below) generally are employees of the Adviser or one of its affiliates. The officers conduct and supervise the business operations of the Trusts. The officers hold office until a successor has been elected and duly qualified. The Trusts have no employees. The names of the officers of the Funds, together with their year of birth, information regarding their positions held with the Trusts and principal occupations are shown below. The contact address for each of the officers, unless otherwise noted, is 277 Park Avenue, New York, NY 10172.
| Name (Year of Birth), Positions Held with the Trusts (Since) |
Principal Occupations During Past 5 Years |
| Brian S. Shlissel (1964), President and Principal Executive Officer (2016)* |
Managing Director and Chief Administrative Officer for J.P. Morgan pooled vehicles, J.P. Morgan Investment Management Inc. since 2014. |
| Timothy J. Clemens (1975), Treasurer and Principal Financial Officer (2018) |
Executive Director, J.P. Morgan Investment Management Inc. since February 2016. Mr. Clemens has been with J.P. Morgan Investment Management Inc. since 2013. |
| Gregory S. Samuels (1980), Secretary (2019)** (formerly Assistant Secretary 2010-2019) |
Managing Director and Assistant General Counsel, JPMorgan Chase. Mr. Samuels has been with JPMorgan Chase since 2010. |
| Stephen M. Ungerman (1953), Chief Compliance Officer (2005) |
Managing Director, JPMorgan Chase & Co.; Mr. Ungerman has been with JPMorgan Chase & Co. since 2000. |
| Kiesha Astwood-Smith (1973), Assistant Secretary (2021)** |
Vice President and Assistant General Counsel, JPMorgan Chase since June 2021; Senior Director and Counsel, Equitable Financial Life Insurance Company (formerly, AXA Equitable Life Insurance Company) from September 2015 through June 2021. |
| Matthew Beck (1988), Assistant Secretary (2021)*** |
Vice President and Assistant General Counsel, JPMorgan Chase since May 2021; Senior Legal Counsel, Ultimus Fund Solutions from May 2018 through May 2021; General Counsel, The Nottingham Company from April 2014 through May 2018. |
Part II - 113
| Name (Year of Birth), Positions Held with the Trusts (Since) |
Principal Occupations During Past 5 Years |
| Elizabeth A. Davin (1964), Assistant Secretary (2005)*** |
Executive Director and Assistant General Counsel, JPMorgan Chase. Ms. Davin has been with JPMorgan Chase (formerly Bank One Corporation) since 2004. |
| Jessica K. Ditullio (1962), Assistant Secretary (2005)*** |
Executive Director and Assistant General Counsel, JPMorgan Chase. Ms. Ditullio has been with JPMorgan Chase (formerly Bank One Corporation) since 1990. |
| Anthony Geron (1971), Assistant Secretary (2018)** |
Vice President and Assistant General Counsel, JPMorgan Chase since September 2018; Lead Director and Counsel, AXA Equitable Life Insurance Company from 2015 to 2018 and Senior Director and Counsel, AXA Equitable Life Insurance Company from 2014 to 2015. |
| Carmine Lekstutis (1980), Assistant Secretary (2011)** |
Executive Director and Assistant General Counsel, JPMorgan Chase. Mr. Lekstutis has been with JPMorgan Chase since 2011. |
| Max Vogel (1990), Assistant Secretary (2021)** |
Vice President and Assistant General Counsel, JPMorgan Chase since June 2021; Associate, Proskauer Rose LLP (law firm) from March 2017 to June 2021; Associate, Stroock & Stroock & Lavan LLP (law firm) from October 2015 to March 2017. |
| Zachary E. Vonnegut-Gabovitch (1986), Assistant Secretary (2017)** |
Vice President and Assistant General Counsel, JPMorgan Chase since September 2016. |
| Michael M. D’Ambrosio (1969), Assistant Treasurer (2012) |
Managing Director, J.P. Morgan Investment Management Inc. Mr. D’Ambrosio has been with J.P. Morgan Investment Management Inc. since 2012. |
| Aleksandr Fleytekh (1972), Assistant Treasurer (2019) |
Vice President, J.P. Morgan Investment Management Inc. since February 2012. |
| Shannon Gaines (1977), Assistant Treasurer (2018)*** |
Vice President, J.P. Morgan Investment Management Inc. since January 2014. |
| Jeffrey D. House (1972), Assistant Treasurer (2017)*** |
Vice President, J.P. Morgan Investment Management Inc. since July 2006. |
| Michael Mannarino (1985), Assistant Treasurer (2020) |
Vice President, J.P. Morgan Investment Management Inc. since 2014. |
| Joseph Parascondola (1963), Assistant Treasurer (2011)* |
Executive Director, J.P. Morgan Investment Management Inc. Mr. Parascondola has been with J.P. Morgan Investment Management Inc. since 2006. |
| Gillian I. Sands (1969), Assistant Treasurer (2012) |
Executive Director, J.P. Morgan Investment Management Inc. since September 2012. |
*
The contact address for the officer is 575 Washington Boulevard, Jersey City, NJ 07310.
**
The contact address for the officer is 4 New York Plaza, New York, NY 10004.
***
The contact address for the officer is 1111 Polaris Parkway, Columbus, OH 43240.
For details of the percentage of shares of any class of each Fund owned by the officers and Trustees, as a group, see “SHARE OWNERSHIP — Trustees and Officers” in Part I of this SAI.
INVESTMENT ADVISER AND SUB-ADVISERS
Pursuant to investment advisory agreements, JPMIM serves as investment adviser to the Funds. J.P. Morgan Private Investments, Inc. serves as sub-adviser to certain funds pursuant to an investment sub-advisory agreement with JPMIM. Fuller & Thaler Asset Management, Inc. serves as sub-adviser for the Undiscovered Managers Behavioral Value Fund pursuant to a sub-advisory agreement with JPMIM.
The Trust’s Shares are not sponsored, endorsed or guaranteed by, and do not constitute obligations or deposits of JPMorgan Chase, any bank affiliate of JPMIM or any other bank, and are not insured by the FDIC or issued or guaranteed by the U.S. government or any of its agencies.
Part II - 114
For details of the investment advisory fees paid under an applicable advisory agreement, see “INVESTMENT ADVISER — Investment Advisory Fees” in Part I of the SAI for the respective Fund.
For details of the dollar range of shares of each Fund (excluding Money Market Funds) beneficially owned by the portfolio managers who serve on a team that manages such Fund, see “PORTFOLIO MANAGERS — Portfolio Managers’ Other Accounts Managed” in Part I of this SAI.
J.P. Morgan Investment Management Inc (“JPMIM”). JPMIM serves as investment adviser to certain Funds pursuant to the investment advisory agreements between JPMIM and certain of the Trusts (the “JPMIM Advisory Agreements”). Effective October 1, 2003, JPMIM became a wholly-owned subsidiary of JPMorgan Asset Management Holdings Inc., which is a wholly-owned subsidiary of JPMorgan Chase & Co. (“JPMorgan Chase”). Prior to October 1, 2003, JPMIM was a wholly-owned subsidiary of JPMorgan Chase, a publicly traded bank holding company organized under the laws of the State of Delaware which was formed from the merger of J.P. Morgan & Co. Incorporated with and into The Chase Manhattan Corporation.
JPMIM is a registered investment adviser under the Investment Advisers Act of 1940, as amended. JPMIM is located at 383 Madison Avenue, New York, NY 10179.
Under the JPMIM Advisory Agreements, JPMIM provides investment advisory services to certain Funds, which include managing the purchase, retention and disposition of such Funds’ investments. JPMIM may delegate its responsibilities to a sub-adviser. Any subadvisory agreements must be approved by the applicable Trust’s Board of Trustees and the applicable Fund’s shareholders, to the extent required by the 1940 Act.
Under separate agreements, JPMorgan Chase Bank, JPMIM and JPMorgan Distribution Services, Inc. (“JPMDS”) provide certain custodial, fund accounting, recordkeeping and administrative services to the Trusts and the Funds and shareholder services for the Trusts. JPMDS is the shareholder servicing agent and the distributor for certain Funds. JPMorgan Chase Bank, JPMIM and JPMDS are each subsidiaries of JPMorgan Chase and affiliates of the Advisers. See the “Custodian,” “Administrator,” “Shareholder Servicing” and “Distributor” sections.
Under the terms of the JPMIM Advisory Agreements, the investment advisory services JPMIM provides to certain Funds are not exclusive. JPMIM is free to and does render similar investment advisory services to others. JPMIM serves as investment adviser to personal investors and other investment companies and acts as fiduciary for trusts, estates and employee benefit plans. Certain of the assets of trusts and estates under management are invested in common trust funds for which JPMIM serves as trustee. The accounts which are managed or advised by JPMIM have varying investment objectives, and JPMIM invests assets of such accounts in investments substantially similar to, or the same as, those which are expected to constitute the principal investments of certain Funds. Such accounts are supervised by employees of JPMIM who may also be acting in similar capacities for the Funds. See “Portfolio Transactions.”
The Funds are managed by employees of JPMIM who, in acting for their customers, including the Funds, do not discuss their investment decisions with any personnel of JPMorgan Chase or any personnel of other divisions of JPMIM or with any of their affiliated persons, with the exception of certain other investment management affiliates of JPMorgan Chase which execute transactions on behalf of the Funds.
As compensation for the services rendered and related expenses, such as salaries of advisory personnel borne by JPMIM or a predecessor, under the JPMIM Advisory Agreements, the applicable Trusts, on behalf of the Funds, have agreed to pay JPMIM a fee, which is computed daily and may be paid monthly, equal to the annual rate of each Fund’s average daily net assets as described in the applicable Prospectuses.
The JPMIM Advisory Agreements continue in effect for annual periods beyond October 31 of each year only if specifically approved thereafter annually in the same manner as the Distribution Agreement; except that for new funds, the initial approval will continue for up to two years, after which annual approvals are required. See the “Distributor” section. The JPMIM Advisory Agreements will terminate automatically if assigned and are terminable at any time without penalty by a vote of a majority of the Trustees, or by a vote of the holders of a majority of a Fund’s outstanding voting securities (as defined in the 1940 Act), on 60 days’ written notice to JPMIM and by JPMIM on 90 days’ written notice to the Trusts
Part II - 115
(60 days with respect to the International Research Enhanced Equity Fund, Mid Cap Value Fund and Growth Advantage Fund). The continuation of the JPMIM Advisory Agreements was last approved by the Board of Trustees at its meeting in August 2019.
The JPMIM Advisory Agreements provide that the Adviser shall not be liable for any error of judgment or mistake of law or for any loss suffered by the Trust in connection with the performance of the respective investment advisory agreement, except a loss resulting from willful misfeasance, bad faith, or gross negligence on the part of the Adviser in the performance of its duties, or from reckless disregard by it of its duties and obligations thereunder, or, with respect to all such Funds except the Mid Cap Value Fund, a loss resulting from a breach of fiduciary duty with respect to the receipt of compensation for services.
Prior to January 1, 2010, JPMIA served as investment adviser to certain JPMT II Funds pursuant to the Amended and Restated Investment Advisory Agreement between JPMIA and JPMT II dated August 12, 2004 (the “JPMT II Advisory Agreement”). On July 1, 2004, Bank One Corporation, the former indirect corporate parent of JPMIA, merged into J.P. Morgan Chase & Co. (now officially known as JPMorgan Chase & Co.). On that date, JPMIA became an indirect, wholly-owned subsidiary of JPMorgan Chase. JPMIA is a registered investment adviser under the Investment Advisers Act of 1940, as amended. Effective January 1, 2010 (the “Effective Date”), the investment advisory business of JPMIA was transferred to JPMIM and JPMIM became the investment adviser for the applicable Funds under the JPMT II Advisory Agreement. The appointment of JPMIM did not change the portfolio management team, the investment strategies, the investment advisory fees charged to the Funds or the terms of the JPMT II Advisory Agreement (other than the identity of the investment adviser). Shareholder approval was not required for the replacement of JPMIA by JPMIM.
Subject to the supervision of a Trust’s Board of Trustees, JPMIM provides or will cause to be provided a continuous investment program for certain Funds, including investment research and management with respect to all securities and investments and cash equivalents in those Funds. JPMIM may delegate its responsibilities to a sub-adviser. Any subadvisory agreements must be approved by the Trust’s Board of Trustees and the applicable Funds’ shareholders, to the extent required by the 1940 Act.
The JPMT II Advisory Agreement continues in effect for annual periods beyond October 31 of each year, if such continuance is approved at least annually by the Trust’s Board of Trustees or by vote of a majority of the outstanding Shares of such Fund (as defined under “Additional Information” in this SAI), and a majority of the Trustees who are not parties to the respective investment advisory agreements or interested persons (as defined in the 1940 Act) of any party to the respective investment advisory agreements by votes cast in person at a meeting called for such purpose. The continuation of the JPMT II Advisory Agreement was approved by the Trust’s Board of Trustees at its meeting held in August 2019.
The JPMT II Advisory Agreement may be terminated as to a particular Fund at any time on 60 days’ written notice without penalty by the Trustees, by vote of a majority of the outstanding Shares of that Fund, or by the Fund’s Adviser as the case may be. The JPMIA Advisory Agreement also terminates automatically in the event of any assignment, as defined in the 1940 Act.
As compensation for the services rendered and related expenses, such as salaries of advisory personnel borne by JPMIM, under the JPMT II Advisory Agreement, the applicable Trusts, on behalf of the Funds, have agreed to pay JPMIM a fee, which is computed daily and may be paid monthly, equal to the annual rate of each Fund’s average daily net assets as described in the applicable Prospectuses.
The JPMT II Advisory Agreement provides that the Adviser shall not be liable for any error of judgment or mistake of law or for any loss suffered by the Trust in connection with the performance of the respective investment advisory agreement, except a loss resulting from a breach of fiduciary duty with respect to the receipt of compensation for services or a loss resulting from willful misfeasance, bad faith, or gross negligence on the part of the Adviser in the performance of its duties, or from reckless disregard by it of its duties and obligations thereunder.
J.P. Morgan Private Investments, Inc. (“JPMPI”). JPMPI has been engaged by JPMIM to serve as investment sub-adviser to the JPMorgan Access Balanced Fund and JPMorgan Access Growth Fund (the “JPMPI Sub-Advisory Agreement”). JPMPI is a wholly owned subsidiary of JPMorgan Chase & Co. JPMPI is located at 383 Madison Avenue, New York, NY 10179.
JPMPI is paid monthly by JPMIM a fee equal to a percentage of the average daily net assets of the JPMorgan Access Balanced Fund and JPMorgan Access Growth Fund. The aggregate annual rate of the fees payable by JPMIM to JPMPI is 0.75% of the portion of each of the JPMorgan Access Balanced Fund’s and JPMorgan Access Growth Fund’s average daily net assets managed by JPMPI.
Part II - 116
The JPMPI Sub-Advisory Agreement will continue in effect for a period of two years from the date of its execution, unless terminated sooner. It may be renewed from year to year thereafter, so long as continuance is specifically approved at least annually in accordance with the requirements of the 1940 Act.
The JPMPI Sub-Advisory Agreement provides that it will terminate in the event of an “assignment” (as defined in the 1940 Act), and may be terminated without penalty at any time by either party upon 60 days’ written notice, or upon termination of the JPMIM Advisory Agreement. Under the terms of the JPMPI Sub-Advisory Agreement, JPMPI is not liable to JPMIM, the JPMorgan Access Balanced Fund or the JPMorgan Access Growth Fund, or their shareholders, for any error of judgment or mistake of law or for any losses sustained by JPMIM, the JPMorgan Access Balanced Fund or the JPMorgan Access Growth Fund or their shareholders, except in the case of JPMPI’s willful misfeasance, bad faith, gross negligence or reckless disregard of obligations or duties under the JPMPI Sub-Advisory Agreement.
Fuller & Thaler Asset Management, Inc. (“Fuller & Thaler”). Fuller & Thaler has served as the sub-adviser to the Undiscovered Managers Behavioral Value Fund (“Behavioral Value Fund”) for the life of the Fund. As sub-adviser, Fuller & Thaler provides day-to-day management of the Fund’s portfolio. Fuller & Thaler is located at 411 Borel Avenue, Suite 300, San Mateo, California 94402.
The Behavioral Value Fund’s investment portfolio is managed on a day-to-day basis by the Behavioral Value Fund’s sub-adviser pursuant to a sub-advisory agreement. The sub-adviser is regarded for purposes of the 1940 Act as being controlled by the following person, who is a principal of the firm and owns more than 25% of the voting securities of the firm: Russell J. Fuller (Fuller & Thaler).
Under the sub-advisory agreement relating to the Behavioral Value Fund between JPMIM and the Behavioral Value Fund’s sub-adviser, the sub-adviser is entitled to fees, payable at least quarterly by JPMIM out of the fees JPMIM receives, of a certain percentage of the average daily net asset value of the Behavioral Value Fund. For the Behavioral Value Fund, JPMIM will pay the sub-adviser compensation at the annual rate of 0.55% of the Fund’s average daily net assets. For a description of such fees, see “The Funds’ Management and Administration” section in the Fund’s prospectuses.
The Fuller & Thaler Sub-Advisory Agreement will continue in effect for a period of two years from the date of its execution, unless terminated sooner. It may be renewed from year to year thereafter, so long as continuance is specifically approved at least annually in accordance with the requirements of the 1940 Act.
The Fuller & Thaler Sub-Advisory Agreement provides that it may be terminated without penalty by JPMIM, by vote of the Board of Trustees of the Trust or by vote of a majority of the outstanding securities of the relevant Fund, upon 60 days’ written notice and shall automatically terminate in the event of its assignment. The Fund’s advisory agreement provides that JPMIM owns all rights to and control of the name “Undiscovered Managers.” The Fund’s advisory agreement will automatically terminate if the Trust or the relevant Fund shall at any time be required by JPMIM to eliminate all reference to the words “Undiscovered Managers” or the letters “UM,” as applicable, in the name of the Trust or the Fund, unless the continuance of the agreement after such change of name is approved by a majority of the outstanding voting securities of the Fund and by a majority of the Trustees who are not interested persons of the Trust or JPMIM, cast in person at a meeting called for the purpose of voting on such approval.
POTENTIAL CONFLICTS OF INTEREST
JPMIM1
JPMIM and/or its affiliates (the “Affiliates” and, together, “JPMorgan”) provide an array of discretionary and non-discretionary investment management services and products to institutional clients and individual investors. In addition, JPMorgan is a diversified financial services firm that provides a broad range of services and products to its clients and is a major participant in the global currency, equity, commodity, fixed-income and other markets in which a Fund invests or will invest. Investors should carefully review the following, which describes potential and actual conflicts of interest that JPMorgan can face in the operation of its investment management services. JPMorgan and the Funds have adopted
1
The affiliates of JPMIM that act as Adviser or Sub-Adviser to a Fund – J.P. Morgan Private Investments Inc.—will also face some or all of the conflicts of interest described in this section. References to JPMIM should be read to apply to these other advisers for a Fund advised or sub-advised by such other adviser.
Part II - 117
policies and procedures reasonably designed to appropriately prevent, limit or mitigate the conflicts of interest described below. In addition, many of the activities that create these conflicts of interest are limited and/or prohibited by law, unless an exception is available.
This section is not, and is not intended to be, a complete enumeration or explanation of all of the potential conflicts of interest that may arise. Additional information about potential conflicts of interest regarding JPMIM and JPMorgan is set forth in JPMIM’s Form ADV. A copy of Part 1 and Part 2A of JPMIM’s and each other Adviser’s or Sub-Adviser’s Form ADV is available on the SEC’s website (www.adviserinfo.sec.gov).
Acting for Multiple Clients. In general, JPMIM faces conflicts of interest when it renders investment advisory services to several clients and, from time to time, provides dissimilar investment advice to different clients. For example, when funds or accounts managed by JPMIM (“Other Accounts”) engage in short sales of the same securities held by a Fund, JPMIM could be seen as harming the performance of a Fund for the benefit of the Other Accounts engaging in short sales, if the short sales cause the market value of the securities to fall. In addition, a conflict could arise when one or more Other Accounts invest in different instruments or classes of securities of the same issuer than those in which a Fund invests. In certain circumstances, Other Accounts have different investment objectives or could pursue or enforce rights with respect to a particular issuer in which a Fund has also invested and these activities could have an adverse effect on the Fund. For example, if a Fund holds debt instruments of an issuer and an Other Account holds equity securities of the same issuer, then if the issuer experiences financial or operational challenges, the Fund (which holds the debt instrument) may seek a liquidation of the issuer, whereas the Other Account (which holds the equity securities) may prefer a reorganization of the issuer. In addition, an issuer in which the Fund invests may use the proceeds of the Fund’s investment to refinance or reorganize its capital structure which could result in repayment of debt held by JPMorgan or an Other Account. If the issuer performs poorly following such refinancing or reorganization, the Fund’s results will suffer whereas the Other Account’s performance will not be affected because the Other Account no longer has an investment in the issuer. Conflicts are magnified with respect to issuers that become insolvent. It is possible that in connection with an insolvency, bankruptcy, reorganization, or similar proceeding, a Fund will be limited (by applicable law, courts or otherwise) in the positions or actions it will be permitted to take due to other interests held or actions or positions taken by JPMorgan or Other Accounts.
Positions taken by Other Accounts may also dilute or otherwise negatively affect the values, prices or investment strategies associated with positions held by a Fund. For example, this may occur when investment decisions for the Fund are based on research or other information that is also used to support portfolio decisions by JPMIM for Other Accounts following different investment strategies or by Affiliates in managing their clients’ accounts. When an Other Account or an account managed by an Affiliate implements a portfolio decision or strategy ahead of, or contemporaneously with, similar portfolio decisions or strategies for a Fund (whether or not the portfolio decisions emanate from the same research analysis or other information), market impact, liquidity constraints, or other factors could result in the Fund receiving less favorable investment results, and the costs of implementing such portfolio decisions or strategies could be increased or the Fund could otherwise be disadvantaged.
Investment opportunities that are appropriate for a Fund may also be appropriate for Other Accounts and there is no assurance the Fund will receive an allocation of all or a portion of those investments it wishes to pursue. JPMIM’s management of an Other Account that pays it a performance fee or a higher management fee and follows the same or similar strategy as a Fund or invests in substantially similar assets as a Fund, creates an incentive for JPMIM to favor the account paying it the potentially higher fee, e.g., in placing securities trades.
JPMIM and its Affiliates, and any of their directors, officers or employees, also buy, sell, or trade securities for their own accounts or the proprietary accounts of JPMIM and/or an Affiliate. JPMIM or its Affiliates, within their discretion, may make different investment decisions and take other actions with respect to their own proprietary accounts than those made for client accounts, including the timing or nature of such investment decisions or actions. Further, JPMIM is not required to purchase or sell for any client account securities that it, an Affiliate or any of its or their employees may purchase or sell for their own accounts or the proprietary accounts of JPMIM or an Affiliate or its clients. JPMIM, its Affiliates and their respective directors, officers and employees face a conflict of interest as they will have income or other incentives to favor their own accounts or proprietary accounts.
The portfolio managers of certain Funds-of-Funds and separate accounts have access to the holdings and may have knowledge of the investment strategies and techniques of certain underlying Funds because they (i) receive portfolio holding information concerning accounts that are managed in a similar strategy
Part II - 118
as an underlying Fund that is not subject to the same restrictions as the underlying Funds and/or (ii) they serve as or oversee the portfolio manager(s) of the underlying Funds. In addition, the portfolio managers of certain Funds-of-Funds and separate accounts have periodic access to risk exposure information such as currency, sector, region, country, asset class, credit quality, volatility characteristics, VaR and stress information, exposure versus benchmarks, duration and Environmental, Social and Governance (“ESG”) ratings based on the aggregate daily holdings of the underlying Funds in which such Funds-of-Funds and separate accounts invest. They therefore face conflicts of interest in the timing and amount of allocations to or redemptions from an underlying Fund, as well as in the choice of an underlying Fund.
The chart in Part I of this SAI entitled “Portfolio Managers’ Other Accounts Managed” shows the number, type and market value as of a specified date of the accounts and other Funds managed by each Fund’s (excluding the Money Market Funds’) portfolio managers.
Acting in Multiple Commercial Capacities. JPMorgan is a diversified financial services firm that provides a broad range of services and products to its clients and is a major participant in the global currency, equity, commodity, fixed-income and other markets in which a Fund invests or may invest. JPMorgan is typically entitled to compensation in connection with these activities and the Funds will not be entitled to any such compensation. In providing services and products to clients other than the Funds, JPMorgan, from time to time, faces conflicts of interest with respect to activities recommended to or performed for a Fund on one hand and for JPMorgan’s other clients on the other hand. For example, JPMorgan has, and continues to seek to develop, banking and other financial and advisory relationships with numerous U.S. and non-U.S. persons and governments. JPMorgan also advises and represents potential buyers and sellers of businesses worldwide. The Funds have invested in, or may wish to invest in, such entities represented by JPMorgan or with which JPMorgan has a banking or other financial relationship. In addition, certain clients of JPMorgan may invest in entities in which JPMorgan holds an interest, including a Fund. In providing services to its clients, JPMorgan from time to time recommends activities that compete with or otherwise adversely affect a Fund or the Fund’s investments. It should be recognized that such relationships may also preclude the Fund from engaging in certain transactions and may constrain the Fund’s investment flexibility. For example, Affiliates that are broker dealers cannot deal with the Funds as principal in the purchase and sale of securities unless an exemptive order allowing such transactions is obtained from the SEC. Certain of the Funds have received exemptive orders permitting the Funds to engage in principal transactions with Affiliates involving taxable and tax exempt money market instruments. However, for the purchase and sale of longer term fixed income securities, which are generally principal transactions, the Funds cannot use broker dealer Affiliates. Or, if an Affiliate is the sole underwriter of an initial or secondary offering, the Funds could not purchase in the offering. In both cases the number of securities and counterparties available to the Funds will be fewer than are available to mutual funds that are not affiliated with major broker dealers.
JPMorgan derives ancillary benefits from providing investment advisory, custody, administration, fund accounting and shareholder servicing and other services to the Funds, and providing such services to the Funds may enhance JPMorgan’s relationships with various parties, facilitate additional business development and enable JPMorgan to obtain additional business and generate additional revenue.
Participations Adverse to the Funds. JPMorgan’s participation in certain markets or its actions for certain clients may also restrict or affect a Fund’s ability to transact in those markets and JPMorgan may face conflicts with respect to the interests involved. For example, when a Fund and another JPMorgan client invest in different parts of an issuer’s capital structure, decisions over whether to trigger an event of default, over the terms of any workout, or how to exit an investment implicate conflicts of interest. See also “Acting for Multiple Clients.”
Preferential Treatment. JPMIM receives more compensation with respect to certain Funds or Other Accounts than it receives with respect to a Fund, or receives compensation based in part on the performance of certain accounts. This creates a conflict of interest for JPMIM and its portfolio managers by providing an incentive to favor those accounts. Actual or potential conflicts of interest also arise when a portfolio manager has management responsibilities to more than one account or Fund, such as devotion of unequal time and attention to the management of the Funds or accounts.
Allocation and Aggregation. Potential conflicts of interest also arise with both the aggregation of trade orders and allocation of securities transactions or investment opportunities. Allocations of aggregated trades, particularly trade orders that were only partially filled due to limited availability, and allocation of investment opportunities raise a potential conflict of interest because JPMorgan has an incentive to allocate trades or investment opportunities to certain accounts or Funds. For example, JPMorgan has an incentive to cause accounts it manages to participate in an offering where such participation could increase
Part II - 119
JPMorgan’s overall allocation of securities in that offering. When JPMorgan serves as adviser to the Funds, as well as certain Funds-of-Funds, it faces certain potential conflicts of interest when allocating the assets of the Funds-of-Funds among its underlying Funds. For example, JPMorgan has an incentive to allocate assets of the Fund-of-Funds to seed a new Fund or to allocate to an underlying Fund that is small, pays higher fees to JPMorgan or to which JPMorgan has provided seed capital.
Overall Position Limits. Potential conflicts of interest also exist when JPMorgan maintains certain overall investment limitations on positions in securities or other financial instruments due to, among other things, investment restrictions imposed upon JPMorgan by law, regulation, contract or internal policies. These limitations have precluded and, in the future could preclude, a Fund from purchasing particular securities or financial instruments, even if the securities or financial instruments would otherwise meet the Fund’s objectives. For example, there are limits on the aggregate amount of investments by affiliated investors in certain types of securities that may not be exceeded without additional regulatory or corporate consent. There also are limits on the writing of options by a Fund that could be triggered based on the number of options written by JPMIM on behalf of other investment advisory clients. If certain aggregate ownership thresholds are reached or certain transactions are undertaken, the ability of a Fund to purchase or dispose of investments, or exercise rights or undertake business transactions, will be restricted.
Soft Dollars. JPMIM pays certain broker-dealers with “soft” or commission dollars generated by client brokerage transactions in exchange for access to statistical information and other research services. JPMIM faces conflicts of interest because the statistical information and other research services may benefit certain other clients of JPMIM more than a Fund and can be used in connection with the management of accounts other than the accounts whose trades generated the commissions.
Additionally, when JPMIM uses client brokerage commissions to obtain statistical information and other research services, JPMIM receives a benefit because it does not have to produce or pay for the information or other research services itself. As a result, JPMIM may have an incentive to select a particular broker-dealer in order to obtain such information and other research services from that broker-dealer, rather than to obtain the lowest price for execution.
Redemptions. JPMorgan, as a seed investor, JPMorgan Funds of Funds and JPMorgan on behalf of its discretionary clients have significant ownership in certain Funds. JPMorgan faces conflicts of interest when considering the effect of redemptions on such Funds and on other shareholders in deciding whether and when to redeem its shares. A large redemption of shares by JPMorgan, by a JPMorgan Fund of Funds or by JPMorgan acting on behalf of its discretionary clients could result in the Fund selling securities when it otherwise would not have done so, accelerating the realization of capital gains and increasing transaction costs. A large redemption could significantly reduce the assets of a Fund, causing decreased liquidity and, depending on any applicable expense caps, a higher expense ratio.
Affiliated Transactions. The Funds are subject to conflicts of interest if they engage in principal or agency transactions with other Funds or with JPMorgan. To the extent permitted by law, the Funds can enter into transactions in which JPMorgan acts as principal on its own behalf (principal transactions), advises both sides of a transaction (cross transactions) and acts as broker for, and receives a commission from, the Funds (agency transactions). Principal and agency transactions create the opportunity for JPMorgan to engage in self-dealing. JPMorgan faces a conflict of interest when it engages in a principal or agency transaction on behalf of a Fund, because such transactions result in additional compensation to JPMorgan. JPMorgan faces a potentially conflicting division of loyalties and responsibilities to the parties in these transactions.
In addition, Affiliates of JPMIM have direct or indirect interests in electronic communication networks and alternative trading systems (collectively “ECNs”). JPMIM, in accordance with its fiduciary obligation to seek to obtain best execution, from time to time executes client trades through ECNs in which an Affiliate has, or may acquire, an interest. In such case, the Affiliate will be indirectly compensated based upon its ownership percentage in relation to the transaction fees charged by the ECNs.
JPMorgan also faces conflicts of interest if a Fund purchases securities during the existence of an underwriting syndicate for such securities, of which JPMorgan is a member because JPMorgan typically receives fees for certain services that it provides to the syndicate and, in certain cases, will be relieved directly or indirectly of certain financial obligations as a result of a Fund’s purchase of securities.
Affiliated Service Providers. JPMorgan faces conflicts of interest when the Funds use service providers affiliated with JPMorgan because JPMorgan receives greater overall fees when they are used. Affiliates provide investment advisory, custody, administration, fund accounting and shareholder servicing services to the Funds for which they are compensated by the Funds. Similarly, JPMIM faces a conflict of
Part II - 120
interest if it decides to use or negotiate the terms of a credit facility for a Fund if the facility is provided by an Affiliate. In addition, in selecting actively managed underlying funds for JPMorgan Funds of Funds, JPMIM limits its selection to Funds in the JPMorgan family of mutual funds. JPMIM does not consider or canvass the universe of unaffiliated investment companies available, even though there may be unaffiliated investment companies that may be more appropriate for the JPMorgan Fund of Funds or that have superior returns. With respect to a Fund’s uninvested cash and cash received from securities lending borrowers, the Fund’s adviser automatically invests the Fund in J.P. Morgan money market funds without considering or canvassing the universe of unaffiliated money market funds available even though there may (or may not) be one or more unaffiliated money market funds or alternative investments that investors might regard as more attractive for the Fund or that have superior returns. To the extent a Fund invests in a J.P. Morgan money market fund, the Fund’s investment performance is related to the performance of the J.P. Morgan money market fund and the Fund might lose money by investing in a J.P. Morgan money market fund. Because a Fund’s adviser or its affiliates provide services to and receive fees from J.P. Morgan money market funds, investments by the Fund in a J.P. Morgan money market fund benefit the Fund’s adviser and/or its affiliates and create a conflict of interest. These investments also will increase assets under management and support particular J.P. Morgan money market funds. The JPMorgan affiliates providing services to the Funds benefit from additional fees when a Fund is included as an underlying Fund in a JPMorgan Fund of Funds. Certain laws applicable to JPMorgan may also have an impact on the ability of JPMorgan to conduct business with the Funds, which may have a negative impact on the Funds. The Funds are treated as affiliates of JPMorgan Chase Bank, N.A. for purposes of Sections 23A and 23B of the U.S. Federal Reserve Act. Those sections require that banking subsidiaries of JPMorgan, such as JPMorgan Chase Bank, N.A. and its subsidiaries, comply with certain standards and restrictions in dealing with affiliates such as the Funds. For example, the Funds may be unable to enter into certain borrowing or servicing arrangements with JPMorgan Chase Bank, N.A.
Proxy Voting. Potential conflicts of interest can arise when JPMIM votes proxies for securities held by a Fund. A conflict is deemed to exist when the proxy is for JPMorgan Chase & Co. stock or for J.P. Morgan Funds, or when the proxy administrator has actual knowledge indicating that an Affiliate is an investment banker or rendered a fairness opinion with respect to the matter that is the subject of the proxy vote. When such conflicts are identified, the proxy ordinarily will be voted by an independent third party either in accordance with JPMIM’s proxy voting guidelines or by the third party using its own guidelines. Potential conflicts of interest can arise when JPMIM invests Fund assets in securities of companies that are also clients of JPMIM or that have material business relationships with JPMIM or an Affiliate and a vote against management could harm or otherwise affect JPMIM’s or the Affiliate’s business relationship with that company. See the Proxy Voting section in this SAI.
Lending. JPMorgan faces conflicts of interest with respect to interfund lending or the JPMorgan Chase Bank, N.A. credit facility, which could harm the lending or the borrowing Fund if JPMorgan favors one Fund’s or JPMorgan’s interests over those of another Fund. If a Fund engages in securities lending transactions, JPMIM faces a conflict of interest when a JPMIM affiliate operates as a service provider in the securities lending transaction or otherwise receives compensation as part of the securities lending activities.
Personal Trading. JPMorgan and any of its directors, officers, agents or employees, face conflicts of interest when transacting in securities for their own accounts because they could benefit by trading in the same securities as a Fund, which could have an adverse effect on a Fund.
Valuation. JPMIM acting in its capacity as the Funds’ administrator is the primary valuation agent of the Funds. JPMIM values securities and assets in the Funds according to the Funds’ valuation policies. From time to time JPMIM will value an asset differently than an Affiliate values the identical asset, including because the Affiliate has information regarding valuation techniques and models or other information that it does not share with JPMIM. This arises particularly in connection with securities or other assets for which market quotations are not readily available or for which market quotations do not represent the value at the time of pricing (e.g., startup companies) and which are fair valued. JPMIM will also face a conflict with respect to valuations as they affect the amount of JPMIM’s compensation as investment adviser and administrator.
Information Access. As a result of JPMorgan’s various other businesses, Affiliates, from time to time, come into possession of information about certain markets and investments which, if known to JPMIM, could cause JPMIM to seek to dispose of, retain or increase interests in investments held by a Fund or acquire certain positions on behalf of a Fund. However, JPMorgan’s internal information barriers restrict JPMIM’s ability to access such information even when it would be relevant to its management of the Funds. Such Affiliates can trade differently from the Funds potentially based on information not available
Part II - 121
to JPMIM. If JPMIM acquires or is deemed to acquire material non-public information regarding an issuer, JPMIM will be restricted from purchasing or selling securities of that issuer for its clients, including a Fund, until the information has been publicly disclosed or is no longer deemed material. (Such an issuer could include an underlying Fund in a Fund-of-Funds.)
Gifts and Entertainment. From time to time, employees of JPMIM receive gifts and/or entertainment from clients, intermediaries, or service providers to the Funds or JPMIM, which could have the appearance of affecting or may potentially affect the judgment of the employees, or the manner in which they conduct business.
For Funds with Sub-Advisers: Additional Potential Conflicts of Interest
The Advisers to certain Funds have engaged affiliated and/or unaffiliated sub-advisers. The Adviser compensates sub-advisers out of the advisory fees it receives from the Fund, which creates an incentive for the Adviser to select sub-advisers with lower fee rates or to select affiliated sub-advisers. In addition, the sub-advisers have interests and relationships that create actual or potential conflicts of interest related to their management of the assets of the Funds allocated to such sub-advisers. Such conflicts of interest may be similar to, different from or supplement those conflicts described herein relating to JPMorgan. Potential conflicts relate to the sub-advisers’ trading and investment practices, including, but not limited to, their selection of broker-dealers, aggregation of orders for multiple clients or netting of orders for the same client and the investment of client assets in companies in which they have an interest. Additional information about potential conflicts of interest regarding the sub-advisers is set forth in each sub-adviser’s Form ADV. A copy of Part 1 and Part 2 of each sub-adviser’s Form ADV is available on the SEC’s website (www.adviserinfo.sec.gov).
Fuller & Thaler. Responsibility for managing Fuller & Thaler’s investment strategies is generally organized according to investment styles (growth, value or a combination of growth and value) and market capitalization (micro-cap, small-cap, or large-cap). Generally, a portfolio manager is responsible for managing all the client portfolios with a certain investment style and market capitalization. Therefore, portfolio holdings, relative position sizes and industry and sector exposures tend to be similar across portfolios in the same strategy, which minimizes the potential for conflicts of interest.
Fuller & Thaler may receive more compensation with respect to certain accounts than that received with respect to the Funds. Such greater compensation may be attributable to the fact that some accounts may be larger than the Funds, some accounts may pay a higher management fee rate than the Funds, or some accounts may also pay a performance fee unlike the Funds. This may create a potential conflict of interest for Fuller & Thaler or its portfolio managers by providing an incentive to favor these other accounts when, for example, placing securities transactions. Fuller & Thaler may have an incentive to allocate securities that are expected to increase in value to favored accounts. To address this, Fuller & Thaler has established policies designed to achieve fair and equitable allocation of investment opportunities among its clients over time. As a matter of general policy, Fuller & Thaler aggregates orders for the same equity security placed at around the same time. When aggregated trades are executed, whether fully or partially executed, accounts participating in the trade will be allocated their pro rata share on an average price basis, subject to certain limited exceptions. In the event pro rata allocation may not be feasible or in the best interest of its clients, Fuller & Thaler may rotate trades or seek to otherwise allocate transactions in a fair and equitable manner over time.
Another potential conflict of interest may be perceived to arise if transactions in one account closely follow related transactions in a different account, such as when a purchase increases the cost of securities subsequently purchased by another account, or when a sale in one account lowers the sale price received in a sale by a second account. Further, if Fuller & Thaler manages accounts that engage in short sales of securities of the type in which the Funds invest, Fuller & Thaler could be seen as harming the performance of a Fund for the benefit of the accounts engaging in short sales if the short sales cause the market value of the securities to fall.
Fuller & Thaler believes it has adopted policies and procedures to address actual and potential conflicts of interest; however, there is no guarantee that such policies and procedures will detect each and every situation in which a conflict may arise.
For details of the dollar range of shares of each Fund (excluding the Money Market Funds) beneficially owned by the portfolio managers, see “PORTFOLIO MANAGERS — Ownership of Securities” in Part I of this SAI.
Part II - 122
PORTFOLIO MANAGER COMPENSATION
JPMorgan’s compensation programs are designed to align the behavior of employees with the achievement of its short- and long-term strategic goals, which revolve around client investment objectives. This is accomplished in part, through a balanced performance assessment process and total compensation program, as well as a clearly defined culture that rigorously and consistently promotes adherence to the highest ethical standards.
The Firm’s disciplined pay-for-performance framework focuses on Total Compensation – base salary and incentive pay - so that pay is commensurate with the overall performance of the Firm, respective businesses and individual performance. This includes a balanced discretionary approach to assess the employee’s performance throughout the year against four broad dimensions - business results, client/customer/stakeholder, teamwork and leadership, and risk, controls and conduct. These performance dimensions appropriately consider short, medium and long-term priorities that drive sustained shareholder value, while accounting for risk, controls, and conduct objectives. To promote a proper pay-for-performance alignment, the Firm does not assign relative weightings to these dimensions and also considers other relevant factors, including market practices. When conducting this balanced assessment of performance, for select employees in the Portfolio Management population, regard is given to the performance of relevant funds/strategies. Each Portfolio Manager’s performance is evaluated annually based on a number of factors, including, but not limited to:
•
The primary consideration which is blended investment performance relative to the competitive indices or peers, with investment performance generally weighted more to the long term;
•
individual contribution relative to the client’s risk and return objectives; and
•
adherence with the Firm’s compliance, risk, regulatory and client fiduciary responsibilities, including adherence to the Sustainability Risk Integration Policy – J.P. Morgan Asset Management, as applicable, which contains relevant Environmental, Social and Corporate Governance (“ESG”) factors that are intended to guide investment decision-making.
An individual performance assessment using the criteria above, in addition to the overall performance of the relevant business unit and investment team, is integrated into the final assessment of incentive compensation for an individual Portfolio Manager as part of the assessment of Business Results.
Feedback from JPMorgan’s risk and control professions is considered in assessing performance.
JPMorgan maintains a balanced total compensation program comprised of a mix of fixed compensation (including a competitive base salary and, for certain employees, a fixed cash allowance), and variable compensation in the form of cash incentives, and long-term incentives in the form of equity based and/or fund-tracking incentives that vest over time. Long-term awards comprise up to 60% of overall incentive compensation, depending on an employee’s pay level.
Long-term awards are generally in the form of time-vested JPMC Restricted Stock Units (“RSU”). However, portfolio managers are subject to a mandatory deferral of long-term incentive compensation under JPMorgan’s Mandatory Investor Plan (“MIP”). The MIP provides for a rate of return equal to that of the Portfolio(s) that the portfolio managers manage, thereby aligning portfolio manager’s pay with that of their client’s experience/return. 100% if the portfolio manager’s long-term incentive compensation is eligible for MIP with 50% allocated to the specific Portfolio(s) they manage as determined by their respective manager. The remaining portion of the overall amount is electable and may be treated as if invested in any of the Portfolios available in the plan or can take the form of RSUs.
Fuller & Thaler. Fuller & Thaler is 100% beneficially owned by its investment professionals, named principals, and other key employees. As owners, Fuller & Thaler’s investment professionals are co-invested in the strategies they manage and are typically paid above industry averages. As owners, Fuller & Thaler’s investment professionals are ultimately compensated based on the long-term performance of its business, which is largely based on the long-term performance of its strategies. The value of these ownership stakes is typically the most significant long-term driver of compensation for investment professionals. Investment professionals and other key employees own a majority of Fuller & Thaler. As its named principals continue to gradually reduce their ownership stakes, Fuller & Thaler grants additional shares to investment professionals and other key employees. Year-to-year, pre-tax cash bonuses are based on a combination of criteria, including the firm’s profitability, an investment professional’s contributions to the firm’s and his/her strategy’s Year-To-Date, 1, 3, 5, 10, and tenure-long year performance relative to the strategy’s
Part II - 123
benchmark, and an investment professional’s contributions to improvements to the firm’s behavioral investment process, and can vary significantly both year-to-year and among investment professionals. Investment professionals may be granted ownership in Fuller & Thaler within a few years of joining the firm.
CODES OF ETHICS
The Trusts, the Advisers and JPMDS have each adopted codes of ethics pursuant to Rule 17j-1 under the 1940 Act (and pursuant to Rule 204A-1 under the Advisers Act with respect to the Advisers).
The Trusts’ code of ethics includes policies which require “access persons” (as defined in Rule 17j-1) to: (i) place the interest of Trust shareholders first; (ii) conduct personal securities transactions in a manner that avoids any actual or potential conflict of interest or any abuse of a position of trust and responsibility; and (iii) refrain from taking inappropriate advantage of his or her position with the Trusts or a Fund. The Trusts’ code of ethics prohibits any access person from: (i) employing any device, scheme or artifice to defraud the Trusts or a Fund; (ii) making to the Trusts or a Fund any untrue statement of a material fact or omit to state to the Trusts or a Fund a material fact necessary in order to make the statements made, in light of the circumstances under which they are made, not misleading; (iii) engaging in any act, practice, or course of business which operates or would operate as a fraud or deceit upon the Trusts or a Fund; or (iv) engaging in any manipulative practice with respect to the Trusts or a Fund. The Trusts’ code of ethics permits personnel subject to the code to invest in securities, including securities that may be purchased or held by a Fund so long as such investment transactions are not in contravention of the above noted policies and prohibitions.
The code of ethics adopted by the Advisers requires that all employees must: (i) place the interest of the accounts which are managed by the Adviser first; (ii) conduct all personal securities transactions in a manner that is consistent with the code of ethics and the individual employee’s position of trust and responsibility; and (iii) refrain from taking inappropriate advantage of their position. Employees of each Adviser are also prohibited from certain mutual fund trading activity including excessive trading of shares of a mutual fund as described in the applicable Fund’s Prospectuses or SAI and effecting or facilitating a mutual fund transaction to engage in market timing. The Advisers’ code of ethics permits personnel subject to the code to invest in securities, including securities that may be purchased or held by a Fund subject to certain restrictions. However, all employees are required to preclear securities trades (except for certain types of securities such as non-proprietary mutual fund shares and U.S. government securities). Each of the Adviser’s affiliated sub-advisers has also adopted the code of ethics described above.
JPMDS’s code of ethics requires that all employees of JPMDS must: (i) place the interest of the accounts which are managed by affiliates of JPMDS first; (ii) conduct all personal securities transactions in a manner that is consistent with the code of ethics and the individual employee’s position of trust and responsibility; and (iii) refrain from taking inappropriate advantage of their positions. Employees of JPMDS are also prohibited from certain mutual fund trading activity, including excessive trading of shares of a mutual fund as such term is defined in the applicable Fund’s Prospectuses or SAI, or effecting or facilitating a mutual fund transaction to engage in market timing. JPMDS’s code of ethics permits personnel subject to the code to invest in securities, including securities that may be purchased or held by the Funds subject to the policies and restrictions in such code of ethics.
PORTFOLIO TRANSACTIONS
Investment Decisions and Portfolio Transactions. Pursuant to the Advisory and sub-advisory Agreements, the Advisers determine, subject to the general supervision of the Board of Trustees of the Trusts and in accordance with each Fund’s investment objective and restrictions, which securities are to be purchased and sold by each such Fund and which brokers are to be eligible to execute its portfolio transactions. The Advisers operate independently in providing services to their respective clients. Investment decisions are the product of many factors in addition to basic suitability for the particular client involved. Thus, for example, a particular security may be bought or sold for certain clients even though it could have been bought or sold for other clients at the same time. Likewise, a particular security may be bought for one or more clients when one or more other clients are selling the security. In some instances, one client may sell a particular security to another client. It also happens that two or more clients may simultaneously buy or sell the same security, in which event each day’s transactions in such security are, insofar as possible, averaged as to price and allocated between such clients in a manner which in the opinion of the Adviser is equitable to each and in accordance with the amount being purchased or sold by each. There may be circumstances when purchases or sales of portfolio securities for one or more clients will have an adverse effect on other clients.
Part II - 124
Brokerage and Research Services. On behalf of the Funds, a Fund’s Adviser places orders for all purchases and sales of portfolio securities, enters into repurchase agreements, and may enter into reverse repurchase agreements and execute loans of portfolio securities on behalf of a Fund unless otherwise prohibited. See “Investment Strategies and Policies.”
Fixed income and debt securities and municipal bonds and notes are generally traded at a net price with dealers acting as principal for their own accounts without a stated commission. The price of the security usually includes profit to the dealers. In underwritten offerings, securities are purchased at a fixed price, which includes an amount of compensation to the underwriter, generally referred to as the underwriter’s concession or discount. Transactions on stock exchanges (other than foreign stock exchanges) involve the payment of negotiated brokerage commissions. Such commissions vary among different brokers. Also, a particular broker may charge different commissions according to such factors as the difficulty and size of the transaction. Transactions in foreign securities generally involve payment of fixed brokerage commissions, which are generally higher than those in the U.S. On occasion, certain securities may be purchased directly from an issuer, in which case no commissions or discounts are paid.
In connection with portfolio transactions, the overriding objective is to obtain the best execution of purchase and sales orders. In making this determination, the Adviser considers a number of factors including, but not limited to: the price per unit of the security, the broker’s execution capabilities, the commissions charged, the broker’s reliability for prompt, accurate confirmations and on-time delivery of securities, the broker-dealer firm’s financial condition, the broker’s ability to provide access to public offerings, as well as the quality of research services provided. As permitted by Section 28(e) of the Securities Exchange Act, the Adviser may cause the Funds to pay a broker-dealer which provides brokerage and research services to the Adviser, or the Funds and/or other accounts for which the Adviser exercises investment discretion an amount of commission for effecting a securities transaction for a Fund in excess of the amount other broker-dealers would have charged for the transaction if the Adviser determines in good faith that the greater commission is reasonable in relation to the value of the brokerage and research services provided by the executing broker-dealer viewed in terms of either a particular transaction or the Adviser’s overall responsibilities to accounts over which it exercises investment discretion. Not all such services are useful or of value in advising the Funds. The Adviser reports to the Board of Trustees regarding overall commissions paid by the Funds and their reasonableness in relation to the benefits to the Funds. In accordance with Section 28(e) of the Securities Exchange Act and consistent with applicable SEC guidance and interpretation, the term “brokerage and research services” includes (i) advice as to the value of securities; (ii) the advisability of investing in, purchasing or selling securities; (iii) the availability of securities or of purchasers or sellers of securities; (iv) furnishing analyses and reports concerning issues, industries, securities, economic factors and trends, portfolio strategy and the performance of accounts; and (v) effecting securities transactions and performing functions incidental thereto (such as clearance, settlement, and custody) or required by rule or regulation in connection with such transactions.
Brokerage and research services received from such broker-dealers will be in addition to, and not in lieu of, the services required to be performed by an Adviser under the Advisory Agreement (or with respect to a Sub-Adviser, under the sub-advisory agreement). The fees that the Funds pay to the Adviser are not reduced as a consequence of the Adviser’s receipt of brokerage and research services. To the extent the Funds’ portfolio transactions are used to obtain such services, the brokerage commissions paid by the Funds may exceed those that might otherwise be paid by an amount that cannot be presently determined. Such services generally would be useful and of value to the Adviser in serving one or more of its other clients and, conversely, such services obtained by the placement of brokerage business of other clients generally would be useful to the Adviser in carrying out its obligations to the Funds. While such services are not expected to reduce the expenses of the Adviser, the Adviser would, through use of the services, avoid the additional expenses that would be incurred if it should attempt to develop comparable information through its own staff.
Subject to the overriding objective of obtaining the best execution of orders, the Adviser may allocate a portion of a Fund’s brokerage transactions to affiliates of the Adviser. Under the 1940 Act, persons affiliated with a Fund and persons who are affiliated with such persons are prohibited from dealing with the Fund as principal in the purchase and sale of securities unless an exemptive order allowing such transactions is obtained from the SEC. The SEC has granted exemptive orders permitting each Fund to engage in principal transactions with J.P. Morgan Securities LLC, an affiliated broker, involving taxable and tax exempt money market instruments (including commercial paper, banker acceptances and medium term notes) and repurchase agreements. The orders are subject to certain conditions. An affiliated person of a Fund may serve as its broker in listed or over-the-counter transactions conducted on an agency basis
Part II - 125
provided that, among other things, the fee or commission received by such affiliated broker is reasonable and fair compared to the fee or commission received by non-affiliated brokers in connection with comparable transactions.
In addition, a Fund may not purchase securities during the existence of any underwriting syndicate for such securities of which JPMorgan Chase Bank or an affiliate is a member or in a private placement in which JPMorgan Chase Bank or an affiliate serves as placement agent, except pursuant to procedures adopted by the Board of Trustees that either comply with rules adopted by the SEC or with interpretations of the SEC’s staff. Each Fund expects to purchase securities from underwriting syndicates of which certain affiliates of JPMorgan Chase act as a member or manager. Such purchases will be effected in accordance with the conditions set forth in Rule 10f-3 under the 1940 Act and related procedures adopted by the Trustees, including a majority of the Trustees who are not “interested persons” of a Fund. Among the conditions are that the issuer of any purchased securities will have been in operation for at least three years, that not more than 25% of the underwriting will be purchased by a Fund and all other accounts over which the same investment adviser has discretion, and that no shares will be purchased from JPMDS or any of its affiliates.
On those occasions when the Adviser deems the purchase or sale of a security to be in the best interests of a Fund as well as other customers, including other Funds, the Adviser, to the extent permitted by applicable laws and regulations, may, but is not obligated to, aggregate the securities to be sold or purchased for a Fund with those to be sold or purchased for other customers in order to obtain best execution, including lower brokerage commissions if appropriate. In such event, allocation of the securities so purchased or sold as well as any expenses incurred in the transaction will be made by the Adviser in the manner it considers to be most equitable and consistent with its fiduciary obligations to its customers, including the Funds. In some instances, the allocation procedure might not permit a Fund to participate in the benefits of the aggregated trade.
If a Fund that writes options effects a closing purchase transaction with respect to an option written by it, normally such transaction will be executed by the same broker-dealer who executed the sale of the option. The writing of options by a Fund will be subject to limitations established by each of the exchanges governing the maximum number of options in each class which may be written by a single investor or group of investors acting in concert, regardless of whether the options are written on the same or different exchanges or are held or written in one or more accounts or through one or more brokers. The number of options that a Fund may write may be affected by options written by the Adviser for other investment advisory clients. An exchange may order the liquidation of positions found to be in excess of these limits, and it may impose certain other sanctions.
Allocation of transactions, including their frequency, to various broker-dealers is determined by a Fund’s Adviser based on its best judgment and in a manner deemed fair and reasonable to Shareholders and consistent with the Adviser’s obligation to obtain the best execution of purchase and sales orders. In making this determination, the Adviser considers the same factors for the best execution of purchase and sales orders listed above. Accordingly, in selecting broker-dealers to execute a particular transaction, and in evaluating the best overall terms available, a Fund’s Adviser is authorized to consider the brokerage and research services (as those terms are defined in Section 28(e) of the Securities Exchange Act) provided to the Funds and/or other accounts over which a Fund’s Adviser exercises investment discretion. A Fund’s Adviser may cause a Fund to pay a broker-dealer that furnishes brokerage and research services a higher commission than that which might be charged by another broker-dealer for effecting the same transaction, provided that a Fund’s Adviser determines in good faith that such commission is reasonable in relation to the value of the brokerage and research services provided by such broker-dealer, viewed in terms of either the particular transaction or the overall responsibilities of a Fund’s Adviser to the Funds. To the extent such services are permissible under the safe harbor requirements of Section 28(e) of the Securities Exchange Act and consistent with applicable SEC guidance and interpretation, such brokerage and research services might consist of advice as to the value of securities, the advisability of investing in, purchasing, or selling securities, the availability of securities or purchasers or sellers of securities; analyses and reports concerning issuers, industries, securities, economic factors and trends, portfolio strategy, and the performance of accounts, market data, stock quotes, last sale prices, and trading volumes. Shareholders of the Funds should understand that the services provided by such brokers may be useful to a Fund’s Adviser in connection with its services to other clients and not all the services may be used by the Adviser in connection with the Fund.
Under the policy for JPMIM, “soft dollar” services refer to arrangements that fall within the safe harbor requirements of Section 28(e) of the Securities Exchange Act, as amended, which allow JPMIM to allocate client brokerage transactions to a broker-dealer in exchange for products or services that are
Part II - 126
research and brokerage-related and provide lawful and appropriate assistance in the performance of the investment decision-making process. These services include third party research, market data services, and proprietary broker-dealer research. The Funds receive proprietary research where broker-dealers typically incorporate the cost of such research into their commission structure. Many brokers do not assign a hard dollar value to the research they provide, but rather bundle the cost of such research into their commission structure. It is noted in this regard that some research that is available only under a bundled commission structure is particularly important to the investment process. However, the Funds, other than the U.S. Equity Funds (except the JPMorgan Equity Index Fund), JPMorgan Research Market Neutral Fund, JPMorgan Realty Income Fund, JPMorgan Research Equity Long/Short Fund, and JPMorgan Tax Aware Equity Fund, do not participate in soft dollar arrangements for market data services and third-party research.
The U.S. Equity Funds (except the JPMorgan Equity Index Fund), JPMorgan Research Market Neutral Fund, JPMorgan Realty Income Fund, and JPMorgan Tax Aware Equity Fund participate in soft dollar arrangements whereby a broker-dealer provides market data services and third-party research in addition to proprietary research. In order to obtain such research, the Adviser may utilize a Client Commission Arrangement (“CCA”). CCAs are agreements between an investment adviser and executing broker whereby the investment adviser and the broker agree to allocate a portion of commissions to a pool of credits maintained by the broker that are used to pay for eligible brokerage and research services. The Adviser will only enter into and utilize CCAs to the extent permitted by Section 28(e) of the Securities Exchange Act. As required by interpretive guidance issued by the SEC, any CCAs entered into by the Adviser with respect to commissions generated by the U.S. Equity Funds will provide that: (1) the broker-dealer pay the research preparer directly; and (2) the broker-dealer take steps to assure itself that the client commissions that the Adviser directs it to use to pay for such services are only for eligible research under Section 28(e).
Investment decisions for each Fund are made independently from those for the other Funds or any other investment company or account managed by an Adviser. Any such other investment company or account may also invest in the same securities as the Trusts. When a purchase or sale of the same security is made at substantially the same time on behalf of a given Fund and another Fund, investment company or account, the transaction will be averaged as to price, and available investments allocated as to amount, in a manner which the Adviser of the given Fund believes to be equitable to the Fund(s) and such other investment company or account. In some instances, this procedure may adversely affect the price paid or received by a Fund or the size of the position obtained by a Fund. To the extent permitted by law, the Adviser may aggregate the securities to be sold or purchased by it for a Fund with those to be sold or purchased by it for other Funds or for other investment companies or accounts in order to obtain best execution. In making investment recommendations for the Trusts, the Adviser will not inquire or take into consideration whether an issuer of securities proposed for purchase or sale by the Trusts is a customer of the Adviser or their parents or subsidiaries or affiliates and in dealing with its commercial customers, the Adviser and their respective parent, subsidiaries, and affiliates will not inquire or take into consideration whether securities of such customers are held by the Trusts.
Effective January 2018, pursuant to the second Markets in Financial Instruments Directive (“MiFID II”), investment managers in the European Union (“EU”), including a segment of the operations of the Adviser, are required to either pay for research out of their own resources or agree with clients to have research costs paid by clients through research payment accounts that are funded out of trading commissions or by a specific client research charge, provided that the payments for research are unbundled from the payments for execution. Where such a restriction applies, the Adviser will pay for any research out of its own resources and not through soft dollars or CCAs. Additionally, MiFID II may have practical ramifications outside the EU. For example, U.S. asset managers acting under the delegated authority of an EU-based asset manager and U.S. asset managers that are part of a global asset management group with one or more EU affiliates may, in practice, have to restructure the way they procure, value and pay for research under U.S. laws and regulations to more closely align with the requirements under MiFID II. It is difficult to predict the full impact of MiFID II on the Funds, the Adviser and any sub-advisers. Following its withdrawal from the EU on January 31, 2020, the United Kingdom has entered a transition period, during which EU law (including MiFID II) will continue to apply in the United Kingdom. Following the transition period, investment managers in the United Kingdom may still be required to comply with certain MiFID II equivalent requirements in accordance with the handbook of rules and guidance issued by the Financial Conduct Authority.
Sub-Advisers
Part II - 127
Sub-Adviser may place orders for the purchase and sale of securities that are held in the Fund. In executing portfolio transactions and selecting brokers or dealers, it is the policy and principal objective of each Sub-Adviser to seek best execution. Each Sub-Adviser is required to consider all factors that it deems relevant when assessing best execution for the Fund, including, for example, the breadth of the market in the security, the price of the security, the financial condition and execution capability of the broker or dealer and the reasonableness of the commission, if any (for the specific transaction and on a continuing basis).
In addition, when selecting brokers to execute transactions and in evaluating the best execution, each Sub-Adviser is authorized to consider the brokerage and research services (as defined in Section 28(e) of the Securities Exchange Act of 1934, as amended), provided by the broker. Each Sub-Adviser is also authorized to cause the Fund to pay a commission to a broker who provides such brokerage and research services for executing a portfolio transaction which is in excess of the amount of commission another broker would have charged for effecting that transaction. Each Sub-Adviser must determine in good faith, however, that such commission was reasonable in relation to the value of the brokerage and research services provided viewed in terms of that particular transaction or in terms of all the accounts over which each Sub-Adviser exercises investment discretion. Brokerage and research services received from such brokers will be in addition to, and not in lieu of, the services required to be performed by each Sub-Adviser. The Fund may purchase and sell portfolio securities through brokers who provide a Sub-Adviser with brokerage and research services.
The fees of each Sub-Adviser are not reduced by reason of its receipt of such brokerage and research services. Generally, a Sub-Adviser does not provide any services to the Fund except portfolio investment management and related record-keeping services. The Adviser may request that a Sub-Adviser employ certain specific brokers who have agreed to pay certain Fund expenses. The use of such brokers is subject to best execution, and there is no specific amount of brokerage that is required to be placed through such brokers.
It is possible that certain of the services received by a Sub-Adviser attributable to a particular transaction will primarily benefit one or more other accounts for which investment discretion is exercised by the Sub-Adviser.
For details of brokerage commissions paid by the Funds, see “BROKERAGE AND RESEARCH SERVICES — Brokerage Commissions” in Part I of this SAI.
For details of the Funds’ ownership of securities of the Funds’ regular broker dealers, see “BROKERAGE AND RESEARCH SERVICES — Securities of Regular Broker-Dealers” in Part I of this SAI.
OVERVIEW OF SERVICE PROVIDER AGREEMENTS
The following sections provide an overview of the J.P. Morgan Funds’ agreements with various service providers including the Administrator, Distributor, Custodian, Transfer Agent, and Shareholder Servicing Agent. As indicated below, some of the service agreements for the JPMorgan SmartRetirement Blend Funds and other J.P. Morgan Funds are different than the services agreements for the other JPMorgan SmartRetirement Funds. For purposes of distinguishing between the agreements and expenses, the JPMorgan SmartRetirement Funds other than the JPMorgan SmartRetirement Blend Funds are referred to in the following as the “JPMorgan SR Funds.”
ADMINISTRATOR
JPMIM (the “Administrator”) serves as the administrator to the Funds, pursuant to an Administration Agreement dated February 19, 2005, as amended from time to time (the “Administration Agreement”), between the Trusts, on behalf of the Funds, and JPMIM, JPMDS and JPMorgan Chase Bank and an indirect, wholly-owned subsidiary of JPMorgan Chase.
Pursuant to the Administration Agreement, JPMIM performs or supervises all operations of each Fund for which it serves (other than those performed under the advisory agreement, any sub-advisory agreements, the custodian and fund accounting agreement, and the transfer agency agreement for that Fund). Under the Administration Agreement, JPMIM has agreed to maintain the necessary office space for the Funds, and to furnish certain other services required by the Funds with respect to each Fund. The Administrator prepares annual and semi-annual reports to the SEC, prepares federal and state tax returns and generally assists in all aspects of the Funds’ operations other than those performed under the advisory agreement, any sub-advisory agreements, the custodian and fund accounting agreement, and the transfer
Part II - 128
agency agreement. JPMIM may, at its expense, subcontract with any entity or person concerning the provision of services under the Administration Agreement. JPMorgan Chase Bank serves as the Funds’ sub-administrator (the “Sub-administrator”). The Administrator pays JPMorgan Chase Bank a fee for its services as the Funds’ Sub-administrator. Effective January 1, 2019, the Administrator does not receive a separate fee for services to the J.P. Morgan Investor Funds but does receive fees for its services to the underlying funds.
If not terminated, the Administration Agreement continues in effect for annual periods beyond October 31 of each year, provided that such continuance is specifically approved at least annually by the vote of a majority of those members of the Board of Trustees who are not parties to the Administration Agreement or interested persons of any such party. The Administration Agreement may be terminated without penalty, on not less than 60 days’ prior written notice, by the Board of Trustees of each Trust or by JPMIM. The termination of the Administration Agreement with respect to one Fund will not result in the termination of the Administration Agreement with respect to any other Fund.
The Administration Agreement provides that JPMIM shall not be liable for any error of judgment or mistake of law or any loss suffered by the Funds in connection with the matters to which the Administration Agreement relates, except a loss resulting from willful misfeasance, bad faith or negligence in the performance of its duties, or from the reckless disregard by it of its obligations and duties thereunder.
In consideration of the services to be provided by JPMIM pursuant to the Administration Agreement, prior to January 1, 2019, JPMIM received from each Fund a pro rata portion of a fee computed daily and paid monthly at an annual rate equal to 0.15% of the first $25 billion of average daily net assets of all funds in the J.P. Morgan Funds Complex (excluding certain funds of funds and the series of J.P. Morgan Funds Complex that operate as money market funds (each a “Money Market Fund”)) and 0.075% of average daily net assets of all funds in the J.P. Morgan Funds Complex (excluding certain funds of funds and the Money Market Funds) over $25 billion of such assets. For purposes of this paragraph, the “J.P. Morgan Funds Complex” includes most of the open-end investment companies in the J.P. Morgan Funds Complex, including the series of the former One Group Mutual Funds. Effective January 1, 2019, JPMIM receives the following annual fee from each Fund for administration services: 0.075% of the first $10 billion of average daily net assets of the Fund, plus 0.050% of average daily net assets of the Fund between $10 billion and $20 billion, plus 0.025% of average daily net assets of the Fund between $20 billion and $25 billion, plus 0.010% of average daily net assets of the Fund over $25 billion.
With respect to the Money Market Funds, in consideration of the services provided by JPMIM pursuant to the Administration Agreement, prior to January 1, 2019, JPMIM receives from each Fund a pro-rata portion of a fee computed daily and paid monthly at an annual rate of 0.10% on the first $100 billion of the average daily net assets of all the money market funds in the J.P. Morgan Funds Complex and 0.05% of the average daily net assets of the money market funds in the J.P. Morgan Funds Complex over $100 billion. Effective January 1, 2019, JPMIM receives a pro-rata portion of the following annual fee on behalf of each Money Market Fund for administration services: 0.070% of the first $150 billion of average daily net assets of all money market funds in the J.P. Morgan Funds Complex, plus 0.050% of average daily net assets of such Money Market Funds between $150 billion and $300 billion, plus 0.030% of average daily net assets of such Money Market Funds between $300 billion and $400 billion, plus 0.010% of average daily net assets of such Money Market Funds over $400 billion. For purposes of this paragraph, the “J.P. Morgan Funds Complex” includes most of the open-end investment companies in the J.P. Morgan Funds Complex including the series of the former One Group Mutual Funds.
With respect to the Investor Funds, in consideration of the services provided by JPMIM pursuant to the Administration Agreement, prior to January 1, 2019, JPMIM received from each Fund a pro rata portion of a fee computed daily and paid monthly at an annual rate of 0.10% of the first $500 million of average daily net assets of all the Investor Funds in the J.P. Morgan Funds Complex, 0.075% of average daily net assets of such Investor Funds between $500 million and $1 billion, plus 0.05% of average daily net assets of such Investor Funds over of $1 billion. Effective January 1, 2019, JPMIM does not receive a separate fee for administration services to the Investor Funds, but does receive fees for its services to the underlying funds.
JPMIM does not receive a separate fee for administration services to the JPMorgan SmartRetirement Funds, but does receive fees for its services to the underlying funds.
For details of the administration and administrative services fees paid or accrued, see “ADMINISTRATOR — Administration Fees” in Part I of this SAI.
Part II - 129
DISTRIBUTOR
JPMDS serves as the distributor for all the Trusts and holds itself available to receive purchase orders for shares of each of the Funds. In that capacity, JPMDS has been granted the right, as agent of each Trust, to solicit and accept orders for the purchase of shares of each of the Funds in accordance with the terms of the Distribution Agreement between each Trust and JPMDS. JPMDS began serving as JPMT II’s distributor pursuant to a Distribution Agreement dated as of April 1, 2002. JPMDS is an affiliate of the Advisers, the Administrator and JPMorgan Chase Bank and is an indirect, wholly-owned subsidiary of JPMorgan Chase. The principal offices of JPMDS are located at 1111 Polaris Parkway, Columbus, OH 43240.
Unless otherwise terminated, the Distribution Agreement with JPMDS will continue in effect for successive one-year terms if approved at least annually by: (a) the vote of the Board of Trustees, including the vote of a majority of those members of the Board of Trustees who are not parties to the Distribution Agreement or interested persons of any such party, cast in person at a meeting for the purpose of voting on such approval, or (b) the vote of a majority of the outstanding voting securities of the Fund. The Distribution Agreement may be terminated without penalty on not less than 60 days’ prior written notice by the Board of Trustees, by vote of majority of the outstanding voting securities of the Fund or by JPMDS. The termination of the Distribution Agreement with respect to one Fund will not result in the termination of the Distribution Agreement with respect to any other Fund. The Distribution Agreement may also be terminated in the event of its assignment, as defined in the 1940 Act. JPMDS is a broker-dealer registered with the SEC and is a member of the Financial Industry Regulatory Authority (“FINRA”).
For details of the compensation paid to the principal underwriter, JPMDS, see “DISTRIBUTOR —Compensation paid to JPMDS” in Part I of this SAI.
DISTRIBUTION PLAN
Certain Funds have adopted a plan of distribution pursuant to Rule 12b-1 under the 1940 Act (the “Distribution Plan”) on behalf of the Class A Shares, Class C Shares, Class R2 Shares, Class R3 Shares, Cash Management Shares, Morgan Shares, Reserve Shares, Service Shares and E*TRADE Class Shares of the applicable Funds, which provides that each of such classes shall pay for distribution services a distribution fee (the “Distribution Fee”) to JPMDS, at annual rates not to exceed the amounts set forth in each applicable Fund’s prospectuses. The Class L Shares (formerly Institutional Class Shares for certain Funds), Class I Shares (formerly Select Class Shares), Institutional Class Shares, Class R4 Shares, Class R5 Shares, Investor Shares, Class R6 Shares, IM Shares, Premier Shares, Capital Shares and Agency Shares of the Funds have no Distribution Plan. Effective June 19, 2015, Class B Shares were converted into Class A Shares (Morgan Shares for the Money Market Funds).
The Distribution Fees are paid by the Funds to JPMDS as compensation for its services and expenses in connection with the sale and distribution of Fund shares. JPMDS in turn pays all or part of these Distribution Fees to Financial Intermediaries that have agreements with JPMDS to sell shares of the Funds. In addition, JPMDS may use the Distribution Fees payable under the Distribution Plan to finance any other activity that is primarily intended to result in the sale of Shares, including, but not limited to, (i) the development, formulation and implementation of marketing and promotional activities, including direct mail promotions and television, radio, magazine, newspaper, electronic and media advertising; (ii) the preparation, printing and distribution of prospectuses, statements of additional information and reports and any supplements thereto (other than prospectuses, statements of additional information and reports and any supplements thereto used for regulatory purposes or distributed to existing shareholders of each Fund); (iii) the preparation, printing and distribution of sales and promotional materials and sales literature which is provided to various entities and individuals, including brokers, dealers, financial institutions, financial intermediaries, shareholders, and prospective investors in each Fund; (iv) expenditures for sales or distribution support services, including meetings with and assistance to brokers, dealers, financial institutions, and financial intermediaries and in-house telemarketing support services and expenses; (v) preparation of information, analyses, surveys, and opinions with respect to marketing and promotional activities, including those based on meetings with and feedback from JPMDS’s sales force and others including potential investors, shareholders and financial intermediaries; (vi) commissions, incentive compensation, finders’ fees, or other compensation paid to, and expenses of employees of JPMDS, brokers, dealers, and other financial institutions and financial intermediaries that are attributable to any distribution and/or sales support activities, including interest expenses and other costs associated with financing of such commissions, incentive compensation, other compensation, fees, and expenses; (vii) travel, promotional materials, equipment, printing, delivery and mailing costs, overhead and other office
Part II - 130
expenses of JPMDS and its sales force attributable to any distribution and/or sales support activities, including meetings with brokers, dealers, financial institutions and financial intermediaries in order to provide them with information regarding the Funds and their investment process and management; (viii) the costs of administering the Distribution Plan; (ix) expenses of organizing and conducting sales seminars; and (x) any other costs and expenses relating to any distribution and/or sales support activities. Activities intended to promote one class of shares of a Fund may also benefit the Fund’s other shares and other Funds. Anticipated benefits to the Funds that may result from the adoption of the Distribution Plan are economic advantages achieved through economies of scale and enhanced viability if the Funds accumulate a critical mass.
Class A, Class C and Class R2 Shares. Class A Shares of the Funds pay a Distribution Fee of 0.25% of average daily net assets. Class R2 Shares of the Funds pay a Distribution Fee of 0.50% of average daily net assets. Class C Shares of the Funds pay a Distribution Fee of 0.75% of average daily nets assets. Where a broker-dealer pays a Finder’s Fee (as described in a Fund’s prospectus) on the sale of Class A Shares of a Fund, JPMDS currently expects to pay sales commissions to the broker-dealer at the time of the sale even though the sale is not subject to a front-end sales charge. JPMDS currently also expects to pay sales commissions to a dealer at the time of sale of Class C Shares of the Funds of up to 1.00% of the purchase price of the shares sold by such dealer. JPMDS will use its own funds (which may be borrowed or otherwise financed) to pay such commissions and generally recoups such amounts through collection of the Distribution and Shareholder Servicing Fee and any contingent deferred sales charge (“CDSC”). Distribution Fees paid to JPMDS under the Distribution Plan may be paid by JPMDS to broker-dealers as distribution fees in an amount not to exceed 0.25% annualized of the average daily net asset value of the Class A Shares or 0.75% annualized of the average daily net asset value of the Class C Shares or 0.50% annualized of the average daily net asset value of the Class R2 Shares maintained in a Fund by such broker-dealers’ customers. Such payments on Class A (except where a Finder’s Fee is paid) and Class R2 Shares will be paid to broker- dealers promptly after the shares are purchased. Such payments on Class C Shares and Class A Shares (where a Finder’s Fee is paid) will be paid to broker-dealers beginning in the 13th month following the purchase of such shares, except certain broker/dealers who have sold Class C Shares to certain defined contribution plans and who have waived the 1.00% sales commission shall be paid distribution and shareholder servicing fees promptly after the shares are purchased. If the broker-dealer is not paid the Distribution Fee until the 13th month following a transaction, JPMDS retains the fee.
Since the Distribution Fee is not directly tied to expenses, the amount of Distribution Fees paid by a class of a Fund during any year may be more or less than actual expenses incurred pursuant to the Distribution Plan. For this reason, this type of distribution fee arrangement is characterized by the staff of the SEC as being of the “compensation” variety (in contrast to “reimbursement” arrangements by which a distributor’s payments are directly linked to its expenses). With respect to Class C Shares of the Funds, because of the 0.75% annual limitation on the compensation paid to JPMDS during a fiscal year, compensation relating to a large portion of the commissions attributable to sales of Class C Shares in any one year will be accrued and paid by a Fund to JPMDS in fiscal years subsequent. However, the shares are not liable for any distribution expenses incurred in excess of the Distribution Fee paid.
Money Market Funds. Distribution Fees paid to JPMDS under the Distribution Plans adopted by the Money Market Funds may be paid by JPMDS to broker-dealers as distributions fees in an amount not to exceed 0.75% annualized of the average daily net asset value of the Class C Shares, 0.50% annualized of the average daily net asset value of the Cash Management Shares, 0.25% annualized of the average daily net asset value of the Reserve Shares, 0.10% annualized of the average daily net asset value of the Morgan Shares (except for Morgan Shares of the Prime Money Market Fund), 0.60% annualized of the average daily net asset value of the E*TRADE and Service Shares, maintained in a Fund by such broker-dealers’ customers. For Class C Shares, distribution fees will be paid to broker-dealers beginning in the 13th month following the purchase of such shares. Since the distribution fees are not directly tied to expenses, the amount of Distribution Fees paid by a class of a Fund during any year may be more or less than actual expenses incurred pursuant to the Distribution Plan. For this reason, this type of distribution fee arrangement is characterized by the staff of the SEC as being of the “compensation variety” (in contrast to “reimbursement” arrangements by which a distributor’s payments are directly linked to its expenses). No class of shares of a Fund will make payments or be liable for any distribution expenses incurred by other classes of shares of any Fund.
JPMDS, JPMIM or their affiliates may from time to time, at its or their own expense, out of compensation retained by them from the Funds or from other sources available to them, make additional payments to certain Financial Intermediaries for their marketing support services. Such compensation does
Part II - 131
not represent an additional expense to the Funds or to their shareholders, since it will be paid by JPMDS, JPMIM or their affiliates. See “ADDITIONAL COMPENSATION TO FINANCIAL INTERMEDIARIES” below.
The Distribution Plan provides that it will continue in effect indefinitely if such continuance is specifically approved at least annually by a vote of both a majority of the Trustees and a majority of the Trustees who are not “interested persons” (as defined in the 1940 Act) of the Trusts and who have no direct or indirect financial interest in the operation of the Distribution Plan or in any agreement related to such plan (“Qualified Trustees”). The Distribution Plan may be terminated, with respect to any class of a Fund, at any time by a vote of a majority of the Qualified Trustees or by vote of a majority of the outstanding voting shares of the class of such Fund to which it applies (as defined in the 1940 Act and the rules thereunder). The Distribution Plan may not be amended to increase materially the amount of permitted expenses thereunder without the approval of the affected shareholders and may not be materially amended in any case without a vote of the majority of both the Trustees and the Qualified Trustees. Each of the Funds will preserve copies of any plan, agreement or report made pursuant to Rule 12b-1 for a period of not less than six years from the date of such plan, agreement or report, and for the first two years such copies will be preserved in an easily accessible place. The Board of Trustees will review at least on a quarterly basis written reports of the amounts expended under the Distribution Plan indicating the purposes for which such expenditures were made. The selection and nomination of Qualified Trustees shall be committed to the discretion of the disinterested Trustees (as defined in the 1940 Act) then in office.
For details of the Distribution Fees that the Funds paid to or that were accrued by JPMDS, see “DISTRIBUTOR — Distribution Fees” in Part I of this SAI.
CUSTODIAN
Pursuant to the Amended and Restated Global Custody and Fund Accounting Agreement with JPMorgan Chase Bank, 383 Madison Avenue, New York, NY 10179 (the “JPMorgan Custody Agreement”), JPMorgan Chase Bank serves as the custodian and fund accounting agent for each of the Funds. Pursuant to the JPMorgan Custody Agreement, JPMorgan Chase Bank is responsible for holding portfolio securities and cash and maintaining the books of account and records of portfolio transactions. JPMorgan Chase Bank is an affiliate of the Advisers, the Administrator and JPMDS.
CUSTODY AND FUND ACCOUNTING FEES AND EXPENSES
Fees Prior to December 1, 2019
For custodian services, each Fund pays to JPMorgan Chase Bank annual safekeeping fees of between 0.0006% and 0.35% of assets held by JPMorgan Chase Bank (depending on the domicile in which the asset is held), calculated monthly in arrears and fees between $2.50 and $80 for securities trades (depending on the domicile in which the trade is settled), as well as transaction fees on certain activities of $2.50 to $20 per transaction. JPMorgan Chase Bank is also reimbursed for its reasonable out-of-pocket or incidental expenses, including, but not limited to, registration and transfer fees and related legal fees.
JPMorgan Chase Bank may also be paid $15, $35 or $60 per proxy (depending on the country where the issuer is located) for its service which helps facilitate the voting of proxies throughout the world. For securities in the U.S. market, this fee is waived if the Adviser votes the proxies directly.
With respect to fund accounting services, the following schedule shall be employed in the calculation of the fees payable for the services provided under the JPMorgan Custody Agreement. For purposes of determining the asset levels at which a tier applies, assets for that fund type across J.P. Morgan Funds shall be used.
| Money Market Funds: |
|
|
| Tier One |
First $250 billion |
0.0013% |
| Tier Two |
Over $250 billion |
0.0010% |
| Complex Assets1 Funds: |
|
|
| Tier One |
First $75 billion |
0.00425% |
| Tier Two |
Next $25 billion |
0.0040% |
| Tier Three |
Over $100 billion |
0.0035% |
| Non-Complex Assets Funds: |
|
|
| Tier One |
First $75 billion |
0.0025% |
| Tier Two |
Next $25 billion |
0.0020% |
Part II - 132
| Tier Three |
Over $100 billion |
0.0015% |
| Other Fees: |
|
|
| Fund of Funds (for a Fund of Funds that invests in J.P. Morgan Funds only) |
|
$17,5002 |
| Additional Share Classes (this additional class expense applies after the fifth class) |
|
$2,000 |
| Daily Market-based Net Asset Value Calculation for Money Market Funds |
|
$15,000 per Fund |
| Hourly Net Asset Value Calculation for Money Market Funds |
|
$5,000 per Fund |
| Floating NAV Support for Money Market Funds |
|
$100,000 per Fund |
1
“Complex Assets Funds” are Funds whose strategy “routinely” employs one or more of the following instrument types: Bank Loans, Exchange Traded Derivatives or CFD/Portfolio Swaps. The Funds’ classification as either “Complex” or “Non-Complex” will be reviewed on at least an annual basis. Fund of Funds are excluded by both “Complex Assets Funds” and “Non-Complex Assets Funds.”
2
Fund of Funds are not subject to the asset based fees described above.
Transaction fees with respect to servicing exchange traded derivatives and bank loans are included in the asset tiers noted above, as are bank loan servicing fees.
| Annual Minimums: (except for certain Funds of Funds which are subject to the fee described above) |
|
| Money Market Funds |
$15,000 per Fund |
| All Other Funds |
$20,000 per Fund |
In addition, JPMorgan Chase Bank provides derivative servicing, including, with respect to swaps, swaptions and bond and currency options. The fees for these services include a transaction fee of $5 or $75 per new contract (depending on whether the transaction is electronic or manual), a fee of up to $5 or $75 per contract amendment (including transactions such as trade amendments, cancellations, terminations, novations, option exercises, option expiries, maturities or credit events) and a daily fee of $1.00 per contract for position management services. In addition a Fund will pay a fee of $2.00 to $12.25 per day for the valuation of the derivative positions covered by these services.
Pursuant to an arrangement with JPMorgan Chase Bank, custodian fees may be reduced by amounts calculated as a percentage of uninvested balances for certain Funds.
A Fund and/or its Cayman subsidiary, as applicable, may at times hold some of their assets in cash, which may subject the Fund and/or the Cayman subsidiary, as applicable, to additional risks and costs, such as increased credit exposure to the custodian bank and fees imposed for cash balances. Cash positions may also hurt the Fund’s and/or the Cayman subsidiary’s performance.
Fees Beginning December 1, 2019
For custodian services beginning December 1, 2019, each Fund will pay to JPMorgan Chase Bank annual safekeeping fees of between 0.0005% and 0.50% of assets held by JPMorgan Chase Bank (depending on the domicile in which the asset is held), calculated monthly in arrears and fees between $2.25 and $100 for securities trades (depending on the domicile in which the trade is settled), as well as additional transaction fees on certain activities of $2.25 to $50 per transaction. JPMorgan Chase Bank is also reimbursed for its reasonable out-of-pocket or incidental expenses, including, but not limited to, registration and transfer fees and related legal fees.
JPMorgan Chase Bank may also be paid for the following additional custody services:
•
$15 or $45 per proxy (depending on the country where the issuer is located) for its service which helps facilitate the voting of proxies throughout the world. For securities in the U.S. market, this fee is waived if the Adviser votes the proxies directly;
•
$2,000 per year for account maintenance for each custody collateral control account;
•
$2.25 or $15 for income or redemption processing (depending on whether the security is held book entry or physically); and
•
$2.50 to $53.50 for each cash payment or receipt transaction.
Part II - 133
With respect to fund accounting services, the following schedule shall be employed in the calculation of the fees payable for the services provided under the JPMorgan Custody Agreement. For purposes of determining the asset levels at which a tier applies, assets for that fund type across J.P. Morgan Funds (including any Cayman subsidiaries) shall be used.
| Money Market Funds1: |
|
|
| Tier One |
First $250 billion |
0.0013% |
| Tier Two |
Over $250 billion |
0.0010% |
| All Funds except Money Market Funds: |
|
|
| Tier One |
Up to $100 billion |
0.00375% |
| Tier Two |
$100 billion to $175 billion |
0.0030% |
| Tier Three |
Over $175 billion |
0.0020% |
| Other Fees: |
|
|
| Additional Share Classes (this additional class expense applies after the tenth class) |
|
$2,000 per Class |
| Daily Market-based Net Asset Value Calculation for Money Market Funds |
|
$15,000 per Fund |
| Hourly Net Asset Value Calculation for Money Market Funds |
|
$5,000 per Fund |
| Floating NAV Support for Money Market Funds |
|
$85,000 per Fund |
1
A cap on fund accounting fees for each Money Market Fund will be set at $1,400,000 per year. This cap may be reviewed annually for possible adjustment.
| Annual Minimums: |
|
| Money Market Funds |
$15,000 per Fund |
| All Other Funds |
$20,000 per Fund |
In addition, JPMorgan Chase Bank provides additional servicing for certain types of more complex assets. The fees for these services include a transaction fee of $50 for each manual trade and an annual fee of $500 for each bank loan position held by a Fund. In addition, JPMorgan Chase Bank will be paid fees of $0.50 to $4.50 per position per day for the valuation and processing of certain asset positions covered by these services.
If agreed-upon by the Funds and JPMorgan Chase Bank, custodian fees may, from time to time, be reduced by amounts calculated as a percentage of uninvested balances for certain Funds.
A Fund and/or its Cayman subsidiary, as applicable, may at times hold some of their assets in cash, which may subject the Fund and/or the Cayman subsidiary, as applicable, to additional risks and costs, such as increased credit exposure to the custodian bank and fees imposed for cash balances. Cash positions may also hurt the Fund’s and/or the Cayman subsidiary’s performance.
TRANSFER AGENT
DST Asset Manager Solutions, Inc. (formerly Boston Financial Data Services, Inc.) (“DST” or “Transfer Agent”), 2000 Crown Colony Drive, Quincy, MA 02169, serves as each Fund’s transfer and dividend disbursing agent. As transfer agent and dividend disbursing agent, DST is responsible for maintaining account records, detailing the ownership of Fund shares and for crediting income, capital gains and other changes in share ownership to shareholder accounts.
SECURITIES LENDING AGENT
To generate additional income, certain Funds may lend up to 33 1∕3% of their total assets pursuant to agreements (“Borrower Agreements”) requiring that the loan be continuously secured by cash. Citibank serves as securities lending agent pursuant to the Securities Lending Agency Agreement effective October 4, 2018. To the extent that the Funds have engaged in securities lending during the most recently completed fiscal year, information concerning the amounts of income and fees/compensation related to securities lending activities is included in Part I of the applicable Funds’ SAI in the Fund’s next annual update to its registration statement.
Under the Securities Lending Agency Agreement, Citibank acting as agent for the Funds, loans securities to approved borrowers pursuant to Borrower Agreements substantially in the form approved by the Board of Trustees in exchange for collateral. During the term of the loan, the Fund receives payments from borrowers equivalent to the dividends and interest that would have been earned on securities lent while simultaneously seeking to earn income on the investment of cash collateral in accordance with
Part II - 134
investment guidelines contained in the Securities Lending Agency Agreement. The Fund retains the interest on cash collateral investments but is required to pay the borrower a rebate for the use of cash collateral. The net income earned on the securities lending (after payment of rebates and the lending agent’s fee) is included in the Statement of Operations as income from securities lending (net in the Fund’s financial statements). Information on the investment of cash collateral is shown in the Schedule of Portfolio Investments (in the Fund’s financial statements).
Under the Securities Lending Agency Agreement, Citibank is entitled to a fee equal to 8% of (i) the investment income (net of rebates) on cash collateral delivered to Citibank on the Fund’s behalf in respect of any loans by the Borrowers; and (ii) fees paid by a Borrower with respect to a Loan for which non-cash collateral is provided (to the extent that the Funds subsequently authorize Citibank to accept non-cash collateral for securities loans).
A report of a Fund’s percentage on loan as of the prior calendar quarter may be obtained by calling the Financial Advisor Services Line at 1-800-343-1113. In addition, a report for the JPMorgan SmartRetirement Funds and JPMorgan SmartRetirement Blend Funds showing the percentage on loan for the Funds as of the prior calendar quarter may be obtained by calling the Financial Advisor Services Line at 1-800-343-1113. Information concerning percentage on loan is derived from information provided by Citibank as the securities lending agent, has not been audited and may differ from that reported in other publicly available information.
SHAREHOLDER SERVICING
The Trusts, on behalf of the Funds, have entered into a shareholder servicing agreement, effective February 19, 2005, with JPMDS (“Shareholder Servicing Agreement”). Under the Shareholder Servicing Agreement, JPMDS will provide, or cause its agents to provide, any combination of the (i) personal shareholder liaison services and shareholder account information services (“Shareholder Services”) described below and/or (ii) other related services (“Other Related Services”) as also described below. JPMDS is an affiliate of the Advisers, Administrator and JPMorgan Chase Bank.
“Shareholder Services” include (a) answering shareholder inquiries (through electronic and other means) regarding account status and history, the manner in which purchases and redemptions of Fund shares may be effected, and certain other matters pertaining to the Funds; (b) providing shareholders with information through electronic means; (c) assisting shareholders in completing application forms, designating and changing dividend options, account designations and addresses; (d) arranging for or assisting shareholders with respect to the wiring of the funds to and from shareholder accounts in connection with shareholder orders to purchase, redeem or exchange shares; (e) verifying shareholder requests for changes to account information; (f) handling correspondence from shareholders about their accounts; (g) assisting in establishing and maintaining shareholder accounts with the Trusts; and (h) providing other shareholder services as the Trusts or a shareholder may reasonably request, to the extent permitted by applicable law.
“Other Related Services” include (a) aggregating and processing purchase and redemption orders for shares; (b) providing shareholders with account statements showing their purchases, sales, and positions in the applicable Fund; (c) processing dividend payments for the applicable Fund; (d) providing sub-accounting services to the Trusts for shares held for the benefit of shareholders; (e) forwarding communications from the Trusts to shareholders, including proxy statements and proxy solicitation materials, shareholder reports, dividend and tax notices, and updated Prospectuses and SAIs; (f) receiving, tabulating and transmitting proxies executed by shareholders; (g) facilitating the transmission and receipt of funds in connection with shareholder orders to purchase, redeem or exchange shares; (h) developing and maintaining the Trusts’ website; (i) developing and maintaining facilities to enable transmission of share transactions by electronic and non-electronic means; (j) providing support and related services to Financial Intermediaries in order to facilitate their processing of orders and communications with shareholders; (k) providing transmission and other functionalities for shares included in investment, retirement, asset allocation, cash management or sweep programs or similar programs or services; and (l) developing and maintaining check writing functionality.
For details of fees paid by the Funds to JPMDS for Shareholder Services and Other Related Services under the Shareholder Servicing Agreement, see “SHAREHOLDER SERVICING — Shareholder Services Fees” in Part I of this SAI.
Part II - 135
To the extent it is not otherwise required by its contractual agreement to limit a Fund’s expenses as described in the Prospectuses for the Funds, JPMDS may voluntarily agree from time to time to waive a portion of the fees payable to it under the Shareholder Servicing Agreement with respect to each Fund on a month-to-month basis.
If not terminated, the Shareholder Servicing Agreement will continue for successive one year terms beyond October 31 of each year, provided that such continuance is specifically approved at least annually by the vote of a majority of those members of the Board of Trustees of the Trusts who are not parties to the Shareholder Servicing Agreement or interested persons (as defined in the 1940 Act) of any such party. The Shareholder Servicing Agreement may be terminated without penalty, on not less than 60 days’ prior written notice, by the Board of Trustees of the Trusts or by JPMDS. The Shareholder Servicing Agreement will also terminate automatically in the event of its assignment.
JPMDS may enter into service agreements with Financial Intermediaries under which it will pay all or a portion of such fees received from the Funds to such entities for performing Shareholder Services and/or Other Related Services, as described above, for shareholders. Such Financial Intermediaries may include affiliates of JPMDS.
JPMDS, JPMIM or their affiliates may from time to time, at its or their own expense, out of compensation retained by them from the Funds or from other sources available to them, make additional payments to certain Financial Intermediaries for performing “Other Related Services” for their customers. These services include the services listed in paragraph beginning “Other Related Services” above. Such compensation does not represent an additional expense to the Funds or to their shareholders, since it will be paid by JPMDS, JPMIM or their affiliates.
For shareholders that bank with JPMorgan Chase Bank, JPMorgan Chase Bank may aggregate investments in the Funds with balances held in JPMorgan Chase Bank accounts for purposes of determining eligibility for certain bank privileges that are based on specified minimum balance requirements, such as reduced or no fees for certain banking services or preferred rates on loans and deposits.
JPMDS, the Funds and their affiliates, agents and subagents may share certain information about shareholders and their accounts, as permitted by law and as described in the J.P. Morgan Funds Privacy Policy provided with your shareholder report, and also available on the J.P. Morgan Funds website at www.jpmorganfunds.com.
EXPENSES
The Funds pay the expenses incurred in their operations, including their pro-rata share of expenses of the Trusts. These expenses include: investment advisory and administrative fees; the compensation of the Trustees; registration fees; interest charges; taxes; expenses connected with the execution, recording and settlement of security transactions; fees and expenses of the Funds’ custodian for all services to the Funds, including safekeeping of funds and securities and maintaining required books and accounts; expenses of preparing and mailing reports to investors and to government offices and commissions; expenses of meetings of investors; fees and expenses of independent accountants, legal counsel and any transfer agent, registrar or dividend disbursing agent of the Trusts; insurance premiums; and expenses of calculating the NAV of, and the net income on, shares of the Funds. Shareholder servicing and distribution fees are all allocated to specific classes of the Funds. In addition, the Funds may allocate transfer agency and certain other expenses by class. Service providers to a Fund may, from time to time, voluntarily waive all or a portion of any fees to which they are entitled and/or reimburse certain expenses as they may determine from time to time. A Fund’s service providers may discontinue or modify these voluntary actions at any time without notice. Performance for certain Funds reflects the voluntary waiver of fees and/or the reimbursement of expenses. Without these voluntary waivers and/or expense reimbursements, performance would have been less favorable.
Prior to November 1, 2017, the Administrator paid many of the ordinary expenses incurred by the JPMorgan SR Funds in their operations including organization costs, taxes, ordinary fees and expenses for legal and auditing services, fees and expenses of pricing services, the expenses of preparing (including typesetting), printing and mailing reports, prospectuses, statements of additional information, proxy solicitation material and notices to existing shareholders, all expenses incurred in connection with issuing and redeeming shares, the cost of custodial and fund accounting services, and the cost of initial and ongoing registration of the shares under Federal and state securities laws. Effective November 1, 2017, the JPMorgan SR Funds pay these expenses, as noted in the preceding paragraph.
Part II - 136
JPMIM and JPMDS have agreed that they will waive fees or reimburse the Funds, as applicable, as described in the Prospectuses.
FINANCIAL INTERMEDIARIES
As described in “SHAREHOLDER SERVICING” in this SAI, JPMDS may enter into service agreements with Financial Intermediaries under which it will pay all or a portion of the shareholder servicing fees it receives from the Funds to such Financial Intermediaries for performing Shareholder Services and/or Other Related Services for Financial Intermediaries’ customers who are shareholders of the Funds. In addition, as described in “DISTRIBUTION PLAN” in this SAI, JPMDS may enter into Mutual Fund Sales Agreements with Financial Intermediaries under which it will pay all or a portion of the Distribution Fees it receives from the Funds to such Financial Intermediaries for providing distribution services and marketing support.
In addition, the Funds may enter into agreements with Financial Intermediaries pursuant to which the Funds will pay the Financial Intermediary for services such as networking, or sub-transfer agency and/or omnibus sub-accounting (collectively, “Omnibus Sub-Accounting”) or networking. Payments made pursuant to such agreements are generally based on either (1) a percentage of the average daily net assets of clients serviced by such Financial Intermediary up to a set maximum dollar amount per shareholder account serviced, or (2) the number of accounts serviced by such Financial Intermediary. Any payments made pursuant to such agreements are in addition to, rather than in lieu of, Rule 12b-1 fees and shareholder servicing fees the Financial Intermediary may also be receiving pursuant to agreements with the Distributor and shareholder servicing agent, respectively. From time to time, JPMDS, JPMIM or their affiliates may pay a portion of the fees for networking or Omnibus Sub-Accounting at its or their own expense out of its or their own legitimate profits.
Financial Intermediaries may offer additional services to their customers, including specialized procedures and payment for the purchase and redemption of Fund shares, such as pre-authorized or systematic purchase and redemption programs, “sweep” programs, cash advances and redemption checks. Certain Financial Intermediaries may (although they are not required by the Trusts to do so) credit to the accounts of their customers from whom they are already receiving other fees amounts not exceeding such other fees or the fees for their services as Financial Intermediaries.
Financial Intermediaries may establish their own terms and conditions for providing their services and may charge investors a transaction-based or other fee for their services. Such charges may vary among Financial Intermediaries, but in all cases will be retained by the Financial Intermediary and will not be remitted to a Fund or JPMDS.
Certain Funds have authorized one or more Financial Intermediaries to accept purchase and redemption orders on their behalf. Such Financial Intermediaries are authorized to designate other intermediaries to accept purchase and redemption orders on a Fund’s behalf. Such Funds will be deemed to have received a purchase or redemption order when a Financial Intermediary or, if applicable, that Financial Intermediary’s authorized designee accepts the order. These orders will be priced at the Fund’s NAV next calculated after they are so accepted.
Effective April 3, 2017, the Funds ceased making direct payments to Financial Intermediaries for any applicable sub-transfer agency services. After this date, payments to Financial Intermediaries for sub-transfer agency services will be made by JPMDS from the service fee (formerly known as “shareholder service fee”). From time to time, JPMIM or its affiliates may pay a portion of the sub-transfer agency fees at its or their own expense and out of its or their legitimate profits.
ADDITIONAL COMPENSATION TO FINANCIAL INTERMEDIARIES
JPMDS and JPMIM at their own expense out of their own legitimate profits, may provide additional compensation (“Additional Compensation”) to Financial Intermediaries. Additional Compensation may also be paid by other affiliates of JPMDS and JPMIM from time to time. These Additional Compensation payments are over and above any sales charges (including Rule 12b-1 fees), shareholder servicing, Omnibus Sub-Accounting or networking fees which are charged directly to the Funds and which are disclosed elsewhere in the Funds’ prospectuses or in this SAI. The categories of Additional Compensation are described below. These categories are not mutually exclusive and JPMDS and JPMIM and/or their affiliates may pay additional types of Additional Compensation in the future. The same Financial Intermediaries may receive payments under more than one or all categories. Not all Financial Intermediaries receive Additional Compensation payments and such payments may be different for different Financial Intermediaries or different types of funds (e.g., equity fund or fixed income fund).
Part II - 137
These payments may be significant to a Financial Intermediary and may be an important factor in a Financial Intermediary’s willingness to support the sale of the Funds through its distribution system. Additional Compensation payments are always made only to the firm, never to individuals other than occasional gifts and entertainment that are permitted by FINRA rules.
JPMIM and JPMDS and/or their affiliates may be motivated to pay Additional Compensation to promote the sale of Fund shares to clients of Financial Intermediaries and the retention of those investments by those clients. To the extent Financial Intermediaries sell more shares of the Funds or retain shares of the Funds in their clients’ accounts, JPMIM and JPMDS benefit from the incremental management and other fees paid by the Funds with respect to those assets.
The provision of Additional Compensation, the varying fee structure and the basis on which a Financial Intermediary compensates its registered representatives or salespersons may create an incentive for a particular Financial Intermediary, registered representative or salesperson to highlight, feature or recommend funds, including the Funds, or other investments based, at least in part, on the level of compensation paid. Additionally, if one mutual fund sponsor makes greater distribution payments than another, a Financial Intermediary may have an incentive to recommend that sponsor’s mutual fund over other mutual funds. Similarly, if a Financial Intermediary receives greater compensation for one share class versus another, that Financial Intermediary may have an incentive to recommend that share class. Shareholders should consider whether such incentives exist when evaluating any recommendations from a Financial Intermediary to purchase or sell shares of the Funds and when considering which share class is most appropriate. Shareholders should ask their salesperson or visit their Financial Intermediary’s website for more information.
Sales and Marketing Support. Additional Compensation may be paid to Financial Intermediaries for sales and marketing support. Marketing support may include access to a Financial Intermediary’s sales representatives and management representatives. Additional Compensation may also be paid to Financial Intermediaries for inclusion of the Funds on a firm’s list of offered products including a preferred or select sales list, in other sales programs or as an expense reimbursement. Additional Compensation may be calculated in basis points based on average net Fund assets attributable to the Financial Intermediary or sales of the Funds by the Financial Intermediary. Additional Compensation may also be fixed dollar amounts.
From time to time, JPMIM and JPMDS and their affiliates may provide, out of their own legitimate profits, financial assistance to Financial Intermediaries that enable JPMDS and JPMIM to sponsor and/or participate in and/or present at meeting, conferences or seminars, sales, training or educational programs, client and investor events, client prospecting retention, and due diligence events and other firm-sponsored events or other programs for the Financial Intermediaries’ registered representatives and employees. These payments may vary depending upon the nature of the event, and may include travel expenses, such as lodging incurred by registered representatives of the Financial Intermediaries. In addition, JPMIM and JPMDS and their affiliates may pay or reimburse sales representatives of Financial Intermediaries in the form of occasional gifts and occasional meals or entertainment events that JPMIM and JPMDS or their affiliates deem appropriate, subject to applicable law and regulations. Other compensation may be offered to the extent not prohibited by federal or state laws or any self-regulatory agency, such as FINRA. These payments may vary depending upon the nature of the event or the relationship.
Administrative and Processing Support. JPMIM and/or JPMDS may also pay Additional Compensation to Financial Intermediaries for their administrative and processing support, including (i) record keeping, Omnibus Sub-Accounting and networking, to the extent that the Funds do not pay for these costs directly; (ii) reimbursement for ticket processing charges applied to Fund shares and (iii) one time payments for ancillary services such as setting up Funds on the Financial Intermediary’s mutual fund trading system/platform.
Identification of Financial Intermediaries
The following is a list of FINRA member firms that received Additional Compensation for the period ending May 31, 2022. This list includes FINRA members: (1) who have entered into written agreements with the Funds’ Adviser to receive Additional Compensation (excluding payments made for Omnibus Sub-Accounting services); and/or (2) who have received Additional Compensation for events and meetings that were sponsored in whole or in part by JPMDS.
1.
Academy Securities, Inc.
2.
American Enterprise Investment Services, Inc.
Part II - 138
3.
American Veterans Group, PBC
4.
Apex Clearing Corporation
5.
Arlington Trust Company Inc.
6.
Bellator Asset Management LLC
7.
Blackrock Investments, LLC
8.
Board of Regents of The University of Texas Systems
9.
Bofa Securities, Inc.
10.
Broadridge Business Process Outsourcing LLC
11.
Cetera Advisor Networks LLC
12.
Cetera Advisors LLC
13.
Cetera Financial Specialists LLC
14.
Cetera Investment Services LLC
15.
Charles Schwab & Co Inc.
16.
Citco Securities Inc.
17.
Citigroup Global Markets, Inc.
18.
Commonfund Securities, Inc.
19.
Commonwealth Equity Services, Inc. (dba Commonwealth Financial Network)
20.
Continental Stock Transfer & Trust Company
21.
Credit Suisse Securities (USA) LLC
22.
E*Trade Securities LLC
23.
Edward D. Jones & Co., L.P.
24.
Envestnet Asset Management, Inc.
25.
Equitable Advisors, LLC
26.
Fidelity Brokerage Services
27.
Fidelity Investments Institutional Operations Co.
28.
Fifth Third Securities, Inc.
29.
First Allied Securities, Inc.
30.
First Republic Securities Company, LLC
31.
Fi-Tek LLC
32.
FSC Securities Corp.
33.
GWFS Equities, Inc.
34.
HazelTree Fund Services, Inc.
35.
Hilltop Securities Inc.
36.
Huntington Securities, Inc.
37.
Ingalls & Snyder, LLC
38.
Institutional Bond Network, LLC
39.
Institutional Cash Distributors, LLC
Part II - 139
40.
J.P. Morgan Securities LLC
41.
Jackson National Life Distributors, LLC
42.
Janney Montgomery Scott LLC
43.
JPMorgan Chase Bank, National Association
44.
JPMorgan Invest Holdings LLC
45.
KMS Financial Services, Inc.
46.
Liberty Bank and Trust Company
47.
Lincoln Financial Advisors Corp
48.
Lincoln Financial Distributors, Inc.
49.
Lincoln Financial Securities Corporation
50.
Lord Securities Corporation d/b/a TMF Group New York, LLC
51.
LPL Financial LLC
52.
M & T Securities, Inc.
53.
Merrill Lynch, Pierce, Fenner & Smith Inc.
54.
Mischler Financial Group, Inc.
55.
MML Investor Services, LLC
56.
Moreton Capital Markets, LLC
57.
Morgan Stanley Smith Barney LLC
58.
MSEC, LLC
59.
National Financial Services LLC
60.
Northwestern Mutual Investment Services LLC
61.
Othniel Financial Advisory Services LLC
62.
Pershing LLC
63.
PNC Capital Markets LLC
64.
PNC Investments LLC
65.
Raymond James & Associates, Inc.
66.
Raymond James Financial Services, Inc.
67.
RBC Capital Markets, LLC
68.
Robert W. Baird & Co. Incorporated
69.
Royal Alliance Associates
70.
SagePoint Financial, Inc
71.
Securities America Inc.
72.
Securities Service Network, LLC
73.
State Street Global Markets, LLC
74.
Summit Brokerage Services, Inc.
75.
TD Ameritrade Clearing
76.
Triad Advisors Inc.
Part II - 140
77.
UBS Financial Services, Inc.
78.
U.S. Bancorp Investments Inc
79.
Voya Financial Advisors, Inc.
80.
Wedbush Securities, Inc.
81.
Wells Fargo Advisors Financial Network, LLC
82.
Wells Fargo Clearing Services, LLC
83.
Wells Fargo Securities LLC
84.
Woodbury Financial Services, Inc.
Other Financial Intermediaries, which are not members of FINRA, also may receive Additional Compensation.
For details of the amounts of Additional Compensation paid by the Funds’ Adviser to Financial Intermediaries (including both FINRA and Non-FINRA members) pursuant to written agreements including agreements for networking and Omnibus Sub-Accounting for all of the Funds, see “FINANCIAL INTERMEDIARIES — Other Cash Compensation” in Part I of this SAI.
For details of finders’ fee paid to Financial Intermediaries, see “FINANCIAL INTERMEDIARIES —Finders’ Fee Commissions” in Part I of this SAI.
TRUST COUNSEL
The law firm of Dechert LLP, 1095 Avenue of the Americas, New York, NY 10036, is counsel to the Trusts.
INDEPENDENT REGISTERED PUBLIC ACCOUNTING FIRM
The independent registered public accounting firm for the Trusts and the Funds is PricewaterhouseCoopers LLP, 300 Madison Avenue, New York, NY 10017. PricewaterhouseCoopers LLP conducts an annual audit of the financial statements of each of the Funds and assists in the preparation and/or review of each Fund’s federal and state income tax returns.
DIVIDENDS AND DISTRIBUTIONS
Each Fund declares and pays dividends and distributions as described under “Distribution and Tax Matters” in the Prospectuses. Dividends may differ between classes as a result of differences in distribution expenses or other class-specific expenses.
Dividends and capital gains distributions paid by a Fund are automatically reinvested in additional shares of the Fund unless the shareholder has elected to have them paid in cash. Dividends and distributions to be paid in cash are credited to the shareholder’s pre-assigned bank account or are mailed by check in accordance with the customer’s instructions. The Funds reserve the right to discontinue, alter or limit the automatic reinvestment privilege at any time.
If a shareholder has elected to receive dividends and/or capital gain distributions in cash and the postal or other delivery service is unable to deliver checks to the shareholder’s address of record, such shareholder’s distribution option will automatically be converted to having all dividend and other distributions reinvested in additional shares. No interest will accrue on amounts represented by uncashed distribution or redemption checks. With regard to Funds that accrue dividends daily, dividends will only begin to accrue after a Fund receives payment for shares.
NET ASSET VALUE
Shares are sold at NAV per share, plus a sales charge, if any. This is also known as the offering price. Shares are also redeemed at NAV, minus any applicable deferred sales charges. Each class of shares in each Fund has a different NAV. This is primarily because each class has class specific expenses such as distribution and shareholder servicing fees.
Part II - 141
The NAV per share of a class of a Fund is equal to the value of all the assets attributable to that class, minus the liabilities attributable to that class, divided by the number of outstanding shares of that class. The Money Market Funds, excluding Prime Money Market Fund, will continue to value their portfolio of securities using the amortized cost method provided that certain conditions are met, including that the Fund’s Board of Trustees continues to believe that the amortized cost valuation fairly reflects the market-based NAV per share of the Fund. The purpose of this method of calculation is to attempt to maintain a constant NAV per share of each Fund of $1.00. No assurances can be given that this goal can be attained. The amortized cost method of valuation values a security at its cost at the time of purchase and thereafter assumes an amortization that would produce a constant yield to maturity of any discount or premium, regardless of the impact of fluctuating interest rates on the market value of the instrument. The Board of Trustees has established procedures and directed certain officers of the Funds to monitor the differences between the NAVs calculated based on amortized cost and market value at predetermined intervals but no less frequently than weekly, and to report to the Board of Trustees such differences. If a difference of more than 1/2 of 1% occurs between valuation based on the amortized cost method and valuation based on market value, the Board of Trustees may take steps necessary to reduce such deviation if it believes that such deviation will result in material dilution or any unfair results to investors or existing shareholders. Actions that may be taken by the Board of Trustees include (i) redeeming shares in kind, (ii) selling portfolio instruments prior to maturity to realize capital gains or losses or to shorten the average maturity of portfolio securities, (iii) withholding or supplementing dividends, (iv) utilizing a net asset value per share as determined by using available market quotations, or (v) reducing the number of outstanding Fund shares. Any reduction of outstanding shares will be accomplished by having each shareholder contribute to a Fund’s capital the necessary shares on a pro rata basis. Each shareholder will be deemed to have agreed to such contribution in these circumstances by his or her investment in the Funds. In its discretion, the Board of Trustees of the Money Market Funds may elect to calculate the price of a Fund’s shares once per day. Further, with regard to the Money Market Funds, the Board of Trustees has empowered management to temporarily suspend one or more cut-off times for a Fund, other than the last cut-off time of the day.
The NAV of each class of shares of the Prime Money Market Fund is calculated using market-based values. The following is a discussion of the procedures used by the Funds in valuing their assets for market-based NAVs.
Securities for which market quotations are readily available are generally valued at their current market value. Other securities and assets, including securities for which market quotations are not readily available; market quotations are determined not to be reliable; or, their value has been materially affected by events occurring after the close of trading on the exchange or market on which the security is principally traded (for example, a natural disaster affecting an entire country or region, or an event that affects an individual company) but before a Fund’s NAV is calculated, may be valued at its fair value in accordance with policies and procedures adopted by the J.P. Morgan Funds’ Board of Trustees. Fair value represents a good faith determination of the value of a security or other asset based upon specifically applied procedures. Fair valuation determinations may require subjective determinations. There can be no assurance that the fair value of an asset is the price at which the asset could have been sold during the period in which the particular fair value was used in determining the Fund’s NAV.
Equity securities listed on a North American, Central American, South American or Caribbean (“Americas”) securities exchange are generally valued at the last sale price on the exchange on which the security is principally traded that is reported before the time when the net assets of the Funds are valued. The value of securities listed on the NASDAQ Stock Market, Inc. is generally the NASDAQ official closing price.
Generally, trading of foreign equity securities on most foreign markets (i.e., non-Western hemisphere) is completed before the close in trading in U.S. markets. The Funds have implemented fair value pricing on a daily basis for all foreign equity securities and investments with foreign equity reference obligations. The fair value pricing utilizes the quotations of an independent pricing service. Trading on foreign markets may also take place on days on which the U.S. markets and the Funds are closed.
Shares of exchange-traded funds (ETFs) are generally valued at the last sale price on the exchange on which the ETF is principally traded. Shares of open-end mutual funds are valued at their respective NAVs.
Fixed income securities are valued using market quotations supplied by approved independent third party pricing services, affiliated pricing services or broker/dealers. In determining security prices, pricing services and broker/dealers may consider a variety of inputs and factors, including, but not limited to
Part II - 142
proprietary models that may take into account market transactions in securities with comparable characteristics, yield curves, option-adjusted spreads, credit spreads, estimated default rates, coupon rates, underlying collateral and estimated cash flows.
Assets and liabilities initially expressed in foreign currencies will be converted into U.S. dollars at the prevailing market rates from an approved independent pricing service as of 4:00 PM ET.
Options (e.g., on stock indices or equity securities) traded on U.S. equity securities exchanges are valued at the composite mean price, using the National Best Bid and Offer quotes at the close of options trading on such exchanges.
Options traded on foreign exchanges or U.S. commodity exchanges are valued at the settled price, or if no settled price is available, at the last sale price available prior to the calculation of a Fund’s NAV.
Exchange traded futures (e.g., on stock indices, debt securities or commodities) are valued at the settled price, or if no settled price is available, at the last sale price as of the close of the exchanges on which they trade.
Non-listed over-the-counter options and futures are valued at the evaluated price provided by a counterparty or broker/dealer.
Swaps and structured notes are priced generally by an approved independent third party or affiliated pricing service or at an evaluated price provided by a counterparty or broker/dealer.
Certain fixed income securities and swaps may be valued using market quotations or valuations provided by pricing services affiliated with the Adviser. Valuations received by the Funds from affiliated pricing services are the same as those provided to other affiliated and unaffiliated entities by these affiliated pricing services.
With respect to all Funds, securities or other assets for which market quotations are not readily available or for which market quotations do not represent the value at the time of pricing (including certain illiquid securities) are fair valued in accordance with policies and procedures (“Policies”) established by and under the supervision and responsibility of the Trustees. The Board of Trustees has established an Audit and Valuation Committee to assist the Board of Trustees in its oversight of the valuation of the Funds’ securities and delegated to J.P. Morgan Investment Management Inc., an indirect, wholly-owned subsidiary of JPMorgan Chase & Co. (the “Administrator” or “JPMIM”), the responsibility for implementing the day-to-day operational aspects of the valuation process. The Administrator has created the J.P. Morgan Asset Management (“JPMAM”) Americas Valuation Committee (“VC”) to oversee and carry out the Policies for the valuation of investments held in the Funds. The VC is comprised of senior representatives from JPMIM, JPMAM Legal, Compliance and Risk Management and the Funds’ Chief Compliance Officer. Fair value situations could include, but are not limited to: (1) a significant event that affects the value of a Fund’s securities (e.g., news relating to natural disasters affecting an issuer’s operations or earnings announcements); (2) illiquid securities; (3) securities that may be defaulted or de-listed from an exchange and are no longer trading; or (4) any other circumstance in which the VC believes that market quotations do not accurately reflect the value of a security.
From time to time, there may be errors in the calculation of the NAV of a Fund or the processing of purchases and redemptions. Shareholders will generally not be notified of the occurrence of an error or the resolution thereof.
DELAWARE TRUSTS
JPMT I, JPMT II and JPMT IV. JPMT I and JPMT II were each formed as Delaware statutory trusts on November 12, 2004 pursuant to separate Declarations of Trust dated November 5, 2004. JPMT I assumed J.P. Morgan Mutual Fund Series’ (“JPMMFS”) registration pursuant to the 1933 Act and the 1940 Act effective after the close of business on February 18, 2005, and JPMT II assumed One Group Mutual Funds’ registration pursuant to the 1933 Act and the 1940 Act effective after the close of business on February 18, 2005. JPMT IV was formed as a Delaware statutory trust on November 11, 2015 pursuant to a Declaration of Trust dated November 11, 2015.
Under Delaware law, shareholders of a statutory trust shall have the same limitation of personal liability that is extended to stockholders of private corporations for profit organized under Delaware law, unless otherwise provided in the trust’s governing trust instrument. JPMT I’s, JPMT II’s and JPMT IV’s Declarations of Trust each provides that shareholders of JPMT I, JPMT II and JPMT IV shall not be personally liable for the debts, liabilities, obligations and expenses incurred by, contracted for, or otherwise
Part II - 143
existing with respect to JPMT I, JPMT II and JPMT IV or any series or class thereof. In addition, the Declarations of Trust each provides that neither JPMT I, JPMT II, JPMT IV, nor the Trustees, officers, employees, nor agents thereof shall have any power to bind personally any shareholders nor to call upon any shareholder for payment of any sum of money or assessment other than such as the shareholder may personally agree to pay. Moreover, Declarations of Trust for JPMT I, JPMT II and JPMT IV each expressly provide that the shareholders shall have the same limitation of personal liability that is extended to shareholders of a private corporation for profit incorporated in the State of Delaware.
The Declarations of Trust of JPMT I and JPMT II each provides for the indemnification out of the assets held with respect to a particular series of shares of any shareholder or former shareholder held personally liable solely by reason of a claim or demand relating to the person being or having been a shareholder and not because of the shareholder’s acts or omissions. The Declarations of Trust of JPMT I and JPMT II each also provide that JPMT I and JPMT II, on behalf of the applicable series, may, at its option with prior written notice, assume the defense of any claim made against a shareholder.
JPMT I’s, JPMT II’s and JPMT IV’s Declarations of Trust each provides that JPMT I, JPMT II and JPMT IV will indemnify their respective Trustees and officers against liabilities and expenses incurred in connection with any proceeding in which they may be involved because of their offices with JPMT I, JPMT II or JPMT IV, unless, as to liability to JPMT I, JPMT II or JPMT IV, or the shareholders thereof, the Trustees engaged in willful misfeasance, bad faith, gross negligence or reckless disregard of the duties involved in the conduct of their offices. In addition, the Declarations of Trust each provides that any Trustee who has been determined to be an “audit committee financial expert” shall not be subject to a greater liability or duty of care because of such determination.
JPMT I, JPMT II and JPMT IV shall continue without limitation of time subject to the provisions in the Declarations of Trust concerning termination by action of the shareholders or by action of the Trustees upon written notice to the shareholders.
JPMT I is party to an Agreement and Plan of Investment and Transfer of Assets dated January 17, 2006 pursuant to which it has agreed, out of the assets and property of certain Funds, to indemnify and hold harmless JPMorgan Chase Bank, in its corporate capacity and as trustee of certain common trust funds, and each of its directors and officers, for any breach by JPMT I of its representations, warranties, covenants or agreements under such Agreement or any act, error, omission, neglect, misstatement, materially misleading statement, breach of duty or other act wrongfully done or attempted to be committed by JPMT I or its Board of Trustees or officers, related to the transfer of assets from certain common trust funds to the respective Funds and other related transactions.
MASSACHUSETTS TRUSTS
JPMMFIT and UMF. JPMMFIT and UMF are organized as Massachusetts business trusts. The Growth Advantage Fund is a separate and distinct series of JPMMFIT. The JPMorgan Realty Income Fund and the Undiscovered Managers Behavioral Value Fund are each a separate and distinct series of UMF. Copies of the Declarations of Trust of JPMMFIT and UMF are on file in the office of the Secretary of The Commonwealth of Massachusetts. The Declarations of Trust and By-laws of each of JPMMFIT and UMF are designed to make each Trust similar in most respects to a Massachusetts business corporation. The principal distinction between the two forms concerns shareholder liability as described below.
Under Massachusetts law, shareholders of such a trust may, under certain circumstances, be held personally liable as partners for the obligations of the trust, which is not the case for a corporation. However, each of JPMMFIT and UMF’s Declarations of Trust provide that the shareholders shall not be subject to any personal liability for the acts or obligations of a Fund and that every written agreement, obligation, instrument or undertaking made on behalf of a Fund shall contain a provision to the effect that the shareholders are not personally liable thereunder.
No personal liability will attach to the shareholders under any undertaking containing such provision when adequate notice of such provision is given, except possibly in a few jurisdictions. With respect to all types of claims in the latter jurisdictions, (i) tort claims, (ii) contract claims where the provision referred to is omitted from the undertaking, (iii) claims for taxes, and (iv) certain statutory liabilities in other jurisdictions, a shareholder may be held personally liable to the extent that claims are not satisfied by the Funds. However, upon payment of such liability, the shareholder will be entitled to reimbursement from the general assets of the Funds. The Boards of Trustees intend to conduct the operations of JPMMFIT and UMF in such a way so as to avoid, as far as possible, ultimate liability of the shareholders for liabilities of the Funds.
Part II - 144
JPMMIT and UMF’s Declarations of Trust provides that each of JPMMFIT and UMF will indemnify their respective Trustees and officers against liabilities and expenses incurred in connection with litigation in which they may be involved because of their offices with JPMMFIT and UMF, unless, as to liability to JPMMFIT, UMF or their shareholders, it is finally adjudicated that the Trustees engaged in willful misfeasance, bad faith, gross negligence or reckless disregard of the duties involved in their offices or with respect to any matter unless it is finally adjudicated that they did not act in good faith in the reasonable belief that their actions were in the best interests of JPMMFIT or UMF. In the case of settlement, such indemnification will not be provided unless it has been determined by a court or other body approving the settlement or other disposition, or by a reasonable determination based upon a review of readily available facts, by vote of a majority of disinterested Trustees or in a written opinion of independent counsel, that such officers or Trustees have not engaged in willful misfeasance, bad faith, gross negligence or reckless disregard of their duties.
JPMMFIT and UMF shall continue without limitation of time subject to the provisions in each of JPMMFIT and UMF’s Declarations of Trust concerning termination by action of the shareholders or by action of the Trustees upon notice to the shareholders.
MARYLAND CORPORATION
JPMFMFG. JPMFMFG is a diversified open-end management investment company which was organized as a Maryland corporation, on August 19, 1997. Effective April 30, 2003, the name of JPMFMFG was changed from Fleming Mutual Fund Group, Inc. to J.P. Morgan Fleming Mutual Fund Group, Inc.
The Articles of Incorporation of JPMFMFG provide that a Director shall be liable only for his own willful defaults and, if reasonable care has been exercised in the selection of officers, agents, employees or investment advisers, shall not be liable for any neglect or wrongdoing of any such person. The Articles of Incorporation also provide that JPMFMFG will indemnify its Directors and officers against liabilities and expenses incurred in connection with actual or threatened litigation in which they may be involved because of their offices with JPMFMFG to the fullest extent permitted by law. However, nothing in the Articles of Incorporation shall protect or indemnify a Director against any liability for his willful misfeasance, bad faith, gross negligence or reckless disregard of his duties.
DESCRIPTION OF SHARES
Shares of JPMT I, JPMT II and JPMT IV. JPMT I, JPMT II and JPMT IV are open-end, management investment companies organized as Delaware statutory trusts. Each Fund represents a separate series of shares of beneficial interest. See “Delaware Trusts.”
The Declarations of Trust of JPMT I, JPMT II and JPMT IV each permits the Trustees to issue an unlimited number of full and fractional shares ($0.0001 par value) of one or more series and classes within any series and to divide or combine the shares of any series or class without materially changing the proportionate beneficial interest of such shares of such series or class in the assets held with respect to that series. Each share represents an equal beneficial interest in the net assets of a Fund with each other share of that Fund. The Trustees of JPMT I, JPMT II and JPMT IV may authorize the issuance of shares of additional series and the creation of classes of shares within any series with such preferences, voting powers, rights, duties and privileges as the Trustees may determine; however, the Trustees may not classify or change outstanding shares in a manner materially adverse to shareholders of each share. Upon liquidation of a Fund, shareholders are entitled to share pro rata in the net assets of a Fund available for distribution to such shareholders. The rights of redemption and exchange are described in the Prospectuses and elsewhere in this SAI.
The shareholders of each Fund are entitled to one vote for each dollar of NAV (or a proportionate fractional vote with respect to the remainder of the NAV of shares, if any), on matters on which shares of a Fund shall be entitled to vote. Subject to the 1940 Act, the Trustees themselves have the power to alter the number and the terms of office of the Trustees, to lengthen their own terms, or to make their terms of unlimited duration subject to certain removal procedures, and appoint their own successors, provided, however, that immediately after such appointment the requisite majority of the Trustees have been elected by the shareholders of JPMT I, JPMT II or JPMT IV respectively. The voting rights of shareholders are not cumulative with respect to the election of Trustees. It is the intention of JPMT I, JPMT II and JPMT IV not to hold meetings of shareholders annually. The Trustees may call meetings of shareholders for action by shareholder vote as may be required by either the 1940 Act or the Declarations of Trust of JPMT I, JPMT II and JPMT IV.
Part II - 145
Each share of a series or class represents an equal proportionate interest in the assets in that series or class with each other share of that series or class. The shares of each series or class participate equally in the earnings, dividends and assets of the particular series or class. Expenses of JPMT I, JPMT II and JPMT IV which are not attributable to a specific series or class are allocated among all of their series in a manner deemed by the Trustees to be fair and equitable. Shares have no pre-emptive or conversion rights, and when issued, are fully paid and non-assessable. Shares of each series or class generally vote together, except when required under federal securities laws to vote separately on matters that may affect a particular class, such as the approval of distribution plans for a particular class.
The Trustees of JPMT I, JPMT II and JPMT IV may, without shareholder approval (unless otherwise required by applicable law): (i) cause JPMT I, JPMT II or JPMT IV, to merge or consolidate with or into one or more trusts (or series thereof to the extent permitted by law), partnerships, associations, corporations or other business entities (including trusts, partnerships, associations, corporations, or other business entities created by the Trustees to accomplish such merger or consolidation) so long as the surviving or resulting entity is an investment company as defined in the 1940 Act, or is a series thereof, that will succeed to or assume JPMT I’s, JPMT II’s or JPMT IV’s registration under the 1940 Act and that is formed, organized, or existing under the laws of the U.S. or of a state, commonwealth, possession or territory of the U.S., unless otherwise permitted under the 1940 Act; (ii) cause any one or more series or classes of JPMT I, JPMT II or JPMT IV to merge or consolidate with or into any one or more other series or classes of JPMT I, JPMT II or JPMT IV one or more trusts (or series or classes thereof to the extent permitted by law), partnerships, associations, corporations; (iii) cause the shares to be exchanged under or pursuant to any state or federal statute to the extent permitted by law; or (iv) cause JPMT I, JPMT II or JPMT IV to reorganize as a corporation, limited liability company or limited liability partnership under the laws of Delaware or any other state or jurisdiction. However, the exercise of such authority may be subject to certain restrictions under the 1940 Act.
The Trustees may, without shareholder vote, generally restate, amend or otherwise supplement JPMT I’s, JPMT II’s or JPMT IV’s governing instruments, including the Declarations of Trust and the By-Laws, without the approval of shareholders, subject to limited exceptions, such as the right to elect Trustees.
The Trustees, without obtaining any authorization or vote of shareholders, may change the name of any series or class or dissolve or terminate any series or class of shares.
Shares have no subscription or preemptive rights and only such conversion or exchange rights as the Board may grant in its discretion. When issued for payment as described in the Prospectus and this SAI, JPMT I’s, JPMT II’s or JPMT IV’s Shares will be fully paid and non-assessable. In the event of a liquidation or dissolution of JPMT I, JPMT II or JPMT IV Shares of a Fund are entitled to receive the assets available for distribution belonging to the Fund, and a proportionate distribution, based upon the relative asset values of the respective Funds, of any general assets not belonging to any particular Fund which are available for distribution.
Rule 18f-2 under the 1940 Act provides that any matter required to be submitted to the holders of the outstanding voting securities of an investment company such as JPMT I, JPMT II or JPMT IV shall not be deemed to have been effectively acted upon unless approved by the holders of a majority of the outstanding Shares of each Fund affected by the matter. For purposes of determining whether the approval of a majority of the outstanding Shares of a Fund will be required in connection with a matter, a Fund will be deemed to be affected by a matter unless it is clear that the interests of each Fund in the matter are identical, or that the matter does not affect any interest of the Fund. Under Rule 18f-2, the approval of an investment advisory agreement or any change in investment policy would be effectively acted upon with respect to a Fund only if approved by a majority of the outstanding Shares of such Fund. However, Rule 18f-2 also provides that the ratification of independent public accountants, the approval of principal underwriting contracts, and the election of Trustees may be effectively acted upon by Shareholders of the Trust voting without regard to series.
Each share class of a Fund has exclusive voting rights with respect to matters pertaining to the Fund’s Distribution and Shareholder Services Plans, Distribution Plans or Shareholder Services Plan applicable to those classes.
Shares of JPMMFIT and UMF. JPMMFIT and UMF are an open-end, management investment companies which are organized as Massachusetts business trusts. The Growth Advantage Fund represents a separate series of shares of beneficial interest of JPMMFIT. The JPMorgan Realty Income Fund and the Undiscovered Managers Behavioral Value Fund are each a separate and distinct series of UMF. See “Massachusetts Trusts.”
Part II - 146
The Declarations of Trust of each of JPMMFIT and UMF permits the Trustees to issue an unlimited number of full and fractional shares ($0.001 par value) of one or more series and classes within any series and to divide or combine the shares (of any series, if applicable) without changing the proportionate beneficial interest of each shareholder in the Fund (or in the assets of other series, if applicable). Each share represents an equal proportional interest in a Fund with each other share. Upon liquidation of a Fund, holders are entitled to share pro-rata in the net assets of the Fund available for distribution to such shareholders. See “Massachusetts Trusts.” The rights of redemption and exchange are described in the Prospectuses and elsewhere in this SAI.
The shareholders of each Fund are entitled to one vote for each whole share (with fractional shares entitled to a proportionate fractional vote) on matters on which shares of the Fund shall be entitled to vote. Subject to the 1940 Act, the Trustees themselves have the power to alter the number and the terms of office of the Trustees, to lengthen their own terms, or to make their terms of unlimited duration subject to certain removal procedures, and appoint their own successors, provided, however, that immediately after such appointment the requisite majority of the Trustees have been elected by the shareholders of JPMMFIT and UMF, respectively. The voting rights of shareholders are not cumulative so that holders of more than 50% of the shares voting can, if they choose, elect all Trustees being selected while the shareholders of the remaining shares would be unable to elect any Trustees. It is the intention of JPMMFIT and UMF not to hold meetings of shareholders annually. The Trustees may call meetings of shareholders for action by shareholder vote as may be required by either the 1940 Act or the Declarations of Trust.
Each share of a series or class represents an equal proportionate interest in that series or class with each other share of that series or class. The shares of each series or class participate equally in the earnings, dividends and assets of the particular series or class. Expenses of JPMMFIT and UMF which are not attributable to a specific series or class are allocated among all of its series in a manner believed by management of JPMMFIT and UMF to be fair and equitable. Shares have no pre-emptive or conversion rights. Shares when issued are fully paid and non-assessable, except as set forth below. Shares of each series or class generally vote together, except when required under federal securities laws to vote separately on matters that may affect a particular class, such as the approval of distribution plans for a particular class.
The Trustees may, however, authorize the issuance of shares of additional series and the creation of classes of shares within any series with such preferences, privileges, limitations and voting and dividend rights as the Trustees may determine. The proceeds from the issuance of any additional series would be invested in separate, independently managed Funds with distinct investment objectives, policies and restrictions, and share purchase, redemption and net asset valuation procedures. Any additional classes would be used to distinguish among the rights of different categories of shareholders, as might be required by future regulations or other unforeseen circumstances. All consideration received by each Fund for shares of any additional series or class, and all assets in which such consideration is invested, would belong to that series or class, subject only to the rights of creditors of the Fund and would be subject to the liabilities related thereto. Shareholders of any additional series or class will approve the adoption of any management contract or distribution plan relating to such series or class and of any changes in the investment policies related thereto, to the extent required by the 1940 Act.
Shareholders of each Fund have the right, upon the declaration in writing or vote of more than two-thirds of its outstanding shares, to remove a Trustee. The Trustees will call a meeting of shareholders to vote on removal of a Trustee upon the written request of the record holders of 10% of each Fund’s shares. In addition, whenever ten or more shareholders of record who have been such for at least six months preceding the date of application, and who hold in the aggregate either shares having a NAV of at least $25,000 or at least 1% of outstanding shares, whichever is less, in the case of JPMMFIT, or having at least 1% of outstanding shares, in the case of UMF, shall apply to the Trustees in writing, stating that they wish to communicate with other shareholders with a view to obtaining signatures to request a meeting for the purpose of voting upon the question of removal of the Trustee or Trustees and accompanied by a form of communication and request which they wish to transmit, the Trustees shall within five business days after receipt of such application either: (1) afford to such applicants access to a list of the names and addresses of all shareholders as recorded on the books of the Trust; or (2) inform such applicants as to the approximate number of shareholders of record, and the approximate cost of mailing to them the proposed communication and form of request. If the Trustees elect to follow the latter course, the Trustees, upon the written request of such applicants, accompanied by a tender of the material to be mailed and of the reasonable expenses of mailing, shall, with reasonable promptness, mail such material to all shareholders of record at their addresses as recorded on the books, unless within five business days after such tender the Trustees shall mail to such applicants and file with the SEC, together with a copy of the material to be
Part II - 147
mailed, a written statement signed by at least a majority of the Trustees to the effect that in their opinion either such material contains untrue statements of fact or omits to state facts necessary to make the statements contained therein not misleading, or would be in violation of applicable law, and specifying the basis of such opinion. After opportunity for hearing upon the objections specified in the written statements filed, the SEC may, and if demanded by the Trustees or by such applicants shall, enter an order either sustaining one or more of such objections or refusing to sustain any of them. If the SEC shall enter an order refusing to sustain any of such objections, or if, after the entry of an order sustaining one or more of such objections, the SEC shall find, after notice and opportunity for hearing, that all objections so sustained have been met, and shall enter an order so declaring, the Trustees shall mail copies of such material to all shareholders with reasonable promptness after the entry of such order and the renewal of such tender.
For information relating to mandatory redemption of Fund shares or their redemption at the option of JPMMFIT and UMF under certain circumstances, see “Purchases, Redemptions and Exchanges.”
Shares of JPMFMFG. The Articles of Incorporation of JPMFMFG, as supplemented, permit the classes of JPMFMFG to offer 1,262,500,000 shares of common stock, with $.001 par value per share. Pursuant to JPMFMFG’s Articles of Incorporation, the Board may increase the number of shares that the classes of JPMFMFG are authorized to issue without the approval of the shareholders of each class of JPMFMFG. The Board of Directors has the power to designate and redesignate any authorized but unissued shares of capital stock into one or more classes of shares and separate series within each such class, to fix the number of shares in any such class or series and to classify or reclassify any unissued shares with respect to such class or series.
Each share of a series in JPMFMFG represents an equal proportionate interest in that series with each other share. Shares are entitled upon liquidation to a pro rata share in the net assets of the series. Shareholders have no preemptive rights. All consideration received by JPMFMFG for shares of any series and all assets in which such consideration is invested would belong to that series and would be subject to the liabilities related thereto. Share certificates representing shares will not be issued.
Under Maryland law, JPMFMFG is not required to hold an annual meeting of its shareholders unless required to do so under the 1940 Act.
Each share in each series of the Fund represents an equal proportionate interest in that series of the Fund with each other share of that series of the Fund. The shares of each series and class participate equally in the earnings, dividends and assets of the particular series or class. Expenses of JPMFMFG which are not attributable to a specific series or class are allocated among all the series and classes in a manner believed by management of JPMFMFG to be fair and equitable. Shares of each series or class generally vote together, except when required by federal securities laws to vote separately on matters that may affect a particular series or class differently, such as approval of a distribution plan.
PORTFOLIO HOLDINGS DISCLOSURE
As described in the Prospectuses and pursuant to the procedures approved by the Trustees, each business day, a Fund will make available to the public upon request to J.P. Morgan Funds Services or the J.P. Morgan Institutional Funds Service Center (1-800-480-4111 or 1-800-766-7722, as applicable) a complete, uncertified schedule of its portfolio holdings as of the prior business day for the Money Market Funds and as of the last day of that prior month for all other Funds. In addition, from time to time, each Fund may post portfolio holdings on the J.P. Morgan Funds’ website on a more timely basis.
The Funds’ publicly available uncertified, complete list of portfolio holdings information, as described above, may also be provided regularly pursuant to a standing request, such as on a monthly or quarterly basis, to (i) third party service providers, rating and ranking agencies, financial intermediaries, and affiliated persons of the Funds and (ii) clients of the Fund’s Adviser or its affiliates that invest in the Funds or such clients’ consultants. No compensation or other consideration is received by a Fund or the Fund’s Adviser, or any other person for these disclosures.
For a list of the entities that receive the Funds’ portfolio holdings information, the frequency with which it is provided and the length of the lag between the date of the information and the date it is disclosed, see “PORTFOLIO HOLDINGS DISCLOSURE” in Part I of this SAI.
In addition, the Funds may for legitimate business purposes release portfolio holdings earlier than the time period specified in the applicable prospectus to certain service providers to the Funds or the Adviser, any sub-advisers, Administrator, Shareholder Servicing Agent, Distributor or Custodian, including rating
Part II - 148
and ranking agencies, pricing services, proxy voting service providers, accountants, attorneys, custodians, securities lending agents (to the extent the Funds engage in securities lending), consultants retained to assist in the drafting of management discussion of fund performance in shareholder reports, brokers in connection with Fund transactions and in providing pricing quotations, transfer agents and entities providing CDSC financing (released weekly one day after trade date). The Funds may also release portfolio holdings to the Adviser and affiliates of JPMorgan Chase for the limited purposes of hedging seed capital investment of the Adviser in the Funds, risk management, and for regulatory reporting purposes applicable to bank holding companies and their subsidiaries. The Adviser and affiliates of JPMorgan Chase may also have access to portfolio holdings of certain Funds for the limited purpose of hedging the Adviser's liability to pay deferred compensation to portfolio managers and other eligible employees based on the performance of certain designated Funds. The Funds will also provide portfolio holdings information earlier than the time periods specified in the applicable prospectus to the Investment Company Institute (the “ICI”) to support the ICI’s advocacy efforts on behalf of the mutual fund industry. When a Fund redeems a shareholder in kind, the shareholder generally receives its proportionate share of the Fund’s portfolio holdings and, therefore, the shareholder and its agent may receive such information earlier than the time period specified in the Prospectuses. Such holdings are released on conditions of confidentiality, which include appropriate trading prohibitions. “Conditions of confidentiality” include confidentiality terms included in written agreements, implied by the nature of the relationship (e.g., attorney–client relationship), or required by fiduciary or regulatory principles (e.g., custody services provided by financial institutions, Codes of Ethics and Informational Barriers applicable to JPMorgan Chase and its affiliates).
Disclosure of a Fund’s portfolio securities as an exception to the Funds’ normal business practice requires the business unit proposing such exception to identify a legitimate business purpose for the disclosure and to submit the proposal to the Fund’s Treasurer for approval following business and legal review. Additionally, no compensation or other consideration is received by a Fund or the Fund’s Adviser, or any other person for these disclosures. The Funds’ Trustees will review annually a list of such entities that have received such information, the frequency of such disclosures and the business purpose therefor. These procedures are designed to address conflicts of interest between the Funds’ shareholders on the one hand and the Fund’s Adviser or any affiliated person of the Fund or such entities on the other hand by creating a structured review and approval process which seeks to ensure that disclosure of information about the Fund’s portfolio securities is in the best interests of the Fund’s shareholders. There can be no assurance, however, that a Fund’s policies and procedures with respect to the disclosure of portfolio holdings information will prevent the misuse of such information by individuals or firms in possession of such information.
In addition to the foregoing, the portfolio holdings of certain of the Adviser’s separately managed account investment strategies and other vehicles advised or sub-advised by the Adviser or its affiliates, which are the same or substantially similar to certain of the J.P. Morgan Funds, are made available on a more timely basis than the time period specified in the applicable prospectus. In some cases, such portfolio holdings are made publicly available on a daily basis. While not expected, it is possible that a recipient of portfolio holdings information for a Fund or other similarly managed account or vehicle could cause harm to a Fund, including by trading ahead of or against a Fund based on the information received. This risk may be higher for the JPMorgan Equity Premium Income Fund, on a daily basis, which discloses its holdings information as of the prior business day. JPMorgan Equity Premium Income Fund may also post on a daily basis certain additional information about the equity linked notes held by the Fund. Each Fund reserves the right to exclude any portion of its holdings from publication or reduce the frequency of disclosure if deemed by the Board or Adviser to be in the best interest of the Fund.
In addition, the portfolio managers of certain Funds-of-Funds and separate accounts have periodic access to risk exposure information such as currency, sector, region, country, asset class, credit quality, volatility characteristics, VaR and stress information, exposure versus benchmarks, duration and ESG ratings of the underlying Funds in which such Funds-of-Funds and separate accounts invest. While such reports do not disclose individual portfolio holdings of the underlying Funds, they are derived from daily portfolio holdings of the underlying Funds. The Adviser has adopted procedures to determine that: (1) ongoing disclosure continues to strike an appropriate balance between the need of the Funds-of-Funds’ and separate accounts’ portfolio managers to have access to such information and protecting an underlying Fund from potentially harmful disclosure and (2) the disclosure of such risk exposure information is unlikely to be harmful to an underlying fund or its shareholders.
Part II - 149
Finally, the Funds release information concerning any and all portfolio holdings when required by law. Such releases may include providing information concerning holdings of a specific security to the issuer of such security. With regard to the Money Market Funds, not later than five business days after the end of each calendar month, each Fund will post detailed information regarding its portfolio holdings, as well as its dollar-weighted average maturity and dollar-weighted average life, as of the last day of that month on the J.P. Morgan Funds’ website and provide a link to the SEC website where the most recent twelve months of publicly available information filed by the Fund may be obtained. In addition, not later than five business days after the end of each calendar month, each Money Market Fund will file a schedule of detailed information regarding its portfolio holdings as of the last day of that month with the SEC. These filings will be publicly available on the J.P. Morgan Funds’ website at www.jpmorganfunds.com and the SEC’s website. Each business day, each money market will make available upon request an uncertified complete schedule of its portfolio holdings as of the prior business day. In addition, each money market fund may post portfolio holdings on the J.P. Morgan Funds’ website or on other external websites. In addition, on each business day, all money market funds will post their level of weekly liquid assets, net flows and market-based NAV per shares as of the prior business day, with a rolling six month history, and the money market funds (other than tax free and municipal money market funds) will post their level of daily liquid assets, with a rolling six month history, as of the prior business day on the J.P. Morgan Funds’ website at www.jpmorganfunds.com. In addition to information on portfolio holdings, no sooner than 10 days after month end, the Funds may post a portfolio characteristics summary to the J.P. Morgan Funds’ website at www.jpmorganfunds.com. In addition, other fund statistical information may be found on the J.P. Morgan Funds’ website from time to time.
PROXY VOTING PROCEDURES AND GUIDELINES
The Board of Trustees has delegated to the Advisers and their affiliated advisers, proxy voting authority with respect to the Funds’ portfolio securities. To ensure that the proxies of portfolio companies are voted in the best interests of the Funds, the Funds’ Board of Trustees has adopted the Adviser’s detailed proxy voting procedures (the “Procedures”) that incorporate guidelines (“Guidelines”) for voting proxies on specific types of issues for the Funds other than the Behavioral Value Fund. Proxy voting for the Behavioral Value Fund has been delegated to Fuller & Thaler, the Fund’s sub-adviser. Fuller & Thaler votes proxies for the Fund in accordance with the proxy voting policies and procedures as described at the end of this section under Fuller & Thaler.
The Adviser and its affiliated advisers are part of a global asset management organization with the capability to invest in securities of issuers located around the globe. Because the regulatory framework and the business cultures and practices vary from region to region, the Guidelines are customized for each region to take into account such variations. Separate Guidelines cover the regions of (1) North America, (2) Europe, Middle East, Africa, Central America and South America (“EMEA”), (3) Asia (ex-Japan) and (4) Japan, respectively. In addition, the Adviser has adopted Sustainable Strategy Proxy Voting Guidelines (“Sustainable Proxy Guidelines”) for sustainable strategies identified on Exhibit A to the Sustainable Proxy Guidelines. The Sustainable Proxy Guidelines replace Section 12 in the North America Guidelines for such sustainable strategies including such Funds as approved by the Board of Trustees. All other sections of the North America Guidelines and other regional Guidelines will continue to apply to such sustainable strategies. The Board of Trustees has adopted the Sustainable Proxy Guidelines for the JPMorgan Sustainable Municipal Income Fund, JPMorgan Small Cap Sustainable Leaders Fund and JPMorgan U.S. Sustainable Leaders Fund.
Notwithstanding the variations among the Guidelines, all of the Guidelines have been designed with the uniform objective of encouraging corporate action that enhances shareholder value consistent with each Fund's objectives and strategies. As a general rule, in voting proxies of a particular security, the Adviser and its affiliated advisers will apply the Guidelines of the region in which the issuer of such security is organized. Except as noted below, proxy voting decisions will be made in accordance with the Guidelines covering a multitude of both routine and non-routine matters that the Adviser and its affiliated advisers have encountered globally, based on many years of collective investment management experience.
To oversee and monitor the proxy-voting process, the Adviser has established a proxy committee and appointed a proxy administrator in each global location where proxies are voted. The primary functions of each proxy committee include review and approval of the Guidelines annually and the provision of advice and recommendations on general proxy-voting matters as well as on specific voting issues. The procedures permit an independent voting service to perform certain services otherwise carried out or coordinated by the proxy administrator.
Part II - 150
Although for many matters the Guidelines specify the votes to be cast, for many others, the Guidelines contemplate case-by-case determinations. In addition, there will undoubtedly be proxy matters that are not contemplated by the Guidelines. For both of these categories of matters and, in the U.S., to override the Guidelines, the Procedures require a certification and review process to be completed before the vote is cast. That process is designed to identify actual or potential material conflicts of interest (between the Fund on the one hand, and the Fund’s investment adviser, principal underwriter or an affiliate of any of the foregoing, on the other hand) and ensure that the proxy vote is cast in the best interests of the Fund. A conflict is deemed to exist when the proxy is for JPMorgan Chase & Co. stock or for J.P. Morgan Funds, or when the proxy administrator has actual knowledge indicating that a JPMorgan affiliate is an investment banker or rendered a fairness opinion with respect to the matter that is the subject of the proxy vote. When such conflicts are identified, the proxy will be voted by an independent third party either in accordance with JPMorgan proxy voting guidelines or by the third party using its own guidelines; provided, however, that the Adviser’s investment professional(s) may request an exception to this process to vote against a proposal rather than referring it to an independent third party (“Exception Request”) where the proxy administrator has actual knowledge indicating that a JPMorgan Chase affiliate is an investment banker or rendered a fairness opinion with respect to the matter that is the subject of the proxy vote. The applicable proxy committee shall review the Exception Request and shall determine whether the Adviser should vote against the proposal or whether such proxy should still be referred to an independent third party due to the potential for additional conflicts or otherwise.
When other types of potential material conflicts of interest are identified, the applicable proxy administrator and, as necessary and applicable, a legal and/or compliance representative from the applicable proxy committee will evaluate the potential conflict of interest and determine whether such conflict actually exists, and if so, will recommend how the Adviser will vote the proxy. In addressing any material conflict, the Adviser may take one or more of the following measures (or other appropriate action): removing certain Adviser personnel from the proxy voting process or “walling off” personnel with knowledge of the conflict to ensure that such personnel do not influence the relevant proxy vote, voting in accordance with any applicable Guideline if the application of the Guideline would objectively result in the casting of a proxy vote in a predetermined manner, or deferring the vote to or obtaining a recommendation from an independent third party, in which case the proxy will be voted by, or in accordance with the recommendation of, the independent third party. In the event that a J.P. Morgan Fund, in the aggregate, holds more than 25% of the outstanding voting securities of an open-end registered investment company or registered unit investment trust that is not managed by JPMIM (a “Non-J.P. Morgan Fund”), the J.P. Morgan Fund will vote its respective securities in a Non-J.P. Morgan Fund in the same proportion as the vote of all other holders of such securities.
The following summarizes some of the more noteworthy types of proxy voting policies of the North America Guidelines:
•
The Adviser considers votes on director nominees on a case-by-case basis. Votes generally will be withheld from directors who: (a) attend less than 75% of board and committee meetings without a valid excuse; (b) adopt or renew a poison pill without shareholder approval; (c) are affiliated outside directors who serve on audit, compensation or nominating committees or are affiliated outside directors and the full board serves on such committees or the company does not have such committees; (d) ignore a shareholder proposal that is approved by a majority of either the shares outstanding or the votes cast based on a review over a consecutive two year time frame; (e) are insiders and affiliated outsiders on boards that are not at least majority independent except, in the case of controlled companies, vote for non-independent directors who serve on committees other than the audit committee; or (f) are CEOs of publicly-traded companies who serve on more than three public boards or serve on more than four public company boards. In addition, votes are generally withheld for directors who serve on committees in certain cases. For example, the Adviser generally withholds votes from audit committee members in circumstances in which there is evidence that there exists material weaknesses in the company’s internal controls. Votes generally are also withheld from directors when there is a demonstrated history of poor performance or inadequate risk oversight or when the board adopts changes to the company’s governing documents without shareholder approval if the changes materially diminish shareholder rights. Votes generally will be withheld from Board chair, lead independent directors, or government committee chairs of publicly traded companies where employees have departed for significant violation of code of conduct without claw back of compensation. In addition, the Adviser generally votes against the chair of the nominating committee if one or more directors remain on the board after having received less than majority of votes cast in the prior election.
Part II - 151
•
The Adviser votes proposals to classify boards on a case-by-case basis, but normally will vote in favor of such proposal if the issuer’s governing documents contain each of eight enumerated safeguards (for example, a majority of the board is composed of independent directors and the nominating committee is composed solely of such directors).
•
The Adviser also considers management poison pill proposals on a case-by-case basis, looking for shareholder-friendly provisions before voting in favor.
•
The Adviser votes against proposals for a super-majority vote to approve a merger.
•
The Adviser considers proposals to increase common and/or preferred shares and to issue shares as part of a debt restructuring plan on a case-by-case basis, taking into account such factors as the extent of dilution and whether the transaction will result in a change in control.
•
The Adviser considers vote proposals with respect to compensation plans on a case-by-case basis. The analysis of compensation plans focuses primarily on the transfer of shareholder wealth (the dollar cost of pay plans to shareholders) and includes an analysis of the structure of the plan and pay practices of other companies in the relevant industry and peer companies. Other matters included in the analysis are the amount of the company’s outstanding stock to be reserved for the award of stock options, whether the exercise price of an option is less than the stock’s fair market value at the date of the grant of the options, and whether the plan provides for the exchange of outstanding options for new ones at lower exercise prices.
•
The Adviser also considers on a case-by-case basis proposals to change an issuer’s state of incorporation, mergers and acquisitions and other corporate restructuring proposals and certain social issue proposals.
•
The Adviser generally votes for management proposals which seek shareholder approval to make the state of incorporation the exclusive forum for disputes if the company is a Delaware corporation; otherwise, the Adviser votes on a case by case basis.
•
The Adviser supports board refreshment, independence, and a diverse skill set for directors. As a matter of principle, the Adviser expects its investee companies to be committed to diversity and inclusiveness in their general recruitment policies as we believe such diversity contributes to the effectiveness of boards. The Adviser will utilize its voting power to bring about change where Boards are lagging in gender and racial/ethnic diversity. The Adviser will generally vote against the chair of the Nominating Committee when the issuer does not disclose the gender or racial and ethnic composition of the Board, with adequate diversity data considered as adequate in instances where individual directors do not wish to disclose personal identification. The Adviser will also generally vote against the chair of the Nominating Committee when the issuer lacks any gender diversity or any racial/ethnic diversity unless there are mitigating factors such as recent retirement of relevant directors, a relatively new public company, and an ongoing search for a director.
•
The Adviser reviews Say on Pay proposals on a case by case basis with additional review of proposals where the issuer’s previous year’s proposal received a low level of support.
The following summarizes some of the more noteworthy types of proxy voting policies of Section 12 Social and Environmental Issues from the North America Guidelines:
•
The Adviser generally encourages a level of reporting on environmental matters that is not unduly costly or burdensome and which does not place the company at a competitive disadvantage, but which provides meaningful information to enable shareholders to evaluate the impact of the company’s environmental policies and practices on its financial performance. In general, the Adviser supports management disclosure practices that are overall consistent with the goals and objective expressed above. Proposals with respect to companies that have been involved in controversies, fines or litigation are expected to be subject to heightened review and consideration.
•
In evaluating how to vote environmental proposals, key considerations may include, but are not limited to, issuer considerations such as asset profile of the company, including whether it is exposed to potentially declining demand for the company’s products or services due to environmental considerations; cash deployments; cost structure of the company, including its position on the cost curve, expected impact of future carbon tax and exposure to high fixed operating costs; corporate behavior of the company; demonstrated capabilities of the company, its strategic planning process, and past performance; current level of disclosure of the company and consistency of disclosure across its industry; and whether the company incorporates environmental
Part II - 152
or social issues in a risk assessment or risk reporting framework. The Adviser may also consider whether peers have received similar proposals and if so, were the responses transparent and insightful; would adoption of the proposal inform and educate shareholders; and have companies that adopted the proposal provided insightful and meaningful information that would allow shareholders to evaluate the long-term risks and performance of the company; does the proposal require disclosure that is already addressed by existing and proposed mandated regulatory requirements or formal guidance at the local, state, or national level or the company’s existing disclosure practices; and does the proposal create the potential for unintended consequences such as a competitive disadvantage.
•
The Adviser votes against the chair of the committee responsible for providing oversight of environmental matters and/or risk where the Adviser believes the company is lagging peers in terms of disclosure, business practices or targets. The Adviser also votes against committee members, lead independent director and/or board chair for companies that have lagged over several years.
•
With regard to social issues, among other factors, the Adviser considers the company’s labor practices, supply chain, how the company supports and monitors those issues, what types of disclosure the company and its peers currently provide, and whether the proposal would result in a competitive disadvantage for the company.
•
The Adviser expects Boards to provide oversight of human capital management which includes the company management of its workforce, use of full time versus part time employees, workforce cost, employee engagement and turnover, talent development, retention and training, compliance record and health and safety. As an engaged and diverse employee base is integral to a company’s ability to innovate, respond to a diverse customer base and engage with diverse communities and deliver shareholder returns, the Adviser will generally support shareholder resolutions seeking the company to disclose data on workforce demographics including diversity, and release of EEO-1 or comparable data where such disclosure is deemed by the Adviser as inadequate.
Sustainable Proxy Guidelines. For the JPMorgan Sustainable Municipal Income Fund, JPMorgan Small Cap Sustainable Leaders Fund and the JPMorgan U.S. Sustainable Leaders Fund, the Sustainable Proxy Guidelines are used in lieu of Section 12 of the North America Guidelines. The following summarizes some of the more noteworthy types of proxy voting policies of the Sustainable Proxy Guidelines:
•
In voting shares of securities under the Sustainable Proxy Guidelines, the Adviser considers good corporate governance, the ethical behavior of corporations and the social and environmental impact of such companies’ actions consistent with the applicable Fund’s objectives and strategies. The Adviser believes that disclosure and benchmarking of performance versus peers can enable an issuer to generate better long-term performance. The Adviser generally encourages reporting that is material, informative and does not place the company at a competitive disadvantage. Disclosure should provide meaningful information that enables shareholders to evaluate the impact of the company’s environmental, social and governance (ESG) policies and practices.
•
In evaluating how to vote to social proposals, the Adviser considers among other items: (1) the company’s business activities, workplace and product safety, labor practices, diversity and equality, and supply chain, (2) how the company supports and monitors these issues, and (3) what types of disclosure the company provides.
•
In evaluating how to vote environmental proposals, the Adviser considers among other items: (1) the company’s business activities, energy efficiency, impact on climate change, water use, toxic emissions, and operations in environmentally sensitive areas, (2) how the company supports and monitors these issues, and (3) what types of disclosure the company provides.
•
In general, the Adviser supports management disclosure practices that are consistent with the goals and objectives of the applicable Fund. Proposals with respect to companies that have been involved in controversies, fines or litigation are expected to be subject to heightened review and consideration. For companies that have demonstrated leadership in disclosure, the Adviser may yet elect to support a shareholder proposal if the Adviser believes that improvement in disclosures will help sustain the leadership, unless there are material adverse consequences to such disclosure.
•
The Sustainable Proxy Guidelines provide a framework for voting on social and environmental proposals. The Adviser notes that there may be cases in which the final vote varies from the
Part II - 153
guidelines due to the fact the Adviser reviews the merits of each proposal individually and considers relevant information in arriving at decisions. The Adviser considers among other items company-specific circumstances, whether or not the company has substantially achieved the stated objective, whether the proposal would be unduly burdensome, whether the proposal itself is well-framed and reasonable, as well as the most up-to-date research and information that is readily accessible to the Adviser as it pertains to the proposal.
•
Generally, the Advisor votes for proposals that seek to improve the representation of women and minorities in the work force.
•
Generally, the Adviser votes against/withholds from individual directors who serve as members of the nominating committee and the board lacks at least one woman and one racially diverse director, and the board is not at least 30 percent diverse.
•
Generally, the Adviser votes for proposals linking executive compensation to material environmental and social factors.
•
Generally, the Adviser votes for proposals requiring reporting on environmental impacts and preparation of reports in accordance with certain external reporting standards.
•
Generally, the Adviser votes for proposals requiring the company to take specific actions to mitigate climate change, including reducing greenhouse gas emissions and developing and using renewable energy sources.
•
Generally, the Adviser votes for proposals requiring disclosure on the company’s land use, including its supply chain, deforestation and degradation.
•
Generally, the Adviser votes for proposals requiring disclosure of political expenditures and lobbying.
Non-U.S. Guidelines. The following summarizes some of the more noteworthy types of proxy voting policies of the EMEA, Asia (Ex-Japan) and Japan Guidelines (collectively, “Non-U.S. Guidelines”):
•
Corporate governance procedures differ among the countries. Because of time constraints and local customs, it is not always possible for the Adviser to receive and review all proxy materials in connection with each item submitted for a vote. Many proxy statements are in foreign languages. Proxy materials are generally mailed by the issuer to the sub-custodian which holds the securities for the client in the country where the portfolio company is organized, and there may not be sufficient time for such materials to be transmitted to the Adviser in time for a vote to be cast. In some countries, proxy statements are not mailed at all, and in some locations, the deadline for voting is two to four days after the initial announcement that a vote is to be solicited and it may not always be possible to obtain sufficient information to make an informed decision in good time to vote.
•
Certain markets require that shares being tendered for voting purposes are temporarily immobilized from trading until after the shareholder meeting has taken place. Elsewhere, notably emerging markets, it may not always be possible to obtain sufficient information to make an informed decision in good time to vote. Some markets require a local representative to be hired in order to attend the meeting and vote in person on our behalf, which can result in considerable cost. The Adviser also considers the cost of voting in light of the expected benefit of the vote. In certain instances, it may sometimes be in the Fund’s best interests to intentionally refrain from voting in certain overseas markets from time to time.
•
The Non-U.S. Guidelines reflect the applicable region’s corporate governance or stewardship codes with respect to corporate governance and proxy voting. For example, the EMEA Guidelines for UK companies are based on the revised UK Corporate Governance Code. If a portfolio company chooses to deviate from the provisions of the UK Corporate Governance Code, the Adviser takes the company’s explanation into account as appropriate, based on the Adviser’s overall assessment of the standards of corporate governance evidenced at the company. For Continental European markets, the Adviser expects companies to comply with local Corporate Governance Codes, where they exist. In markets where a comparable standard does not exist, we use the EMEA Guidelines as the primary basis for voting, while taking local market practice into consideration where applicable. The Japan Guidelines reflect the 2020 revisions to the Japanese Stewardship Code. Likewise, the Asia (Ex-Japan) Guidelines endorse the stewardship principles promoted by different regulators and industry bodies in the region including the Singapore Stewardship Principles for
Part II - 154
Responsible Investors supported by Monetary Authority of Singapore and Singapore Exchange, the Principles for Responsible Ownership issued by the Securities and Futures Commission in Hong Kong, and the Principles of Internal Governance and Asset Stewardship issued by the Financial Services Council of Australia.
•
Where proxy issues concern corporate governance, takeover defense measures, compensation plans, capital structure changes and so forth, the Adviser pays particular attention to management’s arguments for promoting the prospective change.
•
The Non-U.S. Guidelines encourage transparency and disclosure with respect to remuneration reporting as well as processes and policies designed to align compensation with the long-term performance of portfolio companies.
•
In particular, the EMEA Guidelines indicate that the remuneration policy as it relates to senior management should ideally be presented to shareholders for approval with such votes normally occurring every third year. In addition, the EMEA Guidelines describe information that the Adviser expects to be included in remuneration reports including disclosure on amounts paid to executives, alignment between company performance and pay out to executives, disclosure of, among other things, variable incentive targets, levels of achievement and performance awards, information on the ratio of CEO pay to median employee pay.
•
With respect to the Japan Guidelines, the voting decision will be made taking into account matters such as recent trends in the company’s earnings and performance, with the expectation that companies will have a remuneration system comprised of a reasonable mix of fixed and variable (based on short term and medium to long term incentives) compensation. Such Guidelines also support the introduction of clawback clauses in order to prevent excessive risk taking which can negatively impact shareholder value and excessive pay.
•
Where shareholders are able to exercise a binding vote on remuneration policies, the Asia (Ex-Japan) Guidelines reflect the Adviser’s belief that such polices should stand the test of time. The Asia (Ex-Japan) Guidelines further encourage companies to provide information on the ratio of CEO pay to median employee pay and to explain the reasons for changes to the ratio as it unfolds year by year. The Asia (Ex-Japan) Guidelines also highlight information that companies should have with regard to gender pay gaps and indicate how this issue is being addressed.
•
The Adviser is in favor of a unitary board structure of the type found in the United Kingdom as opposed to tiered board structures. Thus, under the EMEA Guidelines, the Adviser will generally vote to encourage the gradual phasing out of tiered board structures, in favor of unitary boards. However, since tiered boards are still very prevalent in markets outside of the United Kingdom, the Non-U.S. Guidelines do not mandate a unitary board structure and local market practice will always be taken into account.
•
The Adviser will use its voting powers to encourage appropriate levels of board independence and diversity, taking into account local market practice.
•
The Adviser will usually vote against discharging the board from responsibility in cases of pending litigation, or if there is evidence of wrongdoing for which the board must be held accountable.
•
The Adviser will vote in favor of increases in capital which enhance a company’s long-term prospects. The Adviser will also vote in favor of the partial suspension of preemptive rights if they are for purely technical reasons (e.g., rights offers which may not be legally offered to shareholders in certain jurisdictions). However, the Adviser will vote against increases in capital which would allow the company to adopt “poison pill” takeover defense tactics, or where the increase in authorized capital would dilute shareholder value in the long term.
•
The Adviser will vote in favor of proposals which will enhance a company’s long-term prospects. The Adviser will vote against an increase in bank borrowing powers which would result in the company reaching an unacceptable level of financial leverage, where such borrowing is expressly intended as part of a takeover defense, or where there is a material reduction in shareholder value.
•
The Adviser will generally vote against anti-takeover devices.
•
The Adviser considers social or environmental issues on a case-by-case basis under the Non-U.S. Guidelines, keeping in mind at all times the best economic interests of its clients. With respect to
Part II - 155
environmental proposals, the Non-U.S. Guidelines indicate that good corporate governance policies should consider the impact of company operations on the environment and the costs of compliance with laws and regulations relating to environmental matters, physical damage to the environment (including the costs of clean-ups and repairs), consumer preferences and capital investments related to climate change. The Non-U.S. Guidelines further encourage a level of environmental reporting that is not unduly costly or burdensome and which does not place the company at a competitive disadvantage, but which provides meaningful information to enable shareholders to evaluate the impact of the company’s environmental policies and practices on its financial performance. With regard to social issues, among other factors, the Adviser considers the company’s labor practices, supply chain, how the company supports and monitors those issues, what types of disclosure the company and its peers currently provided, and whether the proposal would result in a competitive disadvantage for the company.
North American and Non-U.S. Guidelines. The North American and Non-U.S. Guidelines reflect the Adviser’s concerns that there may be restrictions on shareholder participation in a virtual only annual general meeting and believes such meetings should only be held in exceptional circumstances, such as during pandemic, and that companies should explain why it is necessary to hold the meeting in this manner. Under the Guidelines, the Adviser generally votes for management proposal allowing for the convening of shareholder meetings by electronic means, so long as the governing documents do not prohibit in-person meetings.
Proxy Voting Record. In accordance with regulations of the SEC, the Funds’, including the Behavioral Value Fund’s, proxy voting records for the most recent 12-month period ended June 30 are on file with the SEC and are available on the J.P. Morgan Funds’ website at www.jpmorganfunds.com and are on the SEC’s website at www.sec.gov.
Fuller & Thaler.
The policies and procedures used by Fuller & Thaler, the sub-adviser to the Behavioral Value Fund, to determine how to vote proxies relating to the portfolio securities of such Fund are summarized below:
GENERAL
It is the general policy of Fuller & Thaler to exercise its proxy voting authority in a manner that will maintain or enhance shareholder value of the companies in which we have invested client assets. Unless a client specifically reserves the right, in writing, to vote its own proxies, we will vote all proxies in accordance with this policy.
VOTING POLICY
We use the following guidelines in making voting decisions:
Approve (or follow management recommendations on) the following (unless good reason for voting otherwise):
•
Routine corporate matters including:
•
Selection of directors
•
Appointment of auditors
•
An increase in authorized shares where needed for clearly defined business purposes
•
Follow management recommendations on “social” issues
Oppose (in some cases against management recommendations on) the following (unless good reason for voting otherwise):
•
Indemnification of directors and/or officers where such indemnification includes “negligence and gross negligence” in the performance of their fiduciary duties
•
Super-majority voting requirements
•
Anti-takeover proposals which restrict shareholder authority
•
An increase in authorized shares of more than 25% without a stated business purpose
•
Changes in corporate charter that do not have a clearly stated business purpose
Part II - 156
•
Provisions for multi-tiered voting rights
•
Authorizations of “blank check” preferred stock or other capital stock without a stated business purpose
•
“Shareholder rights” provisions which tend to diminish rather than enhance shareholder power
•
“Anti-greenmail” provisions which also restrict shareholder authority
•
Staggered boards of directors
Evaluate the following on a case-by-case basis:
•
Corporate combinations and divestments
•
Shareholder proposals
•
Profit sharing and stock options plans
VOTING PROCESS
Fuller & Thaler has hired an independent third-party vendor, Institutional Shareholder Services Inc. (“ISS”), to assist it in fulfilling its proxy voting obligations. ISS is responsible for collecting proxy information from companies and voting proxies according to our instructions. ISS also provides Fuller & Thaler with proxy recommendations and corporate governance ratings on each ballot. While we may consider such research in determining how to vote on a proxy issue, we vote each proxy on its own merits. Thus, our proxy voting may or may not be consistent with the recommendations of ISS.
On a weekly basis, we:
•
Send a list of the securities held in client accounts to ISS.
•
Download proxy statements.
Each of our portfolio managers is responsible for voting the proxies for securities held in the portfolio manager’s strategy. Proxy voting reports received from ISS are provided to the portfolio managers for review prior to voting. Where Fuller & Thaler becomes aware that an issuer intends to file, or has filed, additional soliciting materials with the SEC after Fuller & Thaler has received ISS’s voting recommendation but before the submission deadline, Fuller & Thaler considers such additional information in its proxy voting. Any changes to the votes made by the portfolio manager are communicated to ISS electronically.
As part of the overall vote review process, each portfolio manager responsible for voting proxies must report any known, material conflict of interest to the Chief Compliance Officer, who will communicate the conflict of interest to the other portfolio managers.
Using information provided by our firm, ISS votes the proxies for each individual account.
On a quarterly basis, ISS provides us with voting summary reports for our client accounts. These reports, and copies of the Proxy Voting Policy, are available to clients upon request.
CONFLICT OF INTEREST POLICY
All proxies are voted solely in the best interests of our clients. Shareholders and employees of Fuller & Thaler will not be unduly influenced by outside sources nor be affected by any conflict of interest regarding the vote of any proxy. Where a proxy proposal raises a material conflict between our interests and a client’s interests, Fuller & Thaler will rely on the recommendation of ISS to vote the proxy. ISS votes based on its pre-determined voting policy developed from internally conducted research on shareholder best practices.
LIMITATIONS
The following are examples of situations where Fuller & Thaler may abstain from voting or from review of proxies:
1.
Terminated Account: Once a client account has been terminated with us in accordance with its investment advisory agreement, we will not vote any proxies received after the termination.
Part II - 157
2.
Limited Value: If we determine that the value of a client’s economic interest or the value of the portfolio holding is indeterminable or insignificant, we may abstain from voting a proxy or alternatively, vote proxies in accordance with ISS recommendations with minimal review of the proxies. We also will not vote proxies received for securities no longer held by the client’s account.
3.
Unmanaged Assets. If a client account contains securities that we do not actively manage, but that are maintained in the account at the client’s request (designated as “Unmanaged Assets”), we will abstain from voting on such securities unless the client directs us in writing to take action with respect to a particular matter.
4.
Securities Lending Programs: When securities are out on loan, they are transferred into the borrower’s name and are voted by the borrower, in its discretion. However, where we determine that a proxy vote (or other shareholder action) is materially important to the client’s account, we may recall the security for purposes of voting.
RECORDKEEPING
Fuller & Thaler will maintain the following proxy related books and records in an easily accessible place for a period of not less than five years from the end of the fiscal year during which the last entry was made on such record, the first two years in an appropriate office of Fuller & Thaler:
i.
Copies of proxy policies and procedures.
ii.
A copy of each proxy statement that Fuller & Thaler receives regarding client securities. Alternatively, Fuller & Thaler may rely on ISS to make and retain a copy of a proxy statement on Fuller & Thaler’s behalf (provided that Fuller & Thaler has obtained an undertaking from ISS to provide a copy of the proxy statement promptly upon request) or may rely on obtaining a copy of a proxy statement from the Commission's Electronic Data Gathering, Analysis, and Retrieval (EDGAR) system.
iii.
A record of each vote cast by Fuller & Thaler on behalf of a client. Alternatively, Fuller& Thaler may rely on a third party to make and retain a record of the vote cast on Fuller & Thaler's behalf (provided that Fuller & Thaler has obtained an undertaking from ISS to provide a copy of the record promptly upon request).
iv.
A copy of any document created by Fuller & Thaler that was material to making a decision on how to vote proxies on behalf of a client or that memorializes the basis for that decision.
v.
A copy of each written client request for information on how Fuller & Thaler voted proxies on behalf of the client, and a copy of any written response by Fuller & Thaler to any (written or oral) client request for information on how Fuller & Thaler voted proxies on behalf of the requesting client.
Please see Books and Records Policy contained in Section 13 of the Compliance Manual for further details.
RESPONSIBLE PARTIES
The Portfolio Managers are responsible for the following:
•
adhering to this policy which includes voting proxies consistently with these guidelines;
•
notifying the Chief Compliance Officer of any conflicts of interest;
•
providing the Portfolio Administrator with a copy of any document that was material to making a voting decision or that memorializes the basis for a decision, if any was created;
•
recommending any policy or procedure changes to the Director of Trading Operations and Chief Compliance Officer.
The Director of Trading Operations and Portfolio Administrator are responsible for adhering to the voting process and maintaining required books and records. They should also recommend any policy or procedure changes to the Portfolio Managers and Chief Compliance Officer.
The Chief Compliance Officer will review this policy and procedures with the Director of Trading Operations, Portfolio Administrator, and other applicable Fuller & Thaler personnel at least annually.
Part II - 158
ADDITIONAL INFORMATION
A Trust is not required to hold a meeting of Shareholders for the purpose of electing Trustees except that (i) a Trust is required to hold a Shareholders’ meeting for the election of Trustees at such time as less than a majority of the Trustees holding office have been elected by Shareholders and (ii) if, as a result of a vacancy on the Board of Trustees, less than two-thirds of the Trustees holding office have been elected by the Shareholders, that vacancy may only be filled by a vote of the Shareholders. In addition, Trustees may be removed from office by a written consent signed by the holders of Shares representing two-thirds of the outstanding Shares of a Trust at a meeting duly called for the purpose, which meeting shall be called and held in accordance with the bylaws of the applicable Trust. Except as set forth above, the Trustees may continue to hold office and may appoint successor Trustees.
As used in a Trust’s Prospectuses and in this SAI, “assets belonging to a Fund” means the consideration received by a Trust upon the issuance or sale of Shares in that Fund, together with all income, earnings, profits, and proceeds derived from the investment thereof, including any proceeds from the sale, exchange, or liquidation of such investments, and any funds or payments derived from any reinvestment of such proceeds, and any general assets of a Trust not readily identified as belonging to a particular Fund that are allocated to that Fund by a Trust’s Board of Trustees. The Board of Trustees may allocate such general assets in any manner it deems fair and equitable. It is anticipated that the factor that will be used by the Board of Trustees in making allocations of general assets to particular Funds will be the relative net asset values of the respective Funds at the time of allocation. Assets belonging to a particular Fund are charged with the direct liabilities and expenses in respect of that Fund, and with a share of the general liabilities and expenses of a Trust not readily identified as belonging to a particular Fund that are allocated to that Fund in proportion to the relative net asset values of the respective Funds at the time of allocation. The timing of allocations of general assets and general liabilities and expenses of a Trust to particular Funds will be determined by the Board of Trustees of a Trust and will be in accordance with generally accepted accounting principles. Determinations by the Board of Trustees of a Trust as to the timing of the allocation of general liabilities and expenses and as to the timing and allocable portion of any general assets with respect to a particular Fund are conclusive.
As used in this SAI and the Prospectuses, the term “majority of the outstanding voting securities” of the Trust, a particular Fund or a particular class of a Fund means the following when the 1940 Act governs the required approval: the affirmative vote of the lesser of (a) more than 50% of the outstanding shares of the Trust, such Fund or such class of such Fund, or (b) 67% or more of the shares of the Trust, such Fund or such class of such Fund present at a meeting at which the holders of more than 50% of the outstanding shares of the Trust, such Fund or such class of such Fund are represented in person or by proxy. Otherwise, the declaration of trust, articles of incorporation or by-laws usually govern the needed approval and generally require that if a quorum is present at a meeting, the vote of a majority of the shares of the Trust, such Fund or such class of such Fund, as applicable, shall decide the question.
Telephone calls to the Funds, the Funds’ service providers or a Financial Intermediary as Financial Intermediary may be recorded. With respect to the securities offered hereby, this SAI and the Prospectuses do not contain all the information included in the Registration Statements of the Trusts filed with the SEC under the 1933 Act and the 1940 Act. Pursuant to the rules and regulations of the SEC, certain portions have been omitted. The Registration Statement including the exhibits filed therewith may be examined at the office of the SEC in Washington, D.C.
Statements contained in this SAI and the Prospectuses concerning the contents of any contract or other document are not necessarily complete, and in each instance, reference is made to the copy of such contract or other document filed as an exhibit to the Registration Statements of the Trusts. Each such statement is qualified in all respects by such reference.
No dealer, salesman or any other person has been authorized to give any information or to make any representations, other than those contained in the Prospectuses and this SAI, in connection with the offer contained therein and, if given or made, such other information or representations must not be relied upon as having been authorized by any of the Trusts, the Funds or JPMDS. The Prospectuses and this SAI do not constitute an offer by any Fund or by JPMDS to sell or solicit any offer to buy any of the securities offered hereby in any jurisdiction to any person to whom it is unlawful for the Funds or JPMDS to make such offer in such jurisdictions.
Part II - 159
APPENDIX A — PURCHASES, REDEMPTIONS AND EXCHANGES
The Funds have established certain procedures and restrictions, subject to change from time to time, for purchase, redemption, and exchange orders, including procedures for accepting telephone instructions and effecting automatic investments and redemptions. The Funds may defer acting on a shareholder’s instructions until it has received them in proper form and in accordance with the requirements described in the Prospectuses.
Subject to the terms of a Fund’s prospectus, an investor may buy (or redeem) shares in certain Funds: (i) through a Financial Intermediary; or (ii) through JPMDS by calling J.P. Morgan Funds Services. Financial Intermediaries may include financial advisors, investment advisers, brokers, financial planners, banks, insurance companies, retirement or 401(k) plan administrators and others, including affiliates of JPMorgan Chase that have entered into an agreement with the Distributor, or, if applicable, an authorized designee of a Financial Intermediary. Upon receipt of any instructions or inquiries by telephone from a shareholder or, if held in a joint account, from either party, or from any person claiming to be the shareholder, and confirmation that the account registration and address given by such person match those on record, a Fund or its agent is authorized, without notifying the shareholder or joint account parties, to carry out the instructions or to respond to the inquiries, consistent with the service options chosen by the shareholder or joint shareholders in his or their latest account application or other written request for services, including purchasing, exchanging, or redeeming shares of such Fund and depositing and withdrawing monies from the bank account specified in the “Bank Account Registration” section of the shareholder’s latest account application or as otherwise properly specified to such Fund in writing. Investors may incur a fee if they effect transactions through a Financial Intermediary.
A “Business Day” with respect to a Fund is any day on which the New York Stock Exchange is open for business. As of the date of this SAI, the New York Stock Exchange observes the following holidays: New Year’s Day, Martin Luther King, Jr. Day, President’s Day, Good Friday, Memorial Day, Juneteenth, Independence Day, Labor Day, Thanksgiving Day and Christmas Day.
The Funds may, at their own option, accept securities in payment for shares. The securities delivered in such a transaction are valued in the same manner as they would be valued for purposes of computing a Fund’s NAV, as described in the section entitled “Net Asset Value.” This is a taxable transaction to the shareholder. Purchases by means of in-kind contributions of securities will only be accepted if a variety of conditions are satisfied, in accordance with policies and procedures approved by the Board of Trustees.
Except as provided in a Fund’s prospectus, and subject to compliance with applicable regulations, each Fund has reserved the right to pay the redemption price of its shares, either totally or partially, by a distribution in-kind of readily marketable portfolio securities (instead of cash). The securities so distributed would be valued at the same amount as that assigned to them in calculating the NAV of the shares being sold. If a shareholder received a distribution in-kind, the shareholder could incur brokerage or other charges in converting the securities to cash. JPMFMFG and UMF have filed an election under 18f-1 under the 1940 Act. The other Trusts have not filed an election under Rule 18f-1. However, the following Funds have previously filed Rule 18f-1 elections: (i) JPMorgan California Tax Free Bond Fund (formerly, J.P. Morgan California Bond Fund), (ii) JPMorgan Tax Aware Equity Fund, (iii) JPMorgan Intermediate Tax Free Bond Fund and JPMorgan New York Tax Free Bond Fund (as former series of Mutual Fund Select Trust), and (iv) JPMorgan International Equity Fund (as former series of Mutual Fund Select Group). These elections carry over and commit these Funds to paying redemptions by a shareholder of record in cash, limited during any 90 day period to the lesser of: (i) $250,000 or (ii) one percent of the net asset value of the Fund at the beginning of such period.
The Money Market Funds reserve the right to waive any investment minimum. With respect to Agency, Capital, Institutional Class and Premier Shares, examples of when, in the Money Market Funds’ discretion, exceptions to the minimum requirements may be made include, but are not limited to, the following: (1) accounts of a parent corporation and its wholly-owned subsidiaries may be aggregated together to meet the minimum requirement; (2) accounts held by an institutional investor in any of the Money Market Funds in JPMT I or JPMT II may be aggregated together to meet the minimum requirement; and (3) an institutional investor may be given a reasonable amount of time to reach the investment minimum for a class. For Agency, Institutional Class and Premier Shares, investors must purchase the Shares directly from the J.P. Morgan Funds through JPMDS to potentially be eligible. In each case, the investors must inform the J.P. Morgan Funds (or their Financial Intermediary in the case of Capital Shares) that they have accounts that they may be eligible for an exception to the investment minimum.
A-1
Exchange Privilege. Shareholders may exchange their shares in a Fund for shares of any other J.P. Morgan Fund as indicated in the Prospectuses that offers such share class. The shareholder will not pay a sales charge for such exchange. The Funds reserve the right to limit the number of exchanges or to refuse an exchange. The Funds may discontinue this exchange privilege at any time.
Shares of a Fund may only be exchanged into another Fund if the account registrations are identical. All exchanges are subject to meeting any investment minimum or eligibility requirements. With respect to exchanges from any Money Market Fund, shareholders must have acquired their shares in such money market fund by exchange from one of the J.P. Morgan non-money market funds or the exchange will be done at relative NAV plus the appropriate sales charge. Any such exchange may create a gain or loss to be recognized for federal income tax purposes. All exchanges are based upon the NAV that is next calculated after the Fund receives your order, provided the exchange out of one Fund must occur before the exchange into the other Fund. The redemption of your shares will be processed at the next calculated net asset value by the Fund whose shares you are redeeming, and your purchase will be processed as of the same time if the Fund into which you wish to exchange also calculates a net asset value at such time or if not, as of such Fund’s next calculated net asset value. The exchange might not be completed on the date on which the order is submitted and, in such case, the proceeds of the redemption may remain uninvested until the exchange is completed. A shareholder that exchanges out of shares of a Fund that accrues a daily dividend, including a money market fund, will accrue a dividend on the day of the redemption. A shareholder that exchanges into shares of a Fund that accrues dividends daily will not accrue a dividend on the day of the purchase. Normally, shares of the Fund to be acquired are purchased on the redemption date, but such purchase may be delayed by either Fund for up to five Business Days if a Fund determines that it would be disadvantaged by an immediate transfer of the proceeds.
With regard to a Money Market Fund, when a fee or a gate is in place, shareholders will not be permitted to exchange into or out of a Money Market Fund.
Redemptions. In general, shares of a Fund may be exchanged or redeemed at net asset value, less any applicable CDSC. The Trust may suspend the right of redemption or postpone the date of payment for Shares for more than seven days (more than one day for the Prime Money Market Fund, U.S. Treasury Plus Money Market Fund, and U.S. Government Money Market Fund) when:
(a)
trading on the Exchange is broadly restricted by the applicable rules and regulations of the SEC;
(b)
the Exchange is closed for other than customary weekend and holiday closing;
(c)
the SEC has by order permitted such suspension; or
(d)
the SEC has declared a market emergency.
With regard to Money Market Funds that do not qualify as Government Money Market Funds, if a Fund’s weekly liquid assets fall below 30% of its total assets, the Fund’s board, in its discretion, may impose liquidity fees of up to 2% of the value of the shares redeemed and/or gates on redemptions. In addition, if a Money Market Fund’s weekly liquid assets fall below 10% of its total assets at the end of any Business Day, the Fund must impose a 1% liquidity fee on shareholder redemptions unless the Fund’s Board of Trustees determines that not doing so is in the best interests of the Fund.
The Board may, in its discretion, terminate a liquidity fee or redemption gate at any time if it believes such action to be in the best interest of the Fund and its shareholders. Also, liquidity fees and redemption gates will automatically terminate at the beginning of the next Business Day once a Fund’s weekly liquid assets reach at least 30% of its total assets. Redemption gates may only last up to 10 Business Days in any 90-day period. When a fee or a gate is in place, the Fund may elect not to permit the purchase of shares or to subject the purchase of shares to certain conditions, which may include affirmation of the purchaser’s knowledge that a fee or a gate is in effect. When a fee or a gate is in place, shareholders will not be permitted to exchange into or out of a Money Market Fund.
With regard to the Money Market Funds, the Board may, in its discretion, permanently suspend redemptions and liquidate if, among other things, a Fund, at the end of a Business Day, has less than 10% of its total assets invested in weekly liquid assets. The Board of the Retail and Government Money Market Funds may suspend redemptions and liquidate if the Board determines that the deviation between its amortized cost price per share and its market-based NAV per share may result in material dilution or other unfair results to investors or existing shareholders.
A-2
Excessive Trading Limits. Market timers may disrupt portfolio management and harm Fund performance. To the extent that a Fund is unable to effectively identify market timers or a Fund does not seek to identify market timers, long-term investors may be adversely affected. The Funds do not authorize market timing and, except for the Funds identified in the Prospectuses, use reasonable efforts to identify market timers. There is no assurance, however, that the Funds will be able to identify and eliminate all market timers. For example, certain accounts include multiple investors and such accounts typically provide the Funds with a net purchase or redemption request on any given day where purchasers of Fund shares and redeemers of Fund shares are netted against one another and the identity of individual purchasers and redeemers whose orders are aggregated are not known by the Funds. For purposes of the application of the excessive trading limitations, J.P. Morgan Funds that invest in other J.P. Morgan Funds will be considered asset allocation programs within the stated exceptions to the excessive trading limits in the Prospectuses.
Additional Information About Class C Shares. The Distributor pays a commission of 1.00% of the offering price on sales of Class C Shares. The Distributor keeps the entire amount of any CDSC the investor pays for Class C Shares.
If an investor redeems Class C Shares and then uses that money to buy Class C Shares of a J.P. Morgan Fund within 90 days of that redemption, the second purchase will be free of a CDSC. Also, the 12b-1 aging will include the investor’s prior months’ holdings, so that the Financial Intermediary will receive the trail sooner.
Class C Conversion Feature. Class C Shares will be converted to Class A Shares (to Morgan Shares for the Money Market Funds) of the same fund in the following instances:
•
Beginning November 14, 2017, Class C Share positions will convert to Class A Shares after 10 years, calculated from the first day of the month of purchase and processed on the tenth Business Day of the anniversary month.
•
If the Class C Shares are held in an account with a third party broker of record are transferred to an account with the Distributor after April 21, 2017, those Class C Shares will be converted to Class A Shares on the tenth Business Day of the month following the transfer.
•
Class C Shares of the Funds (excluding the Money Market Funds) automatically convert to Class A Shares (and thus are then subject to the lower expenses borne by Class A Shares) after the period of time specified in the applicable Prospectuses has elapsed since the date of purchase (the “CDSC Period”), together with the pro-rata portion of all Class C Shares representing dividends and other distributions paid in additional Class C Shares attributable to the Class C Shares then converting. The conversion of Class C Shares will be effected at the relative net asset value per share of the two classes on the tenth Business Day of the month following the tenth anniversary of the original purchase or such other applicable yearly anniversary. At the time of the conversion, the net asset value per share of the Class A Shares may be higher or lower than the net asset value per share of the Class C Shares; as a result, depending on the relative net asset value per share, a shareholder may receive fewer or more Class A Shares than the number of Class C Shares converted.
•
Class C Shares of the Money Market Funds automatically convert to Morgan Shares (and thus are then subject to the lower expenses borne by Morgan Shares) after the CDSC Period, together with the pro-rata portion of all Class C Shares representing dividends and other distributions paid in additional Class C Shares attributable to the Class C Shares then converting. The conversion of Class C Shares will be effected at the relative net asset value per share of the two classes on the tenth Business Day of the month following the tenth anniversary of the original purchase or such other applicable yearly anniversary. At the time of the conversion, the net asset value per share of the Morgan Shares may be higher or lower than the net asset value per share of the Class C Shares; as a result, depending on the relative net asset value per share, a shareholder may receive fewer or more Morgan Shares than the number of Class C Shares converted.
Conversion of Class B Shares. On June 19, 2015, the Funds’ Class B Shares were converted into Class A Shares (into Morgan Shares for the Money Market Funds) of the same Fund, notwithstanding the prior conversion schedule that indicated a later date. No contingent deferred sales charges were assessed in connection with this automatic conversion.
A-3
Systematic Withdrawal Plan. Systematic withdrawals may be made on a monthly, quarterly or annual basis. The applicable Class C CDSC will be deducted from those payments unless such payments are made:
(i) monthly and constitute no more than 1/12 of 10% of your then-current balance in a Fund each month; or
(ii) quarterly and constitute no more than 1/4 of 10% of your then-current balance in a Fund each quarter.
If you withdraw more than the limits stated above in any given systematic withdrawal payment, you will be charged a CDSC for the amount of the withdrawal over the limit for that month or quarter.
For accounts that allow systematic withdrawals only as a fixed dollar amount per month or quarter, the applicable Class C CDSC is waived provided that, on the date of the systematic withdrawal, the fixed dollar amount to be withdrawn, when multiplied by 12 in the case of monthly payments or by four in the case of quarterly payments, does not exceed 10% of your then-current balance in the Fund. If on any given systematic withdrawal date that amount would exceed 10%, you will be charged a CDSC on the entire amount of that systematic withdrawal payment. This calculation is repeated on each systematic withdrawal date.
For accounts that allow systematic withdrawals on a percentage basis, a Class C CDSC will be charged only on that amount of a systematic payment that exceeds the limits set forth above for that month or quarter.
Your current balance in a Fund for purposes of these calculations will be determined by multiplying the number of shares held by the then-current net asset value for shares of the applicable class.
Cut-Off Times for Purchase, Redemption and Exchange Orders. Orders to purchase, exchange or redeem shares accepted by the Funds (or by a Financial Intermediary authorized to accept such orders on behalf of the Funds) by the cut-off times indicated in the Funds’ Prospectuses will be processed at the NAV next calculated after the order is accepted by the Fund or the Financial Intermediary. Under a variety of different types of servicing agreements, if a Financial Intermediary that is authorized to accept purchase, exchange and/or redemption orders from investors on behalf of the Funds accepts orders prior to the cut-off time for orders stated in the Funds’ Prospectuses, the Financial Intermediary may transmit the orders to the Funds by the deadlines stated in the servicing agreements. The deadlines in the servicing agreements are generally later than the order cut-off times stated in the Funds’ Prospectuses.
Additional Information
A Fund may require medallion signature guarantees for changes that shareholders request be made in Fund records with respect to their accounts, including but not limited to, changes in bank accounts, for any written requests for additional account services made after a shareholder has submitted an initial account application to a Fund, and in certain other circumstances described in the Prospectuses. A Fund may also refuse to accept or carry out any transaction that does not satisfy any restrictions then in effect. A medallion signature guarantee may be obtained from an approved bank, broker, savings and loan association or credit union under Rule 17Ad-15 of the Securities Exchange Act.
The Funds reserve the right to change any of these policies at any time and may reject any request to purchase shares at a reduced sales charge.
Investors may incur a fee if they effect transactions through a Financial Intermediary.
A-4
APPENDIX B — DESCRIPTION OF RATINGS
The following is a summary of published ratings by certain Nationally Recognized Statistical Rating Organizations (“NRSROs”). Credit ratings evaluate only the safety of principal and interest payments, not the market value risk of lower quality securities. NRSROs may fail to change credit ratings to reflect subsequent events on a timely basis. Although the Adviser considers security ratings when making investment decisions, it also performs its own investment analysis and does not rely solely on the ratings assigned by NRSROs.
A Fund only purchases securities that meet the rating criteria, if any, described in its Prospectus and/or SAI. The Adviser will look at a security’s rating at the time of investment. If the securities are unrated, the Adviser must determine that they are of comparable quality to rated securities. Subsequent to its purchase by a Fund, a security may cease to be rated or its rating may be reduced below the minimum rating required for purchase by a Fund. The Adviser will consider such an event in determining whether a Fund should continue to hold the security and is not required to sell a security in the event of a downgrade. Securities issued by the U.S. Government and its agencies and instrumentalities are not rated by NRSROs and so the rating of such securities is determined based on the ratings assigned to the issuer by the NRSRO(s) or if unrated, based on the Adviser’s determination of the issuer’s credit quality. The Adviser may also use the ratings assigned by NRSROs to issuers that are issued by non-U.S. governments and their agencies and instrumentalities to determine the rating of such securities.
From time to time, NRSROs may not agree on the credit quality of a security and issuer and assign different ratings. Certain Funds use the NRSROs and methodology described in their prospectuses to determine the credit quality of their investments, including whether a security is in a particular rating category for purposes of the credit quality requirements specified below. For securities that are not rated by the applicable NRSROs, the Adviser must determine that they are of comparable quality to rated securities. If a Fund’s prospectus does not specify the methodology for determining the credit quality of securities that have received different ratings from more than one NRSRO, such securities will be considered investment grade if at least one agency has rated the security investment grade.
Certain Funds are rated by NRSROs. In order to maintain a rating from a rating organization, the Funds may be subject to additional investment restrictions.
DESCRIPTION OF SHORT-TERM CREDIT RATINGS
Standard & Poor’s Financial Services LLC (“S&P”)
An S&P Global Ratings issue credit rating is a forward-looking opinion about the creditworthiness of an obligor with respect to a specific financial obligation, a specific class of financial obligations, or a specific financial program (including ratings on medium-term note programs and commercial paper programs). It takes into consideration the creditworthiness of guarantors, insurers, or other forms of credit enhancement on the obligation and takes into account the currency in which the obligation is denominated. The opinion reflects S&P Global Ratings’ view of the obligor’s capacity and willingness to meet its financial commitments as they come due, and this opinion may assess terms, such as collateral security and subordination, which could affect ultimate payment in the event of default.
Issue credit ratings can be either long-term or short-term. Short-term issue credit ratings are generally assigned to those obligations considered short-term in the relevant market, typically with an original maturity of no more than 365 days. Short-term issue credit ratings are also used to indicate the creditworthiness of an obligor with respect to put features on long-term obligations. Medium-term notes are assigned long-term ratings.
| A-1 |
A short-term obligation rated ‘A-1’ is rated in the highest category by S&P Global Ratings. The obligor’s capacity to meet its financial commitments on the obligation is strong. Within this category, certain obligations are designated with a plus sign (+). This indicates that the obligor’s capacity to meet its financial commitments on these obligations is extremely strong. |
| A-2 |
A short-term obligation rated ‘A-2’ is somewhat more susceptible to the adverse effects of changes in circumstances and economic conditions than obligations in higher rating categories. However, the obligor’s capacity to meet its financial commitments on the obligation is satisfactory. |
| A-3 |
A short-term obligation rated ‘A-3’ exhibits adequate protection parameters. However, adverse economic conditions or changing circumstances are more likely to weaken an obligor’s capacity to meet its financial commitments on the obligation. |
B-1
| B |
A short-term obligation rated ‘B' is regarded as vulnerable and has significant speculative characteristics. The obligor currently has the capacity to meet its financial commitments; however, it faces major ongoing uncertainties that could lead to the obligor's inadequate capacity to meet its financial commitments. |
| C |
A short-term obligation rated ‘C’ is currently vulnerable to nonpayment and is dependent upon favorable business, financial, and economic conditions for the obligor to meet its financial commitments on the obligation. |
| D |
A short-term obligation rated ‘D’ is in default or in breach of an imputed promise. For non-hybrid capital instruments, the ‘D’ rating category is used when payments on an obligation are not made on the date due, unless S&P Global Ratings believes that such payments will be made within any stated grace period. However, any stated grace period longer than five business days will be treated as five business days. The ‘D’ rating also will be used upon the filing of a bankruptcy petition or the taking of a similar action and where default on an obligation is a virtual certainty, for example due to automatic stay provisions. A rating on an obligation is lowered to ‘D’ if it is subject to a distressed debt restructuring. |
Dual Ratings
Dual ratings may be assigned to debt issues that have a put option or demand feature. The first component of the rating addresses the likelihood of repayment of principal and interest as due, and the second component of the rating addresses only the demand feature. The first component of the rating can relate to either a short-term or long-term transaction and accordingly use either short-term or long-term rating symbols. The second component of the rating relates to the put option and is assigned a short-term rating symbol (for example, ‘AAA/A-1’ or ‘A-1+/A-1’). With U.S. municipal short-term demand debt, the U.S. municipal short-term note rating symbols are used for the first component of the rating (for example, ‘SP-1+/A-1+’).
Active Qualifiers (Currently applied and/or outstanding)
L: Ratings qualified with ‘L’ apply only to amounts invested up to federal deposit insurance limits.
P: This suffix is used for issues in which the credit factors, the terms, or both, that determine the likelihood of receipt of payment of principal are different from the credit factors, terms or both that determine the likelihood of receipt of interest on the obligation. The ‘p’ suffix indicates that the rating addresses the principal portion of the obligation only and that the interest is not rated.
Preliminary: Preliminary ratings, with the “prelim” suffix, may be assigned to obligors or obligations, including financial programs, in the circumstances described below. Assignment of a final rating is conditional on the receipt by S&P Global Ratings of appropriate documentation. S&P Global Ratings reserves the right not to issue a final rating. Moreover, if a final rating is issued, it may differ from the preliminary rating.
•
Preliminary ratings may be assigned to obligations, most commonly structured and project finance issues, pending receipt of final documentation and legal opinions.
•
Preliminary ratings may be assigned to obligations that will likely be issued upon the obligor’s emergence from bankruptcy or similar reorganization, based on late-stage reorganization plans, documentation and discussions with the obligor. Preliminary ratings may also be assigned to the obligors. These ratings consider the anticipated general credit quality of the reorganized or post-bankruptcy issuer as well as attributes of the anticipated obligation(s).
•
Preliminary ratings may be assigned to entities that are being formed or that are in the process of being independently established when, in S&P Global Ratings’ opinion, documentation is close to final. Preliminary ratings may also be assigned to the obligations of these entities.
•
Preliminary ratings may be assigned when a previously unrated entity is undergoing a well-formulated restructuring, recapitalization, significant financing or other transformative event, generally at the point that investor or lender commitments are invited. The preliminary rating may be assigned to the entity and to its proposed obligation(s). These preliminary ratings consider the anticipated general credit quality of the obligor, as well as attributes of the anticipated obligation(s), assuming successful completion of the transformative event. Should the transformative event not occur, S&P Global Ratings would likely withdraw these preliminary ratings.
B-2
•
A preliminary recovery rating may be assigned to an obligation that has a preliminary issue credit rating.
t: This symbol indicates termination structures that are designed to honor their contracts to full maturity or, should certain events occur, to terminate and cash settle all their contracts before their final maturity date.
cir: This symbol indicates a counterparty instrument rating (CIR), which is a forward-looking opinion about the creditworthiness of an issuer in a securitization structure with respect to a specific financial obligation to a counterparty (including interest rate swaps, currency swaps, and liquidity facilities). The CIR is determined on an ultimate payment basis; these opinions do not take into account timeliness of payment.
Inactive Qualifiers (No longer applied or outstanding)
*: This symbol indicated that the rating was contingent upon S&P Global Ratings’ receipt of an executed copy of the escrow agreement or closing documentation confirming investments and cash flows. Discontinued use in August 1998.
c: This qualifier was used to provide additional information to investors that the bank may terminate its obligation to purchase tendered bonds if the long-term credit rating of the issuer was lowered to below an investment-grade level and/or the issuer’s bonds were deemed taxable. Discontinued use in January 2001.
G: The letter ‘G’ followed the rating symbol when a fund’s portfolio consisted primarily of direct U.S. government securities.
pi: This qualifier was used to indicate ratings that were based on an analysis of an issuer’s published financial information, as well as additional information in the public domain. Such ratings did not, however, reflect in-depth meetings with an issuer’s management and therefore could have been based on less comprehensive information than ratings without a ‘pi’ suffix. Discontinued use as of December 2014 and as of August 2015 for Lloyd’s Syndicate Assessments.
pr: The letters ‘pr’ indicate that the rating was provisional. A provisional rating assumed the successful completion of a project financed by the debt being rated and indicates that payment of debt service requirements was largely or entirely dependent upon the successful, timely completion of the project. This rating, however, while addressing credit quality subsequent to completion of the project, made no comment on the likelihood of or the risk of default upon failure of such completion.
q: A ‘q’ subscript indicates that the rating is based solely on quantitative analysis of publicly available information. Discontinued use in April 2001.
r: The ‘r’ modifier was assigned to securities containing extraordinary risks, particularly market risks, that are not covered in the credit rating. The absence of an ‘r’ modifier should not be taken as an indication that an obligation would not exhibit extraordinary noncredit-related risks. S&P Global Ratings discontinued the use of the ‘r’ modifier for most obligations in June 2000 and for the balance of obligations (mainly structured finance transactions) in November 2002.
Fitch Ratings (“Fitch”)
A short-term issuer or obligation rating is based in all cases on the short-term vulnerability to default of the rated entity and relates to the capacity to meet financial obligations in accordance with the documentation governing the relevant obligation. Short-term deposit ratings may be adjusted for loss severity. Short-Term Ratings are assigned to obligations whose initial maturity is viewed as “short term” based on market convention (a long-term rating can also be used to rate an issue with short maturity). Typically, this means up to 13 months for corporate, sovereign, and structured obligations, and up to 36 months for obligations in U.S. public finance markets.
| F1 |
HIGHEST SHORT-TERM CREDIT QUALITY. Indicates the strongest intrinsic capacity for timely payment of financial commitments; may have an added “+” to denote any exceptionally strong credit feature. |
| F2 |
GOOD SHORT-TERM CREDIT QUALITY. Good intrinsic capacity for timely payment of financial commitments. |
| F3 |
FAIR SHORT-TERM CREDIT QUALITY. The intrinsic capacity for timely payment of financial commitments is adequate. |
B-3
| B |
SPECULATIVE SHORT-TERM CREDIT QUALITY. Minimal capacity for timely payment of financial commitments, plus heightened vulnerability to near term adverse changes in financial and economic conditions. |
| C |
HIGH SHORT-TERM DEFAULT RISK. Default is a real possibility. |
| RD |
RESTRICTED DEFAULT. Indicates an entity that has defaulted on one or more of its financial commitments, although it continues to meet other financial obligations. Typically applicable to entity ratings only. |
| D |
DEFAULT. Indicates a broad-based default event for an entity, or the default of a short- term obligation. |
Limitations of the Credit Ratings Scale
Specific limitations relevant to the Credit Ratings scale include:
•
The ratings do not predict a specific percentage of default likelihood or failure likelihood over any given time period.
•
The ratings do not opine on the market value of any issuer’s securities or stock, or the likelihood that this value may change.
•
The ratings do not opine on the liquidity of the issuer’s securities or stock.
•
The ratings do not opine on the possible loss severity on an obligation should an issuer (or an obligation with respect to structured finance transactions) default, except in the following two cases:
•
Ratings assigned to individual obligations of issuers in corporate finance, banks, non-bank financial institutions, insurance and covered bonds.
•
In limited circumstances for U.S. public finance obligations where Chapter 9 of the Bankruptcy Code provides reliably superior prospects for ultimate recovery to local government obligations that benefit from a statutory lien on revenues or during the pendency of a bankruptcy proceeding under the Code if there is sufficient visibility on potential recovery prospects.
•
The ratings do not opine on the suitability of an issuer as a counterparty to trade credit.
The ratings do not opine on any quality related to an issuer’s business, operational or financial profile other than the agency‘s opinion on its relative vulnerability to default or in the case of bank Viability Ratings on its relative vulnerability to failure. For the avoidance of doubt, not all defaults will be considered a default for rating purposes. Typically, a default relates to a liability payable to an unaffiliated, outside investor.
The ratings do not opine on any quality related to a transaction’s profile other than the agency’s opinion on the relative vulnerability to default of an issuer and/or of each rated tranche or security.
The ratings do not predict a specific percentage of extraordinary support likelihood over any given period.
In the case of bank Support Ratings and Support Rating Floors, the ratings do not opine on any quality related to an issuer’s business, operational or financial profile other than the agency’s opinion on its relative likelihood of receiving external extraordinary support.
The ratings do not opine on the suitability of any security for investment or any other purposes.
Moody’s Investors Service, Inc. (“Moody’s”)
Moody’s global short-term rating scales are forward-looking opinions of the relative credit risks of financial obligations issued by non-financial corporates, financial institutions, structured finance vehicles, project finance vehicles and public sector entities. Moody’s short-term ratings, unlike its long-term ratings, apply to an individual issuer’s capacity to repay all short-term obligations rather than to specific short-term borrowing programs. Once assigned to an issuer, a short-term rating is global in scope; it applies to all the issuer’s senior, unsecured obligations with an original maturity of less than one year regardless of the currency or market in which the obligations are issued. An exception to the global nature of these ratings occurs if an issuer’s rating is supported by another entity through vehicles such as a letter of credit or guarantee.
B-4
Moody’s employs the following designations to indicate the relative repayment ability of rated issuers:
| P-1 |
Ratings of Prime-1 reflect a superior ability to repay short-term debt obligations. |
| P-2 |
Ratings of Prime-2 reflect a strong ability to repay short-term debt obligations. |
| P-3 |
Ratings of Prime-3 reflect an acceptable ability to repay short-term obligations. |
| NP |
Issuers (or supporting institutions) rated Not Prime do not fall within any of the Prime rating categories. |
DBRS Morningstar
The DBRS Morningstar short-term debt rating scale provides an opinion on the risk that an issuer will not meet its short-term financial obligations in a timely manner. Ratings are based on quantitative and qualitative considerations relevant to the issuer and the relative ranking of claims. The R-1 and R-2 rating categories are further denoted by the subcategories “(high),” “(middle),” and “(low).”
| R-1 (high) |
Highest credit quality. The capacity for the payment of short-term financial obligations as they fall due is exceptionally high. Unlikely to be adversely affected by future events. |
| R-1 (middle) |
Superior credit quality. The capacity for the payment of short-term financial obligations as they fall due is very high. Differs from R-1 (high) by a relatively modest degree. Unlikely to be significantly vulnerable to future events. |
| R-1 (low) |
Good credit quality. The capacity for the payment of short-term financial obligations as they fall due is substantial. Overall strength is not as favorable as higher rating categories. May be vulnerable to future events, but qualifying negative factors are considered manageable. |
| R-2 (high) |
Upper end of adequate credit quality. The capacity for the payment of short-term financial obligations as they fall due is acceptable. May be vulnerable to future events. |
| R-2 (middle) |
Adequate credit quality. The capacity for the payment of short-term financial obligations as they fall due is acceptable. May be vulnerable to future events or may be exposed to other factors that could reduce credit quality. |
| R-2 (low) |
Lower end of adequate credit quality. The capacity for the payment of short-term financial obligations as they fall due is acceptable. May be vulnerable to future events. A number of challenges are present that could affect the issuer’s ability to meet such obligations. |
| R-3 |
Lowest end of adequate credit quality. There is a capacity for the payment of short-term financial obligations as they fall due. May be vulnerable to future events and the certainty of meeting such obligations could be impacted by a variety of developments. |
| R-4 |
Speculative credit quality. The capacity for the payment of short-term financial obligations as they fall due is uncertain. |
| R-5 |
Highly speculative credit quality. There is a high level of uncertainty as to the capacity to meet short-term financial obligations as they fall due. |
| D |
When the issuer has filed under any applicable bankruptcy, insolvency or winding up statute or there is a failure to satisfy an obligation after the exhaustion of grace periods, a downgrade to D may occur. DBRS Morningstar may also use SD (Selective Default) in cases where only some securities are impacted, such as the case of a “distressed exchange.” |
DESCRIPTION OF LONG-TERM CREDIT RATINGS
S&P
Long-Term Issue Credit Ratings
Issue credit ratings are based, in varying degrees, on S&P Global Ratings’ analysis of the following considerations:
•
The likelihood of payment — the capacity and willingness of the obligor to meet its financial commitments on an obligation in accordance with the terms of the obligation;
•
The nature and provisions of the financial obligation, and the promise we impute; and
B-5
•
The protection afforded by, and relative position of, the financial obligation in the event of a bankruptcy, reorganization, or other arrangement under the laws of bankruptcy and other laws affecting creditors’ rights.
An issue rating is an assessment of default risk, but may incorporate an assessment of relative seniority or ultimate recovery in the event of default. Junior obligations are typically rated lower than senior obligations, to reflect lower priority in bankruptcy, as noted above. (Such differentiation may apply when an entity has both senior and subordinated obligations, secured and unsecured obligations, or operating company and holding company obligations.)
| AAA |
An obligation rated ‘AAA’ has the highest rating assigned by S&P Global Ratings. The obligor’s capacity to meet its financial commitments on the obligation is extremely strong. |
| AA |
An obligation rated ‘AA’ differs from the highest-rated obligations only to a small degree. The obligor’s capacity to meet its financial commitments on the obligation is very strong. |
| A |
An obligation rated ‘A’ is somewhat more susceptible to the adverse effects of changes in circumstances and economic conditions than obligations in higher-rated categories. However, the obligor’s capacity to meet its financial commitments on the obligation is still strong. |
| BBB |
An obligation rated ‘BBB’ exhibits adequate protection parameters. However, adverse economic conditions or changing circumstances are more likely to weaken the obligor’s capacity to meet its financial commitments on the obligation. |
| BB,B,CCC,CC and C |
Obligations rated ‘BB’, ‘B’, ‘CCC’, ‘CC’, and ‘C’ are regarded as having significant speculative characteristics. ‘BB’ indicates the least degree of speculation and ‘C’ the highest. While such obligations will likely have some quality and protective characteristics, these may be outweighed by large uncertainties or major exposure to adverse conditions. |
| BB |
An obligation rated ‘BB’ is less vulnerable to nonpayment than other speculative issues. However, it faces major ongoing uncertainties or exposure to adverse business, financial, or economic conditions that could lead to the obligor’s inadequate capacity to meet its financial commitments on the obligation. |
| B |
An obligation rated ‘B’ is more vulnerable to nonpayment than obligations rated ‘BB’, but the obligor currently has the capacity to meet its financial commitments on the obligation. Adverse business, financial, or economic conditions will likely impair the obligor’s capacity or willingness to meet its financial commitments on the obligation. |
| CCC |
An obligation rated ‘CCC’ is currently vulnerable to nonpayment, and is dependent upon favorable business, financial, and economic conditions for the obligor to meet its financial commitments on the obligation. In the event of adverse business, financial, or economic conditions, the obligor is not likely to have the capacity to meet its financial commitments on the obligation. |
| CC |
An obligation rated ‘CC’ is currently highly vulnerable to nonpayment. The ‘CC’ rating is used when a default has not yet occurred but S&P Global Ratings expects default to be a virtual certainty, regardless of the anticipated time to default. |
| C |
An obligation rated ‘C’ is currently highly vulnerable to nonpayment, and the obligation is expected to have lower relative seniority or lower ultimate recovery compared with obligations that are rated higher. |
| D |
An obligation rated ‘D’ is in default or in breach of an imputed promise. For non-hybrid capital instruments, the ‘D’ rating category is used when payments on an obligation are not made on the date due, unless S&P Global Ratings believes that such payments will be made within five business days in the absence of a stated grace period or within the earlier of the stated grace period or 30 calendar days. The ‘D’ rating also will be used upon the filing of a bankruptcy petition or the taking of similar action and where default on an obligation is a virtual certainty, for example due to automatic stay provisions. A rating on an obligation is lowered to ‘D’ if it is subject to a distressed debt restructuring. |
Plus (+) or Minus (-): The ratings from AA to CCC may be modified by the addition of a plus (+) or minus (-) sign to show relative standing within the rating categories.
B-6
Fitch
Rated entities in a number of sectors, including financial and non-financial corporations, sovereigns, insurance companies, and certain sectors within public finance, are generally assigned Issuer Default Ratings (IDRs). IDRs are also assigned to certain entities or enterprises in global infrastructure, project finance and public finance. IDRs opine on an entity’s relative vulnerability to default (including by way of a distressed debt exchange) on financial obligations. The threshold default risk addressed by the IDR is generally that of the financial obligations whose non-payment would best reflect the uncured failure of that entity. As such, IDRs also address relative vulnerability to bankruptcy, administrative receivership or similar concepts.
In aggregate, IDRs provide an ordinal ranking of issuers based on the agency’s view of their relative vulnerability to default, rather than a prediction of a specific percentage likelihood of default.
| AAA |
HIGHEST CREDIT QUALITY. ‘AAA’ ratings denote the lowest expectation of default risk. They are assigned only in cases of exceptionally strong capacity for payment of financial commitments. This capacity is highly unlikely to be adversely affected by foreseeable events. |
| AA |
VERY HIGH CREDIT QUALITY. ‘AA’ ratings denote expectations of very low default risk. They indicate very strong capacity for payment of financial commitments. This capacity is not significantly vulnerable to foreseeable events. |
| A |
HIGH CREDIT QUALITY. ‘A’ ratings denote expectations of low default risk. The capacity for payment of financial commitments is considered strong. This capacity may, nevertheless, be more vulnerable to adverse business or economic conditions than is the case for higher ratings. |
| BBB |
GOOD CREDIT QUALITY. ‘BBB’ ratings indicate that expectations of default risk are currently low. The capacity for payment of financial commitments is considered adequate, but adverse business or economic conditions are more likely to impair this capacity. |
| BB |
SPECULATIVE. ‘BB’ ratings indicate an elevated vulnerability to default risk, particularly in the event of adverse changes in business or economic conditions over time; however, business or financial flexibility exists that supports the servicing of financial commitments. |
| B |
HIGHLY SPECULATIVE. ‘B’ ratings indicate that material default risk is present, but a limited margin of safety remains. Financial commitments are currently being met; however, capacity for continued payment is vulnerable to deterioration in the business and economic environment. |
| CCC |
SUBSTANTIAL CREDIT RISK. Default is a real possibility. |
| CC |
VERY HIGH LEVELS OF CREDIT RISK. Default of some kind appears probable. |
| C |
NEAR DEFAULT. A default or default-like process has begun, or the issuer is in standstill, or for a closed funding vehicle, payment capacity is irrevocably impaired. Conditions that are indicative of a ‘C’ category rating for an issuer include: |
| |
•the issuer has entered into a grace or cure period following non-payment of a material financial obligation; •the issuer has entered into a temporary negotiated waiver or standstill agreement following a payment default on a material financial obligation; •the formal announcement by the issuer or their agent of a distressed debt exchange; •a closed financing vehicle where payment capacity is irrevocably impaired such that it is not expected to pay interest and/or principal in full during the life of the transaction, but where no payment default is imminent. |
| RD |
RESTRICTED DEFAULT. ‘RD’ ratings indicate an issuer that in Fitch’s opinion has experienced: |
B-7
| |
•an uncured payment default or distressed debt exchange on a bond, loan or other material financial obligation, but •has not entered into bankruptcy filings, administration, receivership, liquidation or other formal winding-up procedure, and •has not otherwise ceased operating. This would include: •the selective payment default on a specific class or currency of debt; •the uncured expiry of any applicable grace period, cure period or default forbearance period following a payment default on a bank loan, capital markets security or other material financial obligation; •the extension of multiple waivers or forbearance periods upon a payment default on one or more material financial obligations, either in series or in parallel; ordinary execution of a distressed debt exchange on one or more material financial obligations. |
| D |
DEFAULT. ‘D’ ratings indicate an issuer that in Fitch Ratings’ opinion has entered into bankruptcy filings, administration, receivership, liquidation or other formal winding-up procedure or that has otherwise ceased business. |
Default ratings are not assigned prospectively to entities or their obligations; within this context, non-payment on an instrument that contains a deferral feature or grace period will generally not be considered a default until after the expiration of the deferral or grace period, unless a default is otherwise driven by bankruptcy or other similar circumstance, or by a distressed debt exchange.
In all cases, the assignment of a default rating reflects the agency’s opinion as to the most appropriate rating category consistent with the rest of its universe of ratings, and may differ from the definition of default under the terms of an issuer’s financial obligations or local commercial practice.
Limitations of the Credit Rating Scale:
Specific limitations relevant to the credit rating scale are listed under Description of Short-Term Credit Ratings section.
Moody’s
Long-Term Obligation Ratings
Moody’s long-term rating scales are forward-looking opinions of the relative credit risks of financial obligations issued by non-financial corporates, financial institutions, structured finance vehicles, project finance vehicles and public sector entities. Moody’s long-term obligation ratings are opinions of the relative credit risk of fixed-income obligations with an original maturity of one year or more. They address the possibility that a financial obligation will not be honored as promised. Such ratings reflect both the likelihood of default and any financial loss suffered in the event of default.
| Aaa |
Obligations rated Aaa are judged to be of the highest quality, with minimal risk. |
| Aa |
Obligations rated Aa are judged to be of high quality and are subject to very low credit risk. |
| A |
Obligations rated A are judged to be upper-medium-grade and are subject to low credit risk. |
| Baa |
Obligations rated Baa are subject to moderate credit risk. They are considered medium- grade and as such may possess certain speculative characteristics. |
| Ba |
Obligations rated Ba are judged to have speculative elements and are subject to substantial credit risk. |
| B |
Obligations rated B are considered speculative and are subject to high credit risk. |
| Caa |
Obligations rated Caa are judged to be of poor standing and are subject to very high credit risk. |
| Ca |
Obligations rated Ca are highly speculative and are likely in, or very near, default, with some prospect of recovery in principal and interest. |
| C |
Obligations rated C are the lowest-rated class of bonds and are typically in default, with little prospect for recovery of principal or interest. |
B-8
Moody’s appends numerical modifiers, 1, 2, and 3 to each generic rating classification from Aa through Caa. The modifier 1 indicates that the obligation ranks in the higher end of its generic rating category; the modifier 2 indicates a mid-range ranking; and the modifier 3 indicates a ranking in the lower end of that generic rating category.
DBRS Morningstar
Long-Term Obligations
The DBRS Morningstar long-term credit ratings provides opinions on the risk of default. DBRS Morningstar considers risk of default to be the risk that an issuer will fail to satisfy the financial obligations in accordance with the terms under which a long-term obligation has been issued. Ratings are based on quantitative and qualitative considerations relevant to the issuer, and the relative ranking of claims. All rating categories other than AAA and D also contain subcategories “(high)” and “(low).” The absence of either a “(high)” or “(low)” designation indicates the credit rating is in the middle of the category.
| AAA |
Highest credit quality. The capacity for the payment of financial obligations is exceptionally high and unlikely to be adversely affected by future events. |
| AA |
Superior credit quality. The capacity for the payment of financial obligations is considered high. Credit quality differs from AAA only to a small degree. Unlikely to be significantly vulnerable to future events. |
| A |
Good credit quality. The capacity for the payment of financial obligations is substantial, but of lesser credit quality than AA. May be vulnerable to future events, but qualifying negative factors are considered manageable. |
| BBB |
Adequate credit quality. The capacity for the payment of financial obligations is considered acceptable. May be vulnerable to future events. |
| BB |
Speculative, non-investment grade credit quality. The capacity for the payment of financial obligations is uncertain. Vulnerable to future events. |
| B |
Highly speculative credit quality. There is a high level of uncertainty as to the capacity to meet financial obligations. |
| CCC/CC/C |
Very highly speculative credit quality. In danger of defaulting on financial obligations. There is little difference between these three categories, although CC and C ratings are normally applied to obligations that are seen as highly likely to default, or subordinated to obligations rated in the CCC to B range. Obligations in respect of which default has not technically taken place but is considered inevitable may be rated in the C category. |
| D |
When the issuer has filed under any applicable bankruptcy, insolvency or winding up statute or there is a failure to satisfy an obligation after the exhaustion of grace periods, a downgrade to D may occur. DBRS Morningstar may also use SD (Selective Default) in cases where only some securities are impacted, such as the case of a “distressed exchange.” |
DESCRIPTION OF INSURANCE RATINGS
S&P
Insurer Financial Strength Rating Definitions
An S&P Global Ratings insurer financial strength rating is a forward-looking opinion about the financial security characteristics of an insurance organization with respect to its ability to pay under its insurance policies and contracts in accordance with their terms. Insurer financial strength ratings are also assigned to health maintenance organizations and similar health plans with respect to their ability to pay under their policies and contracts in accordance with their terms.
This opinion is not specific to any particular policy or contract, nor does it address the suitability of a particular policy or contract for a specific purpose or purchaser. Furthermore, the opinion does not take into account deductibles, surrender or cancellation penalties, timeliness of payment, nor the likelihood of the use of a defense such as fraud to deny claims.
Insurer financial strength ratings do not refer to an organization’s ability to meet nonpolicy (i.e. debt) obligations. Assignment of ratings to debt issued by insurers or to debt issues that are fully or partially supported by insurance policies, contracts, or guarantees is a separate process from the determination of
B-9
insurer financial strength ratings, and it follows procedures consistent with those used to assign an issue credit rating. An insurer financial strength rating is not a recommendation to purchase or discontinue any policy or contract issued by an insurer.
Insurer Financial Strength Ratings
| AAA |
An insurer rated ‘AAA’ has extremely strong financial security characteristics. ‘AAA’ is the highest insurer financial strength rating assigned by S&P Global Ratings. |
| AA |
An insurer rated ‘AA’ has very strong financial security characteristics, differing only slightly from those rated higher. |
| A |
An insurer rated ‘A’ has strong financial security characteristics, but is somewhat more likely to be affected by adverse business conditions than are insurers with higher ratings. |
| BBB |
An insurer rated ‘BBB’ has good financial security characteristics, but is more likely to be affected by adverse business conditions than are higher-rated insurers. |
| BB, B, CCC, and CC |
An insurer rated ‘BB’ or lower is regarded as having vulnerable characteristics that may outweigh its strengths, ‘BB’ indicates the least degree of vulnerability within the range and ‘CC’ the highest. |
| BB |
An insurer rated ‘BB’ has marginal financial security characteristics. Positive attributes exist, but adverse business conditions could lead to insufficient ability to meet financial commitments. |
| B |
An insurer rated ‘B’ has weak financial security characteristics. Adverse business conditions will likely impair its ability to meet financial commitments. |
| CCC |
An insurer rated ‘CCC’ has very weak financial security characteristics, and is dependent on favorable business conditions to meet financial commitments. |
| CC |
An insurer rated ‘CC’ has extremely weak financial security characteristics and is likely not to meet some of its financial commitments. |
| SD and D |
An insurer rated ‘SD’ (selective default) or ‘D’ is in default on one or more of its insurance policy obligations. The ‘D’ rating also will be used upon the filing of a bankruptcy petition or the taking of similar action if payments on a policy obligation are at risk. A ‘D’ rating is assigned when S&P Global Ratings believes that the default will be a general default and that the obligor will fail to pay substantially all of its obligations in full in accordance with the policy terms. An ‘SD’ rating is assigned when S&P Global Ratings believes that the insurer has selectively defaulted on a specific class of policies but it will continue to meet its payment obligations on other classes of obligations. An ‘SD’ includes the completion of a distressed debt restructuring. Claim denials due to lack of coverage or other legally permitted defenses are not considered defaults. |
Ratings from ‘AA’ to ‘CCC’ may be modified by the addition of a plus (+) or minus (-) sign to show relative standing within the rating categories.
Fitch
Insurer Financial Strength Ratings
The Insurer Financial Strength (IFS) Rating provides an assessment of the financial strength of an insurance organization. The IFS Rating is assigned to the insurance company’s policyholder obligations, including assumed reinsurance obligations and contract holder obligations, such as guaranteed investment contracts. The IFS Rating reflects both the ability of the insurer to meet these obligations on a timely basis, and expected recoveries received by claimants in the event the insurer stops making payments or payments are interrupted, due to either the failure of the insurer or some form of regulatory intervention. In the context of the IFS Rating, the timeliness of payments is considered relative to both contract and/or policy terms but also recognizes the possibility of reasonable delays caused by circumstances common to the insurance industry, including claims reviews, fraud investigations and coverage disputes.
The IFS Rating does not encompass policyholder obligations residing in separate accounts, unit-linked products or segregated funds, for which the policyholder bears investment or other risks. However, any guarantees provided to the policyholder with respect to such obligations are included in the IFS Rating.
B-10
Expected recoveries are based on the agency’s assessments of the sufficiency of an insurance company’s assets to fund policyholder obligations, in a scenario in which payments have ceased or been interrupted. Accordingly, expected recoveries exclude the impact of recoveries obtained from any government sponsored guaranty or policyholder protection funds. Expected recoveries also exclude the impact of collateralization or security, such as letters of credit or trusteed assets, supporting select reinsurance obligations.
IFS Ratings can be assigned to insurance and reinsurance companies in any insurance sector, including the life & annuity, non-life, property/casualty, health, mortgage, financial guaranty, residual value and title insurance sectors, as well as to managed care companies such as health maintenance organizations.
The IFS Rating uses the same symbols used by the agency for its International and National credit ratings of long-term or short-term debt issues. However, the definitions associated with the ratings reflect the unique aspects of the IFS Rating within an insurance industry context.
Obligations for which a payment interruption has occurred due to either the insolvency or failure of the insurer or some form of regulatory intervention will generally be rated between ‘B’ and ‘C’ on the Long-Term IFS Rating scales (both International and National). International Short-Term IFS Ratings assigned under the same circumstances will align with the insurer’s International Long-Term IFS Rating.
Long-Term International IFS Ratings
The following rating scale applies to foreign currency and local currency ratings. Ratings of ‘BBB-’ and higher are considered to be “secure,” and those of ‘BB+’ and lower are considered to be “vulnerable.”
| AAA |
EXCEPTIONALLY STRONG. ‘AAA’ IFS Ratings denote the lowest expectation of ceased or interrupted payments. They are assigned only in the case of exceptionally strong capacity to meet policyholder and contract obligations. This capacity is highly unlikely to be adversely affected by foreseeable events. |
| AA |
VERY STRONG. ‘AA’ IFS Ratings denote a very low expectation of ceased or interrupted payments. They indicate very strong capacity to meet policyholder and contract obligations. This capacity is not significantly vulnerable to foreseeable events. |
| A |
STRONG. ‘A’ IFS Ratings denote a low expectation of ceased or interrupted payments. They indicate strong capacity to meet policyholder and contract obligations. This capacity may, nonetheless, be more vulnerable to changes in circumstances or in economic conditions than is the case for higher ratings. |
| BBB |
GOOD. ‘BBB’ IFS Ratings indicate that there is currently a low expectation of ceased or interrupted payments. The capacity to meet policyholder and contract obligations on a timely basis is considered adequate, but adverse changes in circumstances and economic conditions are more likely to impact this capacity. |
| BB |
MODERATELY WEAK. ‘BB’ IFS Ratings indicate that there is an elevated vulnerability to ceased or interrupted payments, particularly as the result of adverse economic or market changes over time. However, business or financial alternatives may be available to allow for policyholder and contract obligations to be met in a timely manner. |
| B |
WEAK. ‘B’ IFS Ratings indicate two possible conditions. If obligations are still being met on a timely basis, there is significant risk that ceased or interrupted payments could occur in the future, but a limited margin of safety remains. Capacity for continued timely payments is contingent upon a sustained, favorable business and economic environment, and favorable market conditions. Alternatively, a ‘B’ IFS Rating is assigned to obligations that have experienced ceased or interrupted payments, but with the potential for extremely high recoveries. Such obligations would possess a recovery assessment of ‘RR1’ (Outstanding). |
| CCC |
VERY WEAK. ‘CCC’ IFS Ratings indicate two possible conditions. If obligations are still being met on a timely basis, there is a real possibility that ceased or interrupted payments could occur in the future. Capacity for continued timely payments is solely reliant upon a sustained, favorable business and economic environment, and favorable market conditions. Alternatively, a ‘CCC’ IFS Rating is assigned to obligations that have experienced ceased or interrupted payments, and with the potential for average to superior recoveries. Such obligations would possess a recovery assessment of ‘RR2’ (Superior), ‘RR3’ (Good), and ‘RR4’ (Average). |
B-11
| CC |
EXTREMELY WEAK. ‘CC’ IFS Ratings indicate two possible conditions. If obligations are still being met on a timely basis, it is probable that ceased or interrupted payments will occur in the future. Alternatively, a ‘CC’ IFS Rating is assigned to obligations that have experienced ceased or interrupted payments, with the potential for average to below-average recoveries. Such obligations would possess a recovery assessment of ‘RR4’ (Average) or ‘RR5’ (Below Average). |
| C |
DISTRESSED. ‘C’ IFS Ratings indicate two possible conditions. If obligations are still being met on a timely basis, ceased or interrupted payments are imminent. Alternatively, a ‘C’ IFS Rating is assigned to obligations that have experienced ceased or interrupted payments, and with the potential for below average to poor recoveries. Such obligations would possess a recovery assessment of ‘RR5’ (Below Average) or ‘RR6’ (Poor). |
Short-Term IFS Ratings
A Short-Term Insurer Financial Strength Rating (ST-IFS Rating) provides an assessment of the near-term financial health of an insurance organization and its capacity to meet senior obligations to policyholders and contract holders that would be expected to be due within one year. The analysis supporting the ST-IFS Rating encompasses all of the factors considered within the context of the IFS Rating, but with greater weight given to an insurer’s near-term liquidity, financial flexibility and regulatory solvency characteristics, and less weight given to longer-term issues such as competitiveness and earnings trends.
The agency will only assign a ST-IFS Rating to insurers that also have been assigned an IFS Rating. Currently, ST-IFS Ratings are used primarily by U.S. life insurance companies that sell short-term funding agreements.
The ST-IFS Rating uses the same international ratings scale used by the agency for short-term debt and issuer ratings.
| F1 |
Insurers are viewed as having a strong capacity to meet their near-term obligations. When an insurer rated in this rating category is designated with a (+) sign, it is viewed as having a very strong capacity to meet near-term obligations. |
| F2 |
Insurers are viewed as having a good capacity to meet their near-term obligations. |
| F3 |
Insurers are viewed as having an adequate capacity to meet their near-term obligations. |
| B |
Insurers are viewed as having a weak capacity to meet their near-term obligations. |
| C |
Insurers are viewed as having a very weak capacity to meet their near-term obligations. |
Recovery Ratings
Recovery Ratings are assigned to selected individual securities and obligations, most frequently for individual obligations of corporate finance issuers with IDRs in speculative grade categories.
Among the factors that affect recovery rates for securities are the collateral, the seniority relative to other obligations in the capital structure (where appropriate), and the expected value of the company or underlying collateral in distress.
The Recovery Rating scale is based on the expected relative recovery characteristics of an obligation upon the curing of a default, emergence from insolvency or following the liquidation or termination of the obligor or its associated collateral.
Recovery Ratings are an ordinal scale and do not attempt to precisely predict a given level of recovery. As a guideline in developing the rating assessments, the agency employs broad theoretical recovery bands in its ratings approach based on historical averages and analytical judgement, but actual recoveries for a given security may deviate materially from historical averages.
| RR1 |
OUTSTANDING RECOVERY PROSPECTS GIVEN DEFAULT. ‘RR1’ rated securities have characteristics consistent with securities historically recovering 91%–100% of current principal and related interest. |
| RR2 |
SUPERIOR RECOVERY PROSPECTS GIVEN DEFAULT. ‘RR2’ rated securities have characteristics consistent with securities historically recovering 71%–90% of current principal and related interest. |
B-12
| RR3 |
GOOD RECOVERY PROSPECTS GIVEN DEFAULT. ‘RR3’ rated securities have characteristics consistent with securities historically recovering 51%–70% of current principal and related interest. |
| RR4 |
AVERAGE RECOVERY PROSPECTS GIVEN DEFAULT. ‘RR4’ rated securities have characteristics consistent with securities historically recovering 31%–50% of current principal and related interest. |
| RR5 |
BELOW AVERAGE RECOVERY PROSPECTS GIVEN DEFAULT. ‘RR5’ rated securities have characteristics consistent with securities historically recovering 11%– 30% of current principal and related interest. |
| RR6 |
POOR RECOVERY PROSPECTS GIVEN DEFAULT. ‘RR6’ rated securities have characteristics consistent with securities historically recovering 0%–10% of current principal and related interest. |
Limitations of the Recovery Ratings Scale
Specific limitations relevant to the Recovery Ratings scale include:
•
The ratings do not predict a specific percentage of recovery should a default occur.
•
The ratings do not opine on the market value of any issuer’s securities or stock, or the likelihood that this value may change.
•
The ratings do not opine on the liquidity of the issuer’s securities or stock.
•
The ratings do not opine on any quality related to an issuer or transaction’s profile other than the agency’s opinion on the relative loss severity of the rated obligation should the obligation default.
•
Recovery Ratings, in particular, reflect a fundamental analysis of the underlying relationship between financial claims on an entity or transaction and potential sources to meet those claims. The size of such sources and claims is subject to a wide variety of dynamic factors outside the agency’s analysis that will influence actual recovery rates.
•
Out-of-court settlements are not contemplated by Fitch’s Recovery Ratings, other than in broad concession payments for some classes of junior-ranking bonds in some specific scenarios. In reality, out-of-court settlements will be influenced heavily by creditor composition and local political and economic imperatives, and Fitch does not attempt to factor these into its Recovery Ratings.
•
Creditor composition is outside the scope of Recovery Ratings. Concentration of creditors at a certain level of the capital structure, common ownership of claims at different levels in a capital structure or even differing entry prices of investors within a creditor class can have a profound effect on actual recovery rates.
•
Information flows for companies close to default can become erratic, which may reduce Fitch’s visibility on its Recovery Ratings.
•
Enterprise valuations play a key role in the allocation of recoveries across credit classes. Recovery Ratings assume cash-flow multiples or advance rates, which are driven by subjective forecasts of Fitch analysts of post-restructuring cash flow, achievable exit multiples and appropriate advance rates. All these parameters are subject to volatility before and during the restructuring process.
•
Recovery rates are strongly influenced by legal decisions. Potential legal decisions are not factored into Fitch’s Recovery Ratings.
Moody’s
Insurance Financial Strength Ratings
Moody’s Insurance Financial Strength Ratings are opinions of the ability of insurance companies to pay punctually senior policyholder claims and obligations and also reflect the expected financial loss suffered in the event of default.
| Aaa |
Insurance companies rated Aaa are judged to be of the highest quality, subject to the lowest level of credit risk. |
B-13
| Aa |
Insurance companies rated Aa are judged to be of high quality and are subject to very low credit risk. |
| A |
Insurance companies rated A are judged to be upper-medium grade and are subject to low credit risk. |
| Baa |
Insurance companies rated Baa are judged to be medium-grade and subject to moderate credit risk and as such may possess certain speculative characteristics. |
| Ba |
Insurance companies rated Ba are judged to be speculative and are subject to substantial credit risk. |
| B |
Insurance companies rated B are considered speculative and are subject to high credit risk. |
| Caa |
Insurance companies rated Caa are judged to be speculative of poor standing and are subject to very high credit risk. |
| Ca |
Insurance companies rated Ca are highly speculative and are likely in, or very near, default, with some prospect of recovery of principal and interest. |
| C |
Insurance companies rated C are the lowest rated and are typically in default, with little prospect for recovery of principal or interest. |
Note: Moody’s appends numerical modifiers 1, 2, and 3 to each generic rating classification from Aa through Caa. The modifier 1 indicates that the obligation ranks in the higher end of its generic rating category; the modifier 2 indicates a mid-range ranking; and the modifier 3 indicates a ranking in the lower end of that generic rating category. Additionally, a “(hyb)” indicator is appended to all ratings of hybrid securities issued by banks, insurers, finance companies, and securities firms.*
*By their terms, hybrid securities allow for the omission of scheduled dividends, interest, or principal payments, which can potentially result in impairment if such an omission occurs. Hybrid securities may also be subject to contractually allowable write-downs of principal that could result in impairment. Together with the hybrid indicator, the long-term obligation rating assigned to a hybrid security is an expression of the relative credit risk associated with that security.
Short-Term Insurance Financial Strength Ratings
| P-1 |
Ratings of Prime-1 reflect a superior ability to repay short-term debt obligations. |
| P-2 |
Ratings of Prime-2 reflect a strong ability to repay short-term debt obligations. |
| P-3 |
Ratings of Prime-3 reflect an acceptable ability to repay short-term obligations. |
| P-4 |
Issuers (or supporting institutions) rated Not Prime do not fall within any of the Prime rating categories. |
DESCRIPTION OF SHORT-TERM MUNICIPAL BOND RATINGS
S&P
Municipal Short-Term Note Ratings
An S&P Global Ratings U.S. municipal note rating reflects S&P Global Ratings’ opinion about the liquidity factors and market access risks unique to the notes. Notes due in three years or less will likely receive a note rating. Notes with an original maturity of more than three years will most likely receive a long-term debt rating. In determining which type of rating, if any, to assign, S&P Global Ratings’ analysis will review the following considerations:
•
Amortization schedule — the larger the final maturity relative to other maturities, the more likely it will be treated as a note; and
•
Source of payment — the more dependent the issue is on the market for its refinancing, the more likely it will be treated as a note.
Note rating symbols are as follows:
| SP-1 |
Strong capacity to pay principal and interest. An issue determined to possess a very strong capacity to pay debt service is given a plus (+) designation. |
| SP-2 |
Satisfactory capacity to pay principal and interest, with some vulnerability to adverse financial and economic changes over the term of the notes. |
| SP-3 |
Speculative capacity to pay principal and interest. |
B-14
| D |
‘D’ is assigned upon failure to pay the note when due, completion of a distressed debt restructuring, or the filing of a bankruptcy petition or the taking of similar action and where default on an obligation is a virtual certainty, for example, due to automatic stay provisions. |
Moody’s
Short-Term Obligation Ratings
The Municipal Investment Grade (MIG) scale is used to rate US municipal cash flow notes, bond anticipation notes and certain other short-term obligations, which typically mature in three years or less. Under certain circumstances, the MIG scale is used for bond anticipation notes with maturities of up to five years.
| MIG 1 |
This designation denotes superior credit quality. Excellent protection is afforded by established cash flows, highly reliable liquidity support or demonstrated broad-based access to the market for refinancing. |
| MIG 2 |
This designation denotes strong credit quality. Margins of protection are ample, although not as large as in the preceding group. |
| MIG 3 |
This designation denotes acceptable credit quality. Liquidity and cash-flow protection may be narrow, and market access for refinancing is likely to be less well-established. |
| SG |
This designation denotes speculative-grade credit quality. Debt instruments in this category may lack sufficient margins of protection. |
Demand Obligation Ratings
In the case of variable rate demand obligations (VRDOs), a two-component rating is assigned. The components are a long-term rating and a short-term demand obligation rating. The long-term rating addresses the issuer’s ability to meet scheduled principal and interest payments. The short-term demand obligation rating addresses the ability of the issuer or the liquidity provider to make payments associated with the purchase-price-upon-demand feature (“demand feature”) of the VRDO. The short-term demand obligation rating uses the VMIG scale. VMIG ratings with liquidity support use as an input the short-term Counterparty Risk Assessment of the support provider, or the long-term rating of the underlying obligor in the absence of third party liquidity support. Transitions of VMIG ratings of demand obligations with conditional liquidity support differ from transitions on the Prime scale to reflect the risk that external liquidity support will terminate if the issuer’s long-term rating drops below investment grade.
| VMIG 1 |
This designation denotes superior credit quality. Excellent protection is afforded by the superior short-term credit strength of the liquidity provider and structural and legal protections that ensure the timely payment of purchase price upon demand. |
| VMIG 2 |
This designation denotes strong credit quality. Good protection is afforded by the strong short-term credit strength of the liquidity provider and structural and legal protections that ensure the timely payment of purchase price upon demand. |
| VMIG 3 |
This designation denotes acceptable credit quality. Adequate protection is afforded by the satisfactory short-term credit strength of the liquidity provider and structural and legal protections that ensure the timely payment of purchase price upon demand. |
| SG |
This designation denotes speculative-grade credit quality. Demand features rated in this category may be supported by a liquidity provider that does not have a sufficiently strong short-term rating or may lack the structural or legal protections necessary to ensure the timely payment of purchase price upon demand. |
DESCRIPTION OF PREFERRED STOCK RATINGS
DBRS Morningstar
Preferred Share Rating Scale
The DBRS Morningstar preferred share rating scale reflects an opinion on the risk that an issuer will not fulfil its obligations with respect to both dividend and principal commitments in respect of preferred shares issued in the Canadian securities market in accordance with the terms under which the relevant preferred shares have been issued. Every DBRS Morningstar rating using the preferred share rating scale
B-15
is based on quantitative and qualitative considerations relevant to the issuing entity. Each rating category may be denoted by the subcategories “high” and “low”. The absence of either a “high” or “low” designation indicates the rating is in the middle of the category.
Preferred shares issued in the Canadian securities markets are rated using the preferred share rating scale and preferred shares issued outside of the Canadian securities markets are rated using the long-term obligations scale. Because preferred share dividends are only payable when approved, the non-payment of a preferred share dividend does not necessarily result in a “D”. DBRS Morningstar may also use “SD” (Selective Default) in cases where only some securities are affected, such as in the case of a “distressed exchange”.
| Pfd-1 |
Preferred shares rated Pfd-1 are generally of superior credit quality, and are supported by entities with strong earnings and balance sheet characteristics. Pfd-1 ratings generally correspond with issuers with a AAA or AA category reference point1. |
| Pfd-2 |
Preferred shares rated Pfd-2 are generally of good credit quality. Protection of dividends and principal is still substantial, but earnings, the balance sheet and coverage ratios are not as strong as Pfd-1 rated companies. Generally, Pfd-2 ratings correspond with issuers with an A category or higher reference point. |
| Pfd-3 |
Preferred shares rated Pfd-3 are generally of adequate credit quality. While protection of dividends and principal is still considered acceptable, the issuing entity is more susceptible to adverse changes in financial and economic conditions, and there may be other adverse conditions present which detract from debt protection. Pfd-3 ratings generally correspond with issuers with a BBB category or higher reference point. |
| Pfd-4 |
Preferred shares rated Pfd-4 are generally speculative, where the degree of protection afforded to dividends and principal is uncertain, particularly during periods of economic adversity. Issuers with preferred shares rated Pfd-4 generally correspond with issuers with a BB category or higher reference point. |
| Pfd-5 |
Preferred shares rated Pfd-5 are generally highly speculative and the ability of the entity to maintain timely dividend and principal payments in the future is highly uncertain. Entities with a Pfd-5 rating generally correspond with issuers with a B category or higher reference point. Preferred shares rated Pfd-5 often have characteristics that, if not remedied, may lead to default. |
| D |
When the issuer has filed under any applicable bankruptcy, insolvency or winding up or the issuer is in default per the legal documents, a downgrade to D may occur. Because preferred share dividends are only payable when approved, the non-payment of a preferred share dividend does not necessarily result in a D. DBRS Morningstar may also use SD (Selective Default) in cases where only some securities are impacted, such as the case of a “distressed exchange”. See the Default Definition document posted on the website for more information. |
1
The reference point is a credit rating or intrinsic assessment on the relevant issuer expressed using the long-term obligations scale. For instance, it could be the issuer rating (for a corporate issuer), the intrinsic assessment (for a bank or a non-bank finance company), or the financial strength rating (for an insurance company).
B-16
PART C: OTHER INFORMATION
Item 28.
Exhibits
| (a)(1) |
|
| (a)(2) |
|
| (a)(3) |
|
| (b) |
|
| (c) |
|
| (d)(1) |
|
| (d)(2)(a) |
|
| (d)(2)(b) |
|
| (d)(3) |
Reserved. |
| (d)(4) |
Reserved. |
| (d)(5) |
|
| (e)(1) |
|
| (e)(2) |
|
| (e)(3) |
|
| (e)(4) |
|
| (e)(5) |
|
| (e)(6) |
| (e)(7) |
|
| (e)(8) |
|
| (f) |
|
| (g)(1)(a) |
|
| (g)(1)(b) |
|
| (g)(1)(c) |
|
| (h)(1)(a) |
|
| (h)(1)(b) |
|
| (h)(1)(c) |
|
| (h)(1)(d) |
|
| (h)(1)(e) |
|
| (h)(1)(f) |
|
| (h)(2)(a) |
|
| (h)(2)(b) |
|
| (h)(2)(c) |
|
| (h)(2)(d) |
|
| (h)(2)(e) |
|
| (h)(3)(a) |
|
| (h)(3)(b) |
|
| (h)(3)(c) |
|
| (h)(3)(d) |
|
| (h)(3)(e) |
|
| (h)(4)(a) |
|
| (h)(4)(b) |
|
| (h)(4)(c) |
|
| (h)(5) |
|
| (h)(6) |
|
| (h)(7) |
|
| (h)(8) |
|
| (h)(9) |
|
| (h)(10) |
|
| (h)(11) |
|
| (h)(12) |
| (h)(13) |
|
| (h)(14) |
|
| (h)(15) |
|
| (h)(16) |
|
| (h)(17) |
|
| (h)(18) |
|
| (h)(19) |
|
| (h)(20) |
|
| (h)(21) |
|
| (h)(22) |
|
| (h)(23) |
|
| (h)(24) |
|
| (h)(25) |
|
| (h)(26) |
|
| (h)(27) |
|
| (h)(28) |
|
| (h)(29) |
| (h)(30) |
|
| (h)(31) |
|
| (h)(32) |
|
| (h)(33) |
|
| (i) |
|
| (j) |
|
| (k) |
None |
| (l) |
None |
| (m)(1) |
|
| (m)(2) |
|
| (n)(1) |
|
| (n)(2) |
|
| (o) |
Reserved. |
| (p)(1) |
|
| (p)(2) |
|
| (p)(3) |
|
| (99)(a) |
|
| (99)(b) |
|
| (99)(c) |
| EX-101.INS |
XBRL Instance Document - the instance document does not appear on the Interactive Data File because its XBRL tags are embedded within the Inline XBRL document. |
| EX-101.SCH |
XBRL Taxonomy Extension Schema Document. |
| EX-101.CAL |
XBRL Taxonomy Extension Calculation Linkbase Document. |
| EX-101.DEF |
XBRL Taxonomy Extension Definition Linkbase Document. |
| EX-101.LAB |
XBRL Taxonomy Extension Labels Linkbase Document. |
| EX-101.PRE |
XBRL Taxonomy Extension Presentation Linkbase Document. |
Item 29.
Persons Controlled by or under Common Control with Registrant
As of the effective date of this Registration Statement there are no persons controlled or under common control with the Registrant.
Item 30.
Indemnification.
Reference is made to Section 3 and Section 5 of Registrant’s Declaration of Trust and Section 1.10 of Registrant’s Distribution Agreement.
The Registrant’s Declaration of Trust states that every person who is, has been, or becomes a Trustee or officer of the Trust or is or has been a trustee or director of a Predecessor Entity shall be indemnified by the Trust to the fullest extent permitted by law against liability and against all expenses reasonably incurred or paid by him or her in connection with any proceeding in which he or she becomes involved as a party or otherwise by virtue of being or having been a Trustee or officer of the Trust or a trustee or director of a Predecessor Entity and against amounts paid or incurred by him or her in the settlement thereof.
The Trustees shall be entitled and empowered to the fullest extent permitted by law to purchase with Trust assets insurance for liability and for all expenses reasonably incurred or paid or expected to be paid by a Trustee, officer or agent of the Trust or a trustee or director of a predecessor entity in connection with any proceeding in which he or she may become involved by virtue of his or her capacity or former capacity as a Trustee, officer or agent of the Trust or a trustee or director of a Predecessor Entity.
The Trust agrees to indemnify, defend and hold the Distributor, its several directors, officers and employees, and any person who controls the Distributor within the meaning of Section 15 of the Securities Act, free and harmless from and against any and all claims, demands, liabilities and expenses (including the cost of investigating or defending such claims, demands or liabilities and any reasonable counsel fees incurred in connection therewith) which the Distributor, its directors, officers and employees, or any such controlling person may incur under the Securities Act or under common law or otherwise arising out of or based upon (i) any untrue statement, or alleged untrue statement, of a material fact contained in any registration statement or any prospectus, (ii) any omission, or alleged omission, to state a material fact, required to be stated in either any registration statement or any prospectus, or necessary to make the statements in either thereof not misleading, or (iii) any Trust advertisement or sales literature that is not in compliance with applicable laws, rules or regulations (including, but not limited to the Conduct Rules of the National Association of Securities Dealers, Inc.). However, the Trust’s agreement to indemnify the Distributor, its directors, officers or employees, and any such controlling person, shall not be deemed to cover any claims, demands, liabilities or expenses arising out of any statements or representations as are contained in any prospectus, advertisement or sales literature and in such financial and other statements as are furnished in writing to the Trust by the Distributor and used in the answers to the registration statement or in the corresponding statements made in the prospectus, advertisement or sales literature, or arising out of or based upon any omission or alleged omission to state a material fact in connection with the giving of such information required to be stated in such answers or necessary to make the answers not misleading. Further, the Trust’s agreement to indemnify Distributor and the Trust’s representations and warranties set forth in the Distribution Agreement shall not be deemed to cover any liability to the Trust or its Shareholders to which Distributor would otherwise be subject by reason of willful misfeasance, bad faith or gross negligence in the performance of its duties, or by reason of Distributor’s reckless disregard of its obligations and duties under the Distribution Agreement.
Insofar as indemnification for liabilities arising under the Securities Act of 1933, as amended (the “1933 Act”), may be permitted to directors, trustees, officers and controlling persons of the Registrant and the principal underwriter pursuant to the foregoing provisions or otherwise, the Registrant has been advised that in the opinion of the Securities and Exchange Commission such indemnification is against public policy as expressed in the 1933 Act and is, therefore, unenforceable. In the event that a claim for indemnification against such liabilities (other than the payment by the Registrant of expenses incurred or paid by a director, trustee, officer, or controlling person of the Registrant and the principal underwriter in connection with the successful defense of any action, suit or proceeding) is asserted against the Registrant by such director, trustee, officer or controlling person or principal underwriter in connection with the shares being registered, the Registrant will, unless in the opinion of its counsel the matter has been settled by controlling precedent, submit to a court of appropriate jurisdiction the question whether such indemnification by it is against public policy as expressed in the 1933 Act and will be governed by the final adjudication of such issue.
Item 31.
Business and Other Connections of Investment Advisers
See “Management of the Trust” in Part B. The business or other connections of each director and officer of Security Capital Research & Management Incorporated is currently listed in the investment advisor registration on Form ADV for Security Capital Research & Management Incorporated (File No. 801-53815) and is incorporated herein by reference.
See “Management of the Trust” in Part B. The business and other connections of each directors of J.P. Morgan Investment Management Inc. is currently listed in the investment adviser registration on Form ADV for J.P. Morgan Investment Management Inc. (File No. 801-21011) and is incorporated by reference herein.
Item 32.
Principal Underwriters
(a) JPMorgan Distribution Services, Inc. is the principal underwriter of the Registrant’s shares. JPMorgan Distribution Services, Inc. is registered with the Securities and Exchange Commission as a broker-dealer and is a member of the National Association of Securities Dealers. JPMorgan Distribution Services, Inc. is located at 1111 Polaris Parkway, Columbus, Ohio 43240. JPMorgan Distribution Services, Inc. acts as the principal underwriter for the following additional investment companies:
J.P. Morgan Fleming Mutual Fund Group, Inc.
J.P. Morgan Mutual Fund Investment Trust
JPMorgan Trust I
JPMorgan Trust II
JPMorgan Trust IV
Undiscovered Managers Funds
JPMorgan Insurance Trust
J.P. Morgan Exchange-Traded Fund Trust
J.P. Morgan Mutual Fund Investment Trust
JPMorgan Trust I
JPMorgan Trust II
JPMorgan Trust IV
Undiscovered Managers Funds
JPMorgan Insurance Trust
J.P. Morgan Exchange-Traded Fund Trust
(b) The directors and officers of JPMorgan Distribution Services, Inc. are set forth below. The business address of each director or officer is 1111 Polaris Parkway, Columbus, Ohio 43240.
| Name with Registrant |
Positions and Office with JPMorgan Distribution Services, Inc. |
Positions and Offices with the Funds |
| Wendy Barta |
Director, Executive Director & President |
None |
| Andrea Lisher |
Director & Managing Director |
None |
| Joseph F. Sanzone |
Director & Managing Director |
None |
| Omar F. Altahawi |
Managing Director & Treasurer |
None |
| Gary C. Krivo |
Managing Director & Chief Risk Officer |
None |
| Michael R. Machulski |
Director & Managing Director |
None |
| Brian S. Shlissel |
Managing Director |
President & Principal Executive Officer |
| James A. Hoffman |
Executive Director |
None |
| Carmine Lekstutis |
Executive Director & Chief Legal Officer |
Assistant Secretary |
| Jessica K. Ditullio |
Executive Director & Assistant Secretary |
Assistant Secretary |
| Kevin Kloza |
Executive Director and Chief Compliance Officer |
None |
| Andrea Lang |
Vice President & Anti-Money Laundering Compliance Officer |
None |
| Frank J. Drozek |
Executive Director & Assistant Treasurer |
None |
| Christopher J. Mohr |
Executive Director & Assistant Treasurer |
None |
| Joanna Corey |
Executive Director & Assistant Secretary |
None |
| Marcela Castro |
Executive Director & Assistant Secretary |
None |
| Afiya M. Jordan |
Vice President & Secretary |
None |
| Amee Kantesaria |
Vice President & Assistant Secretary |
None |
| Amy Hsu |
Vice President & Assistant Secretary |
None |
| Andris Alexander |
Vice President & Assistant Secretary |
None |
| Theodore Weisman |
Vice President & Assistant Secretary |
None |
(c) Not applicable.
Item 33.
Location of Accounts and Records
| (1) |
J.P. Morgan Investment Management Inc., 383 Madison Avenue, New York, New York 10179 (records relating to its functions as Investment Adviser). |
| (2) |
JPMorgan Distribution Services, Inc., 1111 Polaris Parkway, Columbus, Ohio 43240 (records relating to its functions as Distributor for all Funds). |
| (3) |
J.P. Morgan Investment Management Inc., 383 Madison Avenue, New York, NY 10179 (records relating to its functions as Administrator for all Funds). |
| (4) |
DST Systems Inc., 333 West 11th Street, Kansas City, Mo 64105 (records relating to its functions as transfer agent to the Funds). |
| (5) |
JPMorgan Chase Bank, N.A. 383 Madison Avenue, New York, New York 10179 (records relating to its functions as custodian). |
Item 34.
Management Services
N/A
Item 35.
Undertakings
The Registrant undertakes to call a meeting of Shareholders, at the request of at least 10% of the Registrant’s outstanding shares, for the purpose of voting upon the question of removal of a trustee or trustees and to assist in communications with other shareholders as required by Section 16(c) of the Investment Company Act of 1940.
The Registrant undertakes to furnish to each person to whom a prospectus for a particular fund is delivered a copy of the Registrant’s latest annual report to shareholders relating to that fund upon request and without charge.
SIGNATURES
Pursuant to the requirements of the Securities Act of 1933, as amended and the Investment Company Act of 1940, as amended, the Registrant, JPMorgan Trust II, certifies that it meets all the requirements for effectiveness of the Registration Statement under Rule 485(b) under the Securities Act of 1933 and has duly caused this Amendment to the registration statement to be signed on its behalf by the undersigned, duly authorized, in the City of New York and State of New York on the 22nd day of June, 2022.
| JPMorgan Trust II | |
| By: |
Brian S. Shlissel* |
| |
Name: Brian S. Shlissel |
| |
Title: President and Principal Executive Officer |
Pursuant to the requirements of the Securities Act, this Amendment to the registration statement has been signed below by the following persons in the capacities indicated on June 22, 2022.
| John F. Finn* |
| John F. Finn |
| Trustee |
| Stephen P. Fisher* |
| Stephen P. Fisher |
| Trustee |
| Gary L. French* |
| Gary L. French |
| Trustee |
| Kathleen M. Gallagher* |
| Kathleen M. Gallagher |
| Trustee |
| Robert J. Grassi* |
| Robert J. Grassi |
| Trustee |
| Frankie D. Hughes* |
| Frankie D. Hughes |
| Trustee |
| Raymond Kanner* |
| Raymond Kanner |
| Trustee |
| Thomas P. Lemke* |
| Thomas P. Lemke |
| Trustee |
| Timothy J. Clemens* |
| Timothy J. Clemens |
| Treasurer and Principal Financial Officer |
| *By |
/s/ Matthew J. Beck |
| |
Matthew J. Beck |
| |
Attorney-In-Fact |
| Lawrence R. Maffia* |
| Lawrence R. Maffia |
| Trustee |
| Mary E. Martinez* |
| Mary E. Martinez |
| Trustee |
| Marilyn McCoy* |
| Marilyn McCoy |
| Trustee |
| Robert A. Oden, Jr.* |
| Robert A. Oden, Jr. |
| Trustee |
| Marian U. Pardo* |
| Marian U. Pardo |
| Trustee |
| Emily A. Youssouf* |
| Emily A. Youssouf |
| Trustee |
| Robert F. Deutsch* |
| Robert F. Deutsch |
| Trustee |
| Nina O. Shenker* |
| Nina O. Shenker |
| Trustee |
| Brian S. Shlissel* |
| Brian S. Shlissel |
| President and Principal Executive Officer |
Exhibit Index
| Exhibit No. |
Description |
| (i) |
Opinion and consent of counsel. |
| (j) |
Consent of independent registered public accounting firm. |
| EX-101.INS |
XBRL Instance Document - the instance document does not appear on the Interactive Data File because its XBRL tags are embedded within the Inline XBRL document. |
| EX-101.SCH |
XBRL Taxonomy Extension Schema Document. |
| EX-101.CAL |
XBRL Taxonomy Extension Calculation Linkbase Document. |
| EX-101.DEF |
XBRL Taxonomy Extension Definition Linkbase Document. |
| EX-101.LAB |
XBRL Taxonomy Extension Labels Linkbase Document. |
| EX-101.PRE |
XBRL Taxonomy Extension Presentation Linkbase Document. |