
Exhibit 99.1 Financial Supplement Second Quarter 2019 1Exhibit 99.1 Financial Supplement Second Quarter 2019 1

Table of Contents Page Consolidated Financial Highlights 3 Consolidated Statements of Operations (unaudited) 5 Consolidated Balance Sheets (unaudited) 6 Loans and Deposits 7 Average Balance Sheets and Annualized Yields 8 Segment Financial Highlights 10 Credit-Related Information: Nonperforming Assets 17 Charge-offs, Recoveries and Related Ratios 18 Summary of Changes in the Components of the Allowance for Credit Losses 20 Capital and Ratios 21 Key Performance Metrics, Non-GAAP Financial Measures and Reconciliations 22 The information in this Financial Supplement is preliminary and based on company data available at the time of the earnings presentation. It speaks only as of the particular date or dates included in the accompanying pages. The Company does not undertake an obligation to, and disclaims any duty to, update any of the information provided. Any forward-looking statements in this Financial Supplement are subject to the forward- looking statements language contained in the Company’s reports filed with the SEC pursuant to the Securities Exchange Act of 1934, which can be found on the SEC’s website (www.sec.gov) or on the Company’s website (www.citizensbank.com). The Company’s future financial performance is subject to the risks and uncertainties described in its SEC filings. 2Table of Contents Page Consolidated Financial Highlights 3 Consolidated Statements of Operations (unaudited) 5 Consolidated Balance Sheets (unaudited) 6 Loans and Deposits 7 Average Balance Sheets and Annualized Yields 8 Segment Financial Highlights 10 Credit-Related Information: Nonperforming Assets 17 Charge-offs, Recoveries and Related Ratios 18 Summary of Changes in the Components of the Allowance for Credit Losses 20 Capital and Ratios 21 Key Performance Metrics, Non-GAAP Financial Measures and Reconciliations 22 The information in this Financial Supplement is preliminary and based on company data available at the time of the earnings presentation. It speaks only as of the particular date or dates included in the accompanying pages. The Company does not undertake an obligation to, and disclaims any duty to, update any of the information provided. Any forward-looking statements in this Financial Supplement are subject to the forward- looking statements language contained in the Company’s reports filed with the SEC pursuant to the Securities Exchange Act of 1934, which can be found on the SEC’s website (www.sec.gov) or on the Company’s website (www.citizensbank.com). The Company’s future financial performance is subject to the risks and uncertainties described in its SEC filings. 2

CONSOLIDATED FINANCIAL HIGHLIGHTS (in millions, except share, per-share and ratio data) QUARTERLY TRENDS FOR THE SIX MONTHS ENDED JUNE 30, 2Q19 Change 2019 Change 2Q19 1Q19 4Q18 3Q18 2Q18 1Q19 2Q18 2019 2018 2018 $/bps % $/bps % $/bps % SELECTED OPERATING DATA Total revenue $1,628 $1,588 $1,593 $1,564 $1,509 $40 3% $119 8% $3,216 $2,971 $245 8% Noninterest expense 951 937 951 910 875 14 1 76 9 1,888 1,758 130 7 Profit before provision for credit losses 677 651 642 654 634 26 4 43 7 1,328 1,213 115 9 Provision for credit losses 97 85 85 78 85 12 14 12 14 182 163 19 12 NET INCOME 453 439 465 443 425 14 3 28 7 892 813 79 10 1 Net income, Underlying 458 443 474 450 425 15 3 33 8 901 813 88 11 Net income available to common stockholders 435 424 450 436 425 11 3 10 2 859 806 53 7 Net income available to common 1 440 428 459 443 425 12 3 15 4 868 806 62 8 stockholders, Underlying PER COMMON SHARE DATA Basic earnings $0.95 $0.92 $0.96 $0.92 $0.88 $0.03 3% $0.07 8% $1.87 $1.66 $0.21 13% Diluted earnings 0.95 0.92 0.96 0.91 0.88 0.03 3 0.07 8 1.86 1.65 0.21 13 1 Basic earnings, Underlying 0.96 0.93 0.98 0.93 0.88 0.03 3 0.08 9 1.89 1.66 0.23 14 1 Diluted earnings, Underlying 0.96 0.93 0.98 0.93 0.88 0.03 3 0.08 9 1.88 1.65 0.23 14 Cash dividends declared and paid per common share 0.32 0.32 0.27 0.27 0.22 — — 0.10 45 0.64 0.44 0.20 45 Book value per common share 45.61 44.24 42.87 41.62 41.16 1.37 3 4.45 11 45.61 41.16 4.45 11 Tangible book value per common share 30.88 29.60 28.73 27.66 27.67 1.28 4 3.21 12 30.88 27.67 3.21 12 Dividend payout ratio 34% 35% 28% 29% 25% (100) bps 900 bps 34% 27% 700 bps 1 Dividend payout ratio, Underlying 33 34 27 29 25 (100) bps 800 bps 34 27 700 bps COMMON SHARES OUTSTANDING Average: Basic 458,154,335 460,713,172 467,338,825 475,957,526 484,744,354 (2,558,837) (1%) (26,590,019) (5%) 459,426,685 486,114,872 (26,688,187) (5%) Diluted 459,304,224 462,520,680 469,103,134 477,599,917 486,141,695 (3,216,456) (1) (26,837,471) (6) 460,857,535 487,683,216 (26,825,681) (6) Common shares at period-end 457,903,826 461,116,723 466,007,984 474,120,616 484,055,194 (3,212,897) (1) (26,151,368) (5) 457,903,826 484,055,194 (26,151,368) (5) SHARE PRICE High $36.89 $37.73 $39.69 $41.76 $43.62 ($0.84) (2%) ($6.73) (15%) $37.73 $48.23 ($10.50) (22%) Low 32.36 29.26 27.62 38.47 38.84 3.10 11 (6.48) (17) 29.26 38.84 (9.58) (25) Close 35.36 32.50 29.73 38.57 38.90 2.86 9 (3.54) (9) 35.36 38.90 (3.54) (9) Market capitalization 16,191 14,986 13,854 18,287 18,830 1,205 8 (2,639) (14) 16,191 18,830 (2,639) (14) SEGMENT NET INCOME Consumer Banking $213 $202 $193 $207 $197 $11 5% $16 8% $415 $367 $48 13% Commercial Banking 216 227 241 234 237 (11) (5) (21) (9) 443 452 (9) (2) Other 24 10 31 2 (9) 14 140 33 NM 34 (6) 40 NM NET INCOME $453 $439 $465 $443 $425 $14 3% $28 7% $892 $813 $79 10% 1 These are non-GAAP financial measures. For further information on these measures, refer to Key Performance Metrics, Non-GAAP Financial Measures and Reconciliations at the end of this document. 3CONSOLIDATED FINANCIAL HIGHLIGHTS (in millions, except share, per-share and ratio data) QUARTERLY TRENDS FOR THE SIX MONTHS ENDED JUNE 30, 2Q19 Change 2019 Change 2Q19 1Q19 4Q18 3Q18 2Q18 1Q19 2Q18 2019 2018 2018 $/bps % $/bps % $/bps % SELECTED OPERATING DATA Total revenue $1,628 $1,588 $1,593 $1,564 $1,509 $40 3% $119 8% $3,216 $2,971 $245 8% Noninterest expense 951 937 951 910 875 14 1 76 9 1,888 1,758 130 7 Profit before provision for credit losses 677 651 642 654 634 26 4 43 7 1,328 1,213 115 9 Provision for credit losses 97 85 85 78 85 12 14 12 14 182 163 19 12 NET INCOME 453 439 465 443 425 14 3 28 7 892 813 79 10 1 Net income, Underlying 458 443 474 450 425 15 3 33 8 901 813 88 11 Net income available to common stockholders 435 424 450 436 425 11 3 10 2 859 806 53 7 Net income available to common 1 440 428 459 443 425 12 3 15 4 868 806 62 8 stockholders, Underlying PER COMMON SHARE DATA Basic earnings $0.95 $0.92 $0.96 $0.92 $0.88 $0.03 3% $0.07 8% $1.87 $1.66 $0.21 13% Diluted earnings 0.95 0.92 0.96 0.91 0.88 0.03 3 0.07 8 1.86 1.65 0.21 13 1 Basic earnings, Underlying 0.96 0.93 0.98 0.93 0.88 0.03 3 0.08 9 1.89 1.66 0.23 14 1 Diluted earnings, Underlying 0.96 0.93 0.98 0.93 0.88 0.03 3 0.08 9 1.88 1.65 0.23 14 Cash dividends declared and paid per common share 0.32 0.32 0.27 0.27 0.22 — — 0.10 45 0.64 0.44 0.20 45 Book value per common share 45.61 44.24 42.87 41.62 41.16 1.37 3 4.45 11 45.61 41.16 4.45 11 Tangible book value per common share 30.88 29.60 28.73 27.66 27.67 1.28 4 3.21 12 30.88 27.67 3.21 12 Dividend payout ratio 34% 35% 28% 29% 25% (100) bps 900 bps 34% 27% 700 bps 1 Dividend payout ratio, Underlying 33 34 27 29 25 (100) bps 800 bps 34 27 700 bps COMMON SHARES OUTSTANDING Average: Basic 458,154,335 460,713,172 467,338,825 475,957,526 484,744,354 (2,558,837) (1%) (26,590,019) (5%) 459,426,685 486,114,872 (26,688,187) (5%) Diluted 459,304,224 462,520,680 469,103,134 477,599,917 486,141,695 (3,216,456) (1) (26,837,471) (6) 460,857,535 487,683,216 (26,825,681) (6) Common shares at period-end 457,903,826 461,116,723 466,007,984 474,120,616 484,055,194 (3,212,897) (1) (26,151,368) (5) 457,903,826 484,055,194 (26,151,368) (5) SHARE PRICE High $36.89 $37.73 $39.69 $41.76 $43.62 ($0.84) (2%) ($6.73) (15%) $37.73 $48.23 ($10.50) (22%) Low 32.36 29.26 27.62 38.47 38.84 3.10 11 (6.48) (17) 29.26 38.84 (9.58) (25) Close 35.36 32.50 29.73 38.57 38.90 2.86 9 (3.54) (9) 35.36 38.90 (3.54) (9) Market capitalization 16,191 14,986 13,854 18,287 18,830 1,205 8 (2,639) (14) 16,191 18,830 (2,639) (14) SEGMENT NET INCOME Consumer Banking $213 $202 $193 $207 $197 $11 5% $16 8% $415 $367 $48 13% Commercial Banking 216 227 241 234 237 (11) (5) (21) (9) 443 452 (9) (2) Other 24 10 31 2 (9) 14 140 33 NM 34 (6) 40 NM NET INCOME $453 $439 $465 $443 $425 $14 3% $28 7% $892 $813 $79 10% 1 These are non-GAAP financial measures. For further information on these measures, refer to Key Performance Metrics, Non-GAAP Financial Measures and Reconciliations at the end of this document. 3

CONSOLIDATED FINANCIAL HIGHLIGHTS, CONTINUED (in millions, except ratio and headcount data) QUARTERLY TRENDS FOR THE SIX MONTHS ENDED JUNE 30, 2Q19 Change 2019 Change 2Q19 1Q19 4Q18 3Q18 2Q18 1Q19 2Q18 2019 2018 2018 $/bps % $/bps % $/bps % FINANCIAL RATIOS 1 Net interest margin 3.20% 3.23% 3.23% 3.20% 3.20% (3) bps — bps 3.22% 3.20% 2 bps 2 Net interest margin, FTE 3.21 3.25 3.25 3.22 3.22 (4) bps (1) bps 3.23 3.21 2 bps Return on average common equity 8.54 8.62 9.16 8.82 8.65 (8) bps (11) bps 8.58 8.24 34 bps 3 Return on average common equity, Underlying 8.63 8.71 9.33 8.96 8.65 (8) bps (2) bps 8.67 8.24 43 bps Return on average tangible common equity 12.75 13.00 13.85 13.29 12.93 (25) bps (18) bps 12.87 12.32 55 bps Return on average tangible common equity, 3 Underlying 12.89 13.12 14.11 13.50 12.93 (23) bps (4) bps 13.00 12.32 68 bps Return on average total assets 1.13 1.11 1.17 1.13 1.11 2 bps 2 bps 1.12 1.08 4 bps 3 Return on average total assets, Underlying 1.14 1.12 1.19 1.15 1.11 2 bps 3 bps 1.13 1.08 5 bps Return on average total tangible assets 1.17 1.16 1.22 1.18 1.16 1 bps 1 bps 1.17 1.12 5 bps 3 Return on average total tangible assets, Underlying 1.19 1.17 1.24 1.20 1.16 2 bps 3 bps 1.18 1.12 6 bps Effective income tax rate 21.86 22.42 16.45 23.16 22.58 (56) bps (72) bps 22.14 22.55 (41) bps 3 Effective income tax rate, Underlying 21.89 22.44 21.91 23.20 22.58 (55) bps (69) bps 22.16 22.55 (39) bps Efficiency ratio 58.41 59.00 59.69 58.20 57.95 (59) bps 46 bps 58.70 59.17 (47) bps 3 Efficiency ratio, Underlying 58.02 58.67 56.70 57.62 57.95 (65) bps 7 bps 58.34 59.17 (83) bps CAPITAL RATIOS - PERIOD-END (PRELIMINARY) CET1 capital ratio 10.5% 10.5% 10.6% 10.8% 11.2% Tier 1 capital ratio 11.3 11.3 11.3 11.2 11.6 Total capital ratio 13.4 13.4 13.3 13.4 13.8 Tier 1 leverage ratio 10.1 10.0 10.0 9.9 10.2 SELECTED BALANCE SHEET DATA (PERIOD-END) Total assets $162,749 $161,342 $160,518 $158,598 $155,431 $1,407 1% $7,318 5% $162,749 $155,431 $7,318 5% Loans and leases: Commercial 56,963 57,689 56,783 55,405 54,888 (726) (1) 2,075 4 56,963 54,888 2,075 4 Retail 59,875 59,926 59,877 59,315 58,519 (51) — 1,356 2 59,875 58,519 1,356 2 Total loans and leases 116,838 117,615 116,660 114,720 113,407 (777) (1) 3,431 3 116,838 113,407 3,431 3 Deposits 124,004 123,916 119,575 117,075 117,073 88 — 6,931 6 124,004 117,073 6,931 6 4 Long-term borrowed funds 11,538 11,725 15,925 17,133 15,130 (187) (2) (3,592) (24) 11,538 15,130 (3,592) (24) Total stockholders' equity 22,017 21,531 20,817 20,276 20,467 486 2 1,550 8 22,017 20,467 1,550 8 5 Loans-to-deposits ratio (period-end balances) 94.22% 94.92% 97.56% 97.99% 96.87% (70) bps (265) bps 94.22% 96.87% (265) bps 5 Loans-to-deposits ratio (average balances) 95.64 97.70 98.41 97.38 98.01 (206) bps (237) bps 96.65 97.99 (134) bps Full-time equivalent colleagues 18,207 18,078 18,140 18,332 17,699 129 1 508 3 18,207 17,699 508 3 1 Beginning in the first quarter of 2019, we changed the method of calculating our net interest margin to equal net interest income, annualized based on the number of days in the period, divided by average total interest-earning assets. Prior periods have been adjusted to conform with the current period presentation. 2 Net interest income and net interest margin is presented on a fully taxable-equivalent ( FTE ) basis using the federal statutory tax rate of 21%. In the fully taxable-equivalent presentation of net interest income and net interest margin, interest income on tax-exempt assets is increased to make it fully equivalent to interest income earned on taxable assets. The FTE impact is predominantly attributable to commercial loans for the periods presented. 3 These are non-GAAP financial measures. For further information on these measures, refer to Key Performance Metrics, Non-GAAP Financial Measures and Reconciliations at the end of this document. 4 Beginning in the first quarter of 2019, borrowed funds balances and the associated interest expense are based on original maturity. Prior periods have been adjusted to conform with the current period presentation. 5 Beginning in the third quarter of 2018, we revised our method of calculating the loans-to-deposits ratio to exclude loans held for sale. Prior periods have been adjusted to conform with the current period presentation. 4CONSOLIDATED FINANCIAL HIGHLIGHTS, CONTINUED (in millions, except ratio and headcount data) QUARTERLY TRENDS FOR THE SIX MONTHS ENDED JUNE 30, 2Q19 Change 2019 Change 2Q19 1Q19 4Q18 3Q18 2Q18 1Q19 2Q18 2019 2018 2018 $/bps % $/bps % $/bps % FINANCIAL RATIOS 1 Net interest margin 3.20% 3.23% 3.23% 3.20% 3.20% (3) bps — bps 3.22% 3.20% 2 bps 2 Net interest margin, FTE 3.21 3.25 3.25 3.22 3.22 (4) bps (1) bps 3.23 3.21 2 bps Return on average common equity 8.54 8.62 9.16 8.82 8.65 (8) bps (11) bps 8.58 8.24 34 bps 3 Return on average common equity, Underlying 8.63 8.71 9.33 8.96 8.65 (8) bps (2) bps 8.67 8.24 43 bps Return on average tangible common equity 12.75 13.00 13.85 13.29 12.93 (25) bps (18) bps 12.87 12.32 55 bps Return on average tangible common equity, 3 Underlying 12.89 13.12 14.11 13.50 12.93 (23) bps (4) bps 13.00 12.32 68 bps Return on average total assets 1.13 1.11 1.17 1.13 1.11 2 bps 2 bps 1.12 1.08 4 bps 3 Return on average total assets, Underlying 1.14 1.12 1.19 1.15 1.11 2 bps 3 bps 1.13 1.08 5 bps Return on average total tangible assets 1.17 1.16 1.22 1.18 1.16 1 bps 1 bps 1.17 1.12 5 bps 3 Return on average total tangible assets, Underlying 1.19 1.17 1.24 1.20 1.16 2 bps 3 bps 1.18 1.12 6 bps Effective income tax rate 21.86 22.42 16.45 23.16 22.58 (56) bps (72) bps 22.14 22.55 (41) bps 3 Effective income tax rate, Underlying 21.89 22.44 21.91 23.20 22.58 (55) bps (69) bps 22.16 22.55 (39) bps Efficiency ratio 58.41 59.00 59.69 58.20 57.95 (59) bps 46 bps 58.70 59.17 (47) bps 3 Efficiency ratio, Underlying 58.02 58.67 56.70 57.62 57.95 (65) bps 7 bps 58.34 59.17 (83) bps CAPITAL RATIOS - PERIOD-END (PRELIMINARY) CET1 capital ratio 10.5% 10.5% 10.6% 10.8% 11.2% Tier 1 capital ratio 11.3 11.3 11.3 11.2 11.6 Total capital ratio 13.4 13.4 13.3 13.4 13.8 Tier 1 leverage ratio 10.1 10.0 10.0 9.9 10.2 SELECTED BALANCE SHEET DATA (PERIOD-END) Total assets $162,749 $161,342 $160,518 $158,598 $155,431 $1,407 1% $7,318 5% $162,749 $155,431 $7,318 5% Loans and leases: Commercial 56,963 57,689 56,783 55,405 54,888 (726) (1) 2,075 4 56,963 54,888 2,075 4 Retail 59,875 59,926 59,877 59,315 58,519 (51) — 1,356 2 59,875 58,519 1,356 2 Total loans and leases 116,838 117,615 116,660 114,720 113,407 (777) (1) 3,431 3 116,838 113,407 3,431 3 Deposits 124,004 123,916 119,575 117,075 117,073 88 — 6,931 6 124,004 117,073 6,931 6 4 Long-term borrowed funds 11,538 11,725 15,925 17,133 15,130 (187) (2) (3,592) (24) 11,538 15,130 (3,592) (24) Total stockholders' equity 22,017 21,531 20,817 20,276 20,467 486 2 1,550 8 22,017 20,467 1,550 8 5 Loans-to-deposits ratio (period-end balances) 94.22% 94.92% 97.56% 97.99% 96.87% (70) bps (265) bps 94.22% 96.87% (265) bps 5 Loans-to-deposits ratio (average balances) 95.64 97.70 98.41 97.38 98.01 (206) bps (237) bps 96.65 97.99 (134) bps Full-time equivalent colleagues 18,207 18,078 18,140 18,332 17,699 129 1 508 3 18,207 17,699 508 3 1 Beginning in the first quarter of 2019, we changed the method of calculating our net interest margin to equal net interest income, annualized based on the number of days in the period, divided by average total interest-earning assets. Prior periods have been adjusted to conform with the current period presentation. 2 Net interest income and net interest margin is presented on a fully taxable-equivalent ( FTE ) basis using the federal statutory tax rate of 21%. In the fully taxable-equivalent presentation of net interest income and net interest margin, interest income on tax-exempt assets is increased to make it fully equivalent to interest income earned on taxable assets. The FTE impact is predominantly attributable to commercial loans for the periods presented. 3 These are non-GAAP financial measures. For further information on these measures, refer to Key Performance Metrics, Non-GAAP Financial Measures and Reconciliations at the end of this document. 4 Beginning in the first quarter of 2019, borrowed funds balances and the associated interest expense are based on original maturity. Prior periods have been adjusted to conform with the current period presentation. 5 Beginning in the third quarter of 2018, we revised our method of calculating the loans-to-deposits ratio to exclude loans held for sale. Prior periods have been adjusted to conform with the current period presentation. 4
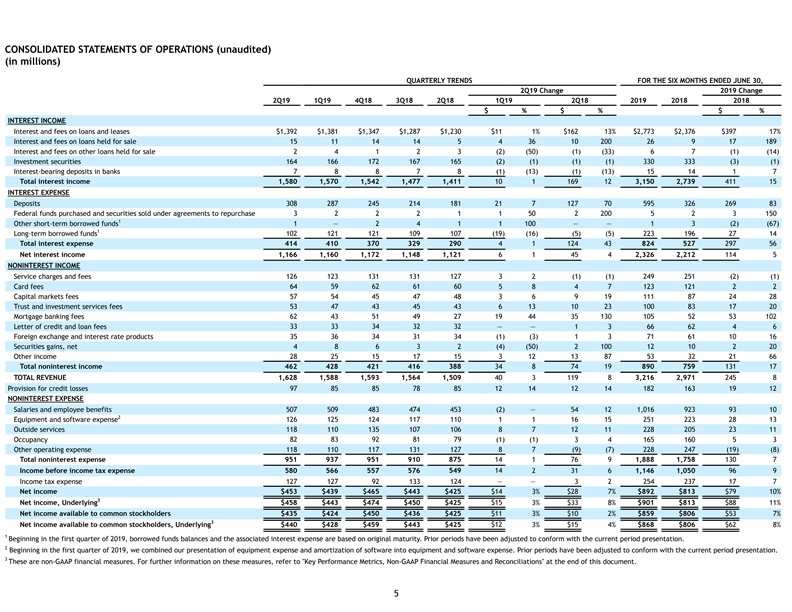
CONSOLIDATED STATEMENTS OF OPERATIONS (unaudited) (in millions) QUARTERLY TRENDS FOR THE SIX MONTHS ENDED JUNE 30, 2Q19 Change 2019 Change 2Q19 1Q19 4Q18 3Q18 2Q18 1Q19 2Q18 2019 2018 2018 $ % $ % $ % INTEREST INCOME Interest and fees on loans and leases $1,392 $1,381 $1,347 $1,287 $1,230 $11 1% $162 13% $2,773 $2,376 $397 17% Interest and fees on loans held for sale 15 11 14 14 5 4 36 10 200 26 9 17 189 Interest and fees on other loans held for sale 2 4 1 2 3 (2) (50) (1) (33) 6 7 (1) (14) Investment securities 164 166 172 167 165 (2) (1) (1) (1) 330 333 (3) (1) Interest-bearing deposits in banks 7 8 8 7 8 (1) (13) (1) (13) 15 14 1 7 Total interest income 1,580 1,570 1,542 1,477 1,411 10 1 169 12 3,150 2,739 411 15 INTEREST EXPENSE Deposits 308 287 245 214 181 21 7 127 70 595 326 269 83 Federal funds purchased and securities sold under agreements to repurchase 3 2 2 2 1 1 50 2 200 5 2 3 150 1 Other short-term borrowed funds 1 — 2 4 1 1 100 — — 1 3 (2) (67) 1 Long-term borrowed funds 102 121 121 109 107 (19) (16) (5) (5) 223 196 27 14 Total interest expense 414 410 370 329 290 4 1 124 43 824 527 297 56 Net interest income 1,166 1,160 1,172 1,148 1,121 6 1 45 4 2,326 2,212 114 5 NONINTEREST INCOME Service charges and fees 126 123 131 131 127 3 2 (1) (1) 249 251 (2) (1) Card fees 64 59 62 61 60 5 8 4 7 123 121 2 2 Capital markets fees 57 54 45 47 48 3 6 9 19 111 87 24 28 Trust and investment services fees 53 47 43 45 43 6 13 10 23 100 83 17 20 Mortgage banking fees 62 43 51 49 27 19 44 35 130 105 52 53 102 Letter of credit and loan fees 33 33 34 32 32 — — 1 3 66 62 4 6 Foreign exchange and interest rate products 35 36 34 31 34 (1) (3) 1 3 71 61 10 16 Securities gains, net 4 8 6 3 2 (4) (50) 2 100 12 10 2 20 Other income 28 25 15 17 15 3 12 13 87 53 32 21 66 Total noninterest income 462 428 421 416 388 34 8 74 19 890 759 131 17 TOTAL REVENUE 1,628 1,588 1,593 1,564 1,509 40 3 119 8 3,216 2,971 245 8 Provision for credit losses 97 85 85 78 85 12 14 12 14 182 163 19 12 NONINTEREST EXPENSE Salaries and employee benefits 507 509 483 474 453 (2) — 54 12 1,016 923 93 10 2 Equipment and software expense 126 125 124 117 110 1 1 16 15 251 223 28 13 Outside services 118 110 135 107 106 8 7 12 11 228 205 23 11 Occupancy 82 83 92 81 79 (1) (1) 3 4 165 160 5 3 Other operating expense 118 110 117 131 127 8 7 (9) (7) 228 247 (19) (8) Total noninterest expense 951 937 951 910 875 14 1 76 9 1,888 1,758 130 7 Income before income tax expense 580 566 557 576 549 14 2 31 6 1,146 1,050 96 9 Income tax expense 127 127 92 133 124 — — 3 2 254 237 17 7 Net income $453 $439 $465 $443 $425 $14 3% $28 7% $892 $813 $79 10% 3 Net income, Underlying $458 $443 $474 $450 $425 $15 3% $33 8% $901 $813 $88 11% Net income available to common stockholders $435 $424 $450 $436 $425 $11 3% $10 2% $859 $806 $53 7% 3 Net income available to common stockholders, Underlying $440 $428 $459 $443 $425 $12 3% $15 4% $868 $806 $62 8% 1 Beginning in the first quarter of 2019, borrowed funds balances and the associated interest expense are based on original maturity. Prior periods have been adjusted to conform with the current period presentation. 2 Beginning in the first quarter of 2019, we combined our presentation of equipment expense and amortization of software into equipment and software expense. Prior periods have been adjusted to conform with the current period presentation. 3 These are non-GAAP financial measures. For further information on these measures, refer to Key Performance Metrics, Non-GAAP Financial Measures and Reconciliations at the end of this document. 5CONSOLIDATED STATEMENTS OF OPERATIONS (unaudited) (in millions) QUARTERLY TRENDS FOR THE SIX MONTHS ENDED JUNE 30, 2Q19 Change 2019 Change 2Q19 1Q19 4Q18 3Q18 2Q18 1Q19 2Q18 2019 2018 2018 $ % $ % $ % INTEREST INCOME Interest and fees on loans and leases $1,392 $1,381 $1,347 $1,287 $1,230 $11 1% $162 13% $2,773 $2,376 $397 17% Interest and fees on loans held for sale 15 11 14 14 5 4 36 10 200 26 9 17 189 Interest and fees on other loans held for sale 2 4 1 2 3 (2) (50) (1) (33) 6 7 (1) (14) Investment securities 164 166 172 167 165 (2) (1) (1) (1) 330 333 (3) (1) Interest-bearing deposits in banks 7 8 8 7 8 (1) (13) (1) (13) 15 14 1 7 Total interest income 1,580 1,570 1,542 1,477 1,411 10 1 169 12 3,150 2,739 411 15 INTEREST EXPENSE Deposits 308 287 245 214 181 21 7 127 70 595 326 269 83 Federal funds purchased and securities sold under agreements to repurchase 3 2 2 2 1 1 50 2 200 5 2 3 150 1 Other short-term borrowed funds 1 — 2 4 1 1 100 — — 1 3 (2) (67) 1 Long-term borrowed funds 102 121 121 109 107 (19) (16) (5) (5) 223 196 27 14 Total interest expense 414 410 370 329 290 4 1 124 43 824 527 297 56 Net interest income 1,166 1,160 1,172 1,148 1,121 6 1 45 4 2,326 2,212 114 5 NONINTEREST INCOME Service charges and fees 126 123 131 131 127 3 2 (1) (1) 249 251 (2) (1) Card fees 64 59 62 61 60 5 8 4 7 123 121 2 2 Capital markets fees 57 54 45 47 48 3 6 9 19 111 87 24 28 Trust and investment services fees 53 47 43 45 43 6 13 10 23 100 83 17 20 Mortgage banking fees 62 43 51 49 27 19 44 35 130 105 52 53 102 Letter of credit and loan fees 33 33 34 32 32 — — 1 3 66 62 4 6 Foreign exchange and interest rate products 35 36 34 31 34 (1) (3) 1 3 71 61 10 16 Securities gains, net 4 8 6 3 2 (4) (50) 2 100 12 10 2 20 Other income 28 25 15 17 15 3 12 13 87 53 32 21 66 Total noninterest income 462 428 421 416 388 34 8 74 19 890 759 131 17 TOTAL REVENUE 1,628 1,588 1,593 1,564 1,509 40 3 119 8 3,216 2,971 245 8 Provision for credit losses 97 85 85 78 85 12 14 12 14 182 163 19 12 NONINTEREST EXPENSE Salaries and employee benefits 507 509 483 474 453 (2) — 54 12 1,016 923 93 10 2 Equipment and software expense 126 125 124 117 110 1 1 16 15 251 223 28 13 Outside services 118 110 135 107 106 8 7 12 11 228 205 23 11 Occupancy 82 83 92 81 79 (1) (1) 3 4 165 160 5 3 Other operating expense 118 110 117 131 127 8 7 (9) (7) 228 247 (19) (8) Total noninterest expense 951 937 951 910 875 14 1 76 9 1,888 1,758 130 7 Income before income tax expense 580 566 557 576 549 14 2 31 6 1,146 1,050 96 9 Income tax expense 127 127 92 133 124 — — 3 2 254 237 17 7 Net income $453 $439 $465 $443 $425 $14 3% $28 7% $892 $813 $79 10% 3 Net income, Underlying $458 $443 $474 $450 $425 $15 3% $33 8% $901 $813 $88 11% Net income available to common stockholders $435 $424 $450 $436 $425 $11 3% $10 2% $859 $806 $53 7% 3 Net income available to common stockholders, Underlying $440 $428 $459 $443 $425 $12 3% $15 4% $868 $806 $62 8% 1 Beginning in the first quarter of 2019, borrowed funds balances and the associated interest expense are based on original maturity. Prior periods have been adjusted to conform with the current period presentation. 2 Beginning in the first quarter of 2019, we combined our presentation of equipment expense and amortization of software into equipment and software expense. Prior periods have been adjusted to conform with the current period presentation. 3 These are non-GAAP financial measures. For further information on these measures, refer to Key Performance Metrics, Non-GAAP Financial Measures and Reconciliations at the end of this document. 5
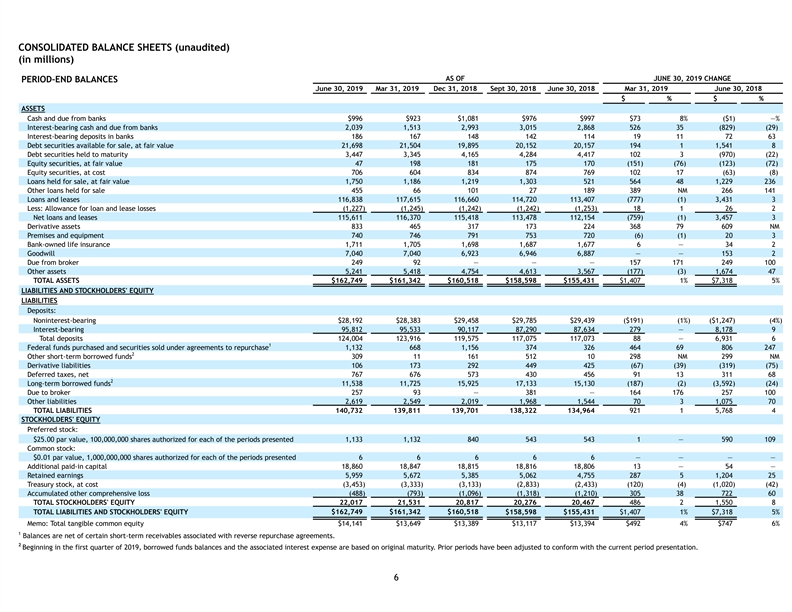
CONSOLIDATED BALANCE SHEETS (unaudited) (in millions) AS OF JUNE 30, 2019 CHANGE PERIOD-END BALANCES June 30, 2019 Mar 31, 2019 Dec 31, 2018 Sept 30, 2018 June 30, 2018 Mar 31, 2019 June 30, 2018 $ % $ % ASSETS Cash and due from banks $996 $923 $1,081 $976 $997 $73 8% ($1) —% Interest-bearing cash and due from banks 2,039 1,513 2,993 3,015 2,868 526 35 (829) (29) Interest-bearing deposits in banks 186 167 148 142 114 19 11 72 63 Debt securities available for sale, at fair value 21,698 21,504 19,895 20,152 20,157 194 1 1,541 8 Debt securities held to maturity 3,447 3,345 4,165 4,284 4,417 102 3 (970) (22) Equity securities, at fair value 47 198 181 175 170 (151) (76) (123) (72) Equity securities, at cost 706 604 834 874 769 102 17 (63) (8) Loans held for sale, at fair value 1,750 1,186 1,219 1,303 521 564 48 1,229 236 Other loans held for sale 455 66 101 27 189 389 NM 266 141 Loans and leases 116,838 117,615 116,660 114,720 113,407 (777) (1) 3,431 3 Less: Allowance for loan and lease losses (1,227) (1,245) (1,242) (1,242) (1,253) 18 1 26 2 Net loans and leases 115,611 116,370 115,418 113,478 112,154 (759) (1) 3,457 3 Derivative assets 833 465 317 173 224 368 79 609 NM Premises and equipment 740 746 791 753 720 (6) (1) 20 3 Bank-owned life insurance 1,711 1,705 1,698 1,687 1,677 6 — 34 2 Goodwill 7,040 7,040 6,923 6,946 6,887 — — 153 2 Due from broker 249 92 — — — 157 171 249 100 Other assets 5,241 5,418 4,754 4,613 3,567 (177) (3) 1,674 47 TOTAL ASSETS $162,749 $161,342 $160,518 $158,598 $155,431 $1,407 1% $7,318 5% LIABILITIES AND STOCKHOLDERS' EQUITY LIABILITIES Deposits: Noninterest-bearing $28,192 $28,383 $29,458 $29,785 $29,439 ($191) (1%) ($1,247) (4%) Interest-bearing 95,812 95,533 90,117 87,290 87,634 279 — 8,178 9 Total deposits 124,004 123,916 119,575 117,075 117,073 88 — 6,931 6 1 Federal funds purchased and securities sold under agreements to repurchase 1,132 668 1,156 374 326 464 69 806 247 2 Other short-term borrowed funds 309 11 161 512 10 298 NM 299 NM Derivative liabilities 106 173 292 449 425 (67) (39) (319) (75) Deferred taxes, net 767 676 573 430 456 91 13 311 68 2 Long-term borrowed funds 11,538 11,725 15,925 17,133 15,130 (187) (2) (3,592) (24) Due to broker 257 93 — 381 — 164 176 257 100 Other liabilities 2,619 2,549 2,019 1,968 1,544 70 3 1,075 70 TOTAL LIABILITIES 140,732 139,811 139,701 138,322 134,964 921 1 5,768 4 STOCKHOLDERS' EQUITY Preferred stock: $25.00 par value, 100,000,000 shares authorized for each of the periods presented 1,133 1,132 840 543 543 1 — 590 109 Common stock: $0.01 par value, 1,000,000,000 shares authorized for each of the periods presented 6 6 6 6 6 — — — — Additional paid-in capital 18,860 18,847 18,815 18,816 18,806 13 — 54 — Retained earnings 5,959 5,672 5,385 5,062 4,755 287 5 1,204 25 Treasury stock, at cost (3,453) (3,333) (3,133) (2,833) (2,433) (120) (4) (1,020) (42) Accumulated other comprehensive loss (488) (793) (1,096) (1,318) (1,210) 305 38 722 60 TOTAL STOCKHOLDERS' EQUITY 22,017 21,531 20,817 20,276 20,467 486 2 1,550 8 TOTAL LIABILITIES AND STOCKHOLDERS' EQUITY $162,749 $161,342 $160,518 $158,598 $155,431 $1,407 1% $7,318 5% Memo: Total tangible common equity $14,141 $13,649 $13,389 $13,117 $13,394 $492 4% $747 6% 1 Balances are net of certain short-term receivables associated with reverse repurchase agreements. 2 Beginning in the first quarter of 2019, borrowed funds balances and the associated interest expense are based on original maturity. Prior periods have been adjusted to conform with the current period presentation. 6CONSOLIDATED BALANCE SHEETS (unaudited) (in millions) AS OF JUNE 30, 2019 CHANGE PERIOD-END BALANCES June 30, 2019 Mar 31, 2019 Dec 31, 2018 Sept 30, 2018 June 30, 2018 Mar 31, 2019 June 30, 2018 $ % $ % ASSETS Cash and due from banks $996 $923 $1,081 $976 $997 $73 8% ($1) —% Interest-bearing cash and due from banks 2,039 1,513 2,993 3,015 2,868 526 35 (829) (29) Interest-bearing deposits in banks 186 167 148 142 114 19 11 72 63 Debt securities available for sale, at fair value 21,698 21,504 19,895 20,152 20,157 194 1 1,541 8 Debt securities held to maturity 3,447 3,345 4,165 4,284 4,417 102 3 (970) (22) Equity securities, at fair value 47 198 181 175 170 (151) (76) (123) (72) Equity securities, at cost 706 604 834 874 769 102 17 (63) (8) Loans held for sale, at fair value 1,750 1,186 1,219 1,303 521 564 48 1,229 236 Other loans held for sale 455 66 101 27 189 389 NM 266 141 Loans and leases 116,838 117,615 116,660 114,720 113,407 (777) (1) 3,431 3 Less: Allowance for loan and lease losses (1,227) (1,245) (1,242) (1,242) (1,253) 18 1 26 2 Net loans and leases 115,611 116,370 115,418 113,478 112,154 (759) (1) 3,457 3 Derivative assets 833 465 317 173 224 368 79 609 NM Premises and equipment 740 746 791 753 720 (6) (1) 20 3 Bank-owned life insurance 1,711 1,705 1,698 1,687 1,677 6 — 34 2 Goodwill 7,040 7,040 6,923 6,946 6,887 — — 153 2 Due from broker 249 92 — — — 157 171 249 100 Other assets 5,241 5,418 4,754 4,613 3,567 (177) (3) 1,674 47 TOTAL ASSETS $162,749 $161,342 $160,518 $158,598 $155,431 $1,407 1% $7,318 5% LIABILITIES AND STOCKHOLDERS' EQUITY LIABILITIES Deposits: Noninterest-bearing $28,192 $28,383 $29,458 $29,785 $29,439 ($191) (1%) ($1,247) (4%) Interest-bearing 95,812 95,533 90,117 87,290 87,634 279 — 8,178 9 Total deposits 124,004 123,916 119,575 117,075 117,073 88 — 6,931 6 1 Federal funds purchased and securities sold under agreements to repurchase 1,132 668 1,156 374 326 464 69 806 247 2 Other short-term borrowed funds 309 11 161 512 10 298 NM 299 NM Derivative liabilities 106 173 292 449 425 (67) (39) (319) (75) Deferred taxes, net 767 676 573 430 456 91 13 311 68 2 Long-term borrowed funds 11,538 11,725 15,925 17,133 15,130 (187) (2) (3,592) (24) Due to broker 257 93 — 381 — 164 176 257 100 Other liabilities 2,619 2,549 2,019 1,968 1,544 70 3 1,075 70 TOTAL LIABILITIES 140,732 139,811 139,701 138,322 134,964 921 1 5,768 4 STOCKHOLDERS' EQUITY Preferred stock: $25.00 par value, 100,000,000 shares authorized for each of the periods presented 1,133 1,132 840 543 543 1 — 590 109 Common stock: $0.01 par value, 1,000,000,000 shares authorized for each of the periods presented 6 6 6 6 6 — — — — Additional paid-in capital 18,860 18,847 18,815 18,816 18,806 13 — 54 — Retained earnings 5,959 5,672 5,385 5,062 4,755 287 5 1,204 25 Treasury stock, at cost (3,453) (3,333) (3,133) (2,833) (2,433) (120) (4) (1,020) (42) Accumulated other comprehensive loss (488) (793) (1,096) (1,318) (1,210) 305 38 722 60 TOTAL STOCKHOLDERS' EQUITY 22,017 21,531 20,817 20,276 20,467 486 2 1,550 8 TOTAL LIABILITIES AND STOCKHOLDERS' EQUITY $162,749 $161,342 $160,518 $158,598 $155,431 $1,407 1% $7,318 5% Memo: Total tangible common equity $14,141 $13,649 $13,389 $13,117 $13,394 $492 4% $747 6% 1 Balances are net of certain short-term receivables associated with reverse repurchase agreements. 2 Beginning in the first quarter of 2019, borrowed funds balances and the associated interest expense are based on original maturity. Prior periods have been adjusted to conform with the current period presentation. 6
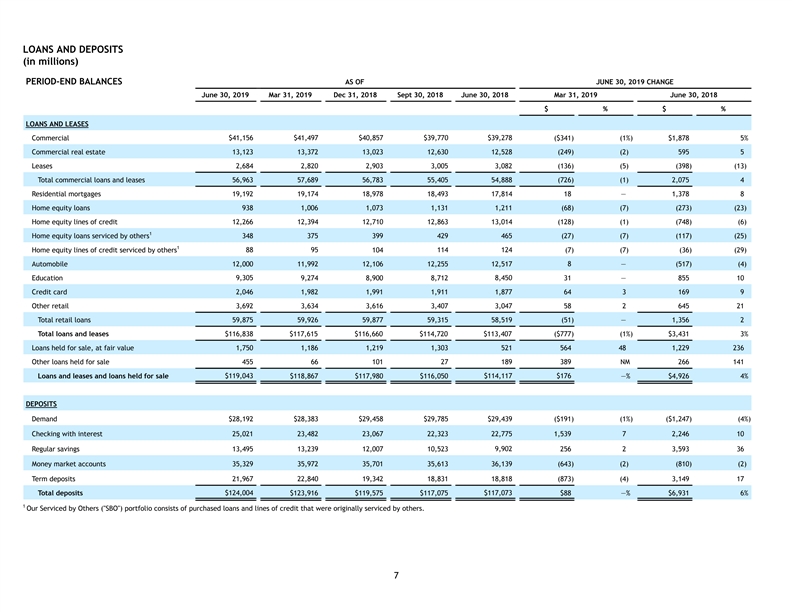
LOANS AND DEPOSITS (in millions) PERIOD-END BALANCES AS OF JUNE 30, 2019 CHANGE June 30, 2019 Mar 31, 2019 Dec 31, 2018 Sept 30, 2018 June 30, 2018 Mar 31, 2019 June 30, 2018 $ % $ % LOANS AND LEASES Commercial $41,156 $41,497 $40,857 $39,770 $39,278 ($341) (1%) $1,878 5% Commercial real estate 13,123 13,372 13,023 12,630 12,528 (249) (2) 595 5 Leases 2,684 2,820 2,903 3,005 3,082 (136) (5) (398) (13) Total commercial loans and leases 56,963 57,689 56,783 55,405 54,888 (726) (1) 2,075 4 Residential mortgages 19,192 19,174 18,978 18,493 17,814 18 — 1,378 8 Home equity loans 938 1,006 1,073 1,131 1,211 (68) (7) (273) (23) Home equity lines of credit 12,266 12,394 12,710 12,863 13,014 (128) (1) (748) (6) 1 Home equity loans serviced by others 348 375 399 429 465 (27) (7) (117) (25) 1 Home equity lines of credit serviced by others 88 95 104 114 124 (7) (7) (36) (29) Automobile 12,000 11,992 12,106 12,255 12,517 8 — (517) (4) Education 9,305 9,274 8,900 8,712 8,450 31 — 855 10 Credit card 2,046 1,982 1,991 1,911 1,877 64 3 169 9 Other retail 3,692 3,634 3,616 3,407 3,047 58 2 645 21 Total retail loans 59,875 59,926 59,877 59,315 58,519 (51) — 1,356 2 Total loans and leases $116,838 $117,615 $116,660 $114,720 $113,407 ($777) (1%) $3,431 3% Loans held for sale, at fair value 1,750 1,186 1,219 1,303 521 564 48 1,229 236 Other loans held for sale 455 66 101 27 189 389 NM 266 141 Loans and leases and loans held for sale $119,043 $118,867 $117,980 $116,050 $114,117 $176 —% $4,926 4% DEPOSITS Demand $28,192 $28,383 $29,458 $29,785 $29,439 ($191) (1%) ($1,247) (4%) Checking with interest 25,021 23,482 23,067 22,323 22,775 1,539 7 2,246 10 Regular savings 13,495 13,239 12,007 10,523 9,902 256 2 3,593 36 Money market accounts 35,329 35,972 35,701 35,613 36,139 (643) (2) (810) (2) Term deposits 21,967 22,840 19,342 18,831 18,818 (873) (4) 3,149 17 Total deposits $124,004 $123,916 $119,575 $117,075 $117,073 $88 —% $6,931 6% 1 Our Serviced by Others ( SBO ) portfolio consists of purchased loans and lines of credit that were originally serviced by others. 7LOANS AND DEPOSITS (in millions) PERIOD-END BALANCES AS OF JUNE 30, 2019 CHANGE June 30, 2019 Mar 31, 2019 Dec 31, 2018 Sept 30, 2018 June 30, 2018 Mar 31, 2019 June 30, 2018 $ % $ % LOANS AND LEASES Commercial $41,156 $41,497 $40,857 $39,770 $39,278 ($341) (1%) $1,878 5% Commercial real estate 13,123 13,372 13,023 12,630 12,528 (249) (2) 595 5 Leases 2,684 2,820 2,903 3,005 3,082 (136) (5) (398) (13) Total commercial loans and leases 56,963 57,689 56,783 55,405 54,888 (726) (1) 2,075 4 Residential mortgages 19,192 19,174 18,978 18,493 17,814 18 — 1,378 8 Home equity loans 938 1,006 1,073 1,131 1,211 (68) (7) (273) (23) Home equity lines of credit 12,266 12,394 12,710 12,863 13,014 (128) (1) (748) (6) 1 Home equity loans serviced by others 348 375 399 429 465 (27) (7) (117) (25) 1 Home equity lines of credit serviced by others 88 95 104 114 124 (7) (7) (36) (29) Automobile 12,000 11,992 12,106 12,255 12,517 8 — (517) (4) Education 9,305 9,274 8,900 8,712 8,450 31 — 855 10 Credit card 2,046 1,982 1,991 1,911 1,877 64 3 169 9 Other retail 3,692 3,634 3,616 3,407 3,047 58 2 645 21 Total retail loans 59,875 59,926 59,877 59,315 58,519 (51) — 1,356 2 Total loans and leases $116,838 $117,615 $116,660 $114,720 $113,407 ($777) (1%) $3,431 3% Loans held for sale, at fair value 1,750 1,186 1,219 1,303 521 564 48 1,229 236 Other loans held for sale 455 66 101 27 189 389 NM 266 141 Loans and leases and loans held for sale $119,043 $118,867 $117,980 $116,050 $114,117 $176 —% $4,926 4% DEPOSITS Demand $28,192 $28,383 $29,458 $29,785 $29,439 ($191) (1%) ($1,247) (4%) Checking with interest 25,021 23,482 23,067 22,323 22,775 1,539 7 2,246 10 Regular savings 13,495 13,239 12,007 10,523 9,902 256 2 3,593 36 Money market accounts 35,329 35,972 35,701 35,613 36,139 (643) (2) (810) (2) Term deposits 21,967 22,840 19,342 18,831 18,818 (873) (4) 3,149 17 Total deposits $124,004 $123,916 $119,575 $117,075 $117,073 $88 —% $6,931 6% 1 Our Serviced by Others ( SBO ) portfolio consists of purchased loans and lines of credit that were originally serviced by others. 7
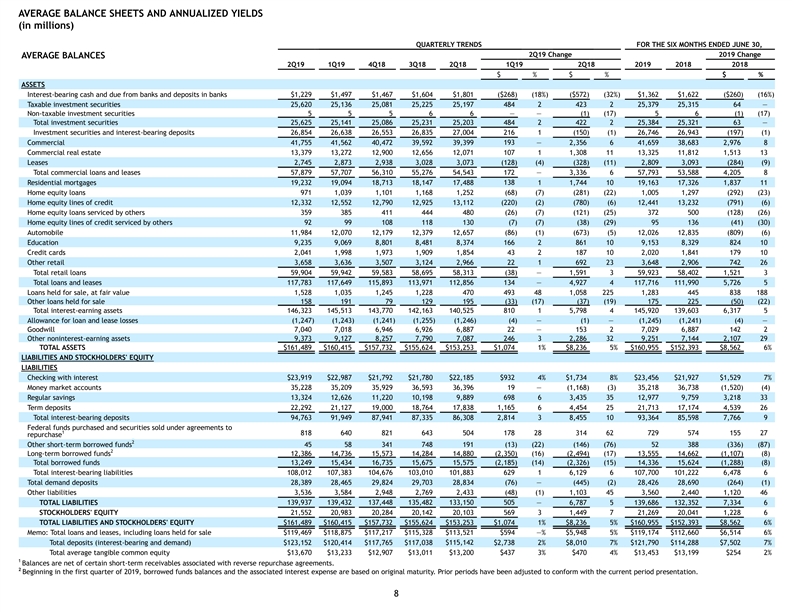
AVERAGE BALANCE SHEETS AND ANNUALIZED YIELDS (in millions) QUARTERLY TRENDS FOR THE SIX MONTHS ENDED JUNE 30, 2Q19 Change 2019 Change AVERAGE BALANCES 2Q19 1Q19 4Q18 3Q18 2Q18 1Q19 2Q18 2019 2018 2018 $ % $ % $ % ASSETS Interest-bearing cash and due from banks and deposits in banks $1,229 $1,497 $1,467 $1,604 $1,801 ($268) (18%) ($572) (32%) $1,362 $1,622 ($260) (16%) Taxable investment securities 25,620 25,136 25,081 25,225 25,197 484 2 423 2 25,379 25,315 64 — Non-taxable investment securities 5 5 5 6 6 — — (1) (17) 5 6 (1) (17) Total investment securities 25,625 25,141 25,086 25,231 25,203 484 2 422 2 25,384 25,321 63 — Investment securities and interest-bearing deposits 26,854 26,638 26,553 26,835 27,004 216 1 (150) (1) 26,746 26,943 (197) (1) Commercial 41,755 41,562 40,472 39,592 39,399 193 — 2,356 6 41,659 38,683 2,976 8 Commercial real estate 13,379 13,272 12,900 12,656 12,071 107 1 1,308 11 13,325 11,812 1,513 13 Leases 2,745 2,873 2,938 3,028 3,073 (128) (4) (328) (11) 2,809 3,093 (284) (9) Total commercial loans and leases 57,879 57,707 56,310 55,276 54,543 172 — 3,336 6 57,793 53,588 4,205 8 Residential mortgages 19,232 19,094 18,713 18,147 17,488 138 1 1,744 10 19,163 17,326 1,837 11 Home equity loans 971 1,039 1,101 1,168 1,252 (68) (7) (281) (22) 1,005 1,297 (292) (23) Home equity lines of credit 12,332 12,552 12,790 12,925 13,112 (220) (2) (780) (6) 12,441 13,232 (791) (6) Home equity loans serviced by others 359 385 411 444 480 (26) (7) (121) (25) 372 500 (128) (26) Home equity lines of credit serviced by others 92 99 108 118 130 (7) (7) (38) (29) 95 136 (41) (30) Automobile 11,984 12,070 12,179 12,379 12,657 (86) (1) (673) (5) 12,026 12,835 (809) (6) Education 9,235 9,069 8,801 8,481 8,374 166 2 861 10 9,153 8,329 824 10 Credit cards 2,041 1,998 1,973 1,909 1,854 43 2 187 10 2,020 1,841 179 10 Other retail 3,658 3,636 3,507 3,124 2,966 22 1 692 23 3,648 2,906 742 26 Total retail loans 59,904 59,942 59,583 58,695 58,313 (38) — 1,591 3 59,923 58,402 1,521 3 Total loans and leases 117,783 117,649 115,893 113,971 112,856 134 — 4,927 4 117,716 111,990 5,726 5 Loans held for sale, at fair value 1,528 1,035 1,245 1,228 470 493 48 1,058 225 1,283 445 838 188 Other loans held for sale 158 191 79 129 195 (33) (17) (37) (19) 175 225 (50) (22) Total interest-earning assets 146,323 145,513 143,770 142,163 140,525 810 1 5,798 4 145,920 139,603 6,317 5 Allowance for loan and lease losses (1,247) (1,243) (1,241) (1,255) (1,246) (4) — (1) — (1,245) (1,241) (4) — Goodwill 7,040 7,018 6,946 6,926 6,887 22 — 153 2 7,029 6,887 142 2 Other noninterest-earning assets 9,373 9,127 8,257 7,790 7,087 246 3 2,286 32 9,251 7,144 2,107 29 TOTAL ASSETS $161,489 $160,415 $157,732 $155,624 $153,253 $1,074 1% $8,236 5% $160,955 $152,393 $8,562 6% LIABILITIES AND STOCKHOLDERS' EQUITY LIABILITIES Checking with interest $23,919 $22,987 $21,792 $21,780 $22,185 $932 4% $1,734 8% $23,456 $21,927 $1,529 7% Money market accounts 35,228 35,209 35,929 36,593 36,396 19 — (1,168) (3) 35,218 36,738 (1,520) (4) Regular savings 13,324 12,626 11,220 10,198 9,889 698 6 3,435 35 12,977 9,759 3,218 33 Term deposits 22,292 21,127 19,000 18,764 17,838 1,165 6 4,454 25 21,713 17,174 4,539 26 Total interest-bearing deposits 94,763 91,949 87,941 87,335 86,308 2,814 3 8,455 10 93,364 85,598 7,766 9 Federal funds purchased and securities sold under agreements to 1 818 640 821 643 504 178 28 314 62 729 574 155 27 repurchase 2 Other short-term borrowed funds 45 58 341 748 191 (13) (22) (146) (76) 52 388 (336) (87) 2 Long-term borrowed funds 12,386 14,736 15,573 14,284 14,880 (2,350) (16) (2,494) (17) 13,555 14,662 (1,107) (8) Total borrowed funds 13,249 15,434 16,735 15,675 15,575 (2,185) (14) (2,326) (15) 14,336 15,624 (1,288) (8) Total interest-bearing liabilities 108,012 107,383 104,676 103,010 101,883 629 1 6,129 6 107,700 101,222 6,478 6 Total demand deposits 28,389 28,465 29,824 29,703 28,834 (76) — (445) (2) 28,426 28,690 (264) (1) Other liabilities 3,536 3,584 2,948 2,769 2,433 (48) (1) 1,103 45 3,560 2,440 1,120 46 TOTAL LIABILITIES 139,937 139,432 137,448 135,482 133,150 505 — 6,787 5 139,686 132,352 7,334 6 STOCKHOLDERS' EQUITY 21,552 20,983 20,284 20,142 20,103 569 3 1,449 7 21,269 20,041 1,228 6 TOTAL LIABILITIES AND STOCKHOLDERS' EQUITY $161,489 $160,415 $157,732 $155,624 $153,253 $1,074 1% $8,236 5% $160,955 $152,393 $8,562 6% Memo: Total loans and leases, including loans held for sale $119,469 $118,875 $117,217 $115,328 $113,521 $594 —% $5,948 5% $119,174 $112,660 $6,514 6% Total deposits (interest-bearing and demand) $123,152 $120,414 $117,765 $117,038 $115,142 $2,738 2% $8,010 7% $121,790 $114,288 $7,502 7% Total average tangible common equity $13,670 $13,233 $12,907 $13,011 $13,200 $437 3% $470 4% $13,453 $13,199 $254 2% 1 Balances are net of certain short-term receivables associated with reverse repurchase agreements. 2 Beginning in the first quarter of 2019, borrowed funds balances and the associated interest expense are based on original maturity. Prior periods have been adjusted to conform with the current period presentation. 8AVERAGE BALANCE SHEETS AND ANNUALIZED YIELDS (in millions) QUARTERLY TRENDS FOR THE SIX MONTHS ENDED JUNE 30, 2Q19 Change 2019 Change AVERAGE BALANCES 2Q19 1Q19 4Q18 3Q18 2Q18 1Q19 2Q18 2019 2018 2018 $ % $ % $ % ASSETS Interest-bearing cash and due from banks and deposits in banks $1,229 $1,497 $1,467 $1,604 $1,801 ($268) (18%) ($572) (32%) $1,362 $1,622 ($260) (16%) Taxable investment securities 25,620 25,136 25,081 25,225 25,197 484 2 423 2 25,379 25,315 64 — Non-taxable investment securities 5 5 5 6 6 — — (1) (17) 5 6 (1) (17) Total investment securities 25,625 25,141 25,086 25,231 25,203 484 2 422 2 25,384 25,321 63 — Investment securities and interest-bearing deposits 26,854 26,638 26,553 26,835 27,004 216 1 (150) (1) 26,746 26,943 (197) (1) Commercial 41,755 41,562 40,472 39,592 39,399 193 — 2,356 6 41,659 38,683 2,976 8 Commercial real estate 13,379 13,272 12,900 12,656 12,071 107 1 1,308 11 13,325 11,812 1,513 13 Leases 2,745 2,873 2,938 3,028 3,073 (128) (4) (328) (11) 2,809 3,093 (284) (9) Total commercial loans and leases 57,879 57,707 56,310 55,276 54,543 172 — 3,336 6 57,793 53,588 4,205 8 Residential mortgages 19,232 19,094 18,713 18,147 17,488 138 1 1,744 10 19,163 17,326 1,837 11 Home equity loans 971 1,039 1,101 1,168 1,252 (68) (7) (281) (22) 1,005 1,297 (292) (23) Home equity lines of credit 12,332 12,552 12,790 12,925 13,112 (220) (2) (780) (6) 12,441 13,232 (791) (6) Home equity loans serviced by others 359 385 411 444 480 (26) (7) (121) (25) 372 500 (128) (26) Home equity lines of credit serviced by others 92 99 108 118 130 (7) (7) (38) (29) 95 136 (41) (30) Automobile 11,984 12,070 12,179 12,379 12,657 (86) (1) (673) (5) 12,026 12,835 (809) (6) Education 9,235 9,069 8,801 8,481 8,374 166 2 861 10 9,153 8,329 824 10 Credit cards 2,041 1,998 1,973 1,909 1,854 43 2 187 10 2,020 1,841 179 10 Other retail 3,658 3,636 3,507 3,124 2,966 22 1 692 23 3,648 2,906 742 26 Total retail loans 59,904 59,942 59,583 58,695 58,313 (38) — 1,591 3 59,923 58,402 1,521 3 Total loans and leases 117,783 117,649 115,893 113,971 112,856 134 — 4,927 4 117,716 111,990 5,726 5 Loans held for sale, at fair value 1,528 1,035 1,245 1,228 470 493 48 1,058 225 1,283 445 838 188 Other loans held for sale 158 191 79 129 195 (33) (17) (37) (19) 175 225 (50) (22) Total interest-earning assets 146,323 145,513 143,770 142,163 140,525 810 1 5,798 4 145,920 139,603 6,317 5 Allowance for loan and lease losses (1,247) (1,243) (1,241) (1,255) (1,246) (4) — (1) — (1,245) (1,241) (4) — Goodwill 7,040 7,018 6,946 6,926 6,887 22 — 153 2 7,029 6,887 142 2 Other noninterest-earning assets 9,373 9,127 8,257 7,790 7,087 246 3 2,286 32 9,251 7,144 2,107 29 TOTAL ASSETS $161,489 $160,415 $157,732 $155,624 $153,253 $1,074 1% $8,236 5% $160,955 $152,393 $8,562 6% LIABILITIES AND STOCKHOLDERS' EQUITY LIABILITIES Checking with interest $23,919 $22,987 $21,792 $21,780 $22,185 $932 4% $1,734 8% $23,456 $21,927 $1,529 7% Money market accounts 35,228 35,209 35,929 36,593 36,396 19 — (1,168) (3) 35,218 36,738 (1,520) (4) Regular savings 13,324 12,626 11,220 10,198 9,889 698 6 3,435 35 12,977 9,759 3,218 33 Term deposits 22,292 21,127 19,000 18,764 17,838 1,165 6 4,454 25 21,713 17,174 4,539 26 Total interest-bearing deposits 94,763 91,949 87,941 87,335 86,308 2,814 3 8,455 10 93,364 85,598 7,766 9 Federal funds purchased and securities sold under agreements to 1 818 640 821 643 504 178 28 314 62 729 574 155 27 repurchase 2 Other short-term borrowed funds 45 58 341 748 191 (13) (22) (146) (76) 52 388 (336) (87) 2 Long-term borrowed funds 12,386 14,736 15,573 14,284 14,880 (2,350) (16) (2,494) (17) 13,555 14,662 (1,107) (8) Total borrowed funds 13,249 15,434 16,735 15,675 15,575 (2,185) (14) (2,326) (15) 14,336 15,624 (1,288) (8) Total interest-bearing liabilities 108,012 107,383 104,676 103,010 101,883 629 1 6,129 6 107,700 101,222 6,478 6 Total demand deposits 28,389 28,465 29,824 29,703 28,834 (76) — (445) (2) 28,426 28,690 (264) (1) Other liabilities 3,536 3,584 2,948 2,769 2,433 (48) (1) 1,103 45 3,560 2,440 1,120 46 TOTAL LIABILITIES 139,937 139,432 137,448 135,482 133,150 505 — 6,787 5 139,686 132,352 7,334 6 STOCKHOLDERS' EQUITY 21,552 20,983 20,284 20,142 20,103 569 3 1,449 7 21,269 20,041 1,228 6 TOTAL LIABILITIES AND STOCKHOLDERS' EQUITY $161,489 $160,415 $157,732 $155,624 $153,253 $1,074 1% $8,236 5% $160,955 $152,393 $8,562 6% Memo: Total loans and leases, including loans held for sale $119,469 $118,875 $117,217 $115,328 $113,521 $594 —% $5,948 5% $119,174 $112,660 $6,514 6% Total deposits (interest-bearing and demand) $123,152 $120,414 $117,765 $117,038 $115,142 $2,738 2% $8,010 7% $121,790 $114,288 $7,502 7% Total average tangible common equity $13,670 $13,233 $12,907 $13,011 $13,200 $437 3% $470 4% $13,453 $13,199 $254 2% 1 Balances are net of certain short-term receivables associated with reverse repurchase agreements. 2 Beginning in the first quarter of 2019, borrowed funds balances and the associated interest expense are based on original maturity. Prior periods have been adjusted to conform with the current period presentation. 8
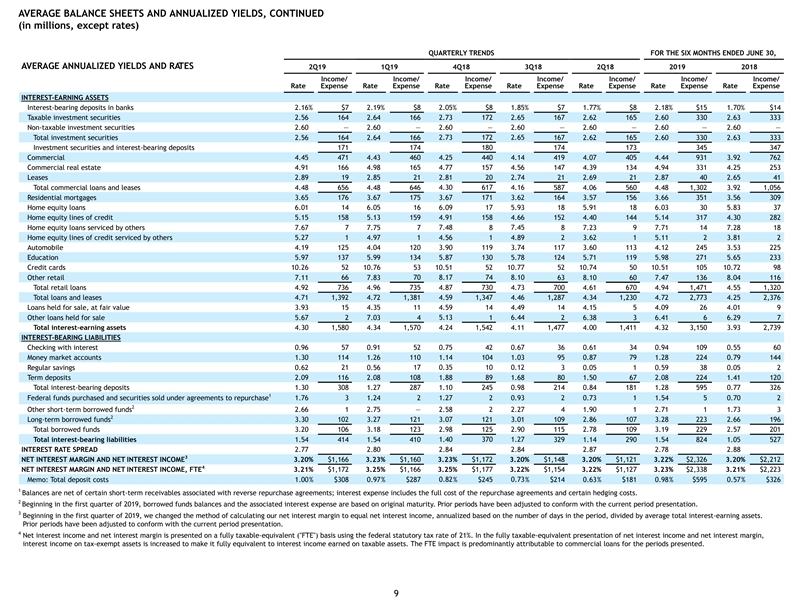
AVERAGE BALANCE SHEETS AND ANNUALIZED YIELDS, CONTINUED (in millions, except rates) QUARTERLY TRENDS FOR THE SIX MONTHS ENDED JUNE 30, AVERAGE ANNUALIZED YIELDS AND RATES 2Q19 1Q19 4Q18 3Q18 2Q18 2019 2018 Income/ Income/ Income/ Income/ Income/ Income/ Income/ Rate Expense Rate Expense Rate Expense Rate Expense Rate Expense Rate Expense Rate Expense INTEREST-EARNING ASSETS Interest-bearing deposits in banks 2.16% $7 2.19% $8 2.05% $8 1.85% $7 1.77% $8 2.18% $15 1.70% $14 Taxable investment securities 2.56 164 2.64 166 2.73 172 2.65 167 2.62 165 2.60 330 2.63 333 Non-taxable investment securities 2.60 — 2.60 — 2.60 — 2.60 — 2.60 — 2.60 — 2.60 — Total investment securities 2.56 164 2.64 166 2.73 172 2.65 167 2.62 165 2.60 330 2.63 333 Investment securities and interest-bearing deposits 171 174 180 174 173 345 347 Commercial 4.45 471 4.43 460 4.25 440 4.14 419 4.07 405 4.44 931 3.92 762 Commercial real estate 4.91 166 4.98 165 4.77 157 4.56 147 4.39 134 4.94 331 4.25 253 Leases 2.89 19 2.85 21 2.81 20 2.74 21 2.69 21 2.87 40 2.65 41 Total commercial loans and leases 4.48 656 4.48 646 4.30 617 4.16 587 4.06 560 4.48 1,302 3.92 1,056 Residential mortgages 3.65 176 3.67 175 3.67 171 3.62 164 3.57 156 3.66 351 3.56 309 Home equity loans 6.01 14 6.05 16 6.09 17 5.93 18 5.91 18 6.03 30 5.83 37 Home equity lines of credit 5.15 158 5.13 159 4.91 158 4.66 152 4.40 144 5.14 317 4.30 282 Home equity loans serviced by others 7.67 7 7.75 7 7.48 8 7.45 8 7.23 9 7.71 14 7.28 18 Home equity lines of credit serviced by others 5.27 1 4.97 1 4.56 1 4.89 2 3.62 1 5.11 2 3.81 2 Automobile 4.19 125 4.04 120 3.90 119 3.74 117 3.60 113 4.12 245 3.53 225 Education 5.97 137 5.99 134 5.87 130 5.78 124 5.71 119 5.98 271 5.65 233 Credit cards 10.26 52 10.76 53 10.51 52 10.77 52 10.74 50 10.51 105 10.72 98 Other retail 7.11 66 7.83 70 8.17 74 8.10 63 8.10 60 7.47 136 8.04 116 Total retail loans 4.92 736 4.96 735 4.87 730 4.73 700 4.61 670 4.94 1,471 4.55 1,320 Total loans and leases 4.71 1,392 4.72 1,381 4.59 1,347 4.46 1,287 4.34 1,230 4.72 2,773 4.25 2,376 Loans held for sale, at fair value 3.93 15 4.35 11 4.59 14 4.49 14 4.15 5 4.09 26 4.01 9 Other loans held for sale 5.67 2 7.03 4 5.13 1 6.44 2 6.38 3 6.41 6 6.29 7 Total interest-earning assets 4.30 1,580 4.34 1,570 4.24 1,542 4.11 1,477 4.00 1,411 4.32 3,150 3.93 2,739 INTEREST-BEARING LIABILITIES Checking with interest 0.96 57 0.91 52 0.75 42 0.67 36 0.61 34 0.94 109 0.55 60 Money market accounts 1.30 114 1.26 110 1.14 104 1.03 95 0.87 79 1.28 224 0.79 144 Regular savings 0.62 21 0.56 17 0.35 10 0.12 3 0.05 1 0.59 38 0.05 2 Term deposits 2.09 116 2.08 108 1.88 89 1.68 80 1.50 67 2.08 224 1.41 120 Total interest-bearing deposits 1.30 308 1.27 287 1.10 245 0.98 214 0.84 181 1.28 595 0.77 326 1 Federal funds purchased and securities sold under agreements to repurchase 1.76 3 1.24 2 1.27 2 0.93 2 0.73 1 1.54 5 0.70 2 2 Other short-term borrowed funds 2.66 1 2.75 — 2.58 2 2.27 4 1.90 1 2.71 1 1.73 3 2 Long-term borrowed funds 3.30 102 3.27 121 3.07 121 3.01 109 2.86 107 3.28 223 2.66 196 Total borrowed funds 3.20 106 3.18 123 2.98 125 2.90 115 2.78 109 3.19 229 2.57 201 Total interest-bearing liabilities 1.54 414 1.54 410 1.40 370 1.27 329 1.14 290 1.54 824 1.05 527 INTEREST RATE SPREAD 2.77 2.80 2.84 2.84 2.87 2.78 2.88 3 NET INTEREST MARGIN AND NET INTEREST INCOME 3.20% $1,166 3.23% $1,160 3.23% $1,172 3.20% $1,148 3.20% $1,121 3.22% $2,326 3.20% $2,212 4 NET INTEREST MARGIN AND NET INTEREST INCOME, FTE 3.21% $1,172 3.25% $1,166 3.25% $1,177 3.22% $1,154 3.22% $1,127 3.23% $2,338 3.21% $2,223 Memo: Total deposit costs 1.00% $308 0.97% $287 0.82% $245 0.73% $214 0.63% $181 0.98% $595 0.57% $326 1 Balances are net of certain short-term receivables associated with reverse repurchase agreements; interest expense includes the full cost of the repurchase agreements and certain hedging costs. 2 Beginning in the first quarter of 2019, borrowed funds balances and the associated interest expense are based on original maturity. Prior periods have been adjusted to conform with the current period presentation. 3 Beginning in the first quarter of 2019, we changed the method of calculating our net interest margin to equal net interest income, annualized based on the number of days in the period, divided by average total interest-earning assets. Prior periods have been adjusted to conform with the current period presentation. 4 Net interest income and net interest margin is presented on a fully taxable-equivalent ( FTE ) basis using the federal statutory tax rate of 21%. In the fully taxable-equivalent presentation of net interest income and net interest margin, interest income on tax-exempt assets is increased to make it fully equivalent to interest income earned on taxable assets. The FTE impact is predominantly attributable to commercial loans for the periods presented. 9AVERAGE BALANCE SHEETS AND ANNUALIZED YIELDS, CONTINUED (in millions, except rates) QUARTERLY TRENDS FOR THE SIX MONTHS ENDED JUNE 30, AVERAGE ANNUALIZED YIELDS AND RATES 2Q19 1Q19 4Q18 3Q18 2Q18 2019 2018 Income/ Income/ Income/ Income/ Income/ Income/ Income/ Rate Expense Rate Expense Rate Expense Rate Expense Rate Expense Rate Expense Rate Expense INTEREST-EARNING ASSETS Interest-bearing deposits in banks 2.16% $7 2.19% $8 2.05% $8 1.85% $7 1.77% $8 2.18% $15 1.70% $14 Taxable investment securities 2.56 164 2.64 166 2.73 172 2.65 167 2.62 165 2.60 330 2.63 333 Non-taxable investment securities 2.60 — 2.60 — 2.60 — 2.60 — 2.60 — 2.60 — 2.60 — Total investment securities 2.56 164 2.64 166 2.73 172 2.65 167 2.62 165 2.60 330 2.63 333 Investment securities and interest-bearing deposits 171 174 180 174 173 345 347 Commercial 4.45 471 4.43 460 4.25 440 4.14 419 4.07 405 4.44 931 3.92 762 Commercial real estate 4.91 166 4.98 165 4.77 157 4.56 147 4.39 134 4.94 331 4.25 253 Leases 2.89 19 2.85 21 2.81 20 2.74 21 2.69 21 2.87 40 2.65 41 Total commercial loans and leases 4.48 656 4.48 646 4.30 617 4.16 587 4.06 560 4.48 1,302 3.92 1,056 Residential mortgages 3.65 176 3.67 175 3.67 171 3.62 164 3.57 156 3.66 351 3.56 309 Home equity loans 6.01 14 6.05 16 6.09 17 5.93 18 5.91 18 6.03 30 5.83 37 Home equity lines of credit 5.15 158 5.13 159 4.91 158 4.66 152 4.40 144 5.14 317 4.30 282 Home equity loans serviced by others 7.67 7 7.75 7 7.48 8 7.45 8 7.23 9 7.71 14 7.28 18 Home equity lines of credit serviced by others 5.27 1 4.97 1 4.56 1 4.89 2 3.62 1 5.11 2 3.81 2 Automobile 4.19 125 4.04 120 3.90 119 3.74 117 3.60 113 4.12 245 3.53 225 Education 5.97 137 5.99 134 5.87 130 5.78 124 5.71 119 5.98 271 5.65 233 Credit cards 10.26 52 10.76 53 10.51 52 10.77 52 10.74 50 10.51 105 10.72 98 Other retail 7.11 66 7.83 70 8.17 74 8.10 63 8.10 60 7.47 136 8.04 116 Total retail loans 4.92 736 4.96 735 4.87 730 4.73 700 4.61 670 4.94 1,471 4.55 1,320 Total loans and leases 4.71 1,392 4.72 1,381 4.59 1,347 4.46 1,287 4.34 1,230 4.72 2,773 4.25 2,376 Loans held for sale, at fair value 3.93 15 4.35 11 4.59 14 4.49 14 4.15 5 4.09 26 4.01 9 Other loans held for sale 5.67 2 7.03 4 5.13 1 6.44 2 6.38 3 6.41 6 6.29 7 Total interest-earning assets 4.30 1,580 4.34 1,570 4.24 1,542 4.11 1,477 4.00 1,411 4.32 3,150 3.93 2,739 INTEREST-BEARING LIABILITIES Checking with interest 0.96 57 0.91 52 0.75 42 0.67 36 0.61 34 0.94 109 0.55 60 Money market accounts 1.30 114 1.26 110 1.14 104 1.03 95 0.87 79 1.28 224 0.79 144 Regular savings 0.62 21 0.56 17 0.35 10 0.12 3 0.05 1 0.59 38 0.05 2 Term deposits 2.09 116 2.08 108 1.88 89 1.68 80 1.50 67 2.08 224 1.41 120 Total interest-bearing deposits 1.30 308 1.27 287 1.10 245 0.98 214 0.84 181 1.28 595 0.77 326 1 Federal funds purchased and securities sold under agreements to repurchase 1.76 3 1.24 2 1.27 2 0.93 2 0.73 1 1.54 5 0.70 2 2 Other short-term borrowed funds 2.66 1 2.75 — 2.58 2 2.27 4 1.90 1 2.71 1 1.73 3 2 Long-term borrowed funds 3.30 102 3.27 121 3.07 121 3.01 109 2.86 107 3.28 223 2.66 196 Total borrowed funds 3.20 106 3.18 123 2.98 125 2.90 115 2.78 109 3.19 229 2.57 201 Total interest-bearing liabilities 1.54 414 1.54 410 1.40 370 1.27 329 1.14 290 1.54 824 1.05 527 INTEREST RATE SPREAD 2.77 2.80 2.84 2.84 2.87 2.78 2.88 3 NET INTEREST MARGIN AND NET INTEREST INCOME 3.20% $1,166 3.23% $1,160 3.23% $1,172 3.20% $1,148 3.20% $1,121 3.22% $2,326 3.20% $2,212 4 NET INTEREST MARGIN AND NET INTEREST INCOME, FTE 3.21% $1,172 3.25% $1,166 3.25% $1,177 3.22% $1,154 3.22% $1,127 3.23% $2,338 3.21% $2,223 Memo: Total deposit costs 1.00% $308 0.97% $287 0.82% $245 0.73% $214 0.63% $181 0.98% $595 0.57% $326 1 Balances are net of certain short-term receivables associated with reverse repurchase agreements; interest expense includes the full cost of the repurchase agreements and certain hedging costs. 2 Beginning in the first quarter of 2019, borrowed funds balances and the associated interest expense are based on original maturity. Prior periods have been adjusted to conform with the current period presentation. 3 Beginning in the first quarter of 2019, we changed the method of calculating our net interest margin to equal net interest income, annualized based on the number of days in the period, divided by average total interest-earning assets. Prior periods have been adjusted to conform with the current period presentation. 4 Net interest income and net interest margin is presented on a fully taxable-equivalent ( FTE ) basis using the federal statutory tax rate of 21%. In the fully taxable-equivalent presentation of net interest income and net interest margin, interest income on tax-exempt assets is increased to make it fully equivalent to interest income earned on taxable assets. The FTE impact is predominantly attributable to commercial loans for the periods presented. 9

SEGMENT FINANCIAL HIGHLIGHTS - CONSOLIDATING (in millions, except ratio data) SECOND QUARTER 2019 FIRST QUARTER 2019 CHANGE 2Q19 from 1Q19 Consumer Commercial Consumer Commercial 1 1 Banking Banking Other Consolidated Banking Banking Other Consolidated $/bps % Net interest income $799 $371 ($4) $1,166 $788 $372 $— $1,160 $6 1% Noninterest income 277 149 36 462 247 150 31 428 34 8 Total revenue 1,076 520 32 1,628 1,035 522 31 1,588 40 3 Noninterest expense 715 217 19 951 700 209 28 937 14 1 Profit before provision for credit losses 361 303 13 677 335 313 3 651 26 4 Provision for credit losses 78 25 (6) 97 67 21 (3) 85 12 14 Income before income tax expense (benefit) 283 278 19 580 268 292 6 566 14 2 Income tax expense (benefit) 70 62 (5) 127 66 65 (4) 127 — — Net income $213 $216 $24 $453 $202 $227 $10 $439 $14 3% AVERAGE BALANCES Total assets $65,485 $56,135 $39,869 $161,489 $65,007 $55,630 $39,778 $160,415 $1,074 1% 2 Total loans and leases 62,678 54,653 2,138 119,469 62,163 54,436 2,276 118,875 594 — Deposits 85,660 30,273 7,219 123,152 82,569 29,823 8,022 120,414 2,738 2 Interest-earning assets 62,731 54,950 28,642 146,323 62,216 54,724 28,573 145,513 810 1 KEY METRICS Net interest margin 5.11% 2.71% NM 3.20% 5.14% 2.76% NM 3.23% (3) bps Efficiency ratio 66.43 41.58 NM 58.41 67.62 40.11 NM 59.00 (59) bps Loans-to-deposits ratio (period-end balances) 71.13 173.48 NM 94.22 71.17 180.53 NM 94.92 (70) bps Loans-to-deposits ratio (average balances) 71.57 179.49 NM 95.64 74.27 181.23 NM 97.70 (206) bps Return on average total tangible assets 1.31 1.54 NM 1.17 1.26 1.66 NM 1.16 1 bps 1 Includes the financial impact of non-core, liquidating loan portfolios and other non-core assets, our treasury activities, wholesale funding activities, securities portfolio, community development assets and other unallocated assets, liabilities, capital, revenues, provision for credit losses, expenses and income tax expense, not attributed to our Consumer Banking or Commercial Banking segments. 2 Includes loans held for sale. 10SEGMENT FINANCIAL HIGHLIGHTS - CONSOLIDATING (in millions, except ratio data) SECOND QUARTER 2019 FIRST QUARTER 2019 CHANGE 2Q19 from 1Q19 Consumer Commercial Consumer Commercial 1 1 Banking Banking Other Consolidated Banking Banking Other Consolidated $/bps % Net interest income $799 $371 ($4) $1,166 $788 $372 $— $1,160 $6 1% Noninterest income 277 149 36 462 247 150 31 428 34 8 Total revenue 1,076 520 32 1,628 1,035 522 31 1,588 40 3 Noninterest expense 715 217 19 951 700 209 28 937 14 1 Profit before provision for credit losses 361 303 13 677 335 313 3 651 26 4 Provision for credit losses 78 25 (6) 97 67 21 (3) 85 12 14 Income before income tax expense (benefit) 283 278 19 580 268 292 6 566 14 2 Income tax expense (benefit) 70 62 (5) 127 66 65 (4) 127 — — Net income $213 $216 $24 $453 $202 $227 $10 $439 $14 3% AVERAGE BALANCES Total assets $65,485 $56,135 $39,869 $161,489 $65,007 $55,630 $39,778 $160,415 $1,074 1% 2 Total loans and leases 62,678 54,653 2,138 119,469 62,163 54,436 2,276 118,875 594 — Deposits 85,660 30,273 7,219 123,152 82,569 29,823 8,022 120,414 2,738 2 Interest-earning assets 62,731 54,950 28,642 146,323 62,216 54,724 28,573 145,513 810 1 KEY METRICS Net interest margin 5.11% 2.71% NM 3.20% 5.14% 2.76% NM 3.23% (3) bps Efficiency ratio 66.43 41.58 NM 58.41 67.62 40.11 NM 59.00 (59) bps Loans-to-deposits ratio (period-end balances) 71.13 173.48 NM 94.22 71.17 180.53 NM 94.92 (70) bps Loans-to-deposits ratio (average balances) 71.57 179.49 NM 95.64 74.27 181.23 NM 97.70 (206) bps Return on average total tangible assets 1.31 1.54 NM 1.17 1.26 1.66 NM 1.16 1 bps 1 Includes the financial impact of non-core, liquidating loan portfolios and other non-core assets, our treasury activities, wholesale funding activities, securities portfolio, community development assets and other unallocated assets, liabilities, capital, revenues, provision for credit losses, expenses and income tax expense, not attributed to our Consumer Banking or Commercial Banking segments. 2 Includes loans held for sale. 10
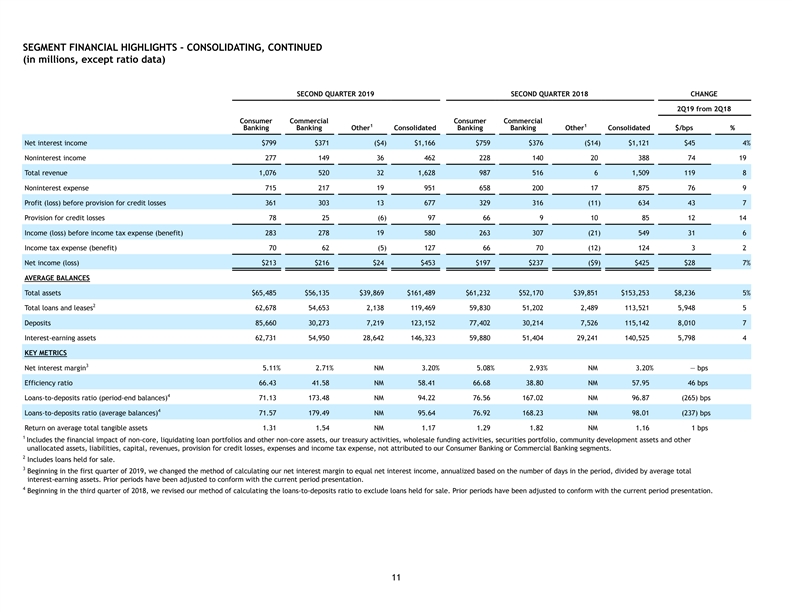
SEGMENT FINANCIAL HIGHLIGHTS - CONSOLIDATING, CONTINUED (in millions, except ratio data) SECOND QUARTER 2019 SECOND QUARTER 2018 CHANGE 2Q19 from 2Q18 Consumer Commercial Consumer Commercial 1 1 Banking Banking Other Consolidated Banking Banking Other Consolidated $/bps % Net interest income $799 $371 ($4) $1,166 $759 $376 ($14) $1,121 $45 4% Noninterest income 277 149 36 462 228 140 20 388 74 19 Total revenue 1,076 520 32 1,628 987 516 6 1,509 119 8 Noninterest expense 715 217 19 951 658 200 17 875 76 9 Profit (loss) before provision for credit losses 361 303 13 677 329 316 (11) 634 43 7 Provision for credit losses 78 25 (6) 97 66 9 10 85 12 14 Income (loss) before income tax expense (benefit) 283 278 19 580 263 307 (21) 549 31 6 Income tax expense (benefit) 70 62 (5) 127 66 70 (12) 124 3 2 Net income (loss) $213 $216 $24 $453 $197 $237 ($9) $425 $28 7% AVERAGE BALANCES Total assets $65,485 $56,135 $39,869 $161,489 $61,232 $52,170 $39,851 $153,253 $8,236 5% 2 Total loans and leases 62,678 54,653 2,138 119,469 59,830 51,202 2,489 113,521 5,948 5 Deposits 85,660 30,273 7,219 123,152 77,402 30,214 7,526 115,142 8,010 7 Interest-earning assets 62,731 54,950 28,642 146,323 59,880 51,404 29,241 140,525 5,798 4 KEY METRICS 3 Net interest margin 5.11% 2.71% NM 3.20% 5.08% 2.93% NM 3.20% — bps Efficiency ratio 66.43 41.58 NM 58.41 66.68 38.80 NM 57.95 46 bps 4 Loans-to-deposits ratio (period-end balances) 71.13 173.48 NM 94.22 76.56 167.02 NM 96.87 (265) bps 4 Loans-to-deposits ratio (average balances) 71.57 179.49 NM 95.64 76.92 168.23 NM 98.01 (237) bps Return on average total tangible assets 1.31 1.54 NM 1.17 1.29 1.82 NM 1.16 1 bps 1 Includes the financial impact of non-core, liquidating loan portfolios and other non-core assets, our treasury activities, wholesale funding activities, securities portfolio, community development assets and other unallocated assets, liabilities, capital, revenues, provision for credit losses, expenses and income tax expense, not attributed to our Consumer Banking or Commercial Banking segments. 2 Includes loans held for sale. 3 Beginning in the first quarter of 2019, we changed the method of calculating our net interest margin to equal net interest income, annualized based on the number of days in the period, divided by average total interest-earning assets. Prior periods have been adjusted to conform with the current period presentation. 4 Beginning in the third quarter of 2018, we revised our method of calculating the loans-to-deposits ratio to exclude loans held for sale. Prior periods have been adjusted to conform with the current period presentation. 11SEGMENT FINANCIAL HIGHLIGHTS - CONSOLIDATING, CONTINUED (in millions, except ratio data) SECOND QUARTER 2019 SECOND QUARTER 2018 CHANGE 2Q19 from 2Q18 Consumer Commercial Consumer Commercial 1 1 Banking Banking Other Consolidated Banking Banking Other Consolidated $/bps % Net interest income $799 $371 ($4) $1,166 $759 $376 ($14) $1,121 $45 4% Noninterest income 277 149 36 462 228 140 20 388 74 19 Total revenue 1,076 520 32 1,628 987 516 6 1,509 119 8 Noninterest expense 715 217 19 951 658 200 17 875 76 9 Profit (loss) before provision for credit losses 361 303 13 677 329 316 (11) 634 43 7 Provision for credit losses 78 25 (6) 97 66 9 10 85 12 14 Income (loss) before income tax expense (benefit) 283 278 19 580 263 307 (21) 549 31 6 Income tax expense (benefit) 70 62 (5) 127 66 70 (12) 124 3 2 Net income (loss) $213 $216 $24 $453 $197 $237 ($9) $425 $28 7% AVERAGE BALANCES Total assets $65,485 $56,135 $39,869 $161,489 $61,232 $52,170 $39,851 $153,253 $8,236 5% 2 Total loans and leases 62,678 54,653 2,138 119,469 59,830 51,202 2,489 113,521 5,948 5 Deposits 85,660 30,273 7,219 123,152 77,402 30,214 7,526 115,142 8,010 7 Interest-earning assets 62,731 54,950 28,642 146,323 59,880 51,404 29,241 140,525 5,798 4 KEY METRICS 3 Net interest margin 5.11% 2.71% NM 3.20% 5.08% 2.93% NM 3.20% — bps Efficiency ratio 66.43 41.58 NM 58.41 66.68 38.80 NM 57.95 46 bps 4 Loans-to-deposits ratio (period-end balances) 71.13 173.48 NM 94.22 76.56 167.02 NM 96.87 (265) bps 4 Loans-to-deposits ratio (average balances) 71.57 179.49 NM 95.64 76.92 168.23 NM 98.01 (237) bps Return on average total tangible assets 1.31 1.54 NM 1.17 1.29 1.82 NM 1.16 1 bps 1 Includes the financial impact of non-core, liquidating loan portfolios and other non-core assets, our treasury activities, wholesale funding activities, securities portfolio, community development assets and other unallocated assets, liabilities, capital, revenues, provision for credit losses, expenses and income tax expense, not attributed to our Consumer Banking or Commercial Banking segments. 2 Includes loans held for sale. 3 Beginning in the first quarter of 2019, we changed the method of calculating our net interest margin to equal net interest income, annualized based on the number of days in the period, divided by average total interest-earning assets. Prior periods have been adjusted to conform with the current period presentation. 4 Beginning in the third quarter of 2018, we revised our method of calculating the loans-to-deposits ratio to exclude loans held for sale. Prior periods have been adjusted to conform with the current period presentation. 11

SEGMENT FINANCIAL HIGHLIGHTS - CONSOLIDATING, CONTINUED (in millions, except ratio data) FOR THE SIX MONTHS ENDED JUNE 30, 2019 FOR THE SIX MONTHS ENDED JUNE 30, 2018 CHANGE 2019 from 2018 Consumer Commercial Consumer Commercial 1 1 Banking Banking Other Consolidated Banking Banking Other Consolidated $/bps % Net interest income $1,587 $743 ($4) $2,326 $1,492 $733 ($13) $2,212 $114 5% Noninterest income 524 299 67 890 450 265 44 759 131 17 Total revenue 2,111 1,042 63 3,216 1,942 998 31 2,971 245 8 Noninterest expense 1,415 426 47 1,888 1,314 408 36 1,758 130 7 Profit (loss) before provision for credit losses 696 616 16 1,328 628 590 (5) 1,213 115 9 Provision for credit losses 145 46 (9) 182 138 5 20 163 19 12 Income (loss) before income tax expense (benefit) 551 570 25 1,146 490 585 (25) 1,050 96 9 Income tax expense (benefit) 136 127 (9) 254 123 133 (19) 237 17 7 Net income (loss) $415 $443 $34 $892 $367 $452 ($6) $813 $79 10% AVERAGE BALANCES Total assets $65,247 $55,884 $39,824 $160,955 $61,290 $51,286 $39,817 $152,393 $8,562 6% 2 Total loans and leases 62,422 54,545 2,207 119,174 59,886 50,249 2,525 112,660 6,514 6 Deposits 84,123 30,050 7,617 121,790 76,414 30,488 7,386 114,288 7,502 7 Interest-earning assets 62,475 54,838 28,607 145,920 59,937 50,447 29,219 139,603 6,317 5 KEY METRICS 3 Net interest margin 5.12% 2.73% NM 3.22% 5.02% 2.93% NM 3.20% 2 bps Efficiency ratio 67.01 40.84 NM 58.70 67.68 40.86 NM 59.17 (47) bps 4 Loans-to-deposits ratio (period-end balances) 71.13 173.48 NM 94.22 76.56 167.02 NM 96.87 (265) bps 4 Loans-to-deposits ratio (average balances) 72.89 180.35 NM 96.65 78.01 163.52 NM 97.99 (134) bps Return on average total tangible assets 1.29 1.60 NM 1.17 1.21 1.78 NM 1.12 5 bps 1 Includes the financial impact of non-core, liquidating loan portfolios and other non-core assets, our treasury activities, wholesale funding activities, securities portfolio, community development assets and other unallocated assets, liabilities, capital, revenues, provision for credit losses, expenses and income tax expense, not attributed to our Consumer Banking or Commercial Banking segments. 2 Includes loans held for sale. 3 Beginning in the first quarter of 2019, we changed the method of calculating our net interest margin to equal net interest income, annualized based on the number of days in the period, divided by average total interest-earning assets. Prior periods have been adjusted to conform with the current period presentation. 4 Beginning in the third quarter of 2018, we revised our method of calculating the loans-to-deposits ratio to exclude loans held for sale. Prior periods have been adjusted to conform with the current period presentation. 12SEGMENT FINANCIAL HIGHLIGHTS - CONSOLIDATING, CONTINUED (in millions, except ratio data) FOR THE SIX MONTHS ENDED JUNE 30, 2019 FOR THE SIX MONTHS ENDED JUNE 30, 2018 CHANGE 2019 from 2018 Consumer Commercial Consumer Commercial 1 1 Banking Banking Other Consolidated Banking Banking Other Consolidated $/bps % Net interest income $1,587 $743 ($4) $2,326 $1,492 $733 ($13) $2,212 $114 5% Noninterest income 524 299 67 890 450 265 44 759 131 17 Total revenue 2,111 1,042 63 3,216 1,942 998 31 2,971 245 8 Noninterest expense 1,415 426 47 1,888 1,314 408 36 1,758 130 7 Profit (loss) before provision for credit losses 696 616 16 1,328 628 590 (5) 1,213 115 9 Provision for credit losses 145 46 (9) 182 138 5 20 163 19 12 Income (loss) before income tax expense (benefit) 551 570 25 1,146 490 585 (25) 1,050 96 9 Income tax expense (benefit) 136 127 (9) 254 123 133 (19) 237 17 7 Net income (loss) $415 $443 $34 $892 $367 $452 ($6) $813 $79 10% AVERAGE BALANCES Total assets $65,247 $55,884 $39,824 $160,955 $61,290 $51,286 $39,817 $152,393 $8,562 6% 2 Total loans and leases 62,422 54,545 2,207 119,174 59,886 50,249 2,525 112,660 6,514 6 Deposits 84,123 30,050 7,617 121,790 76,414 30,488 7,386 114,288 7,502 7 Interest-earning assets 62,475 54,838 28,607 145,920 59,937 50,447 29,219 139,603 6,317 5 KEY METRICS 3 Net interest margin 5.12% 2.73% NM 3.22% 5.02% 2.93% NM 3.20% 2 bps Efficiency ratio 67.01 40.84 NM 58.70 67.68 40.86 NM 59.17 (47) bps 4 Loans-to-deposits ratio (period-end balances) 71.13 173.48 NM 94.22 76.56 167.02 NM 96.87 (265) bps 4 Loans-to-deposits ratio (average balances) 72.89 180.35 NM 96.65 78.01 163.52 NM 97.99 (134) bps Return on average total tangible assets 1.29 1.60 NM 1.17 1.21 1.78 NM 1.12 5 bps 1 Includes the financial impact of non-core, liquidating loan portfolios and other non-core assets, our treasury activities, wholesale funding activities, securities portfolio, community development assets and other unallocated assets, liabilities, capital, revenues, provision for credit losses, expenses and income tax expense, not attributed to our Consumer Banking or Commercial Banking segments. 2 Includes loans held for sale. 3 Beginning in the first quarter of 2019, we changed the method of calculating our net interest margin to equal net interest income, annualized based on the number of days in the period, divided by average total interest-earning assets. Prior periods have been adjusted to conform with the current period presentation. 4 Beginning in the third quarter of 2018, we revised our method of calculating the loans-to-deposits ratio to exclude loans held for sale. Prior periods have been adjusted to conform with the current period presentation. 12

SEGMENT FINANCIAL HIGHLIGHTS - CONSUMER BANKING (in millions, except ratio data) QUARTERLY TRENDS FOR THE SIX MONTHS ENDED JUNE 30, CONSUMER BANKING 2Q19 Change 2019 Change 2Q19 1Q19 4Q18 3Q18 2Q18 1Q19 2Q18 2019 2018 2018 $/bps % $/bps % $/bps % Net interest income $799 $788 $796 $776 $759 $11 1% $40 5% $1,587 $1,492 $95 6% Noninterest income 277 247 265 258 228 30 12 49 21 524 450 74 16 Total revenue 1,076 1,035 1,061 1,034 987 41 4 89 9 2,111 1,942 169 9 Noninterest expense 715 700 723 686 658 15 2 57 9 1,415 1,314 101 8 Profit before provision for credit losses 361 335 338 348 329 26 8 32 10 696 628 68 11 Provision for credit losses 78 67 80 71 66 11 16 12 18 145 138 7 5 Income before income tax expense 283 268 258 277 263 15 6 20 8 551 490 61 12 Income tax expense 70 66 65 70 66 4 6 4 6 136 123 13 11 Net income $213 $202 $193 $207 $197 $11 5% $16 8% $415 $367 $48 13% AVERAGE BALANCES Total assets $65,485 $65,007 $64,187 $62,974 $61,232 $478 1% $4,253 7% $65,247 $61,290 $3,957 6% 1 Total loans and leases 62,678 62,163 61,920 61,045 59,830 515 1 2,848 5 62,422 59,886 2,536 4 Deposits 85,660 82,569 79,174 78,128 77,402 3,091 4 8,258 11 84,123 76,414 7,709 10 Interest-earning assets 62,731 62,216 61,975 61,097 59,880 515 1 2,851 5 62,475 59,937 2,538 4 KEY METRICS Net interest margin 5.11% 5.14% 5.09% 5.04% 5.08% (3) bps 3 bps 5.12% 5.02% 10 bps Efficiency ratio 66.43 67.62 68.22 66.29 66.68 (119) bps (25) bps 67.01 67.68 (67) bps 2 Loans-to-deposits ratio (period-end balances) 71.13 71.17 76.02 77.15 76.56 (4) bps (543) bps 71.13 76.56 (543) bps 2 Loans-to-deposits ratio (average balances) 71.57 74.27 76.91 76.79 76.92 (270) bps (535) bps 72.89 78.01 (512) bps Return on average total tangible assets 1.31 1.26 1.19 1.31 1.29 5 bps 2 bps 1.29 1.21 8 bps 1 Includes loans held for sale. 2 Beginning in the third quarter of 2018, we revised our method of calculating the loans-to-deposits ratio to exclude loans held for sale. Prior periods have been adjusted to conform with the current period presentation. 13SEGMENT FINANCIAL HIGHLIGHTS - CONSUMER BANKING (in millions, except ratio data) QUARTERLY TRENDS FOR THE SIX MONTHS ENDED JUNE 30, CONSUMER BANKING 2Q19 Change 2019 Change 2Q19 1Q19 4Q18 3Q18 2Q18 1Q19 2Q18 2019 2018 2018 $/bps % $/bps % $/bps % Net interest income $799 $788 $796 $776 $759 $11 1% $40 5% $1,587 $1,492 $95 6% Noninterest income 277 247 265 258 228 30 12 49 21 524 450 74 16 Total revenue 1,076 1,035 1,061 1,034 987 41 4 89 9 2,111 1,942 169 9 Noninterest expense 715 700 723 686 658 15 2 57 9 1,415 1,314 101 8 Profit before provision for credit losses 361 335 338 348 329 26 8 32 10 696 628 68 11 Provision for credit losses 78 67 80 71 66 11 16 12 18 145 138 7 5 Income before income tax expense 283 268 258 277 263 15 6 20 8 551 490 61 12 Income tax expense 70 66 65 70 66 4 6 4 6 136 123 13 11 Net income $213 $202 $193 $207 $197 $11 5% $16 8% $415 $367 $48 13% AVERAGE BALANCES Total assets $65,485 $65,007 $64,187 $62,974 $61,232 $478 1% $4,253 7% $65,247 $61,290 $3,957 6% 1 Total loans and leases 62,678 62,163 61,920 61,045 59,830 515 1 2,848 5 62,422 59,886 2,536 4 Deposits 85,660 82,569 79,174 78,128 77,402 3,091 4 8,258 11 84,123 76,414 7,709 10 Interest-earning assets 62,731 62,216 61,975 61,097 59,880 515 1 2,851 5 62,475 59,937 2,538 4 KEY METRICS Net interest margin 5.11% 5.14% 5.09% 5.04% 5.08% (3) bps 3 bps 5.12% 5.02% 10 bps Efficiency ratio 66.43 67.62 68.22 66.29 66.68 (119) bps (25) bps 67.01 67.68 (67) bps 2 Loans-to-deposits ratio (period-end balances) 71.13 71.17 76.02 77.15 76.56 (4) bps (543) bps 71.13 76.56 (543) bps 2 Loans-to-deposits ratio (average balances) 71.57 74.27 76.91 76.79 76.92 (270) bps (535) bps 72.89 78.01 (512) bps Return on average total tangible assets 1.31 1.26 1.19 1.31 1.29 5 bps 2 bps 1.29 1.21 8 bps 1 Includes loans held for sale. 2 Beginning in the third quarter of 2018, we revised our method of calculating the loans-to-deposits ratio to exclude loans held for sale. Prior periods have been adjusted to conform with the current period presentation. 13

SEGMENT FINANCIAL HIGHLIGHTS - CONSUMER BANKING, CONTINUED (in millions, except ratio data) QUARTERLY TRENDS FOR THE SIX MONTHS ENDED JUNE 30, 2Q19 Change 2019 Change 2Q19 1Q19 4Q18 3Q18 2Q18 1Q19 2Q18 2019 2018 2018 $/bps % $/bps % $/bps % 1 MORTGAGE BANKING FEES Production revenue $49 $31 $28 $31 $18 $18 58% $31 172% $80 $33 $47 142% Mortgage servicing revenue 9 14 21 16 9 (5) (36) — — 23 16 7 44 MSR valuation changes, net of hedge impact 4 (2) 2 2 — 6 NM 4 100 2 3 (1) (33) Total mortgage banking fees $62 $43 $51 $49 $27 $19 44% $35 130% $105 $52 $53 102% 1 Gain on sale of secondary originations 1.13% 1.28% 0.82% 0.96% 2.24% (15) bps (111) bps 1.18% 2.21% (103) bps 1 RESIDENTIAL REAL ESTATE ORIGINATIONS Retail $2,115 $1,313 $1,693 $1,939 $1,729 $802 61% $386 22% $3,428 $3,096 $332 11% Third Party 3,921 2,260 2,880 2,178 — 1,661 73 3,921 100 6,181 — 6,181 100 Total $6,036 $3,573 $4,573 $4,117 $1,729 $2,463 69% $4,307 249% $9,609 $3,096 $6,513 210% Originated for sale 81% 81% 80% 74% 42% — bps 3,900 bps 81% 44% 3,700 bps Originated for investment 19 19 20 26 58 — bps (3,900) bps 19 56 (3,700) bps Total 100% 100% 100% 100% 100% 100% 100% 1 MORTGAGE SERVICING INFORMATION (UPB) Loans serviced for others $72,518 $70,847 $69,593 $67,520 $21,589 $1,671 2% $50,929 236% $72,518 $21,589 $50,929 236% Owned loans serviced 19,258 18,437 18,298 17,709 16,553 821 4 2,705 16 19,258 16,553 2,705 16 Total $91,776 $89,284 $87,891 $85,229 $38,142 $2,492 3% $53,634 141% $91,776 $38,142 $53,634 141% 1 MSR CARRYING VALUE MSR at fair value $531 $563 $600 $612 $— ($32) (6%) $531 100% $531 $— $531 100% MSR at lower of cost or market 189 212 221 219 217 (23) (11) (28) (13) 189 217 (28) (13) Total $720 $775 $821 $831 $217 ($55) (7%) $503 232% $720 $217 $503 232% 1 Beginning in the third quarter of 2018, results reflect the impact of the August 1, 2018 Franklin American Mortgage Company acquisition. 14SEGMENT FINANCIAL HIGHLIGHTS - CONSUMER BANKING, CONTINUED (in millions, except ratio data) QUARTERLY TRENDS FOR THE SIX MONTHS ENDED JUNE 30, 2Q19 Change 2019 Change 2Q19 1Q19 4Q18 3Q18 2Q18 1Q19 2Q18 2019 2018 2018 $/bps % $/bps % $/bps % 1 MORTGAGE BANKING FEES Production revenue $49 $31 $28 $31 $18 $18 58% $31 172% $80 $33 $47 142% Mortgage servicing revenue 9 14 21 16 9 (5) (36) — — 23 16 7 44 MSR valuation changes, net of hedge impact 4 (2) 2 2 — 6 NM 4 100 2 3 (1) (33) Total mortgage banking fees $62 $43 $51 $49 $27 $19 44% $35 130% $105 $52 $53 102% 1 Gain on sale of secondary originations 1.13% 1.28% 0.82% 0.96% 2.24% (15) bps (111) bps 1.18% 2.21% (103) bps 1 RESIDENTIAL REAL ESTATE ORIGINATIONS Retail $2,115 $1,313 $1,693 $1,939 $1,729 $802 61% $386 22% $3,428 $3,096 $332 11% Third Party 3,921 2,260 2,880 2,178 — 1,661 73 3,921 100 6,181 — 6,181 100 Total $6,036 $3,573 $4,573 $4,117 $1,729 $2,463 69% $4,307 249% $9,609 $3,096 $6,513 210% Originated for sale 81% 81% 80% 74% 42% — bps 3,900 bps 81% 44% 3,700 bps Originated for investment 19 19 20 26 58 — bps (3,900) bps 19 56 (3,700) bps Total 100% 100% 100% 100% 100% 100% 100% 1 MORTGAGE SERVICING INFORMATION (UPB) Loans serviced for others $72,518 $70,847 $69,593 $67,520 $21,589 $1,671 2% $50,929 236% $72,518 $21,589 $50,929 236% Owned loans serviced 19,258 18,437 18,298 17,709 16,553 821 4 2,705 16 19,258 16,553 2,705 16 Total $91,776 $89,284 $87,891 $85,229 $38,142 $2,492 3% $53,634 141% $91,776 $38,142 $53,634 141% 1 MSR CARRYING VALUE MSR at fair value $531 $563 $600 $612 $— ($32) (6%) $531 100% $531 $— $531 100% MSR at lower of cost or market 189 212 221 219 217 (23) (11) (28) (13) 189 217 (28) (13) Total $720 $775 $821 $831 $217 ($55) (7%) $503 232% $720 $217 $503 232% 1 Beginning in the third quarter of 2018, results reflect the impact of the August 1, 2018 Franklin American Mortgage Company acquisition. 14

SEGMENT FINANCIAL HIGHLIGHTS - COMMERCIAL BANKING (in millions, except ratio data) QUARTERLY TRENDS FOR THE SIX MONTHS ENDED JUNE 30, COMMERCIAL BANKING 2Q19 Change 2019 Change 2Q19 1Q19 4Q18 3Q18 2Q18 1Q19 2Q18 2019 2018 2018 $/bps % $/bps % $/bps % Net interest income $371 $372 $384 $380 $376 ($1) —% ($5) (1%) $743 $733 $10 1% Noninterest income 149 150 140 140 140 (1) (1) 9 6 299 265 34 13 Total revenue 520 522 524 520 516 (2) — 4 1 1,042 998 44 4 Noninterest expense 217 209 203 202 200 8 4 17 9 426 408 18 4 Profit before provision for credit losses 303 313 321 318 316 (10) (3) (13) (4) 616 590 26 4 Provision for credit losses 25 21 7 14 9 4 19 16 178 46 5 41 NM Income before income tax expense 278 292 314 304 307 (14) (5) (29) (9) 570 585 (15) (3) Income tax expense 62 65 73 70 70 (3) (5) (8) (11) 127 133 (6) (5) Net income $216 $227 $241 $234 $237 ($11) (5%) ($21) (9%) $443 $452 ($9) (2%) AVERAGE BALANCES Total assets $56,135 $55,630 $53,970 $52,871 $52,170 $505 1% $3,965 8% $55,884 $51,286 $4,598 9% 1 Total loans and leases 54,653 54,436 52,963 51,881 51,202 217 — 3,451 7 54,545 50,249 4,296 9 Deposits 30,273 29,823 30,608 31,224 30,214 450 2 59 — 30,050 30,488 (438) (1) Interest-earning assets 54,950 54,724 53,221 52,137 51,404 226 — 3,546 7 54,838 50,447 4,391 9 KEY METRICS Net interest margin 2.71% 2.76% 2.86% 2.89% 2.93% (5) bps (22) bps 2.73% 2.93% (20) bps Efficiency ratio 41.58 40.11 38.73 38.83 38.80 147 bps 278 bps 40.84 40.86 (2) bps 2 Loans-to-deposits ratio (period-end balances) 173.48 180.53 172.27 169.64 167.02 (705) bps 646 bps 173.48 167.02 646 bps 2 Loans-to-deposits ratio (average balances) 179.49 181.23 172.07 165.17 168.23 (174) bps 1,126 bps 180.35 163.52 1,683 bps Return on average total tangible assets 1.54 1.66 1.78 1.75 1.82 (12) bps (28) bps 1.60 1.78 (18) bps 1 Includes loans held for sale. 2 Beginning in the third quarter of 2018, we revised our method of calculating the loans-to-deposits ratio to exclude loans held for sale. Prior periods have been adjusted to conform with the current period presentation. 15SEGMENT FINANCIAL HIGHLIGHTS - COMMERCIAL BANKING (in millions, except ratio data) QUARTERLY TRENDS FOR THE SIX MONTHS ENDED JUNE 30, COMMERCIAL BANKING 2Q19 Change 2019 Change 2Q19 1Q19 4Q18 3Q18 2Q18 1Q19 2Q18 2019 2018 2018 $/bps % $/bps % $/bps % Net interest income $371 $372 $384 $380 $376 ($1) —% ($5) (1%) $743 $733 $10 1% Noninterest income 149 150 140 140 140 (1) (1) 9 6 299 265 34 13 Total revenue 520 522 524 520 516 (2) — 4 1 1,042 998 44 4 Noninterest expense 217 209 203 202 200 8 4 17 9 426 408 18 4 Profit before provision for credit losses 303 313 321 318 316 (10) (3) (13) (4) 616 590 26 4 Provision for credit losses 25 21 7 14 9 4 19 16 178 46 5 41 NM Income before income tax expense 278 292 314 304 307 (14) (5) (29) (9) 570 585 (15) (3) Income tax expense 62 65 73 70 70 (3) (5) (8) (11) 127 133 (6) (5) Net income $216 $227 $241 $234 $237 ($11) (5%) ($21) (9%) $443 $452 ($9) (2%) AVERAGE BALANCES Total assets $56,135 $55,630 $53,970 $52,871 $52,170 $505 1% $3,965 8% $55,884 $51,286 $4,598 9% 1 Total loans and leases 54,653 54,436 52,963 51,881 51,202 217 — 3,451 7 54,545 50,249 4,296 9 Deposits 30,273 29,823 30,608 31,224 30,214 450 2 59 — 30,050 30,488 (438) (1) Interest-earning assets 54,950 54,724 53,221 52,137 51,404 226 — 3,546 7 54,838 50,447 4,391 9 KEY METRICS Net interest margin 2.71% 2.76% 2.86% 2.89% 2.93% (5) bps (22) bps 2.73% 2.93% (20) bps Efficiency ratio 41.58 40.11 38.73 38.83 38.80 147 bps 278 bps 40.84 40.86 (2) bps 2 Loans-to-deposits ratio (period-end balances) 173.48 180.53 172.27 169.64 167.02 (705) bps 646 bps 173.48 167.02 646 bps 2 Loans-to-deposits ratio (average balances) 179.49 181.23 172.07 165.17 168.23 (174) bps 1,126 bps 180.35 163.52 1,683 bps Return on average total tangible assets 1.54 1.66 1.78 1.75 1.82 (12) bps (28) bps 1.60 1.78 (18) bps 1 Includes loans held for sale. 2 Beginning in the third quarter of 2018, we revised our method of calculating the loans-to-deposits ratio to exclude loans held for sale. Prior periods have been adjusted to conform with the current period presentation. 15

SEGMENT FINANCIAL HIGHLIGHTS - OTHER (in millions) QUARTERLY TRENDS FOR THE SIX MONTHS ENDED JUNE 30, 1 OTHER 2Q19 Change 2019 Change 2Q19 1Q19 4Q18 3Q18 2Q18 1Q19 2Q18 2019 2018 2018 $ % $ % $ % Net interest income ($4) $— ($8) ($8) ($14) ($4) (100%) $10 71% ($4) ($13) $9 69% Noninterest income 36 31 16 18 20 5 16 16 80 67 44 23 52 Total revenue 32 31 8 10 6 1 3 26 NM 63 31 32 103 Noninterest expense 19 28 25 22 17 (9) (32) 2 12 47 36 11 31 Profit (loss) before provision for credit losses 13 3 (17) (12) (11) 10 NM 24 NM 16 (5) 21 NM Provision for credit losses (6) (3) (2) (7) 10 (3) (100) (16) NM (9) 20 (29) NM Income (loss) before income tax benefit 19 6 (15) (5) (21) 13 217 40 NM 25 (25) 50 NM Income tax benefit (5) (4) (46) (7) (12) (1) (25) 7 58 (9) (19) 10 53 Net income (loss) $24 $10 $31 $2 ($9) $14 140% $33 NM $34 ($6) $40 NM AVERAGE BALANCES Total assets $39,869 $39,778 $39,575 $39,779 $39,851 $91 —% $18 —% $39,824 $39,817 $7 —% 2 Total loans and leases 2,138 2,276 2,334 2,402 2,489 (138) (6) (351) (14) 2,207 2,525 (318) (13) Deposits 7,219 8,022 7,983 7,686 7,526 (803) (10) (307) (4) 7,617 7,386 231 3 Interest-earning assets 28,642 28,573 28,574 28,929 29,241 69 — (599) (2) 28,607 29,219 (612) (2) 1 Includes the financial impact of non-core, liquidating loan portfolios and other non-core assets, our treasury activities, wholesale funding activities, securities portfolio, community development assets and other unallocated assets, liabilities, capital, revenues, provision for credit losses, expenses and income tax expense, not attributed to our Consumer Banking or Commercial Banking segments. 2 Includes loans held for sale. 16SEGMENT FINANCIAL HIGHLIGHTS - OTHER (in millions) QUARTERLY TRENDS FOR THE SIX MONTHS ENDED JUNE 30, 1 OTHER 2Q19 Change 2019 Change 2Q19 1Q19 4Q18 3Q18 2Q18 1Q19 2Q18 2019 2018 2018 $ % $ % $ % Net interest income ($4) $— ($8) ($8) ($14) ($4) (100%) $10 71% ($4) ($13) $9 69% Noninterest income 36 31 16 18 20 5 16 16 80 67 44 23 52 Total revenue 32 31 8 10 6 1 3 26 NM 63 31 32 103 Noninterest expense 19 28 25 22 17 (9) (32) 2 12 47 36 11 31 Profit (loss) before provision for credit losses 13 3 (17) (12) (11) 10 NM 24 NM 16 (5) 21 NM Provision for credit losses (6) (3) (2) (7) 10 (3) (100) (16) NM (9) 20 (29) NM Income (loss) before income tax benefit 19 6 (15) (5) (21) 13 217 40 NM 25 (25) 50 NM Income tax benefit (5) (4) (46) (7) (12) (1) (25) 7 58 (9) (19) 10 53 Net income (loss) $24 $10 $31 $2 ($9) $14 140% $33 NM $34 ($6) $40 NM AVERAGE BALANCES Total assets $39,869 $39,778 $39,575 $39,779 $39,851 $91 —% $18 —% $39,824 $39,817 $7 —% 2 Total loans and leases 2,138 2,276 2,334 2,402 2,489 (138) (6) (351) (14) 2,207 2,525 (318) (13) Deposits 7,219 8,022 7,983 7,686 7,526 (803) (10) (307) (4) 7,617 7,386 231 3 Interest-earning assets 28,642 28,573 28,574 28,929 29,241 69 — (599) (2) 28,607 29,219 (612) (2) 1 Includes the financial impact of non-core, liquidating loan portfolios and other non-core assets, our treasury activities, wholesale funding activities, securities portfolio, community development assets and other unallocated assets, liabilities, capital, revenues, provision for credit losses, expenses and income tax expense, not attributed to our Consumer Banking or Commercial Banking segments. 2 Includes loans held for sale. 16

CREDIT-RELATED INFORMATION (in millions, except ratio data) AS OF JUNE 30, 2019 CHANGE June 30, 2019 Mar 31, 2019 Dec 31, 2018 Sept 30, 2018 June 30, 2018 Mar 31, 2019 June 30, 2018 $/bps % $/bps % NONPERFORMING ASSETS Commercial $198 $208 $194 $228 $249 ($10) (5%) ($51) (20%) Commercial real estate 4 4 7 30 31 — — (27) (87) Leases 17 — — — — 17 100 17 100 Total commercial loans and leases 219 212 201 258 280 7 3 (61) (22) Residential mortgages 141 138 136 136 119 3 2 22 18 Home equity loans 38 42 50 53 59 (4) (10) (21) (36) Home equity lines of credit 210 217 231 221 225 (7) (3) (15) (7) Home equity loans serviced by others 16 15 17 19 19 1 7 (3) (16) Home equity lines of credit serviced by others 14 14 15 16 17 — — (3) (18) Automobile 62 70 81 67 62 (8) (11) — — Education 40 43 38 38 40 (3) (7) — — Credit card 20 22 20 17 17 (2) (9) 3 18 Other retail 10 7 8 7 7 3 43 3 43 Total retail loans 551 568 596 574 565 (17) (3) (14) (2) Nonperforming loans and leases 770 780 797 832 845 (10) (1) (75) (9) Other nonperforming assets - Retail 32 34 34 31 29 (2) (6) 3 10 Nonperforming assets $802 $814 $831 $863 $874 ($12) (1%) ($72) (8%) NONPERFORMING ASSETS BY PRODUCT Commercial $219 $212 $201 $258 $280 $7 3% ($61) (22%) Retail 583 602 630 605 594 (19) (3) (11) (2) Total nonperforming assets $802 $814 $831 $863 $874 ($12) (1%) ($72) (8%) ASSET QUALITY RATIOS Allowance for loan and lease losses to loans and leases 1.05% 1.06% 1.06% 1.08% 1.10% (1) bps (5) bps Allowance for loan and lease losses to nonperforming loans and leases 159.43 159.68 155.99 149.29 148.20 (25) bps NM Nonperforming loans and leases to loans and leases 0.66 0.66 0.68 0.73 0.75 — bps (9) bps Nonperforming assets to total assets 0.49 0.50 0.52 0.54 0.56 (1) bps (7) bps 17CREDIT-RELATED INFORMATION (in millions, except ratio data) AS OF JUNE 30, 2019 CHANGE June 30, 2019 Mar 31, 2019 Dec 31, 2018 Sept 30, 2018 June 30, 2018 Mar 31, 2019 June 30, 2018 $/bps % $/bps % NONPERFORMING ASSETS Commercial $198 $208 $194 $228 $249 ($10) (5%) ($51) (20%) Commercial real estate 4 4 7 30 31 — — (27) (87) Leases 17 — — — — 17 100 17 100 Total commercial loans and leases 219 212 201 258 280 7 3 (61) (22) Residential mortgages 141 138 136 136 119 3 2 22 18 Home equity loans 38 42 50 53 59 (4) (10) (21) (36) Home equity lines of credit 210 217 231 221 225 (7) (3) (15) (7) Home equity loans serviced by others 16 15 17 19 19 1 7 (3) (16) Home equity lines of credit serviced by others 14 14 15 16 17 — — (3) (18) Automobile 62 70 81 67 62 (8) (11) — — Education 40 43 38 38 40 (3) (7) — — Credit card 20 22 20 17 17 (2) (9) 3 18 Other retail 10 7 8 7 7 3 43 3 43 Total retail loans 551 568 596 574 565 (17) (3) (14) (2) Nonperforming loans and leases 770 780 797 832 845 (10) (1) (75) (9) Other nonperforming assets - Retail 32 34 34 31 29 (2) (6) 3 10 Nonperforming assets $802 $814 $831 $863 $874 ($12) (1%) ($72) (8%) NONPERFORMING ASSETS BY PRODUCT Commercial $219 $212 $201 $258 $280 $7 3% ($61) (22%) Retail 583 602 630 605 594 (19) (3) (11) (2) Total nonperforming assets $802 $814 $831 $863 $874 ($12) (1%) ($72) (8%) ASSET QUALITY RATIOS Allowance for loan and lease losses to loans and leases 1.05% 1.06% 1.06% 1.08% 1.10% (1) bps (5) bps Allowance for loan and lease losses to nonperforming loans and leases 159.43 159.68 155.99 149.29 148.20 (25) bps NM Nonperforming loans and leases to loans and leases 0.66 0.66 0.68 0.73 0.75 — bps (9) bps Nonperforming assets to total assets 0.49 0.50 0.52 0.54 0.56 (1) bps (7) bps 17

CREDIT-RELATED INFORMATION, CONTINUED (in millions) QUARTERLY TRENDS FOR THE SIX MONTHS ENDED JUNE 30, 2Q19 Change 2019 Change 2Q19 1Q19 4Q18 3Q18 2Q18 1Q19 2Q18 2019 2018 2018 $ % $ % $ % CHARGE-OFFS, RECOVERIES AND RELATED RATIOS GROSS CHARGE-OFFS Commercial $40 $3 $17 $14 $14 $37 NM $26 186% $43 $17 $26 153% Commercial real estate — 20 — 4 — (20) (100) — — 20 — 20 100 Leases 5 3 — — — 2 67 5 100 8 — 8 100 Total commercial loans and leases 45 26 17 18 14 19 73 31 221 71 17 54 NM Residential mortgages 2 2 2 2 2 — — — — 4 4 — — Home equity loans 3 1 1 1 1 2 200 2 200 4 4 — — Home equity lines of credit 7 5 6 6 7 2 40 — — 12 14 (2) (14) Home equity loans serviced by others 1 1 3 1 2 — — (1) (50) 2 5 (3) (60) Home equity lines of credit serviced by others — — 1 1 1 — — (1) (100) — 2 (2) (100) Automobile 30 38 37 39 36 (8) (21) (6) (17) 68 82 (14) (17) Education 18 16 17 17 19 2 13 (1) (5) 34 34 — — Credit card 21 19 17 17 18 2 11 3 17 40 34 6 18 Other retail 29 30 30 25 20 (1) (3) 9 45 59 40 19 48 Total retail loans 111 112 114 109 106 (1) (1) 5 5 223 219 4 2 Total gross charge-offs $156 $138 $131 $127 $120 $18 13% $36 30% $294 $236 $58 25% GROSS RECOVERIES Commercial $12 $2 $6 $2 $2 $10 NM $10 NM $14 $7 $7 100% Commercial real estate — — 3 — — — — — — — 1 (1) (100) Leases — — — — — — — — — — — — — Total commercial loans and leases 12 2 9 2 2 10 NM 10 NM 14 8 6 75 Residential mortgages 2 5 1 1 1 (3) (60) 1 100 7 3 4 133 Home equity loans 2 4 2 2 4 (2) (50) (2) (50) 6 7 (1) (14) Home equity lines of credit 4 9 4 4 4 (5) (56) — — 13 8 5 63 Home equity loans serviced by others 3 3 4 4 3 — — — — 6 7 (1) (14) Home equity lines of credit serviced by others 1 1 2 2 2 — — (1) (50) 2 3 (1) (33) Automobile 16 15 15 16 18 1 7 (2) (11) 31 36 (5) (14) Education 4 4 4 4 4 — — — — 8 8 — — Credit card 2 2 2 2 3 — — (1) (33) 4 4 — — Other retail 4 4 3 4 3 — — 1 33 8 6 2 33 Total retail loans 38 47 37 39 42 (9) (19) (4) (10) 85 82 3 4 Total gross recoveries $50 $49 $46 $41 $44 $1 2% $6 14% $99 $90 $9 10% NET CHARGE-OFFS (RECOVERIES) Commercial $28 $1 $11 $12 $12 $27 NM $16 133% $29 $10 $19 190% Commercial real estate — 20 (3) 4 — (20) (100) — — 20 (1) 21 NM Leases 5 3 — — — 2 67 5 100 8 — 8 100 Total commercial loans and leases 33 24 8 16 12 9 38 21 175 57 9 48 NM Residential mortgages — (3) 1 1 1 3 100 (1) (100) (3) 1 (4) NM Home equity loans 1 (3) (1) (1) (3) 4 NM 4 NM (2) (3) 1 33 Home equity lines of credit 3 (4) 2 2 3 7 NM — — (1) 6 (7) NM Home equity loans serviced by others (2) (2) (1) (3) (1) — — (1) (100) (4) (2) (2) (100) Home equity lines of credit serviced by others (1) (1) (1) (1) (1) — — — — (2) (1) (1) (100) Automobile 14 23 22 23 18 (9) (39) (4) (22) 37 46 (9) (20) Education 14 12 13 13 15 2 17 (1) (7) 26 26 — — Credit card 19 17 15 15 15 2 12 4 27 36 30 6 20 Other retail 25 26 27 21 17 (1) (4) 8 47 51 34 17 50 Total retail loans 73 65 77 70 64 8 12 9 14 138 137 1 1 Total net charge-offs (recoveries) $106 $89 $85 $86 $76 $17 19% $30 39% $195 $146 $49 34% 18CREDIT-RELATED INFORMATION, CONTINUED (in millions) QUARTERLY TRENDS FOR THE SIX MONTHS ENDED JUNE 30, 2Q19 Change 2019 Change 2Q19 1Q19 4Q18 3Q18 2Q18 1Q19 2Q18 2019 2018 2018 $ % $ % $ % CHARGE-OFFS, RECOVERIES AND RELATED RATIOS GROSS CHARGE-OFFS Commercial $40 $3 $17 $14 $14 $37 NM $26 186% $43 $17 $26 153% Commercial real estate — 20 — 4 — (20) (100) — — 20 — 20 100 Leases 5 3 — — — 2 67 5 100 8 — 8 100 Total commercial loans and leases 45 26 17 18 14 19 73 31 221 71 17 54 NM Residential mortgages 2 2 2 2 2 — — — — 4 4 — — Home equity loans 3 1 1 1 1 2 200 2 200 4 4 — — Home equity lines of credit 7 5 6 6 7 2 40 — — 12 14 (2) (14) Home equity loans serviced by others 1 1 3 1 2 — — (1) (50) 2 5 (3) (60) Home equity lines of credit serviced by others — — 1 1 1 — — (1) (100) — 2 (2) (100) Automobile 30 38 37 39 36 (8) (21) (6) (17) 68 82 (14) (17) Education 18 16 17 17 19 2 13 (1) (5) 34 34 — — Credit card 21 19 17 17 18 2 11 3 17 40 34 6 18 Other retail 29 30 30 25 20 (1) (3) 9 45 59 40 19 48 Total retail loans 111 112 114 109 106 (1) (1) 5 5 223 219 4 2 Total gross charge-offs $156 $138 $131 $127 $120 $18 13% $36 30% $294 $236 $58 25% GROSS RECOVERIES Commercial $12 $2 $6 $2 $2 $10 NM $10 NM $14 $7 $7 100% Commercial real estate — — 3 — — — — — — — 1 (1) (100) Leases — — — — — — — — — — — — — Total commercial loans and leases 12 2 9 2 2 10 NM 10 NM 14 8 6 75 Residential mortgages 2 5 1 1 1 (3) (60) 1 100 7 3 4 133 Home equity loans 2 4 2 2 4 (2) (50) (2) (50) 6 7 (1) (14) Home equity lines of credit 4 9 4 4 4 (5) (56) — — 13 8 5 63 Home equity loans serviced by others 3 3 4 4 3 — — — — 6 7 (1) (14) Home equity lines of credit serviced by others 1 1 2 2 2 — — (1) (50) 2 3 (1) (33) Automobile 16 15 15 16 18 1 7 (2) (11) 31 36 (5) (14) Education 4 4 4 4 4 — — — — 8 8 — — Credit card 2 2 2 2 3 — — (1) (33) 4 4 — — Other retail 4 4 3 4 3 — — 1 33 8 6 2 33 Total retail loans 38 47 37 39 42 (9) (19) (4) (10) 85 82 3 4 Total gross recoveries $50 $49 $46 $41 $44 $1 2% $6 14% $99 $90 $9 10% NET CHARGE-OFFS (RECOVERIES) Commercial $28 $1 $11 $12 $12 $27 NM $16 133% $29 $10 $19 190% Commercial real estate — 20 (3) 4 — (20) (100) — — 20 (1) 21 NM Leases 5 3 — — — 2 67 5 100 8 — 8 100 Total commercial loans and leases 33 24 8 16 12 9 38 21 175 57 9 48 NM Residential mortgages — (3) 1 1 1 3 100 (1) (100) (3) 1 (4) NM Home equity loans 1 (3) (1) (1) (3) 4 NM 4 NM (2) (3) 1 33 Home equity lines of credit 3 (4) 2 2 3 7 NM — — (1) 6 (7) NM Home equity loans serviced by others (2) (2) (1) (3) (1) — — (1) (100) (4) (2) (2) (100) Home equity lines of credit serviced by others (1) (1) (1) (1) (1) — — — — (2) (1) (1) (100) Automobile 14 23 22 23 18 (9) (39) (4) (22) 37 46 (9) (20) Education 14 12 13 13 15 2 17 (1) (7) 26 26 — — Credit card 19 17 15 15 15 2 12 4 27 36 30 6 20 Other retail 25 26 27 21 17 (1) (4) 8 47 51 34 17 50 Total retail loans 73 65 77 70 64 8 12 9 14 138 137 1 1 Total net charge-offs (recoveries) $106 $89 $85 $86 $76 $17 19% $30 39% $195 $146 $49 34% 18

CREDIT-RELATED INFORMATION, CONTINUED (in millions, except rates) QUARTERLY TRENDS FOR THE SIX MONTHS ENDED JUNE 30, 2Q19 Change 2019 Change 2Q19 1Q19 4Q18 3Q18 2Q18 1Q19 2Q18 2019 2018 2018 $/bps % $/bps % $/bps % ANNUALIZED NET CHARGE-OFF (RECOVERY) RATES Commercial 0.27% 0.01% 0.11% 0.13% 0.12% 26 bps 15 bps 0.14% 0.05% 9 bps Commercial real estate — 0.62 (0.11) 0.11 — (62) bps — bps 0.30 (0.01) 31 bps Leases 0.72 0.42 — — — 30 bps 72 bps 0.56 — 56 bps Total commercial loans and leases 0.23 0.17 0.05 0.12 0.09 6 bps 14 bps 0.20 0.03 17 bps Residential mortgages 0.01 (0.07) 0.01 0.02 0.02 8 bps (1) bps (0.03) 0.01 (4) bps Home equity loans 0.33 (1.32) (0.21) (0.50) (0.71) 165 bps 104 bps (0.52) (0.33) (19) bps Home equity lines of credit 0.07 (0.11) 0.07 0.04 0.10 18 bps (3) bps (0.02) 0.10 (12) bps Home equity loans serviced by others (2.26) (1.70) (1.45) (2.03) (1.53) (56) bps (73) bps (1.97) (1.06) (91) bps Home equity lines of credit serviced by others (3.07) (2.52) (3.87) (4.97) (3.33) (55) bps 26 bps (2.79) (1.44) (135) bps Automobile 0.49 0.77 0.71 0.76 0.57 (28) bps (8) bps 0.62 0.72 (10) bps Education 0.62 0.51 0.59 0.61 0.72 11 bps (10) bps 0.57 0.63 (6) bps Credit card 3.71 3.33 3.09 3.06 3.36 38 bps 35 bps 3.52 3.29 23 bps Other retail 2.78 2.91 3.07 2.64 2.31 (13) bps 47 bps 2.85 2.35 50 bps Total retail loans 0.49 0.44 0.51 0.47 0.44 5 bps 5 bps 0.47 0.47 — bps Total loans and leases 0.36% 0.31% 0.29% 0.30% 0.27% 5 bps 9 bps 0.33% 0.26% 7 bps Memo: Average loans Commercial $41,755 $41,562 $40,472 $39,592 $39,399 $193 —% $2,356 6% $41,659 $38,683 $2,976 8% Commercial real estate 13,379 13,272 12,900 12,656 12,071 107 1 1,308 11 13,325 11,812 1,513 13 Leases 2,745 2,873 2,938 3,028 3,073 (128) (4) (328) (11) 2,809 3,093 (284) (9) Total commercial loans and leases 57,879 57,707 56,310 55,276 54,543 172 — 3,336 6 57,793 53,588 4,205 8 Residential mortgages 19,232 19,094 18,713 18,147 17,488 138 1 1,744 10 19,163 17,326 1,837 11 Home equity loans 971 1,039 1,101 1,168 1,252 (68) (7) (281) (22) 1,005 1,297 (292) (23) Home equity lines of credit 12,332 12,552 12,790 12,925 13,112 (220) (2) (780) (6) 12,441 13,232 (791) (6) Home equity loans serviced by others 359 385 411 444 480 (26) (7) (121) (25) 372 500 (128) (26) Home equity lines of credit serviced by others 92 99 108 118 130 (7) (7) (38) (29) 95 136 (41) (30) Automobile 11,984 12,070 12,179 12,379 12,657 (86) (1) (673) (5) 12,026 12,835 (809) (6) Education 9,235 9,069 8,801 8,481 8,374 166 2 861 10 9,153 8,329 824 10 Credit card 2,041 1,998 1,973 1,909 1,854 43 2 187 10 2,020 1,841 179 10 Other retail 3,658 3,636 3,507 3,124 2,966 22 1 692 23 3,648 2,906 742 26 Total retail loans 59,904 59,942 59,583 58,695 58,313 (38) — 1,591 3 59,923 58,402 1,521 3 Total loans and leases $117,783 $117,649 $115,893 $113,971 $112,856 $134 —% $4,927 4% $117,716 $111,990 $5,726 5% 19CREDIT-RELATED INFORMATION, CONTINUED (in millions, except rates) QUARTERLY TRENDS FOR THE SIX MONTHS ENDED JUNE 30, 2Q19 Change 2019 Change 2Q19 1Q19 4Q18 3Q18 2Q18 1Q19 2Q18 2019 2018 2018 $/bps % $/bps % $/bps % ANNUALIZED NET CHARGE-OFF (RECOVERY) RATES Commercial 0.27% 0.01% 0.11% 0.13% 0.12% 26 bps 15 bps 0.14% 0.05% 9 bps Commercial real estate — 0.62 (0.11) 0.11 — (62) bps — bps 0.30 (0.01) 31 bps Leases 0.72 0.42 — — — 30 bps 72 bps 0.56 — 56 bps Total commercial loans and leases 0.23 0.17 0.05 0.12 0.09 6 bps 14 bps 0.20 0.03 17 bps Residential mortgages 0.01 (0.07) 0.01 0.02 0.02 8 bps (1) bps (0.03) 0.01 (4) bps Home equity loans 0.33 (1.32) (0.21) (0.50) (0.71) 165 bps 104 bps (0.52) (0.33) (19) bps Home equity lines of credit 0.07 (0.11) 0.07 0.04 0.10 18 bps (3) bps (0.02) 0.10 (12) bps Home equity loans serviced by others (2.26) (1.70) (1.45) (2.03) (1.53) (56) bps (73) bps (1.97) (1.06) (91) bps Home equity lines of credit serviced by others (3.07) (2.52) (3.87) (4.97) (3.33) (55) bps 26 bps (2.79) (1.44) (135) bps Automobile 0.49 0.77 0.71 0.76 0.57 (28) bps (8) bps 0.62 0.72 (10) bps Education 0.62 0.51 0.59 0.61 0.72 11 bps (10) bps 0.57 0.63 (6) bps Credit card 3.71 3.33 3.09 3.06 3.36 38 bps 35 bps 3.52 3.29 23 bps Other retail 2.78 2.91 3.07 2.64 2.31 (13) bps 47 bps 2.85 2.35 50 bps Total retail loans 0.49 0.44 0.51 0.47 0.44 5 bps 5 bps 0.47 0.47 — bps Total loans and leases 0.36% 0.31% 0.29% 0.30% 0.27% 5 bps 9 bps 0.33% 0.26% 7 bps Memo: Average loans Commercial $41,755 $41,562 $40,472 $39,592 $39,399 $193 —% $2,356 6% $41,659 $38,683 $2,976 8% Commercial real estate 13,379 13,272 12,900 12,656 12,071 107 1 1,308 11 13,325 11,812 1,513 13 Leases 2,745 2,873 2,938 3,028 3,073 (128) (4) (328) (11) 2,809 3,093 (284) (9) Total commercial loans and leases 57,879 57,707 56,310 55,276 54,543 172 — 3,336 6 57,793 53,588 4,205 8 Residential mortgages 19,232 19,094 18,713 18,147 17,488 138 1 1,744 10 19,163 17,326 1,837 11 Home equity loans 971 1,039 1,101 1,168 1,252 (68) (7) (281) (22) 1,005 1,297 (292) (23) Home equity lines of credit 12,332 12,552 12,790 12,925 13,112 (220) (2) (780) (6) 12,441 13,232 (791) (6) Home equity loans serviced by others 359 385 411 444 480 (26) (7) (121) (25) 372 500 (128) (26) Home equity lines of credit serviced by others 92 99 108 118 130 (7) (7) (38) (29) 95 136 (41) (30) Automobile 11,984 12,070 12,179 12,379 12,657 (86) (1) (673) (5) 12,026 12,835 (809) (6) Education 9,235 9,069 8,801 8,481 8,374 166 2 861 10 9,153 8,329 824 10 Credit card 2,041 1,998 1,973 1,909 1,854 43 2 187 10 2,020 1,841 179 10 Other retail 3,658 3,636 3,507 3,124 2,966 22 1 692 23 3,648 2,906 742 26 Total retail loans 59,904 59,942 59,583 58,695 58,313 (38) — 1,591 3 59,923 58,402 1,521 3 Total loans and leases $117,783 $117,649 $115,893 $113,971 $112,856 $134 —% $4,927 4% $117,716 $111,990 $5,726 5% 19

CREDIT-RELATED INFORMATION, CONTINUED (in millions) QUARTERLY TRENDS FOR THE SIX MONTHS ENDED JUNE 30, 2Q19 Change 2019 Change 2Q19 1Q19 4Q18 3Q18 2Q18 1Q19 2Q18 2019 2018 2018 $ % $ % $ % SUMMARY OF CHANGES IN THE COMPONENTS OF THE ALLOWANCE FOR CREDIT LOSSES Allowance for loan and lease losses - beginning $1,245 $1,242 $1,242 $1,253 $1,246 $3 —% ($1) —% $1,242 $1,236 $6 —% Charge-offs: Commercial 45 26 17 18 14 19 73 31 221 71 17 54 NM Retail 111 112 114 109 106 (1) (1) 5 5 223 219 4 2 Total charge-offs 156 138 131 127 120 18 13 36 30 294 236 58 25 Recoveries: Commercial 12 2 9 2 2 10 NM 10 NM 14 8 6 75 Retail 38 47 37 39 42 (9) (19) (4) (10) 85 82 3 4 Total recoveries 50 49 46 41 44 1 2 6 14 99 90 9 10 Net charge-offs 106 89 85 86 76 17 19 30 39 195 146 49 34 Provision for loan and lease losses: Commercial 22 25 (9) 8 16 (3) (12) 6 38 47 39 8 21 Retail 66 67 94 67 67 (1) (1) (1) (1) 133 124 9 7 Total provision for loan and lease losses 88 92 85 75 83 (4) (4) 5 6 180 163 17 10 Allowance for loan and lease losses - ending $1,227 $1,245 $1,242 $1,242 $1,253 ($18) (1%) ($26) (2%) $1,227 $1,253 ($26) (2%) Reserve for unfunded lending commitments - beginning $84 $91 $91 $88 $86 ($7) (8%) ($2) (2%) $91 $88 $3 3% Provision for unfunded lending commitments 9 (7) — 3 2 16 NM 7 NM 2 — 2 100 Reserve for unfunded lending commitments - ending $93 $84 $91 $91 $88 $9 11% $5 6% $93 $88 $5 6% Total allowance for credit losses - ending $1,320 $1,329 $1,333 $1,333 $1,341 ($9) (1%) ($21) (2%) $1,320 $1,341 ($21) (2%) Memo: Total allowance for credit losses by product Commercial $773 $775 $781 $798 $803 ($2) —% ($30) (4%) $773 $803 ($30) (4%) Retail 547 554 552 535 538 (7) (1) 9 2 547 538 9 2 Total allowance for credit losses $1,320 $1,329 $1,333 $1,333 $1,341 ($9) (1%) ($21) (2%) $1,320 $1,341 ($21) (2%) 20CREDIT-RELATED INFORMATION, CONTINUED (in millions) QUARTERLY TRENDS FOR THE SIX MONTHS ENDED JUNE 30, 2Q19 Change 2019 Change 2Q19 1Q19 4Q18 3Q18 2Q18 1Q19 2Q18 2019 2018 2018 $ % $ % $ % SUMMARY OF CHANGES IN THE COMPONENTS OF THE ALLOWANCE FOR CREDIT LOSSES Allowance for loan and lease losses - beginning $1,245 $1,242 $1,242 $1,253 $1,246 $3 —% ($1) —% $1,242 $1,236 $6 —% Charge-offs: Commercial 45 26 17 18 14 19 73 31 221 71 17 54 NM Retail 111 112 114 109 106 (1) (1) 5 5 223 219 4 2 Total charge-offs 156 138 131 127 120 18 13 36 30 294 236 58 25 Recoveries: Commercial 12 2 9 2 2 10 NM 10 NM 14 8 6 75 Retail 38 47 37 39 42 (9) (19) (4) (10) 85 82 3 4 Total recoveries 50 49 46 41 44 1 2 6 14 99 90 9 10 Net charge-offs 106 89 85 86 76 17 19 30 39 195 146 49 34 Provision for loan and lease losses: Commercial 22 25 (9) 8 16 (3) (12) 6 38 47 39 8 21 Retail 66 67 94 67 67 (1) (1) (1) (1) 133 124 9 7 Total provision for loan and lease losses 88 92 85 75 83 (4) (4) 5 6 180 163 17 10 Allowance for loan and lease losses - ending $1,227 $1,245 $1,242 $1,242 $1,253 ($18) (1%) ($26) (2%) $1,227 $1,253 ($26) (2%) Reserve for unfunded lending commitments - beginning $84 $91 $91 $88 $86 ($7) (8%) ($2) (2%) $91 $88 $3 3% Provision for unfunded lending commitments 9 (7) — 3 2 16 NM 7 NM 2 — 2 100 Reserve for unfunded lending commitments - ending $93 $84 $91 $91 $88 $9 11% $5 6% $93 $88 $5 6% Total allowance for credit losses - ending $1,320 $1,329 $1,333 $1,333 $1,341 ($9) (1%) ($21) (2%) $1,320 $1,341 ($21) (2%) Memo: Total allowance for credit losses by product Commercial $773 $775 $781 $798 $803 ($2) —% ($30) (4%) $773 $803 ($30) (4%) Retail 547 554 552 535 538 (7) (1) 9 2 547 538 9 2 Total allowance for credit losses $1,320 $1,329 $1,333 $1,333 $1,341 ($9) (1%) ($21) (2%) $1,320 $1,341 ($21) (2%) 20

CAPITAL AND RATIOS (in millions, except ratio data) AS OF FOR THE SIX MONTHS ENDED JUNE 30, JUNE 30, 2019 CHANGE 2019 Change June 30, Mar 31, Dec 31, Sept 30, June 30, 2019 2019 2018 2018 2018 Mar 31, 2019 June 30, 2018 2019 2018 2018 $ % $ % $ % CAPITAL RATIOS AND COMPONENTS (PRELIMINARY) CET1 capital $14,629 $14,442 $14,485 $14,435 $14,604 $187 1% $25 —% Tier 1 capital 15,762 15,574 15,325 14,978 15,147 188 1 615 4 Total capital 18,582 18,403 18,157 17,810 18,056 179 1 526 3 Risk-weighted assets 138,879 137,246 136,202 133,249 130,621 1,633 1 8,258 6 1 Adjusted average assets 155,956 155,171 153,026 150,717 148,341 785 1 7,615 5 CET1 capital ratio 10.5% 10.5% 10.6% 10.8% 11.2% Tier 1 capital ratio 11.3 11.3 11.3 11.2 11.6 Total capital ratio 13.4 13.4 13.3 13.4 13.8 Tier 1 leverage ratio 10.1 10.0 10.0 9.9 10.2 TANGIBLE COMMON EQUITY (PERIOD-END) Common stockholders' equity $20,884 $20,399 $19,977 $19,733 $19,924 $485 2% $960 5% $20,884 $19,924 $960 5% Less: Goodwill 7,040 7,040 6,923 6,946 6,887 — — 153 2 7,040 6,887 153 2 Less: Other intangible assets 74 80 31 33 2 (6) (8) 72 NM 74 2 72 NM 2 Add: Deferred tax liabilities 371 370 366 363 359 1 — 12 3 371 359 12 3 Total tangible common equity $14,141 $13,649 $13,389 $13,117 $13,394 $492 4% $747 6% $14,141 $13,394 $747 6% TANGIBLE COMMON EQUITY (AVERAGE) Common stockholders' equity $20,420 $19,942 $19,521 $19,599 $19,732 $478 2% $688 3% $20,182 $19,732 $450 2% Less: Goodwill 7,040 7,018 6,946 6,926 6,887 22 — 153 2 7,029 6,887 142 2 Less: Other intangible assets 80 59 32 22 2 21 36 78 NM 69 2 67 NM 2 Add: Deferred tax liabilities 370 368 364 360 357 2 1 13 4 369 356 13 4 Total tangible common equity $13,670 $13,233 $12,907 $13,011 $13,200 $437 3% $470 4% $13,453 $13,199 $254 2% INTANGIBLE ASSETS (PERIOD-END) Goodwill $7,040 $7,040 $6,923 $6,946 $6,887 $— —% $153 2% $7,040 $6,887 $153 2% Other intangible assets 74 80 31 33 2 (6) (8) 72 NM 74 2 72 NM Total intangible assets $7,114 $7,120 $6,954 $6,979 $6,889 ($6) —% $225 3% $7,114 $6,889 $225 3% 1 Adjusted average assets include quarterly average assets, less deductions for disallowed goodwill and other intangible assets, net of deferred tax liabilities related to tax deductible goodwill, and the accumulated other comprehensive income impact related to the adoption of post-retirement benefit plan guidance under GAAP. 2 Deferred tax liabilities relate to tax-deductible goodwill, which is netted against goodwill when calculating tangible common equity. 21CAPITAL AND RATIOS (in millions, except ratio data) AS OF FOR THE SIX MONTHS ENDED JUNE 30, JUNE 30, 2019 CHANGE 2019 Change June 30, Mar 31, Dec 31, Sept 30, June 30, 2019 2019 2018 2018 2018 Mar 31, 2019 June 30, 2018 2019 2018 2018 $ % $ % $ % CAPITAL RATIOS AND COMPONENTS (PRELIMINARY) CET1 capital $14,629 $14,442 $14,485 $14,435 $14,604 $187 1% $25 —% Tier 1 capital 15,762 15,574 15,325 14,978 15,147 188 1 615 4 Total capital 18,582 18,403 18,157 17,810 18,056 179 1 526 3 Risk-weighted assets 138,879 137,246 136,202 133,249 130,621 1,633 1 8,258 6 1 Adjusted average assets 155,956 155,171 153,026 150,717 148,341 785 1 7,615 5 CET1 capital ratio 10.5% 10.5% 10.6% 10.8% 11.2% Tier 1 capital ratio 11.3 11.3 11.3 11.2 11.6 Total capital ratio 13.4 13.4 13.3 13.4 13.8 Tier 1 leverage ratio 10.1 10.0 10.0 9.9 10.2 TANGIBLE COMMON EQUITY (PERIOD-END) Common stockholders' equity $20,884 $20,399 $19,977 $19,733 $19,924 $485 2% $960 5% $20,884 $19,924 $960 5% Less: Goodwill 7,040 7,040 6,923 6,946 6,887 — — 153 2 7,040 6,887 153 2 Less: Other intangible assets 74 80 31 33 2 (6) (8) 72 NM 74 2 72 NM 2 Add: Deferred tax liabilities 371 370 366 363 359 1 — 12 3 371 359 12 3 Total tangible common equity $14,141 $13,649 $13,389 $13,117 $13,394 $492 4% $747 6% $14,141 $13,394 $747 6% TANGIBLE COMMON EQUITY (AVERAGE) Common stockholders' equity $20,420 $19,942 $19,521 $19,599 $19,732 $478 2% $688 3% $20,182 $19,732 $450 2% Less: Goodwill 7,040 7,018 6,946 6,926 6,887 22 — 153 2 7,029 6,887 142 2 Less: Other intangible assets 80 59 32 22 2 21 36 78 NM 69 2 67 NM 2 Add: Deferred tax liabilities 370 368 364 360 357 2 1 13 4 369 356 13 4 Total tangible common equity $13,670 $13,233 $12,907 $13,011 $13,200 $437 3% $470 4% $13,453 $13,199 $254 2% INTANGIBLE ASSETS (PERIOD-END) Goodwill $7,040 $7,040 $6,923 $6,946 $6,887 $— —% $153 2% $7,040 $6,887 $153 2% Other intangible assets 74 80 31 33 2 (6) (8) 72 NM 74 2 72 NM Total intangible assets $7,114 $7,120 $6,954 $6,979 $6,889 ($6) —% $225 3% $7,114 $6,889 $225 3% 1 Adjusted average assets include quarterly average assets, less deductions for disallowed goodwill and other intangible assets, net of deferred tax liabilities related to tax deductible goodwill, and the accumulated other comprehensive income impact related to the adoption of post-retirement benefit plan guidance under GAAP. 2 Deferred tax liabilities relate to tax-deductible goodwill, which is netted against goodwill when calculating tangible common equity. 21

KEY PERFORMANCE METRICS, NON-GAAP FINANCIAL MEASURES AND RECONCILIATIONS (in millions, except share, per-share and ratio data) Key Performance Metrics: Our Management uses certain key performance metrics (KPMs) to gauge our progress against strategic and operational goals, as well as to compare our performance against peers. The KPMs are referred to in our Registration Statements on Form S-1 and our external financial reports filed with the Securities and Exchange Commission. The KPMs include: • Return on average tangible common equity (ROTCE); • Return on average total tangible assets (ROTA); • Efficiency ratio; • Operating leverage; and • Common equity tier 1 capital ratio. Established targets for the KPMs are based on Management-reporting results which are currently referred to by the Company as “Underlying” results. In historical periods, these results may have been referred to as “Adjusted” or “Adjusted/Underlying” results. We believe that Underlying results, which exclude notable items, provide the best representation of our underlying financial progress toward the KPMs as the results exclude items that our Management does not consider indicative of our on-going financial performance. We have consistently shown investors our KPMs on a Management-reporting basis since our initial public offering in September of 2014. KPMs that reflect Underlying results are considered non-GAAP financial measures. Non-GAAP Financial Measures This document contains non-GAAP financial measures denoted as Underlying results. In historical periods, these results may have been referred to as Adjusted or Adjusted/Underlying results. Underlying results for any given reporting period exclude certain items that may occur in that period which Management does not consider indicative of the Company’s on-going financial performance. We believe these non-GAAP financial measures provide useful information to investors because they are used by our Management to evaluate our operating performance and make day-to-day operating decisions. In addition, we believe our Underlying results in any given reporting period reflect our on-going financial performance in that period and, accordingly, are useful to consider in addition to our GAAP financial results. We further believe the presentation of Underlying results increases comparability of period-to-period results. The following tables present reconciliations of our non-GAAP measures to the most directly comparable GAAP financial measures. Other companies may use similarly titled non-GAAP financial measures that are calculated differently from the way we calculate such measures. Accordingly, our non-GAAP financial measures may not be comparable to similar measures used by such companies. We caution investors not to place undue reliance on such non-GAAP financial measures, but to consider them with the most directly comparable GAAP measures. Non-GAAP financial measures have limitations as analytical tools and should not be considered in isolation or as a substitute for our results reported under GAAP. 22KEY PERFORMANCE METRICS, NON-GAAP FINANCIAL MEASURES AND RECONCILIATIONS (in millions, except share, per-share and ratio data) Key Performance Metrics: Our Management uses certain key performance metrics (KPMs) to gauge our progress against strategic and operational goals, as well as to compare our performance against peers. The KPMs are referred to in our Registration Statements on Form S-1 and our external financial reports filed with the Securities and Exchange Commission. The KPMs include: • Return on average tangible common equity (ROTCE); • Return on average total tangible assets (ROTA); • Efficiency ratio; • Operating leverage; and • Common equity tier 1 capital ratio. Established targets for the KPMs are based on Management-reporting results which are currently referred to by the Company as “Underlying” results. In historical periods, these results may have been referred to as “Adjusted” or “Adjusted/Underlying” results. We believe that Underlying results, which exclude notable items, provide the best representation of our underlying financial progress toward the KPMs as the results exclude items that our Management does not consider indicative of our on-going financial performance. We have consistently shown investors our KPMs on a Management-reporting basis since our initial public offering in September of 2014. KPMs that reflect Underlying results are considered non-GAAP financial measures. Non-GAAP Financial Measures This document contains non-GAAP financial measures denoted as Underlying results. In historical periods, these results may have been referred to as Adjusted or Adjusted/Underlying results. Underlying results for any given reporting period exclude certain items that may occur in that period which Management does not consider indicative of the Company’s on-going financial performance. We believe these non-GAAP financial measures provide useful information to investors because they are used by our Management to evaluate our operating performance and make day-to-day operating decisions. In addition, we believe our Underlying results in any given reporting period reflect our on-going financial performance in that period and, accordingly, are useful to consider in addition to our GAAP financial results. We further believe the presentation of Underlying results increases comparability of period-to-period results. The following tables present reconciliations of our non-GAAP measures to the most directly comparable GAAP financial measures. Other companies may use similarly titled non-GAAP financial measures that are calculated differently from the way we calculate such measures. Accordingly, our non-GAAP financial measures may not be comparable to similar measures used by such companies. We caution investors not to place undue reliance on such non-GAAP financial measures, but to consider them with the most directly comparable GAAP measures. Non-GAAP financial measures have limitations as analytical tools and should not be considered in isolation or as a substitute for our results reported under GAAP. 22

KEY PERFORMANCE METRICS, NON-GAAP FINANCIAL MEASURES AND RECONCILIATIONS, CONTINUED (in millions, except share, per-share and ratio data) QUARTERLY TRENDS FOR THE SIX MONTHS ENDED JUNE 30, 2Q19 Change 2019 Change 2Q19 1Q19 4Q18 3Q18 2Q18 1Q19 2Q18 2019 2018 2018 $ % $ % $ % Noninterest income, Underlying: Noninterest income (GAAP) $462 $428 $421 $416 $388 $34 8% $74 19% $890 $759 $131 17% Less: Notable items — — (5) — — — — — — — — — — Noninterest income, Underlying (non-GAAP) $462 $428 $426 $416 $388 $34 8% $74 19% $890 $759 $131 17% Total revenue, Underlying: Total revenue (GAAP) A $1,628 $1,588 $1,593 $1,564 $1,509 $40 3% $119 8% $3,216 $2,971 $245 8% Less: Notable items — — (5) — — — — — — — — — — Total revenue, Underlying (non-GAAP) B $1,628 $1,588 $1,598 $1,564 $1,509 $40 3% $119 8% $3,216 $2,971 $245 8% Noninterest expense, Underlying: Noninterest expense (GAAP) C $951 $937 $951 $910 $875 $14 1% $76 9% $1,888 $1,758 $130 7% Less: Notable items 7 5 45 9 — 2 40 7 100 12 — 12 100 Noninterest expense, Underlying (non-GAAP) D $944 $932 $906 $901 $875 $12 1% $69 8% $1,876 $1,758 $118 7% Pre-provision profit: Total revenue (GAAP) A $1,628 $1,588 $1,593 $1,564 $1,509 $40 3% $119 8% $3,216 $2,971 $245 8% Less: Noninterest expense (GAAP) C 951 937 951 910 875 14 1 76 9 1,888 1,758 130 7 Pre-provision profit (GAAP) $677 $651 $642 $654 $634 $26 4% $43 7% $1,328 $1,213 $115 9% Pre-provision profit, Underlying: Total revenue, Underlying (non-GAAP) B $1,628 $1,588 $1,598 $1,564 $1,509 $40 3% $119 8% $3,216 $2,971 $245 8% Less: Noninterest expense, Underlying (non-GAAP) D 944 932 906 901 875 12 1 69 8 1,876 1,758 118 7 Pre-provision profit, Underlying (non-GAAP) $684 $656 $692 $663 $634 $28 4% $50 8% $1,340 $1,213 $127 10% Income before income tax expense, Underlying: Income before income tax expense (GAAP) E $580 $566 $557 $576 $549 $14 2% $31 6% $1,146 $1,050 $96 9% Less: Income (expense) before income tax expense (benefit) related to notable items (7) (5) (50) (9) — (2) (40) (7) (100) (12) — (12) (100) Income before income tax expense, Underlying (non-GAAP) F $587 $571 $607 $585 $549 $16 3% $38 7% $1,158 $1,050 $108 10% Income tax expense, Underlying: Income tax expense (benefit) (GAAP) G $127 $127 $92 $133 $124 $— —% $3 2% $254 $237 $17 7% Less: Income tax expense (benefit) related to notable items (2) (1) (41) (2) — (1) (100) (2) (100) (3) — (3) (100) Income tax expense, Underlying (non-GAAP) H $129 $128 $133 $135 $124 $1 1% $5 4% $257 $237 $20 8% Net income, Underlying: Net income (GAAP) I $453 $439 $465 $443 $425 $14 3% $28 7% $892 $813 $79 10% Add: Notable items, net of income tax expense (benefit) 5 4 9 7 — 1 25 5 100 9 — 9 100 Net income, Underlying (non-GAAP) J $458 $443 $474 $450 $425 $15 3% $33 8% $901 $813 $88 11% Net income available to common stockholders, Underlying: Net income available to common stockholders (GAAP) K $435 $424 $450 $436 $425 $11 3% $10 2% $859 $806 $53 7% Add: Notable items, net of income tax expense (benefit) 5 4 9 7 — 1 25 5 100 9 — 9 100 Net income available to common stockholders, Underlying (non-GAAP) L $440 $428 $459 $443 $425 $12 3% $15 4% $868 $806 $62 8% 23KEY PERFORMANCE METRICS, NON-GAAP FINANCIAL MEASURES AND RECONCILIATIONS, CONTINUED (in millions, except share, per-share and ratio data) QUARTERLY TRENDS FOR THE SIX MONTHS ENDED JUNE 30, 2Q19 Change 2019 Change 2Q19 1Q19 4Q18 3Q18 2Q18 1Q19 2Q18 2019 2018 2018 $ % $ % $ % Noninterest income, Underlying: Noninterest income (GAAP) $462 $428 $421 $416 $388 $34 8% $74 19% $890 $759 $131 17% Less: Notable items — — (5) — — — — — — — — — — Noninterest income, Underlying (non-GAAP) $462 $428 $426 $416 $388 $34 8% $74 19% $890 $759 $131 17% Total revenue, Underlying: Total revenue (GAAP) A $1,628 $1,588 $1,593 $1,564 $1,509 $40 3% $119 8% $3,216 $2,971 $245 8% Less: Notable items — — (5) — — — — — — — — — — Total revenue, Underlying (non-GAAP) B $1,628 $1,588 $1,598 $1,564 $1,509 $40 3% $119 8% $3,216 $2,971 $245 8% Noninterest expense, Underlying: Noninterest expense (GAAP) C $951 $937 $951 $910 $875 $14 1% $76 9% $1,888 $1,758 $130 7% Less: Notable items 7 5 45 9 — 2 40 7 100 12 — 12 100 Noninterest expense, Underlying (non-GAAP) D $944 $932 $906 $901 $875 $12 1% $69 8% $1,876 $1,758 $118 7% Pre-provision profit: Total revenue (GAAP) A $1,628 $1,588 $1,593 $1,564 $1,509 $40 3% $119 8% $3,216 $2,971 $245 8% Less: Noninterest expense (GAAP) C 951 937 951 910 875 14 1 76 9 1,888 1,758 130 7 Pre-provision profit (GAAP) $677 $651 $642 $654 $634 $26 4% $43 7% $1,328 $1,213 $115 9% Pre-provision profit, Underlying: Total revenue, Underlying (non-GAAP) B $1,628 $1,588 $1,598 $1,564 $1,509 $40 3% $119 8% $3,216 $2,971 $245 8% Less: Noninterest expense, Underlying (non-GAAP) D 944 932 906 901 875 12 1 69 8 1,876 1,758 118 7 Pre-provision profit, Underlying (non-GAAP) $684 $656 $692 $663 $634 $28 4% $50 8% $1,340 $1,213 $127 10% Income before income tax expense, Underlying: Income before income tax expense (GAAP) E $580 $566 $557 $576 $549 $14 2% $31 6% $1,146 $1,050 $96 9% Less: Income (expense) before income tax expense (benefit) related to notable items (7) (5) (50) (9) — (2) (40) (7) (100) (12) — (12) (100) Income before income tax expense, Underlying (non-GAAP) F $587 $571 $607 $585 $549 $16 3% $38 7% $1,158 $1,050 $108 10% Income tax expense, Underlying: Income tax expense (benefit) (GAAP) G $127 $127 $92 $133 $124 $— —% $3 2% $254 $237 $17 7% Less: Income tax expense (benefit) related to notable items (2) (1) (41) (2) — (1) (100) (2) (100) (3) — (3) (100) Income tax expense, Underlying (non-GAAP) H $129 $128 $133 $135 $124 $1 1% $5 4% $257 $237 $20 8% Net income, Underlying: Net income (GAAP) I $453 $439 $465 $443 $425 $14 3% $28 7% $892 $813 $79 10% Add: Notable items, net of income tax expense (benefit) 5 4 9 7 — 1 25 5 100 9 — 9 100 Net income, Underlying (non-GAAP) J $458 $443 $474 $450 $425 $15 3% $33 8% $901 $813 $88 11% Net income available to common stockholders, Underlying: Net income available to common stockholders (GAAP) K $435 $424 $450 $436 $425 $11 3% $10 2% $859 $806 $53 7% Add: Notable items, net of income tax expense (benefit) 5 4 9 7 — 1 25 5 100 9 — 9 100 Net income available to common stockholders, Underlying (non-GAAP) L $440 $428 $459 $443 $425 $12 3% $15 4% $868 $806 $62 8% 23

KEY PERFORMANCE METRICS, NON-GAAP FINANCIAL MEASURES AND RECONCILIATIONS, CONTINUED (in millions, except share, per-share and ratio data) QUARTERLY TRENDS FOR THE SIX MONTHS ENDED JUNE 30, 2Q19 Change 2019 Change 2Q19 1Q19 4Q18 3Q18 2Q18 1Q19 2Q18 2019 2018 2018 $/bps % $/bps % $/bps % Operating leverage: Total revenue (GAAP) A $1,628 $1,588 $1,593 $1,564 $1,509 $40 2.46% $119 7.81% $3,216 $2,971 $245 8.25% Less: Noninterest expense (GAAP) C 951 937 951 910 875 14 1.43 76 8.66 1,888 1,758 130 7.39 Operating leverage 1.03% (0.85%) 0.86% Operating leverage, Underlying: Total revenue, Underlying (non-GAAP) B $1,628 $1,588 $1,598 $1,564 $1,509 $40 2.46% $119 7.81% $3,216 $2,971 $245 8.25% Less: Noninterest expense, Underlying (non-GAAP) D 944 932 906 901 875 12 1.33 69 7.93 1,876 1,758 118 6.73 Operating leverage, Underlying (non-GAAP) 1.13% (0.12%) 1.52% Efficiency ratio and efficiency ratio, Underlying: Efficiency ratio C/A 58.41% 59.00% 59.69% 58.20% 57.95% (59) bps 46 bps 58.70% 59.17% (47) bps Efficiency ratio, Underlying (non-GAAP) D/B 58.02 58.67 56.70 57.62 57.95 (65) bps 7 bps 58.34 59.17 (83) bps Effective income tax rate and effective income tax rate, Underlying: Effective income tax rate G/E 21.86% 22.42% 16.45% 23.16% 22.58% (56) bps (72) bps 22.14% 22.55% (41) bps Effective income tax rate, Underlying (non-GAAP) H/F 21.89 22.44 21.91 23.20 22.58 (55) bps (69) bps 22.16 22.55 (39) bps Return on average common equity and return on average common equity, Underlying: Average common equity (GAAP) M $20,420 $19,942 $19,521 $19,599 $19,732 $478 2% $688 3% $20,182 $19,732 $450 2% Return on average common equity K/M 8.54% 8.62% 9.16% 8.82% 8.65% (8) bps (11) bps 8.58% 8.24% 34 bps Return on average common equity, Underlying (non-GAAP) L/M 8.63 8.71 9.33 8.96 8.65 (8) bps (2) bps 8.67 8.24 43 bps Return on average tangible common equity and return on average tangible common equity, Underlying: Average common equity (GAAP) M $20,420 $19,942 $19,521 $19,599 $19,732 $478 2% $688 3% $20,182 $19,732 $450 2% Less: Average goodwill (GAAP) 7,040 7,018 6,946 6,926 6,887 22 — 153 2 7,029 6,887 142 2 Less: Average other intangibles (GAAP) 80 59 32 22 2 21 36 78 NM 69 2 67 NM Add: Average deferred tax liabilities related to goodwill (GAAP) 370 368 364 360 357 2 1 13 4 369 356 13 4 Average tangible common equity N $13,670 $13,233 $12,907 $13,011 $13,200 $437 3% $470 4% $13,453 $13,199 $254 2% Return on average tangible common equity K/N 12.75% 13.00% 13.85% 13.29% 12.93% (25) bps (18) bps 12.87% 12.32% 55 bps Return on average tangible common equity, Underlying (non-GAAP) L/N 12.89 13.12 14.11 13.50 12.93 (23) bps (4) bps 13.00 12.32 68 bps Return on average total assets and return on average total assets, Underlying: Average total assets (GAAP) O $161,489 $160,415 $157,732 $155,624 $153,253 $1,074 1% $8,236 5% $160,955 $152,393 $8,562 6% Return on average total assets I/O 1.13% 1.11% 1.17% 1.13% 1.11% 2 bps 2 bps 1.12% 1.08% 4 bps Return on average total assets, Underlying (non-GAAP) J/O 1.14 1.12 1.19 1.15 1.11 2 bps 3 bps 1.13 1.08 5 bps Return on average total tangible assets and return on average total tangible assets, Underlying: Average total assets (GAAP) O $161,489 $160,415 $157,732 $155,624 $153,253 $1,074 1% $8,236 5% $160,955 $152,393 $8,562 6% Less: Average goodwill (GAAP) 7,040 7,018 6,946 6,926 6,887 22 — 153 2 7,029 6,887 142 2 Less: Average other intangibles (GAAP) 80 59 32 22 2 21 36 78 NM 69 2 67 NM Add: Average deferred tax liabilities related to goodwill (GAAP) 370 368 364 360 357 2 1 13 4 369 356 13 4 Average tangible assets P $154,739 $153,706 $151,118 $149,036 $146,721 $1,033 1% $8,018 5% $154,226 $145,860 $8,366 6% Return on average total tangible assets I/P 1.17% 1.16% 1.22% 1.18% 1.16% 1 bps 1 bps 1.17% 1.12% 5 bps Return on average total tangible assets, Underlying (non-GAAP) J/P 1.19 1.17 1.24 1.20 1.16 2 bps 3 bps 1.18 1.12 6 bps 24KEY PERFORMANCE METRICS, NON-GAAP FINANCIAL MEASURES AND RECONCILIATIONS, CONTINUED (in millions, except share, per-share and ratio data) QUARTERLY TRENDS FOR THE SIX MONTHS ENDED JUNE 30, 2Q19 Change 2019 Change 2Q19 1Q19 4Q18 3Q18 2Q18 1Q19 2Q18 2019 2018 2018 $/bps % $/bps % $/bps % Operating leverage: Total revenue (GAAP) A $1,628 $1,588 $1,593 $1,564 $1,509 $40 2.46% $119 7.81% $3,216 $2,971 $245 8.25% Less: Noninterest expense (GAAP) C 951 937 951 910 875 14 1.43 76 8.66 1,888 1,758 130 7.39 Operating leverage 1.03% (0.85%) 0.86% Operating leverage, Underlying: Total revenue, Underlying (non-GAAP) B $1,628 $1,588 $1,598 $1,564 $1,509 $40 2.46% $119 7.81% $3,216 $2,971 $245 8.25% Less: Noninterest expense, Underlying (non-GAAP) D 944 932 906 901 875 12 1.33 69 7.93 1,876 1,758 118 6.73 Operating leverage, Underlying (non-GAAP) 1.13% (0.12%) 1.52% Efficiency ratio and efficiency ratio, Underlying: Efficiency ratio C/A 58.41% 59.00% 59.69% 58.20% 57.95% (59) bps 46 bps 58.70% 59.17% (47) bps Efficiency ratio, Underlying (non-GAAP) D/B 58.02 58.67 56.70 57.62 57.95 (65) bps 7 bps 58.34 59.17 (83) bps Effective income tax rate and effective income tax rate, Underlying: Effective income tax rate G/E 21.86% 22.42% 16.45% 23.16% 22.58% (56) bps (72) bps 22.14% 22.55% (41) bps Effective income tax rate, Underlying (non-GAAP) H/F 21.89 22.44 21.91 23.20 22.58 (55) bps (69) bps 22.16 22.55 (39) bps Return on average common equity and return on average common equity, Underlying: Average common equity (GAAP) M $20,420 $19,942 $19,521 $19,599 $19,732 $478 2% $688 3% $20,182 $19,732 $450 2% Return on average common equity K/M 8.54% 8.62% 9.16% 8.82% 8.65% (8) bps (11) bps 8.58% 8.24% 34 bps Return on average common equity, Underlying (non-GAAP) L/M 8.63 8.71 9.33 8.96 8.65 (8) bps (2) bps 8.67 8.24 43 bps Return on average tangible common equity and return on average tangible common equity, Underlying: Average common equity (GAAP) M $20,420 $19,942 $19,521 $19,599 $19,732 $478 2% $688 3% $20,182 $19,732 $450 2% Less: Average goodwill (GAAP) 7,040 7,018 6,946 6,926 6,887 22 — 153 2 7,029 6,887 142 2 Less: Average other intangibles (GAAP) 80 59 32 22 2 21 36 78 NM 69 2 67 NM Add: Average deferred tax liabilities related to goodwill (GAAP) 370 368 364 360 357 2 1 13 4 369 356 13 4 Average tangible common equity N $13,670 $13,233 $12,907 $13,011 $13,200 $437 3% $470 4% $13,453 $13,199 $254 2% Return on average tangible common equity K/N 12.75% 13.00% 13.85% 13.29% 12.93% (25) bps (18) bps 12.87% 12.32% 55 bps Return on average tangible common equity, Underlying (non-GAAP) L/N 12.89 13.12 14.11 13.50 12.93 (23) bps (4) bps 13.00 12.32 68 bps Return on average total assets and return on average total assets, Underlying: Average total assets (GAAP) O $161,489 $160,415 $157,732 $155,624 $153,253 $1,074 1% $8,236 5% $160,955 $152,393 $8,562 6% Return on average total assets I/O 1.13% 1.11% 1.17% 1.13% 1.11% 2 bps 2 bps 1.12% 1.08% 4 bps Return on average total assets, Underlying (non-GAAP) J/O 1.14 1.12 1.19 1.15 1.11 2 bps 3 bps 1.13 1.08 5 bps Return on average total tangible assets and return on average total tangible assets, Underlying: Average total assets (GAAP) O $161,489 $160,415 $157,732 $155,624 $153,253 $1,074 1% $8,236 5% $160,955 $152,393 $8,562 6% Less: Average goodwill (GAAP) 7,040 7,018 6,946 6,926 6,887 22 — 153 2 7,029 6,887 142 2 Less: Average other intangibles (GAAP) 80 59 32 22 2 21 36 78 NM 69 2 67 NM Add: Average deferred tax liabilities related to goodwill (GAAP) 370 368 364 360 357 2 1 13 4 369 356 13 4 Average tangible assets P $154,739 $153,706 $151,118 $149,036 $146,721 $1,033 1% $8,018 5% $154,226 $145,860 $8,366 6% Return on average total tangible assets I/P 1.17% 1.16% 1.22% 1.18% 1.16% 1 bps 1 bps 1.17% 1.12% 5 bps Return on average total tangible assets, Underlying (non-GAAP) J/P 1.19 1.17 1.24 1.20 1.16 2 bps 3 bps 1.18 1.12 6 bps 24
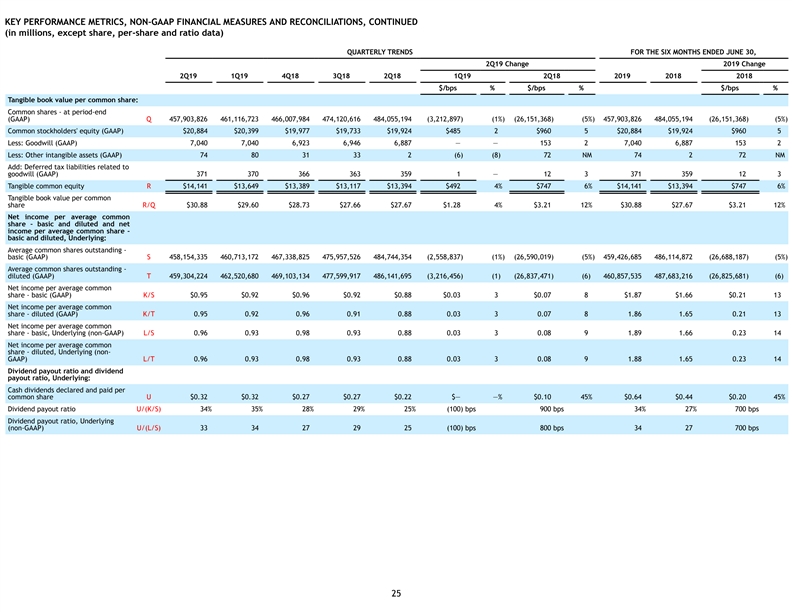
KEY PERFORMANCE METRICS, NON-GAAP FINANCIAL MEASURES AND RECONCILIATIONS, CONTINUED (in millions, except share, per-share and ratio data) QUARTERLY TRENDS FOR THE SIX MONTHS ENDED JUNE 30, 2Q19 Change 2019 Change 2Q19 1Q19 4Q18 3Q18 2Q18 1Q19 2Q18 2019 2018 2018 $/bps % $/bps % $/bps % Tangible book value per common share: Common shares - at period-end (GAAP) Q 457,903,826 461,116,723 466,007,984 474,120,616 484,055,194 (3,212,897) (1%) (26,151,368) (5%) 457,903,826 484,055,194 (26,151,368) (5%) Common stockholders' equity (GAAP) $20,884 $20,399 $19,977 $19,733 $19,924 $485 2 $960 5 $20,884 $19,924 $960 5 Less: Goodwill (GAAP) 7,040 7,040 6,923 6,946 6,887 — — 153 2 7,040 6,887 153 2 Less: Other intangible assets (GAAP) 74 80 31 33 2 (6) (8) 72 NM 74 2 72 NM Add: Deferred tax liabilities related to goodwill (GAAP) 371 370 366 363 359 1 — 12 3 371 359 12 3 Tangible common equity R $14,141 $13,649 $13,389 $13,117 $13,394 $492 4% $747 6% $14,141 $13,394 $747 6% Tangible book value per common share R/Q $30.88 $29.60 $28.73 $27.66 $27.67 $1.28 4% $3.21 12% $30.88 $27.67 $3.21 12% Net income per average common share - basic and diluted and net income per average common share - basic and diluted, Underlying: Average common shares outstanding - basic (GAAP) S 458,154,335 460,713,172 467,338,825 475,957,526 484,744,354 (2,558,837) (1%) (26,590,019) (5%) 459,426,685 486,114,872 (26,688,187) (5%) Average common shares outstanding - diluted (GAAP) T 459,304,224 462,520,680 469,103,134 477,599,917 486,141,695 (3,216,456) (1) (26,837,471) (6) 460,857,535 487,683,216 (26,825,681) (6) Net income per average common share - basic (GAAP) K/S $0.95 $0.92 $0.96 $0.92 $0.88 $0.03 3 $0.07 8 $1.87 $1.66 $0.21 13 Net income per average common share - diluted (GAAP) K/T 0.95 0.92 0.96 0.91 0.88 0.03 3 0.07 8 1.86 1.65 0.21 13 Net income per average common share - basic, Underlying (non-GAAP) L/S 0.96 0.93 0.98 0.93 0.88 0.03 3 0.08 9 1.89 1.66 0.23 14 Net income per average common share - diluted, Underlying (non- GAAP) L/T 0.96 0.93 0.98 0.93 0.88 0.03 3 0.08 9 1.88 1.65 0.23 14 Dividend payout ratio and dividend payout ratio, Underlying: Cash dividends declared and paid per common share U $0.32 $0.32 $0.27 $0.27 $0.22 $— —% $0.10 45% $0.64 $0.44 $0.20 45% Dividend payout ratio U/(K/S) 34% 35% 28% 29% 25% (100) bps 900 bps 34% 27% 700 bps Dividend payout ratio, Underlying (non-GAAP) U/(L/S) 33 34 27 29 25 (100) bps 800 bps 34 27 700 bps 25KEY PERFORMANCE METRICS, NON-GAAP FINANCIAL MEASURES AND RECONCILIATIONS, CONTINUED (in millions, except share, per-share and ratio data) QUARTERLY TRENDS FOR THE SIX MONTHS ENDED JUNE 30, 2Q19 Change 2019 Change 2Q19 1Q19 4Q18 3Q18 2Q18 1Q19 2Q18 2019 2018 2018 $/bps % $/bps % $/bps % Tangible book value per common share: Common shares - at period-end (GAAP) Q 457,903,826 461,116,723 466,007,984 474,120,616 484,055,194 (3,212,897) (1%) (26,151,368) (5%) 457,903,826 484,055,194 (26,151,368) (5%) Common stockholders' equity (GAAP) $20,884 $20,399 $19,977 $19,733 $19,924 $485 2 $960 5 $20,884 $19,924 $960 5 Less: Goodwill (GAAP) 7,040 7,040 6,923 6,946 6,887 — — 153 2 7,040 6,887 153 2 Less: Other intangible assets (GAAP) 74 80 31 33 2 (6) (8) 72 NM 74 2 72 NM Add: Deferred tax liabilities related to goodwill (GAAP) 371 370 366 363 359 1 — 12 3 371 359 12 3 Tangible common equity R $14,141 $13,649 $13,389 $13,117 $13,394 $492 4% $747 6% $14,141 $13,394 $747 6% Tangible book value per common share R/Q $30.88 $29.60 $28.73 $27.66 $27.67 $1.28 4% $3.21 12% $30.88 $27.67 $3.21 12% Net income per average common share - basic and diluted and net income per average common share - basic and diluted, Underlying: Average common shares outstanding - basic (GAAP) S 458,154,335 460,713,172 467,338,825 475,957,526 484,744,354 (2,558,837) (1%) (26,590,019) (5%) 459,426,685 486,114,872 (26,688,187) (5%) Average common shares outstanding - diluted (GAAP) T 459,304,224 462,520,680 469,103,134 477,599,917 486,141,695 (3,216,456) (1) (26,837,471) (6) 460,857,535 487,683,216 (26,825,681) (6) Net income per average common share - basic (GAAP) K/S $0.95 $0.92 $0.96 $0.92 $0.88 $0.03 3 $0.07 8 $1.87 $1.66 $0.21 13 Net income per average common share - diluted (GAAP) K/T 0.95 0.92 0.96 0.91 0.88 0.03 3 0.07 8 1.86 1.65 0.21 13 Net income per average common share - basic, Underlying (non-GAAP) L/S 0.96 0.93 0.98 0.93 0.88 0.03 3 0.08 9 1.89 1.66 0.23 14 Net income per average common share - diluted, Underlying (non- GAAP) L/T 0.96 0.93 0.98 0.93 0.88 0.03 3 0.08 9 1.88 1.65 0.23 14 Dividend payout ratio and dividend payout ratio, Underlying: Cash dividends declared and paid per common share U $0.32 $0.32 $0.27 $0.27 $0.22 $— —% $0.10 45% $0.64 $0.44 $0.20 45% Dividend payout ratio U/(K/S) 34% 35% 28% 29% 25% (100) bps 900 bps 34% 27% 700 bps Dividend payout ratio, Underlying (non-GAAP) U/(L/S) 33 34 27 29 25 (100) bps 800 bps 34 27 700 bps 25

KEY PERFORMANCE METRICS, NON-GAAP FINANCIAL MEASURES AND RECONCILIATIONS, CONTINUED (in millions, except share, per-share and ratio data) QUARTERLY TRENDS FOR THE SIX MONTHS ENDED JUNE 30, 2Q19 Change 2019 Change 2Q19 1Q19 4Q18 3Q18 2Q18 1Q19 2Q18 2019 2018 2018 $ % $ % $/bps % Mortgage banking fees, Underlying: Mortgage banking fees (GAAP) $62 $43 $51 $49 $27 $19 44% $35 130% $105 $52 $53 102% Less: Notable items — — (4) — — — — — — — — — — Mortgage banking fees, Underlying (non-GAAP) $62 $43 $55 $49 $27 $19 44% $35 130% $105 $52 $53 102% Other income, Underlying: Other income (GAAP) $28 $25 $15 $17 $15 $3 12% $13 87% $53 $32 $21 66% Less: Notable items — — (1) — — — — — — — — — — Other income, Underlying (non-GAAP) $28 $25 $16 $17 $15 $3 12% $13 87% $53 $32 $21 66% Salaries and employee benefits, Underlying: Salaries and employee benefits (GAAP) $507 $509 $483 $474 $453 ($2) —% $54 12% $1,016 $923 $93 10% Less: Notable items 2 1 6 5 — 1 100 2 100 3 — 3 100 Salaries and employee benefits, Underlying (non-GAAP) $505 $508 $477 $469 $453 ($3) (1%) $52 11% $1,013 $923 $90 10% 1 Equipment and software expense, Underlying : 1 Equipment and software expense (GAAP) $126 $125 $124 $117 $110 $1 1% $16 15% $251 $223 $28 13% Less: Notable items — — 3 — — — — — — — — — — 1 Equipment and software expense, Underlying (non-GAAP) $126 $125 $121 $117 $110 $1 1% $16 15% $251 $223 $28 13% Outside services, Underlying: Outside services (GAAP) $118 $110 $135 $107 $106 $8 7% $12 11% $228 $205 $23 11% Less: Notable items 5 4 19 1 — 1 25 5 100 9 — 9 100 Outside services, Underlying (non-GAAP) $113 $106 $116 $106 $106 $7 7% $7 7% $219 $205 $14 7% Occupancy, Underlying: Occupancy (GAAP) $82 $83 $92 $81 $79 ($1) (1%) $3 4% $165 $160 $5 3% Less: Notable items — — 16 — — — — — — — — — — Occupancy, Underlying (non-GAAP) $82 $83 $76 $81 $79 ($1) (1%) $3 4% $165 $160 $5 3% Other operating expense, Underlying: Other operating expense (GAAP) $118 $110 $117 $131 $127 $8 7% ($9) (7%) $228 $247 ($19) (8%) Less: Notable items — — 1 3 — — — — — — — — — Other operating expense, Underlying (non-GAAP) $118 $110 $116 $128 $127 $8 7% ($9) (7%) $228 $247 ($19) (8%) 1 Beginning in the first quarter of 2019, we combined our presentation of equipment expense and amortization of software into equipment and software expense. Prior periods have been adjusted to conform with the current period presentation. 26KEY PERFORMANCE METRICS, NON-GAAP FINANCIAL MEASURES AND RECONCILIATIONS, CONTINUED (in millions, except share, per-share and ratio data) QUARTERLY TRENDS FOR THE SIX MONTHS ENDED JUNE 30, 2Q19 Change 2019 Change 2Q19 1Q19 4Q18 3Q18 2Q18 1Q19 2Q18 2019 2018 2018 $ % $ % $/bps % Mortgage banking fees, Underlying: Mortgage banking fees (GAAP) $62 $43 $51 $49 $27 $19 44% $35 130% $105 $52 $53 102% Less: Notable items — — (4) — — — — — — — — — — Mortgage banking fees, Underlying (non-GAAP) $62 $43 $55 $49 $27 $19 44% $35 130% $105 $52 $53 102% Other income, Underlying: Other income (GAAP) $28 $25 $15 $17 $15 $3 12% $13 87% $53 $32 $21 66% Less: Notable items — — (1) — — — — — — — — — — Other income, Underlying (non-GAAP) $28 $25 $16 $17 $15 $3 12% $13 87% $53 $32 $21 66% Salaries and employee benefits, Underlying: Salaries and employee benefits (GAAP) $507 $509 $483 $474 $453 ($2) —% $54 12% $1,016 $923 $93 10% Less: Notable items 2 1 6 5 — 1 100 2 100 3 — 3 100 Salaries and employee benefits, Underlying (non-GAAP) $505 $508 $477 $469 $453 ($3) (1%) $52 11% $1,013 $923 $90 10% 1 Equipment and software expense, Underlying : 1 Equipment and software expense (GAAP) $126 $125 $124 $117 $110 $1 1% $16 15% $251 $223 $28 13% Less: Notable items — — 3 — — — — — — — — — — 1 Equipment and software expense, Underlying (non-GAAP) $126 $125 $121 $117 $110 $1 1% $16 15% $251 $223 $28 13% Outside services, Underlying: Outside services (GAAP) $118 $110 $135 $107 $106 $8 7% $12 11% $228 $205 $23 11% Less: Notable items 5 4 19 1 — 1 25 5 100 9 — 9 100 Outside services, Underlying (non-GAAP) $113 $106 $116 $106 $106 $7 7% $7 7% $219 $205 $14 7% Occupancy, Underlying: Occupancy (GAAP) $82 $83 $92 $81 $79 ($1) (1%) $3 4% $165 $160 $5 3% Less: Notable items — — 16 — — — — — — — — — — Occupancy, Underlying (non-GAAP) $82 $83 $76 $81 $79 ($1) (1%) $3 4% $165 $160 $5 3% Other operating expense, Underlying: Other operating expense (GAAP) $118 $110 $117 $131 $127 $8 7% ($9) (7%) $228 $247 ($19) (8%) Less: Notable items — — 1 3 — — — — — — — — — Other operating expense, Underlying (non-GAAP) $118 $110 $116 $128 $127 $8 7% ($9) (7%) $228 $247 ($19) (8%) 1 Beginning in the first quarter of 2019, we combined our presentation of equipment expense and amortization of software into equipment and software expense. Prior periods have been adjusted to conform with the current period presentation. 26
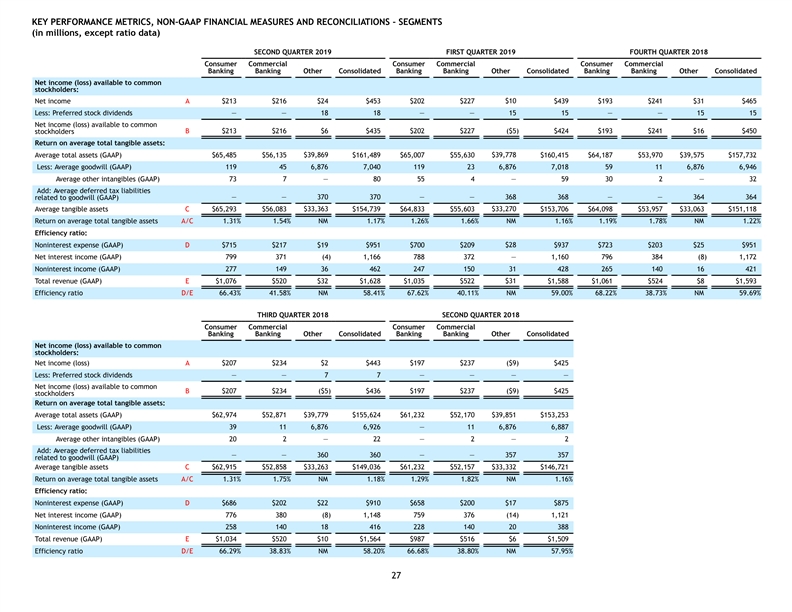
KEY PERFORMANCE METRICS, NON-GAAP FINANCIAL MEASURES AND RECONCILIATIONS - SEGMENTS (in millions, except ratio data) SECOND QUARTER 2019 FIRST QUARTER 2019 FOURTH QUARTER 2018 Consumer Commercial Consumer Commercial Consumer Commercial Banking Banking Other Consolidated Banking Banking Other Consolidated Banking Banking Other Consolidated Net income (loss) available to common stockholders: Net income A $213 $216 $24 $453 $202 $227 $10 $439 $193 $241 $31 $465 Less: Preferred stock dividends — — 18 18 — — 15 15 — — 15 15 Net income (loss) available to common B $213 $216 $6 $435 $202 $227 ($5) $424 $193 $241 $16 $450 stockholders Return on average total tangible assets: Average total assets (GAAP) $65,485 $56,135 $39,869 $161,489 $65,007 $55,630 $39,778 $160,415 $64,187 $53,970 $39,575 $157,732 Less: Average goodwill (GAAP) 119 45 6,876 7,040 119 23 6,876 7,018 59 11 6,876 6,946 Average other intangibles (GAAP) 73 7 — 80 55 4 — 59 30 2 — 32 Add: Average deferred tax liabilities — — 370 370 — — 368 368 — — 364 364 related to goodwill (GAAP) Average tangible assets C $65,293 $56,083 $33,363 $154,739 $64,833 $55,603 $33,270 $153,706 $64,098 $53,957 $33,063 $151,118 Return on average total tangible assets A/C 1.31% 1.54% NM 1.17% 1.26% 1.66% NM 1.16% 1.19% 1.78% NM 1.22% Efficiency ratio: Noninterest expense (GAAP) D $715 $217 $19 $951 $700 $209 $28 $937 $723 $203 $25 $951 Net interest income (GAAP) 799 371 (4) 1,166 788 372 — 1,160 796 384 (8) 1,172 Noninterest income (GAAP) 277 149 36 462 247 150 31 428 265 140 16 421 Total revenue (GAAP) E $1,076 $520 $32 $1,628 $1,035 $522 $31 $1,588 $1,061 $524 $8 $1,593 Efficiency ratio D/E 66.43% 41.58% NM 58.41% 67.62% 40.11% NM 59.00% 68.22% 38.73% NM 59.69% THIRD QUARTER 2018 SECOND QUARTER 2018 Consumer Commercial Consumer Commercial Banking Banking Other Consolidated Banking Banking Other Consolidated Net income (loss) available to common stockholders: Net income (loss) A $207 $234 $2 $443 $197 $237 ($9) $425 Less: Preferred stock dividends — — 7 7 — — — — Net income (loss) available to common B $207 $234 ($5) $436 $197 $237 ($9) $425 stockholders Return on average total tangible assets: Average total assets (GAAP) $62,974 $52,871 $39,779 $155,624 $61,232 $52,170 $39,851 $153,253 Less: Average goodwill (GAAP) 39 11 6,876 6,926 — 11 6,876 6,887 Average other intangibles (GAAP) 20 2 — 22 — 2 — 2 Add: Average deferred tax liabilities — — 360 360 — — 357 357 related to goodwill (GAAP) Average tangible assets C $62,915 $52,858 $33,263 $149,036 $61,232 $52,157 $33,332 $146,721 Return on average total tangible assets A/C 1.31% 1.75% NM 1.18% 1.29% 1.82% NM 1.16% Efficiency ratio: Noninterest expense (GAAP) D $686 $202 $22 $910 $658 $200 $17 $875 Net interest income (GAAP) 776 380 (8) 1,148 759 376 (14) 1,121 Noninterest income (GAAP) 258 140 18 416 228 140 20 388 Total revenue (GAAP) E $1,034 $520 $10 $1,564 $987 $516 $6 $1,509 Efficiency ratio D/E 66.29% 38.83% NM 58.20% 66.68% 38.80% NM 57.95% 27KEY PERFORMANCE METRICS, NON-GAAP FINANCIAL MEASURES AND RECONCILIATIONS - SEGMENTS (in millions, except ratio data) SECOND QUARTER 2019 FIRST QUARTER 2019 FOURTH QUARTER 2018 Consumer Commercial Consumer Commercial Consumer Commercial Banking Banking Other Consolidated Banking Banking Other Consolidated Banking Banking Other Consolidated Net income (loss) available to common stockholders: Net income A $213 $216 $24 $453 $202 $227 $10 $439 $193 $241 $31 $465 Less: Preferred stock dividends — — 18 18 — — 15 15 — — 15 15 Net income (loss) available to common B $213 $216 $6 $435 $202 $227 ($5) $424 $193 $241 $16 $450 stockholders Return on average total tangible assets: Average total assets (GAAP) $65,485 $56,135 $39,869 $161,489 $65,007 $55,630 $39,778 $160,415 $64,187 $53,970 $39,575 $157,732 Less: Average goodwill (GAAP) 119 45 6,876 7,040 119 23 6,876 7,018 59 11 6,876 6,946 Average other intangibles (GAAP) 73 7 — 80 55 4 — 59 30 2 — 32 Add: Average deferred tax liabilities — — 370 370 — — 368 368 — — 364 364 related to goodwill (GAAP) Average tangible assets C $65,293 $56,083 $33,363 $154,739 $64,833 $55,603 $33,270 $153,706 $64,098 $53,957 $33,063 $151,118 Return on average total tangible assets A/C 1.31% 1.54% NM 1.17% 1.26% 1.66% NM 1.16% 1.19% 1.78% NM 1.22% Efficiency ratio: Noninterest expense (GAAP) D $715 $217 $19 $951 $700 $209 $28 $937 $723 $203 $25 $951 Net interest income (GAAP) 799 371 (4) 1,166 788 372 — 1,160 796 384 (8) 1,172 Noninterest income (GAAP) 277 149 36 462 247 150 31 428 265 140 16 421 Total revenue (GAAP) E $1,076 $520 $32 $1,628 $1,035 $522 $31 $1,588 $1,061 $524 $8 $1,593 Efficiency ratio D/E 66.43% 41.58% NM 58.41% 67.62% 40.11% NM 59.00% 68.22% 38.73% NM 59.69% THIRD QUARTER 2018 SECOND QUARTER 2018 Consumer Commercial Consumer Commercial Banking Banking Other Consolidated Banking Banking Other Consolidated Net income (loss) available to common stockholders: Net income (loss) A $207 $234 $2 $443 $197 $237 ($9) $425 Less: Preferred stock dividends — — 7 7 — — — — Net income (loss) available to common B $207 $234 ($5) $436 $197 $237 ($9) $425 stockholders Return on average total tangible assets: Average total assets (GAAP) $62,974 $52,871 $39,779 $155,624 $61,232 $52,170 $39,851 $153,253 Less: Average goodwill (GAAP) 39 11 6,876 6,926 — 11 6,876 6,887 Average other intangibles (GAAP) 20 2 — 22 — 2 — 2 Add: Average deferred tax liabilities — — 360 360 — — 357 357 related to goodwill (GAAP) Average tangible assets C $62,915 $52,858 $33,263 $149,036 $61,232 $52,157 $33,332 $146,721 Return on average total tangible assets A/C 1.31% 1.75% NM 1.18% 1.29% 1.82% NM 1.16% Efficiency ratio: Noninterest expense (GAAP) D $686 $202 $22 $910 $658 $200 $17 $875 Net interest income (GAAP) 776 380 (8) 1,148 759 376 (14) 1,121 Noninterest income (GAAP) 258 140 18 416 228 140 20 388 Total revenue (GAAP) E $1,034 $520 $10 $1,564 $987 $516 $6 $1,509 Efficiency ratio D/E 66.29% 38.83% NM 58.20% 66.68% 38.80% NM 57.95% 27

KEY PERFORMANCE METRICS, NON-GAAP FINANCIAL MEASURES AND RECONCILIATIONS - SEGMENTS (CONTINUED) (in millions, except ratio data) FOR THE SIX MONTHS ENDED JUNE 30, 2019 2018 Consumer Commercial Consumer Commercial Banking Banking Other Consolidated Banking Banking Other Consolidated Net income (loss) available to common stockholders: Net income (loss) A $415 $443 $34 $892 $367 $452 ($6) $813 Less: Preferred stock dividends — — 33 33 — — 7 7 Net income (loss) available to common stockholders B $415 $443 $1 $859 $367 $452 ($13) $806 Return on average total tangible assets: Average total assets (GAAP) $65,247 $55,884 $39,824 $160,955 $61,290 $51,286 $39,817 $152,393 Less: Average goodwill (GAAP) 119 34 6,876 7,029 — 11 6,876 6,887 Average other intangibles (GAAP) 64 5 — 69 — 2 — 2 Add: Average deferred tax liabilities related to goodwill (GAAP) — — 369 369 — — 356 356 Average tangible assets D $65,064 $55,845 $33,317 $154,226 $61,290 $51,273 $33,297 $145,860 Return on average total tangible assets A/D 1.29% 1.60% NM 1.17% 1.21% 1.78% NM 1.12% Efficiency ratio: Noninterest expense (GAAP) E $1,415 $426 $47 $1,888 $1,314 $408 $36 $1,758 Net interest income (GAAP) 1,587 743 (4) 2,326 1,492 733 (13) 2,212 Noninterest income (GAAP) 524 299 67 890 450 265 44 759 Total revenue (GAAP) F $2,111 $1,042 $63 $3,216 $1,942 $998 $31 $2,971 Efficiency ratio E/F 67.01% 40.84% NM 58.70% 67.68% 40.86% NM 59.17% 28KEY PERFORMANCE METRICS, NON-GAAP FINANCIAL MEASURES AND RECONCILIATIONS - SEGMENTS (CONTINUED) (in millions, except ratio data) FOR THE SIX MONTHS ENDED JUNE 30, 2019 2018 Consumer Commercial Consumer Commercial Banking Banking Other Consolidated Banking Banking Other Consolidated Net income (loss) available to common stockholders: Net income (loss) A $415 $443 $34 $892 $367 $452 ($6) $813 Less: Preferred stock dividends — — 33 33 — — 7 7 Net income (loss) available to common stockholders B $415 $443 $1 $859 $367 $452 ($13) $806 Return on average total tangible assets: Average total assets (GAAP) $65,247 $55,884 $39,824 $160,955 $61,290 $51,286 $39,817 $152,393 Less: Average goodwill (GAAP) 119 34 6,876 7,029 — 11 6,876 6,887 Average other intangibles (GAAP) 64 5 — 69 — 2 — 2 Add: Average deferred tax liabilities related to goodwill (GAAP) — — 369 369 — — 356 356 Average tangible assets D $65,064 $55,845 $33,317 $154,226 $61,290 $51,273 $33,297 $145,860 Return on average total tangible assets A/D 1.29% 1.60% NM 1.17% 1.21% 1.78% NM 1.12% Efficiency ratio: Noninterest expense (GAAP) E $1,415 $426 $47 $1,888 $1,314 $408 $36 $1,758 Net interest income (GAAP) 1,587 743 (4) 2,326 1,492 733 (13) 2,212 Noninterest income (GAAP) 524 299 67 890 450 265 44 759 Total revenue (GAAP) F $2,111 $1,042 $63 $3,216 $1,942 $998 $31 $2,971 Efficiency ratio E/F 67.01% 40.84% NM 58.70% 67.68% 40.86% NM 59.17% 28