UNITED STATES
SECURITIES AND EXCHANGE COMMISSION
Washington, D.C. 20549
FORM N-CSR
CERTIFIED SHAREHOLDER REPORT OF REGISTERED
MANAGEMENT INVESTMENT COMPANIES
| Investment Company Act file number | 811-04165 | |||||||||||||||||||
| AMERICAN CENTURY TARGET MATURITIES TRUST | ||||||||||||||||||||
| (Exact name of registrant as specified in charter) | ||||||||||||||||||||
| 4500 MAIN STREET, KANSAS CITY, MISSOURI | 64111 | |||||||||||||||||||
| (Address of principal executive offices) | (Zip Code) | |||||||||||||||||||
| JOHN PAK 4500 MAIN STREET, KANSAS CITY, MISSOURI 64111 | ||||||||||||||||||||
| (Name and address of agent for service) | ||||||||||||||||||||
| Registrant’s telephone number, including area code: | 816-531-5575 | |||||||||||||||||||
| Date of fiscal year end: | 09-30 | |||||||||||||||||||
| Date of reporting period: | 03-31-2024 | |||||||||||||||||||
ITEM 1. REPORTS TO STOCKHOLDERS.
(a) Provided under separate cover.

| Semiannual Report | |||||
| March 31, 2024 | |||||
| Zero Coupon 2025 Fund | |||||
| Investor Class (BTTRX) | |||||
| Advisor Class (ACTVX) | |||||
The Securities and Exchange Commission (SEC) adopted new rules that will require annual and semiannual reports to transition to a new format known as a Tailored Shareholder Report beginning in July 2024. The amendments will require the transmission of a concise report highlighting key fund information to investors. The detailed financial statements will remain available on our website, will be delivered to investors free of charge upon request, and will continue to be filed with the SEC.
| Table of Contents | ||
| President’s Letter | |||||
| Fund Characteristics | |||||
| Shareholder Fee Example | |||||
| Schedule of Investments | |||||
| Statement of Assets and Liabilities | |||||
| Statement of Operations | |||||
| Statement of Changes in Net Assets | |||||
| Notes to Financial Statements | |||||
| Financial Highlights | |||||
| Liquidity Risk Management Program | |||||
| Additional Information | |||||
Any opinions expressed in this report reflect those of the author as of the date of the report, and do not necessarily represent the opinions of American Century Investments® or any other person in the American Century Investments organization. Any such opinions are subject to change at any time based upon market or other conditions and American Century Investments disclaims any responsibility to update such opinions. These opinions may not be relied upon as investment advice and, because investment decisions made by American Century Investments funds are based on numerous factors, may not be relied upon as an indication of trading intent on behalf of any American Century Investments fund. Security examples are used for representational purposes only and are not intended as recommendations to purchase or sell securities. Performance information for comparative indices and securities is provided to American Century Investments by third party vendors. To the best of American Century Investments’ knowledge, such information is accurate at the time of printing.
| President’s Letter | ||
 Jonathan Thomas
Dear Investor:
Thank you for reviewing this semiannual report for the period ending March 31, 2024. It provides a market overview (below), followed by a schedule of fund investments and other financial information. For additional investment insights, please visit americancentury.com.
Declining Treasury Yields Aided Returns
U.S. Treasury yields began the reporting period on the rise, climbing sharply through October on monetary policy concerns. Despite pausing its rate-hike campaign in September, the Federal Reserve (Fed) warned that persistent above-target inflation may require more tightening. The two-year Treasury yield soared to a 17-year high, while the yield on the 10-year Treasury note topped 5% for the first time since 2007.
By November, inflation showed signs of moderating, and the Fed held rates steady for the second straight policy meeting. This news sparked a sharp turnaround for bonds. Then, in December, Fed policymakers expressed more confidence about the inflation outlook and penciled in three rate cuts for 2024. Against this backdrop, recession fears eased, Treasury yields declined, and bond returns rallied further.
But yields reversed course again in the first quarter of 2024. At its first policy meeting of the year, Fed Board Chair Jerome Powell set out to temper the market’s high hopes for aggressive near-term easing. He noted that although rate cuts were likely in 2024, they weren’t imminent, given inflation had not yet dropped to the Fed’s target.
A steady stream of better-than-expected economic data combined with persistent inflation and more measured Fed easing expectations drove Treasury yields higher. Overall, though, yields ended the six-month period lower than they were at the start of the period, which helped Treasury securities deliver six-month gains.
Remaining Diligent in Uncertain Times
We expect market volatility to linger as investors navigate a complex environment of persistent inflation, still-tight financial conditions, political uncertainty and slowing growth. In addition, the Israel-Hamas war and other tensions in the Middle East complicate the global backdrop and represent additional considerations for our investment teams.
Our firm has a long history of helping clients weather unpredictable and volatile markets, and we’re determined to meet today’s challenges. Thank you for your trust and confidence in American Century Investments.
With appreciation and respect,

Jonathan Thomas
President and Chief Executive Officer
American Century Investments
2
| Fund Characteristics | ||
| MARCH 31, 2024 | |||||
| Portfolio at a Glance | |||||
| Anticipated Annual Growth Rate (Investor Class) | 4.25% | ||||
| Weighted Average Maturity Date | 10/29/25 | ||||
Anticipated Value at Maturity (AVM) (Investor Class)(1) | $115.93 | ||||
(1)See graph below. | |||||
Past performance is no guarantee of future results. Even if class shares are held to maturity, there is no guarantee that the class’s share price will reach its AVM. There is also no guarantee that the AVM will fluctuate as little in the future as it has in the past. For more information, please consult the prospectus. | |||||
| Types of Investments in Portfolio | % of net assets | ||||
| Zero-Coupon U.S. Treasury Securities and Equivalents | 95.3% | ||||
| Zero-Coupon U.S. Government Agency Securities | 4.3% | ||||
| Short-Term Investments | 0.5% | ||||
| Other Assets and Liabilities | (0.1)% | ||||
| Share Price vs. Anticipated Value at Maturity (Investor Class) | ||
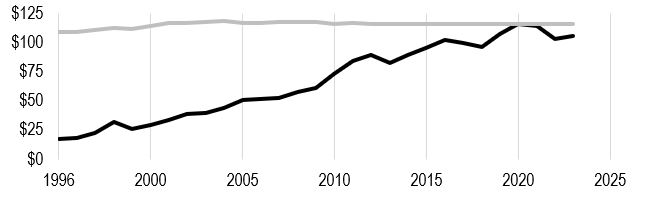
| Actual Share Price (Historical) — $108.42 | |||||
| Anticipated Value at Maturity (Estimated Share Price) — $115.93 | |||||
The top line in the graph represents the class’s AVM, which fluctuates from day to day based on the fund’s weighted average maturity date. The bottom line represents the class’s historical share price, which is managed to grow over time to reach the class’s AVM. The AVM for other share classes will vary due to differences in fee structure. While this graph demonstrates the class’s expected long-term growth pattern, please keep in mind that the fund may experience significant share-price volatility over the short term. Even if shares are held to maturity, there is no guarantee that the class’s share price will reach its AVM. There is also no guarantee that the AVM will fluctuate as little in the future as it has in the past.
3
| Shareholder Fee Example | ||
Fund shareholders may incur two types of costs: (1) transaction costs, including sales charges (loads) on purchase payments and redemption/exchange fees; and (2) ongoing costs, including management fees; distribution and service (12b-1) fees; and other fund expenses. This example is intended to help you understand your ongoing costs (in dollars) of investing in your fund and to compare these costs with the ongoing cost of investing in other mutual funds.
The example is based on an investment of $1,000 made at the beginning of the period and held for the entire period from October 1, 2023 to March 31, 2024.
Actual Expenses
The table provides information about actual account values and actual expenses for each class. You may use the information, together with the amount you invested, to estimate the expenses that you paid over the period. First, identify the share class you own. Then simply divide your account value by $1,000 (for example, an $8,600 account value divided by $1,000 = 8.6), then multiply the result by the number under the heading “Expenses Paid During Period” to estimate the expenses you paid on your account during this period.
If you hold Investor Class shares of any American Century Investments mutual fund, or I Class shares of the American Century Diversified Bond Fund, in an American Century Investments account (i.e., not through a financial intermediary or employer-sponsored retirement plan account), American Century Investments may charge you a $25 annual account maintenance fee if the value of those shares is less than $10,000. We will redeem shares automatically in one of your accounts to pay the $25 fee. In determining your total eligible investment amount, we will include your investments in all personal accounts (including American Century Investments brokerage accounts) registered under your Social Security number. Personal accounts include individual accounts, joint accounts, UGMA/UTMA accounts, personal trusts, Coverdell Education Savings Accounts and IRAs (including traditional, Roth, Rollover, SEP-, SARSEP- and SIMPLE-IRAs), and certain other retirement accounts. If you have only business, business retirement, employer-sponsored or American Century Investments brokerage accounts, you are currently not subject to this fee. If you are subject to the account maintenance fee, your account value could be reduced by the fee amount.
Hypothetical Example for Comparison Purposes
The table also provides information about hypothetical account values and hypothetical expenses based on the actual expense ratio of each class of your fund and an assumed rate of return of 5% per year before expenses, which is not the actual return of a fund’s share class. The hypothetical account values and expenses may not be used to estimate the actual ending account balance or expenses you paid for the period. You may use this information to compare the ongoing costs of investing in your fund and other funds. To do so, compare this 5% hypothetical example with the 5% hypothetical examples that appear in the shareholder reports of the other funds.
Please note that the expenses shown in the table are meant to highlight your ongoing costs only and do not reflect any transactional costs, such as sales charges (loads) or redemption/exchange fees. Therefore, the table is useful in comparing ongoing costs only, and will not help you determine the relative total costs of owning different funds. In addition, if these transactional costs were included, your costs would have been higher.
4
| Beginning Account Value 10/1/23 | Ending Account Value 3/31/24 | Expenses Paid During Period(1) 10/1/23 - 3/31/24 | Annualized Expense Ratio(1) | |||||||||||
| Actual | ||||||||||||||
| Investor Class | $1,000 | $1,029.80 | $2.79 | 0.55% | ||||||||||
| Advisor Class | $1,000 | $1,028.60 | $4.06 | 0.80% | ||||||||||
| Hypothetical | ||||||||||||||
| Investor Class | $1,000 | $1,022.25 | $2.78 | 0.55% | ||||||||||
| Advisor Class | $1,000 | $1,021.00 | $4.04 | 0.80% | ||||||||||
(1)Expenses are equal to the class's annualized expense ratio listed in the table above, multiplied by the average account value over the period, multiplied by 183, the number of days in the most recent fiscal half-year, divided by 366, to reflect the one-half year period. Annualized expense ratio reflects actual expenses, including any applicable fee waivers or expense reimbursements and excluding any acquired fund fees and expenses.
5
| Schedule of Investments | ||
MARCH 31, 2024 (UNAUDITED)
| Principal Amount/Shares | Value | |||||||
ZERO-COUPON U.S. TREASURY SECURITIES AND EQUIVALENTS(1) — 95.3% | ||||||||
Resolution Funding Corp. Interest STRIPS, 0.00%, 4/15/24 | $ | 385,000 | $ | 384,135 | ||||
Resolution Funding Corp. Interest STRIPS, 0.00%, 1/15/25 | 8,445,000 | 8,112,174 | ||||||
Resolution Funding Corp. Interest STRIPS, 0.00%, 4/15/25 | 18,013,000 | 17,156,588 | ||||||
U.S. Treasury STRIPS Coupon, 0.00%, 5/15/25 | 300,000 | 283,632 | ||||||
U.S. Treasury STRIPS Coupon, 0.00%, 8/15/25 | 2,800,000 | 2,621,653 | ||||||
U.S. Treasury STRIPS Coupon, 0.00%, 11/15/25 | 83,500,000 | 77,360,278 | ||||||
U.S. Treasury STRIPS Principal, 0.00%, 11/15/25 | 1,100,000 | 1,019,510 | ||||||
Resolution Funding Corp. Interest STRIPS, 0.00%, 1/15/26 | 16,800,000 | 15,436,136 | ||||||
U.S. Treasury STRIPS Coupon, 0.00%, 2/15/26 | 1,400,000 | 1,283,022 | ||||||
Resolution Funding Corp. Interest STRIPS, 0.00%, 4/15/26 | 19,112,000 | 17,354,759 | ||||||
U.S. Treasury STRIPS Coupon, 0.00%, 11/15/26 | 4,900,000 | 4,357,251 | ||||||
TOTAL ZERO-COUPON U.S. TREASURY SECURITIES AND EQUIVALENTS (Cost $145,589,581) | 145,369,138 | |||||||
ZERO-COUPON U.S. GOVERNMENT AGENCY SECURITIES(1) — 4.3% | ||||||||
FNMA STRIPS - COUPON, 0.00%, 4/8/24 | 10,000 | 9,990 | ||||||
Tennessee Valley Authority Generic STRIPS, 0.00%, 5/1/24 | 1,000,000 | 995,330 | ||||||
FHLMC STRIPS - COUPON, 0.00%, 9/15/24 | 42,000 | 41,048 | ||||||
Tennessee Valley Authority Principal STRIPS, 0.00%, 11/1/25 | 6,000,000 | 5,551,064 | ||||||
TOTAL ZERO-COUPON U.S. GOVERNMENT AGENCY SECURITIES (Cost $6,522,196) | 6,597,432 | |||||||
SHORT-TERM INVESTMENTS — 0.5% | ||||||||
Discount Notes(2) — 0.5% | ||||||||
Federal Home Loan Bank Discount Notes, 5.29%, 4/1/24 | 680,000 | 679,610 | ||||||
Money Market Funds — 0.0% | ||||||||
State Street Institutional U.S. Government Money Market Fund, Premier Class | 885 | 885 | ||||||
TOTAL SHORT-TERM INVESTMENTS (Cost $680,885) | 680,495 | |||||||
TOTAL INVESTMENT SECURITIES — 100.1% (Cost $152,792,662) | 152,647,065 | |||||||
OTHER ASSETS AND LIABILITIES — (0.1)% | (103,143) | |||||||
TOTAL NET ASSETS — 100.0% | $ | 152,543,922 | ||||||
| NOTES TO SCHEDULE OF INVESTMENTS | ||||||||
| Equivalent | – | Security whose payments are secured by the U.S. Treasury | ||||||
| FHLMC | – | Federal Home Loan Mortgage Corporation | ||||||
| FNMA | – | Federal National Mortgage Association | ||||||
| STRIPS | – | Separate Trading of Registered Interest and Principal of Securities | ||||||
(1)Security is a zero-coupon bond. Zero-coupon securities may be issued at a substantial discount from their value at maturity.
(2)The rate indicated is the yield to maturity at purchase for non-interest bearing securities. For interest bearing securities, the stated coupon rate is shown.
See Notes to Financial Statements.
6
| Statement of Assets and Liabilities | ||
| MARCH 31, 2024 (UNAUDITED) | |||||
| Assets | |||||
| Investment securities, at value (cost of $152,792,662) | $ | 152,647,065 | |||
| Receivable for capital shares sold | 32,874 | ||||
| 152,679,939 | |||||
| Liabilities | |||||
| Payable for capital shares redeemed | 66,014 | ||||
| Accrued management fees | 69,563 | ||||
| Distribution and service fees payable | 440 | ||||
| 136,017 | |||||
| Net Assets | $ | 152,543,922 | |||
| Net Assets Consist of: | |||||
| Capital paid in | $ | 153,576,601 | |||
| Distributable earnings (loss) | (1,032,679) | ||||
| $ | 152,543,922 | ||||
| Net Assets | Shares Outstanding | Net Asset Value Per Share | |||||||||
| Investor Class | $150,455,076 | 1,387,707 | $108.42 | ||||||||
| Advisor Class | $2,088,846 | 20,540 | $101.70 | ||||||||
See Notes to Financial Statements.
7
| Statement of Operations | ||
| FOR THE SIX MONTHS ENDED MARCH 31, 2024 (UNAUDITED) | |||||
| Investment Income (Loss) | |||||
| Income: | |||||
| Interest | $ | 3,961,089 | |||
| Expenses: | |||||
| Management fees | 440,227 | ||||
| Distribution and service fees - Advisor Class | 2,646 | ||||
| Trustees' fees and expenses | 6,087 | ||||
| Other expenses | 402 | ||||
| 449,362 | |||||
| Net investment income (loss) | 3,511,727 | ||||
| Realized and Unrealized Gain (Loss) | |||||
| Net realized gain (loss) on investment transactions | (259,990) | ||||
| Change in net unrealized appreciation (depreciation) on investments | 1,573,712 | ||||
| Net realized and unrealized gain (loss) | 1,313,722 | ||||
| Net Increase (Decrease) in Net Assets Resulting from Operations | $ | 4,825,449 | |||
See Notes to Financial Statements.
8
| Statement of Changes in Net Assets | ||
| SIX MONTHS ENDED MARCH 31, 2024 (UNAUDITED) AND YEAR ENDED SEPTEMBER 30, 2023 | ||||||||
Increase (Decrease) in Net Assets | March 31, 2024 | September 30, 2023 | ||||||
| Operations | ||||||||
| Net investment income (loss) | $ | 3,511,727 | $ | 6,349,153 | ||||
| Net realized gain (loss) | (259,990) | (1,005,547) | ||||||
| Change in net unrealized appreciation (depreciation) | 1,573,712 | (2,810,922) | ||||||
| Net increase (decrease) in net assets resulting from operations | 4,825,449 | 2,532,684 | ||||||
| Distributions to Shareholders | ||||||||
| From earnings: | ||||||||
| Investor Class | (6,662,563) | (4,931,580) | ||||||
| Advisor Class | (86,275) | (63,812) | ||||||
| Decrease in net assets from distributions | (6,748,838) | (4,995,392) | ||||||
| Capital Share Transactions | ||||||||
| Net increase (decrease) in net assets from capital share transactions (Note 5) | (19,199,335) | 35,556,252 | ||||||
| Net increase (decrease) in net assets | (21,122,724) | 33,093,544 | ||||||
| Net Assets | ||||||||
| Beginning of period | 173,666,646 | 140,573,102 | ||||||
| End of period | $ | 152,543,922 | $ | 173,666,646 | ||||
See Notes to Financial Statements.
9
| Notes to Financial Statements | ||
MARCH 31, 2024 (UNAUDITED)
1. Organization
American Century Target Maturities Trust (the trust) is registered under the Investment Company Act of 1940, as amended (the 1940 Act), as an open-end management investment company and is organized as a Massachusetts business trust. Zero Coupon 2025 Fund (the fund) is one fund in a series issued by the trust. The fund’s investment objective is to seek the highest return consistent with investment in U.S. Treasury securities. The fund is managed to mature in the year identified in its name and will be liquidated near the end of its maturity year. The fund offers the Investor Class and Advisor Class.
2. Significant Accounting Policies
The following is a summary of significant accounting policies consistently followed by the fund in preparation of its financial statements. The fund is an investment company and follows accounting and reporting guidance in accordance with accounting principles generally accepted in the United States of America. This may require management to make certain estimates and assumptions at the date of the financial statements. Actual results could differ from these estimates. Management evaluated the impact of events or transactions occurring through the date the financial statements were issued that would merit recognition or disclosure.
Investment Valuations — The fund determines the fair value of its investments and computes its net asset value (NAV) per share at the close of regular trading (usually 4 p.m. Eastern time) on the New York Stock Exchange (NYSE) on each day the NYSE is open. The value of investments of the fund is determined by American Century Investment Management, Inc. (ACIM) (the investment advisor), as the valuation designee, pursuant to its valuation policies and procedures. The Board of Trustees oversees the valuation designee and reviews its valuation policies and procedures at least annually.
Fixed income securities are valued at the evaluated bid as provided by independent pricing services or at the most recent bid as provided by investment dealers. U.S. Treasury and Government Agency securities are valued using market models that consider trade data, quotations from dealers and active market makers, relevant yield curve and spread data, creditworthiness, trade data or market information on comparable securities, and other relevant security specific information.
Open-end management investment companies are valued at the reported NAV per share.
If the valuation designee determines that the market price for a portfolio security is not readily available or is believed by the valuation designee to be unreliable, such security is valued at fair value as determined in good faith by the valuation designee, in accordance with its policies and procedures. Circumstances that may cause the fund to determine that market quotations are not available or reliable include, but are not limited to: when there is a significant event subsequent to the market quotation; trading in a security has been halted during the trading day; or trading in a security is insufficient or did not take place due to a closure or holiday.
The valuation designee monitors for significant events occurring after the close of an investment’s primary exchange but before the fund’s NAV per share is determined. Significant events may include, but are not limited to: corporate announcements and transactions; regulatory news, governmental action and political unrest that could impact a specific investment or an investment sector; or armed conflicts, natural disasters and similar events that could affect investments in a specific country or region.
Security Transactions — Security transactions are accounted for as of the trade date. Net realized gains and losses are determined on the identified cost basis, which is also used for federal income tax purposes.
Investment Income — Interest income is recorded on the accrual basis and includes accretion of discounts.
10
Income Tax Status — It is the fund's policy to distribute substantially all net investment income and net realized gains to shareholders and to otherwise qualify as a regulated investment company under provisions of the Internal Revenue Code. Accordingly, no provision has been made for income taxes. The fund files U.S. federal, state, local and non-U.S. tax returns as applicable. The fund's tax returns are subject to examination by the relevant taxing authority until expiration of the applicable statute of limitations, which is generally three years from the date of filing but can be longer in certain jurisdictions. At this time, management believes there are no uncertain tax positions which, based on their technical merit, would not be sustained upon examination and for which it is reasonably possible that the total amounts of unrecognized tax benefits will significantly change in the next twelve months.
Multiple Class — All shares of the fund represent an equal pro rata interest in the net assets of the class to which such shares belong, and have identical voting, dividend, liquidation and other rights and the same terms and conditions, except for class specific expenses and exclusive rights to vote on matters affecting only individual classes. Income, non-class specific expenses, and realized and unrealized capital gains and losses of the fund are allocated to each class of shares based on their relative net assets.
Distributions to Shareholders — Distributions from net investment income and net realized gains, if any, are generally declared and paid annually.
Reverse Share Splits — When the fund pays a distribution, the trustees declare a reverse share split that exactly offsets the per-share amount of the distribution. After taking into account the reverse share split, a shareholder reinvesting dividends and capital gain distributions will hold exactly the same number of shares owned prior to the distribution and reverse share split. A shareholder electing to receive dividends in cash will own fewer shares.
Indemnifications — Under the trust’s organizational documents, its officers and trustees are indemnified against certain liabilities arising out of the performance of their duties to the fund. In addition, in the normal course of business, the fund enters into contracts that provide general indemnifications. The maximum exposure under these arrangements is unknown as this would involve future claims that may be made against a fund. The risk of material loss from such claims is considered by management to be remote.
3. Fees and Transactions with Related Parties
Certain officers and trustees of the trust are also officers and/or directors of American Century Companies, Inc. (ACC). The trust's investment advisor, ACIM, the trust's distributor, American Century Investment Services, Inc. (ACIS), and the trust's transfer agent, American Century Services, LLC, are wholly owned, directly or indirectly, by ACC.
Management Fees — The trust has entered into a management agreement with ACIM, under which ACIM provides the fund with investment advisory and management services in exchange for a single, unified management fee (the fee) per class. The agreement provides that ACIM will pay all expenses of managing and operating the fund, except brokerage expenses, taxes, interest, fees and expenses of the independent trustees (including legal counsel fees), extraordinary expenses, and expenses incurred in connection with the provision of shareholder services and distribution services under a plan adopted pursuant to Rule 12b-1 under the 1940 Act. The fee is computed and accrued daily based on each class’s daily net assets and paid monthly in arrears. The fee consists of (1) an Investment Category Fee based on the daily net assets of the fund and certain other accounts managed by the investment advisor that are in the same broad investment category as the fund and (2) a Complex Fee based on the assets of all funds in the American Century Investments family of funds that have the same investment advisor and distributor as the fund. For purposes of determining the Investment Category Fee and Complex Fee, the assets of funds managed by the investment advisor that invest exclusively in the shares of other funds (funds of funds) are not included. The rates for the Investment Category Fee range from 0.2425% to 0.3600% and the rates for the Complex Fee range from 0.2500% to 0.3100%. The effective annual management fee for the period ended March 31, 2024 was 0.54%.
Distribution and Service Fees — The Board of Trustees has adopted a separate Master Distribution and Individual Shareholder Services Plan for the Advisor Class (the plan), pursuant to Rule 12b-1 of the 1940 Act. The plan provides that the Advisor Class will pay ACIS an annual distribution and service fee of 0.25%. The fees are computed and accrued daily based on the Advisor Class’s daily net assets and paid monthly in arrears. The fees are used to pay financial intermediaries for distribution and individual shareholder services. Fees incurred under the plan during the period ended March 31, 2024 are detailed in the Statement of Operations.
11
Trustees' Fees and Expenses — The Board of Trustees is responsible for overseeing the investment advisor’s management and operations of the fund. The trustees receive detailed information about the fund and its investment advisor regularly throughout the year, and meet at least quarterly with management of the investment advisor to review reports about fund operations. The fund's officers do not receive compensation from the fund.
Other Expenses — A fund’s other expenses may include interest charges, clearing exchange fees, proxy solicitation expenses, fees associated with the recovery of foreign tax reclaims and other miscellaneous expenses.
Interfund Transactions — The fund may enter into security transactions with other American Century Investments funds and other client accounts of the investment advisor, in accordance with the 1940 Act rules and procedures adopted by the Board of Trustees. The rules and procedures require, among other things, that these transactions be effected at the independent current market price of the security. There were no interfund transactions during the period.
4. Investment Transactions
Purchases and sales of investment securities, excluding short-term investments, for the period ended March 31, 2024 were $13,005,621 and $39,031,858, respectively, all of which are U.S. Treasury and Government Agency obligations.
5. Capital Share Transactions
Transactions in shares of the fund were as follows (unlimited number of shares authorized):
Six months ended March 31, 2024 | Year ended September 30, 2023 | |||||||||||||
| Shares | Amount | Shares | Amount | |||||||||||
| Investor Class | ||||||||||||||
| Sold | 80,259 | $ | 15,492,543 | 723,411 | $ | 76,167,455 | ||||||||
| Issued in reinvestment of distributions | 62,249 | 6,391,061 | 46,623 | 4,712,646 | ||||||||||
| Redeemed | (319,266) | (41,058,164) | (433,063) | (45,579,971) | ||||||||||
| Reverse share split | (64,786) | — | (48,714) | — | ||||||||||
| (241,544) | (19,174,560) | 288,257 | 35,300,130 | |||||||||||
| Advisor Class | ||||||||||||||
| Sold | 185 | 108,755 | 4,998 | 494,933 | ||||||||||
| Issued in reinvestment of distributions | 881 | 84,881 | 627 | 59,655 | ||||||||||
| Redeemed | (1,275) | (218,411) | (3,023) | (298,466) | ||||||||||
| Reverse share split | (894) | — | (669) | — | ||||||||||
| (1,103) | (24,775) | 1,933 | 256,122 | |||||||||||
| Net increase (decrease) | (242,647) | $ | (19,199,335) | 290,190 | $ | 35,556,252 | ||||||||
6. Fair Value Measurements
The fund's investments valuation process is based on several considerations and may use multiple inputs to determine the fair value of the investments held by the fund. In conformity with accounting principles generally accepted in the United States of America, the inputs used to determine a valuation are classified into three broad levels.
•Level 1 valuation inputs consist of unadjusted quoted prices in an active market for identical investments.
•Level 2 valuation inputs consist of direct or indirect observable market data (including quoted prices for comparable investments, evaluations of subsequent market events, interest rates, prepayment speeds, credit risk, etc.). These inputs also consist of quoted prices for identical investments initially expressed in local currencies that are adjusted through translation into U.S. dollars.
•Level 3 valuation inputs consist of unobservable data (including a fund’s own assumptions).
12
The level classification is based on the lowest level input that is significant to the fair valuation measurement. The valuation inputs are not necessarily an indication of the risks associated with investing in these securities or other financial instruments.
The following is a summary of the level classifications as of period end. The Schedule of Investments provides additional information on the fund's portfolio holdings.
| Level 1 | Level 2 | Level 3 | |||||||||
| Assets | |||||||||||
| Investment Securities | |||||||||||
| Zero-Coupon U.S. Treasury Securities and Equivalents | — | $ | 145,369,138 | — | |||||||
| Zero-Coupon U.S. Government Agency Securities | — | 6,597,432 | — | ||||||||
| Short-Term Investments | $ | 885 | 679,610 | — | |||||||
| $ | 885 | $ | 152,646,180 | — | |||||||
7. Risk Factors
The value of the fund’s shares will go up and down, sometimes rapidly or unpredictably, based on the performance of the securities owned by the fund and other factors generally affecting the securities market. Market risks, including political, regulatory, economic and social developments, can affect the value of the fund’s investments. Natural disasters, public health emergencies, war, terrorism and other unforeseeable events may lead to increased market volatility and may have adverse long-term effects on world economies and markets generally.
8. Federal Tax Information
The book-basis character of distributions made during the year from net investment income or net realized gains may differ from their ultimate characterization for federal income tax purposes. These differences reflect the differing character of certain income items and net realized gains and losses for financial statement and tax purposes, and may result in reclassification among certain capital accounts on the financial statements.
As of period end, the components of investments for federal income tax purposes were as follows:
| Federal tax cost of investments | $ | 154,920,545 | |||
| Gross tax appreciation of investments | $ | 328,304 | |||
| Gross tax depreciation of investments | (2,601,784) | ||||
| Net tax appreciation (depreciation) of investments | $ | (2,273,480) | |||
The difference between book-basis and tax-basis unrealized appreciation (depreciation) is attributable primarily to the tax deferral of losses on wash sales.
As of September 30, 2023, the fund had accumulated short-term capital losses of $(123,558) and accumulated long-term capital losses of $(294,478), which represent net capital loss carryovers that may be used to offset future realized capital gains for federal income tax purposes. The capital loss carryovers may be carried forward for an unlimited period. Future capital loss carryover utilization in any given year may be subject to Internal Revenue Code limitations.
13
| Financial Highlights | ||
| For a Share Outstanding Throughout the Years Ended September 30 (except as noted) | ||||||||||||||||||||||||||||||||||||||||||||
| Per-Share Data | Ratios and Supplemental Data | |||||||||||||||||||||||||||||||||||||||||||
| Income From Investment Operations*: | Distributions From: | Ratio to Average Net Assets of†: | ||||||||||||||||||||||||||||||||||||||||||
| Net Asset Value, Beginning of Period | Net Investment Income (Loss)(1) | Net Realized and Unrealized Gain (Loss) | Total From Investment Operations | Net Investment Income | Net Realized Gains | Total Distributions | Reverse Share Split | Net Asset Value, End of Period | Total Return(2) | Operating Expenses | Net Investment Income (Loss) | Portfolio Turnover Rate | Net Assets, End of Period (in thousands) | |||||||||||||||||||||||||||||||
| Investor Class | ||||||||||||||||||||||||||||||||||||||||||||
2024(3) | $105.28 | 2.31 | 0.83 | 3.14 | (4.32) | — | (4.32) | 4.32 | $108.42 | 2.98% | 0.55% | 4.30% | 8% | $150,455 | ||||||||||||||||||||||||||||||
| 2023 | $103.40 | 4.20 | (2.32) | 1.88 | (3.61) | — | (3.61) | 3.61 | $105.28 | 1.83% | 0.55% | 3.99% | 7% | $171,527 | ||||||||||||||||||||||||||||||
| 2022 | $113.92 | 3.81 | (14.33) | (10.52) | (3.34) | (0.36) | (3.70) | 3.70 | $103.40 | (9.24)% | 0.54% | 3.50% | 10% | $138,654 | ||||||||||||||||||||||||||||||
| 2021 | $116.13 | 3.40 | (5.61) | (2.21) | (3.03) | (1.42) | (4.45) | 4.45 | $113.92 | (1.91)% | 0.54% | 2.96% | 13% | $150,321 | ||||||||||||||||||||||||||||||
| 2020 | $107.31 | 3.78 | 5.04 | 8.82 | (3.71) | (0.45) | (4.16) | 4.16 | $116.13 | 8.23% | 0.55% | 3.38% | 19% | $148,086 | ||||||||||||||||||||||||||||||
| 2019 | $96.41 | 3.65 | 7.25 | 10.90 | (3.50) | (1.71) | (5.21) | 5.21 | $107.31 | 11.31% | 0.55% | 3.60% | 21% | $133,717 | ||||||||||||||||||||||||||||||
| Advisor Class | ||||||||||||||||||||||||||||||||||||||||||||
2024(3) | $98.88 | 2.04 | 0.78 | 2.82 | (4.05) | — | (4.05) | 4.05 | $101.70 | 2.86% | 0.80% | 4.05% | 8% | $2,089 | ||||||||||||||||||||||||||||||
| 2023 | $97.35 | 3.70 | (2.17) | 1.53 | (3.35) | — | (3.35) | 3.35 | $98.88 | 1.56% | 0.80% | 3.74% | 7% | $2,140 | ||||||||||||||||||||||||||||||
| 2022 | $107.53 | 3.33 | (13.51) | (10.18) | (3.06) | (0.36) | (3.42) | 3.42 | $97.35 | (9.47)% | 0.79% | 3.25% | 10% | $1,919 | ||||||||||||||||||||||||||||||
| 2021 | $109.89 | 2.94 | (5.30) | (2.36) | (2.74) | (1.42) | (4.16) | 4.16 | $107.53 | (2.15)% | 0.79% | 2.71% | 13% | $2,549 | ||||||||||||||||||||||||||||||
| 2020 | $101.79 | 3.30 | 4.80 | 8.10 | (3.44) | (0.45) | (3.89) | 3.89 | $109.89 | 7.96% | 0.80% | 3.13% | 19% | $2,524 | ||||||||||||||||||||||||||||||
| 2019 | $91.68 | 3.23 | 6.88 | 10.11 | (3.26) | (1.71) | (4.97) | 4.97 | $101.79 | 11.03% | 0.80% | 3.35% | 21% | $1,496 | ||||||||||||||||||||||||||||||
| Notes to Financial Highlights | ||
(1)Computed using average shares outstanding throughout the period.
(2)Total returns are calculated based on the net asset value of the last business day. Total returns for periods less than one year are not annualized.
(3)Six months ended March 31, 2024 (unaudited).
*The amount shown for a share outstanding throughout the period may not correlate with the Statement(s) of Operations or precisely reflect the class expense differentials due to the timing of transactions in shares of a fund in relation to income earned and/or fluctuations in the fair value of a fund's investments.
†Ratios for periods less than one year are annualized. Zero balances may reflect amounts less than 0.005%.
See Notes to Financial Statements.
| Liquidity Risk Management Program | ||
The Fund has adopted a liquidity risk management program (the “program”). The Fund’s Board of Trustees (the "Board") has designated American Century Investment Management, Inc. (“ACIM”) as the administrator of the program. Personnel of ACIM or its affiliates, including members of ACIM’s Investment Oversight Committee who are members of ACIM’s Investment Management and Global Analytics departments, conduct the day-to-day operation of the program pursuant to the program.
Under the program, ACIM manages the Fund’s liquidity risk, which is the risk that the Fund could not meet shareholder redemption requests without significant dilution of remaining shareholders’ interests in the Fund. This risk is managed by monitoring the degree of liquidity of the Fund’s investments, limiting the amount of the Fund’s illiquid investments, and utilizing various risk management tools and facilities available to the Fund for meeting shareholder redemptions, among other means. ACIM’s process of determining the degree of liquidity of certain investments held by the Fund is supported by a third-party liquidity assessment vendor.
The Board reviewed a report prepared by ACIM regarding the operation and effectiveness of the program for the period January 1, 2023 through December 31, 2023. No significant liquidity events impacting the Fund were noted in the report. In addition, ACIM provided its assessment that the program had been effective in managing the Fund’s liquidity risk.
16
| Additional Information | ||
Retirement Account Information
As required by law, distributions you receive from certain retirement accounts are subject to federal income tax withholding at the IRS default rate of 10%.* Tax will be withheld on the total amount withdrawn even though you may be receiving amounts that are not subject to withholding, such as nondeductible contributions. In such case, excess amounts of withholding could occur. You may adjust your withholding election so that a greater or lesser amount will be withheld.
You may elect a different withholding rate, or request zero withholding, by submitting an acceptable IRS Form W-4R election with your distribution request. You may notify us of your W-4R election by telephone, on our distribution forms, on IRS Form W-4R, or through other acceptable electronic means. If your withholding election is for an automatic withdrawal plan, you have the right to revoke your election at any time and any election you make will remain in effect until revoked by filing a new election.
Remember, even if you elect not to have income tax withheld, you are liable for paying income tax on the taxable portion of your withdrawal. If you elect not to have income tax withheld or you don’t have enough income tax withheld, you may be responsible for payment of estimated tax. You may incur penalties under the estimated tax rules if your withholding and estimated tax payments are not sufficient. You can reduce or defer the income tax on a distribution by directly or indirectly rolling such distribution over to another IRA or eligible plan. You should consult your tax advisor for additional information.
State tax will be withheld according to state regulations if, at the time of your distribution, your tax residency is within one of the mandatory withholding states.
*Some 403(b), 457 and qualified retirement plan distributions may be subject to 20% mandatory withholding, as they are subject to special tax and withholding rules. Your plan administrator or plan sponsor is required to provide you with a special tax notice explaining those rules at the time you request a distribution. If applicable, federal and/or state taxes may be withheld from your distribution amount.
Proxy Voting Policies
Descriptions of the principles and policies that the fund's investment advisor uses in exercising the voting rights associated with the securities purchased and/or held by the fund are available without charge, upon request, by calling 1-800-345-2021 or visiting American Century Investments’ website at americancentury.com/proxy. A description of the policies is also available on the Securities and Exchange Commission’s website at sec.gov. Information regarding how the investment advisor voted proxies relating to portfolio securities during the most recent 12-month period ended June 30 is available on americancentury.com/proxy. It is also available at sec.gov.
Quarterly Portfolio Disclosure
The fund files its complete schedule of portfolio holdings with the Securities and Exchange Commission (SEC) for the first and third quarters of each fiscal year as an exhibit to its reports on Form N-PORT. These portfolio holdings are available on the fund's website at americancentury.com and, upon request, by calling 1-800-345-2021. The fund’s Form N-PORT reports are available on the SEC’s website at sec.gov.
17
| Notes | ||
18
| Notes | ||
19
| Notes | ||
20
| ||||||||
| Contact Us | americancentury.com | |||||||
| Automated Information Line | 1-800-345-8765 | |||||||
| Investor Services Representative | 1-800-345-2021 or 816-531-5575 | |||||||
| Investors Using Advisors | 1-800-378-9878 | |||||||
| Business, Not-For-Profit, Employer-Sponsored Retirement Plans | 1-800-345-3533 | |||||||
| Banks and Trust Companies, Broker-Dealers, Financial Professionals, Insurance Companies | 1-800-345-6488 | |||||||
| Telecommunications Relay Service for the Deaf | 711 | |||||||
| American Century Target Maturities Trust | ||||||||
Investment Advisor: American Century Investment Management, Inc. Kansas City, Missouri | ||||||||
| This report and the statements it contains are submitted for the general information of our shareholders. The report is not authorized for distribution to prospective investors unless preceded or accompanied by an effective prospectus. | ||||||||
| ©2024 American Century Proprietary Holdings, Inc. All rights reserved. CL-SAN-92289 2405 | ||||||||
(b) None.
ITEM 2. CODE OF ETHICS.
Not applicable for semiannual report filings.
ITEM 3. AUDIT COMMITTEE FINANCIAL EXPERT.
Not applicable for semiannual report filings.
ITEM 4. PRINCIPAL ACCOUNTANT FEES AND SERVICES.
Not applicable for semiannual report filings.
ITEM 5. AUDIT COMMITTEE OF LISTED REGISTRANTS.
Not applicable for semiannual report filings.
ITEM 6. INVESTMENTS.
(a) The schedule of investments is included as part of the report to stockholders filed under Item 1 of this Form.
(b) Not applicable.
ITEM 7. DISCLOSURE OF PROXY VOTING POLICIES AND PROCEDURES FOR CLOSED-END MANAGEMENT INVESTMENT COMPANIES.
Not applicable.
ITEM 8. PORTFOLIO MANAGERS OF CLOSED-END MANAGEMENT INVESTMENT COMPANIES.
Not applicable.
ITEM 9. PURCHASES OF EQUITY SECURITIES BY CLOSED-END MANAGEMENT INVESTMENT COMPANY AND AFFILIATED PURCHASERS.
Not applicable.
ITEM 10. SUBMISSION OF MATTERS TO A VOTE OF SECURITY HOLDERS.
During the reporting period, there were no material changes to the procedures by which shareholders may recommend nominees to the registrant’s board.
ITEM 11. CONTROLS AND PROCEDURES.
(a) The registrant's principal executive officer and principal financial officer have concluded that the registrant's disclosure controls and procedures (as defined in Rule 30a-3(c) under the Investment Company Act of 1940) are effective based on their evaluation of these controls and procedures as of a date within 90 days of the filing date of this report.
(b) There were no changes in the registrant's internal control over financial reporting (as defined in Rule 30a-3(d) under the Investment Company Act of 1940) that occurred during the period covered by this report that have materially affected, or are reasonably likely to materially affect, the registrant's internal control over financial reporting.
ITEM 12. DISCLOSURE OF SECURITIES LENDING ACTIVITIES FOR CLOSED-END MANAGEMENT INVESTMENT COMPANIES.
Not applicable.
ITEM 18. RECOVERY OF ERRONEOUSLY AWARDED COMPENSATION.
(a) Not applicable.
(b) Not applicable.
ITEM 19. EXHIBITS.
(a)(1) Not applicable for semiannual report filings.
(a)(2) Not applicable for semiannual report filings.
(a)(3) Separate certifications by the registrant’s principal executive officer and principal financial officer, pursuant to Section 302 of the Sarbanes-Oxley Act of 2002 and Rule 30a-2(a) under the Investment Company Act of 1940, are filed and attached hereto as EX-99.CERT.
(a)(4) Not applicable.
(a)(5) Not applicable.
(b) A certification by the registrant’s chief executive officer and chief financial officer, pursuant to Section 906 of the Sarbanes-Oxley Act of 2002, is furnished and attached hereto as EX- 99.906CERT.
SIGNATURES
Pursuant to the requirements of the Securities Exchange Act of 1934 and the Investment Company Act of 1940, the registrant has duly caused this report to be signed on its behalf by the undersigned, thereunto duly authorized.
| Registrant: | American Century Target Maturities Trust | ||||||||||
| By: | /s/ Patrick Bannigan | ||||||||||
| Name: | Patrick Bannigan | ||||||||||
| Title: | President | ||||||||||
| Date: | May 30, 2024 | ||||||||||
Pursuant to the requirements of the Securities Exchange Act of 1934 and the Investment Company Act of 1940, this report has been signed below by the following persons on behalf of the registrant and in the capacities and on the dates indicated.
| By: | /s/ Patrick Bannigan | |||||||
| Name: | Patrick Bannigan | |||||||
| Title: | President | |||||||
| (principal executive officer) | ||||||||
| Date: | May 30, 2024 | |||||||
| By: | /s/ R. Wes Campbell | |||||||
| Name: | R. Wes Campbell | |||||||
| Title: | Treasurer and Chief Financial Officer | |||||||
| (principal financial officer) | ||||||||
| Date: | May 30, 2024 | |||||||