Management’s Discussion
and Analysis (“MD&A”)
Management’s Discussion and Analysis (“MD&A”) is intended to help the reader understand Barrick Gold Corporation (“Barrick”, “we”, “our”, the “Company” or the “Group”), our operations, financial performance and the present and future business environment. This MD&A, which has been prepared as of February 15, 2022, should be read in conjunction with our audited consolidated financial statements (“Financial Statements”) for the year ended December 31, 2021. Unless otherwise indicated, all amounts are presented in US dollars.
For the purposes of preparing our MD&A, we consider the materiality of information. Information is considered material if: (i) such information results in, or would reasonably be expected to result in, a significant change in the market price or value of our shares; (ii) there is a substantial likelihood that a reasonable investor would
consider it important in making an investment decision; or (iii) it would significantly alter the total mix of information available to investors. We evaluate materiality with reference to all relevant circumstances, including potential market sensitivity.
Continuous disclosure materials, including our most recent Form 40-F/Annual Information Form, annual MD&A, audited consolidated financial statements, and Notice of Annual Meeting of Shareholders and Proxy Circular will be available on our website at www.barrick.com, on SEDAR at www.sedar.com and on EDGAR at www.sec.gov. For an explanation of terminology unique to the mining industry, readers should refer to the glossary on page 128.
Cautionary Statement on Forward-Looking Information
Certain information contained or incorporated by reference in this MD&A, including any information as to our strategy, projects, plans or future financial or operating performance, constitutes “forward-looking statements”. All statements, other than statements of historical fact, are forward-looking statements. The words “believe”, “expect”, “anticipated”, “contemplate” “vision”, “aim”, “strategy”, “target”, “plan”, “opportunities”, “guidance”, “forecast”, “outlook”, “objective”, “intend”, “project”, “pursue”, “goal”, “continue”, “committed”, “budget”, “estimate”, “potential”, “prospective”, “future”, “focus”, “ongoing”, “following”, “subject to”, “scheduled”, “may”, “will”, “can”, “could”, “would”, “should” and similar expressions identify forward-looking statements. In particular, this MD&A contains forward-looking statements including, without limitation, with respect to: Barrick’s forward-looking production guidance; estimates of future cost of sales per ounce for gold and per pound for copper, total cash costs per ounce and C1 cash costs per pound, and all-in-sustaining costs per ounce/pound; cash flow forecasts; projected capital, operating and exploration expenditures; the share buyback program and performance dividend policy, including the criteria for dividend payments; mine life and production rates; Barrick’s engagement with local communities to manage the Covid-19 pandemic, including Covid-19 vaccination initiatives and Covid-19 protocols at Barrick’s minesites; projected capital estimates and anticipated permitting timelines related to the Goldrush Project, as well as opportunities for development in the Red Hill mining zone during the permitting process; our plans and expected completion and benefits of our growth projects, including the Goldrush Project and construction of the twin exploration declines, Turquoise Ridge Third Shaft, Pueblo Viejo plant expansion and mine life extension project, Bulyanhulu production ramp-up and results of the internal feasibility study, including further planned reserve conversion drilling at Deep West, Zaldívar chloride leach project, and Veladero Phase 7 leach pad and power transmission projects; capital expenditures related to upgrades and ongoing management initiatives, including at North Mara; Barrick’s global exploration strategy and
planned exploration activities, including at North Leeville and the acquisition of prospecting licenses in Tanzania; the impact of Nevada’s new mining excise tax on Nevada Gold Mines and of proposed changes to the U.S. General Mining Law; the timeline for execution and effectiveness of definitive agreements and formation of a new joint venture to implement the binding Framework Agreement between Papua New Guinea and Barrick Niugini Limited (“BNL”) and the timeline for resolution of outstanding tax audits with Papua New Guinea’s Internal Revenue Commission (“IRC”); the duration of the temporary suspension of operations at Porgera and timeline to recommence operations; steps required prior to the distribution of cash and equivalents held at Kibali in banks in the Democratic Republic of Congo; our pipeline of high confidence projects at or near existing operations; potential mineralization and metal or mineral recoveries; our ability to convert resources into reserves and future reserve replacement; asset sales, joint ventures and partnerships, including the expected benefits of the South Arturo asset exchange, the sale of Lagunas Norte, and the sale of several other legacy closure properties; Barrick’s strategy, plans, targets and goals in respect of environmental and social governance issues, including climate change, greenhouse gas emissions reduction targets, tailings storage facility management, biodiversity and human rights initiatives; and expectations regarding future price assumptions, financial performance and other outlook or guidance.
Forward-looking statements are necessarily based upon a number of estimates and assumptions including material estimates and assumptions related to the factors set forth below that, while considered reasonable by the Company as at the date of this MD&A in light of management’s experience and perception of current conditions and expected developments, are inherently subject to significant business, economic and competitive uncertainties and contingencies. Known and unknown factors could cause actual results to differ materially from those projected in the forward-looking statements and
|
|
|
|
|
|
|
|
|
| BARRICK YEAR-END 2021 |
24 |
MANAGEMENT’S DISCUSSION AND ANALYSIS |
undue reliance should not be placed on such statements and information. Such factors include, but are not limited to: fluctuations in the spot and forward price of gold, copper or certain other commodities (such as silver, diesel fuel, natural gas and electricity); risks associated with projects in the early stages of evaluation and for which additional engineering and other analysis is required; risks related to the possibility that future exploration results will not be consistent with the Company’s expectations, that quantities or grades of reserves will be diminished, and that resources may not be converted to reserves; risks associated with the fact that certain of the initiatives described in this MD&A are still in the early stages and may not materialize; changes in mineral production performance, exploitation and exploration successes; risks that exploration data may be incomplete and considerable additional work may be required to complete further evaluation, including but not limited to drilling, engineering and socioeconomic studies and investment; the speculative nature of mineral exploration and development; lack of certainty with respect to foreign legal systems, corruption and other factors that are inconsistent with the rule of law; changes in national and local government legislation, taxation, controls or regulations and/or changes in the administration of laws, policies and practices; expropriation or nationalization of property and political or economic developments in Canada, the United States or other countries in which Barrick does or may carry on business in the future; risks relating to political instability in certain of the jurisdictions in which Barrick operates; timing of receipt of, or failure to comply with, necessary permits and approvals, including the issuance of a Record of Decision for the Goldrush Project and/or whether the Goldrush Project will be permitted to advance as currently designed under its Feasibility Study; non-renewal of key licenses by governmental authorities, including non-renewal of Porgera’s special mining lease; failure to comply with environmental and health and safety laws and regulations; contests over title to properties, particularly title to undeveloped properties, or over access to water, power and other required infrastructure; the liability associated with risks and hazards in the mining industry, and the ability to maintain insurance to cover such losses; increased costs and physical risks, including extreme weather events and resource shortages, related to climate change; damage to the Company’s reputation due to the actual or perceived occurrence of any number of events, including negative publicity with respect to the Company’s handling of environmental matters or dealings with community groups, whether true or not; risks related to operations near communities that may regard Barrick’s operations as being detrimental to them; litigation and legal and administrative proceedings; operating or technical difficulties in connection with mining or development activities, including geotechnical challenges, tailings dam and storage facilities failures, and disruptions in the maintenance or provision of required infrastructure and information technology systems; increased costs, delays, suspensions and technical challenges associated with the construction of capital projects; risks associated with working with partners in jointly controlled assets; risks related to disruption of supply
routes which may cause delays in construction and mining activities; risk of loss due to acts of war, terrorism, sabotage and civil disturbances; risks associated with artisanal and illegal mining; risks associated with Barrick’s infrastructure, information technology systems and the implementation of Barrick’s technological initiatives; the impact of global liquidity and credit availability on the timing of cash flows and the values of assets and liabilities based on projected future cash flows; the impact of inflation; adverse changes in our credit ratings; fluctuations in the currency markets; changes in U.S. dollar interest rates; risks arising from holding derivative instruments (such as credit risk, market liquidity risk and mark-to-market risk); risks related to the demands placed on the Company’s management, the ability of management to implement its business strategy and enhanced political risk in certain jurisdictions; uncertainty whether some or all of Barrick's targeted investments and projects will meet the Company’s capital allocation objectives and internal hurdle rate; whether benefits expected from recent transactions being realized; business opportunities that may be presented to, or pursued by, the Company; our ability to successfully integrate acquisitions or complete divestitures; risks related to competition in the mining industry; employee relations including loss of key employees; availability and increased costs associated with mining inputs and labor; risks associated with diseases, epidemics and pandemics, including the effects and potential effects of the global Covid-19 pandemic; risks related to the failure of internal controls; and risks related to the impairment of the Company’s goodwill and assets. Barrick also cautions that its 2022 guidance may be impacted by the unprecedented business and social disruption caused by the spread of Covid-19.
In addition, there are risks and hazards associated with the business of mineral exploration, development and mining, including environmental hazards, industrial accidents, unusual or unexpected formations, pressures, cave-ins, flooding and gold bullion, copper cathode or gold or copper concentrate losses (and the risk of inadequate insurance, or inability to obtain insurance, to cover these risks).
Many of these uncertainties and contingencies can affect our actual results and could cause actual results to differ materially from those expressed or implied in any forward-looking statements made by, or on behalf of, us. Readers are cautioned that forward-looking statements are not guarantees of future performance. All of the forward-looking statements made in this MD&A are qualified by these cautionary statements. Specific reference is made to the most recent Form 40-F/Annual Information Form on file with the SEC and Canadian provincial securities regulatory authorities for a more detailed discussion of some of the factors underlying forward-looking statements and the risks that may affect Barrick’s ability to achieve the expectations set forth in the forward-looking statements contained in this MD&A. We disclaim any intention or obligation to update or revise any forward-looking statements whether as a result of new information, future events or otherwise, except as required by applicable law.
|
|
|
|
|
|
|
|
|
| BARRICK YEAR-END 2021 |
25 |
MANAGEMENT’S DISCUSSION AND ANALYSIS |
Use of Non-GAAP Financial Performance Measures
We use the following non-GAAP financial performance measures in our MD&A:
■“adjusted net earnings”
■“free cash flow”
■“EBITDA”
■“adjusted EBITDA”
■“minesite sustaining capital expenditures”
■“project capital expenditures”
■“total cash costs per ounce”
■“C1 cash costs per pound”
■“all-in sustaining costs per ounce/pound”
■“all-in costs per ounce” and
■“realized price”
For a detailed description of each of the non-GAAP measures used in this MD&A and a detailed reconciliation to the most directly comparable measure under International Financial Reporting Standards (“IFRS”), please refer to the Non-GAAP Financial Performance Measures section of this MD&A on pages 94 to 120. Each non-GAAP financial performance measure has been annotated with a reference to an endnote on page 121. The non-GAAP financial performance measures set out in this MD&A are intended to provide additional information to investors and do not have any standardized meaning under IFRS, and therefore may not be comparable to other issuers, and should not be considered in isolation or as a substitute for measures of performance prepared in accordance with IFRS.
Changes in Presentation of Non-GAAP Financial Performance Measures
Capital Expenditures
Starting with this MD&A, we have identified minesite sustaining capital expenditures and project capital expenditures as non-GAAP financial performance measures as a result of adopting National Instrument 52-112 - Non-GAAP and Other Financial Measures Disclosure issued by the Canadian Securities Administrators. We have included the required disclosures for these non-GAAP financial measures, although there is no change to our calculation of these measures.
|
|
|
|
|
|
|
|
|
| BARRICK YEAR-END 2021 |
26 |
MANAGEMENT’S DISCUSSION AND ANALYSIS |
Index
|
|
|
|
|
|
|
|
|
|
|
|
|
|
Overview |
|
|
|
Our Vision |
|
|
|
Our Business |
|
|
|
Our Strategy |
|
|
|
Financial and Operating Highlights |
|
|
|
Environmental, Social and Governance |
|
|
|
Reserves and Resources |
|
|
|
Key Business Developments |
|
|
|
Outlook for 2022 |
|
|
|
Risks and Risk Management |
|
|
|
Market Overview |
|
|
|
Production and Cost Summary |
|
|
Operating Performance |
|
|
|
Nevada Gold Mines |
|
|
|
|
Carlin |
|
|
|
|
Cortez |
|
|
|
|
Turquoise Ridge |
|
|
|
|
Other Mines - Nevada Gold Mines |
|
|
|
|
|
|
|
Pueblo Viejo |
|
|
|
Loulo-Gounkoto |
|
|
|
Kibali |
|
|
|
Veladero |
|
|
|
|
|
|
|
North Mara |
|
|
|
Bulyanhulu |
|
|
|
Other Mines - Gold |
|
|
|
Other Mines - Copper |
|
|
Growth Project Updates |
|
|
Exploration and Mineral Resource Management |
|
|
|
|
|
|
|
|
|
|
|
|
|
|
|
|
|
|
|
|
|
|
|
|
|
|
|
|
|
|
|
|
|
|
|
|
|
|
|
|
|
|
|
|
|
|
|
|
|
|
|
|
|
|
|
|
|
|
|
|
|
|
|
|
|
|
|
|
|
|
|
|
|
|
|
|
|
|
|
|
|
|
|
|
|
|
|
|
|
|
|
|
|
|
|
|
|
|
|
|
|
|
|
|
|
|
|
|
|
|
|
|
|
|
|
|
|
|
|
|
|
|
|
|
|
|
|
|
|
|
|
|
|
|
|
|
|
|
|
|
|
|
|
|
|
|
|
|
|
|
|
|
|
|
|
|
|
|
|
|
|
|
|
|
|
|
|
|
|
Review of Financial Results |
|
|
Revenue |
|
|
Production Costs |
|
|
Capital Expenditures |
|
|
General and Administrative Expenses |
|
|
Exploration, Evaluation and Project Costs |
|
|
Finance Costs, Net |
|
|
Additional Significant Statement of Income Items |
|
|
Income Tax Expense |
|
Financial Condition Review |
|
|
Balance Sheet Review |
|
|
Shareholders’ Equity |
|
|
Financial Position and Liquidity |
|
|
Summary of Cash Inflow (Outflow) |
|
|
Summary of Financial Instruments |
|
Commitments and Contingencies |
|
Review of Quarterly Results |
|
Internal Control Over Financial Reporting and Disclosure Controls and Procedures |
|
IFRS Critical Accounting Policies and Accounting Estimates |
|
Non-GAAP Financial Performance Measures |
|
Technical Information |
|
Endnotes |
|
Glossary of Technical Terms |
|
Mineral Reserves and Mineral Resources Tables |
|
Management’s Responsibility |
|
Management’s Report on Internal Control Over Financial Reporting |
|
Independent Auditor’s Report |
|
Financial Statements |
|
Notes to Consolidated Financial Statements |
|
|
|
|
|
|
|
|
|
| BARRICK YEAR-END 2021 |
27 |
MANAGEMENT’S DISCUSSION AND ANALYSIS |
Overview
Our Vision
We strive to be the world’s most valued gold mining business by finding, developing and owning the best assets, with the best people, to deliver sustainable returns for our owners and partners.
Our Business
Barrick is one of the world’s leading gold mining companies with annual gold production and gold reserves that are among the largest in the industry. We are principally engaged in the production and sale of gold and copper, as well as related activities such as exploration and mine development. We hold ownership interests in thirteen producing gold mines, including six Tier One Gold Assets1 and a diversified exploration portfolio positioned for growth in many of the world’s most prolific gold districts. These gold mines are geographically diversified and are located in Argentina, Canada, Côte d’Ivoire, the Democratic Republic of Congo, the Dominican Republic, Mali, Tanzania and the United States. Our mine in Papua New Guinea was placed on care and maintenance in April 2020. Our three copper mines are located in Zambia, Chile and Saudi Arabia. Our exploration and development projects are located throughout the Americas and Africa. We sell our production in the world market through the following distribution channels: gold bullion is sold in the gold spot market or to independent refineries; gold and copper concentrate is sold to independent smelting or trading companies; and copper cathode is sold to third-party purchasers or on exchange. Barrick shares trade on the New York Stock Exchange under the symbol GOLD and the Toronto Stock Exchange under the symbol ABX.
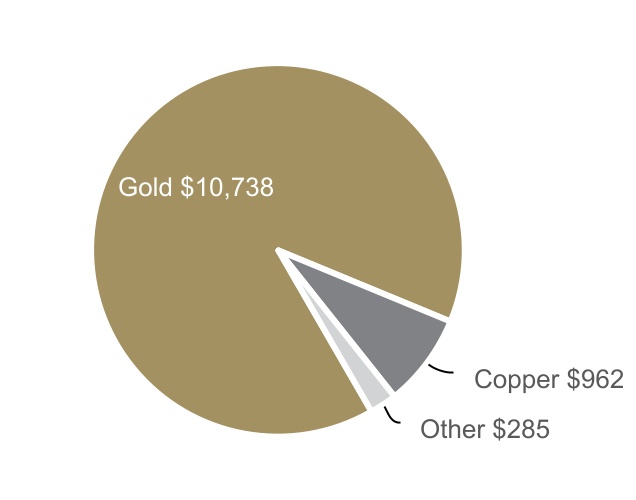
2021 REVENUE ($ millions)
Our Strategy
Our strategy is to operate as business owners by attracting and developing world-class people who understand and are involved in the value chain of the business, act with integrity and are tireless in their pursuit of excellence. We are focused on returns to our stakeholders by optimizing free cash flow, managing risk to create long-term value for our
shareholders and partnering with host governments and our local communities to transform their country’s natural resources into sustainable benefits and mutual prosperity. We aim to achieve this through the following:1
Asset Quality
■Grow and invest in a portfolio of Tier One Gold Assets1, Tier Two Gold Assets2, Tier One Copper Assets3 and Strategic Assets4 with an emphasis on organic growth to leverage our existing footprint. We will focus our efforts on identifying, investing in and developing assets that meet our investment criteria. The required internal rate of return (“IRR”) for Tier One Gold Assets and Tier Two Gold Assets is 15% and 20%, respectively, based on our long-term gold price assumption. The required IRR for Tier One Copper Assets is 15% based on our long-term copper price assumption. A Tier One Gold Asset is an asset with a reserve potential to deliver a minimum 10-year life, annual production of at least 500,000 ounces of gold and total cash costs per ounce6 over the mine life that are in the lower half of the industry cost curve. A Tier Two Gold Asset is an asset with a reserve potential to deliver a minimum 10-year life, annual production of at least 250,000 ounces of gold and total cash costs per ounce6 over the mine life that are in the lower half of the industry cost curve. A Tier One Copper Asset is an asset with a reserve potential of greater than five million tonnes of contained copper and C1 cash costs per pound6 over the mine life that are in the lower half of the industry cost curve.
■Invest in exploration across extensive land positions in many of the world’s most prolific gold and copper districts.
■Maximize the long-term value of our strategic Copper Business5.
■Sell non-core assets over time in a disciplined manner.
Operational Excellence
■Strive for zero harm workplaces.
■Operate a flat management structure with a strong ownership culture.
■Streamline management and operations, and hold management accountable for the businesses they manage.
■Leverage innovation and technology to drive industry-leading efficiencies.
■Build trust-based partnerships with our host governments, business partners, and local communities to drive shared long-term value.
Sustainable Profitability
■Follow a disciplined approach to growth and proactively manage our impacts on the wider environment, emphasizing long-term value for all stakeholders.
■Increase returns to shareholders, driven by a focus on return on capital, internal rate of return and free cash flow.
1 Numerical annotations throughout the text of this document refer to the endnotes found on page 121.
|
|
|
|
|
|
|
|
|
| BARRICK YEAR-END 2021 |
28 |
MANAGEMENT’S DISCUSSION AND ANALYSIS |
Financial and Operating Highlights
|
|
|
|
|
|
|
|
|
|
|
|
|
|
|
|
|
|
|
|
|
|
|
|
|
|
|
|
|
|
|
For the three months ended |
|
For the years ended |
| |
12/31/21 |
9/30/21 |
Change |
|
12/31/21 |
12/31/20 |
Change |
|
12/31/19 |
Financial Results ($ millions) |
|
|
|
|
|
|
|
|
|
| Revenues |
3,310 |
|
2,826 |
|
17% |
|
11,985 |
|
12,595 |
|
(5%) |
|
9,717 |
|
| Cost of sales |
1,905 |
|
1,768 |
|
8% |
|
7,089 |
|
7,417 |
|
(4%) |
|
6,911 |
|
Net earningsa |
726 |
|
347 |
|
109% |
|
2,022 |
|
2,324 |
|
(13%) |
|
3,969 |
|
Adjusted net earningsb |
626 |
|
419 |
|
49% |
|
2,065 |
|
2,042 |
|
1% |
|
902 |
|
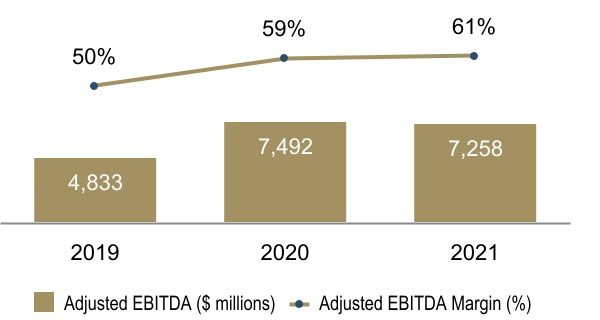
Adjusted EBITDAb |
2,070 |
|
1,669 |
|
24% |
|
7,258 |
|
7,492 |
|
(3)% |
|
4,833 |
|
Adjusted EBITDA marginb,c |
63 |
% |
59 |
% |
7% |
|
61 |
% |
59 |
% |
3% |
|
50 |
% |
Minesite sustaining capital expendituresb,d |
431 |
|
386 |
|
12% |
|
1,673 |
|
1,559 |
|
7% |
|
1,320 |
|
Project capital expendituresb,d |
234 |
|
179 |
|
31% |
|
747 |
|
471 |
|
59% |
|
370 |
|
Total consolidated capital expendituresd,e |
669 |
|
569 |
|
18% |
|
2,435 |
|
2,054 |
|
19% |
|
1,701 |
|
| Net cash provided by operating activities |
1,387 |
|
1,050 |
|
32% |
|
4,378 |
|
5,417 |
|
(19%) |
|
2,833 |
|
Net cash provided by operating activities marginf |
42 |
% |
37 |
% |
14% |
|
37 |
% |
43 |
% |
(14%) |
|
29 |
% |
Free cash flowb |
718 |
|
481 |
|
49% |
|
1,943 |
|
3,363 |
|
(42%) |
|
1,132 |
|
| Net earnings per share (basic and diluted) |
0.41 |
|
0.20 |
|
105% |
|
1.14 |
|
1.31 |
|
(13%) |
|
2.26 |
|
Adjusted net earnings (basic)b per share |
0.35 |
|
0.24 |
|
46% |
|
1.16 |
|
1.15 |
|
1% |
|
0.51 |
|
| Weighted average diluted common shares (millions of shares) |
1,779 |
|
1,779 |
|
0% |
|
1,779 |
|
1,778 |
|
0% |
|
1,758 |
|
| Operating Results |
|
|
|
|
|
|
|
|
|
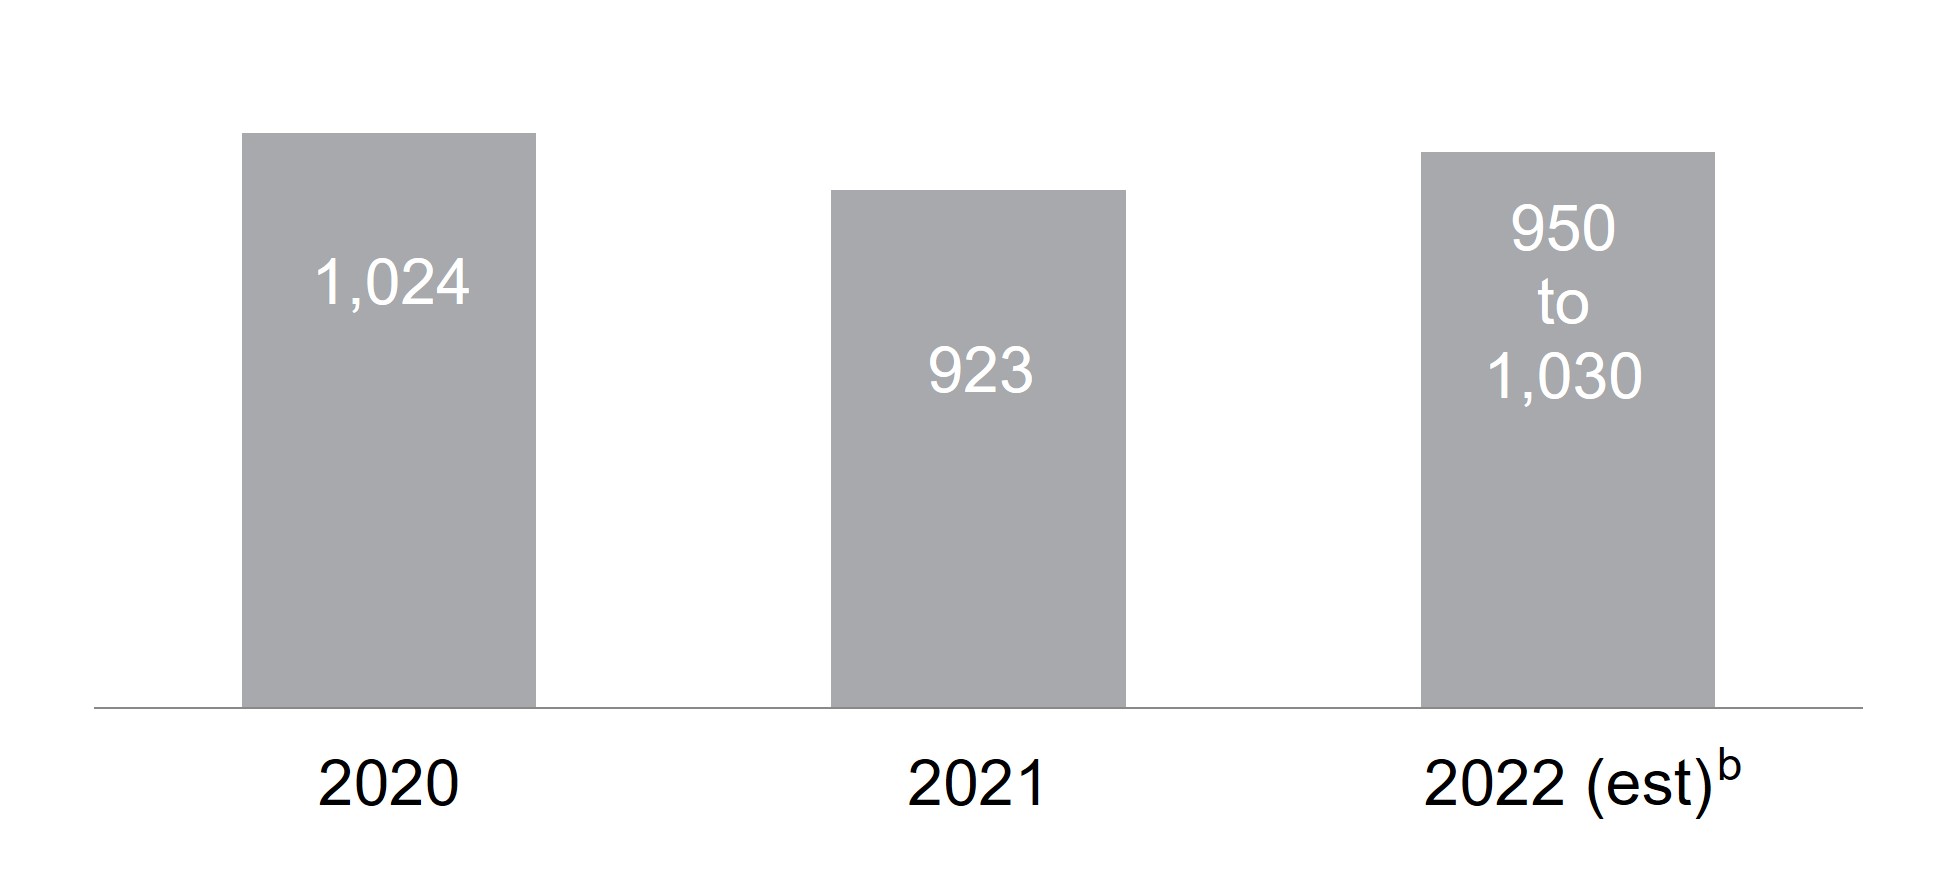
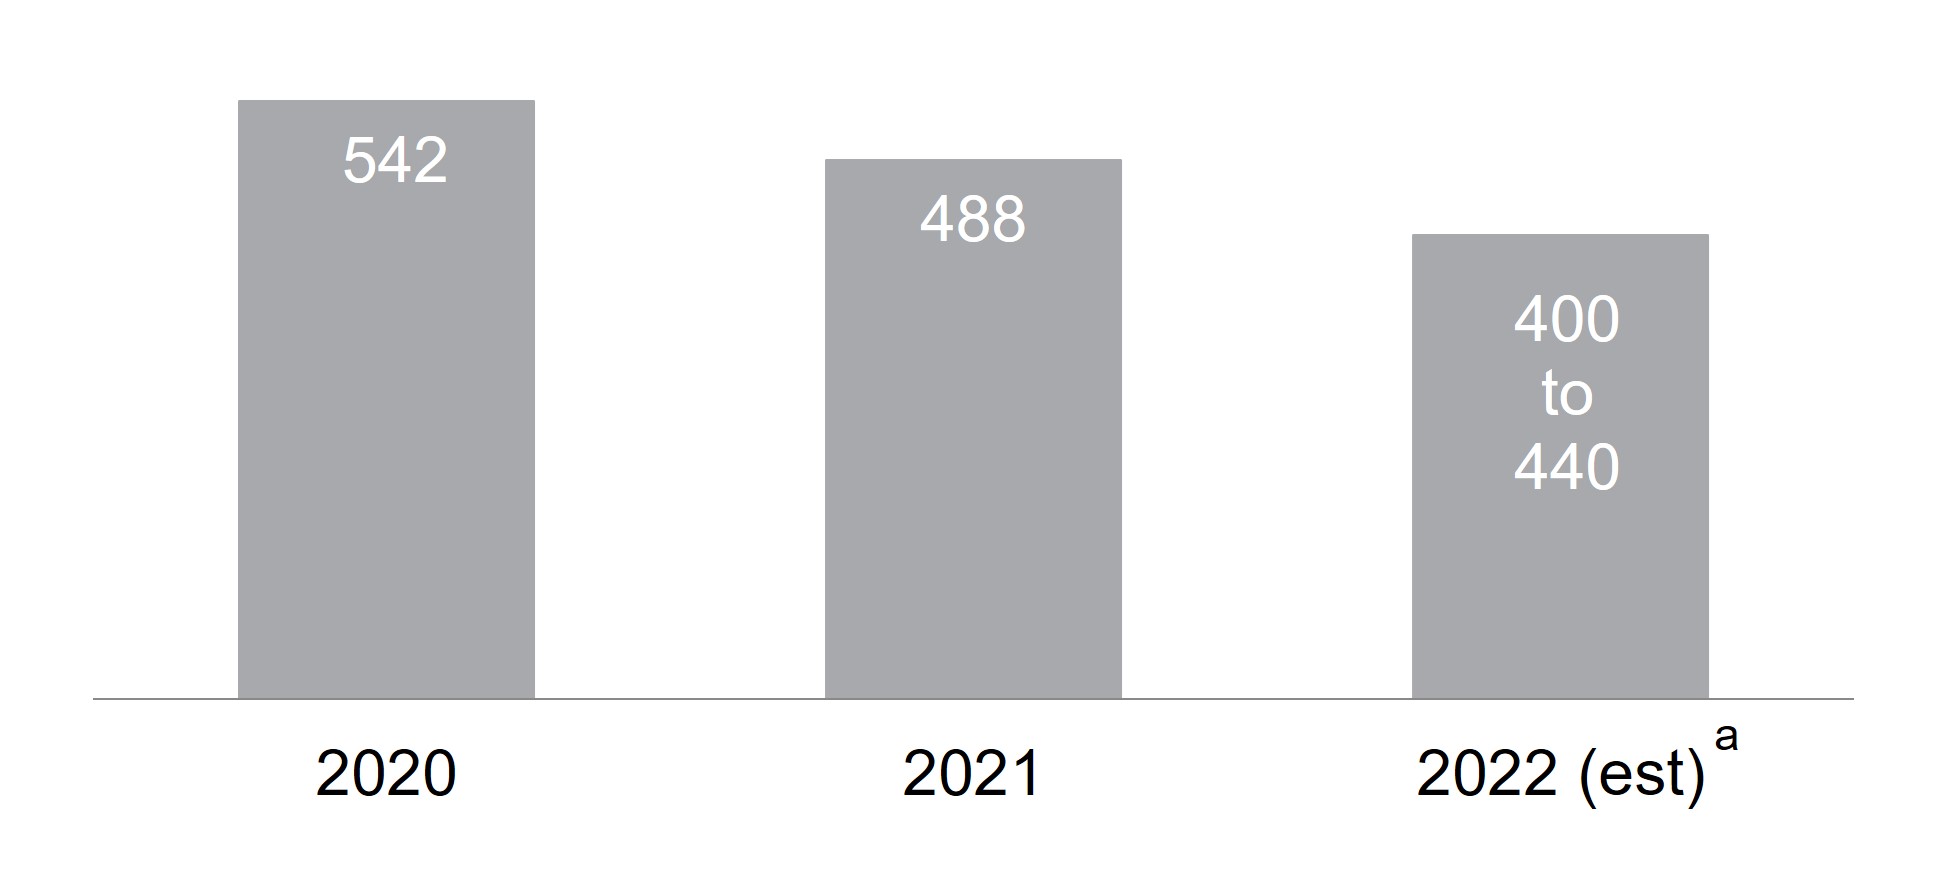
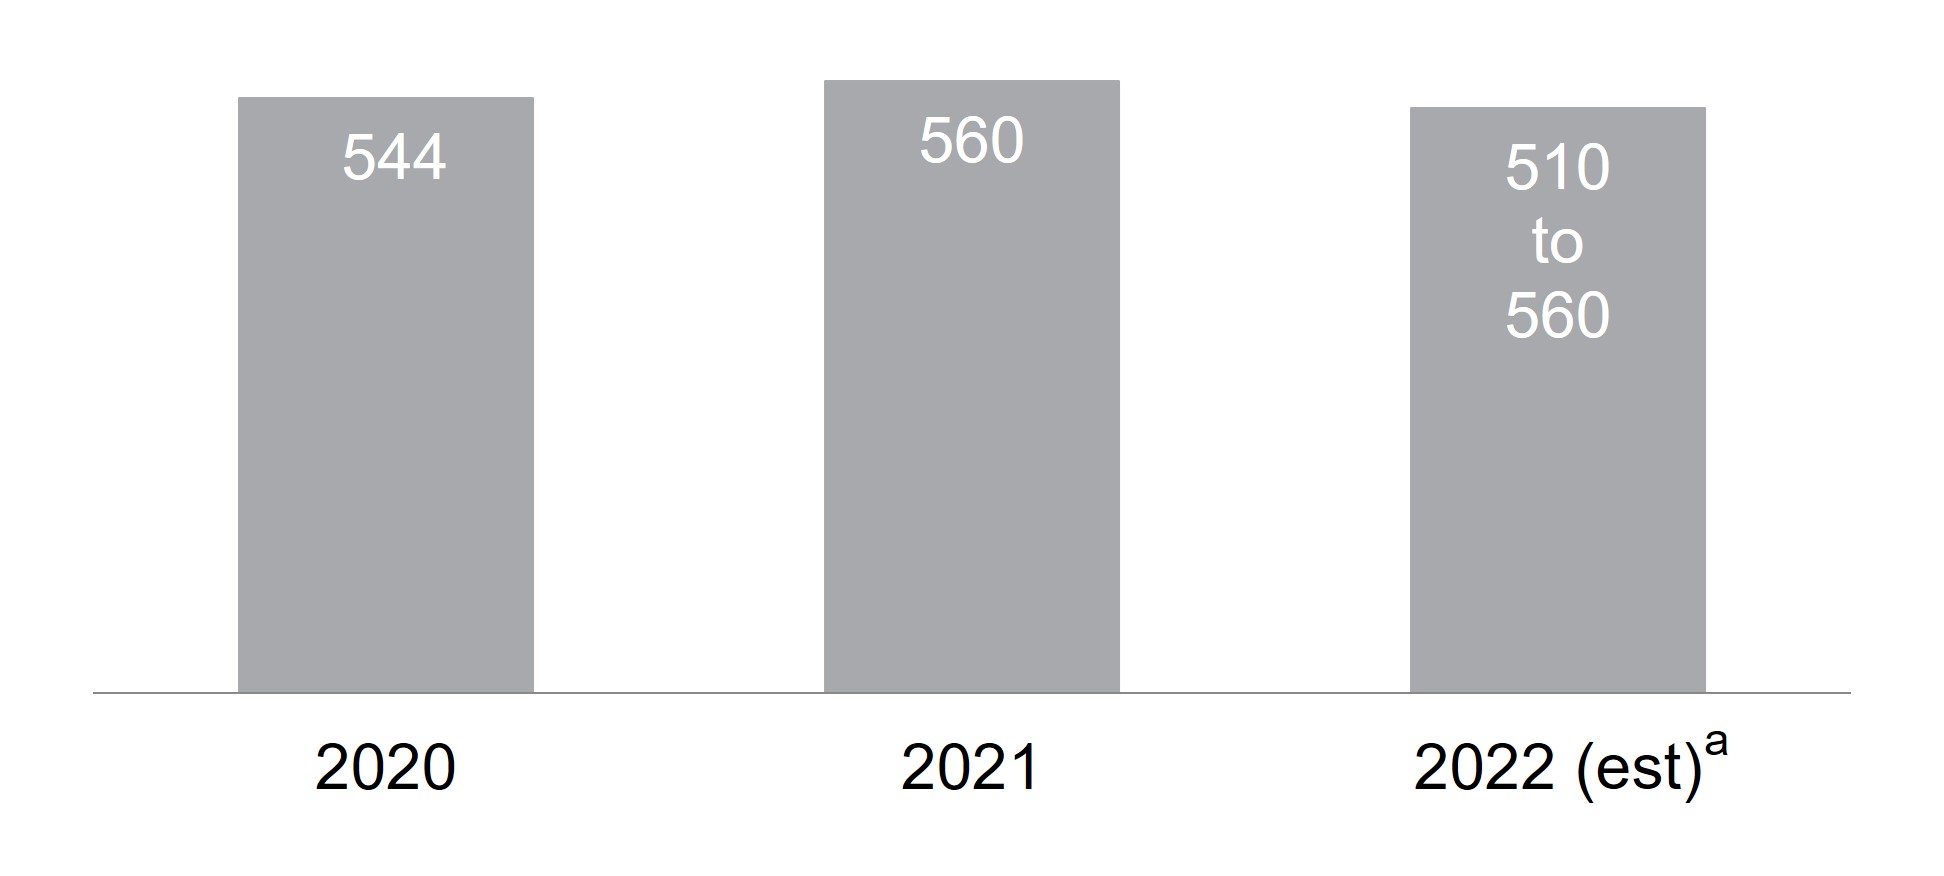
Gold production (thousands of ounces)g |
1,203 |
|
1,092 |
|
10% |
|
4,437 |
|
4,760 |
|
(7%) |
|
5,465 |
|
Gold sold (thousands of ounces)g |
1,234 |
|
1,071 |
|
15% |
|
4,468 |
|
4,879 |
|
(8%) |
|
5,467 |
|
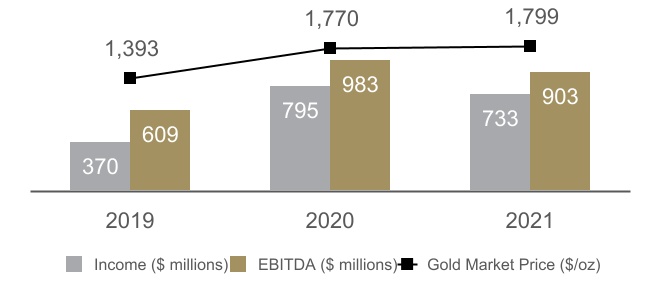
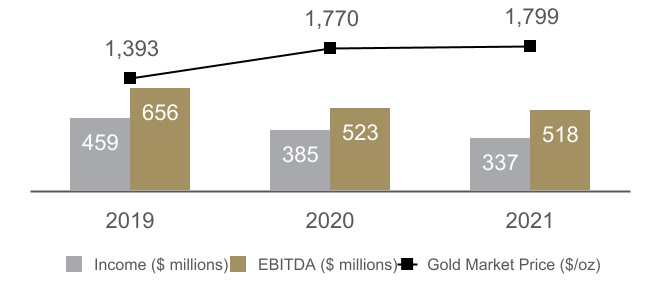
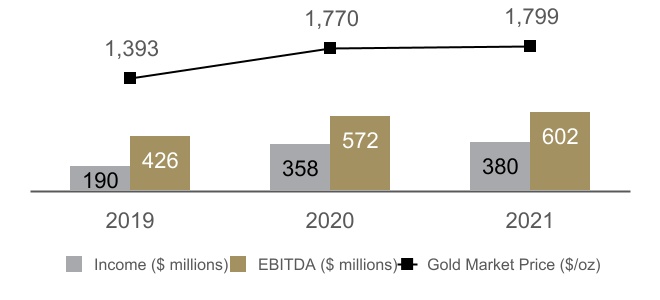
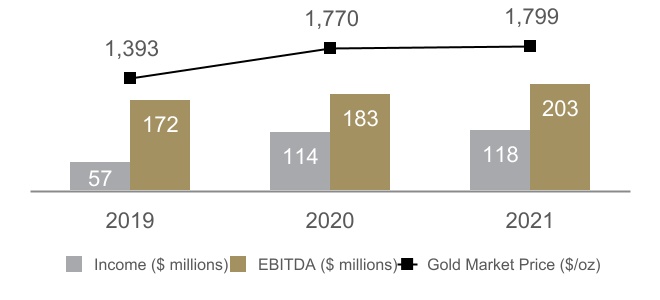
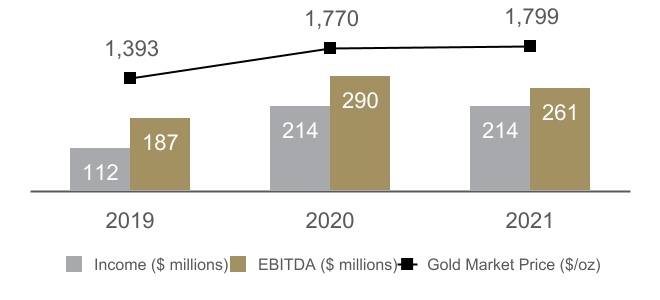
| Market gold price ($/oz) |
1,795 |
|
1,790 |
|
0% |
|
1,799 |
|
1,770 |
|
2% |
|
1,393 |
|
Realized gold priceb,g ($/oz) |
1,793 |
|
1,771 |
|
1% |
|
1,790 |
|
1,778 |
|
1% |
|
1,396 |
|
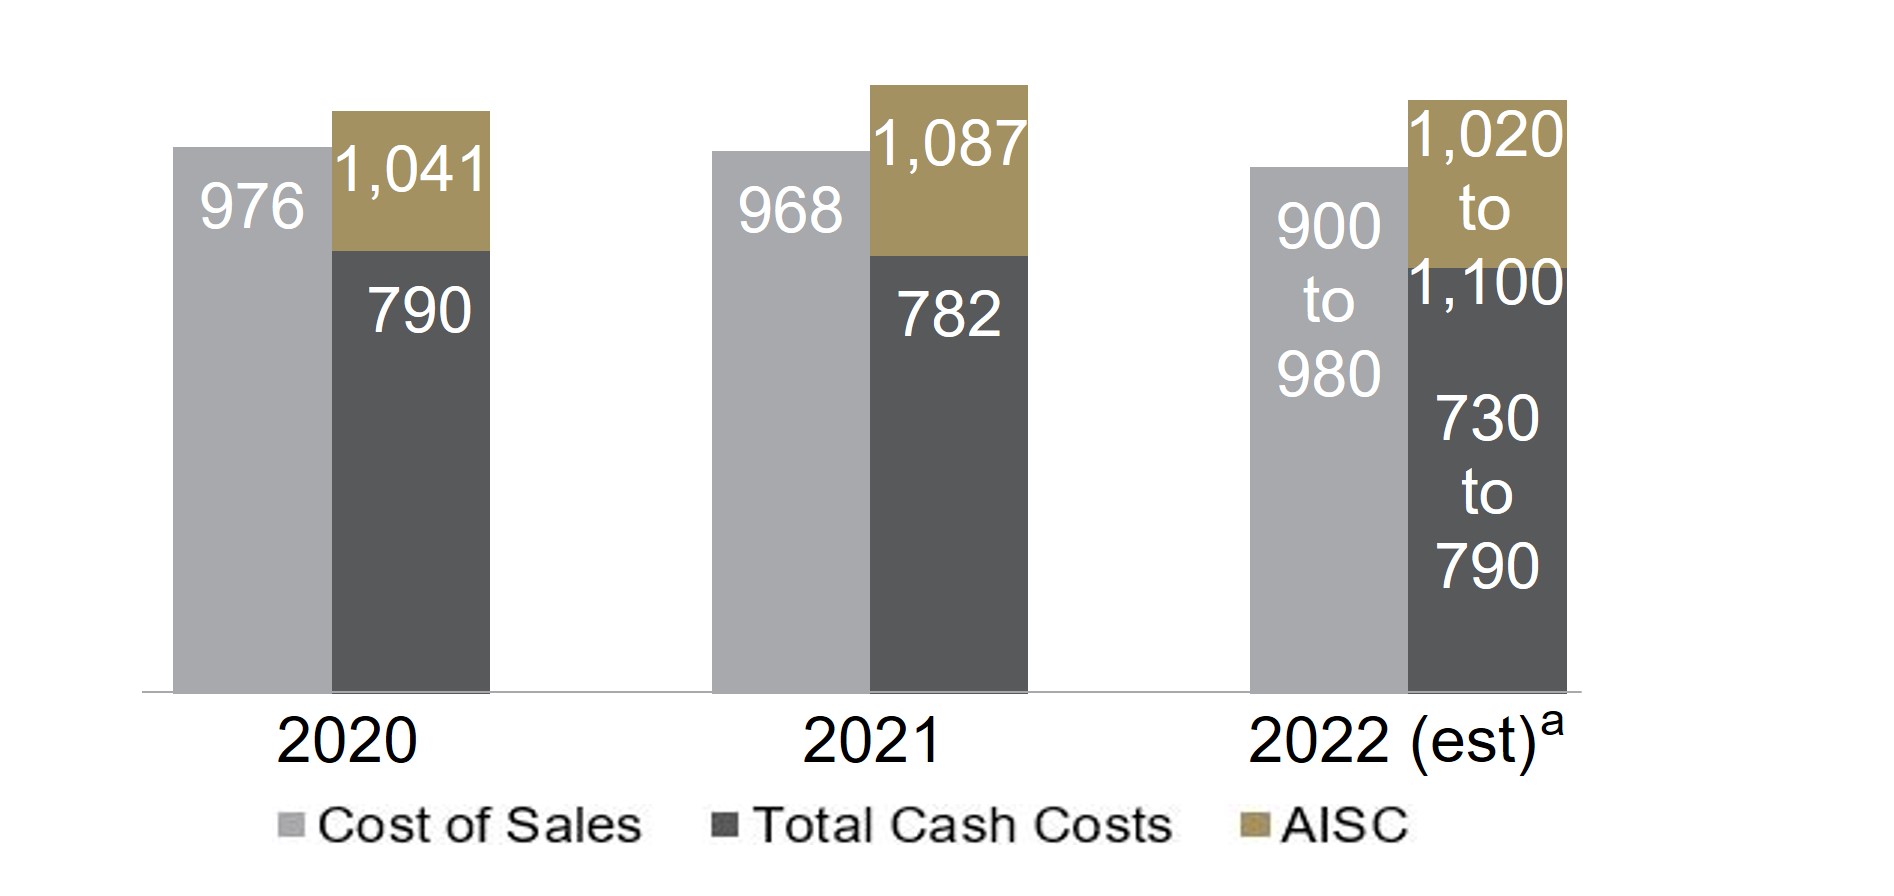
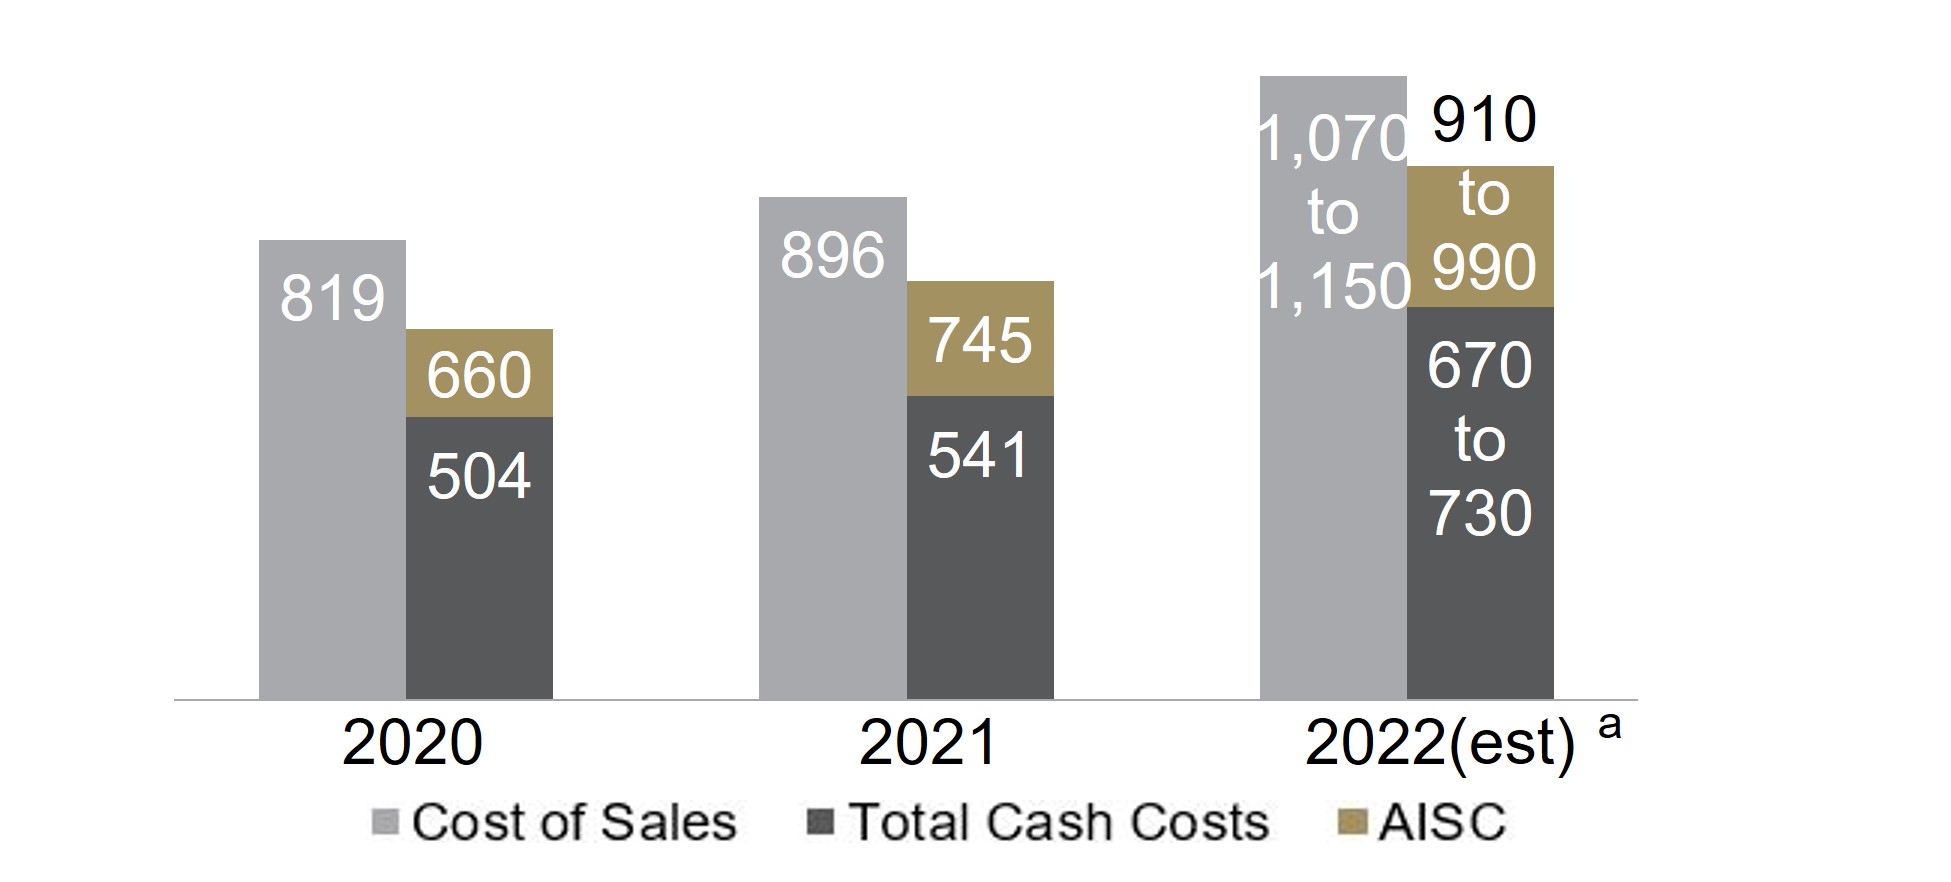
Gold cost of sales (Barrick’s share)g,h ($/oz) |
1,075 |
|
1,122 |
|
(4)% |
|
1,093 |
|
1,056 |
|
4% |
|
1,005 |
|
Gold total cash costsb,g ($/oz) |
715 |
|
739 |
|
(3)% |
|
725 |
|
699 |
|
4% |
|
671 |
|
Gold all-in sustaining costsb,g ($/oz) |
971 |
|
1,034 |
|
(6)% |
|
1,026 |
|
967 |
|
6% |
|
894 |
|
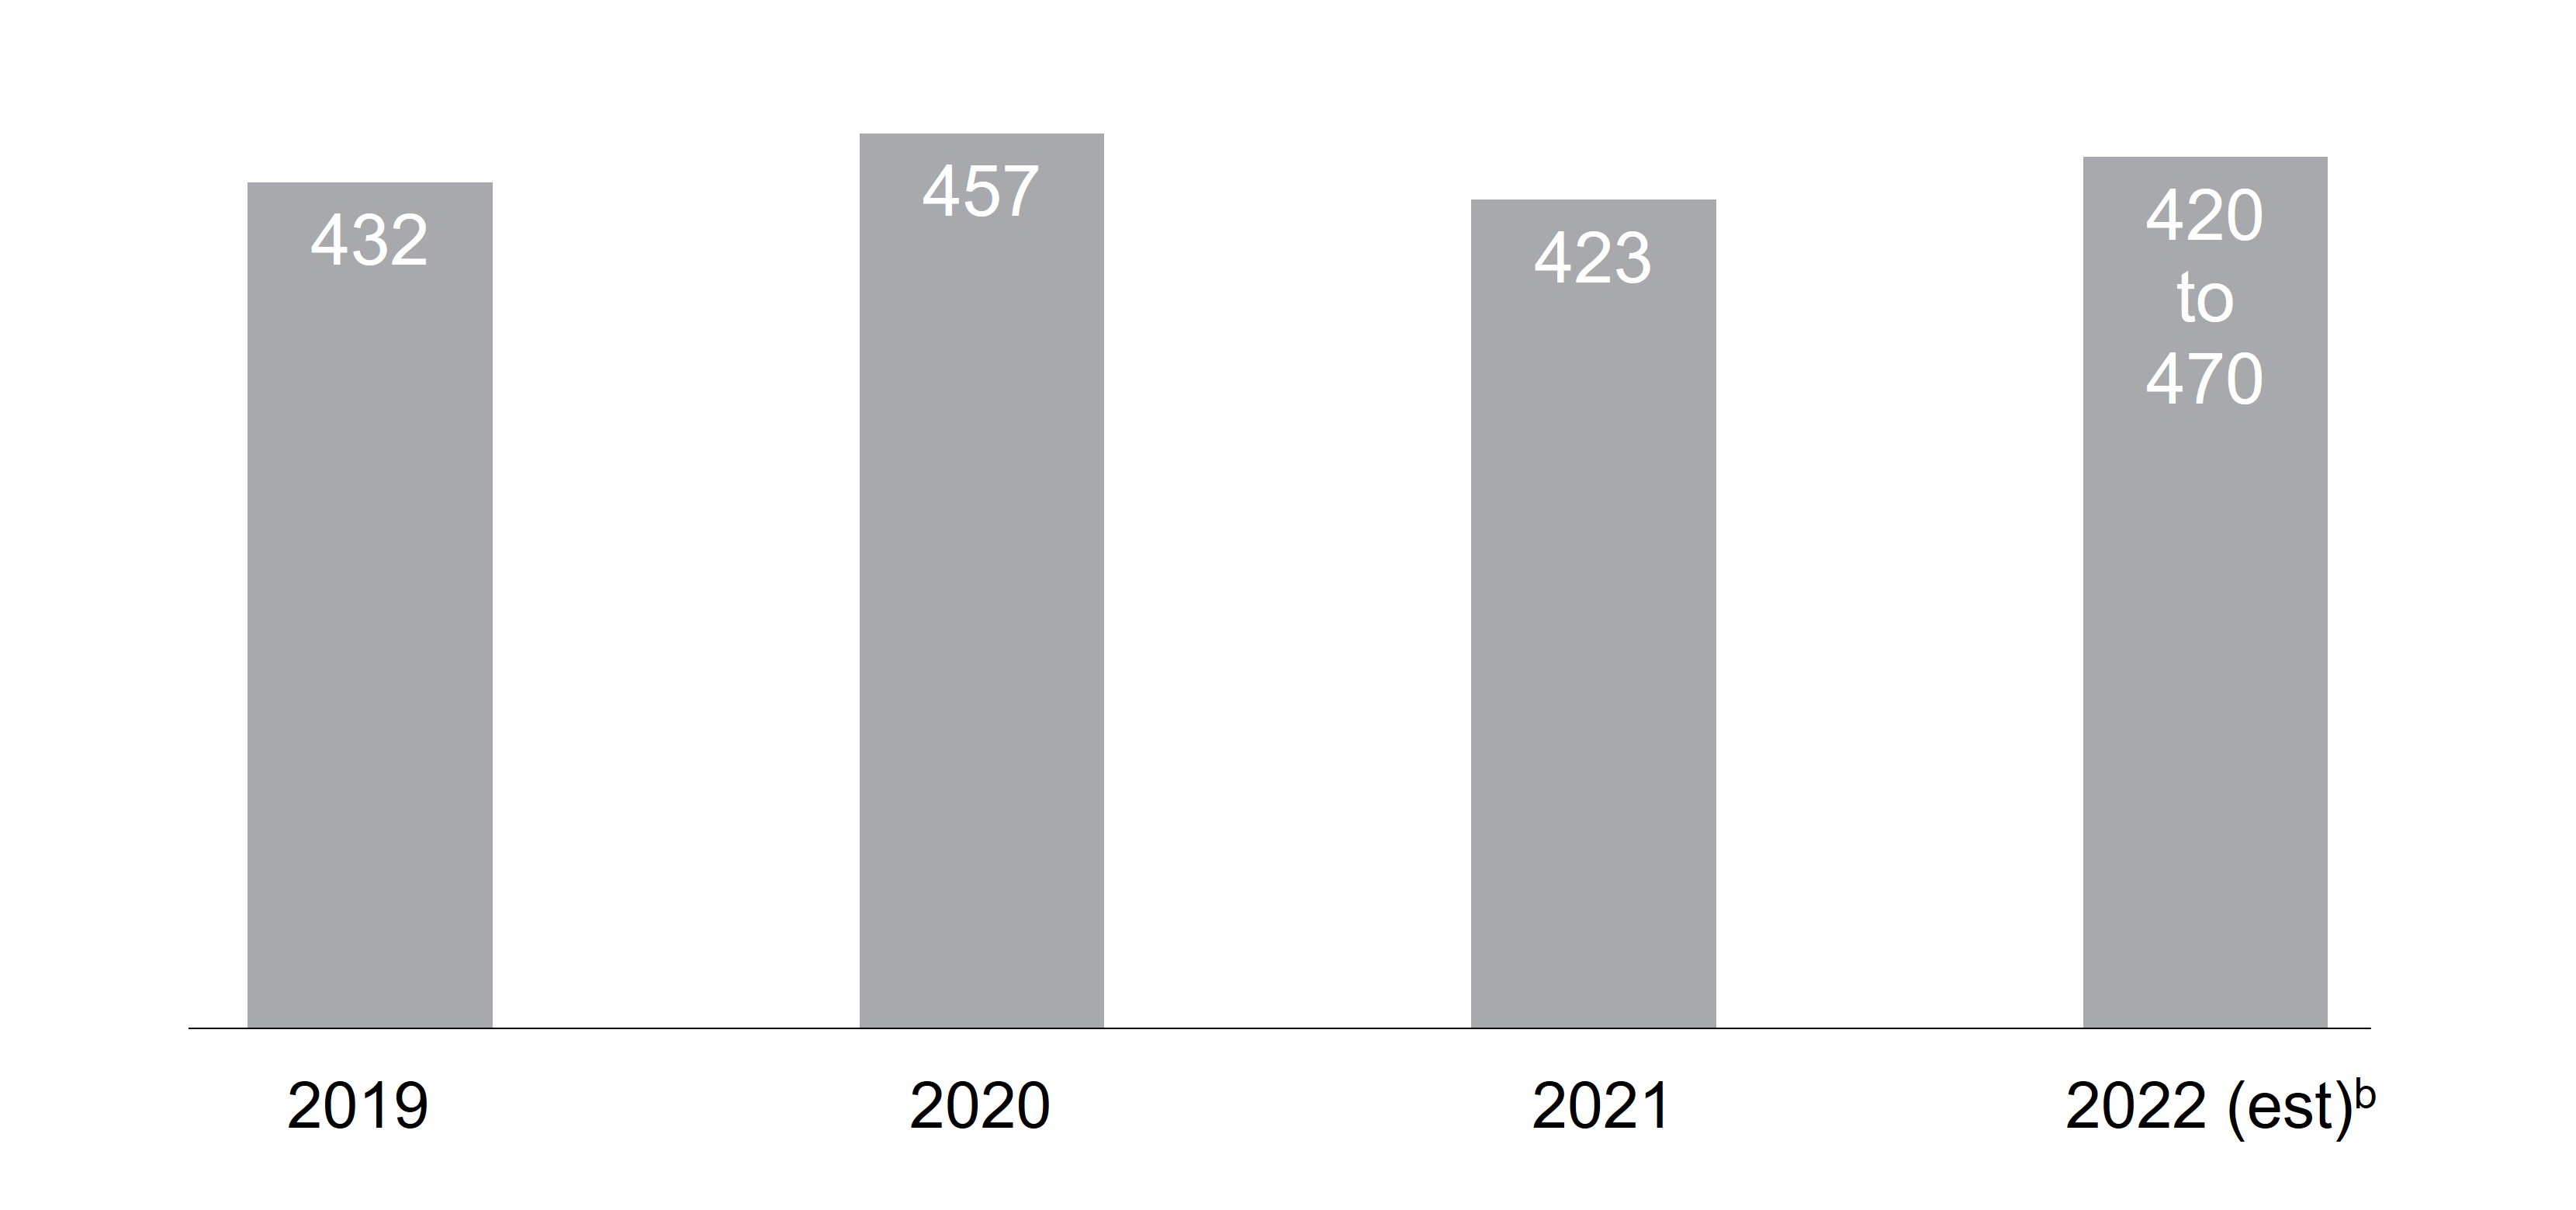
Copper production (millions of pounds)g |
126 |
|
100 |
|
26% |
|
415 |
|
457 |
|
(9%) |
|
432 |
|
Copper sold (millions of pounds)g |
113 |
|
101 |
|
12% |
|
423 |
|
457 |
|
(7%) |
|
355 |
|
| Market copper price ($/lb) |
4.40 |
|
4.25 |
|
4% |
|
4.23 |
|
2.80 |
|
51% |
|
2.72 |
|
Realized copper priceb,g ($/lb) |
4.63 |
|
3.98 |
|
16% |
|
4.32 |
|
2.92 |
|
48% |
|
2.77 |
|
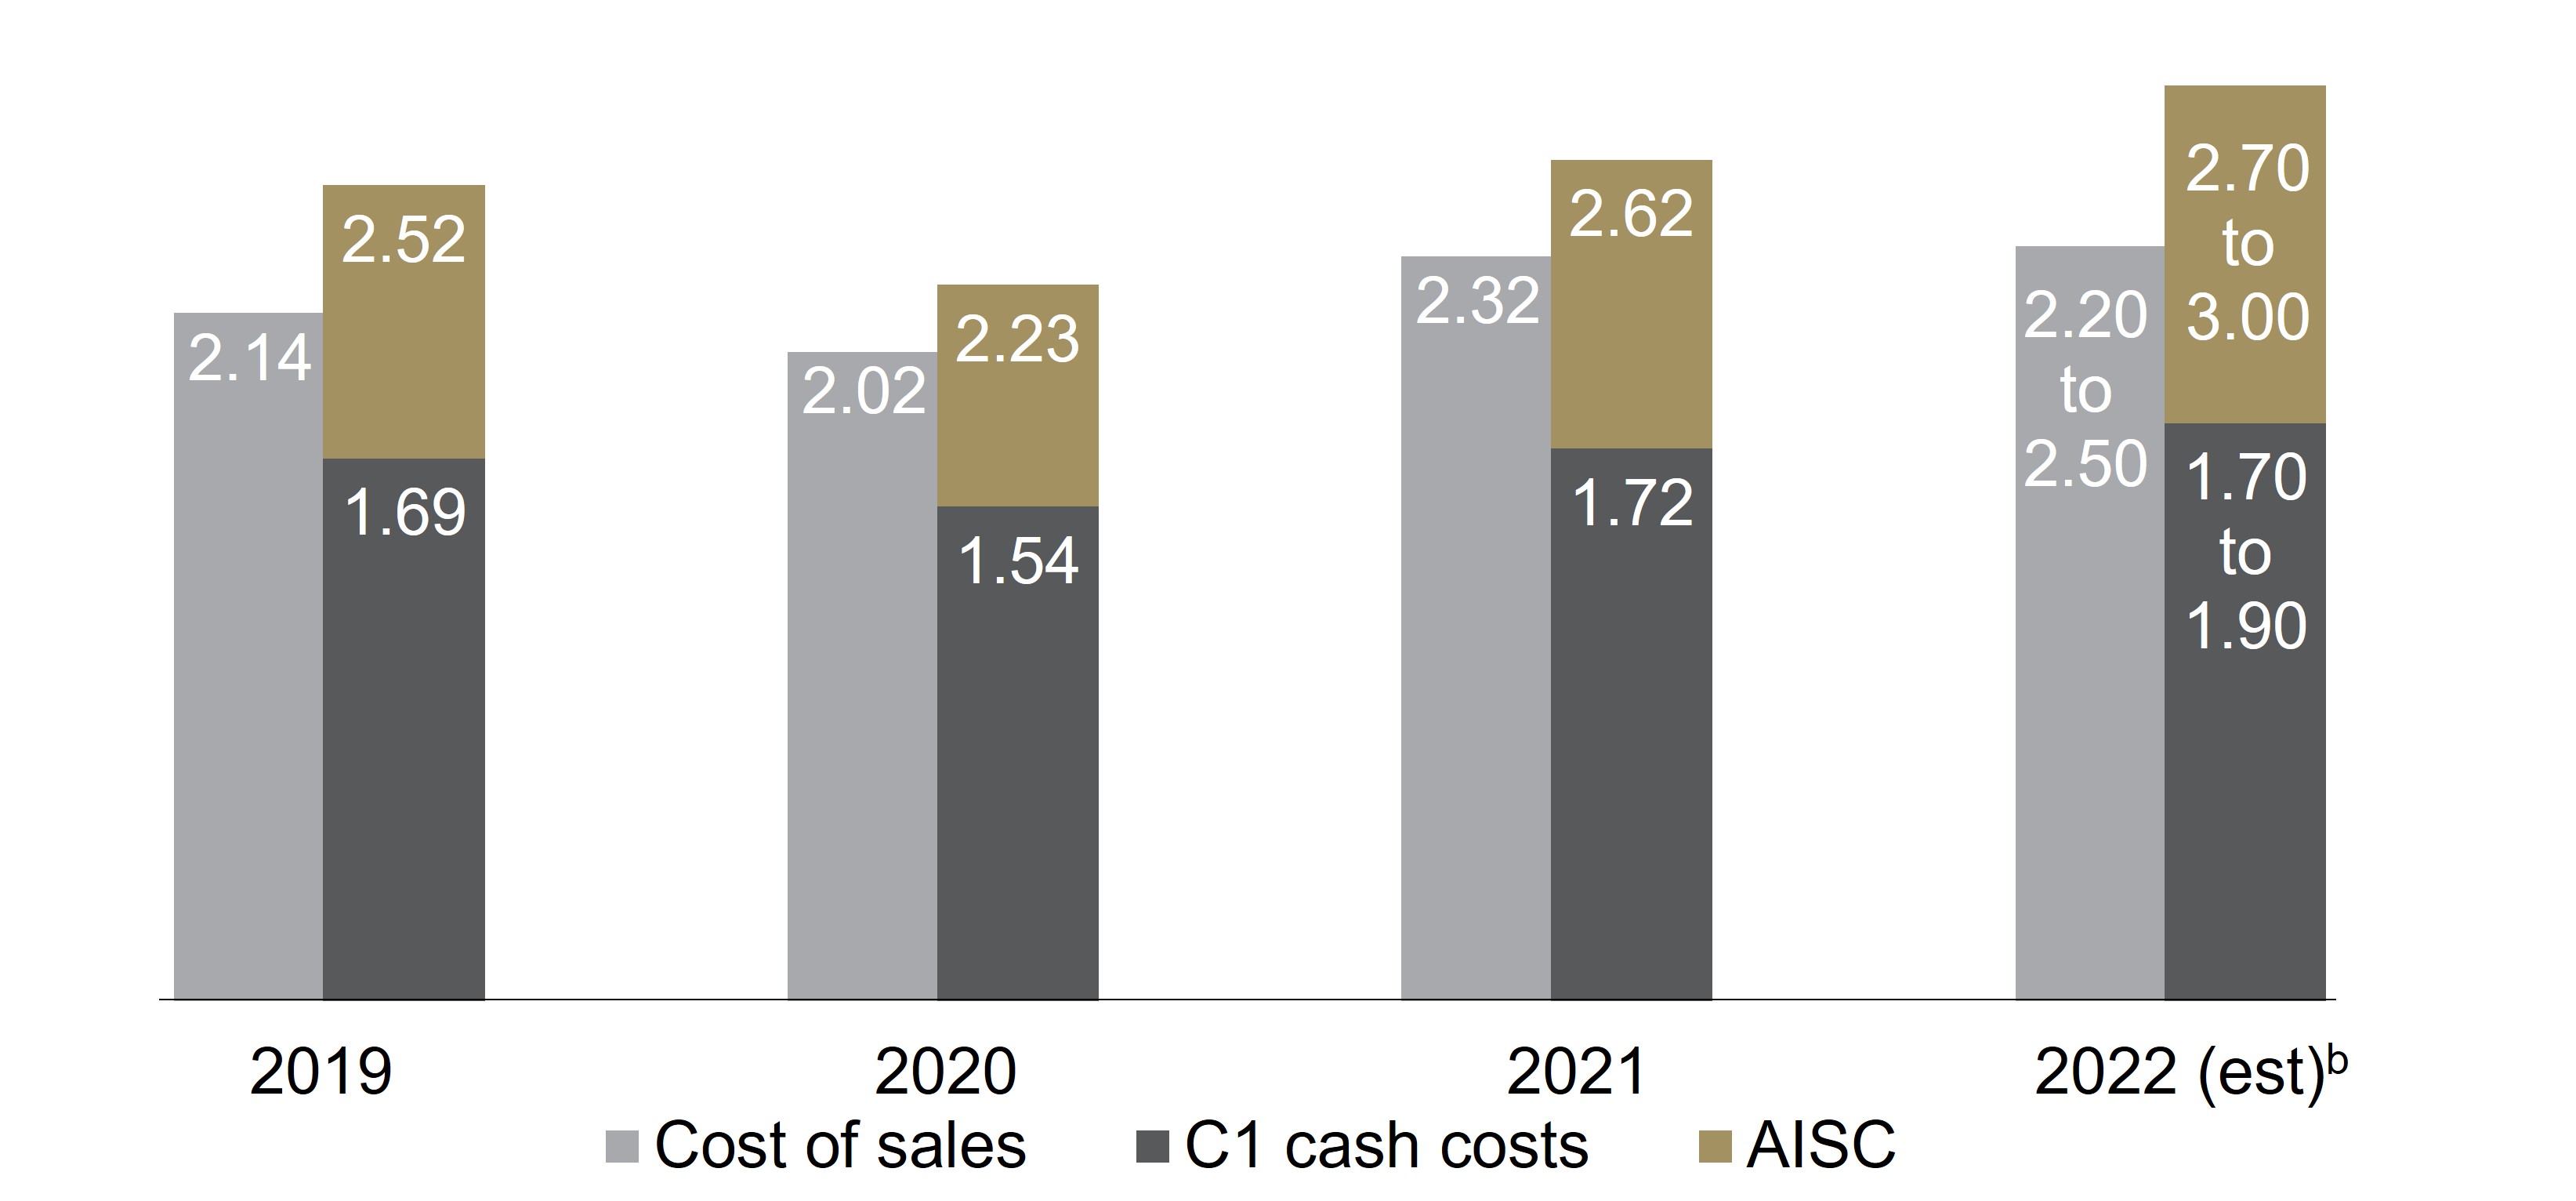
Copper cost of sales (Barrick’s share)g,i ($/lb) |
2.21 |
|
2.57 |
|
(14)% |
|
2.32 |
|
2.02 |
|
15% |
|
2.14 |
|
Copper C1 cash costsb,g ($/lb) |
1.63 |
|
1.85 |
|
(12)% |
|
1.72 |
|
1.54 |
|
12% |
|
1.69 |
|
Copper all-in sustaining costsb,g ($/lb) |
2.92 |
|
2.60 |
|
12% |
|
2.62 |
|
2.23 |
|
17% |
|
2.52 |
|
| |
As at 12/31/21 |
As at 9/30/21 |
Change |
|
As at 12/31/21 |
As at 12/31/20 |
Change |
|
As at 12/31/19 |
Financial Position ($ millions) |
|
|
|
|
|
|
|
|
|
| Debt (current and long-term) |
5,150 |
|
5,154 |
|
0% |
|
5,150 |
|
5,155 |
|
0% |
|
5,536 |
|
| Cash and equivalents |
5,280 |
|
5,043 |
|
5% |
|
5,280 |
|
5,188 |
|
2% |
|
3,314 |
|
| Debt, net of cash |
(130) |
|
111 |
|
(217)% |
|
(130) |
|
(33) |
|
294% |
|
2,222 |
|
a.Net earnings represents net earnings attributable to the equity holders of the Company.
b.Further information on these non-GAAP financial measures, including detailed reconciliations, is included on pages 94 to 120 of this MD&A. c.Represents adjusted EBITDA divided by revenue.
d.Amounts presented on a consolidated cash basis. Project capital expenditures are included in our calculation of all-in costs, but not included in our calculation of all-in sustaining costs.
e.Total consolidated capital expenditures also includes capitalized interest of $4 million and $15 million, respectively, for the three months and year ended December 31, 2021 (September 30, 2021: $4 million; 2020: $24 million; 2019: $11 million).
f.Represents net cash provided by operating activities divided by revenue.
g.On an attributable basis.
h.Gold cost of sales per ounce is calculated as cost of sales across our gold operations (excluding sites in closure or care and maintenance) divided by ounces sold (both on an attributable basis using Barrick’s ownership share).
i.Copper cost of sales per pound is calculated as cost of sales across our copper operations divided by pounds sold (both on an attributable basis using Barrick’s ownership share).
|
|
|
|
|
|
|
|
|
| BARRICK YEAR-END 2021 |
29 |
MANAGEMENT’S DISCUSSION AND ANALYSIS |
|
|
|
|
|
|
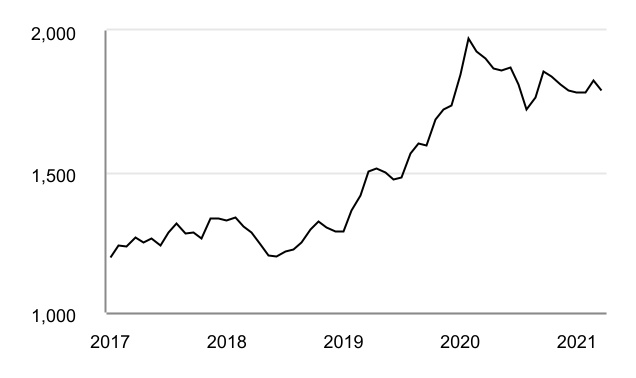
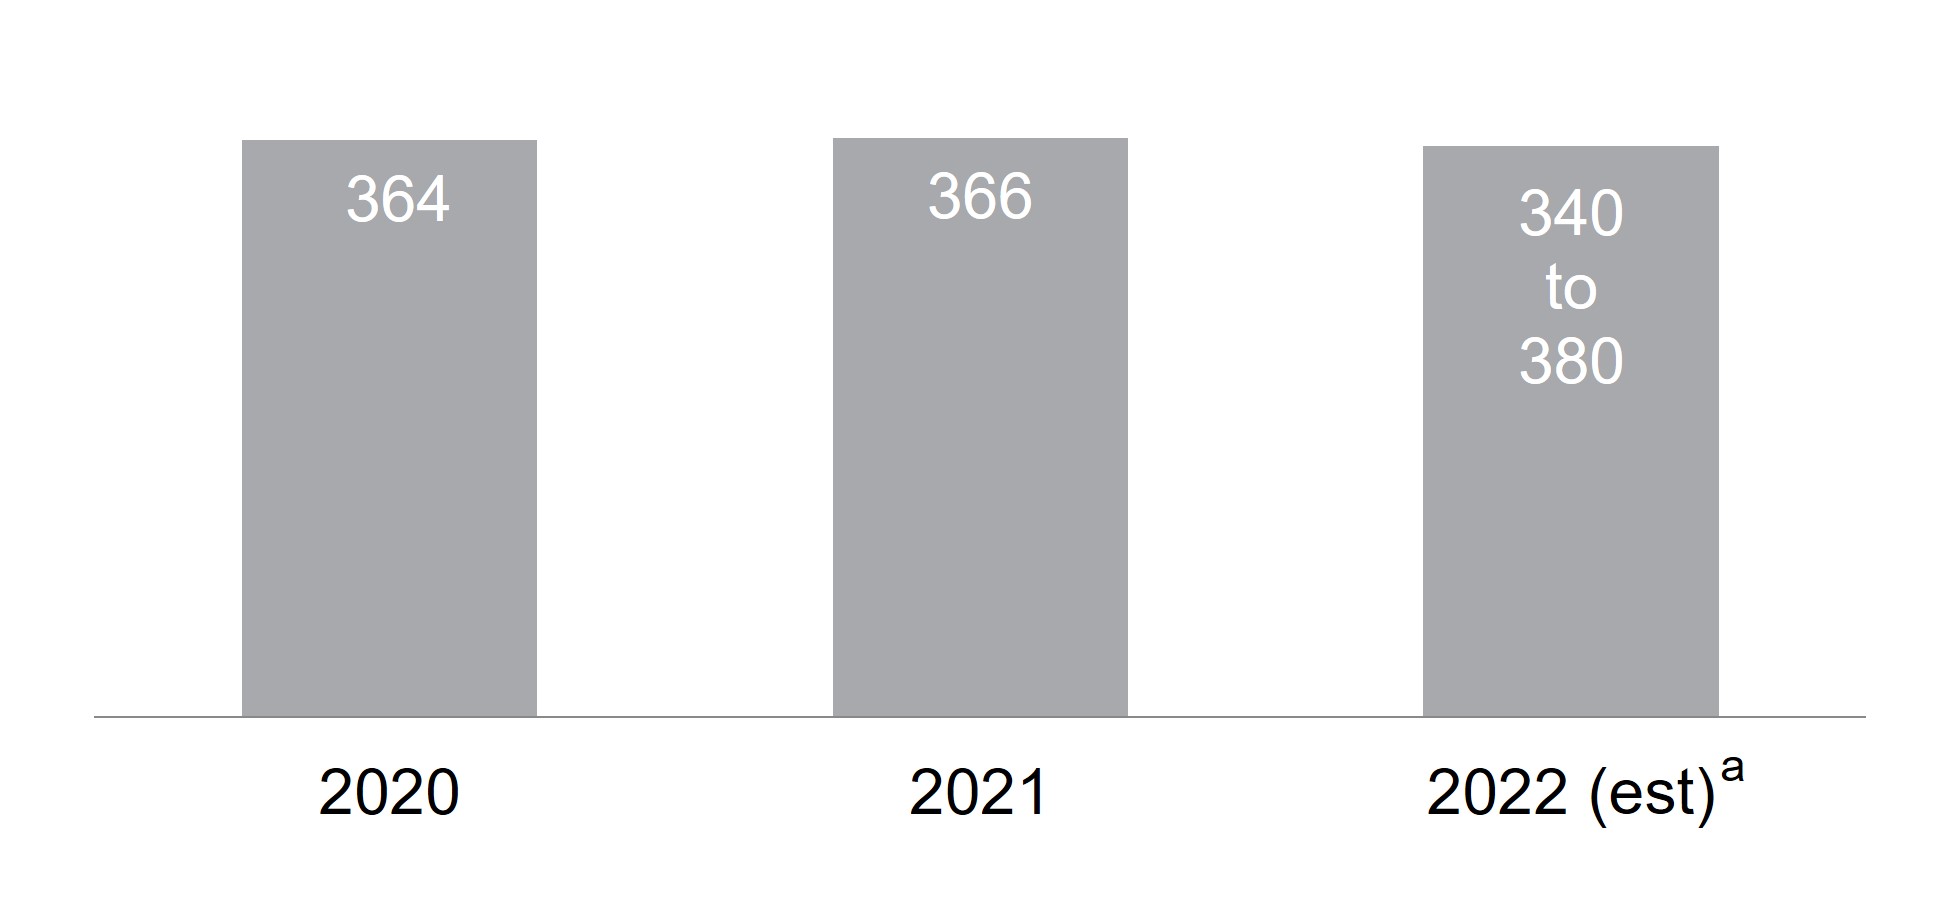
GOLD PRODUCTIONa (thousands of ounces) |
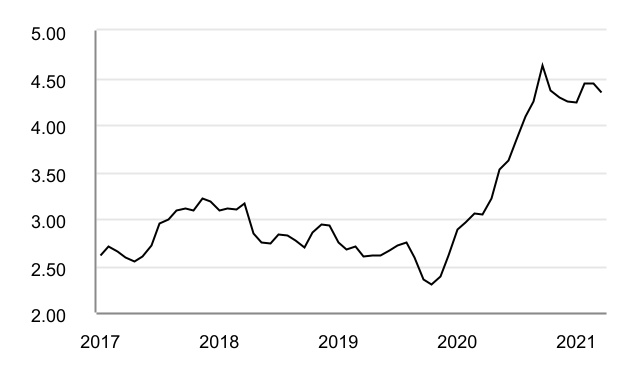
COPPER PRODUCTIONa (millions of pounds) |
|
|
|
|
|
|
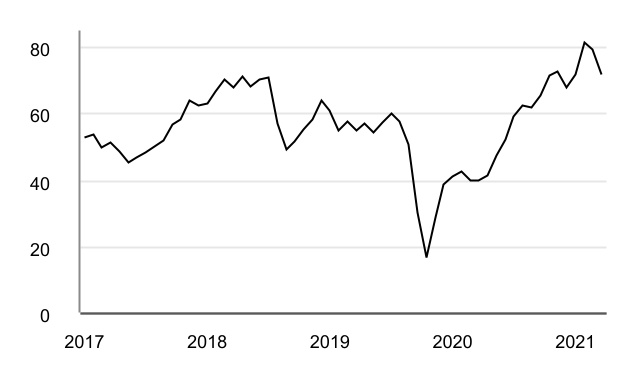
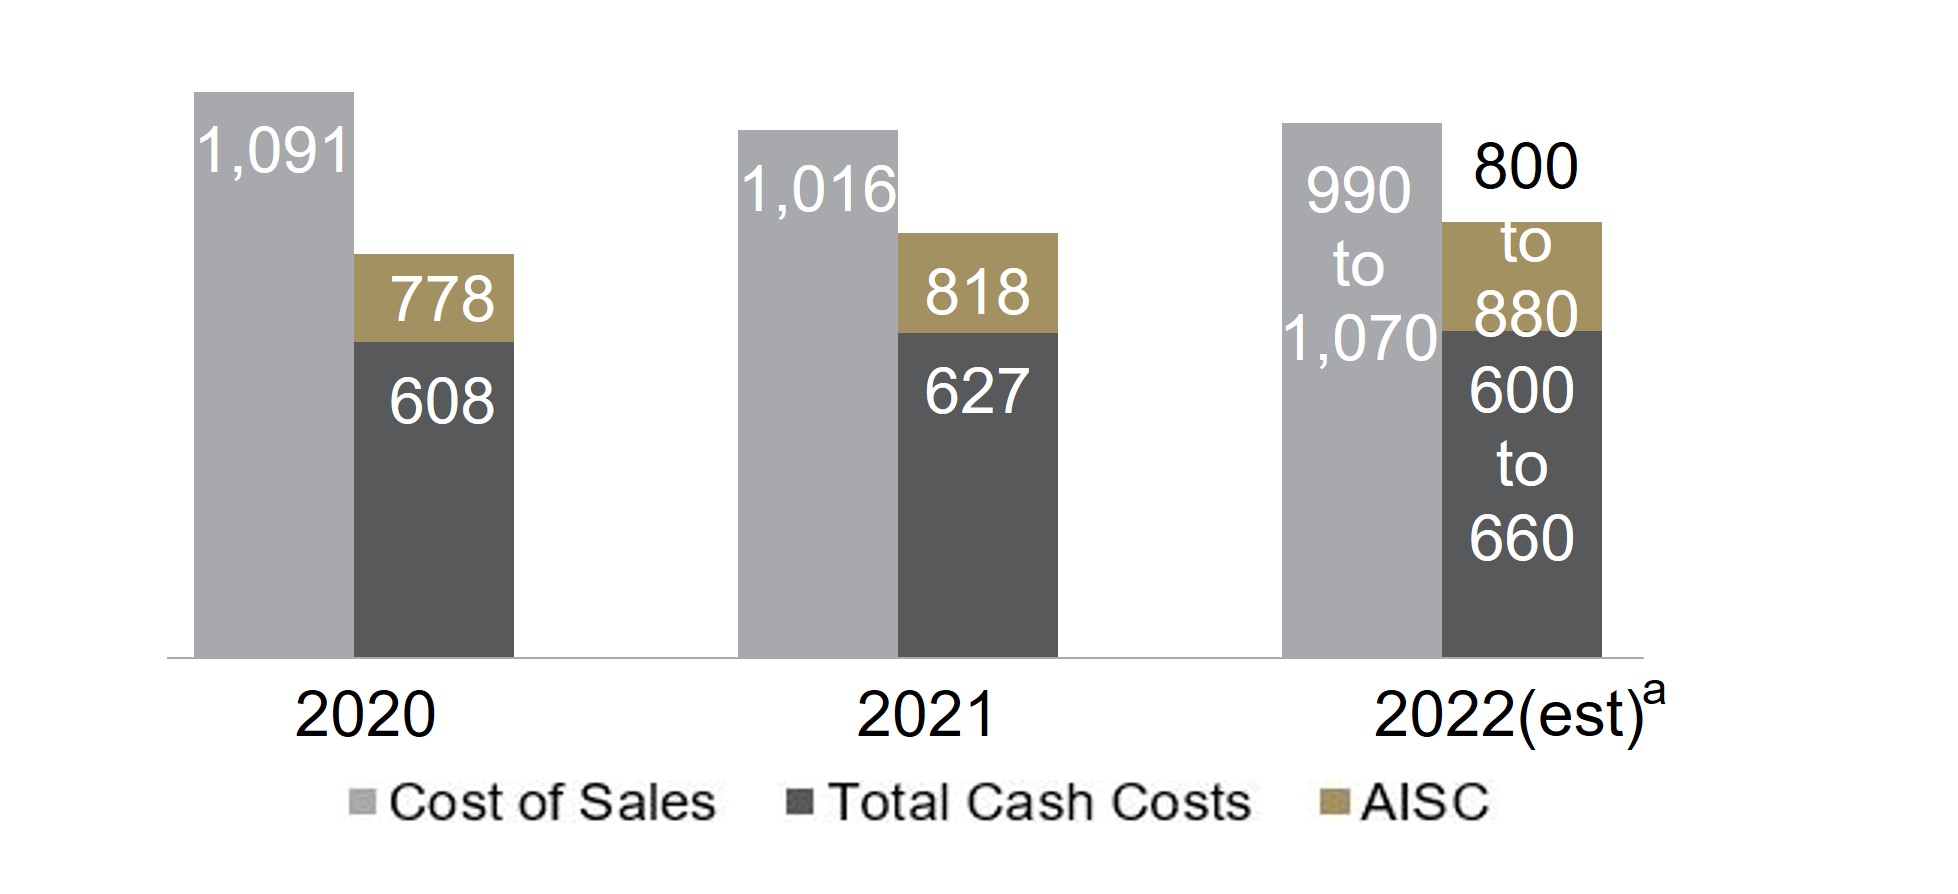
GOLD COST OF SALESc, TOTAL CASH COSTSd, |
COPPER COST OF SALESc, C1 CASH COSTSd, |
AND ALL-IN SUSTAINING COSTSd ($ per ounce) |
AND ALL-IN SUSTAINING COSTSd ($ per pound) |
|
|
|
|
|
|
ADJUSTED EBITDAd AND ADJUSTED EBITDA MARGINe |
CAPITAL EXPENDITURES ($ millions) |
|
|
|
|
|
|
OPERATING CASH FLOW AND FREE CASH FLOWd |
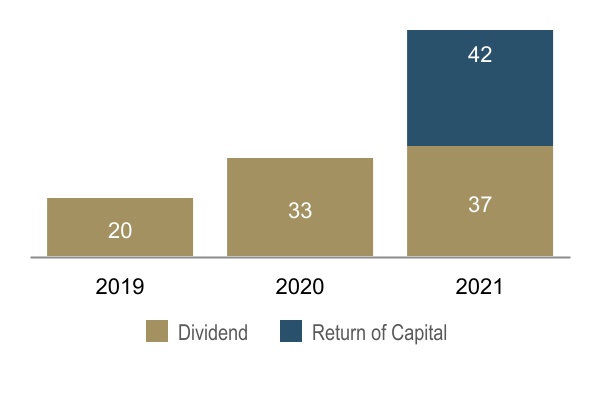
SHAREHOLDER DISTRIBUTIONSf (cents per share) |
a.On an attributable basis.
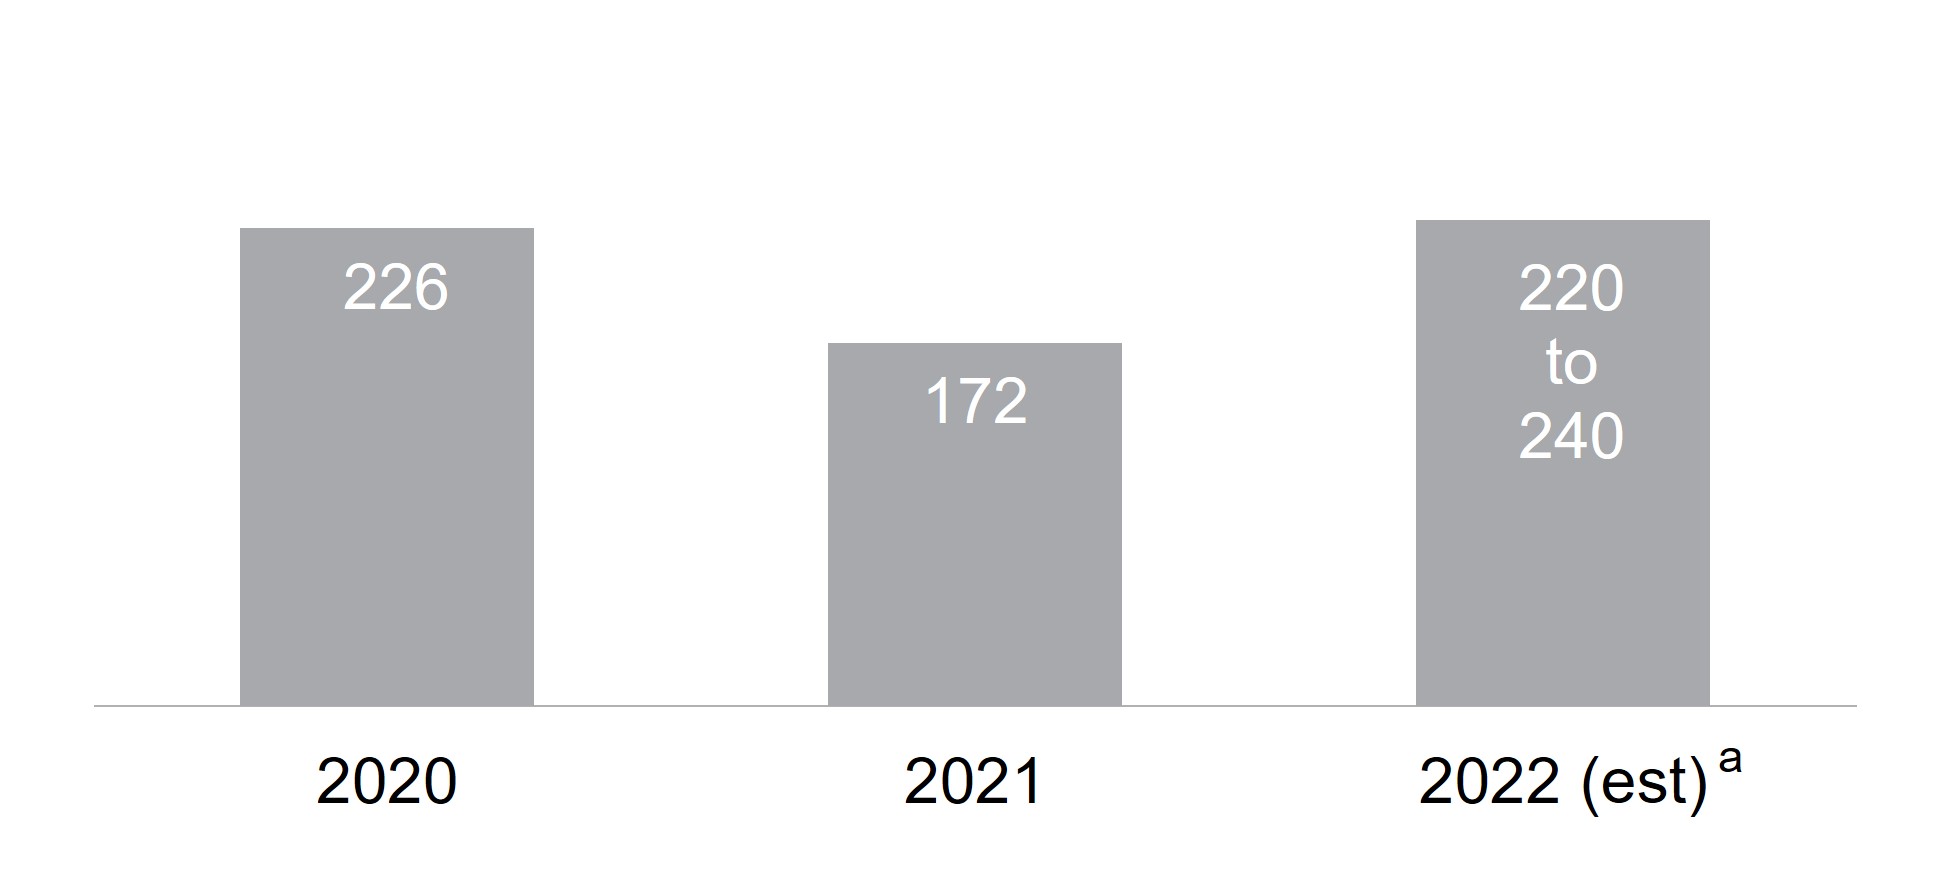
b.Based on the midpoint of the guidance range.
c.Gold cost of sales per ounce is calculated as cost of sales across our gold operations (excluding sites in closure or care and maintenance) divided by ounces sold (both on an attributable basis using Barrick’s ownership share).
d.Further information on these non-GAAP financial measures, including detailed reconciliations, is included on pages 94 to 120 of this MD&A. e.Represents adjusted EBITDA divided by revenue.
f.Dividend per share declared in respect of the stated period. Return of capital distribution was paid contemporaneously with the dividend for that period.
|
|
|
|
|
|
|
|
|
| BARRICK YEAR-END 2021 |
30 |
MANAGEMENT’S DISCUSSION AND ANALYSIS |
Factors affecting net earnings and adjusted net earnings6 - three months ended December 31, 2021 versus September 30, 2021
Net earnings attributable to equity holders of Barrick ("net earnings") for the three months ended December 31, 2021 were $726 million compared to $347 million in the prior quarter. The increase was primarily due to a $205 million gain on the sale of Lone Tree in addition to the drivers described immediately below.
After adjusting for items that are not indicative of future operating earnings, adjusted net earnings6 of $626 million for the three months ended December 31, 2021 was $207 million higher than the prior quarter. The increase in adjusted net earnings6 was mainly due to an increase in gold sales volumes and lower cost of sales per ounce/pound6. This was combined with a higher realized copper price6 of $4.63 per pound for the three months ended December 31, 2021, compared to $3.98 per pound in the prior quarter and to a lesser extent, a higher realized gold price6 of $1,793 per ounce for the three months ended December 31, 2021, compared to $1,771 per ounce in the prior quarter.
The significant adjusting item in the three months ended December 31, 2021 was $109 million ($198 million before tax and non-controlling interest) in acquisition/disposition gains, primarily resulting from the sale of Lone Tree.
Refer to page 94 for a full list of reconciling items between net earnings and adjusted net earnings6 for the current and previous periods.
Factors affecting net earnings and adjusted net earnings6 - year ended December 31, 2021 versus December 31, 2020
Net earnings for the year ended December 31, 2021 were $2,022 million compared to $2,324 million in the prior year. The decrease was primarily due to:
■a net impairment reversal of $91 million ($304 million before tax) resulting from the Framework Agreement with the Government of Tanzania (“GoT”) being signed and made effective in the first quarter of 2020 occurring in the prior year;
■a gain of $172 million ($180 million before tax and non-controlling interest) in acquisitions/dispositions, primarily resulting from the sale of Eskay Creek, Massawa, Morila and Bullfrog, occurring in the prior year;
■a gain of $104 million (no tax impact) on the remeasurement of the residual cash liability relating to our silver sale agreement with Wheaton Precious Metals (“Wheaton”), occurring in the prior year; and
■$125 million in current year significant tax expense items mainly due to deferred tax expense as a result of tax reform measures in Argentina, the foreign exchange impact on current tax expense in Peru and the remeasurement of current and deferred tax balances, the acquisition of the 40% interest in South Arturo that Nevada Gold Mines (“NGM”) did not already own, the sale of Lagunas Norte, the settlement of the Massawa Senegalese tax dispute and the recognition/derecognition of our deferred taxes in various jurisdictions compared to $119 million of prior year significant positive tax items related to deferred tax recoveries as a result of tax reform measures in Argentina and adjustments made in recognition of the net settlement of all outstanding disputes with the GoT.
These impacts were partially offset by current year positive items consisting of:
■a gain of $94 million ($213 million before tax and non-controlling interest) in acquisition/disposition gains, primarily resulting from the sale of Lone Tree; and
■an impairment reversal of $64 million ($63 million before tax and non-controlling interests), primarily resulting from the sale of our 100% interest in the Lagunas Norte mine, occurring in the current year.
After adjusting for items that are not indicative of future operating earnings, adjusted net earnings6 of $2,065 million for the year ended December 31, 2021 was $23 million higher than the prior year. The increase in adjusted net earnings6 was primarily due to a higher realized copper price6 of $4.32 per pound in 2021 compared to $2.92 per pound in the prior year and to a lesser extent, a higher realized gold price6 of $1,790 per ounce in 2021 compared to $1,778 per ounce in the prior year. These impacts were largely offset by a decrease in gold and copper sales volumes and higher cost of sales per ounce/pound7.
Refer to page 94 for a full list of reconciling items between net earnings and adjusted net earnings6 for the current and previous periods.
Factors affecting Operating Cash Flow and Free Cash Flow6 - three months ended December 31, 2021 versus September 30, 2021
In the three months ended December 31, 2021, we generated $1,387 million in operating cash flow, compared to $1,050 million in the prior quarter. The increase of $337 million was primarily due to lower cash taxes paid, combined with an increase in realized gold and copper prices6 as well as higher gold and copper sales volumes. Operating cash flow was further impacted by lower cost of sales per ounce/pound7. These impacts were partially offset by an unfavorable movement in working capital, mainly in other current assets and receivables, which was partially offset by a favorable movement in inventory.
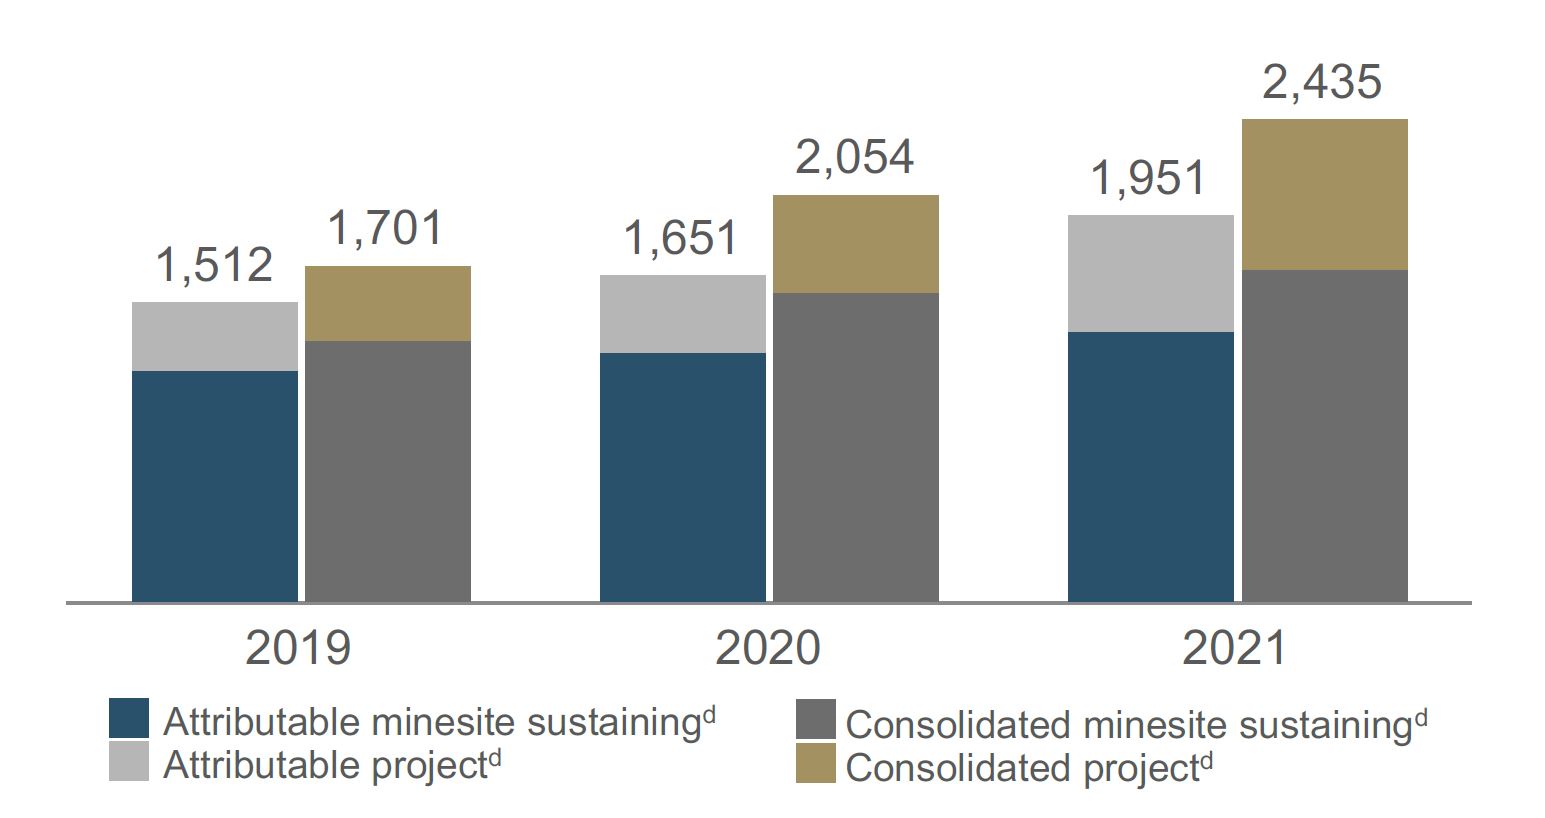
Free cash flow6 for the three months ended December 31, 2021 was $718 million, compared to $481 million in the prior quarter, reflecting higher operating cash flows, partially offset by higher capital expenditures. In the three months ended December 31, 2021, capital expenditures on a cash basis were $669 million compared to $569 million in the prior quarter due to an increase in both minesite sustaining capital expenditures6 and project capital expenditures6. The increase in minesite sustaining capital expenditures6 is primarily at Lumwana due to new mining equipment and stripping, at North Mara resulting from the initial capital spend on the restart of the open-pit mine and at Bulyanhulu, mainly related to the long-term underground fleet. Higher project capital expenditures6 is attributed to the plant expansion and mine life extension project at Pueblo Viejo, the development of the third underground mine and expansion of power capacity at Loulo-Gounkoto, and the commencement of construction for the Phase 7A leach pad at Veladero.
Factors affecting Operating Cash Flow and Free Cash Flow6 - year ended December 31, 2021 versus December 31, 2020
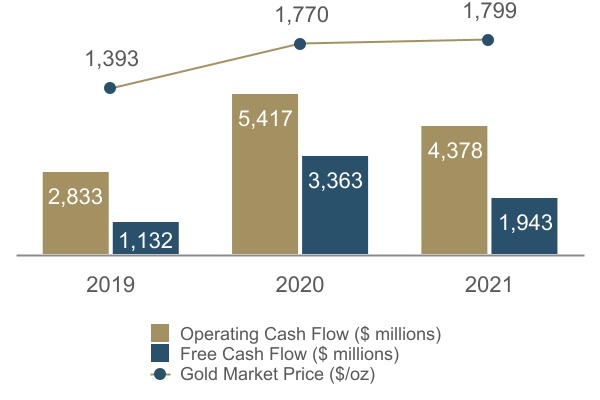
For the year ended December 31, 2021, we generated $4,378 million in operating cash flow, compared to $5,417 million in the prior year. The decrease of $1,039 million was primarily due to higher cash taxes paid, lower gold and copper sales volumes and higher cost of sales per ounce/
|
|
|
|
|
|
|
|
|
| BARRICK YEAR-END 2021 |
31 |
MANAGEMENT’S DISCUSSION AND ANALYSIS |
pound7. This was partially offset by higher realized gold and copper prices6.
For 2021, we generated free cash flow6 of $1,943 million compared to $3,363 million in the prior year. The decrease primarily reflects lower operating cash flows and higher capital expenditures. In 2021, capital expenditures on a cash basis were $2,435 million compared to $2,054 million in the prior year, mainly due to higher project capital expenditures6. The increase in project capital expenditures6 is mainly attributable to the Pueblo Viejo plant expansion and mine life extension project, as well as the development of the third underground mine and expansion of power capacity at Loulo-Gounkoto, partially offset by a decrease at Carlin due to lower cost development and exploration activities at Goldrush underground.
Environmental, Social and Governance ("ESG")
At Barrick, sustainability is entrenched in our DNA.
Our sustainability strategy has four main pillars: (1) ensuring we respect human rights; (2) protecting the health and safety of our people and local communities; (3) sharing the benefits of our operations; and (4) managing our impacts on the environment.
We implement this strategy by blending top-down accountability with bottom-up responsibility. This means we place the day-to-day ownership of sustainability, and the associated risks and opportunities, in the hands of individual sites. In the same way that each site must manage its geological, operational and technical capabilities to meet business objectives, it must also manage and identify programs, metrics, and targets that measure progress and deliver real value for the business and our stakeholders, including our host countries and local communities. The Group Sustainability Executive, supported by regional sustainability leads, provides oversight and direction over this site-level ownership, to ensure alignment with the strategic priorities of the overall business.
Governance
The bedrock of our sustainability strategy is strong governance. We established the Environmental and Social Oversight Committee ("E&S Committee") to connect site-level ownership of our sustainability strategy with the leadership of the Group. It is chaired by the President and Chief Executive Officer and includes: (1) regional Chief Operating Officers; (2) minesite General Managers; (3) Health, Safety, Environment and Closure Leads; (4) the Group Sustainability Executive; (5) in-house legal counsel; and (6) an independent sustainability consultant in an advisory role. The E&S Committee meets on a quarterly basis to review our performance across a range of key performance indicators, and to provide independent oversight and review of sustainability management.
The President and Chief Executive Officer reviews the reports of the E&S Committee with the Board's Environmental, Social, Governance & Nominating Committee (“ESG & Nominating Committee”), formerly known as the Corporate Governance & Nominating Committee. The change to this Committee's name was approved by the Board on February 15, 2022, to better reflect the critical role this Committee plays in overseeing Barrick's sustainability performance. The reports are reviewed to ensure the implementation of our sustainability policies and drive performance of our environmental, health and safety, corporate social responsibility, and human rights programs.
This is supplemented by weekly meetings, at a minimum, between the Regional Sustainability Leads and the Group Sustainability Executive. These meetings examine the sustainability-related risks and opportunities facing the business in real time, as well as the progress and issues integrated into weekly Executive Committee review meetings.
Sustainability is a fundamental business priority for the company and this was reflected in the S&P Global Corporate Sustainability Assessment as Barrick retained its listing in the prestigious Dow Jones Sustainability Index’s (“DJSI”) World Index, ranking in the 95th percentile of all mining companies assessed.
This is the 14th consecutive year Barrick has been listed in the DJSI World Index, in which 2,500 companies are evaluated against governance, social performance, environmental management and economic contribution factors to identify the top 10 percent or “best in class” performers in every industry. The DJSI World Index is the longest-running global sustainability benchmark worldwide and has become the key reference point in sustainability investment.
Our strong performance was demonstrated by scoring full marks (100th percentile) in the categories of environmental reporting, water-related risks, social reporting and human rights, and improved scores in policy influence, operational eco-efficiency, biodiversity and occupational health and safety.
This performance reinforces our sustainability strategy, policies, procedures and management and is reflected in some of our performance metrics through the year, with a trend of continued performance improvement since the merger of Barrick and Randgold Resources (the “Merger”).
Throughout the year, we have been tracking our progress against our Sustainability Scorecard, which we introduced as part of our 2019 Sustainability Report. Our motivation for developing the scorecard was to both transparently disclose to external stakeholders what we viewed as the most important ESG metrics in the industry and our performance against them, while also driving internal improvement at a regional and site level.
Our performance on the scorecard accounts for 25% of the long-term incentive awards for senior leaders in 2021 as part of the Barrick Partnership Plan. Overall, we have improved our score and were it not for the tragic fatalities late in the year we would have seen an increase in our grade to A. We, however, have a zero tolerance for fatalities and as a result remain at a B grade, unchanged from 2020 (on a scale where A represents top performance and E represents bottom performance). As we strive for continued performance, the 2022 Sustainability Scorecard targets and metrics will be updated.
In late 2021 and early 2022, we actively sought feedback by reaching out to a number of our largest shareholders owning over 30% of our issued and outstanding common shares (as of December 31, 2021). Our Lead Director and the Chair of the Compensation Committee participated in these discussions which covered a variety of topics, including our performance, sustainability strategy, environmental goals, human capital strategy, continued active oversight during the Covid-19 pandemic, and executive compensation matters, as well as key governance priorities, including Board composition and renewal. The meetings were an instructive two-way discussion where we heard about our shareholders’ priorities, discussed Barrick’s sustainability vision and provided an opportunity for our performance to be constructively challenged. Sustainability-related topics and
|
|
|
|
|
|
|
|
|
| BARRICK YEAR-END 2021 |
32 |
MANAGEMENT’S DISCUSSION AND ANALYSIS |
key areas of concern are shared and provided as part of our annual ESG materiality assessment.
Human rights
In December 2021, coinciding with the United Nations International Human Rights Day, we published our first, post-Merger, Human Rights Report. This report details how we embed our human rights policy throughout the organization and our commitment to respect human rights at every site. We have zero tolerance for human rights violations wherever we operate. We avoid causing or contributing to human rights violations and facilitate access to remedies.
The report follows the United Nations Guiding Principles (“UNGP”) Reporting Framework and described some of the challenges faced and lessons learned as we work to continually improve our human rights performance.
Our commitment to respect human rights is fulfilled on the ground via our Human Rights Program, the fundamental principles of which include: monitoring and reporting, due diligence, training, and disciplinary action and remedy.
We continue to provide security and human rights training to security forces across our sites. In the first quarter of 2022, we will publish our annual Voluntary Principles on Security and Human Rights Plenary Report, which will include a full detailed report as part of a three-year reporting cycle.
Safety
We are committed to the safety, health and well-being of our people, their families and the communities in which we operate. Our safety vision is “Every person going home safe and healthy every day.”
To achieve this, we continue to implement our “Journey to Zero Harm” initiative. This is focused on engagement with our workforce through Visible Felt Leadership, and by aligning and improving our standards across the Group, ensuring accountability to our safety commitments, and ensuring our employees are fit for duty.
We report our safety performance quarterly as both part of our E&S Committee meetings and to the Board's ESG & Nominating Committee. Our safety performance is a regular standing agenda item on our weekly Executive Committee review meeting.
We achieved our target to certify all operational sites to the internationally recognized ISO 45001 standard by the end of 2021.
Safety key performance indicators for the fourth quarter of 2021 include our Lost Time Injury Frequency Rate ("LTIFR")8 at 0.42 and our Total Recordable Injury Frequency Rate ("TRIFR")8 at 1.57. Our annual indicators for 2021 was LTIFR at 0.38, a 12% increase from 2020, and TRIFR at 1.47, which was an improvement of 13% from 2020.
The indicator that is the most meaningful, however, is the two fatalities we had in 2021. The first was on July 14, 2021, when an incident occurred at Hemlo which resulted in the tragic fatality of an employee from our underground mining contractor. The second was on September 1, 2021, when an incident at Tongon resulted in the tragic fatality of a drilling contractor. Unfortunately, we also had an incident on January 17, 2022 at North Mara, which resulted in a fatality of a contractor. A full investigation into the cause of the fatality is ongoing.
We have held numerous regional and group workshops to strategize and improve our safety approach and action plans. One such initiative to improve safety is its consideration as part of the recruitment and retention
process. Safety starts with our people and their behavior, and this means ensuring we attract people who live and demonstrate safe behavior and do not compromise on safety standards.
We continue to focus on safeguarding our employees and operations from Covid-19. Strict Covid-19 screening and prevention measures remain in place at our mine gates, including ‘test to enter’ policies at some higher risk operations. We have undertaken extensive vaccination awareness campaigns to encourage uptake of the vaccines by our employees. To date, approximately 59% of our employees are fully vaccinated, and a further 8% are partially vaccinated.
Social
We regard our host communities and countries as important partners in our business. Our sustainability policies commit us to transparency in our relationships with host communities, government authorities, the public and other key stakeholders. Through these policies, we commit to conducting our business with integrity and with absolute opposition to corruption. We require our suppliers to operate ethically and responsibly as a condition of doing business with us.
Community and economic development
Our commitment to social and economic development is set out in our overarching Sustainable Development and Social Performance policies. The approach is encapsulated in three concepts:
Paying our fair share of taxes: the taxes, royalties and dividends we pay provide significant income for our host countries and help fund vital services and infrastructure. We report all government and tax payments transparently, primarily through the reporting mechanism of the Canadian Extractive Sector Transparency Measures Act (“ESTMA”). In addition, we plan to publish our first annual tax contribution report in April 2022 covering the 2021 year, which will highlight our overall contribution to our host countries. Our comprehensive tax policy covers governance, tax risk management, tax planning principles, compliance, relationships with tax authorities as well as transparency and disclosure.
Prioritizing local hiring and buying: the employment opportunities created by our presence in a community is one of our largest social and economic contributions to our host communities and countries. Our aim is to maximize this contribution. We work to identify and nurture local talent at every level of our business through a range of skills and formal training. We also strive to maximize the value that stays in our communities and countries of operation through procurement processes that prioritize local companies, followed by those from the larger region or host country.
Investing in community-led development initiatives: we believe that no one knows the needs of local communities better than the communities themselves. We have community development committees (“CDCs”) established at every operating site. The role of the CDC is to allocate the community investment budget to those projects and initiatives most needed and desired by local stakeholders. Each CDC is elected and made up of a mix of local leaders, community members, as well as representatives from local women and youth groups.
For 2021, we invested approximately $26.5 million in local community development projects. Some community initiatives include the following:
■At NGM, a Cultural Awareness video was created in partnership with the local Tribes to better
|
|
|
|
|
|
|
|
|
| BARRICK YEAR-END 2021 |
33 |
MANAGEMENT’S DISCUSSION AND ANALYSIS |
educate the workforce on cultural awareness. This video was a request from Tribal Leaders in our partnering communities due to the mine sites being located on or around traditionally inhabited lands of the Western Shoshone, Northern Paiute, and Goshute people. The video will be used to train NGM's entire workforce on an annual basis.
■At Veladero, seven water treatment plants were commissioned in Bella Vista and Villa Iglesia to provide potable water for the communities. Beneficiaries include over 7,000 people from Iglesia.
■At Loulo-Gounkoto, we undertook a socioeconomic study and validation workshop to understand community needs and identify major projects for development. Outputs will be used to issue a 5-year development plan for Kenieba.
Environment
Being responsible stewards of the environment is the third pillar of our sustainability strategy. Environmental matters such as how we use water, prevent incidents, manage tailings, respond to a changing climate, and protection of biodiversity are key focuses.
We maintained our strong track record of stewardship and did not record any Class 19 environmental incidents throughout 2021.
Climate Change
The Board’s ESG & Nominating Committee is responsible for overseeing Barrick’s policies, programs and performance relating to the environment, including climate change. The Audit & Risk Committee assists the Board in overseeing the Group’s management of enterprise risks as well as the implementation of policies and standards for monitoring and mitigating such risks. Climate change is built into our formal risk management process, outputs of which are regularly reviewed by the Audit & Risk Committee.
Barrick’s climate change strategy has three pillars: (1) identify, understand and mitigate the risks associated with climate change; (2) measure and reduce our impacts on climate change; and (3) improve our disclosure on climate change. Our climate disclosure is based on the recommendations of the Task Force for Climate-related Financial Disclosures ("TCFD").
We are also acutely aware of the impacts that climate change has on our host communities and countries, particularly developing nations who are often most vulnerable. As the world economy transitions to renewable power, it is imperative that developing nations are not left behind. As a responsible business, we have focused our efforts on building resilience in our host communities and countries, just as we do for our business.
Identify, understand and mitigate the risks associated with climate change
We identify and manage risks, build resilience to climate change, as well as position ourselves for new opportunities. Climate change-related factors continue to be incorporated into our formal risk assessment process. We have identified several climate-related risks and opportunities for our business including: physical impacts of climate change; an increase in regulations that seek to address climate change; and an increase in global investment in innovation and low-carbon technologies. The risk assessment process includes scenario analysis, which is being rolled out to all sites with an initial focus on our Tier One Gold Assets1, to assess site-specific climate related risks and opportunities.
Measure and reduce the Group’s impact on climate change
Mining is an energy-intensive business, and we understand the important link between energy use and greenhouse gas (“GHG”) emissions. By measuring and effectively managing our energy use, we can reduce our GHG emissions, achieve more efficient production, and reduce our costs.
We have climate champions at each site that are tasked with identifying roadmaps and assessing feasibility for our GHG emissions reductions and carbon offsets for hard-to-abate emissions. Any carbon offsets that we pursue must have appropriate socioeconomic and/or biodiversity benefits. We have published an achievable emissions reduction roadmap and continue to assess further reduction opportunities across our operations.
Improve our disclosure on climate change
As part of our commitment to improve our disclosure on climate change, we complete the annual CDP (formerly known as the Carbon Disclosure Project) Climate Change and Water Security questionnaires. This ensures our investor-relevant water use, emissions and climate data is widely available.
Our CDP scores were positive and although we maintained our B score for Water Security, we improved our Climate Change score a full grade from a C in 2020 to B in 2021. We are also pleased to score as industry leaders for several indicators. For Climate Change, we scored as industry leaders for Governance, Emission Reduction Initiatives, as well as Scope 1 & 2 Emissions. Similarly we achieved industry leader scores in Water-Related Opportunities, Integrated Approach to Environmental Challenges and Business Impacts for Water Security.
Emissions
As detailed in our 2020 Sustainability Report, Barrick’s GHG emissions reduction target is for a minimum 30% reduction by 2030, while maintaining a steady production profile. The basis of this reduction is against a 2018 baseline of 7,541 kt CO2-e.
Our emissions reduction target is grounded in climate science and has a detailed pathway for achievement. Our target is not static and will be updated as we continue to identify and implement new GHG reduction opportunities.
Ultimately, our vision is net zero GHG emissions by 2050, achieved primarily through GHG reductions, with some offsets for hard-to-abate emissions. Site-level plans to improve energy efficiency, integrate clean and renewable energy sources and reduce GHG emissions will also be strengthened, and we plan to supplement our corporate emissions reduction target with context-based site-specific emissions reduction targets.
Our GHG emissions for 2021 were 7,096kt CO2-e10 (Scope 1 and Scope 2: Market-Based), representing a 5.9% reduction from our 2018 baseline. The reduction in our market-based emissions are due to the extensive effort by Nevada Gold Mines to implement Power Purchase Agreements that prioritize renewable energy and maximize power usage from our own power plants.
Water
Water is a vital and increasingly scarce global resource. Managing and using water responsibly is one of the most critical parts of our sustainability strategy. Our commitment to responsible water use is codified in our Environmental Policy. Steady, reliable access to water is critical to the effective operation of our mines. Access to water is also a fundamental human right.
|
|
|
|
|
|
|
|
|
| BARRICK YEAR-END 2021 |
34 |
MANAGEMENT’S DISCUSSION AND ANALYSIS |
In 2021, we reviewed our definition of water stress against global reporting, disclosure frameworks and tools which helped define our operations that are exposed or potentially exposed to water stress, either in terms of water scarcity or surplus water. Understanding the water stress in the regions we operate enables us to better understand the risks and manage our water resources through site-specific water balances, based on the International Council on Mining and Metals’ (“ICMM”) Water Accounting Framework, aimed at minimizing our water withdrawal and maximizing water reuse and recycling within our operations.
We include each mine’s water risks in its operational risk register. These risks are then aggregated and incorporated into the corporate risk register. Our identified water-related risks include: (1) managing excess water in regions with high rainfall; (2) maintaining access to water in arid areas and regions prone to water scarcity; and (3) regulatory risks related to permitting limits as well as municipal and national regulations for water use.
We are pleased that our 2021 water recycling and reuse rate of 83% was above our annual target of 80%.
Tailings
We are committed to ensuring our tailings storage facilities ("TSFs") meet global best practices for safety. Our TSFs are carefully engineered and regularly inspected, particularly those in regions with high rainfall and seismic events.
We continue to progress our compliance to the Global Industry Standard for Tailings Management ("GISTM"), and have completed the consequence classification for a majority of sites. Sites are currently working to complete a gap assessment against the GISTM using the Conformance Protocols developed by the ICMM.
Since we assumed operating control of the mines previously managed by Acacia Mining plc (“Acacia”) in 2019, a critical project has been the corrective management and responsible operations of the North Mara TSF. At the time we assumed operational control, the TSF had 7.5 million cubic meters of water and was operating well above its design capacity; an Environmental Protection Order had been issued to Acacia by the authorities to close the TSF. To safely reopen the TSF, one of the commitments agreed between Barrick and the Government of Tanzania was to reduce the water in the TSF to below 800,000 cubic meters by the end of 2021. After an exceptional team effort, approximately $60 million in capital investment for water treatment, as well as extensive studies, we achieved the target ahead of schedule.
Biodiversity
Biodiversity underpins many of the ecosystem services on which our mines and their surrounding communities depend. If improperly managed, mining and exploration activities have the potential to negatively affect biodiversity and ecosystem services. We work to proactively manage our impact on biodiversity and strive to protect the ecosystems in which we operate. Wherever possible, we aim to achieve a net neutral biodiversity impact, particularly for ecologically sensitive environments.
We established a target to develop Biodiversity Action Plans (“BAPs”) for all our operational sites by the end of 2021. We achieved this target and are in the process of implementing these BAPs, which outline our strategy to achieve net-neutral impacts and associated management plans. In 2021, we disclosed our first CDP questionnaire for forests, which incorporates biodiversity disclosures. Although the CDP forests questionnaires are not yet scored for the metals and mining industry, we feel biodiversity
disclosures are imperative for the industry and are currently under-reported.
We have made progress in developing conservation and offset projects, including sagebrush and mule habitats in Nevada, forestry conservation in Zambia and establishing a partnership at the Fina Reserve in Mali.
Reserves and Resources11
For full details of our mineral reserves and mineral resources, refer to page 129 of the Fourth Quarter 2021 Report.
Gold Reserves
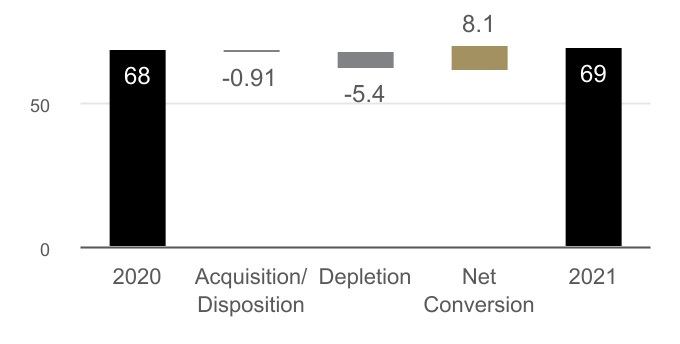
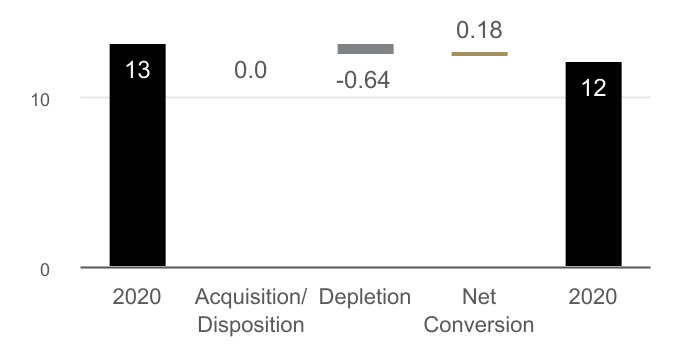
Barrick’s 2021 mineral reserves are estimated using a gold price assumption of $1,200 per ounce and are reported to a rounding standard of two significant digits, both unchanged from 2020. As of December 31, 2021, Barrick’s proven and probable gold reserves were 69 million ounces12 at an average grade of 1.71 g/t, compared to 68 million ounces13 at an average grade of 1.66 g/t in 2020. Year-over-year, grade has increased by approximately 3%, while reserves have increased by approximately 1.5%. Notably, this year-over-year change incorporates the net removal of 0.91 million ounces from mineral reserves, due to the expected change in our equity interest in Porgera from 47.5% to 24.5%, partially offset by the net impact of the asset exchange of Lone Tree to i-80 Gold for the remaining 40% of South Arturo that NGM did not already own. Excluding the impact of these changes, reserve replacement was 150% of depletion. Similarly, when adjusting for the above ownership changes, the net increase in reserves year-over-year is approximately 3%.
Mineral reserve growth, net of depletion, was achieved at three of Barrick’s Tier One Gold Assets1 - Kibali, Cortez and Turquoise Ridge - while Bulyanhulu, North Mara, and Phoenix also all achieved this milestone. This further moves the Bulyanhulu and North Mara mines closer to potential Tier One status as a combined complex, while the Covid-19 pandemic continued to impact drilling activities at Veladero. Our core focus on geological modeling is delivering results with year-over-year mineral reserves growing, net of depletion.
During 2021, the Company converted a net of 8.1 million ounces to attributable proven and probable reserves. Compared to mining depletion of 5.4 million ounces, this represents an impressive 150% replacement of ounces.
The Africa & Middle East region converted a net of 3.1 million ounces to attributable proven and probable reserves, before depletion, with contributions from Loulo-Gounkoto, Kibali, North Mara, Bulyanhulu and Tongon. At Loulo-Gounkoto, this was principally from extensions at the Yalea, Gara and Gounkoto underground mines. At Kibali, this was driven by the addition and expansion of multiple open pits, together with the Karagba, Chauffeur and Durba (“KCD”) underground extensions of the 3,000 and 9,000 lodes. Given the year-over-year growth from the open pits, the average grade of proven and probable mineral reserves at Kibali has decreased from 3.84 g/t to 3.60 g/t. However, this growth continues to support a balanced and flexible underground and open-pit feed blend. We have now achieved a similar optimized and balanced life of mine profile at North Mara, with conversions in 2021 driven by extensions to the Gokona, Gena and Rama pits.
The North America region converted a net of 5.3 million ounces to attributable proven and probable reserves, primarily from Cortez and Turquoise Ridge, before depletion. At Cortez, the increase in reserves was driven by the completion of the Goldrush Underground feasibility study, while additions at Turquoise Ridge were driven by
|
|
|
|
|
|
|
|
|
| BARRICK YEAR-END 2021 |
35 |
MANAGEMENT’S DISCUSSION AND ANALYSIS |
improvements to geological models. The core focus on improving geological models is a key contributor to mineral resource and reserve growth at Nevada Gold Mines.
In the Latin America & Asia Pacific region, there was a net reduction of 0.3 million ounces before depletion in 2021, mainly as the drilling required to convert resources into reserves was unable to be completed due to the impact of Covid-19 at Veladero. The potential for reserve conversion remains at Pueblo Viejo, where a significant indicated resource base requires the completion of a tailings expansion study to support the potential conversion to reserves. For further information on the Pueblo Viejo Plant Expansion and Mine Life Extension Project, please refer to the Growth Project Updates section of this MD&A.
ATTRIBUTABLE CONTAINED GOLD RESERVES12,13,a (Moz)
a Figures rounded to two significant digits.
Gold Resources
In 2021, all mineral resources were estimated using a gold price assumption of $1,500 per ounce, unchanged from 2020. Barrick’s mineral resources for 2021 continue to be reported on an inclusive basis, incorporating all areas that form mineral reserves. All open-pit mineral resources are contained within a Whittle shell, while all underground mineral resources are contained within optimized mining shapes. Excluding the impact of the expected change in equity interest at Porgera, the disposal of Lagunas Norte, and the South Arturo asset exchange with i-80 Gold, Barrick’s total attributable mineral resources grew in 2021 by an impressive 126%, net of depletion. This growth in total mineral resources stems from a combination of our increased confidence in our geological models as well as a more integrated approach to our mine planning, resulting in improved optimizations that ultimately support increased mineral resource conversion. In particular, this is reflected in both the open pit and underground interface studies of the Gokona deposit at North Mara, and the extension of the Deep West zone at Bulyanhulu and across our portfolio at Nevada Gold Mines. This integrated planning approach continues to gather momentum.
Growth in total attributable mineral resources for North America, net of depletion, was encouraging. At Carlin, optimized pit shells at both Gold Quarry and South Arturo delivered year-over-year total open-pit resource growth at consistent grades. Notably at Gold Quarry, the mineral resource estimates were further optimized based on process routing options only made possible with the multiple processing facilities available following the formation of NGM. Within Leeville at Carlin, drilling at Turf and West Leeville, along with improved mine designs, delivered total mineral resource growth, net of depletion. Drilling at the Ren and North Leeville underground projects delivered maiden additions to the resource base, and are expected to be growth areas for Carlin into the future with mineralization open in all directions. At Cortez, total mineral
resource growth was principally driven by the Robertson open pit and to a lesser extent, updated geological modeling and mine design improvements at Goldrush, Crossroads and Cortez Hills Underground. A portion of inferred resources were upgraded to the indicated category at Robertson which, together with year-over-year total mineral resource growth, supports our plan for the deposit to contribute meaningfully to Cortez’s production profile starting in 2025.
Challenging operating environments throughout Latin America due to the Covid-19 pandemic impacted drilling activities in 2021. However, we continued our focus on geological and metallurgical studies to grow our understanding of Veladero, Pascua-Lama and Alturas-Del Carmen over the course of the year.
Barrick’s resources are reported to a rounding standard of two significant digits, unchanged from 2020. As of December 31, 2021, Barrick’s attributable measured and indicated resources were 160 million ounces12 at an average grade of 1.50 g/t Au. This compares to measured and indicated resources of 160 million ounces13 at an average grade of 1.52 g/t Au in 2020. As of December 31, 2021, Barrick’s attributable inferred resources were 42 million ounces12 at an average grade of 1.3 g/t Au. This compares to inferred resources in 2020 of 43 million ounces13 at an average grade of 1.4 g/t Au.
Copper
Copper mineral reserves for 2021 are estimated using a copper price of $2.75 per pound and mineral resources are estimated at $3.50 per pound, both unchanged from 2020. Copper reserves and resources for 2021 are reported to a rounding standard of two significant digits, also unchanged from 2020.
As of December 31, 2021, attributable proven and probable copper mineral reserves were 12 billion pounds12 at an average grade of 0.38%. This compares to 13 billion pounds13 at an average grade of 0.39% in the prior year.
Attributable measured and indicated copper mineral resources were 24 billion pounds12 at an average grade of 0.35%, and inferred copper mineral resources were 2.1 billion pounds12 at an average grade of 0.2% as of December 31, 2021. This compares to prior year attributable measured and indicated copper mineral resources of 25 billion pounds12 at an average grade of 0.36%, and inferred copper mineral resources of 2.2 billion pounds13 at an average grade of 0.2%.
2021 mineral reserves and mineral resources are estimated using the combined value of gold, copper and silver. Accordingly, mineral reserves and mineral resources are reported for all assets where copper or silver is produced and sold as a primary product or a by-product.
ATTRIBUTABLE CONTAINED COPPER RESERVES12,13,a (Blb)
a Figures rounded to two significant digits.
|
|
|
|
|
|
|
|
|
| BARRICK YEAR-END 2021 |
36 |
MANAGEMENT’S DISCUSSION AND ANALYSIS |
Key Business Developments
2021 Highlights
■Gold and copper production achieves guidance for third consecutive year with the Africa & Middle East and Latin America & Asia Pacific regions at the top end of guidance;
■Record $1.4 billion in total cash returns paid to shareholders in 2021, inclusive of a $750 million return of capital distribution;
■Announcement of performance dividend policy and share buyback program for up to $1.0 billion starting in 2022, further demonstrates our strong commitment to return surplus funds to shareholders;
■Disciplined operational execution in achieving production guidance highlights benefit and flexibility of six Tier One Gold Assets1, notwithstanding a mechanical mill failure at Carlin;
■Our decentralized and agile management structure mitigated the flow-through challenges created by the Covid-19 pandemic such as supply chain pressures and tighter labor markets;
■Kibali paid a total of $200 million in dividends over the course of the second half of 2021, providing a mechanism for repatriation of cash from the Democratic Republic of Congo;
■Further optimization and simplification of the North America portfolio with the successful asset exchange of Lone Tree to i-80 Gold Corp. for the remaining 40% of South Arturo that Nevada Gold Mines did not already own
■Successfully completed the sale of Lagunas Norte as well as the sale or option of seven legacy closure properties over the past 18 months, in line with our strategy of divesting non-core assets and portfolio optimization
■Achieved zero debt, net of cash at the end of 2021 for the second straight year-end, notwithstanding record cash returns to shareholders during the year of $1.4 billion
■Further ounces added to our 10-year production outlook, highlighting the quality of our portfolio and ability to generate strong cash flow well into the future;
■Attributable gold reserves replaced 150% of depletion, before acquisition and equity changes related to South Arturo and Porgera, at a higher grade;
■Future reserve replacement and 10-year production outlook reinforced by a robust pipeline of advanced exploration targets;
■Generative work drives a newly invigorated exploration team into under-explored and prospective new frontiers;
■Reinforced our industry-leading approach to ESG by further enhancement to our Sustainability Scorecard, designed to ensure transparent reporting that aligns key performance indicators against strategic priorities; and
■Completed the implementation of SAP at our operations throughout the Americas and Africa, which has allowed us to significantly simplify our systems landscape by decommissioning several legacy Enterprise Resource Planning (ERP) platforms.
Covid-19 pandemic
Barrick continues to work closely with our local communities on managing the impacts of the Covid-19 pandemic on our people and business. Barrick has a strong culture of caring for the welfare of its employees and communities. Our well-established prevention practices and procedures, as well as the experience we gained in past years from managing two Ebola outbreaks around our African operations, has assisted us with managing this unprecedented challenge. We continue to work actively in supporting government
responses to the Covid-19 pandemic including vaccination programs, financial assistance as well as using our supply chain to secure key supplies for the benefit of the communities in which we operate.
Our preference for employing local nationals where we operate rather than expatriates, means that we are not dependent upon a workforce traveling to site on a regular basis from other parts of the globe. We continue to enforce certain operating procedures to respond to Covid-19, and to date, our operations have not been significantly impacted by the pandemic with the exception of Veladero, where the commissioning of the Phase 6 leach pad was delayed to the second quarter of 2021 following movement restrictions implemented by the government of Argentina during the construction phase. Hemlo also experienced a slower ramp-up of underground development in 2021 due to Covid-19 movement restrictions which impacted production.
Our ongoing vigilance around social distancing, screening and contact tracing has allowed our sites to continue to produce and sell their production as well as keep our people and local communities safe at the same time. These actions have minimized the impacts of the pandemic at our operations and facilitated the continued delivery of strong operating cash flow since the onset of the pandemic.
We believe that our focus on strengthening our balance sheet in recent years has given us the financial flexibility to endure any short-term impacts to our operations, affording us the opportunity to participate in our industry's inevitable consolidation. We have $5.3 billion in cash, an undrawn $3.0 billion credit facility and no significant debt repayments due until 2033, providing us with sufficient liquidity to execute on our strategic goals.
Although the global rollout of vaccination programs is progressing, we recognize the situation remains dynamic. We continue to monitor developments around the world and believe we have positioned Barrick as best we can to weather the storm and take advantage of any value opportunities should they present themselves.
Performance Dividend Policy
At the February 15, 2022 meeting, the Board of Directors approved a performance dividend policy that will enhance the return to shareholders when the Company’s liquidity is strong. In addition to our base dividend, the amount of the performance dividend on a quarterly basis will be based on the amount of cash, net of debt, on our consolidated balance sheet at the end of each quarter as per the schedule below. This performance dividend calculation will commence after our March 31, 2022 consolidated balance sheet, with a potential payment in the second quarter of the year.
|
|
|
|
|
|
|
|
|
|
|
|
|
|
|
| Performance Dividend Level |
Threshold Level |
Quarterly Base Dividend |
Quarterly Performance Dividend |
Quarterly Total Dividend |
| Level I |
Net cash <$0 |
$0.10
per share |
$0.00
per share |
$0.10
per share |
| Level II |
Net cash
>$0 and <$0.5B |
$0.10
per share |
$0.05
per share |
$0.15
per share |
| Level III |
Net cash
>$0.5B and <$1B |
$0.10
per share |
$0.10
per share |
$0.20
per share |
| Level IV |
Net cash >$1B |
$0.10
per share |
$0.15
per share |
$0.25
per share |
|
|
|
|
|
|
|
|
|
| BARRICK YEAR-END 2021 |
37 |
MANAGEMENT’S DISCUSSION AND ANALYSIS |
The declaration and payment of dividends is at the discretion of the Board of Directors, and will depend on the company’s financial results, cash requirements, future prospects, the number of outstanding common shares, and other factors deemed relevant by the Board.
Share Buyback Program
At the February 15, 2022 meeting, the Board of Directors authorized a share buyback program for the repurchase of up to $1.0 billion of the Company’s outstanding common shares over the next 12 months.
The actual number of common shares that may be purchased, if any, and the timing of any such purchases, will be determined by Barrick based on a number of factors, including the Company’s financial performance, the availability of cash flows, and the consideration of other uses of cash, including capital investment opportunities, returns to shareholders, and debt reduction.
The repurchase program does not obligate the Company to acquire any particular number of common shares, and the repurchase program may be suspended or discontinued at any time at the Company’s discretion.
Return of Capital
At the Annual and Special Meeting on May 4, 2021, shareholders approved a $750 million return of capital distribution. This distribution was derived from a portion of the proceeds from the divestiture of Kalgoorlie Consolidated Gold Mines in November 2019 and from other recent dispositions made by Barrick and its affiliates in line with our strategy of focusing on our core assets. The total return of capital distribution was effected in three equal tranches of $250 million. The first tranche was paid on June 15, 2021, to shareholders of record at the close of business on May 28, 2021. The second tranche was paid on September 15, 2021, to shareholders of record at the close of business on August 31, 2021. The third tranche was paid on December 15, 2021, to shareholders of record at the close of business on November 30, 2021.
This return of capital distribution demonstrated Barrick’s commitment to return surplus funds to shareholders as outlined in the strategy stated at the time of the Randgold merger announcement in September 2018. Since that time, the quarterly dividend has more than tripled and together with this capital distribution, established one of the industry's leading returns for shareholders in 2021.
Sale of Lagunas Norte
On February 16, 2021, Barrick announced it had entered into an agreement to sell its 100% interest in the Lagunas Norte gold mine in Peru to Boroo Pte Ltd. ("Boroo") for total consideration of up to $81 million, with $20 million of cash consideration on closing, additional cash consideration of $10 million payable on the first anniversary of closing and $20 million payable on the second anniversary of closing, a 2% net smelter return royalty, which may be purchased by Boroo for a fixed period after closing for $16 million, plus a contingent payment of up to $15 million based on the two-year average gold price. An impairment reversal of $86 million was recognized in the first quarter of 2021. Refer to note 21 of the Financial Statements for further details. The transaction closed on June 1, 2021 and we recognized a gain on sale of $4 million in the second quarter of 2021, based on a final fair value of consideration of $65 million. We remain contractually liable for all tax
matters that existed prior to our divestiture until these matters are resolved.
Acquisition of South Arturo Non-Controlling Interest
On September 7, 2021, Barrick announced it had entered into a definitive asset exchange agreement (the "Exchange Agreement") with i-80 Gold Corp. ("i-80 Gold") to acquire the 40% interest in South Arturo that NGM did not already own, in exchange for the Lone Tree and Buffalo Mountain properties and infrastructure, which were in care and maintenance at the time. The exchange transaction closed on October 14, 2021.
The Exchange Agreement provides for payment to NGM of contingent consideration of up to $50 million based on mineral resources from the Lone Tree property. In connection with the asset exchange, NGM also entered into toll-milling agreements providing i-80 Gold with interim processing capacity at NGM’s autoclave facilities until the earlier of the three-year anniversary of the asset exchange and the date on which the Lone Tree facility is operational, and separately at NGM’s roaster facilities for a 10-year period, which was assigned a fair value of $nil. In addition, each party assumed the environmental liabilities and closure bonding for their acquired properties. In conjunction with the closing of the transaction, on October 14, 2021, NGM subscribed for $48 million in common shares of i-80 Gold.
We assigned a fair value of $175 million to the transaction and recognized a gain of $205 million in the fourth quarter of 2021 in relation to the disposition of Lone Tree. Lone Tree was in a net liability position, which resulted in a gain that exceeded the fair value. In addition, we recognized a loss of $85 million in equity in the fourth quarter, representing our share of the difference between the carrying value of the South Arturo non-controlling interest and the fair value of the transaction.
Porgera Special Mining Lease Extension
On April 9, 2021, BNL signed a binding Framework Agreement with the Independent State of Papua New Guinea (“PNG”) and Kumul Minerals Holdings Limited (“Kumul Minerals”), a state-owned mining company, setting out the terms and conditions for the reopening of the Porgera mine. On February 3, 2022, the Framework Agreement was replaced by the more detailed Porgera Project Commencement Agreement (the “Commencement Agreement”). The Commencement Agreement was signed by PNG, Kumul Minerals, BNL and its affiliate Porgera (Jersey) Limited on October 15, 2021, and it became effective on February 3, 2022, following signature by Mineral Resources Enga Limited (“MRE”), the holder of the remaining 5% of the original Porgera joint venture. The Commencement Agreement reflects the commercial terms previously agreed to under the Framework Agreement, namely that PNG stakeholders will receive a 51% equity stake in the Porgera mine, with the remaining 49% to be held by BNL or an affiliate. BNL is jointly owned on a 50/50 basis by Barrick and Zijin Mining Group. Accordingly, following the implementation of the Commencement Agreement, Barrick’s current 47.5% interest in the Porgera mine is expected to be reduced to a 24.5% interest as reflected in Barrick’s reserve and resource estimates for Porgera. BNL will retain operatorship of the mine. The Commencement Agreement also provides that PNG stakeholders and BNL and its affiliates will share the economic benefits derived from the reopened Porgera Mine on a 53% and 47% basis over the remaining life of mine, respectively, and that the Government of PNG will retain the
|
|
|
|
|
|
|
|
|
| BARRICK YEAR-END 2021 |
38 |
MANAGEMENT’S DISCUSSION AND ANALYSIS |
option to acquire BNL’s or its affiliate’s 49% equity participation at fair market value after 10 years.
The provisions of the Commencement Agreement will be implemented, and work to recommence full mine operations at Porgera will begin, following the execution of a number of definitive agreements and satisfaction of a number of conditions. These include a Shareholders Agreement among the shareholders of a new Porgera joint venture company, an Operatorship Agreement pursuant to which BNL will operate the Porgera mine, as well as a Mine Development Contract to accompany the new Special Mining Lease (“SML”) that the new Porgera joint venture company will apply for following its incorporation. Under the terms of the Commencement Agreement, BNL will remain in possession of the site and maintain the mine on care and maintenance.
Porgera was excluded from our 2021 guidance and will also be excluded from our 2022 guidance. We expect to update our guidance following both the execution of all of the definitive agreements to implement the binding Commencement Agreement and the finalization of a timeline for the resumption of full mine operations. Refer to notes 21 and 35 to the Financial Statements for more information.
Global Exploration Executive Changes
On November 1, 2021, after 33 years of distinguished service, Rob Krcmarov transitioned from his position as Executive Vice-President, Exploration to a new role as technical advisor to Barrick. During his career with the Company, Mr. Krcmarov has led teams that have discovered and delineated multiple ore bodies for Barrick, including the world-class Goldrush deposit.
On November 3, 2021, Joel Holliday was appointed to the role of Executive Vice-President, Exploration, assuming leadership of Barrick’s global exploration team. Mr. Holliday has served as Barrick’s Senior Vice-President for Global Exploration since the merger with Randgold Resources. Prior to the merger, Mr. Holliday served as Randgold’s Group Executive Exploration.
North America Regional Management Changes
Catherine Raw, Chief Operating Officer, North America, decided to return to the United Kingdom and departed Barrick on December 31, 2021.
On January 6, 2022, Barrick announced that Christine Keener will be appointed Chief Operating Officer of the North America region commencing in February 2022. Ms. Keener has extensive experience in finance, strategy, commercial and operational roles. Prior to joining Barrick, Ms. Keener was Vice-President Operations, Europe and North America of Alcoa Corporation.
|
|
|
|
|
|
|
|
|
| BARRICK YEAR-END 2021 |
39 |
MANAGEMENT’S DISCUSSION AND ANALYSIS |
Outlook for 2022
Operating Division Guidance
Our 2021 actual gold and copper production, cost of sales, total cash costs6, all-in sustaining costs6 and 2022 forecast gold and copper production, cost of sales, total cash costs6 and all-in sustaining costs6 ranges by operating division are as follows:
|
|
|
|
|
|
|
|
|
|
|
|
|
|
|
|
|
|
|
|
|
|
|
|
|
|
|
| Operating Division |
2021 attributable production (000s ozs) |
2021 cost of salesa ($/oz) |
2021 total cash costsb ($/oz) |
2021 all-in sustaining costsb ($/oz) |
2022 forecast attributable production (000s ozs) |
2022 forecast cost of salesa ($/oz) |
2022 forecast total cash costsb ($/oz) |
2022 forecast all-in sustaining costsb ($/oz) |
| Gold |
|
|
|
|
|
|
|
|
Carlin (61.5%)c |
923 |
968 |
782 |
1,087 |
950 - 1,030 |
900 - 980 |
730 - 790 |
1,020 - 1,100 |
Cortez (61.5%)d |
509 |
1,122 |
763 |
1,013 |
480 - 530 |
970 - 1,050 |
650 - 710 |
1,010 - 1,090 |
| Turquoise Ridge (61.5%) |
334 |
1,122 |
749 |
892 |
330 - 370 |
1,110 - 1,190 |
770 - 830 |
930 - 1,010 |
| Phoenix (61.5%) |
109 |
1,922 |
398 |
533 |
90 - 120 |
2,000 - 2,080 |
720 - 780 |
890 - 970 |
| Long Canyon (61.5%) |
161 |
739 |
188 |
238 |
40 - 50 |
1,420 - 1,500 |
540 - 600 |
540 - 620 |
| Nevada Gold Mines (61.5%) |
2,036 |
1,072 |
705 |
949 |
1,900 - 2,100 |
1,020 - 1,100 |
710 - 770 |
990 - 1,070 |
| Hemlo |
150 |
1,693 |
1,388 |
1,970 |
160 - 180 |
1,340 - 1,420 |
1,140 - 1,200 |
1,510 - 1,590 |
| North America |
2,186 |
1,115 |
752 |
1,020 |
2,100 - 2,300 |
1,050 - 1,130 |
740 - 800 |
1,040 - 1,120 |
|
|
|
|
|
|
|
|
|
| Pueblo Viejo (60%) |
488 |
896 |
541 |
745 |
400 - 440 |
1,070 - 1,150 |
670 - 730 |
910 - 990 |
| Veladero (50%) |
172 |
1,256 |
816 |
1,493 |
220 - 240 |
1,210 - 1,290 |
740 - 800 |
1,270 - 1,350 |
Porgera (47.5%)e |
— |
— |
— |
— |
— |
— |
— |
— |
|
|
|
|
|
|
|
|
|
| Latin America & Asia Pacific |
660 |
1,028 |
622 |
969 |
620 - 680 |
1,140 - 1,220 |
700 - 760 |
1,040 - 1,120 |
|
|
|
|
|
|
|
|
|
| Loulo-Gounkoto (80%) |
560 |
1,049 |
650 |
970 |
510 - 560 |
1,070 - 1,150 |
680 - 740 |
940 - 1,020 |
| Kibali (45%) |
366 |
1,016 |
627 |
818 |
340 - 380 |
990 - 1,070 |
600 - 660 |
800 - 880 |
| North Mara (84%) |
260 |
966 |
777 |
1,001 |
230 - 260 |
820 - 900 |
670 - 730 |
930 - 1,010 |
| Bulyanhulu (84%) |
178 |
1,079 |
709 |
891 |
180 - 210 |
950 - 1,030 |
630 - 690 |
850 - 930 |
| Tongon (89.7%) |
187 |
1,504 |
1,093 |
1,208 |
170 - 200 |
1,700 - 1,780 |
1,220 - 1,280 |
1,400 - 1,480 |
|
|
|
|
|
|
|
|
|
Africa & Middle Eastf |
1,591 |
1,092 |
740 |
968 |
1,450 - 1,600 |
1,070 - 1,150 |
720 - 780 |
950 - 1,030 |
|
|
|
|
|
|
|
|
|
Total Attributable to Barrickg,h,i |
4,437 |
1,093 |
725 |
1,026 |
4,200 - 4,600 |
1,070 - 1,150 |
730 - 790 |
1,040 - 1,120 |
|
|
|
|
|
|
|
|
|
| |
2021 attributable production (M lbs) |
2021 cost of salesa ($/lb) |
2021 C1 cash costsb ($/lb) |
2021 all-in sustaining costsb ($/lb) |
2022 forecast attributable production
(M lbs) |
2022 forecast cost of salesa ($/lb) |
2022 forecast C1 cash costsb ($/lb) |
2022 forecast all-in sustaining costsb ($/lb) |
| Copper |
|
|
|
|
|
|
|
|
| Lumwana |
242 |
2.25 |
1.62 |
2.80 |
250 - 280 |
2.20 - 2.50 |
1.60 - 1.80 |
3.10 - 3.40 |
| Zaldívar (50%) |
97 |
3.19 |
2.38 |
2.94 |
100 - 120 |
2.70 - 3.00 |
2.00 - 2.20 |
2.50 - 2.80 |
| Jabal Sayid (50%) |
76 |
1.38 |
1.18 |
1.33 |
70 - 80 |
1.40 - 1.70 |
1.30 - 1.50 |
1.30 - 1.60 |
Total Copperh |
415 |
2.32 |
1.72 |
2.62 |
420 - 470 |
2.20 - 2.50 |
1.70 - 1.90 |
2.70 - 3.00 |
a.Gold cost of sales per ounce is calculated as cost of sales across our gold operations (excluding sites in closure or care and maintenance) divided by ounces sold (both on an attributable basis using Barrick’s ownership share). Copper cost of sales per pound is calculated as cost of sales across our copper operations divided by pounds sold (both on an attributable basis using Barrick’s ownership share).
b.Further information on these non-GAAP financial measures, including detailed reconciliations, is included on pages 94 to 120 of this MD&A. c.Includes our share of South Arturo. On September 7, 2021, NGM announced it had entered into an Exchange Agreement with i-80 Gold to acquire the 40% interest in South Arturo that NGM did not already own in exchange for the Lone Tree and Buffalo Mountain properties and infrastructure. Operating results within our 61.5% interest in Carlin includes NGM’s 60% interest in South Arturo up until May 30, 2021, and 100% interest thereafter, reflecting the terms of the exchange transaction which closed on October 14, 2021. Please refer to page 37 for more details. d.Includes Goldrush.
e.Porgera was placed on temporary care and maintenance in April 2020 and remains excluded from our 2022 guidance. We expect to update our guidance to include Porgera following both the execution of definitive agreements to implement the Commencement Agreement and the finalization of a timeline for the resumption of full mine operations. Refer to page 72 for further details. f.2021 results include Buzwagi until the end of the third quarter of 2021.
g.Total cash costs and all-in sustaining costs per ounce include costs allocated to non-operating sites.
h.Operating division guidance ranges reflect expectations at each individual operating division, and may not add up to the company-wide guidance range total. The company-wide 2021 results and 2022 guidance ranges exclude Pierina, Lagunas Norte, Golden Sunlight, and include Buzwagi until the end of the third quarter of 2021. Some of these assets are producing incidental ounces while in closure or care and maintenance. Lagunas Norte was divested in June 2021.
i.Includes corporate administration costs.
|
|
|
|
|
|
|
|
|
| BARRICK YEAR-END 2021 |
40 |
MANAGEMENT’S DISCUSSION AND ANALYSIS |
Operating Division, Consolidated Expense and Capital Guidance
Our 2021 actual gold and copper production, cost of sales, total cash costs6, all-in sustaining costs6, consolidated expenses and capital expenditures and 2022 forecast gold and copper production, cost of sales, total cash costs6, all-in sustaining costs6, consolidated expenses and capital expenditures are as follows:
|
|
|
|
|
|
|
|
|
|
|
|
|
| ($ millions, except per ounce/pound data) |
|
2021 Guidancea |
2021 Actual |
2022 Guidancea |
| Gold production |
|
|
|
|
| Production (millions of ounces) |
|
4.40 - 4.70 |
4,437 |
4.20 - 4.60 |
| Gold cost metrics |
|
|
|
|
| Cost of sales - gold ($ per oz) |
|
1,020 - 1,070 |
1,093 |
1,070 - 1,150 |
Total cash costs ($ per oz)b |
|
680 - 730 |
725 |
730 - 790 |
| Depreciation ($ per oz) |
|
300 - 330 |
326 |
300 - 330 |
All-in sustaining costs ($ per oz)b |
|
970 - 1,020 |
1,026 |
1,040 - 1,120 |
| Copper production |
|
|
|
|
| Production (millions of pounds) |
|
410 - 460 |
415 |
420 - 470 |
| Copper cost metrics |
|
|
|
|
| Cost of sales - copper ($ per lb) |
|
1.90 - 2.10 |
2.32 |
2.20 - 2.50 |
C1 cash costs ($ per lb)b |
|
1.40 - 1.60 |
1.72 |
1.70 - 1.90 |
| Depreciation ($ per lb) |
|
0.60 - 0.70 |
0.70 |
0.70 - 0.80 |
All-in sustaining costs ($ per lb)b |
|
2.00 - 2.20 |
2.62 |
2.70 - 3.00 |
| Exploration and project expenses |
|
280 - 320 |
287 |
310 - 350 |
| Exploration and evaluation |
|
230 - 250 |
186 |
180 - 200 |
| Project expenses |
|
50 - 70 |
101 |
130 - 150 |
| General and administrative expenses |
|
~190 |
151 |
~180 |
| Corporate administration |
|
~130 |
118 |
~130 |
Stock-based compensationc |
|
~60 |
33 |
~50 |
|
|
|
|
|
| Other expense (income) |
|
80 - 100 |
(67) |
50 - 70 |
| Finance costs, net |
|
330 - 370 |
355 |
330 - 370 |
Attributable capital expendituresd |
|
|
|
|
Attributable minesite sustainingb,d |
|
1,250 - 1,450 |
1,364 |
1,350 - 1,550 |
Attributable projectb,d |
|
550 - 650 |
587 |
550 - 650 |
Total attributable capital expendituresd |
|
1,800 - 2,100 |
1,951 |
1,900 - 2,200 |
a.Based on the communication we received from the Government of Papua New Guinea that the SML will not be extended, Porgera was placed on temporary care and maintenance on April 25, 2020. Due to the uncertainty related to the timing and scope of future developments on the mine’s operating outlook, our 2021 and 2022 guidance excludes Porgera. We expect to update our guidance to include Porgera following both the execution of definitive agreements to implement the Commencement Agreement and the finalization of a timeline for the resumption of full mine operations. Refer to page 72 for further details. b.Further information on these non-GAAP financial measures, including detailed reconciliations, is included on pages 94 to 120 of this MD&A. c.2021 actual results are based on a US$19.00 share price and 2022 guidance is based on a one-month trailing average ending December 31, 2021 of US$19.23 per share.
d.Attributable capital expenditures are presented on the same basis as guidance, which includes our 61.5% share of Nevada Gold Mines, our 60% share of Pueblo Viejo, our 80% share of Loulo-Gounkoto, our 89.7% share of Tongon, our 84% share of North Mara and Bulyanhulu and our 50% share of Zaldívar and Jabal Sayid.
|
|
|
|
|
|
|
|
|
| BARRICK YEAR-END 2021 |
41 |
MANAGEMENT’S DISCUSSION AND ANALYSIS |
2022 Guidance Analysis
Estimates of future production, cost of sales per ounce7, total cash costs per ounce6 and all-in sustaining costs per ounce6 presented in this MD&A are based on mine plans that reflect the expected method by which we will mine reserves at each site. Actual gold and copper production and associated costs may vary from these estimates due to a number of operational and non-operational risk factors (see the “Cautionary Statement on Forward-Looking Information” on page 24 of this MD&A for a description of certain risk factors that could cause actual results to differ materially from these estimates).
Gold Production
We expect 2022 gold production to be in the range of 4.2 to 4.6 million ounces, anchored by stable year-over-year performance across our portfolio of six Tier One Gold Assets1, highlighting the importance of a world-class asset base in delivering consistent performance.
Our 2022 gold production guidance currently excludes Porgera. We expect to update our guidance following both the execution of all of the definitive agreements to implement the Commencement Agreement and the finalization of a timeline for the resumption of full mine operations. Refer to page 72 for more information. This is due to the uncertainty related to the timing and scope of future operations at Porgera following the decision to place the mine on temporary care and maintenance on April 25, 2020 to ensure the safety and security of our employees and communities. As this matter continues to evolve, we will provide further updates in due course. We remain in constructive discussions with the Government of PNG and are optimistic about finding a solution to allow operations at Porgera to resume in 2022.
Outside of our Tier One Gold Assets1, we expect the following significant changes in year-over-year production. As previously disclosed, mining will cease at Long Canyon towards the middle of 2022, with residual leaching to commence thereafter. The focus at Long Canyon is now shifting to permitting Phase 2, which is expected to begin production in 2026. This is partially offset by Veladero, where we expect stronger performance in 2022 following the commissioning of Phase 6 in the second quarter of 2021. Furthermore, we expect higher production at Bulyanhulu in 2022 following the successful ramp-up of underground operations achieved at the end of 2021.
Across the four quarters of 2022, the Company’s gold production is expected to be the lowest in the first quarter mainly due to planned maintenance at Pueblo Viejo, Kibali and North Mara, as well as mine sequencing at Phoenix and Tongon. We expect the fourth quarter to be the strongest quarter for gold production as we continue to expect Goldrush to ramp up towards the end of the year, based on the issuance of a Record of Decision (“ROD”) in the second half of 2022, as well as higher grades from Phoenix and Tongon, and improved underground productivity at Hemlo.
Gold Cost of Sales per Ounce7
On a per ounce basis, cost of sales applicable to gold7, after removing the portion related to non-controlling interests, is expected to be in the range of $1,070 to $1,150 per ounce in 2022, compared to the 2021 actual result of $1,093 per ounce.
The expected increase compared to the 2021 guidance range reflects changes in the expected sales mix
with a higher contribution from Carlin and Veladero offset by a lower contribution from Pueblo Viejo and Long Canyon as described further in the Gold Total Cash Costs per Ounce6 section immediately below.
Gold Total Cash Costs per Ounce6
Total cash costs per ounce6 in 2022 is expected to be in the range of $730 to $790 per ounce, compared to the 2021 actual result of $725 per ounce.
The expected increase compared to the 2021 actual result partially reflects the full year impact of the new Mining Education Tax applied to gross proceeds in Nevada and changes in the expected sales mix as well as underlying cost inflation, particularly energy costs. The Nevada Mining Education Tax became effective on July 1, 2021.
In North America, our 2022 guidance for total cash costs per ounce6 for Nevada Gold Mines of $710 to $770 per ounce compares to the 2021 actual result of $705 per ounce. The new Mining Education Tax in Nevada is estimated to have a full year impact of approximately $17 per ounce for Nevada Gold Mines based on our $1,700 per ounce gold price assumption for 2022. Separately, the reduction in the contribution from Long Canyon offset by a higher contribution from Carlin, which has a comparatively higher cost on a per ounce basis, is expected to result in relatively higher costs for Nevada Gold Mines.
In Latin America & Asia Pacific, total cash costs per ounce6 at Pueblo Viejo are expected to be higher in 2022 due to lower grades compared to the prior year. This is in line with the mine and stockpile processing plan at Pueblo Viejo, as we near completion of the plant expansion project to offset the expected decline in grade. At Veladero, which is higher cost relative to Pueblo Viejo, the expected higher production and sales volumes will also drive an increase in total cash costs per ounce6 at the regional level due to the change in sales mix.
For Africa & Middle East, the expected change in sales mix is having a positive impact reflecting the closure of Buzwagi, partially offset by a higher contribution from Bulyanhulu as the underground operation was ramping up through the course of 2021. Total cash costs per ounce6 at Kibali in 2022 are expected to be consistent with the prior year, while expected to slightly increase at Loulo-Gounkoto. As previously disclosed, we have extended the life of mine at Tongon with the prospect of further extensions from our exploration programs, resulting in higher total cash costs per ounce6 due to higher mining costs associated with the satellite pits.
Gold All-In Sustaining Costs per Ounce6
All-in sustaining costs per ounce6 in 2022 is expected to be in the range of $1,040 to $1,120 per ounce, compared to the 2021 actual result of $1,026 per ounce. This is based on the expectation that minesite sustaining capital expenditures on a per ounce basis will be higher (refer to Capital Expenditure commentary below for further detail) and slightly higher total cash costs per ounce6.
The expected increase compared to the 2021 guidance range also reflects the enactment of the new Mining Education Tax in Nevada (effective from July 1, 2021), which was not included in our 2021 guidance, together with the same underlying drivers described in the Gold Total Cash Costs per Ounce6 section above.
|
|
|
|
|
|
|
|
|
| BARRICK YEAR-END 2021 |
42 |
MANAGEMENT’S DISCUSSION AND ANALYSIS |
Copper Production and Costs
We expect 2022 copper production to be in the range of 420 to 470 million pounds, compared to actual production of 415 million pounds in 2021. Production in the second half of 2022 is expected to be stronger than the first half, due to steadily increasing throughput at Lumwana. In addition, major maintenance at Zaldívar is scheduled in the first and third quarters of 2022.
In 2022, cost of sales applicable to copper7 is expected to be in the range of $2.20 to $2.50 per pound, in line with the actual result of $2.32 per pound for 2021. The expected increase compared to the 2021 guidance range reflects cost inflation and the impact of higher royalty expenses due to our copper price assumption increasing to $4.00 per pound (from $2.75 per pound in 2021). C1 cash costs per pound6 guidance of $1.70 to $1.90 per pound for 2022 is also in line with the 2021 actual result of $1.72 per pound. Copper all-in sustaining costs per pound6 guidance of $2.70 to $3.00 for 2022 compares to the actual result of $2.62 in 2021 and is based on the expectation that minesite sustaining capital expenditures on a per pound basis will be higher (refer to Capital Expenditures commentary below for further detail).
Exploration and Project Expenses
We expect to incur approximately $310 to $350 million of exploration and project expenses in 2022. This is an increase compared to our 2021 guidance range of $280 to $320 million and is higher than the 2021 actual result of $287 million.
Within this range, we expect our exploration and evaluation expenditures in 2022 to be approximately $180 to $200 million. This is consistent with the 2021 actual result of $186 million and will continue to support our resource and reserve conversion over the coming years.
We also expect to incur approximately $130 to $150 million of project expenses in 2022, compared to $101 million in 2021. Project expenses are mainly related to the ongoing site costs at Pascua-Lama as well as project evaluation costs across our portfolio, particularly in the Latin America & Asia Pacific region.
General and Administrative Expenses
In 2022, we expect corporate administration costs to be approximately $130 million which is unchanged from our 2021 guidance. This compares to the actual result for 2021 of $118 million as we expect travel and office-related costs to return to pre-pandemic levels in 2022.
Separately, stock-based compensation expense in 2022 is expected to be approximately $50 million based on a share price assumption of $19.23.
Finance Costs, Net
In 2022, net finance costs of $330 to $370 million primarily represents interest expense on long-term debt, non-cash interest expense relating to the gold and silver streaming agreements at Pueblo Viejo, and accretion, net of finance income. This guidance for 2022 is consistent with the actual result for 2021 of $355 million.
Capital Expenditures
Total attributable gold and copper capital expenditure for 2022 is expected to be in the range of $1,900 to $2,200 million. This compares to the actual spend for the 2021 year of $1,951 million. We continue to focus on the delivery of our project capital pipeline and expect attributable project capital expenditures6 to be in the range of $550 to $650 million in 2022, at around the same level as our actual expenditures of $587 million in 2021. This reflects the ongoing construction activities for the plant expansion and mine life extension project at Pueblo Viejo and to a lesser extent, our solar power initiatives at Loulo-Gounkoto and the construction of the Phase 7A leach pad expansion at Veladero. The remainder of expected project capital expenditures6 is mainly related to underground development and infrastructure at Goldrush, the third shaft project at Turquoise Ridge, open pit development at North Mara and optimization projects at Bulyanhulu.
Attributable minesite sustaining capital expenditure6 for 2022 is expected to be in the range of $1,350 to $1,550 million, which compares to the actual spend for 2021 of $1,364 million. The guidance range for 2022 is split between our gold assets ($1,000 to $1,200 million) and copper assets ($340 to $360 million). Compared to the prior year, minesite sustaining capital expenditures6 in 2022 are expected to increase at Lumwana by approximately $100 million, mainly related to higher waste stripping to allow for future production growth over the five-year outlook. At NGM, we are also expecting minesite sustaining capital expenditure6 to be approximately $100 million higher, driven by Cortez and Carlin. At Cortez, this is due to higher waste stripping, infrastructure and equipment related to Cortez Pits as well as tailings dam construction. At Carlin, the key drivers are the expansion of the Gold Quarry Roaster and conversion of the Goldstrike autoclave to a carbon-in-leach circuit.
Effective Income Tax Rate
Based on a gold price assumption of $1,700/oz, our expected effective tax rate range for 2022 is 27% to 32%. The rate is sensitive to the relative proportion of sales in high versus low tax jurisdictions, realized gold and copper prices, the proportion of income from our equity accounted investments and the level of non-tax affected costs in countries where we generate net losses.
Outlook Assumptions and Economic Sensitivity Analysis
|
|
|
|
|
|
|
|
|
|
|
|
|
|
|
|
| |
2022 Guidance Assumption |
Hypothetical Change |
Impact on EBITDAa (millions) |
|
Impact on TCC and AISCa |
| |
| Gold price sensitivity |
$1,700/oz |
+/- $100/oz |
‘+/-$580 |
|
‘+/-$5/oz |
| Copper price sensitivity |
$4.00/lb |
‘+/-$0.25/lb |
‘+/- $60 |
|
‘+/-$0.01/lb |
|
|
|
|
|
|
|
|
|
|
|
|
|
|
|
|
|
|
|
|
|
|
|
|
|
|
|
|
|
|
|
|
|
|
|
|
|
|
|
|
|
|
|
|
|
|
|
|
|
|
|
|
|
|
|
|
|
|
|
|
a.Further information on these non-GAAP financial measures, including detailed reconciliations, is included on pages 94 to 120 of this MD&A.
|
|
|
|
|
|
|
|
|
| BARRICK YEAR-END 2021 |
43 |
MANAGEMENT’S DISCUSSION AND ANALYSIS |
Risks and Risk Management
Overview
The ability to deliver on our vision, strategic objectives and operating guidance depends on our ability to understand and appropriately respond to the uncertainties or “risks” we face that may prevent us from achieving our objectives. To achieve this, we:
■Maintain a framework that permits us to manage risk effectively and in a manner that creates the greatest value;
■Integrate a process for managing risk into all our important decision-making processes so that we reduce the effect of uncertainty on achieving our objectives;
■Actively monitor key controls we rely on to achieve the Company’s objectives so they remain in place and are effective at all times; and
■Provide assurance to senior management and relevant committees of the Board on the effectiveness of key control activities.
Board and Committee Oversight
We maintain strong risk oversight practices, with responsibilities outlined in the mandates of the Board and related committees. The Board’s mandate is clear on its responsibility for reviewing and discussing with management the processes used to assess and manage risk, including the identification by management of the principal risks of the business, and the implementation of appropriate systems to deal with such risks.
The Audit & Risk Committee assists the Board in overseeing the Company’s management of principal risks and the implementation of policies and standards for monitoring and modifying such risks, as well as monitoring and reviewing the Company’s financial position and financial risk management programs. The ESG & Nominating Committee assists the Board in overseeing the Company’s policies and performance for its environmental, health and safety, corporate social responsibility and human rights programs.
Management Oversight
Our weekly Executive Committee Review is the main forum for senior management to raise and discuss risks facing the operations and organization more broadly. At regularly scheduled meetings, the Board and the Audit & Risk Committee are provided with updates on the key issues identified by management at these weekly sessions.
Principal Risks
The following subsections describe some of our key sources of uncertainty and critical risk modification activities. The risks described below are not the only ones facing Barrick. Our business is subject to inherent risks in financial, regulatory, strategic and operational areas. For a more comprehensive discussion of those inherent risks, see “Risk Factors” in our most recent Form 40-F/Annual Information Form on file with the SEC and Canadian provincial securities regulatory authorities. Also see the “Cautionary Statement on Forward-Looking Information” on page 24 of this MD&A.
Financial position and liquidity
Our liquidity profile, level of indebtedness and credit ratings are all factors in our ability to meet short-and long-term financial demands. Barrick’s outstanding debt balances impact liquidity through scheduled interest and principal
repayments and the results of leverage ratio calculations, which could influence our investment grade credit ratings and ability to access capital markets. In addition, our ability to draw on our credit facility is subject to meeting its covenants. Our primary source of liquidity is our operating cash flow, which is dependent on the ability of our operations to deliver projected future cash flows. The ability of our operations to deliver projected future cash flows, as well as future changes in gold and copper market prices, either favorable or unfavorable, will continue to have a material impact on our cash flow and liquidity.
Key risk modification activities:
■Continued focus on generating positive free cash flow by improving the underlying cost structures of our operations in a sustainable manner;
■Disciplined capital allocation criteria for all investments, to ensure a high degree of consistency and rigor is applied to all capital allocation decisions based on a comprehensive understanding of risk and reward;
■Preparation of budgets and forecasts to understand the impact of different price scenarios on liquidity, including our capacity to provide cash returns to shareholders, and formulate appropriate strategies;
■Review of debt and net debt levels to ensure appropriate leverage and monitor the market for liability management opportunities; and
■Other options available to the Company to enhance liquidity include drawing on our $3.0 billion undrawn credit facility, asset sales, joint ventures, or the issuance of debt or equity securities.
Improving free cash flow6 and costs
Our ability to improve productivity, drive down operating costs and reduce working capital remains a focus in 2022 and is subject to several sources of uncertainty. This includes our ability to achieve and maintain industry-leading margins by improving the productivity and efficiency of our operations.
Key risk modification activities:
■Maximizing the benefit of higher gold prices through agile management and operational execution;
■Weekly Executive Committee Review to identify, assess and respond to risks in a timely manner;
■Enabling simplification and agile decision making through unification of business systems; and
■A flat, operationally focused, agile management structure with a tenet in ownership culture.
Social license to operate
At Barrick, we are committed to building, operating, and closing our mines in a safe and responsible manner. To do this, we seek to build trust-based partnerships with host governments and local communities to drive shared long-term value while working to minimize the social and environmental impacts of our activities. Geopolitical risks such as resource nationalism and incidents of corruption are inherent in the business of a company operating globally. Past environmental incidents in the extractive industry highlight the hazards (e.g., water management, tailings storage facilities, etc.) and the potential consequences to the environment, community health and safety. Our ability to maintain compliance with regulatory and community obligations in order to protect the environment and our host communities alike remains one of our top priorities. Barrick also recognizes climate change
|
|
|
|
|
|
|
|
|
| BARRICK YEAR-END 2021 |
44 |
MANAGEMENT’S DISCUSSION AND ANALYSIS |
as an area of risk requiring specific focus and that reducing emissions to counter the causes of climate change requires strong collective action by the mining industry.
Key risk modification activities:
■Our commitment to responsible mining is supported by a robust governance framework, including an overarching Sustainable Development Policy and related policies in the areas of Biodiversity, Social Performance, Occupational Health and Safety, Environment and Human Rights;
■Implementation of a Sustainability Scorecard to track our sustainability performance using key performance indicators aligned to priority areas set out in our strategy;
■Mandatory training on our Code of Business Conduct and Ethics as well as supporting policies which set out the ethical behavior expected of everyone working at, or with, Barrick;
■We take a partnership approach with our host governments. This means we work to balance our own interests and priorities with those of our government partners, working to ensure that everyone derives real value from our operations;
■Established Community Development Committees at each of our operational mines to identify community needs and priorities and to allocate funds to those initiatives most meaningful to the local community;
■We open our social and environmental performance to third-party scrutiny, including through the ISO 14001 re-certification process, International Cyanide Management Code audits, and annual human rights impact assessments;
■Our climate change strategy has three pillars: identify, understand and mitigate the risks associated with climate change; measure and reduce our impacts on climate change; and improve our disclosure on climate change;
■We established site-specific emergency response plans as well as regional crisis management plans to manage any manifestation of Covid-19 in or near our mines globally; and
■We continuously review and update our closure plans and cost estimates to plan for environmentally responsible closure and monitoring of operations.
Resources and reserves and production outlook
Like any mining company, we face the risk that we are unable to discover or acquire new resources or that we do not convert resources into production. As we move into 2022 and beyond, our overriding objective of growing free cash flow6 continues to be underpinned by a strong pipeline of organic projects and minesite expansion opportunities in our core regions. Uncertainty related to these and other opportunities exists (potentially both favorable and unfavorable) due to the speculative nature of mineral exploration and development as well as the potential for increased costs, delays, suspensions and technical challenges associated with the construction of capital projects.
Key risk modification activities:
■Focus on responsible mineral resource management, continuously improve ore body knowledge, and add to reserves and resources;
■Grow and invest in a portfolio of Tier One Gold Assets1, Tier Two Gold Assets2, Tier One Copper Assets3 and
Strategic Assets4 with an emphasis on organic growth to leverage our existing footprint; and
■Invest in exploration across extensive land positions in many of the world’s most prolific gold districts.
Market Overview
The market prices of gold and, to a lesser extent, copper are the primary drivers of our profitability and our ability to generate free cash flow6 for our shareholders.
Gold
The price of gold is subject to volatile price movements over short periods of time and is affected by numerous industry and macroeconomic factors. During 2021, the gold price ranged from $1,677 per ounce to $1,959 per ounce. The average market price for the year of $1,799 per ounce represented an all-time annual high and an increase of 2% versus 2020.
AVERAGE MONTHLY SPOT GOLD PRICES
(dollars per ounce)
During the year, the gold price remained strong as a result of the continued fiscal and monetary stimulus measures put in place due to the economic uncertainty caused by Covid-19, negative real interest rates, and growing inflation concerns, tempered by an increase in the trade-weighted value of the US dollar.
Copper
During 2021, London Metal Exchange (“LME”) copper prices traded in a wide range of $3.49 to an all-time high of $4.87 per pound, averaged an all-time annual high of $4.23 per pound, and closed the year at $4.40 per pound. Copper prices are significantly influenced by physical demand from emerging markets, especially China.
After copper prices fell to four-year lows in March 2020 due to initial concerns and near-term economic impacts from the spread of Covid-19, they subsequently rose over the next 12 months, reaching all-time highs in May 2021 due to a recovery in demand from China, low global stockpile levels, and the expected impact of global financial stimulus measures. Prices moderated thereafter, but remained robust through the remainder of 2021.
|
|
|
|
|
|
|
|
|
| BARRICK YEAR-END 2021 |
45 |
MANAGEMENT’S DISCUSSION AND ANALYSIS |
AVERAGE MONTHLY SPOT COPPER PRICES
(dollars per pound)
We have provisionally priced copper sales for which final price determination versus the relevant copper index is outstanding at the balance sheet date. As at December 31, 2021, we recorded 45 million pounds of copper sales still subject to final price settlement at an average provisional price of $4.34 per pound. The impact to net income before taxation of a 10% movement in the market price of copper would be approximately $20 million, holding all other variables constant.
Currency Exchange Rates
The results of our mining operations outside of the United States are affected by US dollar exchange rates. We have exposure to the Argentine peso through operating costs at our Veladero mine, and peso denominated VAT receivable balances. In addition, we have exposure to the Canadian and Australian dollars, Chilean peso, Papua New Guinea kina, Peruvian sol, Zambian kwacha, Tanzanian shilling, Dominican peso, West African CFA franc, Euro, South African rand, and British pound through mine operating and capital costs.
Fluctuations in these exchange rates increase the volatility of our costs reported in US dollars. In 2021, the Australian dollar traded in a range of $0.70 to $0.80 against the US dollar, while the US dollar against the Canadian dollar, Argentine peso, and West African CFA franc ranged from $1.20 to $1.30, ARS 84 to ARS 103, and XOF 531 to XOF 586, respectively. Due to inflation pressures in Argentina and government actions, there was a continued weakening of the Argentine peso during the year. During 2021, we did not have any currency hedge positions, and are unhedged against foreign exchange exposures as at December 31, 2021 beyond spot requirements.
Fuel
For 2021, the price of West Texas Intermediate (“WTI”) crude oil traded in a wide range between $47 and $85 per barrel, with an average market price of $68 per barrel, and closed the year at $75 per barrel. Oil prices were significantly impacted by an increase in global economic activity during the year as well as constrained supply.
AVERAGE MONTHLY SPOT CRUDE OIL PRICE (WTI)
(dollars per barrel)
During 2021, we did not have any fuel hedge positions, and are unhedged against fuel exposures as at December 31, 2021.
US Dollar Interest Rates
During March 2020, the US Federal Reserve lowered interest rates to a range of 0.00% to 0.25% as a result of the economic impacts of the spread of Covid-19 and kept rates at that level through the remainder of 2020 and all of 2021. There are growing expectations for increases in benchmark rates in 2022, but the scale of any changes to monetary policy will be dependent on the strength of economic recovery and inflation levels.
At present, our interest rate exposure mainly relates to interest income received on our cash balances ($5.3 billion at December 31, 2021); the mark-to-market value of derivative instruments; the carrying value of certain long-lived assets and liabilities; and the interest payments on our variable-rate debt ($0.1 billion at December 31, 2021). Currently, the amount of interest expense recorded in our consolidated statement of income is not materially impacted by changes in interest rates, because the majority of debt was issued at fixed interest rates. The relative amounts of variable-rate financial assets and liabilities may change in the future, depending on the amount of operating cash flow we generate, as well as the level of capital expenditures and our ability to borrow on favorable terms using fixed rate debt instruments. Changes in interest rates affect the accretion expense recorded on our provision for environmental rehabilitation and therefore would affect our net earnings.
|
|
|
|
|
|
|
|
|
| BARRICK YEAR-END 2021 |
46 |
MANAGEMENT’S DISCUSSION AND ANALYSIS |
Production and Cost Summary - Gold
|
|
|
|
|
|
|
|
|
|
|
|
|
|
|
|
|
|
|
|
|
|
|
|
|
|
|
|
|
|
|
For the three months ended |
|
For the years ended |
|
12/31/21 |
9/30/21 |
Change |
|
12/31/21 |
12/31/20 |
Change |
|
12/31/19 |
Nevada Gold Mines (61.5%)a |
|
|
|
|
|
|
|
|
|
| Gold produced (000s oz) |
604 |
|
495 |
|
22% |
|
2,036 |
2,131 |
|
(4%) |
|
2,218 |
| Cost of sales ($/oz) |
1,023 |
|
1,123 |
|
(9%) |
|
1,072 |
1,029 |
|
4% |
|
924 |
Total cash costs ($/oz)b |
687 |
|
734 |
|
(6%) |
|
705 |
702 |
|
0% |
|
634 |
All-in sustaining costs ($/oz)b |
893 |
|
975 |
|
(8%) |
|
949 |
941 |
|
1% |
|
828 |
Carlin (61.5%)c |
|
|
|
|
|
|
|
|
|
| Gold produced (000s oz) |
295 |
|
209 |
|
41% |
|
923 |
1,024 |
|
(10%) |
|
968 |
| Cost of sales ($/oz) |
899 |
|
1,017 |
|
(12%) |
|
968 |
976 |
|
(1%) |
|
1,004 |
Total cash costs ($/oz)b |
728 |
|
814 |
|
(11%) |
|
782 |
790 |
|
(1%) |
|
746 |
All-in sustaining costs ($/oz)b |
950 |
|
1,124 |
|
(15%) |
|
1,087 |
1,041 |
|
4% |
|
984 |
Cortez (61.5%)d |
|
|
|
|
|
|
|
|
|
| Gold produced (000s oz) |
169 |
|
130 |
|
30% |
|
509 |
491 |
|
4% |
|
801 |
| Cost of sales ($/oz) |
984 |
|
1,164 |
|
(15%) |
|
1,122 |
958 |
|
17% |
|
762 |
Total cash costs ($/oz)b |
657 |
|
800 |
|
(18%) |
|
763 |
678 |
|
13% |
|
515 |
All-in sustaining costs ($/oz)b |
853 |
|
1,065 |
|
(20%) |
|
1,013 |
998 |
|
2% |
|
651 |
Turquoise Ridge (61.5%)e |
|
|
|
|
|
|
|
|
|
| Gold produced (000s oz) |
82 |
|
82 |
|
0% |
|
334 |
330 |
|
1% |
|
335 |
| Cost of sales ($/oz) |
1,194 |
|
1,169 |
|
2% |
|
1,122 |
1,064 |
|
5% |
|
846 |
Total cash costs ($/oz)b |
819 |
|
788 |
|
4% |
|
749 |
711 |
|
5% |
|
585 |
All-in sustaining costs ($/oz)b |
996 |
|
943 |
|
6% |
|
892 |
798 |
|
12% |
|
732 |
Phoenix (61.5%)f |
|
|
|
|
|
|
|
|
|
| Gold produced (000s oz) |
25 |
|
31 |
|
(19%) |
|
109 |
126 |
|
(13%) |
|
56 |
| Cost of sales ($/oz) |
2,047 |
|
1,777 |
|
15% |
|
1,922 |
1,772 |
|
8% |
|
2,093 |
Total cash costs ($/oz)b |
443 |
|
499 |
|
(11%) |
|
398 |
649 |
|
(39%) |
|
947 |
All-in sustaining costs ($/oz)b |
614 |
|
582 |
|
5% |
|
533 |
814 |
|
(35%) |
|
1,282 |
Long Canyon (61.5%)f |
|
|
|
|
|
|
|
|
|
| Gold produced (000s oz) |
33 |
|
43 |
|
(23%) |
|
161 |
|
160 |
|
1% |
|
58 |
| Cost of sales ($/oz) |
999 |
|
796 |
|
26% |
|
739 |
|
869 |
|
(15%) |
|
1,088 |
Total cash costs ($/oz)b |
325 |
|
201 |
|
62% |
|
188 |
|
236 |
|
(20%) |
|
333 |
All-in sustaining costs ($/oz)b |
384 |
|
251 |
|
53% |
|
238 |
|
405 |
|
(41%) |
|
681 |
| Pueblo Viejo (60%) |
|
|
|
|
|
|
|
|
|
| Gold produced (000s oz) |
107 |
|
127 |
|
(16%) |
|
488 |
|
542 |
|
(10%) |
|
590 |
| Cost of sales ($/oz) |
987 |
|
895 |
|
10% |
|
896 |
|
819 |
|
9% |
|
747 |
Total cash costs ($/oz)b |
612 |
|
521 |
|
17% |
|
541 |
|
504 |
|
7% |
|
471 |
All-in sustaining costs ($/oz)b |
858 |
|
728 |
|
18% |
|
745 |
|
660 |
|
13% |
|
592 |
| Loulo-Gounkoto (80%) |
|
|
|
|
|
|
|
|
|
| Gold produced (000s oz) |
126 |
|
137 |
|
(8%) |
|
560 |
|
544 |
|
3% |
|
572 |
| Cost of sales ($/oz) |
1,139 |
|
1,109 |
|
3% |
|
1,049 |
|
1,060 |
|
(1%) |
|
1,044 |
Total cash costs ($/oz)b |
685 |
|
708 |
|
(3%) |
|
650 |
|
666 |
|
(2%) |
|
634 |
All-in sustaining costs ($/oz)b |
822 |
|
1,056 |
|
(22%) |
|
970 |
|
1,006 |
|
(4%) |
|
886 |
| Kibali (45%) |
|
|
|
|
|
|
|
|
|
| Gold produced (000s oz) |
94 |
|
95 |
|
(1%) |
|
366 |
|
364 |
|
1% |
|
366 |
| Cost of sales ($/oz) |
979 |
|
987 |
|
(1%) |
|
1,016 |
|
1,091 |
|
(7%) |
|
1,111 |
Total cash costs ($/oz)b |
582 |
|
597 |
|
(3%) |
|
627 |
|
608 |
|
3% |
|
568 |
All-in sustaining costs ($/oz)b |
776 |
|
751 |
|
3% |
|
818 |
|
778 |
|
5% |
|
693 |
| Veladero (50%) |
|
|
|
|
|
|
|
|
|
| Gold produced (000s oz) |
61 |
|
48 |
|
27% |
|
172 |
|
226 |
|
(24%) |
|
274 |
| Cost of sales ($/oz) |
1,279 |
|
1,315 |
|
(3%) |
|
1,256 |
|
1,151 |
|
9% |
|
1,188 |
Total cash costs ($/oz)b |
834 |
|
882 |
|
(5%) |
|
816 |
|
748 |
|
9% |
|
734 |
All-in sustaining costs ($/oz)b |
1,113 |
|
1,571 |
|
(29%) |
|
1,493 |
|
1,308 |
|
14% |
|
1,105 |
Porgera (47.5%)g |
|
|
|
|
|
|
|
|
|
| Gold produced (000s oz) |
— |
— |
— |
|
— |
86 |
(100%) |
|
284 |
| Cost of sales ($/oz) |
— |
— |
— |
|
— |
1,225 |
(100%) |
|
994 |
Total cash costs ($/oz)b |
— |
— |
— |
|
— |
928 |
(100%) |
|
838 |
All-in sustaining costs ($/oz)b |
— |
— |
— |
|
— |
1,115 |
(100%) |
|
1,003 |
|
|
|
|
|
|
|
|
|
|
|
|
|
|
|
|
|
|
|
|
|
|
|
|
|
|
|
|
|
|
|
|
|
|
|
|
|
|
|
|
|
|
|
|
|
|
|
|
|
|
|
|
|
|
|
|
|
|
|
|
|
|
|
|
|
|
|
|
|
|
|
|
|
|
|
|
|
|
|
|
|
|
|
|
|
|
|
|
|
|
|
|
|
|
|
|
|
|
|
|
|
|
|
|
|
|
|
|
|
|
|
|
|
|
|
|
|
|
|
|
|
|
|
|
|
|
|
|
|
|
|
|
|
|
|
|
|
|
|
|
|
|
|
|
|
|
|
|
|
|
|
|
|
|
|
|
|
|
|
|
|
|
|
|
|
|
|
|
|
|
|
|
|
|
|
|
|
|
|
|
|
|
|
|
|
|
|
|
|
|
|
|
|
|
|
|
|
|
|
|
|
|
|
|
|
|
|
|
|
|
|
|
|
|
|
|
|
|
|
|
|
|
|
|
|
|
|
|
|
|
|
|
|
|
|
|
|
|
|
|
|
|
|
|
|
|
|
|
|
|
|
|
|
|
|
|
|
|
|
|
|
|
|
|
|
|
|
|
|
|
|
|
|
|
|
|
|
|
|
|
|
|
|
|
|
|
|
|
|
|
|
|
|
|
|
|
|
|
|
|
|
|
|
|
|
|
|
|
|
|
|
|
|
|
|
|
|
|
|
|
|
|
|
|
|
|
|
|
|
|
|
|
|
|
|
|
|
|
|
|
|
|
|
|
|
|
|
|
|
|
|
|
|
|
|
|
|
|
|
|
|
|
|
|
|
|
|
|
|
|
|
|
|
|
|
|
|
|
|
|
|
|
|
|
|
|
|
|
|
|
|
|
|
|
|
|
|
|
|
|
|
|
|
|
|
|
|
|
|
|
|
|
|
|
|
|
|
|
|
|
|
|
|
|
|
|
|
|
|
|
|
|
|
|
|
|
|
|
|
|
|
|
|
|
|
|
|
|
|
|
|
|
|
|
|
|
|
|
|
|
|
|
|
|
|
|
|
|
|
|
|
|
|
|
|
|
|
|
|
|
|
|
|
|
|
|
|
|
|
|
|
|
|
|
|
|
|
|
|
|
|
|
|
|
|
|
|
|
|
| BARRICK YEAR-END 2021 |
47 |
MANAGEMENT’S DISCUSSION AND ANALYSIS |
Production and Cost Summary - Gold (continued)
|
|
|
|
|
|
|
|
|
|
|
|
|
|
|
|
|
|
|
|
|
|
|
|
|
|
|
|
|
|
|
For the three months ended |
|
For the years ended |
|
12/31/21 |
9/30/21 |
Change |
|
12/31/21 |
12/31/20 |
Change |
|
12/31/19 |
|
|
|
|
|
|
|
|
|
|
|
|
|
|
|
|
|
|
|
|
|
|
|
|
|
|
|
|
|
|
|
|
|
|
|
|
|
|
|
|
|
|
|
|
|
|
|
|
|
|
|
|
|
|
|
|
|
|
|
|
|
|
|
|
|
|
|
|
|
|
|
|
|
|
|
|
|
|
|
|
|
|
|
|
|
|
|
|
|
|
|
|
|
|
|
|
|
|
|
|
|
|
|
|
|
|
|
|
|
|
|
|
|
|
|
|
|
|
|
|
|
|
|
|
|
|
|
|
|
|
|
|
|
|
|
|
|
|
|
|
|
|
|
|
|
|
|
|
|
|
|
|
|
|
|
|
|
|
|
|
|
|
|
|
|
|
|
|
|
|
|
|
|
|
|
|
|
|
|
|
|
|
|
|
|
|
|
|
|
|
|
|
|
|
|
|
|
|
|
|
|
|
|
|
|
|
|
|
|
|
|
|
|
|
|
|
|
|
|
|
|
|
|
|
|
|
|
|
|
|
|
|
|
|
|
|
|
|
|
|
|
|
|
|
|
|
|
|
|
|
|
|
|
|
|
|
|
|
|
|
|
|
|
|
|
|
|
|
|
|
|
|
|
|
|
|
|
|
|
|
|
|
|
|
|
|
|
|
|
|
|
|
|
|
|
|
|
|
|
|
|
|
|
|
|
|
|
|
|
|
|
|
|
|
|
|
|
|
|
|
|
|
|
|
|
|
|
|
|
|
|
|
|
|
|
|
|
|
|
|
|
|
|
|
|
|
|
|
|
|
|
|
|
|
|
|
|
|
|
|
|
|
|
|
|
|
|
|
|
|
|
|
|
|
|
|
|
|
|
|
|
|
|
|
|
|
|
|
|
|
|
|
|
|
|
|
|
|
|
|
|
|
|
|
|
|
|
|
|
|
|
|
|
|
|
|
|
|
|
|
|
|
|
|
|
|
|
|
|
|
|
|
|
|
|
|
|
|
|
|
|
|
|
|
|
|
|
|
|
|
|
|
|
|
|
|
|
|
|
|
|
|
|
|
|
|
|
|
|
|
|
|
|
|
|
|
|
|
|
|
|
|
|
|
|
|
|
|
|
|
|
|
|
|
|
|
|
|
|
|
|
|
|
|
|
|
|
|
|
|
|
|
|
|
|
|
|
|
|
|
|
|
|
|
|
|
|
|
|
|
|
|
|
|
|
|
|
|
|
|
|
|
|
|
|
|
|
|
|
|
|
|
|
|
|
|
|
|
|
|
|
|
|
|
|
|
|
|
|
|
|
|
|
|
|
|
|
|
|
|
|
|
|
|
|
|
|
|
|
|
|
|
|
|
|
|
|
|
|
|
| Tongon (89.7%) |
|
|
|
|
|
|
|
|
|
| Gold produced (000s oz) |
50 |
|
41 |
|
22% |
|
187 |
|
255 |
(27%) |
|
245 |
| Cost of sales ($/oz) |
1,494 |
|
1,579 |
|
(5%) |
|
1,504 |
|
1,334 |
13% |
|
1,469 |
Total cash costs ($/oz)b |
1,205 |
|
1,139 |
|
6% |
|
1,093 |
|
747 |
46% |
|
787 |
All-in sustaining costs ($/oz)b |
1,301 |
|
1,329 |
|
(2%) |
|
1,208 |
|
791 |
53% |
|
844 |
Hemlo |
|
|
|
|
|
|
|
|
|
| Gold produced (000s oz) |
35 |
|
26 |
|
35% |
|
150 |
223 |
(33%) |
|
213 |
| Cost of sales ($/oz) |
1,770 |
|
1,870 |
|
(5%) |
|
1,693 |
1,256 |
35% |
|
1,137 |
Total cash costs ($/oz)b |
1,481 |
|
1,493 |
|
(1%) |
|
1,388 |
1,056 |
31% |
|
904 |
All-in sustaining costs ($/oz)b |
1,938 |
|
2,276 |
|
(15%) |
|
1,970 |
1,423 |
38% |
|
1,140 |
North Marah |
|
|
|
|
|
|
|
|
|
| Gold produced (000s oz) |
69 |
|
66 |
|
5% |
|
260 |
261 |
0% |
|
251 |
| Cost of sales ($/oz) |
858 |
|
993 |
|
(14%) |
|
966 |
992 |
(3%) |
|
953 |
|
Total cash costs ($/oz)b |
679 |
|
796 |
|
(15%) |
|
777 |
702 |
11% |
|
646 |
|
All-in sustaining costs ($/oz)b |
1,033 |
|
985 |
|
5% |
|
1,001 |
929 |
8% |
|
802 |
|
Buzwagih,i |
|
|
|
|
|
|
|
|
|
| Gold produced (000s oz) |
|
4 |
|
|
|
40 |
84 |
(52%) |
|
83 |
| Cost of sales ($/oz) |
|
1,000 |
|
|
|
1,334 |
1,021 |
31% |
|
1,240 |
Total cash costs ($/oz)b |
|
967 |
|
|
|
1,284 |
859 |
49% |
|
1,156 |
All-in sustaining costs ($/oz)b |
|
970 |
|
|
|
1,291 |
871 |
48% |
|
1,178 |
Bulyanhuluh |
|
|
|
|
|
|
|
|
|
| Gold produced (000s oz) |
57 |
|
53 |
|
8% |
|
178 |
44 |
304% |
|
27 |
| Cost of sales ($/oz) |
956 |
|
1,073 |
|
(11%) |
|
1,079 |
1,499 |
(28%) |
|
1,207 |
Total cash costs ($/oz)b |
567 |
|
724 |
|
(22%) |
|
709 |
832 |
(15%) |
|
676 |
All-in sustaining costs ($/oz)b |
897 |
|
827 |
|
8% |
|
891 |
895 |
0% |
|
773 |
Kalgoorlie (50%)j |
|
|
|
|
|
|
|
|
|
| Gold produced (000s oz) |
|
|
|
|
|
|
|
|
206 |
| Cost of sales ($/oz) |
|
|
|
|
|
|
|
|
1,062 |
Total cash costs ($/oz)b |
|
|
|
|
|
|
|
|
873 |
All-in sustaining costs ($/oz)b |
|
|
|
|
|
|
|
|
1,183 |
|
|
|
|
|
|
|
|
|
|
|
|
|
|
|
|
|
|
|
|
|
|
|
|
|
|
|
|
|
|
|
|
|
|
|
|
|
|
|
|
|
|
|
|
|
|
|
|
|
|
|
|
|
|
|
|
|
|
|
|
|
|
|
|
|
|
|
|
|
|
|
|
|
|
|
|
|
|
|
|
|
|
|
|
|
|
|
|
|
|
|
|
|
|
|
|
|
|
|
|
|
|
|
|
|
|
|
|
|
|
|
|
|
|
|
|
|
|
|
|
|
|
|
|
|
|
|
|
|
|
|
|
|
|
|
|
|
|
|
|
|
|
|
|
|
|
|
|
|
|
Total Attributable to Barrickk |
|
|
|
|
|
|
|
|
|
| Gold produced (000s oz) |
1,203 |
|
1,092 |
|
10% |
|
4,437 |
|
4,760 |
(7%) |
|
5,465 |
Cost of sales ($/oz)l |
1,075 |
|
1,122 |
|
(4%) |
|
1,093 |
|
1,056 |
4% |
|
1,005 |
Total cash costs ($/oz)b |
715 |
|
739 |
|
(3%) |
|
725 |
|
699 |
4% |
|
671 |
All-in sustaining costs ($/oz)b |
971 |
|
1,034 |
|
(6%) |
|
1,026 |
|
967 |
6% |
|
894 |
a.Represents the combined results of Cortez, Goldstrike (including our 60% share of South Arturo) and our 75% interest in Turquoise Ridge until June 30, 2019. Commencing July 1, 2019, the date Nevada Gold Mines was established, the results represent our 61.5% interest in Cortez, Carlin (including Goldstrike and NGM’s 60% interest in South Arturo up until May 30, 2021 and 100% interest thereafter), Turquoise Ridge (including Twin Creeks), Phoenix and Long Canyon.
b.Further information on these non-GAAP financial measures, including detailed reconciliations, is included on pages 94 to 120 of this MD&A. c.On July 1, 2019, Barrick's Goldstrike and Newmont's Carlin were contributed to Nevada Gold Mines and are now referred to as Carlin. As a result, the amounts presented represent Goldstrike on a 100% basis (including our 60% share of South Arturo) up until June 30, 2019, and the combined results of Carlin and Goldstrike (including our share of South Arturo) on a 61.5% basis thereafter. On September 7, 2021, Barrick announced NGM had entered into an Exchange Agreement with i-80 Gold to acquire the 40% interest in South Arturo that NGM did not already own in exchange for the Lone Tree and Buffalo Mountain properties and infrastructure. Operating results within our 61.5% interest in Carlin includes NGM’s 60% interest in South Arturo up until May 30, 2021, and 100% interest thereafter, reflecting the terms of the Exchange Agreement which closed on October 14, 2021.
d.On July 1, 2019, Cortez was contributed to Nevada Gold Mines, a joint venture with Newmont. As a result, the amounts presented are on a 100% basis up until June 30, 2019, and on a 61.5% basis thereafter. Starting in the first quarter of 2021, Goldrush is reported as part of Cortez as it is operated by Cortez management. Comparative periods have been restated to include Goldrush.
e.Barrick owned 75% of Turquoise Ridge through to the end of the second quarter of 2019, with our joint venture partner, Newmont, owning the remaining 25%. Turquoise Ridge was proportionately consolidated on the basis that the joint venture partners that have joint control have rights to the assets and obligations for the liabilities relating to the arrangement. The figures presented in this table are based on our 75% interest in Turquoise Ridge until June 30, 2019. On July 1, 2019, Barrick's 75% interest in Turquoise Ridge and Newmont's Twin Creeks and 25% interest in Turquoise Ridge were contributed to Nevada Gold Mines. Starting July 1, 2019, the results represent our 61.5% share of Turquoise Ridge and Twin Creeks, now referred to as Turquoise Ridge.
f.A 61.5% interest in these sites was acquired as a result of the formation of Nevada Gold Mines on July 1, 2019.
g.As Porgera was placed on care and maintenance on April 25, 2020, no operating data or per ounce data has been provided starting the third quarter of 2020.
h.Formerly part of Acacia Mining plc. On September 17, 2019, Barrick acquired all of the shares of Acacia it did not own. Operating results are included at 63.9% until September 30, 2019 (notwithstanding the completion of the Acacia transaction on September 17, 2019, we consolidated our interest in Acacia and recorded a non-controlling interest of 36.1% in the income statement for the entirety of the third quarter of 2019 as a matter of convenience), on a 100% basis from October 1, 2019, to December 31, 2019, and on an 84% basis thereafter as the GoT’s 16% free-carried interest was made effective from January 1, 2020.
i.With the end of mining at Buzwagi in the third quarter of 2021, as previously reported, we have ceased to include production or non-GAAP cost metrics for Buzwagi from October 1, 2021 onwards.
j.On November 28, 2019, we completed the sale of our 50% interest in Kalgoorlie in Western Australia to Saracen Mineral Holdings Limited for total cash consideration of $750 million. Accordingly, the amounts presented represent our 50% interest until November 28, 2019.
k.Excludes Pierina, Golden Sunlight starting in the third quarter of 2019, Morila (40%) starting in the third quarter of 2019 up until its divestiture in November 2020, Lagunas Norte starting in the fourth quarter of 2019 up until its divestiture in June 1, 2021 and Buzwagi starting in the fourth quarter of 2021. Some of these assets are producing incidental ounces while in closure or care and maintenance.
l.Gold cost of sales per ounce is calculated as cost of sales across our gold operations (excluding sites in closure or care and maintenance) divided by ounces sold (both on an attributable basis using Barrick’s ownership share).
|
|
|
|
|
|
|
|
|
| BARRICK YEAR-END 2021 |
48 |
MANAGEMENT’S DISCUSSION AND ANALYSIS |
Production and Cost Summary - Copper
|
|
|
|
|
|
|
|
|
|
|
|
|
|
|
|
|
|
|
|
|
|
|
|
|
|
|
|
|
|
|
For the three months ended |
|
For the years ended |
|
12/31/21 |
9/30/21 |
Change |
|
12/31/21 |
12/31/20 |
Change |
|
12/31/19 |
|
|
|
|
|
|
|
|
|
|
|
|
|
|
|
|
|
|
|
|
|
|
|
|
|
|
|
|
|
|
|
|
|
|
|
|
|
|
|
|
|
|
|
|
|
|
|
|
|
|
|
|
|
|
|
|
|
|
|
|
|
|
|
|
|
|
|
|
|
|
|
|
|
|
|
|
|
|
|
|
|
|
|
|
|
|
|
|
|
|
|
|
|
|
|
|
|
|
|
|
|
|
|
|
|
|
|
|
|
|
|
|
|
|
|
|
|
|
|
|
|
|
|
|
|
|
|
|
|
|
|
|
|
|
|
|
|
|
|
|
|
|
|
|
|
|
|
|
|
|
|
|
|
|
|
|
|
|
|
|
|
|
|
|
|
|
|
|
|
|
|
|
|
|
|
|
|
|
|
|
|
|
|
|
|
|
|
|
|
|
|
|
|
|
|
|
|
|
|
|
|
|
|
|
|
|
|
|
|
|
|
|
|
|
|
|
|
|
|
|
|
|
|
|
|
|
|
|
|
|
|
|
|
|
|
|
|
|
|
|
|
|
|
|
|
|
|
|
|
|
|
|
|
|
|
|
|
|
|
|
|
|
|
|
|
|
|
|
|
|
|
|
|
|
|
|
|
|
|
|
|
|
|
|
|
|
|
|
|
|
|
|
|
|
|
|
|
|
|
|
|
|
|
|
|
|
|
|
|
|
|
|
|
|
|
|
|
|
|
|
|
|
|
|
|
|
|
|
|
|
|
|
|
|
|
|
|
|
|
|
|
|
|
|
|
|
|
|
|
|
|
|
|
|
|
|
|
|
|
|
|
|
|
|
|
|
|
|
|
|
|
|
|
|
|
|
|
|
|
|
|
|
|
|
|
|
|
|
|
|
|
|
|
|
|
|
|
|
|
|
|
|
|
|
|
|
|
|
|
|
|
|
|
|
|
|
|
|
|
|
|
|
|
|
|
|
|
|
|
|
|
|
|
|
|
|
|
|
|
|
|
|
|
|
|
|
|
|
|
|
| Lumwana |
|
|
|
|
|
|
|
|
|
| Copper production (millions lbs) |
78 |
|
57 |
|
37% |
|
242 |
276 |
|
(12%) |
|
238 |
|
| Cost of sales ($/lb) |
2.16 |
|
2.54 |
|
(15%) |
|
2.25 |
2.01 |
|
12% |
|
2.13 |
|
C1 cash costs ($/lb)a |
1.54 |
|
1.76 |
|
(13%) |
|
1.62 |
1.56 |
|
4% |
|
1.79 |
|
All-in sustaining costs ($/lb)a |
3.29 |
|
2.68 |
|
23% |
|
2.80 |
2.43 |
|
15% |
|
3.04 |
|
Zaldívar (50%) |
|
|
|
|
|
|
|
|
|
| Copper production (millions lbs) |
27 |
|
24 |
|
13% |
|
97 |
106 |
|
(8%) |
|
128 |
|
| Cost of sales ($/lb) |
3.14 |
|
3.13 |
|
0% |
|
3.19 |
2.46 |
|
30% |
|
2.46 |
|
C1 cash costs ($/lb)a |
2.35 |
|
2.33 |
|
1% |
|
2.38 |
1.79 |
|
33% |
|
1.77 |
|
All-in sustaining costs ($/lb)a |
3.42 |
|
2.77 |
|
23% |
|
2.94 |
2.25 |
|
31% |
|
2.15 |
|
| Jabal Sayid (50%) |
|
|
|
|
|
|
|
|
|
| Copper production (millions lbs) |
21 |
|
19 |
|
11% |
|
76 |
75 |
|
1% |
|
66 |
|
| Cost of sales ($/lb) |
1.36 |
|
1.51 |
|
(10%) |
|
1.38 |
1.42 |
|
(3%) |
|
1.53 |
|
C1 cash costs ($/lb)a |
1.11 |
|
1.35 |
|
(18%) |
|
1.18 |
1.11 |
|
6% |
|
1.26 |
|
All-in sustaining costs ($/lb)a |
1.27 |
|
1.55 |
|
(18%) |
|
1.33 |
1.24 |
|
7% |
|
1.51 |
|
| Total Copper |
|
|
|
|
|
|
|
|
|
| Copper production (millions lbs) |
126 |
|
100 |
|
26% |
|
415 |
457 |
(9%) |
|
432 |
Cost of sales ($/lb)b |
2.21 |
|
2.57 |
|
(14%) |
|
2.32 |
2.02 |
15% |
|
2.14 |
C1 cash costs ($/lb)a |
1.63 |
|
1.85 |
|
(12%) |
|
1.72 |
1.54 |
12% |
|
1.69 |
All-in sustaining costs ($/lb)a |
2.92 |
|
2.60 |
|
12% |
|
2.62 |
2.23 |
17% |
|
2.52 |
a.Further information on these non-GAAP financial measures, including detailed reconciliations, is included on pages 94 to 120 of this MD&A. b.Copper cost of sales per pound is calculated as cost of sales across our copper operations divided by pounds sold (both on an attributable basis using Barrick’s ownership share).
Operating Performance
Review of Operating Performance
Our presentation of reportable operating segments consists of nine gold mines (Carlin, Cortez, Turquoise Ridge, Pueblo Viejo, Loulo-Gounkoto, Kibali, Veladero, North Mara and Bulyanhulu). Starting in the first quarter of 2021, Goldrush was included as part of Cortez as management began reviewing the operating results and assessing performance on a combined level. The remaining operating segments, including our remaining gold mines, copper mines, and
project, have been grouped into an “other” category and will not be reported on individually. Segment performance is evaluated based on a number of measures including operating income before tax, production levels and unit production costs. Certain costs are managed on a consolidated basis and are therefore not reflected in segment income.
|
|
|
|
|
|
|
|
|
| BARRICK YEAR-END 2021 |
49 |
MANAGEMENT’S DISCUSSION AND ANALYSIS |
Nevada Gold Mines (61.5% basis)a, Nevada USA
Summary of Operating and Financial Data
|
|
|
|
|
|
|
|
|
|
|
|
|
|
|
|
|
|
|
|
|
|
|
|
|
|
|
|
|
|
|
For the three months ended |
|
For the years ended |
| |
12/31/21 |
9/30/21 |
Change |
|
12/31/21 |
12/31/20 |
Change |
|
12/31/19 |
| Total tonnes mined (000s) |
45,593 |
|
48,494 |
|
(6)% |
|
198,725 |
|
223,148 |
|
(11)% |
|
189,456 |
|
| Open pit ore |
8,763 |
|
11,553 |
|
(24)% |
|
37,670 |
|
36,305 |
|
4% |
|
26,942 |
|
| Open pit waste |
35,468 |
|
35,616 |
|
0% |
|
155,724 |
|
181,675 |
|
(14)% |
|
157,868 |
|
| Underground |
1,362 |
|
1,325 |
|
3% |
|
5,331 |
|
5,168 |
|
3% |
|
4,646 |
|
| Average grade (grams/tonne) |
|
|
|
|
|
|
|
|
|
| Open pit mined |
0.65 |
|
0.69 |
|
(6)% |
|
0.84 |
|
1.14 |
|
(26)% |
|
0.93 |
|
| Underground mined |
9.86 |
|
9.28 |
|
6% |
|
9.32 |
|
9.67 |
|
(4)% |
|
10.52 |
|
| Processed |
1.90 |
|
1.50 |
|
27% |
|
1.78 |
|
2.02 |
|
(12)% |
|
2.29 |
|
| Ore tonnes processed (000s) |
12,194 |
|
14,697 |
|
(17)% |
|
49,232 |
|
43,174 |
|
14% |
|
36,724 |
|
| Oxide mill |
3,054 |
|
2,991 |
|
2% |
|
12,334 |
|
12,907 |
|
(4)% |
|
8,338 |
|
| Roaster |
1,386 |
|
1,108 |
|
25% |
|
4,866 |
|
5,222 |
|
(7)% |
|
5,377 |
|
| Autoclave |
1,203 |
|
1,204 |
|
0% |
|
4,683 |
|
5,418 |
|
(14)% |
|
5,656 |
|
| Heap leach |
6,551 |
|
9,394 |
|
(30)% |
|
27,349 |
|
19,627 |
|
39% |
|
17,353 |
|
Recovery rateb |
80 |
% |
80 |
% |
0% |
|
79 |
% |
80 |
% |
(1)% |
|
82 |
% |
Oxide Millb |
75 |
% |
79 |
% |
(5)% |
|
77 |
% |
73 |
% |
5% |
|
76 |
% |
| Roaster |
86 |
% |
86 |
% |
0% |
|
86 |
% |
86 |
% |
0% |
|
87 |
% |
| Autoclave |
68 |
% |
69 |
% |
(1)% |
|
69 |
% |
71 |
% |
(3)% |
|
74 |
% |
| Gold produced (000s oz) |
604 |
|
495 |
|
22% |
|
2,036 |
|
2,131 |
|
(4)% |
|
2,218 |
|
| Oxide mill |
113 |
|
98 |
|
15% |
|
364 |
|
300 |
|
21% |
|
336 |
|
| Roaster |
308 |
|
214 |
|
44% |
|
960 |
|
1,070 |
|
(10)% |
|
1,070 |
|
| Autoclave |
102 |
|
102 |
|
0% |
|
410 |
|
468 |
|
(12)% |
|
547 |
|
| Heap leach |
81 |
|
81 |
|
0% |
|
302 |
|
293 |
|
3% |
|
265 |
|
| Gold sold (000s oz) |
611 |
|
485 |
|
26% |
|
2,039 |
|
2,134 |
|
(4)% |
|
2,223 |
|
| Revenue ($ millions) |
1,128 |
|
891 |
|
27% |
|
3,773 |
|
3,867 |
|
(2)% |
|
3,128 |
|
| Cost of sales ($ millions) |
625 |
|
544 |
|
15% |
|
2,186 |
|
2,186 |
|
0% |
|
2,035 |
|
| Income ($ millions) |
617 |
|
333 |
|
85% |
|
1,675 |
|
1,636 |
|
2% |
|
1,050 |
|
EBITDA ($ millions)c |
793 |
|
495 |
|
60% |
|
2,305 |
|
2,232 |
|
3% |
|
1,642 |
|
EBITDA margind |
70 |
% |
56 |
% |
27% |
|
61 |
% |
58 |
% |
5% |
|
52 |
% |
Capital expenditures ($ millions)e |
135 |
|
133 |
|
2% |
|
555 |
|
583 |
|
(5)% |
|
627 |
|
Minesite sustainingc |
115 |
|
104 |
|
11% |
|
458 |
|
459 |
|
0% |
|
380 |
|
Projectc |
20 |
|
29 |
|
(31)% |
|
97 |
|
124 |
|
(22)% |
|
247 |
|
| Cost of sales ($/oz) |
1,023 |
|
1,123 |
|
(9)% |
|
1,072 |
|
1,029 |
|
4% |
|
924 |
|
Total cash costs ($/oz)c |
687 |
|
734 |
|
(6)% |
|
705 |
|
702 |
|
0% |
|
634 |
|
All-in sustaining costs ($/oz)c |
893 |
|
975 |
|
(8)% |
|
949 |
|
941 |
|
1% |
|
828 |
|
All-in costs ($/oz)c |
927 |
|
1,035 |
|
(10)% |
|
997 |
|
998 |
|
0% |
|
938 |
|
a.Barrick is the operator of Nevada Gold Mines and owns 61.5% with Newmont Corporation owning the remaining 38.5%. Nevada Gold Mines is accounted for as a subsidiary with a 38.5% non-controlling interest. These results represent the combined results of Cortez, Goldstrike (including our 60% share of South Arturo) and our 75% interest in Turquoise Ridge until June 30, 2019. Commencing July 1, 2019, the date Nevada Gold Mines was established, the results represent our 61.5% interest in Cortez, Carlin, Turquoise Ridge (including Twin Creeks), Phoenix and Long Canyon. Carlin includes Goldstrike and our share of South Arturo. On September 7, 2021, Barrick announced NGM had entered into an Exchange Agreement with i-80 Gold to acquire the 40% interest in South Arturo that NGM did not already own in exchange for the Lone Tree and Buffalo Mountain properties and infrastructure. Operating results within our 61.5% interest in Carlin includes NGM’s 60% interest in South Arturo up until May 30, 2021, and 100% interest thereafter, reflecting the terms of the Exchange Agreement which closed on October 14, 2021.
b.Excludes the Gold Quarry (Mill 5) concentrator.
c.Further information on these non-GAAP financial measures, including detailed reconciliations, is included on pages 94 to 120 of this MD&A. d.Represents EBITDA divided by revenue.
e.Amounts presented exclude capitalized interest.
Nevada Gold Mines includes Carlin, Cortez, Turquoise Ridge, Phoenix and Long Canyon. Barrick is the operator of the joint venture and owns 61.5%, with Newmont owning the remaining 38.5%. Refer to the following pages for a detailed discussion of each minesite’s results.
Regulatory Matters
Mining Education tax
The Nevada Legislative Session ended on May 31, 2021 with the passing of Assembly Bill 495, now named the Mining Education Tax, which is a new mining excise tax applied to gross proceeds. Importantly, the revenue generated by this new excise tax will be directed towards
|
|
|
|
|
|
|
|
|
| BARRICK YEAR-END 2021 |
50 |
MANAGEMENT’S DISCUSSION AND ANALYSIS |
education. This new tax became effective on July 1, 2021 and is a tiered tax, with the highest rate at 1.1%, the first payment of which is expected in April 2022. The bill was a negotiated alternative to the three resolutions that were passed in the special session that commenced on July 31, 2020, none of which passed a second approval in the legislative session ended on May 31, 2021. This was a positive outcome and the result of months of negotiation between Barrick, the Nevada Mining Association, legislators, the Nevada Governor’s office and other key stakeholders.
A number of rural Nevada counties and NGM had filed lawsuits in the Nevada District Court, challenging the constitutionality of the three resolutions from July 2020. These lawsuits were subsequently consolidated into one. On January 27, 2021, the Nevada District Court granted a summary judgment in favor of the Nevada Legislature, concluding that the matter is not yet ripe for adjudication. On February 24, 2021, NGM filed an appeal to this decision to the Nevada Supreme Court. The Nevada Supreme Court has ordered the appeal dismissed as moot and that the district court decision does not have precedential effect.
The tax does not take into consideration expenses or costs incurred to generate gross proceeds, therefore, it is treated as a gross receipts tax and not as a tax based on income subject to IAS 12. As a result, this new tax is reported as a component of cost of sales and not as an income tax expense.
Federal tax and royalty
In July 2021, the U.S. Congress began discussing proposed changes to the General Mining Law of 1872 (“General Mining Law”) which governs mining activities on federal land in the United States. The General Mining Law was designed to incentivize mining activity on federal lands by granting miners the right to prospect, explore, and mine while meeting all applicable environmental and other regulatory requirements, generating fees, taxable revenue, investment and employment benefiting the U.S. federal and state governments. Nevada Gold Mines conducts a portion of its mining activities on federal lands in Nevada pursuant to the General Mining Law.
The U.S. House version of the Build Back Better Act (the “Act”) contained provisions that would have amended the General Mining Law; however, the Act failed to reach a vote in the U.S. Senate. The Company was engaged in constructive discussions with legislators and affected stakeholders regarding the proposed changes to the General Mining Law that were included in the Act. The Company will continue to be engaged on any proposed changes to the General Mining Law and continues to support updates that will result in a more secure legal framework for Barrick and the U.S. hard rock mining industry as a whole.
|
|
|
|
|
|
|
|
|
| BARRICK YEAR-END 2021 |
51 |
MANAGEMENT’S DISCUSSION AND ANALYSIS |
Carlin (61.5% basis)a, Nevada USA
Summary of Operating and Financial Data
|
|
|
|
|
|
|
|
|
|
|
|
|
|
|
|
|
|
|
|
|
|
|
|
|
|
|
|
|
|
|
For the three months ended |
|
For the years ended |
| |
12/31/21 |
9/30/21 |
Change |
|
12/31/21 |
12/31/20 |
Change |
|
12/31/19 |
| Total tonnes mined (000s) |
17,833 |
|
19,839 |
|
(10)% |
|
75,207 |
|
72,820 |
|
3% |
|
49,343 |
|
| Open pit ore |
1,381 |
|
2,777 |
|
(50)% |
|
6,472 |
|
6,054 |
|
7% |
|
4,773 |
|
| Open pit waste |
15,622 |
|
16,285 |
|
(4)% |
|
65,507 |
|
63,579 |
|
3% |
|
41,978 |
|
| Underground |
830 |
|
777 |
|
7% |
|
3,228 |
|
3,187 |
|
1% |
|
2,592 |
|
| Average grade (grams/tonne) |
|
|
|
|
|
|
|
|
|
| Open pit mined |
0.91 |
|
0.69 |
|
32% |
|
0.78 |
|
2.08 |
|
(63)% |
|
2.08 |
|
| Underground mined |
9.23 |
|
8.98 |
|
3% |
|
8.85 |
|
9.36 |
|
(5)% |
|
9.09 |
|
| Processed |
3.48 |
|
2.36 |
|
47% |
|
2.97 |
|
3.69 |
|
(20)% |
|
3.80 |
|
| Ore tonnes processed (000s) |
3,373 |
|
4,627 |
|
(27)% |
|
14,282 |
|
12,195 |
|
17% |
|
10,467 |
|
| Oxide mill |
671 |
|
629 |
|
7% |
|
2,735 |
|
2,936 |
|
(7)% |
|
1,368 |
|
| Roaster |
1,029 |
|
817 |
|
26% |
|
3,616 |
|
3,743 |
|
(3)% |
|
3,627 |
|
| Autoclave |
571 |
|
569 |
|
0% |
|
2,221 |
|
3,071 |
|
(28)% |
|
4,169 |
|
| Heap leach |
1,102 |
|
2,612 |
|
(58)% |
|
5,710 |
|
2,445 |
|
134% |
|
1,303 |
|
Recovery rateb |
78 |
% |
77 |
% |
1% |
|
77 |
% |
79 |
% |
(3)% |
|
75 |
% |
| Roaster |
85 |
% |
85 |
% |
0% |
|
85 |
% |
86 |
% |
(1)% |
|
86 |
% |
| Autoclave |
47 |
% |
48 |
% |
(2)% |
|
46 |
% |
57 |
% |
(19)% |
|
59 |
% |
| Gold produced (000s oz) |
295 |
|
209 |
|
41% |
|
923 |
|
1,024 |
|
(10)% |
|
968 |
|
| Oxide mill |
23 |
|
12 |
|
92% |
|
51 |
|
38 |
|
34% |
|
25 |
|
| Roaster |
229 |
|
164 |
|
40% |
|
728 |
|
784 |
|
(7)% |
|
694 |
|
| Autoclave |
27 |
|
26 |
|
4% |
|
102 |
|
161 |
|
(37)% |
|
225 |
|
| Heap leach |
16 |
|
7 |
|
129% |
|
42 |
|
41 |
|
2% |
|
24 |
|
| Gold sold (000s oz) |
297 |
|
202 |
|
47% |
|
922 |
|
1,024 |
|
(10)% |
|
967 |
|
| Revenue ($ millions) |
535 |
|
359 |
|
49% |
|
1,653 |
|
1,812 |
|
(9)% |
|
1,355 |
|
| Cost of sales ($ millions) |
268 |
|
205 |
|
31% |
|
893 |
|
999 |
|
(11)% |
|
971 |
|
|
|
|
|
|
|
|
|
|
|
|
|
|
|
|
|
|
|
|
|
| Income ($ millions) |
247 |
|
147 |
|
68% |
|
733 |
|
795 |
|
(8)% |
|
370 |
|
EBITDA ($ millions)c |
298 |
|
188 |
|
59% |
|
903 |
|
983 |
|
(8)% |
|
609 |
|
EBITDA margind |
56 |
% |
52 |
% |
8% |
|
55 |
% |
54 |
% |
2% |
|
45 |
% |
Capital expenditures ($ millions)e |
63 |
|
55 |
|
15% |
|
260 |
|
231 |
|
13% |
|
211 |
|
Minesite sustainingc |
63 |
|
55 |
|
15% |
|
260 |
|
231 |
|
13% |
|
211 |
|
Projectc |
0 |
|
0 |
|
0% |
|
0 |
|
0 |
|
0% |
|
0 |
|
| Cost of sales ($/oz) |
899 |
|
1,017 |
|
(12)% |
|
968 |
|
976 |
|
(1)% |
|
1,004 |
|
Total cash costs ($/oz)c |
728 |
|
814 |
|
(11)% |
|
782 |
|
790 |
|
(1)% |
|
746 |
|
All-in sustaining costs ($/oz)c |
950 |
|
1,124 |
|
(15)% |
|
1,087 |
|
1,041 |
|
4% |
|
984 |
|
All-in costs ($/oz)c |
950 |
|
1,124 |
|
(15)% |
|
1,087 |
|
1,041 |
|
4% |
|
984 |
|
a.On July 1, 2019, Barrick's Goldstrike and Newmont's Carlin were contributed to Nevada Gold Mines and are now collectively referred to as Carlin. As a result, the amounts presented represent Goldstrike on a 100% basis (including our 60% share of South Arturo) up until June 30, 2019, and the combined results of Carlin and Goldstrike (including our share of South Arturo) on a 61.5% basis thereafter. On September 7, 2021, Barrick announced NGM had entered into an Exchange Agreement with i-80 Gold to acquire the 40% interest in South Arturo that NGM did not already own in exchange for the Lone Tree and Buffalo Mountain properties and infrastructure. Operating results within our 61.5% interest in Carlin includes NGM’s 60% interest in South Arturo up until May 30, 2021, and 100% interest thereafter, reflecting the terms of the Exchange Agreement which closed on October 14, 2021.
b.Excludes the Gold Quarry (Mill 5) concentrator.
c.Further information on these non-GAAP financial measures, including detailed reconciliations, is included on pages 94 to 120 of this MD&A. d.Represents EBITDA divided by revenue.
e.Amounts presented exclude capitalized interest.
Safety and Environment
There were two lost time injuries (“LTI”) recorded at Carlin during the fourth quarter of 2021, which resulted in an LTIFR8 of 0.99, compared to 0.97 in the prior quarter. The TRIFR8 for the fourth quarter of 2021 was 3.47 per million hours worked, compared to 2.42 in the prior quarter.
There were 10 LTIs recorded in 2021, which resulted in an LTIFR8 of 1.19, compared to 1.06 in 2020. The TRIFR8 for 2021 was 3.08 per million hours worked,
compared to 3.48 in the prior year. No Class 19 environmental incidents occurred during 2021 or 2020.
Financial Results
Q4 2021 compared to Q3 2021
Carlin's income for the fourth quarter of 2021 was 68% higher than the prior quarter due to a significant increase in sales volume, a lower cost of sales per ounce7 and a higher realized gold price6.
|
|
|
|
|
|
|
|
|
| BARRICK YEAR-END 2021 |
52 |
MANAGEMENT’S DISCUSSION AND ANALYSIS |
Gold production in the fourth quarter of 2021 was 41% higher compared to the prior quarter, mainly resulting from higher roaster production due to the previously disclosed mechanical mill failure at the Goldstrike roaster on May 26, 2021, which resulted in a 40% reduction in throughput for the majority of the third quarter. Repairs were completed by the end of September, ahead of schedule. Mitigating actions taken in the third quarter of 2021 included the prioritization of ore with higher carbonaceous content for the majority of the quarter to take advantage of the extra retention time in the roasting circuit to deliver a higher recovery rate from this type of ore. Those actions allowed the complex to optimize roaster throughput and recoveries, which positively impacted the fourth quarter of 2021. Higher grade underground ore stockpiled through the roaster repair period, as described above, was processed in the fourth quarter of 2021. Total tonnes mined were 10% lower compared to the prior quarter, driven by the open pit. Open pit ore tonnes mined were 50% lower compared to the prior quarter, driven by a decrease in heap leach ore mined from the Gold Quarry and Gold Star open pits as planned. Average open pit mined grade was 32% higher than the prior quarter, due to a lower proportion of heap leach ore mined. Underground mined tonnes and grade were 7% and 3% higher, respectively, than the prior quarter due to mine sequencing across Carlin’s underground operations.
Cost of sales per ounce7 and total cash costs per ounce6 in the fourth quarter of 2021 were 12% and 11% lower, respectively, than the prior quarter due to continued cost discipline combined with the impact of higher sales volume. In the fourth quarter of 2021, all-in sustaining costs per ounce6 decreased by 15% compared to the prior quarter, primarily due to lower total cash costs per ounce6 and lower minesite sustaining capital expenditures6 on a per ounce basis.
Capital expenditures in the fourth quarter of 2021 increased by 15% compared to the prior quarter, due to an increase in waste tonnes from increased stripping at Goldstrike 5th NW and Gold Star Phase 3, partially offset by lower sustaining capital expenditures6 and underground capital development.
2021 compared to 2020
Carlin's income for the twelve month period ended December 31, 2021 was 8% lower than the same prior year period primarily due to a decrease in sales volume, partially offset by a slightly lower cost of sales per ounce7 and a higher realized gold price6.
INCOME AND EBITDA6,a
a The results represent Goldstrike on a 100% basis (including our 60% share of South Arturo) from January 1, 2019 to June 30, 2019 and the combined results of Carlin and Goldstrike (including NGM’s 60% interest in South Arturo up until May 30, 2021 and 100% interest thereafter) on a 61.5% basis from July 1, 2019 onwards.
Gold production for the twelve month period ended December 31, 2021 was 10% lower compared to the prior year, mainly due to the previously disclosed mechanical mill failure at the Goldstrike roaster, which negatively impacted production in the current year. In addition, lower production from the Goldstrike autoclave was mainly driven by the transition from acid to alkaline ore. As previously disclosed, the Goldstrike autoclave completed processing of acidic ore at the end of the third quarter of 2020. Total tonnes mined increased 3% compared to the same prior year period, mainly due to shorter hauls as the Goldstrike pit has transitioned from mining ore in the 4th NW layback to stripping of the 5th NW layback. Open pit ore tonnes mined increased by 7% compared to the same prior year period due to an increase in heap leach ore mined from the Gold Quarry and Gold Star open pits, offsetting the transition to stripping at the Goldstrike open pit as described above. Average open pit mined grade decreased by 63% due to the mining of a higher proportion of heap leach ore compared to the same prior year period. Underground tonnes mined were 1% higher compared to the same prior year period due to upgraded equipment and increased haulage capacity, while underground mined grade decreased by 5% driven by a change in the mix of ore sources across the different underground operations as per the mine plan.
PRODUCTIONa (thousands of ounces)
a The results include NGM’s 60% interest in South Arturo up until May 30, 2021 and 100% interest thereafter.
b Based on the midpoint of the guidance range.
Cost of sales per ounce7 and total cash costs per ounce6 for the twelve month period ended December 31, 2021 were slightly lower than the same prior year period, with operating cost discipline offsetting the impact of lower sales volume. For the twelve-month period December 31, 2021,
|
|
|
|
|
|
|
|
|
| BARRICK YEAR-END 2021 |
53 |
MANAGEMENT’S DISCUSSION AND ANALYSIS |
all-in sustaining costs per ounce6 was 4% higher than the prior year, primarily due to the impact of higher minesite sustaining capital expenditures6.
COST OF SALES7, TOTAL CASH COSTS6
AND ALL-IN SUSTAINING COSTS6 ($ per ounce)
a Based on the midpoint of the guidance range.
Capital expenditures for the twelve month period ended December 31, 2021 increased by 13% from the prior year due to an increase in capitalized waste stripping and the purchase of an oxygen plant at the Goldstrike autoclave, which was previously owned by a third party and is expected to reduce operating costs going forward.
2021 compared to Guidance
Gold production for 2021 of 923 thousand ounces was below the guidance range of 940 to 1,000 thousand ounces as a result of the previously disclosed mechanical mill failure at the Goldstrike roaster on May 26, 2021 which was repaired in late September. Despite lower production and inflationary pressures, rigorous cost discipline resulted in all cost metrics coming in within guidance. Cost of sales per ounce7 of $968 was within the guidance range of $920 to $970 per ounce. Total cash costs per ounce6 and all-in sustaining costs per ounce6 of $782 and $1,087, respectively, were also within the guidance ranges of $740 to $790 per ounce, and $1,050 to $1,100 per ounce, respectively.
|
|
|
|
|
|
|
|
|
| BARRICK YEAR-END 2021 |
54 |
MANAGEMENT’S DISCUSSION AND ANALYSIS |
Cortez (61.5% basis)a, Nevada USA
Summary of Operating and Financial Data
|
|
|
|
|
|
|
|
|
|
|
|
|
|
|
|
|
|
|
|
|
|
|
|
|
|
|
|
|
|
|
For the three months ended |
|
For the years ended |
| |
12/31/21 |
9/30/21 |
Change |
|
12/31/21 |
12/31/20 |
Change |
|
12/31/19 |
| Total tonnes mined (000s) |
17,996 |
|
17,515 |
|
3% |
|
74,960 |
|
85,740 |
|
(13)% |
|
105,949 |
|
| Open pit ore |
4,528 |
|
4,893 |
|
(7)% |
|
15,456 |
|
11,392 |
|
36% |
|
14,640 |
|
| Open pit waste |
13,136 |
|
12,295 |
|
7% |
|
58,235 |
|
73,240 |
|
(20)% |
|
90,029 |
|
| Underground |
332 |
|
327 |
|
2% |
|
1,269 |
|
1,108 |
|
15% |
|
1,280 |
|
| Average grade (grams/tonne) |
|
|
|
|
|
|
|
|
|
| Open pit mined |
0.62 |
|
0.63 |
|
(2)% |
|
0.71 |
|
0.56 |
|
27% |
|
0.67 |
|
| Underground mined |
10.96 |
|
9.40 |
|
17% |
|
9.45 |
|
9.86 |
|
(4)% |
|
10.66 |
|
| Processed |
1.28 |
|
1.01 |
|
27% |
|
1.22 |
|
1.41 |
|
(13)% |
|
1.60 |
|
| Ore tonnes processed (000s) |
5,413 |
|
5,917 |
|
(9)% |
|
18,333 |
|
13,019 |
|
41% |
|
17,583 |
|
| Oxide mill |
673 |
|
667 |
|
1% |
|
2,548 |
|
2,432 |
|
5% |
|
3,462 |
|
| Roaster |
357 |
|
291 |
|
23% |
|
1,250 |
|
1,479 |
|
(15)% |
|
1,750 |
|
| Autoclave |
10 |
|
n/a |
n/a |
|
10 |
|
n/a |
n/a |
|
n/a |
| Heap leach |
4,373 |
|
4,959 |
|
(12)% |
|
14,525 |
|
9,108 |
|
59% |
|
12,371 |
|
| Recovery rate |
83 |
% |
85 |
% |
(2)% |
|
83 |
% |
83 |
% |
0% |
|
86 |
% |
| Oxide Mill |
75 |
% |
80 |
% |
(6)% |
|
78 |
% |
75 |
% |
4% |
|
78 |
% |
| Roaster |
90 |
% |
89 |
% |
1% |
|
88 |
% |
87 |
% |
1% |
|
87 |
% |
| Autoclave |
81 |
% |
n/a |
n/a |
|
81 |
% |
n/a |
n/a |
|
n/a |
| Gold produced (000s oz) |
169 |
|
130 |
|
30% |
|
509 |
|
491 |
|
4% |
|
801 |
|
| Oxide mill |
61 |
|
52 |
|
17% |
|
192 |
|
129 |
|
49% |
|
253 |
|
| Roaster |
79 |
|
50 |
|
58% |
|
232 |
|
286 |
|
(19)% |
|
376 |
|
| Autoclave |
1 |
|
n/a |
n/a |
|
1 |
|
n/a |
n/a |
|
n/a |
| Heap leach |
28 |
|
28 |
|
0% |
|
84 |
|
76 |
|
11% |
|
172 |
|
| Gold sold (000s oz) |
170 |
|
126 |
|
35% |
|
508 |
|
491 |
|
3% |
|
798 |
|
| Revenue ($ millions) |
306 |
|
226 |
|
35% |
|
913 |
|
865 |
|
6% |
|
1,086 |
|
| Cost of sales ($ millions) |
167 |
|
147 |
|
14% |
|
570 |
|
470 |
|
21% |
|
608 |
|
|
|
|
|
|
|
|
|
|
|
|
|
|
|
|
|
|
|
|
|
| Income ($ millions) |
139 |
|
77 |
|
81% |
|
337 |
|
385 |
|
(12)% |
|
459 |
|
EBITDA ($ millions)b |
194 |
|
123 |
|
58% |
|
518 |
|
523 |
|
(1)% |
|
656 |
|
EBITDA marginc |
63 |
% |
54 |
% |
17% |
|
57 |
% |
60 |
% |
(5)% |
|
60 |
% |
Capital expenditures ($ millions)d |
49 |
|
48 |
|
2% |
|
177 |
|
235 |
|
(25)% |
|
294 |
|
Minesite sustainingb |
31 |
|
31 |
|
0% |
|
118 |
|
145 |
|
(19)% |
|
90 |
|
Projectb |
18 |
|
17 |
|
6% |
|
59 |
|
90 |
|
(34)% |
|
204 |
|
| Cost of sales ($/oz) |
984 |
|
1,164 |
|
(15)% |
|
1,122 |
|
958 |
|
17% |
|
762 |
|
Total cash costs ($/oz)b |
657 |
|
800 |
|
(18)% |
|
763 |
|
678 |
|
13% |
|
515 |
|
All-in sustaining costs ($/oz)b |
853 |
|
1,065 |
|
(20)% |
|
1,013 |
|
998 |
|
2% |
|
651 |
|
All-in costs ($/oz)b |
958 |
|
1,199 |
|
(20)% |
|
1,129 |
|
1,179 |
|
(4)% |
|
903 |
|
a.On July 1, 2019, Cortez was contributed to Nevada Gold Mines, a joint venture with Newmont. As a result, the amounts presented are on a 100% basis up until June 30, 2019, and on a 61.5% basis thereafter. Starting in the first quarter of 2021, Goldrush is reported as part of Cortez as it is operated by Cortez management. Comparative periods have been restated to include Goldrush.
b.Further information on these non-GAAP financial measures, including detailed reconciliations, is included on pages 94 to 120 of this MD&A. c.Represents EBITDA divided by revenue.
d.Amounts presented exclude capitalized interest.
Safety and Environment
There were three LTIs recorded at Cortez during the fourth quarter of 2021, which resulted in a LTIFR8 of 3.21 per million hours worked, compared to 1.01 in the prior quarter. The TRIFR8 for the fourth quarter of 2021 was 3.21 per million hours worked, compared to 3.04 in the prior quarter.
There were seven LTIs recorded in 2021, which resulted in an LTIFR8 of 1.81 per million hours worked, compared to 0.24 in 2020. The TRIFR8 for 2021 was 2.85 per million hours worked, compared to 2.59 in the prior year. No Class 19 environmental incidents occurred during 2021 or 2020.
Financial Results
Q4 2021 compared to Q3 2021
Cortez’s income for the fourth quarter of 2021 was 81% higher than the prior quarter due to substantially higher sales volume, a lower cost of sales per ounce7 and a higher realized gold price6.
Gold production in the fourth quarter of 2021 was 30% higher compared to the prior quarter. This was primarily driven by higher grade refractory production at the Carlin roasters (including batch processing of trial Goldrush ore), following the previously disclosed mechanical mill failure at the Goldstrike roaster which impacted third quarter
|
|
|
|
|
|
|
|
|
| BARRICK YEAR-END 2021 |
55 |
MANAGEMENT’S DISCUSSION AND ANALYSIS |
production. Open pit ore tonnes mined were 7% lower compared to the prior quarter, driven primarily by the open pit mine sequence at Crossroads. Underground tonnes mined were 2% higher compared to the prior quarter due to higher underground tonnes mined from the Goldrush development project.
Cost of sales per ounce7 and total cash costs per ounce6 in the fourth quarter of 2021 were 15% and 18% lower, respectively, versus the prior quarter due to sales mix with a higher proportion from lower cost underground, production. In the fourth quarter of 2021, all-in sustaining costs per ounce6 were 20% lower than the prior quarter, driven by lower total cash costs per ounce6.
Capital expenditures in the fourth quarter of 2021 were 2% higher compared to the prior quarter due to higher project capital expenditures6. Minesite sustaining capital expenditure6 spend was comparable quarter-on-quarter.
2021 compared to 2020
Cortez’s income for the twelve month period ended December 31, 2021 was 12% lower than the same prior year period, primarily due to a higher cost of sales per ounce7, partially offset by the higher realized gold price6 and higher sales volume.
INCOME AND EBITDA6,a
a The results are on a 100% basis from January 1, 2019 to June 30, 2019 and on a 61.5% basis from July 1, 2019 onwards.
Gold production for the twelve month period ended December 31, 2021 was 4% higher than the same prior year period, mainly due to an increase in oxide mill and heap leach production, partially offset by a reduction in refractory ore processed at the Carlin roasters. The increase in oxide mill and heap leach production was due to higher grade ore and increased volumes mined from the Pipeline and Crossroads open pits. Lower refractory ore tonnes were processed at the Carlin roasters due to displacement by higher grade Carlin refractory ore. Open pit ore tonnes mined increased 36% over the same prior year period largely due to increased ore mined from the Crossroads open pit. Underground tonnes mined increased 15% over the same prior year period, mainly driven by increased underground development activity at Goldrush.
PRODUCTIONa (thousands of ounces)
a The results are on a 100% basis from January 1, 2019 to June 30, 2019 and on a 61.5% basis from July 1, 2019 onwards.
b Based on the midpoint of the guidance range.
Cost of sales per ounce7 and total cash costs per ounce6 for the twelve month period ended December 31, 2021 were 17% and 13% higher, respectively, than the same prior year period, mainly due to a higher proportion of higher cost open pit ounces, partially offset by the impact of higher sales volume. The higher cost of sales per ounce7 was also driven by higher depreciation expense. For the twelve month period ended December 31, 2021, all-in sustaining costs per ounce6 increased by 2% compared to the same prior year period, driven by higher total cash costs per ounce6, partially offset by lower minesite sustaining capital expenditures6.
COST OF SALES7, TOTAL CASH COSTS6
AND ALL-IN SUSTAINING COSTS6 ($ per ounce)
a Based on the midpoint of the guidance range.
Capital expenditures for the twelve month period ended December 31, 2021 were 25% lower than the prior year due to both lower minesite sustaining6 and project capital expenditures6. Minesite sustaining capital expenditures6 were 19% lower compared to the same prior year period, primarily due to a decrease in capitalized waste stripping as relatively more mining activity occurred in operating phases of the Crossroads and Pipeline open pits. Lower project capital expenditures6 were due to lower cost development and exploration activities at Goldrush underground in the current period whereas in the same prior year period, activity mainly related to Goldrush twin decline development, Goldrush power infrastructure, and the Cortez Hills Rangefront Decline project.
2021 compared to Guidance
Gold production for 2021 of 509 thousand ounces was within the guidance range of 500 to 550 thousand ounces. Cost of sales per ounce7 for 2021 was $1,122, above the guidance range of $1,000 to $1,050 per ounce. Higher than expected open pit maintenance costs contributed to higher operating costs. Total cash costs per ounce6 of $763 was also above the guidance range of $700 to $750 per ounce, and all-in sustaining costs per ounce6 of $1,013 was higher than guidance of $940 to $990 per ounce due to higher sustaining capital expenditures6.
|
|
|
|
|
|
|
|
|
| BARRICK YEAR-END 2021 |
56 |
MANAGEMENT’S DISCUSSION AND ANALYSIS |
Turquoise Ridge (61.5%)a, Nevada USA
Summary of Operating and Financial Data
|
|
|
|
|
|
|
|
|
|
|
|
|
|
|
|
|
|
|
|
|
|
|
|
|
|
|
|
|
|
|
For the three months ended |
|
For the years ended |
|
12/31/21 |
9/30/21 |
Change |
|
12/31/21 |
12/31/20 |
Change |
|
12/31/19 |
| Total tonnes mined (000s) |
235 |
|
1,581 |
|
(85)% |
|
8,510 |
|
15,483 |
|
(45)% |
|
9,001 |
|
| Open pit ore |
35 |
|
785 |
|
(96)% |
|
3,020 |
|
5,150 |
|
(41)% |
|
1,340 |
|
| Open pit waste |
0 |
|
575 |
|
(100)% |
|
4,656 |
|
9,460 |
|
(51)% |
|
6,887 |
|
| Underground |
200 |
|
221 |
|
(10)% |
|
834 |
|
873 |
|
(4)% |
|
774 |
|
| Average grade (grams/tonne) |
|
|
|
|
|
|
|
|
|
| Open pit mined |
1.72 |
|
1.36 |
|
26% |
|
1.69 |
|
2.24 |
|
(25)% |
|
1.37 |
|
| Underground mined |
10.36 |
|
10.04 |
|
3% |
|
10.69 |
|
10.44 |
|
2% |
|
14.44 |
|
| Processed |
4.12 |
|
2.94 |
|
40% |
|
3.31 |
|
3.42 |
|
(3)% |
|
5.62 |
|
| Ore tonnes processed (000s) |
747 |
|
1,075 |
|
(31)% |
|
3,793 |
|
3,613 |
|
5% |
|
2,201 |
|
| Oxide Mill |
125 |
|
105 |
|
19% |
|
434 |
|
458 |
|
(5)% |
|
221 |
|
| Autoclave |
622 |
|
635 |
|
(2)% |
|
2,452 |
|
2,346 |
|
5% |
|
1,483 |
|
| Heap leach |
0 |
|
335 |
|
(100)% |
|
907 |
|
809 |
|
12% |
|
497 |
|
| Recovery Rate |
81 |
% |
82 |
% |
(1)% |
|
82 |
% |
83 |
% |
(1)% |
|
89 |
% |
| Oxide Mill |
81 |
% |
84 |
% |
(4)% |
|
83 |
% |
88 |
% |
(6)% |
|
87 |
% |
| Autoclave |
81 |
% |
82 |
% |
(1)% |
|
82 |
% |
83 |
% |
(1)% |
|
89 |
% |
| Gold produced (000s oz) |
82 |
|
82 |
|
0% |
|
334 |
|
330 |
|
1% |
|
335 |
|
| Oxide Mill |
4 |
|
4 |
|
0% |
|
16 |
|
16 |
|
0% |
|
8 |
|
| Autoclave |
74 |
|
76 |
|
(3)% |
|
307 |
|
306 |
|
0% |
|
321 |
|
| Heap leach |
4 |
|
2 |
|
100% |
|
11 |
|
8 |
|
38% |
|
6 |
|
| Gold sold (000s oz) |
84 |
|
82 |
|
2% |
|
337 |
|
332 |
|
2% |
|
356 |
|
| Revenue ($ millions) |
151 |
|
146 |
|
3% |
|
607 |
|
589 |
|
3% |
|
504 |
|
| Cost of sales ($ millions) |
100 |
|
95 |
|
5% |
|
378 |
|
353 |
|
7% |
|
300 |
|
| Income ($ millions) |
51 |
|
51 |
|
0% |
|
229 |
|
229 |
|
0% |
|
201 |
|
EBITDA ($ millions)b |
82 |
|
82 |
|
0% |
|
352 |
|
342 |
|
3% |
|
293 |
|
EBITDA marginc |
54 |
% |
56 |
% |
(4)% |
|
58 |
% |
58 |
% |
0% |
|
58 |
% |
| Capital expenditures ($ millions) |
19 |
|
21 |
|
(10)% |
|
81 |
|
51 |
|
59% |
|
85 |
|
Minesite sustainingb |
14 |
|
12 |
|
17% |
|
47 |
|
24 |
|
96% |
|
50 |
|
Projectb |
5 |
|
9 |
|
(44)% |
|
34 |
|
27 |
|
26% |
|
35 |
|
| Cost of sales ($/oz) |
1,194 |
|
1,169 |
|
2% |
|
1,122 |
|
1,064 |
|
5% |
|
846 |
|
Total cash costs ($/oz)b |
819 |
|
788 |
|
4% |
|
749 |
|
711 |
|
5% |
|
585 |
|
All-in sustaining costs ($/oz)b |
996 |
|
943 |
|
6% |
|
892 |
|
798 |
|
12% |
|
732 |
|
All-in costs ($/oz)b |
1,061 |
|
1,053 |
|
1% |
|
993 |
|
879 |
|
13% |
|
834 |
|
a.Prior to July 1, 2019, Barrick owned 75% of Turquoise Ridge with our joint venture partner, Newmont, owning the remaining 25%. Turquoise Ridge was proportionately consolidated on the basis that the joint venture partners that have joint control have rights to the assets and obligations for the liabilities relating to the arrangement. The figures presented in this table are based on our 75% interest in Turquoise Ridge until June 30, 2019. On July 1, 2019, Barrick's 75% interest in Turquoise Ridge and Newmont's 100% interest in Twin Creeks and 25% interest in Turquoise Ridge were contributed to Nevada Gold Mines. Starting July 1, 2019, the results represent our 61.5% share of Turquoise Ridge and Twin Creeks, now collectively referred to as Turquoise Ridge.
b.Further information on these non-GAAP financial measures, including detailed reconciliations, is included on pages 94 to 120 of this MD&A. c.Represents EBITDA divided by revenue.
Safety and Environment
There were three LTIs recorded at Turquoise Ridge during the fourth quarter of 2021, which resulted in an LTIFR8 of 4.29 per million hours worked, compared to 5.81 in the prior quarter. The TRIFR8 for the fourth quarter of 2021 was 8.58 per million hours worked, compared to 4.36 in the prior quarter.
There were eight LTIs recorded in 2021, which resulted in an LTIFR8 of 2.85 per million hours worked compared to 2.51 million hours in 2020. The TRIFR8 for 2021 was 4.63 per million hours worked, compared to 4.31 in the prior year. No Class 19 environmental incidents occurred during 2021 or 2020.
Financial Results
Q4 2021 compared to Q3 2021
Turquoise Ridge's income for the fourth quarter of 2021 was in line with the prior quarter as higher sales volume and a higher realized gold price6 were offset by an increase in cost of sales per ounce7.
Gold production in the fourth quarter of 2021 was in line with the prior quarter. Total tonnes mined decreased by 85% compared to the prior quarter, driven by lower open pit production as the current phase of fresh ore mining ramped down and was completed in the fourth quarter of 2021 as expected and previously disclosed. We continue to expect open pit mining to resume in the medium-to-long term at Cut 40, with the analysis of an optimized restart currently under review. Underground tonnes mined
|
|
|
|
|
|
|
|
|
| BARRICK YEAR-END 2021 |
57 |
MANAGEMENT’S DISCUSSION AND ANALYSIS |
decreased by 10% compared to the prior quarter. Equipment issues continued to impact performance in the fourth quarter of 2021 including a battery fire in mid-October, which resulted in the loss of the electric truck fleet for the remainder of the fourth quarter at the direction of the Mine Safety and Health Administration (MSHA), pending a investigation into the cause of the fire. Once resolved, we expect to continue trialing battery-powered Sandvik haul trucks, together with the continued use of conventional mining equipment at Turquoise Ridge Underground.
Cost of sales per ounce7 and total cash costs per ounce6 in the fourth quarter of 2021 were 2% and 4% higher, respectively, than the prior quarter mainly due to the processing of a higher proportion of lower grade open pit ore (including ore stockpiled from prior quarters of the year) which carries a higher cost on a per ounce basis. All-in sustaining costs per ounce6 increased by 6% compared to the prior quarter, primarily reflecting higher total cash costs per ounce6 and higher sustaining capital expenditures6.
Capital expenditures in the fourth quarter of 2021 decreased by 10% compared to the prior quarter, primarily due to lower project capital expenditures6 on the Third Shaft project, partially offset by higher sustaining capital expenditures6. Project capital expenditures6 on the Third Shaft project was lower due to delays in shaft steel placement, while higher sustaining capital expenditures6 was related to the timing of underground equipment purchases.
2021 compared to 2020
Turquoise Ridge’s income for the twelve month period ended December 31, 2021 was in line with the prior year, as higher sales volume and a higher realized gold price6 were offset by an increase in cost of sales per ounce7.
INCOME AND EBITDA6,a
a The results represent Turquoise Ridge on a 75% basis from January 1, 2019 to June 30, 2019 and the combined results of Turquoise Ridge and Twin Creeks on a 61.5% basis from July 1, 2019 onwards.
Gold production for the twelve month period ended December 31, 2021 was 1% higher compared to the prior year, primarily due to improved grades from Turquoise Ridge underground combined with improved throughput at the Sage autoclave, partially offset by lower underground tonnes mined. Total tonnes mined were lower by 45% relative to the same prior year period due to a decrease in open pit tonnes as the current phases of fresh ore mining were completed in the fourth quarter of 2021, as expected and previously disclosed. We continue to expect open pit mining to resume in the medium-to-long term at Cut 40, with the economics of an optimized restart currently under review. In addition, underground tonnes were lower by 4% relative to the same prior year period as higher operating
rates were more than offset by lower equipment availability and ventilation constraints.
PRODUCTIONa (thousands of ounces)
a The results represent Turquoise Ridge on a 75% basis from January 1, 2019 to June 30, 2019 and the combined results of Turquoise Ridge and Twin Creeks on a 61.5% basis from July 1, 2019 onwards.
b Based on the midpoint of the guidance range.
Cost of sales per ounce7 and total cash costs per ounce6 for the twelve month period ended December 31, 2021 were both 5% higher than the same prior year period due to the impact of lower grades processed, which was driven by a higher proportion of lower grade open pit ore versus the same prior year period. All-in sustaining costs per ounce6 increased by 12% compared to the prior year due to higher total cash costs per ounce6, and higher minesite sustaining capital expenditures6.
COST OF SALES7, TOTAL CASH COSTS6
AND ALL-IN SUSTAINING COSTS6 ($ per ounce)
a Based on the midpoint of the guidance range.
Capital expenditures for the twelve month period ended December 31, 2021 increased by 59% compared to the same prior year period, mainly due to an increase in minesite sustaining capital expenditures6 relating to underground equipment purchases and process efficiency related projects. This was combined with higher project capital expenditures6 related to the Third Shaft project.
2021 compared to Guidance
As expected and previously disclosed, gold production in 2021 of 334 thousand ounces was below the guidance range of 390 to 440 thousand ounces. This was mainly due to lower than planned underground equipment availability and utilization, as well as lower plant availability. Cost of sales per ounce7 and total cash costs per ounce6 of $1,122 and $749, respectively, were above the guidance ranges of $950 to $1,000 per ounce and $620 to $670 per ounce, respectively, mainly due to the impact of lower sales volumes which reflected this underperformance. All-in sustaining costs per ounce6 of $892 was above the guidance range of $810 to $860 per ounce for similar reasons.
|
|
|
|
|
|
|
|
|
| BARRICK YEAR-END 2021 |
58 |
MANAGEMENT’S DISCUSSION AND ANALYSIS |
Other Mines - Nevada Gold Mines
Summary of Operating and Financial Data
|
|
|
|
|
|
|
|
|
|
|
|
|
|
|
|
|
|
|
|
|
|
|
|
|
|
|
|
|
|
|
|
|
|
|
|
|
For the three months ended |
|
12/31/21 |
|
9/30/21 |
|
Gold produced (000s oz) |
Cost of sales
($/oz) |
Total cash costs
($/oz)a |
All-in sustaining costs
($/oz)a |
Capital Expend-ituresb |
|
Gold produced (000s oz) |
Cost of sales
($/oz) |
Total cash costs ($/oz)a |
All-in sustaining costs ($/oz)a |
Capital Expend-ituresb |
Phoenix (61.5%)c |
25 |
2,047 |
|
443 |
|
614 |
|
4 |
|
|
31 |
1,777 |
|
499 |
|
582 |
|
2 |
|
| Long Canyon (61.5%) |
33 |
999 |
|
325 |
|
384 |
|
1 |
|
|
43 |
796 |
|
201 |
|
251 |
|
1 |
|
a.Further information on these non-GAAP financial measures, including detailed reconciliations, is included on pages 94 to 120 of this MD&A. b.Includes both minesite sustaining and project capital expenditures.
c.On September 7, 2021, NGM announced it had entered into an Exchange Agreement with i-80 Gold to acquire the 40% interest in South Arturo that NGM did not already own in exchange for the Lone Tree and Buffalo Mountain properties and infrastructure. Operating results within our 61.5% interest in Phoenix includes Lone Tree up until May 30, 2021, reflecting the terms of the Exchange Agreement which closed on October 14, 2021.
Phoenix (61.5%)
Gold production for Phoenix in the fourth quarter of 2021 was 19% lower compared to the prior quarter driven by the divestment of Lone Tree (part of the Phoenix operations) following the execution of the Exchange Agreement between NGM and i-80 Gold. Pursuant to this agreement, NGM exchanged Lone Tree and Buffalo Mountain for i-80 Gold’s 40% interest in South Arturo (included within the Carlin operations). This transaction closed in the fourth quarter of 2021 and had an effective date of June 1, 2021. Separately, a reduction in tonnes milled and lower mill recoveries also contributed to the decrease in quarter-on-quarter production.
Cost of sales per ounce7 in the fourth quarter of 2021 was 15% higher than the prior quarter, primarily due to lower sales volume. Total cash costs per ounce6 were 11% lower than the prior quarter primarily due to higher by- product credits, partially offset by lower sales volume. In the fourth quarter of 2021, all-in sustaining costs per ounce6 increased by 5% compared to the prior quarter, primarily due to higher minesite sustaining capital expenditures6, partially offset by lower total cash costs per ounce6.
Compared to our 2021 outlook, gold production of 109 thousand ounces was within the guidance range of 100 to 120 thousand ounces. Cost of sales per ounce7 of $1,922 was above the guidance range of $1,800 to $1,850 per ounce. Total cash costs per ounce6 and all-in sustaining costs per ounce6 of $398 and $533, respectively, were below the guidance ranges of $725 to $775 per ounce and $970 to $1,020 per ounce, respectively, mainly due to higher by-product credits driven by the increase in copper and silver prices.
Long Canyon (61.5%)
Gold production for Long Canyon in the fourth quarter of 2021 was 23% lower compared to the third quarter of 2021, primarily due to lower grade and a reduction in ore tonnes stacked, combined with a higher stacking height leading to a longer leach cycle. Cost of sales per ounce7 and total cash costs per ounce6 in the fourth quarter of 2021 were 26% and 62% higher than the prior quarter, respectively, primarily due to these same impacts. All-in sustaining costs per ounce6 increased by 53% compared to the prior quarter, primarily due to the same drivers described above as well as slightly higher sustaining capital expenditures6 resulting from haul truck refurbishments.
Compared to our 2021 outlook, gold production of 161 thousand ounces was above the top end of the guidance range of 140 to 160 thousand ounces. Cost of sales per ounce7 of $739 was well below the guidance range of $800 to $850 per ounce. Total cash costs per ounce6 and all-in sustaining costs per ounce6 of $188 and $238, respectively, were near or below the bottom end of the guidance ranges of $180 to $230 per ounce and $240 to $290 per ounce, respectively.
We continue to pursue sales of non-core assets that are not aligned with Barrick’s strategic investment filters. We will only proceed with transactions that make sense for the business, on terms we consider favorable to our shareholders. In this regard, we intend to initiate a process to explore the sale of Long Canyon in the first quarter of 2022.
|
|
|
|
|
|
|
|
|
| BARRICK YEAR-END 2021 |
59 |
MANAGEMENT’S DISCUSSION AND ANALYSIS |
Pueblo Viejo (60% basis)a, Dominican Republic
Summary of Operating and Financial Data
|
|
|
|
|
|
|
|
|
|
|
|
|
|
|
|
|
|
|
|
|
|
|
|
|
|
|
|
|
|
|
For the three months ended |
|
For the years ended |
| |
12/31/21 |
9/30/21 |
Change |
|
12/31/21 |
12/31/20 |
Change |
|
12/31/19 |
| Open pit tonnes mined (000s) |
5,626 |
|
5,926 |
|
(5)% |
|
24,687 |
|
20,262 |
|
22% |
|
24,732 |
|
| Open pit ore |
1,489 |
|
2,464 |
|
(40)% |
|
7,969 |
|
6,147 |
|
30% |
|
8,085 |
|
| Open pit waste |
4,137 |
|
3,462 |
|
19% |
|
16,718 |
|
14,115 |
|
18% |
|
16,647 |
|
| Average grade (grams/tonne) |
|
|
|
|
|
|
|
|
|
| Open pit mined |
2.57 |
|
2.28 |
|
13% |
|
2.41 |
|
2.57 |
|
(6)% |
|
2.76 |
|
| Processed |
2.83 |
|
3.07 |
|
(8)% |
|
3.18 |
|
3.61 |
|
(12)% |
|
3.91 |
|
| Autoclave ore tonnes processed (000s) |
1,365 |
|
1,446 |
|
(6)% |
|
5,466 |
|
5,297 |
|
3% |
|
5,164 |
|
| Recovery rate |
90 |
% |
88 |
% |
2% |
|
88 |
% |
89 |
% |
(1)% |
|
89 |
% |
| Gold produced (000s oz) |
107 |
|
127 |
|
(16)% |
|
488 |
|
542 |
|
(10)% |
|
590 |
|
| Gold sold (000s oz) |
113 |
|
125 |
|
(10)% |
|
497 |
|
541 |
|
(8)% |
|
584 |
|
| Revenue ($ millions) |
203 |
|
227 |
|
(11)% |
|
898 |
|
954 |
|
(6)% |
|
843 |
|
| Cost of sales ($ millions) |
112 |
|
112 |
|
0% |
|
445 |
|
443 |
|
0% |
|
435 |
|
| Income ($ millions) |
90 |
|
113 |
|
(20)% |
|
445 |
|
508 |
|
(12)% |
|
402 |
|
EBITDA ($ millions)b |
125 |
|
150 |
|
(17)% |
|
587 |
|
644 |
|
(9)% |
|
522 |
|
EBITDA marginc |
62 |
% |
66 |
% |
(6)% |
|
65 |
% |
68 |
% |
(4)% |
|
62 |
% |
| Capital expenditures ($ millions) |
94 |
|
73 |
|
29% |
|
311 |
|
134 |
|
132% |
|
64 |
|
Minesite sustainingb |
27 |
|
24 |
|
13% |
|
96 |
|
79 |
|
22% |
|
64 |
|
Projectb |
67 |
|
49 |
|
37% |
|
215 |
|
55 |
|
291% |
|
0 |
|
| Cost of sales ($/oz) |
987 |
|
895 |
|
10% |
|
896 |
|
819 |
|
9% |
|
747 |
|
Total cash costs ($/oz)b |
612 |
|
521 |
|
17% |
|
541 |
|
504 |
|
7% |
|
471 |
|
All-in sustaining costs ($/oz)b |
858 |
|
728 |
|
18% |
|
745 |
|
660 |
|
13% |
|
592 |
|
All-in costs ($/oz)b |
1,453 |
|
1,117 |
|
30% |
|
1,178 |
|
761 |
|
55% |
|
600 |
|
a.Barrick is the operator of Pueblo Viejo and owns 60% with Newmont Corporation owning the remaining 40%. Pueblo Viejo is accounted for as a subsidiary with a 40% non-controlling interest. The results in the table and the discussion that follows are based on our 60% share only.
b.Further information on these non-GAAP financial measures, including detailed reconciliations, is included on pages 94 to 120 of this MD&A. c.Represents EBITDA divided by revenue.
Safety and Environment
There were no LTIs recorded at Pueblo Viejo during the fourth quarter of 2021, which resulted in an LTIFR8 of 0.00 per million hours worked, a reduction from 0.30 LTIFR8 in the prior quarter. The TRIFR8 for the fourth quarter of 2021 was 0.46 per million hours worked, compared to 0.30 in the prior quarter.
There was one LTI recorded in 2021, which resulted in an LTIFR8 of 0.07 per million hours worked, compared to 0.10 in 2020. The TRIFR8 for 2021 was 0.50 per million hours worked, compared to 0.73 in the prior year. No Class 19 environmental incidents occurred during 2021 or 2020.
Financial Results
Q4 2021 compared to Q3 2021
Pueblo Viejo’s income for the fourth quarter of 2021 was 20% lower than the third quarter of 2021 due to lower sales volume and a higher cost of sales per ounce7, partially offset by a higher realized gold price6.
Gold production for the fourth quarter of 2021 was 16% lower than the prior quarter due to lower throughput driven by planned maintenance during the quarter, lower grades processed in line with the mine and stockpile processing plan and higher carbon-in-leach inventory accumulation. This was partially offset by higher recovery.
Cost of sales per ounce7 and total cash costs per ounce6 for the fourth quarter of 2021 were 10% and 17% higher, respectively, than the prior quarter primarily
reflecting the impact of planned maintenance and higher natural gas prices in the current quarter. This was partially offset by higher margins from third-party energy sales at the Quisqueya power plant driven by higher spot energy prices. The increase in cost of sales per ounce7 was also impacted by higher depreciation on a per ounce basis, resulting from the impact of lower sales volumes. For the fourth quarter of 2021, all-in sustaining costs per ounce6 increased by 18% compared to the prior quarter, reflecting higher total cash costs per ounce6 and higher minesite sustaining capital expenditures6.
Capital expenditures for the fourth quarter of 2021 increased by 29% compared to the prior quarter, primarily due to increased project capital expenditures6 incurred on the plant expansion and mine life extension project. This was combined with higher minesite sustaining capital expenditures6 related to the Llagal tailings storage facility and major maintenance at the Quisqueya power plant.
2021 compared to 2020
Pueblo Viejo’s income for 2021 was 12% lower than the prior year due to lower sales volume and a higher cost of sales per ounce7, partially offset by the higher realized gold price6.
|
|
|
|
|
|
|
|
|
| BARRICK YEAR-END 2021 |
60 |
MANAGEMENT’S DISCUSSION AND ANALYSIS |
INCOME AND EBITDA6
Gold production for 2021 was 10% lower than the prior year, mainly due to lower grades processed in line with the mine and stockpile processing plan, partially offset by higher tonnes processed. Pueblo Viejo once again achieved record throughput in 2021 due to improved maintenance practices and increased tonnes per operating hour, with throughput 3% higher than the previous record set in 2020.
PRODUCTION (thousands of ounces)
a Based on the midpoint of the guidance range.
Cost of sales per ounce7 and total cash costs per ounce6 for 2021 increased by 9% and 7%, respectively, compared to the prior year, primarily reflecting the impact of lower grades as described above, and higher natural gas prices. For 2021, all-in sustaining costs per ounce6 increased by 13% compared to the prior year, mainly reflecting higher total cash costs per ounce6 and higher minesite sustaining capital expenditures6.
COST OF SALES7, TOTAL CASH COSTS6
AND ALL-IN SUSTAINING COSTS6 ($ per ounce)
a Based on the midpoint of the guidance range.
Capital expenditures for 2021 increased by 132% compared to the prior year, primarily due to increased project capital expenditures6 for the plant expansion and mine life extension project. This was combined with higher minesite sustaining capital expenditures6 related to the Llagal tailings storage facility, higher capitalized stripping at the Montenegro open pit and major maintenance at the Quisqueya power plant. This was partially offset by the purchase of a new fleet for ore rehandling activities occurring in the prior year.
2021 compared to Guidance
Gold production in 2021 of 488 thousand ounces was within the guidance range of 470 to 510 thousand ounces. Cost of sales per ounce7 and total cash costs per ounce6 of $896 and $541, respectively, were within the guidance ranges of $880 to $930 per ounce and $520 to $570 per ounce, respectively, despite the impact of higher energy prices. All-in sustaining costs per ounce6 was $745, which was lower than the guidance range of $760 to $810 per ounce mainly driven by the deferral of sustaining capital at the existing tailings facility.
|
|
|
|
|
|
|
|
|
| BARRICK YEAR-END 2021 |
61 |
MANAGEMENT’S DISCUSSION AND ANALYSIS |
Loulo-Gounkoto (80% basis)a, Mali
Summary of Operating and Financial Data
|
|
|
|
|
|
|
|
|
|
|
|
|
|
|
|
|
|
|
|
|
|
|
|
|
|
|
|
|
|
|
|
|
For the three months ended |
|
|
|
For the years ended |
| |
12/31/21 |
9/30/21 |
Change |
|
|
|
12/31/21 |
12/31/20 |
Change |
|
12/31/19 |
| Total tonnes mined (000s) |
7,766 |
|
8,131 |
|
(4)% |
|
|
|
33,073 |
|
33,036 |
|
—% |
|
32,192 |
|
| Open pit ore |
1,208 |
|
257 |
|
370% |
|
|
|
1,808 |
|
1,698 |
|
6% |
|
2,726 |
|
| Open pit waste |
5,999 |
|
7,319 |
|
(18)% |
|
|
|
29,050 |
|
29,078 |
|
0% |
|
27,183 |
|
| Underground |
559 |
|
555 |
|
1% |
|
|
|
2,215 |
|
2,260 |
|
(2)% |
|
2,283 |
|
|
|
|
|
|
|
|
|
|
|
|
|
|
|
|
|
|
|
|
|
|
|
|
|
| Average grade (grams/tonne) |
|
|
|
|
|
|
|
|
|
|
|
| Open pit mined |
3.47 |
|
2.63 |
|
32% |
|
|
|
3.22 |
|
5.50 |
|
(41)% |
|
4.83 |
|
| Underground mined |
4.34 |
|
4.65 |
|
(7)% |
|
|
|
4.68 |
|
4.36 |
|
7% |
|
4.67 |
|
| Processed |
4.25 |
|
4.63 |
|
(8)% |
|
|
|
4.79 |
|
4.76 |
|
1% |
|
4.90 |
|
| Ore tonnes processed (000s) |
1,019 |
|
1,011 |
|
1% |
|
|
|
4,015 |
|
3,916 |
|
3% |
|
3,945 |
|
| Recovery rate |
91 |
% |
91 |
% |
0% |
|
|
|
91 |
% |
91 |
% |
0% |
|
92 |
% |
| Gold produced (000s oz) |
126 |
|
137 |
|
(8)% |
|
|
|
560 |
|
544 |
|
3% |
|
572 |
|
| Gold sold (000s oz) |
128 |
|
134 |
|
(4)% |
|
|
|
558 |
|
542 |
|
3% |
|
575 |
|
| Revenue ($ millions) |
228 |
|
239 |
|
(5)% |
|
|
|
999 |
|
966 |
|
3% |
|
806 |
|
| Cost of sales ($ millions) |
145 |
|
149 |
|
(3)% |
|
|
|
585 |
|
576 |
|
2% |
|
601 |
|
|
|
|
|
|
|
|
|
|
|
|
|
|
|
|
|
|
|
|
|
|
|
|
|
| Income ($ millions) |
74 |
|
84 |
|
(12)% |
|
|
|
380 |
|
358 |
|
6% |
|
190 |
|
EBITDA ($ millions)b |
132 |
|
137 |
|
(4)% |
|
|
|
602 |
|
572 |
|
5% |
|
426 |
|
EBITDA marginc |
58 |
% |
57 |
% |
2% |
|
|
|
60 |
% |
59 |
% |
2% |
|
53 |
% |
| Capital expenditures ($ millions) |
50 |
|
59 |
|
(15)% |
|
|
|
238 |
|
185 |
|
29% |
|
136 |
|
Minesite sustainingb |
13 |
|
42 |
|
(69)% |
|
|
|
159 |
|
170 |
|
(6)% |
|
133 |
|
Projectb |
37 |
|
17 |
|
118% |
|
|
|
79 |
|
15 |
|
427% |
|
3 |
|
| Cost of sales ($/oz) |
1,139 |
|
1,109 |
|
3% |
|
|
|
1,049 |
|
1,060 |
|
(1)% |
|
1,044 |
|
Total cash costs ($/oz)b |
685 |
|
708 |
|
(3)% |
|
|
|
650 |
|
666 |
|
(2)% |
|
634 |
|
All-in sustaining costs ($/oz)b |
822 |
|
1,056 |
|
(22)% |
|
|
|
970 |
|
1,006 |
|
(4)% |
|
886 |
|
All-in costs ($/oz)b |
1,109 |
|
1,184 |
|
(6)% |
|
|
|
1,111 |
|
1,034 |
|
7% |
|
891 |
|
a.Barrick owns 80% of Société des Mines de Loulo SA and Société des Mines de Gounkoto with the Republic of Mali owning 20%. Loulo-Gounkoto is accounted for as a subsidiary with a 20% non-controlling interest on the basis that Barrick controls the asset. The results in the table and the discussion that follows are based on our 80% share, inclusive of the impact of the purchase price allocation resulting from the Merger.
b.Further information on these non-GAAP financial measures, including detailed reconciliations, is included on pages 94 to 120 of this MD&A. c.Represents EBITDA divided by revenue.
Safety and Environment
There were zero LTIs recorded during the fourth quarter of 2021, which resulted in an LTIFR8 of 0.00 per million hours worked compared to 0.00 in the prior quarter. The TRIFR8 for the fourth quarter of 2021 was 0.35 per million hours worked, compared to 0.41 in the prior quarter.
There were two LTIs recorded in 2021, which resulted in an LTIFR8 of 0.11 per million hours worked compared to 0.07 in 2020. The TRIFR8 for 2021 was 0.92 per million hours worked, compared to 1.53 in the prior year. No Class 19 environmental incidents occurred during 2021 or 2020.
Financial Results
Q4 2021 compared to Q3 2021
Loulo-Gounkoto’s income for the fourth quarter of 2021 was 12% lower than the prior quarter, mainly due to lower sales volume and higher cost of sales per ounce7 partially offset by a higher realized gold price6.
Gold production for the fourth quarter of 2021 was 8% lower than the prior quarter, mainly due to lower grades processed, in line with the mine plan.
Cost of sales per ounce7 for the fourth quarter of 2021 was 3% higher than the prior quarter due to higher depreciation, partially offset by lower total cash costs per
ounce6. Total cash costs per ounce6 was 3% lower than the prior quarter due to more efficient power blends in both the underground mine and processing operations towards the end of the quarter, partially offset by the impact of lower grades. For the fourth quarter of 2021, all-in sustaining costs per ounce6 decreased by 22% compared to the prior quarter, primarily reflecting lower minesite sustaining capital expenditures6, as well as lower total cash costs per ounce6.
Capital expenditures for the fourth quarter of 2021 decreased by 15% compared to the prior quarter, primarily due to lower minesite sustaining capital expenditures6. This was partially offset by higher project capital expenditures6 relating to the continued development of Gounkoto underground and the expansion of power capacity.
2021 compared to 2020
Loulo-Gounkoto’s income for 2021 was 6% higher than the prior year, due to a higher realized gold price6, higher sales volume and lower cost of sales per ounce7.
|
|
|
|
|
|
|
|
|
| BARRICK YEAR-END 2021 |
62 |
MANAGEMENT’S DISCUSSION AND ANALYSIS |
INCOME AND EBITDA6
Gold production in 2021 was 3% higher compared to the prior year, primarily due to higher plant throughput as well as higher grades processed.
PRODUCTION (thousands of ounces)
a Based on the midpoint of the guidance range.
Cost of sales per ounce7 and total cash costs per ounce6 in 2021 were 1% and 2% lower, respectively, compared to the prior year, mainly due to the impact of higher grades as well as lower underground mining costs. For 2021, all-in sustaining costs6 were 4% lower compared to the prior year reflecting lower total cash costs per ounce6 and decreased minesite sustaining capital expenditures6.
COST OF SALES7, TOTAL CASH COSTS6
AND ALL-IN SUSTAINING COSTS6 ($ per ounce)
a Based on the midpoint of the guidance range.
Capital expenditures in 2021 were 29% higher compared to the prior year, primarily due to higher project capital expenditures6 from the development of Gounkoto underground and the expansion of power capacity. This was slightly offset by lower minesite sustaining capital expenditures6.
2021 compared to Guidance
Gold production in 2021 of 560 thousand ounces was at the top end of the guidance range of 510 to 560 thousand ounces. Cost of sales per ounce7 of $1,049 was above the guidance range of $980 to $1,030 per ounce, due to higher depreciation. Total cash costs per ounce6 and all-in sustaining costs per ounce6 of $650 and $970, respectively, were within the guidance ranges of $630 to $680 per ounce and $930 to $980 per ounce, respectively.
|
|
|
|
|
|
|
|
|
| BARRICK YEAR-END 2021 |
63 |
MANAGEMENT’S DISCUSSION AND ANALYSIS |
Kibali (45% basis)a, Democratic Republic of Congo
Summary of Operating and Financial Data
|
|
|
|
|
|
|
|
|
|
|
|
|
|
|
|
|
|
|
|
|
|
|
|
|
|
|
|
|
|
|
|
|
For the three months ended |
|
|
|
For the years ended |
| |
12/31/21 |
9/30/21 |
Change |
|
|
|
12/31/21 |
12/31/20 |
Change |
|
12/31/19 |
| Total tonnes mined (000s) |
3,866 |
|
3,840 |
|
1% |
|
|
|
14,657 |
|
13,308 |
|
10% |
|
12,273 |
|
| Open pit ore |
330 |
|
361 |
|
(9)% |
|
|
|
1,278 |
|
1,380 |
|
(7)% |
|
1,693 |
|
| Open pit waste |
3,082 |
|
3,072 |
|
0% |
|
|
|
11,610 |
|
10,091 |
|
15% |
|
8,824 |
|
| Underground |
454 |
|
407 |
|
12% |
|
|
|
1,769 |
|
1,837 |
|
(4)% |
|
1,756 |
|
|
|
|
|
|
|
|
|
|
|
|
|
|
|
|
|
|
|
|
|
|
|
|
|
| Average grade (grams/tonne) |
|
|
|
|
|
|
|
|
|
|
|
| Open pit mined |
2.43 |
|
3.00 |
|
(19)% |
|
|
|
2.71 |
|
2.22 |
|
22% |
|
2.32 |
|
| Underground mined |
5.88 |
|
5.89 |
|
0% |
|
|
|
5.63 |
|
5.20 |
|
8% |
|
5.12 |
|
| Processed |
3.90 |
|
3.73 |
|
5% |
|
|
|
3.62 |
|
3.68 |
|
(2)% |
|
3.80 |
|
| Ore tonnes processed (000s) |
841 |
|
872 |
|
(4)% |
|
|
|
3,503 |
|
3,434 |
|
2% |
|
3,381 |
|
| Recovery rate |
89 |
% |
90 |
% |
(1)% |
|
|
|
90 |
% |
90 |
% |
0% |
|
89 |
% |
| Gold produced (000s oz) |
94 |
|
95 |
|
(1)% |
|
|
|
366 |
|
364 |
|
1% |
|
366 |
|
| Gold sold (000s oz) |
95 |
|
93 |
|
2% |
|
|
|
367 |
|
364 |
|
1% |
|
363 |
|
| Revenue ($ millions) |
172 |
|
166 |
|
4% |
|
|
|
661 |
|
648 |
|
2% |
|
505 |
|
| Cost of sales ($ millions) |
93 |
|
92 |
|
1% |
|
|
|
373 |
|
397 |
|
(6)% |
|
403 |
|
|
|
|
|
|
|
|
|
|
|
|
|
|
|
|
|
|
|
|
|
|
|
|
|
| Income ($ millions) |
71 |
|
74 |
|
(4)% |
|
|
|
278 |
|
244 |
|
14% |
|
108 |
|
EBITDA ($ millions)b |
108 |
|
110 |
|
(2)% |
|
|
|
419 |
|
418 |
|
0% |
|
304 |
|
EBITDA marginc |
63 |
% |
66 |
% |
(5)% |
|
|
|
63 |
% |
65 |
% |
(3)% |
|
60 |
% |
| Capital expenditures ($ millions) |
19 |
|
19 |
|
0% |
|
|
|
70 |
|
51 |
|
37% |
|
43 |
|
Minesite sustainingb |
12 |
|
11 |
|
9% |
|
|
|
54 |
|
49 |
|
10% |
|
41 |
|
Projectb |
7 |
|
8 |
|
(13)% |
|
|
|
16 |
|
2 |
|
700% |
|
2 |
|
| Cost of sales ($/oz) |
979 |
|
987 |
|
(1)% |
|
|
|
1,016 |
|
1,091 |
|
(7)% |
|
1,111 |
|
Total cash costs ($/oz)b |
582 |
|
597 |
|
(3)% |
|
|
|
627 |
|
608 |
|
3% |
|
568 |
|
All-in sustaining costs ($/oz)b |
776 |
|
751 |
|
3% |
|
|
|
818 |
|
778 |
|
5% |
|
693 |
|
All-in costs ($/oz)b |
844 |
|
838 |
|
1% |
|
|
|
861 |
|
782 |
|
10% |
|
701 |
|
a.Barrick owns 45% of Kibali Goldmines SA (Kibali) with the Democratic Republic of Congo ("DRC") and our joint venture partner, AngloGold Ashanti, owning 10% and 45%, respectively. Kibali is accounted for as an equity method investment on the basis that the joint venture partners that have joint control have rights to the net assets of the joint venture. The figures presented in this table and the discussion that follows are based on our 45% effective interest in Kibali, inclusive of the impact of the purchase price allocation resulting from the merger with Randgold.
b.Further information on these non-GAAP financial measures, including detailed reconciliations, is included on pages 94 to 120 of this MD&A. c.Represents EBITDA divided by revenue.
Safety and Environment
There were no LTIs recorded during the fourth quarter of 2021, which resulted in an LTIFR8 of 0.00 per million hours worked, consistent with the prior quarter. The TRIFR8 for the fourth quarter of 2021 was 1.39 per million hours worked, an improvement from 1.88 in the prior quarter.
There were two LTIs recorded in 2021, which resulted in an LTIFR8 of 0.14 per million hours worked compared to 0.23 in 2020. The TRIFR8 for 2021 was 1.22 per million hours worked, compared to 1.59 in the prior year. No Class 19 environmental incidents occurred during 2021 or 2020.
Financial Results
Q4 2021 compared to Q3 2021
Kibali’s income for the fourth quarter of 2021 was 4% lower than the third quarter of 2021 as a result of foreign exchange payment fees incurred on dividend payments.
Gold production for the fourth quarter of 2021 was 1% lower than the prior quarter, due to fewer tonnes processed in line with the mine plan for the quarter, partially offset by higher grades processed. Gold sales for the fourth quarter of 2021 were 2% higher when compared to the prior quarter, due to the timing of sales.
Cost of sales per ounce7 for the fourth quarter of 2021 was in line with the prior quarter. Total cash costs per ounce6 was 3% below the prior quarter, with fewer stockpiled tonnes processed when compared to the previous quarter. All-in sustaining costs per ounce6 for the fourth quarter of 2021 ended 3% higher than the prior quarter, mainly due to higher minesite sustaining capital expenditures6, partially offset by lower total cash costs per ounce6.
Capital expenditures for the fourth quarter of 2021, were in line with the prior quarter. Slightly higher minesite sustaining capital expenditures7 were due to higher capitalized stripping relative to the prior quarter.
2021 compared to 2020
Kibali’s income for 2021 was 14% higher than the prior year due to a higher realized gold price6, lower cost of sales per ounce7 and slightly higher sales volume.
|
|
|
|
|
|
|
|
|
| BARRICK YEAR-END 2021 |
64 |
MANAGEMENT’S DISCUSSION AND ANALYSIS |
INCOME AND EBITDA6
Gold production in 2021 was slightly higher compared to the prior year due to higher throughput, partially offset by lower grades processed.
PRODUCTION (thousands of ounces)
a Based on the midpoint of the guidance range.
Cost of sales per ounce7 in 2021 decreased by 7% compared to the prior year due to lower depreciation expense, partially offset by higher total cash costs6. Total cash costs per ounce6 were 3% higher, mainly due to higher labor and logistics charges due to pandemic-related
travel restrictions. This was partially offset by lower energy costs driven by an improved hydro power blend in the first half of 2021 and relatively lower fuel prices. For 2021, all-in sustaining costs per ounce6 was 5% higher compared to the prior year, reflecting higher total cash costs per ounce6 and higher minesite sustaining capital expenditures6.
COST OF SALES7, TOTAL CASH COSTS6
AND ALL-IN SUSTAINING COSTS6 ($ per ounce)
a Based on the midpoint of the guidance range.
Capital expenditures in 2021 were 37% higher compared to the prior year, due to higher minesite sustaining capital expenditures6 related to a tailings dam raise, and project capital expenditures6 related to the advancement of the Kalimva/Ikamva and Pamao open pit projects.
2021 compared to Guidance
Attributable gold production in 2021 of 366 thousand ounces was near the midpoint of the guidance range of 350 to 380 thousand ounces. Cost of sales per ounce7 of $1,016 was within guidance range of $990 to $1,040 per ounce. Total cash costs per ounce6 of $627 were also within the guidance range of $590 to $640 per ounce, while all-in sustaining costs per ounce6 of $818 were at the lower end of the guidance range of $800 to $850 per ounce.
|
|
|
|
|
|
|
|
|
| BARRICK YEAR-END 2021 |
65 |
MANAGEMENT’S DISCUSSION AND ANALYSIS |
Veladero (50% basis)a, Argentina
Summary of Operating and Financial Data
|
|
|
|
|
|
|
|
|
|
|
|
|
|
|
|
|
|
|
|
|
|
|
|
|
|
|
|
|
|
|
For the three months ended |
|
For the years ended |
| |
12/31/21 |
9/30/21 |
Change |
|
12/31/21 |
12/31/20 |
Change |
|
12/31/19 |
| Open pit tonnes mined (000s) |
8,997 |
|
8,837 |
|
2 |
% |
|
37,787 |
|
29,108 |
|
30 |
% |
|
36,758 |
|
| Open pit ore |
3,308 |
|
3,267 |
|
1 |
% |
|
10,629 |
|
13,678 |
|
(22) |
% |
|
16,048 |
|
| Open pit waste |
5,689 |
|
5,570 |
|
2 |
% |
|
27,158 |
|
15,430 |
|
76 |
% |
|
20,710 |
|
| Average grade (grams/tonne) |
|
|
|
|
|
|
|
|
|
| Open pit mined |
0.85 |
|
0.69 |
|
23 |
% |
|
0.77 |
|
0.78 |
|
(1) |
% |
|
0.71 |
|
| Processed |
0.81 |
|
0.71 |
|
14 |
% |
|
0.77 |
|
0.84 |
|
(8) |
% |
|
0.79 |
|
| Heap leach ore tonnes processed (000s) |
3,442 |
|
3,126 |
|
10 |
% |
|
11,114 |
|
12,017 |
|
(8) |
% |
|
13,587 |
|
| Gold produced (000s oz) |
61 |
|
48 |
|
27 |
% |
|
172 |
|
226 |
|
(24) |
% |
|
274 |
|
| Gold sold (000s oz) |
83 |
|
44 |
|
89 |
% |
|
206 |
|
186 |
|
11 |
% |
|
271 |
|
| Revenue ($ millions) |
153 |
|
81 |
|
89 |
% |
|
382 |
|
333 |
|
15 |
% |
|
386 |
|
| Cost of sales ($ millions) |
109 |
|
58 |
|
88 |
% |
|
262 |
|
213 |
|
23 |
% |
|
323 |
|
| Income ($ millions) |
43 |
|
24 |
|
79 |
% |
|
118 |
|
114 |
|
4 |
% |
|
57 |
|
EBITDA ($ millions)b |
80 |
|
41 |
|
95 |
% |
|
203 |
|
183 |
|
11 |
% |
|
172 |
|
EBITDA marginc |
52 |
% |
51 |
% |
2 |
% |
|
53 |
% |
55 |
% |
(3) |
% |
|
45 |
% |
| Capital expenditures ($ millions) |
28 |
|
29 |
|
(3) |
% |
|
142 |
|
113 |
|
26 |
% |
|
106 |
|
Minesite sustainingb |
22 |
|
29 |
|
(24) |
% |
|
136 |
|
98 |
|
39 |
% |
|
91 |
|
Projectb |
6 |
|
0 |
|
100 |
% |
|
6 |
|
15 |
|
(60) |
% |
|
15 |
|
| Cost of sales ($/oz) |
1,279 |
|
1,315 |
|
(3) |
% |
|
1,256 |
|
1,151 |
|
9 |
% |
|
1,188 |
|
Total cash costs ($/oz)b |
834 |
|
882 |
|
(5) |
% |
|
816 |
|
748 |
|
9 |
% |
|
734 |
|
All-in sustaining costs ($/oz)b |
1,113 |
|
1,571 |
|
(29) |
% |
|
1,493 |
|
1,308 |
|
14 |
% |
|
1,105 |
|
All-in costs ($/oz)b |
1,179 |
|
1,571 |
|
(25) |
% |
|
1,520 |
|
1,390 |
|
9 |
% |
|
1,162 |
|
a.Barrick owns 50% of Veladero with our joint venture partner, Shandong Gold, owning the remaining 50%. Veladero is proportionately consolidated on the basis that the joint venture partners that have joint control have rights to the assets and obligations for the liabilities relating to the arrangement. The figures presented in this table and the discussion that follows are based on our 50% interest in Veladero inclusive of the impact of remeasurement of our interest in Veladero following the disposal of a 50% interest on June 30, 2017.
b.Further information on these non-GAAP financial measures, including detailed reconciliations, is included on pages 94 to 120 of this MD&A. c.Represents EBITDA divided by revenue.
Safety and Environment
There were no LTIs recorded at Veladero during the fourth quarter of 2021, which resulted in an LTIFR8 of 0.00 per million hours worked, consistent with the prior quarter. The TRIFR8 for the fourth quarter of 2021 was 0.00 per million hours worked, compared to 0.64 in the prior quarter.
There were three LTIs recorded in 2021, which resulted in an LTIFR8 of 0.28 per million hours worked compared to 0.31 in 2020. The TRIFR8 for 2021 was 0.48 per million hours worked, compared to 0.72 in the prior year. No Class 19 environmental incidents occurred during 2021 or 2020.
Minera Andina del Sol SRL, the joint venture company that operates the Veladero mine, is the subject of various regulatory proceedings related to operational incidents occurring in March 2017, September 2016 and September 2015. Refer to note 35 to the Financial Statements for more information regarding these and related matters.
Financial Results
Q4 2021 compared to Q3 2021
Veladero’s income for the fourth quarter of 2021 was 79% higher than the third quarter of 2021, primarily due to higher sales volume, lower cost of sales per ounce7 and a higher realized gold price6.
Gold production in the fourth quarter of 2021 was 27% higher than the prior quarter, primarily due to an
increase in recoverable ounces placed, combined with a successful strategy of processing material simultaneously from both Phases 1 to 5 and the recently commissioned Phase 6 leach pad. Gold sales were higher than production in the fourth quarter of 2021 due to the sale of a portion of built-up gold inventory as we continue to manage the timing of our sales to minimize our exposure to local currency devaluation.
Cost of sales per ounce7 and total cash costs per ounce6 in the fourth quarter of 2021 decreased by 3% and 5%, respectively, mainly due to the impact of higher sales volumes, partially offset by higher open pit mining and processing costs driven by maintenance and higher consumable prices. In the fourth quarter of 2021, all-in sustaining costs per ounce6 was 29% lower than the prior quarter, primarily attributable to lower minesite sustaining capital expenditures6, combined with lower total cash costs per ounce6.
Capital expenditures in the fourth quarter of 2021 decreased by 3% compared to the prior quarter due to lower minesite sustaining capital expenditures6 related to lower capitalized stripping and drilling. This was partially offset by increased project capital expenditures6 reflecting the commencement of construction for the Phase 7A leach pad after the winter season.
|
|
|
|
|
|
|
|
|
| BARRICK YEAR-END 2021 |
66 |
MANAGEMENT’S DISCUSSION AND ANALYSIS |
2021 compared to 2020
Veladero’s income for 2021 was 4% higher than the prior year, primarily due to a higher realized gold price6 and higher sales volume, partially offset by higher cost of sales per ounce7.
INCOME AND EBITDA6
In 2021, gold production decreased by 24% compared to the prior year, primarily due to the construction and commissioning of the Phase 6 leach pad. As previously disclosed, heap leach processing operations at Veladero were reduced through the first half of 2021, while the mine transitioned to Phase 6. The Phase 6 leach pad expansion was successfully commissioned in the second quarter of 2021, in line with guidance. Gold sales were higher than production as we actively managed the timing of sales to minimize our exposure to local currency devaluation and support the payment of a $20 million dividend to the Veladero joint venture partners.
PRODUCTION (thousands of ounces)
a Based on the midpoint of the guidance range.
In 2021, cost of sales per ounce7 and total cash costs per ounce6 both increased by 9% compared to the prior year period due to higher open pit costs driven by increased mining activity, combined with higher G&A expenditure related to Covid-19. Cost of sales per ounce7 was further impacted by higher depreciation expense. All-in sustaining costs per ounce6 in 2021 increased by 14% compared to the prior year, primarily due to the impact of higher total cash costs per ounce6 and higher minesite sustaining capital expenditures6.
COST OF SALES7, TOTAL CASH COSTS6
AND ALL-IN SUSTAINING COSTS6 ($ per ounce)
a Based on the midpoint of the guidance range.
In 2021, capital expenditures increased by 26% compared to the prior year, mainly due to higher sustaining capital expenditures6 resulting from the development of the Phase 6 leach pad expansion and higher capitalized stripping. Project capital expenditures were lower compared to the prior year, mainly due to a $15 million payment made for the funding of a power transmission line in Argentina following an agreement made with the Provincial Power Regulatory Body of San Juan ("EPRE") that occurred in the same prior year period.
2021 compared to Guidance
Gold production in 2021 of 172 thousand ounces was above the guidance range of 130 to 150 thousand ounces due to stronger performance from the additional stacking capacity of Phase 6, as well as the simultaneous processing of Phases 1 to 5 together with Phase 6. All cost metrics were below the guidance ranges. Cost of sales per ounce7 was $1,256 compared to the guidance range of $1,510 to $1,560 per ounce due to lower depreciation. Total cash costs per ounce6 and all-in sustaining costs per ounce6 were $816 and $1,493, respectively, compared to the guidance ranges of $820 to $870 per ounce and $1,720 to $1,770 per ounce, respectively. Lower total cash costs per ounce6 was driven by higher production. All-in sustaining costs per ounce6 was lower than guidance due to lower total cash costs per ounce6, lower capitalized stripping, and the postponement of truck purchases to 2023.
Regulatory matters
On September 1, 2019, the Argentine government issued Decree 609/2019 announcing currency restrictions in Argentina. Subsequently, the Central Bank of Argentina issued Communication “A” 6770 complementing this decree. As a result, all export proceeds are required to be converted into Argentine pesos. Dividend distributions and payments to foreign suppliers now require specific authorizations from the Central Bank. These currency restrictions have had limited impact on mining operations to date but we continue to optimize the timing of our gold sales to minimize our exposure to currency devaluation. During the fourth quarter of 2021, a dividend of $20 million was paid to the Veladero joint venture partners, in addition to a $17 million loan interest payment. Ongoing constructive discussions are still being held with the Central Bank on our rights to repatriate further profits.
Separately, on October 2, 2020, the Argentine government issued Decree 785/2020 that established the rate for mining export duties at 8%. On December 31, 2021, this decree was extended until December 31, 2023.
|
|
|
|
|
|
|
|
|
| BARRICK YEAR-END 2021 |
67 |
MANAGEMENT’S DISCUSSION AND ANALYSIS |
North Mara (84 basis)a, Tanzania
Summary of Operating and Financial Data
|
|
|
|
|
|
|
|
|
|
|
|
|
|
|
|
|
|
|
|
|
|
|
|
|
|
|
|
|
|
|
For the three months ended |
|
For the years ended |
| |
12/31/21 |
9/30/21 |
Change |
|
12/31/21 |
12/31/20 |
Change |
|
12/31/19 |
| Total tonnes mined (000s) |
661 |
|
340 |
|
94% |
|
1,603 |
|
3,758 |
|
(57)% |
|
10,388 |
|
| Open pit ore |
116 |
|
n/a |
n/a |
|
116 |
|
1,484 |
|
(92)% |
|
3,987 |
|
| Open pit waste |
160 |
|
n/a |
n/a |
|
160 |
|
1,197 |
|
(87)% |
|
5,532 |
|
| Underground |
385 |
|
340 |
|
13% |
|
1,327 |
|
1,077 |
|
23% |
|
869 |
|
| Average grade (grams/tonne) |
|
|
|
|
|
|
|
|
|
| Open pit mined |
1.63 |
|
n/a |
n/a |
|
1.63 |
|
2.14 |
|
(24)% |
|
2.03 |
|
| Underground mined |
6.89 |
|
6.29 |
|
10% |
|
5.58 |
|
6.19 |
|
(10)% |
|
6.82 |
|
| Processed |
3.57 |
|
3.25 |
|
10% |
|
3.30 |
|
3.45 |
|
(4)% |
|
4.50 |
|
| Ore tonnes processed (000s) |
690 |
|
658 |
|
5% |
|
2,703 |
|
2,546 |
|
6% |
|
1,829 |
|
| Recovery rate |
90 |
% |
91 |
% |
(1)% |
|
90 |
% |
92 |
% |
(2)% |
|
94 |
% |
|
|
|
|
|
|
|
|
|
|
|
|
|
|
|
|
|
|
|
|
| Gold produced (000s oz) |
69 |
|
66 |
|
5% |
|
260 |
|
261 |
|
0% |
|
251 |
|
| Gold sold (000s oz) |
70 |
|
65 |
|
8% |
|
257 |
|
269 |
|
(4)% |
|
248 |
|
| Revenue ($ millions) |
126 |
|
116 |
|
9% |
|
463 |
|
480 |
|
(4)% |
|
350 |
|
| Cost of sales ($ millions) |
59 |
|
64 |
|
(8)% |
|
248 |
|
267 |
|
(7)% |
|
236 |
|
| Income ($ millions) |
68 |
|
52 |
|
31% |
|
214 |
|
214 |
|
0% |
|
112 |
|
EBITDA ($ millions)b |
80 |
|
64 |
|
25% |
|
261 |
|
290 |
|
(10)% |
|
187 |
|
EBITDA marginc |
63 |
% |
55 |
% |
15% |
|
56 |
% |
60 |
% |
(7)% |
|
53 |
% |
| Capital expenditures ($ millions) |
32 |
|
18 |
|
78% |
|
79 |
|
87 |
|
(9)% |
|
42 |
|
Minesite sustainingb |
23 |
|
11 |
|
109% |
|
52 |
|
57 |
|
(9)% |
|
36 |
|
Projectb |
9 |
|
7 |
|
29% |
|
27 |
|
30 |
|
(10)% |
|
6 |
|
| Cost of sales ($/oz) |
858 |
|
993 |
|
(14)% |
|
966 |
|
992 |
|
(3)% |
|
953 |
|
Total cash costs ($/oz)b |
679 |
|
796 |
|
(15)% |
|
777 |
|
702 |
|
11% |
|
646 |
|
All-in sustaining costs ($/oz)b |
1,033 |
|
985 |
|
5% |
|
1,001 |
|
929 |
|
8% |
|
802 |
|
All-in costs ($/oz)b |
1,150 |
|
1,105 |
|
4% |
|
1,105 |
|
1,039 |
|
6% |
|
824 |
|
a.Formerly part of Acacia Mining plc. On September 17, 2019, Barrick acquired all of the shares of Acacia it did not already own. The results presented are on a 63.9% basis until September 30, 2019 (notwithstanding the completion of the Acacia transaction on September 17, 2019, we consolidated our interest in Acacia and recorded a non-controlling interest of 36.1% in the income statement for the entirety of the third quarter of 2019 as a matter of convenience); on a 100% basis from October 1, 2019 to December 31, 2019; and on a 84% basis starting January 1, 2020, the date the GoT’s 16% free carried interest was made effective. The results in the table and the discussion that follows are based on our share.
b.Further information on these non-GAAP financial measures, including detailed reconciliations, is included on pages 94 to 120 of this MD&A. c.Represents EBITDA divided by revenue.
Safety and Environment
There were no LTIs recorded at North Mara during the fourth quarter of 2021, which resulted in an LTIFR8 of 0.00 per million hours worked, consistent with the prior quarter. The TRIFR8 for the fourth quarter of 2021 was 1.04 per million hours worked, compared to 0.00 in the prior quarter.
There was one LTI recorded in 2021, resulting in an LTIFR8 of 0.13 per million hours worked, compared to 0.28 in 2020. The TRIFR8 for 2021 was 0.90 per million hours worked, compared to 1.96 in the prior year. No Class 19 environmental incidents occurred during 2021 or 2020.
Financial Results
Q4 2021 compared to Q3 2021
North Mara’s income for the fourth quarter of 2021 was 31% higher than the third quarter of 2021, mainly due to higher sales volumes, lower cost of sales per ounce7 and a higher realized gold price6.
In the fourth quarter of 2021, gold production was 5% higher than the prior quarter, mainly due to improved plant throughput combined with higher grade and tonnes from the underground. Open-pit mining resumed in the
fourth quarter of 2021 for the first time since the second quarter of 2020. The Rama pit is expected to be commissioned in the first quarter of 2022. Fleet replacement and an improvement in underground efficiency in 2021 has resulted in a record year for underground tonnes mined.
Cost of sales per ounce7 and total cash costs per ounce6 in the fourth quarter of 2021 were 14% and 15% lower, respectively, than the prior quarter, primarily due to the successful transition to grid power from diesel in the underground. This was combined with improved underground ore delivery, at a higher grade, after the delivery of new fleet purchased in prior quarters. All-in sustaining costs per ounce6 in the fourth quarter of 2021 was 5% higher than the prior quarter as a result of higher minesite sustaining capital expenditures6, partially offset by lower total cash costs per ounce6.
Capital expenditures in the fourth quarter of 2021 were 78% higher than the third quarter of 2021, driven by higher minesite sustaining capital expenditures6 as well as higher project capital expenditures6 predominantly relating to the initial capital spend on the restart of the open-pit mine, procurement of key underground equipment in line
|
|
|
|
|
|
|
|
|
| BARRICK YEAR-END 2021 |
68 |
MANAGEMENT’S DISCUSSION AND ANALYSIS |
with our automation and optimization plan, and completion of the brine treatment facility.
2021 compared to 2020
North Mara’s income for 2021 was in line with the prior year as lower sales volume was offset by a higher realized gold price6 and lower cost of sales per ounce7.
INCOME AND EBITDA6,a
a The results are presented on a 63.9% basis from January 1, 2019 to September 30, 2019, on a 100% basis from October 1, 2019 to December 31, 2019 and on a 84% basis starting January 1, 2020, the date the GoT’s 16% free carried interest was made effective.
In 2021, gold production was largely in line with the prior year as higher throughput was offset by lower grades processed. Both mill throughput and underground tonnes mined reached annual records in 2021.
PRODUCTION (thousands of ounces)
a Based on the midpoint of the guidance range.
Cost of sales per ounce7 in 2021 was 3% lower than the prior year, due to lower depreciation following the temporary cessation of open-pit mining in 2020, partially offset by higher total cash costs per ounce6. The increase in total cash costs per ounce6 of 11% was mainly due to increased royalty expense due to a higher realized gold price6, combined with higher operating costs related to the water treatment plant. All-in sustaining costs per ounce6 was 8% higher than the prior year, primarily due to higher total cash costs per ounce6, partially offset by a decrease in minesite sustaining capital expenditures6.
COST OF SALES7, TOTAL CASH COSTS6
AND ALL-IN SUSTAINING COSTS6 ($ per ounce)
a Based on the midpoint of the guidance range.
In 2021, capital expenditures decreased by 9% compared to the prior year, driven by lower minesite sustaining capital expenditures6 as well as lower project capital expenditures6, mainly due to investments in the prior year related to the tailings storage facility and other water management initiatives.
2021 compared to Guidance
Gold production in 2021 of 260 thousand ounces was in the upper end of the guidance range of 240 to 270 thousand ounces. Cost of sales per ounce7 of $966 was slightly below the guidance range of $970 to $1,020 per ounce. Total cash costs per ounce6 and and all-in sustaining costs per ounce6 of $777 and $1,001, respectively, were both within the guidance ranges of $740 to $790 per ounce and $960 to $1,100 per ounce, respectively.
|
|
|
|
|
|
|
|
|
| BARRICK YEAR-END 2021 |
69 |
MANAGEMENT’S DISCUSSION AND ANALYSIS |
Bulyanhulu (84% basis)a, Tanzania
Summary of Operating and Financial Data
|
|
|
|
|
|
|
|
|
|
|
|
|
|
|
|
|
|
|
|
|
|
|
|
|
|
|
|
|
|
|
For the three months ended |
|
For the years ended |
| |
12/31/21 |
9/30/21 |
Change |
|
12/31/21 |
12/31/20 |
Change |
|
12/31/19 |
| Underground tonnes mined (000s) |
243 |
|
198 |
|
23 |
% |
|
730 |
|
83 |
|
780 |
% |
|
n/a |
|
|
|
|
|
|
|
|
|
|
|
|
|
|
|
|
|
|
|
|
|
|
|
|
|
|
|
|
|
|
| Average grade (grams/tonne) |
|
|
|
|
|
|
|
|
|
|
|
|
|
|
|
|
|
|
|
| Underground mined |
8.86 |
|
9.91 |
|
(11) |
% |
|
9.23 |
|
8.81 |
|
5 |
% |
|
n/a |
| Processed |
8.18 |
|
9.82 |
|
(17) |
% |
|
8.95 |
|
1.35 |
|
563 |
% |
|
1.09 |
|
| Ore tonnes processed (000s) |
234 |
|
179 |
|
31 |
% |
|
661 |
|
1,618 |
|
(59) |
% |
|
1,531 |
|
| Recovery rate |
93 |
% |
94 |
% |
(1) |
% |
|
93 |
% |
62 |
% |
50 |
% |
|
50 |
% |
|
|
|
|
|
|
|
|
|
|
|
|
|
|
|
|
|
|
|
|
| Gold produced (000s oz) |
57 |
|
53 |
|
8 |
% |
|
178 |
|
44 |
|
304 |
% |
|
27 |
|
| Gold sold (000s oz) |
53 |
|
49 |
|
8 |
% |
|
166 |
|
103 |
|
61 |
% |
|
27 |
|
| Revenue ($ millions) |
101 |
|
91 |
|
11 |
% |
|
303 |
|
202 |
|
50 |
% |
|
39 |
|
| Cost of sales ($ millions) |
50 |
|
53 |
|
(6) |
% |
|
179 |
|
154 |
|
16 |
% |
|
33 |
|
| Income ($ millions) |
51 |
|
37 |
|
38 |
% |
|
122 |
|
27 |
|
352 |
% |
|
(14) |
|
EBITDA ($ millions)b |
65 |
|
50 |
|
30 |
% |
|
170 |
|
87 |
|
95 |
% |
|
0 |
|
EBITDA marginc |
64 |
% |
55 |
% |
16 |
% |
|
56 |
% |
43 |
% |
30 |
% |
|
0 |
% |
| Capital expenditures ($ millions) |
31 |
|
10 |
|
210 |
% |
|
70 |
|
64 |
|
9 |
% |
|
5 |
|
Minesite sustainingb |
17 |
|
5 |
|
240 |
% |
|
29 |
|
6 |
|
383 |
% |
|
2 |
|
Projectb |
14 |
|
5 |
|
180 |
% |
|
41 |
|
58 |
|
(29) |
% |
|
3 |
|
| Cost of sales ($/oz) |
956 |
|
1,073 |
|
(11) |
% |
|
1,079 |
|
1,499 |
|
(28) |
% |
|
1,207 |
|
Total cash costs ($/oz)b |
567 |
|
724 |
|
(22) |
% |
|
709 |
|
832 |
|
(15) |
% |
|
676 |
|
All-in sustaining costs ($/oz)b |
897 |
|
827 |
|
8 |
% |
|
891 |
|
895 |
|
0 |
% |
|
773 |
|
All-in costs ($/oz)b |
1,159 |
|
937 |
|
24 |
% |
|
1,138 |
|
1,459 |
|
(22) |
% |
|
850 |
|
a.Formerly part of Acacia Mining plc. On September 17, 2019, Barrick acquired all of the shares of Acacia it did not already own. The results presented are on a 63.9% basis until September 30, 2019 (notwithstanding the completion of the Acacia transaction on September 17, 2019, we consolidated our interest in Acacia and recorded a non-controlling interest of 36.1% in the income statement for the entirety of the third quarter of 2019 as a matter of convenience); on a 100% basis from October 1, 2019 to December 31, 2019; and on a 84% basis starting January 1, 2020, the date the GoT’s 16% free carried interest was made effective. The results in the table and the discussion that follows are based on our share.
b.Further information on these non-GAAP financial measures, including detailed reconciliations, is included on pages 94 to 120 of this MD&A. c.Represents EBITDA divided by revenue.
Safety and Environment
There were two LTIs recorded at Bulyanhulu during the fourth quarter of 2021, which resulted in an LTIFR8 of 1.34 per million hours worked, versus 1.40 in the prior quarter. The TRIFR8 for the fourth quarter of 2021 was 2.69 per million hours worked, compared to 4.88 in the prior quarter.
There were four LTIs recorded at Bulyanhulu in 2021, which resulted in an LTIFR8 of 0.72 per million hours worked versus 0.32 in 2020. The TRIFR8 for 2021 was 2.90 per million hours worked, compared to 2.30 in the prior year. No Class 19 environmental incidents occurred during 2021 or 2020.
Financial Results
Q4 2021 compared to Q3 2021
Bulyanhulu’s income for the fourth quarter of 2021 was 38% higher than the third quarter of 2021, mainly due to higher sales volumes and lower cost of sales per ounce7 following the successful ramp-up of the underground operation into the fourth quarter of 2021, combined with a higher realized gold price6.
In the fourth quarter of 2021, gold production was 8% higher than the prior quarter. This increase was driven by the successful ramp-up of the underground operation, which achieved steady-state production during the quarter.
Cost of sales per ounce7 and total cash costs per ounce6 in the fourth quarter of 2021 were 11% and 22% lower, respectively, than the prior quarter mainly due to the
impact of higher production. All-in sustaining costs per ounce6 in the fourth quarter of 2021 was 8% higher than the prior quarter, mainly as a result of higher minesite sustaining capital expenditures6, partially offset by lower total cash costs per ounce6.
Capital expenditures in the fourth quarter of 2021 were 210% higher than the third quarter of 2021, mainly due to increased minesite sustaining capital expenditures6 related to the replacement of the underground mobile fleet. This was combined with higher project capital expenditures6 relating to the process plant optimization, capitalized drilling and life of mine design improvements identified during the underground re-start project.
2021 compared to 2020
Bulyanhulu’s income for 2021 was 352% higher than the prior year, primarily due to higher sales volumes related to the ramp-up of underground mining and processing operations, as described above. This was combined with lower cost of sales per ounce7 and a higher realized gold price6.
|
|
|
|
|
|
|
|
|
| BARRICK YEAR-END 2021 |
70 |
MANAGEMENT’S DISCUSSION AND ANALYSIS |
INCOME AND EBITDA6,a
a The results are presented on a 63.9% basis from January 1, 2019 to September 30, 2019, on a 100% basis from October 1, 2019 to December 31, 2019 and on a 84% basis starting January 1, 2020, the date the GoT’s 16% free carried interest was made effective.
In 2021, gold production was 304% higher than the prior year, primarily due to the ramp-up of underground mining and processing following the restart of underground mining operations at the end of the third quarter of 2020. For most of the prior year, Bulyanhulu was a tailings re-treatment operation.
PRODUCTION (thousands of ounces)
a Based on the midpoint of the guidance range.
Cost of sales per ounce7 and total cash costs per ounce6 in 2021 were 28% and 15% lower, respectively, than the prior year, mainly due to the impact of higher gold production following the successful ramp-up of underground mining and processing in 2021. All-in sustaining costs per ounce6 was in line with the prior year due to lower total cash costs per ounce6, largely offset by higher minesite sustaining capital expenditures6.
COST OF SALES7, TOTAL CASH COSTS6
AND ALL-IN SUSTAINING COSTS6 ($ per ounce)
a Based on the midpoint of the guidance range.
In 2021, capital expenditures increased by 9% compared to the prior year, driven by higher minesite sustaining capital expenditures6 mainly from the replacement of the underground mobile fleet as well as capitalized drilling of the underground. This was partially offset by lower project capital expenditures6 as the mine transitioned to steady state.
2021 compared to Guidance
Gold production in 2021 of 178 thousand ounces was within the guidance range of 170 to 200 thousand ounces. Cost of sales per ounce7 and total cash costs per ounce6 of $1,079 and $709, respectively, were higher than the guidance ranges of $980 to $1,030 per ounce and $580 to $630 per ounce, respectively. All-in sustaining costs per ounce6 of $891 was also higher than the guidance range of $810 to $860 per ounce. All cost metrics were higher than the guidance ranges due to higher than expected dilution, additional drilling to improve grade control reconciliation, and the timing of concentrate sales resulting in lower copper by-product credits.
|
|
|
|
|
|
|
|
|
| BARRICK YEAR-END 2021 |
71 |
MANAGEMENT’S DISCUSSION AND ANALYSIS |
Other Mines - Gold
|
|
|
|
|
|
|
|
|
|
|
|
|
|
|
|
|
|
|
|
|
|
|
|
|
|
|
|
|
|
|
|
|
|
| Summary of Operating and Financial Data |
|
|
For the three months ended |
|
12/31/21 |
|
9/30/21 |
|
Gold produced (000s oz) |
Cost of sales
($/oz) |
Total cash costs ($/oz)a |
All-in sustaining costs ($/oz)a |
Capital Expend-ituresb |
|
Gold produced (000s oz) |
Cost of sales
($/oz) |
Total cash costs ($/oz)a |
All-in sustaining costs ($/oz)a |
Capital Expend-ituresb |
|
|
|
|
|
|
|
|
|
|
|
|
| Tongon (89.7%) |
50 |
1,494 |
|
1,205 |
|
1,301 |
|
2 |
|
|
41 |
1,579 |
|
1,139 |
|
1,329 |
|
7 |
|
| Hemlo |
35 |
1,770 |
|
1,481 |
|
1,938 |
|
15 |
|
|
26 |
1,870 |
|
1,493 |
|
2,276 |
|
20 |
|
|
|
|
|
|
|
|
|
|
|
|
|
|
|
|
|
|
|
|
|
|
|
|
|
Buzwagic (84%) |
|
|
|
|
|
|
4 |
1,000 |
|
967 |
|
970 |
|
0 |
|
Porgerad (47.5%) |
— |
— |
|
— |
|
— |
|
— |
|
|
— |
— |
|
— |
|
— |
|
— |
|
|
|
|
|
|
|
|
|
|
|
|
|
|
|
|
|
|
|
|
|
|
|
|
|
|
|
|
|
|
|
|
|
|
|
|
|
|
|
|
|
|
|
|
|
|
|
|
|
a.Further information on these non-GAAP financial measures, including detailed reconciliations, is included on pages 94 to 120 of this MD&A. b.Includes both minesite sustaining and project capital expenditures.
c.With the end of mining at Buzwagi in the third quarter of 2021, as previously reported, we have ceased to include production or non-GAAP cost metrics for Buzwagi from October 1, 2021 onwards.
d.As Porgera has been on care and maintenance since April 25, 2020, no operating data or per ounce data is provided.
Tongon (89.7% basis), Côte d'Ivoire
Gold production for Tongon in the fourth quarter of 2021 was 22% higher than the prior quarter, reflecting higher grades processed, throughput and recoveries. As previously disclosed, production in the third quarter of 2021 was impacted by a heavy rainy season. Cost of sales per ounce7 in the fourth quarter of 2021 was 5% lower than the prior quarter due to lower depreciation, partially offset by higher total cash costs per ounce6. Total cash costs per ounce6 were 6% higher than the prior quarter, primarily due to higher mill power consumption reflecting increased throughput. All-in sustaining costs per ounce6 in the fourth quarter of 2021 were lower than the prior quarter, due to lower minesite sustaining capital expenditures6, partially offset by the increase in total cash costs per ounce6 .
Gold production in 2021 of 187 thousand ounces was within the guidance range of 180 to 200 thousand ounces. Cost of sales per ounce7 of $1,504 was also within the guidance range of $1,470 to $1,520 per ounce. Total cash costs per ounce6 and all-in sustaining costs per ounce6 of $1,093 and $1,208, respectively, were both above the guidance ranges of $1,000 to $1,050 per ounce and $1,140 to $1,190 per ounce, respectively, driven by increased material mined and processed with lower grade and recoveries.
Hemlo, Ontario, Canada
Hemlo's gold production in the fourth quarter of 2021 was 35% higher than the prior quarter, primarily due to higher grades and higher ore tonnes mined due to improved underground performance. Cost of sales per ounce7 and total cash costs per ounce6 in the fourth quarter of 2021 were 5% and 1% lower, respectively, than the prior quarter due to the impact of higher sales volumes. All-in sustaining costs per ounce6 decreased by 15% compared to the prior quarter, primarily due to lower minesite sustaining capital expenditures6 and lower total cash costs per ounce6.
As expected and previously disclosed, gold production in 2021 of 150 thousand ounces was below the guidance range of 200 to 220 thousand ounces, which was due to lower underground productivity impacted by Covid-19 movement restrictions that slowed the ramp-up of underground development, temporary seismicity issues, and a mine shutdown following the tragic fatality in July 2021 of an employee from our underground mining contractor. Cost of sales per ounce7 of $1,693 and total cash costs per ounce6 of $1,388 were both above the guidance ranges of $1,200 to $1,250 per ounce and $950
to $1,000 per ounce, respectively. All-in sustaining costs per ounce6 of $1,970 was also higher than the guidance range of $1,280 to $1,330 per ounce. As expected and previously disclosed, per ounce cost metrics in 2021 were above guidance due to a significant increase in royalty expense from a higher realized gold price6 and mining in specific underground zones that incurred a higher net profit interest royalty burden. Costs were also impacted by lower production volumes as described above.
Porgera (47.5% basis), Papua New Guinea
On April 9, 2021, BNL signed a binding Framework Agreement with PNG and Kumul Minerals, a state-owned mining company, setting out the terms and conditions for the reopening of the Porgera mine. On February 3, 2022, the Framework Agreement was replaced by the Commencement Agreement. The Commencement Agreement was signed by PNG, Kumul Minerals, BNL and its affiliate Porgera (Jersey) Limited on October 15, 2021, and it became effective on February 3, 2022, following signature by Mineral Resources Enga Limited (“MRE”), the holder of the remaining 5% of the original Porgera joint venture. The Commencement Agreement reflects the commercial terms previously agreed to under the Framework Agreement, namely that PNG stakeholders will receive a 51% equity stake in the Porgera mine, with the remaining 49% to be held by BNL or an affiliate. BNL is jointly owned on a 50/50 basis by Barrick and Zijin Mining Group. Accordingly, following the implementation of the Commencement Agreement, Barrick’s current 47.5% interest in the Porgera mine is expected to be reduced to a 24.5% interest as reflected in Barrick’s reserve and resource estimates for Porgera. BNL will retain operatorship of the mine. The Commencement Agreement also provides that PNG stakeholders and BNL and its affiliates will share the economic benefits derived from the reopened Porgera Mine on a 53% and 47% basis over the remaining life of mine, respectively, and that the Government of PNG will retain the option to acquire BNL’s or its affiliate’s 49% equity participation at fair market value after 10 years.
The provisions of the Commencement Agreement will be implemented, and work to recommence full mine operations at Porgera will begin, following the execution of a number of definitive agreements and satisfaction of a number of conditions. These include a Shareholders Agreement among the shareholders of a new Porgera joint venture company, an Operatorship Agreement pursuant to which BNL will operate the Porgera mine, as well as a Mine
|
|
|
|
|
|
|
|
|
| BARRICK YEAR-END 2021 |
72 |
MANAGEMENT’S DISCUSSION AND ANALYSIS |
Development Contract to accompany the new SML that the new Porgera joint venture company will apply for following its incorporation. Under the terms of the Commencement Agreement, BNL will remain in possession of the site and maintain the mine on care and maintenance.
Porgera was excluded from our 2021 guidance and will also be excluded from our 2022 guidance. We expect to update our guidance following both the execution of all of the definitive agreements to implement the binding Commencement Agreement and the finalization of a timeline for the resumption of full mine operations. Refer to notes 21 and 35 to the Financial Statements for more information.
|
|
|
|
|
|
|
|
|
| BARRICK YEAR-END 2021 |
73 |
MANAGEMENT’S DISCUSSION AND ANALYSIS |
Other Mines - Copper
|
|
|
|
|
|
|
|
|
|
|
|
|
|
|
|
|
|
|
|
|
|
|
|
|
|
|
|
|
|
|
|
|
|
| Summary of Operating and Financial Data |
|
|
For the three months ended |
|
12/31/21 |
|
9/30/21 |
|
Copper production (millions of pounds) |
Cost of sales
($/lb) |
C1 cash costs ($/lb)a |
All-in sustaining costs ($/lb)a |
Capital Expend-ituresb |
|
Copper production (millions of pounds) |
Cost of sales
($/lb) |
C1 cash costs
($/lb)a |
All-in sustaining costs
($/lb)a |
Capital Expend-ituresb |
| Lumwana |
78 |
2.16 |
|
1.54 |
|
3.29 |
|
79 |
|
|
57 |
2.54 |
|
1.76 |
|
2.68 |
|
30 |
|
Zaldívar (50%) |
27 |
3.14 |
|
2.35 |
|
3.42 |
|
35 |
|
|
24 |
3.13 |
|
2.33 |
|
2.77 |
|
21 |
|
| Jabal Sayid (50%) |
21 |
1.36 |
|
1.11 |
|
1.27 |
|
3 |
|
|
19 |
1.51 |
|
1.35 |
|
1.55 |
|
2 |
|
a.Further information on these non-GAAP financial measures, including detailed reconciliations, is included on pages 94 to 120 of this MD&A. b.Includes both minesite sustaining and project capital expenditures.
Lumwana, Zambia
Copper production for Lumwana in the fourth quarter of 2021 was 37% higher compared to the prior quarter, resulting from higher grades processed, improved recovery and a significant improvement in throughput driven by higher mill availability. Cost of sales per pound7 and C1 cash costs per pound6 in the fourth quarter of 2021 were 15% and 13% lower, respectively, than the prior quarter primarily due to higher capitalized stripping, partially offset by higher mining costs. Cost of sales per pound7 was further impacted by lower depreciation expense. In the fourth quarter of 2021, all-in sustaining costs per pound6 increased by 23% compared to the prior quarter, primarily due to higher minesite sustaining capital expenditures6 mainly related to new mining equipment and stripping, partially offset by lower C1 cash costs per pound6.
Copper production in 2021 of 242 million pounds was below the guidance range of 250 to 280 million pounds, mainly due to lower mill and equipment availability. A new fleet was commissioned in the fourth quarter of 2021, which improved availability and was a key driver in the significant increase in production quarter-on-quarter. Cost of sales per pound7 of $2.25 was above the guidance range of $1.85 to $2.05 per pound, while C1 cash costs per pound6 of $1.62 was within the guidance range of $1.45 to $1.65. All-in sustaining costs6 of $2.80 per pound were above the guidance range of $2.25 to $2.45 per pound, due to the timing of shipments. Higher cost metrics are mainly attributed to a higher realized copper price6, which resulted in a higher royalty expense, whereas the guidance ranges were based on a copper price of $2.75/lb as previously disclosed.
Zaldívar (50% basis), Chile
Copper production for Zaldívar in the fourth quarter of 2021 was 13% higher than the prior quarter, mainly due to higher grades processed. Cost of sales per pound7 and C1 cash costs per pound6 in the fourth quarter of 2021 were in line with the prior quarter. All-in sustaining costs per pound6 increased by 23% compared to the prior quarter, primarily due to higher minesite sustaining capital expenditures6 that were previously deferred as a result of Covid-19 movement restrictions earlier in the year.
Copper production in 2021 of 97 million pounds was within the guidance range of 90 to 110 million pounds. Cost metrics per pound were above the guidance ranges mainly due to cost overruns relating to site maintenance. Cost of sales per pound7 for 2021 was $3.19 compared to guidance of $2.30 to $2.50 per pound. C1 cash costs per pound6 was $2.38 compared to guidance of $1.65 to $1.85 per pound, and all-in sustaining costs per pound6 was $2.94 compared to guidance of $1.90 to $2.10 per pound.
Jabal Sayid (50% basis), Saudi Arabia
Jabal Sayid's copper production in the fourth quarter of 2021 was 11% higher compared to the prior quarter, mainly due to increased throughput. Cost of sales per pound7 and C1 cash costs per pound6 in the fourth quarter of 2021 were 10% and 18% lower, respectively, than the prior quarter mainly due to the impact of higher sales volume. All-in sustaining costs per pound6 in the fourth quarter of 2021 decreased by 18% when compared to the prior quarter, mainly due to the lower C1 cash costs per pound6, with minesite sustaining capital expenditures6 remaining consistent with the prior quarter.
Copper production in 2021 of 76 million pounds was near the midpoint of the guidance range of 70 to 80 million pounds, with the mine exceeding expectations on grade and the mill delivering across all quarters. Cost of sales per pound7 for 2021 was $1.38, finishing below the guidance range of $1.40 to $1.60 per pound. C1 cash costs per pound6 were $1.18, which was within the guidance range of $1.10 to $1.30 per pound. All-in sustaining costs per pound6 were $1.33, also within guidance of $1.30 to $1.50 per pound.
|
|
|
|
|
|
|
|
|
| BARRICK YEAR-END 2021 |
74 |
MANAGEMENT’S DISCUSSION AND ANALYSIS |
Growth Project Updates
Goldrush Project, Nevada, USA
Since the conclusion of the public scoping period in September 2021, the Bureau of Land Management’s (“BLM”) Environmental Impact Statement (“EIS”) contractor (Stantec) has completed the Draft EIS (“DEIS”) documents. The draft documents will be reviewed by the local, state, and federal BLM offices before being made available for public review and comment. We expect the public review period for the DEIS to begin in the first quarter of 2022, and it will last for 45 days. Public meetings will be held to gather comments and answer questions from the public. Comments gathered during the public review of the DEIS will then be addressed in the Final EIS (“FEIS”) documents. We continue to expect the issuance of a Record of Decision (“ROD”) in the second half of 2022, which is reflected in the current mine plan.
As the permitting process progresses, mine development has continued in the Red Hill mining zone at Goldrush. Development is currently focused on the upper portions of Red Hill, where dewatering of the ore body is not required. Additionally, the Multi-Purpose Drift (“MPD”) continues to be developed to the north over the top of the orebody. The MPD will serve as a platform for continued underground exploration drilling of the Red Hill and Crow mining zones. Test mining of underground longhole stopes commenced in November 2021. Test stoping will allow for the validation of mining rock mass conditions and increase the amount of ore available for bulk metallurgical testing through the Carlin roasters.
Capital purchases of mobile mining equipment continued in the fourth quarter of 2021. Assembly has begun on a modular dry facility just outside of the existing office/shop facility near the Cortez Hills Open Pit. Engineering work is progressing on Ventilation Raise #1 (“VR1”), the materials handling system, and the underground backfill system. The drilling of test wells for the first three dewatering wells is currently expected to begin in the third quarter of 2022.
The headcount ramp-up at Goldrush also continues, with 127 NGM employees on-site at year-end. Headcount is planned to increase to 233 over the course of 2022.
As at December 31, 2021, we have spent $290 million on a 100% basis (including $26 million in the fourth quarter of 2021) on the Goldrush project, inclusive of the exploration declines. This capital spent to date, together with the remaining expected pre-production capital (until commercial production begins in 2025), is anticipated to be slightly less than the $1 billion initial capital estimate previously disclosed for the Goldrush project (on a 100% basis).
Turquoise Ridge Third Shaft, Nevada, USA14
Construction of the Third Shaft at Turquoise Ridge, which has a hoisting capacity of 5,500 tonnes per day, continues to advance according to schedule and within budget. We continue to expect commissioning in late 2022. Together with increased hoisting capacity, the Third Shaft is expected to provide additional ventilation for underground mining operations as well as shorter haulage distances.
Construction activities continued in the fourth quarter of 2021, focusing on shaft steel installation. At the
end of the quarter, shaft steel equipping reached 28% completion as measured by steel weight. Furthermore, commissioning of the concrete/shotcrete slick line was successfully completed, construction on the 2280 level materials handling system restarted and surface construction of the additional main exhaust fan at the No. 1 Shaft began. Permanent conveyance deliveries have started and a contract is now in place for the construction of the change house facility, which will commence in 2022. The focus of the project will remain on shaft equipping for the first quarter of 2022, followed by final headframe refit.
As at December 31, 2021, we have spent $222 million (including $7 million in the fourth quarter of 2021) out of an estimated capital cost of approximately $300-$330 million (100% basis).
Pueblo Viejo Expansion, Dominican Republic15
The Pueblo Viejo plant expansion and mine life extension project is designed to increase throughput to 14 million tonnes per annum, allowing the operation to maintain minimum average annual gold production of approximately 800,000 ounces after 2022 (100% basis).
Engineering design of the plant expansion continued to progress during the fourth quarter of 2021 and is now essentially complete (from 97% as of the third quarter of 2021). 94% of the contracts and purchase orders have been placed. Steel fabrication is now complete and 91% of the manufactured steel required had been shipped at the end of the fourth quarter of 2021.
Construction for the plant expansion is now 26% complete (from 16% as of the third quarter of 2021). Earthworks were 75% and civil concrete works were 60% complete at the end of the fourth quarter of 2021. Steel and mechanical installation has started, and will ramp up through the first quarter of 2022 upon the arrival of materials. We expect completion of the plant expansion by the end of 2022.
The social, environmental, and technical studies for additional tailings and mine waste rock capacity continued to advance, including the review of alternative sites, in consultation with the government. Detailed design and engineering of these alternative sites is ongoing. We are continuing to engage with local stakeholders to review concerns and feedback.
As of December 31, 2021, we have incurred $450 million (including $112 million in the fourth quarter of 2021) on the project. As previously disclosed, the project has experienced logistical challenges and related delays primarily due to the impact of the Covid-19 pandemic on the global supply chain, and consequently the capital cost of the project is now estimated at approximately $1.4 billion (100% basis).
Bulyanhulu Re-Start and Optimization
During the fourth quarter of 2021, Bulyanhulu achieved record gold production of 68 thousand ounces (100% basis) since resuming mining operations, which is higher than the 2022 planned quarterly run-rate of 55 to 60 thousand ounces (100% basis). In addition, full commissioning of the grinding and gravity circuits has now been completed, enabling the plant to achieve steady throughput rates of
|
|
|
|
|
|
|
|
|
| BARRICK YEAR-END 2021 |
75 |
MANAGEMENT’S DISCUSSION AND ANALYSIS |
2,500 tonnes per day. As the construction phase of this project has been completed, it will no longer be separately reported in this section of the MD&A.
The internal feasibility study for Bulyanhulu delivered mineral reserve growth of 670 thousand ounces year on year (100% basis), net of 2021 depletion, as a direct result of the underground resource conversion drill program at Deep West. Accordingly, the updated mine plan is now expected to deliver an average of 240 thousand ounces (100% basis) per annum for the majority of the life of mine, in excess of 10 years. Furthermore, mineral reserve conversion drilling is planned to convert the lower half of the Deep West panel during 2022.
Zaldívar Chloride Leach Project, Chile
Zaldívar is jointly owned by Antofagasta and Barrick, and is operated by Antofagasta. In December 2019, the Board of Compañía Minera Zaldívar approved the Chloride Leach Project. The project contemplates the construction of a chloride dosing system, an upgrade of the solvent extraction plant and the construction of additional washing ponds.
During the fourth quarter of 2021, the fourth solvent extraction processing stream (Train D) was modified and recommissioned. Capital is trending in line with the approved budget. Construction of the project was substantially complete at the end of the fourth quarter of 2021 and subsequently completed in January 2022. Commissioning is expected in the first quarter of 2022.
Upon commissioning, the project is expected to increase copper recoveries by more than 10% through the addition of chlorides to the leach solution and with further potential upside in recoveries possible depending on the type of ore being processed. This process is based on a proprietary technology called CuproChlor® that was developed by Antofagasta at its Michilla operation, which had ore types similar to those that are processed at Zaldívar. Once in full operation, the project is expected to increase production at Zaldívar by approximately 10 to 15 thousand tonnes per annum at lower operating costs over the remaining life of mine.
As at December 31, 2021, we have spent $180 million (including $15 million in the fourth quarter of 2021)
out of an estimated capital cost of approximately $189 million (100% basis).
Veladero Phase 7 Leach Pad, Argentina
In November 2021, the board of Minera Andina del Sol approved the Phase 7A leach pad construction project. Construction of Phase 7B will commence following the completion of Phase 7A subject to approval by the Board. Construction on both phases will include sub-drainage and monitoring, leak collection and recirculation, impermeabilization, and pregnant leaching solution collection. Additionally, the north channel (non-contacted water management) will be extended along the leach pad facility.
Construction of Phase 7A commenced in November 2021. Overall project progress was at 20% completion at the end of the fourth quarter of 2021, slightly ahead of schedule. Completion is expected in mid-2022, in line with the mine plan.
As at December 31, 2021, we have spent $10 million out of an estimated capital cost of $75 million (100% basis). Subject to approval by the board of Minera Andina del Sol, construction of Phase 7B is expected to commence in the fourth quarter of 2022.
Veladero Power Transmission, Chile-Argentina
In 2019, we commenced construction of an extension to the existing Pascua-Lama power transmission line to connect to Veladero. Upon completion, the power transmission line will allow Veladero to convert to grid power exported from Chile and cease operating the current high-cost diesel generation power plant located at site. A power purchase price agreement was executed during the fourth quarter of 2019 to supply power from renewable energy that will significantly reduce Veladero’s carbon footprint. This is expected to reduce CO2 equivalent emissions by 100,000 tonnes per year upon commissioning.
We have now completed the construction of the Veladero Power Transmission project, which is expected to be energized in the first half of 2022, subject to final authorization. As of December 31, 2021, we have spent $52 million to complete the project (100% basis).
Exploration and Mineral Resource Management
The foundation of our exploration strategy starts with a deep organizational understanding that exploration is an investment and a value driver for the business - not a process. Our strategy has multiple elements that all need to be in balance to deliver on the Company's business plan for growth and long-term sustainability.
First, we seek to deliver projects of a short-to medium-term nature that will drive improvements in mine plans. Second, we seek to make new discoveries that add to Barrick's Tier One Gold Asset1 portfolio. Third, we seek to optimize the value of major undeveloped projects. Finally, we seek to identify emerging opportunities early in their value chain and secure them by an earn-in or outright acquisition, where appropriate.
Our exploration approach is to first understand the geological framework and ore controls. We then design exploration programs based upon that understanding,
instead of simply drilling for mineralized intervals. This has put us in good stead with robust results from multiple projects highlighted in the following section.
North America
Carlin, Nevada, USA16, 17
At North Leeville, results from the 2021 resource delineation program have delivered a maiden inferred resource of 1.9 million tonnes at 11.5 g/t for 0.70 million ounces (on a 100% basis). The bulk of high-grade mineralization occurs in a 200 meter by 135 meter area, with significant growth opportunity along prospective northwest and north-northeast structures. Additional assay results from hole NLX-00010 extend the previously reported 42.4 meters with a further 14.3 meters of high-grade mineralization, producing a final intercept of 56.7 meters at 28.39 g/t Au. A subsequent hole, NLX-00012, located
|
|
|
|
|
|
|
|
|
| BARRICK YEAR-END 2021 |
76 |
MANAGEMENT’S DISCUSSION AND ANALYSIS |
approximately 60 meters to the east returned two intercepts including 4.3 meters at 8.88 g/t Au and 7.8 meters at 26.03 g/t Au. The results confirm the continuity of mineralization along prominent low angle structural and stratigraphic controls in that direction. Resource delineation drilling will continue into 2022 to capture additional high-value ounces, while exploration drilling will test down-dip opportunities along interpreted feeder faults.
Exploration drifting continued from the south, with underground drilling successfully executing the drill program planned to infill the deposit along its southern extents. Overall, North Leeville is defined as a 1 by 1.2 kilometer zone of stratiform mineralization, primarily hosted at or near the contact of the Devonian Rodeo Creek and Popovich Formations, with high-grade centers focused on northwest and north-northeast structures, defining epicenters of high-value ounces within a rough 200 by 250 meter area, currently constrained only by drilling and open to the south and northeast.
Along the Post-Gen fault corridor beneath the southern margin of the Goldstrike stock, a final drill hole was completed at the Dogma target. While the hole intersected favorable breccia and alteration, the lithology was unfavorable and is expected to return only low-grade mineralization through the targeted zone. Focus along the fertile Post fault corridor has moved north of the Goldstrike stock, where down-dip extensions of several high-grade ore bodies remain open.
Resource delineation drilling at REN was completed in the fourth quarter of 2021, with the addition of a metallurgical core hole to increase the understanding of recoveries within the JB Zone. On a 100% basis, this program has delivered a maiden resource of 50 thousand ounces in the indicated category (0.11 million tonnes at 14.40 g/t Au) and 1.2 million ounces in the inferred category (5.2 million tonnes at 7.3 g/t Au), and has further expanded exploration upside potential. Drilling completed in the fourth quarter of 2021 targeted high upside potential areas outside the newly defined resource footprint and highlighted the potential for resource expansion both on the eastern side of the drift, south of the JB Zone (MRC-21015: 16.6 meters at 9.63 g/t Au, ~100m south of existing underground drilling) and, on the western side of the drift, highlighting the high-grade potential of the Corona Corridor (MRC-21001: 40.2 meters at 27.60 g/t Au in the north and MRC-21011: 16.8 meters at 7.03 g/t Au towards the south). Mineralization in the west remains open north, south and to the west. While on the east, mineralization remains unconstrained by drilling up to 800 meters to the south, at East Banshee.
Cortez, Nevada, USA18
At the Cortez Hills underground mine, drill testing of a fertile fault and inferred feeder below the mine referred to as the Hanson Footwall target was successful. To date, multiple intersections (16.9 meters at 11.24 g/t Au in the third quarter of 2021 and 22.6 meters at 23.07 g/t Au in the fourth quarter of 2021), provide encouragement for expansion along strike and down-dip. Follow-up step-out drill testing is planned to start in early 2022.
Follow-up drilling to grow the deposit westward at the Distal target intersected skarn alteration and quartz-sulfide veins that are associated with the previously encountered Distal mineralization. Further to the northwest, field mapping and sampling highlights additional potential associated with parallel structures containing strong
alteration, and surface gold mineralization. Mapping and sampling is ongoing with drilling planned for 2022 in this new area of the deposit.
Further west at Swift, an exploration earn-in joint venture for Nevada Gold Mines, geologic mapping in conjunction with soil and rock chip sampling was undertaken and has validated and expanded the extents of known surface anomalies. Drilling of a framework core hole was initiated to assess depth and alteration of favorable lower plate carbonate host rocks in an area of sparse drilling and strong surficial geochemistry.
Fourmile, Nevada, USA
At Fourmile, drilling northwest of the Dorothy breccia at the northern extents of known mineralization, returned a narrow interval of high-grade mineralization along with a thick interval of breccia that has anomalous pathfinder geochemistry. This anomalous breccia indicates proximity to mineralization and warrants follow-up work to vector to its source. Further north, mapping continues tracing the northward projection of known fertile faults and the northern margin of the premineral Mill Canyon stock where strong geochemical anomalies are focused. Framework drilling commenced during the fourth quarter of 2021, targeting the intersection of anomalous structures identified from mapping to assess the potential of this frontier area several kilometers north of Fourmile.
Turquoise Ridge, Nevada, USA14
Improvements in the understanding of the Turquoise Ridge district geology continues to be delivered from data mining, re-logging, and section work. Updates to the geologic model using the new interpretations continues to highlight opportunities in the camp and multiple targets have been developed.
Sphinx scout drilling results have all been received, intersecting gold mineralization and strong multi-element leakage along three primary structural corridors. Follow-up drilling to test the down-dip intersection of these fertile faults with favorable host rocks at depth is in progress. Additional reverse circulation (“RC”) drilling in the Fence Line target, towards the Mega Pit, is planned to define the extent of a newly recognized area of strong Carlin-type chemical anomalism. The program planned for 2022 is significantly larger than in recent years.
Hemlo, Canada
Infill drilling is ramping up through 2022 in the western extension (E-Zone). The E-Zone consists of fine grain visible gold associated with deformed quartz-carbonate veining and intense carbonate alteration. This varies from the typical C-Zone mineralization to the east, which is mainly associated with strong feldspathization, indicating the E-Zone might be a more distal ore zone to the main ore body. A second rig has been added and the E-Zone is on track to add a new mining area near surface, which will be accessible from the 9975 level.
The most significant reserve and resource material was added in the Lower C-Zone, with continuation of the Lower C-Zone high-grade ore shoots defined approximately 200 meters below current development.
|
|
|
|
|
|
|
|
|
| BARRICK YEAR-END 2021 |
77 |
MANAGEMENT’S DISCUSSION AND ANALYSIS |
Uchi Belt, Canada
In the second half of 2021, Barrick executed four exploration earn-in agreements to secure consolidated land packages totaling ~124,000 hectares of highly prospective and underexplored ground in the western Uchi Belt of northern Ontario. The properties cover over 130 kilometers of strike along prospective structural corridors within the belt, and are all early-stage greenfield projects with excellent discovery potential. Each of the option agreements allow Barrick a clear path, through various expenditure and milestone commitments, to earn a minimum 70% interest in the properties.
On the South Uchi option with Kenorland Minerals in the east of the belt, a property-wide till survey has been completed and partial results to date have identified an anomalous gold-arsenic train within the eastern half of the property package, coincident with the approximately 40 kilometer long arsenic anomaly identified from legacy lake sediment data. Multiple barren grid lines to the immediate northeast, in the up-ice flow direction from the anomalous area, suggests that the source is proximal.
A Lidar survey was flown over the three western properties in the fourth quarter of 2021, which will be used to map the geomorphology to understand the glaciation history ahead of till surveys when the weather permits in 2022.
Latin America & Asia Pacific
Pueblo Viejo, Dominican Republic15
Delineation work progressed at the Arroyo del Rey target, where mapping identified multiple silica alteration events and rock chip samples yielded mineralization at surface, extending the geochemical footprint of the target to 1.5 by 0.7 kilometers, along a northeast trend which is consistent with historical geophysics anomalies. An induced polarization survey is planned for the first quarter of 2022 to further define targets for drill testing later in the year. The first phase of drilling at the Zambrana Central target failed to intersect a significant system, but did add support to the concept of a blind target below the thrusted Hatillo limestones within the Pueblo Viejo corridor, where significant high chargeability and low magnetic anomalies are present.
Pascua-Lama Project Area, Argentina and Chile
At Pascua, the review of the incoming metallurgical results from the 5,537 meter metallurgical campaign is ongoing. Initial results from bottle roll tests are being reviewed, and variability in data is being correlated to the underlying geology models. Flotation variability testwork results are expected in the first quarter of 2022. Bottle roll tests are showing indicative results that portions of the orebody do recover well through direct cyanidation. As a result, we plan to initiate a small 3,000 meter campaign in the first half of 2022 to test for leachability of these ore types. This work continues in support of our effort to rebuild a geometallurgical model and processing optionality review from first principles data.
At Lama, we began a detailed review of the potential high-sulfidation epithermal targets in the immediate district that could tie into a greater Pascua- Lama project or optionality for Veladero. A drill program is being finalized and will be initiated with two rigs in the first half of 2022, with an objective of defining targets that
warrant future work, or elimination from ongoing optionality reviews.
El Indio Belt, Argentina and Chile
The El Indio Belt spans for over 120 kilometers along the Chile-Argentina border in the high Andes, from Alturas-Del Carmen at the southern end to El Encierro in the north. Barrick controls significant ground over this highly productive and prospective belt. Our exploration efforts have been focused on delineating targets with potential to deliver value, including drill testing in nine different targets during 2021, with an additional six targets at drill-ready stage planned for 2022. Generative work has delivered seven additional targets for delineation, which are expected to represent additional exploration opportunities.
At Alturas-Del Carmen, work in the fourth quarter of 2021 was focused on a drilling campaign at Alturas, to test structural controls within the system that could yield higher-grade controls and preferred ore continuity, within the larger framework of the deposit. Drilling at the Del Carmen targets is expected to resume in the first quarter of 2022.
Two holes drilled at Carmen Norte, located immediately to the north of the Rojo Grande mineralization in Del Carmen, confirmed the presence of porphyry style mineralization, associated with reduced high-sulfidation mineralization in the upper part of the drill holes. However, grades are expected to be weak and a decision on further work will be made when results are received.
A geophysical survey consisting of induced polarization and ground magnetics was completed at the Tayta target in Bañitos identifying a strong conductive area related to a large mineralized stockwork surrounded by a high chargeability anomaly, interpreted to be part of the quartz-sericite-pyrite halo of a sizeable gold-copper porphyry system. One framework drillhole was completed during the fourth quarter of 2021, which intersected intense quartz-pyrite-molybdenite and chalcopyrite mineralization in a favorable, strongly magnetized and altered microdioritic host rock. These observations support the potential for a previously unexplored porphyry target at Tayta and further drilling is being planned.
In Chile, drilling started at the Azufreras target in the El Indio Camp, where three drillholes successfully intercepted high-sulfidation style alteration, associated with different styles of phreatomagmatic breccias below a cover of 250 to 300 meters of a fresh or weakly altered tuff, which creates challenges for the economic potential of the target. Upon the completion of two additional holes that are underway to test for shallower concepts in the target, a decision on further work will be made.
Veladero District, Argentina
At Cerro Pelado, work continued through the fourth quarter of 2021 to consolidate recent drill results into the greater Veladero 3D geological model. The updated model will be drill tested in the first quarter of 2022, with the objective of defining a viable project for inclusion in the Veladero life of mine plan.
Delineation work was carried out at Zancarron, located 39 kilometers to the south of Veladero, in an area containing structurally controlled high-sulphidation veins. Two drillholes were subsequently completed at Zancarron, intersecting several intervals of vuggy silica and silicification that is often associated with high grade in the system.
|
|
|
|
|
|
|
|
|
| BARRICK YEAR-END 2021 |
78 |
MANAGEMENT’S DISCUSSION AND ANALYSIS |
Assays are pending. Additionally, ongoing work shows potential for continuity of the Zancarron system under cover to the southeast, where geochemical results from talus sampling has revealed a 400 meter long gold and copper anomaly associated with alteration, that may represent the upper parts of a high-sulfidation system.
El Quevar, Argentina
Results received from an extensive talus fines sampling campaign at El Quevar has defined five areas for follow-up work within the large (greater than 570 square kilometer) mining property. Consistent pathfinder anomalies (arsenic, antimony, bismuth) of a large, high-sulphidation system have been defined and are coincident with significant structures. This information supports the presence of a fully preserved target.
A controlled-source audio-frequency geophysical survey was completed during the fourth quarter of 2021, and drilling is scheduled to start in the first quarter of 2022.
Porgera, Papua New Guinea
As discussed on page 37, Porgera is currently on temporary care and maintenance and consequently, all exploration activities have ceased.
Japan Gold Strategic Alliance, Japan
Regional scale geochemical sampling programs along with geophysical gravity surveys have been completed and interpreted over the majority of the portfolio and have led to the identification of a number of exciting target areas for further work. The Japan Gold and Barrick teams are working collaboratively to prioritize these areas of interest and define the follow-up work programs.
Makapa Project, Guyana
Systematic geological and geochemical screening along a 60 kilometer zone of the Makapa-Kuribrong Shear Zone is supporting the interpretation of prospectivity beneath post-mineral sand cover. A wide-spaced air-core drilling program is in progress and low-level gold and pathfinder anomalism in the southeastern extents of the project is coincident with and potentially controlled by a newly interpreted truncated fold closure. Drilling along the shear zone is ongoing.
Reunion Gold Strategic Alliance, Guiana Shield
Drilling commenced on the NW Extension project in Suriname late in the fourth quarter of 2021, and 10 drill holes have been completed to date. The purpose of the program is to geologically and geochemically screen the projection of interpreted structural corridors, similar to those associated with gold mineralization at the Rosebel gold deposit located 70 kilometers to the southeast. Post-mineral cover on average has been less than or equal to 30 meters thick to date and bedrock comprised of volcanics and sediments is broadly consistent with the interpreted geology. Analytical results are pending and the drilling program will continue through the first quarter of 2022.
Africa & Middle East
Bambadji, Senegal
At Bambadji, in addition to doubling our land position over the prospective Faleme Volcanics Domain, further data integration continued to upgrade the geology models, while
geochemistry has generated additional robust anomalies to be tested in the next field season.
Kabewest continues to emerge as a new discovery and further modeling undertaken in the fourth quarter of 2021 supports potential for significant upside. The next phase of drilling is planned to define the down-dip extent of the system and target potentially blind mineralization along strike.
At Soya, a new soil sampling program has already delineated four kilometers of high tenor anomalies to the north with a prospective north-northwest corridor emerging along strike from Gounkoto on the eastern margin of the albitite. An RC drilling program is being designed to test this area and the potential strike extension of the Gounkoto domain boundary into the Bambadji permit.
At Baqata Ridge, additional rock sampling was undertaken to assess the tenor of mineralization in the host sandstone between already defined high-grade quartz-carbonate-hematite-pyrite vein arrays. This new sampling returned values from hematite altered sandstone supporting the high-grade potential of this target. Further mapping and drilling are planned to rapidly progress this Gara-style deposit (an underground mine at Loulo-Gounkoto).
Loulo-Gounkoto, Mali19
At Yalea Ridge, Phase 2 drilling continues with the aim of further defining the extents and footprint of the system, while providing detailed geological information to enable the building of the first integrated 3D geological model of the target. In the fourth quarter of 2021, drilling successfully intersected the system at 400 meters vertical depth with results including: 3.20 meters at 15.53 g/t Au, 12.40 meters at 3.33 g/t Au and 5.23 meters at 9.54 g/t Au. To date, the highest gold grades are associated with sheeted quartz veinlets and hematite-quartz shear veins.
Along strike to the north from Yalea Ridge, at Sansamba West, first pass aircore drilling over previously defined auger anomalies returned encouraging results in a similar geological setting to Yalea Ridge. Intersections associated with hematite alteration included 3.00 meters at 3.05 g/t Au, 6.00 meters at 2.89 g/t Au, including 2.00 meters at 7.36 g/t Au and 8.00 meters at 3.57 g/t Au, including 4.00 meters at 5.77 g/t. This confirms continuity of the system over at least a 1.20 kilometer strike length beyond Yalea Ridge, highlighting the continued prospectivity of this trend.
At Loulo 1-2 Complex (Yalea Structure), the stratigraphic framework has been resolved with recent diamond drilling and historical reverse circulation and diamond drill holes have been relogged within this framework. Next steps are to incorporate the relogged structural architecture and assess complexities that may influence grade and shoot distribution. The outcomes from this model update will dictate subsequent drill planning.
At the Faraba Complex, drilling through 2021 was aimed to assess the continuity of mineralization through this entire complex and figure out the potential for merging two resources into one mineralized system. Drilling has confirmed the continuation of Faraba Main mineralization (footwall zones 1 and 2) 300 meters to the north into Faraba Gap, and main zone 2 mineralization has been traced 280 meters south from Faraba North into Faraba Gap. In addition, the possibility for a high-grade horizontal shoot within the Dip Domain Boundary Structure, beneath the current optimized pit shell has been identified. Overall,
|
|
|
|
|
|
|
|
|
| BARRICK YEAR-END 2021 |
79 |
MANAGEMENT’S DISCUSSION AND ANALYSIS |
results are very encouraging for building a continuous resource through this area. Further infill drilling is required and will be designed and planned for commencement in the first quarter of 2022.
At Gounkoto DB1, located two kilometers to the south of Gounkoto, drill results within the overall DB structure have been weak. However, drilling did intersect 39 meters of high-grade footwall zone mineralization which indicates potential for Gounkoto-style mineralization. Geological modeling is ongoing with further drilling planned for early in the first quarter of 2022.
Tongon, Côte d'Ivoire20
At Seydou North, step-out drilling is confirming an additional 90 meters down-plunge continuity of mineralization at depth. Results include 16.13 meters at 2.32 g/t Au and 10.90 meters at 2.27 g/t Au. Infill resource conversion drilling has returned better than expected results including 35 meters at 8.99 g/t Au and 28 meters at 6.24 g/t Au. Geotechnical drilling to support an updated pit design commenced in January 2022.
Building on auger results along the fertile Stabilo trend from the second quarter of 2021, ten targets were identified, ranked and drill tested in the fourth quarter of 2021. New potential zones of mineralization have been identified at multiple targets with initial results including 15 meters at 3.54 g/t Au from the Koro A2 target and 10 meters at 0.96 g/t Au from the Koro A1 target. Additional high priority targets are Jubula Main and Jubula West. A second phase of drilling to test these targets will commence in 2022.
Regional Exploration, Côte d'Ivoire
At Fonondara on the Boundiali permit, results from two deep diamond drillholes confirmed the extension of mineralization for more than 75 vertical meters and infill drilling to assess satellite potential to Tongon is currently being planned.
Kibali, Democratic Republic of Congo21
At KCD, the third hole and final hole of the deep drilling program was completed, testing 500 meters down plunge of the 9000 and 12000 lode systems. The targeted lodes and related banded iron formation (“BIF”) were not intersected; however, a 150 meter wide zone of alteration with anomalous mineralization was intersected at the 9000 lode targeted depth. Analysis of the data suggests the BIF and lodes have swung slightly to the southeast. The next phase of exploration will commence after additional infill drilling up plunge more clearly defines the trend of these lodes.
Also at KCD, three underground conversion drillholes targeting the high-grade 3106 lode were extended by exploration, to test for opportunities to the northwest of the main KCD system. All holes intersected a new BIF with alteration and anomalous mineralization. This indicates exploration potential to the northwest of the main KCD system between KCD and the Gorumbwa and Kombokolo deposits, opening a kilometer scale exploration play that is very sparsely tested. Additional drilling is being planned.
At Kalimva, the first hole of a 19 hole follow -st the down-plunge continuation of high-grade shoots and to assess the continuity of mineralization between shoots along the structure. This hole was located on the expected edge of the system and confirmed lithologies, structure,
alteration and anomalous mineralization. Remaining holes in this program will continue to be drilled in early 2022.
At Kolapi, the first phase of drilling commenced to test open-pit potential along a 1.6 kilometer section of the prolific KZ structure between the Oere and Mofu pits. Significant results thus far include 4 meters at 3.8 g/t Au, including 1 meter at 6.27 g/t Au. This open-pit opportunity is close to mine infrastructure including the Ikamva-Kalimva-Oere haul road.
At Makoro, fieldwork aims to build geological understanding behind stream sediment and soil anomalies. Observations and results indicate a shear zone system comprising a number of sub parallel structures that extend over two kilometers. Exploration is just commencing but lithosamples and pit groove samples are returning encouraging results. The shear zone remains open along strike towards the northwest and southeast. Exploration and construction of the geology model is ongoing.
North Mara and Bulyanhulu, Tanzania
Building upon work reported in the third quarter of 2021, mapping and rock chip sampling continued at North Mara with a 1,020 square kilometer area completed during the fourth quarter of 2021. This has delivered four new areas of interest over priority targets showing key indicators for mineralization including host rocks, structure, alteration and geochemical pathfinders.
At the Ochuna target, located 45 kilometers west of the Rama deposit, the structural review to update the geology mode has concluded. This work shows several east-northeast and west-northwest zones of higher-grade mineralization, controlled by lithologic contacts and increased vein intensity. Intervening rock between the higher-grade mineralization contains broad halos of lower-grade disseminated pyrite, which increases mineralization continuity in the system. Resource estimation and pit optimization activities are planned for early 2022 to further evaluate this target as a potential new satellite opportunity
At Bulyanhulu, detailed regolith mapping shows prospective geology and mineralized trends are largely covered by lake sediments and river alluvium, preserving the exploration potential of the district. Results from recent geochemical drilling through this cover have generated several priority targets in the northeast of the mining license. Two of these targets are drill-ready for the first quarter of 2022. Program objectives are to discover additional resources that will increase our inventory and introduce open-pit flexibility into the mine plan.
Regional Exploration, Tanzania
After the successful granting of 2,600 square kilometers of new regional permits earlier in 2021, reconnaissance field programs and exploration planning intensified during the fourth quarter of 2021. In the Ndalilo and Maji-Moto districts, over 330 kilometers of traverses were completed leading to the delivery of six priority areas of interest and two new structural corridors with over 10 kilometers of prospective strike (combined) for advancement in the first half of 2022.
Delivering on our strategy of increased investment in new growth opportunities, in partnership with the Government of Tanzania, we have entered into a binding agreement with Tembo Gold Corporation for the acquisition of six highly prospective prospecting licenses adjacent to
|
|
|
|
|
|
|
|
|
| BARRICK YEAR-END 2021 |
80 |
MANAGEMENT’S DISCUSSION AND ANALYSIS |
the Bulyanhulu mining permit. These licenses contain extensions to prospective structures and geology and have the potential to add mineral reserves to Barrick’s asset base in Tanzania. This transaction is subject to customary regulatory approvals, which are expected to be complete in the first quarter of 2022. Reconnaissance programs are currently being designed for implementation as soon as approvals are complete.
Egypt, Regional Exploration
In Egypt, the administrative and technical setup in-country is progressing. Field visits to the four licenses areas were undertaken in the fourth quarter of 2021. Field observations validate regional spectral interpretation from satellite imagery. Detailed alteration, lithological and structural mapping is underway using high-resolution, multi-spectral satellite imagery to aid rapid testing of ground and targets during the first year field program in 2022.
Jabal Sayid, Kingdom of Saudi Arabia22
At Jabal Sayid Lode 1, exploration drilling intersected significant copper mineralization of 135.7 meters at 1.93% Cu, indicating strong potential to grow the Lode 1 resource along strike and down-plunge to the southwest. Geological observations from this part of the deposit continue to support the presence of a conceptual feeder at depth, with infill drilling planned for the first half of 2022.
Ongoing exploration continues to identify multiple new opportunities along the target palaeosurface along strike from Lode 4. A key exploration focus is the North Gossan target located 500 meters north of Lode 4. Multiple zones of VMS-style alteration within the favorable rhyolite host stratigraphy was observed in exploration drilling in the fourth quarter of 2021. Additional gaps, including around known lodes and possible new mineralization along strike to the south-southwest will be advanced in 2022, including the South Gossan and Wadi Ghafara targets.
|
|
|
|
|
|
|
|
|
| BARRICK YEAR-END 2021 |
81 |
MANAGEMENT’S DISCUSSION AND ANALYSIS |
REVIEW OF FINANCIAL RESULTS
Revenue
|
|
|
|
|
|
|
|
|
|
|
|
|
|
|
|
|
|
| ($ millions, except per ounce/pound data in dollars) |
For the three months ended |
For the years ended |
| |
12/31/21 |
9/30/21 |
12/31/21 |
12/31/20 |
12/31/19 |
| Gold |
|
|
|
|
|
000s oz solda |
1,234 |
|
1,071 |
|
4,468 |
|
4,879 |
|
5,467 |
|
000s oz produceda |
1,203 |
|
1,092 |
|
4,437 |
|
4,760 |
|
5,465 |
|
Market price ($/oz) |
1,795 |
|
1,790 |
|
1,799 |
|
1,770 |
|
1,393 |
|
Realized price ($/oz)b |
1,793 |
|
1,771 |
|
1,790 |
|
1,778 |
|
1,396 |
|
Revenue |
2,977 |
|
2,531 |
|
10,738 |
|
11,670 |
|
9,186 |
|
| Copper |
|
|
|
|
|
millions lbs solda |
113 |
|
101 |
|
423 |
|
457 |
|
355 |
|
millions lbs produceda |
126 |
|
100 |
|
415 |
|
457 |
|
432 |
|
Market price ($/lb) |
4.40 |
|
4.25 |
|
4.23 |
|
2.80 |
|
2.72 |
|
Realized price ($/lb)b |
4.63 |
|
3.98 |
|
4.32 |
|
2.92 |
|
2.77 |
|
Revenue |
263 |
|
209 |
|
962 |
|
697 |
|
393 |
|
| Other sales |
70 |
|
86 |
|
285 |
|
228 |
|
138 |
|
| Total revenue |
3,310 |
|
2,826 |
|
11,985 |
|
12,595 |
|
9,717 |
|
a.On an attributable basis.
b.Further information on these non-GAAP financial measures, including detailed reconciliations, is included on pages 94 to 120 of this MD&A.
Both 2021 gold and copper production of 4.44 million ounces and 415 million pounds, respectively, were within the guidance ranges of 4.4 to 4.7 million ounces and 410 to 460 million pounds, respectively.
Q4 2021 compared to Q3 2021
In the fourth quarter of 2021, gold revenues increased by 18% compared to the third quarter of 2021 primarily due to higher sales volume, combined with a higher realized gold price4. The average market price for the three month period ended December 31, 2021 was $1,795 per ounce versus $1,790 per ounce for the prior quarter. During the fourth quarter of 2021, the gold price ranged from $1,746 per ounce to $1,877 per ounce and closed the quarter at $1,806 per ounce. Gold prices in the fourth quarter of 2021 continued to be volatile as a result of impacts relating to the Covid-19 pandemic, including the progress of vaccine distribution and emergence of variants, as well as growing concerns about increased levels of inflation and expectations for continued economic recovery that are forecast to lead to increases in benchmark interest rates in the near future.
ATTRIBUTABLE GOLD PRODUCTION VARIANCE (000s oz)
Q4 2021 compared to Q3 2021
In the fourth quarter of 2021, attributable gold production was 111 thousand ounces higher than the prior quarter, primarily due to the strong performance from Carlin and Cortez following the repair of the Goldstrike roaster completed at the end of the third quarter of 2021, which allowed for increased processing of material mined from both sites. Gold sales volume also benefited as Veladero sold a portion of its built-up gold inventory.
Copper revenues in the fourth quarter of 2021 increased by 26% compared to the prior quarter, primarily due to a higher realized copper price6, combined with higher copper sales volume. The average market price in the fourth quarter of 2021 was $4.40 per pound versus $4.25 per pound in the prior quarter. In the fourth quarter of 2021, the realized copper price6 was higher than the market copper price due to the impact of positive provisional pricing adjustments, whereas a negative provisional pricing adjustment was recorded in the prior quarter. During the fourth quarter of 2021, the copper price ranged from $4.10 per pound to $4.66 per pound and closed the quarter at $4.40 per pound. Copper prices in the fourth quarter of 2021 were positively influenced by economic optimism following the lifting of some pandemic related restrictions, supply constraints and low copper stockpiles.
Attributable copper production in the fourth quarter of 2021 increased by 26 million pounds compared to the prior quarter, primarily at Lumwana due to increased throughput levels. Copper sales were lower than production, primarily due to the timing of shipments at Lumwana.
2021 compared to 2020
In 2021, gold revenues decreased by 8% compared to the prior year, primarily due to a decrease in sales volumes, partially offset by an increase in the realized gold price6.
|
|
|
|
|
|
|
|
|
| BARRICK YEAR-END 2021 |
82 |
MANAGEMENT’S DISCUSSION AND ANALYSIS |
The average market gold price for 2021 was $1,799 per ounce versus $1,770 per ounce in the prior year.
In 2021, attributable gold production was 4,437 thousand ounces, or 323 thousand ounces lower than the prior year, mainly due to the mechanical mill failure at Carlin’s Goldstrike roaster, Porgera being placed on care and maintenance on April 25, 2020, lower underground productivity related to Covid-19 restrictions that slowed the ramp-up of underground development at Hemlo, and lower grades and throughput at Tongon reflecting the change in the mine plan related to the previously disclosed mine life extension to 2023. This was combined with reduced heap leach processing operations at Veladero through the first half of 2021 due to Covid-19 related delays in the commissioning of Phase 6 of the leach pad and lower grades processed in line with the mine and stockpile processing plan at Pueblo Viejo. These impacts were partially offset by increased production at Bulyanhulu following the ramp-up of underground mining and processing operations starting near the end of 2020. Gold sales were higher than gold production in 2021 as Veladero sold a portion of its built-up gold inventory. In 2020, gold sales were higher than gold production following the re-commencement of exports of concentrate stockpiled in Tanzania, which was completed in the third quarter of 2020.
ATTRIBUTABLE GOLD PRODUCTION VARIANCE (000s oz)
Year ended December 31, 2021
*Other consists primarily of Porgera, Tongon, Hemlo and Buzwagi.
Copper revenues for 2021 were up 38% compared to the prior year due to a higher realized copper price6, partially offset by lower copper sales volume. In both 2021 and 2020, the realized copper price6 was higher than the market copper price as a result of positive provisional pricing adjustments to copper sales that were subject to finalization at the end of each year.
Attributable copper production for 2021 was 42 million pounds lower than the prior year, mainly due to lower grades processed and lower throughput at Lumwana.
Production Costs
|
|
|
|
|
|
|
|
|
|
|
|
|
|
|
|
|
|
|
| ($ millions, except per ounce/pound data in dollars) |
For the three months ended |
For the years ended |
| |
12/31/21 |
9/30/21 |
12/31/21 |
12/31/20 |
12/31/19 |
| Gold |
|
|
|
|
|
| Site operating costs |
1,157 |
|
1,025 |
|
4,218 |
|
4,421 |
|
4,274 |
| Depreciation |
512 |
|
475 |
|
1,889 |
|
1,975 |
|
1,902 |
| Royalty expense |
93 |
|
93 |
|
371 |
|
410 |
|
308 |
| Community relations |
9 |
|
8 |
|
26 |
|
26 |
|
30 |
| Cost of sales |
1,771 |
|
1,601 |
|
6,504 |
|
6,832 |
|
6,514 |
Cost of sales ($/oz)a |
1,075 |
|
1,122 |
|
1,093 |
|
1,056 |
|
1,005 |
Total cash costs ($/oz)b |
715 |
|
739 |
|
725 |
|
699 |
|
671 |
All-in sustaining costs ($/oz)b |
971 |
|
1,034 |
|
1,026 |
|
967 |
|
894 |
| Copper |
|
|
|
|
|
| Site operating costs |
63 |
|
73 |
|
266 |
|
292 |
|
224 |
| Depreciation |
43 |
|
60 |
|
197 |
|
208 |
|
100 |
| Royalty expense |
28 |
|
27 |
|
103 |
|
54 |
|
34 |
| Community relations |
0 |
|
2 |
|
3 |
|
2 |
|
3 |
| Cost of sales |
134 |
|
162 |
|
569 |
|
556 |
|
361 |
Cost of sales ($/lb)a |
2.21 |
|
2.57 |
|
2.32 |
|
2.02 |
|
2.14 |
C1 cash costs ($/lb)b |
1.63 |
|
1.85 |
|
1.72 |
|
1.54 |
|
1.69 |
All-in sustaining costs ($/lb)b |
2.92 |
|
2.60 |
|
2.62 |
|
2.23 |
|
2.52 |
a.Gold cost of sales per ounce is calculated as cost of sales across our gold operations (excluding sites in closure or care and maintenance) divided by ounces sold (both on an attributable basis using Barrick’s ownership share). Copper cost of sales per pound is calculated as cost of sales across our copper operations divided by pounds sold (both on an attributable basis using Barrick’s ownership share).
b.Further information on these non-GAAP financial measures, including detailed reconciliations, is included on pages 94 to 120 of this MD&A.
Q4 2021 compared to Q3 2021
In the fourth quarter of 2021, cost of sales applicable to gold was 11% higher compared to the third quarter of 2021, primarily as a result of higher sales volume. Our 45% interest in Kibali is equity accounted and we therefore do not include its cost of sales in our consolidated gold cost of sales. On a per ounce basis, cost of sales applicable to gold7 and total cash costs6, after including our proportionate share of cost of sales at our equity method investees, were 4% and 3% lower, respectively, than the prior quarter, primarily at Cortez due to sales mix with a higher proportion from lower cost underground production and at Carlin resulting from continued cost discipline, offset by the impact of planned maintenance and higher natural gas prices at Pueblo Viejo.
In the fourth quarter of 2021, gold all-in sustaining costs4 decreased by 6% on a per ounce basis compared to the prior quarter, primarily due to lower total cash costs per
|
|
|
|
|
|
|
|
|
| BARRICK YEAR-END 2021 |
83 |
MANAGEMENT’S DISCUSSION AND ANALYSIS |
ounce6 as discussed above, combined with lower minesite sustaining capital expenditures6 on a per ounce basis.
In the fourth quarter of 2021, cost of sales applicable to copper was 17% lower than the prior quarter, primarily due to lower depreciation and higher capitalized stripping, partially offset by higher mining costs at Lumwana. Our 50% interests in Zaldívar and Jabal Sayid are equity accounted and therefore we do not include their cost of sales in our consolidated copper cost of sales. On a per pound basis, cost of sales applicable to copper7 and C1 cash costs6, after including our proportionate share of cost of sales at our equity method investees, decreased by 14% and 12%, respectively, compared to the prior quarter primarily due to higher capitalized stripping, partially offset by higher mining costs at Lumwana. Cost of sales per pound was further impacted by lower depreciation expense at Lumwana.
In the fourth quarter of 2021, copper all-in sustaining costs6, which have been adjusted to include our proportionate share of equity method investees, were 12% higher per pound than the prior quarter, primarily reflecting higher minesite sustaining capital expenditures6 at Lumwana mainly related to new mining equipment and stripping, partially offset by lower C1 cash costs per pound4.
2021 compared to 2020
In 2021, cost of sales applicable to gold was 5% lower than the prior year primarily due to lower sales volume. On a per ounce basis, cost of sales applicable to gold7, after including our proportionate share of cost of sales at our equity method investees, and total cash costs per ounce6 were both 4% higher than the prior year, primarily due to the impact of lower grades, mainly at Tongon and North Mara.
In 2021, gold all-in sustaining costs per ounce6 increased by 6% compared to the prior year primarily due to higher total cash costs per ounce6, combined with higher minesite sustaining capital expenditures6.
In 2021, cost of sales applicable to copper was 2% higher than the prior year, primarily due to higher royalties at Lumwana, which is a function of a higher realized copper price6. Our 50% interests in Zaldívar and Jabal Sayid are equity accounted and therefore we do not include their cost of sales in our consolidated copper cost of sales. On a per pound basis, cost of sales applicable to copper7 and C1 cash costs6, after including our proportionate share of cost of sales at our equity method investees, increased by 15% and 12%, respectively, compared to the prior year, primarily due to higher royalty expense as a result of a higher realized copper price6 and the impact of lower sales volume.
Copper all-in sustaining costs per pound6 was 17% higher than the prior year, primarily reflecting the higher total C1 cash costs per pound6, combined with higher minesite sustaining capital expenditures6.
2021 compared to Guidance
2021 cost of sales applicable to gold7 was $1,093 per ounce, slightly higher than our guidance range of $1,020 to $1,070 per ounce. Gold total cash costs6 for 2021 of $725 per ounce was at the higher end of the guidance range of $680 to $730, while all-in sustaining costs6 for 2021 of $1,026 per ounce was slightly higher than the guidance range of $970 to $1,020 per ounce. The higher gold cost metrics are mainly driven by the Nevada Mining Education
Tax, which became effective on July 1, 2021 and therefore was not factored into our guidance for the year (refer to page 50), as well as higher royalty expense due to a higher realized gold price6. 2021 cost of sales applicable to copper7 and C1 cash costs6 were $2.32 per pound and $1.72 per pound, respectively, higher than our guidance ranges of $1.90 to $2.10 per pound and $1.40 to $1.60 per pound, respectively. 2021 copper all-in sustaining costs6 of $2.62 per pound was also higher than our guidance range of $2.00 to $2.20 per pound. All copper cost metrics for the year were above guidance due to the impact of lower production, higher maintenance costs at Zaldívar and higher royalty expense driven by a higher realized copper price6.
Capital Expendituresa
|
|
|
|
|
|
|
|
|
|
|
|
|
|
|
|
|
|
| ($ millions) |
For the three months ended |
For the years ended |
| |
12/31/21 |
9/30/21 |
12/31/21 |
12/31/20 |
12/31/19 |
Minesite sustainingb,c |
431 |
|
386 |
|
1,673 |
1,559 |
|
1,320 |
|
Project capital expendituresb,d |
234 |
|
179 |
|
747 |
471 |
|
370 |
|
| Capitalized interest |
4 |
|
4 |
|
15 |
24 |
|
11 |
|
| Total consolidated capital expenditures |
669 |
|
569 |
|
2,435 |
2,054 |
|
1,701 |
|
Attributable capital expenditurese |
552 |
|
456 |
|
1,951 |
1,651 |
|
1,512 |
|
2021 Attributable capital expenditures guidancee |
|
|
$1,800
to
$2,100 |
|
|
a.These amounts are presented on a cash basis.
b.Further information on these non-GAAP financial measures, including detailed reconciliations, is included on pages 94 to 120 of this MD&A. c.Includes both minesite sustaining and mine development.
d.Project capital expenditures are included in our calculation of all-in costs, but not included in our calculation of all-in sustaining costs.
e.These amounts are presented on the same basis as our guidance on page 41.
Q4 2021 compared to Q3 2021
In the fourth quarter of 2021, total consolidated capital expenditures on a cash basis were 18% higher than the third quarter of 2021, due to an increase in both minesite sustaining capital expenditures6 and project capital expenditures6. Minesite sustaining capital expenditures6 increased by 12% compared to the prior quarter, primarily at Lumwana due to new mining equipment and stripping, at North Mara from the initial capital spend on the restart of the open-pit mine, and at Bulyanhulu mainly for the long-term underground fleet. Project capital expenditures6 increased by 30% primarily due to the plant expansion and mine life extension project at Pueblo Viejo, the development of the third underground mine and expansion of power capacity at Loulo-Gounkoto, and the commencement of construction for the Phase 7A leach pad at Veladero.
2021 compared to 2020
In 2021, total consolidated capital expenditures on a cash basis increased by 19% compared to the prior year. This was primarily due to a 59% increase in project capital
|
|
|
|
|
|
|
|
|
| BARRICK YEAR-END 2021 |
84 |
MANAGEMENT’S DISCUSSION AND ANALYSIS |
expenditures6 mainly attributable to the Pueblo Viejo plant expansion and mine life extension project, as well as the development of the third underground mine and expansion of power capacity at Loulo-Gounkoto. This was partially offset by a decrease at Cortez due to lower cost development and exploration activities at Goldrush underground. The increase in project capital expenditures6 was combined with higher minesite sustaining capital expenditures6 of 7%, mainly resulting from the Phase 6 leach pad expansion at Veladero, and at Carlin due to an increase in capitalized waste stripping and the purchase of an oxygen plant at the Goldstrike autoclave. This was combined with an increase at Turquoise Ridge relating to underground equipment purchases and process efficiency related projects.
2021 compared to Guidance
Attributable capital expenditures for 2021 of $1,951 million was at the lower end of the guidance range of $1,800 to $2,100 million.
General and Administrative Expenses
|
|
|
|
|
|
|
|
|
|
|
|
|
|
|
|
|
|
| ($ millions) |
For the three months ended |
For the years ended |
| |
12/31/21 |
9/30/21 |
12/31/21 |
12/31/20 |
12/31/19 |
Corporate administrationa |
32 |
|
23 |
|
118 |
118 |
|
148 |
|
Share-based compensationb |
7 |
|
4 |
|
33 |
67 |
|
37 |
|
Tanzaniac |
0 |
|
0 |
|
0 |
0 |
|
27 |
|
| General & administrative expenses |
39 |
|
27 |
|
151 |
185 |
|
212 |
|
| 2021 General & administrative expenses guidance |
|
|
~$190 |
|
|
a.For the three months and year ended December 31, 2021, corporate administration costs include approximately $nil and $nil, respectively, of severance costs (September 30, 2021: $nil; 2020 $nil; 2019: $18 million).
b.Based on US$19.00 share price as at December 31, 2021 (September 30, 2021: US$18.24; 2020: US$22.78; 2019: $18.59) and excludes share-based compensation relating to Tanzania.
c.Formerly known as Acacia Mining plc.
Q4 2021 compared to Q3 2021
In the fourth quarter of 2021, general and administrative expenses increased by $12 million compared to the third quarter of 2021, primarily due to higher spend on external services.
2021 compared to 2020
General and administrative expenses decreased by $34 million compared to the prior year due to lower share-based compensation expense as a result of our lower share price in the current period compared to an increase in the same prior year period.
2021 compared to Guidance
General and administrative expenses were lower than guidance of ~$190 million. Corporate administration expenses of $118 million were below our guidance of ~$130 million, highlighting the continued benefit of our cost reduction activities, while share-based compensation expense of $33 million was lower than our guidance of ~$60 million, resulting from a decrease in our share price.
Exploration, Evaluation and Project Costs
|
|
|
|
|
|
|
|
|
|
|
|
|
|
|
|
|
|
| ($ millions) |
For the three months ended |
For the years ended |
| |
12/31/21 |
9/30/21 |
12/31/21 |
12/31/20 |
12/31/19 |
| Global exploration and evaluation |
35 |
|
26 |
|
122 |
143 |
|
143 |
|
| Project costs: |
|
|
|
|
|
| Pascua-Lama |
16 |
|
9 |
|
46 |
37 |
|
49 |
|
|
|
|
|
|
|
|
|
|
|
|
|
| Other |
11 |
|
8 |
|
39 |
27 |
|
20 |
|
| Corporate development |
8 |
|
4 |
|
16 |
9 |
|
51 |
|
| Business improvement and innovation |
0 |
|
0 |
|
0 |
0 |
|
10 |
|
| Global exploration and evaluation and project expense |
70 |
|
47 |
|
223 |
216 |
|
273 |
|
| Minesite exploration and evaluation |
12 |
|
20 |
|
64 |
79 |
|
69 |
|
| Total exploration, evaluation and project expenses |
82 |
|
67 |
|
287 |
295 |
|
342 |
|
| 2021 total E&E and project expenses guidance |
|
|
$280
to
$320 |
|
|
Q4 2021 compared to Q3 2021
Exploration, evaluation and project expenses for the fourth quarter of 2021 increased by $15 million compared to the prior quarter. This was primarily due to higher project costs at Pascua-Lama and higher global exploration and evaluation costs mainly at Nevada Gold Mines due to increased drilling. This was partially offset by lower minesite exploration and evaluation costs, primarily at Carlin.
2021 compared to 2020
Exploration, evaluation and project costs for 2021 decreased by $8 million compared to the prior year, primarily due to lower global exploration and evaluation costs at Fourmile and lower minesite exploration and evaluation costs, mainly at Carlin due to lower drill and crew availability. This was partially offset by higher project costs across various projects.
2021 compared to Guidance
Exploration, evaluation and project expenses for 2021 of $287 million were within the guidance range of $280 to $320 million. Exploration and evaluation costs of $223 million were slightly lower than the guidance range of $230 million to $250 million and project expenses of $64 million were in the middle of the guidance range of $50 million to $70 million.
|
|
|
|
|
|
|
|
|
| BARRICK YEAR-END 2021 |
85 |
MANAGEMENT’S DISCUSSION AND ANALYSIS |
Finance Costs, Net
|
|
|
|
|
|
|
|
|
|
|
|
|
|
|
|
|
|
| ($ millions) |
For the three months ended |
For the years ended |
| |
12/31/21 |
9/30/21 |
12/31/21 |
12/31/20 |
12/31/19 |
Interest expensea |
90 |
|
94 |
|
357 |
342 |
|
435 |
| Accretion |
10 |
|
13 |
|
48 |
41 |
|
75 |
| Loss on debt extinguishment |
0 |
|
0 |
|
0 |
15 |
|
3 |
| Interest capitalized |
(5) |
|
(4) |
|
(16) |
(24) |
|
(14) |
|
| Other finance costs |
1 |
|
0 |
|
8 |
1 |
|
1 |
| Finance income |
(12) |
|
(10) |
|
(42) |
(28) |
|
(31) |
|
| Finance costs, net |
84 |
|
93 |
|
355 |
347 |
|
469 |
| 2021 finance costs, net guidance |
|
|
$330
to
$370 |
|
|
a.For the three months and year ended December 31, 2021, interest expense includes approximately $9 million and $35 million, respectively, of non-cash interest expense relating to the gold and silver streaming agreements with Wheaton and Royal Gold, Inc. (September 30, 2021: $8 million; 2020: $34 million; 2019: $103 million).
Q4 2021 compared to Q3 2021
In the fourth quarter of 2021, finance costs, net decreased by 10% compared to the prior quarter, mainly due to minor decreases in both interest expense and accretion, combined with marginally higher finance income.
2021 compared to 2020
In 2021, finance costs, net were 2% higher than the prior year, primarily due to higher interest expense, combined with higher accretion resulting from an increase in market interest rates. This was partially offset by a loss on debt extinguishment of $15 million occurring in the same prior year period. The loss on debt extinguishment in the prior year was due to the make-whole repurchase of the outstanding $337 million of principal of our 3.85% notes due 2022.
2021 compared to Guidance
Finance costs, net for 2021 of $355 million were within the guidance range of $330 to $370 million.
Additional Significant Statement of Income Items
|
|
|
|
|
|
|
|
|
|
|
|
|
|
|
|
|
|
|
| ($ millions) |
For the three months ended |
For the years ended |
|
| |
12/31/21 |
9/30/21 |
12/31/21 |
12/31/20 |
12/31/19 |
|
| Impairment charges (reversals) |
14 |
|
10 |
|
(63) |
|
(269) |
|
(1,423) |
|
|
| Loss on currency translation |
13 |
|
5 |
|
29 |
|
50 |
|
109 |
|
|
| Other (income) expense |
(130) |
|
18 |
|
(67) |
|
(178) |
|
(3,100) |
|
|
Impairment Charges (Reversals)
|
|
|
|
|
|
|
|
|
|
|
|
|
|
|
|
|
|
| ($ millions) |
For the three months ended |
For the years ended |
| |
12/31/21 |
9/30/21 |
12/31/21 |
12/31/20 |
12/31/19 |
| |
Post-tax
(our share) |
Post-tax (our share) |
Post-tax
(our
share) |
Post-tax (our share) |
Post-tax (our share) |
| Asset impairments (reversals) |
| Lagunas Norte |
0 |
|
0 |
|
(86) |
|
0 |
|
12 |
|
| Pueblo Viejo |
0 |
|
0 |
|
(2) |
|
2 |
|
(277) |
|
| Golden Sunlight |
12 |
|
0 |
|
12 |
|
0 |
|
0 |
|
| Hemlo |
0 |
|
0 |
|
4 |
|
0 |
|
0 |
|
| Tanzania |
(1) |
|
0 |
|
3 |
|
(91) |
|
0 |
|
| Pascua-Lama |
0 |
|
0 |
|
1 |
|
0 |
|
296 |
|
| Nevada Gold Mines |
0 |
|
0 |
|
0 |
|
6 |
|
48 |
|
| Lumwana |
0 |
|
0 |
|
0 |
|
0 |
|
(663) |
|
| Veladero |
0 |
|
0 |
|
0 |
|
0 |
|
2 |
|
|
|
|
|
|
|
|
|
|
|
|
|
|
|
|
|
|
|
|
|
|
|
|
|
|
|
|
|
|
|
|
|
|
|
|
|
|
|
|
|
|
|
|
|
|
|
|
|
|
|
|
|
|
|
| Other |
(2) |
|
10 |
|
4 |
|
15 |
|
14 |
|
| Total asset impairment charges (reversals) |
9 |
|
10 |
|
(64) |
|
(68) |
|
(568) |
|
|
|
|
|
|
|
|
|
|
|
|
|
|
|
|
|
|
|
|
|
|
|
|
|
|
|
|
|
|
|
|
|
|
|
|
|
|
|
|
|
|
|
| Tax effects and NCI |
5 |
|
0 |
|
1 |
|
(201) |
|
(855) |
|
| Total impairment charges (reversals) |
14 |
|
10 |
|
(63) |
|
(269) |
|
(1,423) |
|
Impairment Charges (Reversals)
Q4 2021 compared to Q3 2021
In the fourth quarter of 2021, net impairment charges were $9 million (net of tax and non-controlling interests) compared to $10 million (net of tax and non-controlling interests) in the prior quarter. The net impairment charge in
both the current quarter and prior quarter relate to miscellaneous assets.
2021 compared to 2020
In 2021, we recognized $64 million (net of tax and non-controlling interests) of net impairment reversals for non-current assets. This was mainly due to the impairment reversal at Lagunas Norte of $86 million (net of tax) resulting from the agreement to sell our 100% interest to Boroo. This compares to net impairment reversals of $68 million (net of tax and non-controlling interests) in 2020 mainly from our Tanzanian assets as the agreement with the Government of Tanzania was made effective in the first quarter of 2020.
Refer to note 21 to the Financial Statements for a full description of impairment charges, including pre-tax amounts and sensitivity analysis.
Loss on Currency Translation
Q4 2021 compared to Q3 2021
Loss on currency translation in the fourth quarter of 2021 was $13 million compared to $5 million in the prior quarter. The losses in both quarters mainly relate to unrealized foreign currency translation losses from the depreciation of the Argentine peso. The current quarter was also impacted by the depreciation of the Zambian kwacha, whereas in the prior quarter the appreciation of the Zambian kwacha partially offset the losses on the Argentine peso.
|
|
|
|
|
|
|
|
|
| BARRICK YEAR-END 2021 |
86 |
MANAGEMENT’S DISCUSSION AND ANALYSIS |
Fluctuations in these currencies versus the US dollar revalue our peso and kwacha denominated value-added tax receivable balances.
2021 compared to 2020
Loss on currency translation for 2021 was $29 million compared to $50 million in the prior year. The losses in both years mainly relate to unrealized foreign currency losses from the Argentine peso and the Zambian kwacha, however the rate of depreciation of the Argentine peso moderated compared to the same prior year period. Fluctuations in these currencies versus the US dollar revalue our peso and kwacha denominated value-added tax receivable balances.
Other Expense (Income)
Q4 2021 compared to Q3 2021
In the fourth quarter of 2021, other income was $130 million compared to other expense of $18 million in the prior quarter. Other income in the fourth quarter of 2021 mainly relates to a gain on the sale of Lone Tree of $205 million (refer to note 4 to the Financial Statements for more information), partially offset by a $25 million litigation settlement, $21 million of supplies obsolescence at Buzwagi, and care and maintenance expenses at Porgera. In the prior quarter, other expense primarily relates to care and maintenance expenses at Porgera and losses on the revaluation of warrant investments.
2021 compared to 2020
Other income was $67 million in 2021 compared to $178 million in the prior year. In 2021, we recognized a gain on the sale of Lone Tree of $205 million, partially offset by care and maintenance expenses at Porgera of $51 million, a $25 million litigation settlement and supplies obsolescence at Buzwagi of $21 million. In 2020, other income mainly relates to gains of $180 million reflecting gains on the sale of Eskay Creek ($59 million), Massawa ($54 million), Morila ($27 million), and Bullfrog ($22 million). Refer to note 4 to the Financial Statements for more information. This was combined with a gain of $104 million on the remeasurement of the residual cash liability relating to our silver sale agreement with Wheaton. This was partially offset by care and maintenance expenses at Porgera of $51 million and donations made to our host communities relating to the Covid-19 pandemic.
For a further breakdown of other expense (income), refer to note 9 to the Financial Statements.
Income Tax Expense
Income tax expense was $1,344 million in 2021. The unadjusted effective income tax rate for 2021 was 29% of the income before income taxes.
The underlying effective income tax rate on ordinary income for 2021 was 27% after adjusting for the impact of net impairment reversals; the impact of deferred taxes at Hemlo; the impact of the sale of long-lived assets; the impact of the settlement of the Massawa Senegalese Tax Dispute; the impact of tax reform measures in Argentina; the impact of foreign currency translation gains and losses on tax balances; the impact of non-deductible foreign exchange losses; the impact of the Porgera mine being placed on care and maintenance; the impact of the recognition and de-recognition of deferred tax assets; and the impact of other expense adjustments.
We record deferred tax charges or credits if changes in facts or circumstances affect the estimated tax basis of assets and therefore, the expectations in our ability to realize deferred tax assets. The interpretation of tax regulations and legislation as well as their application to our business is complex and subject to change. We have significant amounts of deferred tax assets, including tax loss carry forwards, and also deferred tax liabilities. We also have significant amounts of unrecognized deferred tax assets (e.g. for tax losses in Canada). Potential changes in any of these amounts, as well as our ability to realize deferred tax assets, could significantly affect net income or cash flow in future periods. For further details on income tax expense, refer to note 12 to the Financial Statements.
|
|
|
|
|
|
|
|
|
| Reconciliation to Canadian Statutory Rate |
| For the years ended |
12/31/21 |
12/31/20 |
| At 26.5% statutory rate |
1,228 |
|
1,311 |
|
| Increase (decrease) due to: |
|
|
Allowances and special tax deductionsa |
(138) |
|
(151) |
|
Impact of foreign tax ratesb |
(84) |
|
(32) |
|
| Expenses not tax deductible |
118 |
|
154 |
|
| Taxable gains on sales of long-lived assets |
24 |
|
0 |
|
|
|
|
|
|
|
| Net currency translation (gains) losses on current and deferred tax balances |
23 |
|
(19) |
|
| Tax impact from pass-through entities and equity accounted investments |
(330) |
|
(309) |
|
| Current year tax gains not recognized |
(18) |
|
(9) |
|
|
|
|
| Recognition and de-recognition of deferred tax assets |
(31) |
|
(61) |
|
|
|
|
|
|
|
| Adjustments in respect of prior years |
24 |
|
(53) |
|
| Increase to income tax related contingent liabilities |
19 |
|
42 |
|
|
|
|
| Impact of tax rate changes |
66 |
|
1 |
|
| Withholding taxes |
110 |
|
100 |
|
|
|
|
| Mining taxes |
323 |
|
383 |
|
| Tax impact of amounts recognized within accumulated OCI |
8 |
|
(21) |
|
| Other items |
2 |
|
(4) |
|
| Income tax expense |
1,344 |
|
1,332 |
|
a.We are able to claim certain allowances, incentives and tax deductions unique to extractive industries that result in a lower effective tax rate.
b.We operate in multiple foreign tax jurisdictions that have tax rates different than the Canadian statutory rate.
The more significant items impacting income tax expense in 2021 and 2020 include the following:
Currency Translation
Current and deferred tax balances are subject to remeasurement for changes in currency exchange rates each period. This is required in countries where tax is paid in local currency and the subsidiary has a different functional currency (e.g. US dollars). The most significant balances relate to Argentine and Malian tax liabilities.
In 2021, a tax expense of $23 million arose from translation losses on tax balances, mainly due to the weakening of the Argentine peso and the West African CFA franc against the US dollar. In 2020, a tax recovery of $19 million arose from translation losses and gains on tax balances due to the weakening of the Argentine peso and strengthening of the West African CFA franc, respectively,
|
|
|
|
|
|
|
|
|
| BARRICK YEAR-END 2021 |
87 |
MANAGEMENT’S DISCUSSION AND ANALYSIS |
against the US dollar. These net translation losses (gains) are included within income tax expense (recovery).
Withholding Taxes
In 2021, we have recorded $66 million of dividend withholding taxes related to the undistributed earnings of our subsidiaries in Argentina, Côte d'Ivoire, Saudi Arabia and the United States. We have also recorded $33 million (2020: $87 million, related to Côte d’Ivoire, Tanzania and the United States) of dividend withholding taxes related to the distributed earnings of our subsidiaries in Argentina, Saudi Arabia and the United States.
Accounting for Joint Ventures and Associates
Nevada Gold Mines is a limited liability company treated as a flow through partnership for US tax purposes. The partnership is not subject to federal income tax directly, but
each of its partners is liable for tax on its share of the profits of the partnership. As such, Barrick accounts for its current and deferred income tax associated with the investment (61.5% share) following the principles in IAS 12.
Mining Taxes
Nevada Gold Mines is subject to a Net Proceeds of Minerals tax in Nevada at a rate of 5% and the tax expense recorded in 2021 was $136 million (2020: $149 million). Other significant mining taxes include the Dominican Republic’s Net Profits Interest tax, which is determined based on cash flows as defined by the Pueblo Viejo Special Lease Agreement. A tax expense of $180 million (2020: $212 million) was recorded for this in 2021. Both taxes are included on a consolidated basis in the Company's consolidated statements of income.
|
|
|
|
|
|
|
|
|
|
|
|
| Financial Condition Review |
|
|
|
|
|
|
|
| Summary Balance Sheet and Key Financial Ratios |
|
|
| ($ millions, except ratios and share amounts) |
|
|
|
| As at December 31 |
2021 |
|
2020 |
|
2019 |
|
| Total cash and equivalents |
5,280 |
|
5,188 |
|
3,314 |
|
| Current assets |
2,969 |
|
2,955 |
|
3,573 |
|
| Non-current assets |
38,641 |
|
38,363 |
|
37,505 |
|
| Total Assets |
46,890 |
|
46,506 |
|
44,392 |
|
| Current liabilities excluding short-term debt |
2,071 |
|
2,200 |
|
2,001 |
|
Non-current liabilities excluding long-term debta |
7,362 |
|
7,441 |
|
7,028 |
|
| Debt (current and long-term) |
5,150 |
|
5,155 |
|
5,536 |
|
| Total Liabilities |
14,583 |
|
14,796 |
|
14,565 |
|
| Total shareholders’ equity |
23,857 |
|
23,341 |
|
21,432 |
|
| Non-controlling interests |
8,450 |
|
8,369 |
|
8,395 |
|
| Total Equity |
32,307 |
|
31,710 |
|
29,827 |
|
| Total common shares outstanding (millions of shares) |
1,779 |
|
1,778 |
|
1,778 |
|
| Key Financial Ratios: |
|
|
|
Current ratiob |
3.95:1 |
3.67:1 |
2.90:1 |
Debt-to-equityc |
0.16:1 |
0.16:1 |
0.19:1 |
a.Non-current financial liabilities as at December 31, 2021 were $5,578 million (2020: $5,486 million; 2019: $5,559 million).
b.Represents current assets (excluding assets held-for-sale) divided by current liabilities (including short-term debt and excluding liabilities held-for-sale) as at December 31, 2021, December 31, 2020 and December 31, 2019.
c.Represents debt divided by total shareholders’ equity (including minority interest) as at December 31, 2021, December 31, 2020, and December 31, 2019.
Balance Sheet Review
Total assets were $46.9 billion at December 31, 2021, slightly higher than total assets at December 31, 2020.
Our asset base is primarily comprised of non-current assets such as property, plant and equipment and goodwill, reflecting the capital-intensive nature of the mining business and our history of growth through acquisitions. Other significant assets include production inventories, indirect taxes recoverable and receivable, concentrate sales receivables, other government transaction and joint venture related receivables, and cash and equivalents.
Total liabilities at December 31, 2021 were $14.6 billion, slightly lower than total liabilities at December 31, 2020. Our liabilities are primarily comprised of debt, other non-current liabilities such as provisions and deferred income tax liabilities, and accounts payable.
Shareholders’ Equity
|
|
|
|
|
|
|
|
| February 8, 2022 |
Number of shares |
| Common shares |
1,779,331,037 |
|
| Stock options |
— |
|
Financial Position and Liquidity
We believe we have sufficient financial resources to meet our business requirements for the foreseeable future, including capital expenditures, working capital requirements, interest payments, share buybacks and dividends. To date, we have not experienced significant negative impacts to liquidity as a result of the Covid-19 pandemic. During 2021, our cash balance benefited from strong cash flow from operating activities and cash exceeded debt as at December 31, 2021, for the second
|
|
|
|
|
|
|
|
|
| BARRICK YEAR-END 2021 |
88 |
MANAGEMENT’S DISCUSSION AND ANALYSIS |
year in a row, despite a record $1.4 billion in cash returns paid to shareholders in 2021, inclusive of a $750 million return of capital distribution.
Total cash and cash equivalents as at December 31, 2021 were $5.3 billion. This cash and cash equivalents balance does not include cash held by our equity method investments, including approximately $500 million (our share) at Kibali. The cash and cash equivalents held at Kibali are subject to various steps before they can be distributed to the joint venture shareholders and are held across three banks in the Democratic Republic of Congo, including two domestic banks. Our capital structure comprises a mix of debt, non-controlling interest (primarily at Nevada Gold Mines) and shareholders’ equity. As at December 31, 2021, our total debt was $5.2 billion (debt net of cash and equivalents was negative $130 million) and our debt-to-equity ratio was 0.16:1. This compares to debt as at December 31, 2020 of $5.2 billion (debt, net of cash and cash equivalents was negative $33 million), and a debt-to-equity ratio of 0.16:1.
In 2022, we have capital commitments of $425 million and expect to incur attributable sustaining and project capital expenditures6 of approximately $1,900 to $2,200 million in 2022 based on our guidance range on page 40. In 2022, we have $308 million in interest payments and other amounts as detailed in the table on page 91. In addition, we have contractual obligations and commitments of $658 million in purchase obligations for supplies and consumables. We expect to fund these commitments through operating cash flow, which is our primary source of liquidity, as well as existing cash balances. Our operating cash flow is dependent on the ability of our operations to deliver projected future cash flows. The market prices of gold, and to a lesser extent copper, are the primary drivers of our operating cash flow. Other options to enhance liquidity include further portfolio optimization and the creation of new joint ventures and partnerships; issuance of equity securities in the public markets or to private investors, which could be undertaken for liquidity enhancement and/or in connection with establishing a strategic partnership; issuance of long-term debt securities in the public markets or to private investors (Moody’s and S&P currently rate Barrick’s outstanding long-term debt as investment grade, with ratings of Baa1 and BBB, respectively); and drawing on the $3.0 billion available under our undrawn Credit Facility (subject to compliance with covenants and the making of certain representations and warranties, this facility is available for drawdown as a source of financing). In May 2021, we amended the credit and guarantee agreement (the “Credit Facility”) with certain Lenders, which requires such Lenders to make available to us a credit facility of $3.0 billion or the equivalent amount in Canadian dollars. The Credit Facility, which is unsecured, currently has an interest rate of London Interbank Offered Rate (“LIBOR”) plus 1.125% on drawn amounts, and a standby rate of 0.11% on undrawn amounts. The Credit Facility also includes terms to replace LIBOR with a suitable replacement once that matter is resolved. As part of the amendment, the termination date of the Credit Facility was extended from January 2025 to May 2026. The Credit Facility was undrawn as at December 31, 2021. The key financial covenant in our undrawn credit facility requires Barrick to maintain a net debt to total capitalization ratio of less than 0.60:1. Barrick’s net debt to total capitalization
ratio was 0.00:1 as at December 31, 2021 (0.00:1 as at December 31, 2020).
|
|
|
|
|
|
|
|
|
|
|
|
|
|
|
|
|
|
| Summary of Cash Inflow (Outflow) |
|
|
| ($ millions) |
For the three months ended |
For the years ended |
| |
12/31/21 |
9/30/21 |
12/31/21 |
12/31/20 |
12/31/19 |
| Net cash provided by operating activities |
1,387 |
|
1,050 |
|
4,378 |
|
5,417 |
|
2,833 |
|
| Investing activities |
|
|
|
|
| Capital expenditures |
(669) |
|
(569) |
|
(2,435) |
|
(2,054) |
|
(1,701) |
|
| Investment (purchases) sales |
(46) |
|
0 |
|
(46) |
|
220 |
|
0 |
|
| Cash acquired in Merger |
0 |
|
0 |
|
0 |
|
0 |
|
751 |
|
| Divestitures |
8 |
|
0 |
|
27 |
|
283 |
|
750 |
|
| Dividends received from equity method investments |
306 |
|
53 |
|
520 |
|
141 |
|
217 |
|
| Other |
14 |
|
17 |
|
37 |
|
124 |
|
33 |
|
| Total investing (outflows) inflows |
(387) |
|
(499) |
|
(1,897) |
|
(1,286) |
|
50 |
|
| Financing activities |
|
|
|
|
Net change in debta |
(5) |
|
(5) |
|
(27) |
|
(379) |
|
(309) |
|
Dividendsb |
(159) |
|
(158) |
|
(634) |
|
(547) |
|
(548) |
|
| Return of Capital |
(250) |
|
(250) |
|
(750) |
|
0 |
|
0 |
|
| Net disbursements to non-controlling interests |
(363) |
|
(270) |
|
(1,092) |
|
(1,356) |
|
(281) |
|
| Other |
14 |
|
37 |
|
115 |
|
28 |
|
(1) |
|
| Total financing outflows |
(763) |
|
(646) |
|
(2,388) |
|
(2,254) |
|
(1,139) |
|
| Effect of exchange rate |
0 |
|
0 |
|
(1) |
|
(3) |
|
(1) |
|
| Increase (decrease) in cash and equivalents |
237 |
|
(95) |
|
92 |
|
1,874 |
|
1,743 |
|
a.The difference between the net change in debt on a cash basis and the net change on the balance sheet is due to changes in non-cash charges, specifically the unwinding of discounts and amortization of debt issue costs.
b.For the three months and year ended December 31, 2021, we declared and paid dividends per share in US dollars totaling $0.09 and $0.36, respectively (September 30, 2021: declared and paid $0.09; 2020: declared and paid $0.31; 2019: declared $0.13 and paid $0.20, and also paid $2.69 per share to Randgold shareholders).
Q4 2021 compared to Q3 2021
In the fourth quarter of 2021, we generated $1,387 million in operating cash flow, compared to $1,050 million in the prior quarter. The increase of $337 million was primarily due to lower cash taxes paid, combined with an increase in realized gold and copper prices6 as well as higher gold and copper sales volumes. Operating cash flow was further impacted by lower cost of sales per ounce/pound7. These impacts were partially offset by an unfavorable movement in working capital, mainly in other current assets and
|
|
|
|
|
|
|
|
|
| BARRICK YEAR-END 2021 |
89 |
MANAGEMENT’S DISCUSSION AND ANALYSIS |
receivables, which was partially offset by a favorable movement in inventory.
Cash outflows from investing activities in the fourth quarter of 2021 were $387 million, compared to $499 million in the prior quarter. The decreased outflow was primarily due to an increase in dividends from our equity method investments, partially offset by an increase in capital expenditures. Cash outflows from investing activities was further impacted by the purchase of i-80 Gold shares by NGM pursuant to the Exchange Agreement to acquire the 40% interest in South Arturo that NGM did not already own in exchange for the Lone Tree and Buffalo Mountain properties and infrastructure.
Net financing cash outflows for the fourth quarter of 2021 amounted to $763 million, compared to $646 million in the prior quarter. The increase of $117 million is primarily due to an increase in disbursements to non-controlling interests, primarily to Newmont in relation to their interest in Nevada Gold Mines.
2021 compared to 2020
In 2021, we generated $4,378 million in operating cash flow, compared to $5,417 million in the prior year. The decrease of $1,039 million was primarily due to higher cash taxes paid, lower gold and copper sales volumes and higher cost of sales per ounce/pound7. This was partially offset by higher realized gold and copper prices6.
Cash outflows from investing activities for 2021 were $1,897 million compared to $1,286 million in the prior year. The increased outflow of $611 million was primarily due to an increase in capital expenditures, namely the Pueblo Viejo plant expansion and mine life extension project, as well as the development of the third underground mine and expansion of power capacity at Loulo-Gounkoto. This was combined with cash proceeds of $283 million from the sale of Massawa as well as net investment sales of $220 million mainly from the sale of shares in Shandong Gold, both occurring in the prior year. These impacts were partially offset by higher dividends received from our equity method investments, specifically Jabal Sayid, Zaldívar and Kibali, in the current year.
Net financing cash outflows for 2021 amounted to $2,388 million, compared to $2,254 million in the prior year. The higher outflow of $134 million is primarily due to the payment of the $750 million return of capital distribution in 2021 and higher dividends paid, reflecting Barrick's continued strong financial performance. This was partially offset by the make-whole repurchase of the outstanding $337 million of principal of our 3.85% notes due 2022 in January 2020 and a decrease in disbursements to non-controlling interests, primarily to Newmont in relation to their interest in Nevada Gold Mines, in the current year.
|
|
|
|
|
|
|
|
|
|
|
|
|
|
|
Summary of Financial Instrumentsa |
|
|
|
|
| As at December 31, 2021 |
|
|
|
|
| Financial Instrument |
Principal/Notional Amount |
Associated Risks |
|
|
|
|
|
n Interest rate |
| Cash and equivalents |
|
$5,280 |
|
million |
n Credit |
| |
|
|
|
n Credit |
| Accounts receivable |
|
$623 |
|
million |
n Market |
| |
|
|
|
n Market |
| Other investments |
|
$414 |
|
million |
n Liquidity |
| Accounts payable |
|
$1,448 |
|
million |
n Liquidity |
| Debt |
|
$5,176 |
|
million |
n Interest rate |
| Restricted share units |
|
$31 |
|
million |
n Market |
| Deferred share units |
|
$13 |
|
million |
n Market |
|
|
|
|
|
|
|
|
|
|
|
|
|
|
|
|
|
|
|
|
|
|
|
|
|
|
|
|
|
|
|
|
|
|
|
|
|
|
|
|
|
|
|
|
|
|
|
|
|
|
a.Refer to notes 25, 26 and 28 to the Financial Statements for more information regarding financial instruments, fair value measurements and financial risk management, respectively.
|
|
|
|
|
|
|
|
|
| BARRICK YEAR-END 2021 |
90 |
MANAGEMENT’S DISCUSSION AND ANALYSIS |
Commitments and Contingencies
Litigation and Claims
We are currently subject to various litigation proceedings as disclosed in note 35 to the Financial Statements, and we may be involved in disputes with other parties in the future that may result in litigation. If we are unable to resolve these disputes favorably, it may have a material adverse impact on our financial condition, cash flow and results of operations.
Contractual Obligations and Commitments
In the normal course of business, we enter into contracts that give rise to commitments for future minimum payments. The following table summarizes the remaining contractual maturities of our financial liabilities and operating and capital commitments shown on an undiscounted basis:
|
|
|
|
|
|
|
|
|
|
|
|
|
|
|
|
|
|
|
|
|
|
|
|
| ($ millions) |
Payments due as at December 31, 2021 |
| |
2022 |
2023 |
2024 |
2025 |
2026 |
2027 and thereafter |
Total |
Debta |
|
|
|
|
|
|
|
| Repayment of principal |
0 |
|
0 |
|
0 |
|
12 |
|
47 |
|
5,050 |
|
5,109 |
|
| Capital leases |
15 |
|
12 |
|
5 |
|
5 |
|
3 |
|
27 |
|
67 |
|
| Interest |
308 |
|
307 |
|
306 |
|
306 |
|
304 |
|
3,836 |
|
5,367 |
|
Provisions for environmental rehabilitationb |
254 |
|
155 |
|
101 |
|
96 |
|
96 |
|
1,927 |
|
2,629 |
|
|
|
|
|
|
|
|
|
| Restricted share units |
24 |
|
7 |
|
0 |
|
0 |
|
0 |
|
0 |
|
31 |
|
| Pension benefits and other post-retirement benefits |
4 |
|
4 |
|
4 |
|
4 |
|
4 |
|
41 |
|
61 |
|
Minimum royalty paymentsc |
1 |
|
2 |
|
2 |
|
2 |
|
2 |
|
1 |
|
10 |
|
|
|
|
|
|
|
|
|
Purchase obligations for supplies and consumablesd |
658 |
|
188 |
|
149 |
|
139 |
|
134 |
|
450 |
|
1,718 |
|
Capital commitmentse |
425 |
|
18 |
|
0 |
|
0 |
|
0 |
|
0 |
|
443 |
|
Social development costsf |
14 |
|
12 |
|
10 |
|
10 |
|
9 |
|
64 |
|
119 |
|
Other obligationsg |
9 |
|
17 |
|
17 |
|
17 |
|
17 |
|
348 |
|
425 |
|
| Total |
1,712 |
|
722 |
|
594 |
|
591 |
|
616 |
|
11,744 |
|
15,979 |
|
a.Debt and Interest - Our debt obligations do not include any subjective acceleration clauses or other clauses that enable the holder of the debt to call for early repayment, except in the event that we breach any of the terms and conditions of the debt or for other customary events of default. We are not required to post any collateral under any debt obligations. Projected interest payments on variable rate debt were based on interest rates in effect at December 31, 2021. Interest is calculated on our long-term debt obligations using both fixed and variable rates.
b.Provisions for environmental rehabilitation - Amounts presented in the table represent the undiscounted uninflated future payments for the expected cost of provisions for environmental rehabilitation.
c.Minimum royalty payments are related to continuing operations and are presented net of recoverable amounts.
d.Purchase obligations for supplies and consumables - Includes commitments related to new purchase obligations to secure supply of acid, tires and cyanide for our production process.
e.Capital commitments - Purchase obligations for capital expenditures include only those items where binding commitments have been entered into.
f.Social development costs - Includes a commitment of $14 million in 2027 and thereafter related to the funding of a power transmission line in Argentina.
g.Other obligations includes the Pueblo Viejo JV partner shareholder loan and the deposit on the Pascua-Lama silver sale agreement with Wheaton.
|
|
|
|
|
|
|
|
|
| BARRICK YEAR-END 2021 |
91 |
MANAGEMENT’S DISCUSSION AND ANALYSIS |
Review of Quarterly Results
Quarterly Informationa
|
|
|
|
|
|
|
|
|
|
|
|
|
|
|
|
|
|
|
|
|
|
|
|
|
|
|
|
|
|
| |
2021 |
|
2020 |
| ($ millions, except where indicated) |
Q4 |
Q3 |
Q2 |
Q1 |
|
Q4 |
Q3 |
Q2 |
Q1 |
| Revenues |
3,310 |
|
2,826 |
|
2,893 |
|
2,956 |
|
|
3,279 |
|
3,540 |
|
3,055 |
|
2,721 |
|
Realized price per ounce – goldb |
1,793 |
|
1,771 |
|
1,820 |
|
1,777 |
|
|
1,871 |
|
1,926 |
|
1,725 |
|
1,589 |
|
Realized price per pound – copperb |
4.63 |
|
3.98 |
|
4.57 |
|
4.12 |
|
|
3.39 |
|
3.28 |
|
2.79 |
|
2.23 |
|
| Cost of sales |
1,905 |
|
1,768 |
|
1,704 |
|
1,712 |
|
|
1,814 |
|
1,927 |
|
1,900 |
|
1,776 |
|
| Net earnings |
726 |
|
347 |
|
411 |
|
538 |
|
|
685 |
|
882 |
|
357 |
|
400 |
|
Per share (dollars)c |
0.41 |
|
0.20 |
|
0.23 |
|
0.30 |
|
|
0.39 |
|
0.50 |
|
0.20 |
|
0.22 |
|
Adjusted net earningsb |
626 |
|
419 |
|
513 |
|
507 |
|
|
616 |
|
726 |
|
415 |
|
285 |
|
Per share (dollars)b,c |
0.35 |
|
0.24 |
|
0.29 |
|
0.29 |
|
|
0.35 |
|
0.41 |
|
0.23 |
|
0.16 |
|
| Operating cash flow |
1,387 |
|
1,050 |
|
639 |
|
1,302 |
|
|
1,638 |
|
1,859 |
|
1,031 |
|
889 |
|
Cash consolidated capital expendituresd |
669 |
|
569 |
|
658 |
|
539 |
|
|
546 |
|
548 |
|
509 |
|
451 |
|
Free cash flowb |
718 |
|
481 |
|
(19) |
|
763 |
|
|
1,092 |
|
1,311 |
|
522 |
|
438 |
|
a.Sum of all the quarters may not add up to the annual total due to rounding.
b.Further information on these non-GAAP financial measures, including detailed reconciliations, is included on pages 94 to 120 of this MD&A. c.Calculated using weighted average number of shares outstanding under the basic method of earnings per share.
d.Amounts presented on a consolidated cash basis.
Our recent financial results reflect our emphasis on cost discipline, an agile management structure that empowers our site based leadership teams and a portfolio of Tier One Gold Assets1. This, combined with rising gold and copper prices, has resulted in stronger operating cash flows. The positive free cash flow6 generated, together with the proceeds from various divestitures, have allowed us to continue to strengthen our balance sheet over the past two years and to increase returns to shareholders.
These same fundamentals have also driven higher net earnings in recent quarters. Net earnings has also been impacted by the following items in each quarter
which have been excluded from adjusted net earnings6. In the fourth quarter of 2021, we recorded a gain of $118 million (net of tax and non-controlling interest) related to the disposition of Lone Tree. In the first quarter of 2021, we recorded a net impairment reversal of $86 million (no tax impact) at Lagunas Norte resulting from the agreement to sell our 100% interest of the mine to Boroo. In the first quarter of 2020, we recorded a net impairment reversal of $115 million (net of tax effects), resulting from the agreement with the Government of Tanzania being signed and made effective in that quarter.
|
|
|
|
|
|
|
|
|
| BARRICK YEAR-END 2021 |
92 |
MANAGEMENT’S DISCUSSION AND ANALYSIS |
Internal Control Over Financial Reporting and Disclosure Controls and Procedures
Management is responsible for establishing and maintaining adequate internal control over financial reporting and disclosure controls and procedures. Internal control over financial reporting is a framework designed to provide reasonable assurance regarding the reliability of financial reporting and the preparation of financial statements for external purposes in accordance with IFRS. The Company’s internal control over financial reporting framework includes those policies and procedures that (i) pertain to the maintenance of records that, in reasonable detail, accurately and fairly reflect the transactions and dispositions of the assets of the Company; (ii) provide reasonable assurance that transactions are recorded as necessary to permit preparation of financial statements in accordance with IFRS, and that receipts and expenditures of the Company are being made only in accordance with authorizations of management and directors of the Company; and (iii) provide reasonable assurance regarding prevention or timely detection of unauthorized acquisition, use or disposition of the Company’s assets that could have a material effect on the Company’s consolidated financial statements.
Disclosure controls and procedures form a broader framework designed to provide reasonable assurance that other financial information disclosed publicly fairly presents in all material respects the financial condition, results of operations and cash flows of the Company for the periods presented in this MD&A and Barrick’s Annual Report. The Company’s disclosure controls and procedures framework includes processes designed to ensure that material information relating to the Company, including its consolidated subsidiaries, is made known to management by others within those entities to allow timely decisions regarding required disclosure.
Together, the internal control over financial reporting and disclosure controls and procedures frameworks provide internal control over financial reporting and disclosure. Due to its inherent limitations, internal control over financial reporting and disclosure may not prevent or detect all misstatements. Further, the effectiveness of internal control is subject to the risk that controls may become inadequate because of changes in conditions, or that the degree of compliance with policies or procedures may change.
There were no changes in the Company’s internal control over financial reporting during the year ended December 31, 2021 that have materially affected, or are reasonably likely to materially affect, the Company’s internal control over financial reporting.
The management of Barrick, at the direction of our President and Chief Executive Officer and Senior Executive Vice-President, Chief Financial Officer, evaluated the effectiveness of the design and operation of internal control over financial reporting as of the end of the period covered by this report based on the framework and criteria established in Internal Control – Integrated Framework (2013) as issued by the Committee of Sponsoring Organizations of the Treadway Commission (COSO). Based on that evaluation, management concluded that the Company’s internal control over financial reporting was effective as at December 31, 2021.
Barrick’s annual management report on internal control over financial reporting and the integrated audit report of Barrick’s auditors for the year ended December 31, 2021 will be included in Barrick’s 2021 Annual Report and its 2021 Form 40-F/Annual Information Form on file with the US Securities and Exchange Commission and Canadian provincial securities regulatory authorities.
IFRS Critical Accounting Policies and Accounting Estimates
Management has discussed the development and selection of our critical accounting estimates with the Audit & Risk Committee of the Board of Directors, and the Audit & Risk Committee has reviewed the disclosure relating to such estimates in conjunction with its review of this MD&A. The accounting policies and methods we utilize determine how we report our financial condition and results of operations, and they may require Management to make estimates or rely on assumptions about matters that are inherently uncertain. The consolidated financial statements have been prepared in accordance with IFRS as issued by the International Accounting Standards Board (“IASB”) under the historical cost convention, as modified by revaluation of certain financial assets, derivative contracts and post-retirement assets. Our significant accounting policies are disclosed in note 2 to the Financial Statements, including a summary of current and future changes in accounting policies.
Critical Accounting Estimates and Judgments
Certain accounting estimates have been identified as being “critical” to the presentation of our financial condition and results of operations because they require us to make subjective and/or complex judgments about matters that are inherently uncertain; or there is a reasonable likelihood that materially different amounts could be reported under different conditions or using different assumptions and estimates. Our significant accounting judgments, estimates and assumptions are disclosed in note 3 to the accompanying Financial Statements.
|
|
|
|
|
|
|
|
|
| BARRICK YEAR-END 2021 |
93 |
MANAGEMENT’S DISCUSSION AND ANALYSIS |
Non-GAAP Financial Performance Measures
Adjusted Net Earnings and Adjusted Net Earnings per Share
Adjusted net earnings is a non-GAAP financial measure which excludes the following from net earnings:
■Impairment charges (reversals) related to intangibles, goodwill, property, plant and equipment, and investments;
■Acquisition/disposition gains/losses;
■Foreign currency translation gains/losses;
■Significant tax adjustments; and
■Tax effect and non-controlling interest of the above items.
Management uses this measure internally to evaluate our underlying operating performance for the reporting periods presented and to assist with the planning and forecasting of future operating results. Management believes that adjusted net earnings is a useful measure of our performance because impairment charges, acquisition/disposition gains/losses and significant tax adjustments do not reflect the underlying operating performance of our core mining business and are not necessarily indicative of future operating results. Furthermore, foreign currency translation gains/losses are not necessarily reflective of the underlying operating results for the reporting periods presented. The tax effect and non-controlling interest of the adjusting items
are also excluded to reconcile the amounts to Barrick’s share on a post-tax basis, consistent with net earnings.
As noted, we use this measure for internal purposes. Management’s internal budgets and forecasts and public guidance do not reflect the types of items we adjust for. Consequently, the presentation of adjusted net earnings enables investors and analysts to better understand the underlying operating performance of our core mining business through the eyes of management. Management periodically evaluates the components of adjusted net earnings based on an internal assessment of performance measures that are useful for evaluating the operating performance of our business segments and a review of the non-GAAP financial measures used by mining industry analysts and other mining companies.
Adjusted net earnings is intended to provide additional information only and does not have any standardized definition under IFRS and should not be considered in isolation or as a substitute for measures of performance prepared in accordance with IFRS. The measures are not necessarily indicative of operating profit or cash flow from operations as determined under IFRS. Other companies may calculate these measures differently. The following table reconciles these non-GAAP financial measures to the most directly comparable IFRS measure.
Reconciliation of Net Earnings to Net Earnings per Share, Adjusted Net Earnings and Adjusted Net Earnings per Share
|
|
|
|
|
|
|
|
|
|
|
|
|
|
|
|
|
|
|
|
|
|
|
For the three months ended |
|
|
For the years ended |
| ($ millions, except per share amounts in dollars) |
12/31/21 |
9/30/21 |
|
|
12/31/21 |
12/31/20 |
12/31/19 |
| Net earnings attributable to equity holders of the Company |
726 |
|
347 |
|
|
|
2,022 |
|
2,324 |
|
3,969 |
|
Impairment charges (reversals) related to long-lived assetsa |
14 |
|
10 |
|
|
|
(63) |
|
(269) |
|
(1,423) |
|
Acquisition/disposition gainsb |
(198) |
|
(5) |
|
|
|
(213) |
|
(180) |
|
(2,327) |
|
| Loss on currency translation |
13 |
|
5 |
|
|
|
29 |
|
50 |
|
109 |
|
Significant tax adjustmentsc |
(29) |
|
45 |
|
|
|
125 |
|
(119) |
|
34 |
|
Other expense (income) adjustmentsd |
36 |
|
12 |
|
|
|
73 |
|
71 |
|
(687) |
|
|
|
|
|
|
|
|
|
Tax effect and non-controlling intereste |
64 |
|
5 |
|
|
|
92 |
|
165 |
|
1,227 |
|
| Adjusted net earnings |
626 |
|
419 |
|
|
|
2,065 |
|
2,042 |
|
902 |
|
Net earnings per sharef |
0.41 |
|
0.20 |
|
|
|
1.14 |
|
1.31 |
|
2.26 |
|
Adjusted net earnings per sharef |
0.35 |
|
0.24 |
|
|
|
1.16 |
|
1.15 |
|
0.51 |
|
a.Net impairment reversals primarily relate to non-current asset reversals at Lagunas Norte in the current year and primarily relate to our Tanzanian assets in the prior year.
b.Acquisition/disposition gains for the current year primarily relate to the gain on the sale of Lone Tree in the fourth quarter of 2021, while the prior year mainly relates to the gains on the sale of Eskay Creek, Massawa, Morila and Bullfrog.
c.Significant tax adjustments in the current year primarily relate to deferred tax expense as a result of tax reform measures in Argentina, the foreign exchange impact on current tax expense in Peru and the remeasurement of current and deferred tax balances, the acquisition of the 40% interest in South Arturo that NGM did not already own, the sale of Lagunas Norte, the settlement of the Massawa Senegalese tax dispute and the recognition/derecognition of our deferred taxes in various jurisdictions. In 2020, significant tax adjustments primarily relate to deferred tax recoveries as a result of tax reform measures in Argentina and adjustments made in recognition of the net settlement of all outstanding disputes with the Government of Tanzania.
d.Other expense adjustments for both the current and prior year primarily relate to care and maintenance expenses at Porgera. The current year periods were also impacted by a $25 million litigation settlement. The prior year was further impacted by the impact of changes in the discount rate assumptions on our closed mine rehabilitation provision and donations related to Covid-19, partially offset by the gain on the remeasurement of the residual cash liability relating to our silver sale agreement with Wheaton.
e.Tax effect and non-controlling interest for the current year primarily relates to acquisition/disposition gains.
f.Calculated using weighted average number of shares outstanding under the basic method of earnings per share.
|
|
|
|
|
|
|
|
|
| BARRICK YEAR-END 2021 |
94 |
MANAGEMENT’S DISCUSSION AND ANALYSIS |
Free Cash Flow
Free cash flow is a non-GAAP financial measure that deducts capital expenditures from net cash provided by operating activities. Management believes this to be a useful indicator of our ability to operate without reliance on additional borrowing or usage of existing cash.
Free cash flow is intended to provide additional information only and does not have any standardized definition under IFRS, and should not be considered in
isolation or as a substitute for measures of performance prepared in accordance with IFRS. The measure is not necessarily indicative of operating profit or cash flow from operations as determined under IFRS. Other companies may calculate this measure differently. The following table reconciles this non-GAAP financial measure to the most directly comparable IFRS measure.
Reconciliation of Net Cash Provided by Operating Activities to Free Cash Flow
|
|
|
|
|
|
|
|
|
|
|
|
|
|
|
|
|
|
|
|
|
|
|
For the three months ended |
|
|
For the years ended |
| ($ millions) |
12/31/21 |
9/30/21 |
|
|
12/31/21 |
12/31/20 |
12/31/19 |
| Net cash provided by operating activities |
1,387 |
|
1,050 |
|
|
|
4,378 |
|
5,417 |
|
2,833 |
|
| Capital expenditures |
(669) |
|
(569) |
|
|
|
(2,435) |
|
(2,054) |
|
(1,701) |
|
| Free cash flow |
718 |
|
481 |
|
|
|
1,943 |
|
3,363 |
|
1,132 |
|
Capital Expenditures
Starting with this MD&A, we have included minesite sustaining capital expenditures and project capital expenditures as non-GAAP financial measures. Capital expenditures are classified into minesite sustaining capital expenditures or project capital expenditures depending on the nature of the expenditure. Minesite sustaining capital expenditures is the capital spending required to support current production levels. Project capital expenditures represent the capital spending at new projects and major, discrete projects at existing operations intended to increase net present value through higher production or longer mine life. Management believes this to be a useful indicator of
the purpose of capital expenditures and this distinction is an input into the calculation of all-in sustaining costs per ounce and all-in costs per ounce.
Classifying capital expenditures is intended to provide additional information only and does not have any standardized definition under IFRS, and should not be considered in isolation or as a substitute for measures of performance prepared in accordance with IFRS. Other companies may calculate these measures differently. The following table reconciles these non-GAAP financial measures to the most directly comparable IFRS measure.
Reconciliation of the Classification of Capital Expenditures
|
|
|
|
|
|
|
|
|
|
|
|
|
|
|
|
|
|
|
|
|
|
|
For the three months ended |
|
|
For the years ended |
| ($ millions) |
12/31/21 |
9/30/21 |
|
|
12/31/21 |
12/31/20 |
12/31/19 |
| Minesite sustaining capital expenditures |
431 |
|
386 |
|
|
|
1,673 |
|
1,559 |
|
1,320 |
|
| Project capital expenditures |
234 |
|
179 |
|
|
|
747 |
|
471 |
|
370 |
|
| Capitalized interest |
4 |
|
4 |
|
|
|
15 |
|
24 |
|
11 |
|
| Total consolidated capital expenditures |
669 |
|
569 |
|
|
|
2,435 |
|
2,054 |
|
1,701 |
|
|
|
|
|
|
|
|
|
|
| BARRICK YEAR-END 2021 |
95 |
MANAGEMENT’S DISCUSSION AND ANALYSIS |
Total cash costs per ounce, All-in sustaining costs per ounce, All-in costs per ounce, C1 cash costs per pound and All-in sustaining costs per pound
Total cash costs per ounce, all-in sustaining costs per ounce and all-in costs per ounce are non-GAAP financial measures which are calculated based on the definition published by the World Gold Council (a market development organization for the gold industry comprised of and funded by gold mining companies from around the world, including Barrick, the “WGC”). The WGC is not a regulatory organization. Management uses these measures to monitor the performance of our gold mining operations and its ability to generate positive cash flow, both on an individual site basis and an overall company basis.
Total cash costs start with our cost of sales related to gold production and removes depreciation, the non-controlling interest of cost of sales and includes by-product credits. All-in sustaining costs start with total cash costs and includes minesite sustaining capital expenditures, sustaining leases, general and administrative costs, minesite exploration and evaluation costs and reclamation cost accretion and amortization. These additional costs reflect the expenditures made to maintain current production levels.
All-in costs starts with all-in sustaining costs and adds additional costs that reflect the varying costs of producing gold over the life-cycle of a mine, including: project capital expenditures (capital spending at new projects and major, discrete projects at existing operations intended to increase net present value through higher production or longer mine life) and other non-sustaining costs (primarily non-sustaining leases, exploration and evaluation costs, community relations costs and general and administrative costs that are not associated with current operations). These definitions recognize that there are different costs associated with the life-cycle of a mine, and that it is therefore appropriate to distinguish between sustaining and non-sustaining costs.
We believe that our use of total cash costs, all-in sustaining costs and all-in costs will assist analysts, investors and other stakeholders of Barrick in understanding the costs associated with producing gold, understanding the economics of gold mining, assessing our operating performance and also our ability to generate free cash flow from current operations and to generate free cash flow on an overall company basis. Due to the capital-intensive nature of the industry and the long useful lives over which these items are depreciated, there can be a significant timing difference between net earnings
calculated in accordance with IFRS and the amount of free cash flow that is being generated by a mine and therefore we believe these measures are useful non-GAAP operating metrics and supplement our IFRS disclosures. These measures are not representative of all of our cash expenditures as they do not include income tax payments, interest costs or dividend payments. These measures do not include depreciation or amortization.
Total cash costs per ounce, all-in sustaining costs and all-in costs are intended to provide additional information only and do not have standardized definitions under IFRS and should not be considered in isolation or as a substitute for measures of performance prepared in accordance with IFRS. These measures are not equivalent to net income or cash flow from operations as determined under IFRS. Although the WGC has published a standardized definition, other companies may calculate these measures differently.
In addition to presenting these metrics on a by-product basis, we have calculated these metrics on a co-product basis. Our co-product metrics remove the impact of other metal sales that are produced as a by-product of our gold production from cost per ounce calculations but does not reflect a reduction in costs for costs associated with other metal sales.
C1 cash costs per pound and all-in sustaining costs per pound are non-GAAP financial measures related to our copper mine operations. We believe that C1 cash costs per pound enables investors to better understand the performance of our copper operations in comparison to other copper producers who present results on a similar basis. C1 cash costs per pound excludes royalties and production taxes and non-routine charges as they are not direct production costs. All-in sustaining costs per pound is similar to the gold all-in sustaining costs metric and management uses this to better evaluate the costs of copper production. We believe this measure enables investors to better understand the operating performance of our copper mines as this measure reflects all of the sustaining expenditures incurred in order to produce copper. All-in sustaining costs per pound includes C1 cash costs, sustaining capital expenditures, sustaining leases, general and administrative costs, minesite exploration and evaluation costs, royalties and production taxes, reclamation cost accretion and amortization and write-downs taken on inventory to net realizable value.
|
|
|
|
|
|
|
|
|
| BARRICK YEAR-END 2021 |
96 |
MANAGEMENT’S DISCUSSION AND ANALYSIS |
Reconciliation of Gold Cost of Sales to Total cash costs, All-in sustaining costs and All-in costs, including on a per ounce basis
|
|
|
|
|
|
|
|
|
|
|
|
|
|
|
|
|
|
|
|
|
|
|
|
|
|
|
For the three months ended |
|
For the years ended |
| ($ millions, except per ounce information in dollars) |
Footnote |
12/31/21 |
9/30/21 |
|
|
12/31/21 |
12/31/20 |
12/31/19 |
| Cost of sales applicable to gold production |
|
1,771 |
|
1,601 |
|
|
|
6,504 |
|
6,832 |
|
6,514 |
|
| Depreciation |
|
(512) |
|
(475) |
|
|
|
(1,889) |
|
(1,975) |
|
(1,902) |
|
Cash cost of sales applicable to equity method investments |
|
52 |
|
51 |
|
|
|
217 |
|
222 |
|
226 |
|
By-product credits |
|
(70) |
|
(86) |
|
|
|
(285) |
|
(228) |
|
(138) |
|
| Realized losses on hedge and non-hedge derivatives |
a |
0 |
|
0 |
|
|
|
0 |
|
0 |
|
1 |
|
Non-recurring items |
b |
0 |
|
0 |
|
|
|
0 |
|
1 |
|
(55) |
|
Other |
c |
(7) |
|
14 |
|
|
|
(48) |
|
(129) |
|
(102) |
|
Non-controlling interests |
d |
(351) |
|
(314) |
|
|
|
(1,261) |
|
(1,312) |
|
(878) |
|
Total cash costs |
|
883 |
|
791 |
|
|
|
3,238 |
|
3,411 |
|
3,666 |
|
| General & administrative costs |
|
39 |
|
27 |
|
|
|
151 |
|
185 |
|
212 |
|
Minesite exploration and evaluation costs |
e |
12 |
|
20 |
|
|
|
64 |
|
79 |
|
69 |
|
Minesite sustaining capital expenditures |
f |
431 |
|
386 |
|
|
|
1,673 |
|
1,559 |
|
1,320 |
|
Sustaining leases |
|
13 |
|
9 |
|
|
|
41 |
|
31 |
|
27 |
|
Rehabilitation - accretion and amortization (operating sites) |
g |
12 |
|
14 |
|
|
|
50 |
|
46 |
|
65 |
|
Non-controlling interest, copper operations and other |
h |
(191) |
|
(140) |
|
|
|
(636) |
|
(594) |
|
(470) |
|
All-in sustaining costs |
|
1,199 |
|
1,107 |
|
|
|
4,581 |
|
4,717 |
|
4,889 |
|
| Global exploration and evaluation and project expense |
e |
70 |
|
47 |
|
|
|
223 |
|
216 |
|
273 |
|
Community relations costs not related to current operations |
|
0 |
|
0 |
|
|
|
0 |
|
1 |
|
2 |
|
Project capital expenditures |
f |
234 |
|
179 |
|
|
|
747 |
|
471 |
|
370 |
|
| Non-sustaining leases |
|
0 |
|
0 |
|
|
|
0 |
|
4 |
|
0 |
|
Rehabilitation - accretion and amortization (non-operating sites) |
g |
2 |
|
4 |
|
|
|
13 |
|
10 |
|
22 |
|
Non-controlling interest and copper operations and other |
h |
(71) |
|
(53) |
|
|
|
(240) |
|
(157) |
|
(105) |
|
| All-in costs |
|
1,434 |
|
1,284 |
|
|
|
5,324 |
|
5,262 |
|
5,451 |
|
| Ounces sold - equity basis (000s ounces) |
i |
1,234 |
|
1,071 |
|
|
|
4,468 |
|
4,879 |
|
5,467 |
|
| Cost of sales per ounce |
j,k |
1,075 |
|
1,122 |
|
|
|
1,093 |
|
1,056 |
|
1,005 |
|
| Total cash costs per ounce |
k |
715 |
|
739 |
|
|
|
725 |
|
699 |
|
671 |
|
| Total cash costs per ounce (on a co-product basis) |
k,l |
753 |
|
794 |
|
|
|
765 |
|
727 |
|
689 |
|
| All-in sustaining costs per ounce |
k |
971 |
|
1,034 |
|
|
|
1,026 |
|
967 |
|
894 |
|
| All-in sustaining costs per ounce (on a co-product basis) |
k,l |
1,009 |
|
1,089 |
|
|
|
1,066 |
|
995 |
|
912 |
|
| All-in costs per ounce |
k |
1,162 |
|
1,199 |
|
|
|
1,192 |
|
1,079 |
|
996 |
|
| All-in costs per ounce (on a co-product basis) |
k,l |
1,200 |
|
1,254 |
|
|
|
1,232 |
|
1,107 |
|
1,014 |
|
a.Realized losses on hedge and non-hedge derivatives
Includes realized hedge losses of $nil and $nil for the three months and year ended December 31, 2021, respectively (September 30, 2021: $nil; 2020: $nil; 2019: $nil), and realized non-hedge losses of $nil and $nil for the three months and year ended December 31, 2021, respectively (September 30, 2021: $nil; 2020: $nil; 2019: $1 million). Refer to note 5 to the Financial Statements for further information.
b.Non-recurring items
These costs are not indicative of our cost of production and have been excluded from the calculation of total cash costs. Non-recurring items in 2019 relate to organizational restructuring.
c.Other
Other adjustments for the three months and year ended December 31, 2021 include the removal of total cash costs and by-product credits associated with Pierina, Golden Sunlight starting in the third quarter of 2019, Morila starting in the third quarter of 2019 up until its divestiture in November 2020, Lagunas Norte starting in the fourth quarter of 2019 up until its divestiture in June 2021 and Buzwagi starting in the fourth quarter of 2021, which are producing incidental ounces, of $7 million and $51 million, respectively (September 30, 2021: $6 million; 2020: $104 million; 2019: $92 million).
d.Non-controlling interests
Non-controlling interests include non-controlling interests related to gold production of $527 million and $1,923 million, respectively, for the three months and year ended December 31, 2021 (September 30, 2021: $481 million; 2020: $1,959 million; 2019: $1,306 million). Non-controlling interests include Nevada Gold Mines from July 1, 2019, Pueblo Viejo, Loulo-Gounkoto, Tongon; North Mara, Bulyanhulu and Buzwagi (until September 30, 2019, notwithstanding the completion of the Acacia transaction on September 17, 2019, we consolidated our interest in Acacia and recorded a non-controlling interest of 36.1% in the income statement for the entirety of the third quarter of 2019 as a matter of convenience; and from January 1, 2020 onwards, the date the GoT’s 16% free carried interest was made effective). Refer to note 5 to the Financial Statements for further information.
|
|
|
|
|
|
|
|
|
| BARRICK YEAR-END 2021 |
97 |
MANAGEMENT’S DISCUSSION AND ANALYSIS |
e.Exploration and evaluation costs
Exploration, evaluation and project expenses are presented as minesite if it supports current mine operations and project if it relates to future projects. Refer to page 85 of this MD&A.
f.Capital expenditures
Capital expenditures are related to our gold sites only and are split between minesite sustaining and project capital expenditures. Project capital expenditures are capital spending at new projects and major, discrete projects at existing operations intended to increase net present value through higher production or longer mine life. Significant projects in the current year are the expansion project at Pueblo Viejo, construction of the Third Shaft at Turquoise Ridge, the development of the Gounkoto underground and the Veladero Phase 7 expansion. Refer to page 84 of this MD&A.
g.Rehabilitation - accretion and amortization
Includes depreciation on the assets related to rehabilitation provisions of our gold operations and accretion on the rehabilitation provisions of our gold operations, split between operating and non-operating sites.
h.Non-controlling interest and copper operations
Removes general & administrative costs related to non-controlling interests and copper based on a percentage allocation of revenue. Also removes exploration, evaluation and project expenses, rehabilitation costs and capital expenditures incurred by our copper sites and the non-controlling interest of Nevada Gold Mines (including South Arturo) from July 1, 2019, Pueblo Viejo, Loulo-Gounkoto, Tongon; North Mara, Bulyanhulu and Buzwagi (until September 30, 2019 notwithstanding the completion of the Acacia transaction on September 17, 2019, we consolidated our interest in Acacia and recorded a non-controlling interest of 36.1% in the income statement for the entirety of the third quarter of 2019 as a matter of convenience; and from January 1, 2020 onwards, the date the GoT’s 16% free carried interest was made effective). It also includes capital expenditures applicable to our equity method investment in Kibali. Figures remove the impact of Pierina, Golden Sunlight starting in the third quarter of 2019, Morila starting in the third quarter of 2019 up until its divestiture in November 2020, Lagunas Norte starting in the fourth quarter of 2019 up until its divestiture in June 2021 and Buzwagi starting in the fourth quarter of 2021. The impact is summarized as the following:
|
|
|
|
|
|
|
|
|
|
|
|
|
|
|
|
|
|
|
($ millions) |
For the three months ended |
For the years ended |
| Non-controlling interest, copper operations and other |
12/31/21 |
9/30/21 |
|
12/31/21 |
12/31/20 |
12/31/19 |
General & administrative costs |
(4) |
|
(4) |
|
|
(21) |
|
(25) |
|
(58) |
|
Minesite exploration and evaluation costs |
(2) |
|
(7) |
|
|
(19) |
|
(25) |
|
(16) |
|
Rehabilitation - accretion and amortization (operating sites) |
(3) |
|
(4) |
|
|
(14) |
|
(14) |
|
(13) |
|
| Minesite sustaining capital expenditures |
(182) |
|
(125) |
|
|
(582) |
|
(530) |
|
(383) |
|
All-in sustaining costs total |
(191) |
|
(140) |
|
|
(636) |
|
(594) |
|
(470) |
|
| Global exploration and evaluation and project costs |
(6) |
|
(4) |
|
|
(19) |
|
(25) |
|
(54) |
|
Project capital expenditures |
(65) |
|
(49) |
|
|
(221) |
|
(132) |
|
(51) |
|
All-in costs total |
(71) |
|
(53) |
|
|
(240) |
|
(157) |
|
(105) |
|
i.Ounces sold - equity basis
Figures remove the impact of Pierina, Golden Sunlight starting in the third quarter of 2019, Morila starting in the third quarter of 2019 up until its divestiture in November 2020, Lagunas Norte starting in the fourth quarter of 2019 up until its divestiture in June 2021 and Buzwagi starting in the fourth quarter of 2021. Some of these assets are producing incidental ounces while in closure or care and maintenance.
j.Cost of sales per ounce
Figures remove the cost of sales impact of Pierina of $7 million and $20 million, respectively, for the three months and year ended December 31, 2021 (September 30, 2021: $6 million; 2020: $18 million; 2019: $113 million); starting in the third quarter of 2019, Golden Sunlight of $nil and $nil, respectively, for the three months and year ended December 31, 2021 (September 30, 2021: $nil; 2020: $nil; 2019: $1 million); starting in the third quarter of 2019 up until its divestiture in November 2020, Morila of $nil and $nil, respectively, for the three months and year ended December 31, 2021 (September 30, 2021: $nil; 2020: $22 million; 2019: $23 million); and starting in the fourth quarter of 2019 up until its divestiture in June 2021, Lagunas Norte of $nil and $37 million, respectively, for the three months and year ended December 31, 2021 (September 30, 2021: $nil; 2020: $92 million; 2019: $26 million), and Buzwagi of $nil and $nil, respectively, for the three months and year ended December 31, 2021 (September 30, 2021: $nil; 2020: $nil; 2019: $nil), which are producing incidental ounces. Gold cost of sales per ounce is calculated as cost of sales across our gold operations (excluding sites in closure or care and maintenance) divided by ounces sold (both on an attributable basis using Barrick’s ownership share).
k.Per ounce figures
Cost of sales per ounce, cash costs per ounce, all-in sustaining costs per ounce and all-in costs per ounce may not calculate based on amounts presented in this table due to rounding.
l.Co-product costs per ounce
Cash costs per ounce, all-in sustaining costs per ounce and all-in costs per ounce presented on a co-product basis remove the impact of by-product credits of our gold production (net of non-controlling interest) calculated as:
|
|
|
|
|
|
|
|
|
|
|
|
|
|
|
|
|
|
|
($ millions) |
For the three months ended |
For the years ended |
|
12/31/21 |
9/30/21 |
|
12/31/21 |
12/31/20 |
12/31/19 |
By-product credits |
70 |
|
86 |
|
|
285 |
|
228 |
|
138 |
|
Non-controlling interest |
(25) |
|
(27) |
|
|
(108) |
|
(92) |
|
(48) |
|
By-product credits (net of non-controlling interest) |
45 |
|
59 |
|
|
177 |
|
136 |
|
90 |
|
|
|
|
|
|
|
|
|
|
| BARRICK YEAR-END 2021 |
98 |
MANAGEMENT’S DISCUSSION AND ANALYSIS |
Reconciliation of Gold Cost of Sales to Total cash costs, All-in sustaining costs and All-in costs, including on a per ounce basis, by operating segment
|
|
|
|
|
|
|
|
|
|
|
|
|
|
|
|
|
|
|
|
|
|
|
|
|
|
|
|
|
|
| ($ millions, except per ounce information in dollars) |
For the three months ended 12/31/21 |
| |
Footnote |
Carlina |
Cortezb |
Turquoise Ridgec |
Long Canyond |
Phoenixd |
Nevada Gold Minese |
Hemlo |
North America |
| Cost of sales applicable to gold production |
|
434 |
|
271 |
|
163 |
|
54 |
|
87 |
|
1,009 |
|
60 |
|
1,069 |
|
| Depreciation |
|
(82) |
|
(89) |
|
(51) |
|
(37) |
|
(21) |
|
(280) |
|
(9) |
|
(289) |
|
| By-product credits |
|
0 |
|
(1) |
|
(1) |
|
0 |
|
(47) |
|
(49) |
|
0 |
|
(49) |
|
|
|
|
|
|
|
|
|
|
|
| Non-recurring items |
f |
0 |
|
0 |
|
0 |
|
0 |
|
0 |
|
0 |
|
0 |
|
0 |
|
| Other |
|
0 |
|
0 |
|
0 |
|
0 |
|
1 |
|
1 |
|
0 |
|
1 |
|
| Non-controlling interests |
|
(135) |
|
(70) |
|
(43) |
|
(6) |
|
(8) |
|
(262) |
|
0 |
|
(262) |
|
| Total cash costs |
|
217 |
|
111 |
|
68 |
|
11 |
|
12 |
|
419 |
|
51 |
|
470 |
|
| General & administrative costs |
|
0 |
|
0 |
|
0 |
|
0 |
|
0 |
|
0 |
|
0 |
|
0 |
|
| Minesite exploration and evaluation costs |
g |
4 |
|
2 |
|
0 |
|
1 |
|
1 |
|
11 |
|
0 |
|
11 |
|
| Minesite sustaining capital expenditures |
h |
99 |
|
50 |
|
23 |
|
3 |
|
6 |
|
188 |
|
15 |
|
203 |
|
| Sustaining capital leases |
|
2 |
|
0 |
|
0 |
|
0 |
|
0 |
|
2 |
|
0 |
|
2 |
|
| Rehabilitation - accretion and amortization (operating sites) |
i |
3 |
|
3 |
|
1 |
|
0 |
|
0 |
|
7 |
|
0 |
|
7 |
|
| Non-controlling interests |
|
(42) |
|
(22) |
|
(9) |
|
(2) |
|
(3) |
|
(81) |
|
0 |
|
(81) |
|
| All-in sustaining costs |
|
283 |
|
144 |
|
83 |
|
13 |
|
16 |
|
546 |
|
66 |
|
612 |
|
| Project exploration and evaluation and project costs |
g |
0 |
|
0 |
|
0 |
|
0 |
|
0 |
|
0 |
|
0 |
|
0 |
|
|
|
|
|
|
|
|
|
|
|
| Project capital expenditures |
h |
0 |
|
29 |
|
9 |
|
0 |
|
0 |
|
33 |
|
0 |
|
33 |
|
|
|
|
|
|
|
|
|
|
|
|
|
|
|
|
|
|
|
|
|
| Non-controlling interests |
|
0 |
|
(11) |
|
(4) |
|
0 |
|
0 |
|
(13) |
|
0 |
|
(13) |
|
| All-in costs |
|
283 |
|
162 |
|
88 |
|
13 |
|
16 |
|
566 |
|
66 |
|
632 |
|
| Ounces sold - equity basis (000s ounces) |
|
297 |
|
170 |
|
84 |
|
34 |
|
26 |
|
611 |
|
34 |
|
645 |
|
| Cost of sales per ounce |
j,k |
899 |
|
984 |
|
1,194 |
|
999 |
|
2,047 |
|
1,023 |
|
1,770 |
|
1,063 |
|
| Total cash costs per ounce |
k |
728 |
|
657 |
|
819 |
|
325 |
|
443 |
|
687 |
|
1,481 |
|
729 |
|
| Total cash costs per ounce (on a co-product basis) |
k,l |
729 |
|
661 |
|
821 |
|
326 |
|
1,533 |
|
736 |
|
1,487 |
|
775 |
|
| All-in sustaining costs per ounce |
k |
950 |
|
853 |
|
996 |
|
384 |
|
614 |
|
893 |
|
1,938 |
|
948 |
|
| All-in sustaining costs per ounce (on a co-product basis) |
k,l |
951 |
|
857 |
|
998 |
|
385 |
|
1,704 |
|
942 |
|
1,944 |
|
994 |
|
| All-in costs per ounce |
k |
950 |
|
958 |
|
1,061 |
|
384 |
|
614 |
|
927 |
|
1,939 |
|
980 |
|
| All-in costs per ounce (on a co-product basis) |
k,l |
951 |
|
962 |
|
1,063 |
|
385 |
|
1,704 |
|
976 |
|
1,945 |
|
1,026 |
|
|
|
|
|
|
|
|
|
|
| BARRICK YEAR-END 2021 |
99 |
MANAGEMENT’S DISCUSSION AND ANALYSIS |
|
|
|
|
|
|
|
|
|
|
|
|
|
|
|
|
| ($ millions, except per ounce information in dollars) |
For the three months ended 12/31/21 |
| |
Footnote |
Pueblo Viejo |
Veladero |
|
Latin America & Asia Pacific |
| Cost of sales applicable to gold production |
|
185 |
|
109 |
|
|
294 |
|
| Depreciation |
|
(57) |
|
(37) |
|
|
(94) |
|
| By-product credits |
|
(12) |
|
(1) |
|
|
(13) |
|
|
|
|
|
|
|
| Non-recurring items |
f |
0 |
|
0 |
|
|
0 |
|
| Other |
|
0 |
|
0 |
|
|
0 |
|
| Non-controlling interests |
|
(47) |
|
0 |
|
|
(47) |
|
| Total cash costs |
|
69 |
|
71 |
|
|
140 |
|
| General & administrative costs |
|
0 |
|
0 |
|
|
0 |
|
| Minesite exploration and evaluation costs |
g |
1 |
|
0 |
|
|
1 |
|
| Minesite sustaining capital expenditures |
h |
45 |
|
22 |
|
|
67 |
|
| Sustaining capital leases |
|
0 |
|
0 |
|
|
0 |
|
| Rehabilitation - accretion and amortization (operating sites) |
i |
2 |
|
1 |
|
|
3 |
|
| Non-controlling interests |
|
(20) |
|
0 |
|
|
(20) |
|
| All-in sustaining costs |
|
97 |
|
94 |
|
|
191 |
|
| Project exploration and evaluation and project costs |
g |
1 |
|
0 |
|
|
1 |
|
|
|
|
|
|
|
| Project capital expenditures |
h |
112 |
|
6 |
|
|
118 |
|
|
|
|
|
|
|
|
|
|
|
|
|
| Non-controlling interests |
|
(46) |
|
0 |
|
|
(46) |
|
| All-in costs |
|
164 |
|
100 |
|
|
264 |
|
| Ounces sold - equity basis (000s ounces) |
|
113 |
|
83 |
|
|
196 |
|
| Cost of sales per ounce |
j,k |
987 |
|
1,279 |
|
|
1,131 |
|
| Total cash costs per ounce |
k |
612 |
|
834 |
|
|
707 |
|
| Total cash costs per ounce (on a co-product basis) |
k,l |
677 |
|
852 |
|
|
752 |
|
| All-in sustaining costs per ounce |
k |
858 |
|
1,113 |
|
|
964 |
|
| All-in sustaining costs per ounce (on a co-product basis) |
k,l |
923 |
|
1,131 |
|
|
1,009 |
|
| All-in costs per ounce |
k |
1,453 |
|
1,179 |
|
|
1,332 |
|
| All-in costs per ounce (on a co-product basis) |
k,l |
1,518 |
|
1,197 |
|
|
1,377 |
|
|
|
|
|
|
|
|
|
|
| BARRICK YEAR-END 2021 |
100 |
MANAGEMENT’S DISCUSSION AND ANALYSIS |
|
|
|
|
|
|
|
|
|
|
|
|
|
|
|
|
|
|
|
|
|
|
|
|
|
|
|
| ($ millions, except per ounce information in dollars) |
For the three months ended 12/31/21 |
| |
Footnote |
Loulo-Gounkoto |
Kibali |
North Maram |
Tongon |
Bulyanhulum |
Buzwagim,n |
Africa & Middle East |
| Cost of sales applicable to gold production |
|
181 |
|
93 |
|
72 |
|
79 |
|
59 |
|
|
484 |
|
| Depreciation |
|
(72) |
|
(37) |
|
(15) |
|
(15) |
|
(17) |
|
|
(156) |
|
| By-product credits |
|
0 |
|
(1) |
|
0 |
|
(1) |
|
(6) |
|
|
(8) |
|
|
|
|
|
|
|
|
|
|
| Non-recurring items |
f |
0 |
|
0 |
|
0 |
|
0 |
|
0 |
|
|
0 |
|
| Other |
|
0 |
|
0 |
|
0 |
|
0 |
|
0 |
|
|
0 |
|
| Non-controlling interests |
|
(21) |
|
0 |
|
(9) |
|
(6) |
|
(6) |
|
|
(42) |
|
| Total cash costs |
|
88 |
|
55 |
|
48 |
|
57 |
|
30 |
|
|
278 |
|
| General & administrative costs |
|
0 |
|
0 |
|
0 |
|
0 |
|
0 |
|
|
0 |
|
| Minesite exploration and evaluation costs |
g |
4 |
|
3 |
|
0 |
|
0 |
|
0 |
|
|
7 |
|
| Minesite sustaining capital expenditures |
h |
17 |
|
12 |
|
28 |
|
3 |
|
20 |
|
|
80 |
|
| Sustaining capital leases |
|
0 |
|
3 |
|
0 |
|
1 |
|
0 |
|
|
4 |
|
| Rehabilitation - accretion and amortization (operating sites) |
i |
1 |
|
0 |
|
1 |
|
1 |
|
0 |
|
|
3 |
|
| Non-controlling interests |
|
(4) |
|
0 |
|
(5) |
|
(1) |
|
(3) |
|
|
(13) |
|
| All-in sustaining costs |
|
106 |
|
73 |
|
72 |
|
61 |
|
47 |
|
|
359 |
|
| Project exploration and evaluation and project costs |
g |
0 |
|
0 |
|
0 |
|
0 |
|
0 |
|
|
0 |
|
|
|
|
|
|
|
|
|
|
| Project capital expenditures |
h |
46 |
|
7 |
|
10 |
|
0 |
|
17 |
|
|
80 |
|
|
|
|
|
|
|
|
|
|
|
|
|
|
|
|
|
|
|
| Non-controlling interests |
|
(9) |
|
0 |
|
(1) |
|
0 |
|
(3) |
|
|
(13) |
|
| All-in costs |
|
143 |
|
80 |
|
81 |
|
61 |
|
61 |
|
|
426 |
|
| Ounces sold - equity basis (000s ounces) |
|
128 |
|
95 |
|
70 |
|
47 |
|
53 |
|
|
393 |
|
| Cost of sales per ounce |
j,k |
1,139 |
|
979 |
|
858 |
|
1,494 |
|
956 |
|
|
1,067 |
|
| Total cash costs per ounce |
k |
685 |
|
582 |
|
679 |
|
1,205 |
|
567 |
|
|
705 |
|
| Total cash costs per ounce (on a co-product basis) |
k,l |
686 |
|
586 |
|
688 |
|
1,209 |
|
678 |
|
|
723 |
|
| All-in sustaining costs per ounce |
k |
822 |
|
776 |
|
1,033 |
|
1,301 |
|
897 |
|
|
915 |
|
| All-in sustaining costs per ounce (on a co-product basis) |
k,l |
823 |
|
780 |
|
1,042 |
|
1,305 |
|
1,008 |
|
|
933 |
|
| All-in costs per ounce |
k |
1,109 |
|
844 |
|
1,150 |
|
1,278 |
|
1,159 |
|
|
1,078 |
|
| All-in costs per ounce (on a co-product basis) |
k,l |
1,110 |
|
848 |
|
1,159 |
|
1,282 |
|
1,270 |
|
|
1,096 |
|
|
|
|
|
|
|
|
|
|
| BARRICK YEAR-END 2021 |
101 |
MANAGEMENT’S DISCUSSION AND ANALYSIS |
|
|
|
|
|
|
|
|
|
|
|
|
|
|
|
|
|
|
|
|
|
|
|
|
|
|
|
|
|
|
| ($ millions, except per ounce information in dollars) |
For the three months ended 9/30/21 |
| |
Footnote |
Carlina |
Cortezb |
Turquoise Ridgec |
Long Canyond |
Phoenixd |
Nevada Gold Minese |
Hemlo |
North America |
| Cost of sales applicable to gold production |
|
335 |
|
240 |
|
155 |
|
55 |
|
95 |
|
880 |
|
54 |
|
934 |
|
| Depreciation |
|
(67) |
|
(75) |
|
(50) |
|
(41) |
|
(26) |
|
(259) |
|
(11) |
|
(270) |
|
| By-product credits |
|
0 |
|
(1) |
|
0 |
|
0 |
|
(51) |
|
(52) |
|
(1) |
|
(53) |
|
|
|
|
|
|
|
|
|
|
|
| Non-recurring items |
f |
0 |
|
0 |
|
0 |
|
0 |
|
0 |
|
0 |
|
0 |
|
0 |
|
| Other |
|
0 |
|
0 |
|
0 |
|
0 |
|
8 |
|
8 |
|
0 |
|
8 |
|
| Non-controlling interests |
|
(104) |
|
(63) |
|
(40) |
|
(6) |
|
(10) |
|
(223) |
|
0 |
|
(223) |
|
| Total cash costs |
|
164 |
|
101 |
|
65 |
|
8 |
|
16 |
|
354 |
|
42 |
|
396 |
|
| General & administrative costs |
|
0 |
|
0 |
|
0 |
|
0 |
|
0 |
|
0 |
|
0 |
|
0 |
|
| Minesite exploration and evaluation costs |
g |
8 |
|
3 |
|
1 |
|
1 |
|
0 |
|
13 |
|
1 |
|
14 |
|
| Minesite sustaining capital expenditures |
h |
91 |
|
51 |
|
20 |
|
2 |
|
3 |
|
171 |
|
20 |
|
191 |
|
| Sustaining capital leases |
|
0 |
|
0 |
|
0 |
|
0 |
|
0 |
|
1 |
|
1 |
|
2 |
|
| Rehabilitation - accretion and amortization (operating sites) |
i |
2 |
|
3 |
|
0 |
|
0 |
|
1 |
|
6 |
|
1 |
|
7 |
|
| Non-controlling interests |
|
(38) |
|
(23) |
|
(8) |
|
(1) |
|
(1) |
|
(73) |
|
0 |
|
(73) |
|
| All-in sustaining costs |
|
227 |
|
135 |
|
78 |
|
10 |
|
19 |
|
472 |
|
65 |
|
537 |
|
| Project exploration and evaluation and project costs |
g |
0 |
|
0 |
|
0 |
|
0 |
|
0 |
|
0 |
|
0 |
|
0 |
|
|
|
|
|
|
|
|
|
|
|
| Project capital expenditures |
h |
0 |
|
28 |
|
15 |
|
0 |
|
0 |
|
48 |
|
0 |
|
48 |
|
|
|
|
|
|
|
|
|
|
|
| Non-controlling interests |
|
0 |
|
(11) |
|
(6) |
|
0 |
|
0 |
|
(19) |
|
0 |
|
(19) |
|
|
|
|
|
|
|
|
|
|
|
| All-in costs |
|
227 |
|
152 |
|
87 |
|
10 |
|
19 |
|
501 |
|
65 |
|
566 |
|
| Ounces sold - equity basis (000s ounces) |
|
202 |
|
126 |
|
82 |
|
42 |
|
33 |
|
485 |
|
29 |
|
514 |
|
| Cost of sales per ounce |
j,k |
1,017 |
|
1,164 |
|
1,169 |
|
796 |
|
1,777 |
|
1,123 |
|
1,870 |
|
1,165 |
|
| Total cash costs per ounce |
k |
814 |
|
800 |
|
788 |
|
201 |
|
499 |
|
734 |
|
1,493 |
|
776 |
|
| Total cash costs per ounce (on a co-product basis) |
k,l |
815 |
|
803 |
|
792 |
|
201 |
|
1,299 |
|
790 |
|
1,498 |
|
829 |
|
| All-in sustaining costs per ounce |
k |
1,124 |
|
1,065 |
|
943 |
|
251 |
|
582 |
|
975 |
|
2,276 |
|
1,047 |
|
| All-in sustaining costs per ounce (on a co-product basis) |
k,l |
1,125 |
|
1,068 |
|
947 |
|
251 |
|
1,382 |
|
1,031 |
|
2,281 |
|
1,100 |
|
| All-in costs per ounce |
k |
1,124 |
|
1,199 |
|
1,053 |
|
251 |
|
582 |
|
1,035 |
|
2,277 |
|
1,103 |
|
| All-in costs per ounce (on a co-product basis) |
k,l |
1,125 |
|
1,202 |
|
1,057 |
|
251 |
|
1,382 |
|
1,091 |
|
2,282 |
|
1,156 |
|
|
|
|
|
|
|
|
|
|
| BARRICK YEAR-END 2021 |
102 |
MANAGEMENT’S DISCUSSION AND ANALYSIS |
|
|
|
|
|
|
|
|
|
|
|
|
|
|
|
| ($ millions, except per ounce information in dollars) |
For the three months ended 9/30/21 |
| |
Footnote |
Pueblo Viejo |
Veladero |
Latin America & Asia Pacific |
| Cost of sales applicable to gold production |
|
186 |
|
58 |
|
244 |
|
| Depreciation |
|
(61) |
|
(17) |
|
(78) |
|
| By-product credits |
|
(16) |
|
(2) |
|
(18) |
|
|
|
|
|
|
| Non-recurring items |
f |
0 |
|
0 |
|
0 |
|
| Other |
|
0 |
|
0 |
|
0 |
|
| Non-controlling interests |
|
(43) |
|
0 |
|
(43) |
|
| Total cash costs |
|
66 |
|
39 |
|
105 |
|
| General & administrative costs |
|
0 |
|
0 |
|
0 |
|
| Minesite exploration and evaluation costs |
g |
1 |
|
1 |
|
2 |
|
| Minesite sustaining capital expenditures |
h |
40 |
|
29 |
|
69 |
|
| Sustaining capital leases |
|
0 |
|
1 |
|
1 |
|
| Rehabilitation - accretion and amortization (operating sites) |
i |
2 |
|
0 |
|
2 |
|
| Non-controlling interests |
|
(18) |
|
0 |
|
(18) |
|
| All-in sustaining costs |
|
91 |
|
70 |
|
161 |
|
| Project exploration and evaluation and project costs |
g |
0 |
|
0 |
|
0 |
|
|
|
|
|
|
| Project capital expenditures |
h |
81 |
|
0 |
|
81 |
|
|
|
|
|
|
| Non-controlling interests |
|
(32) |
|
0 |
|
(32) |
|
|
|
|
|
|
| All-in costs |
|
140 |
|
70 |
|
210 |
|
| Ounces sold - equity basis (000s ounces) |
|
125 |
|
44 |
|
169 |
|
| Cost of sales per ounce |
j,k |
895 |
|
1,315 |
|
1,038 |
|
| Total cash costs per ounce |
k |
521 |
|
882 |
|
616 |
|
| Total cash costs per ounce (on a co-product basis) |
k,l |
600 |
|
922 |
|
685 |
|
| All-in sustaining costs per ounce |
k |
728 |
|
1,571 |
|
960 |
|
| All-in sustaining costs per ounce (on a co-product basis) |
k,l |
807 |
|
1,611 |
|
1,029 |
|
| All-in costs per ounce |
k |
1,117 |
|
1,571 |
|
1,247 |
|
| All-in costs per ounce (on a co-product basis) |
k,l |
1,196 |
|
1,611 |
|
1,316 |
|
|
|
|
|
|
|
|
|
|
| BARRICK YEAR-END 2021 |
103 |
MANAGEMENT’S DISCUSSION AND ANALYSIS |
|
|
|
|
|
|
|
|
|
|
|
|
|
|
|
|
|
|
|
|
|
|
|
|
|
|
|
| ($ millions, except per ounce information in dollars) |
For the three months ended 9/30/21 |
| |
Footnote |
Loulo-Gounkoto |
Kibali |
North Maram |
Tongon |
Bulyanhulum |
Buzwagim,n |
Africa & Middle East |
| Cost of sales applicable to gold production |
|
188 |
|
92 |
|
76 |
|
72 |
|
62 |
|
6 |
|
496 |
|
| Depreciation |
|
(68) |
|
(36) |
|
(14) |
|
(20) |
|
(15) |
|
0 |
|
(153) |
|
| By-product credits |
|
0 |
|
0 |
|
(1) |
|
0 |
|
(5) |
|
0 |
|
(6) |
|
|
|
|
|
|
|
|
|
|
| Non-recurring items |
f |
0 |
|
0 |
|
0 |
|
0 |
|
0 |
|
0 |
|
0 |
|
| Other |
|
0 |
|
0 |
|
0 |
|
0 |
|
0 |
|
0 |
|
0 |
|
| Non-controlling interests |
|
(25) |
|
0 |
|
(10) |
|
(6) |
|
(6) |
|
(1) |
|
(48) |
|
| Total cash costs |
|
95 |
|
56 |
|
51 |
|
46 |
|
36 |
|
5 |
|
289 |
|
| General & administrative costs |
|
0 |
|
0 |
|
0 |
|
0 |
|
0 |
|
0 |
|
0 |
|
| Minesite exploration and evaluation costs |
g |
5 |
|
1 |
|
0 |
|
1 |
|
0 |
|
0 |
|
7 |
|
| Minesite sustaining capital expenditures |
h |
52 |
|
11 |
|
13 |
|
9 |
|
6 |
|
0 |
|
91 |
|
| Sustaining capital leases |
|
0 |
|
2 |
|
0 |
|
0 |
|
0 |
|
0 |
|
2 |
|
| Rehabilitation - accretion and amortization (operating sites) |
i |
1 |
|
0 |
|
2 |
|
0 |
|
0 |
|
0 |
|
3 |
|
| Non-controlling interests |
|
(11) |
|
0 |
|
(2) |
|
(1) |
|
(1) |
|
0 |
|
(15) |
|
| All-in sustaining costs |
|
142 |
|
70 |
|
64 |
|
55 |
|
41 |
|
5 |
|
377 |
|
| Project exploration and evaluation and project costs |
g |
0 |
|
0 |
|
0 |
|
0 |
|
0 |
|
0 |
|
0 |
|
|
|
|
|
|
|
|
|
|
| Project capital expenditures |
h |
21 |
|
8 |
|
9 |
|
1 |
|
6 |
|
0 |
|
45 |
|
|
|
|
|
|
|
|
|
|
| Non-controlling interests |
|
(4) |
|
0 |
|
(2) |
|
0 |
|
(1) |
|
0 |
|
(7) |
|
|
|
|
|
|
|
|
|
|
| All-in costs |
|
159 |
|
78 |
|
71 |
|
56 |
|
46 |
|
5 |
|
415 |
|
| Ounces sold - equity basis (000s ounces) |
|
134 |
|
93 |
|
65 |
|
41 |
|
49 |
|
6 |
|
388 |
|
| Cost of sales per ounce |
j,k |
1,109 |
|
987 |
|
993 |
|
1,579 |
|
1,073 |
|
1,000 |
|
1,104 |
|
| Total cash costs per ounce |
k |
708 |
|
597 |
|
796 |
|
1,139 |
|
724 |
|
967 |
|
747 |
|
| Total cash costs per ounce (on a co-product basis) |
k,l |
708 |
|
601 |
|
803 |
|
1,143 |
|
806 |
|
976 |
|
760 |
|
| All-in sustaining costs per ounce |
k |
1,056 |
|
751 |
|
985 |
|
1,329 |
|
827 |
|
970 |
|
970 |
|
| All-in sustaining costs per ounce (on a co-product basis) |
k,l |
1,056 |
|
755 |
|
992 |
|
1,333 |
|
909 |
|
979 |
|
983 |
|
| All-in costs per ounce |
k |
1,184 |
|
838 |
|
1,105 |
|
1,344 |
|
937 |
|
970 |
|
1,071 |
|
| All-in costs per ounce (on a co-product basis) |
k,l |
1,184 |
|
842 |
|
1,112 |
|
1,348 |
|
1,019 |
|
979 |
|
1,084 |
|
|
|
|
|
|
|
|
|
|
| BARRICK YEAR-END 2021 |
104 |
MANAGEMENT’S DISCUSSION AND ANALYSIS |
|
|
|
|
|
|
|
|
|
|
|
|
|
|
|
|
|
|
|
|
|
|
|
|
|
|
|
|
|
|
| ($ millions, except per ounce information in dollars) |
For the year ended 12/31/2021 |
| |
Footnote |
Carlina |
Cortezb |
Turquoise Ridgec |
Long Canyond |
Phoenixd |
Nevada Gold Minese |
Hemlo |
North America |
| Cost of sales applicable to gold production |
|
1,451 |
|
927 |
|
615 |
|
193 |
|
346 |
|
3,532 |
|
257 |
|
3,789 |
|
| Depreciation |
|
(276) |
|
(294) |
|
(200) |
|
(144) |
|
(89) |
|
(1,003) |
|
(45) |
|
(1,048) |
|
| By-product credits |
|
(2) |
|
(3) |
|
(5) |
|
0 |
|
(194) |
|
(204) |
|
(1) |
|
(205) |
|
|
|
|
|
|
|
|
|
|
|
| Non-recurring items |
f |
0 |
|
0 |
|
0 |
|
0 |
|
0 |
|
0 |
|
0 |
|
0 |
|
| Other |
|
0 |
|
0 |
|
0 |
|
0 |
|
9 |
|
9 |
|
0 |
|
9 |
|
| Non-controlling interests |
|
(451) |
|
(243) |
|
(158) |
|
(19) |
|
(28) |
|
(899) |
|
0 |
|
(899) |
|
| Total cash costs |
|
722 |
|
387 |
|
252 |
|
30 |
|
44 |
|
1,435 |
|
211 |
|
1,646 |
|
| General & administrative costs |
|
0 |
|
0 |
|
0 |
|
0 |
|
0 |
|
0 |
|
0 |
|
0 |
|
| Minesite exploration and evaluation costs |
g |
22 |
|
10 |
|
1 |
|
4 |
|
1 |
|
41 |
|
2 |
|
43 |
|
| Minesite sustaining capital expenditures |
h |
424 |
|
192 |
|
77 |
|
8 |
|
20 |
|
746 |
|
82 |
|
828 |
|
| Sustaining capital leases |
|
2 |
|
0 |
|
0 |
|
0 |
|
1 |
|
5 |
|
2 |
|
7 |
|
| Rehabilitation - accretion and amortization (operating sites) |
i |
10 |
|
11 |
|
1 |
|
1 |
|
2 |
|
25 |
|
2 |
|
27 |
|
| Non-controlling interests |
|
(177) |
|
(86) |
|
(30) |
|
(5) |
|
(9) |
|
(318) |
|
0 |
|
(318) |
|
| All-in sustaining costs |
|
1,003 |
|
514 |
|
301 |
|
38 |
|
59 |
|
1,934 |
|
299 |
|
2,233 |
|
| Project exploration and evaluation and project costs |
g |
0 |
|
0 |
|
0 |
|
0 |
|
0 |
|
0 |
|
0 |
|
0 |
|
|
|
|
|
|
|
|
|
|
|
| Project capital expenditures |
h |
0 |
|
96 |
|
56 |
|
0 |
|
0 |
|
158 |
|
0 |
|
158 |
|
|
|
|
|
|
|
|
|
|
|
| Non-controlling interests |
|
0 |
|
(37) |
|
(22) |
|
0 |
|
0 |
|
(61) |
|
0 |
|
(61) |
|
|
|
|
|
|
|
|
|
|
|
| All-in costs |
|
1,003 |
|
573 |
|
335 |
|
38 |
|
59 |
|
2,031 |
|
299 |
|
2,330 |
|
| Ounces sold - equity basis (000s ounces) |
|
922 |
|
508 |
|
337 |
|
161 |
|
111 |
|
2,039 |
|
152 |
|
2,191 |
|
| Cost of sales per ounce |
j,k |
968 |
|
1,122 |
|
1,122 |
|
739 |
|
1,922 |
|
1,072 |
|
1,693 |
|
1,115 |
|
| Total cash costs per ounce |
k |
782 |
|
763 |
|
749 |
|
188 |
|
398 |
|
705 |
|
1,388 |
|
752 |
|
| Total cash costs per ounce (on a co-product basis) |
k,l |
784 |
|
767 |
|
757 |
|
188 |
|
1,428 |
|
764 |
|
1,394 |
|
807 |
|
| All-in sustaining costs per ounce |
k |
1,087 |
|
1,013 |
|
892 |
|
238 |
|
533 |
|
949 |
|
1,970 |
|
1,020 |
|
| All-in sustaining costs per ounce (on a co-product basis) |
k,l |
1,089 |
|
1,017 |
|
900 |
|
238 |
|
1,563 |
|
1,008 |
|
1,976 |
|
1,075 |
|
| All-in costs per ounce |
k |
1,087 |
|
1,129 |
|
993 |
|
238 |
|
533 |
|
997 |
|
1,970 |
|
1,064 |
|
| All-in costs per ounce (on a co-product basis) |
k,l |
1,089 |
|
1,133 |
|
1,001 |
|
238 |
|
1,563 |
|
1,056 |
|
1,976 |
|
1,119 |
|
|
|
|
|
|
|
|
|
|
| BARRICK YEAR-END 2021 |
105 |
MANAGEMENT’S DISCUSSION AND ANALYSIS |
|
|
|
|
|
|
|
|
|
|
|
|
|
|
|
|
| ($ millions, except per ounce information in dollars) |
|
|
For the year ended 12/31/2021 |
| |
Footnote |
Pueblo Viejo |
Veladero |
|
Latin America & Asia Pacific |
| Cost of sales applicable to gold production |
|
739 |
|
262 |
|
|
1,001 |
|
| Depreciation |
|
(234) |
|
(85) |
|
|
(319) |
|
| By-product credits |
|
(58) |
|
(7) |
|
|
(65) |
|
|
|
|
|
|
|
| Non-recurring items |
|
0 |
|
0 |
|
|
0 |
|
| Other |
f |
0 |
|
0 |
|
|
0 |
|
| Non-controlling interests |
|
(178) |
|
0 |
|
|
(178) |
|
| Total cash costs |
|
269 |
|
170 |
|
|
439 |
|
| General & administrative costs |
|
0 |
|
0 |
|
|
0 |
|
| Minesite exploration and evaluation costs |
g |
4 |
|
1 |
|
|
5 |
|
| Minesite sustaining capital expenditures |
h |
160 |
|
136 |
|
|
296 |
|
| Sustaining capital leases |
|
0 |
|
1 |
|
|
1 |
|
| Rehabilitation - accretion and amortization (operating sites) |
i |
8 |
|
2 |
|
|
10 |
|
| Non-controlling interests |
|
(71) |
|
0 |
|
|
(71) |
|
| All-in sustaining costs |
|
370 |
|
310 |
|
|
680 |
|
| Project exploration and evaluation and project costs |
g |
1 |
|
0 |
|
|
1 |
|
|
|
|
|
|
|
| Project capital expenditures |
h |
358 |
|
6 |
|
|
364 |
|
|
|
|
|
|
|
| Non-controlling interests |
|
(144) |
|
0 |
|
|
(144) |
|
|
|
|
|
|
|
| All-in costs |
|
585 |
|
316 |
|
|
901 |
|
| Ounces sold - equity basis (000s ounces) |
|
497 |
|
206 |
|
|
703 |
|
| Cost of sales per ounce |
j,k |
896 |
|
1,256 |
|
|
1,028 |
|
| Total cash costs per ounce |
k |
541 |
|
816 |
|
|
622 |
|
| Total cash costs per ounce (on a co-product basis) |
k,l |
610 |
|
850 |
|
|
680 |
|
| All-in sustaining costs per ounce |
k |
745 |
|
1,493 |
|
|
969 |
|
| All-in sustaining costs per ounce (on a co-product basis) |
k,l |
814 |
|
1,527 |
|
|
1,027 |
|
| All-in costs per ounce |
k |
1,178 |
|
1,520 |
|
|
1,282 |
|
| All-in costs per ounce (on a co-product basis) |
k,l |
1,247 |
|
1,554 |
|
|
1,340 |
|
|
|
|
|
|
|
|
|
|
| BARRICK YEAR-END 2021 |
106 |
MANAGEMENT’S DISCUSSION AND ANALYSIS |
|
|
|
|
|
|
|
|
|
|
|
|
|
|
|
|
|
|
|
|
|
|
|
|
|
|
|
| ($ millions, except per ounce information in dollars) |
For the year ended 12/31/2021 |
| |
Footnote |
Loulo-Gounkoto |
Kibali |
North Maram |
Tongon |
Bulyanhulum |
Buzwagim,n |
Africa & Middle East |
| Cost of sales applicable to gold production |
|
732 |
|
373 |
|
296 |
|
310 |
|
212 |
|
65 |
|
1,988 |
|
| Depreciation |
|
(278) |
|
(141) |
|
(56) |
|
(84) |
|
(57) |
|
(2) |
|
(618) |
|
| By-product credits |
|
0 |
|
(2) |
|
(2) |
|
(1) |
|
(15) |
|
0 |
|
(20) |
|
|
|
|
|
|
|
|
|
|
| Non-recurring items |
f |
0 |
|
0 |
|
0 |
|
0 |
|
0 |
|
0 |
|
0 |
|
| Other |
|
0 |
|
0 |
|
0 |
|
0 |
|
0 |
|
0 |
|
0 |
|
| Non-controlling interests |
|
(91) |
|
0 |
|
(38) |
|
(23) |
|
(22) |
|
(10) |
|
(184) |
|
| Total cash costs |
|
363 |
|
230 |
|
200 |
|
202 |
|
118 |
|
53 |
|
1,166 |
|
| General & administrative costs |
|
0 |
|
0 |
|
0 |
|
0 |
|
0 |
|
0 |
|
0 |
|
| Minesite exploration and evaluation costs |
g |
18 |
|
5 |
|
0 |
|
3 |
|
0 |
|
0 |
|
26 |
|
| Minesite sustaining capital expenditures |
h |
199 |
|
54 |
|
62 |
|
18 |
|
34 |
|
0 |
|
367 |
|
| Sustaining capital leases |
|
2 |
|
10 |
|
0 |
|
2 |
|
0 |
|
0 |
|
14 |
|
| Rehabilitation - accretion and amortization (operating sites) |
i |
4 |
|
1 |
|
6 |
|
1 |
|
1 |
|
0 |
|
13 |
|
| Non-controlling interests |
|
(44) |
|
0 |
|
(11) |
|
(3) |
|
(5) |
|
0 |
|
(63) |
|
| All-in sustaining costs |
|
542 |
|
300 |
|
257 |
|
223 |
|
148 |
|
53 |
|
1,523 |
|
| Project exploration and evaluation and project costs |
g |
0 |
|
0 |
|
0 |
|
0 |
|
0 |
|
0 |
|
0 |
|
|
|
|
|
|
|
|
|
|
| Project capital expenditures |
h |
98 |
|
16 |
|
32 |
|
0 |
|
49 |
|
0 |
|
195 |
|
|
|
|
|
|
|
|
|
|
| Non-controlling interests |
|
(19) |
|
0 |
|
(5) |
|
0 |
|
(8) |
|
0 |
|
(32) |
|
|
|
|
|
|
|
|
|
|
| All-in costs |
|
621 |
|
316 |
|
284 |
|
223 |
|
189 |
|
53 |
|
1,686 |
|
| Ounces sold - equity basis (000s ounces) |
|
558 |
|
367 |
|
257 |
|
185 |
|
166 |
|
41 |
|
1,574 |
|
| Cost of sales per ounce |
j,k |
1,049 |
|
1,016 |
|
966 |
|
1,504 |
|
1,079 |
|
1,334 |
|
1,092 |
|
| Total cash costs per ounce |
k |
650 |
|
627 |
|
777 |
|
1,093 |
|
709 |
|
1,284 |
|
740 |
|
| Total cash costs per ounce (on a co-product basis) |
k,l |
650 |
|
631 |
|
784 |
|
1,096 |
|
787 |
|
1,277 |
|
751 |
|
| All-in sustaining costs per ounce |
k |
970 |
|
818 |
|
1,001 |
|
1,208 |
|
891 |
|
1,291 |
|
968 |
|
| All-in sustaining costs per ounce (on a co-product basis) |
k,l |
970 |
|
822 |
|
1,008 |
|
1,211 |
|
969 |
|
1,284 |
|
979 |
|
| All-in costs per ounce |
k |
1,111 |
|
861 |
|
1,105 |
|
1,206 |
|
1,138 |
|
1,291 |
|
1,070 |
|
| All-in costs per ounce (on a co-product basis) |
k,l |
1,111 |
|
865 |
|
1,112 |
|
1,209 |
|
1,216 |
|
1,284 |
|
1,081 |
|
|
|
|
|
|
|
|
|
|
| BARRICK YEAR-END 2021 |
107 |
MANAGEMENT’S DISCUSSION AND ANALYSIS |
|
|
|
|
|
|
|
|
|
|
|
|
|
|
|
|
|
|
|
|
|
|
|
|
|
|
|
|
|
|
| ($ millions, except per ounce information in dollars) |
For the year ended 12/31/2020 |
| |
Footnote |
Carlina |
Cortezb |
Turquoise Ridgec |
Long Canyond |
Phoenixd |
Nevada Gold Minese |
Hemlo |
North America |
| Cost of sales applicable to gold production |
|
1,624 |
|
764 |
|
575 |
|
227 |
|
365 |
|
3,555 |
|
281 |
|
3,836 |
|
| Depreciation |
|
(306) |
|
(221) |
|
(184) |
|
(165) |
|
(94) |
|
(970) |
|
(44) |
|
(1,014) |
|
| By-product credits |
|
(2) |
|
(2) |
|
(7) |
|
0 |
|
(137) |
|
(148) |
|
(1) |
|
(149) |
|
|
|
|
|
|
|
|
|
|
|
| Non-recurring items |
f |
0 |
|
0 |
|
0 |
|
0 |
|
0 |
|
0 |
|
0 |
|
0 |
|
| Other |
|
0 |
|
0 |
|
0 |
|
0 |
|
0 |
|
0 |
|
0 |
|
0 |
|
| Non-controlling interests |
|
(507) |
|
(208) |
|
(148) |
|
(24) |
|
(51) |
|
(938) |
|
0 |
|
(938) |
|
| Total cash costs |
|
809 |
|
333 |
|
236 |
|
38 |
|
83 |
|
1,499 |
|
236 |
|
1,735 |
|
| General & administrative costs |
|
0 |
|
0 |
|
0 |
|
0 |
|
0 |
|
0 |
|
0 |
|
0 |
|
| Minesite exploration and evaluation costs |
g |
30 |
|
7 |
|
7 |
|
8 |
|
0 |
|
52 |
|
1 |
|
53 |
|
| Minesite sustaining capital expenditures |
h |
381 |
|
235 |
|
39 |
|
35 |
|
29 |
|
748 |
|
79 |
|
827 |
|
| Sustaining capital leases |
|
1 |
|
0 |
|
0 |
|
0 |
|
1 |
|
4 |
|
0 |
|
4 |
|
| Rehabilitation - accretion and amortization (operating sites) |
i |
8 |
|
13 |
|
0 |
|
2 |
|
3 |
|
26 |
|
1 |
|
27 |
|
| Non-controlling interests |
|
(163) |
|
(98) |
|
(18) |
|
(17) |
|
(13) |
|
(321) |
|
0 |
|
(321) |
|
| All-in sustaining costs |
|
1,066 |
|
490 |
|
264 |
|
66 |
|
103 |
|
2,008 |
|
317 |
|
2,325 |
|
| Project exploration and evaluation and project costs |
g |
0 |
|
0 |
|
0 |
|
0 |
|
0 |
|
0 |
|
0 |
|
0 |
|
|
|
|
|
|
|
|
|
|
|
| Project capital expenditures |
h |
0 |
|
146 |
|
44 |
|
0 |
|
0 |
|
200 |
|
0 |
|
200 |
|
|
|
|
|
|
|
|
|
|
|
| Non-controlling interests |
|
0 |
|
(56) |
|
(17) |
|
0 |
|
0 |
|
(76) |
|
0 |
|
(76) |
|
|
|
|
|
|
|
|
|
|
|
| All-in costs |
|
1,066 |
|
580 |
|
291 |
|
66 |
|
103 |
|
2,132 |
|
317 |
|
2,449 |
|
| Ounces sold - equity basis (000s ounces) |
|
1,024 |
|
491 |
|
332 |
|
161 |
|
126 |
|
2,134 |
|
224 |
|
2,358 |
|
| Cost of sales per ounce |
j,k |
976 |
|
958 |
|
1,064 |
|
869 |
|
1,772 |
|
1,029 |
|
1,256 |
|
1,050 |
|
| Total cash costs per ounce |
k |
790 |
|
678 |
|
711 |
|
236 |
|
649 |
|
702 |
|
1,056 |
|
735 |
|
| Total cash costs per ounce (on a co-product basis) |
k,l |
791 |
|
680 |
|
723 |
|
238 |
|
1,315 |
|
745 |
|
1,060 |
|
774 |
|
| All-in sustaining costs per ounce |
k |
1,041 |
|
998 |
|
798 |
|
405 |
|
814 |
|
941 |
|
1,423 |
|
987 |
|
| All-in sustaining costs per ounce (on a co-product basis) |
k,l |
1,042 |
|
1,000 |
|
810 |
|
407 |
|
1,480 |
|
984 |
|
1,427 |
|
1,026 |
|
| All-in costs per ounce |
k |
1,041 |
|
1,179 |
|
879 |
|
405 |
|
814 |
|
998 |
|
1,424 |
|
1,039 |
|
| All-in costs per ounce (on a co-product basis) |
k,l |
1,042 |
|
1,181 |
|
891 |
|
407 |
|
1,480 |
|
1,041 |
|
1,428 |
|
1,078 |
|
|
|
|
|
|
|
|
|
|
| BARRICK YEAR-END 2021 |
108 |
MANAGEMENT’S DISCUSSION AND ANALYSIS |
|
|
|
|
|
|
|
|
|
|
|
|
|
|
|
|
|
|
|
| ($ millions, except per ounce information in dollars) |
For the year ended 12/31/2020 |
| |
Footnote |
Pueblo Viejo |
Veladero |
Porgerao |
|
Latin America & Asia Pacific |
| Cost of sales applicable to gold production |
|
735 |
|
213 |
|
106 |
|
|
1,054 |
|
| Depreciation |
|
(224) |
|
(69) |
|
(25) |
|
|
(318) |
|
| By-product credits |
|
(57) |
|
(5) |
|
(1) |
|
|
(63) |
|
|
|
|
|
|
|
|
| Non-recurring items |
f |
0 |
|
0 |
|
0 |
|
|
0 |
|
| Other |
|
0 |
|
0 |
|
0 |
|
|
0 |
|
| Non-controlling interests |
|
(182) |
|
0 |
|
0 |
|
|
(182) |
|
| Total cash costs |
|
272 |
|
139 |
|
80 |
|
|
491 |
|
| General & administrative costs |
|
0 |
|
0 |
|
0 |
|
|
0 |
|
| Minesite exploration and evaluation costs |
g |
3 |
|
0 |
|
2 |
|
|
5 |
|
| Minesite sustaining capital expenditures |
h |
132 |
|
98 |
|
11 |
|
|
241 |
|
| Sustaining capital leases |
|
0 |
|
2 |
|
3 |
|
|
5 |
|
| Rehabilitation - accretion and amortization (operating sites) |
i |
6 |
|
4 |
|
0 |
|
|
10 |
|
| Non-controlling interests |
|
(56) |
|
0 |
|
0 |
|
|
(56) |
|
| All-in sustaining costs |
|
357 |
|
243 |
|
96 |
|
|
696 |
|
| Project exploration and evaluation and project costs |
g |
1 |
|
0 |
|
0 |
|
|
1 |
|
|
|
|
|
|
|
|
| Project capital expenditures |
h |
91 |
|
15 |
|
0 |
|
|
106 |
|
|
|
|
|
|
|
|
| Non-controlling interests |
|
(37) |
|
0 |
|
0 |
|
|
(37) |
|
|
|
|
|
|
|
|
| All-in costs |
|
412 |
|
258 |
|
96 |
|
|
766 |
|
| Ounces sold - equity basis (000s ounces) |
|
541 |
|
186 |
|
87 |
|
|
814 |
|
| Cost of sales per ounce |
j,k |
819 |
|
1,151 |
|
1,225 |
|
|
938 |
|
| Total cash costs per ounce |
k |
504 |
|
748 |
|
928 |
|
|
604 |
|
| Total cash costs per ounce (on a co-product basis) |
k,l |
568 |
|
777 |
|
934 |
|
|
654 |
|
| All-in sustaining costs per ounce |
k |
660 |
|
1,308 |
|
1,115 |
|
|
856 |
|
| All-in sustaining costs per ounce (on a co-product basis) |
k,l |
724 |
|
1,337 |
|
1,121 |
|
|
906 |
|
| All-in costs per ounce |
k |
761 |
|
1,390 |
|
1,116 |
|
|
942 |
|
| All-in costs per ounce (on a co-product basis) |
k,l |
825 |
|
1,419 |
|
1,122 |
|
|
992 |
|
|
|
|
|
|
|
|
|
|
| BARRICK YEAR-END 2021 |
109 |
MANAGEMENT’S DISCUSSION AND ANALYSIS |
|
|
|
|
|
|
|
|
|
|
|
|
|
|
|
|
|
|
|
|
|
|
|
|
|
|
|
| ($ millions, except per ounce information in dollars) |
For the year ended 12/31/2020 |
| |
Footnote |
Loulo-Gounkoto |
Kibali |
North Maram |
Tongon |
Bulyanhulum |
Buzwagim,n |
Africa & Middle East |
| Cost of sales applicable to gold production |
|
719 |
|
397 |
|
318 |
|
380 |
|
184 |
|
211 |
|
2,209 |
|
| Depreciation |
|
(267) |
|
(174) |
|
(91) |
|
(167) |
|
(72) |
|
(11) |
|
(782) |
|
| By-product credits |
|
0 |
|
(1) |
|
(2) |
|
0 |
|
(10) |
|
(22) |
|
(35) |
|
|
|
|
|
|
|
|
|
|
| Non-recurring items |
f |
0 |
|
0 |
|
0 |
|
0 |
|
0 |
|
0 |
|
0 |
|
| Other |
|
0 |
|
0 |
|
0 |
|
0 |
|
0 |
|
0 |
|
0 |
|
| Non-controlling interests |
|
(90) |
|
0 |
|
(36) |
|
(22) |
|
(16) |
|
(28) |
|
(192) |
|
| Total cash costs |
|
362 |
|
222 |
|
189 |
|
191 |
|
86 |
|
150 |
|
1,200 |
|
| General & administrative costs |
|
0 |
|
0 |
|
0 |
|
0 |
|
0 |
|
0 |
|
0 |
|
| Minesite exploration and evaluation costs |
g |
11 |
|
2 |
|
0 |
|
3 |
|
0 |
|
0 |
|
16 |
|
| Minesite sustaining capital expenditures |
h |
213 |
|
49 |
|
68 |
|
8 |
|
7 |
|
1 |
|
346 |
|
| Sustaining capital leases |
|
3 |
|
9 |
|
0 |
|
2 |
|
0 |
|
1 |
|
15 |
|
| Rehabilitation - accretion and amortization (operating sites) |
i |
3 |
|
1 |
|
4 |
|
0 |
|
1 |
|
0 |
|
9 |
|
| Non-controlling interests |
|
(46) |
|
0 |
|
(12) |
|
(1) |
|
(1) |
|
0 |
|
(60) |
|
| All-in sustaining costs |
|
546 |
|
283 |
|
249 |
|
203 |
|
93 |
|
152 |
|
1,526 |
|
| Project exploration and evaluation and project costs |
g |
0 |
|
0 |
|
0 |
|
0 |
|
0 |
|
0 |
|
0 |
|
|
|
|
|
|
|
|
|
|
| Project capital expenditures |
h |
19 |
|
2 |
|
35 |
|
0 |
|
69 |
|
0 |
|
125 |
|
|
|
|
|
|
|
|
|
|
| Non-controlling interests |
|
(4) |
|
0 |
|
(5) |
|
0 |
|
(11) |
|
0 |
|
(20) |
|
|
|
|
|
|
|
|
|
|
| All-in costs |
|
561 |
|
285 |
|
279 |
|
203 |
|
151 |
|
152 |
|
1,631 |
|
| Ounces sold - equity basis (000s ounces) |
|
542 |
|
364 |
|
269 |
|
255 |
|
103 |
|
174 |
|
1,707 |
|
| Cost of sales per ounce |
j,k |
1,060 |
|
1,091 |
|
992 |
|
1,334 |
|
1,499 |
|
1,021 |
|
1,119 |
|
| Total cash costs per ounce |
k |
666 |
|
608 |
|
702 |
|
747 |
|
832 |
|
859 |
|
701 |
|
| Total cash costs per ounce (on a co-product basis) |
k,l |
666 |
|
612 |
|
709 |
|
748 |
|
913 |
|
968 |
|
719 |
|
| All-in sustaining costs per ounce |
k |
1,006 |
|
778 |
|
929 |
|
791 |
|
895 |
|
871 |
|
893 |
|
| All-in sustaining costs per ounce (on a co-product basis) |
k,l |
1,006 |
|
782 |
|
936 |
|
792 |
|
976 |
|
980 |
|
911 |
|
| All-in costs per ounce |
k |
1,034 |
|
782 |
|
1,039 |
|
791 |
|
1,459 |
|
871 |
|
954 |
|
| All-in costs per ounce (on a co-product basis) |
k,l |
1,034 |
|
786 |
|
1,046 |
|
792 |
|
1,540 |
|
980 |
|
972 |
|
|
|
|
|
|
|
|
|
|
| BARRICK YEAR-END 2021 |
110 |
MANAGEMENT’S DISCUSSION AND ANALYSIS |
|
|
|
|
|
|
|
|
|
|
|
|
|
|
|
|
|
|
|
|
|
|
|
|
|
|
|
|
|
|
| ($ millions, except per ounce information in dollars) |
For the year ended 12/31/2019 |
| |
Footnote |
Carlina |
Cortezb |
Turquoise Ridgec |
Long Canyond |
Phoenixd |
Nevada Gold Minese |
Hemlo |
North America |
| Cost of sales applicable to gold production |
|
1,310 |
|
751 |
|
425 |
|
101 |
|
154 |
|
2,741 |
|
247 |
|
2,988 |
|
| Depreciation |
|
(312) |
|
(240) |
|
(140) |
|
(70) |
|
(36) |
|
(798) |
|
(27) |
|
(825) |
|
| By-product credits |
|
(1) |
|
(1) |
|
(2) |
|
0 |
|
(48) |
|
(52) |
|
(1) |
|
(53) |
|
|
|
|
|
|
|
|
|
|
|
| Non-recurring items |
f |
(10) |
|
0 |
|
0 |
|
0 |
|
0 |
|
(10) |
|
(23) |
|
(33) |
|
| Other |
|
0 |
|
0 |
|
0 |
|
0 |
|
0 |
|
0 |
|
0 |
|
0 |
|
| Non-controlling interests |
|
(266) |
|
(99) |
|
(75) |
|
(12) |
|
(27) |
|
(479) |
|
0 |
|
(479) |
|
| Total cash costs |
|
721 |
|
411 |
|
208 |
|
19 |
|
43 |
|
1,402 |
|
196 |
|
1,598 |
|
| General & administrative costs |
|
0 |
|
0 |
|
0 |
|
0 |
|
0 |
|
0 |
|
0 |
|
0 |
|
| Minesite exploration and evaluation costs |
g |
17 |
|
8 |
|
4 |
|
6 |
|
1 |
|
36 |
|
1 |
|
37 |
|
| Minesite sustaining capital expenditures |
h |
307 |
|
129 |
|
70 |
|
26 |
|
22 |
|
554 |
|
47 |
|
601 |
|
| Sustaining capital leases |
|
0 |
|
0 |
|
1 |
|
0 |
|
0 |
|
1 |
|
1 |
|
2 |
|
| Rehabilitation - accretion and amortization (operating sites) |
i |
10 |
|
16 |
|
2 |
|
0 |
|
2 |
|
30 |
|
2 |
|
32 |
|
| Non-controlling interests |
|
(102) |
|
(44) |
|
(21) |
|
(12) |
|
(10) |
|
(189) |
|
0 |
|
(189) |
|
| All-in sustaining costs |
|
953 |
|
520 |
|
264 |
|
39 |
|
58 |
|
1,834 |
|
247 |
|
2,081 |
|
| Project exploration and evaluation and project costs |
g |
0 |
|
0 |
|
0 |
|
0 |
|
0 |
|
0 |
|
0 |
|
0 |
|
|
|
|
|
|
|
|
|
|
|
| Project capital expenditures |
h |
0 |
|
332 |
|
45 |
|
0 |
|
0 |
|
295 |
|
0 |
|
295 |
|
|
|
|
|
|
|
|
|
|
|
| Non-controlling interests |
|
0 |
|
(128) |
|
(10) |
|
0 |
|
0 |
|
(48) |
|
0 |
|
(48) |
|
|
|
|
|
|
|
|
|
|
|
| All-in costs |
|
953 |
|
724 |
|
299 |
|
39 |
|
58 |
|
2,081 |
|
247 |
|
2,328 |
|
| Ounces sold - equity basis (000s ounces) |
|
967 |
|
798 |
|
356 |
|
57 |
|
45 |
|
2,223 |
|
217 |
|
2,440 |
|
| Cost of sales per ounce |
j,k |
1,004 |
|
762 |
|
846 |
|
1,088 |
|
2,093 |
|
924 |
|
1,137 |
|
943 |
|
| Total cash costs per ounce |
k |
746 |
|
515 |
|
585 |
|
333 |
|
947 |
|
634 |
|
904 |
|
655 |
|
| Total cash costs per ounce (on a co-product basis) |
k,l |
747 |
|
516 |
|
588 |
|
335 |
|
1,600 |
|
657 |
|
907 |
|
677 |
|
| All-in sustaining costs per ounce |
k |
984 |
|
651 |
|
732 |
|
681 |
|
1,282 |
|
828 |
|
1,140 |
|
851 |
|
| All-in sustaining costs per ounce (on a co-product basis) |
k,l |
985 |
|
652 |
|
735 |
|
683 |
|
1,935 |
|
851 |
|
1,143 |
|
873 |
|
| All-in costs per ounce |
k |
984 |
|
903 |
|
834 |
|
681 |
|
1,282 |
|
938 |
|
1,141 |
|
953 |
|
| All-in costs per ounce (on a co-product basis) |
k,l |
985 |
|
904 |
|
837 |
|
683 |
|
1,935 |
|
961 |
|
1,144 |
|
975 |
|
|
|
|
|
|
|
|
|
|
| BARRICK YEAR-END 2021 |
111 |
MANAGEMENT’S DISCUSSION AND ANALYSIS |
|
|
|
|
|
|
|
|
|
|
|
|
|
|
|
|
|
|
|
|
|
|
| ($ millions, except per ounce information in dollars) |
|
For the year ended 12/31/2019 |
| |
Footnote |
Pueblo Viejo |
|
Veladero |
Porgerao |
Kalgoorliep |
Latin America & Asia Pacific |
| Cost of sales applicable to gold production |
|
721 |
|
|
323 |
|
284 |
|
223 |
|
1,551 |
|
| Depreciation |
|
(196) |
|
|
(115) |
|
(42) |
|
(38) |
|
(391) |
|
| By-product credits |
|
(61) |
|
|
(8) |
|
(3) |
|
(1) |
|
(73) |
|
|
|
|
|
|
|
|
|
| Non-recurring items |
f |
(2) |
|
|
(1) |
|
0 |
|
0 |
|
(3) |
|
| Other |
|
0 |
|
|
0 |
|
0 |
|
0 |
|
0 |
|
| Non-controlling interests |
|
(187) |
|
|
0 |
|
0 |
|
0 |
|
(187) |
|
| Total cash costs |
|
275 |
|
|
199 |
|
239 |
|
184 |
|
897 |
|
| General & administrative costs |
|
0 |
|
|
0 |
|
0 |
|
0 |
|
0 |
|
| Minesite exploration and evaluation costs |
g |
0 |
|
|
3 |
|
2 |
|
6 |
|
11 |
|
| Minesite sustaining capital expenditures |
h |
107 |
|
|
91 |
|
45 |
|
52 |
|
295 |
|
| Sustaining capital leases |
|
0 |
|
|
2 |
|
3 |
|
4 |
|
9 |
|
| Rehabilitation - accretion and amortization (operating sites) |
i |
10 |
|
|
5 |
|
(2) |
|
3 |
|
16 |
|
| Non-controlling interests |
|
(47) |
|
|
0 |
|
0 |
|
0 |
|
(47) |
|
| All-in sustaining costs |
|
345 |
|
|
300 |
|
287 |
|
249 |
|
1,181 |
|
| Project exploration and evaluation and project costs |
g |
8 |
|
|
0 |
|
0 |
|
0 |
|
8 |
|
|
|
|
|
|
|
|
|
| Project capital expenditures |
h |
0 |
|
|
15 |
|
0 |
|
0 |
|
15 |
|
|
|
|
|
|
|
|
|
| Non-controlling interests |
|
(3) |
|
|
0 |
|
0 |
|
0 |
|
(3) |
|
|
|
|
|
|
|
|
|
| All-in costs |
|
350 |
|
|
315 |
|
287 |
|
249 |
|
1,201 |
|
| Ounces sold - equity basis (000s ounces) |
|
584 |
|
|
271 |
|
285 |
|
210 |
|
1,350 |
|
| Cost of sales per ounce |
j,k |
747 |
|
|
1,188 |
|
994 |
|
1,062 |
|
937 |
|
| Total cash costs per ounce |
k |
471 |
|
|
734 |
|
838 |
|
873 |
|
664 |
|
| Total cash costs per ounce (on a co-product basis) |
k,l |
536 |
|
|
759 |
|
848 |
|
876 |
|
716 |
|
| All-in sustaining costs per ounce |
k |
592 |
|
|
1,105 |
|
1,003 |
|
1,183 |
|
874 |
|
| All-in sustaining costs per ounce (on a co-product basis) |
k,l |
657 |
|
|
1,130 |
|
1,013 |
|
1,186 |
|
926 |
|
| All-in costs per ounce |
k |
600 |
|
|
1,162 |
|
1,003 |
|
1,183 |
|
885 |
|
| All-in costs per ounce (on a co-product basis) |
k,l |
665 |
|
|
1,187 |
|
1,013 |
|
1,186 |
|
937 |
|
|
|
|
|
|
|
|
|
|
| BARRICK YEAR-END 2021 |
112 |
MANAGEMENT’S DISCUSSION AND ANALYSIS |
|
|
|
|
|
|
|
|
|
|
|
|
|
|
|
|
|
|
|
|
|
|
|
|
|
|
|
| ($ millions, except per ounce information in dollars) |
For the year ended 12/31/2019 |
| |
Footnote |
Loulo-Gounkoto |
Kibali |
North Maram |
Tongon |
Bulyanhulum |
Buzwagim,n |
Africa & Middle East |
| Cost of sales applicable to gold production |
|
751 |
|
403 |
|
310 |
|
402 |
|
45 |
|
138 |
|
2,049 |
|
| Depreciation |
|
(295) |
|
(196) |
|
(97) |
|
(186) |
|
(19) |
|
(8) |
|
(801) |
|
| By-product credits |
|
0 |
|
(1) |
|
(2) |
|
(1) |
|
(1) |
|
(1) |
|
(6) |
|
|
|
|
|
|
|
|
|
|
| Non-recurring items |
f |
0 |
|
0 |
|
0 |
|
0 |
|
0 |
|
0 |
|
0 |
|
| Other |
|
0 |
|
0 |
|
0 |
|
0 |
|
0 |
|
0 |
|
0 |
|
| Non-controlling interests |
|
(91) |
|
0 |
|
(51) |
|
(23) |
|
(7) |
|
(36) |
|
(208) |
|
| Total cash costs |
|
365 |
|
206 |
|
160 |
|
192 |
|
18 |
|
93 |
|
1,034 |
|
| General & administrative costs |
|
0 |
|
0 |
|
0 |
|
0 |
|
0 |
|
0 |
|
0 |
|
| Minesite exploration and evaluation costs |
g |
12 |
|
3 |
|
0 |
|
3 |
|
0 |
|
0 |
|
18 |
|
| Minesite sustaining capital expenditures |
h |
165 |
|
41 |
|
48 |
|
11 |
|
2 |
|
0 |
|
267 |
|
| Sustaining capital leases |
|
3 |
|
1 |
|
0 |
|
2 |
|
0 |
|
1 |
|
7 |
|
| Rehabilitation - accretion and amortization (operating sites) |
i |
1 |
|
0 |
|
3 |
|
0 |
|
1 |
|
1 |
|
6 |
|
| Non-controlling interests |
|
(37) |
|
0 |
|
(13) |
|
(2) |
|
(1) |
|
0 |
|
(53) |
|
| All-in sustaining costs |
|
509 |
|
251 |
|
198 |
|
206 |
|
20 |
|
95 |
|
1,279 |
|
| Project exploration and evaluation and project costs |
g |
0 |
|
0 |
|
0 |
|
0 |
|
0 |
|
0 |
|
0 |
|
|
|
|
|
|
|
|
|
|
| Project capital expenditures |
h |
4 |
|
2 |
|
9 |
|
0 |
|
3 |
|
0 |
|
18 |
|
|
|
|
|
|
|
|
|
|
| Non-controlling interests |
|
(1) |
|
0 |
|
(3) |
|
0 |
|
(1) |
|
0 |
|
(5) |
|
|
|
|
|
|
|
|
|
|
| All-in costs |
|
512 |
|
253 |
|
204 |
|
206 |
|
22 |
|
95 |
|
1,292 |
|
| Ounces sold - equity basis (000s ounces) |
|
575 |
|
363 |
|
248 |
|
245 |
|
27 |
|
81 |
|
1,539 |
|
| Cost of sales per ounce |
j,k |
1,044 |
|
1,111 |
|
953 |
|
1,469 |
|
1,207 |
|
1,240 |
|
1,126 |
|
| Total cash costs per ounce |
k |
634 |
|
568 |
|
646 |
|
787 |
|
676 |
|
1,156 |
|
673 |
|
| Total cash costs per ounce (on a co-product basis) |
k,l |
634 |
|
571 |
|
654 |
|
789 |
|
709 |
|
1,166 |
|
677 |
|
| All-in sustaining costs per ounce |
k |
886 |
|
693 |
|
802 |
|
844 |
|
773 |
|
1,178 |
|
834 |
|
| All-in sustaining costs per ounce (on a co-product basis) |
k,l |
886 |
|
696 |
|
810 |
|
846 |
|
806 |
|
1,188 |
|
838 |
|
| All-in costs per ounce |
k |
891 |
|
701 |
|
824 |
|
846 |
|
840 |
|
1,178 |
|
842 |
|
| All-in costs per ounce (on a co-product basis) |
k,l |
891 |
|
704 |
|
832 |
|
848 |
|
873 |
|
1,188 |
|
846 |
|
a.On July 1, 2019, Barrick's Goldstrike and Newmont's Carlin were contributed to Nevada Gold Mines and are now collectively referred to as Carlin. As a result, the amounts presented represent Goldstrike on a 100% basis (including our 60% share of South Arturo) up until June 30, 2019, and the combined results of Carlin and Goldstrike (including our share of South Arturo) on a 61.5% basis thereafter. On September 7, 2021, Barrick announced NGM had entered into an Exchange Agreement with i-80 Gold to acquire the 40% interest in South Arturo that NGM did not already own in exchange for the Lone Tree and Buffalo Mountain properties and infrastructure. Operating results within our 61.5% interest in Carlin includes NGM’s 60% interest in South Arturo up until May 30, 2021, and 100% interest thereafter, reflecting the terms of the Exchange Agreement which closed on October 14, 2021.
b.On July 1, 2019, Cortez was contributed to Nevada Gold Mines, a joint venture with Newmont. As a result, the amounts presented are on a 100% basis up until June 30, 2019, and on a 61.5% basis thereafter. Starting in the first quarter of 2021, Goldrush is reported as part of Cortez as it is operated by Cortez management. Comparative periods have been restated to include Goldrush.
c.Barrick owned 75% of Turquoise Ridge through to the end of the second quarter of 2019, with our joint venture partner, Newmont, owning the remaining 25%. Turquoise Ridge was proportionately consolidated on the basis that the joint venture partners that have joint control have rights to the assets and obligations for the liabilities relating to the arrangement. The figures presented in this table are based on our 75% interest in Turquoise Ridge until June 30, 2019. On July 1, 2019, Barrick's 75% interest in Turquoise Ridge and Newmont's Twin Creeks and 25% interest in Turquoise Ridge were contributed to Nevada Gold Mines. Starting July 1, 2019, the results represent our 61.5% share of Turquoise Ridge and Twin Creeks, now referred to as Turquoise Ridge.
d.A 61.5% interest in these sites was acquired as a result of the formation of Nevada Gold Mines on July 1, 2019.
e.Represents the combined results of Cortez, Goldstrike (including our 60% share of South Arturo) and our 75% interest in Turquoise Ridge until June 30, 2019. Commencing July 1, 2019, the date Nevada Gold Mines was established, the results represent our 61.5% interest in Cortez, Carlin (including Goldstrike and NGM’s 60% interest in South Arturo up until May 30, 2021 and 100% interest thereafter), Turquoise Ridge (including Twin Creeks), Phoenix and Long Canyon.
f.Non-recurring items
Non-recurring items in 2019 relate to organizational restructuring. These costs are not indicative of our cost of production and have been excluded from the calculation of total cash costs.
|
|
|
|
|
|
|
|
|
| BARRICK YEAR-END 2021 |
113 |
MANAGEMENT’S DISCUSSION AND ANALYSIS |
g.Exploration and evaluation costs
Exploration, evaluation and project expenses are presented as minesite sustaining if it supports current mine operations and project if it relates to future projects. Refer to page 85 of this MD&A.
h.Capital expenditures
Capital expenditures are related to our gold sites only and are split between minesite sustaining and project capital expenditures. Project capital expenditures are capital spending at new projects and major, discrete projects at existing operations intended to increase net present value through higher production or longer mine life. Significant projects in the current year are the expansion project at Pueblo Viejo, construction of the Third Shaft at Turquoise Ridge, the development of the Gounkoto underground and the Veladero Phase 7 expansion. Refer to page 84 of this MD&A.
i.Rehabilitation - accretion and amortization
Includes depreciation on the assets related to rehabilitation provisions of our gold operations and accretion on the rehabilitation provision of our gold operations, split between operating and non-operating sites.
j.Cost of sales per ounce
Gold cost of sales per ounce is calculated as cost of sales across our gold operations (excluding sites in closure or care and maintenance) divided by ounces sold (both on an attributable basis using Barrick’s ownership share).
k.Per ounce figures
Cost of sales per ounce, total cash costs per ounce, all-in sustaining costs per ounce and all-in costs per ounce may not calculate based on amounts presented in this table due to rounding.
l.Co-product costs per ounce
Total cash costs per ounce, all-in sustaining costs per ounce and all-in costs per ounce presented on a co-product basis removes the impact of by-product credits of our gold production (net of non-controlling interest) calculated as:
|
|
|
|
|
|
|
|
|
|
|
|
|
|
|
|
|
|
|
|
|
|
|
|
|
|
|
|
| ($ millions) |
|
|
|
|
For the three months ended 12/31/21 |
|
| |
Carlina |
Cortezb |
Turquoise Ridgec |
Long Canyond |
Phoenixd |
Nevada Gold Minese |
Hemlo |
Pueblo Viejo |
|
| By-product credits |
0 |
|
1 |
|
1 |
|
0 |
|
47 |
|
49 |
|
0 |
|
12 |
|
|
| Non-controlling interest |
0 |
|
0 |
|
0 |
|
0 |
|
(18) |
|
(18) |
|
0 |
|
(5) |
|
|
| By-product credits (net of non-controlling interest) |
0 |
|
1 |
|
1 |
|
0 |
|
29 |
|
31 |
|
0 |
|
7 |
|
|
|
|
|
|
|
|
|
|
|
|
| ($ millions) |
|
|
|
|
For the three months ended 12/31/21 |
|
| |
|
Veladero |
Loulo-Gounkoto |
Kibali |
North Maram |
Tongon |
Bulyanhulum |
Buzwagim,n |
|
| By-product credits |
|
1 |
|
0 |
1 |
|
0 |
|
1 |
|
6 |
|
|
|
| Non-controlling interest |
|
0 |
|
0 |
0 |
|
0 |
|
0 |
|
(1) |
|
|
|
| By-product credits (net of non-controlling interest) |
|
1 |
|
0 |
1 |
|
0 |
|
1 |
|
5 |
|
|
|
|
|
|
|
|
|
|
|
|
|
| ($ millions) |
|
|
|
|
For the three months ended 9/30/21 |
|
| |
Carlina |
Cortezb |
Turquoise Ridgec |
Long Canyond |
Phoenixd |
Nevada Gold Minese |
Hemlo |
Pueblo Viejo |
|
| By-product credits |
0 |
|
1 |
|
0 |
|
0 |
|
51 |
|
52 |
|
1 |
|
16 |
|
|
| Non-controlling interest |
0 |
|
(1) |
|
0 |
|
0 |
|
(20) |
|
(21) |
|
0 |
|
(6) |
|
|
| By-product credits (net of non-controlling interest) |
0 |
|
0 |
|
0 |
|
0 |
|
31 |
|
31 |
|
1 |
|
10 |
|
|
|
|
|
|
|
|
|
|
|
|
| ($ millions) |
|
|
|
|
For the three months ended 9/30/21 |
|
| |
|
Veladero |
Loulo-Gounkoto |
Kibali |
North Maram |
Tongon |
Bulyanhulum |
Buzwagim,n |
|
| By-product credits |
|
2 |
|
0 |
|
0 |
|
1 |
|
0 |
|
5 |
|
0 |
|
|
| Non-controlling interest |
|
0 |
|
0 |
|
0 |
|
0 |
|
0 |
|
0 |
|
0 |
|
|
| By-product credits (net of non-controlling interest) |
|
2 |
|
0 |
|
0 |
|
1 |
|
0 |
|
5 |
|
0 |
|
|
|
|
|
|
|
|
|
|
|
|
|
|
|
|
|
|
|
|
|
|
|
|
|
|
|
|
|
|
|
|
|
|
|
|
|
|
|
|
|
|
|
|
|
|
|
|
|
|
|
|
|
|
|
|
|
|
|
|
|
|
|
|
|
|
|
|
|
|
|
|
|
|
|
|
|
|
|
|
|
|
|
|
|
|
|
|
|
|
|
|
|
|
|
|
|
|
|
|
|
|
|
|
|
|
|
|
|
|
|
|
|
|
|
|
|
|
|
|
|
|
|
| BARRICK YEAR-END 2021 |
114 |
MANAGEMENT’S DISCUSSION AND ANALYSIS |
|
|
|
|
|
|
|
|
|
|
|
|
|
|
|
|
|
|
|
|
|
|
|
|
|
|
|
|
| |
|
|
|
|
|
For the year ended 12/31/21 |
|
| |
Carlina |
Cortezb |
Turquoise Ridgec |
Long Canyond |
Phoenixd |
Nevada Gold Minese |
Hemlo |
Pueblo Viejo |
|
By-product credits |
2 |
|
3 |
|
5 |
|
0 |
|
194 |
|
204 |
|
1 |
|
58 |
|
|
Non-controlling interest |
(1) |
|
(1) |
|
(2) |
|
0 |
|
(75) |
|
(79) |
|
0 |
|
(23) |
|
|
By-product credits (net of non-controlling interest) |
1 |
|
2 |
|
3 |
|
0 |
|
119 |
|
125 |
|
1 |
|
35 |
|
|
|
|
|
|
|
|
|
|
|
|
| |
|
|
|
|
|
For the year ended 12/31/21 |
| |
|
Veladero |
Loulo-Gounkoto |
Kibali |
North Maram |
Tongon |
Bulyanhulum |
Buzwagim,n |
|
| By-product credits |
|
7 |
|
0 |
|
2 |
|
2 |
|
1 |
|
15 |
|
0 |
|
|
| Non-controlling interest |
|
0 |
|
0 |
|
0 |
|
0 |
|
0 |
|
(2) |
|
0 |
|
|
| By-product credits (net of non-controlling interest) |
|
7 |
|
0 |
|
2 |
|
2 |
|
1 |
|
13 |
|
0 |
|
|
|
|
|
|
|
|
|
|
|
|
| |
|
|
|
For the year ended 12/31/20 |
|
| |
Carlina |
Cortezb |
Turquoise Ridgec |
Long Canyond |
Phoenixd |
Nevada Gold Minese |
Hemlo |
Pueblo Viejo |
|
| By-product credits |
2 |
|
2 |
|
7 |
|
0 |
|
137 |
|
148 |
|
1 |
|
57 |
|
|
| Non-controlling interest |
(1) |
|
(1) |
|
(3) |
|
0 |
|
(53) |
|
(57) |
|
0 |
|
(23) |
|
|
| By-product credits (net of non-controlling interest) |
1 |
|
1 |
|
4 |
|
0 |
|
84 |
|
91 |
|
1 |
|
34 |
|
|
|
|
|
|
|
|
|
|
|
|
| |
|
|
|
For the year ended 12/31/20 |
|
| |
Veladero |
Porgeran |
Loulo-Gounkoto |
Kibali |
North Maram |
Tongon |
Bulyanhulum |
Buzwagim,n |
|
| By-product credits |
5 |
|
1 |
|
0 |
|
1 |
|
2 |
|
0 |
|
10 |
|
22 |
|
|
| Non-controlling interest |
0 |
|
0 |
|
0 |
|
0 |
|
0 |
|
0 |
|
(2) |
|
(4) |
|
|
| By-product credits (net of non-controlling interest) |
5 |
|
1 |
|
0 |
|
1 |
|
2 |
|
0 |
|
8 |
|
18 |
|
|
|
|
|
|
|
|
|
|
|
|
|
|
|
|
|
|
|
|
|
|
|
|
|
|
|
|
|
|
|
|
|
|
|
|
|
|
|
|
|
|
|
|
|
|
|
|
|
|
|
|
|
|
|
|
|
|
|
|
|
|
|
|
|
|
|
|
|
|
|
|
|
|
|
|
|
|
|
|
|
|
|
|
|
|
|
|
|
|
|
|
|
|
|
|
|
|
|
|
|
|
|
|
|
|
|
|
|
|
|
|
|
|
|
|
|
|
|
|
|
|
|
|
|
|
|
|
|
|
|
|
|
|
|
|
|
|
|
|
|
|
|
|
|
|
|
|
|
|
|
|
|
|
|
|
|
|
|
|
|
|
|
|
|
|
|
|
|
|
|
|
|
|
|
|
|
|
|
|
|
|
|
|
|
|
|
|
|
|
|
|
|
|
|
|
|
|
|
|
|
|
|
|
|
| |
|
|
For the year ended 12/31/19 |
|
| |
Carlina |
Cortezb |
Turquoise Ridgec |
Long Canyond |
Phoenixd |
Nevada Gold Minese |
Hemlo |
Pueblo Viejo |
|
| By-product credits |
1 |
|
1 |
|
2 |
|
0 |
|
48 |
|
52 |
|
1 |
|
61 |
|
|
| Non-controlling interest |
0 |
|
0 |
|
(1) |
|
0 |
|
(18) |
|
(19) |
|
0 |
|
(24) |
|
|
| By-product credits (net of non-controlling interest) |
1 |
|
1 |
|
1 |
|
0 |
|
30 |
|
33 |
|
1 |
|
37 |
|
|
|
|
|
|
|
|
|
|
|
|
|
|
|
|
|
|
|
|
|
|
|
|
|
|
|
|
|
|
|
|
|
|
|
|
|
|
|
|
|
|
|
|
|
|
|
|
|
|
|
|
|
|
|
|
|
|
|
|
|
|
|
|
|
|
|
|
|
|
|
|
|
|
|
|
|
|
|
|
|
|
|
|
|
|
|
|
|
|
|
|
|
|
|
|
|
|
|
|
|
|
|
|
|
|
|
|
|
|
|
|
|
|
|
|
|
|
|
|
|
|
|
|
|
|
|
|
|
|
|
|
|
|
|
|
|
|
|
|
|
|
|
|
|
|
|
|
|
|
|
|
|
|
|
|
|
|
|
|
|
|
|
|
|
|
|
|
|
|
|
|
|
|
|
|
|
|
|
|
|
|
|
|
|
|
|
|
|
|
|
|
|
|
|
|
|
|
|
|
|
|
|
|
|
|
|
|
|
|
|
|
|
|
|
|
|
|
|
|
|
|
|
|
|
|
| |
|
|
|
For the year ended 12/31/19 |
|
| |
Veladero |
Porgerao |
Kalgoorliep |
Loulo-Gounkoto |
Kibali |
North Maram |
Tongon |
Bulyanhulum |
Buzwagim,n |
|
| By-product credits |
8 |
|
3 |
|
1 |
|
0 |
|
1 |
|
2 |
|
1 |
|
1 |
|
1 |
|
|
| Non-controlling interest |
0 |
|
0 |
|
0 |
|
0 |
|
0 |
|
0 |
|
0 |
|
0 |
|
0 |
|
|
| By-product credits (net of non-controlling interest) |
8 |
|
3 |
|
1 |
|
0 |
|
1 |
|
2 |
|
1 |
|
1 |
|
1 |
|
|
m.Formerly part of Acacia Mining plc. On September 17, 2019, Barrick acquired all of the shares of Acacia it did not already own. The results presented are on a 63.9% basis until September 30, 2019 (notwithstanding the completion of the Acacia transaction on September 17, 2019, we consolidated our interest in Acacia and recorded a non-controlling interest of 36.1% in the income statement for the entirety of the third quarter of 2019 as a matter of convenience); on a 100% basis from October 1, 2019 to December 31, 2019; and on a 84% basis starting January 1, 2020, the date the GoT’s 16% free carried interest was made effective. The results in the table and the discussion that follows are based on our share.
n.With the end of mining at Buzwagi in the third quarter of 2021, as previously reported, we have ceased to include production or non-GAAP cost metrics for Buzwagi from October 1, 2021 onwards.
o.As Porgera was placed on care and maintenance on April 25, 2020, no operating data or per ounce data was provided for the three month periods ended December 31, 2021 and September 30, 2021 and the year ended December 31, 2021.
p.On November 28, 2019, we completed the sale of our 50% interest in Kalgoorlie in Western Australia to Saracen Mineral Holdings Limited for total cash consideration of $750 million. The transaction resulted in a gain of $408 million for the year ended December 31, 2019. The operating results reported for Kalgoorlie reflect the Company’s attributable share of Kalgoorlie’s results until the date of divestiture.
|
|
|
|
|
|
|
|
|
| BARRICK YEAR-END 2021 |
115 |
MANAGEMENT’S DISCUSSION AND ANALYSIS |
Reconciliation of Copper Cost of Sales to C1 cash costs and All-in sustaining costs, including on a per pound basis
|
|
|
|
|
|
|
|
|
|
|
|
|
|
|
|
|
|
|
|
|
|
|
For the three months ended |
|
For the years ended |
| ($ millions, except per pound information in dollars) |
12/31/21 |
9/30/21 |
|
|
12/31/21 |
12/31/20 |
12/31/19 |
| Cost of sales |
134 |
|
162 |
|
|
|
569 |
|
556 |
|
361 |
|
| Depreciation/amortization |
(43) |
|
(60) |
|
|
|
(197) |
|
(208) |
|
(100) |
|
| Treatment and refinement charges |
39 |
|
42 |
|
|
|
161 |
|
157 |
|
99 |
|
| Cash cost of sales applicable to equity method investments |
88 |
|
74 |
|
|
|
313 |
|
267 |
|
288 |
|
Less: royalties and production taxesa |
(28) |
|
(27) |
|
|
|
(103) |
|
(54) |
|
(35) |
|
| By-product credits |
(6) |
|
(2) |
|
|
|
(15) |
|
(15) |
|
(9) |
|
| Other |
0 |
|
0 |
|
|
|
0 |
|
0 |
|
(5) |
|
C1 cash cost of sales |
184 |
|
189 |
|
|
|
728 |
|
703 |
|
599 |
|
| General & administrative costs |
5 |
|
3 |
|
|
|
17 |
|
18 |
|
19 |
|
| Rehabilitation - accretion and amortization |
2 |
|
1 |
|
|
|
6 |
|
8 |
|
15 |
|
| Royalties and production taxes |
28 |
|
27 |
|
|
|
103 |
|
54 |
|
35 |
|
| Minesite exploration and evaluation costs |
5 |
|
3 |
|
|
|
14 |
|
5 |
|
6 |
|
| Minesite sustaining capital expenditures |
104 |
|
40 |
|
|
|
234 |
|
223 |
|
215 |
|
| Sustaining leases |
3 |
|
2 |
|
|
|
9 |
|
9 |
|
5 |
|
| Inventory write-downs |
0 |
|
0 |
|
|
|
0 |
|
0 |
|
0 |
|
All-in sustaining costs |
331 |
|
265 |
|
|
|
1,111 |
|
1,020 |
|
894 |
|
| Pounds sold - consolidated basis (millions pounds) |
113 |
|
101 |
|
|
|
423 |
|
457 |
|
355 |
|
Cost of sales per poundb,c |
2.21 |
|
2.57 |
|
|
|
2.32 |
|
2.02 |
|
2.14 |
|
C1 cash costs per poundb |
1.63 |
|
1.85 |
|
|
|
1.72 |
|
1.54 |
|
1.69 |
|
All-in sustaining costs per poundb |
2.92 |
|
2.60 |
|
|
|
2.62 |
|
2.23 |
|
2.52 |
|
a.For the three months and year ended December 31, 2021, royalties and production taxes include royalties of $28 million and $103 million, respectively (September 30, 2021: $27 million, 2020: $54 million and 2019: $34 million).
b.Cost of sales per pound, C1 cash costs per pound and all-in sustaining costs per pound may not calculate based on amounts presented in this table due to rounding.
c.Copper cost of sales per pound is calculated as cost of sales across our copper operations divided by pounds sold (both on an attributable basis using Barrick’s ownership share).
|
|
|
|
|
|
|
|
|
| BARRICK YEAR-END 2021 |
116 |
MANAGEMENT’S DISCUSSION AND ANALYSIS |
Reconciliation of Copper Cost of Sales to C1 cash costs and All-in sustaining costs, including on a per pound basis, by operating site
|
|
|
|
|
|
|
|
|
|
|
|
|
|
|
|
|
|
|
|
|
|
|
|
|
For the three months ended |
| ($ millions, except per pound information in dollars) |
12/31/21 |
|
9/30/21 |
| |
Zaldívar |
Lumwana |
Jabal Sayid |
|
Zaldívar |
Lumwana |
Jabal Sayid |
| Cost of sales |
84 |
|
134 |
|
33 |
|
|
79 |
|
162 |
|
19 |
|
| Depreciation/amortization |
(21) |
|
(43) |
|
(8) |
|
|
(20) |
|
(60) |
|
(4) |
|
| Treatment and refinement charges |
0 |
|
31 |
|
8 |
|
|
0 |
|
38 |
|
4 |
|
Less: royalties and production taxesa |
0 |
|
(28) |
|
0 |
|
|
0 |
|
(27) |
|
0 |
|
| By-product credits |
0 |
|
0 |
|
(6) |
|
|
0 |
|
0 |
|
(2) |
|
| Other |
0 |
|
0 |
|
0 |
|
|
0 |
|
0 |
|
0 |
|
C1 cash cost of sales |
63 |
|
94 |
|
27 |
|
|
59 |
|
113 |
|
17 |
|
| Rehabilitation - accretion and amortization |
1 |
|
1 |
|
0 |
|
|
0 |
|
1 |
|
0 |
|
Royalties and production taxesa |
0 |
|
28 |
|
0 |
|
|
0 |
|
27 |
|
0 |
|
| Minesite exploration and evaluation costs |
4 |
|
0 |
|
1 |
|
|
3 |
|
0 |
|
0 |
|
| Minesite sustaining capital expenditures |
22 |
|
79 |
|
3 |
|
|
8 |
|
30 |
|
2 |
|
| Sustaining leases |
1 |
|
1 |
|
1 |
|
|
1 |
|
1 |
|
0 |
|
| Inventory write-downs |
0 |
|
0 |
|
0 |
|
|
0 |
|
0 |
|
0 |
|
All-in sustaining costs |
91 |
|
203 |
|
32 |
|
|
71 |
|
172 |
|
19 |
|
| Pounds sold - consolidated basis (millions pounds) |
26 |
|
62 |
|
25 |
|
|
25 |
|
64 |
|
12 |
|
Cost of sales per poundb,c |
3.14 |
|
2.16 |
|
1.36 |
|
|
3.13 |
|
2.54 |
|
1.51 |
|
C1 cash costs per poundb |
2.35 |
|
1.54 |
|
1.11 |
|
|
2.33 |
|
1.76 |
|
1.35 |
|
All-in sustaining costs per poundb |
3.42 |
|
3.29 |
|
1.27 |
|
|
2.77 |
|
2.68 |
|
1.55 |
|
|
|
|
|
|
|
|
|
|
|
|
|
|
|
|
|
|
|
|
|
|
|
|
|
|
|
|
|
|
|
|
|
|
|
|
|
| ($ millions, except per pound information in dollars) |
|
|
For the years ended December 31 |
|
12/31/21 |
|
12/31/20 |
|
12/31/19 |
| |
Zaldívar |
Lumwana |
Jabal Sayid |
|
Zaldívar |
Lumwana |
Jabal Sayid |
|
Zaldívar |
Lumwana |
Jabal Sayid |
| Cost of sales |
314 |
|
569 |
|
99 |
|
|
262 |
|
556 |
|
104 |
|
|
307 |
|
361 |
|
93 |
|
| Depreciation/amortization |
(79) |
|
(197) |
|
(21) |
|
|
(72) |
|
(208) |
|
(27) |
|
|
(86) |
|
(100) |
|
(27) |
|
| Treatment and refinement charges |
0 |
|
140 |
|
21 |
|
|
1 |
|
137 |
|
19 |
|
|
0 |
|
80 |
|
19 |
|
Less: royalties and production taxesa |
0 |
|
(103) |
|
0 |
|
|
0 |
|
(54) |
|
0 |
|
|
0 |
|
(35) |
|
0 |
|
| By-product credits |
0 |
|
0 |
|
(15) |
|
|
0 |
|
0 |
|
(15) |
|
|
0 |
|
0 |
|
(9) |
|
| Other |
0 |
|
0 |
|
0 |
|
|
0 |
|
0 |
|
0 |
|
|
0 |
|
(5) |
|
0 |
|
| C1 cash cost of sales |
235 |
|
409 |
|
84 |
|
|
191 |
|
431 |
|
81 |
|
|
221 |
|
301 |
|
76 |
|
| Rehabilitation - accretion and amortization |
1 |
|
5 |
|
0 |
|
|
0 |
|
8 |
|
0 |
|
|
5 |
|
10 |
|
0 |
|
Royalties and production taxesa |
0 |
|
103 |
|
0 |
|
|
0 |
|
54 |
|
0 |
|
|
0 |
|
35 |
|
0 |
|
| Minesite exploration and evaluation costs |
13 |
|
0 |
|
1 |
|
|
4 |
|
0 |
|
1 |
|
|
6 |
|
0 |
|
0 |
|
| Minesite sustaining capital expenditures |
37 |
|
189 |
|
8 |
|
|
39 |
|
175 |
|
9 |
|
|
34 |
|
166 |
|
15 |
|
| Sustaining leases |
4 |
|
3 |
|
2 |
|
|
5 |
|
4 |
|
0 |
|
|
3 |
|
2 |
|
0 |
|
| Inventory write-downs |
0 |
|
0 |
|
0 |
|
|
0 |
|
0 |
|
0 |
|
|
0 |
|
0 |
|
0 |
|
| All-in sustaining costs |
290 |
|
709 |
|
95 |
|
|
239 |
|
672 |
|
91 |
|
|
269 |
|
514 |
|
91 |
|
| Pounds sold - consolidated basis (millions pounds) |
98 |
|
253 |
|
72 |
|
|
106 |
|
277 |
|
74 |
|
|
125 |
|
169 |
|
61 |
|
Cost of sales per poundb,c |
3.19 |
|
2.25 |
|
1.38 |
|
|
2.46 |
|
2.01 |
|
1.42 |
|
|
2.46 |
|
2.13 |
|
1.53 |
|
C1 cash costs per poundb |
2.38 |
|
1.62 |
|
1.18 |
|
|
1.79 |
|
1.56 |
|
1.11 |
|
|
1.77 |
|
1.79 |
|
1.26 |
|
All-in sustaining costs per poundb |
2.94 |
|
2.80 |
|
1.33 |
|
|
2.25 |
|
2.43 |
|
1.24 |
|
|
2.15 |
|
3.04 |
|
1.51 |
|
a.For the three months and year ended December 31, 2021, royalties and production taxes include royalties of $28 million and $103 million, respectively (September 30, 2021: $27 million, 2020: $54 million and 2019: $34 million).
b.Cost of sales per pound, C1 cash costs per pound and all-in sustaining costs per pound may not calculate based on amounts presented in this table due to rounding.
c.Copper cost of sales per pound is calculated as cost of sales across our copper operations divided by pounds sold (both on an attributable basis using Barrick’s ownership share).
|
|
|
|
|
|
|
|
|
| BARRICK YEAR-END 2021 |
117 |
MANAGEMENT’S DISCUSSION AND ANALYSIS |
EBITDA and Adjusted EBITDA
EBITDA is a non-GAAP financial measure, which excludes the following from net earnings:
■Income tax expense;
■Finance costs;
■Finance income; and
■Depreciation.
Management believes that EBITDA is a valuable indicator of our ability to generate liquidity by producing operating cash flow to fund working capital needs, service debt obligations, and fund capital expenditures. Management uses EBITDA for this purpose. EBITDA is also frequently used by investors and analysts for valuation purposes whereby EBITDA is multiplied by a factor or “EBITDA multiple” that is based on an observed or inferred relationship between EBITDA and market values to determine the approximate total enterprise value of a company.
Adjusted EBITDA removes the effect of impairment charges; acquisition/disposition gains/losses; foreign currency translation gains/losses; and other expense adjustments. We also remove the impact of the income tax expense, finance costs, finance income and depreciation incurred in our equity method accounted investments. We believe these items provide a greater level of consistency with the adjusting items included in our
adjusted net earnings reconciliation, with the exception that these amounts are adjusted to remove any impact on finance costs/income, income tax expense and/or depreciation as they do not affect EBITDA. We believe this additional information will assist analysts, investors and other stakeholders of Barrick in better understanding our ability to generate liquidity from our full business, including equity method investments, by excluding these amounts from the calculation as they are not indicative of the performance of our core mining business and do not necessarily reflect the underlying operating results for the periods presented.
EBITDA and adjusted EBITDA are intended to provide additional information to investors and analysts and do not have any standardized definition under IFRS, and should not be considered in isolation or as a substitute for measures of performance prepared in accordance with IFRS. EBITDA and adjusted EBITDA exclude the impact of cash costs of financing activities and taxes, and the effects of changes in operating working capital balances, and therefore are not necessarily indicative of operating profit or cash flow from operations as determined under IFRS. Other companies may calculate EBITDA and adjusted EBITDA differently.
Reconciliation of Net Earnings to EBITDA and Adjusted EBITDA
|
|
|
|
|
|
|
|
|
|
|
|
|
|
|
|
|
|
|
|
|
|
|
For the three months ended |
|
For the years ended |
| ($ millions) |
12/31/21 |
9/30/21 |
|
|
12/31/21 |
12/31/20 |
12/31/19 |
| Net earnings |
1,152 |
|
612 |
|
|
|
3,288 |
|
3,614 |
|
4,574 |
|
| Income tax expense |
304 |
|
323 |
|
|
|
1,344 |
|
1,332 |
|
1,783 |
|
Finance costs, neta |
74 |
|
80 |
|
|
|
307 |
|
306 |
|
394 |
|
| Depreciation |
557 |
|
538 |
|
|
|
2,102 |
|
2,208 |
|
2,032 |
|
| EBITDA |
2,087 |
|
1,553 |
|
|
|
7,041 |
|
7,460 |
|
8,783 |
|
Impairment charges (reversals) of long-lived assetsb |
14 |
|
10 |
|
|
|
(63) |
|
(269) |
|
(1,423) |
|
Acquisition/disposition gainsc |
(198) |
|
(5) |
|
|
|
(213) |
|
(180) |
|
(2,327) |
|
| Loss on currency translation |
13 |
|
5 |
|
|
|
29 |
|
50 |
|
109 |
|
Other expense (income) adjustmentsd |
36 |
|
12 |
|
|
|
73 |
|
71 |
|
(687) |
|
|
|
|
|
|
|
|
|
Income tax expense, net finance costsa, and depreciation from equity investees |
118 |
|
94 |
|
|
|
391 |
|
360 |
|
378 |
|
| Adjusted EBITDA |
2,070 |
|
1,669 |
|
|
|
7,258 |
|
7,492 |
|
4,833 |
|
a.Finance costs exclude accretion.
b.Net impairment reversals primarily relate to non-current asset reversals at Lagunas Norte in the current year and primarily relate to our Tanzanian assets in the prior year.
c.Acquisition/disposition gains for the current year primarily relate to the gain on the sale of Lone Tree in the fourth quarter of 2021, while the prior year mainly relates to the gains on the sale of Eskay Creek, Massawa, Morila and Bullfrog.
d.Other expense adjustments for both the current and prior year primarily relate to care and maintenance expenses at Porgera. The current year periods were also impacted by a $25 million litigation settlement. The prior year was further impacted by the impact of changes in the discount rate assumptions on our closed mine rehabilitation provision and donations related to Covid-19, partially offset by the gain on the remeasurement of the residual cash liability relating to our silver sale agreement with Wheaton.
|
|
|
|
|
|
|
|
|
| BARRICK YEAR-END 2021 |
118 |
MANAGEMENT’S DISCUSSION AND ANALYSIS |
Reconciliation of Segment Income to Segment EBITDA
|
|
|
|
|
|
|
|
|
|
|
|
|
|
|
|
|
|
|
|
|
|
|
|
|
|
|
|
|
|
|
|
|
|
| ($ millions) |
For the three months ended 12/31/21 |
| |
Carlina (61.5%) |
Cortezb (61.5%) |
Turquoise Ridgec (61.5%) |
Nevada Gold Minesd (61.5%) |
Pueblo Viejo (60%) |
Loulo-Gounkoto (80%) |
Kibali (45%) |
Veladero (50%) |
|
North Marae (84%) |
Bulyanhulue (84%) |
| Income |
247 |
|
139 |
|
51 |
|
617 |
|
90 |
|
74 |
|
71 |
|
43 |
|
|
68 |
|
51 |
|
| Depreciation |
51 |
|
55 |
|
31 |
|
176 |
|
35 |
|
58 |
|
37 |
|
37 |
|
|
12 |
|
14 |
|
| EBITDA |
298 |
|
194 |
|
82 |
|
793 |
|
125 |
|
132 |
|
108 |
|
80 |
|
|
80 |
|
65 |
|
|
|
|
|
|
|
|
|
|
|
|
|
|
For the three months ended 9/30/21 |
| |
Carlina (61.5%) |
Cortezb (61.5%) |
Turquoise Ridgec (61.5%) |
Nevada Gold Minesd (61.5%) |
Pueblo Viejo (60%) |
Loulo-Gounkoto (80%) |
Kibali (45%) |
Veladero (50%) |
|
North Marae (84%) |
Bulyanhulue (84%) |
| Income |
147 |
|
77 |
|
51 |
|
333 |
|
113 |
|
84 |
|
74 |
|
24 |
|
|
52 |
|
37 |
|
| Depreciation |
41 |
|
46 |
|
31 |
|
162 |
|
37 |
|
53 |
|
36 |
|
17 |
|
|
12 |
|
13 |
|
| EBITDA |
188 |
|
123 |
|
82 |
|
495 |
|
150 |
|
137 |
|
110 |
|
41 |
|
|
64 |
|
50 |
|
|
|
|
|
|
|
|
|
|
|
|
|
|
For the year ended 12/31/21 |
| |
Carlina (61.5%) |
Cortezb (61.5%) |
Turquoise Ridgec (61.5%) |
Nevada Gold Minesd (61.5%) |
Pueblo Viejo (60%) |
Loulo-Gounkoto (80%) |
Kibali (45%) |
Veladero (50%) |
|
North Marae (84%) |
Bulyanhulue (84%) |
| Income |
733 |
|
337 |
|
229 |
|
1,675 |
|
445 |
|
380 |
|
278 |
|
118 |
|
|
214 |
|
122 |
|
| Depreciation |
170 |
|
181 |
|
123 |
|
630 |
|
142 |
|
222 |
|
141 |
|
85 |
|
|
47 |
|
48 |
|
| EBITDA |
903 |
|
518 |
|
352 |
|
2,305 |
|
587 |
|
602 |
|
419 |
|
203 |
|
|
261 |
|
170 |
|
|
|
|
|
|
|
|
|
|
|
|
| |
For the year ended 12/31/20 |
| |
Carlina (61.5%) |
Cortezb (61.5%) |
Turquoise Ridgec (61.5%) |
Nevada Gold Minesd (61.5%) |
Pueblo Viejo (60%) |
Loulo-Gounkoto (80%) |
Kibali (45%) |
Veladero (50%) |
|
North Marae (84%) |
Bulyanhulue (84%) |
| Income |
795 |
|
385 |
|
229 |
|
1,636 |
|
508 |
|
358 |
|
244 |
|
114 |
|
|
214 |
|
27 |
|
| Depreciation |
188 |
|
138 |
|
113 |
|
596 |
|
136 |
|
214 |
|
174 |
|
69 |
|
|
76 |
|
60 |
|
| EBITDA |
983 |
|
523 |
|
342 |
|
2,232 |
|
644 |
|
572 |
|
418 |
|
183 |
|
|
290 |
|
87 |
|
|
|
|
|
|
|
|
|
|
|
|
|
|
For the year ended 12/31/19 |
| |
Carlina (61.5%) |
Cortezb (61.5%) |
Turquoise Ridgec (61.5%) |
Nevada Gold Minesd (61.5%) |
Pueblo Viejo (60%) |
Loulo-Gounkoto (80%) |
Kibali (45%) |
Veladero (50%) |
|
North Marae (84%) |
Bulyanhulue (84%) |
| Income |
370 |
|
459 |
|
201 |
|
1,050 |
|
402 |
|
190 |
|
108 |
|
57 |
|
|
112 |
|
(14) |
|
| Depreciation |
239 |
|
197 |
|
92 |
|
592 |
|
120 |
|
236 |
|
196 |
|
115 |
|
|
75 |
|
14 |
|
| EBITDA |
609 |
|
656 |
|
293 |
|
1,642 |
|
522 |
|
426 |
|
304 |
|
172 |
|
|
187 |
|
0 |
|
a.On July 1, 2019, Barrick's Goldstrike and Newmont's Carlin were contributed to Nevada Gold Mines and are now referred to as Carlin. As a result, the amounts presented represent Goldstrike on a 100% basis (including our 60% share of South Arturo) up until June 30, 2019, and the combined results of Carlin and Goldstrike (including our share of South Arturo) on a 61.5% basis thereafter. On September 7, 2021, Barrick announced NGM had entered into an Exchange Agreement with i-80 Gold to acquire the 40% interest in South Arturo that NGM did not already own in exchange for the Lone Tree and Buffalo Mountain properties and infrastructure. Operating results within our 61.5% interest in Carlin includes NGM’s 60% interest in South Arturo up until May 30, 2021, and 100% interest thereafter, reflecting the terms of the Exchange Agreement which closed on October 14, 2021.
b.On July 1, 2019, Cortez was contributed to Nevada Gold Mines, a joint venture with Newmont. As a result, the amounts presented are on a 100% basis up until June 30, 2019, and on a 61.5% basis thereafter. Starting in the first quarter of 2021, Goldrush is reported as part of Cortez as it is operated by Cortez management. Comparative periods have been restated to include Goldrush.
c.Barrick owned 75% of Turquoise Ridge through to the end of the second quarter of 2019, with our joint venture partner, Newmont, owning the remaining 25%. Turquoise Ridge was proportionately consolidated on the basis that the joint venture partners that have joint control have rights to the assets and obligations for the liabilities relating to the arrangement. The figures presented in this table are based on our 75% interest in Turquoise Ridge until June 30, 2019. On July 1, 2019, Barrick's 75% interest in Turquoise Ridge and Newmont's Twin Creeks and 25% interest in Turquoise Ridge were contributed to Nevada Gold Mines. Starting July 1, 2019, the results represent our 61.5% share of Turquoise Ridge and Twin Creeks, now referred to as Turquoise Ridge.
d.Represents the combined results of Cortez, Goldstrike (including our 60% share of South Arturo) and our 75% interest in Turquoise Ridge until June 30, 2019. Commencing July 1, 2019, the date Nevada Gold Mines was established, the results represent our 61.5% interest in Cortez, Carlin (including Goldstrike and NGM’s 60% interest in South Arturo up until May 30, 2021 and 100% interest thereafter), Turquoise Ridge (including Twin Creeks), Phoenix and Long Canyon.
e.Formerly part of Acacia Mining plc. On September 17, 2019, Barrick acquired all of the shares of Acacia it did not own. Operating results are included at 63.9% until September 30, 2019 (notwithstanding the completion of the Acacia transaction on September 17, 2019, we consolidated our interest in Acacia and recorded a non-controlling interest of 36.1% in the income statement for the entirety of the third quarter of 2019 as a matter of convenience), on a 100% basis from October 1, 2019, to December 31, 2019, and on an 84% basis thereafter as the GoT’s 16% free-carried interest was made effective from January 1, 2020.
|
|
|
|
|
|
|
|
|
| BARRICK YEAR-END 2021 |
119 |
MANAGEMENT’S DISCUSSION AND ANALYSIS |
Realized Price
Realized price is a non-GAAP financial measure which excludes from sales:
■Unrealized gains and losses on non-hedge derivative contracts;
■Unrealized mark-to-market gains and losses on provisional pricing from copper and gold sales contracts;
■Sales attributable to ore purchase arrangements;
■Treatment and refining charges; and
■Cumulative catch-up adjustment to revenue relating to our streaming arrangements.
This measure is intended to enable Management to better understand the price realized in each reporting period for gold and copper sales because unrealized mark-to-market values of non-hedge gold and copper derivatives are subject to change each period due to changes in market factors such as spot and forward gold and copper prices, so that prices ultimately realized may differ from those recorded. The exclusion of such unrealized mark-to-market gains and losses from the presentation of this performance measure enables investors to understand performance based on the realized proceeds of selling gold and copper production.
The gains and losses on non-hedge derivatives and receivable balances relate to instruments/balances that mature in future periods, at which time the gains and losses will become realized. The amounts of these gains and losses reflect fair values based on market valuation assumptions at the end of each period and do not necessarily represent the amounts that will become realized on maturity. We believe this provides investors and analysts with a more accurate measure with which to compare to market gold prices and to assess our gold sales performance. For those reasons, management believes that this measure provides a more accurate reflection of our Company’s past performance and is a better indicator of its expected performance in future periods.
The realized price measure is intended to provide additional information, and does not have any standardized definition under IFRS and should not be considered in isolation or as a substitute for measures of performance prepared in accordance with IFRS. The measure is not necessarily indicative of sales as determined under IFRS. Other companies may calculate this measure differently. The following table reconciles realized prices to the most directly comparable IFRS measure.
Reconciliation of Sales to Realized Price per ounce/pound
|
|
|
|
|
|
|
|
|
|
|
|
|
|
|
|
|
|
|
|
|
|
|
|
|
|
|
|
|
|
|
|
|
|
For the three months ended |
For the years ended |
| ($ millions, except per ounce/pound information in dollars) |
Gold |
Copper |
Gold |
Copper |
| |
12/31/21 |
9/30/21 |
12/31/21 |
9/30/21 |
12/31/21 |
12/31/20 |
12/31/19 |
12/31/21 |
12/31/20 |
12/31/19 |
| Sales |
2,977 |
|
2,531 |
|
263 |
|
209 |
|
10,738 |
|
11,670 |
|
9,186 |
|
962 |
|
697 |
|
393 |
|
| Sales applicable to non-controlling interests |
(931) |
|
(799) |
|
0 |
|
0 |
|
(3,323) |
|
(3,494) |
|
(1,981) |
|
0 |
|
0 |
|
0 |
|
Sales applicable to equity method investmentsa,b |
172 |
|
166 |
|
222 |
|
154 |
|
660 |
|
648 |
|
543 |
|
707 |
|
483 |
|
492 |
|
| Realized non-hedge gold/copper derivative gains |
0 |
|
0 |
|
0 |
|
0 |
|
0 |
|
0 |
|
1 |
|
0 |
|
0 |
|
0 |
|
Sales applicable to sites in care and maintenancec |
(8) |
|
(11) |
|
0 |
|
0 |
|
(88) |
|
(170) |
|
(140) |
|
0 |
|
0 |
|
0 |
|
| Treatment and refining charges |
1 |
|
9 |
|
39 |
|
42 |
|
10 |
|
7 |
|
0 |
|
161 |
|
157 |
|
99 |
|
|
|
|
|
|
|
|
|
|
|
|
Otherd |
2 |
|
0 |
|
0 |
|
0 |
|
2 |
|
13 |
|
22 |
|
0 |
|
0 |
|
0 |
|
| Revenues – as adjusted |
2,213 |
|
1,896 |
|
524 |
|
405 |
|
7,999 |
|
8,674 |
|
7,631 |
|
1,830 |
|
1,337 |
|
984 |
|
Ounces/pounds sold (000s ounces/millions pounds)c |
1,234 |
|
1,071 |
|
113 |
|
101 |
|
4,468 |
|
4,879 |
|
5,467 |
|
423 |
|
457 |
|
355 |
|
Realized gold/copper price per ounce/pounde |
1,793 |
|
1,771 |
|
4.63 |
|
3.98 |
|
1,790 |
|
1,778 |
|
1,396 |
|
4.32 |
|
2.92 |
|
2.77 |
|
a.Represents sales of $172 million and $661 million, respectively, for the three months and year ended December 31, 2021 (September 30, 2021: $166 million; 2020: $648 million; 2019: $505 million) applicable to our 45% equity method investment in Kibali and $nil and $nil, respectively (September 30, 2021: $nil; 2020: $nil; 2019: $39 million) applicable to our 40% equity method investment in Morila for gold. Represents sales of $119 million and $423 million, respectively, for the three months and year ended December 31, 2021 (September 30, 2021: $108 million; 2020: $298 million; 2019: $343 million) applicable to our 50% equity method investment in Zaldívar and $111 million and $305 million, respectively (September 30, 2021: $50 million; 2020: $204 million; 2019: $168 million) applicable to our 50% equity method investment in Jabal Sayid.
b.Sales applicable to equity method investments are net of treatment and refinement charges.
c.Figures exclude Pierina, Golden Sunlight starting in the third quarter of 2019, Morila starting in the third quarter of 2019 up until its divestiture in November 2020, Lagunas Norte starting in the fourth quarter of 2019, and Buzwagi starting in the fourth quarter of 2021 up until its divestiture in June 2021 from the calculation of realized price per ounce. Some of these assets are producing incidental ounces while in closure or care and maintenance.
d.Represents cumulative catch-up adjustment to revenue relating to our streaming arrangements. Refer to note 2f to the Financial Statements for more information.
e.Realized price per ounce/pound may not calculate based on amounts presented in this table due to rounding.
|
|
|
|
|
|
|
|
|
| BARRICK YEAR-END 2021 |
120 |
MANAGEMENT’S DISCUSSION AND ANALYSIS |
The scientific and technical information contained in this MD&A has been reviewed and approved by Craig Fiddes, SME-RM, Manager – Resource Modeling, Nevada Gold Mines; Chad Yuhasz, P.Geo, Mineral Resource Manager, Latin America & Asia Pacific; Simon Bottoms, CGeol, MGeol, FGS, FAusIMM, Mineral Resources Manager: Africa & Middle East; Rodney Quick, MSc, Pr. Sci.Nat, Mineral Resource Management and Evaluation Executive; John Steele, CIM, Metallurgy, Engineering and Capital Projects
Executive; and Rob Krcmarov, FAusIMM, Technical Advisor to Barrick – each a “Qualified Person” as defined in National Instrument 43-101 – Standards of Disclosure for Mineral Projects.
All mineral reserve and mineral resource estimates are estimated in accordance with National Instrument 43-101 – Standards of Disclosure for Mineral Projects. Unless otherwise noted, such mineral reserve and mineral resource estimates are as of December 31, 2021.
1A Tier One Gold Asset is an asset with a reserve potential to deliver a minimum 10-year life, annual production of at least 500,000 ounces of gold and total cash costs per ounce over the mine life that are in the lower half of the industry cost curve.
2A Tier Two Gold Asset is an asset with a reserve potential to deliver a minimum 10-year life, annual production of at least 250,000 ounces of gold and total cash costs per ounce over the mine life that are in the lower half of the industry cost curve.
3A Tier One Copper Asset is an asset with a reserve potential of greater than five million tonnes of contained copper and C1 cash costs per pound over the mine life that are in the lower half of the industry cost curve.
4A Strategic Asset is an asset which in the opinion of Barrick, has the potential to deliver significant unrealized value in the future.
5Currently consists of Barrick’s Lumwana mine and Zaldívar and Jabal Sayid copper joint ventures.
6Further information on these non-GAAP financial measures, including detailed reconciliations, is included on pages 94 to 120 of this MD&A. 7Gold cost of sales per ounce is calculated as cost of sales across our gold operations (excluding sites in closure or care and maintenance) divided by ounces sold (both on an attributable basis using Barrick’s ownership share). Copper cost of sales per pound is calculated as cost of sales across our copper operations divided by pounds sold (both on an attributable basis using Barrick’s ownership share).
8Total reportable incident frequency rate (“TRIFR”) is a ratio calculated as follows: number of reportable injuries x 1,000,000 hours divided by the total number of hours worked. Reportable injuries include fatalities, lost time injuries, restricted duty injuries, and medically treated injuries. Lost time injury frequency rate (“LTIFR”) is a ratio calculated as follows: number of lost time injuries x 1,000,000 hours divided by the total number of hours worked.
9Class 1 - High Significance is defined as an incident that causes significant negative impacts on human health or the environment or an incident that extends
onto publicly accessible land and has the potential to cause significant adverse impact to surrounding communities, livestock or wildlife.
10Preliminary figures and subject to external assurance.
11All mineral resource and mineral reserve estimates of tonnes, Au oz, Ag oz and Cu lb are reported to the second significant digit. All measured and indicated mineral resource estimates of grade and all proven and probable mineral reserve estimates of grade for Au g/t, Ag g/t and Cu % are reported to two decimal places. All inferred mineral resource estimates of grade for Au g/t, Ag g/t and Cu % are reported to one decimal place. 2021 polymetallic mineral resources and mineral reserves are estimated using the combined value of gold, copper & silver and accordingly are reported as Gold, Copper & Silver mineral resources and mineral reserves.
12Estimated in accordance with National Instrument 43-101 - Standards of Disclosure for Mineral Projects as required by Canadian securities regulatory authorities. Estimates are as of December 31, 2021, unless otherwise noted. Proven reserves of 240 tonnes grading 2.20 g/t, representing 17 million ounces of gold, and 380 million tonnes grading 0.41%, representing 3,400 million pounds of copper. Probable reserves of 1,000 tonnes grading 1.60 g/t, representing 53 million ounces of gold, and 1,100 million tonnes grading 0.37%, representing 8,800 million pounds of copper. Measured resources of 490 tonnes grading 2.05 g/t, representing 32 million ounces of gold, and 680 million tonnes grading 0.38%, representing 5,700 million pounds of copper. Indicated resources of 2,800 tonnes grading 1.40 g/t, representing 130 million ounces of gold, and 2,500 million tonnes grading 0.34%, representing 19,000 million pounds of copper. Inferred resources of 1,000 tonnes grading 1.3 g/t, representing 42 million ounces of gold, and 450 million tonnes grading 0.2%, representing 2,100 million pounds of copper. Complete mineral reserve and mineral resource data for all mines and projects referenced in this MD&A, including tonnes, grades, and ounces, can be found on pages 129-137 of Barrick’s Fourth Quarter and Year-End 2021 Report.
|
|
|
|
|
|
|
|
|
| BARRICK YEAR-END 2021 |
121 |
MANAGEMENT’S DISCUSSION AND ANALYSIS |
13Estimated in accordance with National Instrument 43-101 - Standards of Disclosure for Mineral Projects as required by Canadian securities regulatory authorities. Estimates are as of December 31, 2020, unless otherwise noted. Proven reserves of 280 million tonnes grading 2.37 g/t, representing 21 million ounces of gold, and 350 million tonnes grading 0.39%, representing 3,000 million pounds of copper. Probable reserves of 990 million tonnes grading 1.46 g/t, representing 47 million ounces of gold, and 1,100 million tonnes grading 0.39%, representing 9,700 million pounds of copper. Measured resources of 530 million tonnes grading 2.11 g/t, representing 36 million ounces of gold, and 600 million tonnes grading 0.36%, representing 4,800 million pounds of copper. Indicated resources of 2,800 million tonnes grading 1.41 g/t, representing 130 million ounces of gold, and 2,500 million tonnes grading 0.36%, representing 20,000 million pounds of copper. Inferred resources of 980 million tonnes grading 1.4 g/t, representing 43 million ounces of
gold, and 440 million tonnes grading 0.2%, representing 2,200 million pounds of copper. Complete 2020 mineral reserve and mineral resource data for all mines and projects referenced in this MD&A, including tonnes, grades, and ounces, can be found on pages 34-47 of Barrick’s Annual Information Form/Form 40-F for the year ended December 31, 2020 on file with Canadian provincial securities regulatory authorities and the U.S. Securities and Exchange Commission.
14See the Technical Report on the Turquoise Ridge mine, dated March 25, 2020, and filed on SEDAR at www.sedar.com and EDGAR at www.sec.gov on March 25, 2020.
15See the Technical Report on the Pueblo Viejo mine, Sanchez Ramirez Province, Dominican Republic, dated March 19, 2018, and filed on SEDAR at www.sedar.com and EDGAR at www.sec.gov on March 23, 2018.
16North Leeville Significant Interceptsa
|
|
|
|
|
|
|
|
|
|
|
|
|
|
|
|
|
|
| Drill Results from Q4 2021 |
Drill Holeb |
Azimuth |
Dip |
Interval (m) |
Width (m)c |
Au (g/t) |
| NLX-00009 |
23 |
(79) |
822.3 - 833.9 |
11.6 |
12.00 |
| NLX-00010 |
117 |
(72) |
791.6 - 848.3 |
56.7 |
28.39 |
|
|
|
826.9 - 831.2 |
4.3 |
8.88 |
| NLX-00012 |
305 |
-79 |
837.3 - 845.1 |
7.8 |
26.03 |
| CGX-21086 |
90 |
-81 |
773.6 - 778.8 |
5.2 |
24.50 |
|
|
|
|
|
|
a.All intercepts calculated using a 3.4 g/t Au cutoff and are uncapped; minimum intercept width is 3.0 m; internal dilution is less than 20% total width.
b.Carlin Trend drill hole nomenclature: Project area (NLX - North Leeville, CGX - Leeville) followed by hole number.
c.True widths of intercepts are uncertain at this stage.
The drilling results for the Carlin Trend contained in this MD&A have been prepared in accordance with National Instrument 43-101 – Standards of Disclosure for Mineral Projects. All drill hole assay information has been manually reviewed and approved by staff geologists and re-checked by the project manager. Sample preparation and analyses are conducted by an independent laboratory, ALS Minerals. Procedures are employed to ensure security of samples during their delivery from the drill rig to the laboratory. The quality assurance procedures, data verification and assay protocols used in connection with drilling and sampling on North Leeville conform to industry accepted quality control methods.
17 REN Significant Interceptsa
|
|
|
|
|
|
|
|
|
|
|
|
|
|
|
|
|
|
|
|
|
| Drill Results from Q4 2021 |
Drill Holeb |
Azimuth |
Dip |
Interval (m) |
Width (m)c |
True Width (m)c |
Au (g/t) |
|
|
|
273.7 - 313.9 |
40.2 |
15.8 |
27.6 |
| MRC-21001 |
301 |
(28) |
329.2 - 341.4 |
12.2 |
12.9 |
13.78 |
|
|
|
235 - 260.3 |
25.3 |
15.9 |
16.94 |
|
|
|
266.9 - 276.1 |
9.3 |
13.1 |
24.75 |
| MRC-21010 |
239 |
(22) |
299.6 - 307.2 |
7.6 |
9.1 |
5.11 |
|
|
|
347.5 - 351.7 |
4.3 |
9.1 |
5.25 |
| MRC-21011 |
262 |
(27) |
413.9 - 430.7 |
16.8 |
12.2 |
7.03 |
| MRC-21014 |
80 |
(29) |
286.8 - 298.1 |
11.3 |
7.6 |
17.49 |
|
96 |
(20) |
242.2 - 258.8 |
16.6 |
12.2 |
9.63 |
| MRC-21015 |
80 |
(20) |
274 - 293.5 |
19.5 |
14.0 |
5.25 |
a.All intercepts calculated using a 3.4 g/t Au cutoff and are uncapped; minimum intercept width is 3.0 m; internal dilution is less than 20% total width.
b.Carlin Trend drill hole nomenclature: Project area (MRC - Ren) followed by hole number.
c.True widths of intercepts are uncertain at this stage.
|
|
|
|
|
|
|
|
|
| BARRICK YEAR-END 2021 |
122 |
MANAGEMENT’S DISCUSSION AND ANALYSIS |
The drilling results for REN contained in this MD&A have been prepared in accordance with National Instrument 43-101 – Standards of Disclosure for Mineral Projects. All drill hole assay information has been manually reviewed and approved by staff geologists and re-checked by the project manager. Sample preparation and analyses are conducted by an independent laboratory, ALS Minerals. Procedures are employed to ensure security of samples during their delivery from the drill rig to the laboratory. The quality assurance procedures, data verification and assay protocols used in connection with drilling and sampling on REN conform to industry accepted quality control methods.
18 CHUG Hanson Footwall Significant Interceptsa
|
|
|
|
|
|
|
|
|
|
|
|
|
|
|
|
|
|
| Drill Results from Q4 2021 |
Drill Holeb |
Azimuth |
Dip |
Interval (m) |
Width (m)c |
Au (g/t) |
|
|
|
479.6 - 499.5 |
16.9 |
11.24 |
| CMX-21012 |
217 |
42 |
564.4 - 577 |
No Significant Interceptd |
| CMX-21008 |
093 |
55 |
No Significant Interceptd |
| CMX-21025 |
228 |
47 |
584.4 - 608.1 |
22.6 |
23.07 |
|
|
|
|
|
|
|
|
|
|
|
|
|
|
|
|
|
|
a.All intercepts calculated using a 4.2 g/t Au cutoff and are uncapped; minimum intercept width is 2.5 m; internal dilution is less than 20% total width.
b.Cortez drill hole nomenclature: Project (CMX - CHUG Minex) followed by the year (21 for 2021) then hole number.
c.True widths of intercepts are uncertain at this stage.
d.Sub-grade intercepts in drillhole CMX-21012 of 12.6 m at 2.59 g/t and CMX-21008 of 5.2 m at 2.75 g/t and 5.1 m at 1.91 g/t using a 1.0 g/t cutoff uncapped; minimum intercept width is 2.5 m; internal dilution is less than 20% total width, have been listed in previous reports for the purpose of showing the presence of the mineral system.
The drilling results for Cortez contained in this MD&A have been prepared in accordance with National Instrument 43-101 – Standards of Disclosure for Mineral Projects. All drill hole assay information has been manually reviewed and approved by staff geologists and re-checked by the project manager. Sample preparation and analyses are conducted by an independent laboratory, ALS Minerals. Procedures are employed to ensure security of samples during their delivery from the drill rig to the laboratory. The quality assurance procedures, data verification and assay protocols used in connection with drilling and sampling at Cortez conform to industry accepted quality control methods.
19 Loulo-Gounkoto Significant Interceptsa
|
|
|
|
|
|
|
|
|
|
|
|
|
|
|
|
|
|
|
|
|
|
|
|
|
|
|
| Drill Results from Q4 2021 |
|
|
|
|
|
|
|
|
|
Includingd |
Drill Holeb |
Azimuth |
Dip |
Interval (m) |
Width (m)c |
Au (g/t) |
Interval (m) |
Width (m)c |
Au (g/t) |
|
|
|
336.8-340 |
3.20 |
15.53 |
|
|
|
|
|
|
346.03-348.67 |
2.64 |
1.30 |
|
|
|
| YRDH024 |
229.26 |
(56.48) |
371.65-377.45 |
5.80 |
0.76 |
|
|
|
|
|
|
131.1-138.5 |
7.40 |
6.03 |
|
|
|
|
|
|
139.1-141.7 |
2.60 |
6.64 |
|
|
|
| YRDH027 |
230.26 |
(56.16) |
156.5-162.4 |
5.90 |
2.89 |
|
|
|
|
|
|
296.8-299.9 |
3.10 |
0.77 |
|
|
|
| YRDH029 |
225.00 |
(55.00) |
300.9-303.45 |
2.55 |
2.41 |
|
|
|
|
|
|
312.7-315.15 |
2.45 |
0.64 |
|
|
|
| YRDH030 |
225.00 |
(55.00) |
320.5-324.8 |
4.30 |
0.92 |
|
|
|
|
|
|
312-324.4 |
12.40 |
3.33 |
|
|
|
|
|
|
337.17-342.4 |
5.23 |
9.54 |
|
|
|
| YRDH031 |
230.00 |
(55.00) |
343.2-345.6 |
2.40 |
1.72 |
|
|
|
|
|
|
27-30 |
3.00 |
3.05 |
|
|
|
| YRAC0015 |
270.00 |
(60.00) |
42-48 |
6.00 |
2.89 |
42-44 |
2.00 |
7.36 |
| YRAC0017 |
270.00 |
(60.00) |
13-18 |
5.00 |
0.52 |
|
|
|
|
|
|
57-59 |
2.00 |
0.69 |
|
|
|
| YRAC0029 |
270.00 |
(60.00) |
63-66 |
3.00 |
1.02 |
|
|
|
|
|
|
2-13 |
11.00 |
0.96 |
|
|
|
| YRAC0030 |
270.00 |
(60.00) |
15-22 |
7.00 |
1.26 |
|
|
|
| YRAC0031 |
270.00 |
(60.00) |
7-10 |
3.00 |
0.58 |
|
|
|
| YRAC0045 |
270.00 |
(60.00) |
30-32 |
2.00 |
1.21 |
|
|
|
| YRAC0047 |
270.00 |
(60.00) |
13-15 |
2.00 |
1.94 |
|
|
|
| YRAC0048 |
270.00 |
(60.00) |
27-35 |
8.00 |
3.57 |
28-32 |
4.00 |
5.77 |
|
|
|
|
|
|
|
|
|
| BARRICK YEAR-END 2021 |
123 |
MANAGEMENT’S DISCUSSION AND ANALYSIS |
a.All intercepts calculated using a 0.5 g/t Au cutoff and are uncapped; minimum intercept width is 2 m; internal dilution is equal to or less than 2 m total width.
b.Loulo – Gounkoto drill hole nomenclature: prospect initial YR (Yalea Ridge and Sansamba West), followed by type of drilling AC (Air Core), RC (Reverse Circulation), DH (Diamond Drilling) RCDH (RC/Diamond Tail).
c.True widths uncertain at this stage.
d.All intercepts calculated using a 3.0 g/t Au cutoff and are uncapped; minimum intercept width is 2 m; internal dilution is equal to or less than 2 m total width.
The drilling results for the Loulo-Gounkoto property contained in this MD&A have been prepared in accordance with National Instrument 43-101 – Standards of Disclosure for Mineral Projects. All drill hole assay information has been manually reviewed and approved by staff geologists and re-checked by the project manager. Sample preparation and analyses are conducted by SGS Laboratories, an independent laboratory. Industry accepted best practices for preparation and fire assaying procedures are utilized to determine gold content. Procedures are employed to ensure security of samples during their delivery from the drill rig to the laboratory. The quality assurance procedures, data verification and assay protocols used in connection with drilling and sampling on the Loulo property conform to industry accepted quality control methods.
20 Nielle Significant Interceptsa
|
|
|
|
|
|
|
|
|
|
|
|
|
|
|
|
|
|
| Drill Results from Q4 2021 |
Drill Holeb |
Azimuth |
Dip |
Interval (m) |
Width (m)c |
Au (g/t) |
|
|
|
144.00-146.00 |
2.00 |
2.90 |
|
|
|
169.00-175.00 |
6.00 |
1.43 |
|
|
|
183.00-186.00 |
3.00 |
1.15 |
|
|
|
213.00-215.00 |
2.00 |
2.63 |
|
|
|
219.00-223.00 |
4.00 |
1.29 |
| SNRC052 |
119 |
(51) |
225.00-233.00 |
8.00 |
4.52 |
|
|
|
140.00-142.00 |
2.00 |
1.01 |
|
|
|
188.00-205.00 |
17.00 |
2.87 |
|
|
|
208.00-210.00 |
2.00 |
2.07 |
| SNRC053 |
117 |
(53) |
219.00-222.00 |
3.00 |
11.77 |
|
|
|
254.00-262.00 |
8.00 |
1.91 |
|
|
|
263.00-274.70 |
11.70 |
5.17 |
|
|
|
277.26-284.00 |
6.74 |
2.11 |
|
|
|
286.40-293.08 |
6.68 |
5.20 |
|
|
|
372.00-374.00 |
2.00 |
0.56 |
| SNRCDH001 |
121 |
(50) |
384.50-387.20 |
2.70 |
1.54 |
|
|
|
202.00-206.00 |
4.00 |
2.29 |
| SNRCDH002 |
115 |
(52) |
225.00-228.00 |
3.00 |
1.31 |
|
|
|
198.00-200.00 |
2.00 |
0.90 |
|
|
|
208.00-210.00 |
2.00 |
2.69 |
|
|
|
222.00-225.00 |
3.00 |
0.75 |
| SNRCDH003 |
117 |
(50) |
236.00-240.00 |
4.00 |
0.92 |
| SNRCDH004 |
120 |
(54) |
350.07-366.20 |
16.13 |
2.32 |
| SNRCDH005 |
120 |
(53) |
346.80-349.95 |
3.15 |
2.96 |
|
|
|
286.80-291.32 |
4.52 |
1.36 |
| SNRCDH006 |
114 |
(58) |
296.18-300.96 |
4.78 |
2.20 |
|
|
|
303.00-306.00 |
3.00 |
0.88 |
|
|
|
311.00-314.00 |
3.00 |
2.16 |
|
|
|
317.70-323.00 |
5.30 |
2.20 |
| SNRCDH007 |
117 |
(53) |
328.85-332.90 |
4.05 |
1.49 |
|
|
|
294.00-300.10 |
6.10 |
0.87 |
|
|
|
317.35-322.55 |
5.20 |
4.30 |
| SNRCDH008 |
298 |
(53) |
324.40-331.00 |
6.60 |
1.60 |
|
|
|
335.37-338.61 |
3.24 |
1.56 |
|
|
|
355.90-361.90 |
6.00 |
4.79 |
| SNRCDH009 |
300 |
(53) |
387.10-390.80 |
3.70 |
1.65 |
|
|
|
38.00-42.00 |
4.00 |
8.24 |
|
|
|
43.00-48.00 |
5.00 |
1.25 |
| SNRC057 |
117 |
(50) |
52.00-54.00 |
2.00 |
0.58 |
|
|
|
|
|
|
|
|
|
| BARRICK YEAR-END 2021 |
124 |
MANAGEMENT’S DISCUSSION AND ANALYSIS |
|
|
|
|
|
|
|
|
|
|
|
|
|
|
|
|
|
|
|
|
|
189.00-191.00 |
2.00 |
0.50 |
|
|
|
207.00-209.00 |
2.00 |
0.59 |
| SNRC060 |
120 |
(51) |
217.00-230.00 |
13.00 |
2.08 |
|
|
|
50.00-64.00 |
14.00 |
12.01 |
| SNRC103 |
119 |
(49) |
66.00-68.00 |
2.00 |
1.19 |
|
|
|
90.00-102.00 |
12.00 |
1.95 |
| SNRC105 |
125 |
(49) |
109.00-120.00 |
11.00 |
10.47 |
|
|
|
26.00-61.00 |
35.00 |
8.99 |
|
|
|
65.00-69.00 |
4.00 |
1.32 |
| SNRC106 |
115 |
(52) |
74.00-76.00 |
2.00 |
0.53 |
|
|
|
0.00-5.00 |
5.00 |
21.46 |
| SNRC108 |
120 |
(50) |
9.00-12.00 |
3.00 |
0.93 |
| SNRC114 |
128 |
(53) |
73.00-76.00 |
3.00 |
6.62 |
| SNRC115 |
126 |
(51) |
29.00-38.00 |
9.00 |
2.60 |
| SNRC118 |
119 |
(54) |
115.00-122.00 |
7.00 |
4.94 |
|
|
|
73.00-76.00 |
3.00 |
0.70 |
| SNRC119 |
114 |
(51) |
85.00-90.00 |
5.00 |
12.54 |
|
|
|
43.00-51.00 |
8.00 |
3.39 |
| SNRC120 |
126 |
(47) |
67.00-69.00 |
2.00 |
0.96 |
|
|
|
117.00-122.00 |
5.00 |
1.08 |
| SNRC122 |
118 |
(48) |
123.00-132.00 |
9.00 |
4.20 |
|
|
|
88.00-90.00 |
2.00 |
1.28 |
| SNRC123 |
117 |
(50) |
96.00-106.00 |
10.00 |
6.23 |
|
|
|
8.00-11.00 |
3.00 |
4.44 |
|
|
|
14.00-25.00 |
11.00 |
7.22 |
| SNRC125 |
120 |
(50) |
26.00-28.00 |
2.00 |
0.99 |
|
|
|
91.00-106.00 |
15.00 |
1.92 |
| SNRC127 |
125 |
(51) |
107.00-117.00 |
10.00 |
5.37 |
|
|
|
56.00-58.00 |
2.00 |
1.67 |
| SNRC128 |
123 |
(51) |
61.00-84.00 |
23.00 |
7.03 |
| SNRC129 |
120 |
(50) |
21.00-33.00 |
12.00 |
4.53 |
|
|
|
73.00-78.00 |
5.00 |
2.09 |
|
|
|
83.00-85.00 |
2.00 |
1.51 |
|
|
|
91.00-93.00 |
2.00 |
0.90 |
| SNRC131 |
120 |
(52) |
95.00-115.00 |
20.00 |
4.59 |
|
|
|
8.00-10.00 |
2.00 |
1.04 |
|
|
|
36.00-38.00 |
2.00 |
0.58 |
| SNRC132 |
120 |
(50) |
40.00-68.00 |
28.00 |
6.24 |
| SNRC133 |
120 |
(50) |
6.00-20.00 |
14.00 |
3.59 |
| SNRC134 |
125 |
(51) |
161.00-176.00 |
15.00 |
5.91 |
|
|
|
93.00-102.00 |
9.00 |
2.22 |
|
|
|
104.00-109.00 |
5.00 |
2.97 |
|
|
|
120.00-124.00 |
4.00 |
0.93 |
| SNRC135 |
125 |
(49) |
126.00-137.00 |
11.00 |
1.98 |
|
|
|
65.00-72.00 |
7.00 |
3.04 |
|
|
|
79.00-91.00 |
12.00 |
12.80 |
|
|
|
94.00-96.00 |
2.00 |
0.79 |
| SNRC136 |
121 |
(53) |
101.00-114.00 |
13.00 |
7.91 |
|
|
|
25.00-27.00 |
2.00 |
6.50 |
|
|
|
38.00-41.00 |
3.00 |
3.59 |
|
|
|
43.00-45.00 |
2.00 |
20.75 |
|
|
|
54.00-66.00 |
12.00 |
3.00 |
| SNRC137 |
122 |
(51) |
68.00-70.00 |
2.00 |
0.58 |
| SNRC138 |
120 |
(50) |
17.00-22.00 |
5.00 |
1.76 |
| SNRC139 |
123 |
(50) |
179.00-182.00 |
3.00 |
1.08 |
|
|
|
|
|
|
|
|
|
| BARRICK YEAR-END 2021 |
125 |
MANAGEMENT’S DISCUSSION AND ANALYSIS |
|
|
|
|
|
|
|
|
|
|
|
|
|
|
|
|
|
|
| SNRC158 |
120 |
(50) |
52.00-57.00 |
5.00 |
4.42 |
| SNRC160 |
121 |
(51) |
48.00-51.00 |
3.00 |
3.26 |
|
|
|
50.00-57.00 |
7.00 |
1.04 |
|
|
|
60.00-63.00 |
3.00 |
3.64 |
|
|
|
66.00-70.00 |
4.00 |
2.37 |
|
|
|
74.00-80.00 |
6.00 |
2.87 |
| SNRC161 |
131 |
(50) |
83.00-101.00 |
18.00 |
8.91 |
| SNRC162 |
120 |
(50) |
8.00-18.00 |
10.00 |
4.84 |
| SNRC164 |
120 |
(50) |
25.00-28.00 |
3.00 |
1.31 |
|
|
|
275.42-284.00 |
8.58 |
0.79 |
|
|
|
321.10-332.00 |
10.90 |
2.27 |
|
|
|
338.00-343.00 |
5.00 |
1.23 |
| SNDDH003A |
295 |
(52) |
351.10-354.20 |
3.10 |
2.29 |
|
|
|
138.00-140.00 |
2.00 |
2.23 |
|
|
|
148.00-152.00 |
4.00 |
2.07 |
|
|
|
164.00-166.00 |
2.00 |
2.46 |
|
|
|
177.00-179.00 |
2.00 |
1.69 |
| SNRC073A |
121 |
(50) |
190.00-203.00 |
13.00 |
4.06 |
| KORAC001 |
120 |
(50) |
87.00-92.00 |
5.00 |
0.69 |
| KORAC002 |
120 |
(50) |
12.00-23.00 |
11.00 |
0.88 |
| KORAC009 |
120 |
(50) |
50.00-60.00 |
10.00 |
0.96 |
| KORAC021 |
120 |
(50) |
29.00-32.00 |
3.00 |
1.22 |
|
|
|
41.00-48.00 |
7.00 |
1.05 |
| KORAC022 |
120 |
(50) |
51.00-66.00 |
15.00 |
3.54 |
a.All intercepts calculated using a 0.5 g/t Au cutoff and are uncapped; minimum intercept width is 2 m; internal dilution is equal to or less than 2 m width.
b.Nielle drill hole nomenclature: prospect initial SN (Seydou North), KOR (Koro), followed by type of drilling RC (Reverse Circulation), DDH (Diamond Drilling), RCDH (RC pre-collar with Diamond Tail), or AC (Air Core).
c.True widths are uncertain at this stage.
The drilling results for the Nielle property contained in this MD&A have been prepared in accordance with National Instrument 43-101 – Standards of Disclosure for Mineral Projects. All drill hole assay information has been manually reviewed and approved by staff geologists and re-checked by the project manager. Sample preparation and analyses are conducted by SGS, an independent laboratory. Procedures are employed to ensure security of samples during their delivery from the drill rig to the laboratory. The quality assurance procedures, data verification and assay protocols used in connection with drilling and sampling on the Nielle property conform to industry accepted quality control methods.
21 Kibali Significant Interceptsa
|
|
|
|
|
|
|
|
|
|
|
|
|
|
|
|
|
|
|
|
|
|
|
|
|
|
|
| Drill Results from Q4 2021 |
|
|
|
|
|
|
Includingd |
Drill Holeb |
Azimuth |
Dip |
Interval (m) |
Width (m)c |
Au (g/t) |
Interval (m) |
Width (m) |
Au (g/t) |
| KPRC0001 |
290 |
(60) |
100.00-104.00 |
4.00 |
3.80 |
101.00 - 102.00 |
1.00 |
6.27 |
| KPRC0002 |
290 |
(60) |
26.00-30.00 |
4.00 |
0.83 |
|
|
|
|
|
|
|
|
|
|
|
|
|
|
|
|
|
|
|
|
|
|
|
|
|
|
|
|
|
|
|
|
|
|
|
|
|
|
|
|
|
|
|
|
|
|
|
|
|
|
|
|
|
|
|
|
|
|
|
|
|
|
|
|
|
|
|
|
|
|
|
|
|
|
|
|
|
|
|
|
|
|
|
|
|
|
|
|
|
|
|
|
|
|
|
|
|
|
|
|
|
|
|
|
|
|
|
|
|
|
|
|
|
|
|
|
|
|
|
|
|
|
|
|
|
|
|
|
|
|
|
|
|
|
|
|
|
|
|
|
|
|
|
|
|
|
|
a.All intercepts calculated using a 0.5 g/t Au cutoff and are uncapped; minimum intercept width is 2 m; internal dilution is equal to or less than 25% total width.
b.Kibali drill hole nomenclature: prospect initial KP (Kolapi) followed by type of drilling RC (Reverse Circulation) with no designation of the year.
c.True width of intercepts uncertain at this stage.
d.All including intercepts, calculated using a 0.5 g/t Au cutoff and are uncapped, minimum intercept width is 1m, no internal dilution, with grade significantly above (>40%) the overall intercept grade.
The drilling results for the Kibali property contained in this MD&A have been prepared in accordance with National Instrument 43-101 – Standards of Disclosure for Mineral Projects. All drill hole assay information has been manually reviewed and approved by staff geologists and re-checked by the project manager. Sample preparation and analyses are conducted by SGS, an independent laboratory. Procedures are employed to ensure security of samples during their delivery from the drill rig to the laboratory. The quality assurance procedures, data verification and assay protocols used in connection with drilling and sampling on the Kibali property conform to industry accepted quality control methods.
|
|
|
|
|
|
|
|
|
| BARRICK YEAR-END 2021 |
126 |
MANAGEMENT’S DISCUSSION AND ANALYSIS |
22 Jabal Sayid Significant Interceptsa
|
|
|
|
|
|
|
|
|
|
|
|
|
|
|
|
|
|
|
|
|
| Drill Results from Q4 2021 |
|
|
|
|
|
|
|
Drill Holeb |
Azimuth |
Dip |
Interval (m) |
Width (m)c |
Cu (%) |
|
|
|
| BDH1153 |
273 |
(75) |
375.20-510.90 |
135.70 |
1.93 |
|
|
|
| BDH4084 |
21 |
(52) |
5.00-11.00 |
6.00 |
0.78 |
|
|
|
|
|
|
|
|
|
|
|
|
|
|
|
|
|
|
|
|
|
|
|
|
|
|
|
|
|
|
|
|
|
|
|
|
|
|
|
|
|
|
|
|
|
|
|
|
|
|
|
|
|
|
|
|
|
|
|
|
|
|
|
|
|
|
|
|
|
|
|
|
|
|
|
|
|
|
|
|
|
|
|
|
a.All intercepts calculated using a 0.5% Cu cutoff and are uncapped; minimum intercept width is 2 m; internal dilution is equal to or less than 5 m total width.
b.Jabal Sayid drill hole nomenclature: BDH (surface diamond hole) followed by lode and hole number.
c.True widths uncertain at this stage.
The drilling results for the Jabal Sayid property contained in this MD&A have been prepared in accordance with National Instrument 43-101 – Standards of Disclosure for Mineral Projects. All drill hole assay information has been manually reviewed and approved by staff geologists and re-checked by the project manager. Sample preparation and analyses are conducted by ALS Jeddah, an independent laboratory. Procedures are employed to ensure security of samples during their delivery from the drill rig to the laboratory. The quality assurance procedures, data verification and assay protocols used in connection with drilling and sampling on the Jabal Sayid property conform to industry accepted quality control methods.
|
|
|
|
|
|
|
|
|
| BARRICK YEAR-END 2021 |
127 |
MANAGEMENT’S DISCUSSION AND ANALYSIS |
Glossary of Technical Terms
ALL-IN SUSTAINING COSTS: A non-GAAP measure of cost per ounce/pound for gold/copper. Refer to page 96 of this MD&A for further information and a reconciliation of the measure. AUTOCLAVE: Oxidation process in which high temperatures and pressures are applied to convert refractory sulfide mineralization into amenable oxide ore.
BY-PRODUCT: A secondary metal or mineral product recovered in the milling process such as silver.
C1 CASH COSTS: A non-GAAP measure of cost per pound for copper. Refer to page 116 of this MD&A for further information and a reconciliation of the measure. CONCENTRATE: A very fine, powder-like product containing the valuable ore mineral from which most of the waste mineral has been eliminated.
CONTAINED OUNCES: Represents ounces in the ground before loss of ounces not able to be recovered by the applicable metallurgical processing process.
DEVELOPMENT: Work carried out for the purpose of gaining access to an ore body. In an underground mine, this includes shaft sinking, crosscutting, drifting and raising. In an open-pit mine, development includes the removal of overburden (more commonly referred to as stripping in an open pit).
DILUTION: The effect of waste or low-grade ore which is unavoidably extracted and comingled with the ore mined thereby lowering the recovered grade from what was planned to be mined.
DORÉ: Unrefined gold and silver bullion bars usually consisting of approximately 90 percent precious metals that will be further refined to almost pure metal.
DRILLING:
Core: drilling with a hollow bit with a diamond cutting rim to produce a cylindrical core that is used for geological study and assays.
Reverse circulation: drilling that uses a rotating cutting bit within a double-walled drill pipe and produces rock chips rather than core. Air or water is circulated down to the bit between the inner and outer wall of the drill pipe. The chips are forced to the surface through the center of the drill pipe and are collected, examined and assayed.
In-fill: drilling closer spaced holes in between existing holes, used to provide greater geological detail and to help upgrade resource estimates to reserve estimates.
Step-out: drilling to intersect a mineralized horizon or structure along strike or down-dip.
EXPLORATION: Prospecting, sampling, mapping, drilling and other work involved in searching for minerals.
FREE CASH FLOW: A non-GAAP measure that reflects our ability to generate cash flow. Refer to page 95 of this MD&A for a definition. GRADE: The amount of metal in each tonne of ore, expressed as grams per tonne (g/t) for precious metals and as a percentage for most other metals.
Cut-off grade: the minimum metal grade at which an ore body can be economically mined (used in the calculation of ore reserves).
Mill-head grade: metal content per tonne of ore going into a mill for processing.
Reserve grade: estimated metal content of an ore body, based on reserve calculations.
HEAP LEACHING: A process whereby gold/copper is extracted by “heaping” broken ore on sloping impermeable pads and continually applying to the heaps a weak cyanide solution/sulfuric acid which dissolves the contained gold/copper. The gold/copper-laden solution is then collected for gold/copper recovery.
HEAP LEACH PAD: A large impermeable foundation or pad used as a base for stacking ore for the purpose of heap leaching.
MILL: A processing facility where ore is finely ground and thereafter undergoes physical or chemical treatment to extract the valuable metals.
MINERAL RESERVE: See pages 129 to 137 – Summary Gold/Copper Mineral Reserves and Mineral Resources. MINERAL RESOURCE: See pages 129 to 137 – Summary Gold/Copper Mineral Reserves and Mineral Resources. OPEN PIT: A mine where the minerals are mined entirely from the surface.
ORE: Rock, generally containing metallic or non-metallic minerals, which can be mined and processed at a profit.
ORE BODY: A sufficiently large amount of ore that can be mined economically.
OUNCES: Troy ounce is a unit of measure used for weighing gold at 999.9 parts per thousand purity and is equivalent to 31.1035g.
RECLAMATION: The process by which lands disturbed as a result of mining activity are modified to support future beneficial land use. Reclamation activity may include the removal of buildings, equipment, machinery and other physical remnants of mining, closure of tailings storage facilities, leach pads and other mine features, and contouring, covering and re-vegetation of waste rock dumps and other disturbed areas.
RECOVERY RATE: A term used in process metallurgy to indicate the proportion of valuable material physically recovered in the processing of ore. It is generally stated as a percentage of the valuable material recovered compared to the total material originally contained in the ore.
REFINING: The final stage of metal production in which impurities are removed through heating to extract the pure metal.
ROASTING: The treatment of sulfide ore by heat and air, or oxygen enriched air, in order to oxidize sulfides and remove other elements (carbon, antimony or arsenic).
STRIPPING: Removal of overburden or waste rock overlying an ore body in preparation for mining by open-pit methods.
TAILINGS: The material that remains after all economically and technically recoverable precious metals have been removed from the ore during processing.
TOTAL CASH COSTS: A non-GAAP measure of cost per ounce for gold. Refer to page 96 of this MD&A for further information and a reconciliation of the measure.
|
|
|
|
|
|
|
|
|
| BARRICK YEAR-END 2021 |
128 |
MANAGEMENT’S DISCUSSION AND ANALYSIS |
Mineral Reserves and Mineral Resources
The tables on the next seven pages set forth Barrick’s interest in the total proven and probable gold, silver and copper reserves and in the total measured, indicated and inferred gold, silver and copper resources and certain related information at each property. For further details of proven and probable mineral reserves and measured, indicated and inferred mineral resources by category, metal and property, see pages 130 to 137. The Company has carefully prepared and verified the mineral reserve and mineral resource figures and believes that its method of estimating mineral reserves has been verified by mining experience. These figures are estimates, however, and no assurance can be given that the indicated quantities of metal will be produced. Metal price fluctuations may render mineral reserves containing relatively lower grades of mineralization uneconomic. Moreover, short-term operating factors relating to the mineral reserves, such as the need for orderly development of ore bodies or the processing of new or different ore grades, could affect the Company’s profitability in any particular accounting period.
Definitions
A mineral resource is a concentration or occurrence of diamonds, natural solid inorganic material, or natural solid fossilized organic material including base and precious metals, coal, and industrial minerals in or on the Earth’s crust in such form and quantity and of such a grade or quality that it has reasonable prospects for economic extraction. The location, quantity, grade, geological characteristics and continuity of a mineral resource are known, estimated or interpreted from specific geological evidence and knowledge. Mineral resources are sub-divided, in order of increasing geological confidence, into inferred, indicated and measured categories.
An inferred mineral resource is that part of a mineral resource for which quantity and grade or quality can be estimated on the basis of geological evidence and limited sampling and reasonably assumed, but not verified, geological and grade continuity. The estimate is based on limited information and sampling gathered through appropriate techniques from locations such as outcrops, trenches, pits, workings and drill holes.
An indicated mineral resource is that part of a mineral resource for which quantity, grade or quality, densities, shape and physical characteristics can be estimated with a level of confidence sufficient to allow the appropriate application of technical and economic
parameters, to support mine planning and evaluation of the economic viability of the deposit. The estimate is based on detailed and reliable exploration and testing information gathered through appropriate techniques from locations such as outcrops, trenches, pits, workings and drill holes that are spaced closely enough for geological and grade continuity to be reasonably assumed.
A measured mineral resource is that part of a mineral resource for which quantity, grade or quality, densities, shape and physical characteristics are so well established that they can be estimated with confidence sufficient to allow the appropriate application of technical and economic parameters, to support production planning and evaluation of the economic viability of the deposit. The estimate is based on detailed and reliable exploration, sampling and testing information gathered through appropriate techniques from locations such as outcrops, trenches, pits, workings and drill holes that are spaced closely enough to confirm both geological and grade continuity.
Mineral resources, which are not mineral reserves, do not have demonstrated economic viability.
A mineral reserve is the economically mineable part of a measured or indicated mineral resource demonstrated by at least a preliminary feasibility study. This study must include adequate information on mining, processing, metallurgical, economic and other relevant factors that demonstrate, at the time of reporting, that economic extraction can be justified.
A mineral reserve includes diluting materials and allowances for losses that may occur when the material is mined. Mineral reserves are sub-divided in order of increasing confidence into probable mineral reserves and proven mineral reserves. A probable mineral reserve is the economically mineable part of an indicated and, in some circumstances, a measured mineral resource demonstrated by at least a preliminary feasibility study. This study must include adequate information on mining, processing, metallurgical, economic and other relevant factors that demonstrate, at the time of reporting, that economic extraction can be justified.
A proven mineral reserve is the economically mineable part of a measured mineral resource demonstrated by at least a preliminary feasibility study. This study must include adequate information on mining, processing, metallurgical, economic and other relevant factors that demonstrate, at the time of reporting, that economic extraction is justified.
|
|
|
|
|
|
|
|
|
| BARRICK YEAR-END 2021 |
129 |
RESERVES AND RESOURCES |
|
|
|
|
|
|
|
|
|
|
|
|
|
|
|
|
|
|
|
|
|
|
|
|
|
|
|
|
|
|
|
|
|
|
|
|
|
|
|
Gold Mineral Reserves1,2,3 |
|
|
|
|
|
|
|
| As at December 31, 2021 |
PROVEN |
|
PROBABLE |
|
TOTAL |
|
|
Tonnes |
Grade |
Contained ozs |
|
Tonnes |
Grade |
Contained ozs |
|
Tonnes |
Grade |
Contained ozs |
| Based on attributable ounces |
|
(Mt) |
(g/t) |
(Moz) |
|
(Mt) |
(g/t) |
(Moz) |
|
(Mt) |
(g/t) |
(Moz) |
AFRICA AND MIDDLE EAST |
|
|
|
|
|
|
|
|
|
|
|
|
| Bulyanhulu surface |
|
— |
— |
— |
|
0.00010 |
10.42 |
0.000035 |
|
0.00010 |
10.42 |
0.000035 |
| Bulyanhulu underground |
|
— |
— |
— |
|
10 |
7.76 |
2.5 |
|
10 |
7.76 |
2.5 |
| Bulyanhulu (84.00%) total |
|
— |
— |
— |
|
10 |
7.76 |
2.5 |
|
10 |
7.76 |
2.5 |
| Jabal Sayid surface |
|
0.072 |
0.34 |
0.00079 |
|
— |
— |
— |
|
0.072 |
0.34 |
0.00079 |
| Jabal Sayid underground |
|
6.3 |
0.19 |
0.039 |
|
6.7 |
0.33 |
0.071 |
|
13 |
|
0.26 |
0.11 |
| Jabal Sayid (50.00%) total |
|
6.4 |
0.19 |
0.040 |
|
6.7 |
0.33 |
0.071 |
|
13 |
0.26 |
0.11 |
| Kibali surface |
|
5.0 |
2.31 |
0.37 |
|
12 |
2.51 |
0.95 |
|
17 |
2.45 |
1.3 |
| Kibali underground |
|
9.4 |
4.54 |
1.4 |
|
11 |
4.54 |
1.6 |
|
21 |
4.54 |
3.0 |
| Kibali (45.00%) total |
|
14 |
3.76 |
1.7 |
|
23 |
3.50 |
2.6 |
|
37 |
3.60 |
4.3 |
| Loulo-Gounkoto surface |
|
9.6 |
2.62 |
0.81 |
|
12 |
3.26 |
1.3 |
|
22 |
2.98 |
2.1 |
| Loulo-Gounkoto underground |
|
8.4 |
4.45 |
1.2 |
|
21 |
5.03 |
3.4 |
|
29 |
4.86 |
4.6 |
| Loulo-Gounkoto (80.00%) total |
|
18 |
3.48 |
2.0 |
|
33 |
4.38 |
4.7 |
|
51 |
4.06 |
6.7 |
| North Mara surface |
|
0.66 |
1.73 |
0.037 |
|
37 |
1.73 |
2.1 |
|
38 |
1.73 |
2.1 |
| North Mara underground |
|
0.90 |
5.56 |
0.16 |
|
5.9 |
3.12 |
0.59 |
|
6.8 |
3.44 |
0.75 |
| North Mara (84.00%) total |
|
1.6 |
3.93 |
0.20 |
|
43 |
1.92 |
2.6 |
|
44 |
1.99 |
2.8 |
| Tongon surface (89.70%) |
|
2.0 |
1.51 |
0.095 |
|
5.9 |
1.99 |
0.38 |
|
7.9 |
1.87 |
0.47 |
| AFRICA AND MIDDLE EAST TOTAL |
42 |
3.00 |
4.1 |
|
120 |
3.29 |
13 |
|
160 |
3.22 |
17 |
| LATIN AMERICA AND ASIA PACIFIC |
|
|
|
|
|
|
|
|
|
|
| Norte Abierto surface (50.00%) |
|
110 |
0.65 |
2.4 |
|
480 |
0.59 |
9.2 |
|
600 |
0.60 |
12 |
Porgera surface4 |
|
— |
— |
— |
|
4.8 |
3.66 |
0.56 |
|
4.8 |
3.66 |
0.56 |
Porgera underground4 |
|
0.58 |
6.79 |
0.13 |
|
2.6 |
6.25 |
0.53 |
|
3.2 |
6.34 |
0.66 |
Porgera (24.50%) total4 |
|
0.58 |
6.79 |
0.13 |
|
7.4 |
4.59 |
1.1 |
|
8.0 |
4.75 |
1.2 |
| Pueblo Viejo surface (60.00%) |
|
7.5 |
2.20 |
0.53 |
|
68 |
2.22 |
4.9 |
|
76 |
2.22 |
5.4 |
| Veladero surface (50.00%) |
|
9.8 |
0.41 |
0.13 |
|
80 |
0.82 |
2.1 |
|
90 |
0.77 |
2.2 |
| LATIN AMERICA AND ASIA PACIFIC TOTAL |
130 |
0.74 |
3.2 |
|
640 |
0.84 |
17 |
|
770 |
0.83 |
21 |
NORTH AMERICA |
|
|
|
|
|
|
|
|
|
|
|
|
| Carlin surface |
|
11 |
2.58 |
0.95 |
|
73 |
2.18 |
5.1 |
|
84 |
2.23 |
6.0 |
| Carlin underground |
|
12 |
9.25 |
3.6 |
|
7.0 |
8.18 |
1.8 |
|
19 |
8.86 |
5.4 |
Carlin (61.50%) total5 |
|
24 |
6.01 |
4.5 |
|
80 |
2.70 |
6.9 |
|
100 |
3.46 |
11 |
| Cortez surface |
|
1.4 |
2.13 |
0.095 |
|
37 |
1.66 |
2.0 |
|
39 |
1.68 |
2.1 |
Cortez underground6 |
|
0.78 |
8.57 |
0.21 |
|
26 |
7.77 |
6.5 |
|
27 |
7.79 |
6.7 |
| Cortez (61.50%) total |
|
2.2 |
4.43 |
0.31 |
|
63 |
4.16 |
8.5 |
|
65 |
4.17 |
8.8 |
| Hemlo surface |
|
0.018 |
0.32 |
0.00018 |
|
— |
— |
— |
|
0.018 |
0.32 |
0.00018 |
| Hemlo underground |
|
0.34 |
5.02 |
0.055 |
|
6.1 |
5.19 |
1.0 |
|
6.4 |
5.18 |
1.1 |
| Hemlo (100%) total |
|
0.36 |
4.79 |
0.055 |
|
6.1 |
5.19 |
1.0 |
|
6.4 |
5.16 |
1.1 |
| Long Canyon surface (61.50%) |
|
0.21 |
1.43 |
0.0097 |
|
0.40 |
1.06 |
0.013 |
|
0.61 |
1.18 |
0.023 |
| Phoenix surface (61.50%) |
|
8.3 |
0.72 |
0.19 |
|
96 |
0.59 |
1.8 |
|
100 |
0.60 |
2.0 |
| Turquoise Ridge surface |
|
18 |
2.13 |
1.2 |
|
8.3 |
1.90 |
0.51 |
|
26 |
2.05 |
1.7 |
| Turquoise Ridge underground |
|
8.8 |
11.05 |
3.1 |
|
12 |
9.89 |
3.7 |
|
21 |
10.39 |
6.9 |
| Turquoise Ridge (61.50%) total |
|
26 |
5.09 |
4.3 |
|
20 |
6.59 |
4.3 |
|
46 |
5.74 |
8.6 |
NORTH AMERICA TOTAL |
|
61 |
4.81 |
9.4 |
|
270 |
2.64 |
23 |
|
330 |
3.04 |
32 |
|
|
|
|
|
|
|
|
|
|
|
|
|
TOTAL |
|
240 |
2.20 |
17 |
|
1,000 |
1.60 |
53 |
|
1,300 |
1.71 |
69 |
|
| See “Mineral Reserves and Resources Endnotes”. |
|
|
|
|
|
|
|
|
|
|
|
|
|
|
|
|
|
|
|
|
|
|
|
|
|
|
|
|
|
|
|
|
|
|
|
|
|
|
|
|
|
|
|
|
|
|
|
|
|
|
|
|
|
|
|
|
|
|
|
|
|
|
|
|
|
|
|
|
|
|
|
|
|
|
|
|
|
|
|
|
|
|
|
|
|
|
|
|
|
|
|
|
|
|
|
|
|
|
|
|
|
|
|
|
|
|
|
|
|
|
|
|
|
|
|
|
|
|
|
|
|
|
|
|
|
|
|
|
|
|
|
|
|
|
|
|
|
|
|
|
|
|
|
|
|
|
|
|
|
|
|
|
|
|
|
| BARRICK YEAR-END 2021 |
130 |
RESERVES AND RESOURCES |
|
|
|
|
|
|
|
|
|
|
|
|
|
|
|
|
|
|
|
|
|
|
|
|
|
|
|
|
|
|
|
|
|
|
|
|
|
|
|
|
|
|
|
|
|
|
|
|
|
|
|
|
|
|
|
|
|
|
|
|
|
|
|
|
|
|
|
|
|
|
|
|
|
|
|
|
|
|
|
|
|
|
|
|
|
|
|
|
|
|
|
|
|
|
|
|
|
|
|
|
|
|
|
|
|
|
|
|
|
|
|
|
|
|
|
|
|
|
|
|
|
|
|
|
|
|
|
|
|
|
|
|
|
|
|
|
|
|
|
|
|
|
|
|
|
|
|
|
|
|
|
|
|
|
|
|
|
|
|
|
|
|
|
|
|
|
|
|
|
|
|
|
|
|
|
|
|
|
|
|
|
|
|
|
|
|
|
|
|
|
|
|
|
|
|
|
|
|
|
|
|
|
|
|
|
|
|
|
|
|
|
|
|
|
|
|
|
|
|
|
|
|
|
|
|
|
|
|
|
|
|
|
|
|
|
|
|
|
|
|
|
|
|
|
|
|
|
|
|
|
|
|
|
|
|
|
|
|
|
|
|
|
|
|
|
|
|
|
|
|
|
|
|
|
|
|
|
|
|
|
|
|
|
|
|
|
|
|
|
|
|
|
|
|
|
|
|
|
|
|
|
|
|
|
|
|
|
|
|
|
|
|
|
|
|
|
|
|
|
|
|
|
|
|
|
|
|
|
|
Copper Mineral Reserves1,2,3,7 |
|
|
|
|
|
|
|
| As at December 31, 2021 |
PROVEN |
|
PROBABLE |
|
TOTAL |
|
|
Tonnes |
Cu Grade |
Contained Cu |
|
Tonnes |
Cu Grade |
Contained Cu |
|
Tonnes |
Cu Grade |
Contained Cu |
| Based on attributable pounds |
|
(Mt) |
(%) |
(Mlb) |
|
(Mt) |
(%) |
(Mlb) |
|
(Mt) |
(%) |
(Mlb) |
AFRICA AND MIDDLE EAST |
|
|
|
|
|
|
|
|
|
|
|
|
| Bulyanhulu surface |
|
— |
|
— |
|
— |
|
|
0.00010 |
0.61 |
0.0014 |
|
0.00010 |
0.61 |
0.0014 |
| Bulyanhulu underground |
|
— |
|
— |
|
— |
|
|
10 |
0.37 |
82 |
|
10 |
0.37 |
82 |
| Bulyanhulu (84.00%) total |
|
— |
|
— |
|
— |
|
|
10 |
0.37 |
82 |
|
10 |
0.37 |
82 |
| Jabal Sayid surface |
|
0.072 |
3.06 |
4.9 |
|
— |
|
— |
|
— |
|
|
0.072 |
3.06 |
4.9 |
| Jabal Sayid underground |
|
6.3 |
2.30 |
320 |
|
6.7 |
2.24 |
330 |
|
13 |
2.27 |
650 |
| Jabal Sayid (50.00%) total |
|
6.4 |
2.31 |
330 |
|
6.7 |
2.24 |
330 |
|
13 |
2.27 |
650 |
| Lumwana surface (100%) |
|
68 |
0.51 |
770 |
|
410 |
0.58 |
5,200 |
|
470 |
0.57 |
6,000 |
AFRICA AND MIDDLE EAST TOTAL |
|
75 |
0.67 |
1,100 |
|
420 |
0.60 |
5,600 |
|
500 |
0.61 |
6,700 |
LATIN AMERICA AND ASIA PACIFIC |
|
|
|
|
|
|
|
|
|
|
| Norte Abierto surface (50.00%) |
|
110 |
0.19 |
480 |
|
480 |
0.23 |
2,400 |
|
600 |
0.22 |
2,900 |
| Zaldívar surface (50.00%) |
|
180 |
0.45 |
1800 |
|
42 |
0.34 |
320 |
|
230 |
0.43 |
2,100 |
LATIN AMERICA AND ASIA PACIFIC TOTAL |
|
300 |
0.35 |
2,300 |
|
530 |
0.24 |
2,700 |
|
820 |
0.28 |
5,000 |
NORTH AMERICA |
|
|
|
|
|
|
|
|
|
|
|
|
| Phoenix surface (61.50%) |
|
11 |
0.17 |
40 |
|
130 |
0.17 |
470 |
|
140 |
0.17 |
510 |
NORTH AMERICA TOTAL |
|
11 |
0.17 |
40 |
|
130 |
0.17 |
470 |
|
140 |
0.17 |
510 |
|
|
|
|
|
|
|
|
|
|
|
|
|
|
|
|
|
|
|
|
|
|
|
|
|
|
TOTAL |
|
380 |
0.41 |
3,400 |
|
1,100 |
0.37 |
8,800 |
|
1,500 |
0.38 |
12,000 |
|
|
|
|
|
|
|
|
|
|
|
|
|
| See “Mineral Reserves and Resources Endnotes”. |
|
|
|
|
|
|
|
|
|
|
|
|
|
|
|
|
|
|
|
|
|
|
|
|
|
|
|
|
|
|
|
|
|
|
|
|
|
|
|
|
|
|
|
|
|
|
|
|
|
|
|
|
|
|
|
|
|
|
|
|
|
|
|
|
|
|
|
|
|
|
|
|
|
|
|
|
|
|
|
|
|
|
|
|
|
|
|
|
|
|
|
|
|
|
|
|
|
|
|
|
|
|
|
|
|
|
|
|
|
Silver Mineral Reserves1,2,3,7 |
|
|
|
|
|
|
|
| As at December 31, 2021 |
PROVEN |
|
PROBABLE |
|
TOTAL |
|
|
Tonnes |
Ag Grade |
Contained Ag |
|
Tonnes |
Ag Grade |
Contained Ag |
|
Tonnes |
Ag Grade |
Contained Ag |
| Based on attributable ounces |
|
(Mt) |
(g/t) |
(Moz) |
|
(Mt) |
(g/t) |
(Moz) |
|
(Mt) |
(g/t) |
(Moz) |
AFRICA AND MIDDLE EAST |
|
|
|
|
|
|
|
|
|
|
|
|
| Bulyanhulu surface |
|
— |
|
— |
|
— |
|
|
0.00010 |
4.32 |
0.000014 |
|
0.00010 |
4.32 |
0.000014 |
| Bulyanhulu underground |
|
— |
|
— |
|
— |
|
|
10 |
6.92 |
2.3 |
|
10 |
6.92 |
2.3 |
| Bulyanhulu (84.00%) total |
|
— |
|
— |
|
— |
|
|
10 |
6.92 |
2.3 |
|
10 |
6.92 |
2.3 |
AFRICA AND MIDDLE EAST TOTAL |
|
— |
|
— |
|
— |
|
|
10 |
6.92 |
2.3 |
|
10 |
6.92 |
2.3 |
|
|
|
|
|
|
|
|
|
|
|
|
|
|
|
|
|
|
|
|
|
|
|
|
|
|
|
|
|
|
|
|
|
|
|
|
|
|
|
LATIN AMERICA AND ASIA PACIFIC |
|
|
|
|
|
|
|
|
|
|
|
|
| Norte Abierto surface (50.00%) |
|
110 |
1.91 |
7.0 |
|
480 |
1.43 |
22 |
|
600 |
1.52 |
29 |
| Pueblo Viejo surface (60.00%) |
|
7.5 |
11.18 |
2.7 |
|
68 |
14.85 |
33 |
|
76 |
14.49 |
35 |
| Veladero surface (50.00%) |
|
9.8 |
12.41 |
3.9 |
|
80 |
14.78 |
38 |
|
90 |
14.52 |
42 |
LATIN AMERICA AND ASIA PACIFIC TOTAL |
|
130 |
3.21 |
14 |
|
630 |
4.58 |
93 |
|
760 |
4.34 |
110 |
NORTH AMERICA |
|
|
|
|
|
|
|
|
|
|
|
|
| Phoenix surface (61.50%) |
|
8.3 |
7.40 |
2.0 |
|
96 |
6.35 |
20 |
|
100 |
6.43 |
22 |
NORTH AMERICA TOTAL |
|
8.3 |
7.40 |
2.0 |
|
96 |
6.35 |
20 |
|
100 |
6.43 |
22 |
|
|
|
|
|
|
|
|
|
|
|
|
|
TOTAL |
|
140 |
3.46 |
16 |
|
740 |
4.84 |
120 |
|
880 |
4.62 |
130 |
|
|
|
|
|
|
|
|
|
|
|
|
|
| See “Mineral Reserves and Resources Endnotes”. |
|
|
|
|
|
|
|
|
|
|
|
|
|
|
|
|
|
|
|
|
|
|
|
|
|
|
|
|
|
|
|
|
|
|
|
|
|
|
|
|
|
|
|
|
|
|
|
|
|
|
|
|
|
|
|
|
|
|
|
|
|
|
|
| BARRICK YEAR-END 2021 |
131 |
RESERVES AND RESOURCES |
|
|
|
|
|
|
|
|
|
|
|
|
|
|
|
|
|
|
|
|
|
|
|
|
|
|
|
|
|
|
|
|
|
|
|
|
|
|
|
|
|
|
|
|
Gold Mineral Resources1,2,3,8,9 |
|
|
|
|
|
|
|
|
|
|
|
| As at December 31, 2021 |
MEASURED (M)10 |
|
INDICATED (I)10 |
|
|
(M) + (I)10 |
|
INFERRED11 |
|
|
Tonnes |
Grade |
Contained ozs |
|
Tonnes |
Grade |
Contained ozs |
|
|
Contained ozs |
|
Tonnes |
Grade |
Contained ozs |
|
| Based on attributable ounces |
(Mt) |
(g/t) |
(Moz) |
|
(Mt) |
(g/t) |
(Moz) |
|
|
(Moz) |
|
(Mt) |
(g/t) |
(Moz) |
|
AFRICA AND MIDDLE EAST |
|
|
|
|
|
|
|
|
|
|
|
|
|
|
|
| Bulyanhulu surface |
— |
|
— |
|
— |
|
|
0.00010 |
10.42 |
0.000035 |
|
|
0.000035 |
|
— |
|
— |
|
— |
|
|
| Bulyanhulu underground |
— |
|
— |
|
— |
|
|
17 |
8.92 |
4.8 |
|
|
4.8 |
|
24 |
8.0 |
6.2 |
|
| Bulyanhulu (84.00%) total |
— |
|
— |
|
— |
|
|
17 |
8.92 |
4.8 |
|
|
4.8 |
|
24 |
8.0 |
6.2 |
|
|
|
|
|
|
|
|
|
|
|
|
|
|
|
|
|
| Jabal Sayid surface |
0.072 |
0.34 |
0.00079 |
|
— |
|
— |
|
— |
|
|
|
0.00079 |
|
— |
|
— |
|
— |
|
|
| Jabal Sayid underground |
6.8 |
0.22 |
0.049 |
|
7.9 |
0.37 |
0.092 |
|
|
0.14 |
|
1.3 |
0.6 |
0.022 |
|
| Jabal Sayid (50.00%) total |
6.9 |
0.23 |
0.050 |
|
7.9 |
0.37 |
0.092 |
|
|
0.14 |
|
1.3 |
0.6 |
0.022 |
|
| Kibali surface |
7.1 |
2.26 |
0.52 |
|
20 |
2.25 |
1.5 |
|
|
2.0 |
|
3.7 |
2.1 |
0.25 |
|
| Kibali underground |
14 |
4.63 |
2.1 |
|
22 |
4.06 |
2.8 |
|
|
5.0 |
|
6.6 |
3.0 |
0.64 |
|
| Kibali (45.00%) total |
21 |
3.84 |
2.6 |
|
42 |
3.18 |
4.3 |
|
|
6.9 |
|
10 |
2.7 |
0.89 |
|
| Loulo-Gounkoto surface |
9.5 |
2.57 |
0.79 |
|
14 |
3.31 |
1.5 |
|
|
2.3 |
|
3.2 |
2.1 |
0.22 |
|
| Loulo-Gounkoto underground |
16 |
4.57 |
2.3 |
|
30 |
4.94 |
4.8 |
|
|
7.1 |
|
8.3 |
3.1 |
0.82 |
|
| Loulo-Gounkoto (80.00%) total |
25 |
3.82 |
3.1 |
|
44 |
4.42 |
6.2 |
|
|
9.3 |
|
12 |
2.8 |
1.0 |
|
| North Mara surface |
13 |
2.54 |
1.0 |
|
40 |
1.41 |
1.8 |
|
|
2.8 |
|
5.0 |
1.1 |
0.18 |
|
| North Mara underground |
0.64 |
3.56 |
0.073 |
|
18 |
2.04 |
1.2 |
|
|
1.3 |
|
7.8 |
1.8 |
0.46 |
|
| North Mara (84.00%) total |
13 |
2.59 |
1.1 |
|
58 |
1.61 |
3.0 |
|
|
4.1 |
|
13 |
1.6 |
0.65 |
|
| Tongon surface (89.70%) |
2.8 |
1.79 |
0.16 |
|
7.8 |
2.21 |
0.55 |
|
|
0.71 |
|
3.5 |
2.7 |
0.30 |
|
AFRICA AND MIDDLE EAST TOTAL |
70 |
3.15 |
7.1 |
|
180 |
3.34 |
19 |
|
|
26 |
|
64 |
4.5 |
9.1 |
|
| LATIN AMERICA AND ASIA PACIFIC |
|
|
|
|
|
|
|
|
|
|
|
|
|
|
|
| Alturas surface (100%) |
— |
|
— |
|
— |
|
|
— |
|
— |
|
— |
|
|
|
— |
|
|
260 |
1.1 |
8.9 |
|
| Norte Abierto surface (50.00%) |
190 |
0.63 |
3.9 |
|
1,100 |
0.53 |
19 |
|
|
22 |
|
370 |
0.4 |
4.4 |
|
| Pascua Lama surface (100%) |
43 |
1.86 |
2.6 |
|
390 |
1.49 |
19 |
|
|
21 |
|
15 |
1.7 |
0.86 |
|
Porgera surface4 |
— |
|
— |
|
— |
|
|
10 |
3.21 |
1.0 |
|
|
1.0 |
|
3.9 |
2.5 |
0.31 |
|
Porgera underground4 |
0.64 |
6.66 |
0.14 |
|
4.2 |
6.20 |
0.84 |
|
|
0.98 |
|
1.3 |
6.5 |
0.28 |
|
Porgera (24.50%) total4 |
0.64 |
6.66 |
0.14 |
|
14 |
4.09 |
1.9 |
|
|
2.0 |
|
5.3 |
3.5 |
0.59 |
|
| Pueblo Viejo surface (60.00%) |
63 |
2.03 |
4.1 |
|
150 |
2.04 |
10 |
|
|
14 |
|
38 |
1.7 |
2.1 |
|
| Veladero surface (50.00%) |
11 |
0.39 |
0.14 |
|
130 |
0.71 |
2.9 |
|
|
3.0 |
|
18 |
0.7 |
0.39 |
|
LATIN AMERICA AND ASIA PACIFIC TOTAL12 |
310 |
1.09 |
11 |
|
1,800 |
0.92 |
52 |
|
|
63 |
|
710 |
0.8 |
17 |
|
|
|
|
|
|
|
|
|
|
|
|
|
|
|
|
|
| See “Mineral Reserves and Resources Endnotes”. |
|
|
|
|
|
|
|
|
|
|
|
|
|
|
|
|
|
|
|
|
|
|
|
|
|
|
|
|
|
|
|
|
|
|
|
|
|
|
|
|
|
|
|
|
|
|
|
|
|
|
|
|
|
|
|
|
|
|
|
|
|
|
|
|
|
|
|
|
|
|
|
|
|
|
|
|
|
|
|
|
|
|
|
|
|
|
|
|
|
|
|
|
|
|
|
|
|
|
|
|
|
|
|
|
|
|
|
|
|
|
|
|
|
|
|
|
|
|
|
|
|
|
|
|
|
|
|
|
|
|
|
|
|
|
|
|
|
|
|
|
|
|
|
|
|
|
|
|
|
|
|
|
|
|
|
|
|
|
|
|
|
|
|
|
|
|
|
|
|
|
|
|
|
|
|
|
|
|
|
|
|
|
|
|
|
|
|
|
|
|
|
|
|
|
|
|
|
|
|
|
|
|
|
|
|
|
|
|
|
|
|
|
|
|
|
|
|
|
|
|
|
|
|
|
|
|
|
|
|
|
|
|
|
|
|
|
|
|
|
|
|
|
|
|
|
|
|
|
|
|
| BARRICK YEAR-END 2021 |
132 |
RESERVES AND RESOURCES |
|
|
|
|
|
|
|
|
|
|
|
|
|
|
|
|
|
|
|
|
|
|
|
|
|
|
|
|
|
|
|
|
|
|
|
|
|
|
|
|
|
|
|
|
Gold Mineral Resources1,2,3,8,9 |
|
|
|
|
|
|
|
|
|
|
|
| As at December 31, 2021 |
MEASURED (M)10 |
|
INDICATED (I)10 |
|
|
(M) + (I)10 |
|
INFERRED11 |
|
|
Tonnes |
Grade |
Contained ozs |
|
Tonnes |
Grade |
Contained ozs |
|
|
Contained ozs |
|
Tonnes |
Grade |
Contained ozs |
|
| Based on attributable ounces |
(Mt) |
(g/t) |
(Moz) |
|
(Mt) |
(g/t) |
(Moz) |
|
|
(Moz) |
|
(Mt) |
(g/t) |
(Moz) |
|
NORTH AMERICA |
|
|
|
|
|
|
|
|
|
|
|
|
|
|
|
| Carlin surface |
28 |
2.33 |
2.1 |
|
150 |
1.82 |
9.0 |
|
|
11 |
|
58 |
1.2 |
2.2 |
|
| Carlin underground |
23 |
7.53 |
5.6 |
|
12 |
6.97 |
2.7 |
|
|
8.4 |
|
10.0 |
7.5 |
2.4 |
|
Carlin (61.50%) total5 |
51 |
4.68 |
7.8 |
|
170 |
2.20 |
12 |
|
|
19 |
|
68 |
2.1 |
4.6 |
|
| Cortez surface |
1.4 |
2.12 |
0.096 |
|
92 |
1.07 |
3.2 |
|
|
3.3 |
|
62 |
0.5 |
1.1 |
|
Cortez underground6 |
1.2 |
8.06 |
0.32 |
|
32 |
7.40 |
7.7 |
|
|
8.0 |
|
15 |
5.9 |
2.8 |
|
| Cortez (61.50%) total |
2.6 |
4.88 |
0.41 |
|
120 |
2.71 |
11 |
|
|
11 |
|
76 |
1.6 |
3.9 |
|
| Donlin surface (50.00%) |
3.9 |
2.52 |
0.31 |
|
270 |
2.24 |
19 |
|
|
20 |
|
46 |
2.0 |
3.0 |
|
| Fourmile underground (100%) |
— |
|
— |
|
— |
|
|
1.00 |
10.90 |
0.35 |
|
|
0.35 |
|
6.4 |
10.6 |
2.2 |
|
| Hemlo surface |
0.024 |
0.48 |
0.00037 |
|
27 |
0.90 |
0.78 |
|
|
0.78 |
|
5.4 |
0.9 |
0.15 |
|
| Hemlo underground |
0.66 |
4.64 |
0.098 |
|
11 |
4.73 |
1.7 |
|
|
1.8 |
|
3.7 |
5.6 |
0.67 |
|
| Hemlo (100%) total |
0.68 |
4.50 |
0.099 |
|
38 |
2.03 |
2.5 |
|
|
2.6 |
|
9.1 |
2.8 |
0.82 |
|
| Long Canyon surface |
0.54 |
2.66 |
0.046 |
|
5.3 |
2.45 |
0.42 |
|
|
0.47 |
|
1.1 |
0.8 |
0.029 |
|
| Long Canyon underground |
— |
|
— |
|
— |
|
|
1.1 |
10.68 |
0.38 |
|
|
0.38 |
|
0.53 |
9.1 |
0.16 |
|
| Long Canyon (61.50%) total |
0.54 |
2.66 |
0.046 |
|
6.5 |
3.87 |
0.80 |
|
|
0.85 |
|
1.6 |
3.6 |
0.19 |
|
| Phoenix surface (61.50%) |
13 |
0.65 |
0.27 |
|
230 |
0.51 |
3.7 |
|
|
4.0 |
|
30 |
0.4 |
0.36 |
|
| Turquoise Ridge surface |
25 |
2.12 |
1.7 |
|
23 |
2.00 |
1.5 |
|
|
3.2 |
|
10 |
1.8 |
0.60 |
|
| Turquoise Ridge underground |
11 |
10.28 |
3.5 |
|
18 |
8.84 |
5.2 |
|
|
8.7 |
|
0.68 |
6.2 |
0.14 |
|
| Turquoise Ridge (61.50%) total |
36 |
4.57 |
5.3 |
|
41 |
5.05 |
6.6 |
|
|
12 |
|
11 |
2.0 |
0.74 |
|
NORTH AMERICA TOTAL |
110 |
4.08 |
14 |
|
870 |
1.99 |
56 |
|
|
70 |
|
250 |
2.0 |
16 |
|
|
|
|
|
|
|
|
|
|
|
|
|
|
|
|
|
|
|
|
|
|
|
|
|
|
|
|
|
|
|
|
|
|
|
|
|
|
|
|
|
|
|
|
|
|
|
|
|
|
|
|
|
|
|
|
|
|
|
|
|
|
|
|
|
|
|
|
|
|
|
|
|
|
|
|
|
|
|
|
|
|
|
|
|
|
|
|
|
|
|
|
|
|
|
|
|
|
|
|
|
|
|
|
|
|
|
|
|
|
|
|
|
TOTAL |
490 |
2.05 |
32 |
|
2,800 |
1.40 |
130 |
|
|
160 |
|
1,000 |
1.3 |
42 |
|
|
|
|
|
|
|
|
|
|
|
|
|
|
|
|
|
|
|
See “Mineral Reserves and Resources Endnotes”. |
|
|
|
|
|
|
|
|
|
|
|
|
|
|
|
|
|
|
|
|
|
|
|
|
|
|
|
|
|
|
|
|
|
|
|
|
|
|
|
|
|
|
|
|
|
|
|
|
|
|
|
|
|
|
|
|
|
|
|
|
|
|
|
|
|
|
|
|
|
|
|
|
|
|
|
|
|
|
|
|
|
|
|
|
|
|
|
|
|
|
|
|
|
|
|
|
|
|
|
|
|
|
|
|
|
|
|
|
|
|
|
|
|
|
|
|
|
|
|
|
|
|
|
|
|
|
|
|
|
|
|
| BARRICK YEAR-END 2021 |
133 |
RESERVES AND RESOURCES |
|
|
|
|
|
|
|
|
|
|
|
|
|
|
|
|
|
|
|
|
|
|
|
|
|
|
|
|
|
|
|
|
|
|
|
|
|
|
|
|
|
|
|
|
|
Copper Mineral Resources1,3,7,8,9 |
|
|
|
|
|
|
|
|
|
| As at December 31, 2021 |
MEASURED (M)10 |
|
INDICATED (I)10 |
|
(M) + (I)10 |
|
INFERRED11 |
|
|
Tonnes |
Grade |
Contained lbs |
|
Tonnes |
Grade |
Contained lbs |
|
Contained lbs |
|
Tonnes |
Grade |
Contained lbs |
| Based on attributable pounds |
|
(Mt) |
(%) |
(Mlb) |
|
(Mt) |
(%) |
(Mlb) |
|
(Mlb) |
|
(Mt) |
(%) |
(Mlb) |
AFRICA AND MIDDLE EAST |
|
|
|
|
|
|
|
|
|
|
|
|
|
|
| Bulyanhulu surface |
|
— |
|
— |
|
— |
|
|
0.00010 |
0.61 |
0.0014 |
|
0.0014 |
|
— |
|
— |
|
— |
|
| Bulyanhulu underground |
|
— |
|
— |
|
— |
|
|
17 |
0.41 |
150 |
|
150 |
|
24 |
0.4 |
200 |
| Bulyanhulu (84.00%) total |
|
— |
|
— |
|
— |
|
|
17 |
0.41 |
150 |
|
150 |
|
24 |
0.4 |
200 |
| Jabal Sayid surface |
|
0.072 |
3.06 |
4.9 |
|
— |
|
— |
|
— |
|
|
4.9 |
|
— |
|
— |
|
— |
|
| Jabal Sayid underground |
|
6.8 |
2.60 |
390 |
|
7.9 |
2.22 |
380 |
|
770 |
|
1.3 |
1.4 |
38 |
| Jabal Sayid (50.00%) total |
|
6.9 |
2.60 |
390 |
|
7.9 |
2.22 |
380 |
|
780 |
|
1.3 |
1.4 |
38 |
| Lumwana surface (100%) |
|
93 |
0.51 |
1,000 |
|
880 |
0.54 |
10,000 |
|
11,000 |
|
7.6 |
0.6 |
93 |
AFRICA AND MIDDLE EAST TOTAL |
|
99 |
0.65 |
1,400 |
|
910 |
0.55 |
11,000 |
|
12,000 |
|
33 |
0.4 |
330 |
LATIN AMERICA AND ASIA PACIFIC |
|
|
|
|
|
|
|
|
|
|
|
|
|
|
| Norte Abierto surface (50.00%) |
|
170 |
0.21 |
790 |
|
1,000 |
0.21 |
4,700 |
|
5,500 |
|
360 |
0.2 |
1,400 |
| Zaldívar surface (50.00%) |
|
390 |
0.40 |
3,400 |
|
240 |
0.36 |
1,900 |
|
5,300 |
|
26 |
0.3 |
190 |
| LATIN AMERICA AND ASIA PACIFIC TOTAL |
|
560 |
0.34 |
4,200 |
|
1,300 |
0.24 |
6,600 |
|
11,000 |
|
390 |
0.2 |
1,600 |
NORTH AMERICA |
|
|
|
|
|
|
|
|
|
|
|
|
|
|
| Phoenix surface (61.50%) |
|
16 |
0.16 |
55 |
|
310 |
0.15 |
1,000 |
|
1,100 |
|
32 |
0.1 |
90 |
NORTH AMERICA TOTAL |
|
16 |
0.16 |
55 |
|
310 |
0.15 |
1,000 |
|
1,100 |
|
32 |
0.1 |
90 |
|
|
|
|
|
|
|
|
|
|
|
|
|
|
|
TOTAL |
|
680 |
0.38 |
5,700 |
|
2,500 |
0.34 |
19,000 |
|
24,000 |
|
450 |
0.2 |
2,100 |
|
|
|
|
|
|
|
|
|
|
|
|
|
|
|
|
See “Mineral Reserves and Resources Endnotes”. |
|
|
|
|
|
|
|
|
|
|
|
|
|
|
|
|
|
|
|
|
|
|
|
|
|
|
|
|
|
|
|
|
|
|
|
|
|
|
|
|
|
|
|
|
|
|
|
|
|
|
|
|
|
|
|
|
|
|
|
|
|
|
|
|
| BARRICK YEAR-END 2021 |
134 |
RESERVES AND RESOURCES |
|
|
|
|
|
|
|
|
|
|
|
|
|
|
|
|
|
|
|
|
|
|
|
|
|
|
|
|
|
|
|
|
|
|
|
|
|
|
|
|
|
|
|
|
|
Silver Mineral Resources1,3,7,8,9 |
|
|
|
|
|
|
|
|
|
| As at December 31, 2021 |
MEASURED (M)10 |
|
INDICATED (I)10 |
|
(M) + (I)10 |
|
INFERRED11 |
|
|
Tonnes |
Ag Grade |
Contained Ag |
|
Tonnes |
Ag Grade |
Contained Ag |
|
Contained Ag |
|
Tonnes |
Ag Grade |
Contained Ag |
| Based on attributable ounces |
|
(Mt) |
(g/t) |
(Moz) |
|
(Mt) |
(g/t) |
(Moz) |
|
(Moz) |
|
(Mt) |
(g/t) |
(Moz) |
AFRICA AND MIDDLE EAST |
|
|
|
|
|
|
|
|
|
|
|
|
|
|
| Bulyanhulu surface |
|
— |
|
— |
|
— |
|
|
0.00010 |
4.32 |
0.000014 |
|
0.000014 |
|
— |
|
— |
|
— |
|
| Bulyanhulu underground |
|
— |
|
— |
|
— |
|
|
17 |
7.31 |
3.9 |
|
3.9 |
|
24 |
6.3 |
4.9 |
| Bulyanhulu (84.00%) total |
|
— |
|
— |
|
— |
|
|
17 |
7.31 |
3.9 |
|
3.9 |
|
24 |
6.3 |
4.9 |
AFRICA AND MIDDLE EAST TOTAL |
|
— |
|
— |
|
— |
|
|
17 |
7.31 |
3.9 |
|
3.9 |
|
24 |
6.3 |
4.9 |
LATIN AMERICA AND ASIA PACIFIC |
|
|
|
|
|
|
|
|
|
|
|
|
|
|
| Norte Abierto surface (50.00%) |
|
190 |
1.62 |
10 |
|
1,100 |
1.23 |
43 |
|
53 |
|
370 |
1.0 |
11 |
| Pascua-Lama surface (100%) |
|
43 |
57.21 |
79 |
|
390 |
52.22 |
660 |
|
740 |
|
15 |
17.8 |
8.8 |
| Pueblo Viejo surface (60.00%) |
|
63 |
11.47 |
23 |
|
150 |
12.63 |
63 |
|
86 |
|
38 |
9.0 |
11 |
| Veladero surface (50.00%) |
|
11 |
11.35 |
4.0 |
|
130 |
14.19 |
58 |
|
62 |
|
18 |
13.8 |
8.1 |
|
|
|
|
|
|
|
|
|
|
|
|
|
|
|
| LATIN AMERICA AND ASIA PACIFIC TOTAL |
|
310 |
11.68 |
120 |
|
1,800 |
|
14.56 |
820 |
|
940 |
|
440 |
2.8 |
39 |
NORTH AMERICA |
|
|
|
|
|
|
|
|
|
|
|
|
|
|
| Phoenix surface (61.50%) |
|
13 |
6.74 |
2.8 |
|
230 |
|
5.88 |
43 |
|
46 |
|
30 |
5.6 |
5.4 |
NORTH AMERICA TOTAL |
|
13 |
6.74 |
2.8 |
|
230 |
5.88 |
43 |
|
46 |
|
30 |
5.6 |
5.4 |
|
|
|
|
|
|
|
|
|
|
|
|
|
|
|
|
|
|
|
|
|
|
|
|
|
|
|
|
|
|
TOTAL |
|
320 |
11.48 |
120 |
|
2,000 |
13.50 |
870 |
|
990 |
|
500 |
3.1 |
50 |
|
|
|
|
|
|
|
|
|
|
|
|
|
|
|
|
See “Mineral Reserves and Resources Endnotes”. |
|
|
|
|
|
|
|
|
|
|
|
|
|
|
|
|
|
|
|
|
|
|
|
|
|
|
|
|
|
|
|
|
|
|
|
|
|
|
|
|
|
|
|
|
|
|
|
|
|
|
|
|
|
|
|
|
|
|
|
|
|
|
| BARRICK YEAR-END 2021 |
135 |
RESERVES AND RESOURCES |
|
|
|
|
|
|
|
|
|
|
|
|
|
|
|
|
|
|
|
|
|
|
|
|
|
|
|
Summary Gold Mineral Reserves1,2,3 |
| For the years ended December 31 |
2021 |
2020 |
|
Ownership |
Tonnes |
Grade |
Ounces |
Ownership |
Tonnes |
Grade |
Ounces |
| Based on attributable ounces |
% |
(Mt) |
(g/t) |
(Moz) |
% |
(Mt) |
(g/t) |
(Moz) |
AFRICA AND MIDDLE EAST |
|
|
|
|
|
|
|
|
| Bulyanhulu surface |
84.00% |
0.00010 |
10.42 |
0.000035 |
84.00% |
— |
|
— |
— |
|
| Bulyanhulu underground |
84.00% |
10 |
|
7.76 |
2.5 |
|
84.00% |
6.9 |
|
8.92 |
2.0 |
|
| Bulyanhulu Total |
84.00% |
10 |
|
7.76 |
2.5 |
|
84.00% |
6.9 |
|
8.92 |
2.0 |
|
| Buzwagi surface |
84.00% |
— |
|
— |
— |
|
84.00% |
1.7 |
|
0.76 |
0.042 |
|
| Jabal Sayid surface |
50.00% |
0.072 |
0.34 |
0.00079 |
50.00% |
— |
|
— |
— |
|
| Jabal Sayid underground |
50.00% |
13 |
0.26 |
0.11 |
50.00% |
— |
|
— |
— |
|
| Jabal Sayid Total |
50.00% |
13 |
0.26 |
0.11 |
50.00% |
12 |
|
0.23 |
0.090 |
|
| Kibali surface |
45.00% |
17 |
2.45 |
1.3 |
45.00% |
14 |
|
2.47 |
1.1 |
|
| Kibali underground |
45.00% |
21 |
4.54 |
3.0 |
45.00% |
20 |
|
4.81 |
3.1 |
|
Kibali Total |
45.00% |
37 |
3.60 |
4.3 |
45.00% |
34 |
|
3.84 |
4.2 |
|
Loulo-Gounkoto surface |
80.00% |
22 |
2.98 |
2.1 |
80.00% |
17 |
|
3.21 |
1.7 |
|
| Loulo-Gounkoto underground |
80.00% |
29 |
4.86 |
4.6 |
80.00% |
31 |
|
4.93 |
5.0 |
|
| Loulo-Gounkoto Total |
80.00% |
51 |
4.06 |
6.7 |
80.00% |
48 |
|
4.33 |
6.7 |
|
| North Mara surface |
84.00% |
38 |
1.73 |
2.1 |
84.00% |
18 |
|
1.44 |
0.85 |
|
| North Mara underground |
84.00% |
6.8 |
3.44 |
0.75 |
84.00% |
7.3 |
|
5.01 |
1.2 |
|
| North Mara Total |
84.00% |
44 |
1.99 |
2.8 |
84.00% |
26 |
|
2.46 |
2.0 |
|
| Tongon surface |
89.70% |
7.9 |
1.87 |
0.47 |
89.70% |
9.3 |
|
1.92 |
0.57 |
|
|
|
|
|
|
|
|
|
|
|
|
|
|
|
|
|
AFRICA AND MIDDLE EAST TOTAL |
|
160 |
3.22 |
17 |
|
140 |
|
3.52 |
16 |
|
LATIN AMERICA AND ASIA PACIFIC |
|
|
|
|
|
|
|
|
|
|
|
|
|
|
|
|
|
| Norte Abierto surface |
50.00% |
600 |
0.60 |
12 |
50.00% |
600 |
|
0.60 |
|
12 |
Porgera surface4 |
24.50% |
4.8 |
3.66 |
0.56 |
47.50% |
9.2 |
|
3.66 |
|
1.1 |
Porgera underground4 |
24.50% |
3.2 |
6.34 |
0.66 |
47.50% |
6.3 |
|
6.34 |
|
1.3 |
Porgera Total4 |
24.50% |
8.0 |
4.75 |
1.2 |
47.50% |
15 |
|
4.75 |
|
2.4 |
| Pueblo Viejo surface |
60.00% |
76 |
2.22 |
5.4 |
60.00% |
83 |
|
2.31 |
|
6.2 |
| Veladero surface |
50.00% |
90 |
0.77 |
2.2 |
50.00% |
110 |
|
0.75 |
|
2.6 |
LATIN AMERICA AND ASIA PACIFIC TOTAL |
|
770 |
0.83 |
21 |
|
810 |
|
0.88 |
|
23 |
NORTH AMERICA |
|
|
|
|
|
|
|
|
| Carlin surface |
61.50% |
84 |
2.23 |
6.0 |
61.50% |
91 |
|
2.21 |
|
6.5 |
| Carlin underground |
61.50% |
19 |
8.86 |
5.4 |
61.50% |
19 |
|
9.17 |
|
5.6 |
Carlin Total5 |
61.50% |
100 |
3.46 |
11 |
61.50% |
110 |
|
3.42 |
|
12 |
| Cortez surface |
61.50% |
39 |
1.68 |
2.1 |
61.50% |
52 |
|
1.52 |
|
2.6 |
Cortez underground6 |
61.50% |
27 |
7.79 |
6.7 |
61.50% |
11 |
|
9.38 |
|
3.4 |
| Cortez Total |
61.50% |
65 |
4.17 |
8.8 |
61.50% |
64 |
|
2.92 |
|
6.0 |
| Hemlo surface |
100% |
0.018 |
0.32 |
0.00018 |
100% |
0.57 |
|
0.77 |
|
0.014 |
| Hemlo underground |
100% |
6.4 |
5.18 |
1.1 |
100% |
9.0 |
|
5.08 |
|
1.5 |
| Hemlo Total |
100% |
6.4 |
5.16 |
1.1 |
100% |
9.6 |
|
4.82 |
|
1.5 |
| Long Canyon surface |
61.50% |
0.61 |
1.18 |
0.023 |
61.50% |
3.1 |
|
2.21 |
|
0.22 |
| Phoenix surface |
61.50% |
100 |
|
0.60 |
|
2.0 |
|
61.50% |
95 |
|
0.58 |
|
1.8 |
| Turquoise Ridge surface |
61.50% |
26 |
2.05 |
1.7 |
61.50% |
26 |
|
2.03 |
|
1.7 |
| Turquoise Ridge underground |
61.50% |
21 |
10.39 |
6.9 |
61.50% |
17 |
|
10.92 |
|
6.0 |
| Turquoise Ridge Total |
61.50% |
46 |
5.74 |
8.6 |
61.50% |
43 |
|
5.58 |
|
7.7 |
NORTH AMERICA TOTAL |
|
330 |
3.04 |
32 |
|
320 |
|
2.80 |
|
29 |
|
|
|
|
|
|
|
|
|
TOTAL |
|
1,300 |
1.71 |
69 |
|
1,300 |
|
1.66 |
|
68 |
|
|
|
|
|
|
|
|
|
See “Mineral Reserves and Resources Endnotes”. |
|
|
|
|
|
|
|
|
|
|
|
|
|
|
| BARRICK YEAR-END 2021 |
136 |
RESERVES AND RESOURCES |
Mineral Reserves and Resources Endnotes
1.Mineral reserves (“reserves”) and mineral resources (“resources”) have been estimated as at December 31, 2021 (unless otherwise noted) in accordance with National Instrument 43-101 - Standards of Disclosure for Mineral Projects (“NI 43-101”) as required by Canadian securities regulatory authorities. For United States reporting purposes, the SEC has adopted amendments to its disclosure rules to modernize the mineral property disclosure requirements for issuers whose securities are registered with the SEC under the Securities and Exchange Act of 1934, as amended (the “Exchange Act”). These amendments became effective February 25, 2019 (the “SEC Modernization Rules”) with compliance required for the first fiscal year beginning on or after January 1, 2021. The SEC Modernization Rules replace the historical property disclosure requirements for mining registrants that were included in SEC Industry Guide 7, which will be rescinded from and after the required compliance date of the SEC Modernization Rules. As a result of the adoption of the SEC Modernization Rules, the SEC now recognizes estimates of “measured”, “indicated” and “inferred” mineral resources. In addition, the SEC has amended its definitions of “proven mineral reserves” and “probable mineral reserves” to be substantially similar to the corresponding Canadian Institute of Mining, Metallurgy and Petroleum definitions, as required by NI 43-101. U.S. investors should understand that “inferred” mineral resources have a great amount of uncertainty as to their existence and great uncertainty as to their economic and legal feasibility. In addition, U.S. investors are cautioned not to assume that any part or all of Barrick’s mineral resources constitute or will be converted into reserves. Mineral resource and mineral reserve estimations have been prepared by employees of Barrick, its joint venture partners or its joint venture operating companies, as applicable, under the supervision of regional Mineral Resource Managers Simon Bottoms, Africa & Middle East Mineral Resource Manager and Chad Yuhasz, Latin America & Australia Pacific Mineral Resource Manager, Craig Fiddes, North America Resource Modeling Manager and reviewed by Rodney Quick, Barrick’s Mineral Resource Management and Evaluation Executive. Reserves have been estimated based on an assumed gold price of US$1,200 per ounce, an assumed silver price of US$16.50 per ounce, and an assumed copper price of US$2.75 per pound and long-term average exchange rates of 1.30 CAD/US$, except at Zaldívar, where mineral reserves for 2020 and 2021 were calculating using Antofagasta guidance and an assumed copper price of US$3.10 per pound. Reserve estimates incorporate current and/or expected mine plans and cost levels at each property. Varying cut-off grades have been used depending on the mine and type of ore contained in the reserves. Barrick’s normal data verification procedures have been employed in connection with the calculations. Verification procedures include industry-standard quality control practices. Resources as at December 31, 2021 have been estimated using varying cut-off grades, depending on both the type of mine or project, its maturity and ore types at each property.
2.In confirming our annual reserves for each of our mineral properties, projects, and operations, we conduct a reserve test on December 31 of each year to verify that the future undiscounted cash flow from reserves is positive. The cash flow ignores all sunk costs and only considers future operating and closure expenses as well as any future capital costs.
3.All mineral resource and mineral reserve estimates of tonnes, Au oz, Ag oz and Cu lb are reported to the second significant digit.
4.Porgera mineral reserves and mineral resources are reported on a 24.5% interest basis, reflecting Barrick’s expected ownership interest following the implementation of the binding Commencement Agreement entered into by Barrick Niugini Limited (“BNL”), its affiliate Porgera (Jersey) Limited, the Government of Papua New Guinea (“PNG”), Kumul Minerals Holdings Limited, a state-owned mining company, and Mineral Resources Enga Limited, effective February 3, 2022. The Commencement Agreement replaced the Framework Agreement signed in April 2021 and provides, among other things, for ownership of Porgera to be held in a new joint venture owned 51% by PNG stakeholders and 49% by BNL or an affiliate. BNL is jointly owned on a 50/50 basis by Barrick and Zijin Mining Group and will retain operatorship of the mine under the terms of the Commencement Agreement. Efforts are ongoing to execute definitive agreements to implement the Commencement Agreement and finalize a timeline for the reopening of the Porgera mine and resumption of full mine operations. For additional information, see page 37 of Barrick’s Fourth Quarter and Year End Report 2021. 5.On October 14, 2021, NGM acquired the 40% interest in South Arturo that NGM did not already own from i-80 Gold Corp. Accordingly, Carlin mineral reserve and resource estimates include South Arturo on a 36.9% basis as at December 31, 2020, and on a 61.5% basis as at December 31, 2021. For additional information, see page 37 of Barrick’s Fourth Quarter and Year End Report 2021. 6.Cortez underground includes 20 million tonnes at 7.29 g/t for 4.8 million ounces of probable reserves, 23 million tonnes at 7.07 g/t for 5.2 million ounces of indicated resources and 14 million tonnes at 6.0 g/t for 2.8 million ounces of inferred resources related to Goldrush. As noted in endnote #9, mineral resources are reported on an inclusive basis.
7.2021 polymetallic mineral resources and mineral reserves are estimated using the combined value of gold, copper & silver and accordingly are reported as gold, copper and silver mineral resources and mineral reserves.
8.Mineral resources which are not mineral reserves do not have demonstrated economic viability.
9.Mineral resources are reported inclusive of mineral reserves.
10.All measured and indicated mineral resource estimates of grade and all proven and probable mineral reserve estimates of grade for Au g/t, Ag g/t and Cu % are reported to two decimal places.
11.All inferred mineral resource estimates of grade for Au g/t, Ag g/t and Cu % are reported to one decimal place.
12.On June 1, 2021, Barrick sold its 100% interest in the Lagunas Norte gold mine to Boroo Pte Ltd. For additional information, see page 37 of Barrick’s Fourth Quarter and Year End Report 2021.
|
|
|
|
|
|
|
|
|
| BARRICK YEAR-END 2021 |
137 |
RESERVES AND RESOURCES |
Management’s Responsibility
Management’s Responsibility for Financial Statements
The accompanying consolidated financial statements have been prepared by and are the responsibility of the Board of Directors and Management of the Company.
The consolidated financial statements have been prepared in accordance with International Financial Reporting Standards as issued by the International Accounting Standards Board and reflect Management’s best estimates and judgments based on currently available information. The Company has developed and maintains a system of internal controls in order to ensure, on a reasonable and cost effective basis, the reliability of its financial information.
The consolidated financial statements have been audited by PricewaterhouseCoopers LLP, Chartered Professional Accountants. Their report outlines the scope of their examination and opinion on the consolidated financial statements.
/s/ Graham Shuttleworth
Graham Shuttleworth
Senior Executive Vice President
and Chief Financial Officer
February 15, 2022
|
|
|
|
|
|
|
|
|
| BARRICK YEAR-END 2021 |
138 |
|
Management’s Report on Internal Control over Financial Reporting
Barrick’s management is responsible for establishing and maintaining adequate internal control over financial reporting.
Barrick’s management assessed the effectiveness of the Company’s internal control over financial reporting as at December 31, 2021. Barrick’s Management used the Internal Control – Integrated Framework (2013) as issued by the Committee of Sponsoring Organizations of the Treadway Commission (COSO) to evaluate the effectiveness of Barrick’s internal control over financial reporting. Based on management’s assessment, Barrick’s internal control over financial reporting is effective as at December 31, 2021.
The effectiveness of the Company’s internal control over financial reporting as at December 31, 2021 has been audited by PricewaterhouseCoopers LLP, Chartered Professional Accountants, as stated in their report which is located on pages 140 - 142 of Barrick’s 2021 Annual Financial Statements.
|
|
|
|
|
|
|
|
|
| BARRICK YEAR-END 2021 |
139 |
|
Report of Independent Registered Public Accounting Firm
To the Board of Directors and Shareholders of Barrick Gold Corporation
Opinions on the Financial Statements and Internal Control over Financial Reporting
We have audited the accompanying consolidated balance sheets of Barrick Gold Corporation and its subsidiaries (together, the Company) as of December 31, 2021 and 2020, and the related consolidated statements of income, comprehensive income, changes in equity, and cash flow for the years then ended, including the related notes (collectively referred to as the consolidated financial statements). We also have audited the Company's internal control over financial reporting as of December 31, 2021, based on criteria established in Internal Control – Integrated Framework (2013) issued by the Committee of Sponsoring Organizations of the Treadway Commission (COSO).
In our opinion, the consolidated financial statements referred to above present fairly, in all material respects, the financial position of the Company as of December 31, 2021 and 2020, and its financial performance and its cash flows for the years then ended in conformity with International Financial Reporting Standards as issued by the International Accounting Standards Board. Also in our opinion, the Company maintained, in all material respects, effective internal control over financial reporting as of December 31, 2021, based on criteria established in Internal Control – Integrated Framework (2013) issued by the COSO.
Basis for Opinions
The Company's management is responsible for these consolidated financial statements, for maintaining effective internal control over financial reporting, and for its assessment of the effectiveness of internal control over financial reporting, included in the accompanying Management’s Report on Internal Control over Financial Reporting. Our responsibility is to express opinions on the Company’s consolidated financial statements and on the Company's internal control over financial reporting based on our audits. We are a public accounting firm registered with the Public Company Accounting Oversight Board (United States) (PCAOB) and are required to be independent with respect to the Company in accordance with the U.S. federal securities laws and the applicable rules and regulations of the Securities and Exchange Commission and the PCAOB.
We conducted our audits in accordance with the standards of the PCAOB. Those standards require that we plan and perform the audits to obtain reasonable assurance about whether the consolidated financial statements are free of material misstatement, whether due to error or fraud, and whether effective internal control over financial reporting was maintained in all material respects.
Our audits of the consolidated financial statements included performing procedures to assess the risks of material misstatement of the consolidated financial statements, whether due to error or fraud, and performing procedures that respond to those risks. Such procedures included examining, on a test basis, evidence regarding the amounts and disclosures in the consolidated financial statements. Our audits also included evaluating the accounting principles used and significant estimates made by management, as well as evaluating the overall presentation of the consolidated financial statements. Our audit of internal control over financial reporting included obtaining an understanding of internal control over financial reporting, assessing the risk that a material weakness exists, and testing and evaluating the design and operating effectiveness of internal control based on the assessed risk. Our audits also included performing such other procedures as we considered necessary in the circumstances. We believe that our audits
provide a reasonable basis for our opinions.
PricewaterhouseCoopers LLP
PwC Tower, 18 York Street, Suite 2600, Toronto, Ontario, Canada M5J oB2
T: +1 416 863 1133, F: +1 416 365 8215
“PwC” refers to PricewaterhouseCoopers LLP, an Ontario limited liability partnership.
Definition and Limitations of Internal Control over Financial Reporting
A company’s internal control over financial reporting is a process designed to provide reasonable assurance regarding the reliability of financial reporting and the preparation of financial statements for external purposes in accordance with generally accepted accounting principles. A company’s internal control over financial reporting includes those policies and procedures that (i) pertain to the maintenance of records that, in reasonable detail, accurately and fairly reflect the transactions and dispositions of the assets of the company; (ii) provide reasonable assurance that transactions are recorded as necessary to permit preparation of financial statements in accordance with generally accepted accounting principles, and that receipts and expenditures of the company are being made only in accordance with authorizations of management and directors of the company; and (iii) provide reasonable assurance regarding prevention or timely detection of unauthorized acquisition, use, or disposition of the company’s assets that could have a material effect on the financial statements.
Because of its inherent limitations, internal control over financial reporting may not prevent or detect misstatements. Also, projections of any evaluation of effectiveness to future periods are subject to the risk that controls may become inadequate because of changes in conditions, or that the degree of compliance with the policies or procedures may deteriorate.
Critical Audit Matters
The critical audit matters communicated below are matters arising from the current period audit of the consolidated financial statements that were communicated or required to be communicated to the Audit & Risk Committee and that (i) relate to accounts or disclosures that are material to the consolidated financial statements and (ii) involved our especially challenging, subjective, or complex judgments. The communication of critical audit matters does not alter in any way our opinion on the consolidated financial statements, taken as a whole, and we are not, by communicating the critical audit matters below, providing separate opinions on the critical audit matters or on the accounts or disclosures to which they relate.
Impairment (impairment reversal) assessments for goodwill and other non-current assets
As described in Notes 2, 3, 20 and 21 to the consolidated financial statements, the Company’s goodwill and other non-current assets are tested for impairment if there is an indicator of impairment and in the case of goodwill annually during the fourth quarter. Other non-current assets are tested for impairment reversal if there is an indicator of reversal of impairment. Goodwill impairment charges are not reversible. Impairment assessments and impairment reversal assessments are conducted at the level of the cash generating unit (CGU), which is the lowest level for which identifiable cash flows are largely independent of the cash flows of other assets and includes most liabilities specific to the CGU. For operating mines and projects, the individual mine/project represents a CGU for impairment and impairment reversal assessments. The Company’s goodwill and other non-current assets balances as of December 31, 2021 were $4.8 billion and $32.8 billion, respectively. Management estimated the recoverable amounts of the CGUs as the Fair Value Less Costs of Disposal (FVLCD) using discounted estimates of future cash flows derived from the most recent life of mine (LOM) plans, estimated fair values of mineral resources outside LOM plans and the application of a specific Net Asset Value (NAV) multiple for each CGU, where applicable. Management’s estimates of FVLCD of the CGUs included significant assumptions with respect to future metal prices, operating and capital costs, weighted average costs of capital, NAV multiples, future production levels, including mineral reserves and mineral resources, and the fair value of mineral resources outside LOM plans, where applicable. Management’s estimates of future production levels, including mineral reserves and mineral resources, and the fair value of mineral resources outside LOM plans, are based on information compiled by qualified persons (management’s specialists).
The principal considerations for our determination that performing procedures relating to the impairment (impairment reversal) assessments for goodwill and other non-current assets is a critical audit matter are (i) the significant judgment by management, including the use of management’s specialists, in estimating the FVLCD of the CGUs; (ii) a high degree of auditor judgment, subjectivity and effort in performing procedures and evaluating management’s significant assumptions with respect to future metal prices, operating and capital costs, weighted average costs of capital, NAV multiples, future production levels, including mineral reserves and mineral resources, and the fair value of mineral resources outside LOM plans, where applicable; and (iii) the audit effort involved the use of professionals with specialized skill and knowledge.
Addressing the matter involved performing procedures and evaluating audit evidence in connection with forming our overall opinion on the consolidated financial statements. These procedures included testing the effectiveness of controls relating to management’s impairment (impairment reversal) assessments for goodwill and other non-current assets, including controls over the significant assumptions used in management’s estimates of the FVLCD of the CGUs. These procedures also included, among others, testing management’s process for estimating the FVLCD of the CGUs with goodwill and for each CGU where there is an indicator of impairment (or impairment reversal); evaluating the appropriateness of the methods and discounted cash flow models used; testing the completeness and accuracy of underlying data used in the models and evaluating the reasonableness of the significant assumptions used by management in the estimates of FVLCD. Evaluating the reasonableness of the significant assumptions used by management in the estimates of FVLCD with respect to future metal prices, operating and capital costs and NAV multiples involved (i) comparing future metal prices to external industry data; (ii) comparing operating and capital costs to recent actual operating and capital costs incurred and assessing whether these assumptions were consistent with evidence obtained in other areas of the audit, where appropriate; and (iii) comparing NAV multiples to evidence of value from comparable market information. The work of management’s specialists was used in performing the procedures to evaluate the reasonableness of future production levels, including mineral reserves and mineral resources, and the fair value of mineral resources outside LOM plans for certain CGUs. As a basis for using this work, the management’s specialists’ qualifications were understood and the Company’s relationship with management’s specialists was assessed. The procedures performed also included evaluation of the methods and assumptions used by management’s specialists, tests of the data used by management’s specialists and an evaluation of management’s specialists’ findings. Professionals with specialized skill and knowledge were used to assist in evaluating the appropriateness of the methods and discounted cash flow models and the reasonableness of the weighted average costs of capital and NAV multiple assumptions.
Uncertain tax positions
As described in Notes 2, 3, 30 and 35 to the consolidated financial statements, the Company is subject to assessments by various taxation authorities, who may interpret tax legislation differently than the Company. As disclosed by management, the Company operates in certain jurisdictions that have increased degrees of political and sovereign risk and while host governments have historically supported the development of natural resources by foreign companies, tax legislation in these jurisdictions is developing. Management is required to assess uncertainties and make significant judgments when assessing the outcome and amounts recorded for uncertain tax positions. If actual results are significantly different from the Company’s assessments, this could necessitate future adjustments to tax income and expense already recorded.
The principal considerations for our determination that performing procedures relating to uncertain tax positions is a critical audit matter are (i) the significant judgment by management when assessing the outcome and amounts recorded for uncertain tax positions, which include a high degree of estimation uncertainty; (ii) a high degree of auditor judgment, subjectivity and effort in performing procedures and
evaluating management’s timely identification, recognition and accurate measurement of uncertain tax positions; (iii) the evaluation of audit evidence available to support the amounts recorded for uncertain tax positions is complex and resulted in significant auditor judgment as the nature of the evidence is often highly subjective; and (iv) the audit effort involved the use of professionals with specialized skill and knowledge.
Addressing the matter involved performing procedures and evaluating audit evidence in connection with forming our overall opinion on the consolidated financial statements. These procedures included testing the effectiveness of controls relating to the identification and recognition of the amounts recorded for uncertain tax positions, controls addressing the completeness of the uncertain tax positions, and controls over the measurement of the amounts recorded, as well as consolidated financial statement disclosures. These procedures also included, among others, testing the information used in the calculations of the amounts recorded for uncertain tax positions; testing the calculations of the amounts recorded for uncertain tax positions by jurisdiction, including management’s assessment of the technical merits of tax positions; testing the completeness of management’s assessment of both the identification of uncertain tax positions and possible outcomes of each uncertain tax position by reading correspondence with taxation authorities; and evaluating the related disclosures in the consolidated financial statements. Professionals with specialized skill and knowledge were used to assist in evaluating the status and results of income tax assessments including obtaining and reading external legal advice related to management’s positions, where applicable. These professionals with specialized skill and knowledge were also used to assist in evaluating the completeness and measurement of the Company’s uncertain tax positions, including evaluating the reasonableness of management’s assessment of whether tax positions are probable of being accepted by the taxation authority, the application of relevant tax legislation, and estimated interest and penalties.
/s/PricewaterhouseCoopers LLP
Chartered Professional Accountants, Licensed Public Accountants
Toronto, Canada
February 15, 2022
We have served as the Company’s auditor since at least 1982. We have not been able to determine the specific year we began serving as auditor of the Company.
Consolidated Statements of Income
|
|
|
|
|
|
|
|
|
| Barrick Gold Corporation |
|
|
| For the years ended December 31 (in millions of United States dollars, except per share data) |
2021 |
2020 |
| Revenue (notes 5 and 6) |
$11,985 |
|
$12,595 |
|
| Costs and expenses |
|
|
| Cost of sales (notes 5 and 7) |
7,089 |
|
7,417 |
|
| General and administrative expenses (note 11) |
151 |
|
185 |
|
| Exploration, evaluation and project expenses (notes 5 and 8) |
287 |
|
295 |
|
| Impairment reversals (note 10) |
(63) |
|
(269) |
|
| Loss on currency translation |
29 |
|
50 |
|
| Closed mine rehabilitation (note 27b) |
18 |
|
90 |
|
| Income from equity investees (note 16) |
(446) |
|
(288) |
|
|
|
|
| Other (income) expense (note 9) |
(67) |
|
(178) |
|
| Income before finance items and income taxes |
4,987 |
|
5,293 |
|
| Finance costs, net (note 14) |
(355) |
|
(347) |
|
| Income before income taxes |
4,632 |
|
4,946 |
|
| Income tax expense (note 12) |
(1,344) |
|
(1,332) |
|
| Net income |
$3,288 |
|
$3,614 |
|
| Attributable to: |
|
|
| Equity holders of Barrick Gold Corporation |
$2,022 |
|
$2,324 |
|
| Non-controlling interests (note 32) |
$1,266 |
|
$1,290 |
|
| Earnings (loss) per share data attributable to the equity holders of Barrick Gold Corporation (note 13) |
|
|
| Net income |
|
|
| Basic |
$1.14 |
|
$1.31 |
|
| Diluted |
$1.14 |
|
$1.31 |
|
|
|
|
|
|
|
|
|
|
|
|
|
|
|
|
|
|
|
|
|
|
The accompanying notes are an integral part of these consolidated financial statements.
|
|
|
|
|
|
|
|
|
| BARRICK YEAR-END 2021 |
144 |
FINANCIAL STATEMENTS |
Consolidated Statements
of Comprehensive Income
|
|
|
|
|
|
|
|
|
| Barrick Gold Corporation |
|
| For the years ended December 31 (in millions of United States dollars) |
2021 |
2020 |
| Net income |
$3,288 |
|
$3,614 |
|
| Other comprehensive income (loss), net of taxes |
|
|
| Items that may be reclassified subsequently to profit or loss: |
|
|
| Unrealized losses on derivatives designated as cash flow hedges, net of tax $nil and $nil |
— |
|
(3) |
|
| Realized losses on derivatives designated as cash flow hedges, net of tax $nil and $nil |
3 |
|
4 |
|
| Currency translation adjustments, net of tax $nil and $nil |
2 |
|
(7) |
|
| Items that will not be reclassified to profit or loss: |
|
|
| Actuarial gain (loss) on post-employment benefit obligations, net of tax ($1) and $1 |
2 |
|
(6) |
|
| Net change in value of equity investments, net of tax $8 and ($38) |
(44) |
|
148 |
|
|
|
|
| Total other comprehensive (loss) income |
(37) |
|
136 |
|
| Total comprehensive income |
$3,251 |
|
$3,750 |
|
| Attributable to: |
|
|
| Equity holders of Barrick Gold Corporation |
$1,985 |
|
$2,460 |
|
| Non-controlling interests |
$1,266 |
|
$1,290 |
|
|
|
|
|
|
|
|
|
|
|
|
|
|
|
|
|
|
|
The accompanying notes are an integral part of these consolidated financial statements.
|
|
|
|
|
|
|
|
|
| BARRICK YEAR-END 2021 |
145 |
FINANCIAL STATEMENTS |
Consolidated Statements of Cash Flow
|
|
|
|
|
|
|
|
|
| Barrick Gold Corporation |
|
| For the years ended December 31 (in millions of United States dollars) |
2021 |
2020 |
| OPERATING ACTIVITIES |
|
|
| Net income |
$3,288 |
|
$3,614 |
|
| Adjustments for the following items: |
|
|
| Depreciation |
2,102 |
|
2,208 |
|
| Finance costs (note 14) |
390 |
|
364 |
|
| Net impairment reversals (note 10) |
(63) |
|
(269) |
|
| Income tax expense (note 12) |
1,344 |
|
1,332 |
|
| Income from investment in equity investees (note 16) |
(446) |
|
(288) |
|
| Loss on currency translation |
29 |
|
50 |
|
| Gain on sale of non-current assets (note 9) |
(213) |
|
(180) |
|
|
|
|
| Change in working capital (note 15) |
(273) |
|
(211) |
|
| Other operating activities (note 15) |
(203) |
|
(190) |
|
| Operating cash flows before interest and income taxes |
5,955 |
|
6,430 |
|
| Interest paid |
(303) |
|
(295) |
|
Income taxes paid1 |
(1,274) |
|
(718) |
|
| Net cash provided by operating activities |
4,378 |
|
5,417 |
|
| INVESTING ACTIVITIES |
|
|
| Property, plant and equipment |
|
|
| Capital expenditures (note 5) |
(2,435) |
|
(2,054) |
|
| Sales proceeds |
35 |
|
45 |
|
| Divestitures (note 4) |
27 |
|
283 |
|
|
|
|
| Investment (purchases) sales |
(46) |
|
220 |
|
| Dividends received from equity method investments |
520 |
|
141 |
|
| Shareholder loan repayments from equity method investments |
2 |
|
79 |
|
| Net cash used in investing activities |
(1,897) |
|
(1,286) |
|
| FINANCING ACTIVITIES |
|
|
| Lease repayments |
(20) |
|
(26) |
|
|
|
|
| Debt repayments |
(7) |
|
(353) |
|
| Dividends (note 31) |
(634) |
|
(547) |
|
| Return of capital (note 31) |
(750) |
|
— |
|
| Funding from non-controlling interests (note 32) |
12 |
|
11 |
|
| Disbursements to non-controlling interests (note 32) |
(1,104) |
|
(1,367) |
|
| Other financing activities (note 15) |
115 |
|
28 |
|
| Net cash used in financing activities |
(2,388) |
|
(2,254) |
|
| Effect of exchange rate changes on cash and equivalents |
(1) |
|
(3) |
|
| Net increase (decrease) in cash and equivalents |
92 |
|
1,874 |
|
| Cash and equivalents at beginning of year (note 25a) |
5,188 |
|
3,314 |
|
| Cash and equivalents at the end of year |
$5,280 |
|
$5,188 |
|
|
|
|
|
|
|
|
|
|
|
|
|
|
|
|
|
|
|
|
|
|
|
|
|
1 Income taxes paid excludes $69 million (2020: $203 million) of income taxes payable that were settled against offsetting VAT receivables.
The accompanying notes are an integral part of these consolidated financial statements.
|
|
|
|
|
|
|
|
|
| BARRICK YEAR-END 2021 |
146 |
FINANCIAL STATEMENTS |
Consolidated Balance Sheets
|
|
|
|
|
|
|
|
|
| Barrick Gold Corporation |
As at December 31, 2021 |
As at December 31, 2020 |
| (in millions of United States dollars) |
| ASSETS |
|
|
| Current assets |
|
|
| Cash and equivalents (note 25a) |
$5,280 |
|
$5,188 |
|
| Accounts receivable (note 18) |
623 |
|
558 |
|
| Inventories (note 17) |
1,734 |
|
1,878 |
|
| Other current assets (note 18) |
612 |
|
519 |
|
|
|
|
|
|
|
| Total current assets |
8,249 |
|
8,143 |
|
| Non-current assets |
|
|
| Non-current portion of inventory (note 17) |
2,636 |
|
2,566 |
|
| Equity in investees (note 16) |
4,594 |
|
4,670 |
|
| Property, plant and equipment (note 19) |
24,954 |
|
24,628 |
|
| Intangible assets (note 20a) |
150 |
|
169 |
|
| Goodwill (note 20b) |
4,769 |
|
4,769 |
|
| Deferred income tax assets (note 30) |
29 |
|
98 |
|
| Other assets (note 22) |
1,509 |
|
1,463 |
|
| Total assets |
$46,890 |
|
$46,506 |
|
| LIABILITIES AND EQUITY |
|
|
| Current liabilities |
|
|
| Accounts payable (note 23) |
$1,448 |
|
$1,458 |
|
| Debt (note 25b) |
15 |
|
20 |
|
| Current income tax liabilities |
285 |
|
436 |
|
| Other current liabilities (note 24) |
338 |
|
306 |
|
|
|
|
|
|
|
| Total current liabilities |
2,086 |
|
2,220 |
|
| Non-current liabilities |
|
|
| Debt (note 25b) |
5,135 |
|
5,135 |
|
| Provisions (note 27) |
2,768 |
|
3,139 |
|
| Deferred income tax liabilities (note 30) |
3,293 |
|
3,034 |
|
| Other liabilities (note 29) |
1,301 |
|
1,268 |
|
| Total liabilities |
14,583 |
|
14,796 |
|
| Equity |
|
|
| Capital stock (note 31) |
28,497 |
|
29,236 |
|
| Deficit |
(6,566) |
|
(7,949) |
|
| Accumulated other comprehensive (loss) income |
(23) |
|
14 |
|
| Other |
1,949 |
|
2,040 |
|
| Total equity attributable to Barrick Gold Corporation shareholders |
23,857 |
|
23,341 |
|
| Non-controlling interests (note 32) |
8,450 |
|
8,369 |
|
| Total equity |
32,307 |
|
31,710 |
|
| Contingencies and commitments (notes 2, 17, 19 and 36) |
|
|
| Total liabilities and equity |
$46,890 |
|
$46,506 |
|
|
|
|
|
|
|
|
|
|
|
|
|
|
|
|
|
|
|
|
|
|
|
|
|
|
|
|
The accompanying notes are an integral part of these consolidated financial statements.
|
|
|
|
|
|
|
|
|
|
|
|
|
|
|
| Signed on behalf of the Board, |
|
|
|
|
| /s/ Mark Bristow |
|
/s/ J. Brett Harvey |
|
| Mark Bristow, Director |
|
J. Brett Harvey, Director |
|
|
|
|
|
|
|
|
|
|
|
| BARRICK YEAR-END 2021 |
147 |
FINANCIAL STATEMENTS |
Consolidated Statements of Changes in Equity
|
|
|
|
|
|
|
|
|
|
|
|
|
|
|
|
|
|
|
|
|
|
|
|
|
|
|
|
|
| Barrick Gold Corporation |
|
Attributable to equity holders of the Company |
|
|
|
|
| (in millions of United States dollars) |
Common Shares (in thousands) |
Capital stock |
Deficit |
Accumulated other comprehensive (loss) income1 |
Other2 |
Total equity attributable to shareholders |
Non-controlling interests |
Total equity |
|
|
|
|
|
|
|
|
|
|
|
|
|
|
|
|
|
|
|
|
|
|
|
|
| At January 1, 2021 |
1,778,190 |
|
$29,236 |
|
($7,949) |
|
$14 |
|
$2,040 |
|
$23,341 |
|
$8,369 |
|
$31,710 |
|
|
|
| Net income |
— |
|
— |
|
2,022 |
|
— |
|
— |
|
2,022 |
|
1,266 |
|
3,288 |
|
|
|
| Total other comprehensive income |
— |
|
— |
|
— |
|
(37) |
|
— |
|
(37) |
|
— |
|
(37) |
|
|
|
| Total comprehensive income |
— |
|
$— |
|
$2,022 |
|
($37) |
|
$— |
|
$1,985 |
|
$1,266 |
|
$3,251 |
|
|
|
| Transactions with owners |
|
|
|
|
|
|
|
|
|
|
| Dividends (note 31) |
— |
|
— |
|
(634) |
|
— |
|
— |
|
(634) |
|
— |
|
(634) |
|
|
|
|
|
|
|
|
|
|
|
|
|
|
| Return of capital (note 31) |
— |
|
(750) |
|
— |
|
— |
|
— |
|
(750) |
|
— |
|
(750) |
|
|
|
| Acquisition of South Arturo non-controlling interest (note 4) |
— |
|
— |
|
— |
|
— |
|
(85) |
|
(85) |
|
(86) |
|
(171) |
|
|
|
| Issued on exercise of stock options |
50 |
|
— |
|
— |
|
— |
|
— |
|
— |
|
— |
|
— |
|
|
|
| Funding from non-controlling interests (note 32) |
— |
|
— |
|
— |
|
— |
|
— |
|
— |
|
12 |
|
12 |
|
|
|
| Disbursements to non-controlling interests (note 32) |
— |
|
— |
|
— |
|
— |
|
— |
|
— |
|
(1,111) |
|
(1,111) |
|
|
|
| Dividend reinvestment plan (note 31) |
192 |
|
5 |
|
(5) |
|
— |
|
— |
|
— |
|
— |
|
— |
|
|
|
|
|
|
|
|
|
|
|
|
|
|
| Share-based payments |
899 |
|
6 |
|
— |
|
— |
|
(6) |
|
— |
|
— |
|
— |
|
|
|
| Total transactions with owners |
1,141 |
|
($739) |
|
($639) |
|
$— |
|
($91) |
|
($1,469) |
|
($1,185) |
|
($2,654) |
|
|
|
| At December 31, 2021 |
1,779,331 |
|
$28,497 |
|
($6,566) |
|
($23) |
|
$1,949 |
|
$23,857 |
|
$8,450 |
|
$32,307 |
|
|
|
|
|
|
|
|
|
|
|
|
|
|
|
|
|
|
|
|
|
|
|
|
|
|
|
|
|
|
|
|
|
|
|
|
|
|
|
|
|
|
|
|
|
|
|
|
|
|
|
|
|
|
|
|
|
|
|
|
|
|
|
|
|
|
|
|
|
|
|
|
|
|
|
|
|
|
|
|
| At January 1, 2020 |
1,777,927 |
|
$29,231 |
|
($9,722) |
|
($122) |
|
$2,045 |
|
$21,432 |
|
$8,395 |
|
$29,827 |
|
|
|
| Net income |
— |
|
— |
|
2,324 |
|
— |
|
— |
|
2,324 |
|
1,290 |
|
3,614 |
|
|
|
| Total other comprehensive income |
— |
|
— |
|
— |
|
136 |
|
— |
|
136 |
|
— |
|
136 |
|
|
|
| Total comprehensive income |
— |
|
$— |
|
$2,324 |
|
$136 |
|
$— |
|
$2,460 |
|
$1,290 |
|
$3,750 |
|
|
|
| Transactions with owners |
|
|
|
|
|
|
|
|
|
|
| Dividends (note 31) |
— |
|
— |
|
(547) |
|
— |
|
— |
|
(547) |
|
— |
|
(547) |
|
|
|
| Issuance of 16% interest in Tanzania mines (note 21) |
— |
|
— |
|
— |
|
— |
|
— |
|
— |
|
238 |
|
238 |
|
|
|
|
|
|
|
|
|
|
|
|
|
|
| Sale of Acacia exploration properties |
— |
|
— |
|
— |
|
— |
|
(13) |
|
(13) |
|
13 |
|
— |
|
|
|
| Issued on exercise of stock options |
99 |
|
1 |
|
— |
|
— |
|
— |
|
1 |
|
— |
|
1 |
|
|
|
| Funding from non-controlling interests (note 32) |
— |
|
— |
|
— |
|
— |
|
— |
|
— |
|
11 |
|
11 |
|
|
|
| Disbursements to non-controlling interests (note 32) |
— |
|
— |
|
— |
|
— |
|
— |
|
— |
|
(1,578) |
|
(1,578) |
|
|
|
| Dividend reinvestment plan (note 31) |
164 |
|
4 |
|
(4) |
|
— |
|
— |
|
— |
|
— |
|
— |
|
|
|
| Share-based payments |
— |
|
— |
|
— |
|
— |
|
8 |
|
8 |
|
— |
|
8 |
|
|
|
| Total transactions with owners |
263 |
|
$5 |
|
($551) |
|
$— |
|
($5) |
|
($551) |
|
($1,316) |
|
($1,867) |
|
|
|
| At December 31, 2020 |
1,778,190 |
|
$29,236 |
|
($7,949) |
|
$14 |
|
$2,040 |
|
$23,341 |
|
$8,369 |
|
$31,710 |
|
|
|
1 Includes cumulative translation adjustments as at December 31, 2021: $94 million loss (December 31, 2020: $95 million loss). 2 Includes additional paid-in capital as at December 31, 2021: $1,911 million (December 31, 2020: $2,002 million).
The accompanying notes are an integral part of these consolidated financial statements.
|
|
|
|
|
|
|
|
|
| BARRICK YEAR-END 2021 |
148 |
FINANCIAL STATEMENTS |
Notes to Consolidated Financial Statements
Barrick Gold Corporation. Tabular dollar amounts in millions of United States dollars, unless otherwise shown. References to A$, ARS, C$, CLP, DOP, EUR, GBP, PGK, SAR, TZS, XOF, ZAR, and ZMW are to Australian dollars, Argentine pesos, Canadian dollars, Chilean pesos, Dominican pesos, Euros, British pound sterling, Papua New Guinea kina, Saudi riyal, Tanzanian shilling, West African CFA franc, South African rand, and Zambian kwacha, respectively.
1 n Corporate Information
Barrick Gold Corporation (“Barrick”, “we” or the “Company”) is a corporation governed by the Business Corporations Act (British Columbia). The Company’s corporate office is located at Brookfield Place, TD Canada Trust Tower, 161 Bay Street, Suite 3700, Toronto, Ontario, M5J 2S1. The Company’s registered office is 925 West Georgia Street, Suite 1600, Vancouver, British Columbia, V6C 3L2. We are principally engaged in the production and sale of gold and copper, as well as related activities such as exploration and mine development. We sell our gold and copper into the world market.
We have ownership interests in producing gold mines that are located in Argentina, Canada, Côte d’Ivoire, the Democratic Republic of Congo, the Dominican Republic, Mali, Tanzania and the United States. Our mine in Papua New Guinea was placed on care and maintenance in April 2020. We have ownership interests in producing copper mines in Chile, Saudi Arabia and Zambia. We also have exploration and development projects located throughout the Americas and Africa.
2 n Material Accounting Policy Information
a) Statement of Compliance
These consolidated financial statements have been prepared in accordance with International Financial Reporting Standards (“IFRS”) as issued by the International Accounting Standards Board (“IASB”) under the historical cost convention, as modified by revaluation of derivative contracts and certain financial assets. Accounting policies are consistently applied to all years presented, unless otherwise stated. These consolidated financial statements were approved for issuance by the Board of Directors on February 15, 2022.
b) Basis of Preparation
These consolidated financial statements include the accounts of Barrick, its subsidiaries its share of joint operations (“JO”) and its equity share of joint ventures (“JV”). For non wholly-owned, controlled subsidiaries, profit or loss for the period that is attributable to non-controlling interests is typically calculated based on the ownership of the minority shareholders in the subsidiary.
|
|
|
|
|
|
|
|
|
| BARRICK YEAR-END 2021 |
149 |
NOTES TO FINANCIAL STATEMENTS |
Outlined below is information related to our joint arrangements and entities other than 100% owned Barrick subsidiaries at December 31, 2021:
|
|
|
|
|
|
|
|
|
|
|
|
|
|
|
|
Place of business |
Entity type |
Economic interest1 |
Method2 |
Nevada Gold Mines3,4 |
United States |
Subsidiary |
61.5% |
Consolidation |
|
|
|
|
|
|
|
|
|
|
|
|
|
|
|
|
|
|
|
|
North Mara3,5 |
Tanzania |
Subsidiary |
84% |
Consolidation |
Bulyanhulu3,5 |
Tanzania |
Subsidiary |
84% |
Consolidation |
Buzwagi3,5 |
Tanzania |
Subsidiary |
84% |
Consolidation |
Loulo-Gounkoto3 |
Mali |
Subsidiary |
80% |
Consolidation |
Tongon3 |
Côte d’Ivoire |
Subsidiary |
89.7% |
Consolidation |
Pueblo Viejo3 |
Dominican Republic |
Subsidiary |
60% |
Consolidation |
| Norte Abierto Project |
Chile |
JO |
50% |
Our share |
| Donlin Gold Project |
United States |
JO |
50% |
Our share |
|
|
|
|
|
Porgera Mine6,7 |
Papua New Guinea |
JO |
47.5% |
Our share |
| Veladero |
Argentina |
JO |
50% |
Our share |
Kibali8 |
Democratic Republic of Congo |
JV |
45% |
Equity Method |
|
|
|
|
|
|
|
|
|
|
Jabal Sayid8 |
Saudi Arabia |
JV |
50% |
Equity Method |
|
|
|
|
|
Zaldívar8 |
Chile |
JV |
50% |
Equity Method |
1Unless otherwise noted, all of our JOs are funded by contributions made by the parties sharing joint control in proportion to their economic interest.
2For our JOs, we recognize our share of any assets, liabilities, revenues and expenses of the JO.
3We consolidate our interests in Carlin, Cortez, Turquoise Ridge, Phoenix, Long Canyon, North Mara, Bulyanhulu, Buzwagi, Loulo-Gounkoto, Tongon and Pueblo Viejo and record a non-controlling interest for the 38.5%, 38.5%, 38.5%, 38.5%, 38.5%, 16%, 16%, 16%, 20%, 10.3% and 40%, respectively, that we do not own.
4Included within our 61.5% interest in Carlin is Nevada Gold Mines’ (“NGM”) 60% interest in South Arturo. On September 7, 2021, NGM announced it had entered into an Exchange Agreement with i-80 Gold to acquire the 40% interest in South Arturo that NGM did not already own in exchange for the Lone Tree and Buffalo Mountain properties and infrastructure. The exchange transaction closed on October 14, 2021, bringing Barrick’s ownership of South Arturo to 61.5%.
5As part of the Framework Agreement effective January 1, 2020, the Government of Tanzania receives half of the economic benefits from the Tanzanian operations (Bulyanhulu, Buzwagi and North Mara) from taxes, royalties, clearing fees and participation in all cash distributions made by the mines, after the recoupment of capital investments. Earnings are recorded on a proportional basis based on our equity interests each period, with a true-up calculated and recorded annually to ensure the terms of the agreement are being fulfilled.
6We have joint control given that decisions about relevant activities require unanimous consent of the parties to the joint operation.
7We recognize our share of Porgera on a 47.5% interest basis, reflecting Barrick’s undisputed ownership position prior to April 24, 2020, and the ownership position Barrick is asserting in its legal proceedings in the Papua New Guinea (“PNG”) court. On August 16, 2019, the special mining lease (the “SML”) at Porgera was terminated and on April 24, 2020, the PNG government indicated that the SML would not be extended. On April 9, 2021, the PNG government and Barrick Nuigini Limited (“BNL”), the 95% owner and operator of the Porgera joint venture, agreed on a partnership for the future ownership and operation of the mine under a binding Framework Agreement. The Framework Agreement was replaced by the more detailed Commencement Agreement, which became effective on February 3, 2022. Under the terms of the binding Commencement Agreement, ownership of Porgera will be held in a new joint venture owned 51% by PNG stakeholders and 49% by BNL or an affiliate. BNL is jointly owned on a 50/50 basis by Barrick and Zijin Mining Group and therefore Barrick expects to hold a 24.5% interest in the Porgera mine following the implementation of the Commencement Agreement. BNL will retain operatorship of the mine. The parties are working towards the signing of definitive agreements, at which time, full mine recommencement work will begin. For additional information, see note 35.
8Barrick has commitments of $574 million relating to its interest in the joint ventures, including purchase obligations disclosed in note 17 and capital commitments disclosed in note 19.
c) Business Combinations
On the acquisition of a business, the acquisition method of accounting is used.
d) Foreign Currency Translation
The functional currency of all of our operations is the US dollar. We translate non-US dollar balances for these operations into US dollars as follows:
▪Property, plant and equipment (“PP&E”), intangible assets and equity method investments using the rates at the time of acquisition;
▪Fair value through other comprehensive income (“FVOCI”) equity investments using the closing exchange rate as at the balance sheet date with translation gains and losses permanently recorded in Other Comprehensive Income (“OCI”);
▪Deferred tax assets and liabilities using the closing exchange rate as at the balance sheet date with
translation gains and losses recorded in income tax expense;
▪Other assets and liabilities using the closing exchange rate as at the balance sheet date with translation gains and losses recorded in other income/expense; and
▪Income and expenses using the average exchange rate for the period, except for expenses that relate to non-monetary assets and liabilities measured at historical rates, which are translated using the same historical rate as the associated non-monetary assets and liabilities.
e) Revenue Recognition
We sell our production in the world market through the following distribution channels: gold bullion is sold in the gold spot market, to independent refineries or to our non-controlling interest holders; and gold and copper
|
|
|
|
|
|
|
|
|
| BARRICK YEAR-END 2021 |
150 |
NOTES TO FINANCIAL STATEMENTS |
concentrate is sold to independent smelting or trading companies.
Gold Bullion Sales
Gold bullion is sold primarily in the London spot market. The sale price is fixed on the date of sale based on the gold spot price. Generally, we record revenue from gold bullion sales at the time of physical delivery, which is also the date that title to the gold passes.
Concentrate Sales
Under the terms of concentrate sales contracts with independent smelting companies, gold and copper sales prices are provisionally set on a specified future date after shipment based on market prices. We record revenues under these contracts at the time of shipment, which is also when the risk and rewards of ownership pass to the smelting companies, using forward market gold and copper prices on the expected date that final sales prices will be determined. Variations between the price recorded at the shipment date and the actual final price set under the smelting contracts are caused by changes in market gold and copper prices, which result in the existence of an embedded derivative in accounts receivable. The embedded derivative is recorded at fair value each period until final settlement occurs, with changes in fair value classified as provisional price adjustments and included in revenue in the consolidated statement of income and presented separately in note 6 of these consolidated financial statements.
Streaming Arrangements
As the deferred revenue on streaming arrangements is considered variable consideration, an adjustment is made to the transaction price per unit each time there is a change in the underlying production profile of a mine (typically in the fourth quarter of each year). The change in the transaction price per unit results in a cumulative catch-up adjustment to revenue in the period in which the change is made, reflecting the new production profile expected to be delivered under the streaming agreement. A corresponding cumulative catch-up adjustment is made to accretion expense, reflecting the impact of the change in the deferred revenue balance.
f) Exploration and Evaluation
Exploration expenditures are the costs incurred in the initial search for mineral deposits with economic potential or in the process of obtaining more information about existing mineral deposits. Exploration expenditures typically include costs associated with prospecting, sampling, mapping, diamond drilling and other work involved in searching for ore.
Evaluation expenditures are the costs incurred to establish the technical and commercial viability of developing mineral deposits identified through exploration activities or by acquisition. Evaluation expenditures include the cost of (i) establishing the volume and grade of deposits through drilling of core samples, trenching and sampling activities in an ore body that is classified as either a mineral resource or a proven and probable reserve; (ii) determining the optimal methods of extraction and metallurgical and treatment processes; (iii) studies related to surveying, transportation and infrastructure requirements; (iv) permitting activities; and (v) economic evaluations to
determine whether development of the mineralized material is commercially justified, including scoping, prefeasibility and final feasibility studies.
Exploration and evaluation expenditures are expensed as incurred unless management determines that probable future economic benefits will be generated as a result of the expenditures. Once the technical feasibility and commercial viability of a program or project has been demonstrated with a prefeasibility study, and we have recognized reserves in accordance with the Canadian Securities Administrators’ National Instrument 43-101 - Standards of Disclosure for Mineral Projects, we account for future expenditures incurred in the development of that program or project in accordance with our policy for Property, Plant and Equipment, as described in note 2l.
g) Production Stage
A mine that is under construction is determined to enter the production stage when the project is in the location and condition necessary for it to be capable of operating in the manner intended by management. We use the following factors to assess whether these criteria have been met: (1) the level of capital expenditures compared to construction cost estimates; (2) the completion of a reasonable period of commissioning and testing of mine plant and equipment; (3) the ability to produce minerals in saleable form (within specifications); and (4) the ability to sustain ongoing production of minerals.
When a mine construction project moves into the production stage, the capitalization of certain mine construction costs ceases and costs are either capitalized to inventory or expensed, except for capitalizable costs related to property, plant and equipment additions or improvements, open pit stripping activities that provide a future benefit, underground mine development or expenditures that meet the criteria for capitalization in accordance with IAS 16 Property, Plant and Equipment.
h) Taxation
Current tax for each taxable entity is based on the local taxable income at the local statutory tax rate enacted or substantively enacted at the balance sheet date and includes adjustments to tax payable or recoverable in respect of previous periods.
Deferred tax is recognized using the balance sheet method in respect of all temporary differences between the tax bases of assets and liabilities, and their carrying amounts for financial reporting purposes, except as indicated below.
Deferred income tax liabilities are recognized for all taxable temporary differences, except:
•Where the deferred income tax liability arises from the initial recognition of goodwill, or the initial recognition of an asset or liability in an acquisition that is not a business combination and, at the time of the acquisition, affects neither the accounting profit nor taxable profit or loss; and
•In respect of taxable temporary differences associated with investments in subsidiaries and interests in joint arrangements, where the timing of the reversal of the temporary differences can be controlled and it is probable that the temporary differences will not reverse in the foreseeable future.
|
|
|
|
|
|
|
|
|
| BARRICK YEAR-END 2021 |
151 |
NOTES TO FINANCIAL STATEMENTS |
Deferred income tax assets are recognized for all deductible temporary differences and the carry forward of unused tax assets and unused tax losses, to the extent that it is probable that taxable profit will be available against which the deductible temporary differences and the carry forward of unused tax assets and unused tax losses can be utilized, except:
•Where the deferred income tax asset relating to the deductible temporary difference arises from the initial recognition of an asset or liability in an acquisition that is not a business combination and, at the time of the acquisition, affects neither the accounting profit nor taxable profit or loss; and
•In respect of deductible temporary differences associated with investments in subsidiaries and interests in joint arrangements, deferred tax assets are recognized only to the extent that it is probable that the temporary differences will reverse in the foreseeable future and taxable profit will be available against which the temporary differences can be utilized.
The carrying amount of deferred income tax assets is reviewed at each balance sheet date and reduced to the extent that it is no longer probable that sufficient taxable profit will be available to allow all or part of the deferred income tax asset to be utilized. To the extent that an asset not previously recognized fulfills the criteria for recognition, a deferred income tax asset is recorded.
Deferred tax is measured on an undiscounted basis at the tax rates that are expected to apply in the periods in which the asset is realized or the liability is settled, based on tax rates and tax laws enacted or substantively enacted at the balance sheet date.
Current and deferred tax relating to items recognized directly in equity are recognized in equity and not in the income statement.
The Company is subject to assessments by various taxation authorities, who may interpret tax legislation differently than the Company. Tax liabilities for uncertain tax positions are adjusted by the Company to reflect its best estimate of the probable outcome of assessments and in light of changing facts and circumstances, such as the completion of a tax audit, expiration of a statute of limitations, the refinement of an estimate, and interest accruals associated with the uncertain tax positions until they are resolved. Some of these adjustments require significant judgment in estimating the timing and amount of any additional tax expense.
Royalties and Special Mining Taxes
Income tax expense includes the cost of royalties and special mining taxes payable to governments that are calculated based on a percentage of taxable profit whereby taxable profit represents net income adjusted for certain items defined in the applicable legislation.
Indirect Taxes
Indirect tax recoverable is recorded at its undiscounted amount, and is disclosed as non-current if not expected to be recovered within twelve months.
i) Other Investments
Investments in publicly quoted equity securities that are neither subsidiaries nor associates are categorized as FVOCI pursuant to the irrevocable election available in
IFRS 9 for these instruments. FVOCI equity investments are recorded at fair value with all realized and unrealized gains and losses recorded permanently in OCI. Warrant investments are classified as fair value through profit or loss (“FVPL”).
j) Inventory
Material extracted from our mines is classified as either ore or waste. Ore represents material that, at the time of extraction, we expect to process into a saleable form and sell at a profit. Raw materials are comprised of both ore in stockpiles and ore on leach pads as processing is required to extract benefit from the ore. Ore is accumulated in stockpiles that are subsequently processed into gold/copper in a saleable form. The recovery of gold and copper from certain oxide ores is achieved through the heap leaching process. Work in process represents gold/copper in the processing circuit that has not completed the production process, and is not yet in a saleable form. Finished goods inventory represents gold/copper in saleable form.
Metal inventories are valued at the lower of cost and net realizable value. Cost is determined on a weighted average basis and includes all costs incurred, based on a normal production capacity, in bringing each product to its present location and condition. Cost of inventories comprises direct labor, materials and contractor expenses, including non-capitalized stripping costs; depreciation on PP&E including capitalized stripping costs; and an allocation of general and administrative costs. As ore is removed for processing, costs are removed based on the average cost per ounce/pound in the stockpile. Net realizable value is determined with reference to relevant market prices less applicable variable selling and processing costs.
Mine operating supplies represent commodity consumables and other raw materials used in the production process, as well as spare parts and other maintenance supplies that are not classified as capital items. Provisions are recorded to reduce mine operating supplies to net realizable value, which is generally calculated by reference to its salvage or scrap value, when it is determined that the supplies are obsolete. Inventory provisions are reversed to reflect subsequent recoveries in net realizable value where the inventory is still on hand.
k) Royalties
Certain of our properties are subject to royalty arrangements based on mineral production at the properties. The primary type of royalty is a net smelter return (“NSR”) royalty. Under this type of royalty we pay the holder an amount calculated as the royalty percentage multiplied by the value of gold production at market gold prices less third-party smelting, refining and transportation costs. Royalty expense is recorded on completion of the production or sales process in cost of sales. Other types of royalties include:
•Net profits interest (“NPI”) royalty to a party other than a government,
•Modified net smelter return (“NSR”) royalty,
•Net smelter return sliding scale (“NSRSS”) royalty,
•Gross proceeds sliding scale (“GPSS”) royalty,
•Gross smelter return (“GSR”) royalty,
•Net value (“NV”) royalty,
•Land tenement (“LT”) royalty, and a
•Gold revenue royalty.
|
|
|
|
|
|
|
|
|
| BARRICK YEAR-END 2021 |
152 |
NOTES TO FINANCIAL STATEMENTS |
l) Property, Plant and Equipment
Estimated useful lives of Major Asset Categories
|
|
|
|
|
|
| Buildings, plant and equipment |
1 - 38 years |
| Underground mobile equipment |
3 - 7 years |
| Light vehicles and other mobile equipment |
1 - 7 years |
| Furniture, computer and office equipment |
1 - 7 years |
Buildings, Plant and Equipment
At acquisition, we record buildings, plant and equipment at cost, including all expenditures incurred to prepare an asset for its intended use. These expenditures consist of: the purchase price; brokers’ commissions; and installation costs including architectural, design and engineering fees, legal fees, survey costs, site preparation costs, freight charges, transportation insurance costs, duties, testing and preparation charges.
Buildings, plant and equipment are depreciated on a straight-line basis over their expected useful life, which commences when the assets are considered available for use. Once buildings, plant and equipment are considered available for use, they are measured at cost less accumulated depreciation and applicable impairment losses.
Depreciation on equipment utilized in the development of assets, including open pit and underground mine development, is recapitalized as development costs attributable to the related asset.
Mineral Properties
Mineral properties consist of: the fair value attributable to mineral reserves and resources acquired in a business combination or asset acquisition; underground mine development costs; open pit mine development costs; capitalized exploration and evaluation costs; and capitalized interest. In addition, we incur project costs which are generally capitalized when the expenditures result in a future benefit.
i) Acquired Mining Properties
On acquisition of a mining property, we prepare an estimate of the fair value attributable to the proven and probable mineral reserves, mineral resources and exploration potential attributable to the property. The estimated fair value attributable to the mineral reserves and the portion of mineral resources considered to be probable of economic extraction at the time of the acquisition is depreciated on a units of production (“UOP”) basis whereby the denominator is the proven and probable reserves and the portion of mineral resources considered to be probable of economic extraction based on the current life of mine (“LOM”) plan that benefit from the development and are considered probable of economic extraction. The estimated fair value attributable to mineral resources that are not considered to be probable of economic extraction at the time of the acquisition is not subject to depreciation until the resources become probable of economic extraction in the future. The estimated fair value attributable to exploration licenses is recorded as an intangible asset and is not subject to depreciation until the property enters production.
ii) Underground Mine Development Costs
At our underground mines, we incur development costs to build new shafts, drifts and ramps that will enable us to physically access ore underground. The time over which we will continue to incur these costs depends on the mine life. These underground development costs are capitalized as incurred.
Capitalized underground development costs are depreciated on a UOP basis, whereby the denominator is the estimated ounces/pounds of gold/copper in proven and probable reserves and the portion of resources considered probable of economic extraction based on the current LOM plan that benefit from the development and are considered probable of economic extraction.
iii) Open Pit Mine Development Costs
In open pit mining operations, it is necessary to remove overburden and other waste materials to access ore from which minerals can be extracted economically. The process of mining overburden and waste materials is referred to as stripping. Stripping costs incurred in order to provide initial access to the ore body (referred to as pre-production stripping) are capitalized as open pit mine development costs.
Pre-production stripping costs are capitalized until an “other than de minimis” level of mineral is extracted, after which time such costs are either capitalized to inventory or, if it qualifies as an open pit stripping activity that provides a future benefit, to PP&E. We consider various relevant criteria to assess when an “other than de minimis” level of mineral is produced. Some of the criteria considered would include, but are not limited to, the following: (1) the amount of minerals mined versus total ounces in ore expected over the LOM; (2) the amount of ore tonnes mined versus total LOM expected ore tonnes mined; (3) the current stripping ratio versus the strip ratio expected over the LOM; and (4) the ore grade mined versus the grade expected over the LOM.
Stripping costs incurred during the production stage of an open pit are accounted for as costs of the inventory produced during the period that the stripping costs are incurred, unless these costs are expected to provide a future economic benefit to an identifiable component of the ore body. Components of the ore body are based on the distinct development phases identified by the mine planning engineers when determining the optimal development plan for the open pit. Production phase stripping costs generate a future economic benefit when the related stripping activity: (1) improves access to a component of the ore body to be mined in the future; (2) increases the fair value of the mine (or open pit) as access to future mineral reserves becomes less costly; and (3) increases the productive capacity or extends the productive life of the mine (or open pit). Production phase stripping costs that are expected to generate a future economic benefit are capitalized as open pit mine development costs.
Capitalized open pit mine development costs are depreciated on a UOP basis whereby the denominator is the estimated ounces/pounds of gold/copper in proven and probable reserves and the portion of resources considered probable of economic extraction based on the current LOM plan that benefit from the development and are considered probable of economic extraction.
|
|
|
|
|
|
|
|
|
| BARRICK YEAR-END 2021 |
153 |
NOTES TO FINANCIAL STATEMENTS |
Construction-in-Progress
Assets under construction are capitalized as construction-in-progress until the asset is available for use. The cost of construction-in-progress comprises its purchase price and any costs directly attributable to bringing it into working condition for its intended use. Construction-in-progress amounts related to development projects are included in the carrying amount of the development project. Construction-in-progress amounts incurred at operating mines are presented as a separate asset within PP&E. Construction-in-progress also includes deposits on long lead items. Construction-in-progress is not depreciated. Depreciation commences once the asset is complete, commissioned and available for use.
Capitalized Interest
We capitalize interest costs for qualifying assets. Qualifying assets are assets that require a significant amount of time to prepare for their intended use, including projects that are in the exploration and evaluation, development or construction stages. Qualifying assets also include significant expansion projects at our operating mines. Capitalized interest costs are considered an element of the cost of the qualifying asset which is determined based on gross expenditures incurred on an asset. Capitalization ceases when the asset is substantially complete or if active development is suspended or ceases. Where the funds used to finance a qualifying asset form part of general borrowings, the amount capitalized is calculated using a weighted average of rates applicable to the relevant borrowings during the period. Where funds borrowed are directly attributable to a qualifying asset, the amount capitalized represents the borrowing costs specific to those borrowings. Where surplus funds available out of money borrowed specifically to finance a project are temporarily invested, the total capitalized interest is reduced by income generated from short-term investments of such funds.
m) Impairment (and Reversals of Impairment) of Non-Current Assets
We review and test the carrying amounts of PP&E and intangible assets with finite lives when an indicator of impairment is considered to exist. Impairment assessments on PP&E and intangible assets are conducted at the level of the cash generating unit (“CGU”), which is the lowest level for which identifiable cash flows are largely independent of the cash flows of other assets and includes most liabilities specific to the CGU. For operating mines and projects, the individual mine/project represents a CGU for impairment testing.
The recoverable amount of a CGU is the higher of Value in Use (“VIU”) and Fair Value Less Costs of Disposal (“FVLCD”). We have determined that the FVLCD is greater than the VIU amounts and is therefore used as the recoverable amount for impairment testing purposes. An impairment loss is recognized for any excess of the carrying amount of a CGU over its recoverable amount where both the recoverable amount and carrying value include the associated other assets and liabilities, including taxes where applicable, of the CGU. Where it is not appropriate to allocate the loss to a separate asset, an impairment loss related to a CGU is allocated to the carrying amount of the assets of the CGU on a pro rata basis based on the carrying amount of its non-monetary assets.
Impairment Reversal
An assessment is made at each reporting date to determine whether there is an indication that previously recognized impairment losses may no longer exist or may have decreased. A previously recognized impairment loss is reversed only if there has been a change in the assumptions used to determine the CGU’s recoverable amount since the last impairment loss was recognized. This reversal is recognized in the consolidated statements of income and is limited to the carrying value that would have been determined, net of any depreciation where applicable, had no impairment charge been recognized in prior years. When an impairment reversal is undertaken, the recoverable amount is assessed by reference to the higher of VIU and FVLCD. We have determined that the FVLCD is greater than the VIU amounts and is therefore used as the recoverable amount for impairment testing purposes.
n) Intangible Assets
On acquisition of a mineral property in the exploration stage, we prepare an estimate of the fair value attributable to the exploration licenses acquired, including the fair value attributable to mineral resources, if any, of that property. The fair value of the exploration license is recorded as an intangible asset (acquired exploration potential) as at the date of acquisition. When an exploration stage property moves into development, the acquired exploration potential attributable to that property is transferred to mining interests within PP&E.
We also have water rights associated with our mineral properties. Upon acquisition, they are measured at initial cost and are depreciated when they are being used. They are also subject to impairment testing when an indicator of impairment is considered to exist.
o) Goodwill
Goodwill is tested for impairment in the fourth quarter and also when there is an indicator of impairment. At the date of acquisition, goodwill is assigned to the CGU or group of CGUs that is expected to benefit from the synergies of the business combination. For the purposes of impairment testing, goodwill is allocated to the Company’s operating segments, which are our individual minesites, and corresponds to the level at which goodwill is internally monitored by the Chief Operating Decision Maker (“CODM”). Goodwill impairment charges are not reversible.
p) Debt
Debt is recognized initially at fair value, net of financing costs incurred, and subsequently measured at amortized cost. Any difference between the amounts originally received and the redemption value of the debt is recognized in the consolidated statements of income over the period to maturity using the effective interest method.
q) Environmental Rehabilitation Provision
Mining, extraction and processing activities normally give rise to obligations for environmental rehabilitation. Rehabilitation work can include facility decommissioning and dismantling; removal or treatment of waste materials; site and land rehabilitation, including compliance with and monitoring of environmental regulations; security and other site-related costs required to perform the rehabilitation work; and operation of equipment designed to reduce or eliminate environmental effects. The extent of work required
|
|
|
|
|
|
|
|
|
| BARRICK YEAR-END 2021 |
154 |
NOTES TO FINANCIAL STATEMENTS |
and the associated costs are dependent on the requirements of relevant authorities and our environmental policies. Routine operating costs that may impact the ultimate closure and rehabilitation activities, such as waste material handling conducted as an integral part of a mining or production process, are not included in the provision. Abnormal costs arising from unforeseen circumstances, such as the contamination caused by unplanned discharges, are recognized as an expense and liability when the event that gives rise to an obligation occurs and reliable estimates of the required rehabilitation costs can be made.
Provisions for the cost of each rehabilitation program are normally recognized at the time that an environmental disturbance occurs or a new legal or constructive obligation is determined. When the extent of disturbance increases over the life of an operation, the provision is increased accordingly. The major parts of the carrying amount of provisions relate to closure/rehabilitation of tailings facilities, heap leach pads and waste dumps; demolition of buildings/mine facilities; ongoing water treatment; and ongoing care and maintenance and security of closed mines. Costs included in the provision encompass all closure and rehabilitation activity expected to occur progressively over the life of the operation at the time of closure and post-closure in connection with disturbances as at the reporting date. Estimated costs included in the determination of the provision reflect the risks and probabilities of alternative estimates of cash flows required to settle the obligation at each particular operation. The expected rehabilitation costs are estimated based on the cost of external contractors performing the work or the cost of performing the work internally depending on management’s intention.
The timing of the actual rehabilitation expenditure is dependent upon a number of factors such as the life and nature of the asset, the operating license conditions and the environment in which the mine operates. Expenditures may occur before and after closure and can continue for an extended period of time depending on rehabilitation requirements. Rehabilitation provisions are measured at the expected value of future cash flows, which exclude the effect of inflation, discounted to their present value using a current US dollar real risk-free pre-tax discount rate. The unwinding of the discount, referred to as accretion expense, is included in finance costs and results in an increase in the amount of the provision. Provisions are updated each reporting period for changes to expected cash flows and for the effect of changes in the discount rate, and the change in estimate is added or deducted from the related asset and depreciated over the expected economic life of the operation to which it relates.
Significant judgments and estimates are involved in forming expectations of future activities, the amount and timing of the associated cash flows and the period over which we estimate those cash flows. Those expectations are formed based on existing environmental and regulatory requirements or, if more stringent, our environmental policies which give rise to a constructive obligation.
When provisions for closure and rehabilitation are initially recognized, the corresponding cost is capitalized as an asset, representing part of the cost of acquiring the future economic benefits of the operation. The capitalized cost of closure and rehabilitation activities is recognized in
PP&E and depreciated over the expected economic life of the operation to which it relates.
Adjustments to the estimated amount and timing of future closure and rehabilitation cash flows are a normal occurrence in light of the significant judgments and estimates involved. The principal factors that can cause expected cash flows to change are: the construction of new processing facilities; changes in the quantities of material in reserves and resources with a corresponding change in the life of mine plan; changing ore characteristics that impact required environmental protection measures and related costs; changes in water quality or volumes that impact the extent of water treatment required; changes in discount rates; changes in foreign exchange rates; changes in Barrick’s closure policies; and changes in laws and regulations governing the protection of the environment.
Rehabilitation provisions are adjusted as a result of changes in estimates and assumptions. Those adjustments are accounted for as a change in the corresponding cost of the related assets, including the related mineral property, except where a reduction in the provision is greater than the remaining net book value of the related assets, in which case the value is reduced to nil and the remaining adjustment is recognized in the consolidated statements of income. In the case of closed sites, changes in estimates and assumptions are recognized immediately in the consolidated statements of income. For an operating mine, the adjusted carrying amount of the related asset is depreciated prospectively. Adjustments also result in changes to future finance costs. Provisions are discounted to their present value using a current US dollar real risk-free pre-tax discount rate and the accretion expense is included in finance costs.
r) Stock-Based Compensation
We recognize the expense related to these plans over the vesting period, beginning once the grant has been approved and announced to the beneficiaries.
Cash-settled awards are measured at fair value initially using the market value of the underlying shares on the day preceding the date of the grant of the award and are required to be remeasured to fair value at each reporting date until settlement. The cost is then recorded over the vesting period of the award. This expense, and any changes in the fair value of the award, is recorded to the same expense category as the award recipient’s payroll costs. The cost of a cash-settled award is recorded within liabilities until settled. Barrick offers cash-settled (Restricted Share Units (“RSU”), Deferred Share Units (“DSU”) and Performance Granted Share Units (“PGSU”)) awards to certain employees, officers and directors of the Company.
We use the accelerated method (also referred to as ‘graded’ vesting) for attributing stock option expense over the vesting period. Stock option expense incorporates an expected forfeiture rate. The expected forfeiture rate is estimated based on historical forfeiture rates and expectations of future forfeiture rates. We make adjustments if the actual forfeiture rate differs from the expected rate.
Restricted Share Units
Under our Long-Term Incentive Plan, selected employees are granted RSUs where each RSU has a value equal to one Barrick common share. RSUs generally vest within three years in cash and the after-tax value of the award
|
|
|
|
|
|
|
|
|
| BARRICK YEAR-END 2021 |
155 |
NOTES TO FINANCIAL STATEMENTS |
may be used to purchase common shares on the open market, depending on the terms of the grant. Additional RSUs are credited to reflect dividends paid on Barrick common shares over the vesting period.
A liability for RSUs is measured at fair value on the grant date and is subsequently adjusted for changes in fair value. The liability is recognized on a straight-line basis over the vesting period, with a corresponding charge to compensation expense, as a component of general and administrative expenses and cost of sales. Compensation expenses for RSUs incorporate an estimate for expected forfeiture rates based on which the fair value is adjusted.
Deferred Share Units
Under our DSU plan, Directors must receive at least 63.6% of their basic annual retainer in the form of DSUs or cash to purchase common shares that cannot be sold, transferred or otherwise disposed of until the Director leaves the Board. Each DSU has the same value as one Barrick common share. DSUs must be retained until the Director leaves the Board, at which time the cash value of the DSUs is paid out. Additional DSUs are credited to reflect dividends paid on Barrick common shares. The initial fair value of the liability is calculated as of the grant date and is recognized immediately. Subsequently, at each reporting date and on settlement, the liability is remeasured, with any change in fair value recorded as compensation expense in the period. Officers may also elect to receive a portion or all of their incentive compensation in the form of DSUs. We also allow granting of DSUs to other officers and employees at the discretion of the Board Compensation Committee.
Performance Granted Share Units
Under our PGSU plan, selected employees are granted PGSUs, where each PGSU has a value equal to one Barrick common share. Annual PGSU awards are determined based on a multiple ranging from three to six times base salary (depending on position and level of responsibility) multiplied by a performance factor. The number of PGSUs granted to a plan participant is determined by dividing the dollar value of the award by the closing price of Barrick common shares on the day prior to the grant, or if the grant date occurs during a blackout period, by the greater of (i) the closing price of Barrick common shares on the day prior to the grant date and (ii) the closing price of Barrick Common Shares on the first day following the expiration of the blackout.
PGSUs vest within three years in cash, and the after-tax value of the award is used to purchase common shares on the open market. Generally, these shares cannot be sold until the employee meets their share ownership requirement (in which case only those Barrick Shares in excess of the requirement can be sold), or until they retire or leave the company.
The initial fair value of the liability is calculated as of the grant date and is recognized within compensation expense using the straight-line method over the vesting period. Subsequently, at each reporting date and on settlement, the liability is remeasured, with any changes in fair value recorded as compensation expense.
s) New Accounting Standards Adopted during the Year
Disclosure of Accounting Policies (Amendments to IAS 1 Presentation of Financial Statements)
We have early adopted ‘Disclosure of Accounting Policies (Amendments to IAS 1 Presentation of Financial Statements)’ starting with these financial statements. The amendments to IAS 1 provide guidance and examples to help entities apply materiality judgments to the accounting policy disclosures included in this note 2.
t) New Accounting Standards Issued But Not Yet Effective
Certain new accounting standards and interpretations have been published that are not mandatory for the current period and have not been early adopted. These standards are not expected to have a material impact on Barrick in the current or future reporting periods.
|
|
|
|
|
|
|
|
|
| BARRICK YEAR-END 2021 |
156 |
NOTES TO FINANCIAL STATEMENTS |
3 n Critical Judgments, Estimates, Assumptions and Risks
Many of the amounts included in the consolidated balance sheet require management to make judgments and/or estimates. These judgments and estimates are continuously evaluated and are based on management’s experience and knowledge of the relevant facts and circumstances. Actual results may differ from the estimates. Information about such judgments and estimates is contained in the description of our accounting policies and/or other notes to the financial statements. The key areas where judgments, estimates and assumptions have been made are summarized below.
Life of Mine (“LOM”) Plans and Reserves and Resources
Estimates of the quantities of proven and probable mineral reserves and mineral resources form the basis for our LOM plans, which are used for a number of important business and accounting purposes, including: the calculation of depreciation expense; the capitalization of production phase stripping costs; the current/non-current classification of inventory; the recognition of deferred revenue related to streaming arrangements and forecasting the timing of the payments related to the environmental rehabilitation provision. In addition, the underlying LOM plans are used in the impairment tests for goodwill and non-current assets. In certain cases, these LOM plans have made assumptions about our ability to obtain the necessary permits required to complete the planned activities. We estimate our mineral reserves and resources based on information compiled by qualified persons as defined in accordance with the Canadian Securities Administrators’ National Instrument 43-101 - Standards of Disclosure for Mineral Projects requirements. To calculate our gold reserves, as at December 31, 2021, we have used a gold price assumption of $1,200 per ounce, consistent with the prior year. To calculate our measured, indicated, and inferred gold resources, as at December 31, 2021, we have used a gold price assumption of $1,500 per ounce, consistent with the prior year. Refer to notes 19 and 21.
Inventory
The measurement of inventory including the determination of its net realizable value, especially as it relates to ore in stockpiles, involves the use of estimates. Net realizable value is determined with reference to relevant market prices less applicable variable selling expenses. Estimation is also required in determining the tonnage, recoverable gold and copper contained therein, and in determining the remaining costs of completion to bring inventory into its saleable form. Judgment also exists in determining whether to recognize a provision for obsolescence on mine operating supplies, and estimates are required to determine salvage or scrap value of supplies.
Estimates of recoverable gold or copper on the leach pads are calculated from the quantities of ore placed on the leach pads (measured tonnes added to the leach pads), the grade of ore placed on the leach pads (based on assay data) and a recovery percentage (based on ore type).
Impairment and Reversal of Impairment for Non-Current Assets and Impairment of Goodwill
Goodwill and non-current assets are tested for impairment if there is an indicator of impairment or reversal of impairment, and in the case of goodwill annually during the fourth quarter, for all of our operating segments. We consider both external and internal sources of information for indications that non-current assets and/or goodwill are impaired. External sources of information we consider include changes in the market, economic, legal and permitting environment in which the CGU operates that are not within its control and affect the recoverable amount of mining interests and goodwill. Internal sources of information we consider include the manner in which mining properties and plant and equipment are being used or are expected to be used and indications of economic performance of the assets. Calculating the FVLCD of CGUs for non-current asset and goodwill impairment tests requires management to make estimates and assumptions with respect to future production levels, operating, capital and closure costs in our LOM plans, future metal prices, foreign exchange rates, Net Asset Value (“NAV”) multiples, fair value of mineral resources outside LOM plans in relation to the assumptions related to comparable entities and the market values per ounce and per pound and weighted average costs of capital. Changes in any of the assumptions or estimates used in determining the fair values could impact the impairment analysis. Refer to notes 2m, 2o and 21 for further information.
Provisions for Environmental Rehabilitation
Management assesses its provision for environmental rehabilitation on an annual basis or when new information becomes available. This assessment includes the estimation of the future rehabilitation costs (including water treatment), the timing of these expenditures, and the impact of changes in discount rates and foreign exchange rates. The actual future expenditures may differ from the amounts currently provided if the estimates made are significantly different than actual results or if there are significant changes in environmental and/or regulatory requirements in the future. Refer to notes 2q and 27 for further information.
Taxes
Management is required to assess uncertainties and make judgments and estimations regarding the tax basis of assets and liabilities and related deferred income tax assets and liabilities, amounts recorded for uncertain tax positions, the measurement of income tax expense and indirect taxes such as royalties and export duties, and estimates of the timing of repatriation of earnings, which would impact the recognition of withholding taxes and taxes related to the outside basis on subsidiaries/associates. While these amounts represent management’s best estimate based on the laws and regulations that exist at the time of preparation, we operate in certain jurisdictions that have increased degrees of political and sovereign risk and while host governments have historically supported the development of natural resources by foreign companies, tax legislation in these jurisdictions is developing and there is a risk that fiscal reform changes with respect to existing investments could unexpectedly impact application of this tax legislation. Such changes could impact the Company’s judgments about the amounts recorded for uncertain tax positions, tax basis of assets and liabilities, and related
|
|
|
|
|
|
|
|
|
| BARRICK YEAR-END 2021 |
157 |
NOTES TO FINANCIAL STATEMENTS |
deferred income tax assets and liabilities, and estimates of the timing of repatriation of earnings. This could necessitate future adjustments to tax income and expense already recorded. A number of these estimates require management to make estimates of future taxable profit, as well as the recoverability of indirect taxes, and if actual results are significantly different than our estimates, the ability to realize the deferred tax assets and indirect tax receivables recorded on our balance sheet could be impacted. Refer to notes 2h, 12, 30 and 35 for further information.
Contingencies
Contingencies can be either possible assets or possible liabilities arising from past events which, by their nature, will only be resolved when one or more future events not wholly within our control occur or fail to occur. The assessment of such contingencies inherently involves the exercise of significant judgment and estimates of the outcome of future events. In assessing loss contingencies related to legal proceedings that are pending against us or unasserted claims that may result in such proceedings or regulatory or government actions that may negatively impact our business or operations, the Company with assistance from its legal counsel evaluates the perceived merits of any legal proceedings or unasserted claims or actions as well as the perceived merits of the nature and amount of relief sought or expected to be sought, when determining the amount, if any, to recognize as a contingent liability or assessing the impact on the carrying value of assets. If the assessment of a contingency suggests that a loss is probable, and the amount can be reliably estimated, then a loss is recorded. When a contingent loss is not probable but is reasonably possible, or is probable but the amount of loss cannot be reliably estimated, then details of the contingent loss are disclosed. Loss contingencies considered remote are generally not disclosed unless they involve guarantees, in which case we disclose the nature of the guarantee. Contingent assets are not recognized in the consolidated financial statements. Refer to note 35 for more information.
Pascua-Lama Value Added Tax
The Pascua-Lama project received $411 million as at December 31, 2021 ($459 million as at December 31, 2020) in value added tax (“VAT”) refunds in Chile relating to the development of the Chilean side of the project. Under the current arrangement this amount must be repaid if the project does not evidence exports for an amount of $3,538 million within a term that expires on December 31, 2026, unless extended.
In addition, we have recorded $48 million in VAT recoverable in Argentina as at December 31, 2021 ($53 million as at December 31, 2020) relating to the development of the Argentinean side of the project. These amounts may not be fully recoverable if the project does not enter into production and are subject to foreign currency risk as the amounts are recoverable in Argentine pesos.
Streaming Transactions
The upfront cash deposit received from Royal Gold on the gold and silver streaming transaction for production linked to Barrick’s 60% interest in the Pueblo Viejo mine has been accounted for as deferred revenue since we have determined that it is not a derivative as it will be satisfied through the delivery of non-financial items (i.e., gold and silver) rather than cash or financial assets. It is our intention to settle the obligations under the streaming arrangement
through our own production and if we were to fail to settle the obligations with Royal Gold through our own production, this would lead to the streaming arrangement becoming a derivative. This would cause a change to the accounting treatment, resulting in the revaluation of the fair value of the agreement through profit and loss on a recurring basis. Refer to note 29 for further details.
The deferred revenue component of our streaming agreements is considered variable and is subject to retroactive adjustment when there is a change in the timing of the delivery of ounces or in the underlying production profile of the relevant mine. The impact of such a change in the timing or quantity of ounces to be delivered under a streaming agreement will result in retroactive adjustments to both the deferred revenue recognized and the accretion recorded prior to the date of the change. Refer to note 2e. For further details on streaming transactions, including our silver sale agreement with Wheaton Precious Metals Corp. (“Wheaton”), refer to note 29.
Covid-19
On March 11, 2020, the Covid-19 outbreak was declared a pandemic by the World Health Organization. The pandemic and efforts to contain it have had a significant effect on commodity prices and capital markets. We continue to enforce certain operating procedures to respond to Covid-19, and to date, our operations have not been significantly impacted by the pandemic with the exception of Veladero, where the commissioning of the Phase 6 leach pad was delayed to the second quarter of 2021 following movement restrictions implemented by the government of Argentina during the construction phase. Hemlo also experienced a slower ramp-up of underground development in 2021 due to Covid-19 movement restrictions which impacted production. Notwithstanding the proactive and considered actions taken to maintain a safe workplace, it is possible that in the future there will be negative impacts on our operations or supply chain and the pandemic and associated disruptions may trigger actions such as reduced mining and production activities at our operations. This could have a material adverse effect on our cash flows, earnings, results of operations and financial position.
Our sites have continued to produce and sell their production, with no significant disruptions to date other than Veladero and Hemlo, as noted above. Our ability to maintain production across our operations combined with increased market gold prices, has resulted in Barrick being able to deliver $4.4 billion in operating cash flow for the year ended December 31, 2021. Barrick has $5.3 billion in cash, an undrawn $3.0 billion credit facility and no significant debt repayments due until 2033, providing us with sufficient liquidity to manage through this period of uncertainty.
|
|
|
|
|
|
|
|
|
| BARRICK YEAR-END 2021 |
158 |
NOTES TO FINANCIAL STATEMENTS |
Other Notes to the Financial Statements
|
|
|
|
|
|
| |
Note |
| Acquisitions and Divestitures |
4 |
|
| Segment Information |
5 |
|
| Revenue |
6 |
|
| Cost of Sales |
7 |
|
| Exploration, Evaluation and Project Expenses |
8 |
|
| Other Expense (Income) |
9 |
|
| Impairment (Reversals) Charges |
10 |
|
| General and Administrative Expenses |
11 |
|
| Income Tax Expense |
12 |
|
| Earnings (Loss) Per Share |
13 |
|
| Finance Costs, Net |
14 |
|
| Cash Flow - Other Items |
15 |
|
| Investments |
16 |
|
| Inventories |
17 |
|
| Accounts Receivable and Other Current Assets |
18 |
|
| Property, Plant and Equipment |
19 |
|
| Goodwill and other Intangible Assets |
20 |
|
| Impairment and Reversal of Non-Current Assets |
21 |
|
| Other Assets |
22 |
|
| Accounts Payable |
23 |
|
| Other current Liabilities |
24 |
|
| Financial Instruments |
25 |
|
| Fair Value Measurements |
26 |
|
| Provisions |
27 |
|
| Financial Risk Management |
28 |
|
| Other Non-Current Liabilities |
29 |
|
| Deferred Income Taxes |
30 |
|
| Capital Stock |
31 |
|
| Non-Controlling Interests |
32 |
|
| Related Party Transactions |
33 |
|
| Stock-Based Compensation |
34 |
|
|
|
| Contingencies |
35 |
|
|
|
4 n Acquisitions and Divestitures
a) Lagunas Norte
On February 16, 2021, Barrick announced it had entered into an agreement to sell its 100% interest in the Lagunas Norte gold mine in Peru to Boroo Pte Ltd. (“Boroo”) for total consideration of up to $81 million, with $20 million of cash consideration on closing, additional cash consideration of $10 million payable on the first anniversary of closing and $20 million payable on the second anniversary of closing, a 2% net smelter return royalty, which may be purchased by Boroo for a fixed period after closing for $16 million, plus a contingent payment of up to $15 million based on the two-year average gold price. An impairment reversal of $86 million was recognized in the first quarter of 2021. Refer to note 21 for further details. The transaction closed on June 1, 2021 and we recognized a gain on sale of $4 million in the second quarter of 2021 based on a final fair value of consideration of $65 million. We remain contractually liable for all tax matters that existed prior to our divestiture until these matters are resolved. In addition, Boroo assumed 50% of the $173 million reclamation bond obligations for Lagunas Norte upon closing and will assume the other 50% within one year of closing.
b) Acquisition of South Arturo Non-Controlling Interest
On September 7, 2021, Barrick announced NGM had entered into a definitive asset exchange agreement (the "Exchange Agreement") with i-80 Gold Corp. ("i-80 Gold") to acquire the 40% interest in South Arturo that NGM did not already own, in exchange for the Lone Tree and Buffalo Mountain properties and infrastructure, which were in care and maintenance at the time. The exchange transaction closed on October 14, 2021.
The Exchange Agreement provides for payment to NGM of contingent consideration of up to $50 million based on mineral resources from the Lone Tree property. In connection with the asset exchange, NGM also entered into toll-milling agreements providing i-80 Gold with interim processing capacity at NGM’s autoclave facilities until the earlier of the three-year anniversary of the asset exchange and the date on which the Lone Tree facility is operational, and separately at NGM’s roaster facilities for a 10-year period, which was assigned a fair value of $nil. In addition, each party assumed the environmental liabilities and closure bonding for their acquired properties. In conjunction with the closing of the transaction on October 14, 2021, NGM subscribed for $48 million in common shares of i-80 Gold.
We assigned a fair value of $175 million to the transaction and recognized a gain of $205 million in the fourth quarter of 2021 in relation to the disposition of Lone Tree. Lone Tree was in a net liability position, which resulted in a gain that exceeded the fair value. In addition, we recognized a loss of $85 million in equity in the fourth quarter, representing our share of the difference between the carrying value of the South Arturo non-controlling interest and the fair value of the transaction.
c) Massawa Project
On March 4, 2020, Barrick and our Senegalese joint venture partner completed the sale of our aggregate 90% interest in the Massawa project (“Massawa”) in Senegal to Teranga Gold Corporation (“Teranga”), now Endeavour Mining Corporation, for total consideration fair valued at
|
|
|
|
|
|
|
|
|
| BARRICK YEAR-END 2021 |
159 |
NOTES TO FINANCIAL STATEMENTS |
$440 million on the date of closing. Barrick received 92.5% of the consideration for its interest in the Massawa project, with the balance received by Barrick’s local Senegalese partner. Barrick received a net of $256 million in cash and 19,164,403 Teranga common shares (worth $104 million at the date of closing) plus a contingent payment of up to $46.25 million based on the three-year average gold price, which was valued at $28 million at the date of closing. The cash consideration received was net of $25 million that Barrick provided through its participation in the $225 million syndicated debt financing facility secured by Teranga in connection with the transaction. In the first quarter of 2021, we received full repayment of the outstanding loan. The difference between the fair value of consideration received and the carrying value of the assets on closing was $54 million and was recognized as a gain in the first quarter of 2020.
d) Eskay Creek
On August 4, 2020 Barrick entered into a definitive agreement with Skeena Resources Limited (“Skeena”) pursuant to which Skeena exercised its option to acquire the Eskay Creek project in British Columbia and Barrick waived its back-in right on the Eskay Creek project. The consideration under the definitive agreement consisted of: (i) the issuance by Skeena of 22,500,000 units (the “Units”), with each Unit comprising one common share of Skeena and one half of a warrant, with each whole warrant entitling Barrick to purchase one additional common share of Skeena at an exercise price of C$2.70 each until the second anniversary of the closing date; (ii) the grant of a 1% NSR royalty on the entire Eskay Creek land package; and (iii) a contingent payment of C$15 million payable during a 24-month period after closing. The transaction closed on October 5, 2020 and we recognized a gain of $59 million for the year ended December 31, 2020.
e) Bullfrog
On October 13, 2020, wholly-owned subsidiaries of Barrick and Bullfrog Gold Corp. (“Bullfrog”) entered into a definitive agreement pursuant to which Barrick agreed to sell to Bullfrog all of Barrick’s mining claims, historical resources, permits, rights of way and water rights in the Bullfrog mine area (the “Barrick Lands”). Consideration for the transaction consisted of (i) the issuance by Bullfrog of 54,600,000 units, with each unit comprising one common share of Bullfrog and one warrant entitling Barrick to purchase one additional common share of Bullfrog at an exercise price of C$0.30 each until the fourth anniversary of the closing date, and (ii) a 2% NSR royalty on all minerals produced from the Barrick Lands, subject to a maximum aggregate NSR royalty of 5.5% on any individual mining claim and a minimum 0.5% NSR royalty granted to Barrick on any individual mining claim. The transaction closed on October 26, 2020 and we recognized a gain of $22 million for the year ended December 31, 2020.
f) Morila
On November 10, 2020, Barrick and AngloGold Ashanti Limited completed the sale of our combined 80% interest in the Morila gold mine in Mali to Firefinch Limited (previously Mali Lithium Limited) for $28.8 million cash consideration. The State of Mali continues to hold the remaining 20% of the Morila gold mine. The consideration received was allocated against the interests that AngloGold Ashanti and Barrick held in Morila, as well as intercompany loans that Barrick held against Morila, and the transaction resulted in a gain for Barrick of $27 million for the year ended December 31, 2020.
5 n Segment Information
Barrick’s business is organized into eighteen minesites and one project. Barrick’s CODM (Mark Bristow, President and Chief Executive Officer) reviews the operating results, assesses performance and makes capital allocation decisions at the minesite, Company and/or project level. Each individual minesite and the Pascua-Lama project are operating segments for financial reporting purposes. Our presentation of our reportable operating segments consists of nine gold mines (Carlin, Cortez, Turquoise Ridge, Pueblo Viejo, Loulo-Gounkoto, Kibali, Veladero, North Mara and Bulyanhulu). Starting in the first quarter of 2021, Goldrush was included as part of Cortez as the CODM began reviewing the operating results and assessing performance on a combined level. The remaining operating segments, including our remaining gold mines, copper mines and project, have been grouped into an “other” category and will not be reported on individually. Segment performance is evaluated based on a number of measures including operating income before tax, production levels and unit production costs. Certain costs are managed on a consolidated basis and are therefore not reflected in segment income. Prior period figures have been restated to reflect the changes made to our reportable operating segments in the current year.
|
|
|
|
|
|
|
|
|
| BARRICK YEAR-END 2021 |
160 |
NOTES TO FINANCIAL STATEMENTS |
Consolidated Statements of Income Information
|
|
|
|
|
|
|
|
|
|
|
|
|
|
|
|
|
|
|
|
|
|
| |
|
Cost of Sales |
|
|
|
|
| For the year ended December 31, 2021 |
Revenue |
Site operating costs, royalties and community relations |
Depreciation |
Exploration, evaluation and project expenses |
Other expenses (income)1 |
Segment income (loss) |
|
Carlin2 |
$2,687 |
|
$1,175 |
|
$276 |
|
$22 |
|
$25 |
|
$1,189 |
|
|
Cortez2 |
1,485 |
|
633 |
|
294 |
|
10 |
|
1 |
|
547 |
|
|
Turquoise Ridge2 |
987 |
|
415 |
|
200 |
|
1 |
|
— |
|
371 |
|
|
Pueblo Viejo2 |
1,514 |
|
505 |
|
234 |
|
5 |
|
11 |
|
759 |
|
|
Loulo-Gounkoto2 |
1,249 |
|
454 |
|
278 |
|
18 |
|
25 |
|
474 |
|
|
| Kibali |
661 |
|
232 |
|
141 |
|
5 |
|
5 |
|
278 |
|
|
| Veladero |
382 |
|
177 |
|
85 |
|
1 |
|
1 |
|
118 |
|
|
|
|
|
|
|
|
|
|
North Mara2 |
552 |
|
240 |
|
56 |
|
— |
|
2 |
|
254 |
|
|
Bulyanhulu2 |
361 |
|
155 |
|
57 |
|
— |
|
2 |
|
147 |
|
|
Other Mines2 |
2,659 |
|
1,179 |
|
580 |
|
10 |
|
81 |
|
809 |
|
|
| Reportable segment total |
$12,537 |
|
$5,165 |
|
$2,201 |
|
$72 |
|
$153 |
|
$4,946 |
|
|
| Share of equity investee |
(661) |
|
(232) |
|
(141) |
|
(5) |
|
(5) |
|
(278) |
|
|
| Segment total |
$11,876 |
|
$4,933 |
|
$2,060 |
|
$67 |
|
$148 |
|
$4,668 |
|
|
Consolidated Statements of Income Information
|
|
|
|
|
|
|
|
|
|
|
|
|
|
|
|
|
|
|
|
|
|
| |
|
Cost of Sales |
|
|
|
|
| For the year ended December 31, 2020 |
Revenue |
Site operating costs, royalties and community relations |
Depreciation |
Exploration, evaluation and project expenses |
Other expenses (income)1 |
Segment income (loss) |
|
Carlin2 |
$2,952 |
|
$1,318 |
|
$306 |
|
$30 |
|
$1 |
|
$1,297 |
|
|
Cortez2 |
1,409 |
|
543 |
|
222 |
|
12 |
|
4 |
|
628 |
|
|
Turquoise Ridge2 |
960 |
|
391 |
|
184 |
|
7 |
|
3 |
|
375 |
|
|
Pueblo Viejo2 |
1,613 |
|
511 |
|
224 |
|
11 |
|
(6) |
|
873 |
|
|
Loulo-Gounkoto2 |
1,208 |
|
452 |
|
267 |
|
11 |
|
29 |
|
449 |
|
|
| Kibali |
648 |
|
223 |
|
174 |
|
2 |
|
5 |
|
244 |
|
|
| Veladero |
333 |
|
144 |
|
69 |
|
— |
|
6 |
|
114 |
|
|
|
|
|
|
|
|
|
|
North Mara2 |
571 |
|
227 |
|
91 |
|
— |
|
(1) |
|
254 |
|
|
Bulyanhulu2 |
240 |
|
112 |
|
72 |
|
— |
|
25 |
|
31 |
|
|
Other Mines2 |
3,124 |
|
1,414 |
|
715 |
|
14 |
|
55 |
|
926 |
|
|
| Reportable segment total |
$13,058 |
|
$5,335 |
|
$2,324 |
|
$87 |
|
$121 |
|
$5,191 |
|
|
| Share of equity investee |
(648) |
|
(223) |
|
(174) |
|
(2) |
|
(5) |
|
(244) |
|
|
| Segment total |
$12,410 |
|
$5,112 |
|
$2,150 |
|
$85 |
|
$116 |
|
$4,947 |
|
|
|
|
|
|
|
|
|
|
|
|
|
|
|
|
|
|
1Includes accretion expense, which is included with finance costs in the consolidated statements of income. For the year ended December 31, 2021, accretion expense was $26 million (2020: $22 million).
2Includes non-controlling interest portion of revenues, cost of sales and segment income (loss) for the year ended December 31, 2021, for Pueblo Viejo, $617 million, $294 million, $318 million (2020: $660 million, $293 million, $365 million), Nevada Gold Mines, $2,362 million, $1,359 million, $991 million (2020: $2,432 million, $1,369 million, $1,036 million), North Mara, Bulyanhulu and Buzwagi, $159 million, $92 million, $63 million (2020: $194 million, $114 million, $76 million), Loulo-Gounkoto, $250 million, $146 million, $95 million (2020: $242 million, $144 million, $90 million) and Tongon, $38 million, $32 million, $5 million (2020: $52 million, $39 million, $14 million).
|
|
|
|
|
|
|
|
|
| BARRICK YEAR-END 2021 |
161 |
NOTES TO FINANCIAL STATEMENTS |
Reconciliation of Segment Income to Income Before Income Taxes
|
|
|
|
|
|
|
|
|
| For the years ended December 31 |
2021 |
2020 |
| Segment income |
$4,668 |
|
$4,947 |
|
| Other revenue |
109 |
|
185 |
|
| Other cost of sales/amortization |
(96) |
|
(155) |
|
| Exploration, evaluation and project expenses not attributable to segments |
(220) |
|
(210) |
|
| General and administrative expenses |
(151) |
|
(185) |
|
| Other income not attributable to segments |
187 |
|
262 |
|
| Impairment reversals |
63 |
|
269 |
|
| Loss on currency translation |
(29) |
|
(50) |
|
| Closed mine rehabilitation |
(18) |
|
(90) |
|
| Income from equity investees |
446 |
|
288 |
|
Finance costs, net (includes non-segment accretion)1 |
(329) |
|
(325) |
|
| Gain on non-hedge derivatives |
2 |
|
10 |
|
| Income before income taxes |
$4,632 |
|
$4,946 |
|
|
|
|
|
|
|
|
|
|
1Includes debt extinguishment losses of $nil (2020: $15 million losses).
Geographic Information
|
|
|
|
|
|
|
|
|
|
|
|
|
|
|
|
| |
Non-current assets |
Revenue |
|
As at December 31, 2021 |
|
As at December 31, 2020 |
2021 |
2020 |
| United States |
$16,355 |
|
|
$16,233 |
|
$6,134 |
|
$6,298 |
|
| Mali |
4,709 |
|
|
4,659 |
|
1,249 |
|
1,208 |
|
| Dominican Republic |
4,602 |
|
|
4,219 |
|
1,514 |
|
1,613 |
|
| Democratic Republic of Congo |
3,267 |
|
|
3,278 |
|
— |
|
— |
|
| Chile |
1,937 |
|
|
2,027 |
|
— |
|
— |
|
| Zambia |
1,793 |
|
|
1,720 |
|
962 |
|
697 |
|
| Tanzania |
1,767 |
|
|
1,703 |
|
993 |
|
1,214 |
|
| Argentina |
1,739 |
|
|
1,686 |
|
382 |
|
333 |
|
| Canada |
517 |
|
|
479 |
|
291 |
|
407 |
|
| Saudi Arabia |
382 |
|
|
369 |
|
— |
|
— |
|
| Papua New Guinea |
330 |
|
|
347 |
|
— |
|
140 |
|
| Côte d'Ivoire |
191 |
|
|
266 |
|
369 |
|
508 |
|
| Peru |
113 |
|
|
186 |
|
91 |
|
177 |
|
|
|
|
|
|
|
| Unallocated |
939 |
|
|
1,253 |
|
— |
|
— |
|
| Total |
$38,641 |
|
|
$38,425 |
|
$11,985 |
|
$12,595 |
|
|
|
|
|
|
|
|
|
|
|
|
|
|
|
|
|
|
|
|
|
|
|
|
|
|
|
|
| BARRICK YEAR-END 2021 |
162 |
NOTES TO FINANCIAL STATEMENTS |
Capital Expenditures Information
|
|
|
|
|
|
|
|
|
| |
Segment Capital Expenditures1 |
|
As at December 31, 2021 |
As at December 31, 2020 |
| Carlin |
$422 |
|
$395 |
|
| Cortez |
277 |
|
399 |
|
| Turquoise Ridge |
144 |
|
97 |
|
| Pueblo Viejo |
533 |
|
228 |
|
| Loulo-Gounkoto |
313 |
|
243 |
|
| Kibali |
70 |
|
53 |
|
| Veladero |
144 |
|
104 |
|
|
|
|
| North Mara |
93 |
|
89 |
|
| Bulyanhulu |
80 |
|
79 |
|
| Other Mines |
351 |
|
345 |
|
|
|
|
| Reportable segment total |
$2,427 |
|
$2,032 |
|
| Other items not allocated to segments |
129 |
|
89 |
|
| Total |
$2,556 |
|
$2,121 |
|
| Share of equity investee |
(70) |
|
(53) |
|
| Total |
$2,486 |
|
$2,068 |
|
|
|
|
|
|
|
1Segment capital expenditures are presented for internal management reporting purposes on an accrual basis. Capital expenditures in the consolidated statements of cash flow are presented on a cash basis. In 2021, cash expenditures were $2,435 million (2020: $2,054 million) and the increase in accrued expenditures was $51 million (2020: $14 million increase).
6 n Revenue
|
|
|
|
|
|
|
|
|
| For the years ended December 31 |
2021 |
2020 |
Gold sales1 |
|
|
| Spot market sales |
$10,491 |
|
$11,129 |
|
| Concentrate sales |
246 |
|
520 |
|
| Provisional pricing adjustments |
1 |
|
21 |
|
|
$10,738 |
|
$11,670 |
|
Copper sales1 |
|
|
| Copper concentrate sales |
$915 |
|
$644 |
|
| Provisional pricing adjustments |
47 |
|
53 |
|
|
$962 |
|
$697 |
|
Other sales2 |
$285 |
|
$228 |
|
| Total |
$11,985 |
|
$12,595 |
|
|
|
|
|
|
|
|
|
|
|
|
|
1Revenues include amounts transferred from OCI to earnings for commodity cash flow hedges.
2Revenues from the sale of by-products from our gold and copper mines.
For the year ended December 31, 2021, the Company has three customers that individually account for more than 10% of the Company’s total revenue. These customers represent approximately 24%, 13% and 10% of total revenue. However, because gold can be sold through numerous gold market traders worldwide (including a large number of financial institutions), the Company is not economically dependent on a limited number of customers for the sale of its product.
Principal Products
All of our gold mining operations produce gold in doré form, except Phoenix, Bulyanhulu and Porgera (until it was placed on care and maintenance in April 2020), which produce both gold doré and gold concentrate. Gold doré is unrefined gold bullion bars usually consisting of 90% gold that is refined to pure gold bullion prior to sale to our
customers. Concentrate is a semi-processed product containing the valuable metal minerals from which most of the waste mineral has been eliminated. Our Lumwana mine produces a concentrate that primarily contains copper. Our Phoenix mine produces a concentrate that contains both gold and copper. Incidental revenues from the sale of by-products, primarily copper, silver and energy at our gold mines, are classified within other sales.
Provisional Copper and Gold Sales
We have provisionally priced sales for which price finalization, referenced to the relevant copper and gold index, is outstanding at the balance sheet date. Our exposure at December 31, 2021 to the impact of future movements in market commodity prices for provisionally priced sales is set out in the following table:
|
|
|
|
|
|
|
|
|
|
|
|
|
|
|
| |
Volumes subject to final pricing
Copper (millions)
Gold (000s) |
Impact on net income before taxation of 10% movement in market price |
| As at December 31 |
2021 |
2020 |
2021 |
2020 |
| Copper pounds |
45 |
|
49 |
|
$20 |
|
$16 |
|
| Gold ounces |
41 |
|
22 |
|
8 |
|
4 |
|
At December 31, 2021, our provisionally priced copper sales subject to final settlement were recorded at an average price of $4.34/lb (2020: $3.17/lb). At December 31, 2021, our provisionally priced gold sales subject to final settlement were recorded at an average price of $1,819/oz (2020: $1,899/oz). The sensitivities in the above tables have been determined as the impact of a 10% change in commodity prices at each reporting date, while holding all other variables, including foreign currency exchange rates, constant.
|
|
|
|
|
|
|
|
|
| BARRICK YEAR-END 2021 |
163 |
NOTES TO FINANCIAL STATEMENTS |
7 n Cost of Sales
|
|
|
|
|
|
|
|
|
|
|
|
|
|
|
|
|
|
|
|
|
|
|
|
|
|
|
|
|
| |
Gold |
Copper |
Other4 |
Total |
|
|
| For the years ended December 31 |
2021 |
2020 |
2021 |
2020 |
2021 |
2020 |
2021 |
2020 |
|
|
Site operating cost1,2,3 |
$4,218 |
|
$4,421 |
|
$266 |
|
$292 |
|
$— |
|
$3 |
|
$4,484 |
|
$4,716 |
|
|
|
Depreciation1 |
1,889 |
|
1,975 |
|
197 |
|
208 |
|
16 |
|
25 |
|
2,102 |
|
2,208 |
|
|
|
| Royalty expense |
371 |
|
410 |
|
103 |
|
54 |
|
— |
|
— |
|
474 |
|
464 |
|
|
|
| Community relations |
26 |
|
26 |
|
3 |
|
2 |
|
— |
|
1 |
|
29 |
|
29 |
|
|
|
| Total |
$6,504 |
|
$6,832 |
|
$569 |
|
$556 |
|
$16 |
|
$29 |
|
$7,089 |
|
$7,417 |
|
|
|
|
|
|
|
|
|
|
|
|
|
|
|
|
|
|
|
|
|
|
|
|
|
|
|
|
|
|
|
|
|
|
|
|
1Site operating costs and depreciation include charges to reduce the cost of inventory to net realizable value of $22 million (2020: $29 million). Refer to note 17.
2Site operating costs includes the costs of extracting by-products.
3Includes employee costs of $1,396 million (2020: $1,520 million).
4Other includes corporate amortization.
8 n Exploration, Evaluation and Project Expenses
|
|
|
|
|
|
|
|
|
| For the years ended December 31 |
2021 |
2020 |
Global exploration and evaluation1 |
$122 |
|
$143 |
|
| Project costs: |
|
|
| Pascua-Lama |
46 |
|
37 |
|
|
|
|
| Other |
39 |
|
27 |
|
| Corporate development |
16 |
|
9 |
|
|
|
|
Minesite exploration and evaluation1 |
64 |
|
79 |
|
| Total exploration, evaluation and project expenses |
$287 |
|
$295 |
|
|
|
|
|
|
|
|
|
|
1Approximates the impact on operating cash flow.
9 n Other Expense (Income)
|
|
|
|
|
|
|
|
|
|
|
|
| For the years ended December 31 |
2021 |
2020 |
| Other Expense: |
|
|
|
|
|
| Litigation costs |
$17 |
|
$19 |
|
| Write-offs (reversals) |
12 |
|
(1) |
|
Bulyanhulu reduced operations program costs1 |
— |
|
22 |
|
| Bank charges |
7 |
|
16 |
|
| Porgera care and maintenance costs |
51 |
|
51 |
|
| Covid-19 donations |
— |
|
24 |
|
| Buzwagi supplies obsolescence |
21 |
|
— |
|
| Litigation settlements |
25 |
|
— |
|
| Other |
17 |
|
20 |
|
| Total other expense |
$150 |
|
$151 |
|
| Other Income: |
|
|
Gain on sale of long-lived assets2 |
($213) |
|
($180) |
|
|
|
|
Remeasurement of silver sale liability3 |
— |
|
(104) |
|
|
|
|
| Peru tax disputes settlement |
— |
|
7 |
|
| Loss (gain) on warrant investments at FVPL |
16 |
|
(9) |
|
| Gain on non-hedge derivatives |
(2) |
|
(10) |
|
| Interest income on other assets |
(15) |
|
(21) |
|
| Other |
(3) |
|
(12) |
|
| Total other income |
($217) |
|
($329) |
|
| Total |
($67) |
|
($178) |
|
|
|
|
|
|
|
|
|
|
|
|
|
|
|
|
1Primarily relates to care and maintenance costs.
22021 includes a gain of $205 million from the disposal of Lone Tree. 2020 includes a gain of $59 million from the sale of Eskay Creek, a gain of $54 million from the sale of Massawa, a gain of $27 million from the sale of Morila, and a gain of $22 million from the sale of Bullfrog. Refer to note 4 for further details.
3Refer to note 29 for further details.
10 n Impairment (Reversals) Charges
|
|
|
|
|
|
|
|
|
| For the years ended December 31 |
2021 |
2020 |
Impairment reversals of long-lived assets1 |
($63) |
|
($281) |
|
Impairment of intangibles1 |
— |
|
12 |
|
|
|
|
| Total |
($63) |
|
($269) |
|
|
|
|
|
|
|
|
|
|
1Refer to note 21 for further details.
11 n General and Administrative Expenses
|
|
|
|
|
|
|
|
|
| For the years ended December 31 |
2021 |
2020 |
| Corporate administration |
$118 |
|
$118 |
|
| Share-based compensation |
33 |
|
67 |
|
|
|
|
Total1 |
$151 |
|
$185 |
|
|
|
|
|
|
|
|
|
|
1Includes employee costs of $101 million (2020: $128 million).
|
|
|
|
|
|
|
|
|
| BARRICK YEAR-END 2021 |
164 |
NOTES TO FINANCIAL STATEMENTS |
12 n Income Tax Expense
|
|
|
|
|
|
|
|
|
| For the years ended December 31 |
2021 |
2020 |
| Tax on profit |
|
|
| Current tax |
|
|
| Charge for the year |
$1,031 |
|
$1,122 |
|
Adjustment in respect of prior years1 |
(32) |
|
59 |
|
| |
$999 |
|
$1,181 |
|
| Deferred tax |
|
|
| Origination and reversal of temporary differences in the current year |
$289 |
|
$263 |
|
Adjustment in respect of prior years1 |
56 |
|
(112) |
|
|
$345 |
|
$151 |
|
| Income tax expense |
$1,344 |
|
$1,332 |
|
| Tax expense related to continuing operations |
| Current |
|
|
| Canada |
($9) |
|
$14 |
|
| International |
1,008 |
|
1,167 |
|
|
$999 |
|
$1,181 |
|
| Deferred |
|
|
| Canada |
$38 |
|
($6) |
|
| International |
307 |
|
157 |
|
|
$345 |
|
$151 |
|
| Income tax expense |
$1,344 |
|
$1,332 |
|
|
|
|
|
|
|
|
|
|
|
|
|
|
|
|
|
|
|
|
|
|
|
|
|
1Includes adjustments to equalize the difference between prior year's tax return and the year-end provision. The 2020 amount also includes a current tax expense and a deferred tax recovery from the resolution of all outstanding disputes between Barrick and the GoT.
|
|
|
|
|
|
|
|
|
| Reconciliation to Canadian Statutory Rate |
|
| For the years ended December 31 |
2021 |
2020 |
| At 26.5% statutory rate |
$1,228 |
|
$1,311 |
|
| Increase (decrease) due to: |
|
|
Allowances and special tax deductions1 |
(138) |
|
(151) |
|
Impact of foreign tax rates2 |
(84) |
|
(32) |
|
| Expenses not tax deductible |
118 |
|
154 |
|
| Taxable gains on sales of long-lived assets |
24 |
|
— |
|
|
|
|
|
|
|
| Net currency translation (gains) losses on current and deferred tax balances |
23 |
|
(19) |
|
| Tax impact from pass-through entities and equity accounted investments |
(330) |
|
(309) |
|
| Current year tax gains not recognized |
(18) |
|
(9) |
|
|
|
|
| Recognition and de-recognition of deferred tax assets |
(31) |
|
(61) |
|
|
|
|
|
|
|
| Adjustments in respect of prior years |
24 |
|
(53) |
|
| Increase to income tax related contingent liabilities |
19 |
|
42 |
|
| Impact of tax rate changes |
66 |
|
1 |
|
|
|
|
| Withholding taxes |
110 |
|
100 |
|
|
|
|
| Mining taxes |
323 |
|
383 |
|
| Tax impact of amounts recognized within accumulated OCI |
8 |
|
(21) |
|
| Other items |
2 |
|
(4) |
|
| Income tax expense |
$1,344 |
|
$1,332 |
|
|
|
|
|
|
|
|
|
|
1We are able to claim certain allowances, incentives and tax deductions unique to extractive industries that result in a lower effective tax rate.
2We operate in multiple foreign tax jurisdictions that have tax rates different than the Canadian statutory rate.
Currency Translation
Current and deferred tax balances are subject to remeasurement for changes in currency exchange rates each period. This is required in countries where tax is paid in local currency and the subsidiary has a different functional currency (e.g. US dollars). The most significant balances relate to Argentine and Malian tax liabilities.
In 2021, a tax expense of $23 million arose from translation losses on tax balances, mainly due to the weakening of the Argentine peso and the West African CFA franc against the US dollar. In 2020, a tax recovery of $19 million arose from translation losses and gains on tax balances due to the weakening of the Argentine peso and strengthening of the West African CFA franc, respectively, against the US dollar. These net translation losses (gains) are included within income tax expense (recovery).
Nevada Mining Education Tax
A new mining excise tax applied to gross proceeds became effective on July 1, 2021 following the passing of Assembly Bill 495 at the Nevada Legislative Session ended on May 31, 2021. The revenue generated by this new excise tax will be directed towards education. The new excise tax is a tiered tax, with the highest rate at 1.1% and first payment expected in April 2022.
The bill does not take into consideration expenses or costs incurred to generate gross proceeds; therefore, this tax is treated as a gross receipts tax and not as a tax based on income subject to IAS 12. As a result, this new tax is reported as a component of cost of sales and not as an income tax expense.
|
|
|
|
|
|
|
|
|
| BARRICK YEAR-END 2021 |
165 |
NOTES TO FINANCIAL STATEMENTS |
Argentina Deferred Taxes
On June 16, 2021, Argentina enacted a law increasing its corporate tax rate from 30% to 35% for 2021 and thereafter. This law supersedes previous legislation that was expected to enforce a corporate tax rate of 25% for 2021 and thereafter. In addition, the dividend withholding tax was decreased from 13% to 7% for 2021 and thereafter.
A deferred tax expense of $72 million was recorded in the second quarter of 2021 as a result of the tax reform measures.
Withholding Taxes
In 2021, we have recorded $66 million of dividend withholding taxes related to the undistributed earnings of our subsidiaries in Argentina, Côte d'Ivoire, Saudi Arabia and the United States. We have also recorded $33 million (2020: $87 million related to Côte d’Ivoire, Tanzania and the United States) of dividend withholding taxes related to the distributed earnings of our subsidiaries in Argentina, Saudi Arabia and the United States.
Nevada Gold Mines
Nevada Gold Mines is a limited liability company treated as a flow through partnership for US tax purposes. The partnership is not subject to federal income tax directly, but each of its partners is liable for tax on its share of the profits of the partnership. As such, Barrick accounts for its current and deferred income tax associated with the investment (61.5% share) following the principles in IAS 12.
Mining Taxes
In addition to corporate income tax, we pay mining taxes in the United States (Nevada), the Dominican Republic, Canada (Ontario) and Peru. Nevada Gold Mines is subject to a Net Proceeds of Minerals tax in Nevada at a rate of 5% and the tax expense recorded in 2021 was $136 million (2020: $149 million). Other significant mining taxes include the Dominican Republic’s Net Profits Interest tax, which is determined based on cash flows as defined by the Pueblo Viejo Special Lease Agreement. A tax expense of $180 million (2020: $212 million) was recorded for this in 2021. Both taxes are included on a consolidated basis in the Company's consolidated statements of income.
13 n Earnings (Loss) Per Share
|
|
|
|
|
|
|
|
|
|
|
|
|
|
|
| For the years ended December 31 ($ millions, except shares in millions and per share amounts in dollars) |
2021 |
2020 |
| Basic |
Diluted |
Basic |
Diluted |
| Net income |
$3,288 |
|
$3,288 |
|
$3,614 |
|
$3,614 |
|
| Net income attributable to non-controlling interests |
(1,266) |
|
(1,266) |
|
(1,290) |
|
(1,290) |
|
| Net income attributable to the equity holders of Barrick Gold Corporation |
$2,022 |
|
$2,022 |
|
$2,324 |
|
$2,324 |
|
| Weighted average shares outstanding |
1,779 |
|
1,779 |
|
1,778 |
|
1,778 |
|
| Basic and diluted earnings per share data attributable to the equity holders of Barrick Gold Corporation |
$1.14 |
|
$1.14 |
|
$1.31 |
|
$1.31 |
|
|
|
|
|
|
|
|
|
|
|
|
|
|
|
|
|
|
|
|
|
|
|
|
|
|
|
|
|
|
| For the years ended December 31 |
2021 |
2020 |
Interest expense1 |
$357 |
|
$342 |
|
| Amortization of debt issue costs |
1 |
|
2 |
|
| Amortization of premium |
(1) |
|
(1) |
|
| Interest on lease liabilities |
5 |
|
5 |
|
| Loss (gain) on interest rate hedges |
3 |
|
(5) |
|
Interest capitalized2 |
(16) |
|
(24) |
|
| Accretion |
48 |
|
41 |
|
| Loss on debt extinguishment |
— |
|
15 |
|
| Finance income |
(42) |
|
(28) |
|
| Total |
$355 |
|
$347 |
|
|
|
|
|
|
|
|
|
|
1Interest in the consolidated statements of cash flow is presented on a cash basis. In 2021, cash interest paid was $303 million (2020: $295 million).
2For the year ended December 31, 2021, the general capitalization rate was 6.00% (2020: 5.90%).
|
|
|
|
|
|
|
|
|
| BARRICK YEAR-END 2021 |
166 |
NOTES TO FINANCIAL STATEMENTS |
15 n Cash Flow – Other Items
|
|
|
|
|
|
|
|
|
| Operating Cash Flows - Other Items |
|
|
| For the years ended December 31 |
2021 |
2020 |
| Adjustments for non-cash income statement items: |
|
|
| Gain on non-hedge derivatives |
($2) |
|
($10) |
|
| Stock-based compensation expense |
81 |
|
87 |
|
| Loss (gain) on warrant investments at FVPL |
16 |
|
(9) |
|
| Increase in estimate of rehabilitation costs at closed mines |
18 |
|
90 |
|
| Net inventory impairment charges (note 17) |
13 |
|
29 |
|
| Remeasurement of silver sale liability (note 29) |
— |
|
(104) |
|
| Buzwagi supplies obsolescence |
21 |
|
— |
|
| Change in other assets and liabilities |
(120) |
|
(70) |
|
Settlement of stock-based compensation1 |
(97) |
|
(97) |
|
| Settlement of rehabilitation obligations |
(133) |
|
(106) |
|
| Other operating activities |
($203) |
|
($190) |
|
| Cash flow arising from changes in: |
|
|
| Accounts receivable |
($46) |
|
($192) |
|
| Inventory |
(163) |
|
121 |
|
| Other current assets |
(178) |
|
(133) |
|
| Accounts payable |
140 |
|
42 |
|
Other current liabilities1 |
(26) |
|
(49) |
|
| Change in working capital |
($273) |
|
($211) |
|
|
|
|
|
|
|
|
|
|
|
|
|
|
|
|
|
|
|
|
|
|
|
|
|
|
|
|
|
|
|
|
|
|
|
|
|
|
|
|
| Financing Cash Flows - Other Items |
|
|
| For the years ended December 31 |
2021 |
2020 |
| Pueblo Viejo JV partner shareholder loan |
$131 |
|
$42 |
|
| GoT shareholder loan |
(16) |
|
— |
|
| Debt extinguishment costs |
— |
|
(15) |
|
| Other |
— |
|
1 |
|
| Other financing activities |
$115 |
|
$28 |
|
12020 figures have been restated to reflect the change in presentation to present settlement of stock-based compensation ($97 million) separately from other current liabilities.
|
|
|
|
|
|
|
|
|
| BARRICK YEAR-END 2021 |
167 |
NOTES TO FINANCIAL STATEMENTS |
16 n Investments
|
|
|
|
|
|
|
|
|
|
|
|
|
|
|
|
|
|
|
| Equity Accounting Method Investment Continuity |
|
|
|
|
|
|
|
Kibali |
Jabal Sayid |
Zaldívar |
Other |
Total |
|
| At January 1, 2020 |
$3,218 |
|
$296 |
|
$955 |
|
$58 |
|
$4,527 |
|
|
|
|
|
|
|
|
|
| Equity pick-up from equity investees |
201 |
|
74 |
|
12 |
|
1 |
|
288 |
|
|
|
|
|
|
|
|
|
| Dividends received from equity investees |
(140) |
|
— |
|
— |
|
(1) |
|
(141) |
|
|
| Shareholder loan repayment/disbursements |
— |
|
(1) |
|
— |
|
(3) |
|
(4) |
|
|
| At December 31, 2020 |
$3,279 |
|
$369 |
|
$967 |
|
$55 |
|
$4,670 |
|
|
|
|
|
|
|
|
|
| Equity pick-up from equity investees |
219 |
|
159 |
|
68 |
|
— |
|
446 |
|
|
|
|
|
|
|
|
|
| Dividends received from equity investees |
(231) |
|
(146) |
|
(142) |
|
(1) |
|
(520) |
|
|
| Shareholder loan repayment |
— |
|
— |
|
— |
|
(2) |
|
(2) |
|
|
| At December 31, 2021 |
$3,267 |
|
$382 |
|
$893 |
|
$52 |
|
$4,594 |
|
|
|
|
|
|
|
|
|
|
|
|
|
|
|
|
|
|
|
|
|
|
|
|
|
|
|
|
|
|
|
|
|
|
|
|
|
|
|
|
|
|
|
|
|
|
|
|
|
|
|
|
|
|
|
|
|
|
| Summarized Equity Investee Financial Information |
|
|
|
|
| |
Kibali |
Jabal Sayid |
Zaldívar |
| For the years ended December 31 |
2021 |
2020 |
2021 |
2020 |
2021 |
2020 |
| Revenue |
$1,469 |
|
$1,440 |
|
$597 |
|
$400 |
|
$847 |
|
$595 |
|
| Cost of sales (excluding depreciation) |
515 |
|
495 |
|
157 |
|
154 |
|
469 |
|
380 |
|
| Depreciation |
314 |
|
387 |
|
42 |
|
54 |
|
158 |
|
143 |
|
| Finance expense (income) |
(1) |
|
(1) |
|
1 |
|
— |
|
(4) |
|
1 |
|
| Other expense (income) |
68 |
|
43 |
|
(5) |
|
4 |
|
25 |
|
32 |
|
| Income before income taxes |
$573 |
|
$516 |
|
$402 |
|
$188 |
|
$199 |
|
$39 |
|
| Income tax expense |
(141) |
|
(94) |
|
(84) |
|
(40) |
|
(61) |
|
(15) |
|
| Net income |
$432 |
|
$422 |
|
$318 |
|
$148 |
|
$138 |
|
$24 |
|
| Total comprehensive income |
$432 |
|
$422 |
|
$318 |
|
$148 |
|
$138 |
|
$24 |
|
|
|
|
|
|
|
|
|
|
|
|
|
|
|
|
|
|
|
|
|
|
| Summarized Balance Sheet |
|
|
|
|
|
|
| |
Kibali |
Jabal Sayid |
Zaldívar |
| For the years ended December 31 |
2021 |
2020 |
2021 |
2020 |
2021 |
2020 |
Cash and equivalents1 |
$1,116 |
|
$944 |
|
$85 |
|
$71 |
|
$171 |
|
$271 |
|
Other current assets2 |
298 |
|
131 |
|
178 |
|
68 |
|
493 |
|
392 |
|
| Total current assets |
$1,414 |
|
$1,075 |
|
$263 |
|
$139 |
|
$664 |
|
$663 |
|
Non-current assets2 |
4,310 |
|
4,559 |
|
419 |
|
429 |
|
2,031 |
|
2,123 |
|
| Total assets |
$5,724 |
|
$5,634 |
|
$682 |
|
$568 |
|
$2,695 |
|
$2,786 |
|
| Current financial liabilities (excluding trade, other payables & provisions) |
$16 |
|
$19 |
|
$13 |
|
$4 |
|
$84 |
|
$36 |
|
| Other current liabilities |
143 |
|
103 |
|
136 |
|
59 |
|
142 |
|
257 |
|
| Total current liabilities |
$159 |
|
$122 |
|
$149 |
|
$63 |
|
$226 |
|
$293 |
|
| Non-current financial liabilities (excluding trade, other payables & provisions) |
68 |
|
42 |
|
— |
|
— |
|
134 |
|
125 |
|
| Other non-current liabilities |
709 |
|
653 |
|
14 |
|
12 |
|
529 |
|
545 |
|
| Total non-current liabilities |
$777 |
|
$695 |
|
$14 |
|
$12 |
|
$663 |
|
$670 |
|
| Total liabilities |
$936 |
|
$817 |
|
$163 |
|
$75 |
|
$889 |
|
$963 |
|
| Net assets |
$4,788 |
|
$4,817 |
|
$519 |
|
$493 |
|
$1,806 |
|
$1,823 |
|
|
|
|
|
|
|
|
|
|
|
|
|
|
|
|
|
|
|
|
|
|
|
|
|
|
|
|
|
|
|
|
|
|
|
|
|
|
|
|
|
|
|
|
|
|
|
|
|
|
1Kibali cash and equivalents are subject to various steps before they can be distributed to the joint venture shareholders and are held across three banks in the Democratic Republic of Congo, including two domestic banks.
2Zaldívar other current assets include inventory of $384 million (2020: $323 million). The 2020 figures have been updated to reflect a $284 million reclassification of short-term inventory to long-term inventory.
The information above reflects the amounts presented in the financial information of the joint venture adjusted for differences between IFRS and local GAAP and fair value adjustments on acquisition of equity in investees.
|
|
|
|
|
|
|
|
|
| BARRICK YEAR-END 2021 |
168 |
NOTES TO FINANCIAL STATEMENTS |
|
|
|
|
|
|
|
|
|
|
|
|
| Reconciliation of Summarized Financial Information to Carrying Value |
|
|
|
| |
Kibali |
Jabal Sayid |
Zaldívar |
| Opening net assets |
$4,817 |
|
$493 |
|
$1,823 |
|
|
|
|
|
| Income for the period |
432 |
|
318 |
|
138 |
|
| Dividends received from equity investees |
(461) |
|
(292) |
|
(285) |
|
|
|
|
|
| Dividends declared in prior year and received in current year |
— |
|
— |
|
130 |
|
| Closing net assets, December 31 |
$4,788 |
|
$519 |
|
$1,806 |
|
| Barrick's share of net assets |
2,156 |
|
259 |
|
903 |
|
| Equity earnings adjustment |
— |
|
— |
|
(10) |
|
| Goodwill recognition |
1,111 |
|
123 |
|
— |
|
| Carrying value |
$3,267 |
|
$382 |
|
$893 |
|
|
|
|
|
|
|
|
|
|
|
|
|
|
|
|
|
17 n Inventories
|
|
|
|
|
|
|
|
|
|
|
|
|
|
|
|
Gold |
Copper |
| |
As at December 31, 2021 |
As at December 31, 2020 |
As at December 31, 2021 |
As at December 31, 2020 |
| Raw materials |
|
|
|
|
| Ore in stockpiles |
$2,587 |
|
$2,742 |
|
$174 |
|
$114 |
|
| Ore on leach pads |
663 |
|
591 |
|
— |
|
— |
|
| Mine operating supplies |
593 |
|
615 |
|
79 |
|
54 |
|
| Work in process |
108 |
|
117 |
|
— |
|
— |
|
| Finished products |
76 |
|
114 |
|
90 |
|
97 |
|
|
$4,027 |
|
$4,179 |
|
$343 |
|
$265 |
|
Non-current ore in stockpiles and on leach pads1 |
(2,462) |
|
(2,452) |
|
(174) |
|
(114) |
|
| |
$1,565 |
|
$1,727 |
|
$169 |
|
$151 |
|
|
|
|
|
|
|
|
|
|
|
|
|
|
|
|
|
|
|
|
|
1Ore that we do not expect to process in the next 12 months is classified within other long-term assets.
|
|
|
|
|
|
|
|
|
| Inventory Impairment Charges |
|
|
| For the years ended December 31 |
2021 |
2020 |
| Cortez |
$22 |
|
$17 |
|
| Phoenix |
— |
|
10 |
|
| Carlin |
— |
|
2 |
|
|
|
|
|
|
|
|
|
|
|
|
|
|
|
|
|
|
|
| Inventory impairment charges |
$22 |
|
$29 |
|
|
|
|
|
|
|
|
|
|
|
|
|
|
|
|
|
|
|
| BARRICK YEAR-END 2021 |
169 |
NOTES TO FINANCIAL STATEMENTS |
|
|
|
|
|
|
|
|
|
|
|
|
| Ore in Stockpiles |
As at December 31, 2021 |
As at December 31, 2020 |
| Gold |
|
|
| Carlin |
$986 |
|
$1,029 |
|
| Pueblo Viejo |
674 |
|
646 |
|
| Turquoise Ridge |
405 |
|
365 |
|
| Loulo-Gounkoto |
161 |
|
171 |
|
| North Mara |
93 |
|
133 |
|
| Cortez |
81 |
|
127 |
|
| Lagunas Norte |
— |
|
73 |
|
| Veladero |
51 |
|
58 |
|
| Phoenix |
73 |
|
47 |
|
| Tongon |
33 |
|
33 |
|
| Porgera |
30 |
|
30 |
|
| Buzwagi |
— |
|
15 |
|
| Hemlo |
— |
|
14 |
|
|
|
|
| Other |
— |
|
1 |
|
| Copper |
|
|
| Lumwana |
174 |
|
114 |
|
| |
$2,761 |
|
$2,856 |
|
|
|
|
|
|
|
|
|
|
|
|
|
| Ore on Leach pads |
As at December 31, 2021 |
As at December 31, 2020 |
| Gold |
|
|
| Carlin |
$209 |
|
$179 |
|
| Veladero |
196 |
|
133 |
|
| Cortez |
113 |
|
58 |
|
| Long Canyon |
77 |
|
33 |
|
| Turquoise Ridge |
41 |
|
39 |
|
| Phoenix |
23 |
|
26 |
|
| Pierina |
4 |
|
2 |
|
| Lagunas Norte |
— |
|
121 |
|
| |
$663 |
|
$591 |
|
|
|
|
|
|
|
|
|
|
Purchase Commitments
At December 31, 2021, we had purchase obligations for supplies and consumables of approximately $1,718 million (2020: $1,882 million).
18 n Accounts Receivable and Other Current Assets
|
|
|
|
|
|
|
|
|
|
As at December 31, 2021 |
As at December 31, 2020 |
| Accounts receivable |
|
|
| Amounts due from concentrate sales |
$242 |
|
$265 |
|
|
|
|
|
|
|
| Other receivables |
381 |
|
293 |
|
| |
$623 |
|
$558 |
|
| Other current assets |
|
|
|
|
|
Value added taxes recoverable1 |
319 |
|
208 |
|
| Prepaid expenses |
206 |
|
227 |
|
Other2 |
87 |
|
84 |
|
| |
$612 |
|
$519 |
|
|
|
|
|
|
|
|
|
|
|
|
|
1Primarily includes VAT and fuel tax recoverables of $25 million in Mali, $90 million in Tanzania, $141 million in Zambia, $39 million in Argentina, and $11 million in the Dominican Republic (Dec. 31, 2020: $59 million, $35 million, $52 million, $37 million, and $11 million, respectively).
2Balance includes $50 million asset reflecting the final settlement of Zambian tax matters.
|
|
|
|
|
|
|
|
|
| BARRICK YEAR-END 2021 |
170 |
NOTES TO FINANCIAL STATEMENTS |
19 n Property, Plant, and Equipment
|
|
|
|
|
|
|
|
|
|
|
|
|
|
|
|
|
Buildings, plant and equipment1 |
Mining property costs subject to depreciation2,4 |
Mining property costs not subject to depreciation2,3 |
Total |
|
| At January 1, 2021 |
|
|
|
|
|
| Net of accumulated depreciation |
$7,473 |
|
$13,569 |
|
$3,586 |
|
$24,628 |
|
|
Additions5 |
23 |
|
154 |
|
2,366 |
|
2,543 |
|
|
| Capitalized interest |
— |
|
— |
|
16 |
|
16 |
|
|
|
|
|
|
|
|
| Divestiture |
(50) |
|
(2) |
|
(1) |
|
(53) |
|
|
| Disposals |
(7) |
|
(1) |
|
(10) |
|
(18) |
|
|
| Depreciation |
(1,139) |
|
(1,053) |
|
— |
|
(2,192) |
|
|
| Impairment reversals (impairments) |
42 |
|
(13) |
|
1 |
|
30 |
|
|
Transfers6 |
194 |
|
1,831 |
|
(2,025) |
|
— |
|
|
|
|
|
|
|
|
| At December 31, 2021 |
$6,536 |
|
$14,485 |
|
$3,933 |
|
$24,954 |
|
|
| At December 31, 2021 |
|
|
|
|
|
| Cost |
$17,237 |
|
$31,824 |
|
$15,876 |
|
$64,937 |
|
|
| Accumulated depreciation and impairments |
(10,701) |
|
(17,339) |
|
(11,943) |
|
(39,983) |
|
|
| Net carrying amount – December 31, 2021 |
$6,536 |
|
$14,485 |
|
$3,933 |
|
$24,954 |
|
|
|
|
|
|
|
|
|
|
|
|
|
|
|
|
|
|
|
|
|
|
|
|
|
|
| |
Buildings, plant and equipment1 |
Mining property costs subject to depreciation2,4 |
Mining property costs not subject to depreciation2,3 |
Total |
|
| At January 1, 2020 |
|
|
|
|
|
| Cost |
$18,544 |
|
$27,268 |
|
$16,050 |
|
$61,862 |
|
|
| Accumulated depreciation and impairments |
(10,791) |
|
(14,980) |
|
(11,950) |
|
(37,721) |
|
|
| Net carrying amount – January 1, 2020 |
$7,753 |
|
$12,288 |
|
$4,100 |
|
$24,141 |
|
|
Additions5 |
10 |
|
259 |
|
1,919 |
|
2,188 |
|
|
| Capitalized interest |
— |
|
— |
|
24 |
|
24 |
|
|
|
|
|
|
|
|
|
|
|
|
|
|
| Disposals |
(24) |
|
(1) |
|
(12) |
|
(37) |
|
|
| Depreciation |
(1,219) |
|
(1,146) |
|
— |
|
(2,365) |
|
|
| Impairment reversals |
260 |
|
412 |
|
5 |
|
677 |
|
|
Transfers6 |
693 |
|
1,757 |
|
(2,450) |
|
— |
|
|
|
|
|
|
|
|
| At December 31, 2020 |
$7,473 |
|
$13,569 |
|
$3,586 |
|
$24,628 |
|
|
| At December 31, 2020 |
|
|
|
|
|
| Cost |
$18,361 |
|
$29,901 |
|
$15,531 |
|
$63,793 |
|
|
| Accumulated depreciation and impairments |
(10,888) |
|
(16,332) |
|
(11,945) |
|
(39,165) |
|
|
| Net carrying amount – December 31, 2020 |
$7,473 |
|
$13,569 |
|
$3,586 |
|
$24,628 |
|
|
|
|
|
|
|
|
|
|
|
|
|
|
|
|
|
|
|
|
|
|
|
|
|
|
1Additions include $22 million of right-of-use assets for lease arrangements entered into during the year ended December 31, 2021 (2020: $4 million). Depreciation includes depreciation for leased right-of-use assets of $18 million for the year ended December 31, 2021 (2020: $21 million). The net carrying amount of leased right-of-use assets was $53 million as at December 31, 2021 (2020: $50 million).
2Includes capitalized reserve acquisition costs, capitalized development costs and capitalized exploration and evaluation costs other than exploration license costs included in intangible assets.
3Assets not subject to depreciation include construction-in-progress, projects and acquired mineral resources and exploration potential at operating minesites and development projects.
4Assets subject to depreciation include the following items for production stage properties: acquired mineral reserves and resources, capitalized mine development costs, capitalized stripping and capitalized exploration and evaluation costs.
5Additions include revisions to the capitalized cost of closure and rehabilitation activities.
6Primarily relates to long-lived assets that are transferred between categories within PP&E once they are placed into service.
|
|
|
|
|
|
|
|
|
| BARRICK YEAR-END 2021 |
171 |
NOTES TO FINANCIAL STATEMENTS |
a) Mineral Property Costs Not Subject to Depreciation
|
|
|
|
|
|
|
|
|
|
Carrying amount at Dec. 31, 2021 |
Carrying amount at Dec. 31, 2020 |
Construction-in-progress1 |
$2,114 |
|
$1,208 |
|
| Acquired mineral resources and exploration potential |
165 |
|
786 |
|
| Projects |
|
|
| Pascua-Lama |
780 |
|
741 |
|
| Norte Abierto |
662 |
|
653 |
|
| Donlin Gold |
212 |
|
198 |
|
| |
$3,933 |
|
$3,586 |
|
|
|
|
|
|
|
|
|
|
1Represents assets under construction at our operating minesites.
b) Changes in Gold and Copper Mineral Life of Mine Plan
As part of our annual business cycle, we prepare updated estimates of proven and probable gold and copper mineral reserves and the portion of resources considered probable of economic extraction for each mineral property. This forms the basis for our LOM plans. We prospectively revise
calculations of amortization expense for property, plant and equipment amortized using the UOP method, where the denominator is our LOM ounces. The effect of changes in our LOM on amortization expense for 2021 was a $128 million decrease (2020: $170 million decrease).
c) Capital Commitments
In addition to entering into various operational commitments in the normal course of business, we had commitments of approximately $443 million at December 31, 2021 (2020: $223 million) for construction activities at our sites and projects.
d) Other Lease Disclosure
The Company leases various buildings, plant and equipment as part of the normal course of operations. Lease terms are negotiated on an individual basis and contain a wide range of different terms and conditions. Refer to note 25 for a lease maturity analysis. Included in net income for 2021 are short-term payments and variable lease payments not included in the measurement of lease liabilities of $10 million (2020: $14 million) and $67 million (2020: $35 million), respectively.
20 n Goodwill and Other Intangible Assets
|
|
|
|
|
|
|
|
|
|
|
|
|
|
|
|
|
|
|
| a) Intangible Assets |
|
|
|
|
|
|
|
Water rights1 |
Technology2 |
Supply contracts3 |
Exploration potential4 |
Total |
|
| Opening balance January 1, 2020 |
$72 |
|
$7 |
|
$7 |
|
$140 |
|
$226 |
|
|
| Additions |
— |
|
— |
|
— |
|
5 |
|
5 |
|
|
| Disposals |
(5) |
|
— |
|
— |
|
(41) |
|
(46) |
|
|
| Amortization and impairment losses |
— |
|
(1) |
|
(3) |
|
(12) |
|
(16) |
|
|
| Closing balance December 31, 2020 |
$67 |
|
$6 |
|
$4 |
|
$92 |
|
$169 |
|
|
|
|
|
|
|
|
|
Disposals5 |
(6) |
|
— |
|
— |
|
(10) |
|
(16) |
|
|
| Amortization and impairment losses |
— |
|
— |
|
(3) |
|
— |
|
(3) |
|
|
| Closing balance December 31, 2021 |
$61 |
|
$6 |
|
$1 |
|
$82 |
|
$150 |
|
|
| Cost |
$61 |
|
$17 |
|
$39 |
|
$252 |
|
$369 |
|
|
| Accumulated amortization and impairment losses |
— |
|
(11) |
|
(38) |
|
(170) |
|
(219) |
|
|
| Net carrying amount December 31, 2021 |
$61 |
|
$6 |
|
$1 |
|
$82 |
|
$150 |
|
|
|
|
|
|
|
|
|
|
|
|
|
|
|
|
|
|
|
|
|
|
|
|
|
|
|
|
|
|
1Relates to water rights in South America, and will be amortized through cost of sales when we begin using these in the future.
2The amount is amortized through cost of sales using the UOP method over LOM ounces of the Pueblo Viejo mine, with no assumed residual value.
3Relates to a supply agreement with Michelin North America Inc. to secure a supply of tires and is amortized over the effective term of the contract through cost of sales.
4Exploration potential consists of the estimated fair value attributable to exploration licenses acquired as a result of a business combination or asset acquisition. The carrying value of the licenses will be transferred to PP&E when the development of attributable mineral resources commences.
5Exploration potential disposals relate to the sale of Acacia exploration properties.
|
|
|
|
|
|
|
|
|
| BARRICK YEAR-END 2021 |
172 |
NOTES TO FINANCIAL STATEMENTS |
b) Goodwill
|
|
|
|
|
|
|
|
|
|
|
|
|
|
|
|
|
|
Closing balance December 31, 2020 |
Additions |
|
Disposals |
Closing balance December 31, 2021 |
|
| Carlin |
$1,294 |
|
$— |
|
|
$— |
|
$1,294 |
|
|
Cortez1 |
899 |
|
— |
|
|
— |
|
899 |
|
|
| Turquoise Ridge |
722 |
|
— |
|
|
— |
|
722 |
|
|
| Phoenix |
119 |
|
— |
|
|
— |
|
119 |
|
|
|
|
|
|
|
|
|
|
|
|
|
|
|
|
| Hemlo |
63 |
|
— |
|
|
— |
|
63 |
|
|
|
|
|
|
|
|
|
| Loulo-Gounkoto |
1,672 |
|
— |
|
|
— |
|
1,672 |
|
|
|
|
|
|
|
|
|
| Total |
$4,769 |
|
$— |
|
|
$— |
|
$4,769 |
|
|
1Starting in Q1 2021, Goldrush is included as part of Cortez as the CODM began reviewing the operating results and assessing performance on a combined level. The goodwill of Cortez and Goldrush has been combined and the prior period has been changed to reflect this presentation.
On a total basis, the gross amount and accumulated impairment losses are as follows:
|
|
|
|
|
|
| Cost |
$12,211 |
|
|
|
|
|
| Accumulated impairment losses December 31, 2021 |
(7,442) |
|
| Net carrying amount December 31, 2021 |
$4,769 |
|
|
|
21 n Impairment and Reversal of Non-Current Assets
Summary of impairments (reversals)
For the year ended December 31, 2021, we recorded net impairment reversals of $63 million (2020: net impairment reversals of $269 million) for non-current assets, as summarized in the following table:
|
|
|
|
|
|
|
|
|
| For the years ended December 31 |
2021 |
2020 |
| Tanzania |
$5 |
|
($304) |
|
| Cortez |
— |
|
10 |
|
| Pueblo Viejo |
(7) |
|
5 |
|
|
|
|
|
|
|
| Lagunas Norte |
(86) |
|
— |
|
| Golden Sunlight |
15 |
|
— |
|
|
|
|
| Hemlo |
5 |
|
— |
|
| Intangible assets |
— |
|
12 |
|
| Other |
5 |
|
8 |
|
|
|
|
| Total impairment (reversals) losses of long-lived assets |
($63) |
|
($269) |
|
|
|
|
|
|
|
|
|
|
|
|
|
|
|
|
|
|
|
|
|
|
|
|
|
|
|
|
|
|
|
2021 Indicators of Impairment and Reversals
In the fourth quarter of 2021, as per our policy, we performed our annual goodwill impairment test as required by IAS 36 and identified no impairments. Also in the fourth quarter of 2021, we reviewed the updated LOM plans for our other operating minesites for indicators of impairment or reversal. We noted an indicator of impairment at Long Canyon and an indicator of impairment reversal at Lumwana.
Long Canyon
The delayed timing of permitting activities and an updated geological model resulting in lower production over the LOM plan represented impairment triggers in the fourth quarter of 2021. We have performed an analysis and concluded that the carrying amount remains recoverable under the revised LOM plan. The key assumptions used in this assessment are consistent with our testing of goodwill impairment in the fourth quarter of 2021, as listed below.
Lumwana
In the fourth quarter of 2021, the Zambian government enacted amendments to the income tax laws, effective January 1, 2022, which allow for the deductibility of royalties when calculating income tax. We determined that this was an indicator of an impairment reversal, therefore we performed an analysis of the FVLCD and concluded that no reversal was appropriate at this time.
First Quarter 2021
Lagunas Norte
As described in note 4, on February 16, 2021, we announced an agreement to sell our 100% interest in the Lagunas Norte gold mine in Peru to Boroo for total consideration of up to $81 million. An impairment reversal of $86 million was recognized in the first quarter of 2021 based on the March 31, 2021 fair value of the consideration to be received of $63 million. Lagunas Norte was in a net liability position, which resulted in an impairment reversal that exceeded the FVLCD. The transaction closed on June 1, 2021.
Porgera
On April 9, 2021, the Papua New Guinea ("PNG") government and Barrick Niugini Limited (“BNL”, the 95% owner and operator of the Porgera joint venture) agreed on a partnership for the future ownership and operation of the Porgera mine. Porgera has been on care and maintenance since April 2020, when the government declined to renew its special mining lease ("SML"). The financial impact will be determined once all definitive agreements, which are currently being negotiated, have been signed. We have determined that the carrying value of our 47.5% share of Porgera ($299 million as at December 31, 2021) remains recoverable and there is no impairment loss to recognize. The ultimate resolution of this dispute may differ from this assumption and there is no certainty that the carrying value will remain recoverable. Refer to note 35 for more information.
|
|
|
|
|
|
|
|
|
| BARRICK YEAR-END 2021 |
173 |
NOTES TO FINANCIAL STATEMENTS |
2020 Indicators of Impairment and Reversals
Fourth Quarter 2020
In the fourth quarter of 2020, as per our policy, we performed our annual goodwill impairment test as required by IAS 36 and identified no impairments. Also in the fourth quarter of 2020, we reviewed the updated LOM plans for our other operating minesites for indicators of impairment or reversal. We noted one indicator of impairment at Veladero and no indicators of impairment reversal.
Veladero
In December 2020, Veladero began a transition to a new heap leach valley facility to process subsequent phases of the open pit. During the transition phase, heap leach processing operations at Veladero were reduced until the Phase 6 leach pad expansion was commissioned later in 2021. We performed an analysis and concluded that the carrying amount remains recoverable under the revised LOM plan. The key assumptions used in this assessment were consistent with our testing of goodwill impairment in the fourth quarter of 2020, as listed below.
Porgera
As described in note 35, on April 24, 2020, we received communication from the Government of Papua New Guinea that the Special Mining Lease will not be extended, and therefore Porgera was placed on temporary care and maintenance on April 25, 2020. We have performed an analysis and concluded that the carrying value of our 47.5% share of Porgera ($297 million as at December 31, 2020) remains recoverable. The ultimate resolution of this dispute may differ from this assumption and there is no certainty that the carrying value will remain recoverable.
Tanzania
On January 24, 2020, Barrick formalized the establishment of a joint venture between Barrick and the GoT and resolution of all outstanding disputes between Barrick and the GoT, including the lifting of the previous concentrate export ban, effective immediately. Effective January 1, 2020, the GoT received a free carried shareholding of 16% in each of the Tanzania mines (Bulyanhulu, Buzwagi and North Mara), a 16% interest in the shareholder loans owed by the operating companies and will receive half of the economic benefits from the Tanzanian operations from taxes, royalties, clearing fees and participation in all cash distributions made by the mines, after the recoupment of capital investments.
We have determined this to be an indicator of impairment reversal, as the resolution of the long-standing dispute has led to a decrease in the risk adjustment previously included in the weighted average cost of capital ("WACC") and the removal of the estimated impact of the previously anticipated issuance of the equity to the GoT. The key assumptions and estimates used in determining the FVLCD are a short-term gold price of $1,350 per ounce, long-term gold price of $1,300 per ounce, NAV multiples of 1.1-1.3 and a WACC of 5.4%-6.2%. Management assumed the resumption of concentrate sales and exports commencing in the second quarter of 2020 and the resumption of production from underground mining at Bulyanhulu in 2020. We identified that the FVLCD exceeded the carrying value and a full non-current asset impairment reversal was recognized in 2020 of $663 million at Bulyanhulu and $46 million at North Mara, based on a
FVLCD of $1,237 million and $967 million, respectively. No impairment reversal was recognized at Buzwagi.
Similar assumptions were also used to determine the fair value of the 16% equity interest in each of the operating mines that was given to the GoT. The recognition of this non-controlling interest in the three Tanzanian mines resulted in a loss of $238 million being recognized in the first quarter of 2020. The assignment of 16% of the existing shareholder loans also resulted in the recognition of a $167 million loss in the first quarter of 2020.
As the signing of the agreement to resolve all outstanding disputes with the GoT caused the impairment reversal, loss on equity issuance and loss on assignment of shareholder loans, the financial impact has been aggregated and presented as a $304 million net impairment reversal on the consolidated statement of income.
Key Assumptions
Recoverable amount has been determined based on the estimated FVLCD, which has been determined to be greater than the VIU amounts. The key assumptions and estimates used in determining the FVLCD are related to future metal prices, weighted average costs of capital, NAV multiples for gold assets, operating costs, exchange rates, capital expenditures, closure costs, future production levels, continued license to operate, evidence of value from current year disposals and the expected start of production for our projects. In addition, assumptions are related to observable market evaluation metrics, including identification of comparable entities, and associated market values per ounce and per pound of reserves and/or resources, as well as the fair value of mineral resources outside of LOM plans.
Gold
For the gold segments where a recoverable amount was required to be determined, FVLCD was determined by calculating the net present value (“NPV”) of the future cash flows expected to be generated by the mines and projects within the CGU (Level 3 of the fair value hierarchy). The estimates of future cash flows were derived from the most recent LOM plans and, where the LOM plans exclude a material portion of total reserves and resources, we assign value to reserves and resources not considered in these models. Based on observable market or publicly available data, including forward prices and equity sell-side analyst forecasts, we make an assumption of future gold and silver prices to estimate future revenues. The future cash flows for each gold mine are discounted using a real WACC, which reflects specific market risk factors for each mine. Some gold companies trade at a market capitalization greater than the NPV of their expected cash flows. Market participants describe this as a “NAV multiple”, which represents the multiple applied to the NPV to arrive at the trading price. The NAV multiple is generally understood to take account of a variety of additional value factors such as the exploration potential of the mineral property, namely the ability to find and produce more metal than what is currently included in the LOM plan or reserve and resource estimates, and the benefit of gold price optionality. As a result, we applied a specific NAV multiple to the NPV of each CGU within each gold segment based on the NAV multiples observed in the market in recent periods and that we judged to be appropriate to the CGU.
|
|
|
|
|
|
|
|
|
| BARRICK YEAR-END 2021 |
174 |
NOTES TO FINANCIAL STATEMENTS |
Assumptions
The short-term and long-term gold price assumptions used in our fourth quarter 2021 impairment testing are $1,700 and $1,500 per ounce, respectively. The short-term and long-term gold price assumptions used in our fourth quarter 2020 impairment testing were $1,700 and $1,400 per ounce, respectively. The increase in the long-term gold price assumption from 2020 was not considered an indicator of impairment reversal as the increased price would not, in isolation, have resulted in the identification of an impairment reversal at our mines with reversible impairments. The other key assumptions used in our impairment testing, based on the CGUs tested in each year, are summarized in the table below:
|
|
|
|
|
|
|
|
|
|
2021 |
2020 |
| Copper price per lb (long-term) |
$3.00 |
$3.00 |
| WACC - gold (range) |
3%-8% |
3%-12% |
| WACC - gold (avg) |
4 |
% |
5 |
% |
| WACC - copper |
12 |
% |
n/a |
| NAV multiple - gold (avg) |
1.2 |
1.3 |
| LOM years - gold (avg) |
19 |
20 |
Sensitivities
Should there be a significant increase or decline in commodity prices, we would take actions to assess the implications on our LOM plans, including the determination of reserves and resources, and the appropriate cost structure for the CGU. The recoverable amount of the CGU would be affected by these changes and also be impacted by other market factors such as changes in NAV multiples and the value per ounce/pound of comparable market entities.
We performed a sensitivity analysis on each gold CGU that was tested as part of the goodwill impairment test, as well as those gold CGUs which we believe are most sensitive to changes in the key assumptions. We flexed the gold prices and the WACC, which are the most significant assumptions that impact the impairment calculations. We first assumed a +/- $100 per ounce change in our gold price assumptions, while holding all other assumptions constant. We then assumed a +/-1% change in our WACC, independent from the change in gold prices, while holding all other assumptions constant. Finally, we assumed a +/- 0.1 change in the NAV multiple, while holding all other assumptions constant. These sensitivities help to determine the theoretical impairment losses or impairment reversals that would be recorded with these changes in gold prices, WACC and NAV multiple. If the gold price per ounce was decreased by $100, the following impairments would be recognized: a goodwill impairment of $329 million at Loulo-Gounkoto and a non-current asset impairment of $134 million at Veladero. If the NAV multiple was decreased by 0.1, a non-current asset impairment of $91 million would be recognized at Veladero.
We also performed a sensitivity analysis on the Lumwana CGU. We flexed the copper prices and the WACC, which are the most significant assumptions that impact the impairment calculations. We first assumed a +/- $0.25 per pound change in our copper price assumptions, while holding all other assumptions constant. We then assumed a +/-1% change in our WACC, independent from the change in copper prices, while holding all other assumptions constant. These sensitivities help to determine
the theoretical impairment losses or impairment reversals that would be recorded with these changes in copper prices and WACC. If the copper price per pound was decreased by $0.25, a non-current asset impairment of $393 million would be recognized. If the copper price per pound was increased by $0.25, a non-current asset impairment reversal of $351 million would be recognized.
The carrying value of the CGUs that are most sensitive to changes in the key assumptions used in the FVLCD calculation are:
|
|
|
|
|
|
| As at December 31, 2021 |
Carrying Value |
| Loulo-Gounkoto |
$4,214 |
|
|
|
| Lumwana |
1,578 |
|
| Veladero |
774 |
|
| Long Canyon |
495 |
|
|
|
|
|
|
|
|
|
|
|
|
| BARRICK YEAR-END 2021 |
175 |
NOTES TO FINANCIAL STATEMENTS |
22 n Other Assets
|
|
|
|
|
|
|
|
|
|
As at December 31, 2021 |
As at December 31, 2020 |
Value added taxes receivable1 |
$199 |
|
$193 |
|
Other investments2 |
414 |
|
428 |
|
Notes receivable3 |
123 |
|
154 |
|
| Norte Abierto JV Partner Receivable |
150 |
|
193 |
|
Restricted cash4 |
147 |
|
146 |
|
|
|
|
Prepayments5 |
253 |
|
161 |
|
Derivative assets6 |
53 |
|
40 |
|
| Other |
170 |
|
148 |
|
|
$1,509 |
|
$1,463 |
|
|
|
|
|
|
|
|
|
|
1Includes VAT and fuel tax receivables of $47 million in Argentina, $94 million in Tanzania and $58 million in Chile (Dec. 31, 2020: $52 million, $79 million and $61 million, respectively).
2Includes equity investments in other mining companies.
3Primarily represents the interest bearing promissory note due from NovaGold.
4Primarily represents the cash balance at Pueblo Viejo that is contractually restricted in respect of disbursements for environmental rehabilitation that are expected to occur near the end of Pueblo Viejo’s mine life.
5Primarily relates to prepaid royalties at Carlin and Pueblo Viejo.
6Primarily consists of contingent consideration received as part of the sale of Massawa and Lagunas Norte. Refer to note 4.
23 n Accounts Payable
|
|
|
|
|
|
|
|
|
|
As at December 31, 2021 |
As at December 31, 2020 |
| Accounts payable |
$539 |
|
$929 |
|
| Accruals |
909 |
|
529 |
|
|
$1,448 |
|
$1,458 |
|
|
|
|
|
|
|
24 n Other Current Liabilities
|
|
|
|
|
|
|
|
|
|
As at December 31, 2021 |
As at December 31, 2020 |
| Provision for environmental rehabilitation (note 27b) |
$166 |
|
$131 |
|
|
|
|
| Deposit on Pueblo Viejo gold and silver streaming agreement |
43 |
|
47 |
|
| Share-based payments (note 34a) |
57 |
|
67 |
|
|
|
|
| Pueblo Viejo JV partner shareholder loan |
9 |
|
— |
|
| Other |
63 |
|
61 |
|
|
$338 |
|
$306 |
|
|
|
|
|
|
|
25 n Financial Instruments
Financial instruments include cash; evidence of ownership in an entity; or a contract that imposes an obligation on one party and conveys a right to a second entity to deliver/receive cash or another financial instrument. Information on certain types of financial instruments is included elsewhere in these consolidated financial statements as follows: accounts receivable (note 18); restricted share units (note 34a).
a) Cash and Equivalents
Cash and equivalents include cash, term deposits, treasury bills and money market investments with original maturities of less than 90 days.
|
|
|
|
|
|
|
|
|
|
As at December 31, 2021 |
As at December 31, 2020 |
| Cash deposits |
$3,691 |
|
$3,713 |
|
| Term deposits |
1,582 |
|
1,469 |
|
| Money market investments |
7 |
|
6 |
|
|
$5,280 |
|
$5,188 |
|
|
|
|
|
|
|
Of total cash and cash equivalents as of December 31, 2021, $nil (2020: $nil) was held in subsidiaries which have regulatory regulations, contractual restrictions or operate in countries where exchange controls and other legal restrictions apply and are therefore not available for general use by the Company.
|
|
|
|
|
|
|
|
|
| BARRICK YEAR-END 2021 |
176 |
NOTES TO FINANCIAL STATEMENTS |
b) Debt and Interest1
|
|
|
|
|
|
|
|
|
|
|
|
|
|
|
|
|
|
|
|
Closing balance December 31, 2020 |
Proceeds |
Repayments |
Amortization and other2 |
Closing balance December 31, 2021 |
|
5.7% notes3,10 |
$842 |
|
$— |
|
$— |
|
$1 |
|
$843 |
|
|
5.25% notes4 |
744 |
|
— |
|
— |
|
— |
|
744 |
|
|
5.80% notes5,10 |
395 |
|
— |
|
— |
|
— |
|
395 |
|
|
6.35% notes6,10 |
594 |
|
— |
|
— |
|
— |
|
594 |
|
|
Other fixed rate notes7,10 |
1,081 |
|
— |
|
— |
|
1 |
|
1,082 |
|
|
|
|
|
|
|
|
|
Leases8 |
66 |
|
— |
|
(20) |
|
22 |
|
68 |
|
|
| Other debt obligations |
590 |
|
— |
|
(7) |
|
(2) |
|
581 |
|
|
5.75% notes9,10 |
843 |
|
— |
|
— |
|
— |
|
843 |
|
|
|
|
|
|
|
|
|
|
$5,155 |
|
$— |
|
($27) |
|
$22 |
|
$5,150 |
|
|
Less: current portion12 |
(20) |
|
— |
|
— |
|
— |
|
(15) |
|
|
|
$5,135 |
|
$— |
|
($27) |
|
$22 |
|
$5,135 |
|
|
|
|
|
|
|
|
|
|
|
|
|
|
|
|
|
|
|
|
|
|
|
|
|
|
|
|
|
|
|
|
|
|
|
|
|
|
|
|
|
|
|
|
|
|
|
|
|
|
Closing balance December 31, 2019 |
Proceeds |
Repayments |
Amortization and other2 |
Closing balance December 31, 2020 |
|
5.7% notes3,10 |
$842 |
|
$— |
|
$— |
|
$— |
|
$842 |
|
|
3.85%/5.25% notes4 |
1,079 |
|
— |
|
(337) |
|
2 |
|
744 |
|
|
5.80% notes5,10 |
395 |
|
— |
|
— |
|
— |
|
395 |
|
|
6.35% notes6,10 |
594 |
|
— |
|
— |
|
— |
|
594 |
|
|
Other fixed rate notes7,10 |
1,080 |
|
— |
|
— |
|
1 |
|
1,081 |
|
|
|
|
|
|
|
|
|
Leases8 |
96 |
|
— |
|
(26) |
|
(4) |
|
66 |
|
|
| Other debt obligations |
594 |
|
— |
|
(2) |
|
(2) |
|
590 |
|
|
5.75% notes9,10 |
842 |
|
— |
|
— |
|
1 |
|
843 |
|
|
Acacia credit facility11 |
14 |
|
— |
|
(14) |
|
— |
|
— |
|
|
|
$5,536 |
|
$— |
|
($379) |
|
($2) |
|
$5,155 |
|
|
Less: current portion12 |
(375) |
|
— |
|
— |
|
— |
|
(20) |
|
|
|
$5,161 |
|
$— |
|
($379) |
|
($2) |
|
$5,135 |
|
|
|
|
|
|
|
|
|
|
|
|
|
|
|
|
|
|
|
|
|
|
|
1The agreements that govern our long-term debt each contain various provisions which are not summarized herein. These provisions allow Barrick, at its option, to redeem indebtedness prior to maturity at specified prices and also may permit redemption of debt by Barrick upon the occurrence of certain specified changes in tax legislation.
2Amortization of debt premium/discount and increases (decreases) in capital leases.
3Consists of $850 million (2020: $850 million) of our wholly-owned subsidiary Barrick North America Finance LLC (“BNAF”) notes due 2041.
4Consists of $750 million (2020: $750 million) of 5.25% notes which mature in 2042.
5Consists of $400 million (2020: $400 million) of 5.80% notes which mature in 2034.
6Consists of $600 million (2020: $600 million) of 6.35% notes which mature in 2036.
7Consists of $1.1 billion (2020: $1.1 billion) in conjunction with our wholly-owned subsidiary BNAF and our wholly-owned subsidiary Barrick (PD) Australia Finance Pty Ltd. (“BPDAF”). This consists of $250 million (2020: $250 million) of BNAF notes due 2038 and $850 million (2020: $850 million) of BPDAF notes due 2039.
8Consists primarily of leases at Nevada Gold Mines, $18 million, Loulo-Gounkoto, $25 million, Lumwana, $6 million, Hemlo, $4 million, Pascua-Lama, $2 million and Tongon, $4 million (2020: $18 million, $28 million, $8 million, $2 million, $2 million and $4 million, respectively).
9Consists of $850 million (2020: $850 million) in conjunction with our wholly-owned subsidiary BNAF.
10We provide an unconditional and irrevocable guarantee on all BNAF, BPDAF, Barrick Gold Finance Company (“BGFC”), and Barrick (HMC) Mining (“BHMC”) notes and generally provide such guarantees on all BNAF, BPDAF, BGFC, and BHMC notes issued, which rank equally with our other unsecured and unsubordinated obligations.
11Consists of an export credit backed term loan facility.
12The current portion of long-term debt consists of leases ($15 million; 2020: $13 million), and other debt obligations ($nil; 2020: $7 million).
|
|
|
|
|
|
|
|
|
| BARRICK YEAR-END 2021 |
177 |
NOTES TO FINANCIAL STATEMENTS |
5.7% Notes
In June 2011, BNAF issued an aggregate of $4.0 billion in debt securities consisting of $850 million of 5.70% notes that mature in 2041 issued by BNAF (collectively, the “BNAF Notes”). Barrick provides an unconditional and irrevocable guarantee of the BNAF Notes, which rank equally with Barrick’s other unsecured and unsubordinated obligations.
3.85% and 5.25% Notes
On April 3, 2012, we issued an aggregate of $2 billion in debt securities comprised of $1.25 billion of 3.85% notes that mature in 2022 and $750 million of 5.25% notes that mature in 2042. During 2015, $913 million of the 3.85% notes was repaid. On January 31, 2020, the remaining $337 million of the 3.85% notes was repaid.
Other Fixed Rate Notes
On October 16, 2009, we issued debentures through our wholly-owned indirect subsidiary BPDAF consisting of $850 million of 30-year notes with a coupon rate of 5.95%. We also provide an unconditional and irrevocable guarantee of these payments, which rank equally with our other unsecured and unsubordinated obligations.
In September 2008, we issued an aggregate of $1.25 billion of notes through our wholly-owned indirect subsidiaries BNAF and BGFC consisting of $250 million of 30-year notes with a coupon rate of 7.5%. We also provide an unconditional and irrevocable guarantee of these payments, which rank equally with our other unsecured and unsubordinated obligations.
5.75% Notes
On May 2, 2013, we issued an aggregate of $3 billion in notes through Barrick and our wholly-owned indirect subsidiary BNAF consisting of $850 million of 5.75% notes issued by BNAF that mature in 2043. $2 billion of the net proceeds from this offering was used to repay amounts outstanding under our revolving credit facility at that time. We provide an unconditional and irrevocable guarantee on the $850 million of 5.75% notes issued by BNAF, which rank equally with our other unsecured and unsubordinated obligations.
Amendment and Refinancing of the Credit Facility
In May 2021, we amended the credit and guarantee agreement (the “Credit Facility”) with certain Lenders, which requires such Lenders to make available to us a credit facility of $3.0 billion or the equivalent amount in Canadian dollars. The Credit Facility, which is unsecured, currently has an interest rate of London Interbank Offered Rate (“LIBOR”) plus 1.125% on drawn amounts, and a standby rate of 0.11% on undrawn amounts. The Credit Facility also includes terms to replace LIBOR with a suitable replacement once that matter is resolved. The replacement of LIBOR is not expected to have an impact on the consolidated financial statements. As part of the amendment, the termination date of the Credit Facility was extended from January 2025 to May 2026. The Credit Facility was undrawn as at December 31, 2021.
Acacia Credit Facility
In January 2013, Acacia concluded negotiations with a group of commercial banks for the provision of an export credit backed term loan facility (the “Facility”) for the amount of $142 million. The Facility was put in place to fund a substantial portion of the construction costs of the carbon in leach (“CIL”) circuit at the process plant at Bulyanhulu. The Facility had a term of seven years and, when drawn, the spread over LIBOR was 250 basis points. The Facility was repayable in equal installments over the term of the Facility, after a two-year repayment holiday period. At December 31, 2014, the full value of the Facility was drawn. During 2015, $14 million was repaid. During 2016, $29 million was repaid. During 2017, $28 million was repaid. During 2018, $28 million was repaid. During 2019, $29 million was repaid. In January 2020, the final installment of $14 million was paid.
|
|
|
|
|
|
|
|
|
| BARRICK YEAR-END 2021 |
178 |
NOTES TO FINANCIAL STATEMENTS |
Interest
|
|
|
|
|
|
|
|
|
|
|
|
|
|
|
|
|
|
| |
2021 |
|
2020 |
| For the years ended December 31 |
Interest cost |
Effective rate1 |
|
Interest cost |
Effective rate1 |
| 5.7% notes |
$49 |
|
5.74 |
% |
|
$49 |
|
5.73 |
% |
| 3.85%/5.25% notes |
40 |
|
5.29 |
% |
|
41 |
|
5.31 |
% |
| 5.80% notes |
23 |
|
5.85 |
% |
|
23 |
|
5.84 |
% |
| 6.35% notes |
38 |
|
6.41 |
% |
|
38 |
|
6.39 |
% |
| Other fixed rate notes |
70 |
|
6.38 |
% |
|
70 |
|
6.38 |
% |
|
|
|
|
|
|
| Leases |
5 |
|
7.66 |
% |
|
5 |
|
6.09 |
% |
| Other debt obligations |
35 |
|
6.25 |
% |
|
34 |
|
6.16 |
% |
| 5.75% notes |
49 |
|
5.79 |
% |
|
49 |
|
5.77 |
% |
|
|
|
|
|
|
| Deposits on Pascua-Lama silver sale agreement (note 29) |
4 |
|
2.82 |
% |
|
1 |
|
0.53 |
% |
| Deposits on Pueblo Viejo gold and silver streaming agreement (note 29) |
31 |
|
6.24 |
% |
|
33 |
|
6.44 |
% |
| Other interest |
21 |
|
|
|
— |
|
|
|
$365 |
|
|
|
$343 |
|
|
| Less: interest capitalized |
(16) |
|
|
|
(24) |
|
|
| |
$349 |
|
|
|
$319 |
|
|
|
|
|
|
|
|
|
|
|
|
|
|
|
|
|
|
|
|
1The effective rate includes the stated interest rate under the debt agreement, amortization of debt issue costs and debt discount/premium and the impact of interest rate contracts designated in a hedging relationship with debt.
Scheduled Debt Repayments1
|
|
|
|
|
|
|
|
|
|
|
|
|
|
|
|
|
|
|
|
|
|
|
|
|
|
|
|
|
|
|
|
Issuer |
Maturity Year |
2022 |
2023 |
2024 |
2025 |
2026 |
2027 and thereafter |
Total |
|
|
|
|
|
|
|
|
|
|
|
|
|
|
|
|
|
|
|
|
|
|
|
|
|
|
|
|
|
|
|
|
|
|
|
|
|
|
|
|
|
|
|
|
|
|
|
|
|
|
|
|
|
|
|
|
|
|
|
|
|
|
|
|
|
|
|
7.73% notes2 |
BGC |
2025 |
$— |
|
$— |
|
$— |
|
$7 |
|
$— |
|
$— |
|
$7 |
|
|
7.70% notes2 |
BGC |
2025 |
— |
|
— |
|
— |
|
5 |
|
— |
|
— |
|
5 |
|
|
7.37% notes2 |
BGC |
2026 |
— |
|
— |
|
— |
|
— |
|
32 |
|
— |
|
32 |
|
|
8.05% notes2 |
BGC |
2026 |
— |
|
— |
|
— |
|
— |
|
15 |
|
— |
|
15 |
|
|
6.38% notes2 |
BGC |
2033 |
— |
|
— |
|
— |
|
— |
|
— |
|
200 |
|
200 |
|
|
| 5.80% notes |
BGC |
2034 |
— |
|
— |
|
— |
|
— |
|
— |
|
200 |
|
200 |
|
|
| 5.80% notes |
BGFC |
2034 |
— |
|
— |
|
— |
|
— |
|
— |
|
200 |
|
200 |
|
|
6.45% notes2 |
BGC |
2035 |
— |
|
— |
|
— |
|
— |
|
— |
|
300 |
|
300 |
|
|
| 6.35% notes |
BHMC |
2036 |
— |
|
— |
|
— |
|
— |
|
— |
|
600 |
|
600 |
|
|
7.50% notes3 |
BNAF |
2038 |
— |
|
— |
|
— |
|
— |
|
— |
|
250 |
|
250 |
|
|
5.95% notes3 |
BPDAF |
2039 |
— |
|
— |
|
— |
|
— |
|
— |
|
850 |
|
850 |
|
|
| 5.70% notes |
BNAF |
2041 |
— |
|
— |
|
— |
|
— |
|
— |
|
850 |
|
850 |
|
|
| 5.25% notes |
BGC |
2042 |
— |
|
— |
|
— |
|
— |
|
— |
|
750 |
|
750 |
|
|
| 5.75% notes |
BNAF |
2043 |
— |
|
— |
|
— |
|
— |
|
— |
|
850 |
|
850 |
|
|
|
|
|
|
|
|
|
|
|
|
|
|
|
|
|
|
|
|
|
|
|
|
|
|
|
|
|
|
|
|
|
|
|
| |
|
|
$— |
|
$— |
|
$— |
|
$12 |
|
$47 |
|
$5,050 |
|
$5,109 |
|
|
| Minimum annual payments under leases |
|
|
$15 |
|
$12 |
|
$5 |
|
$5 |
|
$3 |
|
$27 |
|
$67 |
|
|
|
|
|
|
|
|
|
|
|
|
|
|
|
|
|
|
|
|
|
|
|
|
1This table illustrates the contractual undiscounted cash flows, and may not agree with the amounts disclosed in the consolidated balance sheet.
2Included in Other debt obligations in the Long-Term Debt table.
3Included in Other fixed rate notes in the Long-Term Debt table.
|
|
|
|
|
|
|
|
|
| BARRICK YEAR-END 2021 |
179 |
NOTES TO FINANCIAL STATEMENTS |
c) Derivative Instruments (“Derivatives”)
In the normal course of business, our assets, liabilities and forecasted transactions, as reported in US dollars, are impacted by various market risks including, but not limited to:
|
|
|
|
|
|
| Item |
Impacted by |
● Revenue |
● Prices of gold, silver and copper |
| ● Cost of sales |
|
| o Consumption of diesel fuel, propane, natural gas, and electricity |
o Prices of diesel fuel, propane, natural gas, and electricity |
| o Non-US dollar expenditures |
o Currency exchange rates - US dollar versus A$, ARS, C$, CLP, DOP, EUR, PGK, TZS, XOF, ZAR and ZMW |
| ● General and administration, exploration and evaluation costs |
● Currency exchange rates - US dollar versus A$, ARS, C$, CLP, DOP, GBP, PGK, TZS, XOF, ZAR, and ZMW |
| ● Capital expenditures |
|
| o Non-US dollar capital expenditures |
o Currency exchange rates - US dollar versus A$, ARS, C$, CLP, DOP, EUR, GBP, PGK, XOF, ZAR, and ZMW |
| o Consumption of steel |
o Price of steel |
| ● Interest earned on cash and equivalents |
● US dollar interest rates |
| ● Interest paid on fixed-rate borrowings |
● US dollar interest rates |
The time frame and manner in which we manage those risks varies for each item based upon our assessment of the risk and available alternatives for mitigating risk. For these particular risks, we believe that derivatives are an appropriate way of managing the risk.
We use derivatives as part of our risk management program to mitigate variability associated with changing market values related to the hedged item. Many of the derivatives we use meet the hedge effectiveness criteria and are designated in a hedge accounting relationship.
Certain derivatives are designated as either hedges of the fair value of recognized assets or liabilities or of firm commitments (“fair value hedges”) or hedges of highly probable forecasted transactions (“cash flow hedges”), collectively known as “accounting hedges”. Hedges that are expected to be highly effective in achieving offsetting changes in fair value or cash flows are assessed on an ongoing basis to determine that they actually have been highly effective throughout the financial reporting periods for which they were designated. Some of the derivatives we use are effective in achieving our risk management objectives, but they do not meet the strict hedge accounting criteria. These derivatives are considered to be “non-hedge derivatives”.
During 2021 and 2020, we did not enter into any derivative contracts for US dollar interest rates, currencies, or commodity inputs. During 2020, we sold 57 thousand ounces of producer gold collars. We had no contracts outstanding at December 31, 2021.
26 n Fair Value Measurements
Fair value is the price that would be received to sell an asset or paid to transfer a liability in an orderly transaction between market participants at the measurement date. The fair value hierarchy establishes three levels to classify the inputs to valuation techniques used to measure fair value. Level 1 inputs are quoted prices (unadjusted) in active markets for identical assets or liabilities. Level 2 inputs are quoted prices in markets that are not active, quoted prices for similar assets or liabilities in active markets, inputs other than quoted prices that are observable for the asset or liability (for example, interest rate and yield curves observable at commonly quoted intervals, forward pricing curves used to value currency and commodity contracts and volatility measurements used to value option contracts), or inputs that are derived principally from or corroborated by observable market data or other means. Level 3 inputs are unobservable (supported by little or no market activity). The fair value hierarchy gives the highest priority to Level 1 inputs and the lowest priority to Level 3 inputs.
|
|
|
|
|
|
|
|
|
| BARRICK YEAR-END 2021 |
180 |
NOTES TO FINANCIAL STATEMENTS |
a) Assets and Liabilities Measured at Fair Value on a Recurring Basis
|
|
|
|
|
|
|
|
|
|
|
|
|
|
|
|
| Fair Value Measurements |
|
|
|
|
|
| At December 31, 2021 |
Quoted Prices in Active Markets for Identical Assets |
Significant Other Observable Inputs |
Significant Unobservable Inputs |
Aggregate Fair Value |
|
| (Level 1) |
(Level 2) |
(Level 3) |
|
| Cash and equivalents |
$5,280 |
|
$— |
|
$— |
|
$5,280 |
|
|
Other investments1 |
414 |
|
— |
|
— |
|
414 |
|
|
| Derivatives |
— |
|
53 |
|
— |
|
53 |
|
|
| Receivables from provisional copper and gold sales |
— |
|
242 |
|
— |
|
242 |
|
|
|
$5,694 |
|
$295 |
|
$— |
|
$5,989 |
|
|
|
|
|
|
|
|
|
|
|
|
|
|
| Fair Value Measurements |
|
|
|
|
|
| At December 31, 2020 |
Quoted Prices in Active Markets for Identical Assets |
Significant Other Observable Inputs |
Significant Unobservable Inputs |
Aggregate Fair Value |
|
| (Level 1) |
(Level 2) |
(Level 3) |
|
| Cash and equivalents |
$5,188 |
|
$— |
|
$— |
|
$5,188 |
|
|
Other investments1 |
428 |
|
— |
|
— |
|
428 |
|
|
| Derivatives |
— |
|
40 |
|
— |
|
40 |
|
|
| Receivables from provisional copper and gold sales |
— |
|
265 |
|
— |
|
265 |
|
|
|
$5,616 |
|
$305 |
|
$— |
|
$5,921 |
|
|
|
|
|
|
|
|
|
|
|
|
|
|
1 Includes equity investments in other mining companies.
b) Fair Values of Financial Assets and Liabilities
|
|
|
|
|
|
|
|
|
|
|
|
|
|
|
| |
At December 31, 2021 |
At December 31, 2020 |
|
Carrying amount |
Estimated fair value |
Carrying amount |
Estimated fair value |
| Financial assets |
|
|
|
|
Other assets1 |
$382 |
|
$382 |
|
$571 |
|
$571 |
|
Other investments2 |
414 |
|
414 |
|
428 |
|
428 |
|
Derivative assets3 |
53 |
|
53 |
|
40 |
|
40 |
|
| |
$849 |
|
$849 |
|
$1,039 |
|
$1,039 |
|
| Financial liabilities |
|
|
|
|
Debt4 |
$5,150 |
|
$6,928 |
|
$5,155 |
|
$7,288 |
|
|
|
|
|
|
| Other liabilities |
473 |
|
473 |
|
382 |
|
382 |
|
|
$5,623 |
|
$7,401 |
|
$5,537 |
|
$7,670 |
|
|
|
|
|
|
|
|
|
|
|
|
|
|
|
|
1Includes restricted cash and amounts due from our partners.
2Includes equity investments in other mining companies. Recorded at fair value. Quoted market prices are used to determine fair value.
3Primarily consists of contingency consideration received as part of the sale of Massawa and Lagunas Norte.
4Debt is generally recorded at amortized cost except for obligations that are designated in a fair-value hedge relationship, in which case the carrying amount is adjusted for changes in fair value of the hedging instrument in periods when a hedge relationship exists. The fair value of debt is primarily determined using quoted market prices. Balance includes both current and long-term portions of debt.
We do not offset financial assets with financial liabilities.
|
|
|
|
|
|
|
|
|
| BARRICK YEAR-END 2021 |
181 |
NOTES TO FINANCIAL STATEMENTS |
c) Assets Measured at Fair Value on a Non-Recurring Basis Valuation Techniques
Derivative Instruments
The fair value of derivative instruments is determined using either present value techniques or option pricing models that utilize a variety of inputs that are a combination of quoted prices and market-corroborated inputs. The fair value of all our derivative contracts includes an adjustment for credit risk. For counterparties in a net asset position, credit risk is based upon the observed credit default swap spread for each particular counterparty, as appropriate. For counterparties in a net liability position, credit risk is based upon Barrick’s observed credit default swap (“CDS”) spread. The fair value of US dollar interest rate and currency swap contracts is determined by discounting contracted cash flows using a discount rate derived from observed LIBOR and swap rate curves and credit default swap rates. In the case of currency contracts, we convert non-US dollar cash flows into US dollars using an exchange rate derived from currency swap curves and CDS rates. The fair value of commodity forward contracts is determined by discounting contractual cash flows using a discount rate derived from observed LIBOR and swap rate curves and CDS rates. Contractual cash flows are calculated using a forward pricing curve derived from observed forward prices for each commodity. Derivative instruments are classified within Level 2 of the fair value hierarchy.
Receivables from Provisional Copper and Gold Sales
The fair value of receivables arising from copper and gold sales contracts that contain provisional pricing mechanisms is determined using the appropriate quoted forward price from the exchange that is the principal active market for the particular metal. As such, these receivables, which meet the definition of an embedded derivative, are classified within Level 2 of the fair value hierarchy.
Other Long-Term Assets
The fair value of property, plant and equipment, goodwill, intangibles and other assets is determined primarily using an income approach based on unobservable cash flows and a market multiples approach where applicable, and as a result is classified within Level 3 of the fair value hierarchy. Refer to note 21 for disclosure of inputs used to develop these measures.
27 n Provisions
|
|
|
|
|
|
|
|
|
| a) Provisions |
|
|
|
As at December 31, 2021 |
As at December 31, 2020 |
| Environmental rehabilitation (“PER”) |
$2,559 |
|
$2,950 |
|
| Post-retirement benefits |
48 |
|
43 |
|
| Share-based payments |
17 |
|
24 |
|
| Other employee benefits |
42 |
|
25 |
|
| Other |
102 |
|
97 |
|
|
$2,768 |
|
$3,139 |
|
|
|
|
|
|
|
|
|
|
|
|
|
|
|
|
| b) Environmental Rehabilitation |
|
|
|
2021 |
2020 |
| At January 1 |
$3,081 |
|
$3,078 |
|
| PERs divested during the year |
(265) |
|
(6) |
|
| Closed Sites |
|
|
| Impact of revisions to expected cash flows recorded in earnings |
44 |
|
79 |
|
| Settlements |
|
|
| Cash payments |
(89) |
|
(67) |
|
| Settlement gains |
(6) |
|
(3) |
|
| Accretion |
18 |
|
16 |
|
| Operating Sites |
|
|
| PER revisions in the year |
(42) |
|
1 |
|
| Settlements |
|
|
| Cash payments |
(44) |
|
(39) |
|
| Settlement gains |
(2) |
|
(3) |
|
| Accretion |
30 |
|
25 |
|
|
|
|
| At December 31 |
$2,725 |
|
$3,081 |
|
| Current portion (note 24) |
(166) |
|
(131) |
|
|
$2,559 |
|
$2,950 |
|
|
|
|
|
|
|
|
|
|
The eventual settlement of substantially all PERs estimated is expected to take place between 2022 and 2061.
The total PER has decreased in the fourth quarter of 2021 by $97 million primarily due to spending incurred during the quarter, combined with the divestment of our Lone Tree mine and changes in cost estimates at our Pascua-Lama, Lumwana and Buzwagi properties. For the year ended December 31, 2021, our PER balance decreased by $356 million primarily due to the divestment of our Lagunas Norte mine and spending incurred during the year. A 1% increase in the discount rate would result in a decrease in PER by $315 million and a 1% decrease in the discount rate would result in a decrease in PER by $nil (as the discount rate used was 0%), while holding the other assumptions constant.
|
|
|
|
|
|
|
|
|
| BARRICK YEAR-END 2021 |
182 |
NOTES TO FINANCIAL STATEMENTS |
28 n Financial Risk Management
Our financial instruments are comprised of financial liabilities and financial assets. Our principal financial liabilities, other than derivatives, comprise accounts payable and debt. The main purpose of these financial instruments is to manage short-term cash flow and raise funds for our capital expenditure program. Our principal financial assets, other than derivative instruments, are cash and equivalents and accounts receivable, which arise directly from our operations. In the normal course of business, we use derivative instruments to mitigate exposure to various financial risks.
We manage our exposure to key financial risks in accordance with our financial risk management policy. The objective of the policy is to support the delivery of our financial targets while protecting future financial security. The main risks that could adversely affect our financial assets, liabilities or future cash flows are as follows:
a.Market risk, including commodity price risk, foreign currency and interest rate risk;
b.Credit risk;
c.Liquidity risk; and
d.Capital risk management.
Management designs strategies for managing each of these risks, which are summarized below. Our senior management oversees the management of financial risks. Our senior management ensures that our financial risk-taking activities are governed by policies and procedures and that financial risks are identified, measured and managed in accordance with our policies and our risk appetite. All derivative activities for risk management purposes are carried out by the appropriate personnel.
a) Market Risk
Market risk is the risk that changes in market factors, such as commodity prices, foreign exchange rates or interest rates, will affect the value of our financial instruments. We manage market risk by either accepting it or mitigating it through the use of derivatives and other economic hedging strategies.
Commodity Price Risk
Gold and Copper
We sell our gold and copper production in the world market. The market prices of gold and copper are the primary drivers of our profitability and ability to generate both operating and free cash flow. Our corporate treasury group implements hedging strategies on an opportunistic basis to protect us from downside price risk on our gold and copper production. We did not enter into any positions during the year. During 2020, we sold 57 thousand ounces of producer gold collars. We do not have any positions outstanding as at December 31, 2021. Our gold and copper production is subject to market prices.
Fuel
We consume diesel fuel and natural gas to run our operations. Diesel fuel is refined from crude oil and is therefore subject to the same price volatility affecting crude oil prices. Therefore, volatility in crude oil and natural gas prices have a direct and indirect impact on our production costs.
Foreign Currency Risk
The functional and reporting currency for all of our operating segments is the US dollar and we report our results using the US dollar. The majority of our operating and capital expenditures are denominated and settled in US dollars. We have exposure to the Argentine peso through operating costs at our Veladero mine, and peso denominated VAT receivable balances. In addition, we have exposure to the Canadian and Australian dollars, Chilean peso, Papua New Guinea kina, Peruvian sol, Zambian kwacha, Tanzanian shilling, Dominican peso, West African CFA franc, Euro, South African rand, and British pound through mine operating and capital costs. Consequently, fluctuations in the US dollar exchange rate against these currencies increase the volatility of cost of sales, general and administrative costs and overall net earnings, when translated into US dollars.
Interest Rate Risk
Interest rate risk refers to the risk that the value of a financial instrument or cash flows associated with the instruments will fluctuate due to changes in market interest rates. Currently, our interest rate exposure mainly relates to interest receipts on our cash balances ($5.3 billion at the end of the year); the mark-to-market value of derivative instruments; and to the interest payments on our variable-rate debt ($0.1 billion at December 31, 2021).
The effect on net earnings and equity of a 1% change in the interest rate of our financial assets and liabilities as at December 31, 2021 is approximately $37 million (2020: $30 million).
b) Credit Risk
Credit risk is the risk that a third party might fail to fulfill its performance obligations under the terms of a financial instrument. Credit risk arises from cash and equivalents, trade and other receivables as well as derivative assets. For cash and equivalents and trade and other receivables, credit risk exposure equals the carrying amount on the balance sheet, net of any overdraft positions. To mitigate our inherent exposure to credit risk we maintain policies to limit the concentration of credit risk, review counterparty creditworthiness on a monthly basis, and ensure liquidity of available funds. We also invest our excess cash and equivalents in highly rated financial institutions, primarily within the United States and Canada. Furthermore, we sell our gold and copper production into the world market and to financial institutions and private customers with strong credit ratings. Historically, customer defaults have not had a significant impact on our operating results or financial position.
The Company’s maximum exposure to credit risk at the reporting date is the carrying value of each of the financial assets disclosed as follows:
|
|
|
|
|
|
|
|
|
|
As at December 31, 2021 |
As at December 31, 2020 |
| Cash and equivalents |
$5,280 |
|
$5,188 |
|
| Accounts receivable |
623 |
|
558 |
|
| Derivative assets |
53 |
|
40 |
|
|
$5,956 |
|
$5,786 |
|
|
|
|
|
|
|
|
|
|
|
|
|
|
|
|
| BARRICK YEAR-END 2021 |
183 |
NOTES TO FINANCIAL STATEMENTS |
c) Liquidity Risk
Liquidity risk is the risk of loss from not having access to sufficient funds to meet both expected and unexpected cash demands. We manage our exposure to liquidity risk by maintaining cash reserves, access to undrawn credit facilities and access to public debt markets, by staggering the maturities of outstanding debt instruments to mitigate refinancing risk and by monitoring of forecasted and actual cash flows. Details of the undrawn credit facility are included in note 25.
Our capital structure comprises a mix of debt, non-controlling interest and shareholders’ equity. As at December 31, 2021, our total debt was $5.2 billion (debt net of cash and equivalents was $(130) million) compared to total debt as at December 31, 2020 of $5.2 billion (debt net of cash and equivalents was $(33) million).
Our operating cash flow is dependent on the ability of our operations to deliver projected future cash flows. The market prices of gold, and to a lesser extent copper, are the primary drivers of our operating cash flow. Other options to enhance liquidity include further portfolio optimization and the creation of new joint ventures and partnerships; issuance of equity securities in the public markets or to private investors, which could be undertaken for liquidity
enhancement and/or in connection with establishing a strategic partnership; issuance of long-term debt securities in the public markets or to private investors (Moody’s and S&P currently rate Barrick’s outstanding long-term debt as investment grade, with ratings of Baa1 and BBB, respectively); and drawing on the $3.0 billion available under our undrawn credit facility (subject to compliance with covenants and the making of certain representations and warranties, this facility is available for drawdown as a source of financing). The key financial covenant in the Credit Facility (undrawn as at December 31, 2021) requires Barrick to maintain a net debt to total capitalization ratio, as defined in the agreement, of 0.60:1 or lower (Barrick’s net debt to total capitalization ratio was 0.00:1 as at December 31, 2021).
The following table outlines the expected maturity of our significant financial assets and liabilities into relevant maturity groupings based on the remaining period from the balance sheet date to the contractual maturity date. As the amounts presented in the table are the contractual undiscounted cash flows, these balances may not agree with the amounts disclosed in the balance sheet.
|
|
|
|
|
|
|
|
|
|
|
|
|
|
|
|
|
|
|
| As at December 31, 2021 |
|
|
|
|
|
|
| (in $ millions) |
Less than 1 year |
1 to 3 years |
3 to 5 years |
Over 5 years |
Total |
|
| Cash and equivalents |
$5,280 |
|
$— |
|
$— |
|
$— |
|
$5,280 |
|
|
| Accounts receivable |
623 |
|
— |
|
— |
|
— |
|
623 |
|
|
| Derivative assets |
— |
|
53 |
|
— |
|
— |
|
53 |
|
|
| Trade and other payables |
1,448 |
|
— |
|
— |
|
— |
|
1,448 |
|
|
| Debt |
15 |
|
17 |
|
67 |
|
5,077 |
|
5,176 |
|
|
|
|
|
|
|
|
|
| Other liabilities |
30 |
|
196 |
|
92 |
|
155 |
|
473 |
|
|
| As at December 31, 2020 |
|
|
|
|
|
|
| (in $ millions) |
Less than 1 year |
1 to 3 years |
3 to 5 years |
Over 5 years |
Total |
|
| Cash and equivalents |
$5,188 |
|
$— |
|
$— |
|
$— |
|
$5,188 |
|
|
| Accounts receivable |
558 |
|
— |
|
— |
|
— |
|
558 |
|
|
| Derivative assets |
— |
|
40 |
|
— |
|
— |
|
40 |
|
|
| Trade and other payables |
1,458 |
|
— |
|
— |
|
— |
|
1,458 |
|
|
| Debt |
20 |
|
16 |
|
20 |
|
5,125 |
|
5,181 |
|
|
|
|
|
|
|
|
|
| Other liabilities |
31 |
|
72 |
|
36 |
|
243 |
|
382 |
|
|
|
|
|
|
|
|
|
d) Capital Risk Management
Our objective when managing capital is to provide value for shareholders by maintaining an optimal short-term and long-term capital structure in order to reduce the overall cost of capital while preserving our ability to continue as a going concern. Our capital management objectives are to safeguard our ability to support our operating requirements on an ongoing basis, continue the development and exploration of our mineral properties and support any expansion plans. Our objectives are also to ensure that we maintain a strong balance sheet and optimize the use of debt and equity to support our business and provide financial flexibility in order to maximize shareholder value. We define capital as total debt less cash and equivalents and it is managed by management subject to approved policies and limits by the Board of Directors. We have no significant financial covenants or capital requirements with
our lenders or other parties other than what is discussed under liquidity risk in note 28c.
|
|
|
|
|
|
|
|
|
| BARRICK YEAR-END 2021 |
184 |
NOTES TO FINANCIAL STATEMENTS |
29 n Other Non-Current Liabilities
|
|
|
|
|
|
|
|
|
|
As at December 31, 2021 |
As at December 31, 2020 |
| Deposit on Pascua-Lama silver sale agreement |
$154 |
|
$149 |
|
Deposit on Pueblo Viejo gold and silver streaming agreement1 |
438 |
|
447 |
|
| Long-term income tax payable |
267 |
|
321 |
|
|
|
|
| GoT shareholder loan |
150 |
|
167 |
|
| Pueblo Viejo JV partner shareholder loan |
164 |
|
42 |
|
| Provision for offsite remediation |
52 |
|
50 |
|
| Other |
76 |
|
92 |
|
|
$1,301 |
|
1,268 |
|
|
|
|
1Revenues of $44 million were recognized in 2021 (2020: $53 million) through the draw-down of our streaming liabilities relating to a contract in place at Pueblo Viejo.
GoT Shareholder Loan
On January 24, 2020, Barrick formalized the establishment of a joint venture between Barrick and the GoT. Effective January 1, 2020, the GoT received a 16% interest in the shareholder loans owed by Bulyanhulu and Buzwagi, of which $167 million was payable to the GoT. During 2021, $16 million was repaid.
Pueblo Viejo Shareholder Loan
In November 2020, Pueblo Viejo entered into a $1.3 billion loan facility agreement with its shareholders (the “PV Shareholder Loan”) to provide long-term financing to expand the mine. The shareholders will lend funds pro rata in accordance with their shareholding in Pueblo Viejo. The PV Shareholder Loan is broken up into two facilities: $0.8 billion of funds that can be drawn on a pro rata basis until June 30, 2022 (“Facility I”) and $0.5 billion of funds that can be drawn on a pro rata basis until June 30, 2025 (“Facility II”). Amortized repayments for Facility I are due to begin twice yearly on the scheduled repayment dates after the earlier of full drawdown of Facility I or June 30, 2022, with a final maturity date of February 28, 2032. Amortized repayments for Facility II are due to begin twice yearly on the scheduled repayment dates after the earlier of full drawdown of Facility II or June 30, 2025, with a final maturity date of February 28, 2035. The interest rate on drawn amounts is LIBOR plus 400 basis points. During 2021 and 2020, $327 million and $104 million, respectively, were drawn on Facility I, including $131 million and $42 million, respectively, from Barrick’s Pueblo Viejo JV partner.
Pascua-Lama Silver Sale Agreement
Our silver sale agreement with Wheaton requires us to deliver 25 percent of the life of mine silver production from the Pascua-Lama project once it is constructed and required delivery of 100 percent of silver production from the Lagunas Norte, Pierina and Veladero mines until March 31, 2018. In return, we were entitled to an upfront cash payment of $625 million payable over three years from the date of the agreement, as well as ongoing payments in cash of the lesser of $3.90 (subject to an annual inflation adjustment of 1 percent starting three years after project completion at Pascua-Lama) and the prevailing market price for each ounce of silver delivered under the agreement. An imputed interest expense was recorded on the liability at the rate implicit in the agreement. The liability plus imputed interest was amortized based on the difference between the effective contract price for silver and the amount of the ongoing cash payment per ounce of silver delivered under the agreement. The completion date guarantee under the silver sale agreement for Pascua-Lama was originally December 31, 2015 but was subsequently extended to June 30, 2020. Per the terms of the amended silver purchase agreement, if the requirements of the completion guarantee were not satisfied by June 30, 2020, then Wheaton had the right to terminate the agreement within 90 days of that date, in which case, they would have been entitled to the return of the upfront consideration paid less credit for silver delivered up to the date of that event.
Given that, as of September 28, 2020, Wheaton had not exercised its termination right, a residual liability of $253 million remains due on September 1, 2039 (assuming no future deliveries are made). This residual cash liability was remeasured to $148 million as at September 30, 2020, which is the present value of the liability due in 2039 discounted at a rate estimated for comparable liabilities, including Barrick's outstanding debt. This remeasurement resulted in a gain of $104 million recorded in Other Income (refer to note 9) for the year ended December 31, 2020. The liability of $148 million was reclassified from other current liabilities to other non-current liabilities as at September 30, 2020 and will be measured at amortized cost in future periods. The liability had a balance of $154 million as at December 31, 2021.
Pueblo Viejo Gold and Silver Streaming Agreement
On September 29, 2015, we closed a gold and silver streaming transaction with Royal Gold, Inc. (“Royal Gold”) for production linked to Barrick’s 60 percent interest in the Pueblo Viejo mine. Royal Gold made an upfront cash payment of $610 million and will continue to make cash payments for gold and silver delivered under the agreement. The $610 million upfront payment is not repayable and Barrick is obligated to deliver gold and silver based on Pueblo Viejo’s production. We have accounted for the upfront payment as deferred revenue and will recognize it in earnings, along with the ongoing cash payments, as the gold and silver is delivered to Royal Gold. We will also be recording accretion expense on the deferred revenue balance as the time value of the upfront deposit represents a significant component of the transaction.
Under the terms of the agreement, Barrick will sell gold and silver to Royal Gold equivalent to:
•7.5 percent of Barrick’s interest in the gold produced at Pueblo Viejo until 990,000 ounces of
|
|
|
|
|
|
|
|
|
| BARRICK YEAR-END 2021 |
185 |
NOTES TO FINANCIAL STATEMENTS |
gold have been delivered, and 3.75 percent thereafter.
•75 percent of Barrick’s interest in the silver produced at Pueblo Viejo until 50 million ounces have been delivered, and 37.5 percent thereafter. Silver will be delivered based on a fixed recovery rate of 70 percent. Silver above this recovery rate is not subject to the stream.
Barrick will receive ongoing cash payments from Royal Gold equivalent to 30 percent of the prevailing spot prices for the first 550,000 ounces of gold and 23.1 million ounces of silver delivered. Thereafter payments will double to 60 percent of prevailing spot prices for each subsequent ounce of gold and silver delivered. Ongoing cash payments to Barrick are tied to prevailing spot prices rather than fixed in advance, maintaining exposure to higher gold and silver prices in the future.
30 n Deferred Income Taxes
Recognition and Measurement
We record deferred income tax assets and liabilities where temporary differences exist between the carrying amounts of assets and liabilities in our balance sheet and their tax bases. The measurement and recognition of deferred income tax assets and liabilities takes into account: substantively enacted rates that will apply when temporary differences reverse; interpretations of relevant tax legislation; estimates of the tax bases of assets and liabilities; and the deductibility of expenditures for income tax purposes. In addition, the measurement and recognition of deferred tax assets takes into account tax planning strategies. We recognize the effect of changes in our assessment of these estimates and factors when they occur. Changes in deferred income tax assets and liabilities are allocated between net income, other comprehensive income, equity and goodwill based on the source of the change.
Current income taxes of $66 million have been provided in the year on the undistributed earnings of certain foreign subsidiaries. Deferred income taxes have not been provided on the undistributed earnings of all other foreign subsidiaries for which we are able to control the timing of the remittance, and it is probable that there will be no remittance in the foreseeable future. These undistributed earnings amounted to $18,016 million as at December 31, 2021.
Sources of Deferred Income Tax Assets and Liabilities
|
|
|
|
|
|
|
|
|
|
As at December 31, 2021 |
As at December 31, 2020 |
| Deferred tax assets |
|
|
| Tax loss carry forwards |
$330 |
|
$456 |
|
| Tax credits |
10 |
|
13 |
|
| Environmental rehabilitation |
262 |
|
358 |
|
|
|
|
| Post-retirement benefit obligations and other employee benefits |
30 |
|
30 |
|
|
|
|
| Other working capital |
68 |
|
70 |
|
|
|
|
| Other |
5 |
|
3 |
|
|
$705 |
|
$930 |
|
| Deferred tax liabilities |
|
|
| Property, plant and equipment |
(3,556) |
|
(3,375) |
|
| Inventory |
(416) |
|
(463) |
|
| Accrued interest payable |
3 |
|
(28) |
|
|
($3,264) |
|
($2,936) |
|
| Classification: |
|
|
| Non-current assets |
$29 |
|
$98 |
|
| Non-current liabilities |
(3,293) |
|
(3,034) |
|
|
($3,264) |
|
($2,936) |
|
|
|
|
|
|
|
|
|
|
|
|
|
|
|
|
Expiry Dates of Tax Losses
|
|
|
|
|
|
|
|
|
|
|
|
|
|
|
|
|
|
|
|
|
|
|
|
|
|
2022 |
2023 |
2024 |
2025 |
2026+ |
No expiry date |
Total |
|
Non-capital tax losses1 |
|
|
|
|
|
|
|
|
|
|
|
|
|
|
|
|
|
| Barbados |
$97 |
|
$399 |
|
$213 |
|
$220 |
|
$138 |
|
$— |
|
$1,067 |
|
|
| Canada |
— |
|
— |
|
— |
|
— |
|
2,146 |
|
— |
|
2,146 |
|
|
| Chile |
— |
|
— |
|
— |
|
— |
|
— |
|
894 |
|
894 |
|
|
| Saudi Arabia |
— |
|
— |
|
— |
|
— |
|
— |
|
349 |
|
349 |
|
|
| Tanzania |
— |
|
— |
|
— |
|
— |
|
— |
|
1,296 |
|
1,296 |
|
|
| United Kingdom |
— |
|
— |
|
— |
|
— |
|
— |
|
190 |
|
190 |
|
|
| Zambia |
32 |
|
2 |
|
2 |
|
1 |
|
11 |
|
— |
|
48 |
|
|
| Others |
— |
|
— |
|
— |
|
— |
|
59 |
|
45 |
|
104 |
|
|
|
$129 |
|
$401 |
|
$215 |
|
$221 |
|
$2,354 |
|
$2,774 |
|
$6,094 |
|
|
|
|
|
|
|
|
|
|
|
|
|
|
|
|
|
|
|
|
1Represents the gross amount of tax loss carry forwards translated at closing exchange rates at December 31, 2021.
The non-capital tax losses include $4,995 million of losses which are not recognized in deferred tax assets. Of these, $99 million expire in 2022, $401 million expire in 2023, $214 million expire in 2024, $221 million expire in 2025, $2,287 million expire in 2026 or later, and $1,772 million have no expiry date.
Recognition of Deferred Tax Assets
We recognize deferred tax assets taking into account the effects of local tax law. Deferred tax assets are fully recognized when we conclude that sufficient positive evidence exists to demonstrate that it is probable that a deferred tax asset will be realized. The main factors considered are:
•Historic and expected future levels of taxable income;
|
|
|
|
|
|
|
|
|
| BARRICK YEAR-END 2021 |
186 |
NOTES TO FINANCIAL STATEMENTS |
•Tax plans that affect whether tax assets can be realized; and
•The nature, amount and expected timing of reversal of taxable temporary differences.
Levels of future income are mainly affected by: market gold, copper and silver prices; forecasted future costs and expenses to produce gold and copper; quantities of proven and probable gold and copper reserves; market interest rates; and foreign currency exchange rates. If these factors or other circumstances change, we record an adjustment to the recognition of deferred tax assets to reflect our latest assessment of the amount of deferred tax assets that is probable will be realized.
Deferred Tax Assets Not Recognized
|
|
|
|
|
|
|
|
|
|
As at December 31, 2021 |
As at December 31, 2020 |
| Argentina |
$118 |
|
$105 |
|
| Australia |
302 |
|
298 |
|
| Barbados |
27 |
|
10 |
|
| Canada |
966 |
|
1,127 |
|
| Chile |
1,059 |
|
1,037 |
|
| Côte d'Ivoire |
6 |
|
6 |
|
|
|
|
| Mali |
11 |
|
9 |
|
| Peru |
79 |
|
281 |
|
| Saudi Arabia |
71 |
|
70 |
|
| Tanzania |
105 |
|
110 |
|
| United Kingdom |
36 |
|
36 |
|
| Zambia |
3 |
|
40 |
|
|
$2,783 |
|
$3,129 |
|
|
|
|
|
|
|
Deferred tax assets not recognized relate to: non-capital loss carry forwards of $1,048 million (2020: $1,168 million), capital loss carry forwards with no expiry date of $321 million (2020: $323 million), and other deductible temporary differences with no expiry date of $1,414 million (2020: $1,638 million).
|
|
|
|
|
|
|
|
|
| Source of Changes in Deferred Tax Balances |
| For the years ended December 31 |
2021 |
2020 |
| Temporary differences |
|
|
| Property, plant and equipment |
($181) |
|
($112) |
|
| Environmental rehabilitation |
(97) |
|
29 |
|
| Tax loss carry forwards |
(127) |
|
(54) |
|
| AMT and other tax credits |
(3) |
|
(14) |
|
| Inventory |
48 |
|
81 |
|
|
|
|
| Other |
32 |
|
(10) |
|
|
($328) |
|
($80) |
|
| Intraperiod allocation to: |
|
|
| Income from continuing operations before income taxes |
($345) |
|
($151) |
|
|
|
|
|
|
|
| Income Tax Payable |
(2) |
|
65 |
|
|
|
|
| Other comprehensive (income) loss |
19 |
|
(6) |
|
| Other |
— |
|
12 |
|
| |
($328) |
|
($80) |
|
|
|
|
| Income Tax Related Contingent Liabilities |
|
2021 |
2020 |
| At January 1 |
$266 |
|
$327 |
|
| Net additions based on uncertain tax positions related to prior years |
19 |
|
39 |
|
|
|
|
| Reductions for tax positions of prior years |
(28) |
|
(100) |
|
|
|
|
At December 311 |
$257 |
|
$266 |
|
|
|
|
|
|
|
|
|
|
|
|
|
|
|
|
|
|
|
1If reversed, the total amount of $257 million would be recognized as a benefit to income taxes on the income statement, and therefore would impact the reported effective tax rate.
|
|
|
|
|
|
| Tax Years Still Under Examination |
| Argentina |
2010-2011, 2015-2021 |
| Australia |
2017-2021 |
| Canada |
2015-2021 |
| Chile |
2015-2021 |
| Côte d'Ivoire |
2020-2021 |
| Democratic Republic of Congo |
2019-2021 |
| Dominican Republic |
2015-2021 |
| Mali |
2017-2021 |
| Papua New Guinea |
2006-2021 |
| Peru |
2015-2021 |
| Saudi Arabia |
2020-2021 |
| Tanzania |
2018-2021 |
| United States |
2021 |
| Zambia |
2018-2021 |
|
|
|
|
|
|
|
|
|
| BARRICK YEAR-END 2021 |
187 |
NOTES TO FINANCIAL STATEMENTS |
31 n Capital Stock
Authorized Capital Stock
Our authorized capital stock is composed of an unlimited number of common shares (issued 1,779,331,037 common shares as at December 31, 2021). Our common shares have no par value.
Dividends
In 2021, we declared and paid dividends in US dollars totaling $634 million (2020: $547 million).
The Company’s dividend reinvestment plan resulted in $5 million (2020: $4 million) reinvested into the Company.
Return of Capital
At the Annual and Special Meeting on May 4, 2021, shareholders approved a $750 million return of capital distribution. This distribution was derived from a portion of the proceeds from the divestiture of Kalgoorlie Consolidated Gold Mines in November 2019 and from other recent dispositions made by Barrick and its affiliates in line with
our strategy of focusing on our core assets. The total return of capital distribution was paid in three equal tranches of $250 million on June 15, 2021, September 15, 2021 and December 15, 2021.
Share Buyback Program
At the February 15, 2022 meeting, the Board of Directors authorized a share buyback program for the repurchase of up to $1.0 billion of the Company’s outstanding common shares over the next 12 months.
The actual number of common shares that may be purchased, if any, and the timing of any such purchases, will be determined by Barrick based on a number of factors, including the Company’s financial performance, the availability of cash flows, and the consideration of other uses of cash, including capital investment opportunities, returns to shareholders, and debt reduction.
The repurchase program does not obligate the Company to acquire any particular number of common shares, and the repurchase program may be suspended or discontinued at any time at the Company’s discretion.
32 n Non-Controlling Interests
|
|
|
|
|
|
|
|
|
|
|
|
|
|
|
|
|
|
|
|
|
|
|
|
|
| a) Non-Controlling Interests (“NCI”) Continuity |
|
|
Nevada Gold Mines |
Pueblo Viejo |
Tanzania Mines1 |
Loulo-Gounkoto |
Tongon |
Other |
Total |
|
| NCI in subsidiary at December 31, 2021 |
38.5 |
% |
40 |
% |
16 |
% |
20 |
% |
10.3 |
% |
Various |
|
|
| At January 1, 2020 |
$6,039 |
|
$1,424 |
|
$— |
|
$901 |
|
$47 |
|
($16) |
|
$8,395 |
|
|
|
|
|
|
|
|
|
|
|
| Share of income (loss) |
965 |
|
196 |
|
57 |
|
68 |
|
9 |
|
(5) |
|
1,290 |
|
|
| Cash contributed |
— |
|
— |
|
— |
|
— |
|
— |
|
11 |
|
11 |
|
|
Increase in non-controlling interest2 |
— |
|
— |
|
251 |
|
— |
|
— |
|
— |
|
251 |
|
|
| Disbursements |
(1,026) |
|
(427) |
|
(45) |
|
(36) |
|
(17) |
|
(27) |
|
(1,578) |
|
|
| At December 31, 2020 |
$5,978 |
|
$1,193 |
|
$263 |
|
$933 |
|
$39 |
|
($37) |
|
$8,369 |
|
|
|
|
|
|
|
|
|
|
|
| Share of income |
980 |
|
174 |
|
35 |
|
71 |
|
6 |
|
— |
|
1,266 |
|
|
| Cash contributed |
— |
|
— |
|
— |
|
— |
|
— |
|
12 |
|
12 |
|
|
Decrease in non-controlling interest3 |
(49) |
|
— |
|
— |
|
— |
|
— |
|
(37) |
|
(86) |
|
|
| Disbursements |
(848) |
|
(178) |
|
— |
|
(51) |
|
(16) |
|
(18) |
|
(1,111) |
|
|
| At December 31, 2021 |
$6,061 |
|
$1,189 |
|
$298 |
|
$953 |
|
$29 |
|
($80) |
|
$8,450 |
|
|
|
|
|
|
|
|
|
|
|
|
|
|
|
|
|
|
|
|
1Tanzania mines consist of North Mara, Bulyanhulu and Buzwagi.
2Refer to note 21 for further details.
3Refer to note 4 for further details.
b) Summarized Financial Information on Subsidiaries with Material Non-Controlling Interests
Summarized Balance Sheets
|
|
|
|
|
|
|
|
|
|
|
|
|
|
|
|
|
|
|
|
|
|
|
|
|
|
|
|
|
|
|
|
|
|
|
| |
Nevada Gold Mines |
Pueblo Viejo |
Tanzania Mines |
Loulo-Gounkoto |
Tongon |
|
|
As at December 31, 2021 |
As at December 31, 2020 |
As at December 31, 2021 |
As at December 31, 2020 |
As at December 31, 2021 |
As at December 31, 2020 |
As at December 31, 2021 |
As at December 31, 2020 |
As at December 31, 2021 |
As at December 31, 2020 |
|
|
| Current assets |
$3,351 |
|
$6,111 |
|
$394 |
|
$491 |
|
$637 |
|
$530 |
|
$444 |
|
$347 |
|
$205 |
|
$288 |
|
|
|
| Non-current assets |
13,750 |
|
13,708 |
|
4,724 |
|
4,342 |
|
1,798 |
|
1,758 |
|
4,712 |
|
4,660 |
|
192 |
|
265 |
|
|
|
| Total assets |
$17,101 |
|
$19,819 |
|
$5,118 |
|
$4,833 |
|
$2,435 |
|
$2,288 |
|
$5,156 |
|
$5,007 |
|
$397 |
|
$553 |
|
|
|
| Current liabilities |
561 |
|
636 |
|
633 |
|
240 |
|
926 |
|
1,024 |
|
141 |
|
32 |
|
76 |
|
118 |
|
|
|
| Non-current liabilities |
1,244 |
|
1,266 |
|
1,249 |
|
1,053 |
|
526 |
|
565 |
|
575 |
|
567 |
|
59 |
|
76 |
|
|
|
| Total liabilities |
$1,805 |
|
$1,902 |
|
$1,882 |
|
$1,293 |
|
$1,452 |
|
$1,589 |
|
$716 |
|
$599 |
|
$135 |
|
$194 |
|
|
|
|
|
|
|
|
|
|
|
|
|
|
|
|
|
|
|
|
|
|
|
|
|
|
|
|
|
|
|
|
|
|
|
|
|
|
|
|
|
|
|
|
|
|
|
|
|
|
|
| BARRICK YEAR-END 2021 |
188 |
NOTES TO FINANCIAL STATEMENTS |
Summarized Statements of Income
|
|
|
|
|
|
|
|
|
|
|
|
|
|
|
|
|
|
|
|
|
|
|
|
|
|
|
|
|
|
|
|
|
|
|
| |
Nevada Gold Mines |
Pueblo Viejo |
Tanzania Mines1 |
Loulo-Gounkoto |
Tongon |
|
| For the years ended December 31 |
2021 |
2020 |
2021 |
2020 |
2021 |
2020 |
2021 |
2020 |
2021 |
2020 |
|
|
| Revenue |
$6,135 |
|
$6,299 |
|
$1,514 |
|
$1,613 |
|
$993 |
|
$1,213 |
|
$1,249 |
|
$1,208 |
|
$368 |
|
$507 |
|
|
|
| Income from continuing operations after tax |
2,246 |
|
2,439 |
|
361 |
|
418 |
|
284 |
|
653 |
|
322 |
|
339 |
|
52 |
|
83 |
|
|
|
| Other comprehensive income |
9 |
|
— |
|
— |
|
— |
|
— |
|
— |
|
— |
|
— |
|
— |
|
— |
|
|
|
| Total comprehensive income |
$2,255 |
|
$2,439 |
|
$361 |
|
$418 |
|
$284 |
|
$653 |
|
$322 |
|
$339 |
|
$52 |
|
$83 |
|
|
|
Dividends paid to NCI2 |
$848 |
|
$1,026 |
|
$48 |
|
$6 |
|
$— |
|
$45 |
|
$51 |
|
$36 |
|
$20 |
|
$— |
|
|
|
|
|
|
|
|
|
|
|
|
|
|
|
|
| Summarized Statements of Cash Flows |
|
|
|
|
|
|
|
|
|
|
|
|
|
|
|
|
|
|
|
|
|
|
| |
Nevada Gold Mines |
Pueblo Viejo |
Tanzania Mines1 |
Loulo-Gounkoto |
Tongon3 |
|
| For the years ended December 31 |
2021 |
2020 |
2021 |
2020 |
2021 |
2020 |
2021 |
2020 |
2021 |
2020 |
|
|
| Net cash provided by operating activities |
$3,035 |
|
$3,518 |
|
$541 |
|
$820 |
|
$373 |
|
$609 |
|
$605 |
|
$497 |
|
$61 |
|
$252 |
|
|
|
| Net cash used in investing activities |
(962) |
|
(971) |
|
(522) |
|
(223) |
|
(178) |
|
(181) |
|
(297) |
|
(226) |
|
(17) |
|
(8) |
|
|
|
| Net cash used in financing activities |
(2,208) |
|
(2,668) |
|
(101) |
|
(651) |
|
(100) |
|
(270) |
|
(254) |
|
(189) |
|
(143) |
|
(119) |
|
|
|
| Net increase (decrease) in cash and cash equivalents |
($135) |
|
($121) |
|
($82) |
|
($54) |
|
$95 |
|
$158 |
|
$54 |
|
$82 |
|
($99) |
|
$125 |
|
|
|
|
|
|
|
|
|
|
|
|
|
|
|
|
|
|
|
|
|
|
|
|
|
|
|
|
|
|
|
|
|
|
|
|
|
|
|
|
|
|
|
|
|
|
|
|
|
|
|
|
|
|
|
|
|
|
|
|
|
|
|
|
|
|
|
|
1 Tanzania mines consist of North Mara, Bulyanhulu and Buzwagi. 2 Includes partner distributions.
3 2020 figures have been updated to present a $117 million reclassification between operating and financing activities related to dividends paid.
33 n Related Party Transactions
The Company’s related parties include its subsidiaries, joint operations, joint ventures and key management personnel. During its normal course of operations, the Company enters into transactions with its related parties for goods and services. Transactions between the Company and its subsidiaries and joint operations, which are related parties of the Company, have been eliminated on consolidation and are not disclosed in this note. There were no other material related party transactions reported in the year.
Remuneration of Key Management Personnel
Key management personnel include the members of the Board of Directors and the executive leadership team. Compensation for key management personnel (including Directors) was as follows:
|
|
|
|
|
|
|
|
|
| For the years ended December 31 |
2021 |
2020 |
Salaries and short-term employee benefits1 |
$36 |
|
$33 |
|
Post-employment benefits2 |
6 |
|
4 |
|
|
|
|
Share-based payments and other3 |
25 |
|
45 |
|
|
$67 |
|
$82 |
|
|
|
|
|
|
|
1 Includes annual salary and annual short-term incentives/other bonuses earned in the year.
2 Represents Company contributions to retirement savings plans.
3 Relates to DSU, RSU, and PGSU grants and other compensation.
|
|
|
|
|
|
|
|
|
| BARRICK YEAR-END 2021 |
189 |
NOTES TO FINANCIAL STATEMENTS |
34 n Stock-Based Compensation
a) Restricted Share Units (RSUs) and Deferred Share Units (DSUs) Compensation expense for RSUs was a $31 million charge to earnings in 2021 (2020: $45 million) and is presented as a component of general and administrative expenses and cost of sales, consistent with the classification of other elements of compensation expense for those employees who had RSUs.
Compensation expense for RSUs incorporates an expected forfeiture rate. The expected forfeiture rate is estimated based on historical forfeiture rates and expectations of future forfeiture rates. We make adjustments if the actual forfeiture rate differs from the expected rate. At December 31, 2021, the weighted average remaining contractual life of RSUs was 0.75 years (2020: 0.83 years).
DSU and RSU Activity (Number of Units in Thousands)
|
|
|
|
|
|
|
|
|
|
|
|
|
|
|
|
DSUs |
Fair value |
RSUs |
Fair value |
| At January 1, 2020 |
476 |
|
$8.8 |
|
3,110 |
|
$41.5 |
|
| Settled for cash |
— |
|
— |
|
(2,136) |
|
(47.3) |
|
| Forfeited |
— |
|
— |
|
(313) |
|
(5.7) |
|
| Granted |
85 |
|
2.0 |
|
1,923 |
|
35.2 |
|
| Credits for dividends |
— |
|
— |
|
39 |
|
0.9 |
|
| Change in value |
— |
|
2.0 |
|
— |
|
14.0 |
|
| At December 31, 2020 |
561 |
|
$12.8 |
|
2,623 |
|
$38.6 |
|
| Settled for cash |
— |
|
— |
|
(1,435) |
|
(36.2) |
|
|
|
|
|
|
| Granted |
117 |
|
2.2 |
|
1,300 |
|
26.4 |
|
| Credits for dividends |
— |
|
— |
|
30 |
|
0.6 |
|
| Change in value |
— |
|
(2.4) |
|
— |
|
1.6 |
|
| At December 31, 2021 |
678 |
|
$12.6 |
|
2,518 |
|
$31.0 |
|
|
|
|
|
|
|
|
|
|
|
|
|
|
|
|
b) Performance Granted Share Units (PGSUs)
In 2014, Barrick launched a PGSU plan. Under this plan, selected employees are granted PGSUs, where each PGSU has a value equal to one Barrick common share. At December 31, 2021, 2,873 thousand units had been granted at a fair value of $43 million (2020: 3,962 thousand units at a fair value of $52 million).
c) Stock Options
Under Barrick’s stock option plan, certain officers and key employees of the Company may purchase common shares at an exercise price that is equal to the closing share price on the day before the grant of the option. The grant date is the date when the details of the award, including the number of options granted by individual and the exercise price, are approved. Stock options vest evenly over four years, beginning in the year after granting. Options are exercisable over seven years. At December 31, 2021, nil (2020: 0.1 million) stock options were outstanding.
Compensation expense for stock options was $nil in 2021 (2020: $nil), and is presented as a component of corporate administration, consistent with the classification of other elements of compensation expense for those employees who had stock options. The recognition of compensation expense for stock options had no impact on earnings per share for 2021 and 2020.
Total intrinsic value relating to options exercised in 2021 was $1 million (2020: $2 million). As at December 31, 2021, there was $nil (2020: $nil) of total unrecognized compensation cost relating to unvested stock options.
Employee Stock Option Activity (Number of Shares in Millions)
|
|
|
|
|
|
|
|
|
|
|
|
|
|
|
| |
2021 |
2020 |
|
Shares |
Average Price |
Shares |
Average Price |
| C$ options |
|
|
|
|
| At January 1 |
0.1 |
|
$10 |
|
0.2 |
|
$10 |
|
|
|
|
|
|
| Exercised |
(0.1) |
|
10 |
|
(0.1) |
|
10 |
|
|
|
|
|
|
| At December 31 |
— |
|
$— |
|
0.1 |
|
$10 |
|
| US$ options |
|
|
|
|
| At January 1 |
— |
|
$— |
|
0.1 |
|
$32 |
|
|
|
|
|
|
| Cancelled/expired |
— |
|
— |
|
(0.1) |
|
32 |
|
| At December 31 |
— |
|
$— |
|
— |
|
$— |
|
|
|
|
|
|
|
|
|
|
|
|
|
|
|
|
|
|
|
|
|
|
|
|
|
| BARRICK YEAR-END 2021 |
190 |
NOTES TO FINANCIAL STATEMENTS |
35 n Contingencies
Certain conditions may exist as of the date the financial statements are issued that may result in a loss to the Company, but which will only be resolved when one or more future events occur or fail to occur. The impact of any resulting loss from such matters affecting these financial statements and noted below may be material.
Litigation and Claims
In assessing loss contingencies related to legal proceedings that are pending against us or unasserted claims that may result in such proceedings, the Company with assistance from its legal counsel, evaluates the perceived merits of any legal proceedings or unasserted claims as well as the perceived merits of the amount of relief sought or expected to be sought.
Proposed Canadian Securities Class Actions (Pascua-Lama)
Between April and September 2014, eight proposed class actions were commenced against the Company in Canada in connection with the Pascua-Lama project. Four of the proceedings were commenced in Ontario, two were commenced in Alberta, one was commenced in Saskatchewan, and one was commenced in Quebec. The proceedings alleged that the Company made false and misleading statements to the investing public relating to (among other things) capital cost and schedule estimates for the Pascua-Lama project (the “Project”), environmental compliance matters in Chile, as well as alleged internal control failures and certain accounting-related matters.
Two of the Ontario proceedings were subsequently consolidated into one proceeding. That consolidated proceeding and the Quebec proceeding have moved ahead in the manner described below. None of the other five proceedings has been pursued. One was never served, one was dismissed on consent, two were discontinued and one was stayed by Court order.
The Statement of Claim in the remaining Ontario proceeding indicates that the proposed representative plaintiffs purport to seek damages on behalf of any person who acquired Barrick securities during the period from May 7, 2009 to November 1, 2013. The defendants in this proceeding are the Company and Aaron Regent, Jamie Sokalsky, Ammar Al-Joundi and Peter Kinver (all of whom are former officers of the Company), and the claim for damages is stated to be more than $3 billion. In August 2018, the Company and other defendants delivered their Statement of Defence. In June 2019, plaintiffs’ counsel indicated that they are pursuing claims only in respect of the period from July 28, 2011 to November 1, 2013.
The Quebec proceeding purports to be on behalf of any person who resides in Quebec and acquired Barrick securities during the period from May 7, 2009 to November 1, 2013. However, the parties agreed that, by operation of the applicable statute of limitations, statutory secondary market misrepresentation claims could only be pursued in respect of the period from April 30, 2011 to November 1, 2013. The focus of the Quebec proceeding is on allegations concerning the Company’s public disclosures relating to matters of environmental compliance. The defendants are the Company and Messrs. Regent, Sokalsky, Al-Joundi and Kinver, and an unspecified amount of damages is being
sought. No Statement of Defence has been filed or is required to be filed at this stage.
In both Ontario and Quebec, the proposed representative plaintiffs have brought motions seeking: (i) leave of the Court to proceed with statutory secondary market misrepresentation claims pursuant to provincial securities legislation; and (ii) orders certifying the actions as class actions, and therefore allowing the proposed representative plaintiffs to pursue statutory secondary market misrepresentation claims and other claims on behalf of the proposed classes.
In the Quebec proceeding, both motions were heard in May 2019 with additional oral submissions in December 2019. In March 2020, the Superior Court of Quebec denied both motions. As a result, subject to appeal, the proposed representative plaintiff cannot pursue the statutory secondary market misrepresentation claims, and can only pursue his other purported claims on an individual basis rather than on behalf of other shareholders. The proposed representative plaintiff has filed an appeal. The hearing of that appeal has not yet been scheduled.
In the Ontario proceeding, the motion for leave to proceed with statutory secondary market misrepresentation claims was heard in July 2019. In October 2019, the Ontario Superior Court of Justice dismissed all but one of those claims, and dismissed all of the statutory secondary market misrepresentation claims as against Mr. Regent and Mr. Kinver. With respect to the sole remaining statutory secondary market misrepresentation claim, the Court denied leave to proceed in respect of securityholders other than common shareholders. The sole remaining statutory secondary market misrepresentation claim pertains to a statement concerning the water management system in Chile made by the Company in its Management's Discussion and Analysis for the second quarter of 2012. The Company filed a motion in the Divisional Court for leave to appeal the decision to allow that claim to proceed, which was denied in October 2020. The proposed representative plaintiffs filed an appeal to the Ontario Court of Appeal in respect of the claims that were dismissed, which was heard over two days in November 2020.
On February 19, 2021, the Ontario Court of Appeal allowed the proposed representative plaintiffs’ appeal in part. The Ontario Court of Appeal set aside the Ontario Superior Court’s decision dismissing statutory secondary market misrepresentation claims pertaining to the Company’s capital cost and scheduling estimates as well as to certain accounting and financial reporting issues, and remitted to the Ontario Superior Court the issue of whether leave to proceed should be granted in respect of those claims. The Ontario Court of Appeal upheld the Ontario Superior Court’s decision dismissing statutory secondary market misrepresentation claims pertaining to certain environmental matters in Chile. The Company subsequently filed an application for leave to appeal to the Supreme Court of Canada. This application was dismissed on July 29, 2021.
As a result, the case has been returned to the Ontario Superior Court, which will determine anew whether to grant leave to proceed with the balance of the plaintiffs’ statutory secondary market misrepresentations claims. The Superior Court heard the Plaintiffs’ motion for leave to proceed in respect of those claims in January 2022. The Court has reserved its judgment.
|
|
|
|
|
|
|
|
|
| BARRICK YEAR-END 2021 |
191 |
NOTES TO FINANCIAL STATEMENTS |
The motion for class certification in Ontario has not yet been heard. The Ontario Superior Court has indicated that it currently does not intend to hear that motion until after the plaintiffs’ motion for leave to proceed in respect of the balance of their statutory secondary market misrepresentation claims is determined.
The Company intends to vigorously defend the remaining proposed Canadian securities class actions. No amounts have been recorded for any potential liability arising from any of the proposed class actions, as the Company cannot reasonably predict the outcome.
Pascua-Lama – SMA Regulatory Sanctions
In May 2013, Compañía Minera Nevada (“CMN”), Barrick’s Chilean subsidiary that holds the Chilean portion of the Project, received a Resolution (the “Original Resolution”) from Chile’s environmental regulator (the Superintendencia del Medio Ambiente, or “SMA”) that requires CMN to complete the water management system for the Project in accordance with the Project’s environmental permit before resuming construction activities in Chile. The Original Resolution also required CMN to pay an administrative fine of approximately $16 million for deviations from certain requirements of the Project’s Chilean environmental approval, including a series of reporting requirements and instances of non-compliance related to the Project’s water management system. CMN paid the administrative fine in May 2013.
In June 2013, CMN began engineering studies to review the Project’s water management system in accordance with the Original Resolution. The studies were suspended in the second half of 2015 as a result of CMN’s decision to file a temporary and partial closure plan for the Project. The review of the Project’s water management system may require a new environmental approval and the construction of additional water management facilities.
In June 2013, a group of local farmers and indigenous communities challenged the Original Resolution. The challenge, which was brought in the Environmental Court of Santiago, Chile (the “Environmental Court”), claimed that the fine was inadequate and requested more severe sanctions against CMN including the revocation of the Project’s environmental permit. The SMA presented its defense of the Original Resolution in July 2013. On August 2, 2013, CMN joined as a party to this proceeding and vigorously defended the Original Resolution. On March 3, 2014, the Environmental Court annulled the Original Resolution and remanded the matter back to the SMA for further consideration in accordance with its decision (the “Environmental Court Decision”). In particular, the Environmental Court ordered the SMA to issue a new administrative decision that recalculated the amount of the fine to be paid by CMN using a different methodology and addressed certain other errors it identified in the Original Resolution. The Environmental Court did not annul the portion of the Original Resolution that required the Company to halt construction on the Chilean side of the Project until the water management system is completed in accordance with the Project’s environmental permit. On December 30, 2014, the Chilean Supreme Court declined to consider CMN’s appeal of the Environmental Court Decision on procedural grounds. As a result of the Supreme Court’s ruling, on April 22, 2015, the SMA reopened the administrative proceeding against CMN in accordance with the Environmental Court Decision.
On April 22, 2015, CMN was notified that the SMA had initiated a new administrative proceeding for alleged deviations from certain requirements of the Project’s environmental approval, including with respect to the Project’s environmental impact and a series of monitoring requirements. In May 2015, CMN submitted a compliance program to address certain of the allegations and presented its defense to the remainder of the alleged deviations. The SMA rejected CMN’s proposed compliance program on June 24, 2015, and denied CMN’s administrative appeal of that decision on July 31, 2015. On December 30, 2016, the Environmental Court rejected CMN’s appeal and CMN declined to challenge this decision.
On June 8, 2016, the SMA consolidated the two administrative proceedings against CMN into a single proceeding encompassing both the reconsideration of the Original Resolution in accordance with the decision of the Environmental Court and the alleged deviations from the Project’s environmental approval notified by the SMA in April 2015.
On January 17, 2018, CMN received the revised resolution (the “Revised Resolution”) from the SMA, in which the environmental regulator reduced the original administrative fine from approximately $16 million to $11.5 million and ordered the closure of existing surface facilities on the Chilean side of the Project in addition to certain monitoring activities. The Revised Resolution does not revoke the Project’s environmental approval. CMN filed an appeal of the Revised Resolution on February 3, 2018 with the First Environmental Court of Antofagasta (the “Antofagasta Environmental Court”).
On October 12, 2018, the Antofagasta Environmental Court issued an administrative ruling ordering review of the significant sanctions ordered by the SMA. CMN was not a party to this process. In its ruling, the Antofagasta Environmental Court rejected four of the five closure orders contained in the Revised Resolution and remanded the related environmental infringements back to the SMA for further consideration. A new resolution from the SMA with respect to the sanctions for these four infringements could include a range of potential sanctions, including additional fines, as provided in the Chilean legislation. The Antofagasta Environmental Court upheld the SMA’s decision to order the closure of the Chilean side of the Project for the fifth infringement.
Following the issuance of the Revised Resolution, the Company reversed the estimated amount previously recorded for any additional proposed administrative fines in this matter. In addition, the Company reclassified Pascua-Lama’s proven and probable gold reserves as measured and indicated resources and recorded a pre-tax impairment of $429 million in the fourth quarter of 2017. No additional amounts have been recorded for any potential liability arising from the Antofagasta Environmental Court’s October 12, 2018 ruling and subsequent review by the SMA, as the Company cannot reasonably predict any potential losses and the SMA has not issued any additional proposed administrative fines.
On March 14, 2019, the Chilean Supreme Court annulled the October 12, 2018 administrative decision of the Antofagasta Environmental Court on procedural grounds and remanded the case back to the Environmental Court for review by a different panel of judges. The Chilean Supreme Court did not review the merits of the Revised Resolution, which remains in effect.
|
|
|
|
|
|
|
|
|
| BARRICK YEAR-END 2021 |
192 |
NOTES TO FINANCIAL STATEMENTS |
On September 17, 2020, the Antofagasta Environmental Court issued a ruling in which it upheld the closure order and sanctions imposed on CMN by the SMA in the Revised Resolution from January 2018. As part of its ruling, the Environmental Court also ordered the SMA to reevaluate certain environmental infringements contained in the Revised Resolution which may result in the imposition of additional fines against CMN. The Company confirmed that it will not appeal the Environmental Court’s decision, and the Chilean side of the Pascua-Lama project will now be transitioned to closure in accordance with that ruling.
On October 6, 2020, a group of local farmers challenged the Environmental Court’s decision. The challenge, which was brought before the Chilean Supreme Court, claims that the fines imposed by the SMA were inadequate and seeks to require the SMA to issue additional and more severe sanctions against CMN. The Chilean Supreme Court has accepted the appeal and the parties have presented their arguments on the merits. The decision of the Chilean Supreme Court is pending.
Veladero – Operational Incidents and Associated Proceedings
Minera Andina del Sol SRL (formerly, Minera Argentina Gold SRL) (“MAS”), the joint venture company that operates the Veladero mine, is the subject of various regulatory proceedings related to operational incidents at the Veladero Valley Leach Facility (“VLF”) occurring in March 2017 (the “March 2017 incident”), September 2016 (the “September 2016 incident”) and September 2015 (the “September 2015 incident”), and involving the San Juan Provincial mining authority, the Argentine federal government, and certain residents of Jachal, Argentina. Regulatory authorities were notified following the occurrence of each of these incidents, and remediation and/or monitoring activities were undertaken as appropriate. Although the September 2015 incident resulted in the release of cyanide-bearing process solution into a nearby waterway, environmental monitoring conducted by MAS and an independent third party has demonstrated that the incident posed no risk to human health at downstream communities. Monitoring and inspection following the September 2016 incident and remediation and inspection following the March 2017 incidents confirmed that those incidents did not result in any long-term environmental impacts.
Regulatory Proceedings and Actions
San Juan Provincial Regulatory Proceedings
On October 9, 2015, the San Juan Provincial mining authority initiated an administrative sanction process against MAS for alleged violations of the Mining Code relating to the September 2015 incident. MAS was formally notified of the imposition of an administrative fine in connection with the incident on March 15, 2016. MAS sought reconsideration of certain aspects of the decision but paid the administrative fine of approximately $10 million (at the then-applicable Argentine peso to U.S. dollar exchange rate) while the request for reconsideration was pending. After the San Juan government rejected MAS’ administrative appeal of this decision, on September 5, 2017, the Company commenced a legal action to continue challenging certain aspects of the decision before the San Juan courts, which is ongoing.
MAS is also the subject of a consolidated provincial regulatory proceeding related to the September 2016 incident and the March 2017 incident. MAS received notice of a resolution on December 27, 2017, from the San Juan Provincial mining authority requiring payment of an administrative fine of approximately $5.6 million (calculated at the prevailing exchange rate on December 31, 2017) for both the September 2016 incident and the March 2017 incident. On January 23, 2018, in accordance with local requirements, MAS paid the administrative fine and filed a request for reconsideration with the San Juan Provincial mining authority. MAS was notified in March 2018 that the San Juan Provincial mining authority had rejected the request for reconsideration of the administrative fine. A further appeal will be heard and decided by the Governor of San Juan.
Provincial Amparo Action
Following the March 2017 incident, an “amparo” protection action (the “Provincial Amparo Action”) was filed against MAS in the Jachal First Instance Court, San Juan Province (the “Jachal Court”) by individuals who claimed to be living in Jachal, San Juan Province, Argentina, seeking the cessation of all activities at the Veladero mine or, alternatively, a suspension of the mine’s leaching process. On March 30, 2017, the Jachal Court rejected the request for an injunction to cease all activities at the Veladero mine, but ordered, among other things, the suspension of the leaching process. The Jachal Court lifted the leaching process suspension in June 2017. The Jachal Court tried to join this proceeding with the Federal Amparo Action (as defined below), triggering a jurisdictional dispute. On December 26, 2019, the Argentine Supreme Court ruled on the jurisdictional dispute in favor of the Federal Court in connection with the Federal Amparo Action described below, meaning that the Jachal Court has retained jurisdiction over the Provincial Amparo Action and the two amparo actions were not effectively joined. The Provincial Amparo Action case file has not yet been remitted to the Jachal Court by the Supreme Court (see “Federal Amparo Action” below).
Federal Amparo Action
On April 4, 2017, the National Minister of Environment of Argentina filed an amparo protection action in the Federal Court in connection with the March 2017 incident (the “Federal Amparo Action”) seeking an order requiring the cessation and/or suspension of activities at the Veladero mine. MAS submitted extensive information to the Federal Court about the incident, the then-existing administrative and provincial judicial suspensions, the remedial actions taken by the Company and the lifting of the suspension orders described in the Provincial Amparo Action above, and challenged the jurisdiction of the Federal Court as well as the standing of the National Minister of Environment and requested that the matter be remanded to the Jachal Court. The Province of San Juan also challenged the jurisdiction of the Federal Court in this matter. On December 26, 2019, the Argentine Supreme Court ruled on the jurisdictional dispute in favor of the Federal Court. The Company was notified on October 1, 2020, that the National Ministry of the Environment had petitioned the Federal Court to resume the proceedings following the Supreme Court’s decision that the Federal Court is competent to hear the case. The
|
|
|
|
|
|
|
|
|
| BARRICK YEAR-END 2021 |
193 |
NOTES TO FINANCIAL STATEMENTS |
Federal Court ordered the resumption of the proceedings on February 19, 2021.
Civil Action
On December 15, 2016, MAS was served notice of a civil action filed before the San Juan Provincial Court by certain persons allegedly living in Jachal, San Juan Province, claiming to be affected by the Veladero mine and, in particular, the VLF. The plaintiffs requested a court order that MAS cease leaching metals with cyanide solutions, mercury and other similar substances at the mine and replace that process with one that is free of hazardous substances, implement a closure and remediation plan for the VLF and surrounding areas, and create a committee to monitor this process. These claims were supplemented by new allegations that the risk of environmental damage had increased as a result of the March 2017 incident. MAS replied to the lawsuit in February 2017 and it also responded to the supplement claim and intends to continue defending this matter vigorously.
Criminal Matters
Provincial Criminal Proceedings
In August 2017, the San Juan Court of Appeals confirmed criminal indictments against eight current and former MAS employees in connection with the September 2015 incident (the “Provincial Criminal Action”). MAS is not a party to the Provincial Criminal Action. On August 23, 2018, the defendants in the Provincial Criminal Action were granted probation. All defendants have now completed the probationary period and, having complied with good behavior and community service requirements, have requested dismissal of the charges against them without admitting to any wrongdoing. On June 21, 2021, the Court issued a decision dismissing all charges against the defendants. The case is now closed.
Federal Criminal Matters
A federal criminal investigation was initiated by a Buenos Aires federal court (the “Federal Court”) based on the alleged failure of certain current and former federal and provincial government officials and individual directors of MAS to prevent the September 2015 incident (the “Federal Investigation”). On May 5, 2016, the National Supreme Court of Argentina limited the scope of the Federal Investigation to the potential criminal liability of the federal officials, ruling that the Federal Court does not have jurisdiction to investigate the solution release.
On April 11, 2018, the federal judge indicted three former federal officials, alleging breach of duty in connection with their actions and omissions related to the failure to maintain adequate environmental controls during 2015 and the case was sent to trial.
In June 2018, the federal judge ordered additional environmental studies in the communities downstream from the Veladero mine, but this order was overturned due to lack of jurisdiction by the Federal Supreme Court on October 8, 2020.
Glacier Investigation
On October 17, 2016, a separate criminal investigation was initiated by the federal judge overseeing the Federal Investigation based on the alleged failure of federal officials to regulate the Veladero mine under Argentina’s glacier legislation (the “Glacier Investigation”) with regard to the
September 2015 incident. On June 16, 2017, MAS submitted a motion to challenge the federal judge’s decision to assign the Glacier Investigation to himself, and to request that it be admitted as a party in order to present evidence supporting MAS. On September 14, 2017, the Federal Court of Appeals ordered the federal judge to consolidate the two investigations and clarified that MAS is not a party to the case and therefore does not have standing to seek the recusal of the federal judge, but nonetheless recognized MAS’ right to continue to participate in the case (without clarifying the scope of those rights).
On November 27, 2017, the federal judge indicted four former federal officials, alleging abuse of authority in connection with their actions and omissions related to the enforcement of Argentina’s glacier legislation. The Court of Appeals confirmed the indictments and on August 6, 2018, the case was assigned to a federal trial judge.
In total, six former federal officials were indicted under the Federal Investigation and the Glacier Investigation and will face trial. In 2019, one of the former federal officials, who was indicted on separate charges under both investigations, passed away and charges against him were dropped.
Due to the Argentine response to Covid-19 and a procedural challenge by one of the former federal officials, the oral arguments originally scheduled for April and May 2020 in this matter have been postponed and have not yet been rescheduled.
Veladero – Tax Assessment and Criminal Charges
On December 26, 2017, MAS received notice of a tax assessment (the “Tax Assessment”) for 2010 and 2011, amounting to ARS 543 million (approximately $6.5 million at the prevailing exchange rate at December 31, 2020), plus interest and fines. The Tax Assessment primarily claims that certain deductions made by MAS were not properly characterized, including that (i) the interest and foreign exchange on loans borrowed between 2002 and 2006 to fund Veladero’s construction should have been classified as equity contributions, and (ii) fees paid for intercompany services were not for services related to the operation of the Veladero mine.
On June 21, 2018, the Argentinean Federal Tax Authority (“AFIP”) confirmed the Tax Assessment, which MAS appealed to the Federal Tax Court on July 31, 2018. A hearing for the appeal has not yet been scheduled.
The Company filed Mutual Agreement Procedure applications in Canada on December 21, 2018, and in Argentina on March 29, 2019, pursuant to the Canada-Argentina Income Tax Convention Act (the “Canada-Argentina Tax Treaty”) to escalate resolution of the Tax Assessment to the competent authority (as defined in the Canada-Argentina Tax Treaty) in an effort to seek efficient resolution of the matter.
In November 2018, MAS received notice that AFIP filed criminal charges against current and former employees serving on its board of directors when the 2010 and 2011 tax returns were filed (the “Criminal Tax Case”).
Hearings for the Criminal Tax Case were held between March 25 and March 27, 2019. The defendants filed a motion to dismiss based on the statute of limitations, which was granted in part and appealed by the prosecution.
On June 2, 2021 the trial court issued a decision dismissing the Criminal Tax Case against the directors.
|
|
|
|
|
|
|
|
|
| BARRICK YEAR-END 2021 |
194 |
NOTES TO FINANCIAL STATEMENTS |
AFIP appealed and on September 24, 2021, the Mendoza Federal Court of Appeals partially reversed the trial court’s decision, ruling that there was insufficient evidence to either indict the directors or dismiss the case against them, and ordering additional investigation by the trial court. The Criminal Tax Case was remanded to the trial court in accordance with the decision of the Mendoza Federal Court of Appeals, and the trial court has ordered additional evidence to be prepared by the court-appointed expert.
The Company believes that the Tax Assessment and the Criminal Tax Case are without merit and intends to defend the proceedings vigorously.
Perilla Complaint
In 2009, Barrick Gold Inc. and Placer Dome Inc. were purportedly served in Ontario with a complaint filed in November 2008 in the Regional Trial Court of Boac (the “Court”), on the Philippine island of Marinduque, on behalf of two named individuals and purportedly on behalf of the approximately 200,000 residents of Marinduque. The complaint alleges injury to the economy and the ecology of Marinduque as a result of the discharge of mine tailings from the Marcopper mine into Calancan Bay, the Boac River, and the Mogpog River. Placer Dome Inc., which was acquired by the Company in 2006, had been a minority indirect shareholder of the Marcopper mine. The plaintiffs are claiming for abatement of a public nuisance allegedly caused by the tailings discharge and for nominal damages for an alleged violation of their constitutional right to a balanced and healthful ecology. In June 2010, Barrick Gold Inc. and Placer Dome Inc. filed a motion to have the Court resolve their unresolved motions to dismiss before considering the plaintiffs' motion to admit an amended complaint and also filed an opposition to the plaintiffs' motion to admit on the same basis. By Order dated November 9, 2011, the Court granted a motion to suspend the proceedings filed by the plaintiffs. It is not known when these motions or the outstanding motions to dismiss will be decided by the Court. To date neither the plaintiffs nor the Company has advised the Court of an intention to resume the proceedings. The Company intends to defend the action vigorously. No amounts have been recorded for any potential liability under this complaint, as the Company cannot reasonably predict the outcome.
Writ of Kalikasan
In February 2011, a Petition for the Issuance of a Writ of Kalikasan with Prayer for Temporary Environmental Protection Order was filed in the Supreme Court of the Republic of the Philippines (the “Supreme Court”) in Eliza M. Hernandez, Mamerto M. Lanete and Godofredo L. Manoy (the “Petitioners”) versus Placer Dome Inc. and Barrick Gold Corporation. In March 2011, the Supreme Court issued an En Banc Resolution and Writ of Kalikasan, directed service of summons on Placer Dome Inc. (“Placer Dome”) and the Company, ordered Placer Dome and the Company to make a verified return of the Writ within ten (10) days of service and referred the case to the Court of Appeal (the “Court”) for hearing. The Petition alleges that Placer Dome violated the Petitioners’ constitutional right to a balanced and healthful ecology as a result of, among other things, the discharge of tailings into Calancan Bay, the 1993 Maguila-Guila dam break, the 1996 Boac River tailings spill and failure of Marcopper to properly decommission the Marcopper mine. The Petitioners have
pleaded that the Company is liable for the alleged actions and omissions of Placer Dome, which was a minority indirect shareholder of Marcopper at all relevant times, and is seeking orders requiring the Company to environmentally remediate the areas in and around the mine site that are alleged to have sustained environmental impacts. A Writ of Kalikasan brought under the then-new Rules of Procedure in Environmental Cases (the “Environmental Rules”) is intended to be a mechanism for speedy relief and the Environmental Rules impose rigid deadlines and other requirements on such proceedings, including that a petitioner file and serve all evidence on which it relies at the outset of the proceeding and a respondent file all evidence on which it relies within 10 days of being served. While the Company complied with this requirement and filed extensive affidavit evidence, including expert affidavits, at the time it filed its Return Ad Cautelam in April 2011, the Petitioners did not file any affidavits in support of their Writ and the only evidence filed or referenced by the Petitioners was various documents and news articles with no person testifying to their contents. The Company filed a motion challenging the Court’s jurisdiction over both the proceedings and the Company at the outset of the proceedings, and also challenged the constitutionality of the Environmental Rules pursuant to which the Petition was filed.
In October 2011, the proceedings were suspended to permit the Petitioners to explore the possibility of a settlement. Although discussions ended without a resulting settlement by December 2013, with the exception of a few inquiries by the Court as to the status of the settlement and the Petitioners’ intentions, the proceedings remained essentially inactive between October 2011 and September 2018 when the Petitioners sought to have the suspension lifted and the proceedings resume.
In March 2019, the Court lifted the suspension of proceedings. Between March 2019, when the suspension of proceedings was lifted and January 2020, the Court has: (i) rejected the Company’s constitutional objections and held that the Court has jurisdiction based on a “tentative” determination that the Company was doing business in the Philippines made exclusively on the basis of unproved allegations made by the Petitioners in their petition; (ii) directed a court-annexed mediation, which did not result in settlement; (iii) dismissed the Company’s arguments that the proceedings should be dismissed for delay, laches and due process reasons; (iv) conducted a preliminary case conference in January 2020; and (v) permitted the Petitioners to file late two affidavits in September 2019, over the Company’s objections. The Company has consistently challenged all adverse Court decisions, including by way of certiorari to the Supreme Court. In all instances, such attempts have been unsuccessful.
A tentative trial date in March 2020 was postponed due to the Philippine government's response to the Covid-19 pandemic. Subsequently, a September 2020 trial date was set, but later cancelled by the Court because of a late request by Petitioners’ counsel, over the objections of the Company.
Since June 2020, the Petitioners have taken numerous steps to attempt to seek to expand the issues for consideration by the Court in these proceedings beyond the scope of the original Writ and also to supplement the evidentiary record outside the strict limitations of the Environment Rules, including by: (i) filing a motion asking
|
|
|
|
|
|
|
|
|
| BARRICK YEAR-END 2021 |
195 |
NOTES TO FINANCIAL STATEMENTS |
the Court to issue a Temporary Environmental Protection Order on broader grounds than those pleaded in the original Writ; (ii) filing a motion requesting a discovery order for the “ocular inspection” of various physical locations in or around the Marcopper Mine site on the basis of alleged issues not previously pleaded in the original Writ; and (iii) filing a motion days prior to a scheduled trial date seeking to cancel the trial date and revert the proceedings to the preliminary conference stage to allow the Petitioners to file additional evidence, to add additional individuals to their list of witnesses, and to file additional judicial affidavits on behalf of additional witnesses. The Company has objected to such steps in materials filed with the Court.
On October 27, 2020, the Province of Marinduque filed a Motion for Leave to Intervene and a Petition in Intervention in the Supreme Court (the “Intervention Motion”). In the Intervention Motion, the Province sought leave to intervene in the case and effectively also sought to expand the scope of relief to include claims regarding alleged maintenance and structural integrity issues of infrastructure at the Marcopper Mine site, amongst other issues not raised in the original Writ of Kalikasan. On November 17, 2020, the Supreme Court issued a Resolution referring the Intervention Motion to the Court; however, the Company did not receive notice of this Resolution until January 26, 2021. On January 21, 2021, the Court issued a resolution admitting the Intervention Motion before the Court, granting the Intervention Motion and accepting for filing the Petition in Intervention. The January 21, 2021 Resolution was issued without the Court affording the Company due process and an opportunity to respond to the merits of the Intervention Motion. On February 9, 2021 the Company filed a Motion for Partial Reconsideration of the January 21, 2021 Resolution seeking to set aside the granting of the Intervention Motion by the Court and to have the Intervention Motion dismissed.
On November 25, 2020, the Court set a new trial date of December 2, 2020. The trial began on December 2, 2020, with the Petitioners calling a new witness not disclosed prior to September 2020 and stating their intention to call seven more unspecified witnesses. The Company has made multiple filings and submissions recording its objections to the Petitioners being permitted to call witnesses whose affidavits have been delivered outside the prescribed time requirements and years after the Company has filed its evidence in response to the Petitioners claims.
On January 7, 2021, the Petitioners filed an urgent motion to cancel the second trial date scheduled for January 11, 2021 on the basis that the witness they intended to call would not be able to appear at the hearing. The Company objected. Although the Court issued an order dismissing the Petitioners’ request to cancel the January 11, 2021 hearing date, the Court nevertheless effectively granted the relief sought by the Petitioners by acknowledging that the Petitioners’ next witness could be called instead on the reserved hearing date on January 27, 2021.
On January 21, 2021, the Court ruled on the Company’s objections to the Petitioners being permitted to call witnesses whose affidavits are delivered late and ordered the Petitioners to submit all of their remaining judicial affidavits within a non-extendable 15 days from notice (by February 10, 2021). It is not clear how many additional witnesses the Petitioners intend to call or will be
permitted to call. The Company intends to seek reconsideration of this ruling.
The Petitioners called one witness on January 27, 2021. One additional judicial affidavit was delivered by the Petitioners by February 10, 2021 and the Petitioners manifested their intention to introduce additional evidence without judicial affidavits. The Company objected to Petitioners’ manifested intention as well as to the admissibility of the additional judicial affidavit delivered by the Petitioners.
On February 17, 2021, the Province of Marinduque filed a Motion to Implead asking the Court of Appeal to add Marcopper Mining Corporation as a respondent. On March 1, 2021, the Company filed both a Manifestation submitting that the Motion to Implead is premature in light of the Company’s Motion for Partial Reconsideration filed February 9, 2021, and an Opposition to the Motion to Implead. The February 24, 2021 hearing date did not proceed.
On March 26, 2021, the Company filed a Petition for Certiorari in the Supreme Court seeking to set aside the Court of Appeals’ rulings of November 25, 2020 and January 21, 2021 relating to the Petitioners’ ability to call additional witnesses and file additional judicial affidavits.
On June 14, 2021, the Court of Appeals released a Resolution denying the Company’s Motion for Partial Reconsideration filed February 9, 2021 as well as the Province of Marinduque’s Motion to Implead Marcopper Mining Corporation as a respondent.
On June 25, 2021, the Company filed a Return Ad Cautelam in response to the Province of Marinduque’s Petition for Intervention.
On July 2, 2021, the Province of Marinduque filed a Motion for Reconsideration of the June 14, 2021 Resolution of the Court of Appeals denying the Motion to Implead Marcopper Mining Corporation as a respondent. On July 15, 2021, the Company filed its Comment Ad Cautelam in response to the Province of Marinduque’s Motion for Reconsideration.
On July 26, 2021, the Petitioners filed their Formal Offer of Evidence, which formally concludes the Petitioners’ evidence portion of the trial. The Company responded to and opposed the Petitioners’ Offer of Evidence on October 27, 2021.
On September 10, 2021, the Company filed a Petition for Certiorari of the January 21, 2021 and June 14, 2021 Resolutions of the Court of Appeals, which granted the Province of Marinduque leave to intervene in the Writ of Kalikasan proceeding and denied the Company’s Motion for Partial Reconsideration of that decision. The Company’s
Petition for Certiorari of the January 21, 2021 and June 14, 2021 Resolutions of the Court of Appeals was dismissed by the Supreme Court of the Philippines on November 10, 2021.
Court filing deadlines in the Philippines were suspended from August 4, 2021 until October 18, 2021 due to Covid-19 quarantine requirements.
On November 2, 2021, the Company filed a Motion to Strike and Reply in respect of the Province of Marinduque’s Petition in Intervention.
The next trial date has not been scheduled.
No amounts have been recorded for any potential liability under this matter, as the Company cannot
|
|
|
|
|
|
|
|
|
| BARRICK YEAR-END 2021 |
196 |
NOTES TO FINANCIAL STATEMENTS |
reasonably predict the outcome. The Company intends to continue to defend the action vigorously.
Reko Diq Arbitration
Barrick currently indirectly holds 50% of the shares of Tethyan Copper Company Pty Limited (“TCC”), with Antofagasta plc (“Antofagasta”) indirectly holding the other 50%. On November 15, 2011, the Government of the Province of Balochistan notified Tethyan Copper Company Pakistan (Private) Limited (“TCCP”) (the local operating subsidiary of TCC) of the rejection of TCCP’s application for a mining lease for the Reko Diq project, to which TCCP was lawfully entitled subject only to "routine" government requirements. On November 28, 2011, TCC filed a request for international arbitration against the Government of Pakistan (“GOP”) with the International Centre for Settlement of Investment Disputes (“ICSID”) asserting breaches of the Bilateral Investment Treaty (“BIT”) between Australia (where TCC is incorporated) and Pakistan.
On March 20, 2017, the Tribunal issued its decision, rejecting the GOP’s position. In March 2019, ICSID closed the record in the arbitration.
In July 2019, ICSID awarded $5.84 billion in damages to TCC in relation to the arbitration claims and unlawful denial of a mining lease for the Reko Diq project (the “ICSID Award”). Damages include compensation of $4.087 billion in relation to the fair market value of the Reko Diq project at the time the mining lease was denied, and interest until the date of the ICSID Award of $1.753 billion. Compound interest continues to apply at a rate of US Prime +1% per annum until the ICSID Award is paid.
In November 2019, the GOP applied to annul TCC’s damages award, which resulted in an automatic stay on TCC from pursuing enforcement action. ICSID has constituted a committee (the “Annulment Committee”) to hear the annulment application, consisting of a president from South Korea and additional members from Mexico and Finland.
On September 17, 2020, with respect to the automatic stay of enforcement of the July 12, 2019 ICSID Award, the Annulment Committee ruled that: (i) the stay of enforcement of the ICSID Award would be continued on a conditional basis; (ii) Pakistan shall provide an unconditional and irrevocable bank guarantee or letter of credit for 25% of the ICSID Award, plus accrued interest as of the date of the decision, from a reputable international bank based outside of Pakistan, pledged in favor of TCC and to be released on the order of the Committee; (iii) Pakistan shall provide the Annulment Committee with a letter signed by Pakistan’s Minister of Finance or the official having full authority to bind Pakistan that, to the extent the ICSID Award is not annulled, it undertakes to recognize and pay the ICSID Award in compliance with its obligations under the ICSID convention; and (iv) should Pakistan not furnish the security and undertaking in the terms as set out above, to the satisfaction of the Annulment Committee, within 30 days after notification of the decision, the stay of enforcement in the amount of 50% of the ICSID Award, plus accrued interest as of the date of the decision, shall be lifted.
If Pakistan does not satisfy its security and undertaking obligation, in order to commence collection TCC must within 30 days satisfy two conditions: (1) establish an escrow account under the sole control of an international escrow agent and under the direction of the
Annulment Committee into which any collected amounts will be placed; and (2) provide “an undertaking, to the satisfaction of the Annulment Committee, that, if the ICSID Award is annulled, TCC will pay any amounts that Pakistan cannot recover from the escrow account that will hold assets obtained from enforcement, excluding those amounts due to Pakistan’s third-party creditors.” To date, Pakistan has not posted the surety or undertaking.
On November 20, 2020, TCC commenced collection actions in the British Virgin Islands ("BVI"). On December 3, 2020, the BVI Court recognized the ICSID Award, issued a provisional charging order against shares of PIA Investments, Minhal Inc. and PIA Hotels, companies TCC alleges to be assets of the GOP, injunctions against dissipation of value and or redomiciling those companies, and receivership over the assets of those companies. On May 25, 2021, at the behest of the GOP, the BVI Court dissolved the provisional charging order and the injunctions. TCC appealed the BVI Court’s decision to dissolve the order and injunctions to the Eastern Caribbean Supreme Court and is vigorously prosecuting the appeal.
On March 16, 2021, ICSID registered a request for revision filed by the GOP, resulting in a provisional stay on enforcement of the ICSID Award. The original panel that decided the case has reconstituted itself to hear the revision request. On September 7, 2021, the panel rejected Pakistan’s request to continue the provisional stay on enforcement of the ICSID Award and lifted it. TCC is vigorously opposing the revision request.
The Annulment Committee held its merits hearing on May 26 through 29, 2021. The decision of the Annulment Committee is pending.
The Company has been engaging with the GOP to discuss a mutually acceptable framework agreement for the potential development of the Reko Diq project. These discussions are ongoing, and the parties may not agree on terms for the development of the project and resolution of TCC’s dispute with the GOP. TCC is continuing to protect its right to payment under the ICSID Award while negotiations continue.
The Company cannot reasonably estimate the financial effect of the ICSID Award. No amounts have been recognized at this time.
Porgera Special Mining Lease Extension
Porgera's Special Mining Lease (“SML”) terminated on August 16, 2019. The Company applied for a 20-year extension of the SML in June 2017 and has been engaging with the Government of Papua New Guinea on this matter since then. On August 2, 2019, the National Court of Papua New Guinea ruled that the provisions of the country’s 1992 Mining Act applied to the Porgera gold mine, thus allowing it to continue operating while the application to extend its SML was being considered.
On April 25, 2020, the Porgera gold mine was put on care and maintenance, after Barrick Niugini Limited (“BNL”), the 95% owner and operator of the Porgera joint venture, received a communication from the Government of Papua New Guinea that its application for the 20-year extension of the SML had been refused. While the Company believed the Government’s decision not to extend the SML was tantamount to nationalization without due process and in violation of the Government’s legal obligations to BNL, it nevertheless engaged in discussions with Prime Minister Marape and his Government to agree
|
|
|
|
|
|
|
|
|
| BARRICK YEAR-END 2021 |
197 |
NOTES TO FINANCIAL STATEMENTS |
on a revised arrangement under which the Porgera mine could be reopened, for the benefit of all stakeholders involved.
On April 9, 2021, BNL signed a binding Framework Agreement with the Independent State of Papua New Guinea (“PNG”) and Kumul Minerals Holdings Limited (“Kumul Minerals”), a state-owned mining company, setting out the terms and conditions for the reopening of the Porgera mine. On February 3, 2022, the Framework Agreement was replaced by the more detailed Porgera Project Commencement Agreement (the “Commencement Agreement”). The Commencement Agreement was signed by PNG, Kumul Minerals, BNL and its affiliate Porgera (Jersey) Limited on October 15, 2021, and it became effective on February 3, 2022, following signature by Mineral Resources Enga Limited (“MRE”), the holder of the remaining 5% of the original Porgera joint venture. The Commencement Agreement reflects the commercial terms previously agreed to under the Framework Agreement, namely that PNG stakeholders will receive a 51% equity stake in the Porgera mine, with the remaining 49% to be held by BNL or an affiliate. BNL is jointly owned on a 50/50 basis by Barrick and Zijin Mining Group. Accordingly, following the implementation of the Commencement Agreement, Barrick’s current 47.5% interest in the Porgera mine is expected to be reduced to a 24.5% interest as reflected in Barrick’s reserve and resource estimates for Porgera. BNL will retain operatorship of the mine. The Commencement Agreement also provides that PNG stakeholders and BNL and its affiliates will share the economic benefits derived from the reopened Porgera Mine on a 53% and 47% basis over the remaining life of mine, respectively, and that the Government of PNG will retain the option to acquire BNL’s or its affiliate’s 49% equity participation at fair market value after 10 years.
The provisions of the Commencement Agreement will be implemented, and work to recommence full mine operations at Porgera will begin, following the execution of a number of definitive agreements and satisfaction of a number of conditions. These include a Shareholders Agreement among the shareholders of a new Porgera joint venture company, an Operatorship Agreement pursuant to which BNL will operate the Porgera mine, as well as a Mine Development Contract to accompany the new Special Mining Lease (“SML”) that the new Porgera joint venture company will apply for following its incorporation. Under the terms of the Commencement Agreement, BNL will remain in possession of the site and maintain the mine on care and maintenance.
In the meantime, under standstill arrangements contemplated by the Commencement Agreement, all legal and arbitral proceedings previously initiated by the parties in relation to the Porgera dispute are to be suspended. These proceedings include Judicial Review actions filed by BNL against the Government of Papua New Guinea in April and September 2020, and international arbitration initiated by Barrick (PD) Australia Pty Limited, the Company’s subsidiary and an investor in the Porgera mine, before the World Bank’s International Centre for Settlement of Investment Disputes (“ICSID”) in September 2020.
In December 2021, a group of local landowners known as the Justice Foundation for Porgera initiated a proceeding in the Papua New Guinea Supreme Court in which they seek a declaration that as customary landowners they own and can mine the minerals situated on their customary lands including at the Porgera mine, and
that certain provisions of the Mining Act and related provisions of the Papua New Guinea Constitution are invalid.
BNL intends to intervene in this matter to protect its rights under the Commencement Agreement and will defend its position vigorously.
On February 10, 2022, the Company was informed that certain directors of a shareholder of MRE have sought standing to challenge the validity of MRE’s signature of the Commencement Agreement and this matter has been referred to mediation to which BNL is not a party.
Porgera Tax Audits
In April 2020, BNL received a position paper from the Internal Revenue Commission ("IRC") in Papua New Guinea asserting various proposed adjustments and other tax liabilities amounting to $131 million (not including penalties, based on the kina foreign exchange rate as at December 31, 2021) arising from tax audits of BNL conducted for 2006 through 2015. BNL responded to the position paper on June 30, 2020. On October 2, 2020, BNL received amended assessments from the IRC which increased the amount of proposed adjustments and other taxes to $485 million (including penalties, based on the kina foreign exchange rate as at December 31, 2021). The Company has reviewed the amended assessments and concluded that there is no merit to the IRC’s tax audit adjustments, except for certain immaterial items for which a provision had already been made. BNL filed objections to the amended assessments on November 30, 2020 in accordance with the Papua New Guinea Income Tax Act, and the Company remains in discussions with the IRC with respect to this matter.
The Company intends to defend its position vigorously and has not recorded any additional estimated amounts for the potential liability arising from the amended assessments as the Company cannot reasonably predict the outcome.
Tanzania – Concentrate Export Ban and Related Disputes
On March 3, 2017, the GoT announced a general ban on the export of metallic mineral concentrates (the "Ban") following a directive made by the President to promote the creation of a domestic smelting industry. Following the directive, Acacia ceased all exports of its gold/copper concentrate (“concentrate”) including containers previously approved for export prior to the Ban located at the port in Dar es Salaam.
During the second quarter of 2017, the GoT initiated investigations which resulted in allegations of historical undeclared revenue and unpaid taxes by Acacia and its predecessor companies. Acacia subsequently received adjusted assessments for the tax years 2000-2017 from the Tanzania Revenue Authority for a total amount of approximately $190 billion for alleged unpaid taxes, interest and penalties. In addition, following the end of the third quarter of 2017, Acacia was served with notices of conflicting adjusted corporate income tax and withholding tax assessments for tax years 2005 to 2011 with respect to Acacia’s former Tulawaka joint venture, and demands for payment, for a total amount of approximately $3 billion. Acacia disputed these assessments through arbitration and the Tanzanian tax appeals process, respectively.
In addition to the Ban, new and amended legislation was passed in Tanzania in early July 2017,
|
|
|
|
|
|
|
|
|
| BARRICK YEAR-END 2021 |
198 |
NOTES TO FINANCIAL STATEMENTS |
including various amendments to the 2010 Mining Act and a new Finance Act. The amendments to the 2010 Mining Act increased the royalty rate applicable to metallic minerals such as gold, copper and silver to 6% (from 4%), and the new Finance Act imposes a 1% clearing fee on the value of all minerals exported from Tanzania from July 1, 2017. In January 2018, new Mining Regulations were announced by the GoT introducing, among other things, local content requirements, export regulations and mineral rights regulations, the scope and effect of which remain under review. Barrick continued to monitor the impact of new legislation in light of Acacia's Mineral Development Agreements with the GoT.
On October 19, 2017, Barrick announced that it had agreed with the GoT on a proposed framework for a new partnership between Acacia and the GoT. Acacia did not participate directly in these discussions as the GoT had informed Barrick that it wished to continue dialogue solely with Barrick. Barrick and the GoT also agreed to form a working group that would focus on the resolution of outstanding tax claims against Acacia. Key terms of the proposed framework announced by Barrick and the GoT included (i) the creation of a new Tanzanian company to provide management services to Acacia’s Bulyanhulu, Buzwagi and North Mara mines and all future operations in the country with key officers located in Tanzania and Tanzanian representation on the board of directors; (ii) maximization of local employment of Tanzanians and procurement of goods and services within Tanzania; (iii) economic benefits from Bulyanhulu, Buzwagi and North Mara to be shared on a 50/50 basis, with the GoT’s share delivered in the form of royalties, taxes and a 16% free carry interest in Acacia’s Tanzanian operations; and (iv) in support of the working group’s ongoing efforts to resolve outstanding tax claims, Acacia would make a payment of $300 million to the GoT, staged over time, on terms to be settled by the working group. Barrick and the GoT also reviewed the conditions for the lifting of the Ban.
On February 20, 2019, Barrick announced that it had arrived at a proposal with the GoT that set forth the commercial terms to resolve outstanding disputes concerning Acacia’s operations in Tanzania.
On May 19, 2019, the GoT Negotiating Team wrote to Acacia’s three Tanzanian operating companies (the “TMCs”) to indicate that the GoT had resolved not to proceed to execute final agreements for the resolution of Acacia’s disputes if Acacia was one of the counterparties to the agreements.
On July 12, 2019, Acacia’s North Mara mine received a letter from the Mining Commission of the Tanzanian Ministry of Minerals informing it that the Mining Commission is soon to conduct an inspection of North Mara's gold production (the "No Export Letter"). The No Export Letter stated that export permits for gold shipments from North Mara would be issued following completion of this inspection.
Following an investigation conducted by the Mining Commission on July 30 and 31, 2019, the North Mara mine received a letter from the Mining Commission (the “Inspection Findings Letter”) stating that it believes that certain provisions of the Mining Regulations, 2010 were violated and directing the North Mara mine to submit a feasibility study report and current mine plan for its approval by August 16, 2019. The Inspection Findings Letter also
authorized the resumption of gold exports from North Mara subject to its adherence to the export procedure.
On July 19, 2019, the Acacia Transaction Committee Directors and Barrick published a firm offer announcement pursuant to Rule 2.7 of the City Code on Takeovers and Mergers (“Rule 2.7 Announcement”) announcing that they had reached agreement on the terms of a recommended final offer by Barrick for the ordinary share capital of Acacia that Barrick did not already own, with the belief that the recommended final offer would enable Barrick to finalize the terms of a full, final and comprehensive settlement of all of Acacia’s existing disputes with the GoT. To facilitate this and in anticipation of the Rule 2.7 Announcement, on July 17, 2019, Acacia announced that Bulyanhulu Gold Mine Limited and Pangea Minerals Limited would immediately seek a stay of their international arbitration proceedings with the GoT.
On September 12, 2019, the High Court of Justice in England and Wales made an order sanctioning the scheme of arrangement under Part 26 of the Companies Act 2006 (the "Scheme"), and on September 17, 2019, Barrick completed the acquisition of all of the shares of Acacia that the Company did not already own pursuant to the Scheme. Acacia ceased trading on the London Stock Exchange and became a wholly-owned subsidiary of Barrick called Barrick TZ Limited.
On October 20, 2019, Barrick announced that it had reached an agreement with the GoT to settle all disputes between the GoT and the mining companies formerly operated by Acacia but now managed by Barrick. The final agreements were submitted to the Tanzanian Attorney General for review and legalization.
The terms of the signed agreement are consistent with those previously announced, including the payment of $300 million to settle all outstanding tax and other disputes (the “Settlement Payment”); the lifting of the concentrate export ban; the sharing of future economic benefits from the mines on a 50/50 basis; and a dispute resolution mechanism that provides for binding international arbitration. The 50/50 division of economic benefits will be maintained through an annual true-up mechanism, which will not account for the Settlement Payment.
The Settlement Payment will be paid in installments, with an initial payment of $100 million which was paid to the GoT following the resumption of mineral concentrate exports. Five subsequent annual payments of $40 million each will be made, starting on the first anniversary of the fulfillment of all conditions of the signed agreement, subject to certain cash flow conditions.
On January 24, 2020, Barrick announced that the Company had ratified the creation of Twiga (“Twiga”) at a signing ceremony with the President of Tanzania, formalizing the establishment of a joint venture between Barrick and the GoT and resolution of all outstanding disputes between Barrick and the GoT, including the lifting of the previous concentrate export ban, effective immediately. The GoT received a free carried shareholding of 16% in each of the Tanzania mines (Bulyanhulu, Buzwagi and North Mara), a 16% interest in the shareholder loans owed by the operating companies and will receive its half of the economic benefits from taxes, royalties, clearing fees and participation in all cash distributions made by the mines and Twiga, after the recoupment of capital investments. Twiga will provide management services to the mines.
|
|
|
|
|
|
|
|
|
| BARRICK YEAR-END 2021 |
199 |
NOTES TO FINANCIAL STATEMENTS |
In October 2020, Twiga paid a maiden interim cash dividend of $250 million, of which $40 million was paid to the GoT.
Barrick and the GoT continue efforts to fulfill their respective obligations to satisfy all conditions of the signed agreement, primarily with respect to the execution and delivery of formal termination documents for the settlement of all outstanding disputes between the two parties.
See note 21 of these Financial Statements for impairment losses/reversals arising from these matters.
Tanzanian Revenue Authority Assessments
The Tanzanian Revenue Authority (“TRA”) issued a number of tax assessments to Acacia related to past taxation years from 2002 onwards. Acacia believed that the majority of these assessments were incorrect and filed objections and appeals accordingly in an attempt to resolve these matters by means of discussions with the TRA or through the Tanzanian appeals process. Overall, it was Acacia’s assessment that the relevant assessments and claims by the TRA were without merit.
The claims include an assessment issued to Acacia in the amount of $41.3 million for withholding tax on certain historic offshore dividend payments paid by Acacia (then African Barrick Gold plc) to its shareholders from 2010 to 2013. Acacia appealed this assessment on the substantive grounds that, as an English incorporated company, it was not resident in Tanzania for taxation purposes. In August 2020, the Tanzanian Court of Appeal found African Barrick Gold plc (now called Barrick TZ Limited) to be tax resident in Tanzania upholding an earlier decision from the Tanzania Revenue Authority, and that as a result, withholding tax was payable on the dividends of $41.3 million, plus accrued interest, previously declared and paid between 2010 to 2013, inclusive. During October 2020, Barrick TZ Limited filed a motion for the Court of Appeal to review this decision with written submissions following in December 2020. No date has been set for the Court of Appeal to review its decision.
Further TRA assessments were issued to Acacia in January 2016 in the amount of $500.7 million, based on an allegation that Acacia was resident in Tanzania for corporate and dividend withholding tax purposes. The corporate tax assessments were levied on certain of Acacia’s net profits before tax. Acacia appealed these assessments at the TRA Board level. Acacia’s substantive grounds of appeal were based on the correct interpretation of Tanzanian permanent establishment principles and law, relevant to a non-resident English incorporated company.
In addition, the TRA issued adjusted tax assessments totaling approximately $190 billion for alleged unpaid taxes, interest and penalties, apparently issued in respect of alleged and disputed under-declared export revenues, and appearing to follow on from the announced findings of the First and Second Presidential Committees. For more information about these adjusted tax assessments, see “Tanzania - Concentrate Export Ban and Related Disputes” above.
On October 20, 2019, Barrick announced that it had reached an agreement with the GoT to settle all disputes between the GoT and the mining companies formerly operated by Acacia but now managed by Barrick. The final agreements were submitted to the Tanzanian Attorney General for review and legalization.
On January 24, 2020, Barrick announced that the Company had ratified the creation of Twiga Minerals Corporation at a signing ceremony with the President of Tanzania, formalizing the establishment of a joint venture between Barrick and the Government of Tanzania (“GoT”) and resolution of all outstanding disputes between Barrick and the GoT, including the lifting of the previous concentrate export ban, effective immediately. The GoT will receive a free carried shareholding of 16% in each of the former Acacia mines (Bulyanhulu, Buzwagi and North Mara), and will receive its half of the economic benefits from taxes, royalties, clearing fees and participation in all cash distributions made by the mines and Twiga, after the recoupment of capital investments.
The terms of the signed agreement are consistent with those previously announced, including the Settlement Payment; the lifting of the concentrate export ban; the sharing of future economic benefits from the mines on a 50/50 basis; and a dispute resolution mechanism that provides for binding international arbitration. The 50/50 division of economic benefits will be maintained through an annual true-up mechanism, which will not account for the Settlement Payment.
The Settlement Payment will be paid in installments, with an initial payment of $100 million which was paid to the GoT following the resumption of mineral concentrate exports. Five subsequent annual payments of $40 million each will be made, starting on the first anniversary of the fulfillment of all conditions of the signed agreement, subject to certain cash flow conditions.
All of the tax disputes with the TRA were considered resolved as part of the settlement with the GoT described above under "Tanzania – Concentrate Export Ban and Related Disputes." As noted above, Barrick and the GoT continue efforts to fulfill their respective obligations to satisfy all conditions of the signed agreement, primarily with respect to the execution and delivery of formal termination documents for the settlement of all outstanding disputes between the two parties.
Zaldívar Chilean Tax Assessment
On August 28, 2019, Barrick's Chilean subsidiary that holds the Company's interest in the Zaldívar mine, Compañía Minera Zaldívar Limitada ("CMZ"), received notice of a tax assessment from the Chilean Internal Revenue Service ("Chilean IRS") amounting to approximately $1 billion in outstanding taxes, including interest and penalties (the "Zaldívar Tax Assessment"). The Zaldívar Tax Assessment primarily claims that CMZ improperly claimed a deduction relating to a loss on an intercompany transaction prior to recognizing and offsetting a capital gain on the sale of a 50% interest by CMZ in the Zaldívar mine to Antofagasta in 2015. CMZ filed an administrative appeal with the Chilean IRS on October 14, 2019. Following initial meetings with CMZ, the Chilean IRS agreed with CMZ’s position and reduced the Assessment to $678 million (including interest and penalties as at December 31, 2021). CMZ will continue discussions with the Chilean IRS, prior to the authority's final decision.
|
|
|
|
|
|
|
|
|
| BARRICK YEAR-END 2021 |
200 |
NOTES TO FINANCIAL STATEMENTS |
On March 17, 2020, Compañía Minera Zaldívar Limitada ("CMZ"), Barrick’s Chilean subsidiary that holds the Company’s interest in the Zaldívar mine, filed a claim against the Chilean IRS at the Tax Court of Coquimbo (the “Tax Court”) to nullify the tax assessment relating to the sale of a 50% interest by CMZ in the Zaldívar mine to Antofagasta in 2015 (the “2015 Tax Assessment”). The Chilean IRS filed their response to CMZ’s claim on April 13, 2020.
On May 22, 2020, the Tax Court held a conciliation hearing which did not result in the resolution of the matter. The Tax Court then granted a joint proposal from CMZ and the Chilean IRS to suspend the legal case until October 2020 while settlement discussions continue.
In April 2020, the Chilean IRS initiated an audit of CMZ for 2016 relating to the same claims included in the 2015 Tax Assessment. This audit resulted in a new tax assessment against CMZ (the “2016 Tax Assessment”). On September 9, 2020, CMZ filed a claim at the Tax Court to nullify the 2016 Tax Assessment and the Chilean IRS filed its response on October 7, 2020.
On September 29, 2020, the Tax Court approved CMZ's request to consolidate its challenges to the 2015 and 2016 Tax Assessments (collectively, the “Zaldívar Tax Assessments”) in a single proceeding. Court proceedings have been delayed as a result of the Covid-19 pandemic, but are expected to commence in March 2022.
The Company believes that the Zaldívar Tax Assessments are without merit and intends to vigorously defend its position. No amounts have been recorded for any potential liability arising from the Zaldívar Tax Assessments as the Company cannot reasonably predict the outcome.
Massawa Senegalese Tax Dispute
The Company received a Notice for Reassessment, dated May 7, 2020, from the Senegalese Tax Authority (“SRA”) asserting capital gains and withholding tax liabilities and penalties of approximately $228 million (as calculated at December 31, 2020) arising from the disposal of the subsidiary that held the Company’s interest in the Massawa project in March 2020. The amount was subsequently reduced to $216 million (as calculated at December 31, 2020) in a Confirmation of Reassessment dated July 13, 2020. The Company has reviewed the Notice for Reassessment and the Confirmation of Reassessment and has concluded that the proposed tax claims are without merit as Massawa’s mining convention with the State of Senegal specifically precludes them. The Company submitted its responses to the SRA on June 5, 2020 and September 2, 2020.
On March 10, 2021, the Company filed an application with the International Chamber of Commerce (“ICC”) in Paris in accordance with the Mining Convention for Gold and Related Substances, dated November 24, 2003, pertaining to the Senegal mining code between the Government of the Republic of Senegal and the Company. On July 16, 2021, the ICC confirmed the appointment of three arbitrators to the tribunal.
On September, 21 2021, the Company and the Government of the Republic of Senegal settled the Massawa tax dispute. On December 16, 2021, the ICC confirmed that both parties had agreed to withdraw from the arbitration and the matter is now settled.
The settlement amount has been paid by the Company and no provision has been retained for this matter.
Kibali Customs Dispute
At the end of January and in early February 2022, Kibali Goldmines SA, which owns and operates the Kibali gold mine in the Democratic Republic of the Congo, received fifteen claims from the Direction Générale des Douanes et Accises (“Customs Authority”) concerning customs duties. The Customs Authority claims that incorrect import duty tariffs have been applied to the importation of certain consumables and equipment for the Kibali gold mine. In addition, they claim that the exemption available to Kibali Goldmines SA, which was granted in relation to the original mining lease, no longer applies. Finally, the Customs Authority claims that a service fee paid on the exportation of gold was paid to the wrong government body. The claims, including substantial penalties and interest, total $339 million.
The Company has examined the Customs Authority claims and concluded that they are without merit, as they seek to challenge established customs practices which have been accepted by the Customs Authority for many years and, where relevant, are in line with ministerial instruction letters. No amounts have been recorded for any potential liability arising from these claims as the Company cannot reasonably predict the outcome. The Company will vigorously defend its position that the Customs Authority claims are unfounded.
|
|
|
|
|
|
|
|
|
| BARRICK YEAR-END 2021 |
201 |
NOTES TO FINANCIAL STATEMENTS |
Corporate Office
Barrick Gold Corporation
161 Bay Street, Suite 3700
Toronto, Ontario M5J 2S1
Canada
Telephone: +1 416 861-9911
Email: investor@barrick.com
Website: www.barrick.com
Shares Listed
GOLD The New York Stock Exchange
ABX The Toronto Stock Exchange
Transfer Agents and Registrars
TSX Trust Company
P.O. Box 700, Postal Station B
Montreal, Quebec H3B 3K3
or
American Stock Transfer & Trust Company, LLC
6201 – 15 Avenue
Brooklyn, New York 11219
Telephone: 1-800-387-0825
Fax: 1-888-249-6189
Email: inquiries@astfinancial.com
Website: www.astfinancial.com
Enquiries
President and Chief Executive Officer
Mark Bristow
+1 647 205 7694
+44 788 071 1386
Senior Executive Vice-President and
Chief Financial Officer
Graham Shuttleworth
+1 647 262 2095
+44 779 771 1338
Investor and Media Relations
Kathy du Plessis
+44 20 7557 7738
barrick@dpapr.com
Cautionary Statement on Forward-Looking Information
Certain information contained or incorporated by reference in this press release, including any information as to our strategy, projects, plans or future financial or operating performance, constitutes “forward-looking statements”. All statements, other than statements of historical fact, are forward-looking statements. The words “goal”, “target”, “plan”, “opportunities”, “guidance”, “project”, “potential”, “possibility”, “future”, “prospective”, “will”, “may”, “could” and similar expressions identify forward-looking statements. In particular, this press release contains forward-looking statements including, without limitation, with respect to: Barrick’s forward-looking production guidance; projected capital, operating and exploration expenditures; Barrick’s 10-year production profile and our pipeline of large growth projects at or near existing operations, including Donlin Gold, Pascua-Lama and Norte Abierto; our ability to convert resources into reserves and replace reserves net of depletion from production; Barrick’s global exploration strategy and planned exploration activities, including in new
prospective territories, at North Leeville and in the Asia-Pacific region; the status of North Mara and Bulyanhulu as potential Tier One mines; the duration of the temporary suspension of operations at Porgera and timeline to recommence operations, including the potential to restart operations in July 2022; steps required prior to the distribution of cash and equivalents held at Kibali in banks in the Democratic Republic of Congo; Barrick’s strategy, plans, targets and goals in respect of environmental and social governance issues, including biodiversity initiatives in our local communities; plans to repurchase Barrick shares pursuant to the share buyback program, which does not obligate the Company to acquire any particular number of common shares and which may be suspended or discontinued at any time at the Company’s discretion; Barrick’s performance dividend policy; and expectations regarding future price assumptions, financial performance and other outlook or guidance.
|
|
|
|
|
|
|
|
|
| BARRICK YEAR-END 2021 |
202 |
|
Forward-looking statements are necessarily based upon a number of estimates and assumptions including material estimates and assumptions related to the factors set forth below that, while considered reasonable by the Company as at the date of this press release in light of management’s experience and perception of current conditions and expected developments, are inherently subject to significant business, economic and competitive uncertainties and contingencies. Known and unknown factors could cause actual results to differ materially from those projected in the forward-looking statements and undue reliance should not be placed on such statements and information. Such factors include, but are not limited to: fluctuations in the spot and forward price of gold, copper or certain other commodities (such as silver, diesel fuel, natural gas and electricity); risks associated with projects in the early stages of evaluation and for which additional engineering and other analysis is required; risks related to the possibility that future exploration results will not be consistent with the Company’s expectations, that quantities or grades of reserves will be diminished, and that resources may not be converted to reserves; risks associated with the fact that certain of the initiatives described in this press release are still in the early stages and may not materialize; changes in mineral production performance, exploitation and exploration successes; risks that exploration data may be incomplete and considerable additional work may be required to complete further evaluation, including but not limited to drilling, engineering and socioeconomic studies and investment; the speculative nature of mineral exploration and development; lack of certainty with respect to foreign legal systems, corruption and other factors that are inconsistent with the rule of law; changes in national and local government legislation, taxation, controls or regulations and/or changes in the administration of laws, policies and practices; expropriation or nationalization of property and political or economic developments in Canada, the United States or other countries in which Barrick does or may carry on business in the future; risks relating to political instability in certain of the jurisdictions in which Barrick operates; timing of receipt of, or failure to comply with, necessary permits and approvals; non-renewal of key licenses by governmental authorities, including non-renewal of Porgera’s special mining lease; failure to comply with environmental and health and safety laws and regulations; contests over title to properties, particularly title to undeveloped properties, or over access to water, power and other required infrastructure; the liability associated with risks and hazards in the mining industry, and the ability to maintain insurance to cover such losses; increased costs and physical risks, including extreme weather events and resource shortages, related to climate change; damage to the Company’s reputation due to the actual or perceived occurrence of any number of events, including negative publicity with respect to the Company’s handling of environmental matters or dealings with community groups, whether true or not; risks related to operations near communities that may regard Barrick’s operations as being detrimental to them; litigation and legal and administrative proceedings; operating or technical difficulties in connection with mining or development activities, including geotechnical challenges, tailings dam and storage facilities failures, and disruptions in the maintenance or provision of required infrastructure and information technology systems;
increased costs, delays, suspensions and technical challenges associated with the construction of capital projects; risks associated with working with partners in jointly controlled assets; risks related to disruption of supply routes which may cause delays in construction and mining activities; risk of loss due to acts of war, terrorism, sabotage and civil disturbances; risks associated with artisanal and illegal mining; risks associated with Barrick’s infrastructure, information technology systems and the implementation of Barrick’s technological initiatives; the impact of global liquidity and credit availability on the timing of cash flows and the values of assets and liabilities based on projected future cash flows; the impact of inflation; adverse changes in our credit ratings; fluctuations in the currency markets; changes in U.S. dollar interest rates; risks arising from holding derivative instruments (such as credit risk, market liquidity risk and mark-to-market risk); risks related to the demands placed on the Company’s management, the ability of management to implement its business strategy and enhanced political risk in certain jurisdictions; uncertainty whether some or all of Barrick's targeted investments and projects will meet the Company’s capital allocation objectives and internal hurdle rate; whether benefits expected from recent transactions being realized; business opportunities that may be presented to, or pursued by, the Company; our ability to successfully integrate acquisitions or complete divestitures; risks related to competition in the mining industry; employee relations including loss of key employees; availability and increased costs associated with mining inputs and labor; risks associated with diseases, epidemics and pandemics, including the effects and potential effects of the global Covid-19 pandemic; risks related to the failure of internal controls; and risks related to the impairment of the Company’s goodwill and assets. Barrick also cautions that its 2022 guidance may be impacted by the unprecedented business and social disruption caused by the spread of Covid-19. In addition, there are risks and hazards associated with the business of mineral exploration, development and mining, including environmental hazards, industrial accidents, unusual or unexpected formations, pressures, cave-ins, flooding and gold bullion, copper cathode or gold or copper concentrate losses (and the risk of inadequate insurance, or inability to obtain insurance, to cover these risks).
Many of these uncertainties and contingencies can affect our actual results and could cause actual results to differ materially from those expressed or implied in any forward-looking statements made by, or on behalf of, us. Readers are cautioned that forward-looking statements are not guarantees of future performance. All of the forward-looking statements made in this press release are qualified by these cautionary statements. Specific reference is made to the most recent Form 40-F/Annual Information Form on file with the SEC and Canadian provincial securities regulatory authorities for a more detailed discussion of some of the factors underlying forward-looking statements and the risks that may affect Barrick’s ability to achieve the expectations set forth in the forward-looking statements contained in this press release.
We disclaim any intention or obligation to update or revise any forward-looking statements whether as a result of new information, future events or otherwise, except as required by applicable law.
|
|
|
|
|
|
|
|
|
| BARRICK YEAR-END 2021 |
203 |
|