UNITED STATES
SECURITIES AND EXCHANGE COMMISSION
WASHINGTON, D.C. 20549
Form 6-K
REPORT OF FOREIGN PRIVATE ISSUER
PURSUANT TO RULE 13a-16 OR 15d-16 UNDER THE
SECURITIES EXCHANGE ACT OF 1934
For the month of November 2020
Commission File Number: 1-9059
BARRICK GOLD CORPORATION
(Registrants name)
Brookfield Place, TD Canada Trust Tower, Suite 3700
161 Bay Street, P.O. Box 212
Toronto, Ontario M5J 2S1 Canada
(Address of principal executive offices)
Indicate by check mark whether the registrant files or will file annual reports under cover of Form 20-F or Form 40-F.
Form 20-F ☐ Form 40-F ☒
Indicate by check mark if the registrant is submitting the Form 6-K in paper as permitted by Regulation S-T Rule 101(b)(1): ☐
Indicate by check mark if the registrant is submitting the Form 6-K in paper as permitted by Regulation S-T Rule 101(b)(7): ☐
INCORPORATION BY REFERENCE
Exhibit 99.1 to this report on Form 6-K is furnished, not filed, and will not be incorporated by reference into any registration statement.
Exhibit 99.2 to this report on Form 6-K is hereby incorporated by reference into the Registration Statements on Form F-3 (File No. 333-206417), Form S-8 (File No. 333-224560) and Form F-10 (File No. 333-230235).
SIGNATURES
Pursuant to the requirements of the Securities Exchange Act of 1934, the registrant has duly caused this report to be signed on its behalf by the undersigned, thereunto duly authorized.
BARRICK GOLD CORPORATION | ||||||
Date: November 6, 2020 | By: /s/ Richie Haddock | |||||
Name: Richie Haddock | ||||||
Title: General Counsel |
EXHIBIT INDEX
Exhibits |
Description | |
99.1 | 2020 Q3 Report Press Release dated November 5, 2020 | |
99.2 | Barrick Gold Corporations Comparative Unaudited Financial Statements prepared in accordance with International Financial Reporting Standards and the notes thereto for the three and nine months ended September 30, 2020 and Managements Discussion and Analysis for the same periods |
Exhibit 99.1
ANOTHER STRONG QUARTER POSITIONS BARRICK
TO DELIVER ON ANNUAL PRODUCTION GUIDANCE
ALL AMOUNTS EXPRESSED IN US DOLLARS
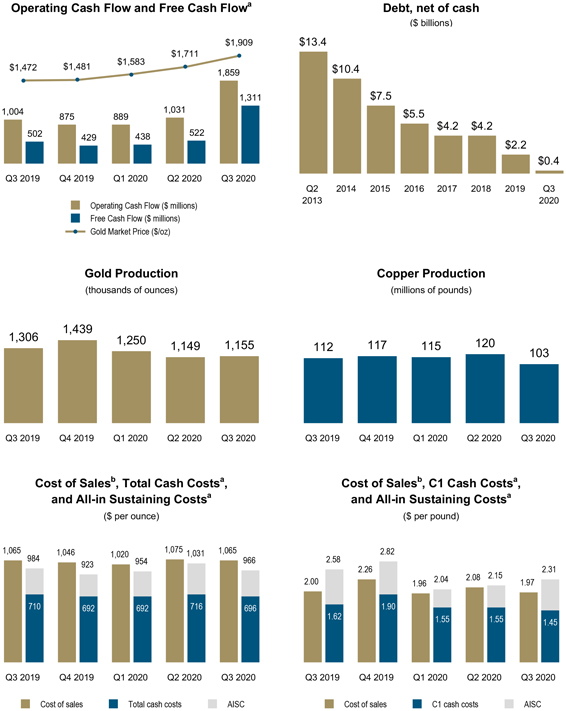
Toronto, November 5, 2020 Capturing the benefit of higher gold prices through agile management and operational efficiency, Barrick Gold Corporation (NYSE:GOLD)(TSX:ABX) increased its operating cash flow by 80% quarter-on-quarter to $1.9 billion and free cash flow1 by 151% to $1.3 billion in the third quarter of 2020 a record level of quarterly free cash flow for the company. Net earnings per share was 50 cents, while adjusted net earnings per share2 was 78% higher than the prior quarter at 41 cents. Debt net of cash was reduced by a further 71% to $417 million, compared to $1.4 billion in the prior quarter, and the quarterly dividend was increased again, the third time in the past year, rising by 12.5% to 9 cents per share.
President and chief executive Mark Bristow said that two quarters into the Covid-19 pandemic, it was clear how effectively Barrick had been dealing with the impact of the virus on its business, its people and its communities.
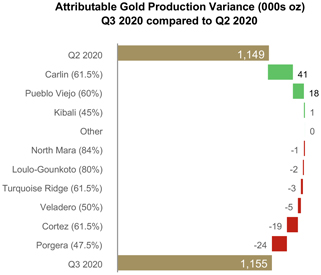
As todays results show, in the face of unprecedented challenges we have succeeded in beating our earnings consensus, reinforcing our 10-year plan and capitalizing on the gold price to maintain an industry-leading balance sheet. Our year-to-date gold production of 3.6 million ounces keeps Barrick on track to achieve our guidance of between 4.6 and 5.0 million ounces for the year, he said.
CONTINUED ON PAGE 3 |
![]() |
Key Performance Indicators
Financial and Operating Highlights
BARRICK THIRD QUARTER 2020 | 2 | PRESS RELEASE |
BARRICK DECLARES INCREASED DIVIDEND
Barricks Board of Directors has declared a dividend for the third quarter of 2020 of $0.09 per share, a 12.5% increase on the previous quarters dividend, payable on December 15, 2020, to shareholders of record at the close of business on November 30, 2020.12
ANNE KABAGAMBE APPOINTED TO BARRICKS BOARD
Barrick has appointed Anne Kabagambe to its Board of Directors as an independent director.
BARRICK THIRD QUARTER 2020 | 3 | PRESS RELEASE |
FINDING AND DEVELOPING THE TALENT
TO TAKE BARRICK INTO THE FUTURE
A modern mining business needs people who share its vision and its values, and are entrepreneurial, agile, alive to technological and societal changes, and profit-orientated. That is why, in an industry traditionally dominated by aging males, Barrick is building an employee corps with its eye on the future.
BARRICK THIRD QUARTER 2020 | 4 | PRESS RELEASE |
WORLD-CLASS GEOLOGISTS
LEAD BARRICKS GLOBAL DRIVE
Since the Barrick-Randgold merger reintroduced geology as the foundation of the business, the company has launched a new exploration strategy that is being implemented by rebuilt and reinvigorated exploration teams in each of its regions.
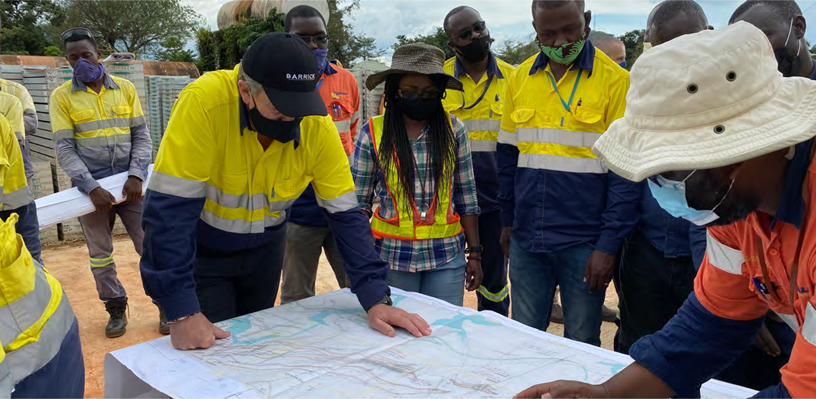
Mark Bristow visits geologists at the Kibali mine in DRC.
BARRICK THIRD QUARTER 2020 | 5 | PRESS RELEASE |
SAP IMPLEMENTATION IN NEVADA
MARKS AN IMPORTANT MILESTONE
IN BARRICKS DIGITAL TRANSFORMATION
Barricks new transactional system, SAP S4 HANA, has gone live at Nevada Gold Mines and will be rolled out across the entire group in the course of 2021.
GLOBAL CLOSURE STRATEGY:
PLAN FOR THE END BEFORE THE BEGINNING
The mining industry has traditionally dealt with the issue of mine closures by kicking the can down the road: delaying the inevitable for as long as possible, usually through a series of compliance adjustments.
BARRICK THIRD QUARTER 2020 | 6 | PRESS RELEASE |
MANAGING BY WALKING ABOUT
Mines cannot be managed effectively by remote control. Thats why after last years merger, Barricks head office was converted into a much smaller corporate hub providing specialized services while operational management was transferred to the mines.
Mark Bristow (left) and North America chief operating officer Catherine Raw (centre), visit the Hemlo operation in Canada.
BARRICK THIRD QUARTER 2020 | 7 | PRESS RELEASE |
PIONEERING KIBALI
CONTINUES TO POINT THE WAY
The Kibali mine is on track to deliver at the upper end of its 2020 guidance, says president and chief executive Mark Bristow.
STRONG PARTNERSHIPS IN MALI
SUPPORT ROBUST PRODUCTION PERFORMANCE
The Loulo-Gounkoto complex remains on track to meet the upper end of its 2020 guidance in the face of multiple challenges including a military coup in Mali.
BARRICK THIRD QUARTER 2020 | 8 | PRESS RELEASE |
Appendix 1
2020 Operating and Capital Expenditure Guidance
GOLD PRODUCTION AND COSTS | ||||||||
2020 forecast | 2020 forecast cost | 2020 forecast total | 2020 forecast all-in | |||||
attributable production (000s oz) |
of sales14 ($/oz) | cash costs8 ($/oz) | sustaining costs8 ($/oz) | |||||
Carlin (61.5%)15 |
1,000 - 1,050 | 920 - 970 | 760 - 810 | 1,000 - 1,050 | ||||
Cortez (61.5%) |
450 - 480 | 980 - 1,030 | 640 - 690 | 910 - 960 | ||||
Turquoise Ridge (61.5%) |
430 - 460 | 900 - 950 | 540 - 590 | 690 - 740 | ||||
Phoenix (61.5%) |
100 - 120 | 1,850 - 1,900 | 700 - 750 | 920 - 970 | ||||
Long Canyon (61.5%) |
130 - 150 | 910 - 960 | 240 - 290 | 450 - 500 | ||||
Nevada Gold Mines (61.5%) |
2,100 - 2,250 | 970 - 1,020 | 660 - 710 | 880 - 930 | ||||
Hemlo |
200 - 220 | 960 - 1,010 | 800 - 850 | 1,200 - 1,250 | ||||
North America | 2,300 - 2,450 | 970 - 1,020 | 660 - 710 | 900 - 950 | ||||
Pueblo Viejo (60%) |
530 - 580 | 840 - 890 | 520 - 570 | 720 - 770 | ||||
Veladero (50%) |
240 - 270 | 1,220 - 1,270 | 670 - 720 | 1,250 - 1,300 | ||||
Porgera (47.5%)16 |
||||||||
Latin America & Asia Pacific | 800 - 900 | 930 - 980 | 610 - 660 | 890 - 940 | ||||
Loulo-Gounkoto (80%) |
500 - 540 | 1,050 - 1,100 | 620 - 670 | 970 - 1,020 | ||||
Kibali (45%) |
340 - 370 | 1,030 - 1,080 | 600 - 650 | 790 - 840 | ||||
North Mara (84%)17 |
240 - 270 | 750 - 800 | 570 - 620 | 830 - 880 | ||||
Tongon (89.7%) |
240 - 260 | 1,390 - 1,440 | 680 - 730 | 740 - 790 | ||||
Bulyanhulu (84%)17 |
30 - 50 | 1,210 - 1,260 | 790 - 840 | 1,110 - 1,160 | ||||
Buzwagi (84%)17 |
80 - 100 | 850 - 900 | 820 - 870 | 850 - 900 | ||||
Africa & Middle East |
1,450 - 1,600 | 1,040 - 1,090 | 640 - 690 | 870 - 920 | ||||
Total Attributable to Barrick18,19,20 |
4,600 - 5,000 | 980 - 1,030 | 650 - 700 | 920 - 970 | ||||
COPPER PRODUCTION AND COSTS | ||||||||
2020 forecast attributable production (Mlbs) |
2020 forecast cost of sales14 ($/lb) |
2020 forecast C1 cash costs21 ($/lb) |
2020 forecast
all-in sustaining costs21 ($/lb) | |||||
Lumwana |
250 - 280 | 2.20 - 2.40 | 1.50 - 1.70 | 2.30 - 2.60 | ||||
Zaldívar (50%) |
120 - 135 | 2.40 - 2.70 | 1.65 - 1.85 | 2.30 - 2.60 | ||||
Jabal Sayid (50%) |
60 - 70 | 1.75 - 2.00 | 1.40 - 1.60 | 1.50 - 1.70 | ||||
Total Copper20 |
440 - 500 | 2.10 - 2.40 | 1.50 - 1.80 | 2.20 - 2.50 |
ATTRIBUTABLE CAPITAL EXPENDITURES | ||||
($ millions) | ||||
Attributable minesite sustaining |
1,300 - 1,500 | |||
Attributable project |
300 - 400 | |||
Total attributable capital expenditures22 | 1,600 - 1,900 |
2020 Outlook Assumptions and Economic Sensitivity Analysis23
2020 Guidance Assumption |
Hypothetical Change | Impact on EBITDA (millions)24 |
Impact on TCC/C1 Cash Costs and AISC8,21 | |||||
Gold price sensitivity25 | $1,350/oz | +$100/oz | +$653 | +$4/oz | ||||
$1,350/oz | -$100/oz | -$650 | -$4/oz | |||||
Copper price sensitivity | $2.75/lb | +/-$0.50/lb | +/-$124 | +/-$0.02/lb |
BARRICK THIRD QUARTER 2020 | 9 | PRESS RELEASE |
Appendix 2
Production and Cost Summary - Gold
For the three months ended | ||||||||||||||||||||||||
9/30/20 | 6/30/20 | % Change | 9/30/19 | % Change | ||||||||||||||||||||
Nevada Gold Mines LLC (61.5%)a | ||||||||||||||||||||||||
Gold produced (000s oz attributable basis) |
538 | 521 | 3 % | 535 | 1 % | |||||||||||||||||||
Gold produced (000s oz 100% basis) |
875 | 847 | 3 % | 870 | 1 % | |||||||||||||||||||
Cost of sales ($/oz) |
1,060 | 1,055 | 0 % | 1,027 | 3 % | |||||||||||||||||||
Total cash costs ($/oz)b |
723 | 728 | (1)% | 693 | 4 % | |||||||||||||||||||
All-in sustaining costs ($/oz)b |
956 | 985 | (3)% | 946 | 1 % | |||||||||||||||||||
Carlin (61.5%)c |
||||||||||||||||||||||||
Gold produced (000s oz attributable basis) |
276 | 235 | 17 % | 278 | (1)% | |||||||||||||||||||
Gold produced (000s oz 100% basis) |
448 | 382 | 17 % | 452 | (1)% | |||||||||||||||||||
Cost of sales ($/oz) |
985 | 1,037 | (5)% | 1,007 | (2)% | |||||||||||||||||||
Total cash costs ($/oz)b |
800 | 850 | (6)% | 775 | 3 % | |||||||||||||||||||
All-in sustaining costs ($/oz)b |
1,036 | 1,130 | (8)% | 1,014 | 2 % | |||||||||||||||||||
Cortez (61.5%)d |
||||||||||||||||||||||||
Gold produced (000s oz attributable basis) |
113 | 132 | (14)% | 126 | (10)% | |||||||||||||||||||
Gold produced (000s oz 100% basis) |
184 | 215 | (14)% | 205 | (10)% | |||||||||||||||||||
Cost of sales ($/oz) |
1,060 | 870 | 22 % | 829 | 28 % | |||||||||||||||||||
Total cash costs ($/oz)b |
763 | 613 | 24 % | 570 | 34 % | |||||||||||||||||||
All-in sustaining costs ($/oz)b |
1,133 | 950 | 19 % | 772 | 47 % | |||||||||||||||||||
Turquoise Ridge (61.5%)e |
||||||||||||||||||||||||
Gold produced (000s oz attributable basis) |
76 | 79 | (4)% | 82 | (7)% | |||||||||||||||||||
Gold produced (000s oz 100% basis) |
124 | 128 | (4)% | 133 | (7)% | |||||||||||||||||||
Cost of sales ($/oz) |
1,097 | 1,073 | 2 % | 1,077 | 2 % | |||||||||||||||||||
Total cash costs ($/oz)b |
745 | 753 | (1)% | 622 | 20 % | |||||||||||||||||||
All-in sustaining costs ($/oz)b |
805 | 829 | (3)% | 840 | (4)% | |||||||||||||||||||
Phoenix (61.5%)f |
||||||||||||||||||||||||
Gold produced (000s oz attributable basis) |
30 | 35 | (14)% | 25 | 20 % | |||||||||||||||||||
Gold produced (000s oz 100% basis) |
49 | 57 | (14)% | 41 | 20 % | |||||||||||||||||||
Cost of sales ($/oz) |
1,773 | 1,726 | 3 % | 2,186 | (19)% | |||||||||||||||||||
Total cash costs ($/oz)b |
520 | 725 | (28)% | 1,010 | (49)% | |||||||||||||||||||
All-in sustaining costs ($/oz)b |
659 | 957 | (31)% | 1,622 | (59)% | |||||||||||||||||||
Long Canyon (61.5%)f |
||||||||||||||||||||||||
Gold produced (000s oz attributable basis) |
43 | 40 | 8 % | 24 | 79 % | |||||||||||||||||||
Gold produced (000s oz 100% basis) |
70 | 65 | 8 % | 39 | 79 % | |||||||||||||||||||
Cost of sales ($/oz) |
877 | 1,009 | (13)% | 1,170 | (25)% | |||||||||||||||||||
Total cash costs ($/oz)b |
212 | 308 | (31)% | 353 | (40)% | |||||||||||||||||||
All-in sustaining costs ($/oz)b |
384 | 430 | (11)% | 714 | (46)% | |||||||||||||||||||
Pueblo Viejo (60%) |
||||||||||||||||||||||||
Gold produced (000s oz attributable basis) |
129 | 111 | 16 % | 139 | (7)% | |||||||||||||||||||
Gold produced (000s oz 100% basis) |
215 | 185 | 16 % | 232 | (7)% | |||||||||||||||||||
Cost of sales ($/oz) |
791 | 935 | (15)% | 807 | (2)% | |||||||||||||||||||
Total cash costs ($/oz)b |
450 | 579 | (22)% | 504 | (11)% | |||||||||||||||||||
All-in sustaining costs ($/oz)b |
609 | 720 | (15)% | 631 | (3)% |
BARRICK THIRD QUARTER 2020 | 10 | PRESS RELEASE |
Production and Cost Summary - Gold (continued)
For the three months ended | ||||||||||||||||||||||||
9/30/20 | 6/30/20 | % Change | 9/30/19 | % Change | ||||||||||||||||||||
Loulo-Gounkoto (80%) |
||||||||||||||||||||||||
Gold produced (000s oz attributable basis) |
139 | 141 | (1)% | 153 | (9)% | |||||||||||||||||||
Gold produced (000s oz 100% basis) |
174 | 176 | (1)% | 191 | (9)% | |||||||||||||||||||
Cost of sales ($/oz) |
1,088 | 1,012 | 8 % | 1,018 | 7 % | |||||||||||||||||||
Total cash costs ($/oz)b |
682 | 639 | 7 % | 630 | 8 % | |||||||||||||||||||
All-in sustaining costs ($/oz)b |
1,161 | 1,030 | 13 % | 966 | 20 % | |||||||||||||||||||
Kibali (45%) |
||||||||||||||||||||||||
Gold produced (000s oz attributable basis) |
91 | 90 | 1 % | 91 | 0 % | |||||||||||||||||||
Gold produced (000s oz 100% basis) |
203 | 201 | 1 % | 202 | 0 % | |||||||||||||||||||
Cost of sales ($/oz) |
1,088 | 1,067 | 2 % | 1,187 | (8)% | |||||||||||||||||||
Total cash costs ($/oz)b |
617 | 617 | 0 % | 554 | 11 % | |||||||||||||||||||
All-in sustaining costs ($/oz)b |
817 | 739 | 11 % | 703 | 16 % | |||||||||||||||||||
Veladero (50%) |
||||||||||||||||||||||||
Gold produced (000s oz attributable basis) |
44 | 49 | (10)% | 58 | (24)% | |||||||||||||||||||
Gold produced (000s oz 100% basis) |
89 | 98 | (10)% | 116 | (24)% | |||||||||||||||||||
Cost of sales ($/oz) |
1,136 | 1,228 | (7)% | 1,243 | (9)% | |||||||||||||||||||
Total cash costs ($/oz)b |
708 | 801 | (12)% | 773 | (8)% | |||||||||||||||||||
All-in sustaining costs ($/oz)b |
1,159 | 1,383 | (16)% | 1,142 | 1 % | |||||||||||||||||||
Porgera (47.5%)g |
||||||||||||||||||||||||
Gold produced (000s oz attributable basis) |
| 24 | 75 | |||||||||||||||||||||
Gold produced (000s oz 100% basis) |
| 51 | 158 | |||||||||||||||||||||
Cost of sales ($/oz) |
| 1,141 | 1,024 | |||||||||||||||||||||
Total cash costs ($/oz)b |
| 875 | 868 | |||||||||||||||||||||
All-in sustaining costs ($/oz)b |
| 1,046 | 1,053 | |||||||||||||||||||||
Tongon (89.7%) |
||||||||||||||||||||||||
Gold produced (000s oz attributable basis) |
64 | 64 | 0 % | 62 | 3 % | |||||||||||||||||||
Gold produced (000s oz 100% basis) |
71 | 71 | 0 % | 69 | 3 % | |||||||||||||||||||
Cost of sales ($/oz) |
1,329 | 1,275 | 4 % | 1,396 | (5)% | |||||||||||||||||||
Total cash costs ($/oz)b |
731 | 688 | 6 % | 793 | (8)% | |||||||||||||||||||
All-in sustaining costs ($/oz)b |
777 | 745 | 4 % | 869 | (11)% | |||||||||||||||||||
Hemlo |
||||||||||||||||||||||||
Gold produced (000s oz) |
55 | 54 | 2 % | 49 | 12 % | |||||||||||||||||||
Cost of sales ($/oz) |
1,257 | 1,268 | (1)% | 1,083 | 16 % | |||||||||||||||||||
Total cash costs ($/oz)b |
1,099 | 1,080 | 2 % | 953 | 15 % | |||||||||||||||||||
All-in sustaining costs ($/oz)b |
1,497 | 1,456 | 3 % | 1,280 | 17 % | |||||||||||||||||||
North Marah |
||||||||||||||||||||||||
Gold produced (000s oz attributable basis) |
67 | 68 | (1)% | 29 | 131 % | |||||||||||||||||||
Gold produced (000s oz 100% basis) |
80 | 81 | (1)% | 45 | 78 % | |||||||||||||||||||
Cost of sales ($/oz) |
903 | 1,040 | (13)% | 907 | 0 % | |||||||||||||||||||
Total cash costs ($/oz)b |
649 | 724 | (10)% | 603 | 8 % | |||||||||||||||||||
All-in sustaining costs ($/oz)b |
758 | 1,166 | (35)% | 850 | (11)% | |||||||||||||||||||
Buzwagih |
||||||||||||||||||||||||
Gold produced (000s oz attributable basis) |
21 | 20 | 5 % | 18 | 17 % | |||||||||||||||||||
Gold produced (000s oz 100% basis) |
25 | 24 | 5 % | 28 | (11)% | |||||||||||||||||||
Cost of sales ($/oz) |
907 | 909 | 0 % | 1,292 | (30)% | |||||||||||||||||||
Total cash costs ($/oz)b |
687 | 751 | (9)% | 1,202 | (43)% | |||||||||||||||||||
All-in sustaining costs ($/oz)b |
693 | 770 | (10)% | 1,220 | (43)% |
BARRICK THIRD QUARTER 2020 | 11 | PRESS RELEASE |
Production and Cost Summary - Gold (continued)
For the three months ended | ||||||||||||||||||||||||
9/30/20 | 6/30/20 | % Change | 9/30/19 | % Change | ||||||||||||||||||||
Bulyanhuluh |
||||||||||||||||||||||||
Gold produced (000s oz attributable basis) |
7 | 7 | 0 % | 6 | 17 % | |||||||||||||||||||
Gold produced (000s oz 100% basis) |
8 | 8 | 0 % | 9 | (11)% | |||||||||||||||||||
Cost of sales ($/oz) |
1,502 | 1,658 | (9)% | 1,288 | 17 % | |||||||||||||||||||
Total cash costs ($/oz)b |
874 | 950 | (8)% | 729 | 20 % | |||||||||||||||||||
All-in sustaining costs ($/oz)b |
913 | 1,014 | (10)% | 769 | 19 % | |||||||||||||||||||
Kalgoorlie (50%)i |
||||||||||||||||||||||||
Gold produced (000s oz attributable basis) |
58 | (100)% | ||||||||||||||||||||||
Gold produced (000s oz 100% basis) |
116 | (100)% | ||||||||||||||||||||||
Cost of sales ($/oz) |
1,037 | (100)% | ||||||||||||||||||||||
Total cash costs ($/oz)b |
856 | (100)% | ||||||||||||||||||||||
All-in sustaining costs ($/oz)b |
1,170 | (100)% | ||||||||||||||||||||||
Total Attributable to Barrickj,i |
||||||||||||||||||||||||
Gold produced (000s oz) |
1,155 | 1,149 | 1 % | 1,306 | (12)% | |||||||||||||||||||
Cost of sales ($/oz)k |
1,065 | 1,075 | (1)% | 1,065 | 0 % | |||||||||||||||||||
Total cash costs ($/oz)b |
696 | 716 | (3)% | 710 | (2)% | |||||||||||||||||||
All-in sustaining costs ($/oz)b |
966 | 1,031 | (6)% | 984 | (2)% |
a. | Represents the combined results of Cortez, Goldstrike (including our 60% share of South Arturo) and our 75% interest in Turquoise Ridge until June 30, 2019. Commencing July 1, 2019, the date Nevada Gold Mines was established, the results represent our 61.5% interest in Cortez, Carlin (including Goldstrike and 60% of South Arturo), Turquoise Ridge (including Twin Creeks), Phoenix and Long Canyon. |
b. | These are non-GAAP financial performance measures with no standardized meaning under IFRS and therefore may not be comparable to similar measures presented by other issuers. For further information and a detailed reconciliation of each non-GAAP measure used to the most directly comparable IFRS measure, please see pages 82 to 106 of our third quarter MD&A. |
c. | On July 1, 2019, Barricks Goldstrike and Newmonts Carlin were contributed to Nevada Gold Mines and are now referred to as Carlin. As a result, the amounts presented represent Goldstrike on a 100% basis (including our 60% share of South Arturo) up until June 30, 2019, and the combined results of Carlin and Goldstrike (including NGMs 60% share of South Arturo) on a 61.5% basis thereafter. |
d. | On July 1, 2019, Cortez was contributed to Nevada Gold Mines, a joint venture with Newmont. As a result, the amounts presented are on an 100% basis up until June 30, 2019, and on a 61.5% basis thereafter. |
e. | Barrick owned 75% of Turquoise Ridge through to the end of the second quarter of 2019, with our joint venture partner, Newmont, owning the remaining 25%. Turquoise Ridge was proportionately consolidated on the basis that the joint venture partners that have joint control have rights to the assets and obligations for the liabilities relating to the arrangement. The figures presented in this table are based on our 75% interest in Turquoise Ridge until June 30, 2019. On July 1, 2019, Barricks 75% interest in Turquoise Ridge as well as Newmonts Twin Creeks and 25% interest in Turquoise Ridge were contributed to Nevada Gold Mines. Starting July 1, 2019, the results represent our 61.5% share of Turquoise Ridge and Twin Creeks, now referred to as Turquoise Ridge. |
f. | A 61.5% interest in these sites was acquired as a result of the formation of Nevada Gold Mines on July 1, 2019. |
g. | As Porgera was placed on care and maintenance on April 25, 2020, no operating data or per ounce data is provided. |
h. | Formerly part of Acacia Mining plc. On September 17, 2019, Barrick acquired all of the shares of Acacia it did not own. Operating results are included at 100% from October 1, 2019 to December 31, 2019 (notwithstanding the completion of the Acacia transaction on September 17, 2019, we consolidated our interest in Acacia and recorded a non-controlling interest of 36.1% in the income statement for the entirety of the third quarter of 2019 as a matter of convenience), and on an 84% basis thereafter as the GoTs 16% free-carried interest was made effective from January 1, 2020. |
i. | On November 28, 2019, we completed the sale of our 50% interest in Kalgoorlie in Western Australia to Saracen Mineral Holdings Limited for total cash consideration of $750 million. Accordingly, these represent our 50% interest until November 28, 2019. |
j. | Excludes Pierina; Lagunas Norte starting in the fourth quarter of 2019, and Golden Sunlight and Morila (40%) starting in the third quarter of 2019 which are producing incidental ounces as they reach the end of their mine lives. |
k. | Cost of sales per ounce (Barricks share) is calculated as gold cost of sales on an attributable basis (excluding sites in care and maintenance) divided by gold attributable ounces sold. |
BARRICK THIRD QUARTER 2020 | 12 | PRESS RELEASE |
Production and Cost Summary - Copper
For the three months ended | ||||||||||||||||||||
9/30/20 | 6/30/20 | % Change | 9/30/19 | % Change | ||||||||||||||||
Lumwana |
||||||||||||||||||||
Copper production (Mlbs) |
62 | 72 | (14)% | 65 | (5)% | |||||||||||||||
Cost of sales ($/lb) |
2.06 | 2.06 | 0 % | 2.04 | 1 % | |||||||||||||||
C1 cash costs ($/lb)a |
1.49 | 1.55 | (4)% | 1.83 | (19)% | |||||||||||||||
All-in sustaining costs ($/lb)a |
2.58 | 2.27 | 14 % | 3.66 | (30)% | |||||||||||||||
Zaldívar (50%) |
||||||||||||||||||||
Copper production (Mlbs attributable basis) |
24 | 28 | (14)% | 32 | (25)% | |||||||||||||||
Copper production (Mlbs 100% basis) |
48 | 56 | (14)% | 64 | (25)% | |||||||||||||||
Cost of sales ($/lb) |
2.20 | 2.52 | (13)% | 2.18 | 1 % | |||||||||||||||
C1 cash costs ($/lb)a |
1.64 | 1.79 | (8)% | 1.55 | 6 % | |||||||||||||||
All-in sustaining costs ($/lb)a |
2.27 | 2.09 | 9 % | 1.91 | 19 % | |||||||||||||||
Jabal Sayid (50%) |
||||||||||||||||||||
Copper production (Mlbs attributable basis) |
17 | 20 | (15)% | 15 | 13 % | |||||||||||||||
Copper production (Mlbs 100% basis) |
34 | 40 | (15)% | 30 | 13 % | |||||||||||||||
Cost of sales ($/lb) |
1.43 | 1.41 | 1 % | 1.63 | (12)% | |||||||||||||||
C1 cash costs ($/lb)a |
1.14 | 1.14 | 0 % | 1.42 | (20)% | |||||||||||||||
All-in sustaining costs ($/lb)a |
1.17 | 1.41 | (17)% | 1.65 | (29)% | |||||||||||||||
Total Copper |
||||||||||||||||||||
Copper production (Mlbs attributable basis) |
103 | 120 | (14)% | 112 | (8)% | |||||||||||||||
Cost of sales ($/lb)b |
1.97 | 2.08 | (5)% | 2.00 | (2)% | |||||||||||||||
C1 cash costs ($/lb)a |
1.45 | 1.55 | (6)% | 1.62 | (10)% | |||||||||||||||
All-in sustaining costs ($/lb)a |
2.31 | 2.15 | 7 % | 2.58 | (10)% |
a. | These are non-GAAP financial performance measures with no standardized meaning under IFRS and therefore may not be comparable to similar measures presented by other issuers. For further information and a detailed reconciliation of each non-GAAP measure used to the most directly comparable IFRS measure, please see pages 82 to 106 of our third quarter MD&A. |
b. | Cost of sales per pound (Barricks share) is calculated as copper cost of sales plus our equity share of cost of sales attributable to Zaldívar and Jabal Sayid divided by copper attributable pounds sold. |
BARRICK THIRD QUARTER 2020 | 13 | PRESS RELEASE |
Technical Information
The scientific and technical information contained in this MD&A has been reviewed and approved by Steven Yopps, MMSA, Manager of Growth Projects, Nevada Gold Mines; Craig Fiddes, SME-RM, Manager Resource Modeling, Nevada Gold Mines; Chad Yuhasz, P.Geo, Mineral Resource Manager, Latin America and Asia Pacific; Simon Bottoms, CGeol, MGeol, FGS, FAusIMM, Mineral Resources Manager: Africa and Middle East; Rodney Quick, MSc, Pr. Sci.Nat, Mineral Resource Management and Evaluation Executive; John Steele, CIM, Metallurgy, Engineering and Capital Projects Executive; and Rob Krcmarov, FAusIMM, Executive Vice President, Exploration and Growth each a Qualified Person as defined in National Instrument 43-101 Standards of Disclosure for Mineral Projects.
Endnotes
Endnote 1
Free cash flow is a non-GAAP financial performance measure that deducts capital expenditures from net cash provided by operating activities. Barrick believes this to be a useful indicator of our ability to operate without reliance on additional borrowing or usage of existing cash. Free cash flow is intended to provide additional information only and does not have any standardized meaning under IFRS and may not be comparable to similar measures of performance presented by other companies. Free cash flow should not be considered in isolation or as a substitute for measures of performance prepared in accordance with IFRS. Further details on this non-GAAP measure are provided in the MD&A accompanying Barricks financial statements filed from time to time on SEDAR at www.sedar.com and on EDGAR at www.sec.gov.
Reconciliation of Net Cash Provided by Operating Activities to Free Cash Flow
($ millions) | For the three months ended | For the nine months ended | ||||||||||||||||||
9/30/20 | 6/30/20 | 9/30/19 | 9/30/20 | 9/30/19 | ||||||||||||||||
Net cash provided by operating activities |
1,859 | 1,031 | 1,004 | 3,779 | 1,958 | |||||||||||||||
Capital expenditures |
(548 | ) | (509 | ) | (502 | ) | (1,508 | ) | (1,255 | ) | ||||||||||
Free cash flow |
1,311 | 522 | 502 | 2,271 | 703 |
Endnote 2
Adjusted net earnings and adjusted net earnings per share are non-GAAP financial performance measures. Adjusted net earnings excludes the following from net earnings: certain impairment charges (reversals) related to intangibles, goodwill, property, plant and equipment, and investments; gains (losses) and other one-time costs relating to acquisitions or dispositions; foreign currency translation gains (losses); significant tax adjustments not related to current period earnings; and the tax effect and non-controlling interest of these items. The Company uses this measure internally to evaluate our underlying operating performance for the reporting periods presented and to assist with the planning and forecasting of future operating results. Barrick believes that adjusted net earnings is a useful measure of our performance because these adjusting items do not reflect the underlying operating performance of our core mining business and are not necessarily indicative of future operating results. Adjusted net earnings and adjusted net earnings per share are intended to provide additional information only and do not have any standardized meaning under IFRS and may not be comparable to similar measures of performance presented by other companies. They should not be considered in isolation or as a substitute for measures of performance prepared in accordance with IFRS. Further details on these non-GAAP measures are provided in the MD&A accompanying Barricks financial statements filed from time to time on SEDAR at www.sedar.com and on EDGAR at www.sec.gov.
Reconciliation of Net Earnings to Net Earnings per Share, Adjusted Net Earnings and Adjusted Net Earnings per Share
($ millions, except per share amounts in dollars) | For the three months ended | For the nine months ended | ||||||||||||||||||
9/30/20 | 6/30/20 | 9/30/19 | 9/30/20 | 9/30/19 | ||||||||||||||||
Net earnings attributable to equity holders of the Company |
882 | 357 | 2,277 | 1,639 | 2,582 | |||||||||||||||
Impairment charges (reversals) related to intangibles, goodwill, property, plant and equipment, and investmentsa |
4 | 23 | (872 | ) | (309 | ) | (857 | ) | ||||||||||||
Acquisition/disposition (gains) lossesb |
(2 | ) | 8 | (1,901 | ) | (54 | ) | (1,913 | ) | |||||||||||
Loss (gain) on currency translation |
16 | 2 | 40 | 34 | 56 | |||||||||||||||
Significant tax adjustmentsc |
(66 | ) | (7 | ) | 35 | (117 | ) | (40 | ) | |||||||||||
Other expense adjustmentsd |
(90 | ) | 48 | 53 | 56 | 158 | ||||||||||||||
Tax effect and non-controlling intereste |
(18 | ) | (16 | ) | 631 | 177 | 616 | |||||||||||||
Adjusted net earnings |
726 | 415 | 264 | 1,426 | 602 | |||||||||||||||
Net earnings per sharef |
0.50 | 0.20 | 1.30 | 0.92 | 1.47 | |||||||||||||||
Adjusted net earnings per sharef |
0.41 | 0.23 | 0.15 | 0.80 | 0.34 |
a. | For the three month period ended September 30, 2020, we recorded no significant impairment charges or reversals. For the nine month period ended September 30, 2020, net impairment reversals primarily relate to non-current asset reversals at our Tanzanian assets. Net impairment reversals for the three |
BARRICK THIRD QUARTER 2020 | 14 | PRESS RELEASE |
and nine month periods ended September 30, 2019 mainly relate to non-current asset reversals at Lumwana, partially offset by impairments at Cortez and Lagunas Norte. |
b. | Acquisition/disposition gains for the nine month period ended September 30, 2020 primarily relate to the gain on the sale of Massawa. For the three and nine months ended September 30, 2019, acquisition/disposition gains primarily relate to the gain on the remeasurement of Turquoise Ridge to fair value as a result of its contribution to Nevada Gold Mines. |
c. | Significant tax adjustments for the nine month period ended September 30, 2020 mainly relates to deferred tax recoveries as a result of tax reform measures in Argentina and adjustments made in recognition of the net settlement of all outstanding disputes with the GoT. |
d. | Other expense adjustments for the three and nine month period ended September 30, 2020 primarily relate to the gain on the remeasurement of the residual cash liability relating to our silver sale agreement with Wheaton Precious Metals Corp., partially offset by care and maintenance expenses at Porgera and Covid-19 donations. For the three month period ended June 30, 2020, other expense adjustments primarily relate to care and maintenance expenses at Porgera and Covid-19 donations. The nine month period ended September 30, 2020 was further impacted by changes in the discount rate assumptions on our closed mine rehabilitation provision. For the three and nine month periods ended September 30, 2019, other expense adjustments primarily relate to severance costs as a result of the implementation of a number of organizational reductions, the impact of changes in the discount rate assumptions on our closed mine rehabilitation provision and transaction costs related to Nevada Gold Mines and Acacia. |
e. | Tax effect and non-controlling interest for the three and nine month periods ended September 30, 2019 primarily relates to the net impairment reversals related to long-lived assets and acquisition gains. |
f. | Calculated using weighted average number of shares outstanding under the basic method of earnings per share. |
Endnote 3
Realized price is a non-GAAP financial measure which excludes from sales: unrealized gains and losses on non-hedge derivative contracts; unrealized mark-to-market gains and losses on provisional pricing from copper and gold sales contracts; sales attributable to ore purchase arrangements; treatment and refining charges; export duties; and cumulative catch-up adjustments to revenue relating to our streaming arrangements. This measure is intended to enable Management to better understand the price realized in each reporting period for gold and copper sales because unrealized mark-to-market values of non-hedge gold and copper derivatives are subject to change each period due to changes in market factors such as market and forward gold and copper prices, so that prices ultimately realized may differ from those recorded. The exclusion of such unrealized mark-to-market gains and losses from the presentation of this performance measure enables investors to understand performance based on the realized proceeds of selling gold and copper production. The realized price measure is intended to provide additional information and does not have any standardized definition under IFRS and should not be considered in isolation or as a substitute for measures of performance prepared in accordance with IFRS. Further details on these non-GAAP measures are provided in the MD&A accompanying Barricks financial statements filed from time to time on SEDAR at www.sedar.com and on EDGAR at www.sec.gov.
Reconciliation of Sales to Realized Price per ounce/pound
($ millions, except per ounce/pound information in dollars) |
Gold | Copper | Gold | Copper | ||||||||||||||||||||||||||||||||||||
For the three months ended | For the nine months ended | |||||||||||||||||||||||||||||||||||||||
9/30/20 | 6/30/20 | 9/30/19 | 9/30/20 | 6/30/20 | 9/30/19 | 9/30/20 | 9/30/19 | 9/30/20 | 9/30/19 | |||||||||||||||||||||||||||||||
Sales |
3,237 | 2,812 | 2,585 | 219 | 184 | 45 | 8,642 | 6,428 | 502 | 311 | ||||||||||||||||||||||||||||||
Sales applicable to non-controlling interests |
(967 | ) | (822 | ) | (748 | ) | 0 | 0 | 0 | (2,560 | ) | (1,212 | ) | 0 | 0 | |||||||||||||||||||||||||
Sales applicable to equity method investmentsa,b |
183 | 172 | 140 | 121 | 120 | 100 | 502 | 404 | 348 | 345 | ||||||||||||||||||||||||||||||
Realized non-hedge gold/copper derivative (losses) gains |
0 | 0 | 0 | 0 | 0 | 0 | 0 | 1 | 0 | 0 | ||||||||||||||||||||||||||||||
Sales applicable to sites in care and maintenancec |
(53 | ) | (53 | ) | (32 | ) | 0 | 0 | 0 | (152 | ) | (84 | ) | 0 | 0 | |||||||||||||||||||||||||
Treatment and refinement charges |
4 | 2 | 0 | 39 | 40 | 18 | 6 | 0 | 118 | 74 | ||||||||||||||||||||||||||||||
Otherd |
0 | 0 | 0 | 0 | 0 | 0 | 15 | 0 | 0 | 0 | ||||||||||||||||||||||||||||||
Revenues as adjusted |
2,404 | 2,111 | 1,945 | 379 | 344 | 163 | 6,453 | 5,537 | 968 | 730 | ||||||||||||||||||||||||||||||
Ounces/pounds sold (000s ounces/millions pounds)c |
1,249 | 1,224 | 1,318 | 116 | 123 | 65 | 3,693 | 4,055 | 349 | 264 | ||||||||||||||||||||||||||||||
Realized gold/copper price per ounce/pounde |
1,926 | 1,725 | 1,476 | 3.28 | 2.79 | 2.55 | 1,748 | 1,365 | 2.78 | 2.78 |
a. | Represents sales of $176 million and $480 million, respectively, for the three and nine month periods ended September 30, 2020 (June 30, 2020: $164 million and September 30, 2019: $133 million and $375 million, respectively) applicable to our 45% equity method investment in Kibali and $nil and nil, respectively, (June 30, 2020: $nil and September 30, 2019: $8 million and $30 million, respectively) applicable to our 40% equity method investment in Morila for gold. Represents sales of $66 million and $216 million, respectively, for the three and nine months ended September 30, 2020 (June 30, 2020: $78 million and September 30, 2019: $66 million and $233 million, respectively) applicable to our 50% equity method investment in Zaldívar and $59 million and $145 million, respectively (June 30, 2020: $46 million and September 30, 2019: $37 million and $125 million, respectively) applicable to our 50% equity method investment in Jabal Sayid for copper. |
b. | Sales applicable to equity method investments are net of treatment and refinement charges. |
c. | Figures exclude: Pierina; Golden Sunlight and Morila starting in the third quarter of 2019; and Lagunas Norte starting in the fourth quarter of 2019, from the calculation of realized price per ounce as the mine is mining incidental ounces as it enters closure. |
d. | Represents a cumulative catch-up adjustment to revenue relating to our streaming arrangements. Refer to note 2f of the 2019 Annual Financial Statements for more information. |
e. | Realized price per ounce/pound may not calculate based on amounts presented in this table due to rounding. |
BARRICK THIRD QUARTER 2020 | 15 | PRESS RELEASE |
Endnote 4
Includes North Mara, Bulyanhulu and Buzwagi on a 84% basis starting January 1, 2020 (and on a 63.9% basis from January 1, 2019 to September 30, 2019; notwithstanding the completion of the Acacia transaction on September 17, 2019, we consolidated our interest in Acacia and recorded a non-controlling interest of 36.1% in the income statement for the entirety of the third quarter of 2019 as a matter of convenience, and on a 100% basis from October 1, 2019 to December 31, 2019), Pueblo Viejo on a 60% basis, South Arturo on a 36.9% basis from July 1, 2019 onwards as a result of its contribution to Nevada Gold Mines (and on a 60% basis from January 1, 2019 to June 30, 2019), Veladero on a 50% basis, Loulo-Gounkoto on an 80% basis, Kibali on a 45% basis, Tongon on an 89.7% basis, and Morila on a 40% basis until the second quarter of 2019, which reflects our equity share of production and sales. Also removes the non-controlling interest of 38.5% Nevada Gold Mines from July 1, 2019 onwards.
Endnote 5
Net earnings (loss) represents net earnings (loss) attributable to the equity holders of the Company.
Endnote 6
These amounts are presented on the same basis as our guidance and include our 60% share of Pueblo Viejo, 80% share of Loulo-Gounkoto, 89.7% share of Tongon, 45% share of Kibali, 40% share of Morila and 60% share of South Arturo (36.9% of South Arturo from July 1, 2019 onwards as a result of its contribution to Nevada Gold Mines), our 84% share of Tanzania starting January 1, 2020 (63.9% share from January 1, 2019 to September 30, 2019; notwithstanding the completion of the Acacia transaction on September 17, 2019, we consolidated our interest in Acacia and recorded a non-controlling interest of 36.1% in the income statement for the entirety of the third quarter of 2019 as a matter of convenience, and 100% share from October 1, 2019 to December 31, 2019) and our 50% share of Zaldívar and Jabal Sayid. Starting July 1, 2019, it also includes our 61.5% share of Nevada Gold Mines.
Endnote 7
Gold cost of sales (Barricks share) is calculated as cost of sales - gold on an attributable basis (excluding sites in care and maintenance) divided by ounces sold.
Endnote 8
Total cash costs per ounce, All-in sustaining costs per ounce and All-in costs per ounce are non-GAAP financial performance measures. Total cash costs per ounce starts with cost of sales related to gold production and removes depreciation, the non-controlling interest of cost of sales, and includes by product credits. All-in sustaining costs per ounce start with Total cash costs per ounce and add further costs which reflect the expenditures made to maintain current production levels, primarily sustaining capital expenditures, sustaining leases, general & administrative costs, minesite exploration and evaluation costs, and reclamation cost accretion and amortization. All-in costs per ounce starts with All-in sustaining costs per ounce and adds additional costs that reflect the varying costs of producing gold over the life-cycle of a mine, including: project capital expenditures and other non-sustaining costs. Barrick believes that the use of Total cash costs per ounce, All-in sustaining costs per ounce and All-in costs per ounce will assist investors, analysts and other stakeholders in understanding the costs associated with producing gold, understanding the economics of gold mining, assessing our operating performance and also our ability to generate free cash flow from current operations and to generate free cash flow on an overall Company basis. Total cash costs per ounce, All-in sustaining costs per ounce and All-in costs per ounce are intended to provide additional information only and do not have any standardized meaning under IFRS. Although a standardized definition of all-in sustaining costs was published in 2013 by the World Gold Council (a market development organization for the gold industry comprised of and funded by gold mining companies from around the world, including Barrick), it is not a regulatory organization, and other companies may calculate this measure differently. These measures should not be considered in isolation or as a substitute for measures prepared in accordance with IFRS. Further details on these non-GAAP measures are provided in the MD&A accompanying Barricks financial statements filed from time to time on SEDAR at www.sedar.com and on EDGAR at www.sec.gov.
BARRICK THIRD QUARTER 2020 | 16 | PRESS RELEASE |
Reconciliation of Gold Cost of Sales to Total cash costs, All-in sustaining costs and All-in costs, including on a per ounce basis
($ millions, except per ounce information in dollars) | For the three months ended | For the nine months ended | ||||||||||||||||||||||
Footnote | 9/30/20 | 6/30/20 | 9/30/19 | 9/30/20 | 9/30/19 | |||||||||||||||||||
Cost of sales applicable to gold production |
1,768 | 1,740 | 1,831 | 5,151 | 4,618 | |||||||||||||||||||
Depreciation |
(508 | ) | (498 | ) | (538 | ) | (1,480 | ) | (1,353 | ) | ||||||||||||||
Cash cost of sales applicable to equity method investments |
53 | 62 | 45 | 156 | 169 | |||||||||||||||||||
By-product credits |
(84 | ) | (59 | ) | (48 | ) | (172 | ) | (95 | ) | ||||||||||||||
Realized (gains) losses on hedge and non-hedge derivatives |
a | 0 | 1 | 1 | 1 | 0 | ||||||||||||||||||
Non-recurring items |
b | 0 | 0 | (4 | ) | 0 | (33 | ) | ||||||||||||||||
Other |
c | (24 | ) | (26 | ) | (19 | ) | (77 | ) | (65 | ) | |||||||||||||
Non-controlling interests |
d | (337 | ) | (336 | ) | (339 | ) | (989 | ) | (552 | ) | |||||||||||||
Total cash costs |
868 | 884 | 929 | 2,590 | 2,689 | |||||||||||||||||||
General & administrative costs |
50 | 71 | 68 | 161 | 181 | |||||||||||||||||||
Minesite exploration and evaluation costs |
e | 19 | 23 | 22 | 57 | 45 | ||||||||||||||||||
Minesite sustaining capital expenditures |
f | 415 | 420 | 406 | 1,205 | 926 | ||||||||||||||||||
Sustaining leases |
9 | 10 | 5 | 19 | 23 | |||||||||||||||||||
Rehabilitation - accretion and amortization (operating sites) |
g | 13 | 12 | 28 | 39 | 58 | ||||||||||||||||||
Non-controlling interest, copper operations and other |
h | (166 | ) | (158 | ) | (184 | ) | (438 | ) | (335 | ) | |||||||||||||
All-in sustaining costs |
1,208 | 1,262 | 1,274 | 3,633 | 3,587 | |||||||||||||||||||
Project exploration and evaluation and project costs |
e | 53 | 55 | 64 | 164 | 213 | ||||||||||||||||||
Community relations costs not related to current operations |
0 | 0 | 1 | 1 | 2 | |||||||||||||||||||
Project capital expenditures |
f | 126 | 85 | 96 | 287 | 324 | ||||||||||||||||||
Rehabilitation - accretion and amortization (non-operating sites) |
g | 3 | 4 | 5 | 9 | 19 | ||||||||||||||||||
Non-controlling interest and copper operations and other |
h | (47 | ) | (36 | ) | (46 | ) | (100 | ) | (77 | ) | |||||||||||||
All-in costs |
1,343 | 1,370 | 1,394 | 3,994 | 4,068 | |||||||||||||||||||
Ounces sold - equity basis (000s ounces) |
i | 1,249 | 1,224 | 1,318 | 3,693 | 4,055 | ||||||||||||||||||
Cost of sales per ounce |
j,k | 1,065 | 1,075 | 1,065 | 1,054 | 991 | ||||||||||||||||||
Total cash costs per ounce |
k | 696 | 716 | 710 | 701 | 663 | ||||||||||||||||||
Total cash costs per ounce (on a co-product basis) |
k,l | 742 | 747 | 735 | 732 | 680 | ||||||||||||||||||
All-in sustaining costs per ounce |
k | 966 | 1,031 | 984 | 984 | 883 | ||||||||||||||||||
All-in sustaining costs per ounce (on a co-product basis) |
k,l | 1,012 | 1,062 | 1,009 | 1,015 | 900 | ||||||||||||||||||
All-in costs per ounce |
k | 1,076 | 1,118 | 1,074 | 1,082 | 999 | ||||||||||||||||||
All-in costs per ounce (on a co-product basis) |
k,l | 1,122 | 1,149 | 1,099 | 1,113 | 1,016 |
a. | Realized (gains) losses on hedge and non-hedge derivatives |
Includes realized hedge losses of $nil and $nil, respectively, for the three and nine month periods ended September 30, 2020 (June 30, 2020: $nil and September 30, 2019: $nil and $nil, respectively), and realized non-hedge losses of $nil and $1 million, respectively, for the three and nine month periods ended September 30, 2020 (June 30, 2020: $1 million and September 30, 2019: $1 million and $nil, respectively). Refer to note 5 to the Financial Statements for further information.
b. | Non-recurring items |
Non-recurring items in 2019 relate to organizational restructuring. These costs are not indicative of our cost of production and have been excluded from the calculation of total cash costs.
c. | Other |
Other adjustments for the three and nine month period ended September 30, 2020 include the removal of total cash costs and by-product credits associated with: our Pierina mine; Golden Sunlight and Morila starting in the third quarter of 2019; and Lagunas Norte starting in the fourth quarter of 2019, which all are mining incidental ounces as they enter closure of $27 million and $78 million, respectively, (June 30, 2020: $26 million; September 30, 2019: $19 million and $57 million, respectively).
d. | Non-controlling interests |
Non-controlling interests include non-controlling interests related to gold production of $508 million and $1,469 million, respectively, for the three and nine month periods ended September 30, 2020 (June 30, 2020: $495 million and September 30, 2019: $504 million and $827 million, respectively). Non-controlling interests include Pueblo Viejo, Loulo-Gounkoto, Tongon, North Mara, Bulyanhulu, Buzwagi (notwithstanding the completion of the Acacia transaction on September 17, 2019, we consolidated our interest in Acacia and recorded a non-controlling interest of 36.1% in the income statement for the entirety of the third quarter of 2019 as a matter of convenience) and Nevada Gold Mines starting July 1, 2019. Refer to note 5 to the Financial Statements for further information.
e. | Exploration and evaluation costs |
Exploration, evaluation and project expenses are presented as minesite sustaining if it supports current mine operations and project if it relates to future projects. Refer to page 75 of the Q3 2020 MD&A.
BARRICK THIRD QUARTER 2020 | 17 | PRESS RELEASE |
f. | Capital expenditures |
Capital expenditures are related to our gold sites only and are split between minesite sustaining and project capital expenditures. Project capital expenditures are distinct projects designed to increase the net present value of the mine and are not related to current production. Significant projects in the current year are the expansion project at Pueblo Viejo, the Goldrush exploration declines, the restart of mining activities at Bulyanhulu, and construction of the third shaft at Turquoise Ridge. Refer to page 74 of the Q3 2020 MD&A.
g. | Rehabilitationaccretion and amortization |
Includes depreciation on the assets related to rehabilitation provisions of our gold operations and accretion on the rehabilitation provision of our gold operations, split between operating and non-operating sites.
h. | Non-controlling interest and copper operations |
Removes general & administrative costs related to non-controlling interests and copper based on a percentage allocation of revenue. Also removes exploration, evaluation and project expenses, rehabilitation costs and capital expenditures incurred by our copper sites and the non-controlling interest of North Mara, Bulyanhulu and Buzwagi (notwithstanding the completion of the Acacia transaction on September 17, 2019, we consolidated our interest in Acacia and recorded a non-controlling interest of 36.1% in the income statement for the entirety of the third quarter of 2019 as a matter of convenience), Pueblo Viejo, Loulo-Gounkoto and Tongon operating segments and South Arturo (63.1% of South Arturo from July 1, 2019 onwards as a result of its contribution to Nevada Gold Mines). Also removes the non-controlling interest of Nevada Gold Mines starting July 1, 2019. It also includes capital expenditures applicable to equity method investments. Figures remove the impact of Pierina; Golden Sunlight and Morila starting in the third quarter of 2019; and Lagunas Norte starting in the fourth quarter of 2019. The impact is summarized as the following:
($ millions) | For the three months ended | For the nine months ended | ||||||||||||||||||
Non-controlling interest, copper operations and other | 9/30/20 | 6/30/20 | 9/30/19 | 9/30/20 | 9/30/19 | |||||||||||||||
General & administrative costs |
(6 | ) | (8 | ) | (22 | ) | (20 | ) | (55 | ) | ||||||||||
Minesite exploration and evaluation expenses |
(5 | ) | (8 | ) | (9 | ) | (16 | ) | (10 | ) | ||||||||||
Rehabilitation - accretion and amortization (operating sites) |
(3 | ) | (4 | ) | (10 | ) | (11 | ) | (12 | ) | ||||||||||
Minesite sustaining capital expenditures |
(152 | ) | (138 | ) | (143 | ) | (391 | ) | (258 | ) | ||||||||||
All-in sustaining costs total |
(166 | ) | (158 | ) | (184 | ) | (438 | ) | (335 | ) | ||||||||||
Project exploration and evaluation and project costs |
(9 | ) | (9 | ) | (12 | ) | (21 | ) | (40 | ) | ||||||||||
Project capital expenditures |
(38 | ) | (27 | ) | (34 | ) | (79 | ) | (37 | ) | ||||||||||
All-in costs total |
(47 | ) | (36 | ) | (46 | ) | (100 | ) | (77 | ) |
i. | Ounces sold - equity basis |
Figures remove the impact of: Pierina; Golden Sunlight and Morila starting in the third quarter of 2019; and Lagunas Norte starting in the fourth quarter of 2019, which are producing incidental ounces as they reach the end of their mine lives.
j. | Cost of sales per ounce |
Figures remove the cost of sales impact of: Pierina of $4 million and $14 million, respectively, for the three and nine month periods ended September 30, 2020 (June 30, 2020: $4 million and September 30, 2019: $44 million and $71 million, respectively); starting in the third quarter of 2019, Golden Sunlight of $nil and $nil, respectively, for the three and nine month periods ended September 30, 2020 (June 30, 2020: $nil and September 30, 2019: $1 million and $1 million, respectively) and Morila of $7 million and $20 million, respectively, for the three and nine month periods ended September 30, 2020 (June 30, 2020: $8 million and September 30, 2019: $10 million and $10 million, respectively); and starting in the fourth quarter of 2019, Lagunas Norte of $22 million and $66 million, respectively, for the three and nine month periods ended September 30, 2020 (June 30, 2020: $23 million and September 30, 2019: $nil and $nil, respectively), which are mining incidental ounces as these sites enter closure. Cost of sales per ounce excludes non-controlling interest related to gold production. Cost of sales applicable to gold per ounce is calculated using cost of sales on an attributable basis (removing the non-controlling interest of 40% Pueblo Viejo, 20% of Loulo-Gounkoto, 10.3% of Tongon, 16% North Mara, Bulyanhulu and Buzwagi starting January 1, 2020, the effective date of the GoTs free carried interest (36.1% up until September 30, 2019; notwithstanding the completion of the Acacia transaction on September 17, 2019, we consolidated our interest in Acacia and recorded a non-controlling interest of 36.1% in the income statement for the entirety of the third quarter of 2019 as a matter of convenience) and 40% South Arturo from cost of sales (63.1% of South Arturo from July 1, 2019 onwards as a result of its contribution to Nevada Gold Mines)), divided by attributable gold ounces. The non-controlling interest of 38.5% Nevada Gold Mines is also removed from cost of sales from July 1, 2019 onwards.
k. | Per ounce figures |
Cost of sales per ounce, total cash costs per ounce, all-in sustaining costs per ounce and all-in costs per ounce may not calculate based on amounts presented in this table due to rounding.
l. | Co-product costs per ounce |
Total cash costs per ounce, all-in sustaining costs per ounce and all-in costs per ounce presented on a co-product basis removes the impact of by-product credits of our gold production (net of non-controlling interest) calculated as:
($ millions) | For the three months ended | For the nine months ended | ||||||||||||||||||
9/30/20 | 6/30/20 | 9/30/19 | 9/30/20 | 9/30/19 | ||||||||||||||||
By-product credits |
84 | 59 | 48 | 172 | 95 | |||||||||||||||
Non-controlling interest |
(29 | ) | (22 | ) | (16 | ) | (65 | ) | (31 | ) | ||||||||||
By-product credits (net of non-controlling interest) |
55 | 37 | 32 | 107 | 64 |
Endnote 9
Amounts reflect production and sales from Jabal Sayid and Zaldívar on a 50% basis, which reflects our equity share of production, and Lumwana.
Endnote 10
Copper cost of sales (Barricks share) is calculated as cost of sales - copper plus our equity share of cost of sales attributable to Zaldívar and Jabal Sayid divided by pounds sold.
BARRICK THIRD QUARTER 2020 | 18 | PRESS RELEASE |
Endnote 11
A Tier One Gold Asset is a mine with a stated life in excess of 10 years, annual production of at least 500,000 ounces of gold and total cash costs per ounce over the mine life that are in the lower half of the industry cost curve.
Endnote 12
The declaration and payment of dividends is at the discretion of the Board of Directors, and will depend on the companys financial results, cash requirements, future prospects and other factors deemed relevant by the Board.
Endnote 13
Botswana, Burundi, Eritrea, Eswatini, Ethiopia, The Gambia, Kenya, Lesotho, Liberia, Malawi, Mozambique, Namibia, Rwanda, Seychelles, Sierra Leone, Somalia, South Sudan, Sudan, Tanzania, Uganda, Zambia, Zimbabwe.
Endnote 14
Cost of sales applicable to gold per ounce is calculated using cost of sales applicable to gold on an attributable basis (removing the non-controlling interest of 38.5% of Nevada Gold Mines (including 63.1% of South Arturo), 40% of Pueblo Viejo, 20% of Loulo-Gounkoto, 10.3% of Tongon, and 16% of North Mara, Bulyanhulu and Buzwagi from cost of sales and including our proportionate share of cost of sales attributable to our equity method investments in Kibali), divided by attributable gold ounces sold. Cost of sales applicable to copper per pound is calculated using cost of sales applicable to copper including our proportionate share of cost of sales attributable to our equity method investments in Zaldívar and Jabal Sayid, divided by consolidated copper pounds sold (including our proportionate share of copper pounds sold from our equity method investments).
Endnote 15
Includes our 36.9% share of South Arturo.
Endnote 16
Based on the communication we received from the Government of Papua New Guinea that the SML will not be extended, Porgera was placed on temporary care and maintenance on April 25, 2020 to ensure the safety and security of our employees and communities. Due to the uncertainty related to the timing and scope of future developments on the mines operating outlook, our full year 2020 guidance for Porgera has been withdrawn.
Endnote 17
Amounts are on an 84% basis as the GoTs 16% free-carried interest was made effective from January 1, 2020.
Endnote 18
Total cash costs and all-in sustaining costs per ounce include the impact of hedges and/or costs allocated to non-operating sites.
Endnote 19
Operating unit guidance ranges reflect expectations at each individual operating unit, and may not add up to the company-wide guidance range total. Guidance ranges exclude Pierina, Lagunas Norte, Golden Sunlight and Morila (40%).
Endnote 20
Includes corporate administration costs.
Endnote 21
C1 cash costs per pound and All-in sustaining costs per pound are non-GAAP financial performance measures. C1 cash costs per pound is based on cost of sales but excludes the impact of depreciation and royalties and production taxes and includes treatment and refinement charges. All-in sustaining costs per pound begins with C1 cash costs per pound and adds further costs which reflect the additional costs of operating a mine, primarily sustaining capital expenditures, general & administrative costs and royalties and production taxes. Barrick believes that the use of C1 cash costs per pound and all-in sustaining costs per pound will assist investors, analysts, and other stakeholders in understanding the costs associated with producing copper, understanding the economics of copper mining, assessing our operating performance, and also our ability to generate free cash flow from current operations and to generate free cash flow on an overall Company basis. C1 cash costs per pound and All-in sustaining costs per pound are intended to provide additional information only, do not have any standardized meaning under IFRS, and may not be comparable to similar measures of performance presented by other companies. These measures should not be considered in isolation or as a substitute for measures of performance prepared in accordance with IFRS. Further details on these non-GAAP measures are provided in the MD&A accompanying Barricks financial statements filed from time to time on SEDAR at www.sedar.com and on EDGAR at www.sec.gov.
BARRICK THIRD QUARTER 2020 | 19 | PRESS RELEASE |
Reconciliation of Copper Cost of Sales to C1 cash costs and All-in sustaining costs, including on a per pound basis
($ millions, except per pound information in dollars) | For the three months ended | For the nine months ended | ||||||||||||||||||
9/30/20 | 6/30/20 | 9/30/19 | 9/30/20 | 9/30/19 | ||||||||||||||||
Cost of sales |
154 | 153 | 49 | 431 | 281 | |||||||||||||||
Depreciation/amortization |
(61 | ) | (63 | ) | (13 | ) | (167 | ) | (83 | ) | ||||||||||
Treatment and refinement charges |
39 | 40 | 18 | 118 | 74 | |||||||||||||||
Cash cost of sales applicable to equity method investments |
57 | 72 | 59 | 195 | 194 | |||||||||||||||
Less: royalties and production taxesa |
(16 | ) | (11 | ) | (5 | ) | (38 | ) | (26 | ) | ||||||||||
By-product credits |
(4 | ) | (3 | ) | (3 | ) | (10 | ) | (8 | ) | ||||||||||
Other |
0 | 0 | 0 | (5 | ) | |||||||||||||||
C1 cash costs |
169 | 188 | 105 | 529 | 427 | |||||||||||||||
General & administrative costs |
4 | 6 | 5 | 13 | 16 | |||||||||||||||
Rehabilitation - accretion and amortization |
2 | 2 | 2 | 7 | 8 | |||||||||||||||
Royalties and production taxesa |
16 | 11 | 5 | 38 | 26 | |||||||||||||||
Minesite exploration and evaluation costs |
2 | 1 | 1 | 4 | 4 | |||||||||||||||
Minesite sustaining capital expenditures |
74 | 52 | 48 | 158 | 155 | |||||||||||||||
Sustaining leases |
2 | 2 | 0 | 7 | 2 | |||||||||||||||
All-in sustaining costs |
269 | 262 | 166 | 756 | 638 | |||||||||||||||
Pounds sold - consolidated basis (millions pounds) |
116 | 123 | 65 | 349 | 264 | |||||||||||||||
Cost of sales per poundb,c |
1.97 | 2.08 | 2.00 | 2.01 | 2.10 | |||||||||||||||
C1 cash cost per poundb |
1.45 | 1.55 | 1.62 | 1.52 | 1.62 | |||||||||||||||
All-in sustaining costs per poundb |
2.31 | 2.15 | 2.58 | 2.17 | 2.42 |
a. | For the three and nine month period ended September 30, 2020, royalties and production taxes include royalties of $16 million and $38 million, respectively (June 30, 2020: $11 million and September 30, 2019: $5 million and $26 million, respectively). |
b. | Cost of sales per pound, C1 cash costs per pound and all-in sustaining costs per pound may not calculate based on amounts presented in this table due to rounding. |
c. | Cost of sales applicable to copper per pound is calculated using cost of sales including our proportionate share of cost of sales attributable to equity method investments (Zaldívar and Jabal Sayid), divided by consolidated copper pounds (including our proportionate share of copper pounds from our equity method investments). |
Endnote 22
2020 Guidance includes our 61.5% share of Nevada Gold Mines, our 60% share of Pueblo Viejo, our 80% share of Loulo-Gounkoto, our 89.7% share of Tongon, our 84% share of North Mara, Bulyanhulu and Buzwagi, our 50% share of Zaldívar and Jabal Sayid, and our 45% of Kibali, and our share of joint operations.
Endnote 23
Reflects the impact of the full year.
Endnote 24
EBITDA is a non-GAAP financial measure, which excludes the following from net earnings: income tax expense; finance costs; finance income; and depreciation. Management believes that EBITDA is a valuable indicator of our ability to generate liquidity by producing operating cash flow to fund working capital needs, service debt obligations, and fund capital expenditures. Management uses EBITDA for this purpose. Adjusted EBITDA removes the effect of impairment charges; acquisition/disposition gains/losses; foreign currency translation gains/losses; other expense adjustments; and the impact of the income tax expense, finance costs, finance income and depreciation incurred in our equity method accounted investments. We believe these items provide a greater level of consistency with the adjusting items included in our Adjusted Net Earnings reconciliation, with the exception that these amounts are adjusted to remove any impact on finance costs/income, income tax expense and/or depreciation as they do not affect EBITDA. We believe this additional information will assist analysts, investors and other stakeholders of Barrick in better understanding our ability to generate liquidity from our full business, including equity method investments, by excluding these amounts from the calculation as they are not indicative of the performance of our core mining business and not necessarily reflective of the underlying operating results for the periods presented. EBITDA and adjusted EBITDA are intended to provide additional information only and do not have any standardized meaning under IFRS and may not be comparable to similar measures of performance presented by other companies. They should not be considered in isolation or as a substitute for measures of performance prepared in accordance with IFRS. Further details on these non-GAAP measures are provided in the MD&A accompanying Barricks financial statements filed from time to time on SEDAR at www.sedar.com and on EDGAR at www.sec.gov.
BARRICK THIRD QUARTER 2020 | 20 | PRESS RELEASE |
Reconciliation of Net Earnings to EBITDA and Adjusted EBITDA
($ millions) | For the three months ended | For the nine months ended | ||||||||||||||||||
9/30/20 | 6/30/20 | 9/30/19 | 9/30/20 | 9/30/19 | ||||||||||||||||
Net earnings (loss) | 1,271 | 622 | 2,435 | 2,556 | 2,798 | |||||||||||||||
Income tax expense |
284 | 258 | 791 | 928 | 999 | |||||||||||||||
Finance costs, neta |
72 | 74 | 106 | 234 | 304 | |||||||||||||||
Depreciation |
574 | 566 | 559 | 1,664 | 1,460 | |||||||||||||||
EBITDA | 2,201 | 1,520 | 3,891 | 5,382 | 5,561 | |||||||||||||||
Impairment charges (reversals) of long-lived assetsb | 4 | 23 | (872 | ) | (309 | ) | (857 | ) | ||||||||||||
Acquisition/disposition (gains) lossesc | (2 | ) | 8 | (1,901 | ) | (54 | ) | (1,913 | ) | |||||||||||
Loss on currency translation | 16 | 2 | 40 | 34 | 56 | |||||||||||||||
Other expense (income) adjustmentsd | (90 | ) | 48 | 53 | 56 | 158 | ||||||||||||||
Unrealized (gains) losses on non-hedge derivative instruments | 0 | 0 | 1 | 0 | 0 | |||||||||||||||
Income tax expense, net finance costs, and depreciation from equity investees | 94 | 96 | 85 | 277 | 266 | |||||||||||||||
Adjusted EBITDA | 2,223 | 1,697 | 1,297 | 5,386 | 3,271 |
a. | Finance costs exclude accretion. |
b. | For the three month period ended September 30, 2020, we recorded no significant impairment charges or reversals. For the nine month period ended September 30, 2020, net impairment reversals primarily relate to non-current asset reversals at our Tanzanian assets. Net impairment reversals for the three and nine month periods ended September 30, 2019 mainly relate to non-current asset reversals at Lumwana, partially offset by impairments at Cortez and Lagunas Norte. |
c. | Acquisition/disposition gains for the nine month period ended September 30, 2020 primarily relate to the gain on the sale of Massawa. For the three and nine months ended September 30, 2019, acquisition/disposition gains primarily relate to the gain on the remeasurement of Turquoise Ridge to fair value as a result of its contribution to Nevada Gold Mines. |
d. | Other expense adjustments for the three and nine month period ended September 30, 2020 primarily relate to the gain on the remeasurement of the residual cash liability relating to our silver sale agreement with Wheaton Precious Metals Corp., partially offset by care and maintenance expenses at Porgera and Covid-19 donations. For the three month period ended June 30, 2020, other expense adjustments primarily relate to care and maintenance expenses at Porgera and Covid-19 donations. The nine month period ended September 30, 2020 was further impacted by changes in the discount rate assumptions on our closed mine rehabilitation provision. For the three and nine month periods ended September 30, 2019, other expense adjustments primarily relate to severance costs as a result of the implementation of a number of organizational reductions, the impact of changes in the discount rate assumptions on our closed mine rehabilitation provision and transaction costs related to Nevada Gold Mines and Acacia. |
Endnote 25
Due to our hedging activities, which are reflected in these sensitivities, we are partially protected against changes in these factors.
BARRICK THIRD QUARTER 2020 | 21 | PRESS RELEASE |
Transfer Agents and Registrars
AST Trust Company (Canada)
P.O. Box 700, Postal Station B
Montreal, Quebec H3B 3K3
or
American Stock Transfer & Trust Company, LLC
6201 15 Avenue
Brooklyn, New York 11219
Telephone: 1-800-387-0825
Fax: 1-888-249-6189
Email: inquiries@astfinancial.com
Website: www.astfinancial.com
Cautionary Statement on Forward-Looking Information
Exhibit 99.2
MANAGEMENTS DISCUSSION AND ANALYSIS (MD&A)
QUARTERLY REPORT ON THE THIRD QUARTER OF 2020
CAUTIONARY STATEMENT ON FORWARD-LOOKING INFORMATION
BARRICK THIRD QUARTER 2020 | 22 | MANAGEMENTS DISCUSSION AND ANALYSIS |
BARRICK THIRD QUARTER 2020 | 23 | MANAGEMENTS DISCUSSION AND ANALYSIS |
BARRICK THIRD QUARTER 2020 | 24 | MANAGEMENTS DISCUSSION AND ANALYSIS |
OVERVIEW
Financial and Operating Highlights
For the three months ended | For the nine months ended | |||||||||||||||||||||||||||||||
9/30/20 | 6/30/20 | % Change | 9/30/19 | % Change | 9/30/20 | 9/30/19 | % Change | |||||||||||||||||||||||||
Financial Results ($ millions) |
||||||||||||||||||||||||||||||||
Revenues |
3,540 | 3,055 | 16 % | 2,678 | 32 % | 9,316 | 6,834 | 36 % | ||||||||||||||||||||||||
Cost of sales |
1,927 | 1,900 | 1 % | 1,889 | 2 % | 5,603 | 4,924 | 14 % | ||||||||||||||||||||||||
Net earningsa |
882 | 357 | 147 % | 2,277 | (61) % | 1,639 | 2,582 | (37)% | ||||||||||||||||||||||||
Adjusted net earningsb |
726 | 415 | 75 % | 264 | 175 % | 1,426 | 602 | 137% | ||||||||||||||||||||||||
Adjusted EBITDAb |
2,223 | 1,697 | 31 % | 1,297 | 71 % | 5,386 | 3,271 | 65 % | ||||||||||||||||||||||||
Adjusted EBITDA marginb,c |
63 | % | 56 | % | 13 % | 48 | % | 31 % | 58 | % | 48 | % | 21 % | |||||||||||||||||||
Minesite sustaining capital expendituresd |
415 | 420 | (1)% | 406 | 2 % | 1,205 | 926 | 30 % | ||||||||||||||||||||||||
Project capital expendituresd |
126 | 85 | 48 % | 96 | 31 % | 287 | 324 | (11)% | ||||||||||||||||||||||||
Total consolidated capital expendituresd,e |
548 | 509 | 8 % | 502 | 9 % | 1,508 | 1,255 | 20 % | ||||||||||||||||||||||||
Net cash provided by operating activities |
1,859 | 1,031 | 80 % | 1,004 | 85 % | 3,779 | 1,958 | 93 % | ||||||||||||||||||||||||
Net cash provided by operating activities marginf |
53 | % | 34 | % | 56 % | 37 | % | 43 % | 41 | % | 29 | % | 41 % | |||||||||||||||||||
Free cash flowb |
1,311 | 522 | 151 % | 502 | 161 % | 2,271 | 703 | 223 % | ||||||||||||||||||||||||
Net earnings per share (basic and diluted) |
0.50 | 0.20 | 150 % | 1.30 | (62)% | 0.92 | 1.47 | (37)% | ||||||||||||||||||||||||
Adjusted net earnings (basic)b per share |
0.41 | 0.23 | 78 % | 0.15 | 173 % | 0.80 | 0.34 | 135 % | ||||||||||||||||||||||||
Weighted average diluted common shares (millions of shares) |
1,778 | 1,778 | 0 % | 1,756 | 1 % | 1,778 | 1,751 | 2 % | ||||||||||||||||||||||||
Operating Results |
||||||||||||||||||||||||||||||||
Gold production (thousands of ounces)g |
1,155 | 1,149 | 1 % | 1,306 | (12)% | 3,554 | 4,026 | (12)% | ||||||||||||||||||||||||
Gold sold (thousands of ounces)g |
1,249 | 1,224 | 2 % | 1,318 | (5)% | 3,693 | 4,055 | (9)% | ||||||||||||||||||||||||
Market gold price ($/oz) |
1,909 | 1,711 | 12 % | 1,472 | 30 % | 1,735 | 1,364 | 27 % | ||||||||||||||||||||||||
Realized gold priceb,g ($/oz) |
1,926 | 1,725 | 12 % | 1,476 | 30 % | 1,748 | 1,365 | 28 % | ||||||||||||||||||||||||
Gold cost of sales (Barricks share)g,h ($/oz) |
1,065 | 1,075 | (1)% | 1,065 | 0 % | 1,054 | 991 | 6 % | ||||||||||||||||||||||||
Gold total cash costsb,g ($/oz) |
696 | 716 | (3)% | 710 | (2)% | 701 | 663 | 6 % | ||||||||||||||||||||||||
Gold all-in sustaining costsb,g ($/oz) |
966 | 1,031 | (6)% | 984 | (2)% | 984 | 883 | 11 % | ||||||||||||||||||||||||
Copper production (millions of pounds)i |
103 | 120 | (14)% | 112 | (8)% | 338 | 315 | 7 % | ||||||||||||||||||||||||
Copper sold (millions of pounds)i |
116 | 123 | (6)% | 65 | 78 % | 349 | 264 | 32 % | ||||||||||||||||||||||||
Market copper price ($/lb) |
2.96 | 2.43 | 22 % | 2.63 | 13 % | 2.65 | 2.74 | (3)% | ||||||||||||||||||||||||
Realized copper priceb,i ($/lb) |
3.28 | 2.79 | 18 % | 2.55 | 29 % | 2.78 | 2.78 | 0 % | ||||||||||||||||||||||||
Copper cost of sales (Barricks share)i,j ($/lb) |
1.97 | 2.08 | (5)% | 2.00 | (2)% | 2.01 | 2.10 | (4)% | ||||||||||||||||||||||||
Copper C1 cash costsb,i ($/lb) |
1.45 | 1.55 | (6)% | 1.62 | (10)% | 1.52 | 1.62 | (6)% | ||||||||||||||||||||||||
Copper all-in sustaining costsb,i ($/lb) |
2.31 | 2.15 | 7 % | 2.58 | (10)% | 2.17 | 2.42 | (10)% | ||||||||||||||||||||||||
As at 9/30/20 |
As at 6/30/20 |
% Change | As at 9/30/19 |
% Change | ||||||||||||||||||||||||||||
Financial Position ($ millions) |
||||||||||||||||||||||||||||||||
Debt (current and long-term) |
5,161 | 5,168 | 0 % | 5,560 | (7)% | |||||||||||||||||||||||||||
Cash and equivalents |
4,744 | 3,743 | 27 % | 2,405 | 97 % | |||||||||||||||||||||||||||
Debt, net of cash |
417 | 1,425 | (71)% | 3,155 | (87)% |
a. | Net earnings represents net earnings attributable to the equity holders of the Company. |
b. | Adjusted net earnings, adjusted EBITDA, adjusted EBITDA margin, free cash flow, adjusted net earnings per share, realized gold price, all-in sustaining costs, total cash costs, C1 cash costs and realized copper price are non-GAAP financial performance measures with no standardized meaning under IFRS and therefore may not be comparable to similar measures presented by other issuers. For further information and a detailed reconciliation of each non-GAAP measure to the most directly comparable IFRS measure, please see pages 82 to 106 of this MD&A. |
c. | Represents adjusted EBITDA divided by revenue. |
d. | Amounts presented on a consolidated cash basis. Project capital expenditures are included in our calculation of all-in costs, but not included in our calculation of all-in sustaining costs. |
e. | Total consolidated capital expenditures also includes capitalized interest. |
f. | Represents net cash provided by operating activities divided by revenue. |
g. | Includes North Mara, Bulyanhulu and Buzwagi on a 84% basis starting January 1, 2020 (and on a 63.9% basis from January 1, 2019 to September 30, 2019; notwithstanding the completion of the Acacia transaction on September 17, 2019, we consolidated our interest in Acacia and recorded a non-controlling interest of 36.1% in the income statement for the entirety of the third quarter of 2019 as a matter of convenience, and on a 100% basis from October 1, 2019 to December 31, 2019), Pueblo Viejo on a 60% basis, South Arturo on a 36.9% basis from July 1, 2019 onwards as a result of its contribution to Nevada Gold Mines (and on a 60% basis from January 1, 2019 to June 30, 2019), Veladero on a 50% basis, Loulo-Gounkoto on an 80% basis, Kibali on a 45% basis, Tongon on an 89.7% basis, and Morila on a 40% basis until the second quarter of 2019, which reflects our equity share of production and sales. Also removes the non-controlling interest of 38.5% Nevada Gold Mines from July 1, 2019 onwards. |
h. | Gold cost of sales (Barricks share) is calculated as gold cost of sales on an attributable basis (excluding sites in care and maintenance) divided by ounces sold. |
i. | Amounts reflect production and sales from Jabal Sayid and Zaldívar on a 50% basis, which reflects our equity share of production, and Lumwana. |
j. | Copper cost of sales (Barricks share) is calculated as copper cost of sales plus our equity share of cost of sales attributable to Zaldívar and Jabal Sayid divided by pounds sold. |
BARRICK THIRD QUARTER 2020 | 25 | MANAGEMENTS DISCUSSION AND ANALYSIS |
a. | These are non-GAAP financial performance measures with no standardized meaning under IFRS and therefore may not be comparable to similar measures presented by other issuers. For further information and a detailed reconciliation of each non-GAAP measure to the most directly comparable IFRS measure, please see pages 82 to 106 of this MD&A. |
b. | Cost of sales applicable to gold per ounce is calculated using cost of sales applicable to gold on an attributable basis (removing the non-controlling interest of 40% Pueblo Viejo; 20% Loulo-Gounkoto; 10.3% Tongon; 16% North Mara, Bulyanhulu and Buzwagi starting January 1, 2020, the date the GoTs 16% free carried interest was made effective (36.1% from January 1, 2019 to September 30, 2019; notwithstanding the completion of the Acacia transaction on September 17, 2019, we consolidated our interest in Acacia and recorded a non-controlling interest of 36.1% in the income statement for the entirety of the third quarter of 2019 as a matter of convenience); 63.1% South Arturo from cost of sales from July 1, 2019 onwards as a result of its contribution to Nevada Gold Mines (and on a 40% basis from January 1, 2019 to June 30, 2019); and our proportionate share of cost of sales attributable to equity method investments (Kibali, and Morila until the second quarter of 2019), divided by attributable gold ounces. Also removes the non-controlling interest of 38.5% Nevada Gold Mines from cost of sales from July 1, 2019 onwards. Cost of sales applicable to copper per pound is calculated using cost of sales applicable to copper including our proportionate share of cost of sales attributable to equity method investments (Zaldívar and Jabal Sayid), divided by consolidated copper pounds (including our proportionate share of copper pounds from our equity method investments). |
BARRICK THIRD QUARTER 2020 | 26 | MANAGEMENTS DISCUSSION AND ANALYSIS |
Factors affecting net earnings and adjusted net earnings1 - three months ended September 30, 2020 versus June 30, 2020
Net earnings attributable to equity holders of Barrick (net earnings) for the three months ended September 30, 2020 were $882 million compared to $357 million in the prior quarter. The increase was primarily due to the higher realized gold price1 of $1,926 per ounce in the three months ended September 30, 2020 compared to $1,725 per ounce in the prior quarter. This was combined with a gain of $104 million (no tax impact) on the remeasurement of the residual cash liability relating to our silver sale agreement with Wheaton Precious Metals Corp.
After adjusting for items that are not indicative of future operating earnings, adjusted net earnings1 of $726 million for the three months ended September 30, 2020 were 75% higher than the prior quarter. The increase in adjusted net earnings1 was mainly due to the higher realized gold price1 as discussed above, combined with higher gold sales volumes following the export of the remaining stockpiled concentrate in Tanzania, combined with higher production at Carlin and Pueblo Viejo following completion of scheduled plant maintenance in the prior quarter. This was partially offset by reduced production and sales volumes at Porgera as the mine entered care and maintenance on April 25, 2020, as well as at Cortez mainly from a decrease in trucking of open pit stockpiles to Carlin and lower grades from Cortez Hills Underground.
Factors affecting net earnings and adjusted net earnings1 - three months ended September 30, 2020 versus September 30, 2019
Net earnings for the third quarter of 2020 were $882 million compared to $2,277 million in the same prior year period. The decrease was mainly due to:
| a gain of $1.9 billion ($1.5 billion net of taxes) relating to the remeasurement of Turquoise Ridge to fair value as a result of its contribution to Nevada Gold Mines occurring in the same prior year period; and |
| an impairment reversal of $947 million ($663 million net of taxes) at Lumwana occurring in the same prior year period; partially offset by |
| a gain of $104 million (no tax impact) on the remeasurement of the residual cash liability relating to our silver sale agreement with Wheaton Precious Metals Corp. in the current year period. |
After adjusting for items that are not indicative of future operating earnings, adjusted net earnings1 of $726 million in the third quarter of 2020 were $462 million higher than the same prior year period. The increase was primarily due to the higher realized gold price1 of $1,926 per ounce in the three months ended September 30, 2020 compared to $1,476 per ounce in the same prior year period. This was partially offset by lower gold sales volumes, as a result of Porgera being placed on care and maintenance on April 25, 2020, combined with the sale of our 50% interest in Kalgoorlie on November 28, 2019. These impacts were partially offset by higher production at North Mara as a result of the lifting of the July 2019 Prohibition Notice which had resulted in the closure of the tailings storage facility and shut down of the processing plant during the third quarter of 2019 and the export of the remaining stockpiled concentrate in Tanzania in the current year period.
The significant adjusting item in the three months ended September 30, 2020 was:
| $103 million ($90 million before tax and non-controlling interest) in other expense adjustments, mainly related to a gain of $104 million (no tax impact) on the remeasurement of the residual cash liability relating to our silver sale agreement with Wheaton Precious Metals Corp., partially offset by care and maintenance expenses at Porgera and donations relating to Covid-19 |
Refer to page 83 for a full list of reconciling items between net earnings and adjusted net earnings1 for the current and previous periods.
Factors affecting net earnings and adjusted net earnings1 - nine months ended September 30, 2020 versus September 30, 2019
Net earnings for the nine months ended September 30, 2020 were $1,639 million compared to $2,582 million in the same prior year period. The decrease was mainly due to:
| a gain of $1.9 billion ($1.5 billion net of taxes) relating to the remeasurement of Turquoise Ridge to fair value as a result of its contribution to Nevada Gold Mines occurring in the prior year period; and |
| an impairment reversal of $947 million ($663 million net of taxes) at Lumwana occurring in the prior year period; partially offset by current year items consisting of: |
| a net impairment reversal of $111 million ($332 million before tax) resulting from the agreement with the GoT being signed and made effective in the first quarter of 2020; |
| a gain of $104 million (no tax impact) on the remeasurement of the residual cash liability relating to our silver sale agreement with Wheaton Precious Metals Corp.; and |
| a gain of $54 million (no tax impact) on the sale of Massawa. |
Numerical annotations throughout the text of this document refer to the endnotes found on page 107.
BARRICK THIRD QUARTER 2020 | 27 | MANAGEMENTS DISCUSSION AND ANALYSIS |
After adjusting for items that are not indicative of future operating earnings, adjusted net earnings1 of $1,426 million for the nine months ended September 30, 2020 were $824 million higher than the same prior year period. The significant increase in adjusted net earnings was primarily due to the higher realized gold price1 of $1,748 per ounce in the nine months ended September 30, 2020 compared to $1,365 per ounce in the same prior year period, combined with the impact of the formation of Nevada Gold Mines on July 1, 2019. Gold sales volumes in the current period were further impacted by the re-commencement of exports of concentrate stockpiled in Tanzania. This was partially offset by lower grades mined and processed at Cortez as mining from CHOP was completed in the second quarter of 2019, Porgera entering care and maintenance on April 25, 2020, and the sale of our 50% interest in Kalgoorlie on November 28, 2019. Gold production was further impacted by the exclusion of Golden Sunlight and Morila after the second quarter of 2019 and Lagunas Norte after the third quarter of 2019 from our production calculation upon entering care and maintenance, and by the impact of the Covid-19 pandemic at Veladero, where movement and social distancing restrictions slowed the remobilization of employees and contractors back to site after quarantine restrictions were lifted in April.
Significant adjusting items in the nine months ended September 30, 2020 include:
| $94 million ($309 million before tax and non-controlling interest) in net impairment reversals, primarily relating to the Tanzanian assets; |
| $117 million in significant tax adjustments mainly due to deferred tax recoveries as a result of tax reform measures in Argentina and adjustments made in recognition of the net settlement of all outstanding disputes with the GoT; and |
| $54 million (no tax impact) in acquisition/disposition gains mainly relating to the sale of Massawa; partly offset by |
| $21 million ($56 million before tax and non-controlling interest) in other expense adjustments, primarily related to the impact of changes in the discount rate assumptions on our closed mine rehabilitation provision, care and maintenance expenses at Porgera and donations related to Covid-19, partially offset by a gain of $104 million (no tax impact) on the remeasurement of the residual cash liability relating to our silver sale agreement with Wheaton Precious Metals Corp. |
Refer to page 83 for a full list of reconciling items between net earnings and adjusted net earnings1 for the current and previous periods.
Factors affecting Operating Cash Flow and Free Cash Flow1 - three months ended September 30, 2020 versus June 30, 2020
In the three months ended September 30, 2020, we generated $1,859 million in operating cash flow, compared to $1,031 million in the prior quarter. The increase of $828 million was primarily due to the higher realized gold price1 of $1,926 per ounce in the three months ended September 30, 2020 compared to $1,725 per ounce in the prior quarter. This was combined with lower cash taxes paid and interest paid due to the timing of payments.
Free cash flow1 for the three months ended September 30, 2020 was $1,311 million, compared to $522 million in the prior quarter, reflecting higher operating cash flows, partially offset by higher capital expenditures. In the third quarter of 2020, capital expenditures on a cash basis were $548 million compared to $509 million in the prior quarter. The increase in capital expenditures is primarily due to higher project capital expenditures, namely the water management initiatives at North Mara, the Gounkoto underground expansion and the re-start of underground mining operations at Bulyanhulu.
Factors affecting Operating Cash Flow and Free Cash Flow1 - three months ended September 30, 2020 versus September 30, 2019
In the third quarter of 2020, we generated $1,859 million in operating cash flow, compared to $1,004 million in the same prior year period. The increase of $855 million was primarily due to the higher realized gold price1 of $1,926 per ounce in the three months ended September 30, 2020 compared to $1,476 per ounce in the same prior year period, partially offset by lower gold sales volume and higher cash taxes paid.
In the third quarter of 2020, we generated free cash flow1 of $1,311 million compared to $502 million in the same prior year period. The increase primarily reflects higher operating cash flows, partially offset by higher capital expenditures. In the third quarter of 2020, capital expenditures on a cash basis were $548 million compared to $502 million in the third quarter of 2019. The increase in capital expenditures of $46 million was primarily due to higher project capital expenditures, namely the water management initiatives at North Mara, the Gounkoto underground expansion, the re-start of underground mining operations at Bulyanhulu and the commencement of early works expenditures for the proposed plant and tailings expansion project at Pueblo Viejo.
BARRICK THIRD QUARTER 2020 | 28 | MANAGEMENTS DISCUSSION AND ANALYSIS |
Factors affecting Operating Cash Flow and Free Cash Flow1 - nine months ended September 30, 2020 versus September 30, 2019
For the nine months ended September 30, 2020, we generated $3,779 million in operating cash flow, compared to $1,958 million in the same prior year period. The increase of $1,821 million was primarily due to the higher realized gold price1 of $1,748 per ounce in the nine months ended September 30, 2020 compared to $1,365 per ounce in the same prior year period, partially offset by lower gold sales volume and higher cash taxes paid.
For the nine months ended September 30, 2020, we generated free cash flow1 of $2,271 million compared to $703 million in the same prior year period. The increase primarily reflects higher operating cash flows, partially offset by higher capital expenditures. In the nine months ended September 30, 2020, capital expenditures on a cash basis were $1,508 million compared to $1,255 million in the same prior year period. Higher capital expenditures of $253 million were primarily due to the impact of the sites acquired as part of the formation of Nevada Gold Mines on July 1, 2019, which is consolidated and included at 100%. This was further impacted by increased capitalized stripping at Loulo-Gounkoto and our investment on the tailings storage facility and other water management initiatives at North Mara.
Key Business Developments
BARRICK THIRD QUARTER 2020 | 29 | MANAGEMENTS DISCUSSION AND ANALYSIS |
BARRICK THIRD QUARTER 2020 | 30 | MANAGEMENTS DISCUSSION AND ANALYSIS |
BARRICK THIRD QUARTER 2020 | 31 | MANAGEMENTS DISCUSSION AND ANALYSIS |
Environmental and Social Governance (ESG)
BARRICK THIRD QUARTER 2020 | 32 | MANAGEMENTS DISCUSSION AND ANALYSIS |
BARRICK THIRD QUARTER 2020 | 33 | MANAGEMENTS DISCUSSION AND ANALYSIS |
BARRICK THIRD QUARTER 2020 | 34 | MANAGEMENTS DISCUSSION AND ANALYSIS |
BARRICK THIRD QUARTER 2020 | 35 | MANAGEMENTS DISCUSSION AND ANALYSIS |
BARRICK THIRD QUARTER 2020 | 36 | MANAGEMENTS DISCUSSION AND ANALYSIS |
Operating Division Guidance
Our 2020 forecast gold and copper production, cost of salesa, total cash costsb, all-in sustaining costsb, and C1 cash costsb ranges by operating division are as follows:
Operating Division | 2020 forecast attributable production (000s ozs) |
2020 forecast cost
of salesa ($/oz) |
2020 forecast total
cash costsb ($/oz) |
2020 forecast all-in
sustaining costsb ($/oz) |
||||||||||||
Gold | ||||||||||||||||
Carlin (61.5%)c |
1,000 - 1,050 | 920 - 970 | 760 - 810 | 1,000 - 1,050 | ||||||||||||
Cortez (61.5%) |
450 - 480 | 980 - 1,030 | 640 - 690 | 910 - 960 | ||||||||||||
Turquoise Ridge (61.5%) |
430 - 460 | 900 - 950 | 540 - 590 | 690 - 740 | ||||||||||||
Phoenix (61.5%) |
100 - 120 | 1,850 - 1,900 | 700 - 750 | 920 - 970 | ||||||||||||
Long Canyon (61.5%) |
130 - 150 | 910 - 960 | 240 - 290 | 450 - 500 | ||||||||||||
Nevada Gold Mines (61.5%) |
2,100 - 2,250 | 970 - 1,020 | 660 - 710 | 880 - 930 | ||||||||||||
Hemlo |
200 - 220 | 960 - 1,010 | 800 - 850 | 1,200 - 1,250 | ||||||||||||
North America |
2,300 - 2,450 | 970 - 1,020 | 660 - 710 | 900 - 950 | ||||||||||||
Pueblo Viejo (60%) |
530 - 580 | 840 - 890 | 520 - 570 | 720 - 770 | ||||||||||||
Veladero (50%) |
240 - 270 | 1,220 - 1,270 | 670 - 720 | 1,250 - 1,300 | ||||||||||||
Porgera (47.5%)d |
||||||||||||||||
Latin America & Asia Pacific |
800 - 900 | 930 - 980 | 610 - 660 | 890 - 940 | ||||||||||||
Loulo-Gounkoto (80%) |
500 - 540 | 1,050 - 1,100 | 620 - 670 | 970 - 1,020 | ||||||||||||
Kibali (45%) |
340 - 370 | 1,030 - 1,080 | 600 - 650 | 790 - 840 | ||||||||||||
North Mara (84%)e |
240 - 270 | 750 - 800 | 570 - 620 | 830 - 880 | ||||||||||||
Tongon (89.7%) |
240 - 260 | 1,390 - 1,440 | 680 - 730 | 740 - 790 | ||||||||||||
Bulyanhulu (84%)e |
30 - 50 | 1,210 - 1,260 | 790 - 840 | 1,110 - 1,160 | ||||||||||||
Buzwagi (84%)e |
80 - 100 | 850 - 900 | 820 - 870 | 850 - 900 | ||||||||||||
Africa & Middle East | 1,450 - 1,600 | 1,040 - 1,090 | 640 - 690 | 870 - 920 | ||||||||||||
Total Attributable to Barrickf,g,h | 4,600 - 5,000 | 980 - 1,030 | 650 - 700 | 920 - 970 | ||||||||||||
2020 forecast attributable production (M lbs) |
2020 forecast cost of salesa ($/lb) |
2020 forecast C1 cash costsb ($/lb) |
2020 forecast all-in sustaining costsb ($/lb) |
|||||||||||||
Copper | ||||||||||||||||
Lumwana |
250 - 280 | 2.20 - 2.40 | 1.50 - 1.70 | 2.30 - 2.60 | ||||||||||||
Zaldívar (50%) |
120 - 135 | 2.40 - 2.70 | 1.65 - 1.85 | 2.30 - 2.60 | ||||||||||||
Jabal Sayid (50%) |
60 - 70 | 1.75 - 2.00 | 1.40 - 1.60 | 1.50 - 1.70 | ||||||||||||
Total Copperh | 440 - 500 | 2.10 - 2.40 | 1.50 - 1.80 | 2.20 - 2.50 |
a. | Cost of sales applicable to gold per ounce is calculated using cost of sales applicable to gold on an attributable basis (removing the non-controlling interest of 38.5% of Nevada Gold Mines (including 63.1% of South Arturo), 40% of Pueblo Viejo, 20% of Loulo-Gounkoto, 10.3% of Tongon, and 16% of North Mara, Bulyanhulu and Buzwagi from cost of sales and including our proportionate share of cost of sales attributable to our equity method investments in Kibali), divided by attributable gold ounces sold. Cost of sales applicable to copper per pound is calculated using cost of sales applicable to copper including our proportionate share of cost of sales attributable to our equity method investments in Zaldívar and Jabal Sayid, divided by consolidated copper pounds sold (including our proportionate share of copper pounds sold from our equity method investments). |
b. | Total cash costs, all-in sustaining costs and C1 cash costs are non-GAAP financial performance measures with no standardized meaning under IFRS and therefore may not be comparable to similar measures of performance presented by other issuers. For further information and a detailed reconciliation of the non-GAAP measures used in this section of the MD&A to the most directly comparable IFRS measures, please see pages 82 to 106 of this MD&A. |
c. | Includes our 36.9% share of South Arturo. |
d. | Based on the communication we received from the Government of Papua New Guinea that the SML will not be extended, Porgera was placed on temporary care and maintenance on April 25, 2020 to ensure the safety and security of our employees and communities. Due to the uncertainty related to the timing and scope of future developments on the mines operating outlook, our full year 2020 guidance for Porgera has been withdrawn. |
e. | Amounts are on an 84% basis as the GoTs 16% free-carried interest was made effective from January 1, 2020. |
f. | Total cash costs and all-in sustaining costs per ounce include the impact of hedges and/or costs allocated to non-operating sites. |
g. | Operating unit guidance ranges reflect expectations at each individual operating unit, and may not add up to the company-wide guidance range total. Guidance ranges exclude Pierina, Lagunas Norte, Golden Sunlight and Morila (40%). |
h. | Includes corporate administration costs. |
BARRICK THIRD QUARTER 2020 | 37 | MANAGEMENTS DISCUSSION AND ANALYSIS |
Production and Cost Summary - Gold
For the three months ended | ||||||||||||||||
9/30/20 | 6/30/20 | % Change | 9/30/19 | % Change | ||||||||||||
Nevada Gold Mines LLC (61.5%)a | ||||||||||||||||
Gold produced (000s oz) |
538 | 521 | 3 % | 535 | 1 % | |||||||||||
Cost of sales ($/oz) |
1,060 | 1,055 | 0 % | 1,027 | 3 % | |||||||||||
Total cash costs ($/oz)b |
723 | 728 | (1)% | 693 | 4 % | |||||||||||
All-in sustaining costs ($/oz)b |
956 | 985 | (3)% | 946 | 1 % | |||||||||||
Carlin (61.5%)c |
||||||||||||||||
Gold produced (000s oz) |
276 | 235 | 17 % | 278 | (1)% | |||||||||||
Cost of sales ($/oz) |
985 | 1,037 | (5)% | 1,007 | (2)% | |||||||||||
Total cash costs ($/oz)b |
800 | 850 | (6)% | 775 | 3 % | |||||||||||
All-in sustaining costs ($/oz)b |
1,036 | 1,130 | (8)% | 1,014 | 2 % | |||||||||||
Cortez (61.5%)d |
||||||||||||||||
Gold produced (000s oz) |
113 | 132 | (14)% | 126 | (10)% | |||||||||||
Cost of sales ($/oz) |
1,060 | 870 | 22 % | 829 | 28 % | |||||||||||
Total cash costs ($/oz)b |
763 | 613 | 24 % | 570 | 34 % | |||||||||||
All-in sustaining costs ($/oz)b |
1,133 | 950 | 19 % | 772 | 47 % | |||||||||||
Turquoise Ridge (61.5%)e |
||||||||||||||||
Gold produced (000s oz) |
76 | 79 | (4)% | 82 | (7)% | |||||||||||
Cost of sales ($/oz) |
1,097 | 1,073 | 2 % | 1,077 | 2 % | |||||||||||
Total cash costs ($/oz)b |
745 | 753 | (1)% | 622 | 20 % | |||||||||||
All-in sustaining costs ($/oz)b |
805 | 829 | (3)% | 840 | (4)% | |||||||||||
Phoenix (61.5%)f |
||||||||||||||||
Gold produced (000s oz) |
30 | 35 | (14)% | 25 | 20 % | |||||||||||
Cost of sales ($/oz) |
1,773 | 1,726 | 3 % | 2,186 | (19)% | |||||||||||
Total cash costs ($/oz)b |
520 | 725 | (28)% | 1,010 | (49)% | |||||||||||
All-in sustaining costs ($/oz)b |
659 | 957 | (31)% | 1,622 | (59)% | |||||||||||
Long Canyon (61.5%)f |
||||||||||||||||
Gold produced (000s oz) |
43 | 40 | 8 % | 24 | 79 % | |||||||||||
Cost of sales ($/oz) |
877 | 1,009 | (13)% | 1,170 | (25)% | |||||||||||
Total cash costs ($/oz)b |
212 | 308 | (31)% | 353 | (40)% | |||||||||||
All-in sustaining costs ($/oz)b |
384 | 430 | (11)% | 714 | (46)% | |||||||||||
Pueblo Viejo (60%) | ||||||||||||||||
Gold produced (000s oz) |
129 | 111 | 16 % | 139 | (7)% | |||||||||||
Cost of sales ($/oz) |
791 | 935 | (15)% | 807 | (2)% | |||||||||||
Total cash costs ($/oz)b |
450 | 579 | (22)% | 504 | (11)% | |||||||||||
All-in sustaining costs ($/oz)b |
609 | 720 | (15)% | 631 | (3)% | |||||||||||
Loulo-Gounkoto (80%) | ||||||||||||||||
Gold produced (000s oz) |
139 | 141 | (1)% | 153 | (9)% | |||||||||||
Cost of sales ($/oz) |
1,088 | 1,012 | 8 % | 1,018 | 7 % | |||||||||||
Total cash costs ($/oz)b |
682 | 639 | 7 % | 630 | 8 % | |||||||||||
All-in sustaining costs ($/oz)b |
1,161 | 1,030 | 13 % | 966 | 20 % | |||||||||||
Kibali (45%) | ||||||||||||||||
Gold produced (000s oz) |
91 | 90 | 1 % | 91 | 0 % | |||||||||||
Cost of sales ($/oz) |
1,088 | 1,067 | 2 % | 1,187 | (8)% | |||||||||||
Total cash costs ($/oz)b |
617 | 617 | 0 % | 554 | 11 % | |||||||||||
All-in sustaining costs ($/oz)b |
817 | 739 | 11 % | 703 | 16 % | |||||||||||
Veladero (50%) | ||||||||||||||||
Gold produced (000s oz) |
44 | 49 | (10)% | 58 | (24)% | |||||||||||
Cost of sales ($/oz) |
1,136 | 1,228 | (7)% | 1,243 | (9)% | |||||||||||
Total cash costs ($/oz)b |
708 | 801 | (12)% | 773 | (8)% | |||||||||||
All-in sustaining costs ($/oz)b |
1,159 | 1,383 | (16)% | 1,142 | 1 % | |||||||||||
Porgera (47.5%)g | ||||||||||||||||
Gold produced (000s oz) |
| 24 | 75 | |||||||||||||
Cost of sales ($/oz) |
| 1,141 | 1,024 | |||||||||||||
Total cash costs ($/oz)b |
| 875 | 868 | |||||||||||||
All-in sustaining costs ($/oz)b |
| 1,046 | 1,053 |
BARRICK THIRD QUARTER 2020 | 38 | MANAGEMENTS DISCUSSION AND ANALYSIS |
Production and Cost Summary - Gold (continued)
For the three months ended | ||||||||||||||||
9/30/20 | 6/30/20 | % Change | 9/30/19 | % Change | ||||||||||||
Tongon (89.7%) | ||||||||||||||||
Gold produced (000s oz) |
64 | 64 | 0 % | 62 | 3 % | |||||||||||
Cost of sales ($/oz) |
1,329 | 1,275 | 4 % | 1,396 | (5)% | |||||||||||
Total cash costs ($/oz)b |
731 | 688 | 6 % | 793 | (8)% | |||||||||||
All-in sustaining costs ($/oz)b |
777 | 745 | 4 % | 869 | (11)% | |||||||||||
Hemlo | ||||||||||||||||
Gold produced (000s oz) |
55 | 54 | 2 % | 49 | 12 % | |||||||||||
Cost of sales ($/oz) |
1,257 | 1,268 | (1)% | 1,083 | 16 % | |||||||||||
Total cash costs ($/oz)b |
1,099 | 1,080 | 2 % | 953 | 15 % | |||||||||||
All-in sustaining costs ($/oz)b |
1,497 | 1,456 | 3 % | 1,280 | 17 % | |||||||||||
North Marah | ||||||||||||||||
Gold produced (000s oz) |
67 | 68 | (1)% | 29 | 131 % | |||||||||||
Cost of sales ($/oz) |
903 | 1,040 | (13)% | 907 | 0 % | |||||||||||
Total cash costs ($/oz)b |
649 | 724 | (10)% | 603 | 8 % | |||||||||||
All-in sustaining costs ($/oz)b |
758 | 1,166 | (35)% | 850 | (11)% | |||||||||||
Buzwagih | ||||||||||||||||
Gold produced (000s oz) |
21 | 20 | 5 % | 18 | 17 % | |||||||||||
Cost of sales ($/oz) |
907 | 909 | 0 % | 1,292 | (30)% | |||||||||||
Total cash costs ($/oz)b |
687 | 751 | (9)% | 1,202 | (43)% | |||||||||||
All-in sustaining costs ($/oz)b |
693 | 770 | (10)% | 1,220 | (43)% | |||||||||||
Bulyanhuluh | ||||||||||||||||
Gold produced (000s oz) |
7 | 7 | 0 % | 6 | 17 % | |||||||||||
Cost of sales ($/oz) |
1,502 | 1,658 | (9)% | 1,288 | 17 % | |||||||||||
Total cash costs ($/oz)b |
874 | 950 | (8)% | 729 | 20 % | |||||||||||
All-in sustaining costs ($/oz)b |
913 | 1,014 | (10)% | 769 | 19 % | |||||||||||
Kalgoorlie (50%)i | ||||||||||||||||
Gold produced (000s oz) |
58 | (100)% | ||||||||||||||
Cost of sales ($/oz) |
1,037 | (100)% | ||||||||||||||
Total cash costs ($/oz)b |
856 | (100)% | ||||||||||||||
All-in sustaining costs ($/oz)b |
1,170 | (100)% | ||||||||||||||
Total Attributable to Barrickj,i | ||||||||||||||||
Gold produced (000s oz) |
1,155 | 1,149 | 1 % | 1,306 | (12)% | |||||||||||
Cost of sales ($/oz)k |
1,065 | 1,075 | (1)% | 1,065 | 0 % | |||||||||||
Total cash costs ($/oz)b |
696 | 716 | (3)% | 710 | (2)% | |||||||||||
All-in sustaining costs ($/oz)b |
966 | 1,031 | (6)% | 984 | (2)% |
a. | Represents the combined results of Cortez, Goldstrike (including our 60% share of South Arturo) and our 75% interest in Turquoise Ridge until June 30, 2019. Commencing July 1, 2019, the date Nevada Gold Mines was established, the results represent our 61.5% interest in Cortez, Carlin (including Goldstrike and 60% of South Arturo), Turquoise Ridge (including Twin Creeks), Phoenix and Long Canyon. |
b. | These are non-GAAP financial performance measures with no standardized meaning under IFRS and therefore may not be comparable to similar measures presented by other issuers. For further information and a detailed reconciliation of each non-GAAP measure used in this section of the MD&A to the most directly comparable IFRS measure, please see pages 82 to 106 of this MD&A. |
c. | On July 1, 2019, Barricks Goldstrike and Newmonts Carlin were contributed to Nevada Gold Mines and are now referred to as Carlin. As a result, the amounts presented represent Goldstrike on a 100% basis (including our 60% share of South Arturo) up until June 30, 2019, and the combined results of Carlin and Goldstrike (including NGMs 60% share of South Arturo) on a 61.5% basis thereafter. |
d. | On July 1, 2019, Cortez was contributed to Nevada Gold Mines, a joint venture with Newmont. As a result, the amounts presented are on an 100% basis up until June 30, 2019, and on a 61.5% basis thereafter. |
e. | Barrick owned 75% of Turquoise Ridge through to the end of the second quarter of 2019, with our joint venture partner, Newmont, owning the remaining 25%. Turquoise Ridge was proportionately consolidated on the basis that the joint venture partners that have joint control have rights to the assets and obligations for the liabilities relating to the arrangement. The figures presented in this table are based on our 75% interest in Turquoise Ridge until June 30, 2019. On July 1, 2019, Barricks 75% interest in Turquoise Ridge as well as Newmonts Twin Creeks and 25% interest in Turquoise Ridge were contributed to Nevada Gold Mines. Starting July 1, 2019, the results represent our 61.5% share of Turquoise Ridge and Twin Creeks, now referred to as Turquoise Ridge. |
f. | A 61.5% interest in these sites was acquired as a result of the formation of Nevada Gold Mines on July 1, 2019. |
g. | As Porgera was placed on care and maintenance on April 25, 2020, no operating data or per ounce data is provided. |
h. | Formerly part of Acacia Mining plc. On September 17, 2019, Barrick acquired all of the shares of Acacia it did not own. Operating results are included at 100% from October 1, 2019 to December 31, 2019 (notwithstanding the completion of the Acacia transaction on September 17, 2019, we consolidated our interest in Acacia and recorded a non-controlling interest of 36.1% in the income statement for the entirety of the third quarter of 2019 as a matter of convenience), and on an 84% basis thereafter as the GoTs 16% free-carried interest was made effective from January 1, 2020. |
i. | On November 28, 2019, we completed the sale of our 50% interest in Kalgoorlie in Western Australia to Saracen Mineral Holdings Limited for total cash consideration of $750 million. Accordingly, these represent our 50% interest until November 28, 2019. |
j. | Excludes Pierina; Lagunas Norte starting in the fourth quarter of 2019; and Golden Sunlight and Morila (40%) starting in the third quarter of 2019 which are producing incidental ounces as they reach the end of their mine lives. |
k. | Cost of sales per ounce (Barricks share) is calculated as gold cost of sales on an attributable basis (excluding sites in care and maintenance) divided by gold attributable ounces sold. |
BARRICK THIRD QUARTER 2020 | 39 | MANAGEMENTS DISCUSSION AND ANALYSIS |
Production and Cost Summary - Copper
For the three months ended | ||||||||||||||||
9/30/20 | 6/30/20 | % Change | 9/30/19 | % Change | ||||||||||||
Lumwana | ||||||||||||||||
Copper production (millions lbs) |
62 | 72 | (14)% | 65 | (5)% | |||||||||||
Cost of sales ($/lb) |
2.06 | 2.06 | 0 % | 2.04 | 1 % | |||||||||||
C1 cash costs ($/lb)a |
1.49 | 1.55 | (4)% | 1.83 | (19)% | |||||||||||
All-in sustaining costs ($/lb)a |
2.58 | 2.27 | 14 % | 3.66 | (30)% | |||||||||||
Zaldívar (50%) | ||||||||||||||||
Copper production (millions lbs) |
24 | 28 | (14)% | 32 | (25)% | |||||||||||
Cost of sales ($/lb) |
2.20 | 2.52 | (13)% | 2.18 | 1 % | |||||||||||
C1 cash costs ($/lb)a |
1.64 | 1.79 | (8)% | 1.55 | 6 % | |||||||||||
All-in sustaining costs ($/lb)a |
2.27 | 2.09 | 9 % | 1.91 | 19 % | |||||||||||
Jabal Sayid (50%) | ||||||||||||||||
Copper production (millions lbs) |
17 | 20 | (15)% | 15 | 13 % | |||||||||||
Cost of sales ($/lb) |
1.43 | 1.41 | 1 % | 1.63 | (12)% | |||||||||||
C1 cash costs ($/lb)a |
1.14 | 1.14 | 0 % | 1.42 | (20)% | |||||||||||
All-in sustaining costs ($/lb)a |
1.17 | 1.41 | (17)% | 1.65 | (29)% | |||||||||||
Total Copper | ||||||||||||||||
Copper production (millions lbs) |
103 | 120 | (14)% | 112 | (8)% | |||||||||||
Cost of sales ($/lb)b |
1.97 | 2.08 | (5)% | 2.00 | (2)% | |||||||||||
C1 cash costs ($/lb)a |
1.45 | 1.55 | (6)% | 1.62 | (10)% | |||||||||||
All-in sustaining costs ($/lb)a |
2.31 | 2.15 | 7 % | 2.58 | (10)% |
a. | These are non-GAAP financial performance measures with no standardized meaning under IFRS and therefore may not be comparable to similar measures presented by other issuers. For further information and a detailed reconciliation of each non-GAAP measure used in this section of the MD&A to the most directly comparable IFRS measure, please see pages 82 to 106 of this MD&A. |
b. | Cost of sales per pound (Barricks share) is calculated as copper cost of sales plus our equity share of cost of sales attributable to Zaldívar and Jabal Sayid divided by copper attributable pounds sold. |
OPERATING DIVISIONS PERFORMANCE
BARRICK THIRD QUARTER 2020 | 40 | MANAGEMENTS DISCUSSION AND ANALYSIS |
Nevada Gold Mines (61.5% basis)a, Nevada USA
Summary of Operating and Financial Data | For the three months ended | For the nine months ended | ||||||||||||||||||||||||
9/30/20 | 6/30/20 | % Change | 9/30/19 | % Change | 9/30/20 | 9/30/19 | % Change | |||||||||||||||||||
Total tonnes mined (000s) | 56,896 | 52,132 | 9 % | 52,528 | 8 % | 165,545 | 136,189 | 22 % | ||||||||||||||||||
Open pit ore |
9,630 | 7,398 | 30 % | 7,706 | 25 % | 27,461 | 17,626 | 56 % | ||||||||||||||||||
Open pit waste |
45,974 | 43,421 | 6 % | 43,572 | 6 % | 134,204 | 115,245 | 16 % | ||||||||||||||||||
Underground |
1,292 | 1,313 | (2)% | 1,250 | 3 % | 3,880 | 3,318 | 17 % | ||||||||||||||||||
Average grade (grams/tonne) |
||||||||||||||||||||||||||
Open pit mined |
1.39 | 1.47 | (6)% | 0.77 | 80 % | 1.18 | 0.99 | 19 % | ||||||||||||||||||
Underground mined |
9.65 | 9.61 | 0 % | 9.97 | (3)% | 9.76 | 10.45 | (7)% | ||||||||||||||||||
Processed |
2.13 | 2.27 | (6)% | 2.02 | 5 % | 2.01 | 2.44 | (18)% | ||||||||||||||||||
Ore tonnes processed (000s) |
10,818 | 9,280 | 17 % | 10,211 | 6 % | 32,456 | 25,138 | 29 % | ||||||||||||||||||
Oxide mill |
3,244 | 3,254 | 0 % | 3,124 | 4 % | 9,687 | 5,294 | 83 % | ||||||||||||||||||
Roaster |
1,340 | 1,110 | 21 % | 1,309 | 2 % | 3,754 | 4,033 | (7)% | ||||||||||||||||||
Autoclave |
1,314 | 1,495 | (12)% | 1,316 | 0 % | 4,210 | 4,100 | 3 % | ||||||||||||||||||
Heap leach |
4,920 | 3,421 | 44 % | 4,462 | 10 % | 14,805 | 11,711 | 26 % | ||||||||||||||||||
Recovery rateb |
79 | % | 80 | % | (1)% | 82 | % | (4)% | 80 | % | 81 | % | (1)% | |||||||||||||
Oxide Millb |
74 | % | 72 | % | 3 % | 72 | % | 3 % | 73 | % | 78 | % | (6)% | |||||||||||||
Roaster |
86 | % | 87 | % | (2)% | 87 | % | (2)% | 86 | % | 87 | % | (1)% | |||||||||||||
Autoclave |
68 | % | 74 | % | (9)% | 79 | % | (14)% | 72 | % | 74 | % | (2)% | |||||||||||||
Gold produced (000s oz) |
538 | 521 | 3 % | 535 | 1 % | 1,585 | 1,633 | (3)% | ||||||||||||||||||
Oxide mill |
72 | 73 | (1)% | 76 | (5)% | 216 | 260 | (17)% | ||||||||||||||||||
Roaster |
288 | 252 | 14 % | 275 | 5 % | 800 | 784 | 2 % | ||||||||||||||||||
Autoclave |
107 | 122 | (12)% | 112 | (4)% | 357 | 392 | (9)% | ||||||||||||||||||
Heap leach |
71 | 74 | (4)% | 72 | (1)% | 212 | 197 | 7 % | ||||||||||||||||||
Gold sold (000s oz) |
542 | 522 | 4 % | 537 | 1 % | 1,592 | 1,658 | (4)% | ||||||||||||||||||
Revenue ($ millions) |
1,063 | 919 | 16 % | 804 | 32 % | 2,835 | 2,267 | 25 % | ||||||||||||||||||
Cost of sales ($ millions) |
571 | 546 | 4 % | 552 | 3 % | 1,644 | 1,462 | 12 % | ||||||||||||||||||
Income ($ millions) |
481 | 357 | 35 % | 237 | 103 % | 1,154 | 773 | 49 % | ||||||||||||||||||
EBITDA ($ millions)c |
633 | 503 | 26 % | 403 | 57 % | 1,598 | 1,202 | 33 % | ||||||||||||||||||
EBITDA marginc,d |
60 | % | 55 | % | 9 % | 50 | % | 20 % | 56 | % | 53 | % | 6 % | |||||||||||||
Capital expenditures ($ millions)e |
153 | 161 | (5)% | 164 | (7)% | 457 | 482 | (5)% | ||||||||||||||||||
Minesite sustaining |
118 | 124 | (5)% | 110 | 7 % | 364 | 256 | 42 % | ||||||||||||||||||
Project |
35 | 37 | (5)% | 54 | (35)% | 93 | 226 | (59)% | ||||||||||||||||||
Cost of sales ($/oz) |
1,060 | 1,055 | 0 % | 1,027 | 3 % | 1,039 | 881 | 18 % | ||||||||||||||||||
Total cash costs ($/oz)c |
723 | 728 | (1)% | 693 | 4 % | 714 | 608 | 17 % | ||||||||||||||||||
All-in sustaining costs ($/oz)c |
956 | 985 | (3)% | 946 | 1 % | 964 | 789 | 22 % | ||||||||||||||||||
All-in costs ($/oz)c |
1,025 | 1,052 | (3)% | 1,048 | (2%) | 1,023 | 926 | 10 % |
a. | Represents the combined results of Cortez, Goldstrike (including our 60% share of South Arturo) and our 75% interest in Turquoise Ridge until June 30, 2019. Commencing July 1, 2019, the date Nevada Gold Mines was established, the results represent our 61.5% interest in Cortez, Carlin (including Goldstrike and 60% of South Arturo), Turquoise Ridge (including Twin Creeks), Phoenix and Long Canyon. |
b. | Excludes the Gold Quarry (Mill 5) concentrator. |
c. | These are non-GAAP financial performance measures with no standardized meaning under IFRS and therefore may not be comparable to similar measures presented by other issuers. For further information and a detailed reconciliation of each non-GAAP measure used in this section of the MD&A to the most directly comparable IFRS measure, please see pages 82 to 106 of this MD&A. |
d. | Represents EBITDA divided by revenue. |
e. | Amounts presented exclude capitalized interest. |
On July 1, 2019, Nevada Gold Mines (NGM) was established, which includes Barricks Cortez, Goldstrike, Turquoise Ridge and Goldrush properties and Newmont Corporations (Newmont) Carlin, Twin Creeks, Phoenix, Long Canyon and Lone Tree properties. Barrick is the operator of the joint venture and owns 61.5%, with Newmont owning the remaining 38.5% of the joint venture. Refer to the following pages for a detailed discussion of Cortez, Carlin (including Goldstrike) and Turquoise Ridge (including Twin Creeks) results.
Regulatory Matters
In a Special Session of the Nevada Legislature, which commenced on July 31, 2020, the Legislature passed three resolutions proposing amendments to the Nevada Constitution to modify provisions regarding the Net Proceeds of Minerals tax. These resolutions require further approvals, including a statewide vote to become law. If any of those resolutions were to ultimately result in an amendment of the Nevada Constitution, a potentially multi-year process, it could significantly increase the State taxes paid by NGM. The Company is engaged in constructive discussions with affected stakeholders on these resolutions, the fiscal requirements of the State and the economic contributions of the Nevada mining industry.
BARRICK THIRD QUARTER 2020 | 41 | MANAGEMENTS DISCUSSION AND ANALYSIS |
Carlin (61.5% basis)a, Nevada USA
Summary of Operating and Financial Data | For the three months ended | For the nine months ended | ||||||||||||||||||||||||
9/30/20 | 6/30/20 | % Change | 9/30/19 | % Change | 9/30/20 | 9/30/19 | % Change | |||||||||||||||||||
Total tonnes mined (000s) | 20,147 | 15,793 | 28 % | 11,584 | 74 % | 53,059 | 35,704 | 49 % | ||||||||||||||||||
Open pit ore |
2,092 | 1,576 | 33 % | 1,627 | 29 % | 5,135 | 2,941 | 75 % | ||||||||||||||||||
Open pit waste |
17,234 | 13,407 | 29 % | 9,145 | 88 % | 45,541 | 31,012 | 47 % | ||||||||||||||||||
Underground |
821 | 810 | 1 % | 812 | 1 % | 2,383 | 1,751 | 36 % | ||||||||||||||||||
Average grade (grams/tonne) |
||||||||||||||||||||||||||
Open pit mined |
2.62 | 2.42 | 8 % | 1.44 | 82 % | 2.20 | 0.75 | 194 % | ||||||||||||||||||
Underground mined |
9.65 | 9.56 | 1 % | 8.61 | 12 % | 9.56 | 8.93 | 7 % | ||||||||||||||||||
Processed |
3.93 | 3.60 | 9 % | 3.33 | 18 % | 3.64 | 3.87 | (6)% | ||||||||||||||||||
Ore tonnes processed (000s) |
3,078 | 2,835 | 9 % | 3,188 | (3)% | 9,142 | 7,311 | 25 % | ||||||||||||||||||
Oxide mill |
718 | 764 | (6)% | 663 | 8 % | 2,151 | 663 | 224 % | ||||||||||||||||||
Roasters |
962 | 710 | 35 % | 980 | (2)% | 2,600 | 2,636 | (1)% | ||||||||||||||||||
Autoclave |
724 | 899 | (19)% | 810 | (11)% | 2,476 | 3,277 | (24)% | ||||||||||||||||||
Heap leach |
674 | 462 | 46 % | 735 | (8)% | 1,915 | 735 | 161 % | ||||||||||||||||||
Recovery rateb |
78 | % | 80 | % | (3)% | 81 | % | (4)% | 79 | % | 77 | % | 3 % | |||||||||||||
Roasters |
86 | % | 86 | % | 0 % | 87 | % | (2)% | 86 | % | 86 | % | 0 % | |||||||||||||
Autoclave |
49 | % | 64 | % | (24)% | 63 | % | (23)% | 59 | % | 60 | % | (1)% | |||||||||||||
Gold produced (000s oz) |
276 | 235 | 17 % | 278 | (1)% | 764 | 692 | 10 % | ||||||||||||||||||
Oxide mill |
12 | 8 | 49 % | 14 | (15)% | 29 | 14 | 107 % | ||||||||||||||||||
Roasters |
219 | 168 | 30 % | 213 | 3 % | 570 | 489 | 17 % | ||||||||||||||||||
Autoclave |
36 | 48 | (26)% | 38 | (7)% | 134 | 176 | (24)% | ||||||||||||||||||
Heap leach |
9 | 11 | (18)% | 13 | (31)% | 31 | 13 | 138 % | ||||||||||||||||||
Gold sold (000s oz) |
275 | 234 | 18 % | 272 | 1 % | 765 | 692 | 11 % | ||||||||||||||||||
Revenue ($ millions) |
524 | 402 | 30 % | 401 | 31% | 1,333 | 947 | 41 % | ||||||||||||||||||
Cost of sales ($ millions) |
271 | 243 | 12 % | 274 | (1)% | 762 | 703 | 8 % | ||||||||||||||||||
Income ($ millions) |
247 | 151 | 64 % | 121 | 104 % | 551 | 237 | 132 % | ||||||||||||||||||
EBITDA ($ millions)c |
297 | 195 | 52 % | 183 | 62 % | 694 | 418 | 66 % | ||||||||||||||||||
EBITDA marginc,d |
57 | % | 49 | % | 16 % | 46 | % | 24 % | 52 | % | 44 | % | 18 % | |||||||||||||
Capital expenditures ($ millions) |
59 | 60 | (2)% | 56 | 5 % | 174 | 160 | 9 % | ||||||||||||||||||
Minesite sustaining |
59 | 60 | (2)% | 56 | 5 % | 174 | 160 | 9 % | ||||||||||||||||||
Project |
0 | 0 | 0 % | 0 | 0 % | 0 | 0 | 0 % | ||||||||||||||||||
Cost of sales ($/oz) |
985 | 1,037 | (5)% | 1,007 | (2)% | 996 | 1,015 | (2)% | ||||||||||||||||||
Total cash costs ($/oz)c |
800 | 850 | (6)% | 775 | 3 % | 807 | 738 | 9 % | ||||||||||||||||||
All-in sustaining costs ($/oz)c |
1,036 | 1,130 | (8)% | 1,014 | 2 % | 1,055 | 992 | 6 % | ||||||||||||||||||
All-in costs ($/oz)c |
1,036 | 1,130 | (8)% | 1,014 | 2% | 1,055 | 992 | 6 % |
a. | On July 1, 2019, Barricks Goldstrike and Newmonts Carlin were contributed to Nevada Gold Mines and are now referred to as Carlin. As a result, the amounts presented represent Goldstrike on a 100% basis (including our 60% share of South Arturo) up until June 30, 2019, and the combined results of Carlin and Goldstrike (including NGMs 60% share of South Arturo) on a 61.5% basis thereafter. |
b. | Excludes the Gold Quarry (Mill 5) concentrator. |
c. | These are non-GAAP financial performance measures with no standardized meaning under IFRS and therefore may not be comparable to similar measures presented by other issuers. For further information and a detailed reconciliation of each non-GAAP measure used in this section of the MD&A to the most directly comparable IFRS measure, please see pages 82 to 106 of this MD&A. |
d. | Represents EBITDA divided by revenue. |
BARRICK THIRD QUARTER 2020 | 42 | MANAGEMENTS DISCUSSION AND ANALYSIS |
BARRICK THIRD QUARTER 2020 | 43 | MANAGEMENTS DISCUSSION AND ANALYSIS |
Cortez (61.5% basis)a, Nevada USA
Summary of Operating and Financial Data | For the three months ended | For the nine months ended | ||||||||||||||||||||||||||||||
9/30/20 | 6/30/20 | % Change | 9/30/19 | % Change | 9/30/20 | 9/30/19 | % Change | |||||||||||||||||||||||||
Total tonnes mined (000s) |
20,494 | 20,719 | (1)% | 23,357 | (12)% | 63,909 | 82,527 | (23)% | ||||||||||||||||||||||||
Open pit ore |
2,755 | 1,792 | 54 % | 2,158 | 28 % | 9,114 | 10,764 | (15)% | ||||||||||||||||||||||||
Open pit waste |
17,480 | 18,639 | (6)% | 20,948 | (17)% | 53,960 | 70,754 | (24)% | ||||||||||||||||||||||||
Underground |
259 | 288 | (10)% | 251 | 3 % | 835 | 1,009 | (17)% | ||||||||||||||||||||||||
Average grade (grams/tonne) |
||||||||||||||||||||||||||||||||
Open pit mined |
0.47 | 0.50 | (6)% | 0.42 | 11 % | 0.46 | 1.00 | (54)% | ||||||||||||||||||||||||
Underground mined |
9.44 | 10.29 | (8)% | 11.41 | (17)% | 10.16 | 10.39 | (2)% | ||||||||||||||||||||||||
Processed |
1.34 | 1.87 | (28)% | 1.54 | (13)% | 1.33 | 1.68 | (21)% | ||||||||||||||||||||||||
Ore tonnes processed (000s) |
3,301 | 2,381 | 39 % | 2,837 | 16 % | 10,466 | 13,324 | (21)% | ||||||||||||||||||||||||
Oxide mill |
590 | 613 | (4)% | 654 | (10)% | 1,874 | 2,824 | (34)% | ||||||||||||||||||||||||
Roasters |
378 | 400 | (6)% | 329 | 15 % | 1,154 | 1,397 | (17)% | ||||||||||||||||||||||||
Heap leach |
2,333 | 1,368 | 71 % | 1,854 | 26 % | 7,438 | 9,103 | (18)% | ||||||||||||||||||||||||
Recovery rate |
82 | % | 84 | % | (2)% | 84 | % | (2)% | 82 | % | 89 | % | (8)% | |||||||||||||||||||
Oxide Mill |
73 | % | 75 | % | (2)% | 79 | % | (7)% | 74 | % | 80 | % | (8)% | |||||||||||||||||||
Roasters |
86 | % | 87 | % | (1)% | 86 | % | 0 % | 87 | % | 87 | % | 0 % | |||||||||||||||||||
Gold produced (000s oz) |
113 | 132 | (14)% | 126 | (10)% | 373 | 668 | (44)% | ||||||||||||||||||||||||
Oxide mill |
28 | 30 | (7)% | 34 | (18)% | 84 | 218 | (61)% | ||||||||||||||||||||||||
Roasters |
69 | 84 | (18)% | 62 | 11% | 230 | 295 | (22)% | ||||||||||||||||||||||||
Heap leach |
16 | 18 | (9)% | 30 | (46)% | 59 | 155 | (62)% | ||||||||||||||||||||||||
Gold sold (000s oz) |
115 | 132 | (13)% | 126 | (9)% | 375 | 666 | (44)% | ||||||||||||||||||||||||
Revenue ($ millions) |
220 | 226 | (3)% | 185 | 19% | 649 | 892 | (27)% | ||||||||||||||||||||||||
Cost of sales ($ millions) |
122 | 115 | 6 % | 105 | 16 % | 349 | 484 | (28)% | ||||||||||||||||||||||||
Income ($ millions) |
96 | 109 | (12)% | 77 | 25 % | 294 | 390 | (25)% | ||||||||||||||||||||||||
EBITDA ($ millions)b |
129 | 144 | (10)% | 109 | 18 % | 395 | 551 | (28)% | ||||||||||||||||||||||||
EBITDA marginb,c |
59 | % | 64 % | (8)% | 59 | % | 0 % | 61 | % | 62 | % | (2)% | ||||||||||||||||||||
Capital expenditures ($ millions)d |
52 | 52 | 0 % | 53 | (2)% | 154 | 212 | (27)% | ||||||||||||||||||||||||
Minesite sustaining |
39 | 42 | (7)% | 22 | 77 % | 127 | 50 | 154% | ||||||||||||||||||||||||
Project |
13 | 10 | 30 % | 31 | (58)% | 27 | 162 | (83)% | ||||||||||||||||||||||||
Cost of sales ($/oz) |
1,060 | 870 | 22 % | 829 | 28 % | 931 | 725 | 28 % | ||||||||||||||||||||||||
Total cash costs ($/oz)b |
763 | 613 | 24 % | 570 | 34 % | 660 | 482 | 37 % | ||||||||||||||||||||||||
All-in sustaining costs ($/oz)b |
1,133 | 950 | 19 % | 772 | 47 % | 1,026 | 580 | 77 % | ||||||||||||||||||||||||
All-in costs ($/oz)b |
1,236 | 1,031 | 20 % | 1,020 | 21% | 1,096 | 818 | 34 % |
a. | On July 1, 2019, Cortez was contributed to Nevada Gold Mines, a joint venture with Newmont. As a result, the amounts presented are on an 100% basis up until June 30, 2019, and on a 61.5% basis thereafter. |
b. | These are non-GAAP financial performance measures with no standardized meaning under IFRS and therefore may not be comparable to similar measures presented by other issuers. For further information and a detailed reconciliation of each non-GAAP measure used in this section of the MD&A to the most directly comparable IFRS measure, please see pages 82 to 106 of this MD&A. |
c. | Represents EBITDA divided by revenue. |
d. | Amounts presented exclude capitalized interest. |
BARRICK THIRD QUARTER 2020 | 44 | MANAGEMENTS DISCUSSION AND ANALYSIS |
BARRICK THIRD QUARTER 2020 | 45 | MANAGEMENTS DISCUSSION AND ANALYSIS |
Turquoise Ridge (61.5%)a, Nevada USA
Summary of Operating and Financial Data | For the three months ended | For the nine months ended | ||||||||||||||||||||||||||||||
9/30/20 | 6/30/20 | % Change | 9/30/19 | % Change | 9/30/20 | 9/30/19 | % Change | |||||||||||||||||||||||||
Total tonnes mined (000s) |
3,988 | 3,870 | 3 % | 4,811 | (17)% | 11,603 | 5,182 | 124 % | ||||||||||||||||||||||||
Open pit ore |
1,601 | 1,094 | 46 % | 732 | 119 % | 3,703 | 732 | 406 % | ||||||||||||||||||||||||
Open pit waste |
2,175 | 2,561 | (15)% | 3,892 | (44)% | 7,239 | 3,892 | 86 % | ||||||||||||||||||||||||
Underground |
212 | 215 | (1)% | 187 | 13 % | 661 | 558 | 18 % | ||||||||||||||||||||||||
Average grade (grams/tonne) |
||||||||||||||||||||||||||||||||
Open pit mined |
2.19 | 2.63 | (17)% | 1.01 | 117% | 2.25 | 1.01 | 122% | ||||||||||||||||||||||||
Underground mined |
9.89 | 8.96 | 10 % | 13.28 | (25)% | 9.95 | 14.57 | (32)% | ||||||||||||||||||||||||
Processed |
3.29 | 3.61 | (9)% | 3.78 | (13)% | 3.41 | 6.61 | (48)% | ||||||||||||||||||||||||
Ore tonnes processed (000s) |
968 | 821 | 18 % | 950 | 2 % | 2,649 | 1,267 | 109 % | ||||||||||||||||||||||||
Oxide Mill |
111 | 108 | 3 % | 107 | 4 % | 338 | 107 | 216 % | ||||||||||||||||||||||||
Autoclave |
590 | 596 | (1)% | 506 | 17 % | 1,734 | 823 | 111 % | ||||||||||||||||||||||||
Heap leach |
267 | 117 | 128 % | 337 | (21)% | 577 | 337 | 71 % | ||||||||||||||||||||||||
Recovery rate |
82 | % | 82 | % | 0 % | 89 | % | (8)% | 83 | % | 90 | % | (8)% | |||||||||||||||||||
Oxide Mill |
92 | % | 86 | % | 7 % | 87 | % | 6 % | 88 | % | 87 | % | 1 % | |||||||||||||||||||
Autoclave |
81 | % | 82 | % | (1)% | 89 | % | (9)% | 83 | % | 91 | % | (9)% | |||||||||||||||||||
Gold produced (000s oz) |
76 | 79 | (4)% | 82 | (7)% | 239 | 224 | 7 % | ||||||||||||||||||||||||
Oxide Mill |
4 | 3 | 33% | 5 | (20)% | 11 | 5 | 120 % | ||||||||||||||||||||||||
Autoclave |
71 | 74 | (4)% | 74 | (4)% | 222 | 216 | 3 % | ||||||||||||||||||||||||
Heap leach |
1 | 2 | (50)% | 3 | (67)% | 6 | 3 | 100 % | ||||||||||||||||||||||||
Gold sold (000s oz) |
76 | 79 | (4)% | 96 | (21)% | 242 | 257 | (6)% | ||||||||||||||||||||||||
Revenue ($ millions) |
148 | 134 | 10 % | 142 | 4 % | 421 | 352 | 20 % | ||||||||||||||||||||||||
Cost of sales ($ millions) |
84 | 84 | 0 % | 103 | (18)% | 258 | 205 | 26 % | ||||||||||||||||||||||||
Income ($ millions) |
62 | 48 | 29 % | 38 | 63 % | 157 | 145 | 8 % | ||||||||||||||||||||||||
EBITDA ($ millions)b |
87 | 73 | 19 % | 81 | 7 % | 238 | 203 | 17 % | ||||||||||||||||||||||||
EBITDA marginb,c |
59 | % | 54 | % | 9 % | 57 | % | 4 % | 57 | % | 58 | % | (3)% | |||||||||||||||||||
Capital expenditures ($ millions) |
13 | 9 | 45% | 26 | (50)% | 41 | 61 | (33)% | ||||||||||||||||||||||||
Minesite sustaining |
4 | 3 | 33 % | 18 | (78)% | 18 | 32 | (44)% | ||||||||||||||||||||||||
Project |
9 | 6 | 50 % | 8 | 13 % | 23 | 29 | (21)% | ||||||||||||||||||||||||
Cost of sales ($/oz) |
1,097 | 1,073 | 2 % | 1,077 | 2 % | 1,066 | 797 | 34 % | ||||||||||||||||||||||||
Total cash costs ($/oz)b |
745 | 753 | (1)% | 622 | 20 % | 720 | 570 | 26 % | ||||||||||||||||||||||||
All-in sustaining costs ($/oz)b |
805 | 829 | (3)% | 840 | (4)% | 813 | 710 | 15 % | ||||||||||||||||||||||||
All-in costs ($/oz)b |
929 | 894 | 4 % | 927 | 0 % | 908 | 825 | 10 % |
a. | Barrick owned 75% of Turquoise Ridge through to the end of the second quarter of 2019, with our joint venture partner, Newmont, owning the remaining 25%. Turquoise Ridge was proportionately consolidated on the basis that the joint venture partners that have joint control have rights to the assets and obligations for the liabilities relating to the arrangement. The figures presented in this table are based on our 75% interest in Turquoise Ridge until June 30, 2019. On July 1, 2019, Barricks 75% interest in Turquoise Ridge as well as Newmonts Twin Creeks and 25% interest in Turquoise Ridge were contributed to Nevada Gold Mines. Starting July 1, 2019, the results represent our 61.5% share of Turquoise Ridge and Twin Creeks, now referred to as Turquoise Ridge. |
b. | These are non-GAAP financial performance measures with no standardized meaning under IFRS and therefore may not be comparable to similar measures presented by other issuers. For further information and a detailed reconciliation of each non-GAAP measure used in this section of the MD&A to the most directly comparable IFRS measure, please see pages 82 to 106 of this MD&A. |
c. | Represents EBITDA divided by revenue. |
BARRICK THIRD QUARTER 2020 | 46 | MANAGEMENTS DISCUSSION AND ANALYSIS |
BARRICK THIRD QUARTER 2020 | 47 | MANAGEMENTS DISCUSSION AND ANALYSIS |
Other Mines - Nevada Gold Mines
Summary of Operating and Financial Data | For the three months ended | |||||||||||||||||||||||||||||||||||||||
9/30/20 | 6/30/20 | |||||||||||||||||||||||||||||||||||||||
Gold produced (000s oz) |
Cost of ($/oz) |
Total cash ($/oz)a |
All-in ($/oz)a |
Capital Expend- ituresb |
Gold produced (000s oz) |
Cost of ($/oz) |
Total cash ($/oz)a |
All-in ($/oz)a |
Capital Expend- ituresb |
|||||||||||||||||||||||||||||||
Phoenix (61.5%) |
30 | 1,773 | 520 | 659 | 4 | 35 | 1,726 | 725 | 957 | 8 | ||||||||||||||||||||||||||||||
Long Canyon (61.5%) |
43 | 877 | 212 | 384 | 6 | 40 | 1,009 | 308 | 430 | 3 |
a. | These are non-GAAP financial performance measures with no standardized meaning under IFRS and therefore may not be comparable to similar measures presented by other issuers. For further information and a detailed reconciliation of each non-GAAP measure used in this section of the MD&A to the most directly comparable IFRS measure, please see pages 82 to 106 of this MD&A. |
b. | Includes both minesite sustaining and project capital expenditures. |
BARRICK THIRD QUARTER 2020 | 48 | MANAGEMENTS DISCUSSION AND ANALYSIS |
Pueblo Viejo (60% basis)a, Dominican Republic
Summary of Operating and Financial Data | For the three months ended | For the nine months ended | ||||||||||||||||||||||||||||||
9/30/20 | 6/30/20 | % Change | 9/30/19 | % Change | 9/30/20 | 9/30/19 | % Change | |||||||||||||||||||||||||
Open pit tonnes mined (000s) | 5,328 | 4,647 | 15 % | 5,817 | (8)% | 14,014 | 19,003 | (26)% | ||||||||||||||||||||||||
Open pit ore |
1,777 | 1,469 | 21 % | 1,767 | 1 % | 3,873 | 5,002 | (23)% | ||||||||||||||||||||||||
Open pit waste |
3,551 | 3,178 | 12 % | 4,050 | (12)% | 10,141 | 14,001 | (28)% | ||||||||||||||||||||||||
Average grade (grams/tonne) |
||||||||||||||||||||||||||||||||
Open pit mined |
2.61 | 2.53 | 3 % | 2.98 | (13)% | 2.51 | 2.66 | (6)% | ||||||||||||||||||||||||
Processed |
3.60 | 3.45 | 4 % | 4.05 | (11)% | 3.50 | 3.79 | (8)% | ||||||||||||||||||||||||
Autoclave ore tonnes processed (000s) |
1,281 | 1,088 | 18 % | 1,182 | 8 % | 3,841 | 3,700 | 4 % | ||||||||||||||||||||||||
Recovery rate |
89 | % | 89 | % | 0 % | 90 | % | (2)% | 89 | % | 89 | % | 0 % | |||||||||||||||||||
Gold produced (000s oz) |
129 | 111 | 16 % | 139 | (7)% | 383 | 411 | (7)% | ||||||||||||||||||||||||
Gold sold (000s oz) |
129 | 115 | 12 % | 136 | (5)% | 388 | 410 | (5)% | ||||||||||||||||||||||||
Revenue ($ millions) |
246 | 201 | 22 % | 213 | 15% | 663 | 603 | 10 % | ||||||||||||||||||||||||
Cost of sales ($ millions) |
102 | 108 | (6)% | 109 | (6)% | 321 | 321 | 0 % | ||||||||||||||||||||||||
Income ($ millions) |
147 | 92 | 60 % | 104 | 41 % | 341 | 277 | 23 % | ||||||||||||||||||||||||
EBITDA ($ millions)b |
181 | 125 | 45 % | 133 | 36 % | 440 | 363 | 21 % | ||||||||||||||||||||||||
EBITDA marginb,c |
74 | % | 62 | % | 19 % | 62 | % | 19 % | 66 | % | 60 | % | 10 % | |||||||||||||||||||
Capital expenditures ($ millions) |
30 | 21 | 44 % | 16 | 88 % | 68 | 50 | 36 % | ||||||||||||||||||||||||
Minesite sustaining |
20 | 15 | 33 % | 16 | 25 % | 52 | 50 | 4 % | ||||||||||||||||||||||||
Project |
10 | 6 | 67 % | 0 | 100 % | 16 | 0 | 100 % | ||||||||||||||||||||||||
Cost of sales ($/oz) |
791 | 935 | (15)% | 807 | (2)% | 825 | 783 | 5 % | ||||||||||||||||||||||||
Total cash costs ($/oz)b |
450 | 579 | (22)% | 504 | (11)% | 508 | 492 | 3 % | ||||||||||||||||||||||||
All-in sustaining costs ($/oz)b |
609 | 720 | (15)% | 631 | (3)% | 648 | 623 | 4 % | ||||||||||||||||||||||||
All-in costs ($/oz)b |
697 | 763 | (9)% | 636 | 10 % | 694 | 632 | 10 % |
a. | Pueblo Viejo is accounted for as a subsidiary with a 40% non-controlling interest. The results in the table and the discussion that follows are based on our 60% share only. |
b. | These are non-GAAP financial performance measures with no standardized meaning under IFRS and therefore may not be comparable to similar measures presented by other issuers. For further information and a detailed reconciliation of each non-GAAP measure used in this section of the MD&A to the most directly comparable IFRS measure, please see pages 82 to 106 of this MD&A. |
c. | Represents EBITDA divided by revenue. |
BARRICK THIRD QUARTER 2020 | 49 | MANAGEMENTS DISCUSSION AND ANALYSIS |
BARRICK THIRD QUARTER 2020 | 50 | MANAGEMENTS DISCUSSION AND ANALYSIS |
Loulo-Gounkoto (80% basis)a, Mali
Summary of Operating and Financial Data | For the three months ended | For the nine months ended | ||||||||||||||||||||||||||||||
9/30/20 | 6/30/20 | % Change | 9/30/19 | % Change | 9/30/20 | 9/30/19 | % Change | |||||||||||||||||||||||||
Total tonnes mined (000s) |
8,145 | 8,736 | (7)% | 8,115 | 0 % | 24,454 | 24,942 | (2)% | ||||||||||||||||||||||||
Open pit ore |
155 | 57 | 172 % | 286 | (46)% | 810 | 1,646 | (51)% | ||||||||||||||||||||||||
Open pit waste |
7,416 | 8,145 | (9)% | 7,244 | 2 % | 21,967 | 21,617 | 2 % | ||||||||||||||||||||||||
Underground |
574 | 534 | 7 % | 585 | (2)% | 1,677 | 1,679 | 0 % | ||||||||||||||||||||||||
Average grade (grams/tonne) |
||||||||||||||||||||||||||||||||
Open pit mined |
2.07 | 1.54 | 35 % | 4.06 | (49)% | 6.03 | 4.27 | 41 % | ||||||||||||||||||||||||
Underground mined |
4.48 | 4.21 | 7 % | 5.09 | (12)% | 4.29 | 4.51 | (5)% | ||||||||||||||||||||||||
Processed |
4.74 | 4.92 | (4)% | 5.14 | (8)% | 4.87 | 4.69 | 4 % | ||||||||||||||||||||||||
Ore tonnes processed (000s) |
1,004 | 972 | 3 % | 1,013 | (1)% | 2,957 | 3,059 | (3)% | ||||||||||||||||||||||||
Recovery rate |
90 | % | 92 | % | (2)% | 92 | % | (2)% | 91 | % | 93 | % | (2)% | |||||||||||||||||||
Gold produced (000s oz) |
139 | 141 | (1)% | 153 | (9)% | 421 | 428 | (2)% | ||||||||||||||||||||||||
Gold sold (000s oz) |
136 | 157 | (14)% | 155 | (13)% | 416 | 431 | (3)% | ||||||||||||||||||||||||
Revenue ($ millions) |
264 | 272 | (3)% | 230 | 15 % | 730 | 592 | 23 % | ||||||||||||||||||||||||
Cost of sales ($ millions) |
149 | 160 | (7)% | 159 | (6)% | 430 | 452 | (5)% | ||||||||||||||||||||||||
Income ($ millions) |
92 | 107 | (14)% | 64 | 44 % | 267 | 125 | 114 % | ||||||||||||||||||||||||
EBITDA ($ millions)b |
147 | 167 | (12)% | 125 | 18 % | 429 | 303 | 42 % | ||||||||||||||||||||||||
EBITDA marginb,c |
56 | % | 61 | % | (8)% | 54 | % | 4 % | 59 | % | 51 | % | 15 % | |||||||||||||||||||
Capital expenditures ($ millions) |
71 | 55 | 29 % | 49 | 45 % | 158 | 98 | 61 % | ||||||||||||||||||||||||
Minesite sustaining |
62 | 55 | 12 % | 49 | 26 % | 149 | 96 | 55 % | ||||||||||||||||||||||||
Project |
9 | 0 | 100 % | 0 | 100 % | 9 | 2 | 350 % | ||||||||||||||||||||||||
Cost of sales ($/oz) |
1,088 | 1,012 | 8 % | 1,018 | 7 % | 1,034 | 1,047 | (1)% | ||||||||||||||||||||||||
Total cash costs ($/oz)b |
682 | 639 | 7 % | 630 | 8 % | 646 | 635 | 2 % | ||||||||||||||||||||||||
All-in sustaining costs ($/oz)b |
1,161 | 1,030 | 13 % | 966 | 20 % | 1,031 | 875 | 18 % | ||||||||||||||||||||||||
All-in costs ($/oz)b |
1,229 | 1,030 | 19 % | 971 | 27 % | 1,053 | 880 | 20 % |
a. | Barrick owns 80% of Société des Mines de Loulo SA and Société des Mines de Gounkoto with the Republic of Mali owning 20%. Loulo-Gounkoto is accounted for as a subsidiary with a 20% non-controlling interest on the basis that Barrick controls the asset. The results in the table and the discussion that follows are based on our 80% share, inclusive of the impact of the purchase price allocation resulting from the Merger. |
b. | These are non-GAAP financial performance measures with no standardized meaning under IFRS and therefore may not be comparable to similar measures presented by other issuers. For further information and a detailed reconciliation of each non-GAAP measure used in this section of the MD&A to the most directly comparable IFRS measure, please see pages 82 to 106 of this MD&A. |
c. | Represents EBITDA divided by revenue. |
BARRICK THIRD QUARTER 2020 | 51 | MANAGEMENTS DISCUSSION AND ANALYSIS |
BARRICK THIRD QUARTER 2020 | 52 | MANAGEMENTS DISCUSSION AND ANALYSIS |
Kibali (45% basis)a, Democratic Republic of Congo
Summary of Operating and Financial Data | For the three months ended | For the nine months ended | ||||||||||||||||||||||||||||||
9/30/20 | 6/30/20 | % Change | 9/30/19 | % Change | 9/30/20 | 9/30/19 | % Change | |||||||||||||||||||||||||
Total tonnes mined (000s) |
3,405 | 3,253 | 5 % | 3,077 | 11 % | 9,834 | 9,177 | 7 % | ||||||||||||||||||||||||
Open pit ore |
380 | 316 | 20 % | 269 | 41 % | 1,072 | 1,347 | (20)% | ||||||||||||||||||||||||
Open pit waste |
2,569 | 2,507 | 2 % | 2,330 | 10 % | 7,409 | 6,534 | 13 % | ||||||||||||||||||||||||
Underground |
456 | 430 | 6 % | 478 | (5)% | 1,353 | 1,296 | 4 % | ||||||||||||||||||||||||
Average grade (grams/tonne) |
||||||||||||||||||||||||||||||||
Open pit mined |
2.40 | 1.97 | 22 % | 2.26 | 6 % | 2.17 | 2.35 | (7)% | ||||||||||||||||||||||||
Underground mined |
5.01 | 5.25 | (5)% | 5.17 | (3)% | 5.14 | 5.27 | (3)% | ||||||||||||||||||||||||
Processed |
3.67 | 3.68 | 0 % | 3.74 | (2)% | 3.71 | 3.84 | (3)% | ||||||||||||||||||||||||
Ore tonnes processed (000s) |
862 | 857 | 1 % | 852 | 1 % | 2,557 | 2,542 | 1 % | ||||||||||||||||||||||||
Recovery rate |
90 | % | 89 | % | 1 % | 88 | % | 2 % | 89 | % | 89 | % | 0 % | |||||||||||||||||||
Gold produced (000s oz) |
91 | 90 | 1 % | 91 | 0 % | 272 | 279 | (2)% | ||||||||||||||||||||||||
Gold sold (000s oz) |
91 | 96 | (5)% | 89 | 3 % | 275 | 274 | 0 % | ||||||||||||||||||||||||
Revenue ($ millions) |
176 | 164 | 7 % | 133 | 32 % | 480 | 375 | 28 % | ||||||||||||||||||||||||
Cost of sales ($ millions) |
99 | 101 | (2)% | 107 | (7)% | 293 | 297 | (1)% | ||||||||||||||||||||||||
Income ($ millions) |
74 | 64 | 16 % | 25 | 196 % | 186 | 78 | 138 % | ||||||||||||||||||||||||
EBITDA ($ millions)b |
117 | 106 | 10 % | 82 | 43 % | 312 | 222 | 41 % | ||||||||||||||||||||||||
EBITDA marginb,c |
66 | % | 65 | % | 2 % | 62 | % | 6 % | 65 | % | 59 | % | 10 % | |||||||||||||||||||
Capital expenditures ($ millions) |
14 | 10 | 40 % | 14 | 0 % | 39 | 34 | 15 % | ||||||||||||||||||||||||
Minesite sustaining |
14 | 9 | 56 % | 13 | 8 % | 38 | 32 | 19 % | ||||||||||||||||||||||||
Project |
0 | 1 | (100)% | 1 | (100)% | 1 | 2 | (50)% | ||||||||||||||||||||||||
Cost of sales ($/oz) |
1,088 | 1,067 | 2 % | 1,187 | (8)% | 1,067 | 1,081 | (1)% | ||||||||||||||||||||||||
Total cash costs ($/oz)b |
617 | 617 | 0 % | 554 | 11 % | 606 | 555 | 9 % | ||||||||||||||||||||||||
All-in sustaining costs ($/oz)b |
817 | 739 | 11 % | 703 | 16 % | 776 | 678 | 14 % | ||||||||||||||||||||||||
All-in costs ($/oz)b |
823 | 750 | 10 % | 717 | 15 % | 781 | 685 | 14 % |
a. | Barrick owns 45% of Kibali Goldmines SA (Kibali) with the Democratic Republic of Congo (DRC) and our joint venture partner, AngloGold Ashanti, owning 10% and 45%, respectively. Kibali is accounted for as an equity method investment on the basis that the joint venture partners that have joint control have rights to the net assets of the joint venture. The figures presented in this table and the discussion that follows are based on our 45% effective interest in Kibali inclusive of the impact of the purchase price allocation resulting from the Merger. |
b. | These are non-GAAP financial performance measures with no standardized meaning under IFRS and therefore may not be comparable to similar measures presented by other issuers. For further information and a detailed reconciliation of each non-GAAP measure used in this section of the MD&A to the most directly comparable IFRS measure, please see pages 82 to 106 of this MD&A. |
c. | Represents EBITDA divided by revenue. |
BARRICK THIRD QUARTER 2020 | 53 | MANAGEMENTS DISCUSSION AND ANALYSIS |
BARRICK THIRD QUARTER 2020 | 54 | MANAGEMENTS DISCUSSION AND ANALYSIS |
Veladero (50% basis)a, Argentina
Summary of Operating and Financial Data | For the three months ended | For the nine months ended | ||||||||||||||||||||||||||||||
9/30/20 | 6/30/20 | % Change | 9/30/19 | % Change | 9/30/20 | 9/30/19 | % Change | |||||||||||||||||||||||||
Open pit tonnes mined (000s) |
6,930 | 5,015 | 38 % | 9,449 | (27)% | 20,225 | 26,481 | (24)% | ||||||||||||||||||||||||
Open pit ore |
3,385 | 2,630 | 29 % | 3,909 | (13)% | 9,886 | 11,220 | (12)% | ||||||||||||||||||||||||
Open pit waste |
3,545 | 2,385 | 49 % | 5,540 | (36)% | 10,339 | 15,261 | (32)% | ||||||||||||||||||||||||
Average grade (grams/tonne) |
||||||||||||||||||||||||||||||||
Open pit mined |
0.76 | 0.89 | (15)% | 0.68 | 12 % | 0.79 | 0.67 | 17 % | ||||||||||||||||||||||||
Processed |
0.79 | 0.93 | (15)% | 0.74 | 6 % | 0.83 | 0.75 | 11 % | ||||||||||||||||||||||||
Heap leach ore tonnes processed (000s) |
3,189 | 2,609 | 22 % | 3,463 | (8)% | 9,041 | 9,707 | (7)% | ||||||||||||||||||||||||
Gold produced (000s oz) |
44 | 49 | (10)% | 58 | (24)% | 168 | 203 | (17)% | ||||||||||||||||||||||||
Gold sold (000s oz) |
43 | 35 | 22 % | 59 | (28)% | 135 | 201 | (33)% | ||||||||||||||||||||||||
Revenue ($ millions) |
82 | 62 | 32 % | 89 | (8%) | 234 | 280 | (16)% | ||||||||||||||||||||||||
Cost of sales ($ millions) |
49 | 43 | 14 % | 72 | (32)% | 159 | 241 | (34)% | ||||||||||||||||||||||||
Income ($ millions) |
30 | 16 | 88 % | 14 | 114 % | 70 | 36 | 94 % | ||||||||||||||||||||||||
EBITDA ($ millions)b |
47 | 29 | 62 % | 39 | 21 % | 122 | 122 | 0 % | ||||||||||||||||||||||||
EBITDA marginb,c |
57 | % | 47 | % | 21 % | 44 % | 30 % | 52 | % | 44 | % | 18 % | ||||||||||||||||||||
Capital expenditures ($ millions) |
18 | 20 | (10)% | 19 | (5)% | 78 | 78 | 0 % | ||||||||||||||||||||||||
Minesite sustaining |
18 | 20 | (10)% | 19 | (5)% | 63 | 63 | 0 % | ||||||||||||||||||||||||
Project |
0 | 0 | 0 % | 0 | 0 % | 15 | 15 | 0 % | ||||||||||||||||||||||||
Cost of sales ($/oz) |
1,136 | 1,228 | (7)% | 1,243 | (9)% | 1,180 | 1,206 | (2)% | ||||||||||||||||||||||||
Total cash costs ($/oz)b |
708 | 801 | (12)% | 773 | (8)% | 766 | 742 | 3 % | ||||||||||||||||||||||||
All-in sustaining costs ($/oz)b |
1,159 | 1,383 | (16)% | 1,142 | 1 % | 1,263 | 1,093 | 16 % | ||||||||||||||||||||||||
All-in costs ($/oz)b |
1,159 | 1,383 | (16)% | 1,142 | 1% | 1,376 | 1,169 | 18 % |
a. | Barrick owns 50% of Veladero with our joint venture partner, Shandong Gold, owning the remaining 50%. Veladero is proportionately consolidated on the basis that the joint venture partners that have joint control have rights to the assets and obligations for the liabilities relating to the arrangement. The figures presented in this table and the discussion that follows are based on our 50% interest in Veladero inclusive of the impact of remeasurement of our interest in Veladero following the disposal of a 50% interest on June 30, 2017. |
b. | These are non-GAAP financial performance measures with no standardized meaning under IFRS and therefore may not be comparable to similar measures presented by other issuers. For further information and a detailed reconciliation of each non-GAAP measure used in this section of the MD&A to the most directly comparable IFRS measure, please see pages 82 to 106 of this MD&A. |
c. | Represents EBITDA divided by revenue. |
BARRICK THIRD QUARTER 2020 | 55 | MANAGEMENTS DISCUSSION AND ANALYSIS |
BARRICK THIRD QUARTER 2020 | 56 | MANAGEMENTS DISCUSSION AND ANALYSIS |
Porgera (47.5% basis)a, Papua New Guinea
Summary of Operating and Financial Data | For the three months ended | For the nine months ended | ||||||||||||||||||||||||||||||
9/30/2020b | 6/30/20 | % Change | 9/30/19 | % Change | 9/30/20 | 9/30/19 | % Change | |||||||||||||||||||||||||
Total tonnes mined (000s) |
| 654 | 3,657 | 3,463 | 10,276 | (66)% | ||||||||||||||||||||||||||
Open pit ore |
| 143 | 495 | 570 | 1,316 | (57)% | ||||||||||||||||||||||||||
Open pit waste |
| 452 | 2,914 | 2,622 | 8,282 | (68)% | ||||||||||||||||||||||||||
Underground |
| 59 | 248 | 271 | 678 | (60)% | ||||||||||||||||||||||||||
Average grade (grams/tonne) |
||||||||||||||||||||||||||||||||
Open pit mined |
| 1.75 | 2.07 | 1.72 | 1.86 | (8)% | ||||||||||||||||||||||||||
Underground mined |
| 5.40 | 5.88 | 5.72 | 6.22 | (8)% | ||||||||||||||||||||||||||
Processed |
| 3.16 | 3.33 | 3.01 | 3.26 | (8)% | ||||||||||||||||||||||||||
Autoclave ore tonnes processed (000s) |
| 200 | 705 | 936 | 1,935 | (52)% | ||||||||||||||||||||||||||
Recovery rate |
| 91 | % | 90 | % | 90 | % | 90 | % | 0 % | ||||||||||||||||||||||
Gold produced (000s oz) |
| 24 | 75 | 86 | 202 | (57)% | ||||||||||||||||||||||||||
Gold sold (000s oz) |
| 24 | 75 | 87 | 203 | (57)% | ||||||||||||||||||||||||||
Revenue ($ millions) |
| 39 | 111 | 140 | 280 | (50)% | ||||||||||||||||||||||||||
Cost of sales ($ millions) |
5 | 26 | (81 | )% | 76 | (93)% | 101 | 209 | (52)% | |||||||||||||||||||||||
Income/(loss) ($ millions) |
(17 | ) | (13 | ) | 31 | % | 33 | (152)% | (1) | 67 | (101)% | |||||||||||||||||||||
EBITDA ($ millions)c |
(13 | ) | (7 | ) | 86 | % | 44 | (130)% | 19 | 97 | (80)% | |||||||||||||||||||||
EBITDA marginc,d |
| (18 | )% | 40 | % | 14 | % | 35 | % | (61)% | ||||||||||||||||||||||
Capital expenditures ($ millions) |
1 | 2 | (50 | )% | 14 | (93)% | 11 | 34 | (68)% | |||||||||||||||||||||||
Minesite sustaining |
1 | 2 | (50 | )% | 14 | (93)% | 11 | 34 | (68)% | |||||||||||||||||||||||
Project |
0 | 0 | 0 | % | 0 | 0 % | 0 | 0 | 0 % | |||||||||||||||||||||||
Cost of sales ($/oz) |
| 1,141 | 1,024 | 1,168 | 1,029 | 14 % | ||||||||||||||||||||||||||
Total cash costs ($/oz)c |
| 875 | 868 | 925 | 871 | 6 % | ||||||||||||||||||||||||||
All-in sustaining costs ($/oz)c |
| 1,046 | 1,053 | 1,102 | 1,047 | 5 % | ||||||||||||||||||||||||||
All-in costs ($/oz)c |
| 1,046 | 1,053 | 1,102 | 1,047 | 5 % |
a. | Barrick owns 47.5% of Porgera with our joint venture partners, Zijin Mining and Mineral Resources Enga, owning the remaining 47.5% and 5%, respectively. Porgera is proportionately consolidated on the basis that the joint venture partners that have joint control have rights to the assets and obligations for the liabilities relating to the arrangement. The figures presented in this table and the discussion that follows are based on our 47.5% interest in Porgera. |
b. | As Porgera was placed on care and maintenance on April 25, 2020, no operating data or per ounce data is provided. |
c. | These are non-GAAP financial performance measures with no standardized meaning under IFRS and therefore may not be comparable to similar measures presented by other issuers. For further information and a detailed reconciliation of each non-GAAP measure used in this section of the MD&A to the most directly comparable IFRS measure, please see pages 82 to 106 of this MD&A. |
d. | Represents EBITDA divided by revenue. |
BARRICK THIRD QUARTER 2020 | 57 | MANAGEMENTS DISCUSSION AND ANALYSIS |
BARRICK THIRD QUARTER 2020 | 58 | MANAGEMENTS DISCUSSION AND ANALYSIS |
BARRICK THIRD QUARTER 2020 | 59 | MANAGEMENTS DISCUSSION AND ANALYSIS |
North Mara (84% basis)a, Tanzania
Summary of Operating and Financial Data | For the three months ended | For the nine months ended | ||||||||||||||||||||||||||||||
9/30/20 | 6/30/20 | % Change | 9/30/19 | % Change | 9/30/20 | 9/30/19 | % Change | |||||||||||||||||||||||||
Total tonnes mined (000s) |
247 | 766 | (68)% | 1,781 | (86)% | 3,462 | 6,858 | (50)% | ||||||||||||||||||||||||
Open pit ore |
n/a | 326 | n/a | 667 | n/a | 1,484 | 2,134 | (30)% | ||||||||||||||||||||||||
Open pit waste |
n/a | 204 | n/a | 970 | n/a | 1,197 | 4,242 | (72)% | ||||||||||||||||||||||||
Underground |
247 | 236 | 5 % | 144 | 72 % | 781 | 482 | 62 % | ||||||||||||||||||||||||
Average grade (grams/tonne) |
||||||||||||||||||||||||||||||||
Open pit mined |
n/a | 2.53 | n/a | 1.89 | n/a | 2.14 | 1.99 | 8 % | ||||||||||||||||||||||||
Underground mined |
5.13 | 9.95 | (48)% | 6.87 | (25)% | 6.28 | 7.64 | (18)% | ||||||||||||||||||||||||
Processed |
3.59 | 3.75 | (4)% | 5.58 | (36)% | 3.59 | 4.39 | (18)% | ||||||||||||||||||||||||
Ore tonnes processed (000s) |
622 | 611 | 2 % | 172 | 262 % | 1,869 | 1,117 | 67 % | ||||||||||||||||||||||||
Recovery rate |
93 | % | 93 | % | 0 % | 94 | % | (1)% | 93 | % | 94 | % | (1)% | |||||||||||||||||||
Gold produced (000s oz) |
67 | 68 | (1)% | 29 | 131 % | 200 | 148 | 35 % | ||||||||||||||||||||||||
Gold sold (000s oz) |
69 | 67 | 3 % | 36 | 91 % | 206 | 145 | 42 % | ||||||||||||||||||||||||
Revenue ($ millions) |
132 | 117 | 13 % | 56 | 137% | 360 | 198 | 82 % | ||||||||||||||||||||||||
Cost of sales ($ millions) |
61 | 71 | (14)% | 34 | 80 % | 198 | 132 | 50 % | ||||||||||||||||||||||||
Income ($ millions) |
72 | 44 | 63 % | 20 | 260 % | 165 | 60 | 175 % | ||||||||||||||||||||||||
EBITDA ($ millions)b |
89 | 65 | 36 % | 31 | 187 % | 224 | 100 | 125% | ||||||||||||||||||||||||
EBITDA marginb,c |
67 | % | 56 | % | 20 % | 56 | % | 20 % | 62 | % | 50 | % | 24 % | |||||||||||||||||||
Capital expenditures ($ millions) |
17 | 30 | (43)% | 9 | 89 % | 60 | 26 | 131 % | ||||||||||||||||||||||||
Minesite sustaining |
6 | 29 | (79)% | 8 | (25)% | 46 | 21 | 119 % | ||||||||||||||||||||||||
Project |
11 | 1 | 1,000% | 1 | 1,000 % | 14 | 5 | 180 % | ||||||||||||||||||||||||
Cost of sales ($/oz) |
903 | 1,040 | (13)% | 907 | 0 % | 967 | 905 | 7 % | ||||||||||||||||||||||||
Total cash costs ($/oz)b |
649 | 724 | (10)% | 603 | 8 % | 673 | 625 | 8 % | ||||||||||||||||||||||||
All-in sustaining costs ($/oz)b |
758 | 1,166 | (35)% | 850 | (11)% | 911 | 782 | 16 % | ||||||||||||||||||||||||
All-in costs ($/oz)b |
912 | 1,195 | (24)% | 886 | 3 % | 979 | 815 | 20 % |
a. | Formerly part of Acacia Mining plc. On September 17, 2019, Barrick acquired all of the shares of Acacia it did not own. The results are on a 63.9% basis until September 30, 2019 (notwithstanding the completion of the Acacia transaction on September 17, 2019, we consolidated our interest in Acacia and recorded a non-controlling interest of 36.1% in the income statement for the entirety of the third quarter of 2019 as a matter of convenience), on a 100% basis from October 1, 2019 to December 31, 2019 and on a 84% basis starting January 1, 2020, the date the GoTs 16% free carried interest was made effective. |
b. | These are non-GAAP financial performance measures with no standardized meaning under IFRS and therefore may not be comparable to similar measures presented by other issuers. For further information and a detailed reconciliation of each non-GAAP measure used in this section of the MD&A to the most directly comparable IFRS measure, please see pages 82 to 106 of this MD&A. |
c. | Represents EBITDA divided by revenue. |
BARRICK THIRD QUARTER 2020 | 60 | MANAGEMENTS DISCUSSION AND ANALYSIS |
BARRICK THIRD QUARTER 2020 | 61 | MANAGEMENTS DISCUSSION AND ANALYSIS |
Other Mines - Gold
Summary of Operating and Financial Data | For the three months ended | |||||||||||||||||||||||||||||||||||||||
9/30/20 | 6/30/20 | |||||||||||||||||||||||||||||||||||||||
Gold produced (000s oz) |
Cost of sales ($/oz) |
Total ($/oz)a |
All-in ($/oz)a |
Capital ituresb |
Gold produced (000s oz) |
Cost of ($/oz) |
Total cash ($/oz)a |
All-in ($/oz)a |
Capital Expend- ituresb |
|||||||||||||||||||||||||||||||
Tongon (89.7%) |
64 | 1,329 | 731 | 777 | 2 | 64 | 1,275 | 688 | 745 | 2 | ||||||||||||||||||||||||||||||
Hemlo |
55 | 1,257 | 1,099 | 1,497 | 21 | 54 | 1,268 | 1,080 | 1,456 | 19 | ||||||||||||||||||||||||||||||
Buzwagi (84%)c |
21 | 907 | 687 | 693 | 0 | 20 | 909 | 751 | 770 | 1 | ||||||||||||||||||||||||||||||
Bulyanhulu (84%)c |
7 | 1,502 | 874 | 913 | 17 | 7 | 1,658 | 950 | 1,014 | 8 |
a. | These are non-GAAP financial performance measures with no standardized meaning under IFRS and therefore may not be comparable to similar measures presented by other issuers. For further information and a detailed reconciliation of each non-GAAP measure used in this section of the MD&A to the most directly comparable IFRS measure, please see pages 82 to 106 of this MD&A. |
b. | Includes both minesite sustaining and project capital expenditures. |
c. | Formerly part of Acacia Mining plc. On September 17, 2019, Barrick acquired all of the shares of Acacia it did not own. The results are on an 84% basis starting January 1, 2020, the date the GoTs 16% free carried interest was made effective. |
BARRICK THIRD QUARTER 2020 | 62 | MANAGEMENTS DISCUSSION AND ANALYSIS |
Other Mines - Copper
Summary of Operating and Financial Data | For the three months ended | |||||||||||||||||||||||||||||||||||||||
9/30/20 | 6/30/20 | |||||||||||||||||||||||||||||||||||||||
Copper production (millions of pounds) |
Cost of sales ($/lb) |
C1 cash costs |
All-in ($/lb)a |
Capital Expend- ituresb |
Copper production (millions of pounds) |
Cost of sales ($/lb) |
C1 cash costs |
All-in ($/lb)a |
Capital Expend- ituresb |
|||||||||||||||||||||||||||||||
Lumwana |
62 | 2.06 | 1.49 | 2.58 | 63 | 72 | 2.06 | 1.55 | 2.27 | 40 | ||||||||||||||||||||||||||||||
Zaldĺvar (50%) |
24 | 2.20 | 1.64 | 2.27 | 17 | 28 | 2.52 | 1.79 | 2.09 | 13 | ||||||||||||||||||||||||||||||
Jabal Sayid (50%) |
17 | 1.43 | 1.14 | 1.17 | 0 | 20 | 1.41 | 1.14 | 1.41 | 5 |
a. | These are non-GAAP financial performance measures with no standardized meaning under IFRS and therefore may not be comparable to similar measures presented by other issuers. For further information and a detailed reconciliation of each non-GAAP measure used in this section of the MD&A to the most directly comparable IFRS measure, please see pages 82 to 106 of this MD&A. |
b. | Includes both minesite sustaining and project capital expenditures. |
BARRICK THIRD QUARTER 2020 | 63 | MANAGEMENTS DISCUSSION AND ANALYSIS |
BARRICK THIRD QUARTER 2020 | 64 | MANAGEMENTS DISCUSSION AND ANALYSIS |
Exploration and Mineral Resource Management
BARRICK THIRD QUARTER 2020 | 65 | MANAGEMENTS DISCUSSION AND ANALYSIS |
BARRICK THIRD QUARTER 2020 | 66 | MANAGEMENTS DISCUSSION AND ANALYSIS |
BARRICK THIRD QUARTER 2020 | 67 | MANAGEMENTS DISCUSSION AND ANALYSIS |
BARRICK THIRD QUARTER 2020 | 68 | MANAGEMENTS DISCUSSION AND ANALYSIS |
BARRICK THIRD QUARTER 2020 | 69 | MANAGEMENTS DISCUSSION AND ANALYSIS |
BARRICK THIRD QUARTER 2020 | 70 | MANAGEMENTS DISCUSSION AND ANALYSIS |
BARRICK THIRD QUARTER 2020 | 71 | MANAGEMENTS DISCUSSION AND ANALYSIS |
BARRICK THIRD QUARTER 2020 | 72 | MANAGEMENTS DISCUSSION AND ANALYSIS |
BARRICK THIRD QUARTER 2020 | 73 | MANAGEMENTS DISCUSSION AND ANALYSIS |
BARRICK THIRD QUARTER 2020 | 74 | MANAGEMENTS DISCUSSION AND ANALYSIS |
BARRICK THIRD QUARTER 2020 | 75 | MANAGEMENTS DISCUSSION AND ANALYSIS |
BARRICK THIRD QUARTER 2020 | 76 | MANAGEMENTS DISCUSSION AND ANALYSIS |
BARRICK THIRD QUARTER 2020 | 77 | MANAGEMENTS DISCUSSION AND ANALYSIS |
FINANCIAL CONDITION REVIEW
Summary Balance Sheet and Key Financial Ratios
($ millions, except ratios and share amounts) | As at 9/30/20 | As at 12/31/19 | ||||||
Total cash and equivalents |
4,744 | 3,314 | ||||||
Current assets |
3,115 | 3,573 | ||||||
Non-current assets |
38,257 | 37,505 | ||||||
Total Assets |
46,116 | 44,392 | ||||||
Current liabilities excluding short-term debt |
1,730 | 2,001 | ||||||
Non-current liabilities excluding long-term debta |
7,575 | 7,028 | ||||||
Debt (current and long-term) |
5,161 | 5,536 | ||||||
Total Liabilities |
14,466 | 14,565 | ||||||
Total shareholders equity |
22,799 | 21,432 | ||||||
Non-controlling interests |
8,851 | 8,395 | ||||||
Total Equity |
31,650 | 29,827 | ||||||
Total common shares outstanding (millions of shares)b |
1,778 | 1,778 | ||||||
Debt, net of cash |
417 | 2,222 | ||||||
Key Financial Ratios: |
||||||||
Current ratioc |
4.49:1 | 2.90:1 | ||||||
Debt-to-equityd |
0.16:1 | 0.19:1 |
a. | Non-current financial liabilities as at September 30, 2020 were $5,451 million (December 31, 2019: $5,559 million). |
b. | Total common shares outstanding do not include 0.1 million stock options. |
c. | Represents current assets divided by current liabilities (including short-term debt) as at September 30, 2020 and December 31, 2019. |
d. | Represents debt divided by total shareholders equity (including minority interest) as at September 30, 2020 and December 31, 2019. |
BARRICK THIRD QUARTER 2020 | 78 | MANAGEMENTS DISCUSSION AND ANALYSIS |
BARRICK THIRD QUARTER 2020 | 79 | MANAGEMENTS DISCUSSION AND ANALYSIS |
COMMITMENTS AND CONTINGENCIES
Litigation and Claims
We are currently subject to various litigation proceedings as disclosed in note 17 to the Financial Statements, and we may be involved in disputes with other parties in the future that may result in litigation. If we are unable to resolve these disputes favorably, it may have a material adverse impact on our financial condition, cash flow and results of operations.
Contractual Obligations and Commitments
In the normal course of business, we enter into contracts that give rise to commitments for future minimum payments. The following table summarizes the remaining contractual maturities of our financial liabilities and operating and capital commitments shown on an undiscounted basis:
($ millions) | Payments due as at 9/30/20 | |||||||||||||||||||||||||||
2020 | 2021 | 2022 | 2023 | 2024 | 2025 and thereafter |
Total | ||||||||||||||||||||||
Debta |
||||||||||||||||||||||||||||
Repayment of principal |
0 | 7 | 0 | 0 | 0 | 5,109 | 5,116 | |||||||||||||||||||||
Capital leases |
4 | 13 | 9 | 6 | 4 | 32 | 68 | |||||||||||||||||||||
Interest |
135 | 308 | 307 | 307 | 306 | 4,447 | 5,810 | |||||||||||||||||||||
Provisions for environmental rehabilitationb |
124 | 170 | 194 | 172 | 127 | 2,254 | 3,041 | |||||||||||||||||||||
Restricted share units |
13 | 29 | 11 | 0 | 0 | 0 | 53 | |||||||||||||||||||||
Pension benefits and other post-retirement benefits |
1 | 3 | 3 | 2 | 2 | 32 | 43 | |||||||||||||||||||||
Minimum royalty paymentsc |
0 | 0 | 0 | 1 | 1 | 1 | 3 | |||||||||||||||||||||
Purchase obligations for supplies and consumablesd |
315 | 304 | 149 | 134 | 120 | 639 | 1,661 | |||||||||||||||||||||
Capital commitmentse |
98 | 52 | 8 | 0 | 0 | 0 | 158 | |||||||||||||||||||||
Social development costsf |
8 | 11 | 5 | 5 | 5 | 60 | 94 | |||||||||||||||||||||
Deposit on Pascua-Lama silver sale agreementg |
0 | 0 | 0 | 0 | 0 | 253 | 253 | |||||||||||||||||||||
Total |
698 | 897 | 686 | 627 | 565 | 12,827 | 16,300 |
a. | Debt and Interest - Our debt obligations do not include any subjective acceleration clauses or other clauses that enable the holder of the debt to call for early repayment, except in the event that we breach any of the terms and conditions of the debt or for other customary events of default. We are not required to post any collateral under any debt obligations. Projected interest payments on variable rate debt were based on interest rates in effect at September 30, 2020. Interest is calculated on our long-term debt obligations using both fixed and variable rates. |
b. | Provisions for environmental rehabilitation - Amounts presented in the table represent the undiscounted uninflated future payments for the expected cost of provisions for environmental rehabilitation. |
c. | Minimum royalty payments are related to continuing operations and are presented net of recoverable amounts. |
d. | Purchase obligations for supplies and consumables - Includes commitments related to new purchase obligations to secure a supply of acid, tires and cyanide for our production process. |
e. | Capital commitments - Purchase obligations for capital expenditures include only those items where binding commitments have been entered into. |
f. | Social development costs - Includes a commitment of $14 million in 2025 and thereafter related to the funding of a power transmission line in Argentina. |
g. | Deposit on Pascua-Lama silver sale agreement - Relates to our silver sale agreement with Wheaton Precious Metals Corp. |
BARRICK THIRD QUARTER 2020 | 80 | MANAGEMENTS DISCUSSION AND ANALYSIS |
REVIEW OF QUARTERLY RESULTS
Quarterly Informationa
($ millions, except where indicated) | 2020 | 2020 | 2020 | 2019 | 2019 | 2019 | 2019 | 2018 | ||||||||||||||||||||||||
Q3 | Q2 | Q1 | Q4 | Q3 | Q2 | Q1 | Q4 | |||||||||||||||||||||||||
Revenues |
3,540 | 3,055 | 2,721 | 2,883 | 2,678 | 2,063 | 2,093 | 1,904 | ||||||||||||||||||||||||
Realized price per ounce goldb |
1,926 | 1,725 | 1,589 | 1,483 | 1,476 | 1,317 | 1,307 | 1,223 | ||||||||||||||||||||||||
Realized price per pound copperb |
3.28 | 2.79 | 2.23 | 2.76 | 2.55 | 2.62 | 3.07 | 2.76 | ||||||||||||||||||||||||
Cost of sales |
1,927 | 1,900 | 1,776 | 1,987 | 1,889 | 1,545 | 1,490 | 1,577 | ||||||||||||||||||||||||
Net earnings (loss) |
882 | 357 | 400 | 1,387 | 2,277 | 194 | 111 | (1,197) | ||||||||||||||||||||||||
Per share (dollars)c |
0.50 | 0.20 | 0.22 | 0.78 | 1.30 | 0.11 | 0.06 | (1.02) | ||||||||||||||||||||||||
Adjusted net earningsb |
726 | 415 | 285 | 300 | 264 | 154 | 184 | 69 | ||||||||||||||||||||||||
Per share (dollars)b,c |
0.41 | 0.23 | 0.16 | 0.17 | 0.15 | 0.09 | 0.11 | 0.06 | ||||||||||||||||||||||||
Operating cash flow |
1,859 | 1,031 | 889 | 875 | 1,004 | 434 | 520 | 411 | ||||||||||||||||||||||||
Cash capital expenditures |
548 | 509 | 451 | 446 | 502 | 379 | 374 | 374 | ||||||||||||||||||||||||
Free cash flowb |
1,311 | 522 | 438 | 429 | 502 | 55 | 146 | 37 |
a. | Sum of all the quarters may not add up to the annual total due to rounding. |
b. | Realized price, adjusted net earnings, adjusted net earnings per share and free cash flow are non-GAAP financial performance measures with no standardized meaning under IFRS and therefore may not be comparable to similar measures of performance presented by other issuers. For further information and a detailed reconciliation of each non-GAAP measure used in this section of the MD&A to the most directly comparable IFRS measure, please see pages 82 to 106 of this MD&A. |
c. | Calculated using weighted average number of shares outstanding under the basic method of earnings per share. |
INTERNAL CONTROL OVER FINANCIAL REPORTING AND DISCLOSURE CONTROLS AND PROCEDURES
BARRICK THIRD QUARTER 2020 | 81 | MANAGEMENTS DISCUSSION AND ANALYSIS |
IFRS CRITICAL ACCOUNTING POLICIES AND ACCOUNTING ESTIMATES
NON-GAAP FINANCIAL PERFORMANCE MEASURES
Adjusted Net Earnings and Adjusted Net Earnings per Share
BARRICK THIRD QUARTER 2020 | 82 | MANAGEMENTS DISCUSSION AND ANALYSIS |
Reconciliation of Net Earnings to Net Earnings per Share, Adjusted Net Earnings and Adjusted Net Earnings per Share
($ millions, except per share amounts in dollars) | For the three months ended | For the nine months ended | ||||||||||||||||||
9/30/20 | 6/30/20 | 9/30/19 | 9/30/20 | 9/30/19 | ||||||||||||||||
Net earnings attributable to equity holders of the Company |
882 | 357 | 2,277 | 1,639 | 2,582 | |||||||||||||||
Impairment charges (reversals) related to intangibles, goodwill, property, plant and equipment, and investmentsa |
4 | 23 | (872 | ) | (309 | ) | (857 | ) | ||||||||||||
Acquisition/disposition (gains) lossesb |
(2 | ) | 8 | (1,901 | ) | (54 | ) | (1,913 | ) | |||||||||||
Loss (gain) on currency translation |
16 | 2 | 40 | 34 | 56 | |||||||||||||||
Significant tax adjustmentsc |
(66 | ) | (7 | ) | 35 | (117 | ) | (40 | ) | |||||||||||
Other expense adjustmentsd |
(90 | ) | 48 | 53 | 56 | 158 | ||||||||||||||
Tax effect and non-controlling intereste |
(18 | ) | (16 | ) | 631 | 177 | 616 | |||||||||||||
Adjusted net earnings |
726 | 415 | 264 | 1,426 | 602 | |||||||||||||||
Net earnings per sharef |
0.50 | 0.20 | 1.30 | 0.92 | 1.47 | |||||||||||||||
Adjusted net earnings per sharef |
0.41 | 0.23 | 0.15 | 0.80 | 0.34 |
a. | For the three month period ended September 30, 2020, we recorded no significant impairment charges or reversals. For the nine month period ended September 30, 2020, net impairment reversals primarily relate to non-current asset reversals at our Tanzanian assets. Net impairment reversals for the three and nine month periods ended September 30, 2019 mainly relate to non-current asset reversals at Lumwana, partially offset by impairments at Cortez and Lagunas Norte. |
b. | Acquisition/disposition gains for the nine month period ended September 30, 2020 primarily relate to the gain on the sale of Massawa. For the three and nine months ended September 30, 2019, acquisition/disposition gains primarily relate to the gain on the remeasurement of Turquoise Ridge to fair value as a result of its contribution to Nevada Gold Mines. |
c. | Significant tax adjustments for the nine month period ended September 30, 2020 mainly relates to deferred tax recoveries as a result of tax reform measures in Argentina and adjustments made in recognition of the net settlement of all outstanding disputes with the GoT. |
d. | Other expense adjustments for the three and nine month period ended September 30, 2020 primarily relate to the gain on the remeasurement of the residual cash liability relating to our silver sale agreement with Wheaton Precious Metals Corp., partially offset by care and maintenance expenses at Porgera and Covid-19 donations. For the three month period ended June 30, 2020, other expense adjustments primarily relate to care and maintenance expenses at Porgera and Covid-19 donations. The nine month period ended September 30, 2020 was further impacted by changes in the discount rate assumptions on our closed mine rehabilitation provision. For the three and nine month periods ended September 30, 2019, other expense adjustments primarily relate to severance costs as a result of the implementation of a number of organizational reductions, the impact of changes in the discount rate assumptions on our closed mine rehabilitation provision and transaction costs related to Nevada Gold Mines and Acacia. |
e. | Tax effect and non-controlling interest for the three and nine month periods ended September 30, 2019 primarily relates to the net impairment reversals related to long-lived assets and acquisition gains. |
f. | Calculated using weighted average number of shares outstanding under the basic method of earnings per share. |
Free Cash Flow
Reconciliation of Net Cash Provided by Operating Activities to Free Cash Flow
($ millions) | For the three months ended | For the nine months ended | ||||||||||||||||||
9/30/20 | 6/30/20 | 9/30/19 | 9/30/20 | 9/30/19 | ||||||||||||||||
Net cash provided by operating activities |
1,859 | 1,031 | 1,004 | 3,779 | 1,958 | |||||||||||||||
Capital expenditures |
(548 | ) | (509 | ) | (502 | ) | (1,508 | ) | (1,255 | ) | ||||||||||
Free cash flow |
1,311 | 522 | 502 | 2,271 | 703 |
BARRICK THIRD QUARTER 2020 | 83 | MANAGEMENTS DISCUSSION AND ANALYSIS |
Total cash costs per ounce, All-in sustaining costs per ounce, All-in costs per ounce, C1 cash costs per pound and All-in sustaining costs per pound
BARRICK THIRD QUARTER 2020 | 84 | MANAGEMENTS DISCUSSION AND ANALYSIS |
Reconciliation of Gold Cost of Sales to Total cash costs, All-in sustaining costs and All-in costs, including on a per ounce basis
($ millions, except per ounce information in dollars) | For the three months ended |
For the nine months ended | ||||||||||||||||||||
Footnote | 9/30/20 | 6/30/20 | 9/30/19 | 9/30/20 | 9/30/19 | |||||||||||||||||
Cost of sales applicable to gold production |
1,768 | 1,740 | 1,831 | 5,151 | 4,618 | |||||||||||||||||
Depreciation |
(508 | ) | (498 | ) | (538 | ) | (1,480 | ) | (1,353 | ) | ||||||||||||
Cash cost of sales applicable to equity method investments |
53 | 62 | 45 | 156 | 169 | |||||||||||||||||
By-product credits |
(84 | ) | (59 | ) | (48 | ) | (172 | ) | (95 | ) | ||||||||||||
Realized (gains) losses on hedge and non-hedge derivatives |
a | 0 | 1 | 1 | 1 | 0 | ||||||||||||||||
Non-recurring items |
b | 0 | 0 | (4 | ) | 0 | (33 | ) | ||||||||||||||
Other |
c | (24 | ) | (26 | ) | (19 | ) | (77 | ) | (65 | ) | |||||||||||
Non-controlling interests |
d | (337 | ) | (336 | ) | (339 | ) | (989 | ) | (552 | ) | |||||||||||
Total cash costs |
868 | 884 | 929 | 2,590 | 2,689 | |||||||||||||||||
General & administrative costs |
50 | 71 | 68 | 161 | 181 | |||||||||||||||||
Minesite exploration and evaluation costs |
e | 19 | 23 | 22 | 57 | 45 | ||||||||||||||||
Minesite sustaining capital expenditures |
f | 415 | 420 | 406 | 1,205 | 926 | ||||||||||||||||
Sustaining leases |
9 | 10 | 5 | 19 | 23 | |||||||||||||||||
Rehabilitation - accretion and amortization (operating sites) |
g | 13 | 12 | 28 | 39 | 58 | ||||||||||||||||
Non-controlling interest, copper operations and other |
h | (166 | ) | (158 | ) | (184 | ) | (438 | ) | (335 | ) | |||||||||||
All-in sustaining costs |
1,208 | 1,262 | 1,274 | 3,633 | 3,587 | |||||||||||||||||
Project exploration and evaluation and project costs |
e | 53 | 55 | 64 | 164 | 213 | ||||||||||||||||
Community relations costs not related to current operations |
0 | 0 | 1 | 1 | 2 | |||||||||||||||||
Project capital expenditures |
f | 126 | 85 | 96 | 287 | 324 | ||||||||||||||||
Rehabilitation - accretion and amortization (non-operating sites) |
g | 3 | 4 | 5 | 9 | 19 | ||||||||||||||||
Non-controlling interest and copper operations and other |
h | (47 | ) | (36 | ) | (46 | ) | (100 | ) | (77 | ) | |||||||||||
All-in costs |
1,343 | 1,370 | 1,394 | 3,994 | 4,068 | |||||||||||||||||
Ounces sold - equity basis (000s ounces) |
i | 1,249 | 1,224 | 1,318 | 3,693 | 4,055 | ||||||||||||||||
Cost of sales per ounce |
j,k | 1,065 | 1,075 | 1,065 | 1,054 | 991 | ||||||||||||||||
Total cash costs per ounce |
k | 696 | 716 | 710 | 701 | 663 | ||||||||||||||||
Total cash costs per ounce (on a co-product basis) |
k,l | 742 | 747 | 735 | 732 | 680 | ||||||||||||||||
All-in sustaining costs per ounce |
k | 966 | 1,031 | 984 | 984 | 883 | ||||||||||||||||
All-in sustaining costs per ounce (on a co-product basis) |
k,l | 1,012 | 1,062 | 1,009 | 1,015 | 900 | ||||||||||||||||
All-in costs per ounce |
k | 1,076 | 1,118 | 1,074 | 1,082 | 999 | ||||||||||||||||
All-in costs per ounce (on a co-product basis) |
k,l | 1,122 | 1,149 | 1,099 | 1,113 | 1,016 |
a. | Realized (gains) losses on hedge and non-hedge derivatives |
Includes realized hedge losses of $nil and $nil, respectively, for the three and nine month periods ended September 30, 2020 (June 30, 2020: $nil and September 30, 2019: $nil and $nil, respectively), and realized non-hedge losses of $nil and $1 million, respectively, for the three and nine month periods ended September 30, 2020 (June 30, 2020: $1 million and September 30, 2019: $1 million and $nil, respectively). Refer to note 5 to the Financial Statements for further information.
b. | Non-recurring items |
Non-recurring items in 2019 relate to organizational restructuring. These costs are not indicative of our cost of production and have been excluded from the calculation of total cash costs.
c. | Other |
Other adjustments for the three and nine month period ended September 30, 2020 include the removal of total cash costs and by-product credits associated with: our Pierina mine; Golden Sunlight and Morila starting in the third quarter of 2019; and Lagunas Norte starting in the fourth quarter of 2019, which all are mining incidental ounces as they enter closure of $27 million and $78 million, respectively, (June 30, 2020: $26 million; September 30, 2019: $19 million and $57 million, respectively).
d. | Non-controlling interests |
Non-controlling interests include non-controlling interests related to gold production of $508 million and $1,469 million, respectively, for the three and nine month periods ended September 30, 2020 (June 30, 2020: $495 million and September 30, 2019: $504 million and $827 million, respectively). Non- controlling interests include Pueblo Viejo, Loulo-Gounkoto, Tongon, North Mara, Bulyanhulu, Buzwagi (notwithstanding the completion of the Acacia transaction on September 17, 2019, we consolidated our interest in Acacia and recorded a non-controlling interest of 36.1% in the income statement for the entirety of the third quarter of 2019 as a matter of convenience) and Nevada Gold Mines starting July 1, 2019. Refer to note 5 to the Financial Statements for further information.
e. | Exploration and evaluation costs |
Exploration, evaluation and project expenses are presented as minesite sustaining if it supports current mine operations and project if it relates to future projects. Refer to page 75 of this MD&A.
BARRICK THIRD QUARTER 2020 | 85 | MANAGEMENTS DISCUSSION AND ANALYSIS |
f. | Capital expenditures |
Capital expenditures are related to our gold sites only and are split between minesite sustaining and project capital expenditures. Project capital expenditures are distinct projects designed to increase the net present value of the mine and are not related to current production. Significant projects in the current year are the expansion project at Pueblo Viejo, the Goldrush exploration declines, the restart of mining activities at Bulyanhulu, and construction of the third shaft at Turquoise Ridge. Refer to page 74 of this MD&A.
g. | Rehabilitationaccretion and amortization |
Includes depreciation on the assets related to rehabilitation provisions of our gold operations and accretion on the rehabilitation provision of our gold operations, split between operating and non-operating sites.
h. | Non-controlling interest and copper operations |
Removes general & administrative costs related to non-controlling interests and copper based on a percentage allocation of revenue. Also removes exploration, evaluation and project expenses, rehabilitation costs and capital expenditures incurred by our copper sites and the non-controlling interest of North Mara, Bulyanhulu and Buzwagi (notwithstanding the completion of the Acacia transaction on September 17, 2019, we consolidated our interest in Acacia and recorded a non-controlling interest of 36.1% in the income statement for the entirety of the third quarter of 2019 as a matter of convenience), Pueblo Viejo, Loulo-Gounkoto and Tongon operating segments and South Arturo (63.1% of South Arturo from July 1, 2019 onwards as a result of its contribution to Nevada Gold Mines). Also removes the non-controlling interest of Nevada Gold Mines starting July 1, 2019. It also includes capital expenditures applicable to equity method investments. Figures remove the impact of Pierina; Golden Sunlight and Morila starting in the third quarter of 2019; and Lagunas Norte starting in the fourth quarter of 2019. The impact is summarized as the following:
($ millions) | For the three months ended | For the nine months ended | ||||||||||||||||||
Non-controlling interest, copper operations and other | 9/30/20 | 6/30/20 | 9/30/19 | 9/30/20 | 9/30/19 | |||||||||||||||
General & administrative costs |
(6 | ) | (8 | ) | (22 | ) | (20 | ) | (55 | ) | ||||||||||
Minesite exploration and evaluation expenses |
(5 | ) | (8 | ) | (9 | ) | (16 | ) | (10 | ) | ||||||||||
Rehabilitation - accretion and amortization (operating sites) |
(3 | ) | (4 | ) | (10 | ) | (11 | ) | (12 | ) | ||||||||||
Minesite sustaining capital expenditures |
(152 | ) | (138 | ) | (143 | ) | (391 | ) | (258 | ) | ||||||||||
All-in sustaining costs total |
(166 | ) | (158 | ) | (184 | ) | (438 | ) | (335 | ) | ||||||||||
Project exploration and evaluation and project costs |
(9 | ) | (9 | ) | (12 | ) | (21 | ) | (40 | ) | ||||||||||
Project capital expenditures |
(38 | ) | (27 | ) | (34 | ) | (79 | ) | (37 | ) | ||||||||||
All-in costs total |
(47 | ) | (36 | ) | (46 | ) | (100 | ) | (77 | ) |
i. | Ounces sold - equity basis |
Figures remove the impact of: Pierina; Golden Sunlight and Morila starting in the third quarter of 2019; and Lagunas Norte starting in the fourth quarter of 2019, which are producing incidental ounces as they reach the end of their mine lives.
j. | Cost of sales per ounce |
Figures remove the cost of sales impact of: Pierina of $4 million and $14 million, respectively, for the three and nine month periods ended September 30, 2020 (June 30, 2020: $4 million and September 30, 2019: $44 million and $71 million, respectively); starting in the third quarter of 2019, Golden Sunlight of $nil and $nil, respectively, for the three and nine month periods ended September 30, 2020 (June 30, 2020: $nil and September 30, 2019: $1 million and $1 million, respectively) and Morila of $7 million and $20 million, respectively, for the three and nine month periods ended September 30, 2020 (June 30, 2020: $8 million and September 30, 2019: $10 million and $10 million, respectively); and starting in the fourth quarter of 2019, Lagunas Norte of $22 million and $66 million, respectively, for the three and nine month periods ended September 30, 2020 (June 30, 2020: $23 million and September 30, 2019: $nil and $nil, respectively), which are mining incidental ounces as these sites enter closure. Cost of sales per ounce excludes non-controlling interest related to gold production. Cost of sales applicable to gold per ounce is calculated using cost of sales on an attributable basis (removing the non- controlling interest of 40% Pueblo Viejo, 20% of Loulo-Gounkoto, 10.3% of Tongon, 16% North Mara, Bulyanhulu and Buzwagi starting January 1, 2020, the effective date of the GoTs free carried interest (36.1% up until September 30, 2019; notwithstanding the completion of the Acacia transaction on September 17, 2019, we consolidated our interest in Acacia and recorded a non-controlling interest of 36.1% in the income statement for the entirety of the third quarter of 2019 as a matter of convenience) and 40% South Arturo from cost of sales (63.1% of South Arturo from July 1, 2019 onwards as a result of its contribution to Nevada Gold Mines)), divided by attributable gold ounces. The non-controlling interest of 38.5% Nevada Gold Mines is also removed from cost of sales from July 1, 2019 onwards.
k. | Per ounce figures |
Cost of sales per ounce, total cash costs per ounce, all-in sustaining costs per ounce and all-in costs per ounce may not calculate based on amounts presented in this table due to rounding.
l. | Co-product costs per ounce |
Total cash costs per ounce, all-in sustaining costs per ounce and all-in costs per ounce presented on a co-product basis removes the impact of by-product credits of our gold production (net of non-controlling interest) calculated as:
($ millions) | For the three months ended | For the nine months ended | ||||||||||||||||||
9/30/20 | 6/30/20 | 9/30/19 | 9/30/20 | 9/30/19 | ||||||||||||||||
By-product credits |
84 | 59 | 48 | 172 | 95 | |||||||||||||||
Non-controlling interest |
(29 | ) | (22 | ) | (16 | ) | (65 | ) | (31 | ) | ||||||||||
By-product credits (net of non-controlling interest) |
55 | 37 | 32 | 107 | 64 |
BARRICK THIRD QUARTER 2020 | 86 | MANAGEMENTS DISCUSSION AND ANALYSIS |
Reconciliation of Gold Cost of Sales to Total cash costs, All-in sustaining costs and All-in costs, including on a per ounce basis, by operating site
($ millions, except per ounce information in dollars) | For the three months ended 9/30/20 | |||||||||||||||||||||||||||||||||
Footnote | Carlina | Cortezb | Turquoise Ridgec |
Long Canyond |
Phoenixd | Nevada Gold Minese |
Hemlo | North America |
||||||||||||||||||||||||||
Cost of sales applicable to gold production |
440 | 198 | 136 | 64 | 90 | 928 | 69 | 997 | ||||||||||||||||||||||||||
Depreciation |
(82 | ) | (54 | ) | (41 | ) | (48 | ) | (23 | ) | (248 | ) | (8 | ) | (256 | ) | ||||||||||||||||||
By-product credits |
(1 | ) | (1 | ) | (2 | ) | 0 | (39 | ) | (43 | ) | (1 | ) | (44 | ) | |||||||||||||||||||
Non-recurring items |
f | 0 | 0 | 0 | 0 | 0 | 0 | 0 | 0 | |||||||||||||||||||||||||
Other |
0 | 0 | 0 | 0 | 0 | 0 | 0 | 0 | ||||||||||||||||||||||||||
Non-controlling interests |
(137 | ) | (55 | ) | (36 | ) | (6 | ) | (10 | ) | (244 | ) | 0 | (244 | ) | |||||||||||||||||||
Total cash costs |
220 | 88 | 57 | 10 | 18 | 393 | 60 | 453 | ||||||||||||||||||||||||||
General & administrative costs |
0 | 0 | 0 | 0 | 0 | 0 | 0 | 0 | ||||||||||||||||||||||||||
Minesite exploration and evaluation costs |
g | 7 | 1 | 2 | 1 | 0 | 11 | 0 | 11 | |||||||||||||||||||||||||
Minesite sustaining capital expenditures |
h | 97 | 64 | 6 | 10 | 6 | 189 | 21 | 210 | |||||||||||||||||||||||||
Sustaining leases |
0 | 0 | 0 | 0 | 0 | 0 | 0 | 0 | ||||||||||||||||||||||||||
Rehabilitation - accretion and amortization (operating sites) |
i | 2 | 3 | 0 | 0 | 1 | 6 | 0 | 6 | |||||||||||||||||||||||||
Non-controlling interests |
(41 | ) | (26 | ) | (3 | ) | (4 | ) | (2 | ) | (78 | ) | 0 | (78 | ) | |||||||||||||||||||
All-in sustaining costs |
285 | 130 | 62 | 17 | 23 | 521 | 81 | 602 | ||||||||||||||||||||||||||
Project exploration and evaluation and project costs |
g | 0 | 0 | 0 | 0 | 0 | 0 | 0 | 0 | |||||||||||||||||||||||||
Project capital expenditures |
h | 0 | 20 | 15 | 0 | 0 | 59 | 0 | 59 | |||||||||||||||||||||||||
Non-controlling interests |
0 | (7 | ) | (6 | ) | 0 | 0 | (24 | ) | 0 | (24 | ) | ||||||||||||||||||||||
All-in costs |
285 | 143 | 71 | 17 | 23 | 556 | 81 | 637 | ||||||||||||||||||||||||||
Ounces sold - equity basis (000s ounces) |
275 | 115 | 76 | 45 | 31 | 542 | 55 | 597 | ||||||||||||||||||||||||||
Cost of sales per ounce |
j,k | 985 | 1,060 | 1,097 | 877 | 1,773 | 1,060 | 1,257 | 1,078 | |||||||||||||||||||||||||
Total cash costs per ounce |
k | 800 | 763 | 745 | 212 | 520 | 723 | 1,099 | 758 | |||||||||||||||||||||||||
Total cash costs per ounce (on a co-product basis) |
k,l | 802 | 768 | 766 | 216 | 1,308 | 774 | 1,104 | 805 | |||||||||||||||||||||||||
All-in sustaining costs per ounce |
k | 1,036 | 1,133 | 805 | 384 | 659 | 956 | 1,497 | 1,006 | |||||||||||||||||||||||||
All-in sustaining costs per ounce (on a co-product basis) |
k,l | 1,038 | 1,138 | 826 | 388 | 1,447 | 1,007 | 1,502 | 1,053 | |||||||||||||||||||||||||
All-in costs per ounce |
k | 1,036 | 1,236 | 929 | 384 | 659 | 1,025 | 1,502 | 1,069 | |||||||||||||||||||||||||
All-in costs per ounce (on a co-product basis) |
k,l | 1,038 | 1,241 | 950 | 388 | 1,447 | 1,076 | 1,507 | 1,116 |
BARRICK THIRD QUARTER 2020 | 87 | MANAGEMENTS DISCUSSION AND ANALYSIS |
($ millions, except per ounce information in dollars) | For the three months ended 9/30/20 | |||||||||||||||
Footnote | Pueblo Viejo | Veladero | Latin America & Asia Pacific |
|||||||||||||
Cost of sales applicable to gold production |
169 | 49 | 218 | |||||||||||||
Depreciation |
(56 | ) | (17 | ) | (73 | ) | ||||||||||
By-product credits |
(17 | ) | (1 | ) | (18 | ) | ||||||||||
Non-recurring items |
f | 0 | 0 | 0 | ||||||||||||
Other |
0 | 0 | 0 | |||||||||||||
Non-controlling interests |
(38 | ) | 0 | (38 | ) | |||||||||||
Total cash costs |
58 | 31 | 89 | |||||||||||||
General & administrative costs |
0 | 0 | 0 | |||||||||||||
Minesite exploration and evaluation costs |
g | 0 | 0 | 0 | ||||||||||||
Minesite sustaining capital expenditures |
h | 32 | 18 | 50 | ||||||||||||
Sustaining leases |
0 | 1 | 1 | |||||||||||||
Rehabilitation - accretion and amortization (operating sites) |
i | 1 | 1 | 2 | ||||||||||||
Non-controlling interests |
(13 | ) | 0 | (13 | ) | |||||||||||
All-in sustaining costs |
78 | 51 | 129 | |||||||||||||
Project exploration and evaluation and project costs |
g | 1 | 0 | 1 | ||||||||||||
Project capital expenditures |
h | 18 | 0 | 18 | ||||||||||||
Non-controlling interests |
(7 | ) | 0 | (7 | ) | |||||||||||
All-in costs |
90 | 51 | 141 | |||||||||||||
Ounces sold - equity basis (000s ounces) |
129 | 43 | 172 | |||||||||||||
Cost of sales per ounce |
j,k | 791 | 1,136 | 877 | ||||||||||||
Total cash costs per ounce |
k | 450 | 708 | 515 | ||||||||||||
Total cash costs per ounce (on a co-product basis) |
k,l | 527 | 743 | 581 | ||||||||||||
All-in sustaining costs per ounce |
k | 609 | 1,159 | 746 | ||||||||||||
All-in sustaining costs per ounce (on a co-product basis) |
k,l | 686 | 1,194 | 812 | ||||||||||||
All-in costs per ounce |
k | 697 | 1,159 | 813 | ||||||||||||
All-in costs per ounce (on a co-product basis) |
k,l | 774 | 1,194 | 879 |
BARRICK THIRD QUARTER 2020 | 88 | MANAGEMENTS DISCUSSION AND ANALYSIS |
($ millions, except per ounce information in dollars) | For the three months ended 9/30/20 | |||||||||||||||||||||||||||||||
Footnote | Loulo- Gounkoto |
Kibali | North Maran |
Tongon | Bulyanhulun | Buzwagin | Africa & Middle East |
|||||||||||||||||||||||||
Cost of sales applicable to gold production |
185 | 99 | 73 | 96 | 82 | 79 | 614 | |||||||||||||||||||||||||
Depreciation |
(69 | ) | (43 | ) | (20 | ) | (43 | ) | (28 | ) | (4 | ) | (207 | ) | ||||||||||||||||||
By-product credits |
0 | 0 | (1 | ) | 0 | (6 | ) | (14 | ) | (21 | ) | |||||||||||||||||||||
Non-recurring items |
f | 0 | 0 | 0 | 0 | 0 | 0 | 0 | ||||||||||||||||||||||||
Other |
0 | 0 | 0 | 0 | 0 | 0 | 0 | |||||||||||||||||||||||||
Non-controlling interests |
(23 | ) | 0 | (8 | ) | (6 | ) | (8 | ) | (9 | ) | (54 | ) | |||||||||||||||||||
Total cash costs |
93 | 56 | 44 | 47 | 40 | 52 | 332 | |||||||||||||||||||||||||
General & administrative costs |
0 | 0 | 0 | 0 | 0 | 0 | 0 | |||||||||||||||||||||||||
Minesite exploration and evaluation costs |
g | 3 | 0 | 0 | 0 | 0 | 0 | 3 | ||||||||||||||||||||||||
Minesite sustaining capital expenditures |
h | 77 | 14 | 7 | 2 | 2 | 0 | 102 | ||||||||||||||||||||||||
Sustaining leases |
0 | 5 | 0 | 0 | 0 | 0 | 5 | |||||||||||||||||||||||||
Rehabilitation - accretion and amortization (operating sites) |
i | 2 | 0 | 1 | 0 | 1 | 0 | 4 | ||||||||||||||||||||||||
Non-controlling interests |
(16 | ) | 0 | (1 | ) | 0 | 0 | 0 | (17 | ) | ||||||||||||||||||||||
All-in sustaining costs |
159 | 75 | 51 | 49 | 43 | 52 | 429 | |||||||||||||||||||||||||
Project exploration and evaluation and project costs |
g | 0 | 0 | 0 | 0 | 0 | 0 | 0 | ||||||||||||||||||||||||
Project capital expenditures |
h | 11 | 0 | 13 | 0 | 18 | 0 | 42 | ||||||||||||||||||||||||
Non-controlling interests |
(2 | ) | 0 | (2 | ) | 0 | (3 | ) | 0 | (7 | ) | |||||||||||||||||||||
All-in costs |
168 | 75 | 62 | 49 | 58 | 52 | 464 | |||||||||||||||||||||||||
Ounces sold - equity basis (000s ounces) |
136 | 91 | 69 | 65 | 46 | 73 | 480 | |||||||||||||||||||||||||
Cost of sales per ounce |
j,k | 1,088 | 1,088 | 903 | 1,329 | 1,502 | 907 | 1,106 | ||||||||||||||||||||||||
Total cash costs per ounce |
k | 682 | 617 | 649 | 731 | 874 | 687 | 691 | ||||||||||||||||||||||||
Total cash costs per ounce (on a co-product basis) |
k,l | 682 | 622 | 656 | 732 | 996 | 863 | 732 | ||||||||||||||||||||||||
All-in sustaining costs per ounce |
k | 1,161 | 817 | 758 | 777 | 913 | 693 | 891 | ||||||||||||||||||||||||
All-in sustaining costs per ounce (on a co-product basis) |
k,l | 1,161 | 822 | 765 | 778 | 1,035 | 869 | 932 | ||||||||||||||||||||||||
All-in costs per ounce |
k | 1,229 | 823 | 912 | 778 | 1,243 | 693 | 965 | ||||||||||||||||||||||||
All-in costs per ounce (on a co-product basis) |
k,l | 1,229 | 828 | 919 | 779 | 1,365 | 869 | 1,006 |
BARRICK THIRD QUARTER 2020 | 89 | MANAGEMENTS DISCUSSION AND ANALYSIS |
($ millions, except per ounce information in dollars) | For the three months ended 6/30/20 | |||||||||||||||||||||||||||||||||
Footnote | Carlina | Cortezb | Turquoise Ridgec |
Long Canyond |
Phoenixd | Nevada Gold Minese |
Hemlo | North America |
||||||||||||||||||||||||||
Cost of sales applicable to gold production |
395 | 187 | 136 | 63 | 108 | 889 | 68 | 957 | ||||||||||||||||||||||||||
Depreciation |
(70 | ) | (56 | ) | (40 | ) | (44 | ) | (27 | ) | (237 | ) | (10 | ) | (247 | ) | ||||||||||||||||||
By-product credits |
(1 | ) | 0 | 0 | 0 | (36 | ) | (37 | ) | 0 | (37 | ) | ||||||||||||||||||||||
Non-recurring items |
f | 0 | 0 | 0 | 0 | 0 | 0 | 0 | ||||||||||||||||||||||||||
Other |
0 | 0 | 0 | 0 | 0 | 0 | 0 | 0 | ||||||||||||||||||||||||||
Non-controlling interests |
(125 | ) | (51 | ) | (37 | ) | (7 | ) | (18 | ) | (238 | ) | 0 | (238 | ) | |||||||||||||||||||
Total cash costs |
199 | 80 | 59 | 12 | 27 | 377 | 58 | 435 | ||||||||||||||||||||||||||
General & administrative costs |
0 | 0 | 0 | 0 | 0 | 0 | 0 | 0 | ||||||||||||||||||||||||||
Minesite exploration and evaluation costs |
g | 7 | 3 | 4 | 3 | 1 | 18 | 0 | 18 | |||||||||||||||||||||||||
Minesite sustaining capital expenditures |
h | 97 | 67 | 5 | 5 | 13 | 193 | 19 | 212 | |||||||||||||||||||||||||
Sustaining leases |
0 | 0 | 0 | 0 | 0 | 0 | 0 | 0 | ||||||||||||||||||||||||||
Rehabilitation - accretion and amortization (operating sites) |
i | 2 | 3 | 0 | 1 | 0 | 6 | 1 | 7 | |||||||||||||||||||||||||
Non-controlling interests |
(41 | ) | (28 | ) | (4 | ) | (3 | ) | (5 | ) | (87 | ) | 0 | (87 | ) | |||||||||||||||||||
All-in sustaining costs |
264 | 125 | 64 | 18 | 36 | 507 | 78 | 585 | ||||||||||||||||||||||||||
Project exploration and evaluation and project costs |
g | 0 | 0 | 0 | 0 | 0 | 0 | 0 | 0 | |||||||||||||||||||||||||
Project capital expenditures |
h | 0 | 17 | 8 | 0 | 0 | 57 | 0 | 57 | |||||||||||||||||||||||||
Non-controlling interests |
0 | (7 | ) | (2 | ) | 0 | 0 | (20 | ) | 0 | (20 | ) | ||||||||||||||||||||||
All-in costs |
264 | 135 | 70 | 18 | 36 | 544 | 78 | 622 | ||||||||||||||||||||||||||
Ounces sold - equity basis (000s ounces) |
234 | 132 | 79 | 38 | 39 | 522 | 54 | 576 | ||||||||||||||||||||||||||
Cost of sales per ounce |
j,k | 1,037 | 870 | 1,073 | 1,009 | 1,726 | 1,055 | 1,268 | 1,075 | |||||||||||||||||||||||||
Total cash costs per ounce |
k | 850 | 613 | 753 | 308 | 725 | 728 | 1,080 | 761 | |||||||||||||||||||||||||
Total cash costs per ounce (on a co-product basis) |
k,l | 851 | 613 | 753 | 308 | 1,293 | 797 | 1,087 | 824 | |||||||||||||||||||||||||
All-in sustaining costs per ounce |
k | 1,130 | 950 | 829 | 430 | 957 | 985 | 1,456 | 1,029 | |||||||||||||||||||||||||
All-in sustaining costs per ounce (on a co-product basis) |
k,l | 1,131 | 950 | 829 | 430 | 1,525 | 1,054 | 1,463 | 1,092 | |||||||||||||||||||||||||
All-in costs per ounce |
k | 1,130 | 1,031 | 894 | 430 | 957 | 1,052 | 1,456 | 1,090 | |||||||||||||||||||||||||
All-in costs per ounce (on a co-product basis) |
k,l | 1,131 | 1,031 | 894 | 430 | 1,525 | 1,121 | 1,463 | 1,153 |
BARRICK THIRD QUARTER 2020 | 90 | MANAGEMENTS DISCUSSION AND ANALYSIS |
($ millions, except per ounce information in dollars) | For the three months ended 6/30/20 | |||||||||||||||||
Footnote | Pueblo Viejo | Veladero | Porgera° |
Latin America & Asia Pacific |
||||||||||||||
Cost of sales applicable to gold production |
178 | 43 | 26 | 247 | ||||||||||||||
Depreciation |
(54 | ) | (13 | ) | (6 | ) | (73 | ) | ||||||||||
By-product credits |
(13 | ) | (1 | ) | (1 | ) | (15 | ) | ||||||||||
Non-recurring items |
f | 0 | ||||||||||||||||
Other |
0 | 0 | 0 | 0 | ||||||||||||||
Non-controlling interests |
(44 | ) | 0 | 0 | (44 | ) | ||||||||||||
Total cash costs |
67 | 29 | 19 | 115 | ||||||||||||||
General & administrative costs |
0 | 0 | 0 | 0 | ||||||||||||||
Minesite exploration and evaluation costs |
g | 0 | 0 | 0 | 0 | |||||||||||||
Minesite sustaining capital expenditures |
h | 26 | 20 | 2 | 48 | |||||||||||||
Sustaining leases |
0 | 1 | 1 | 2 | ||||||||||||||
Rehabilitation - accretion and amortization (operating sites) |
i | 2 | 1 | 0 | 3 | |||||||||||||
Non-controlling interests |
(11 | ) | 0 | 0 | (11 | ) | ||||||||||||
All-in sustaining costs |
84 | 51 | 22 | 157 | ||||||||||||||
Project exploration and evaluation and project costs |
g | 0 | 0 | 0 | 0 | |||||||||||||
Project capital expenditures |
h | 9 | 0 | 0 | 9 | |||||||||||||
Non-controlling interests |
(3 | ) | 0 | 0 | (3 | ) | ||||||||||||
All-in costs |
90 | 51 | 22 | 163 | ||||||||||||||
Ounces sold - equity basis (000s ounces) |
115 | 35 | 24 | 174 | ||||||||||||||
Cost of sales per ounce |
j,k | 935 | 1,228 | 1,141 | 1,023 | |||||||||||||
Total cash costs per ounce |
k | 579 | 801 | 875 | 664 | |||||||||||||
Total cash costs per ounce (on a co-product basis) |
k,l | 649 | 840 | 884 | 743 | |||||||||||||
All-in sustaining costs per ounce |
k | 720 | 1,383 | 1,046 | 900 | |||||||||||||
All-in sustaining costs per ounce (on a co-product basis) |
k,l | 790 | 1,422 | 1,055 | 979 | |||||||||||||
All-in costs per ounce |
k | 763 | 1,383 | 1,046 | 929 | |||||||||||||
All-in costs per ounce (on a co-product basis) |
k,l | 833 | 1,422 | 1,055 | 1,008 |
BARRICK THIRD QUARTER 2020 | 91 | MANAGEMENTS DISCUSSION AND ANALYSIS |
($ millions, except per ounce information in dollars) | For the three months ended 6/30/20 | |||||||||||||||||||||||||||||||
Footnote | Loulo- Gounkoto |
Kibali | North Maran |
Tongon | Bulyanhulun | Buzwagin | Africa & Middle East |
|||||||||||||||||||||||||
Cost of sales applicable to gold production |
200 | 101 | 84 | 96 | 60 | 61 | 602 | |||||||||||||||||||||||||
Depreciation |
(74 | ) | (42 | ) | (25 | ) | (45 | ) | (23 | ) | (2 | ) | (211 | ) | ||||||||||||||||||
By-product credits |
0 | (1 | ) | 0 | 0 | (4 | ) | (9 | ) | (14 | ) | |||||||||||||||||||||
Non-recurring items |
f | 0 | ||||||||||||||||||||||||||||||
Other |
0 | 0 | 0 | 0 | 0 | 0 | 0 | |||||||||||||||||||||||||
Non-controlling interests |
(25 | ) | 0 | (9 | ) | (5 | ) | (5 | ) | (8 | ) | (52 | ) | |||||||||||||||||||
Total cash costs |
101 | 58 | 50 | 46 | 28 | 42 | 325 | |||||||||||||||||||||||||
General & administrative costs |
0 | 0 | 0 | 0 | 0 | 0 | 0 | |||||||||||||||||||||||||
Minesite exploration and evaluation costs |
g | 4 | 1 | 0 | 1 | 0 | 0 | 6 | ||||||||||||||||||||||||
Minesite sustaining capital expenditures |
h | 70 | 9 | 34 | 3 | 3 | 1 | 120 | ||||||||||||||||||||||||
Sustaining leases |
2 | 2 | 0 | 1 | 0 | 1 | 6 | |||||||||||||||||||||||||
Rehabilitation - accretion and amortization (operating sites) |
i | 1 | 1 | 1 | 0 | 0 | 0 | 3 | ||||||||||||||||||||||||
Non-controlling interests |
(16 | ) | 0 | (6 | ) | (1 | ) | (1 | ) | 0 | (24 | ) | ||||||||||||||||||||
All-in sustaining costs |
162 | 71 | 79 | 50 | 30 | 44 | 436 | |||||||||||||||||||||||||
Project exploration and evaluation and project costs |
g | 0 | 0 | 0 | 0 | 0 | 0 | 0 | ||||||||||||||||||||||||
Project capital expenditures |
h | 0 | 1 | 2 | 0 | 7 | 0 | 10 | ||||||||||||||||||||||||
Non-controlling interests |
0 | 0 | (1 | ) | 0 | (1 | ) | 0 | (2 | ) | ||||||||||||||||||||||
All-in costs |
162 | 72 | 80 | 50 | 36 | 44 | 444 | |||||||||||||||||||||||||
Ounces sold - equity basis (000s ounces) |
157 | 96 | 67 | 68 | 30 | 56 | 474 | |||||||||||||||||||||||||
Cost of sales per ounce |
j,k | 1,012 | 1,067 | 1,040 | 1,275 | 1,658 | 909 | 1,094 | ||||||||||||||||||||||||
Total cash costs per ounce |
k | 639 | 617 | 724 | 688 | 950 | 751 | 687 | ||||||||||||||||||||||||
Total cash costs per ounce (on a co-product basis) |
k,l | 639 | 620 | 730 | 689 | 1,030 | 865 | 711 | ||||||||||||||||||||||||
All-in sustaining costs per ounce |
k | 1,030 | 739 | 1,166 | 745 | 1,014 | 770 | 919 | ||||||||||||||||||||||||
All-in sustaining costs per ounce (on a co-product basis) |
k,l | 1,030 | 742 | 1,172 | 746 | 1,094 | 884 | 943 | ||||||||||||||||||||||||
All-in costs per ounce |
k | 1,030 | 750 | 1,195 | 745 | 1,214 | 770 | 938 | ||||||||||||||||||||||||
All-in costs per ounce (on a co-product basis) |
k,l | 1,030 | 753 | 1,201 | 746 | 1,294 | 884 | 962 |
BARRICK THIRD QUARTER 2020 | 92 | MANAGEMENTS DISCUSSION AND ANALYSIS |
($ millions, except per ounce information in dollars) | For the three months ended 9/30/19 | |||||||||||||||||||||||||||||||||||||
Footnote | Nevada Gold Minese |
Cortezb | Carlina | Turquoise Ridgec |
Phoenixd | Long Canyond |
Pueblo Viejo |
Loulo- Gounkoto |
Kibali | |||||||||||||||||||||||||||||
Cost of sales applicable to gold production |
897 | 170 | 445 | 168 | 68 | 46 | 181 | 199 | 107 | |||||||||||||||||||||||||||||
Depreciation |
(270 | ) | (53 | ) | (101 | ) | (70 | ) | (14 | ) | (32 | ) | (48 | ) | (76 | ) | (57 | ) | ||||||||||||||||||||
By-product credits |
(25 | ) | (1 | ) | (1 | ) | (1 | ) | (22 | ) | 0 | (17 | ) | 0 | 0 | |||||||||||||||||||||||
Non-recurring items |
f | 0 | 0 | 0 | 0 | 0 | 0 | 0 | 0 | 0 | ||||||||||||||||||||||||||||
Other |
0 | 0 | 0 | 0 | 0 | 0 | 0 | 0 | 0 | |||||||||||||||||||||||||||||
Non-controlling interests |
(233 | ) | (45 | ) | (133 | ) | (37 | ) | (13 | ) | (5 | ) | (48 | ) | (25 | ) | 0 | |||||||||||||||||||||
Total cash costs |
369 | 71 | 210 | 60 | 19 | 9 | 68 | 98 | 50 | |||||||||||||||||||||||||||||
General & administrative costs |
0 | 0 | 0 | 0 | 0 | 0 | 0 | 0 | 0 | |||||||||||||||||||||||||||||
Minesite exploration and evaluation costs |
g | 12 | 2 | 5 | 2 | 0 | 3 | 0 | 3 | 0 | ||||||||||||||||||||||||||||
Minesite sustaining capital expenditures |
h | 188 | 36 | 102 | 27 | 14 | 9 | 27 | 60 | 13 | ||||||||||||||||||||||||||||
Sustaining leases |
1 | 0 | 0 | 1 | 0 | 0 | 0 | 2 | 0 | |||||||||||||||||||||||||||||
Rehabilitation -accretion and amortization (operating sites) |
i | 20 | 4 | 8 | 3 | 4 | 1 | 3 | 0 | 0 | ||||||||||||||||||||||||||||
Non-controlling interests |
(86 | ) | (15 | ) | (48 | ) | (12 | ) | (6 | ) | (5 | ) | (12 | ) | (13 | ) | 0 | |||||||||||||||||||||
All-in sustaining costs |
504 | 98 | 277 | 81 | 31 | 17 | 86 | 150 | 63 | |||||||||||||||||||||||||||||
Project exploration and evaluation and project costs |
g | 0 | 0 | 0 | 0 | 0 | 0 | 0 | 0 | 0 | ||||||||||||||||||||||||||||
Project capital expenditures |
h | 85 | 49 | 0 | 13 | 0 | 0 | 0 | 1 | 1 | ||||||||||||||||||||||||||||
Non-controlling interests |
(31 | ) | (18 | ) | 0 | (5 | ) | 0 | 0 | 0 | (1 | ) | 0 | |||||||||||||||||||||||||
All-in costs |
558 | 129 | 277 | 89 | 31 | 17 | 86 | 150 | 64 | |||||||||||||||||||||||||||||
Ounces sold - equity basis (000s ounces) |
537 | 126 | 272 | 96 | 19 | 24 | 136 | 155 | 89 | |||||||||||||||||||||||||||||
Cost of sales per ounce |
j,k | 1,027 | 829 | 1,007 | 1,077 | 2,186 | 1,170 | 807 | 1,018 | 1,187 | ||||||||||||||||||||||||||||
Total cash costs per ounce |
k | 693 | 570 | 775 | 622 | 1,010 | 353 | 504 | 630 | 554 | ||||||||||||||||||||||||||||
Total cash costs per ounce (on a co-product basis) |
k,l | 694 | 571 | 776 | 622 | 1,734 | 355 | 587 | 630 | 554 | ||||||||||||||||||||||||||||
All-in sustaining costs per ounce |
k | 946 | 772 | 1,014 | 840 | 1,622 | 714 | 631 | 966 | 703 | ||||||||||||||||||||||||||||
All-in sustaining costs per ounce (on a co-product basis) |
k,l | 947 | 773 | 1,015 | 840 | 2,346 | 716 | 714 | 966 | 703 | ||||||||||||||||||||||||||||
All-in costs per ounce |
k | 1,048 | 1,020 | 1,014 | 927 | 1,622 | 714 | 636 | 971 | 717 | ||||||||||||||||||||||||||||
All-in costs per ounce (on a co-product basis) |
k,l | 1,049 | 1,021 | 1,015 | 927 | 2,346 | 716 | 719 | 971 | 717 |
BARRICK THIRD QUARTER 2020 | 93 | MANAGEMENTS DISCUSSION AND ANALYSIS |
($ millions, except per ounce information in dollars) | For the three months ended 9/30/19 | |||||||||||||||||||||||||||||||||||||
Footnote | Veladero | Kalgoorliem | Tongon | Porgerao | Hemlo | Lagunas Norte |
North Maran | Bulyanhulun | Buzwagin | |||||||||||||||||||||||||||||
Cost of sales applicable to gold production |
72 | 60 | 102 | 77 | 55 | 54 | 53 | 10 | 35 | |||||||||||||||||||||||||||||
Depreciation |
(25 | ) | (10 | ) | (44 | ) | (11 | ) | (6 | ) | (5 | ) | (17 | ) | (4 | ) | (3 | ) | ||||||||||||||||||||
By-product credits |
(1 | ) | 0 | 0 | (1 | ) | (1 | ) | (2 | ) | 0 | 0 | (1 | ) | ||||||||||||||||||||||||
Non-recurring items |
f | 0 | 0 | 0 | 0 | (1 | ) | (3 | ) | 0 | 0 | 0 | ||||||||||||||||||||||||||
Other |
0 | 0 | 0 | 0 | 0 | 0 | 0 | 0 | 0 | |||||||||||||||||||||||||||||
Non-controlling interests |
0 | 0 | (6 | ) | 0 | 0 | 0 | (12 | ) | (3 | ) | (12 | ) | |||||||||||||||||||||||||
Total cash costs |
46 | 50 | 52 | 65 | 47 | 44 | 24 | 3 | 19 | |||||||||||||||||||||||||||||
General & administrative costs |
0 | 0 | 0 | 0 | 0 | 0 | 0 | 0 | 0 | |||||||||||||||||||||||||||||
Minesite exploration and evaluation costs |
g | 1 | 2 | 0 | 0 | 0 | 1 | 0 | 0 | 0 | ||||||||||||||||||||||||||||
Minesite sustaining capital expenditures |
h | 19 | 15 | 4 | 14 | 15 | 0 | 13 | 1 | 0 | ||||||||||||||||||||||||||||
Sustaining leases |
1 | 1 | 1 | 1 | 0 | 0 | 0 | 0 | 0 | |||||||||||||||||||||||||||||
Rehabilitation - accretion and amortization (operating sites) |
i | 1 | 0 | 0 | (1 | ) | 1 | 2 | 0 | 0 | 1 | |||||||||||||||||||||||||||
Non-controlling interests |
0 | 0 | 0 | 0 | 0 | 0 | (5 | ) | 0 | 0 | ||||||||||||||||||||||||||||
All-in sustaining costs |
68 | 68 | 57 | 79 | 63 | 47 | 32 | 4 | 20 | |||||||||||||||||||||||||||||
Project exploration and evaluation and project costs |
g | 0 | 0 | 0 | 0 | 0 | 0 | 0 | 0 | 0 | ||||||||||||||||||||||||||||
Project capital expenditures |
h | 0 | 0 | 0 | 0 | 0 | 0 | 2 | 0 | 0 | ||||||||||||||||||||||||||||
Non-controlling interests |
0 | 0 | 0 | 0 | 0 | 0 | (1 | ) | 1 | 0 | ||||||||||||||||||||||||||||
All-in costs |
68 | 68 | 57 | 79 | 63 | 47 | 33 | 5 | 20 | |||||||||||||||||||||||||||||
Ounces sold - equity basis (000s ounces) |
59 | 58 | 66 | 75 | 50 | 33 | 36 | 5 | 18 | |||||||||||||||||||||||||||||
Cost of sales per ounce |
j,k | 1,243 | 1,037 | 1,396 | 1,024 | 1,083 | 1,661 | 907 | 1,288 | 1,292 | ||||||||||||||||||||||||||||
Total cash costs per ounce |
k | 773 | 856 | 793 | 868 | 953 | 1,327 | 603 | 729 | 1,202 | ||||||||||||||||||||||||||||
Total cash costs per ounce (on a co-product basis) |
k,l | 799 | 859 | 795 | 878 | 956 | 1,374 | 608 | 754 | 1,210 | ||||||||||||||||||||||||||||
All-in sustaining costs per ounce |
k | 1,142 | 1,170 | 869 | 1,053 | 1,280 | 1,422 | 850 | 769 | 1,220 | ||||||||||||||||||||||||||||
All-in sustaining costs per ounce (on a co-product basis) |
k,l | 1,168 | 1,173 | 871 | 1,063 | 1,283 | 1,469 | 855 | 794 | 1,228 | ||||||||||||||||||||||||||||
All-in costs per ounce |
k | 1,142 | 1,170 | 869 | 1,053 | 1,280 | 1,422 | 886 | 866 | 1,220 | ||||||||||||||||||||||||||||
All-in costs per ounce (on a co-product basis) |
k,l | 1,168 | 1,173 | 871 | 1,063 | 1,283 | 1,469 | 891 | 891 | 1,228 |
BARRICK THIRD QUARTER 2020 | 94 | MANAGEMENTS DISCUSSION AND ANALYSIS |
($ millions, except per ounce information in dollars) | For the nine months ended 9/30/2020 | |||||||||||||||||||||||||||||||||||
Footnote | Carlina | Cortezb | Turquoise Ridgec |
Long Canyond |
Phoenixd | Nevada Gold Minese |
Hemlo | North America |
||||||||||||||||||||||||||||
Cost of sales applicable to gold production |
1,239 | 567 | 419 | 172 | 276 | 2,673 | 202 | 2,875 | ||||||||||||||||||||||||||||
Depreciation |
(232 | ) | (164 | ) | (132 | ) | (122 | ) | (72 | ) | (722 | ) | (28 | ) | (750 | ) | ||||||||||||||||||||
By-product credits |
(2 | ) | (1 | ) | (3 | ) | 0 | (95 | ) | (101 | ) | (1 | ) | (102 | ) | |||||||||||||||||||||
Non-recurring items |
f | 0 | 0 | 0 | 0 | 0 | 0 | 0 | 0 | |||||||||||||||||||||||||||
Other |
0 | 0 | 0 | 0 | 0 | 0 | 0 | 0 | ||||||||||||||||||||||||||||
Non-controlling interests |
(387 | ) | (155 | ) | (110 | ) | (19 | ) | (42 | ) | (713 | ) | 0 | (713 | ) | |||||||||||||||||||||
Total cash costs |
618 | 247 | 174 | 31 | 67 | 1,137 | 173 | 1,310 | ||||||||||||||||||||||||||||
General & administrative costs |
0 | 0 | 0 | 0 | 0 | 0 | 0 | 0 | ||||||||||||||||||||||||||||
Minesite exploration and evaluation costs |
g | 17 | 6 | 7 | 5 | 1 | 36 | 0 | 36 | |||||||||||||||||||||||||||
Minesite sustaining capital expenditures |
h | 285 | 207 | 29 | 23 | 26 | 591 | 59 | 650 | |||||||||||||||||||||||||||
Sustaining leases |
0 | 0 | 0 | 0 | 0 | 0 | 0 | 0 | ||||||||||||||||||||||||||||
Rehabilitation - accretion and amortization (operating sites) |
i | 6 | 10 | 0 | 1 | 2 | 19 | 1 | 20 | |||||||||||||||||||||||||||
Non-controlling interests |
(119 | ) | (86 | ) | (14 | ) | (11 | ) | (10 | ) | (248 | ) | 0 | (248 | ) | |||||||||||||||||||||
All-in sustaining costs |
807 | 384 | 196 | 49 | 86 | 1,535 | 233 | 1,768 | ||||||||||||||||||||||||||||
Project exploration and evaluation and project costs |
g | 0 | 0 | 0 | 0 | 0 | 0 | 0 | 0 | |||||||||||||||||||||||||||
Project capital expenditures |
h | 0 | 43 | 37 | 0 | 0 | 150 | 0 | 150 | |||||||||||||||||||||||||||
Non-controlling interests |
0 | (16 | ) | (14 | ) | 0 | 0 | (57 | ) | 0 | (57 | ) | ||||||||||||||||||||||||
All-in costs |
807 | 411 | 219 | 49 | 86 | 1,628 | 233 | 1,861 | ||||||||||||||||||||||||||||
Ounces sold - equity basis (000s ounces) |
765 | 375 | 242 | 110 | 100 | 1,592 | 167 | 1,759 | ||||||||||||||||||||||||||||
Cost of sales per ounce |
j,k | 996 | 931 | 1,066 | 960 | 1,697 | 1,039 | 1,213 | 1,056 | |||||||||||||||||||||||||||
Total cash costs per ounce |
k | 807 | 660 | 720 | 278 | 665 | 714 | 1,040 | 745 | |||||||||||||||||||||||||||
Total cash costs per ounce (on a co-product basis) |
k,l | 808 | 662 | 728 | 280 | 1,251 | 753 | 1,044 | 781 | |||||||||||||||||||||||||||
All-in sustaining costs per ounce |
k | 1,055 | 1,026 | 813 | 443 | 852 | 964 | 1,409 | 1,006 | |||||||||||||||||||||||||||
All-in sustaining costs per ounce (on a co-product basis) |
k,l | 1,056 | 1,028 | 821 | 445 | 1,438 | 1,003 | 1,413 | 1,042 | |||||||||||||||||||||||||||
All-in costs per ounce |
k | 1,055 | 1,096 | 908 | 443 | 852 | 1,023 | 1,411 | 1,060 | |||||||||||||||||||||||||||
All-in costs per ounce (on a co-product basis) |
k,l | 1,056 | 1,098 | 916 | 445 | 1,438 | 1,062 | 1,415 | 1,096 |
BARRICK THIRD QUARTER 2020 | 95 | MANAGEMENTS DISCUSSION AND ANALYSIS |
($ millions, except per ounce information in dollars) | For the nine months ended 9/30/2020 | |||||||||||||||||||
Footnote | Pueblo Viejo | Veladero | Porgera° |
Latin America & Asia Pacific |
||||||||||||||||
Cost of sales applicable to gold production |
532 | 159 | 101 | 792 | ||||||||||||||||
Depreciation |
(163 | ) | (52 | ) | (20 | ) | (235 | ) | ||||||||||||
By-product credits |
(42 | ) | (3 | ) | (1 | ) | (46 | ) | ||||||||||||
Non-recurring items |
f | 0 | 0 | 0 | 0 | |||||||||||||||
Other |
0 | 0 | 0 | 0 | ||||||||||||||||
Non-controlling interests |
(130 | ) | 0 | 0 | (130 | ) | ||||||||||||||
Total cash costs |
197 | 104 | 80 | 381 | ||||||||||||||||
General & administrative costs |
0 | 0 | 0 | 0 | ||||||||||||||||
Minesite exploration and evaluation costs |
g | 0 | 0 | 2 | 2 | |||||||||||||||
Minesite sustaining capital expenditures |
h | 86 | 63 | 11 | 160 | |||||||||||||||
Sustaining leases |
0 | 1 | 3 | 4 | ||||||||||||||||
Rehabilitation - accretion and amortization (operating sites) |
i | 4 | 3 | 0 | 7 | |||||||||||||||
Non-controlling interests |
(36 | ) | 0 | 0 | (36 | ) | ||||||||||||||
All-in sustaining costs |
251 | 171 | 96 | 518 | ||||||||||||||||
Project exploration and evaluation and project costs |
g | 3 | 0 | 0 | 3 | |||||||||||||||
Project capital expenditures |
h | 27 | 15 | 0 | 42 | |||||||||||||||
Non-controlling interests |
(11 | ) | 0 | 0 | (11 | ) | ||||||||||||||
All-in costs |
270 | 186 | 96 | 552 | ||||||||||||||||
Ounces sold - equity basis (000s ounces) |
388 | 135 | 87 | 610 | ||||||||||||||||
Cost of sales per ounce |
j,k | 825 | 1,180 | 1,168 | 952 | |||||||||||||||
Total cash costs per ounce |
k | 508 | 766 | 925 | 624 | |||||||||||||||
Total cash costs per ounce (on a co-product basis) |
k,l | 571 | 790 | 931 | 671 | |||||||||||||||
All-in sustaining costs per ounce |
k | 648 | 1,263 | 1,102 | 849 | |||||||||||||||
All-in sustaining costs per ounce (on a co-product basis) |
k,l | 711 | 1,287 | 1,108 | 896 | |||||||||||||||
All-in costs per ounce |
k | 694 | 1,376 | 1,102 | 901 | |||||||||||||||
All-in costs per ounce (on a co- product basis) |
k,l | 757 | 1,400 | 1,108 | 948 |
BARRICK THIRD QUARTER 2020 | 96 | MANAGEMENTS DISCUSSION AND ANALYSIS |
($ millions, except per ounce information in dollars) | For the nine months ended 9/30/2020 | |||||||||||||||||||||||||||||||
Footnote | Loulo- Gounkoto |
Kibali | North Maran |
Tongon | Bulyanhulun | Buzwagin | Africa & Middle East |
|||||||||||||||||||||||||
Cost of sales applicable to gold production |
538 | 293 | 236 | 281 | 156 | 179 | 1,683 | |||||||||||||||||||||||||
Depreciation |
(202 | ) | (126 | ) | (70 | ) | (127 | ) | (59 | ) | (9 | ) | (593 | ) | ||||||||||||||||||
By-product credits |
0 | (1 | ) | (2 | ) | 0 | (10 | ) | (23 | ) | (36 | ) | ||||||||||||||||||||
Non-recurring items |
f | 0 | 0 | 0 | 0 | 0 | 0 | 0 | ||||||||||||||||||||||||
Other |
0 | 0 | 0 | 0 | 0 | 0 | 0 | |||||||||||||||||||||||||
Non-controlling interests |
(67 | ) | 0 | (26 | ) | (16 | ) | (14 | ) | (23 | ) | (146 | ) | |||||||||||||||||||
Total cash costs |
269 | 166 | 138 | 138 | 73 | 124 | 908 | |||||||||||||||||||||||||
General & administrative costs |
0 | 0 | 0 | 0 | 0 | 0 | 0 | |||||||||||||||||||||||||
Minesite exploration and evaluation costs |
g | 9 | 2 | 0 | 2 | 0 | 0 | 13 | ||||||||||||||||||||||||
Minesite sustaining capital expenditures |
h | 186 | 38 | 55 | 7 | 6 | 1 | 293 | ||||||||||||||||||||||||
Sustaining leases |
2 | 7 | 0 | 1 | 0 | 1 | 11 | |||||||||||||||||||||||||
Rehabilitation - accretion and amortization (operating sites) |
i | 4 | 1 | 3 | 0 | 1 | 0 | 9 | ||||||||||||||||||||||||
Non-controlling interests |
(40 | ) | 0 | (9 | ) | (1 | ) | (1 | ) | 0 | (51 | ) | ||||||||||||||||||||
All-in sustaining costs |
430 | 214 | 187 | 147 | 79 | 126 | 1,183 | |||||||||||||||||||||||||
Project exploration and evaluation and project costs |
g | 0 | 0 | 0 | 0 | 0 | 0 | 0 | ||||||||||||||||||||||||
Project capital expenditures |
h | 11 | 1 | 17 | 0 | 26 | 0 | 55 | ||||||||||||||||||||||||
Non-controlling interests |
(2 | ) | 0 | (3 | ) | 0 | (4 | ) | 0 | (9 | ) | |||||||||||||||||||||
All-in costs |
439 | 215 | 201 | 147 | 101 | 126 | 1,229 | |||||||||||||||||||||||||
Ounces sold - equity basis (000s ounces) |
416 | 275 | 206 | 191 | 83 | 153 | 1,324 | |||||||||||||||||||||||||
Cost of sales per ounce |
j,k | 1,034 | 1,067 | 967 | 1,322 | 1,574 | 981 | 1,100 | ||||||||||||||||||||||||
Total cash costs per ounce |
k | 646 | 606 | 673 | 725 | 885 | 803 | 686 | ||||||||||||||||||||||||
Total cash costs per ounce (on a co-product basis) |
k,l | 646 | 609 | 680 | 726 | 983 | 930 | 709 | ||||||||||||||||||||||||
All-in sustaining costs per ounce |
k | 1,031 | 776 | 911 | 769 | 949 | 815 | 892 | ||||||||||||||||||||||||
All-in sustaining costs per ounce (on a co-product basis) |
k,l | 1,031 | 779 | 918 | 770 | 1,047 | 942 | 915 | ||||||||||||||||||||||||
All-in costs per ounce |
k | 1,053 | 781 | 979 | 769 | 1,215 | 815 | 927 | ||||||||||||||||||||||||
All-in costs per ounce (on a co-product basis) |
k,l | 1,053 | 784 | 986 | 770 | 1,313 | 942 | 950 |
BARRICK THIRD QUARTER 2020 | 97 | MANAGEMENTS DISCUSSION AND ANALYSIS |
($ millions, except per ounce information in dollars) | For the nine months ended 9/30/2019 | |||||||||||||||||||||||||||||||||||||
Footnote | Nevada Gold Minese |
Cortezb | Carlina | Turquoise Ridgec |
Phoenixd | Long Canyond |
Pueblo Viejo |
Loulo- Gounkoto |
Kibali | |||||||||||||||||||||||||||||
Cost of sales applicable to gold production |
1,807 | 549 | 874 | 270 | 68 | 46 | 532 | 565 | 297 | |||||||||||||||||||||||||||||
Depreciation |
(533 | ) | (182 | ) | (220 | ) | (85 | ) | (14 | ) | (32 | ) | (141 | ) | (222 | ) | (144 | ) | ||||||||||||||||||||
By-product credits |
(25 | ) | (1 | ) | (1 | ) | (1 | ) | (22 | ) | 0 | (49 | ) | 0 | 0 | |||||||||||||||||||||||
Non-recurring items |
f | (9 | ) | 0 | (9 | ) | 0 | 0 | 0 | (1 | ) | 0 | 0 | |||||||||||||||||||||||||
Other |
0 | 0 | 0 | 0 | 0 | 0 | 0 | 0 | 0 | |||||||||||||||||||||||||||||
Non-controlling interests |
(234 | ) | (45 | ) | (134 | ) | (37 | ) | (13 | ) | (5 | ) | (139 | ) | (69 | ) | 0 | |||||||||||||||||||||
Total cash costs |
1,006 | 321 | 510 | 147 | 19 | 9 | 202 | 274 | 153 | |||||||||||||||||||||||||||||
General & administrative costs |
0 | 0 | 0 | 0 | 0 | 0 | 0 | 0 | 0 | |||||||||||||||||||||||||||||
Minesite exploration and evaluation costs |
g | 20 | 5 | 9 | 3 | 0 | 3 | 0 | 7 | 1 | ||||||||||||||||||||||||||||
Minesite sustaining capital expenditures |
h | 343 | 64 | 215 | 41 | 14 | 9 | 84 | 119 | 32 | ||||||||||||||||||||||||||||
Sustaining leases |
1 | 0 | 0 | 1 | 0 | 0 | 0 | 3 | 0 | |||||||||||||||||||||||||||||
Rehabilitation -accretion and amortization (operating sites) |
i | 30 | 12 | 10 | 3 | 4 | 1 | 6 | 0 | 0 | ||||||||||||||||||||||||||||
Non-controlling interests |
(95 | ) | (15 | ) | (57 | ) | (12 | ) | (6 | ) | (5 | ) | (36 | ) | (26 | ) | 0 | |||||||||||||||||||||
All-in sustaining costs |
1,305 | 387 | 687 | 183 | 31 | 17 | 256 | 377 | 186 | |||||||||||||||||||||||||||||
Project exploration and evaluation and project costs |
g | 0 | 0 | 0 | 0 | 0 | 0 | 3 | 0 | 0 | ||||||||||||||||||||||||||||
Project capital expenditures |
h | 257 | 180 | 0 | 34 | 0 | 0 | 0 | 3 | 2 | ||||||||||||||||||||||||||||
Non-controlling interests |
(31 | ) | (18 | ) | 0 | (5 | ) | 0 | 0 | 0 | (1 | ) | 0 | |||||||||||||||||||||||||
All-in costs |
1,531 | 549 | 687 | 212 | 31 | 17 | 259 | 379 | 188 | |||||||||||||||||||||||||||||
Ounces sold - equity basis (000s ounces) |
1,658 | 666 | 692 | 257 | 19 | 24 | 410 | 431 | 274 | |||||||||||||||||||||||||||||
Cost of sales per ounce |
j,k | 881 | 725 | 1,015 | 797 | 2,186 | 1,170 | 783 | 1,047 | 1,081 | ||||||||||||||||||||||||||||
Total cash costs per ounce |
k | 608 | 482 | 738 | 570 | 1,010 | 353 | 492 | 635 | 555 | ||||||||||||||||||||||||||||
Total cash costs per ounce (on a co-product basis) |
k,l | 609 | 483 | 739 | 572 | 1,734 | 354 | 568 | 635 | 555 | ||||||||||||||||||||||||||||
All-in sustaining costs per ounce |
k | 789 | 580 | 992 | 710 | 1,622 | 714 | 623 | 875 | 678 | ||||||||||||||||||||||||||||
All-in sustaining costs per ounce (on a co-product basis) |
k,l | 790 | 581 | 993 | 712 | 2,346 | 715 | 699 | 875 | 678 | ||||||||||||||||||||||||||||
All-in costs per ounce |
k | 926 | 818 | 992 | 825 | 1,622 | 714 | 632 | 880 | 685 | ||||||||||||||||||||||||||||
All-in costs per ounce (on a co-product basis) |
k,l | 927 | 819 | 993 | 827 | 2,346 | 715 | 708 | 880 | 685 |
BARRICK THIRD QUARTER 2020 | 98 | MANAGEMENTS DISCUSSION AND ANALYSIS |
($ millions, except per ounce information in dollars) | For the nine months ended 9/30/2019 | |||||||||||||||||||||||||||||||||||||
Footnote | Veladero | Kalgoorlie | Tongon | Porgerao | Hemlo | Lagunas Nortep |
North Maran |
Bulyanhulun | Buzwagin | |||||||||||||||||||||||||||||
Cost of sales applicable to gold production |
241 | 179 | 303 | 209 | 160 | 139 | 206 | 34 | 107 | |||||||||||||||||||||||||||||
Depreciation |
(86 | ) | (32 | ) | (141 | ) | (30 | ) | (20 | ) | (19 | ) | (62 | ) | (15 | ) | (7 | ) | ||||||||||||||||||||
By-product credits |
(5 | ) | 0 | 0 | (2 | ) | (1 | ) | (6 | ) | (1 | ) | (1 | ) | (1 | ) | ||||||||||||||||||||||
Non-recurring items |
f | (1 | ) | 0 | 0 | 0 | (2 | ) | (18 | ) | 0 | 0 | 0 | |||||||||||||||||||||||||
Other |
0 | 0 | 0 | 0 | 0 | 0 | 0 | 0 | ||||||||||||||||||||||||||||||
Non-controlling interests |
0 | 0 | (17 | ) | 0 | 0 | 0 | (51 | ) | (7 | ) | (36 | ) | |||||||||||||||||||||||||
Total cash costs |
149 | 147 | 145 | 177 | 137 | 96 | 92 | 11 | 63 | |||||||||||||||||||||||||||||
General & administrative costs |
0 | 0 | 0 | 0 | 0 | 0 | 0 | 0 | 0 | |||||||||||||||||||||||||||||
Minesite exploration and evaluation costs |
g | 2 | 4 | 2 | 1 | 1 | 2 | 0 | 0 | 0 | ||||||||||||||||||||||||||||
Minesite sustaining capital expenditures |
h | 63 | 46 | 8 | 34 | 32 | 11 | 33 | 2 | 0 | ||||||||||||||||||||||||||||
Sustaining leases |
2 | 4 | 1 | 2 | 0 | 8 | 0 | 0 | 1 | |||||||||||||||||||||||||||||
Rehabilitation - accretion and amortization (operating sites) |
i | 4 | 2 | 0 | (1 | ) | 2 | 7 | 2 | 1 | 1 | |||||||||||||||||||||||||||
Non-controlling interests |
0 | 0 | (1 | ) | 0 | 0 | 0 | (13 | ) | 0 | 0 | |||||||||||||||||||||||||||
All-in sustaining costs |
220 | 203 | 155 | 213 | 172 | 124 | 114 | 13 | 65 | |||||||||||||||||||||||||||||
Project exploration and evaluation and project costs |
g | 0 | 0 | 0 | 0 | 0 | 0 | 0 | 0 | 0 | ||||||||||||||||||||||||||||
Project capital expenditures |
h | 15 | 0 | 0 | 0 | 0 | 0 | 8 | 2 | 0 | ||||||||||||||||||||||||||||
Non-controlling interests |
0 | 0 | 0 | 0 | 0 | 0 | (3 | ) | 0 | 0 | ||||||||||||||||||||||||||||
All-in costs |
235 | 203 | 155 | 213 | 172 | 124 | 119 | 15 | 65 | |||||||||||||||||||||||||||||
Ounces sold - equity basis (000s ounces) |
201 | 171 | 186 | 203 | 164 | 108 | 145 | 18 | 55 | |||||||||||||||||||||||||||||
Cost of sales per ounce |
j,k | 1,206 | 1,047 | 1,467 | 1,029 | 977 | 1,285 | 905 | 1,166 | 1,242 | ||||||||||||||||||||||||||||
Total cash costs per ounce |
k | 742 | 857 | 781 | 871 | 843 | 879 | 625 | 639 | 1,162 | ||||||||||||||||||||||||||||
Total cash costs per ounce (on a co-product basis) |
k,l | 768 | 860 | 783 | 882 | 847 | 931 | 631 | 663 | 1,169 | ||||||||||||||||||||||||||||
All-in sustaining costs per ounce |
k | 1,093 | 1,186 | 837 | 1,047 | 1,061 | 1,133 | 782 | 708 | 1,182 | ||||||||||||||||||||||||||||
All-in sustaining costs per ounce (on a co-product basis) |
k,l | 1,119 | 1,189 | 839 | 1,058 | 1,065 | 1,185 | 788 | 732 | 1,189 | ||||||||||||||||||||||||||||
All-in costs per ounce |
k | 1,169 | 1,186 | 837 | 1,047 | 1,062 | 1,131 | 815 | 805 | 1,182 | ||||||||||||||||||||||||||||
All-in costs per ounce (on a co-product basis) |
k,l | 1,195 | 1,189 | 839 | 1,058 | 1,066 | 1,183 | 821 | 829 | 1,189 |
a. | On July 1, 2019, Barricks Goldstrike and Newmonts Carlin were contributed to Nevada Gold Mines and are now referred to as Carlin. As a result, the amounts presented represent Goldstrike on a 100% basis (including our 60% share of South Arturo) up until June 30, 2019, and the combined results of Carlin and Goldstrike (including our 60% share of South Arturo) on a 61.5% basis thereafter. |
b. | On July 1, 2019, Cortez was contributed to Nevada Gold Mines, a joint venture with Newmont. As a result, the amounts presented are on a 100% basis up until June 30, 2019, and on a 61.5% basis thereafter. |
c. | Barrick owned 75% of Turquoise Ridge through to the end of the second quarter of 2019, with our joint venture partner, Newmont, owning the remaining 25%. Turquoise Ridge was proportionately consolidated on the basis that the joint venture partners that have joint control have rights to the assets and obligations for the liabilities relating to the arrangement. The figures presented in this table are based on our 75% interest in Turquoise Ridge until June 30, 2019. On July 1, 2019, Barricks 75% interest in Turquoise Ridge as well as Newmonts Twin Creeks and 25% interest in Turquoise Ridge were contributed to Nevada Gold Mines. Starting July 1, 2019, the results represent our 61.5% share of Turquoise Ridge and Twin Creeks, now referred to as Turquoise Ridge. |
d. | These sites were acquired as a result of the formation of Nevada Gold Mines on July 1, 2019. The results for the three months ended March 31, 2019 did not form a part of the Barrick consolidated results as these sites were acquired as a result of the formation of Nevada Gold Mines. Therefore, no comparative figures are provided. |
e. | Represents the combined results of Cortez, Goldstrike (including our 60% share of South Arturo) and our 75% interest in Turquoise Ridge until June 30, 2019. Commencing July 1, 2019, the date Nevada Gold Mines was established, the results represent our 61.5% interest in Cortez, Carlin (including Goldstrike and 60% of South Arturo), Turquoise Ridge (including Twin Creeks), Phoenix and Long Canyon. |
f. | Non-recurring items |
Non-recurring items in 2019 relate to organizational restructuring. These costs are not indicative of our cost of production and have been excluded from the calculation of total cash costs. |
g. | Exploration and evaluation costs |
Exploration, evaluation and project expenses are presented as minesite sustaining if it supports current mine operations and project if it relates to future projects. Refer to page 75 of this MD&A. |
h. | Capital expenditures |
BARRICK THIRD QUARTER 2020 | 99 | MANAGEMENTS DISCUSSION AND ANALYSIS |
Capital expenditures are related to our gold sites only and are split between minesite sustaining and project capital expenditures. Project capital expenditures are distinct projects designed to increase the net present value of the mine and are not related to current production. Significant projects in the current year are the expansion project at Pueblo Viejo, the Goldrush exploration declines, the restart of mining activities at Bulyanhulu, and construction of the third shaft at Turquoise Ridge. Refer to page 74 of this MD&A. |
i. | Rehabilitation - accretion and amortization |
Includes depreciation on the assets related to rehabilitation provisions of our gold operations and accretion on the rehabilitation provision of our gold operations, split between operating and non-operating sites. |
j. | Cost of sales per ounce |
Cost of sales applicable to gold per ounce is calculated using cost of sales on an attributable basis (removing the non-controlling interest of 40% Pueblo Viejo, 20% Loulo-Gounkoto, 10.3% Tongon, 16% North Mara, Bulyanhulu and Buzwagi starting January 1, 2020, the date the GoTs 16% free carried interest was made effective (36.1% until September 30, 2019; notwithstanding the completion of the Acacia transaction on September 17, 2019, we consolidated our interest in Acacia and recorded a non-controlling interest of 36.1% in the income statement for the entirety of the third quarter of 2019 as a matter of convenience) and 40% South Arturo from cost of sales (63.1% of South Arturo from July 1, 2019 onwards as a result of its contribution to Nevada Gold Mines)), divided by attributable gold ounces. The non-controlling interest of 38.5% Nevada Gold Mines is also removed from cost of sales from July 1, 2019 onwards. |
k. | Per ounce figures |
Cost of sales per ounce, total cash costs per ounce, all-in sustaining costs per ounce and all-in costs per ounce may not calculate based on amounts presented in this table due to rounding. |
l. | Co-product costs per ounce |
Total cash costs per ounce, all-in sustaining costs per ounce and all-in costs per ounce presented on a co-product basis removes the impact of by-product credits of our gold production (net of non-controlling interest) calculated as: |
($ millions) | For the three months ended 9/30/20 | |||||||||||||||||||||||||||||||||||
Carlina | Cortezb | Turquoise Ridgec |
Long Canyond |
Phoenixd | Nevada Gold Minese |
Hemlo | Pueblo Viejo |
Veladero | ||||||||||||||||||||||||||||
By-product credits |
1 | 1 | 2 | 0 | 39 | 43 | 1 | 17 | 1 | |||||||||||||||||||||||||||
Non-controlling interest |
(1 | ) | 0 | (1 | ) | 0 | (14 | ) | (16 | ) | 0 | (8 | ) | 0 | ||||||||||||||||||||||
By-product credits (net of non-controlling interest) |
0 | 1 | 1 | 0 | 25 | 27 | 1 | 9 | 1 | |||||||||||||||||||||||||||
($ millions) | For the three months ended 9/30/20 | |||||||||||||||||||||||||||||||||||
Loulo- Gounkoto |
Kibali | North Maran |
Tongon | Bulyanhulu n |
Buzwagin | |||||||||||||||||||||||||||||||
By-product credits |
0 | 0 | 1 | 0 | 6 | 14 | ||||||||||||||||||||||||||||||
Non-controlling interest |
0 | 0 | 0 | 0 | (1 | ) | (3 | ) | ||||||||||||||||||||||||||||
By-product credits (net of non-controlling interest) |
0 | 0 | 1 | 0 | 5 | 11 | ||||||||||||||||||||||||||||||
($ millions) | For the three months ended 6/30/20 | |||||||||||||||||||||||||||||||||||
Carlina | Cortezb | Turquoise Ridgec |
Long Canyond |
Phoenixd | Nevada Gold Minese |
Hemlo | Pueblo Viejo |
Veladero | ||||||||||||||||||||||||||||
By-product credits |
1 | 0 | 0 | 0 | 36 | 37 | 0 | 13 | 1 | |||||||||||||||||||||||||||
Non-controlling interest |
0 | 0 | 0 | 0 | (13 | ) | (13 | ) | 0 | (6 | ) | 0 | ||||||||||||||||||||||||
By-product credits (net of non-controlling interest) |
1 | 0 | 0 | 0 | 23 | 24 | 0 | 7 | 1 | |||||||||||||||||||||||||||
($ millions) | For the three months ended 6/30/20 | |||||||||||||||||||||||||||||||||||
Porgerao | Loulo- Gounkoto |
Kibali | North Maran |
Tongon | Bulyanhulun | Buzwagin | ||||||||||||||||||||||||||||||
By-product credits |
1 | 0 | 1 | 0 | 0 | 4 | 9 | |||||||||||||||||||||||||||||
Non-controlling interest |
0 | 0 | 0 | 0 | 0 | (1 | ) | (1 | ) | |||||||||||||||||||||||||||
By-product credits (net of non-controlling interest) |
1 | 0 | 1 | 0 | 0 | 3 | 8 |
BARRICK THIRD QUARTER 2020 | 100 | MANAGEMENTS DISCUSSION AND ANALYSIS |
($ millions) | For the three months ended 9/30/2019 | |||||||||||||||||||||||||||||||||||||||
Carlina | Cortezb | Turquoise Ridgec |
Long Canyond |
Phoenixd | Nevada Gold Minese |
Hemlo | Golden Sunlighto |
Pueblo Viejo |
Veladero | |||||||||||||||||||||||||||||||
By-product credits |
1 | 1 | 1 | 0 | 22 | 25 | 1 | 0 | 17 | 1 | ||||||||||||||||||||||||||||||
Non-controlling interest |
0 | 0 | 0 | 0 | (9 | ) | (9 | ) | 0 | 0 | (6 | ) | 0 | |||||||||||||||||||||||||||
By-product credits (net of non-controlling interest) |
1 | 1 | 1 | 0 | 13 | 16 | 1 | 0 | 11 | 1 | ||||||||||||||||||||||||||||||
($ millions) | For the three months ended 9/30/2019 | |||||||||||||||||||||||||||||||||||||||
Porgerao | Kalgoorliem | Lagunas Nortep |
Loulo- Gounkoto |
Kibali | North Maran | Tongon | Bulyanhulun | Buzwagin | ||||||||||||||||||||||||||||||||
By-product credits |
1 | 0 | 2 | 0 | 0 | 0 | 0 | 0 | 1 | |||||||||||||||||||||||||||||||
Non-controlling interest |
0 | 0 | 0 | 0 | 0 | 0 | 0 | 0 | 0 | |||||||||||||||||||||||||||||||
By-product credits (net of non-controlling interest) |
1 | 0 | 2 | 0 | 0 | 0 | 0 | 0 | 1 |
($ millions) | For the nine months ended 9/30/2020 | |||||||||||||||||||||||||||||||||||
Carlina | Cortezb | Turquoise Ridgec |
Long Canyond |
Phoenixd | Nevada Gold Minese |
Hemlo | Pueblo Viejo |
Veladero | ||||||||||||||||||||||||||||
By-product credits |
2 | 1 | 3 | 0 | 95 | 101 | 1 | 42 | 3 | |||||||||||||||||||||||||||
Non-controlling interest |
(1 | ) | 0 | (1 | ) | 0 | (37 | ) | (39 | ) | 0 | (17 | ) | 0 | ||||||||||||||||||||||
By-product credits (net of non-controlling interest) |
1 | 1 | 2 | 0 | 58 | 62 | 1 | 25 | 3 | |||||||||||||||||||||||||||
($ millions) | For the nine months ended 9/30/2020 | |||||||||||||||||||||||||||||||||||
Porgerao | Loulo- Gounkoto |
Kibali | North Maran |
Tongon | Bulyanhulun | Buzwagin | ||||||||||||||||||||||||||||||
By-product credits |
1 | 0 | 1 | 2 | 0 | 10 | 23 | |||||||||||||||||||||||||||||
Non-controlling interest |
0 | 0 | 0 | 0 | 0 | (2 | ) | (4 | ) | |||||||||||||||||||||||||||
By-product credits (net of non-controlling interest) |
1 | 0 | 1 | 2 | 0 | 8 | 19 | |||||||||||||||||||||||||||||
($ millions) | For the nine months ended 9/30/2019 | |||||||||||||||||||||||||||||||||||
Carlina | Cortezb | Turquoise Ridgec |
Long Canyond |
Phoenixd | Nevada Gold Minese |
Hemlo | Pueblo Viejo | Veladero | ||||||||||||||||||||||||||||
By-product credits |
1 | 1 | 1 | 0 | 22 | 25 | 1 | 49 | 5 | |||||||||||||||||||||||||||
Non-controlling interest |
0 | 0 | 0 | 0 | (9 | ) | (9 | ) | 0 | (18 | ) | 0 | ||||||||||||||||||||||||
By-product credits (net of non-controlling interest) |
1 | 1 | 1 | 0 | 13 | 16 | 1 | 31 | 5 | |||||||||||||||||||||||||||
($ millions) | For the nine months ended 9/30/2019 | |||||||||||||||||||||||||||||||||||
Porgerao | Kalgoorliem | Lagunas Nortep |
Loulo- Gounkoto |
Kibali | North Maran | Tongon | Bulyanhulun | Buzwagin | ||||||||||||||||||||||||||||
By-product credits |
2 | 0 | 6 | 0 | 0 | 1 | 0 | 1 | 1 | |||||||||||||||||||||||||||
Non-controlling interest |
0 | 0 | 0 | 0 | 0 | (1 | ) | 0 | 0 | 0 | ||||||||||||||||||||||||||
By-product credits (net of non-controlling interest) |
2 | 0 | 6 | 0 | 0 | 0 | 0 | 1 | 1 |
m. | On November 28, 2019, we completed the sale of our 50% interest in Kalgoorlie in Western Australia to Saracen Mineral Holdings Limited for total cash consideration of $750 million. The transaction resulted in a gain of $408 million for the year ended December 31, 2019. The operating results reported for Kalgoorlie reflect the Companys attributable share of Kalgoorlies results until the date of disposal. |
n. | Formerly part of Acacia Mining plc. On September 17, 2019, Barrick acquired all of the shares of Acacia it did not own. The results are on a 63.9% basis until September 30, 2019 (notwithstanding the completion of the Acacia transaction on September 17, 2019, we consolidated our interest in Acacia and recorded a non-controlling interest of 36.1% in the income statement for the entirety of the third quarter of 2019 as a matter of convenience), on a 100% basis from October 1, 2019 to December 31, 2019, and on an 84% basis from January 1, 2020 onwards, the date the GoTs 16% free carried interest was made effective. |
o. | As Porgera was placed on care and maintenance on April 25, 2020, no operating data or per ounce data was provided for the three months ended September 30, 2020. |
p. | With the end of mining at Lagunas Norte in the third quarter of 2019 and at Golden Sunlight and Morila in the second quarter of 2019 as previously reported, we have ceased to include production or non-GAAP cost metrics for these sites from October 1, 2019 and July 1, 2019, respectively, onwards. |
BARRICK THIRD QUARTER 2020 | 101 | MANAGEMENTS DISCUSSION AND ANALYSIS |
Reconciliation of Copper Cost of Sales to C1 cash costs and All-in sustaining costs, including on a per pound basis
($ millions, except per pound information in dollars) | For the three months ended | For the nine months ended | ||||||||||||||||||
9/30/20 | 6/30/20 | 9/30/19 | 9/30/20 | 9/30/19 | ||||||||||||||||
Cost of sales | 154 | 153 | 49 | 431 | 281 | |||||||||||||||
Depreciation/amortization |
(61 | ) | (63 | ) | (13 | ) | (167 | ) | (83 | ) | ||||||||||
Treatment and refinement charges |
39 | 40 | 18 | 118 | 74 | |||||||||||||||
Cash cost of sales applicable to equity method investments |
57 | 72 | 59 | 195 | 194 | |||||||||||||||
Less: royalties and production taxesa |
(16 | ) | (11 | ) | (5 | ) | (38 | ) | (26 | ) | ||||||||||
By-product credits |
(4 | ) | (3 | ) | (3 | ) | (10 | ) | (8 | ) | ||||||||||
Other |
0 | 0 | 0 | (5 | ) | |||||||||||||||
C1 cash costs | 169 | 188 | 105 | 529 | 427 | |||||||||||||||
General & administrative costs |
4 | 6 | 5 | 13 | 16 | |||||||||||||||
Rehabilitation - accretion and amortization |
2 | 2 | 2 | 7 | 8 | |||||||||||||||
Royalties and production taxesa |
16 | 11 | 5 | 38 | 26 | |||||||||||||||
Minesite exploration and evaluation costs |
2 | 1 | 1 | 4 | 4 | |||||||||||||||
Minesite sustaining capital expenditures |
74 | 52 | 48 | 158 | 155 | |||||||||||||||
Sustaining leases |
2 | 2 | 0 | 7 | 2 | |||||||||||||||
All-in sustaining costs | 269 | 262 | 166 | 756 | 638 | |||||||||||||||
Pounds sold - consolidated basis (millions pounds) | 116 | 123 | 65 | 349 | 264 | |||||||||||||||
Cost of sales per poundb,c | 1.97 | 2.08 | 2.00 | 2.01 | 2.10 | |||||||||||||||
C1 cash cost per poundb | 1.45 | 1.55 | 1.62 | 1.52 | 1.62 | |||||||||||||||
All-in sustaining costs per poundb | 2.31 | 2.15 | 2.58 | 2.17 | 2.42 |
a. | For the three and nine month period ended September 30, 2020, royalties and production taxes include royalties of $16 million and $38 million, respectively (June 30, 2020: $11 million and September 30, 2019: $5 million and $26 million, respectively). |
b. | Cost of sales per pound, C1 cash costs per pound and all-in sustaining costs per pound may not calculate based on amounts presented in this table due to rounding. |
c. | Cost of sales applicable to copper per pound is calculated using cost of sales including our proportionate share of cost of sales attributable to equity method investments (Zaldívar and Jabal Sayid), divided by consolidated copper pounds (including our proportionate share of copper pounds from our equity method investments). |
BARRICK THIRD QUARTER 2020 | 102 | MANAGEMENTS DISCUSSION AND ANALYSIS |
Reconciliation of Copper Cost of Sales to C1 cash costs and All-in sustaining costs, including on a per pound basis, by operating site
($ millions, except per pound information in dollars) | For the three months ended | |||||||||||||||||||||||||||||||||||
9/30/20 | 6/30/20 | 9/30/19 | ||||||||||||||||||||||||||||||||||
Zaldívar | Lumwana | Jabal Sayid |
||||||||||||||||||||||||||||
Cost of sales |
46 | 154 | 30 | 78 | 153 | 24 | 57 | 49 | 24 | |||||||||||||||||||||||||||
Depreciation/amortization |
(12 | ) | (61 | ) | (7 | ) | (23 | ) | (63 | ) | (7 | ) | (17 | ) | (13 | ) | (5 | ) | ||||||||||||||||||
Treatment and refinement charges |
0 | 34 | 5 | 0 | 36 | 4 | 0 | 14 | 4 | |||||||||||||||||||||||||||
Less: royalties and production taxesa |
0 | (16 | ) | 0 | 0 | (11 | ) | 0 | 0 | (5 | ) | 0 | ||||||||||||||||||||||||
By-product credits |
0 | 0 | (4 | ) | 0 | 0 | (3 | ) | 0 | 0 | (3 | ) | ||||||||||||||||||||||||
Other |
0 | 0 | 0 | 0 | 0 | 0 | 0 | 0 | 0 | |||||||||||||||||||||||||||
C1 cash costs |
34 | 111 | 24 | 55 | 115 | 18 | 40 | 45 | 20 | |||||||||||||||||||||||||||
Rehabilitation - accretion and amortization |
0 | 2 | 0 | 0 | 2 | 0 | 0 | 2 | 0 | |||||||||||||||||||||||||||
Royalties and production taxesa |
0 | 16 | 0 | 0 | 11 | 0 | 0 | 5 | 0 | |||||||||||||||||||||||||||
Minesite exploration and evaluation costs |
1 | 0 | 1 | 1 | 0 | 0 | 1 | 0 | 0 | |||||||||||||||||||||||||||
Minesite sustaining capital expenditures |
11 | 63 | 0 | 7 | 39 | 6 | 7 | 37 | 4 | |||||||||||||||||||||||||||
Sustaining leases |
1 | 1 | 0 | 2 | 0 | 0 | 0 | 0 | 0 | |||||||||||||||||||||||||||
All-in sustaining costs |
47 | 193 | 25 | 65 | 167 | 24 | 48 | 89 | 24 | |||||||||||||||||||||||||||
Pounds sold - consolidated basis (millions pounds) |
21 | 74 | 21 | 30 | 75 | 18 | 26 | 24 | 15 | |||||||||||||||||||||||||||
Cost of sales per poundb,c |
2.20 | 2.06 | 1.43 | 2.52 | 2.06 | 1.41 | 2.18 | 2.04 | 1.63 | |||||||||||||||||||||||||||
C1 cash cost per poundb |
1.64 | 1.49 | 1.14 | 1.79 | 1.55 | 1.14 | 1.55 | 1.83 | 1.42 | |||||||||||||||||||||||||||
All-in sustaining costs per poundb |
2.27 | 2.58 | 1.17 | 2.09 | 2.27 | 1.41 | 1.91 | 3.66 | 1.65 |
($ millions, except per pound information in dollars) | For the nine months ended | |||||||||||||||||||||||
9/30/20 | 9/30/19 | |||||||||||||||||||||||
Zaldívar | Lumwana | Jabal Sayid | Zaldívar | Lumwana | Jabal Sayid | |||||||||||||||||||
Cost of sales |
194 | 431 | 76 | 203 | 281 | 71 | ||||||||||||||||||
Depreciation/amortization |
(55 | ) | (167 | ) | (20 | ) | (60 | ) | (83 | ) | (20 | ) | ||||||||||||
Treatment and refinement charges |
0 | 104 | 14 | 0 | 60 | 14 | ||||||||||||||||||
Less: royalties and production taxesa |
0 | (38 | ) | 0 | 0 | (26 | ) | 0 | ||||||||||||||||
By-product credits |
0 | 0 | (10 | ) | 0 | 0 | (8 | ) | ||||||||||||||||
Other |
0 | 0 | 0 | 0 | (5 | ) | 0 | |||||||||||||||||
C1 cash costs |
139 | 330 | 60 | 143 | 227 | 57 | ||||||||||||||||||
Rehabilitation - accretion and amortization |
0 | 7 | 0 | 1 | 7 | 0 | ||||||||||||||||||
Royalties and production taxesa |
0 | 38 | 0 | 0 | 26 | 0 | ||||||||||||||||||
Minesite exploration and evaluation costs |
3 | 0 | 1 | 4 | 0 | 0 | ||||||||||||||||||
Minesite sustaining capital expenditures |
24 | 127 | 7 | 18 | 129 | 8 | ||||||||||||||||||
Sustaining leases |
4 | 3 | 0 | 0 | 2 | 0 | ||||||||||||||||||
All-in sustaining costs |
170 | 505 | 68 | 166 | 391 | 65 | ||||||||||||||||||
Pounds sold - consolidated basis (millions pounds) |
81 | 212 | 56 | 85 | 133 | 46 | ||||||||||||||||||
Cost of sales per poundb,c |
2.39 | 2.03 | 1.38 | 2.39 | 2.11 | 1.54 | ||||||||||||||||||
C1 cash costs per poundb |
1.72 | 1.55 | 1.09 | 1.69 | 1.71 | 1.25 | ||||||||||||||||||
All-in sustaining costs per poundb |
2.10 | 2.38 | 1.23 | 1.97 | 2.94 | 1.42 |
a. | For the three and nine month period ended September 30, 2020, royalties and production taxes include royalties of $16 million and $38 million, respectively (June 30, 2020: $11 million and September 30, 2019: $5 million and $26 million, respectively). |
b. | Cost of sales per pound, C1 cash costs per pound and all-in sustaining costs per pound may not calculate based on amounts presented in this table due to rounding. |
c. | Cost of sales applicable to copper per pound is calculated using cost of sales including our proportionate share of cost of sales attributable to equity method investments (Zaldívar and Jabal Sayid), divided by consolidated copper pounds (including our proportionate share of copper pounds from our equity method investments). |
BARRICK THIRD QUARTER 2020 | 103 | MANAGEMENTS DISCUSSION AND ANALYSIS |
EBITDA and Adjusted EBITDA
Reconciliation of Net Earnings to EBITDA and Adjusted EBITDA
($ millions) | For the three months ended |
For the nine months ended | ||||||||||||||||||
9/30/20 | 6/30/20 | 9/30/19 | 9/30/20 | 9/30/19 | ||||||||||||||||
Net earnings (loss) |
1,271 | 622 | 2,435 | 2,556 | 2,798 | |||||||||||||||
Income tax expense |
284 | 258 | 791 | 928 | 999 | |||||||||||||||
Finance costs, neta |
72 | 74 | 106 | 234 | 304 | |||||||||||||||
Depreciation |
574 | 566 | 559 | 1,664 | 1,460 | |||||||||||||||
EBITDA |
2,201 | 1,520 | 3,891 | 5,382 | 5,561 | |||||||||||||||
Impairment charges (reversals) of long-lived assetsb |
4 | 23 | (872 | ) | (309 | ) | (857 | ) | ||||||||||||
Acquisition/disposition (gains) lossesc |
(2 | ) | 8 | (1,901 | ) | (54 | ) | (1,913 | ) | |||||||||||
Loss on currency translation |
16 | 2 | 40 | 34 | 56 | |||||||||||||||
Other expense (income) adjustmentsd |
(90 | ) | 48 | 53 | 56 | 158 | ||||||||||||||
Unrealized (gains) losses on non-hedge derivative instruments |
0 | 0 | 1 | 0 | 0 | |||||||||||||||
Income tax expense, net finance costs, and depreciation from equity investees |
94 | 96 | 85 | 277 | 266 | |||||||||||||||
Adjusted EBITDA |
2,223 | 1,697 | 1,297 | 5,386 | 3,271 |
a. | Finance costs exclude accretion. |
b. | For the three month period ended September 30, 2020, we recorded no significant impairment charges or reversals. For the nine month period ended September 30, 2020, net impairment reversals primarily relate to non-current asset reversals at our Tanzanian assets. Net impairment reversals for the three and nine month periods ended September 30, 2019 mainly relate to non-current asset reversals at Lumwana, partially offset by impairments at Cortez and Lagunas Norte. |
c. | Acquisition/disposition gains for the nine month period ended September 30, 2020 primarily relate to the gain on the sale of Massawa. For the three and nine months ended September 30, 2019, acquisition/disposition gains primarily relate to the gain on the remeasurement of Turquoise Ridge to fair value as a result of its contribution to Nevada Gold Mines. |
d. | Other expense adjustments for the three and nine month period ended September 30, 2020 primarily relate to the gain on the remeasurement of the residual cash liability relating to our silver sale agreement with Wheaton Precious Metals Corp., partially offset by care and maintenance expenses at Porgera and Covid-19 donations. For the three month period ended June 30, 2020, other expense adjustments primarily relate to care and maintenance expenses at Porgera and Covid-19 donations. The nine month period ended September 30, 2020 was further impacted by changes in the discount rate assumptions on our closed mine rehabilitation provision. For the three and nine month periods ended September 30, 2019, other expense adjustments primarily relate to severance costs as a result of the implementation of a number of organizational reductions, the impact of changes in the discount rate assumptions on our closed mine rehabilitation provision and transaction costs related to Nevada Gold Mines and Acacia. |
BARRICK THIRD QUARTER 2020 | 104 | MANAGEMENTS DISCUSSION AND ANALYSIS |
Reconciliation of Income to EBITDA by operating site
($ millions) | For the three months ended 9/30/20 |
|||||||||||||||||||||||||||||||||||||||
Carlina (61.5%) |
Cortezb (61.5%) |
Turquoise Ridgec (61.5%) |
Nevada Gold Minesd (61.5%) |
Pueblo Viejo (60%) |
Loulo- (80%) |
Kibali (45%) |
Veladero (50%) |
Porgera (47.5%) |
North Marae (84%) |
|||||||||||||||||||||||||||||||
Income |
247 | 96 | 62 | 481 | 147 | 92 | 74 | 30 | (17 | ) | 72 | |||||||||||||||||||||||||||||
Depreciation |
50 | 33 | 25 | 152 | 34 | 55 | 43 | 17 | 4 | 17 | ||||||||||||||||||||||||||||||
EBITDA |
297 | 129 | 87 | 633 | 181 | 147 | 117 | 47 | (13 | ) | 89 | |||||||||||||||||||||||||||||
For the three months ended 6/30/20 |
||||||||||||||||||||||||||||||||||||||||
Carlina (61.5%) |
Cortezb (61.5%) |
Turquoise Ridgec (61.5%) |
Nevada Gold Minesd |
Pueblo Viejo (60%) |
Loulo- Gounkoto |
Kibali (45%) |
Veladero (50%) |
Porgera (47.5%) |
North Marae (84%) |
|||||||||||||||||||||||||||||||
Income |
151 | 109 | 48 | 357 | 92 | 107 | 64 | 16 | (13 | ) | 44 | |||||||||||||||||||||||||||||
Depreciation |
44 | 35 | 25 | 146 | 33 | 60 | 42 | 13 | 6 | 21 | ||||||||||||||||||||||||||||||
EBITDA |
195 | 144 | 73 | 503 | 125 | 167 | 106 | 29 | (7 | ) | 65 | |||||||||||||||||||||||||||||
For the three months ended 9/30/19 |
||||||||||||||||||||||||||||||||||||||||
Carlina (61.5%) |
Cortezb (61.5%) |
Turquoise Ridgec (61.5%) |
Nevada Gold Minesd |
Pueblo Viejo (60%) |
Loulo- Gounkoto |
Kibali (45%) |
Veladero (50%) |
Porgera (47.5%) |
North Marae (84%) |
|||||||||||||||||||||||||||||||
Income |
121 | 77 | 38 | 237 | 104 | 64 | 25 | 14 | 33 | 20 | ||||||||||||||||||||||||||||||
Depreciation |
62 | 32 | 43 | 166 | 29 | 61 | 57 | 25 | 11 | 11 | ||||||||||||||||||||||||||||||
EBITDA |
183 | 109 | 81 | 403 | 133 | 125 | 82 | 39 | 44 | 31 | ||||||||||||||||||||||||||||||
($ millions) | For the nine months ended 9/30/2020 |
|||||||||||||||||||||||||||||||||||||||
Carlina (61.5%) |
Cortezb (61.5%) |
Turquoise Ridgec (61.5%) |
Nevada Gold Minesd (61.5%) |
Pueblo Viejo (60%) |
Loulo- Gounkoto |
Kibali (45%) |
Veladero (50%) |
Porgera (47.5%) |
North Marae (84%) |
|||||||||||||||||||||||||||||||
Income |
551 | 294 | 157 | 1,154 | 341 | 267 | 186 | 70 | (1 | ) | 165 | |||||||||||||||||||||||||||||
Depreciation |
143 | 101 | 81 | 444 | 99 | 162 | 126 | 52 | 20 | 59 | ||||||||||||||||||||||||||||||
EBITDA |
694 | 395 | 238 | 1,598 | 440 | 429 | 312 | 122 | 19 | 224 | ||||||||||||||||||||||||||||||
($ millions) | For the nine months ended 9/30/2019 |
|||||||||||||||||||||||||||||||||||||||
Carlina (61.5%) |
Cortezb (61.5%) |
Turquoise Ridgec (61.5%) |
Nevada Gold Minesd |
Pueblo Viejo (60%) |
Loulo- Gounkoto |
Kibali (45%) |
Veladero (50%) |
Porgera (47.5%) |
North Marae (84%) |
|||||||||||||||||||||||||||||||
Income |
237 | 390 | 145 | 773 | 277 | 125 | 78 | 36 | 67 | 60 | ||||||||||||||||||||||||||||||
Depreciation |
181 | 161 | 58 | 429 | 86 | 178 | 144 | 86 | 30 | 40 | ||||||||||||||||||||||||||||||
EBITDA |
418 | 551 | 203 | 1,202 | 363 | 303 | 222 | 122 | 97 | 100 |
a. | On July 1, 2019, Barricks Goldstrike and Newmonts Carlin were contributed to Nevada Gold Mines and are now referred to as Carlin. As a result, the amounts presented represent Goldstrike on a 100% basis (including our 60% share of South Arturo) up until June 30, 2019, and the combined results of Carlin and Goldstrike (including NGMs 60% share of South Arturo) on a 61.5% basis thereafter. |
b. | On July 1, 2019, Cortez was contributed to Nevada Gold Mines, a joint venture with Newmont. As a result, the amounts presented are on a 100% basis up until June 30, 2019, and on a 61.5% basis thereafter. |
c. | Barrick owned 75% of Turquoise Ridge through to the end of the second quarter of 2019, with our joint venture partner, Newmont, owning the remaining 25%. Turquoise Ridge was proportionately consolidated on the basis that the joint venture partners that have joint control have rights to the assets and obligations for the liabilities relating to the arrangement. The figures presented in this table are based on our 75% interest in Turquoise Ridge until June 30, 2019. On July 1, 2019, Barricks 75% interest in Turquoise Ridge as well as Newmonts Twin Creeks and 25% interest in Turquoise Ridge were contributed to Nevada Gold Mines. Starting July 1, 2019, the results represent our 61.5% share of Turquoise Ridge and Twin Creeks, now referred to as Turquoise Ridge. |
d. | Represents the combined results of Cortez, Goldstrike (including our 60% share of South Arturo) and our 75% interest in Turquoise Ridge until June 30, 2019. Commencing July 1, 2019, the date Nevada Gold Mines was established, the results represent our 61.5% interest in Cortez, Carlin (including Goldstrike and 60% of South Arturo), Turquoise Ridge (including Twin Creeks), Phoenix and Long Canyon. |
e. | Formerly part of Acacia Mining plc. On September 17, 2019, Barrick acquired all of the shares of Acacia it did not own. The results are on a 63.9% basis until September 30, 2019 (notwithstanding the completion of the Acacia transaction on September 17, 2019, we consolidated our interest in Acacia and recorded a non-controlling interest of 36.1% in the income statement for the entirety of the third quarter of 2019 as a matter of convenience), on a 100% basis from October 1, 2019 to December 31, 2019, and on an 84% basis from January 1, 2020 onwards, the effective date of the GoTs free carried interest. |
BARRICK THIRD QUARTER 2020 | 105 | MANAGEMENTS DISCUSSION AND ANALYSIS |
Realized Price
Reconciliation of Sales to Realized Price per ounce/pound
($ millions, except per ounce/pound information in dollars) |
Gold |
Copper |
Gold | Copper | ||||||||||||||||||||||||||||||||||||
For the three months ended |
For the nine months ended |
|||||||||||||||||||||||||||||||||||||||
9/30/20 | 6/30/20 | 9/30/19 | 9/30/20 | 6/30/20 | 9/30/19 | 9/30/20 | 9/30/19 | 9/30/20 | 9/30/19 | |||||||||||||||||||||||||||||||
Sales |
3,237 | 2,812 | 2,585 | 219 | 184 | 45 | 8,642 | 6,428 | 502 | 311 | ||||||||||||||||||||||||||||||
Sales applicable to non-controlling interests |
(967 | ) | (822 | ) | (748 | ) | 0 | 0 | 0 | (2,560 | ) | (1,212 | ) | 0 | 0 | |||||||||||||||||||||||||
Sales applicable to equity method investmentsa,b |
183 | 172 | 140 | 121 | 120 | 100 | 502 | 404 | 348 | 345 | ||||||||||||||||||||||||||||||
Realized non-hedge gold/copper derivative (losses) gains |
0 | 0 | 0 | 0 | 0 | 0 | 0 | 1 | 0 | 0 | ||||||||||||||||||||||||||||||
Sales applicable to sites in care and maintenancec |
(53 | ) | (53 | ) | (32 | ) | 0 | 0 | 0 | (152 | ) | (84 | ) | 0 | 0 | |||||||||||||||||||||||||
Treatment and refinement charges |
4 | 2 | 0 | 39 | 40 | 18 | 6 | 0 | 118 | 74 | ||||||||||||||||||||||||||||||
Otherd |
0 | 0 | 0 | 0 | 0 | 0 | 15 | 0 | 0 | 0 | ||||||||||||||||||||||||||||||
Revenues as adjusted |
2,404 | 2,111 | 1,945 | 379 | 344 | 163 | 6,453 | 5,537 | 968 | 730 | ||||||||||||||||||||||||||||||
Ounces/pounds sold (000s ounces/millions pounds)c |
1,249 | 1,224 | 1,318 | 116 | 123 | 65 | 3,693 | 4,055 | 349 | 264 | ||||||||||||||||||||||||||||||
Realized gold/copper price per ounce/pounde |
1,926 | 1,725 | 1,476 | 3.28 | 2.79 | 2.55 | 1,748 | 1,365 | 2.78 | 2.78 |
a. | Represents sales of $176 million and $480 million, respectively, for the three and nine month periods ended September 30, 2020 (June 30, 2020: $164 million and September 30, 2019: $133 million and $375 million, respectively) applicable to our 45% equity method investment in Kibali and $nil and nil, respectively, (June 30, 2020: $nil and September 30, 2019: $8 million and $30 million, respectively) applicable to our 40% equity method investment in Morila for gold. Represents sales of $66 million and $216 million, respectively, for the three and nine months ended September 30, 2020 (June 30, 2020: $78 million and September 30, 2019: $66 million and $233 million, respectively) applicable to our 50% equity method investment in Zaldívar and $59 million and $145 million, respectively (June 30, 2020: $46 million and September 30, 2019: $37 million and $125 million, respectively) applicable to our 50% equity method investment in Jabal Sayid for copper. |
b. | Sales applicable to equity method investments are net of treatment and refinement charges. |
c. | Figures exclude: Pierina; Golden Sunlight and Morila starting in the third quarter of 2019; and Lagunas Norte starting in the fourth quarter of 2019, from the calculation of realized price per ounce as the mine is mining incidental ounces as it enters closure. |
d. | Represents a cumulative catch-up adjustment to revenue relating to our streaming arrangements. Refer to note 2f of the 2019 Annual Financial Statements for more information. |
e. | Realized price per ounce/pound may not calculate based on amounts presented in this table due to rounding. |
BARRICK THIRD QUARTER 2020 | 106 | MANAGEMENTS DISCUSSION AND ANALYSIS |
TECHNICAL INFORMATION
The scientific and technical information contained in this MD&A has been reviewed and approved by Steven Yopps, MMSA, Manager of Growth Projects, Nevada Gold Mines; Craig Fiddes, SME-RM, Manager Resource Modeling, Nevada Gold Mines; Chad Yuhasz, P.Geo, Mineral Resource Manager, Latin America and Asia Pacific; Simon Bottoms, CGeol, MGeol, FGS, FAusIMM, Mineral Resources Manager: Africa and Middle East; Rodney Quick, MSc, Pr. Sci.Nat, Mineral Resource Management and Evaluation Executive; John Steele, CIM, Metallurgy, Engineering and Capital Projects Executive; and Rob Krcmarov, FAusIMM, Executive Vice President, Exploration and Growth each a Qualified Person as defined in National Instrument 43-101 Standards of Disclosure for Mineral Projects.
All mineral reserve and mineral resource estimates are estimated in accordance with National Instrument 43-101 Standards of Disclosure for Mineral Projects. Unless otherwise noted, such mineral reserve and mineral resource estimates are as of December 31, 2019.
ENDNOTES
1 | These are non-GAAP financial performance measures with no standardized meaning under IFRS and therefore may not be comparable to similar measures presented by other issuers. For further information and a detailed reconciliation of each non-GAAP measure to the most directly comparable IFRS measure, please see pages 82 to 106 of this MD&A. |
2 | Cost of sales applicable to gold per ounce is calculated using cost of sales applicable to gold on an attributable basis (removing the non-controlling interest of 40% Pueblo Viejo; 20% Loulo-Gounkoto; 10.3% Tongon; 16% North Mara, Bulyanhulu and Buzwagi starting January 1, 2020, the date the GoTs 16% free carried interest was made effective (36.1% from January 1, 2019 to September 30, 2019; notwithstanding the completion of the Acacia transaction on September 17, 2019, we consolidated our interest in Acacia and recorded a non-controlling interest of 36.1% in the income statement for the entirety of the third quarter of 2019 as a matter of convenience); 63.1% South Arturo from cost of sales from July 1, 2019 onwards as a result of its contribution to Nevada Gold Mines (and on a 40% basis from January 1, 2019 to June 30, 2019); and our proportionate share of cost of sales attributable to equity method investments (Kibali, and Morila until the second quarter of 2019), divided by attributable gold ounces. Also removes the non-controlling interest of 38.5% Nevada Gold Mines from cost of sales from July 1, 2019 onwards. Cost of sales applicable to copper per pound is calculated using cost of sales applicable to copper including our proportionate share of cost of sales attributable to equity method investments (Zaldívar and Jabal Sayid), divided by consolidated copper pounds (including our proportionate share of copper pounds from our equity method investments). |
3 | Class 1 - High Significance is defined as an incident that causes significant negative impacts on human health or the environment or an incident that extends onto publicly accessible land and has the potential to cause significant adverse impact to surrounding communities, livestock or wildlife. |
4 | See the Technical Report on the Turquoise Ridge complex, dated March 25, 2020, and filed on SEDAR at www.sedar.com and EDGAR at www.sec.gov on March 25, 2020. |
5 | See the Technical Report on the Pueblo Viejo mine, Sanchez Ramirez Province, Dominican Republic, dated March 19, 2018, and filed on SEDAR at www.sedar.com and EDGAR at www.sec.gov on March 23, 2018. |
BARRICK THIRD QUARTER 2020 | 107 | MANAGEMENTS DISCUSSION AND ANALYSIS |
6 | Fourmile Significant Interceptsa |
Drill Results from Q3 2020 | ||||||||||
Drill Holeb | Azimuth | Dip | Interval (m) | Width (m)c | Au (g/t) | |||||
FM20-155D |
82 | (76) | no intercepts > 5 g/t | |||||||
FM20-157DW1d |
105 | (65) | 1215.4 - 1216.5 | 1.1 | 9.8 | |||||
FM20-162Dd |
124 | (83) | no intercepts > 5 g/t | |||||||
FM20-163Dd |
68 | (71) | no intercepts > 5 g/t | |||||||
FM20-164Dd |
48 | (79) | no intercepts > 5 g/t | |||||||
109 | (74) | 1116.2 - 1117.7 | 1.5 | 5.5 | ||||||
1119.2 - 1120.4 | 1.2 | 7.2 | ||||||||
1187.2 - 1188.4 | 1.2 | 8.5 | ||||||||
1193.6 - 1195.1 | 1.5 | 6.0 | ||||||||
FM20-167Dd |
1224.4 - 1225.6 | 1.2 | 8.2 | |||||||
79 | (73) | 1005.7 - 1006.6 | .9 | 5.4 | ||||||
1145.3 - 1154.9 | 9.6 | 80.1 | ||||||||
1168.2 - 1169.2 | 1.0 | 61.5 | ||||||||
FM20-169Dd |
1170.9 - 1172.0 | 1.1 | 25.0 | |||||||
FM20-170Dd |
114 | (64) | no intercepts > 5 g/t | |||||||
FM20-171Dd |
67 | (68) | 1378.7 - 1382.4 | 3.7 | 15.0 |
a. | All intercepts calculated using a 5 g/t Au cutoff and are uncapped; minimum intercept width is 0.8 m; internal dilution is less than 20% total width. |
b. | Fourmile drill hole nomenclature: FM (Fourmile) followed by the year (20 for 2020). |
c. | True width of intercepts are uncertain at this stage. |
d. | Partial results received. |
The drilling results for the Fourmile property contained in this MD&A have been prepared in accordance with National Instrument 43-101 Standards of Disclosure for Mineral Projects. All drill hole assay information has been manually reviewed and approved by staff geologists and re-checked by the project manager. Sample preparation and analyses are conducted by ALS Minerals. Procedures are employed to ensure security of samples during their delivery from the drill rig to the laboratory. The quality assurance procedures, data verification and assay protocols used in connection with drilling and sampling on the Fourmile property conform to industry accepted quality control methods.
7 | Carlin Trend Significant Interceptsa |
Drill Results from Q3 2020 | ||||||||||
Drill Holeb | Azimuth | Dip | Interval (m) | Width (m)c | Au (g/t) | |||||
609.0 - 609.9 | .9 | 8.5 | ||||||||
612.9 - 616.3 | 3.4 | 5.5 | ||||||||
719.0 - 720.5 | 1.5 | 5.3 | ||||||||
722.1 - 723.8 | 1.7 | 8.6 | ||||||||
727.0 - 728.2 | 1.2 | 6.8 | ||||||||
PGX-20002d |
9 | (68) | 808.6 - 810.1 | 1.5 | 5.4 | |||||
NHD-20281 |
0 | (90) | 810.2 - 811.7 | 1.5 | 5.0 |
a. | All intercepts calculated using a 5 g/t Au cutoff and are uncapped; minimum intercept width is 0.8 m; internal dilution is less than 20% total width |
b. | Carlin Trend drill hole nomenclature: Project area (CGX - Leeville, PGX - Post-Gen, LBB - Little Boulder Basin) followed by the year (20 for 2020) then hole number |
c. | True width of intercepts are uncertain at this stage. |
d. | Partial results received; results from 0-145 m and 819-977 m reported in Q2 |
The drilling results for the Carlin Trend contained in this MD&A have been prepared in accordance with National Instrument 43-101 Standards of Disclosure for Mineral Projects. All drill hole assay information has been manually reviewed and approved by staff geologists and re-checked by the project manager. Sample preparation and analyses are conducted by ALS Minerals. Procedures are employed to ensure security of samples during their delivery from the drill rig to the laboratory. The quality assurance procedures, data verification and assay protocols used in connection with drilling and sampling on the Carlin Trend conform to industry accepted quality control methods.
BARRICK THIRD QUARTER 2020 | 108 | MANAGEMENTS DISCUSSION AND ANALYSIS |
8 | Hemlo Significant Interceptsa |
Trench Results from Q3 2020
| ||||||||
Trench IDb | From (m) | To (m) | Width (m)c | Au (g/t) | ||||
TR2002P5a | 16.25 | 18.70 | 2.45 | 1.17 | ||||
TR2002P6a | 17.65 | 24.80 | 7.15 | 0.85 | ||||
TR2003 | No significant intersections | |||||||
TR2004P1 | 3.70 | 9.00 | 5.30 | 0.95 | ||||
8.50 | 12.00 | 3.50 | 2.48 | |||||
35.00 | 36.35 | 1.65 | 1.15 | |||||
50.05 | 52.85 | 2.80 | 1.81 | |||||
TR2004P3a | 56.20 | 57.20 | 1.00 | 1.98 |
a. | All intercepts calculated using a 0.1 g/t Au cutoff and are uncapped; minimum intercept width is 0.5 m; internal dilution is less than 50% total width. |
b. | Hemlo trench nomenclature: Trench (TR) followed by the year (20 for 2020 when the program commenced) then the sequence of trenching and sub-trench follows with P suffix |
c. | Width is measured width on surface; true width is not calculated. |
The trench results for Hemlo contained in this MD&A have been prepared in accordance with National Instrument 43-101 Standards of Disclosure for Mineral Projects. All drill hole assay information has been manually reviewed and approved by staff geologists and re-checked by the project manager. Sample preparation and analyses are conducted by ALS Minerals. Procedures are employed to ensure security of samples during their delivery from the field sites to the laboratory. The quality assurance procedures, data verification and assay protocols used in connection with trenching and sampling at Hemlo conform to industry accepted quality control methods.
9 | Pueblo Viejo Significant Interceptsa |
Drill Results from Q3 2020 | ||||||||||
Drill Holeb | Azimuth | Dip | Interval (m) | Width (m)c | Au (g/t) | |||||
DPV20-788 | 270 | (60) | 148 - 158.5 | 10.50 | 2.48 |
a. | All significant intercepts calculated using a 0.5 g/t Au cutoff and are uncapped; a minimum intercept length of 10m is reported, with internal dilution of no more than 10 consecutive meters below cut-off included in the calculation. |
b. | Pueblo Viejo drill hole nomenclature: DPV (Pueblo Viejo) followed by the year (20 for 2020) and a correlative number. |
c. | True widths uncertain at this stage. |
The drilling results for the Pueblo Viejo Joint Venture property contained in this MD&A have been prepared in accordance with National Instrument 43-101 Standards of Disclosure for Mineral Projects. All drill hole assay information has been manually reviewed and approved by staff geologists and re-checked by the project manager. Sample preparation and analyses are conducted by the onsite laboratory, and 5% of samples are sent to ALS Peru, an independent laboratory, for quality assurance. Procedures are employed to ensure security of samples during their delivery from the drill rig to the respective laboratory. The quality assurance procedures, data verification and assay protocols used in connection with drilling and sampling on the Pueblo Viejo Joint Venture property conform to industry accepted quality control methods.
BARRICK THIRD QUARTER 2020 | 109 | MANAGEMENTS DISCUSSION AND ANALYSIS |
10 | Bambadji Significant Interceptsa |
Drill Results from Q3 2020 | ||||||||||||||||||||||||||||||
Drill Holeb |
Azimuth | Dip | From | To | Width (m)c | Au (g/t) | Includingd Interval (m) |
Width (m)c | Au (g/t) | |||||||||||||||||||||
135 - 144 | 9.00 | 5.10 | ||||||||||||||||||||||||||||
KBWRC001 | 135 | (55) | 130.00 | 160.00 | 30.00 | 2.45 | 148 - 155 | 7.00 | 2.80 | |||||||||||||||||||||
KBWRC002 | 135 | (55) | 91.00 | 113.00 | 22.00 | 0.54 | ||||||||||||||||||||||||
KBWRC003 | 135 | (50) | 11.00 | 23.00 | 12.00 | 2.04 | 16 - 19 | 3.00 | 6.76 | |||||||||||||||||||||
KBWRC003 | 135 | (50) | 33.00 | 57.00 | 24.00 | 1.33 | 48 - 52 | 4.00 | 3.36 | |||||||||||||||||||||
KBWRC004 | 135 | (55) | 66.00 | 81.00 | 15.00 | 1.15 | ||||||||||||||||||||||||
KBWRC005 | 135 | (55) | 55.00 | 78.00 | 23.00 | 1.30 | 55 - 62 | 7.00 | 3.02 | |||||||||||||||||||||
KBWRC005 | 135 | (55) | 100.00 | 107.00 | 7.00 | 0.93 | ||||||||||||||||||||||||
KBWRC006 | 135 | (55) | 19.00 | 28.00 | 9.00 | 2.04 | 19 - 24 | 5.00 | 3.00 | |||||||||||||||||||||
127 - 132 | 5.00 | 2.02 | ||||||||||||||||||||||||||||
KBWRC006 | 135 | (55) | 107.00 | 150.00 | 43.00 | 1.16 | 136 - 143 | 7.00 | 2.12 | |||||||||||||||||||||
KBWRC007 | 135 | (50) | 145.00 | 150.00 | 5.00 | 1.45 | ||||||||||||||||||||||||
KBWRC009 | 135 | (55) | 32.00 | 54.00 | 22.00 | 1.04 | ||||||||||||||||||||||||
KBWRC009 | 135 | (55) | 57.00 | 68.00 | 11.00 | 1.02 | ||||||||||||||||||||||||
KBWRC009 | 135 | (55) | 142.00 | 147.00 | 5.00 | 1.62 | 143 - 145 | 2.00 | 3.21 | |||||||||||||||||||||
70 - 75 | 5.00 | 2.80 | ||||||||||||||||||||||||||||
KBWRC010 | 135 | (55) | 63.00 | 93.00 | 30.00 | 1.88 | 83 - 92 | 9.00 | 3.17 |
a. | All intercepts calculated using a 0.5 g/t Au cutoff and are uncapped; minimum intercept width is 2m; internal dilution is equal to or less than 2m total width. |
b. | Kabewest drill hole nomenclature: prospect initial KBW (Kabewest), DAK (Dakota) followed by type of drilling RC (Reverse Circulation). |
c. | True widths uncertain at this stage. |
d. | Includings calculated using a 10.0 g/t Au cutoff and are uncapped; minimum intercept width is 2m; internal dilution is equal to or less than 2m total width. |
The drilling results for the Bambadji property contained in this MD&A have been prepared in accordance with National Instrument 43-101 Standards of Disclosure for Mineral Projects. All drill hole assay information has been manually reviewed and approved by staff geologists and re-checked by the project manager. Sample preparation and analyses are conducted by SGS Laboratories, an independent laboratory. Procedures are employed to ensure security of samples during their delivery from the drill rig to the laboratory. The quality assurance procedures, data verification and assay protocols used in connection with drilling and sampling on the Bambadji property conform to industry accepted quality control methods.
11 | Loulo-Gounkoto Significant Interceptsa |
Drill Results from Q3 2020 | ||||||||||
Drill Holeb | Azimuth | Dip | Interval (m) | Width (m)c | Au (g/t) | |||||
DB1RC020 | 228.00 | (51.00) | 247.00 - 258.00 | 11.00 | 1.31 | |||||
DB1RC022 | 226.33 | (52.00) | 155.00 - 157.00 | 2.00 | 1.20 | |||||
DB1RC025 | 46.00 | (66.00) | 32.00 - 35.00 | 3.00 | 0.62 | |||||
417.25 - 419.25 | 2.00 | 6.24 | ||||||||
L3DH255 | 220.02 | (58.91) | 423.65 - 428.20 | 4.55 | 1.46 | |||||
312.70 - 316.75 | 4.05 | 3.34 | ||||||||
329.00 - 331.75 | 2.75 | 8.36 | ||||||||
L3DH256 | 237.71 | (56.57) | 333.80 - 336.60 | 2.80 | 2.57 | |||||
377.05 - 379.55 | 2.50 | 0.92 | ||||||||
382.25 - 385.20 | 2.95 | 7.02 | ||||||||
394.15 - 401.10 | 6.95 | 3.23 | ||||||||
L3DH257 | 224.10 | (78.82) | 408.90 - 416.10 | 7.20 | 1.75 | |||||
490.20 - 503.90 | 13.70 | 6.41 | ||||||||
L3DH258 | 215.16 | (59.27) | 506.90 - 510.90 | 4.00 | 22.11 | |||||
510.00 - 519.55 | 9.55 | 8.99 | ||||||||
523.15 - 528.00 | 4.85 | 2.82 | ||||||||
530.45 - 536.60 | 6.15 | 0.96 | ||||||||
L3DH259 | 226.00 | (69.00) | 540.35 - 547.00 | 6.65 | 1.18 | |||||
633.30 - 644.15 | 10.85 | 2.86 |
BARRICK THIRD QUARTER 2020 | 110 | MANAGEMENTS DISCUSSION AND ANALYSIS |
645.20 - 648.10 | 2.90 | 0.87 | ||||||||
L3DH261 | 210.00 | (60.00) | 649.20 - 655.00 | 5.80 | 1.52 | |||||
644.40 - 646.55 | 2.15 | 2.96 | ||||||||
653.20 - 657.85 | 4.65 | 0.78 | ||||||||
L3DH262 | 205.40 | (66.76) | 660.40 - 668.85 | 8.45 | 3.22 | |||||
582.75 - 593.85 | 11.10 | 8.77 | ||||||||
602.00 - 605.75 | 3.75 | 4.72 | ||||||||
L3DH263 | 210.96 | (55.13) | 609.80 - 613.20 | 3.40 | 1.85 | |||||
681.80 - 695.35 | 13.55 | 2.08 | ||||||||
L3DH264 | 208.45 | (62.13) | 703.25 - 707.35 | 4.10 | 1.67 | |||||
446.65 - 448.65 | 2.00 | 0.58 | ||||||||
L3DH266 | 221.28 | (61.00) | 461.20 - 464.75 | 3.55 | 2.17 | |||||
YADH147 | 68.98 | (61.78) | 902.60 - 907.30 | 4.70 | 1.98 | |||||
1,039.50 - 1,054.85 | 15.35 | 3.33 | ||||||||
YADH149 | 69.92 | (65.67) | 1,055.65 - 1,069.60 | 13.95 | 4.85 | |||||
1,114.00 - 1,116.00 | 2.00 | 3.68 | ||||||||
1,122.80 - 1,143.00 | 20.20 | 4.77 | ||||||||
1,153.00 - 1,156.00 | 3.00 | 2.06 | ||||||||
1,167.50 - 1,169.50 | 2.00 | 8.42 | ||||||||
1,171.80 - 1,178.00 | 6.20 | 2.20 | ||||||||
1,181.00 - 1,185.85 | 4.85 | 1.68 | ||||||||
YADH162 | 62.00 | (64.00) | 1,189.75 - 1,195.05 | 5.30 | 6.79 | |||||
YADH165 | 70.00 | (68.00) | 982.15 - 1,000.70 | 18.55 | 2.35 | |||||
986.00 - 990.00 | 4.00 | 0.69 | ||||||||
996.50 - 1,001.80 | 5.30 | 1.17 | ||||||||
YADH166 | 58.40 | (68.02) | 1,006.00 - 1,010.80 | 4.80 | 4.20 | |||||
1,077.00 - 1,084.00 | 7.00 | 3.20 | ||||||||
YADH167 | 67.05 | (64.06) | 1,088.90 - 1,099.15 | 10.25 | 5.52 | |||||
833.00 - 837.00 | 4.00 | 5.35 | ||||||||
877.00 - 879.00 | 2.00 | 0.69 | ||||||||
885.20 - 888.80 | 3.60 | 2.25 | ||||||||
894.00 - 896.00 | 2.00 | 0.78 | ||||||||
YADH168 | 67.00 | (63.00) | 1,000.75 - 1,009.00 | 8.25 | 6.58 | |||||
979.70 - 982.70 | 3.00 | 0.53 | ||||||||
1,015.90 - 1,018.00 | 2.10 | 1.79 | ||||||||
YADH169 | 70.52 | (60.17) | 1,038.40 - 1,045.90 | 7.50 | 2.35 | |||||
1,135.20 - 1,146.00 | 10.80 | 1.37 | ||||||||
1,153.90 - 1,159.20 | 5.30 | 0.56 | ||||||||
1,160.00 - 1,162.00 | 2.00 | 1.07 | ||||||||
1,168.90 - 1,171.00 | 2.10 | 1.16 | ||||||||
1,174.00 - 1,180.00 | 6.00 | 1.41 | ||||||||
YADH170 | 67.00 | (63.00) | 1,196.00 - 1,200.00 | 4.00 | 1.27 | |||||
1,123.25 - 1,137.00 | 13.75 | 4.34 | ||||||||
YADH171 | 63.31 | (65.94) | 1,144.00 - 1,160.00 | 16.00 | 2.33 | |||||
1,220.00 - 1,229.65 | 9.65 | 2.43 | ||||||||
1,232.10 - 1,239.00 | 6.90 | 1.47 | ||||||||
1,241.80 - 1,255.00 | 13.20 | 3.14 | ||||||||
YADH66 | 60.00 | (65.00) | 1,261.00 - 1,264.00 | 3.00 | 1.01 | |||||
1,020.00 - 1,029.00 | 9.00 | 1.68 | ||||||||
1,031.00 - 1,038.20 | 7.20 | 0.91 | ||||||||
1,040.20 - 1,042.40 | 2.20 | 0.87 | ||||||||
1,053.00 - 1,059.00 | 6.00 | 0.77 | ||||||||
YADH67 | 60.00 | (69.00) | 1,061.70 - 1,064.40 | 2.70 | 0.71 | |||||
1,212.00 - 1,220.00 | 8.00 | 1.07 | ||||||||
1,223.00 - 1,225.00 | 2.00 | 0.85 |
BARRICK THIRD QUARTER 2020 | 111 | MANAGEMENTS DISCUSSION AND ANALYSIS |
1,241.70 - 1,285.50 | 43.80 | 5.35 | ||||||||
1,286.30 - 1,314.45 | 28.15 | 10.21 | ||||||||
1,321.00 - 1,324.05 | 3.05 | 0.91 | ||||||||
YDH298W1 | 59.20 | (76.30) | 1,327.10 - 1,343.00 | 15.90 | 3.69 | |||||
1,108.60 - 1,114.65 | 6.05 | 1.27 | ||||||||
YDH298W2 | 59.28 | (75.44) | 1,138.60 - 1,153.90 | 15.30 | 2.23 | |||||
48.00 - 50.00 | 2.00 | 1.45 | ||||||||
57.00 - 63.00 | 6.00 | 3.00 | ||||||||
65.00 - 79.00 | 14.00 | 2.06 | ||||||||
83.00 - 85.00 | 2.00 | 0.65 | ||||||||
89.00 - 92.00 | 3.00 | 0.88 | ||||||||
116.00 - 128.00 | 12.00 | 3.02 | ||||||||
135.00 - 140.00 | 5.00 | 0.52 | ||||||||
146.00 - 153.00 | 7.00 | 0.77 | ||||||||
YRRC005 | 150.00 | (51.00) | 161.00 - 167.00 | 6.00 | 0.91 | |||||
61.00 - 66.00 | 5.00 | 0.99 | ||||||||
69.00 - 71.00 | 2.00 | 1.53 | ||||||||
75.00 - 82.00 | 7.00 | 1.57 | ||||||||
93.00 - 106.00 | 13.00 | 1.56 | ||||||||
116.00 - 122.00 | 6.00 | 1.40 | ||||||||
YRRC006 | 150.36 | (50.46) | 140.00 - 144.00 | 4.00 | 2.00 | |||||
0.00 - 2.00 | 2.00 | 1.34 | ||||||||
7.00 - 14.00 | 7.00 | 2.67 | ||||||||
15.00 - 22.00 | 7.00 | 0.73 | ||||||||
29.00 - 34.00 | 5.00 | 1.14 | ||||||||
57.00 - 60.00 | 3.00 | 0.97 | ||||||||
70.00 - 76.00 | 6.00 | 1.52 | ||||||||
120.00 - 130.00 | 10.00 | 2.26 | ||||||||
YRRCDH001 | 164.66 | (50.82) | 132.00 - 134.00 | 2.00 | 0.52 |
a. | All intercepts calculated using a 0.5 g/t Au cutoff and are uncapped; minimum intercept width is 2m; internal dilution is equal to or less than 2m total width. |
b. | Loulo Gounkoto drill hole nomenclature: prospect initial Y/YA (Yalea), L3 (Loulo 3), GK (Gounkoto), GKUG (Gounkoto Underground), DB1 (Domain Boundary 1) followed by type of drilling RC (Reverse Circulation), DH (Diamond Drilling) RCDH (RC/Diamond Tail) |
c. | True widths uncertain at this stage. |
The drilling results for the Loulo-Gounkoto property contained in this MD&A have been prepared in accordance with National Instrument 43-101 Standards of Disclosure for Mineral Projects. All drill hole assay information has been manually reviewed and approved by staff geologists and re-checked by the project manager. Sample preparation and analyses are conducted by SGS Laboratories, an independent laboratory. Industry accepted best practices for preparation and fire assaying procedures are utilized to determine gold content. Procedures are employed to ensure security of samples during their delivery from the drill rig to the laboratory. The quality assurance procedures, data verification and assay protocols used in connection with drilling and sampling on the Loulo property conform to industry accepted quality control methods.
BARRICK THIRD QUARTER 2020 | 112 | MANAGEMENTS DISCUSSION AND ANALYSIS |
12 | Nielle East Significant Drill Interceptsa |
Drill Results from Q3 2020 | ||||||||||
Drill Holeb | Azimuth | Dip | Interval (m) | Width (m)c | Au (g/t) | |||||
MTRC070 | 90 | (50) | 95.00 - 99.00 | 4.00 | 1.27 | |||||
MTRC071 | 90 | (50) | 155.00 - 162.00 | 7.00 | 4.10 | |||||
MTRC072 | 90 | (50) | 38.00 - 45.00 | 7.00 | 2.77 | |||||
MTRC073 | 90 | (50) | 83.00 - 87.00 | 4.00 | 1.15 | |||||
MTRC074 | 90 | (50) | 57.00 - 60.00 | 3.00 | 1.78 | |||||
ZWAC013 | 94 | (50) | 32.00 - 41.00 | 9.00 | 5.54 | |||||
2.00 - 4.00 | 2.00 | 5.93 | ||||||||
14.00 - 16.00 | 2.00 | 3.78 | ||||||||
ZWAC014 | 94 | (50) | 24.00 - 32.00 | 8.00 | 1.98 | |||||
ZWAC015 | 94 | (50) | 4.00 - 15.00 | 11.00 | 1.61 | |||||
ZWAC019 | 94 | (50) | 34.00 - 39.00 | 5.00 | 0.64 | |||||
ZWAC020 | 94 | (50) | 18.00 - 24.00 | 6.00 | 2.83 | |||||
ZWAC022 | 94 | (50) | 12.00 - 14.00 | 2.00 | 1.81 | |||||
ZWAC023 | 94 | (50) | 1.00 - 4.00 | 3.00 | 0.63 | |||||
ZWAC027 | 94 | (50) | 24.00 - 26.00 | 2.00 | 1.13 | |||||
ZWAC030 | 94 | (50) | 34.00 - 36.00 | 2.00 | 1.64 | |||||
ZWAC031 | 94 | (50) | 40.00 - 42.00 | 2.00 | 1.20 | |||||
ZWAC032 | 94 | (50) | 12.00 - 29.00 | 17.00 | 0.89 | |||||
ZWAC037 | 94 | (50) | 26.00 - 28.00 | 2.00 | 6.51 |
a. | All intercepts calculated using a 0.5 g/t Au cutoff and are uncapped; minimum intercept width is 2m; internal dilution is equal to or less than 25% total width. |
b. | Nielle drill hole nomenclature: prospect initial TB (Tiebila), MT(Mercator), ZW(Zulu West) followed by type of drilling RC (Reverse Circulation), AC (Air core) |
c. | True widths uncertain at this stage. |
The drilling results for the Nielle property contained in this MD&A have been prepared in accordance with National Instrument 43-101 Standards of Disclosure for Mineral Projects. All drill hole assay information has been manually reviewed and approved by staff geologists and re-checked by the project manager. Sample preparation and analyses are conducted by SGS Laboratories, an independent laboratory. Procedures are employed to ensure security of samples during their delivery from the drill rig to the laboratory. The quality assurance procedures, data verification and assay protocols used in connection with drilling and sampling on the Nielle property conform to industry accepted quality control methods.
13 | Barrick defines a Tier One mine as one that produces in excess of 500,000 ounces of gold per annum and has a life of at least 10 years. |
BARRICK THIRD QUARTER 2020 | 113 | MANAGEMENTS DISCUSSION AND ANALYSIS |
Consolidated Statements of Income
Barrick Gold Corporation (in millions of United States dollars, except per share data) (Unaudited) |
Three months ended September 30, |
Nine months ended September 30, |
||||||||||||||
2020 | 2019 | 2020 | 2019 | |||||||||||||
Revenue (notes 5 and 6) |
$3,540 | $2,678 | $9,316 | $6,834 | ||||||||||||
Costs and expenses (income) |
||||||||||||||||
Cost of sales (notes 5 and 7) |
1,927 | 1,889 | 5,603 | 4,924 | ||||||||||||
General and administrative expenses |
50 | 68 | 161 | 181 | ||||||||||||
Exploration, evaluation and project expenses |
72 | 86 | 221 | 258 | ||||||||||||
Impairment (reversals) charges (notes 9B and 13) |
4 | (872 | ) | (309 | ) | (857 | ) | |||||||||
Loss on currency translation |
16 | 40 | 34 | 56 | ||||||||||||
Closed mine rehabilitation |
8 | 5 | 105 | 46 | ||||||||||||
Income from equity investees (note 12) |
(95 | ) | (38 | ) | (210 | ) | (116 | ) | ||||||||
Other income (note 9A) |
(78 | ) | (1,851 | ) | (40 | ) | (1,818 | ) | ||||||||
Income before finance costs and income taxes |
$1,636 | $3,351 | $3,751 | $4,160 | ||||||||||||
Finance costs, net |
(81 | ) | (125 | ) | (267 | ) | (363 | ) | ||||||||
Income before income taxes |
$1,555 | $3,226 | $3,484 | $3,797 | ||||||||||||
Income tax expense (note 10) |
(284 | ) | (791 | ) | (928 | ) | (999 | ) | ||||||||
Net income |
$1,271 | $2,435 | $2,556 | $2,798 | ||||||||||||
Attributable to: |
||||||||||||||||
Equity holders of Barrick Gold Corporation |
$882 | $2,277 | $1,639 | $2,582 | ||||||||||||
Non-controlling interests |
$389 | $158 | $917 | $216 | ||||||||||||
Earnings per share data attributable to the equity holders of Barrick Gold Corporation (note 8) |
||||||||||||||||
Net income |
||||||||||||||||
Basic |
$0.50 | $1.30 | $0.92 | $1.47 | ||||||||||||
Diluted |
$0.50 | $1.30 | $0.92 | $1.47 |
The accompanying notes are an integral part of these condensed interim consolidated financial statements.
BARRICK THIRD QUARTER 2020 | 114 | FINANCIAL STATEMENTS (UNAUDITED) |
Consolidated Statements of Comprehensive Income
Barrick Gold Corporation (in millions of United States dollars) (Unaudited) |
Three months ended September 30, |
Nine months ended September 30, |
||||||||||||||
2020 | 2019 | 2020 | 2019 | |||||||||||||
Net income |
$1,271 | $2,435 | $2,556 | $2,798 | ||||||||||||
Other comprehensive (loss) income, net of taxes |
||||||||||||||||
Items that may be reclassified subsequently to profit or loss: |
||||||||||||||||
Unrealized gains (losses) on derivatives designated as cash flow hedges, net of tax $nil, $nil, $nil and $nil |
(3 | ) | | (4 | ) | | ||||||||||
Realized (gains) losses on derivatives designated as cash flow hedges, net of tax $nil, $nil, $nil and $nil |
3 | | 3 | | ||||||||||||
Currency translation adjustments, net of tax $nil, $nil, $nil and $nil |
(1 | ) | (1 | ) | (6 | ) | (4 | ) | ||||||||
Items that will not be reclassified to profit or loss: |
||||||||||||||||
Actuarial gain (loss) on post employment benefit obligations, net of tax $1, $nil, $1 and $nil |
| | (2 | ) | | |||||||||||
Net change on equity investments, net of tax ($34), $nil, ($34) and $nil |
38 | 53 | 131 | 60 | ||||||||||||
Total other comprehensive income |
37 | 52 | 122 | 56 | ||||||||||||
Total comprehensive income |
$1,308 | $2,487 | $2,678 | $2,854 | ||||||||||||
Attributable to: |
||||||||||||||||
Equity holders of Barrick Gold Corporation |
$919 | $2,329 | $1,761 | $2,638 | ||||||||||||
Non-controlling interests |
$389 | $158 | $917 | $216 |
The accompanying notes are an integral part of these condensed interim consolidated financial statements.
BARRICK THIRD QUARTER 2020 | 115 | FINANCIAL STATEMENTS (UNAUDITED) |
Consolidated Statements of Cash Flow
Barrick Gold Corporation (in millions of United States dollars) (Unaudited) |
Three months ended September 30, |
Nine months ended September 30, |
||||||||||||||
2020 | 2019 | 2020 | 2019 | |||||||||||||
OPERATING ACTIVITIES |
||||||||||||||||
Net income |
$1,271 | $2,435 | $2,556 | $2,798 | ||||||||||||
Adjustments for the following items: |
||||||||||||||||
Depreciation |
574 | 559 | 1,664 | 1,460 | ||||||||||||
Finance costs, net |
83 | 129 | 280 | 381 | ||||||||||||
Impairment (reversals) charges (notes 9B and 13) |
4 | (872 | ) | (309 | ) | (857 | ) | |||||||||
Income tax expense (note 10) |
284 | 791 | 928 | 999 | ||||||||||||
Remeasurement of Turquoise Ridge to fair value |
| (1,886 | ) | | (1,886 | ) | ||||||||||
Gain on sale of non-current assets |
(2 | ) | (15 | ) | (54 | ) | (27 | ) | ||||||||
Loss on currency translation |
16 | 40 | 34 | 56 | ||||||||||||
Change in working capital (note 11) |
(3 | ) | 67 | (344 | ) | (263 | ) | |||||||||
Other operating activities (note 11) |
(244 | ) | (126 | ) | (226 | ) | (112 | ) | ||||||||
Operating cash flows before interest and income taxes |
1,983 | 1,122 | 4,529 | 2,549 | ||||||||||||
Interest paid |
(19 | ) | (31 | ) | (173 | ) | (196 | ) | ||||||||
Income taxes paid |
(105 | ) | (87 | ) | (577 | ) | (395 | ) | ||||||||
Net cash provided by operating activities |
1,859 | 1,004 | 3,779 | 1,958 | ||||||||||||
INVESTING ACTIVITIES |
||||||||||||||||
Property, plant and equipment |
||||||||||||||||
Capital expenditures (note 5) |
(548 | ) | (502 | ) | (1,508 | ) | (1,255 | ) | ||||||||
Sales proceeds |
8 | 13 | 24 | 31 | ||||||||||||
Investment sales (purchases) |
2 | 3 | 208 | (4 | ) | |||||||||||
Divestitures (note 4) |
| | 256 | | ||||||||||||
Cash acquired in merger |
| | | 751 | ||||||||||||
Other investing activities (note 11) |
84 | 103 | 139 | 165 | ||||||||||||
Net cash used in investing activities |
(454 | ) | (383 | ) | (881 | ) | (312 | ) | ||||||||
FINANCING ACTIVITIES |
||||||||||||||||
Lease repayments |
(8 | ) | (5 | ) | (20 | ) | (23 | ) | ||||||||
Debt repayments |
| (264 | ) | (351 | ) | (280 | ) | |||||||||
Dividends |
(141 | ) | (67 | ) | (387 | ) | (461 | ) | ||||||||
Funding from non-controlling interests |
| 102 | 1 | 116 | ||||||||||||
Disbursements to non-controlling interests |
(259 | ) | (133 | ) | (693 | ) | (161 | ) | ||||||||
Other financing activities |
| (2 | ) | (15 | ) | (2 | ) | |||||||||
Net cash used in financing activities |
(408 | ) | (369 | ) | (1,465 | ) | (811 | ) | ||||||||
Effect of exchange rate changes on cash and equivalents |
4 | | (3 | ) | (1 | ) | ||||||||||
Net increase in cash and equivalents |
1,001 | 252 | 1,430 | 834 | ||||||||||||
Cash and equivalents at the beginning of period |
3,743 | 2,153 | 3,314 | 1,571 | ||||||||||||
Cash and equivalents at the end of period |
$4,744 | $2,405 | $4,744 | $2,405 |
The accompanying notes are an integral part of these condensed interim consolidated financial statements.
BARRICK THIRD QUARTER 2020 | 116 | FINANCIAL STATEMENTS (UNAUDITED) |
Consolidated Balance Sheets
Barrick Gold Corporation (in millions of United States dollars) (Unaudited) |
As at September 30, | As at December 31, | ||||||
2020 | 2019 | |||||||
ASSETS |
||||||||
Current assets |
||||||||
Cash and equivalents (note 14A) |
$4,744 | $3,314 | ||||||
Accounts receivable |
509 | 363 | ||||||
Inventories |
2,111 | 2,289 | ||||||
Other current assets |
495 | 565 | ||||||
Total current assets (excluding assets classified as held for sale) | $7,859 | $6,531 | ||||||
Assets classified as held for sale |
| 356 | ||||||
Total current assets |
$7,859 | $6,887 | ||||||
Non-current assets |
||||||||
Equity in investees (note 12) |
4,643 | 4,527 | ||||||
Property, plant and equipment |
24,698 | 24,141 | ||||||
Goodwill |
4,769 | 4,769 | ||||||
Intangible assets |
170 | 226 | ||||||
Deferred income tax assets |
165 | 235 | ||||||
Non-current portion of inventory |
2,392 | 2,300 | ||||||
Other assets |
1,420 | 1,307 | ||||||
Total assets |
$46,116 | $44,392 | ||||||
LIABILITIES AND EQUITY |
||||||||
Current liabilities |
||||||||
Accounts payable |
$1,032 | $1,155 | ||||||
Debt (note 14B) |
21 | 375 | ||||||
Current income tax liabilities |
339 | 224 | ||||||
Other current liabilities |
359 | 622 | ||||||
Total current liabilities |
$1,751 | $2,376 | ||||||
Non-current liabilities |
||||||||
Debt (note 14B) |
5,140 | 5,161 | ||||||
Provisions |
3,311 | 3,114 | ||||||
Deferred income tax liabilities |
3,064 | 3,091 | ||||||
Other liabilities |
1,200 | 823 | ||||||
Total liabilities |
$14,466 | $14,565 | ||||||
Equity |
||||||||
Capital stock (note 16) |
$29,235 | $29,231 | ||||||
Deficit |
(8,474 | ) | (9,722 | ) | ||||
Accumulated other comprehensive loss |
| (122 | ) | |||||
Other |
2,038 | 2,045 | ||||||
Total equity attributable to Barrick Gold Corporation shareholders |
$22,799 | $21,432 | ||||||
Non-controlling interests |
8,851 | 8,395 | ||||||
Total equity |
$31,650 | $29,827 | ||||||
Contingencies and commitments (notes 5 and 17) |
||||||||
Total liabilities and equity |
$46,116 | $44,392 |
The accompanying notes are an integral part of these condensed interim consolidated financial statements.
BARRICK THIRD QUARTER 2020 | 117 | FINANCIAL STATEMENTS (UNAUDITED) |
Consolidated Statements of Changes in Equity
Barrick Gold Corporation | Attributable to equity holders of the company | |||||||||||||||||||||||||||||||
(in millions of United States dollars) (Unaudited) |
Common Shares (in thousands) |
Capital stock |
Retained earnings |
Accumulated other comprehensive income (loss)1 |
Other2 | Total equity attributable to shareholders |
Non- controlling |
Total equity |
||||||||||||||||||||||||
At January 1, 2020 |
1,777,927 | $29,231 | ($9,722 | ) | ($122 | ) | $2,045 | $21,432 | $8,395 | $29,827 | ||||||||||||||||||||||
Net income |
| | 1,639 | | | 1,639 | 917 | 2,556 | ||||||||||||||||||||||||
Total other comprehensive income (loss) |
| | | 122 | | 122 | | 122 | ||||||||||||||||||||||||
Total comprehensive income |
| | 1,639 | 122 | | 1,761 | 917 | 2,678 | ||||||||||||||||||||||||
Transactions with owners |
||||||||||||||||||||||||||||||||
Dividends |
| | (387 | ) | | | (387 | ) | | (387 | ) | |||||||||||||||||||||
Issuance of 16% interest in Tanzania mines (note 13) |
| | | | | | 238 | 238 | ||||||||||||||||||||||||
Sale of Acacia exploration properties |
| | | | (13 | ) | (13 | ) | 13 | | ||||||||||||||||||||||
Issued on exercise of stock options |
70 | | | | | | | | ||||||||||||||||||||||||
Funding from non-controlling interests |
| | | | | | 1 | 1 | ||||||||||||||||||||||||
Disbursements to non-controlling interests |
| | | | | | (713 | ) | (713 | ) | ||||||||||||||||||||||
Dividend reinvestment plan (note 16) |
129 | 4 | (4 | ) | | | | | | |||||||||||||||||||||||
Share-based payments |
| | | | 6 | 6 | | 6 | ||||||||||||||||||||||||
Total transactions with owners |
199 | 4 | (391 | ) | | (7 | ) | (394 | ) | (461 | ) | (855 | ) | |||||||||||||||||||
At September 30, 2020 |
1,778,126 | $29,235 | ($8,474 | ) | $ | $2,038 | $22,799 | $8,851 | $31,650 | |||||||||||||||||||||||
At January 1, 2019 |
1,167,847 | $20,883 | ($13,453 | ) | ($158 | ) | $321 | $7,593 | $1,792 | $9,385 | ||||||||||||||||||||||
Net income |
| | 2,582 | | | 2,582 | 216 | 2,798 | ||||||||||||||||||||||||
Total other comprehensive income |
| | | 56 | | 56 | | 56 | ||||||||||||||||||||||||
Total comprehensive income |
| | 2,582 | 56 | | 2,638 | 216 | 2,854 | ||||||||||||||||||||||||
Transactions with owners |
||||||||||||||||||||||||||||||||
Dividends |
| | (131 | ) | | | (131 | ) | | (131 | ) | |||||||||||||||||||||
Merger with Randgold Resources Limited |
583,669 | 7,903 | | | | 7,903 | 874 | 8,777 | ||||||||||||||||||||||||
Nevada Gold Mines JV with Newmont Goldcorp Corporation |
| | | | 1,645 | 1,645 | 5,909 | 7,554 | ||||||||||||||||||||||||
Acquisition of 36.1% of Acacia Mining plc |
24,837 | 423 | | | 70 | 493 | (495 | ) | (2 | ) | ||||||||||||||||||||||
Issued on exercise of stock options |
130 | 1 | | | | 1 | | 1 | ||||||||||||||||||||||||
Funding from non-controlling interests |
| | | | | | 116 | 116 | ||||||||||||||||||||||||
Disbursements to non-controlling interests |
| | | | | | (161 | ) | (161 | ) | ||||||||||||||||||||||
Dividend reinvestment plan (note 16) |
1,299 | 18 | (18 | ) | | | | | | |||||||||||||||||||||||
Share-based payments |
| | | | 7 | 7 | | 7 | ||||||||||||||||||||||||
Total transactions with owners |
609,935 | 8,345 | (149 | ) | | 1,722 | 9,918 | 6,243 | 16,161 | |||||||||||||||||||||||
At September 30, 2019 |
1,777,782 | $29,228 | ($11,020 | ) | ($102 | ) | $2,043 | $20,149 | $8,251 | $28,400 |
1 | Includes cumulative translation losses at September 30, 2020: $94 million (September 30, 2019: $87 million). |
2 | Includes additional paid-in capital as at September 30, 2020: $2,000 million (December 31, 2019: $2,007 million; September 30, 2019: $1,998 million). |
The accompanying notes are an integral part of these condensed interim consolidated financial statements.
BARRICK THIRD QUARTER 2020 | 118 | FINANCIAL STATEMENTS (UNAUDITED) |
BARRICK THIRD QUARTER 2020 | 119 | NOTES TO FINANCIAL STATEMENTS (UNAUDITED) |
BARRICK THIRD QUARTER 2020 | 120 | NOTES TO FINANCIAL STATEMENTS (UNAUDITED) |
5 > SEGMENT INFORMATION
Barricks business is organized into eighteen minesites and one project. Barricks Chief Operating Decision Maker (CODM) (Mark Bristow, President and Chief Executive Officer) reviews the operating results, assesses performance and makes capital allocation decisions at the minesite, Company and/or project level. Each individual minesite and the Pascua-Lama project are operating segments for financial reporting purposes. Our presentation of our reportable operating segments consists of nine gold mines (Carlin, Cortez, Turquoise Ridge, Pueblo Viejo, Loulo-Gounkoto, Kibali, Veladero, Porgera and North Mara). The remaining operating segments, including our copper mines, remaining gold mines and project, have been grouped into an other category and will not be reported on individually. Segment performance is evaluated based on a number of measures including operating income before tax, production levels and unit production costs. Certain costs are managed on a consolidated basis and are therefore not reflected in segment income. Prior period figures have been restated to reflect the changes made to our reportable operating segments in the prior year.
Consolidated Statement of Income Information
Cost of Sales | ||||||||||||||||||||||||
For the three months ended September 30, 2020 |
Revenue | Direct mining, royalties and community relations |
Depreciation | Exploration, evaluation and project expenses |
Other expenses (income)1 |
Segment income (loss) |
||||||||||||||||||
Carlin2 |
$852 | $358 | $82 | $7 | $4 | $401 | ||||||||||||||||||
Cortez2 |
358 | 144 | 54 | 4 | | 156 | ||||||||||||||||||
Turquoise Ridge2 |
240 | 95 | 41 | 2 | | 102 | ||||||||||||||||||
Pueblo Viejo2 |
417 | 113 | 56 | 2 | (5 | ) | 251 | |||||||||||||||||
Loulo-Gounkoto2 |
329 | 116 | 69 | 3 | 26 | 115 | ||||||||||||||||||
Kibali |
176 | 56 | 43 | | 3 | 74 | ||||||||||||||||||
Veladero |
82 | 32 | 17 | | 3 | 30 | ||||||||||||||||||
Porgera |
| 1 | 4 | 1 | 11 | (17 | ) | |||||||||||||||||
North Mara2 |
158 | 53 | 20 | | | 85 | ||||||||||||||||||
Other Mines2,3 |
1,096 | 439 | 219 | 5 | 9 | 424 | ||||||||||||||||||
Reportable segment total | $3,708 | $1,407 | $605 | $24 | $51 | $1,621 | ||||||||||||||||||
Share of equity investees | (176 | ) | (56 | ) | (43 | ) | | (3 | ) | (74 | ) | |||||||||||||
Segment total | $3,532 | $1,351 | $562 | $24 | $48 | $1,547 | ||||||||||||||||||
Consolidated Statement of Income Information
|
| |||||||||||||||||||||||
Cost of Sales | ||||||||||||||||||||||||
For the three months ended September 30, 2019 |
Revenue | Direct mining, royalties and community relations |
Depreciation | Exploration, evaluation and project expenses |
Other expenses (income)1 |
Segment income (loss) |
||||||||||||||||||
Carlin2 |
$652 | $344 | $101 | $6 | $5 | $196 | ||||||||||||||||||
Cortez2 |
300 | 117 | 53 | 2 | 3 | 125 | ||||||||||||||||||
Turquoise Ridge2 |
231 | 98 | 70 | 2 | | 61 | ||||||||||||||||||
Pueblo Viejo2 |
353 | 133 | 48 | 4 | (3 | ) | 171 | |||||||||||||||||
Loulo-Gounkoto2 |
287 | 123 | 76 | 3 | 5 | 80 | ||||||||||||||||||
Kibali |
133 | 50 | 57 | 1 | | 25 | ||||||||||||||||||
Veladero |
89 | 47 | 25 | 1 | 2 | 14 | ||||||||||||||||||
Porgera |
111 | 65 | 11 | | 2 | 33 | ||||||||||||||||||
North Mara2 |
87 | 36 | 17 | | 3 | 31 | ||||||||||||||||||
Other Mines2,3 |
568 | 362 | 147 | 7 | 7 | 45 | ||||||||||||||||||
Reportable segment total | $2,811 | $1,375 | $605 | $26 | $24 | $781 | ||||||||||||||||||
Share of equity investees | (133 | ) | (50 | ) | (57 | ) | (1 | ) | | (25 | ) | |||||||||||||
Segment total | $2,678 | $1,325 | $548 | $25 | $24 | $756 |
BARRICK THIRD QUARTER 2020 | 121 | NOTES TO FINANCIAL STATEMENTS (UNAUDITED) |
Consolidated Statement of Income Information
Cost of Sales | ||||||||||||||||||||||||
For the nine months ended September 30, 2020 |
Revenue | Direct mining, royalties and community relations |
Depreciation | Exploration, evaluation and project expenses |
Other expenses (income)1 |
Segment income (loss) |
||||||||||||||||||
Carlin2 |
$2,168 | $1,007 | $232 | $17 | $16 | $896 | ||||||||||||||||||
Cortez2 |
1,056 | 403 | 164 | 9 | 2 | 478 | ||||||||||||||||||
Turquoise Ridge2 |
684 | 287 | 132 | 7 | 2 | 256 | ||||||||||||||||||
Pueblo Viejo2 |
1,126 | 369 | 163 | 7 | (5 | ) | 592 | |||||||||||||||||
Loulo-Gounkoto2 |
912 | 336 | 202 | 9 | 31 | 334 | ||||||||||||||||||
Kibali |
480 | 167 | 126 | 2 | (1 | ) | 186 | |||||||||||||||||
Veladero |
234 | 107 | 52 | | 5 | 70 | ||||||||||||||||||
Porgera |
140 | 81 | 20 | 2 | 38 | (1 | ) | |||||||||||||||||
North Mara2 |
429 | 166 | 70 | | (3 | ) | 196 | |||||||||||||||||
Other Mines2,3 |
2,559 | 1,179 | 597 | 12 | 46 | 725 | ||||||||||||||||||
Reportable segment total | $9,788 | $4,102 | $1,758 | $65 | $131 | $3,732 | ||||||||||||||||||
Share of equity investees | (480 | ) | (167 | ) | (126 | ) | (2 | ) | 1 | (186 | ) | |||||||||||||
Segment total | $9,308 | $3,935 | $1,632 | $63 | $132 | $3,546 | ||||||||||||||||||
Consolidated Statement of Income Information
|
| |||||||||||||||||||||||
Cost of Sales | ||||||||||||||||||||||||
For the nine months ended September 30, 2019 |
Revenue | Direct mining, royalties and community relations |
Depreciation | Exploration, evaluation and project expenses |
Other expenses (income)1 |
Segment income (loss) |
||||||||||||||||||
Carlin2 |
$1,198 | $654 | $220 | $10 | $2 | $312 | ||||||||||||||||||
Cortez2 |
1,007 | 367 | 182 | 6 | 14 | 438 | ||||||||||||||||||
Turquoise Ridge2 |
441 | 185 | 85 | 3 | | 168 | ||||||||||||||||||
Pueblo Viejo2 |
993 | 391 | 141 | 10 | (1 | ) | 452 | |||||||||||||||||
Loulo-Gounkoto2 |
740 | 343 | 222 | 7 | 11 | 157 | ||||||||||||||||||
Kibali |
375 | 153 | 144 | 1 | (1 | ) | 78 | |||||||||||||||||
Veladero |
280 | 155 | 86 | 2 | 1 | 36 | ||||||||||||||||||
Porgera |
280 | 179 | 30 | 1 | 3 | 67 | ||||||||||||||||||
North Mara2 |
310 | 144 | 62 | | 10 | 94 | ||||||||||||||||||
Other Mines2,3 |
1,585 | 1,041 | 403 | 14 | 42 | 85 | ||||||||||||||||||
Reportable segment total |
$7,209 | $3,612 | $1,575 | $54 | $81 | $1,887 | ||||||||||||||||||
Share of equity investees |
(375 | ) | (153 | ) | (144 | ) | (1 | ) | 1 | (78 | ) | |||||||||||||
Segment total |
$6,834 | $3,459 | $1,431 | $53 | $82 | $1,809 |
1 | Includes accretion expense, which is included within finance costs in the consolidated statement of income. For the three months ended September 30, 2020, accretion expense was $6 million (2019: $13 million) and for the nine months ended September 30, 2020, accretion expense was $24 million (2019: $39 million). |
2 | Includes non-controlling interest portion of revenues, cost of sales and segment income for the three months ended September 30, 2020 for Nevada Gold Mines $668 million, $359 million, $303 million (2019: $504 million, $346 million, $149 million), Pueblo Viejo $171 million, $67 million, $104 million (2019: $140 million, $72 million, $67 million), Loulo-Gounkoto $65 million, $36 million, $23 million (2019: $57 million, $40 million, $16 million), North Mara, Bulyanhulu and Buzwagi $75 million, $37 million, $37 million (2019: $51 million, $35 million, $12 million), and Tongon $14 million, $9 million, $4 million (2019: $11 million, $11 million, $nil) and for the nine months ended September 30, 2020 for Nevada Gold Mines $1,781 million, $1,031 million, $727 million (2019: $504 million, $346 million, $149 million), Pueblo Viejo $463 million, $211 million, $251 million (2019: $390 million, $211 million, $175 million), Loulo-Gounkoto $182 million, $107 million, $67 million (2019: $148 million, $113 million, $32 million), North Mara, Bulyanhulu and Buzwagi $158 million, $91 million, $63 million (2019: $169 million, $125 million, $31 million) and Tongon $38 million, $29 million, $9 million (2019: $29 million, $32 million, $(3) million). |
3 | Includes provisional pricing adjustments for the three months ended September 30, 2020 of $43 million gains (2019: $1 million gains) and for the nine months ended September 30, 2020 of $50 million gains (2019: $15 million gains). |
BARRICK THIRD QUARTER 2020 | 122 | NOTES TO FINANCIAL STATEMENTS (UNAUDITED) |
Reconciliation of Segment Income to Income Before Income Taxes
For the three months ended September 30 |
For the nine months ended September 30 |
|||||||||||||||
2020 | 2019 | 2020 | 2019 | |||||||||||||
Segment income |
$1,547 | $756 | $3,546 | $1,809 | ||||||||||||
Other revenue |
8 | | 8 | | ||||||||||||
Other cost of sales/amortization |
(14 | ) | (16 | ) | (36 | ) | (34 | ) | ||||||||
Exploration, evaluation and project expenses not attributable to segments |
(48 | ) | (61 | ) | (158 | ) | (205 | ) | ||||||||
General and administrative expenses |
(50 | ) | (68 | ) | (161 | ) | (181 | ) | ||||||||
Other income (expense) not attributable to segments |
115 | 1,863 | 138 | 1,861 | ||||||||||||
Impairment reversals (charges) |
(4 | ) | 872 | 309 | 857 | |||||||||||
Loss on currency translation |
(16 | ) | (40 | ) | (34 | ) | (56 | ) | ||||||||
Closed mine rehabilitation |
(8 | ) | (5 | ) | (105 | ) | (46 | ) | ||||||||
Income from equity investees |
95 | 38 | 210 | 116 | ||||||||||||
Finance costs, net (includes non-segment accretion) |
(75 | ) | (112 | ) | (243 | ) | (324 | ) | ||||||||
Gain (loss) on non-hedge derivatives |
5 | (1 | ) | 10 | | |||||||||||
Income before income taxes1 |
$1,555 | $3,226 | $3,484 | $3,797 |
1 | Includes non-controlling interest portion of revenues, cost of sales and non-segment income for the three months ended September 30, 2020 for Acacia, $nil, $nil, $nil (2019: $nil, $nil, $(11) million) and Nevada Gold Mines, $nil, $2 million, $(4) million (2019: $nil, $2 million, $(4) million) and for the nine months ended September 30, 2020 for Acacia, $nil, $nil, $nil (2019: $nil, $nil, $(17) million) and Nevada Gold Mines, $nil, $4 million, $(13) million (2019: $nil $2 million, $(4) million). |
Capital Expenditures Information
Segment capital expenditures1 | ||||||||||||||||
For the three months ended September 30 |
For the nine months ended September 30 |
|||||||||||||||
2020 | 2019 | 2020 | 2019 | |||||||||||||
Carlin |
$92 | $98 | $288 | $217 | ||||||||||||
Cortez |
76 | 92 | 254 | 257 | ||||||||||||
Turquoise Ridge |
20 | 39 | 73 | 86 | ||||||||||||
Pueblo Viejo |
55 | 28 | 115 | 86 | ||||||||||||
Loulo-Gounkoto |
94 | 62 | 203 | 151 | ||||||||||||
Kibali |
9 | 14 | 40 | 34 | ||||||||||||
Veladero |
21 | 20 | 63 | 68 | ||||||||||||
Porgera |
| 12 | 11 | 41 | ||||||||||||
North Mara |
23 | 12 | 59 | 40 | ||||||||||||
Other Mines |
132 | 90 | 287 | 287 | ||||||||||||
Reportable segment total |
$522 | $467 | $1,393 | $1,267 | ||||||||||||
Other items not allocated to segments |
36 | 35 | 127 | 86 | ||||||||||||
Total |
$558 | $502 | $1,520 | $1,353 | ||||||||||||
Share of equity investees |
(9 | ) | (14 | ) | (40 | ) | (34 | ) | ||||||||
Total |
$549 | $488 | $1,480 | $1,319 |
1 | Segment capital expenditures are presented for internal management reporting purposes on an accrual basis. Capital expenditures in the Consolidated Statements of Cash Flow are presented on a cash basis. For the three months ended September 30, 2020, cash expenditures were $548 million (2019: $502 million) and the increase in accrued expenditures was $1 million (2019: $14 million decrease). For the nine months ended September 30, 2020, cash expenditures were $1,508 million (2019: $1,255 million) and the decrease in accrued expenditures was $28 million (2019: $64 million increase). |
Purchase Commitments
At September 30, 2020, we had purchase obligations for supplies and consumables of $1,661 million (December 31, 2019: $1,681 million).
Capital Commitments
In addition to entering into various operational commitments in the normal course of business, we had capital commitments of $158 million at September 30, 2020 (December 31, 2019: $383 million).
BARRICK THIRD QUARTER 2020 | 123 | NOTES TO FINANCIAL STATEMENTS (UNAUDITED) |
6 > REVENUE
For the three months ended September 30 |
For the nine months ended September 30 |
|||||||||||||||
2020 | 2019 | 2020 | 2019 | |||||||||||||
Gold sales | ||||||||||||||||
Spot market sales | $2,973 | $2,549 | $8,145 | $6,371 | ||||||||||||
Concentrate sales | 246 | 36 | 475 | 56 | ||||||||||||
Provisional pricing adjustments | 18 | | 22 | 1 | ||||||||||||
$3,237 | $2,585 | $8,642 | $6,428 | |||||||||||||
Copper sales | ||||||||||||||||
Copper concentrate sales | $194 | $44 | $474 | $297 | ||||||||||||
Provisional pricing adjustments | 25 | 1 | 28 | 14 | ||||||||||||
$219 | $45 | $502 | $311 | |||||||||||||
Other sales1 | 84 | 48 | 172 | 95 | ||||||||||||
Total | $3,540 | $2,678 | $9,316 | $6,834 |
1 | Revenues include the sale of by-products for our gold and copper mines. |
7 > COST OF SALES
Gold | Copper | Other3 | Total | |||||||||||||||||||||||||||||
For the three months ended September 30 |
2020 | 2019 | 2020 | 2019 | 2020 | 2019 | 2020 | 2019 | ||||||||||||||||||||||||
Direct mining cost1,2 | $1,151 | $1,207 | $76 | $30 | $ | $1 | $1,227 | $1,238 | ||||||||||||||||||||||||
Depreciation | 508 | 538 | 61 | 13 | 5 | 8 | 574 | 559 | ||||||||||||||||||||||||
Royalty expense | 103 | 79 | 16 | 5 | | | 119 | 84 | ||||||||||||||||||||||||
Community relations | 6 | 7 | 1 | 1 | | | 7 | 8 | ||||||||||||||||||||||||
$1,768 | $1,831 | $154 | $49 | $5 | $9 | $1,927 | $1,889 | |||||||||||||||||||||||||
Gold | Copper | Other3 | Total | |||||||||||||||||||||||||||||
For the nine months ended September 30 |
2020 | 2019 | 2020 | 2019 | 2020 | 2019 | 2020 | 2019 | ||||||||||||||||||||||||
Direct mining cost1,2 | $3,352 | $3,022 | $224 | $169 | $4 | $1 | $3,580 | $3,192 | ||||||||||||||||||||||||
Depreciation | 1,480 | 1,353 | 167 | 83 | 17 | 24 | 1,664 | 1,460 | ||||||||||||||||||||||||
Royalty expense | 303 | 223 | 38 | 26 | | | 341 | 249 | ||||||||||||||||||||||||
Community relations | 16 | 20 | 2 | 3 | | | 18 | 23 | ||||||||||||||||||||||||
$5,151 | $4,618 | $431 | $281 | $21 | $25 | $5,603 | $4,924 |
1 | Direct mining cost includes charges to reduce the cost of inventory to net realizable value as follows: $11 million for the three months ended September 30, 2020 (2019: $nil) and $29 million for the nine months ended September 30, 2020 (2019: $16 million). |
2 | Direct mining cost includes the costs of extracting by-products. |
3 | Other includes realized hedge gains and losses and corporate amortization. |
8 > EARNINGS PER SHARE
For the three months ended September 30 |
For the nine months ended September 30 |
|||||||||||||||||||||||||||||||
2020 | 2019 | 2020 | 2019 | |||||||||||||||||||||||||||||
Basic | Diluted | Basic | Diluted | Basic | Diluted | Basic | Diluted | |||||||||||||||||||||||||
Net income |
$1,271 | $1,271 | $2,435 | $2,435 | $2,556 | $2,556 | $2,798 | $2,798 | ||||||||||||||||||||||||
Net income attributable to non-controlling interests |
(389 | ) | (389 | ) | (158 | ) | (158 | ) | (917 | ) | (917 | ) | (216 | ) | (216 | ) | ||||||||||||||||
Net income attributable to equity holders of Barrick Gold Corporation |
$882 | $882 | $2,277 | $2,277 | $1,639 | $1,639 | $2,582 | $2,582 | ||||||||||||||||||||||||
Weighted average shares outstanding |
1,778 | 1,778 | 1,756 | 1,756 | 1,778 | 1,778 | 1,751 | 1,751 | ||||||||||||||||||||||||
Basic and diluted earnings per share data attributable to the equity holders of Barrick Gold Corporation |
$0.50 | $0.50 | $1.30 | $1.30 | $0.92 | $0.92 | $1.47 | $1.47 |
BARRICK THIRD QUARTER 2020 | 124 | NOTES TO FINANCIAL STATEMENTS (UNAUDITED) |
BARRICK THIRD QUARTER 2020 | 125 | NOTES TO FINANCIAL STATEMENTS (UNAUDITED) |
11 > CASH FLOW OTHER ITEMS
Operating Cash Flows Other Items | For the three months ended September 30 |
For the nine months ended September 30 |
||||||||||||||
2020 | 2019 | 2020 | 2019 | |||||||||||||
Adjustments for non-cash income statement items: | ||||||||||||||||
Loss (gain) on non-hedge derivatives |
($5 | ) | $1 | ($10 | ) | $ | ||||||||||
Remeasurement of silver sale liability |
(104 | ) | | (104 | ) | | ||||||||||
Share-based compensation expense |
23 | 25 | 73 | 63 | ||||||||||||
Income from investment in equity investees |
(95 | ) | (38 | ) | (210 | ) | (116 | ) | ||||||||
Change in estimate of rehabilitation costs at closed mines |
8 | 5 | 105 | 46 | ||||||||||||
Net inventory impairment charges |
11 | | 29 | 16 | ||||||||||||
Change in other assets and liabilities | (51 | ) | (96 | ) | (34 | ) | (68 | ) | ||||||||
Settlement of rehabilitation obligations | (31 | ) | (23 | ) | (75 | ) | (53 | ) | ||||||||
Other operating activities | ($244 | ) | ($126 | ) | ($226 | ) | ($112 | ) | ||||||||
Cash flow arising from changes in: | ||||||||||||||||
Accounts receivable |
($110 | ) | ($6 | ) | ($158 | ) | ($39 | ) | ||||||||
Inventory |
101 | 9 | 76 | 21 | ||||||||||||
Other current assets |
89 | (39 | ) | (50 | ) | (133 | ) | |||||||||
Accounts payable |
(88 | ) | 115 | (161 | ) | (45 | ) | |||||||||
Other current liabilities |
5 | (12 | ) | (51 | ) | (67 | ) | |||||||||
Change in working capital | ($3 | ) | $67 | ($344 | ) | ($263 | ) | |||||||||
Investing Cash Flows Other Items | For the three months ended September 30 |
For the nine months ended September 30 |
||||||||||||||
2020 | 2019 | 2020 | 2019 | |||||||||||||
Dividends received from equity method investments | $38 | $72 | $92 | $104 | ||||||||||||
Funding of equity method investments | | (2 | ) | | (2 | ) | ||||||||||
Shareholder loan repayments from equity method investments | 46 | 35 | 47 | 65 | ||||||||||||
Other | | (2 | ) | | (2 | ) | ||||||||||
Other net investing activities | $84 | $103 | $139 | $165 |
12 > EQUITY ACCOUNTING METHOD INVESTMENT CONTINUITY
Kibali | Jabal Sayid | Zaldívar | Other | Total | ||||||||||||||||
At January 1, 2019 | $ | $245 | $989 | $ | $1,234 | |||||||||||||||
Acquisitions | 3,195 | | | 58 | 3,253 | |||||||||||||||
Equity pick-up from equity investees | 98 | 51 | 16 | | 165 | |||||||||||||||
Funds invested | | | | 2 | 2 | |||||||||||||||
Dividends received | (75 | ) | | (50 | ) | | (125 | ) | ||||||||||||
Shareholder loan repayment | | | | (2 | ) | (2 | ) | |||||||||||||
At December 31, 2019 | $3,218 | $296 | $955 | $58 | $4,527 | |||||||||||||||
Equity pick-up from equity investees | 147 | 51 | 12 | | 210 | |||||||||||||||
Shareholder loan repayment | | | | (2 | ) | (2 | ) | |||||||||||||
Dividends received | (92 | ) | | | | (92 | ) | |||||||||||||
At September 30, 2020 | $3,273 | $347 | $967 | $56 | $4,643 |
BARRICK THIRD QUARTER 2020 | 126 | NOTES TO FINANCIAL STATEMENTS (UNAUDITED) |
BARRICK THIRD QUARTER 2020 | 127 | NOTES TO FINANCIAL STATEMENTS (UNAUDITED) |
BARRICK THIRD QUARTER 2020 | 128 | NOTES TO FINANCIAL STATEMENTS (UNAUDITED) |
BARRICK THIRD QUARTER 2020 | 129 | NOTES TO FINANCIAL STATEMENTS (UNAUDITED) |
BARRICK THIRD QUARTER 2020 | 130 | NOTES TO FINANCIAL STATEMENTS (UNAUDITED) |
BARRICK THIRD QUARTER 2020 | 131 | NOTES TO FINANCIAL STATEMENTS (UNAUDITED) |
Transfer Agents and Registrars
AST Trust Company (Canada)
P.O. Box 700, Postal Station B
Montreal, Quebec H3B 3K3
or
American Stock Transfer & Trust Company, LLC
6201 15 Avenue
Brooklyn, New York 11219
Telephone: 1-800-387-0825
Fax: 1-888-249-6189
Email: inquiries@astfinancial.com
Website: www.astfinancial.com
Cautionary Statement on Forward-Looking Information
7!E96YU;0 I%4VQI8V54>7!E $EM9R &8F]U;F1S
M3V)J8P $ !28W0Q ! !4;W @;&]N9P 3&5F
M=&QO;F< $)T;VUL;VYG S0 !29VAT;&]N9P S #
M=7)L5$585 $ !N=6QL5$585 $ !- 7"ZV%]:\?+Z?U/)^SV4Y71Q9]KP["W<'5M=9M9=4;*GL?Z;
MV-L4_P#G5@4_5RCZP9H./3?6U[:1[WES_H451M]2QW_F?\VLGHO3LVCZH]3Z
M59TS[)GMIOK ^W?<#& $'O5R]0T=/F=ZIHE$&]:<=[I@G3E9@$Y3.K
MJ6 JJ=-^*N5RN5P5P5P5P[%RCL7*.Q ,/-+8PPZT3@G"
M#7XJ4=S(R*9'\#ED'"RQN32#@HY,>C6JJ"L5Y0G=-*A7F%%2RBJ%BO*$Y-H$
M Y=2SAGZ!.F'B5EU S7<$8R#@I].H[TWF3ZE!WH1C0!2X%"$L04&UP.DUO9&EF>41A=&4](C(P,C M,3$M,#94,#$Z,S
,YU'VE,Z'T:1YRQU'H9VQ5M$U6I)W6'
6H:2Y
MCDHZ/X7$ITM* D6I'O(M4552B-:(J0Z&D!*)KP9;55=$40Z:?4:0A,7 T62]
MU8DTM2NJK4HEU,=*84J0XBT\XI*/@()HVNJ(\?*\"BB&^AERZK/=YA5M",R*Y
M3+8ZY;HN,XV,8G91\Y\^KTEJ(RWD,O(Y&/DA-MM^#FH# 3JRO%HDML.WF8T^G>&^G
EUHT\)#R(DY_Q)U$KK:J#B5>'/Y+KJU+-51?:FMN X-X9HKPU5O:/
M7A#9Y1==1M'7B<7@BZ5&E*JJB*C[73*H+?B\YTP)55:C.J!KXTX/*7[BB_.%
ME: =*;2FQX*E(E+PTHD_AYJ4$6B'1.#:T3>M-#RUIX$E(E,?%8CTE7.X!H[/
M6*TY+(5Q>[$217.HCWNE^-2S0:=5=6M:#76Z'_"\>JS"\/:E2QCCZ@/,V(:1
MI2NG3(Q6TK;XD1KU.2FI4(:4ZX@!*$I$?=F'Y+;_<@7(FY6Y,CJ5/
M)(;8LEKC
MQ@LT=HH#$*ZO%"GQ(EK9N8165(Q"RS'7L5:QP-AX)TXNZ->DUE$&3+S7HN
MB))W1*S'80B!B5%Z&538SIPF-U@='->"@1[3)ID-P5X[%>.Q7CL7.W!/(DVB
M,2&&Y&$B&.P=%PF<=B,)L0=UA],BJO'8B3>;1$$4W(@L0=U@D+PKQV(>HU+3
MZ9O5X[%GFS[J69($-P1A(AB&NZ/DD6V7A>:(/
81KQ6
MII$N6,G[TP4=Z DO+5D_M-40OM'Y;!':4!M* V=*$
M^(4#OZ&:18+F?@FNCLV\4)R#0'?PM/!#.0'7.%SA4RR"]33NQ&S\,-74+@X?
M%%MO1EP/@C;E3!55+ 0LQ3NG%"A$FIV+,2"-F*:YUEO*J4(@>4(@U*E&YBF)
MO"NN+HG!EK.<46-RTY"68R(D;)-_2Q1CO0&((3&H3"CV5]GFAV;5GCID< LX
MB0VY1>+$60XJ'$=./%1XCH9(!R2%R]Z:88[T(ZHIM&"<7&P\%#KM$XEB%6Z4
M?.D8S#A&!P1TSA46'@H,'O7*>QA$#@ N0,B&?:,0
MC$W8'7\ L^H>
MV(1B*8G8A"-P#6'@/!:?S#QL)4IG$D]JS'^(?KP]AI]:=#2'E@!=MXH0! ).
M*$CYI[?A\>C'B/&P=$=$]!D^%C/5,;BJ%$%-@F&"J@$,ET>8^Y&QEQ]L. 48
M'$KG/8%SGL")TIB6ZY4)C(+T]3G [1\;?1B?-._A^]@B=2.8U/PZE]6*&II:
M@,Q0C:$Z )\\:'W']8VZ77[K!+U!4 W'XK+*H-QP*'J/E>K7H:D!G>XFO==;
M/@;)$2$6W(Z@D)-> ,+'D29B\/W[5ETXB(W6G@/!:?S#QL(1B<"RRG^0;KP]
MAI]:"CJZ :3!QMIAO32#$(:6M6.!Q'Q0E$N#T(\1X^T<="B:P%/8QO",FJBB
MU AJZQ,(&[^J7#8%Z>E$1B/U6P*Y/LL>V[V(X!0XCQM