(fidelity_logo)(registered trademark)
Fidelity® Advisor
Aggressive Growth
Fund - Class A, Class T, Class B
and Class C
Annual Report
November 30, 2002
(2_fidelity_logos) (Registered_Trademark)
Contents
|
Chairman's Message |
Ned Johnson on investing strategies. |
|
|
Performance |
How the fund has done over time. |
|
|
Fund Talk |
The manager's review of fund performance, strategy and outlook. |
|
|
Investment Changes |
A summary of major shifts in the fund's investments over the past six months. |
|
|
Investments |
A complete list of the fund's investments with their market values. |
|
|
Financial Statements |
Statements of assets and liabilities, operations, and changes in net assets, as well as financial highlights. |
|
|
Notes |
Notes to the financial statements. |
|
|
Report of Independent Accountants |
The auditors' opinion. |
|
|
Trustees and Officers |
|
|
|
Proxy Voting Results |
|
Standard & Poor's, S&P and S&P 500 are registered service marks of The McGraw-Hill Companies, Inc. and have been licensed for use by Fidelity Distributors Corporation.
Other third party marks appearing herein are the property of their respective owners.
All other marks appearing herein are registered or unregistered trademarks or service marks of FMR Corp. or an affiliated company.
(Recycle graphic) This report is printed on recycled paper using soy-based inks.
This report and the financial statements contained herein are submitted for the general information of the shareholders of the fund. This report is not authorized for distribution to prospective investors in the fund unless preceded or accompanied by an effective prospectus.
Mutual fund shares are not deposits or obligations of, or guaranteed by, any depository institution. Shares are not insured by the FDIC, Federal Reserve Board or any other agency, and are subject to investment risks, including possible loss of principal amount invested.
Neither the fund nor Fidelity Distributors Corporation is a bank.
For more information on any Fidelity Advisor fund, including charges and expenses, contact your investment professional for a free prospectus. Read it carefully before you invest or send money.
Annual Report
Chairman's Message
(photo_of_Edward_C_Johnson_3d)
Dear Shareholder:
Stock market gains in October and November kindled hopes for a strong close to the year. But even with December historically the best month for the Dow industrials, according to a recent study, most equity indexes had double-digit losses for 2002 through November, and avoiding a third straight year of declines seemed unlikely. Although recent fixed-income performance was tarnished by the stock market rebound, most bond categories were up 7%-9% year to date.
While it's impossible to predict the future direction of the markets with any degree of certainty, there are certain basic principles that can help investors plan for their future needs.
First, investors are encouraged to take a long-term view of their portfolios. If you can afford to leave your money invested through the inevitable up and down cycles of the financial markets, you will greatly reduce your vulnerability to any single decline. We know from experience, for example, that stock prices have gone up over longer periods of time, have significantly outperformed other types of investments and have stayed ahead of inflation.
Second, you can further manage your investing risk through diversification. A stock mutual fund, for instance, is already diversified, because it invests in many different companies. You can increase your diversification further by investing in a number of different stock funds, or in such other investment categories as bonds. If you have a short investment time horizon, you might want to consider moving some of your investment into a money market fund, which seeks income and a stable share price by investing in high-quality, short-term investments. Of course, it's important to remember that an investment in a money market fund is not insured or guaranteed by the Federal Deposit Insurance Corporation or any other government agency. Although money market funds seek to preserve the value of your investment at $1.00 per share, it is possible to lose money by investing in these types of funds.
Finally, no matter what your time horizon or portfolio diversity, it makes good sense to follow a regular investment plan, investing a certain amount of money in a fund at the same time each month or quarter and periodically reviewing your overall portfolio. By doing so, you won't get caught up in the excitement of a rapidly rising market, nor will you buy all your shares at market highs. While this strategy - known as dollar cost averaging - won't assure a profit or protect you from a loss in a declining market, it should help you lower the average cost of your purchases. Of course, you should consider your financial ability to continue your purchases through periods of low price levels before undertaking such a strategy.
Remember to contact your investment professional if you need help with your investments.
Best regards,
/s/Edward C. Johnson 3d
Edward C. Johnson 3d
Annual Report
Fidelity Advisor Aggressive Growth Fund - Class A
Performance: The Bottom Line
There are several ways to evaluate historical performance. You can look at cumulative total returns, average annual returns or the growth of a hypothetical investment. Total return reflects the change in the value of an investment, assuming reinvestment of the class' dividend income and capital gains (the profits earned upon the sale of securities that have grown in value). If Fidelity had not reimbursed certain class expenses, the one year and life of fund total returns would have been lower. The $10,000 table and the fund's returns do not reflect the deduction of taxes that a shareholder would pay on fund distributions or the redemption of fund shares.
Cumulative Total Returns
|
Periods ended November 30, 2002 |
|
Past 1 |
Life of |
|
Fidelity® Adv Aggressive Growth - CL A |
|
-19.93% |
-35.23% |
|
Fidelity Adv Aggressive Growth - CL A |
|
-24.53% |
-38.95% |
|
Russell Midcap® Growth |
|
-19.80% |
-43.46% |
|
Mid-Cap Funds Average |
|
-15.21% |
n/a * |
|
Mid-Cap Growth Funds Average |
|
-20.15% |
n/a * |
Cumulative total returns show Class A's performance in percentage terms over a set period - in this case, one year or since the fund started on November 13, 2000. For example, if you had invested $1,000 in a fund that had a 5% return over the past year, the value of your investment would be $1,050. You can compare Class A's returns to the performance of the Russell Midcap® Growth Index - a market capitalization-weighted index of medium capitalization growth-oriented stocks of U.S. domiciled corporations. You can also compare Class A's performance to the performance of mutual funds tracked by Lipper Inc. and grouped by similar objectives and by portfolio characteristics and capitalization. These benchmarks include reinvested dividends and capital gains, if any.
Average Annual Total Returns
|
Periods ended November 30, 2002 |
|
|
Past 1 |
Life of |
|
Fidelity Adv Aggressive Growth - CL A |
|
|
-19.93% |
-19.12% |
|
Fidelity Adv Aggressive Growth - CL A |
|
|
-24.53% |
-21.42% |
|
Russell Midcap Growth |
|
|
-19.80% |
-24.31% |
|
Mid-Cap Funds Average |
|
|
-15.21% |
n/a * |
|
Mid-Cap Growth Funds Average |
|
|
-20.15% |
n/a * |
* Not available
Annual Report
Fidelity Advisor Aggressive Growth Fund - Class A
Performance - continued
Average annual total returns take Class A shares' cumulative return and show you what would have happened if Class A shares had performed at a constant rate each year.
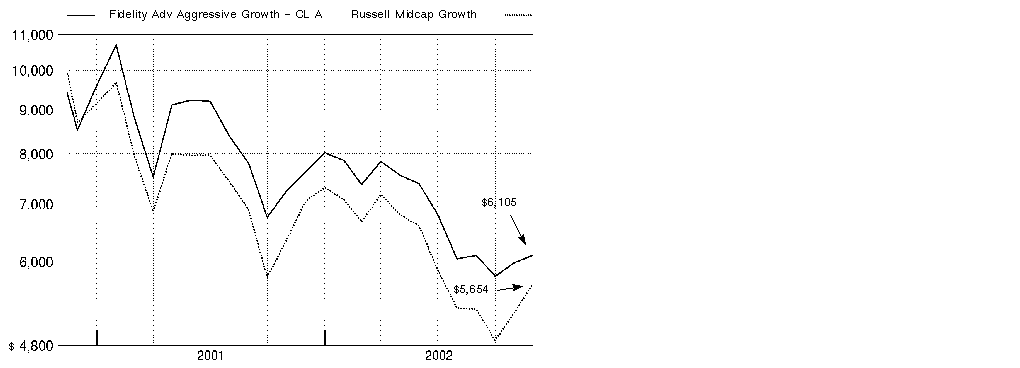
$10,000 Over Life of Fund
Let's say hypothetically that $10,000 was invested in Fidelity® Advisor Aggressive Growth Fund - Class A on November 13, 2000, when the fund started, and the current 5.75% sales charge was paid. The chart shows what the value of your investment would have been, and also shows how the Russell Midcap Growth Index did over the same period.
3
Understanding Performance
How a fund did yesterday is no guarantee of how it will do tomorrow. The stock market, for example, has a history of long-term growth and short-term volatility. In turn, the share price and return of a fund that invests in stocks will vary. When you sell your shares, they could be worth more or less than what you paid for them.
Annual Report
Fidelity Advisor Aggressive Growth Fund - Class T
Performance: The Bottom Line
There are several ways to evaluate historical performance. You can look at cumulative total returns, average annual returns or the growth of a hypothetical investment. Total return reflects the change in the value of an investment, assuming reinvestment of the class' dividend income and capital gains (the profits earned upon the sale of securities that have grown in value). If Fidelity had not reimbursed certain class expenses, the one year and life of fund total returns would have been lower. The $10,000 table and the fund's returns do not reflect the deduction of taxes that a shareholder would pay on fund distributions or the redemption of fund shares.
Cumulative Total Returns
|
Periods ended November 30, 2002 |
|
Past 1 |
Life of |
|
Fidelity Adv Aggressive Growth - CL T |
|
-20.22% |
-35.63% |
|
Fidelity Adv Aggressive Growth - CL T |
|
-23.02% |
-37.88% |
|
Russell Midcap Growth |
|
-19.80% |
-43.46% |
|
Mid-Cap Funds Average |
|
-15.21% |
n/a * |
|
Mid-Cap Growth Funds Average |
|
-20.15% |
n/a * |
Cumulative total returns show Class T's performance in percentage terms over a set period - in this case, one year or since the fund started on November 13, 2000. For example, if you had invested $1,000 in a fund that had a 5% return over the past year, the value of your investment would be $1,050. You can compare Class T's returns to the performance of the Russell Midcap Growth Index - a market capitalization-weighted index of medium capitalization growth-oriented stocks of U.S. domiciled corporations. You can also compare Class T's performance to the performance of mutual funds tracked by Lipper Inc. and grouped by similar objectives and by portfolio characteristics and capitalization. These benchmarks include reinvested dividends and capital gains, if any.
Average Annual Total Returns
|
Periods ended November 30, 2002 |
|
|
Past 1 |
Life of |
|
Fidelity Adv Aggressive Growth - CL T |
|
|
-20.22% |
-19.36% |
|
Fidelity Adv Aggressive Growth - CL T |
|
|
-23.02% |
-20.75% |
|
Russell Midcap Growth |
|
|
-19.80% |
-24.31% |
|
Mid-Cap Funds Average |
|
|
-15.21% |
n/a * |
|
Mid-Cap Growth Funds Average |
|
|
-20.15% |
n/a * |
* Not available
Annual Report
Fidelity Advisor Aggressive Growth Fund - Class T
Performance - continued
Average annual total returns take Class T shares' cumulative return and show you what would have happened if Class T shares had performed at a constant rate each year.
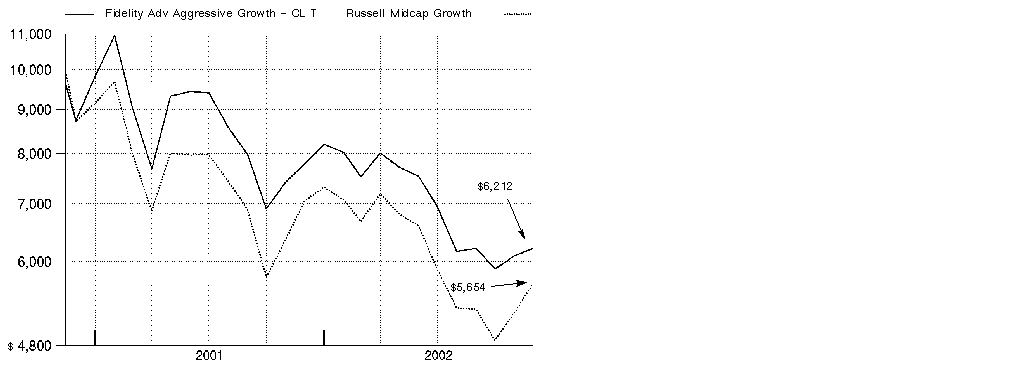
$10,000 Over Life of Fund
Let's say hypothetically that $10,000 was invested in Fidelity Advisor Aggressive Growth Fund - Class T on November 13, 2000, when the fund started, and the current 3.50% sales charge was paid. The chart shows what the value of your investment would have been, and also shows how the Russell Midcap Growth Index did over the same period.
3
Understanding Performance
How a fund did yesterday is no guarantee of how it will do tomorrow. The stock market, for example, has a history of long-term growth and short-term volatility. In turn, the share price and return of a fund that invests in stocks will vary. When you sell your shares, they could be worth more or less than what you paid for them.
Annual Report
Fidelity Advisor Aggressive Growth Fund - Class B
Performance: The Bottom Line
There are several ways to evaluate historical performance. You can look at cumulative total returns, average annual returns or the growth of a hypothetical investment. Total return reflects the change in the value of an investment, assuming reinvestment of the class' dividend income and capital gains (the profits earned upon the sale of securities that have grown in value). Class B shares' contingent deferred sales charges included in the past one year and the life of fund total returns are 5% and 3%, respectively. If Fidelity had not reimbursed certain class expenses, the one year and life of fund total returns would have been lower. The $10,000 table and the fund's returns do not reflect the deduction of taxes that a shareholder would pay on fund distributions or the redemption of fund shares.
Cumulative Total Returns
|
Periods ended November 30, 2002 |
|
Past 1 |
Life of |
|
|
Fidelity Adv Aggressive Growth - CL B |
|
-20.57% |
-36.23% |
|
|
Fidelity Adv Aggressive Growth - CL B |
|
-24.54% |
-38.14% |
|
|
Russell Midcap Growth |
|
-19.80% |
-43.46% |
|
|
Mid-Cap Funds Average |
|
-15.21% |
n/a * |
|
|
Mid-Cap Growth Funds Average |
|
-20.15% |
n/a * |
|
Cumulative total returns show Class B's performance in percentage terms over a set period - in this case, one year or since the fund started on November 13, 2000. For example, if you had invested $1,000 in a fund that had a 5% return over the past year, the value of your investment would be $1,050. You can compare Class B's returns to the performance of the Russell Midcap Growth Index - a market capitalization-weighted index of medium capitalization growth-oriented stocks of U.S. domiciled corporations. You can also compare Class B's performance to the performance of mutual funds tracked by Lipper Inc. and grouped by similar objectives and by portfolio characteristics and capitalization. These benchmarks include reinvested dividends and capital gains, if any.
Average Annual Total Returns
|
Periods ended November 30, 2002 |
|
|
Past 1 |
Life of |
|
Fidelity Adv Aggressive Growth - CL B |
|
|
-20.57% |
-19.73% |
|
Fidelity Adv Aggressive Growth - CL B |
|
|
-24.54% |
-20.92% |
|
Russell Midcap Growth |
|
|
-19.80% |
-24.31% |
|
Mid-Cap Funds Average |
|
|
-15.21% |
n/a * |
|
Mid-Cap Growth Funds Average |
|
|
-20.15% |
n/a * |
* Not available
Annual Report
Fidelity Advisor Aggressive Growth Fund - Class B
Performance - continued
Average annual total returns take Class B shares' cumulative return and show you what would have happened if Class B shares had performed at a constant rate each year.
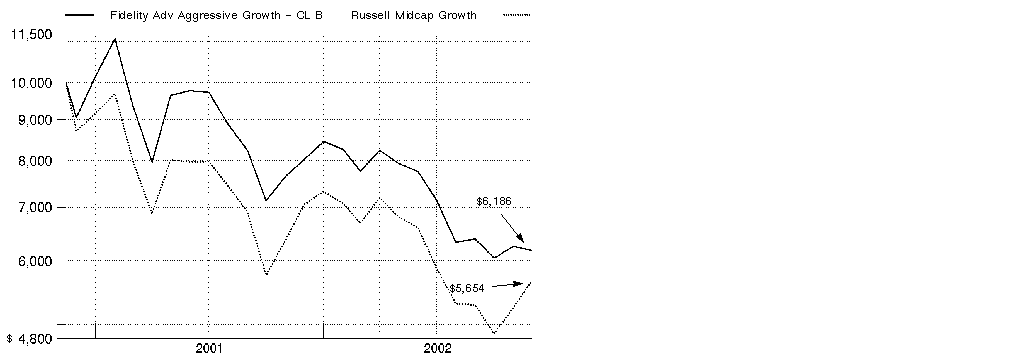
$10,000 Over Life of Fund
Let's say hypothetically that $10,000 was invested in Fidelity Advisor Aggressive Growth Fund - Class B on November 13, 2000, when the fund started, including the effect of the contingent deferred sales charge. The chart shows what the value of your investment would have been, and also shows how the Russell Midcap Growth Index did over the same period.
3
Understanding Performance
How a fund did yesterday is no guarantee of how it will do tomorrow. The stock market, for example, has a history of long-term growth and short-term volatility. In turn, the share price and return of a fund that invests in stocks will vary. When you sell your shares, they could be worth more or less than what you paid for them.
Annual Report
Fidelity Advisor Aggressive Growth Fund - Class C
Performance: The Bottom Line
There are several ways to evaluate historical performance. You can look at cumulative total returns, average annual returns or the growth of a hypothetical investment. Total return reflects the change in the value of an investment, assuming reinvestment of the class' dividend income and capital gains (the profits earned upon the sale of securities that have grown in value). Class C shares' contingent deferred sales charges included in the past one year and the life of fund total returns are 1%, and 0%, respectively. If Fidelity had not reimbursed certain class expenses, the one year and life of fund total returns would have been lower. The $10,000 table and the fund's returns do not reflect the deduction of taxes that a shareholder would pay on fund distributions or the redemption of fund shares.
Cumulative Total Returns
|
Periods ended November 30, 2002 |
|
Past 1 |
Life of |
|
Fidelity Adv Aggressive Growth - CL C |
|
-20.55% |
-36.13% |
|
Fidelity Adv Aggressive Growth - CL C |
|
-21.34% |
-36.13% |
|
Russell Midcap Growth |
|
-19.80% |
-43.46% |
|
Mid-Cap Funds Average |
|
-15.21% |
n/a * |
|
Mid-Cap Growth Funds Average |
|
-20.15% |
n/a * |
Cumulative total returns show Class C's performance in percentage terms over a set period - in this case, one year or since the fund started on November 13, 2000. For example, if you had invested $1,000 in a fund that had a 5% return over the past year, the value of your investment would be $1,050. You can compare Class C's returns to the performance of the Russell Midcap Growth Index - a market capitalization-weighted index of medium capitalization growth-oriented stocks of U.S. domiciled corporations. You can also compare Class C's performance to the performance of mutual funds tracked by Lipper Inc. and grouped by similar objectives and by portfolio characteristics and capitalization. These benchmarks include reinvested dividends and capital gains, if any.
Average Annual Total Returns
|
Periods ended November 30, 2002 |
|
Past 1 |
Life of |
|
Fidelity Adv Aggressive Growth - CL C |
|
-20.55% |
-19.67% |
|
Fidelity Adv Aggressive Growth - CL C |
|
-21.34% |
-19.67% |
|
Russell Midcap Growth |
|
-19.80% |
-24.31% |
|
Mid-Cap Funds Average |
|
-15.21% |
n/a * |
|
Mid-Cap Growth Funds Average |
|
-20.15% |
n/a * |
* Not available
Annual Report
Fidelity Advisor Aggressive Growth Fund - Class C
Performance - continued
Average annual total returns take Class C shares' cumulative return and show you what would have happened if Class C shares had performed at a constant rate each year.
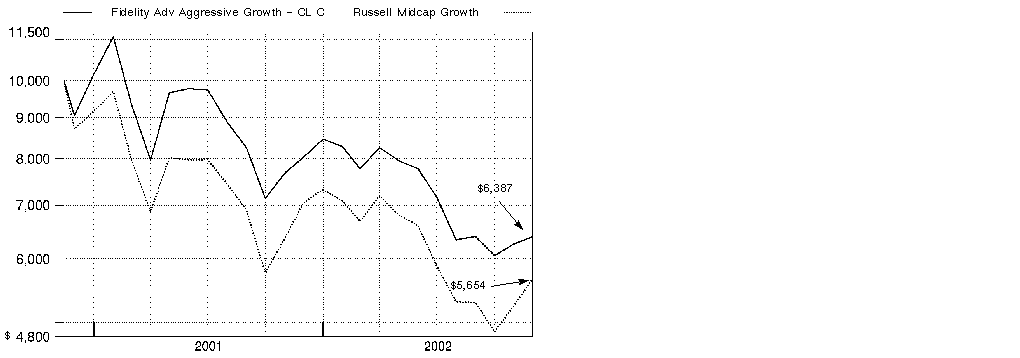
$10,000 Over Life of Fund
Let's say hypothetically that $10,000 was invested in Fidelity Advisor Aggressive Growth Fund - Class C on November 13, 2000, when the fund started. The chart shows what the value of your investment would have been, and also shows how the Russell Midcap Growth Index did over the same period.
3
Understanding Performance
How a fund did yesterday is no guarantee of how it will do tomorrow. The stock market, for example, has a history of long-term growth and short-term volatility. In turn, the share price and return of a fund that invests in stocks will vary. When you sell your shares, they could be worth more or less than what you paid for them.
Annual Report
Fund Talk: The Manager's Overview
Market Recap
U.S. equity markets enjoyed an eight-week winning streak to close the 12-month period ending November 30, 2002. Ironically, the one-year period ended just as it began - with two relatively strong months assisted by an easing of interest rates by the Federal Reserve Board. The eight months in between, however, were a nightmare. A plethora of corporate accounting scandals, concerns about the possibility of a double-dip recession, and rampant fears of further terrorist attacks and a new war with Iraq ravaged a market that was still contending with the "irrational exuberance" of the late 1990s. By early October 2002, most major equity benchmarks found themselves at five- to six-year lows. Somehow, throughout all of this, American consumers remained stalwart, and their spending helped alleviate some of the burden on the U.S. economy. As signs of economic growth began to appear in the fall, along with the 12th straight cut in interest rates by the Fed, the stock market ended the period with promising upward momentum. For the year overall, however, the large-cap oriented Standard & Poor's 500SM Index dropped 16.51%; the technology- and telecommunications-dominated NASDAQ Composite® Index retreated 23.12%; and the Dow Jones Industrial AverageSM - the venerable proxy of blue-chip stock performance - slid 7.82%.
(Portfolio Manager photograph)
An interview with Rajiv Kaul, Portfolio Manager of Fidelity Advisor Aggressive Growth Fund
Q. How did the fund perform, Rajiv?
A. It performed about in line with its benchmark index but trailed its peers in a weak market environment. For the 12 months ending November 30, 2002, the fund's Class A, Class T, Class B and Class C shares returned -19.93%, -20.22%, -20.57%, and -20.55%, respectively. During the same period, the Russell Midcap Growth Index fell 19.80%, while the mid-cap funds average tracked by Lipper Inc. posted a loss of 15.21%.
Annual Report
Fund Talk: The Manager's Overview - continued
Q. What factors affected the fund's performance versus the index and Lipper average?
A. Due to the challenging environment, I positioned the fund defensively, with a large underweighting in technology - especially semiconductor firms, which tend to experience very cyclical demand that is tied to overall economic activity. This strategy worked well until the end of the period, when a rally that began in mid-October erased the fund's performance advantage over the index. Technology stocks outperformed during this rally, and the more defensive parts of the market lagged, which hurt us. For the period overall, though, my technology stock selection significantly helped the fund's relative performance. On the other hand, an overweighting in health care was a negative factor. Moreover, a number of my picks in hospital management, health insurance and medical equipment detracted from our returns compared with the index. Versus our Lipper peer group, we suffered from the outperformance of value over growth during the period under review.
Q. Health care was your largest overweighting. What did you like about the sector?
A. Some areas of health care - the services segment and some equipment companies, for example - offer an attractive mix of solid growth potential that is also relatively reliable. On the other hand, pharmaceutical and biotechnology firms are driven by product cycles. In those industries, I felt that Fidelity's research capabilities gave me an edge in helping me assess the commercial impact of new discoveries and the latest clinical results.
Q. Which stocks helped the fund's performance?
A. Redback Networks and Sonus Networks, both telecommunications infrastructure stocks that I mentioned in the report to shareholders six months ago, were positive contributors during the period. I took advantage of the tech rally at the end of 2001 to liquidate both positions after solid gains. Wilson Greatbatch, a maker of components for pacemakers and other cardiovascular devices, was another holding that did well, as the company beat earnings estimates and enjoyed strong demand from a key customer. On a relative basis, substantially underweighting index components VeriSign and Sanmina, which performed poorly, did a lot for our performance.
Q. What were the disappointments?
A. Salix Pharmaceuticals, the fund's biggest holding on average during the period, was the largest detractor. In addition to being hurt by negative publicity about other pharmaceutical and biotech companies, Salix suffered from the delayed launch of Colazol, its product for treating gastrointestinal illness. Although I still liked the long-term prospects for Salix, I sold a large chunk of our holdings late in the period due to the stock's extreme volatility. Another detractor was hospital management stock Tenet Healthcare. After doing well for most of the period, Tenet's stock plunged in October and November due to charges that the company overstated its Medicare claims to the government. Finally, despite the fund's underweighting in semiconductors, Vitesse Semiconductor was one chip company I felt good about. Sluggish demand and missed earnings estimates sidetracked the stock, however. At the end of the period, the fund had no positions in Vitesse Semiconductor, Wilson Greatbatch, VeriSign or Sanmina.
Annual Report
Q. What's your outlook, Rajiv?
A. I'll continue to look for more convincing signs of improvement in the economy before I commit the fund more heavily to the technology sector. Meanwhile, I'll concentrate on solid bottom-up analysis, trying to identify the best companies in each industry, especially those poised to benefit from favorable new product cycles or some other potentially powerful catalyst. I'll also keep a sharp eye on valuations. Tech valuations generally are not as high as they were at the height of the late-1990s bull market, but still are much higher than I would prefer to see them at this stage of the game. Of course, stronger corporate earnings could make the current level of share prices seem more attractive, but I don't see a substantial earnings rebound on the near-term horizon.
The views expressed in this report reflect those of the portfolio manager only through the end of the period of the report as stated on the cover and do not necessarily represent the views of Fidelity or any other person in the Fidelity organization. Any such views are subject to change at any time based upon market or other conditions and Fidelity disclaims any responsibility to update such views. These views may not be relied on as investment advice and, because investment decisions for a Fidelity fund are based on numerous factors, may not be relied on as an indication of trading intent on behalf of any Fidelity fund.
Fund Facts
Goal: seeks capital appreciation by normally investing primarily in common stocks
Start date: November 13, 2000
Size: as of November 30, 2002, more than $26 million
Manager: Rajiv Kaul, since 2001; joined Fidelity in 1996
3Rajiv Kaul on growth prospects for technology:
"As I look around at various segments of technology, I'm not terribly encouraged by what I see, although there are some brighter spots, including technology services, Internet gaming, wireless LANs - or local area networks - and mobile data services. For example, spending for gaming tends to be relatively independent of overall economic conditions. Instead, it's driven mostly by product cycles - whenever a hot new product appears, aficionados want to have it.
"On the other hand, the personal computer industry, which accounts for a good portion of the dollars spent on technology, is in the throes of an extended slump. A lot of consumers and corporations bought new computers in preparation for Y2K. The PC cycle used to last about three years, so some analysts have been expecting a new round of purchases to begin very soon. However, buying cycles are never ironclad - they are shaped to some extent by external circumstances. Right now, we've got two factors working against a new wave of PC buying. First, the economy is soft, with little apparent prospect of fresh demand. Second, there's no killer technology that might prompt people to upgrade. The result could be a more lengthy PC cycle than many investors anticipate."
Annual Report
Investment Changes
|
Top Ten Stocks as of November 30, 2002 |
||
|
|
% of fund's |
% of fund's net assets |
|
Boston Scientific Corp. |
2.3 |
0.6 |
|
Newmont Mining Corp. Holding Co. |
1.9 |
0.3 |
|
Taiwan Semiconductor Manufacturing Co. Ltd. sponsored ADR |
1.9 |
0.0 |
|
Colgate-Palmolive Co. |
1.5 |
0.0 |
|
Fox Entertainment Group, Inc. Class A |
1.4 |
0.3 |
|
UnitedHealth Group, Inc. |
1.4 |
0.3 |
|
Electronic Arts, Inc. |
1.4 |
0.7 |
|
Smith International, Inc. |
1.3 |
1.2 |
|
Weatherford International Ltd. |
1.3 |
1.2 |
|
Anthem, Inc. |
1.2 |
1.7 |
|
|
15.6 |
|
|
Top Five Market Sectors as of November 30, 2002 |
||
|
|
% of fund's |
% of fund's net assets |
|
Health Care |
22.5 |
27.8 |
|
Consumer Discretionary |
19.2 |
21.1 |
|
Information Technology |
11.6 |
22.7 |
|
Industrials |
8.6 |
11.8 |
|
Consumer Staples |
7.4 |
3.7 |
|
Asset Allocation (% of fund's net assets) |
|||||||
|
As of November 30, 2002 * |
As of May 31, 2002 ** |
||||||
 |
Stocks 82.4% |
|
|
Stocks 103.3% |
|
||
 |
Convertible |
|
|
Convertible |
|
||
 |
Short-Term |
|
|
Short-Term |
|
||
|
* Foreign investments |
4.8% |
|
** Foreign investments |
13.2% |
|
||

A Short-term investments and net other assets are not included in the pie chart.
Annual Report
Investments November 30, 2002
Showing Percentage of Net Assets
|
Common Stocks - 82.4% |
|||
|
Shares |
Value (Note 1) |
||
|
CONSUMER DISCRETIONARY - 19.2% |
|||
|
Auto Components - 0.3% |
|||
|
Superior Industries International, Inc. |
1,600 |
$ 67,408 |
|
|
Automobiles - 0.7% |
|||
|
Thor Industries, Inc. |
2,400 |
91,680 |
|
|
Winnebago Industries, Inc. |
1,900 |
93,936 |
|
|
|
185,616 |
||
|
Hotels, Restaurants & Leisure - 3.7% |
|||
|
Boyd Gaming Corp. (a) |
400 |
5,700 |
|
|
Brinker International, Inc. (a) |
2,400 |
71,520 |
|
|
Darden Restaurants, Inc. |
2,400 |
51,912 |
|
|
Harrah's Entertainment, Inc. (a) |
4,060 |
162,400 |
|
|
International Game Technology (a) |
2,140 |
164,994 |
|
|
MGM Mirage, Inc. (a) |
160 |
5,416 |
|
|
Outback Steakhouse, Inc. |
1,800 |
63,900 |
|
|
Starbucks Corp. (a) |
11,840 |
257,402 |
|
|
The Cheesecake Factory, Inc. (a) |
1,700 |
60,622 |
|
|
Wendy's International, Inc. |
2,600 |
72,618 |
|
|
Yum! Brands, Inc. (a) |
2,800 |
66,948 |
|
|
|
983,432 |
||
|
Household Durables - 1.5% |
|||
|
Black & Decker Corp. |
2,190 |
94,104 |
|
|
Furniture Brands International, Inc. (a) |
1,000 |
28,000 |
|
|
Harman International Industries, Inc. |
600 |
37,440 |
|
|
Maytag Corp. |
5,910 |
182,678 |
|
|
Mohawk Industries, Inc. (a) |
700 |
43,127 |
|
|
The Stanley Works |
700 |
25,158 |
|
|
|
410,507 |
||
|
Internet & Catalog Retail - 1.0% |
|||
|
Amazon.com, Inc. (a) |
11,380 |
265,723 |
|
|
USA Interactive warrants 2/4/09 (a) |
211 |
2,268 |
|
|
|
267,991 |
||
|
Leisure Equipment & Products - 0.5% |
|||
|
Mattel, Inc. |
5,900 |
121,658 |
|
|
Media - 4.5% |
|||
|
E.W. Scripps Co. Class A |
1,700 |
134,776 |
|
|
Entercom Communications Corp. Class A (a) |
1,900 |
102,904 |
|
|
Fox Entertainment Group, Inc. Class A (a) |
14,500 |
386,570 |
|
|
Gannett Co., Inc. |
400 |
28,500 |
|
|
Getty Images, Inc. (a) |
3,400 |
101,558 |
|
|
Knight-Ridder, Inc. |
500 |
31,355 |
|
|
Common Stocks - continued |
|||
|
Shares |
Value (Note 1) |
||
|
CONSUMER DISCRETIONARY - continued |
|||
|
Media - continued |
|||
|
Lamar Advertising Co. Class A (a) |
4,200 |
$ 143,346 |
|
|
The New York Times Co. Class A |
1,500 |
72,060 |
|
|
Viacom, Inc. Class A (a) |
400 |
18,800 |
|
|
Westwood One, Inc. (a) |
4,600 |
178,802 |
|
|
|
1,198,671 |
||
|
Multiline Retail - 0.7% |
|||
|
Big Lots, Inc. (a) |
2,310 |
29,337 |
|
|
BJ's Wholesale Club, Inc. (a) |
1,670 |
32,081 |
|
|
Dollar General Corp. |
3,800 |
50,274 |
|
|
Dollar Tree Stores, Inc. (a) |
2,800 |
82,180 |
|
|
|
193,872 |
||
|
Specialty Retail - 6.3% |
|||
|
Aeropostale, Inc. |
3,700 |
53,650 |
|
|
AutoZone, Inc. (a) |
2,890 |
236,113 |
|
|
Bed Bath & Beyond, Inc. (a) |
4,850 |
168,247 |
|
|
Chico's FAS, Inc. (a) |
5,000 |
112,400 |
|
|
Christopher & Banks Corp. (a) |
1,300 |
35,425 |
|
|
Circuit City Stores, Inc. - Circuit City Group |
17,800 |
172,304 |
|
|
Gap, Inc. |
4,600 |
73,094 |
|
|
Gart Sports Co. (a) |
3,400 |
89,587 |
|
|
Hot Topic, Inc. (a) |
6,270 |
151,665 |
|
|
Limited Brands, Inc. |
1,600 |
27,216 |
|
|
Lowe's Companies, Inc. |
430 |
17,845 |
|
|
Monro Muffler Brake, Inc. (a) |
4,000 |
71,680 |
|
|
PETCO Animal Supplies, Inc. |
1,000 |
25,271 |
|
|
PETsMART, Inc. (a) |
5,100 |
94,095 |
|
|
Rent-A-Center, Inc. (a) |
500 |
24,845 |
|
|
Staples, Inc. (a) |
3,180 |
61,374 |
|
|
Talbots, Inc. |
1,300 |
39,442 |
|
|
TJX Companies, Inc. |
1,400 |
27,398 |
|
|
Too, Inc. (a) |
900 |
26,415 |
|
|
Wet Seal, Inc. Class A (a) |
5,200 |
60,008 |
|
|
Williams-Sonoma, Inc. (a) |
3,460 |
91,136 |
|
|
|
1,659,210 |
||
|
TOTAL CONSUMER DISCRETIONARY |
5,088,365 |
||
|
CONSUMER STAPLES - 7.4% |
|||
|
Beverages - 1.0% |
|||
|
Coca-Cola Enterprises, Inc. |
3,600 |
76,644 |
|
|
Common Stocks - continued |
|||
|
Shares |
Value (Note 1) |
||
|
CONSUMER STAPLES - continued |
|||
|
Beverages - continued |
|||
|
Constellation Brands, Inc. Class A (a) |
1,000 |
$ 23,520 |
|
|
Pepsi Bottling Group, Inc. |
4,620 |
132,686 |
|
|
PepsiCo, Inc. |
700 |
29,736 |
|
|
|
262,586 |
||
|
Food & Drug Retailing - 1.2% |
|||
|
CVS Corp. |
6,100 |
163,968 |
|
|
Nash-Finch Co. |
500 |
4,221 |
|
|
Performance Food Group Co. (a) |
800 |
28,160 |
|
|
Whole Foods Market, Inc. (a) |
2,200 |
116,930 |
|
|
|
313,279 |
||
|
Food Products - 2.5% |
|||
|
Dean Foods Co. (a) |
4,010 |
148,972 |
|
|
Dreyer's Grand Ice Cream, Inc. |
1,100 |
77,132 |
|
|
Fresh Del Monte Produce, Inc. |
1,000 |
22,900 |
|
|
Hershey Foods Corp. |
1,640 |
105,600 |
|
|
Kellogg Co. |
2,450 |
81,757 |
|
|
Kraft Foods, Inc. Class A |
1,700 |
63,852 |
|
|
McCormick & Co., Inc. (non-vtg.) |
1,800 |
42,822 |
|
|
Wm. Wrigley Jr. Co. |
2,190 |
117,800 |
|
|
|
660,835 |
||
|
Household Products - 1.8% |
|||
|
Clorox Co. |
2,100 |
92,064 |
|
|
Colgate-Palmolive Co. |
7,900 |
405,981 |
|
|
|
498,045 |
||
|
Personal Products - 0.5% |
|||
|
Alberto-Culver Co.: |
|
|
|
|
Class A |
700 |
32,830 |
|
|
Class B |
2,000 |
99,100 |
|
|
|
131,930 |
||
|
Tobacco - 0.4% |
|||
|
RJ Reynolds Tobacco Holdings, Inc. |
410 |
15,826 |
|
|
UST, Inc. |
2,640 |
85,008 |
|
|
|
100,834 |
||
|
TOTAL CONSUMER STAPLES |
1,967,509 |
||
|
ENERGY - 6.1% |
|||
|
Energy Equipment & Services - 5.1% |
|||
|
BJ Services Co. (a) |
3,800 |
127,110 |
|
|
Common Stocks - continued |
|||
|
Shares |
Value (Note 1) |
||
|
ENERGY - continued |
|||
|
Energy Equipment & Services - continued |
|||
|
Carbo Ceramics, Inc. |
1,200 |
$ 39,972 |
|
|
Cooper Cameron Corp. (a) |
2,850 |
146,091 |
|
|
ENSCO International, Inc. |
2,310 |
64,634 |
|
|
Input/Output, Inc. (a) |
2,560 |
13,440 |
|
|
Maverick Tube Corp. (a) |
1,200 |
15,396 |
|
|
Nabors Industries Ltd. (a) |
1,560 |
55,224 |
|
|
Noble Corp. (a) |
2,870 |
97,437 |
|
|
Patterson-UTI Energy, Inc. (a) |
2,550 |
73,976 |
|
|
Rowan Companies, Inc. |
2,000 |
42,600 |
|
|
Smith International, Inc. (a) |
10,280 |
349,520 |
|
|
Weatherford International Ltd. (a) |
8,280 |
334,015 |
|
|
|
1,359,415 |
||
|
Oil & Gas - 1.0% |
|||
|
Burlington Resources, Inc. |
2,560 |
107,827 |
|
|
EOG Resources, Inc. |
1,100 |
42,647 |
|
|
Murphy Oil Corp. |
880 |
75,451 |
|
|
Teekay Shipping Corp. |
800 |
29,864 |
|
|
|
255,789 |
||
|
TOTAL ENERGY |
1,615,204 |
||
|
FINANCIALS - 3.1% |
|||
|
Banks - 0.7% |
|||
|
Commerce Bancorp, Inc., New Jersey |
600 |
27,450 |
|
|
Fifth Third Bancorp |
1,000 |
56,000 |
|
|
New York Community Bancorp, Inc. |
1,200 |
33,456 |
|
|
North Fork Bancorp, Inc. |
1,100 |
38,291 |
|
|
Popular, Inc. |
400 |
13,452 |
|
|
TCF Financial Corp. |
300 |
12,795 |
|
|
|
181,444 |
||
|
Diversified Financials - 2.2% |
|||
|
Doral Financial Corp. |
500 |
13,475 |
|
|
Federated Investors, Inc. Class B (non-vtg.) |
2,980 |
80,609 |
|
|
Investment Technology Group, Inc. (a) |
1,500 |
44,205 |
|
|
Investors Financial Services Corp. |
2,100 |
73,458 |
|
|
LaBranche & Co., Inc. (a) |
2,000 |
60,700 |
|
|
Moody's Corp. |
3,700 |
162,874 |
|
|
SLM Corp. |
1,100 |
107,503 |
|
|
Waddell & Reed Financial, Inc. Class A |
2,400 |
49,368 |
|
|
|
592,192 |
||
|
Common Stocks - continued |
|||
|
Shares |
Value (Note 1) |
||
|
FINANCIALS - continued |
|||
|
Insurance - 0.1% |
|||
|
RenaissanceRe Holdings Ltd. |
300 |
$ 12,225 |
|
|
Real Estate - 0.1% |
|||
|
Catellus Development Corp. (a) |
1,400 |
25,564 |
|
|
TOTAL FINANCIALS |
811,425 |
||
|
HEALTH CARE - 22.5% |
|||
|
Biotechnology - 3.5% |
|||
|
Biogen, Inc. (a) |
4,000 |
176,600 |
|
|
BioMarin Pharmaceutical, Inc. (a) |
5,500 |
46,365 |
|
|
Cephalon, Inc. (a) |
1,900 |
104,120 |
|
|
Genzyme Corp. - General Division (a) |
9,100 |
298,480 |
|
|
Gilead Sciences, Inc. (a) |
2,700 |
106,596 |
|
|
IDEC Pharmaceuticals Corp. (a) |
3,660 |
120,414 |
|
|
Neurocrine Biosciences, Inc. (a) |
500 |
23,040 |
|
|
QLT, Inc. (a) |
3,400 |
34,011 |
|
|
Sangstat Medical Corp. (a) |
1,970 |
28,762 |
|
|
|
938,388 |
||
|
Health Care Equipment & Supplies - 8.0% |
|||
|
Advanced Neuromodulation Systems, Inc. (a) |
1,180 |
35,683 |
|
|
Beckman Coulter, Inc. |
700 |
20,692 |
|
|
Biomet, Inc. |
11,260 |
309,650 |
|
|
Boston Scientific Corp. (a) |
14,450 |
606,894 |
|
|
C.R. Bard, Inc. |
1,200 |
66,600 |
|
|
DENTSPLY International, Inc. |
3,980 |
133,529 |
|
|
Fisher Scientific International, Inc. (a) |
1,800 |
53,928 |
|
|
Kensey Nash Corp. (a) |
3,900 |
73,164 |
|
|
Medical Action Industries, Inc. (a) |
23,200 |
249,168 |
|
|
Resmed, Inc. (a) |
2,600 |
84,266 |
|
|
St. Jude Medical, Inc. (a) |
6,340 |
220,759 |
|
|
Stryker Corp. |
1,730 |
107,001 |
|
|
Zimmer Holdings, Inc. (a) |
4,200 |
158,088 |
|
|
|
2,119,422 |
||
|
Health Care Providers & Services - 7.6% |
|||
|
Anthem, Inc. (a) |
5,346 |
316,751 |
|
|
Caremark Rx, Inc. (a) |
7,000 |
123,620 |
|
|
Community Health Systems, Inc. (a) |
7,400 |
152,070 |
|
|
IMS Health, Inc. |
7,200 |
119,520 |
|
|
Lincare Holdings, Inc. (a) |
1,600 |
52,352 |
|
|
McKesson Corp. |
6,610 |
171,331 |
|
|
Common Stocks - continued |
|||
|
Shares |
Value (Note 1) |
||
|
HEALTH CARE - continued |
|||
|
Health Care Providers & Services - continued |
|||
|
Oxford Health Plans, Inc. (a) |
1,500 |
$ 54,780 |
|
|
Renal Care Group, Inc. (a) |
1,200 |
37,584 |
|
|
Tenet Healthcare Corp. (a) |
5,700 |
105,165 |
|
|
Triad Hospitals, Inc. (a) |
6,200 |
186,930 |
|
|
UnitedHealth Group, Inc. |
4,700 |
382,815 |
|
|
Universal Health Services, Inc. Class B (a) |
1,020 |
45,645 |
|
|
Wellpoint Health Networks, Inc. (a) |
4,220 |
277,803 |
|
|
|
2,026,366 |
||
|
Pharmaceuticals - 3.4% |
|||
|
Abbott Laboratories |
5,700 |
249,546 |
|
|
Atrix Laboratories, Inc. (a) |
5,000 |
91,400 |
|
|
Johnson & Johnson |
600 |
34,212 |
|
|
Medicines Co. (a) |
3,600 |
60,408 |
|
|
Merck & Co., Inc. |
1,000 |
59,410 |
|
|
Salix Pharmaceuticals Ltd. (a) |
15,500 |
144,305 |
|
|
Schering-Plough Corp. |
11,600 |
262,856 |
|
|
|
902,137 |
||
|
TOTAL HEALTH CARE |
5,986,313 |
||
|
INDUSTRIALS - 8.6% |
|||
|
Aerospace & Defense - 0.4% |
|||
|
Mercury Computer Systems, Inc. (a) |
1,200 |
37,476 |
|
|
Northrop Grumman Corp. |
710 |
68,806 |
|
|
|
106,282 |
||
|
Airlines - 0.0% |
|||
|
Northwest Airlines Corp. (a) |
900 |
7,578 |
|
|
Building Products - 0.7% |
|||
|
American Standard Companies, Inc. (a) |
1,790 |
133,319 |
|
|
York International Corp. |
2,100 |
52,668 |
|
|
|
185,987 |
||
|
Commercial Services & Supplies - 5.9% |
|||
|
Apollo Group, Inc. Class A (a) |
4,780 |
197,175 |
|
|
Avery Dennison Corp. |
2,200 |
141,768 |
|
|
Career Education Corp. (a) |
1,000 |
38,910 |
|
|
Cendant Corp. (a) |
5,910 |
74,348 |
|
|
ChoicePoint, Inc. (a) |
1,826 |
68,621 |
|
|
Cintas Corp. |
1,200 |
60,564 |
|
|
Concord EFS, Inc. (a) |
8,600 |
129,000 |
|
|
Common Stocks - continued |
|||
|
Shares |
Value (Note 1) |
||
|
INDUSTRIALS - continued |
|||
|
Commercial Services & Supplies - continued |
|||
|
Education Management Corp. (a) |
700 |
$ 27,048 |
|
|
Equifax, Inc. |
2,910 |
70,713 |
|
|
First Data Corp. |
3,280 |
113,619 |
|
|
H&R Block, Inc. |
5,200 |
199,316 |
|
|
Herman Miller, Inc. |
2,700 |
53,835 |
|
|
Manpower, Inc. |
1,100 |
40,997 |
|
|
Paychex, Inc. |
1,040 |
30,368 |
|
|
Robert Half International, Inc. (a) |
7,140 |
140,301 |
|
|
Sabre Holdings Corp. Class A (a) |
6,560 |
142,746 |
|
|
Total System Services, Inc. |
1,700 |
22,950 |
|
|
|
1,552,279 |
||
|
Industrial Conglomerates - 0.2% |
|||
|
3M Co. |
500 |
64,925 |
|
|
Machinery - 0.8% |
|||
|
Danaher Corp. |
2,370 |
148,931 |
|
|
Pall Corp. |
700 |
13,356 |
|
|
SPX Corp. (a) |
1,000 |
47,200 |
|
|
|
209,487 |
||
|
Trading Companies & Distributors - 0.6% |
|||
|
Fastenal Co. |
4,370 |
156,140 |
|
|
TOTAL INDUSTRIALS |
2,282,678 |
||
|
INFORMATION TECHNOLOGY - 11.6% |
|||
|
Communications Equipment - 1.5% |
|||
|
Alcatel SA sponsored ADR |
19,000 |
108,490 |
|
|
Lucent Technologies, Inc. (a) |
17,000 |
29,750 |
|
|
Nokia Corp. sponsored ADR |
13,500 |
259,335 |
|
|
|
397,575 |
||
|
Computers & Peripherals - 1.3% |
|||
|
Dell Computer Corp. (a) |
1,900 |
54,283 |
|
|
Lexmark International, Inc. Class A (a) |
4,290 |
283,741 |
|
|
|
338,024 |
||
|
Electronic Equipment & Instruments - 0.2% |
|||
|
Symbol Technologies, Inc. |
1,500 |
15,435 |
|
|
Thermo Electron Corp. |
800 |
15,672 |
|
|
Vishay Intertechnology, Inc. (a) |
800 |
11,304 |
|
|
|
42,411 |
||
|
Common Stocks - continued |
|||
|
Shares |
Value (Note 1) |
||
|
INFORMATION TECHNOLOGY - continued |
|||
|
Internet Software & Services - 0.7% |
|||
|
Yahoo!, Inc. (a) |
10,400 |
$ 190,008 |
|
|
IT Consulting & Services - 1.1% |
|||
|
Affiliated Computer Services, Inc. Class A (a) |
1,400 |
70,000 |
|
|
MPS Group, Inc. (a) |
18,200 |
109,200 |
|
|
SunGard Data Systems, Inc. (a) |
4,900 |
114,513 |
|
|
|
293,713 |
||
|
Semiconductor Equipment & Products - 2.8% |
|||
|
Atmel Corp. (a) |
8,350 |
29,309 |
|
|
Fairchild Semiconductor International, Inc. Class A (a) |
4,200 |
64,302 |
|
|
NVIDIA Corp. (a) |
300 |
5,139 |
|
|
Semtech Corp. (a) |
340 |
5,127 |
|
|
Silicon Laboratories, Inc. (a) |
200 |
5,860 |
|
|
Taiwan Semiconductor Manufacturing Co. Ltd. sponsored ADR (a) |
54,100 |
497,720 |
|
|
United Microelectronics Corp. sponsored ADR (a) |
28,300 |
128,482 |
|
|
|
735,939 |
||
|
Software - 4.0% |
|||
|
Adobe Systems, Inc. |
3,700 |
109,261 |
|
|
BEA Systems, Inc. (a) |
6,400 |
70,650 |
|
|
Citrix Systems, Inc. (a) |
2,400 |
28,200 |
|
|
Concord Communications, Inc. (a) |
9,500 |
116,375 |
|
|
Electronic Arts, Inc. (a) |
5,280 |
358,301 |
|
|
Intuit, Inc. (a) |
1,700 |
91,698 |
|
|
Network Associates, Inc. (a) |
5,400 |
98,550 |
|
|
PeopleSoft, Inc. (a) |
1,200 |
23,568 |
|
|
Rational Software Corp. (a) |
3,800 |
35,150 |
|
|
Siebel Systems, Inc. (a) |
16,200 |
137,862 |
|
|
|
1,069,615 |
||
|
TOTAL INFORMATION TECHNOLOGY |
3,067,285 |
||
|
MATERIALS - 3.1% |
|||
|
Construction Materials - 0.2% |
|||
|
Lafarge North America, Inc. |
1,500 |
48,150 |
|
|
Containers & Packaging - 0.8% |
|||
|
Owens-Illinois, Inc. (a) |
13,650 |
214,305 |
|
|
Metals & Mining - 2.1% |
|||
|
Massey Energy Corp. |
2,300 |
20,355 |
|
|
Common Stocks - continued |
|||
|
Shares |
Value (Note 1) |
||
|
MATERIALS - continued |
|||
|
Metals & Mining - continued |
|||
|
Newmont Mining Corp. Holding Co. |
21,670 |
$ 507,295 |
|
|
Nucor Corp. |
800 |
40,192 |
|
|
|
567,842 |
||
|
TOTAL MATERIALS |
830,297 |
||
|
TELECOMMUNICATION SERVICES - 0.8% |
|||
|
Diversified Telecommunication Services - 0.5% |
|||
|
AT&T Corp. |
2,780 |
77,951 |
|
|
Covad Communications Group, Inc. (a) |
38,000 |
50,920 |
|
|
|
128,871 |
||
|
Wireless Telecommunication Services - 0.3% |
|||
|
KDDI Corp. |
24 |
79,041 |
|
|
TOTAL TELECOMMUNICATION SERVICES |
207,912 |
||
|
TOTAL COMMON STOCKS (Cost $21,129,293) |
21,856,988 |
||
|
Convertible Preferred Stocks - 0.0% |
|||
|
|
|
|
|
|
CONSUMER DISCRETIONARY - 0.0% |
|||
|
Internet & Catalog Retail - 0.0% |
|||
|
USA Interactive Series A, $0.995 |
190 |
8,835 |
|
|
Money Market Funds - 18.0% |
|||
|
Shares |
Value (Note 1) |
||
|
Fidelity Cash Central Fund, 1.47% (b) |
4,780,465 |
$ 4,780,465 |
|
|
TOTAL INVESTMENT PORTFOLIO - 100.4% (Cost $25,921,831) |
26,646,288 |
||
|
NET OTHER ASSETS - (0.4)% |
(103,680) |
||
|
NET ASSETS - 100% |
$ 26,542,608 |
||
|
Legend |
|
(a) Non-income producing |
|
(b) The rate quoted is the annualized seven-day yield of the fund at period end. A complete listing of the fund's holdings as of its most recent fiscal year end is available upon request. |
|
Other Information |
|
Purchases and sales of securities, other than short-term securities, aggregated $142,563,350 and $147,274,785, respectively. |
|
The fund placed a portion of its portfolio transactions with brokerage firms which are affiliates of the investment adviser. The commissions paid to these affiliated firms were $34,780 for the period. |
|
Income Tax Information |
|
At November 30, 2002, the fund had a capital loss carryforward of approximately $16,956,000 of which $10,016,000 and $6,940,000 will expire on November 30, 2009 and 2010, respectively. |
|
The fund intends to elect to defer to its fiscal year ending November 30, 2003 approximately $282,000 of losses recognized during the period November 1, 2002 to November 30, 2002. |
See accompanying notes which are an integral part of the financial statements.
Annual Report
Financial Statements
Statement of Assets and Liabilities
|
|
November 30, 2002 |
|
|
|
|
|
|
Assets |
|
|
|
Investment in securities, at value (cost $25,921,831) - See accompanying schedule |
|
$ 26,646,288 |
|
Receivable for investments sold |
|
23,665 |
|
Receivable for fund shares sold |
|
55,095 |
|
Dividends receivable |
|
6,218 |
|
Interest receivable |
|
6,020 |
|
Receivable from investment adviser for expense reductions |
|
11,344 |
|
Other receivables |
|
14,209 |
|
Total assets |
|
26,762,839 |
|
|
|
|
|
Liabilities |
|
|
|
Payable for investments purchased |
$ 115,168 |
|
|
Payable for fund shares redeemed |
40,808 |
|
|
Accrued management fee |
13,914 |
|
|
Distribution fees payable |
14,958 |
|
|
Other payables and accrued expenses |
35,383 |
|
|
Total liabilities |
|
220,231 |
|
|
|
|
|
Net Assets |
|
$ 26,542,608 |
|
Net Assets consist of: |
|
|
|
Paid in capital |
|
$ 43,262,500 |
|
Accumulated undistributed net realized gain (loss) on investments and foreign currency transactions |
|
(17,444,349) |
|
Net unrealized appreciation (depreciation) on investments and assets and liabilities in foreign currencies |
|
724,457 |
|
Net Assets |
|
$ 26,542,608 |
See accompanying notes which are an integral part of the financial statements.
Annual Report
Financial Statements - continued
Statement of Assets and Liabilities - continued
|
|
November 30, 2002 |
|
|
|
|
|
|
Calculation of Maximum Offering Price |
|
$ 6.47 |
|
|
|
|
|
Maximum offering price per share (100/94.25 of $6.47) |
|
$ 6.86 |
|
Class T: |
|
$ 6.43 |
|
|
|
|
|
Maximum offering price per share (100/96.50 of $6.43) |
|
$ 6.66 |
|
Class B: |
|
$ 6.37 |
|
|
|
|
|
Class C: |
|
$ 6.38 |
|
|
|
|
|
Institutional Class: |
|
$ 6.52 |
A Redemption price per share is equal to net asset value less any applicable contingent deferred sales charge.
See accompanying notes which are an integral part of the financial statements.
Annual Report
Statement of Operations
|
|
Year ended November 30, 2002 |
|
|
|
|
|
|
Investment Income |
|
|
|
Dividends |
|
$ 84,614 |
|
Interest |
|
53,272 |
|
Total income |
|
137,886 |
|
|
|
|
|
Expenses |
|
|
|
Management fee |
$ 204,862 |
|
|
Transfer agent fees |
165,975 |
|
|
Distribution fees |
229,874 |
|
|
Accounting fees and expenses |
61,470 |
|
|
Non-interested trustees' compensation |
115 |
|
|
Custodian fees and expenses |
16,983 |
|
|
Registration fees |
61,109 |
|
|
Audit |
12,871 |
|
|
Legal |
1,716 |
|
|
Miscellaneous |
10,233 |
|
|
Total expenses before reductions |
765,208 |
|
|
Expense reductions |
(148,791) |
616,417 |
|
Net investment income (loss) |
|
(478,531) |
|
Realized and Unrealized Gain (Loss) Net realized gain (loss) on: |
|
|
|
Investment securities |
(6,653,830) |
|
|
Foreign currency transactions |
(1,863) |
|
|
Total net realized gain (loss) |
|
(6,655,693) |
|
Change in net unrealized appreciation (depreciation) on: Investment securities |
|
(175,472) |
|
Net gain (loss) |
|
(6,831,165) |
|
Net increase (decrease) in net assets resulting from operations |
|
$ (7,309,696) |
See accompanying notes which are an integral part of the financial statements.
Annual Report
Financial Statements - continued
Statement of Changes in Net Assets
|
|
Year ended |
Year ended |
|
Increase (Decrease) in Net Assets |
|
|
|
Operations |
|
|
|
Net investment income (loss) |
$ (478,531) |
$ (193,523) |
|
Net realized gain (loss) |
(6,655,693) |
(10,633,685) |
|
Change in net unrealized appreciation (depreciation) |
(175,472) |
1,723,136 |
|
Net increase (decrease) in net assets resulting |
(7,309,696) |
(9,104,072) |
|
Distributions to shareholders from net realized gain |
- |
(22,418) |
|
Share transactions - net increase (decrease) |
(963,336) |
36,177,370 |
|
Total increase (decrease) in net assets |
(8,273,032) |
27,050,880 |
|
|
|
|
|
Net Assets |
|
|
|
Beginning of period |
34,815,640 |
7,764,760 |
|
End of period |
$ 26,542,608 |
$ 34,815,640 |
See accompanying notes which are an integral part of the financial statements.
Annual Report
Financial Highlights - Class A
|
Years ended November 30, |
2002 |
2001 |
2000 F |
|
Selected Per-Share Data |
|
|
|
|
Net asset value, beginning of period |
$ 8.08 |
$ 9.05 |
$ 10.00 |
|
Income from Investment Operations |
|
|
|
|
Net investment income (loss) E |
(.08) |
(.01) |
- |
|
Net realized and unrealized gain (loss) |
(1.53) |
(.95) |
(.95) |
|
Total from investment operations |
(1.61) |
(.96) |
(.95) |
|
Distributions from net realized gain |
- |
(.01) |
- |
|
Net asset value, end of period |
$ 6.47 |
$ 8.08 |
$ 9.05 |
|
Total Return B,C,D |
(19.93)% |
(10.62)% |
(9.50)% |
|
Ratios to Average Net Assets G |
|
|
|
|
Expenses before expense reductions |
2.05% |
2.06% |
31.94% A |
|
Expenses net of voluntary waivers, if any |
1.69% |
1.75% |
1.75% A |
|
Expenses net of all reductions |
1.49% |
1.71% |
1.75% A |
|
Net investment income (loss) |
(1.07)% |
(.14)% |
.99% A |
|
Supplemental Data |
|
|
|
|
Net assets, end of period (000 omitted) |
$ 2,620 |
$ 3,320 |
$ 1,789 |
|
Portfolio turnover rate |
473% |
481% |
139% A |
B Total returns for periods of less than one year are not annualized.
C Total returns would have been lower had certain expenses not been reduced during the periods shown.
D Total returns do not include the effect of the sales charges.
E Calculated based on average shares outstanding during the period.
F For the period November 13, 2000 (commencement of operations) to November 30, 2000.
G Expense ratios reflect operating expenses of the class. Expenses before reductions do not reflect amounts reimbursed by the investment adviser or reductions from directed brokerage or other expense offset arrangements and do not represent the amount paid by the class during periods when reimbursements or reductions occur. Expense ratios before reductions for start-up periods may not be representative of longer-term operating periods. Expenses net of any voluntary waivers reflects expenses after reimbursement by the investment adviser but prior to reductions from directed brokerage or other expense offset arrangements. Expenses net of all reductions represent the net expenses paid by the class.
See accompanying notes which are an integral part of the financial statements.
Annual Report
Financial Highlights - Class T
|
Years ended November 30, |
2002 |
2001 |
2000 F |
|
Selected Per-Share Data |
|
|
|
|
Net asset value, beginning of period |
$ 8.06 |
$ 9.05 |
$ 10.00 |
|
Income from Investment Operations |
|
|
|
|
Net investment income (loss) E |
(.10) |
(.03) |
- |
|
Net realized and unrealized gain (loss) |
(1.53) |
(.95) |
(.95) |
|
Total from investment operations |
(1.63) |
(.98) |
(.95) |
|
Distributions from net realized gain |
- |
(.01) |
- |
|
Net asset value, end of period |
$ 6.43 |
$ 8.06 |
$ 9.05 |
|
Total Return B,C,D |
(20.22)% |
(10.84)% |
(9.50)% |
|
Ratios to Average Net Assets G |
|
|
|
|
Expenses before expense reductions |
2.16% |
2.30% |
32.36% A |
|
Expenses net of voluntary waivers, if any |
1.92% |
2.00% |
2.00% A |
|
Expenses net of all reductions |
1.72% |
1.96% |
2.00% A |
|
Net investment income (loss) |
(1.29)% |
(.39)% |
.74% A |
|
Supplemental Data |
|
|
|
|
Net assets, end of period (000 omitted) |
$ 10,511 |
$ 14,165 |
$ 2,767 |
|
Portfolio turnover rate |
473% |
481% |
139% A |
A Annualized
B Total returns for periods of less than one year are not annualized.
C Total returns would have been lower had certain expenses not been reduced during the periods shown.
D Total returns do not include the effect of the sales charges.
E Calculated based on average shares outstanding during the period.
F For the period November 13, 2000 (commencement of operations) to November 30, 2000.
G Expense ratios reflect operating expenses of the class. Expenses before reductions do not reflect amounts reimbursed by the investment adviser or reductions from directed brokerage or other expense offset arrangements and do not represent the amount paid by the class during periods when reimbursements or reductions occur. Expense ratios before reductions for start-up periods may not be representative of longer-term operating periods. Expenses net of any voluntary waivers reflects expenses after reimbursement by the investment adviser but prior to reductions from directed brokerage or other expense offset arrangements. Expenses net of all reductions represent the net expenses paid by the class.
See accompanying notes which are an integral part of the financial statements.
Annual Report
Financial Highlights - Class B
|
Years ended November 30, |
2002 |
2001 |
2000 F |
|
Selected Per-Share Data |
|
|
|
|
Net asset value, beginning of period |
$ 8.02 |
$ 9.05 |
$ 10.00 |
|
Income from Investment Operations |
|
|
|
|
Net investment income (loss) E |
(.13) |
(.08) |
- |
|
Net realized and unrealized gain (loss) |
(1.52) |
(.94) |
(.95) |
|
Total from investment operations |
(1.65) |
(1.02) |
(.95) |
|
Distributions from net realized gain |
- |
(.01) |
- |
|
Net asset value, end of period |
$ 6.37 |
$ 8.02 |
$ 9.05 |
|
Total Return B,C,D |
(20.57)% |
(11.29)% |
(9.50)% |
|
Ratios to Average Net Assets G |
|
|
|
|
Expenses before expense reductions |
2.73% |
2.86% |
32.87% A |
|
Expenses net of voluntary waivers, if any |
2.43% |
2.50% |
2.50% A |
|
Expenses net of all reductions |
2.23% |
2.46% |
2.50% A |
|
Net investment income (loss) |
(1.81)% |
(.89)% |
.24% A |
|
Supplemental Data |
|
|
|
|
Net assets, end of period (000 omitted) |
$ 6,262 |
$ 8,038 |
$ 1,659 |
|
Portfolio turnover rate |
473% |
481% |
139% A |
A Annualized
B Total returns for periods of less than one year are not annualized.
C Total returns would have been lower had certain expenses not been reduced during the periods shown.
D Total returns do not include the effect of the contingent deferred sales charge.
E Calculated based on average shares outstanding during the period.
F For the period November 13, 2000 (commencement of operations) to November 30, 2000.
G Expense ratios reflect operating expenses of the class. Expenses before reductions do not reflect amounts reimbursed by the investment adviser or reductions from directed brokerage or other expense offset arrangements and do not represent the amount paid by the class during periods when reimbursements or reductions occur. Expense ratios before reductions for start-up periods may not be representative of longer-term operating periods. Expenses net of any voluntary waivers reflects expenses after reimbursement by the investment adviser but prior to reductions from directed brokerage or other expense offset arrangements. Expenses net of all reductions represent the net expenses paid by the class.
See accompanying notes which are an integral part of the financial statements.
Annual Report
Financial Highlights - Class C
|
Years ended November 30, |
2002 |
2001 |
2000 F |
|
Selected Per-Share Data |
|
|
|
|
Net asset value, beginning of period |
$ 8.03 |
$ 9.05 |
$ 10.00 |
|
Income from Investment Operations |
|
|
|
|
Net investment income (loss) E |
(.13) |
(.08) |
- |
|
Net realized and unrealized gain (loss) |
(1.52) |
(.93) |
(.95) |
|
Total from investment operations |
(1.65) |
(1.01) |
(.95) |
|
Distributions from net realized gain |
- |
(.01) |
- |
|
Net asset value, end of period |
$ 6.38 |
$ 8.03 |
$ 9.05 |
|
Total Return B,C,D |
(20.55)% |
(11.18)% |
(9.50)% |
|
Ratios to Average Net Assets G |
|
|
|
|
Expenses before expense reductions |
2.58% |
2.79% |
32.69% A |
|
Expenses net of voluntary waivers, if any |
2.36% |
2.50% |
2.50% A |
|
Expenses net of all reductions |
2.16% |
2.46% |
2.50% A |
|
Net investment income (loss) |
(1.74)% |
(.89)% |
.24% A |
|
Supplemental Data |
|
|
|
|
Net assets, end of period (000 omitted) |
$ 6,636 |
$ 8,532 |
$ 1,224 |
|
Portfolio turnover rate |
473% |
481% |
139% A |
A Annualized
B Total returns for periods of less than one year are not annualized.
C Total returns would have been lower had certain expenses not been reduced during the periods shown.
D Total returns do not include the effect of the contingent deferred sales charge.
E Calculated based on average shares outstanding during the period.
F For the period November 13, 2000 (commencement of operations) to November 30, 2000.
G Expense ratios reflect operating expenses of the class. Expenses before reductions do not reflect amounts reimbursed by the investment adviser or reductions from directed brokerage or other expense offset arrangements and do not represent the amount paid by the class during periods when reimbursements or reductions occur. Expense ratios before reductions for start-up periods may not be representative of longer-term operating periods. Expenses net of any voluntary waivers reflects expenses after reimbursement by the investment adviser but prior to reductions from directed brokerage or other expense offset arrangements. Expenses net of all reductions represent the net expenses paid by the class.
See accompanying notes which are an integral part of the financial statements.
Annual Report
Financial Highlights - Institutional Class
|
Years ended November 30, |
2002 |
2001 |
2000 E |
|
Selected Per-Share Data |
|
|
|
|
Net asset value, beginning of period |
$ 8.11 |
$ 9.06 |
$ 10.00 |
|
Income from Investment Operations |
|
|
|
|
Net investment income (loss) D |
(.05) |
.01 |
.01 |
|
Net realized and unrealized gain (loss) |
(1.54) |
(.95) |
(.95) |
|
Total from investment operations |
(1.59) |
(.94) |
(.94) |
|
Distributions from net realized gain |
- |
(.01) |
- |
|
Net asset value, end of period |
$ 6.52 |
$ 8.11 |
$ 9.06 |
|
Total Return B,C |
(19.61)% |
(10.39)% |
(9.40)% |
|
Ratios to Average Net Assets F |
|
|
|
|
Expenses before expense reductions |
1.43% |
1.73% |
31.51% A |
|
Expenses net of voluntary waivers, if any |
1.27% |
1.50% |
1.50% A |
|
Expenses net of all reductions |
1.07% |
1.46% |
1.50% A |
|
Net investment income (loss) |
(.64)% |
.11% |
1.24% A |
|
Supplemental Data |
|
|
|
|
Net assets, end of period (000 omitted) |
$ 513 |
$ 761 |
$ 325 |
|
Portfolio turnover rate |
473% |
481% |
139% A |
A Annualized
B Total returns for periods of less than one year are not annualized.
C Total returns would have been lower had certain expenses not been reduced during the periods shown.
D Calculated based on average shares outstanding during the period.
E For the period November 13, 2000 (commencement of operations) to November 30, 2000.
F Expense ratios reflect operating expenses of the class. Expenses before reductions do not reflect amounts reimbursed by the investment adviser or reductions from directed brokerage or other expense offset arrangements and do not represent the amount paid by the class during periods when reimbursements or reductions occur. Expense ratios before reductions for start-up periods may not be representative of longer-term operating periods. Expenses net of any voluntary waivers reflects expenses after reimbursement by the investment adviser but prior to reductions from directed brokerage or other expense offset arrangements. Expenses net of all reductions represent the net expenses paid by the class.
See accompanying notes which are an integral part of the financial statements.
Annual Report
Notes to Financial Statements
For the period ended November 30, 2002
1. Significant Accounting Policies.
Fidelity Advisor Aggressive Growth Fund (the fund) is a fund of Fidelity Securities Fund (the trust) and is authorized to issue an unlimited number of shares. The trust is registered under the Investment Company Act of 1940, as amended (the 1940 Act), as an open-end management investment company organized as a Massachusetts business trust.
The fund offers Class A, Class T, Class B, Class C, and Institutional Class shares, each of which has equal rights as to assets and voting privileges. Each class has exclusive voting rights with respect to matters that affect that class. Class B shares will automatically convert to Class A shares after a holding period of seven years from the initial date of purchase. Investment income, realized and unrealized capital gains and losses, the common expenses of the fund, and certain fund-level expense reductions, if any, are allocated on a pro rata basis to each class based on the relative net assets of each class to the total net assets of the fund. Each class differs with respect to transfer agent and distribution and service plan fees incurred. Certain expense reductions also differ by class.
The financial statements have been prepared in conformity with accounting principles generally accepted in the United States of America, which require management to make certain estimates and assumptions at the date of the financial statements. The following summarizes the significant accounting policies of the fund:
Security Valuation. Net asset value per share (NAV calculation) is calculated as of the close of business of the New York Stock Exchange, normally 4:00 p.m. Eastern time. Equity securities for which market quotations are available are valued at the last sale price or official closing price (closing bid price or last evaluated quote if no sale has occurred) on the primary market or exchange on which they trade. If an event that is expected to materially affect the value of a security occurs after the close of an exchange or market on which that security trades, but prior to the NAV calculation, then that security will be fair valued taking the event into account. Securities (including restricted securities) for which market quotations are not readily available are valued at their fair value as determined in good faith under consistently applied procedures under the general supervision of the Board of Trustees. Price movements in futures contracts and ADRs, market and trading trends, the bid/ask quotes of brokers and off-exchange institutional trading may be reviewed in the course of making a good faith determination of a security's fair value. Short-term securities with remaining maturities of sixty days or less for which quotations are not readily available are valued on the basis of amortized cost. Investments in open-end investment companies are valued at their net asset value each business day.
Annual Report
Notes to Financial Statements - continued
1. Significant Accounting Policies - continued
Foreign Currency. The fund uses foreign currency contracts to facilitate transactions in foreign-denominated securities. Losses from these transactions may arise from changes in the value of the foreign currency or if the counterparties do not perform under the contracts' terms.
Foreign denominated assets, including investment securities, and liabilities are translated into U.S. dollars at the exchange rate at period end. Purchases and sales of investment securities, income and dividends received and expenses denominated in foreign currencies are translated into U.S. dollars at the exchange rate in effect on the transaction date.
The effects of exchange rate fluctuations on investments are included with the net realized and unrealized gain (loss) on investment securities. Other foreign currency transactions resulting in realized and unrealized gain (loss) are disclosed separately.
Investment Transactions and Income. Security transactions are accounted for as of trade date. Gains and losses on securities sold are determined on the basis of identified cost. Dividend income is recorded on the ex-dividend date, except for certain dividends from foreign securities where the ex-dividend date may have passed, which are recorded as soon as the fund is informed of the ex-dividend date. Non-cash dividends included in dividend income, if any, are recorded at the fair market value of the securities received. Interest income, which includes amortization of premium and accretion of discount on debt securities, as required, is accrued as earned. Investment income is recorded net of foreign taxes withheld where recovery of such taxes is uncertain.
Expenses. Most expenses of the trust can be directly attributed to a fund. Expenses which cannot be directly attributed are apportioned among the funds in the trust.
Income Tax Information and Distributions to Shareholders. Each year the fund intends to qualify as a regulated investment company under Subchapter M of the Internal Revenue Code. As a result, no provision for income taxes is required. Foreign taxes are provided for based on each fund's understanding of the tax rules and rates that exist in the foreign markets in which it invests. Income dividends and capital gain distributions are declared separately for each class. Distributions are recorded on the ex-dividend date.
Income and capital gain distributions are determined in accordance with income tax regulations, which may differ from generally accepted accounting principles. Capital accounts within the financial statements are adjusted for permanent and temporary book and tax differences. These adjustments have no impact on net assets or the results of operations. Temporary differences will reverse in a subsequent period. These differences are primarily due to foreign currency transactions, prior period premium and
Annual Report
1. Significant Accounting Policies - continued
Income Tax Information and Distributions to Shareholders - continued
discount on debt securities, net operating losses, capital loss carryforwards, and losses deferred due to wash sales and excise tax regulations.
The tax-basis components of distributable earnings and the federal tax cost as of period end was as follows:
|
Unrealized appreciation |
$ 2,239,336 |
|
|
Unrealized depreciation |
(1,721,922) |
|
|
Net unrealized appreciation (depreciation) |
517,414 |
|
|
Capital loss carryforward |
(16,955,568) |
|
|
Total Distributable earnings |
$ (16,438,154) |
|
|
Cost for federal income tax purposes |
$ 26,128,874 |
|
Change in Accounting Principle. Effective December 1, 2001, the fund adopted the provisions of the AICPA Audit and Accounting Guide for Investment Companies and began amortizing premium and discount on all debt securities, as required. The cumulative effect of this accounting change had no impact on total net assets of the fund, but resulted in a $3,235 increase to the cost of securities held and a corresponding increase to accumulated net undistributed realized gain (loss), based on securities held by the fund on December 1, 2001.
2. Operating Policies.
Repurchase Agreements. Fidelity Management & Research Company (FMR) has received an Exemptive Order from the Securities and Exchange Commission (the SEC) which permits the fund and other affiliated entities of FMR to transfer uninvested cash balances into joint trading accounts. These accounts are then invested in repurchase agreements that are collateralized by U.S. Treasury or Government obligations. The fund may also invest directly with institutions, in repurchase agreements that are collateralized by commercial paper obligations and corporate obligations. The custodian bank receives the collateral, which is marked-to-market daily and maintained at a value at least equal to the principal amount of the repurchase agreement (including accrued interest).
3. Purchases and Sales of Investments.
Information regarding purchases and sales of securities is included under the caption "Other Information" at the end of the fund's Schedule of Investments.
Annual Report
Notes to Financial Statements - continued
4. Fees and Other Transactions with Affiliates.
Management Fee. FMR and its affiliates provide the fund with investment management related services for which the fund pays a monthly management fee.
The management fee is the sum of an individual fund fee rate of .35% of the fund's average net assets and a group fee rate that averaged .28% during the period. The group fee rate is based upon the average net assets of all the mutual funds advised by FMR. The group fee rate decreases as assets under management increase and increases as assets under management decrease. For the period, the total annual management fee rate was .63% of the fund's average net assets.
Distribution and Service Plan. In accordance with Rule 12b-1 of the 1940 Act, the Fund has adopted separate Distribution and Service Plans for each class of shares. Certain classes pay Fidelity Distributors Corporation (FDC), an affiliate of FMR, separate Distribution and Service Fees, each of which is based on an annual percentage of each class' average net assets. Class A and Class T Plans also authorize the use of brokerage commissions to pay distribution expenses. In addition, FDC may pay financial intermediaries for selling shares of the fund and providing shareholder support services. For the period, the Distribution and Service Fee rates, the total amounts paid to and retained by FDC and the amount of distribution expenses paid with brokerage commissions were as follows:
|
|
Distribution |
Service |
Paid to |
Retained |
Paid with |
|
Class A |
.02% |
.25% |
$ 8,124 |
$ 89 |
$ $628 |
|
Class T |
.27% |
.25% |
71,103 |
151 |
2,702 |
|
Class B |
.75% |
.25% |
72,291 |
54,218 |
- |
|
Class C |
.75% |
.25% |
78,356 |
21,574 |
- |
|
|
|
|
$ 229,874 |
$ 76,032 |
$ 3,330 |
Sales Load. FDC receives a front-end sales charge of up to 5.75% for selling Class A shares, and 3.50% for selling Class T shares of the fund. FDC receives the proceeds of contingent deferred sales charges (CDSC) levied on Class A, Class T, Class B, and Class C redemptions. These charges depend on the holding period. The deferred sales charges range from 5% to 1% for Class B, 1% for Class C, and .25% for certain purchases of Class A and Class T shares.
Annual Report
4. Fees and Other Transactions with Affiliates - continued
Sales Load - continued
For the period, sales charge amounts paid to and retained by FDC were as follows:
|
|
Paid to |
Retained |
|
Class A |
$ 27,184 |
$ 7,186 |
|
Class T |
44,784 |
7,875 |
|
Class B* |
31,520 |
31,520 |
|
Class C* |
2,366 |
2,366 |
|
|
$ 105,854 |
$ 48,947 |
* When Class B and Class C shares are initially sold, FDC pays commissions from its own resources to financial intermediaries through which the sales are made.
Transfer Agent Fees. Fidelity Investments Institutional Operations Company, Inc. (FIIOC), an affiliate of FMR, is the transfer, dividend disbursing and shareholder servicing agent (collectively referred to as the transfer agent) for each class of the fund. FIIOC receives account fees and asset-based fees that vary according to the account size and type of account of the shareholders of the respective classes of the fund. FIIOC pays for typesetting, printing and mailing of all shareholder reports, except proxy statements. For the period, the following amounts were paid to FIIOC:
|
|
Amount |
% of |
|
Class A |
$ 19,216 |
.64 |
|
Class T |
68,306 |
.50 |
|
Class B |
42,072 |
.58 |
|
Class C |
34,340 |
.44 |
|
Institutional Class |
2,041 |
.29 |
|
|
$ 165,975 |
|
Accounting Fees. Fidelity Service Company, Inc. (FSC), an affiliate of FMR, maintains the fund's accounting records. The fee is based on the level of average net assets for the month plus out-of-pocket expenses.
Central Funds. The fund may invest in affiliated Central Funds managed by Fidelity Investments Money Management, Inc. (FIMM), an affiliate of FMR. The Central Funds are open-end investment companies available only to investment companies and other accounts managed by FMR and its affiliates. The Central Funds seek preservation of capital and current income and do not pay a management fee. Income distributions earned by the fund are recorded as income in the accompanying financial statements and totaled $43,634 for the period.
Annual Report
Notes to Financial Statements - continued
4. Fees and Other Transactions with Affiliates - continued
Brokerage Commissions. The fund placed a portion of its portfolio transactions with brokerage firms which are affiliates of the investment adviser. The commissions paid to these affiliated firms are shown under the caption "Other Information" at the end of the fund's Schedule of Investments.
5. Committed Line of Credit.
The fund participates with other funds managed by FMR in a $3.5 billion credit facility (the "line of credit") to be utilized for temporary or emergency purposes to fund shareholder redemptions or for other short-term liquidity purposes. The fund has agreed to pay commitment fees on its pro rata portion of the line of credit. During the period, there were no borrowings on this line of credit.
6. Expense Reductions.
FMR agreed to reimburse the classes of the fund to the extent operating expenses exceeded certain levels of average net assets as noted in the table below. Some expenses, for example interest expense, are excluded from this reimbursement.
|
|
Expense |
Reimbursement |
|
|
|
|
|
Class A |
1.75%-*1.50% |
$ 10,823 |
|
Class T |
2.00%-*1.75% |
33,640 |
|
Class B |
2.50%-*2.25% |
21,336 |
|
Class C |
2.50%-*2.25% |
17,293 |
|
Institutional Class |
1.50%-*1.25% |
1,144 |
|
|
|
$ 84,236 |
* Expense limitation in effect at period-end.
Many of the brokers with whom FMR places trades on behalf of the fund provided services to the fund in addition to trade execution. These services may include payments of expenses on behalf of the fund to support distribution of fund shares for Class A and Class T ("Distribution Expense Reductions") and to pay other fund expenses, such as custody fees ("Other Expense Reductions") collectively referred to as "Directed Brokerage" in the accompanying table. Directed brokerage generally benefits all shareholders of
Annual Report
6. Expense Reductions - continued
each class by reducing fund expenses. Each of Class A and Class T shareholders' Other Expense Reduction benefit is reduced by the amount of its Distribution Expense Reduction. All of the applicable expense reductions are noted in the table below.
|
|
Directed |
|
|
|
Distribution |
Other |
|
|
|
|
|
Fund Level |
$ |
$ 61,225 |
|
Class A |
628 |
|
|
Class T |
2,702 |
|
|
|
$ 3,330 |
$ 61,225 |
7. Distributions to Shareholders.
Distributions to shareholders of each class were as follows:
|
|
Year ended |
Year ended |
|
From net realized gain |
|
|
|
Class A |
$ - |
$ 3,027 |
|
Class T |
- |
9,442 |
|
Class B |
- |
4,873 |
|
Class C |
- |
4,440 |
|
Institutional Class |
- |
636 |
|
Total |
$ - |
$ 22,418 |
Annual Report
Notes to Financial Statements - continued
8. Share Transactions.
Transactions for each class of shares were as follows:
|
|
Shares |
Dollars |
||
|
|
Years ended November 30, |
Years ended November 30, |
||
|
|
2002 |
2001 |
2002 |
2001 |
|
Class A |
|
|
|
|
|
Shares sold |
165,182 |
444,403 |
$ 1,240,636 |
$ 4,306,002 |
|
Reinvestment of distributions |
- |
207 |
- |
1,935 |
|
Shares redeemed |
(171,008) |
(231,476) |
(1,293,424) |
(2,054,651) |
|
Net increase (decrease) |
(5,826) |
213,134 |
$ (52,788) |
$ 2,253,286 |
|
Class T |
|
|
|
|
|
Shares sold |
903,899 |
2,239,199 |
$ 7,000,780 |
$ 21,822,601 |
|
Reinvestment of distributions |
- |
938 |
- |
8,749 |
|
Shares redeemed |
(1,027,358) |
(788,246) |
(7,601,666) |
(6,792,125) |
|
Net increase (decrease) |
(123,459) |
1,451,891 |
$ (600,886) |
$ 15,039,225 |
|
Class B |
|
|
|
|
|
Shares sold |
347,968 |
1,146,833 |
$ 2,574,720 |
$ 11,147,186 |
|
Reinvestment of distributions |
- |
459 |
- |
4,280 |
|
Shares redeemed |
(366,934) |
(328,386) |
(2,702,296) |
(2,750,504) |
|
Net increase (decrease) |
(18,966) |
818,906 |
$ (127,576) |
$ 8,400,962 |
|
Class C |
|
|
|
|
|
Shares sold |
378,395 |
1,236,726 |
$ 2,890,698 |
$ 12,477,205 |
|
Reinvestment of distributions |
- |
436 |
- |
4,074 |
|
Shares redeemed |
(400,792) |
(309,914) |
(2,983,429) |
(2,603,523) |
|
Net increase (decrease) |
(22,397) |
927,248 |
$ (92,731) |
$ 9,877,756 |
|
Institutional Class |
|
|
|
|
|
Shares sold |
27,286 |
97,418 |
$ 220,096 |
$ 957,774 |
|
Reinvestment of distributions |
- |
57 |
- |
532 |
|
Shares redeemed |
(42,260) |
(39,613) |
(309,451) |
(352,165) |
|
Net increase (decrease) |
(14,974) |
57,862 |
$ (89,355) |
$ 606,141 |
Annual Report
Report of Independent Accountants
To the Trustees of Fidelity Securities Fund and the Shareholders of Fidelity Advisor Aggressive Growth Fund:
In our opinion, the accompanying statement of assets and liabilities, including the schedule of investments, and the related statements of operations and of changes in net assets and the financial highlights present fairly, in all material respects, the financial position of Fidelity Advisor Aggressive Growth Fund (a fund of Fidelity Securities Fund) at November 30, 2002 and the results of its operations, the changes in its net assets and the financial highlights for the periods indicated, in conformity with accounting principles generally accepted in the United States of America. These financial statements and financial highlights (hereafter referred to as "financial statements") are the responsibility of the Fidelity Advisor Aggressive Growth Fund's management; our responsibility is to express an opinion on these financial statements based on our audits. We conducted our audits of these financial statements in accordance with auditing standards generally accepted in the United States of America which require that we plan and perform the audit to obtain reasonable assurance about whether the financial statements are free of material misstatement. An audit includes examining, on a test basis, evidence supporting the amounts and disclosures in the financial statements, assessing the accounting principles used and significant estimates made by management, and evaluating the overall financial statement presentation. We believe that our audits, which included confirmation of securities at November 30, 2002 by correspondence with the custodian and brokers, provide a reasonable basis for our opinion.
/s/ PricewaterhouseCoopers LLP
PricewaterhouseCoopers LLP
Boston, Massachusetts
January 10, 2003
Annual Report
Trustees and Officers
The Trustees and executive officers of the trust and fund, as applicable, are listed below. The Board of Trustees governs the fund and is responsible for protecting the interests of shareholders. The Trustees are experienced executives who meet periodically throughout the year to oversee the fund's activities, review contractual arrangements with companies that provide services to the fund, and review the fund's performance. Except for William O. McCoy, each of the Trustees oversees 269 funds advised by FMR or an affiliate. Mr. McCoy oversees 271 funds advised by FMR or an affiliate.
The Trustees hold office without limit in time except that (a) any Trustee may resign; (b) any Trustee may be removed by written instrument, signed by at least two-thirds of the number of Trustees prior to such removal; (c) any Trustee who requests to be retired or who has become incapacitated by illness or injury may be retired by written instrument signed by a majority of the other Trustees; and (d) any Trustee may be removed at any special meeting of shareholders by a two-thirds vote of the outstanding voting securities of the trust. In any event, each non-interested Trustee shall retire not later than the last day of the calendar year in which his or her 72nd birthday occurs. The executive officers hold office without limit in time, except that any officer may resign or may be removed by a vote of a majority of the Trustees at any regular meeting or any special meeting of the Trustees. Except as indicated, each individual has held the office shown or other offices in the same company for the past five years.
The fund's Statement of Additional Information (SAI) includes more information about the Trustees. To request a free copy, call Fidelity at 1-877-208-0098.
Interested Trustees*:
Correspondence intended for each Trustee who is an "interested person" (as defined in the 1940 Act) may be sent to 82 Devonshire Street, Boston, Massachusetts 02109.
|
Name, Age; Principal Occupation |
|
|
Edward C. Johnson 3d (72)** |
|
|
|
Year of Election or Appointment: 1984 Trustee of Fidelity Securities Fund. Mr. Johnson is Chairman of the Board of Trustees. Mr. Johnson serves as Chief Executive Officer, Chairman, and a Director of FMR Corp.; a Director and Chairman of the Board and of the Executive Committee of FMR; Chairman and a Director of Fidelity Management & Research (Far East) Inc.; Chairman (1998) and a Director of Fidelity Investments Money Management, Inc.; and Chairman (2001) and a Director (2000) of FMR Co., Inc. |
|
Abigail P. Johnson (40)** |
|
|
|
Year of Election or Appointment: 2001 Senior Vice President of Advisor Aggressive Growth (2001). Ms. Johnson also serves as Senior Vice President of other Fidelity funds (2001). She is President and a Director of FMR (2001), Fidelity Investments Money Management, Inc. (2001), FMR Co., Inc. (2001), and a Director of FMR Corp. Previously, Ms. Johnson managed a number of Fidelity funds. |
|
Peter S. Lynch (59) |
|
|
|
Year of Election or Appointment: 1990 Vice Chairman and a Director of FMR, and Vice Chairman (2001) and a Director (2000) of FMR Co., Inc. Prior to May 31, 1990, he was a Director of FMR and Executive Vice President of FMR (a position he held until March 31, 1991), Vice President of Fidelity® Magellan® Fund and FMR Growth Group Leader, and Managing Director of FMR Corp. Mr. Lynch was also Vice President of Fidelity Investments Corporate Services. In addition, he serves as a Trustee of Boston College, Massachusetts Eye & Ear Infirmary, Historic Deerfield, John F. Kennedy Library, and the Museum of Fine Arts of Boston. |
* Trustees have been determined to be "Interested Trustees" by virtue of, among other things, their affiliation with the trust or various entities under common control with FMR.
** Edward C. Johnson 3d, Trustee, is Abigail P. Johnson's father.
Annual Report
Non-Interested Trustees:
Correspondence intended for each non-interested Trustee (that is, the Trustees other than the Interested Trustees) may be sent to Fidelity Investments, P.O. Box 55235, Boston, Massachusetts 02205-5235.
|
Name, Age; Principal Occupation |
|
|
J. Michael Cook (60) |
|
|
|
Year of Election or Appointment: 2001 Prior to Mr. Cook's retirement in May 1999, he served as Chairman and Chief Executive Officer of Deloitte & Touche LLP (accounting/consulting), Chairman of the Deloitte & Touche Foundation, and a member of the Board of Deloitte Touche Tohmatsu. He currently serves as a Director of Comcast (telecommunications, 2002), International Flavors & Fragrances, Inc. (2000), Rockwell Automation International (2000), The Dow Chemical Company (2000), and HCA - The Healthcare Company (1999). He is a Member of the Advisory Board of the Securities Regulation Institute and of the Directorship Group, Chairman Emeritus of the Board of Catalyst (a leading organization for the advancement of women in business), and is Chairman of the Accountability Advisory Panel to the Comptroller General of the United States. He also serves as a member of the Board of Overseers of the Columbia Business School and a Member of the Advisory Board of the Graduate School of Business of the University of Florida, his alma mater. |
|
Ralph F. Cox (70) |
|
|
|
Year of Election or Appointment: 1991 Mr. Cox is President of RABAR Enterprises (management consulting for the petroleum industry). Prior to February 1994, he was President of Greenhill Petroleum Corporation (petroleum exploration and production). Until March 1990, Mr. Cox was President and Chief Operating Officer of Union Pacific Resources Company (exploration and production). He is a Director of CH2M Hill Companies (engineering), and Abraxas Petroleum (petroleum exploration and production, 1999). In addition, he is a member of advisory boards of Texas A&M University and the University of Texas at Austin. |
|
Phyllis Burke Davis (70) |
|
|
|
Year of Election or Appointment: 1992 Mrs. Davis is retired from Avon Products, Inc. (consumer products) where she held various positions including Senior Vice President of Corporate Affairs and Group Vice President of U.S. product marketing, sales, distribution, and manufacturing. Mrs. Davis is a member of the Toshiba International Advisory Group of Toshiba Corporation (2001) and a member of the Board of Directors of the Southampton Hospital in Southampton, N.Y. (1998). Previously, she served as a Director of BellSouth Corporation (telecommunications), Eaton Corporation (diversified industrial), the TJX Companies, Inc. (retail stores), Hallmark Cards, Inc., and Nabisco Brands, Inc. |
|
Robert M. Gates (59) |
|
|
|
Year of Election or Appointment: 1997 Dr. Gates is President of Texas A&M University (2002). He was Director of the Central Intelligence Agency (CIA) from 1991 to 1993. From 1989 to 1991, Dr. Gates served as Assistant to the President of the United States and Deputy National Security Advisor. Dr. Gates is a Director of Charles Stark Draper Laboratory (non-profit), NACCO Industries, Inc. (mining and manufacturing), and Parker Drilling Co., Inc. (drilling and rental tools for the energy industry, 2001). He also serves as a member of the Advisory Board of VoteHere.net (secure internet voting, 2001). Previously, Dr. Gates served as a Director of LucasVarity PLC (automotive components and diesel engines), a Director of TRW Inc. (automotive, space, defense, and information technology), and Dean of the George Bush School of Government and Public Service at Texas A&M University (1999-2001). Dr. Gates also is a Trustee of the Forum for International Policy. |
|
Donald J. Kirk (70) |
|
|
|
Year of Election or Appointment: 1987 Mr. Kirk is a Governor of the American Stock Exchange (2001), a Trustee and former Chairman of the Board of Trustees of the Greenwich Hospital Association, a Director of the Yale-New Haven Health Services Corp. (1998), and a Director Emeritus and former Chairman of the Board of Directors of National Arts Strategies Inc. Mr. Kirk was an Executive-in-Residence (1995-2000) and a Professor (1987-1995) at Columbia University Graduate School of Business. Prior to 1987, he was Chairman of the Financial Accounting Standards Board. Previously, Mr. Kirk served as a Governor of the National Association of Securities Dealers, Inc. (1996-2002), a member and Vice Chairman of the Public Oversight Board of the American Institute of Certified Public Accountants' SEC Practice Section (1995-2002), a Director of General Re Corporation (reinsurance, 1987-1998) and as a Director of Valuation Research Corp. (appraisals and valuations). |
|
Marie L. Knowles (56) |
|
|
|
Year of Election or Appointment: 2001 Prior to Ms. Knowles' retirement in June 2000, she served as Executive Vice President and Chief Financial Officer of Atlantic Richfield Company (ARCO) (diversified energy, 1996-2000). From 1993 to 1996, she was a Senior Vice President of ARCO and President of ARCO Transportation Company. She served as a Director of ARCO from 1996 to 1998. She currently serves as a Director of Phelps Dodge Corporation (copper mining and manufacturing), URS Corporation (multidisciplinary engineering, 1999), and McKesson Corporation (healthcare service, 2002). Ms. Knowles is a Trustee of the Brookings Institution and the Catalina Island Conservancy and also serves as a member of the Advisory Board for the School of Engineering of the University of Southern California. |
|
Ned C. Lautenbach (58) |
|
|
|
Year of Election or Appointment: 2000 Mr. Lautenbach has been a partner of Clayton, Dubilier & Rice, Inc. (private equity investment firm) since September 1998. Previously, Mr. Lautenbach was with the International Business Machines Corporation (IBM) from 1968 until his retirement in 1998. He was most recently Senior Vice President and Group Executive of Worldwide Sales and Services. From 1993 to 1995, he was Chairman of IBM World Trade Corporation, and from 1994 to 1998 was a member of IBM's Corporate Executive Committee. Mr. Lautenbach serves as Chairman and Chief Executive Officer (1999) and as a Director (1998) of Acterna Corporation (communications test equipment). He is also Co-Chairman and C.E.O. of Covansys, Inc. (global provider of business and technology solutions, 2000). In addition, he is a Director of Eaton Corporation (diversified industrial, 1997), Axcelis Technologies (semiconductors, 2000), and the Philharmonic Center for the Arts in Naples, Florida (1999). He also serves on the Board of Trustees of Fairfield University and is a member of the Council on Foreign Relations. |
|
Name, Age; Principal Occupation |
|
|
Marvin L. Mann (69) |
|
|
|
Year of Election or Appointment: 1993 Mr. Mann is Chairman of the non-interested Trustees (2001). He is Chairman Emeritus of Lexmark International, Inc. (computer peripherals) where he remains a member of the Board. Prior to 1991, he held the positions of Vice President of International Business Machines Corporation (IBM) and President and General Manager of various IBM divisions and subsidiaries. Mr. Mann is a Board member of Imation Corp. (imaging and information storage, 1997) and Acterna Corporation (communications test equipment, 1999). He is also a member of the Director Services Committee of the Investment Company Institute. In addition, Mr. Mann is a member of the President's Cabinet at the University of Alabama and the Board of Visitors of the Culverhouse College of Commerce and Business Administration at the University of Alabama. |
|
William O. McCoy (69) |
|
|
|
Year of Election or Appointment: 1997 Prior to his retirement in December 1994, Mr. McCoy was Vice Chairman of the Board of BellSouth Corporation (telecommunications) and President of BellSouth Enterprises. He is currently a Director of Liberty Corporation (holding company), Duke Realty Corporation (real estate), Progress Energy, Inc. (electric utility), and Acterna Corporation (communications test equipment, 1999). He is also a partner of Franklin Street Partners (private investment management firm, 1997) and a member of the Research Triangle Foundation Board. In addition, Mr. McCoy served as the Interim Chancellor (1999-2000) and a member of the Board of Visitors (1994-1998) for the University of North Carolina at Chapel Hill and currently serves on the Board of Directors of the University of North Carolina Health Care System and the Board of Visitors of the Kenan-Flagler Business School (University of North Carolina at Chapel Hill). He also served as Vice President of Finance for the University of North Carolina (16-school system, 1995-1998). |
|
William S. Stavropoulos (63) |
|
|
|
Year of Election or Appointment: 2002 Mr. Stavropoulos is Chairman of the Board and Chairman of the Executive Committee (2000) and a Director of The Dow Chemical Company. Since joining The Dow Chemical Company in 1967, Mr. Stavropoulos served in numerous senior management positions, including President (1993-2000) and Chief Executive Officer (1995-2000). Currently, he is a Director of NCR Corporation (data warehousing and technology solutions, 1997), BellSouth Corporation (telecommunications, 1997), Chemical Financial Corporation, Computer Associates International Inc. (integrated computer software products, 2002), and Maersk Inc. (industrial conglomerate, 2002). He also serves as a member of the Board of Trustees of the American Enterprise Institute for Public Policy Research and Fordham University. In addition, Mr. Stavropoulos is a member of the American Chemical Society, The Business Council, J.P. Morgan International Council, World Business Council for Sustainable Development, and the University of Notre Dame Advisory Council for the College of Science. |
Executive Officers:
Correspondence intended for each executive officer may be sent to 82 Devonshire Street, Boston, Massachusetts 02109.
|
Name, Age; Principal Occupation |
|
|
John B. McDowell (44) |
|
|
|
Year of Election or Appointment: 2002 Vice President of Advisor Aggressive Growth. Mr. McDowell also serves as Vice President of certain Equity Funds (2002). He is Senior Vice President of FMR (1999), FMR Co., Inc. (2001), and Fidelity Management Trust Company (FMTC). Since joining Fidelity Investments in 1985, Mr. McDowell has worked as a research analyst and manager. |
|
Name, Age; Principal Occupation |
|
|
Eric D. Roiter (54) |
|
|
|
Year of Election or Appointment: 2000 Secretary of Advisor Aggressive Growth. He also serves as Secretary of other Fidelity funds (1998); Vice President, General Counsel, and Clerk of FMR Co., Inc. (2001) and FMR (1998); Vice President and Clerk of FDC (1998); Assistant Clerk of Fidelity Management & Research (U.K.) Inc. (2001) and Fidelity Management & Research (Far East) Inc. (2001); and Assistant Secretary of Fidelity Investments Money Management Inc. (2001). Prior to joining Fidelity, Mr. Roiter was with the law firm of Debevoise & Plimpton, as an associate (1981-1984) and as a partner (1985-1997), and served as an Assistant General Counsel of the U.S. Securities and Exchange Commission (1979-1981). Mr. Roiter was an Adjunct Member, Faculty of Law, at Columbia University Law School (1996-1997). |
|
Maria F. Dwyer (43) |
|
|
|
Year of Election or Appointment: 2002 President and Treasurer of Advisor Aggressive Growth. Ms. Dwyer also serves as President and Treasurer of other Fidelity funds (2002) and is a Vice President (1999) and an employee (1996) of FMR. Prior to joining Fidelity, Ms. Dwyer served as Director of Compliance for MFS Investment Management. |
|
Timothy F. Hayes (51) |
|
|
|
Year of Election or Appointment: 2002 Chief Financial Officer of Advisor Aggressive Growth. Mr. Hayes also serves as Chief Financial Officer of other Fidelity funds (2002). In 2001, Mr. Hayes was appointed President of Fidelity Investments Operations Group (FIOG), which includes Fidelity Pricing and Cash Management Services Group (FPCMS), where he was appointed President in 1998. Previously, Mr. Hayes served as Chief Financial Officer of Fidelity Investments Corporate Systems and Service Group (1998) and Fidelity Systems Company (1997-1998). |
|
John H. Costello (56) |
|
|
|
Year of Election or Appointment: 2000 Assistant Treasurer of Advisor Aggressive Growth. Mr. Costello also serves as Assistant Treasurer of other Fidelity funds and is an employee of FMR. |
|
Name, Age; Principal Occupation |
|
|
Francis V. Knox, Jr. (55) |
|
|
|
Year of Election or Appointment: 2002 Assistant Treasurer of Advisor Aggressive Growth. Mr. Knox also serves as Assistant Treasurer of other Fidelity funds (2002), and is a Vice President and an employee of FMR. Previously, Mr. Knox served as Vice President of Investment & Advisor Compliance (1990-2001), and Compliance Officer of Fidelity Management & Research (U.K.) Inc. (1992-2002), Fidelity Management & Research (Far East) Inc. (1991-2002), and FMR Corp. (1995-2002). |
|
Mark Osterheld (47) |
|
|
|
Year of Election or Appointment: 2002 Assistant Treasurer of Advisor Aggressive Growth. Mr. Osterheld also serves as Assistant Treasurer of other Fidelity funds (2002) and is an employee of FMR. |
|
Thomas J. Simpson (44) |
|
|
|
Year of Election or Appointment: 2000 Assistant Treasurer of Advisor Aggressive Growth. Mr. Simpson is Assistant Treasurer of other Fidelity funds (2000) and an employee of FMR (1996). Prior to joining FMR, Mr. Simpson was Vice President and Fund Controller of Liberty Investment Services (1987-1995). |
Annual Report
Proxy Voting Results
A special meeting of the fund's shareholders was held on July 17, 2002. The results of votes taken among shareholders on proposals before them are reported below. Each vote reported represents one dollar of net asset value held on the record date for the meeting.
|
PROPOSAL 1 |
||
|
To continue the effectiveness of Article VIII, Section 4 of the Declaration of Trust.* |
||
|
|
# of |
% of |
|
Affirmative |
34,152,718,540.11 |
89.928 |
|
Against |
1,595,684,478.44 |
4.202 |
|
Abstain |
2,229,268,880.72 |
5.870 |
|
TOTAL |
37,977,671,899.27 |
100.00 |
|
PROPOSAL 2 |
||
|
To authorize the Trustees to adopt an amended and restated Declaration of Trust.* |
||
|
|
# of |
% of |
|
Affirmative |
33,359,879,895.48 |
87.841 |
|
Against |
2,506,585,409.20 |
6.600 |
|
Abstain |
2,111,206,594.59 |
5.559 |
|
TOTAL |
37,977,671,899.27 |
100.00 |
|
PROPOSAL 3 |
||
|
To elect the thirteen nominees specified below as Trustees.* |
||
|
|
# of |
% of |
|
J. Michael Cook |
||
|
Affirmative |
36,277,611,366.72 |
95.392 |
|
Withheld |
1,750,060,532.55 |
4.608 |
|
TOTAL |
37,977,671,899.27 |
100.00 |
|
Ralph F. Cox |
||
|
Affirmative |
36,182,850,121.37 |
95.274 |
|
Withheld |
1,794,821,777.90 |
4.726 |
|
TOTAL |
37,977,671,899.27 |
100.00 |
|
Phyllis Burke Davis |
||
|
Affirmative |
36,151,180,469.12 |
95.191 |
|
Withheld |
1,826,491,430.15 |
4.809 |
|
TOTAL |
37,977,671,899.27 |
100.00 |
|
|
# of |
% of |
|
Robert M. Gates |
||
|
Affirmative |
36,207,443,324.51 |
95.339 |
|
Withheld |
1,770,228,574.76 |
4.661 |
|
TOTAL |
37,977,671,899.27 |
100.00 |
|
Abigail P. Johnson |
||
|
Affirmative |
36,153,684,587.30 |
95.197 |
|
Withheld |
1,823,987,311.97 |
4.803 |
|
TOTAL |
37,977,671,899.27 |
100.00 |
|
Edward C. Johnson 3d |
||
|
Affirmative |
36,146,668,992.04 |
95.179 |
|
Withheld |
1,831,002,907.23 |
4.821 |
|
TOTAL |
37,977,671,899.27 |
100.00 |
|
Donald J. Kirk |
||
|
Affirmative |
36,212,215,628.07 |
95.351 |
|
Withheld |
1,765,456,271.20 |
4.649 |
|
TOTAL |
37,977,671,899.27 |
100.00 |
|
Marie L. Knowles |
||
|
Affirmative |
36,228,946,938.21 |
95.395 |
|
Withheld |
1,748,724,961.06 |
4.605 |
|
TOTAL |
37,977,671,899.27 |
100.00 |
|
Ned C. Lautenbach |
||
|
Affirmative |
36,247,557,672.80 |
95.444 |
|
Withheld |
1,730,114,226.47 |
4.556 |
|
TOTAL |
37,977,671,899.27 |
100.00 |
|
Peter S. Lynch |
||
|
Affirmative |
36,238,626,074.48 |
95.421 |
|
Withheld |
1,739,045,824.79 |
4.579 |
|
TOTAL |
37,977,671,899.27 |
100.00 |
|
Marvin L. Mann |
||
|
Affirmative |
36,208314,198.20 |
95.341 |
|
Withheld |
1,769,357,701.07 |
4.659 |
|
TOTAL |
37,977,671,899.27 |
100.00 |
* Denotes trust-wide proposals and voting results.
Annual Report
Proxy Voting Results - continued
|
|
# of |
% of |
|
William O. McCoy |
||
|
Affirmative |
36,216,504,381.47 |
95.371 |
|
Withheld |
1,758,167,517.80 |
4.629 |
|
TOTAL |
37,977,671,899.27 |
100.00 |
|
William S. Stavropoulos |
||
|
Affirmative |
36,124,608,895.89 |
95.121 |
|
Withheld |
1,853,063,003.38 |
4.879 |
|
TOTAL |
37,977,671,899.27 |
100.00 |
|
PROPOSAL 6 |
||
|
To amend the fund's fundamental investment limitation concerning lending. |
||
|
|
# of |
% of |
|
Affirmative |
16,103,992.09 |
87.543 |
|
Against |
957,507.22 |
5.205 |
|
Abstain |
1,333,989.77 |
7.252 |
|
TOTAL |
18,395,489.08 |
100.00 |
Annual Report
Investment Adviser
Fidelity Management & Research Company
Boston, MA
Investment Sub-Advisers
FMR Co., Inc.
Fidelity Management & Research
(U.K.) Inc.
Fidelity Management & Research
(Far East) Inc.
Fidelity Investments Japan Limited
General Distributor
Fidelity Distributors Corporation
Boston, MA
Transfer and Shareholder
Servicing Agents
Fidelity Investments Institutional
Operations Company, Inc.
Boston, MA
Custodian
State Street Bank and Trust Company
Quincy, MA
Annual Report
|
Fidelity Advisor Aggressive Growth Fund |
|
Fidelity Advisor Asset Allocation Fund |
|
Fidelity Advisor Balanced Fund |
|
Fidelity Advisor Biotechnology Fund |
|
Fidelity Advisor California Municipal Income Fund |
|
Fidelity Advisor Consumer Industries Fund |
|
Fidelity Advisor Cyclical Industries Fund |
|
Fidelity Advisor Developing Communications Fund |
|
Fidelity Advisor Diversified International Fund |
|
Fidelity Advisor Dividend Growth Fund |
|
Fidelity Advisor Dynamic Capital Appreciation Fund |
|
Fidelity Advisor Electronics Fund |
|
Fidelity Advisor Emerging Asia Fund |
|
Fidelity Advisor Emerging Markets Income Fund |
|
Fidelity Advisor Equity Growth Fund |
|
Fidelity Advisor Equity Income Fund |
|
Fidelity Advisor Equity Value Fund |
|
Fidelity Advisor Europe Capital Appreciation Fund |
|
Fidelity Advisor Fifty Fund |
|
Fidelity Advisor Financial Services Fund |
|
Fidelity Advisor Floating Rate High Income Fund |
|
Fidelity Advisor Global Equity Fund |
|
Fidelity Advisor Government Investment Fund |
|
Fidelity Advisor Growth & Income Fund |
|
Fidelity Advisor Growth Opportunities |
|
Fidelity Advisor Health Care Fund |
|
Fidelity Advisor High Income Advantage Fund |
|
Fidelity Advisor High Income Fund |
|
Fidelity Advisor Inflation-Protected Bond Fund |
|
Fidelity Advisor Intermediate Bond Fund |
|
Fidelity Advisor International Capital Appreciation Fund |
|
Fidelity Advisor Investment Grade Bond Fund |
|
Fidelity Advisor Japan Fund |
|
Fidelity Advisor Korea Fund |
|
Fidelity Advisor Large Cap Fund |
|
Fidelity Advisor Latin America Fund |
|
Fidelity Advisor Leveraged Company Stock Fund |
|
Fidelity Advisor Mid Cap Fund |
|
Fidelity Advisor Mortgage Securities Fund |
|
Fidelity Advisor Municipal Income Fund |
|
Fidelity Advisor Natural Resources Fund |
|
Fidelity Advisor New York Municipal Income Fund |
|
Fidelity Advisor Overseas Fund |
|
Fidelity Advisor Real Estate Fund |
|
Fidelity Advisor Short Fixed-Income Fund |
|
Fidelity Advisor Small Cap Fund |
|
Fidelity Advisor Strategic Growth Fund |
|
Fidelity Advisor Strategic Income Fund |
|
Fidelity Advisor Tax Managed |
|
Fidelity Advisor Technology Fund |
|
Fidelity Advisor Telecommunications & Utilities Growth Fund |
|
Fidelity Advisor Value Strategies Fund |
|
Prime Fund |
|
Tax-Exempt Fund |
|
Treasury Fund |
AAG-ANN-0103 335836
1.750680.102
(Fidelity Investment logo)(registered trademark)
(fidelity_logo)(registered trademark)
Fidelity® Advisor
Aggressive Growth
Fund - Institutional Class
Annual Report
November 30, 2002
(2_fidelity_logos) (Registered_Trademark)
Contents
|
Chairman's Message |
Ned Johnson on investing strategies. |
|
|
Performance |
How the fund has done over time. |
|
|
Fund Talk |
The manager's review of fund performance, strategy and outlook. |
|
|
Investment Changes |
A summary of major shifts in the fund's investments over the past six months. |
|
|
Investments |
A complete list of the fund's investments with their market values. |
|
|
Financial Statements |
Statements of assets and liabilities, operations, and changes in net assets, as well as financial highlights. |
|
|
Notes |
Notes to the financial statements. |
|
|
Report of Independent Accountants |
The auditors' opinion. |
|
|
Trustees and Officers |
|
|
|
Proxy Voting Results |
|
Standard & Poor's, S&P and S&P 500 are registered service marks of The McGraw-Hill Companies, Inc. and have been licensed for use by Fidelity Distributors Corporation.
Other third party marks appearing herein are the property of their respective owners.
All other marks appearing herein are registered or unregistered trademarks or service marks of FMR Corp. or an affiliated company.
(Recycle graphic) This report is printed on recycled paper using soy-based inks.
This report and the financial statements contained herein are submitted for the general information of the shareholders of the fund. This report is not authorized for distribution to prospective investors in the fund unless preceded or accompanied by an effective prospectus.
Mutual fund shares are not deposits or obligations of, or guaranteed by, any depository institution. Shares are not insured by the FDIC, Federal Reserve Board or any other agency, and are subject to investment risks, including possible loss of principal amount invested.
Neither the fund nor Fidelity Distributors Corporation is a bank.
For more information on any Fidelity Advisor fund, including charges and expenses, contact your investment professional for a free prospectus. Read it carefully before you invest or send money.
Semiannual Report
Chairman's Message
(photo_of_Edward_C_Johnson_3d)
Dear Shareholder:
Stock market gains in October and November kindled hopes for a strong close to the year. But even with December historically the best month for the Dow industrials, according to a recent study, most equity indexes had double-digit losses for 2002 through November, and avoiding a third straight year of declines seemed unlikely. Although recent fixed-income performance was tarnished by the stock market rebound, most bond categories were up 7%-9% year to date.
While it's impossible to predict the future direction of the markets with any degree of certainty, there are certain basic principles that can help investors plan for their future needs.
First, investors are encouraged to take a long-term view of their portfolios. If you can afford to leave your money invested through the inevitable up and down cycles of the financial markets, you will greatly reduce your vulnerability to any single decline. We know from experience, for example, that stock prices have gone up over longer periods of time, have significantly outperformed other types of investments and have stayed ahead of inflation.
Second, you can further manage your investing risk through diversification. A stock mutual fund, for instance, is already diversified, because it invests in many different companies. You can increase your diversification further by investing in a number of different stock funds, or in such other investment categories as bonds. If you have a short investment time horizon, you might want to consider moving some of your investment into a money market fund, which seeks income and a stable share price by investing in high-quality, short-term investments. Of course, it's important to remember that an investment in a money market fund is not insured or guaranteed by the Federal Deposit Insurance Corporation or any other government agency. Although money market funds seek to preserve the value of your investment at $1.00 per share, it is possible to lose money by investing in these types of funds.
Finally, no matter what your time horizon or portfolio diversity, it makes good sense to follow a regular investment plan, investing a certain amount of money in a fund at the same time each month or quarter and periodically reviewing your overall portfolio. By doing so, you won't get caught up in the excitement of a rapidly rising market, nor will you buy all your shares at market highs. While this strategy - known as dollar cost averaging - won't assure a profit or protect you from a loss in a declining market, it should help you lower the average cost of your purchases. Of course, you should consider your financial ability to continue your purchases through periods of low price levels before undertaking such a strategy.
Remember to contact your investment professional if you need help with your investments.
Best regards,
/s/Edward C. Johnson 3d
Edward C. Johnson 3d
Annual Report
Fidelity Advisor Aggressive Growth Fund - Institutional Class
Performance: The Bottom Line
There are several ways to evaluate historical performance. You can look at cumulative total returns, average annual returns or the growth of a hypothetical investment. Total return reflects the change in the value of an investment, assuming reinvestment of the class' dividend income and capital gains (the profits earned upon the sale of securities that have grown in value). If Fidelity had not reimbursed certain class expenses, the one year and life of fund total returns would have been lower. The $10,000 table and the fund's returns do not reflect the deduction of taxes that a shareholder would pay on fund distributions or the redemption of fund shares.
Cumulative Total Returns
|
Periods ended November 30, 2002 |
|
Past 1 |
Life of |
|
Fidelity® Adv Aggressive Growth - Institutional Class |
|
-19.61% |
-34.73% |
|
Russell Midcap® Growth |
|
-19.80% |
-43.46% |
|
Mid-Cap Funds Average |
|
-15.21% |
n/a * |
|
Mid-Cap Growth Funds Average |
|
-20.15% |
n/a * |
Cumulative total returns show Institutional Class' performance in percentage terms over a set period - in this case, one year or since the fund started on November 13, 2000. For example, if you had invested $1,000 in a fund that had a 5% return over the past year, the value of your investment would be $1,050. You can compare Institutional Class' returns to the performance of the Russell Midcap® Growth Index - a market capitalization-weighted index of medium capitalization growth-oriented stocks of U.S. domiciled corporations. You can also compare Institutional Class' performance to the performance of mutual funds tracked by Lipper Inc. and grouped by similar objectives and by portfolio characteristics and capitalization. These benchmarks include reinvested dividends and capital gains, if any.
Average Annual Total Returns
|
Periods ended November 30, 2002 |
|
Past 1 |
Life of |
|
Fidelity Adv Aggressive Growth - Institutional Class |
|
-19.61% |
-18.81% |
|
Russell Midcap Growth |
|
-19.80% |
-24.31% |
|
Mid-Cap Funds Average |
|
-15.21% |
n/a * |
|
Mid-Cap Growth Funds Average |
|
-20.15% |
n/a * |
Average annual total returns take Institutional Class' shares' cumulative return and show you what would have happened if Institutional Class' shares had performed at a constant rate each year.
* Not available
Annual Report
Fidelity Advisor Aggressive Growth Fund - Institutional Class
Performance - continued
$10,000 Over Life of Fund
Let's say hypothetically that $10,000 was invested in Fidelity® Advisor Aggressive Growth Fund - Institutional Class on November 13, 2000, when the fund started. The chart shows what the value of your investment would have been, and also shows how the Russell Midcap Growth Index did over the same period.
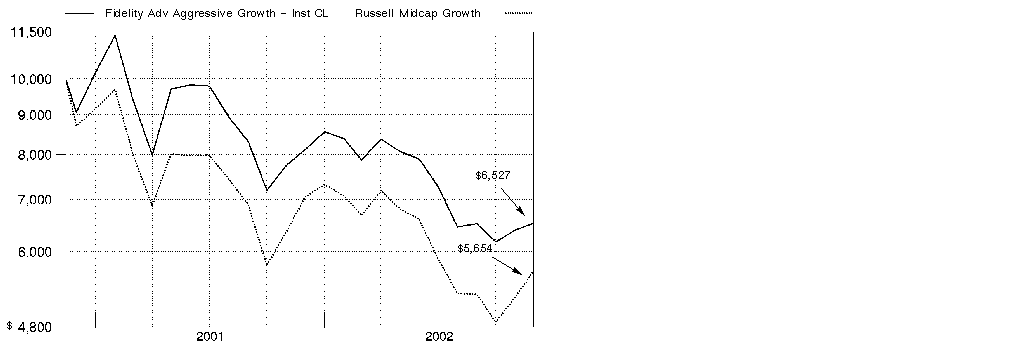
3
Understanding Performance
How a fund did yesterday is no guarantee of how it will do tomorrow. The stock market, for example, has a history of long-term growth and short-term volatility. In turn, the share price and return of a fund that invests in stocks will vary. When you sell your shares, they could be worth more or less than what you paid for them.
Annual Report
Fund Talk: The Manager's Overview
Market Recap
U.S. equity markets enjoyed an eight-week winning streak to close the 12-month period ending November 30, 2002. Ironically, the one-year period ended just as it began - with two relatively strong months assisted by an easing of interest rates by the Federal Reserve Board. The eight months in between, however, were a nightmare. A plethora of corporate accounting scandals, concerns about the possibility of a double-dip recession, and rampant fears of further terrorist attacks and a new war with Iraq ravaged a market that was still contending with the "irrational exuberance" of the late 1990s. By early October 2002, most major equity benchmarks found themselves at five- to six-year lows. Somehow, throughout all of this, American consumers remained stalwart, and their spending helped alleviate some of the burden on the U.S. economy. As signs of economic growth began to appear in the fall, along with the 12th straight cut in interest rates by the Fed, the stock market ended the period with promising upward momentum. For the year overall, however, the large-cap oriented Standard & Poor's 500SM Index dropped 16.51%; the technology- and telecommunications-dominated NASDAQ Composite® Index retreated 23.12%; and the Dow Jones Industrial AverageSM - the venerable proxy of blue-chip stock performance - slid 7.82%.
(Portfolio Manager photograph)
An interview with Rajiv Kaul, Portfolio Manager of Fidelity Advisor Aggressive Growth Fund
Q. How did the fund perform, Rajiv?
A. It performed about in line with its benchmark index but trailed its peers in a weak market environment. For the 12 months ending November 30, 2002, the fund's Institutional Class shares returned -19.61%. During the same period, the Russell Midcap Growth Index fell 19.80%, while the mid-cap funds average tracked by Lipper Inc. posted a loss of 15.21%.
Annual Report
Fund Talk: The Manager's Overview - continued
Q. What factors affected the fund's performance versus the index and Lipper average?
A. Due to the challenging environment, I positioned the fund defensively, with a large underweighting in technology - especially semiconductor firms, which tend to experience very cyclical demand that is tied to overall economic activity. This strategy worked well until the end of the period, when a rally that began in mid-October erased the fund's performance advantage over the index. Technology stocks outperformed during this rally, and the more defensive parts of the market lagged, which hurt us. For the period overall, though, my technology stock selection significantly helped the fund's relative performance. On the other hand, an overweighting in health care was a negative factor. Moreover, a number of my picks in hospital management, health insurance and medical equipment detracted from our returns compared with the index. Versus our Lipper peer group, we suffered from the outperformance of value over growth during the period under review.
Q. Health care was your largest overweighting. What did you like about the sector?
A. Some areas of health care - the services segment and some equipment companies, for example - offer an attractive mix of solid growth potential that is also relatively reliable. On the other hand, pharmaceutical and biotechnology firms are driven by product cycles. In those industries, I felt that Fidelity's research capabilities gave me an edge in helping me assess the commercial impact of new discoveries and the latest clinical results.
Q. Which stocks helped the fund's performance?
A. Redback Networks and Sonus Networks, both telecommunications infrastructure stocks that I mentioned in the report to shareholders six months ago, were positive contributors during the period. I took advantage of the tech rally at the end of 2001 to liquidate both positions after solid gains. Wilson Greatbatch, a maker of components for pacemakers and other cardiovascular devices, was another holding that did well, as the company beat earnings estimates and enjoyed strong demand from a key customer. On a relative basis, substantially underweighting index components VeriSign and Sanmina, which performed poorly, did a lot for our performance.
Q. What were the disappointments?
A. Salix Pharmaceuticals, the fund's biggest holding on average during the period, was the largest detractor. In addition to being hurt by negative publicity about other pharmaceutical and biotech companies, Salix suffered from the delayed launch of Colazol, its product for treating gastrointestinal illness. Although I still liked the long-term prospects for Salix, I sold a large chunk of our holdings late in the period due to the stock's extreme volatility. Another detractor was hospital management stock Tenet Healthcare. After doing well for most of the period, Tenet's stock plunged in October and November due to charges that the company overstated its Medicare claims to the government. Finally, despite the fund's underweighting in semiconductors, Vitesse Semiconductor was one chip company I felt good about. Sluggish demand and missed earnings estimates sidetracked the stock, however. At the end of the period, the fund had no positions in Vitesse Semiconductor, Wilson Greatbatch, VeriSign or Sanmina.
Annual Report
Q. What's your outlook, Rajiv?
A. I'll continue to look for more convincing signs of improvement in the economy before I commit the fund more heavily to the technology sector. Meanwhile, I'll concentrate on solid bottom-up analysis, trying to identify the best companies in each industry, especially those poised to benefit from favorable new product cycles or some other potentially powerful catalyst. I'll also keep a sharp eye on valuations. Tech valuations generally are not as high as they were at the height of the late-1990s bull market, but still are much higher than I would prefer to see them at this stage of the game. Of course, stronger corporate earnings could make the current level of share prices seem more attractive, but I don't see a substantial earnings rebound on the near-term horizon.
The views expressed in this report reflect those of the portfolio manager only through the end of the period of the report as stated on the cover and do not necessarily represent the views of Fidelity or any other person in the Fidelity organization. Any such views are subject to change at any time based upon market or other conditions and Fidelity disclaims any responsibility to update such views. These views may not be relied on as investment advice and, because investment decisions for a Fidelity fund are based on numerous factors, may not be relied on as an indication of trading intent on behalf of any Fidelity fund.
Fund Facts
Goal: seeks capital appreciation by normally investing primarily in common stocks
Start date: November 13, 2000
Size: as of November 30, 2002, more than $26 million
Manager: Rajiv Kaul, since 2001; joined Fidelity in 1996
3Rajiv Kaul on growth prospects for technology:
"As I look around at various segments of technology, I'm not terribly encouraged by what I see, although there are some brighter spots, including technology services, Internet gaming, wireless LANs - or local area networks - and mobile data services. For example, spending for gaming tends to be relatively independent of overall economic conditions. Instead, it's driven mostly by product cycles - whenever a hot new product appears, aficionados want to have it.
"On the other hand, the personal computer industry, which accounts for a good portion of the dollars spent on technology, is in the throes of an extended slump. A lot of consumers and corporations bought new computers in preparation for Y2K. The PC cycle used to last about three years, so some analysts have been expecting a new round of purchases to begin very soon. However, buying cycles are never ironclad - they are shaped to some extent by external circumstances. Right now, we've got two factors working against a new wave of PC buying. First, the economy is soft, with little apparent prospect of fresh demand. Second, there's no killer technology that might prompt people to upgrade. The result could be a more lengthy PC cycle than many investors anticipate."
Annual Report
Investment Changes
|
Top Ten Stocks as of November 30, 2002 |
||
|
|
% of fund's |
% of fund's net assets |
|
Boston Scientific Corp. |
2.3 |
0.6 |
|
Newmont Mining Corp. Holding Co. |
1.9 |
0.3 |
|
Taiwan Semiconductor Manufacturing Co. Ltd. sponsored ADR |
1.9 |
0.0 |
|
Colgate-Palmolive Co. |
1.5 |
0.0 |
|
Fox Entertainment Group, Inc. Class A |
1.4 |
0.3 |
|
UnitedHealth Group, Inc. |
1.4 |
0.3 |
|
Electronic Arts, Inc. |
1.4 |
0.7 |
|
Smith International, Inc. |
1.3 |
1.2 |
|
Weatherford International Ltd. |
1.3 |
1.2 |
|
Anthem, Inc. |
1.2 |
1.7 |
|
|
15.6 |
|
|
Top Five Market Sectors as of November 30, 2002 |
||
|
|
% of fund's |
% of fund's net assets |
|
Health Care |
22.5 |
27.8 |
|
Consumer Discretionary |
19.2 |
21.1 |
|
Information Technology |
11.6 |
22.7 |
|
Industrials |
8.6 |
11.8 |
|
Consumer Staples |
7.4 |
3.7 |
|
Asset Allocation (% of fund's net assets) |
|||||||
|
As of November 30, 2002 * |
As of May 31, 2002 ** |
||||||
|
Stocks 82.4% |
|
|
Stocks 103.3% |
|
||
|
Convertible |
|
|
Convertible |
|
||
|
Short-Term |
|
|
Short-Term |
|
||
|
* Foreign investments |
4.8% |
|
** Foreign investments |
13.2% |
|
||

A Short-term investments and net other assets are not included in the pie chart.
Annual Report
Investments November 30, 2002
Showing Percentage of Net Assets
|
Common Stocks - 82.4% |
|||
|
Shares |
Value (Note 1) |
||
|
CONSUMER DISCRETIONARY - 19.2% |
|||
|
Auto Components - 0.3% |
|||
|
Superior Industries International, Inc. |
1,600 |
$ 67,408 |
|
|
Automobiles - 0.7% |
|||
|
Thor Industries, Inc. |
2,400 |
91,680 |
|
|
Winnebago Industries, Inc. |
1,900 |
93,936 |
|
|
|
185,616 |
||
|
Hotels, Restaurants & Leisure - 3.7% |
|||
|
Boyd Gaming Corp. (a) |
400 |
5,700 |
|
|
Brinker International, Inc. (a) |
2,400 |
71,520 |
|
|
Darden Restaurants, Inc. |
2,400 |
51,912 |
|
|
Harrah's Entertainment, Inc. (a) |
4,060 |
162,400 |
|
|
International Game Technology (a) |
2,140 |
164,994 |
|
|
MGM Mirage, Inc. (a) |
160 |
5,416 |
|
|
Outback Steakhouse, Inc. |
1,800 |
63,900 |
|
|
Starbucks Corp. (a) |
11,840 |
257,402 |
|
|
The Cheesecake Factory, Inc. (a) |
1,700 |
60,622 |
|
|
Wendy's International, Inc. |
2,600 |
72,618 |
|
|
Yum! Brands, Inc. (a) |
2,800 |
66,948 |
|
|
|
983,432 |
||
|
Household Durables - 1.5% |
|||
|
Black & Decker Corp. |
2,190 |
94,104 |
|
|
Furniture Brands International, Inc. (a) |
1,000 |
28,000 |
|
|
Harman International Industries, Inc. |
600 |
37,440 |
|
|
Maytag Corp. |
5,910 |
182,678 |
|
|
Mohawk Industries, Inc. (a) |
700 |
43,127 |
|
|
The Stanley Works |
700 |
25,158 |
|
|
|
410,507 |
||
|
Internet & Catalog Retail - 1.0% |
|||
|
Amazon.com, Inc. (a) |
11,380 |
265,723 |
|
|
USA Interactive warrants 2/4/09 (a) |
211 |
2,268 |
|
|
|
267,991 |
||
|
Leisure Equipment & Products - 0.5% |
|||
|
Mattel, Inc. |
5,900 |
121,658 |
|
|
Media - 4.5% |
|||
|
E.W. Scripps Co. Class A |
1,700 |
134,776 |
|
|
Entercom Communications Corp. Class A (a) |
1,900 |
102,904 |
|
|
Fox Entertainment Group, Inc. Class A (a) |
14,500 |
386,570 |
|
|
Gannett Co., Inc. |
400 |
28,500 |
|
|
Getty Images, Inc. (a) |
3,400 |
101,558 |
|
|
Knight-Ridder, Inc. |
500 |
31,355 |
|
|
Common Stocks - continued |
|||
|
Shares |
Value (Note 1) |
||
|
CONSUMER DISCRETIONARY - continued |
|||
|
Media - continued |
|||
|
Lamar Advertising Co. Class A (a) |
4,200 |
$ 143,346 |
|
|
The New York Times Co. Class A |
1,500 |
72,060 |
|
|
Viacom, Inc. Class A (a) |
400 |
18,800 |
|
|
Westwood One, Inc. (a) |
4,600 |
178,802 |
|
|
|
1,198,671 |
||
|
Multiline Retail - 0.7% |
|||
|
Big Lots, Inc. (a) |
2,310 |
29,337 |
|
|
BJ's Wholesale Club, Inc. (a) |
1,670 |
32,081 |
|
|
Dollar General Corp. |
3,800 |
50,274 |
|
|
Dollar Tree Stores, Inc. (a) |
2,800 |
82,180 |
|
|
|
193,872 |
||
|
Specialty Retail - 6.3% |
|||
|
Aeropostale, Inc. |
3,700 |
53,650 |
|
|
AutoZone, Inc. (a) |
2,890 |
236,113 |
|
|
Bed Bath & Beyond, Inc. (a) |
4,850 |
168,247 |
|
|
Chico's FAS, Inc. (a) |
5,000 |
112,400 |
|
|
Christopher & Banks Corp. (a) |
1,300 |
35,425 |
|
|
Circuit City Stores, Inc. - Circuit City Group |
17,800 |
172,304 |
|
|
Gap, Inc. |
4,600 |
73,094 |
|
|
Gart Sports Co. (a) |
3,400 |
89,587 |
|
|
Hot Topic, Inc. (a) |
6,270 |
151,665 |
|
|
Limited Brands, Inc. |
1,600 |
27,216 |
|
|
Lowe's Companies, Inc. |
430 |
17,845 |
|
|
Monro Muffler Brake, Inc. (a) |
4,000 |
71,680 |
|
|
PETCO Animal Supplies, Inc. |
1,000 |
25,271 |
|
|
PETsMART, Inc. (a) |
5,100 |
94,095 |
|
|
Rent-A-Center, Inc. (a) |
500 |
24,845 |
|
|
Staples, Inc. (a) |
3,180 |
61,374 |
|
|
Talbots, Inc. |
1,300 |
39,442 |
|
|
TJX Companies, Inc. |
1,400 |
27,398 |
|
|
Too, Inc. (a) |
900 |
26,415 |
|
|
Wet Seal, Inc. Class A (a) |
5,200 |
60,008 |
|
|
Williams-Sonoma, Inc. (a) |
3,460 |
91,136 |
|
|
|
1,659,210 |
||
|
TOTAL CONSUMER DISCRETIONARY |
5,088,365 |
||
|
CONSUMER STAPLES - 7.4% |
|||
|
Beverages - 1.0% |
|||
|
Coca-Cola Enterprises, Inc. |
3,600 |
76,644 |
|
|
Common Stocks - continued |
|||
|
Shares |
Value (Note 1) |
||
|
CONSUMER STAPLES - continued |
|||
|
Beverages - continued |
|||
|
Constellation Brands, Inc. Class A (a) |
1,000 |
$ 23,520 |
|
|
Pepsi Bottling Group, Inc. |
4,620 |
132,686 |
|
|
PepsiCo, Inc. |
700 |
29,736 |
|
|
|
262,586 |
||
|
Food & Drug Retailing - 1.2% |
|||
|
CVS Corp. |
6,100 |
163,968 |
|
|
Nash-Finch Co. |
500 |
4,221 |
|
|
Performance Food Group Co. (a) |
800 |
28,160 |
|
|
Whole Foods Market, Inc. (a) |
2,200 |
116,930 |
|
|
|
313,279 |
||
|
Food Products - 2.5% |
|||
|
Dean Foods Co. (a) |
4,010 |
148,972 |
|
|
Dreyer's Grand Ice Cream, Inc. |
1,100 |
77,132 |
|
|
Fresh Del Monte Produce, Inc. |
1,000 |
22,900 |
|
|
Hershey Foods Corp. |
1,640 |
105,600 |
|
|
Kellogg Co. |
2,450 |
81,757 |
|
|
Kraft Foods, Inc. Class A |
1,700 |
63,852 |
|
|
McCormick & Co., Inc. (non-vtg.) |
1,800 |
42,822 |
|
|
Wm. Wrigley Jr. Co. |
2,190 |
117,800 |
|
|
|
660,835 |
||
|
Household Products - 1.8% |
|||
|
Clorox Co. |
2,100 |
92,064 |
|
|
Colgate-Palmolive Co. |
7,900 |
405,981 |
|
|
|
498,045 |
||
|
Personal Products - 0.5% |
|||
|
Alberto-Culver Co.: |
|
|
|
|
Class A |
700 |
32,830 |
|
|
Class B |
2,000 |
99,100 |
|
|
|
131,930 |
||
|
Tobacco - 0.4% |
|||
|
RJ Reynolds Tobacco Holdings, Inc. |
410 |
15,826 |
|
|
UST, Inc. |
2,640 |
85,008 |
|
|
|
100,834 |
||
|
TOTAL CONSUMER STAPLES |
1,967,509 |
||
|
ENERGY - 6.1% |
|||
|
Energy Equipment & Services - 5.1% |
|||
|
BJ Services Co. (a) |
3,800 |
127,110 |
|
|
Common Stocks - continued |
|||
|
Shares |
Value (Note 1) |
||
|
ENERGY - continued |
|||
|
Energy Equipment & Services - continued |
|||
|
Carbo Ceramics, Inc. |
1,200 |
$ 39,972 |
|
|
Cooper Cameron Corp. (a) |
2,850 |
146,091 |
|
|
ENSCO International, Inc. |
2,310 |
64,634 |
|
|
Input/Output, Inc. (a) |
2,560 |
13,440 |
|
|
Maverick Tube Corp. (a) |
1,200 |
15,396 |
|
|
Nabors Industries Ltd. (a) |
1,560 |
55,224 |
|
|
Noble Corp. (a) |
2,870 |
97,437 |
|
|
Patterson-UTI Energy, Inc. (a) |
2,550 |
73,976 |
|
|
Rowan Companies, Inc. |
2,000 |
42,600 |
|
|
Smith International, Inc. (a) |
10,280 |
349,520 |
|
|
Weatherford International Ltd. (a) |
8,280 |
334,015 |
|
|
|
1,359,415 |
||
|
Oil & Gas - 1.0% |
|||
|
Burlington Resources, Inc. |
2,560 |
107,827 |
|
|
EOG Resources, Inc. |
1,100 |
42,647 |
|
|
Murphy Oil Corp. |
880 |
75,451 |
|
|
Teekay Shipping Corp. |
800 |
29,864 |
|
|
|
255,789 |
||
|
TOTAL ENERGY |
1,615,204 |
||
|
FINANCIALS - 3.1% |
|||
|
Banks - 0.7% |
|||
|
Commerce Bancorp, Inc., New Jersey |
600 |
27,450 |
|
|
Fifth Third Bancorp |
1,000 |
56,000 |
|
|
New York Community Bancorp, Inc. |
1,200 |
33,456 |
|
|
North Fork Bancorp, Inc. |
1,100 |
38,291 |
|
|
Popular, Inc. |
400 |
13,452 |
|
|
TCF Financial Corp. |
300 |
12,795 |
|
|
|
181,444 |
||
|
Diversified Financials - 2.2% |
|||
|
Doral Financial Corp. |
500 |
13,475 |
|
|
Federated Investors, Inc. Class B (non-vtg.) |
2,980 |
80,609 |
|
|
Investment Technology Group, Inc. (a) |
1,500 |
44,205 |
|
|
Investors Financial Services Corp. |
2,100 |
73,458 |
|
|
LaBranche & Co., Inc. (a) |
2,000 |
60,700 |
|
|
Moody's Corp. |
3,700 |
162,874 |
|
|
SLM Corp. |
1,100 |
107,503 |
|
|
Waddell & Reed Financial, Inc. Class A |
2,400 |
49,368 |
|
|
|
592,192 |
||
|
Common Stocks - continued |
|||
|
Shares |
Value (Note 1) |
||
|
FINANCIALS - continued |
|||
|
Insurance - 0.1% |
|||
|
RenaissanceRe Holdings Ltd. |
300 |
$ 12,225 |
|
|
Real Estate - 0.1% |
|||
|
Catellus Development Corp. (a) |
1,400 |
25,564 |
|
|
TOTAL FINANCIALS |
811,425 |
||
|
HEALTH CARE - 22.5% |
|||
|
Biotechnology - 3.5% |
|||
|
Biogen, Inc. (a) |
4,000 |
176,600 |
|
|
BioMarin Pharmaceutical, Inc. (a) |
5,500 |
46,365 |
|
|
Cephalon, Inc. (a) |
1,900 |
104,120 |
|
|
Genzyme Corp. - General Division (a) |
9,100 |
298,480 |
|
|
Gilead Sciences, Inc. (a) |
2,700 |
106,596 |
|
|
IDEC Pharmaceuticals Corp. (a) |
3,660 |
120,414 |
|
|
Neurocrine Biosciences, Inc. (a) |
500 |
23,040 |
|
|
QLT, Inc. (a) |
3,400 |
34,011 |
|
|
Sangstat Medical Corp. (a) |
1,970 |
28,762 |
|
|
|
938,388 |
||
|
Health Care Equipment & Supplies - 8.0% |
|||
|
Advanced Neuromodulation Systems, Inc. (a) |
1,180 |
35,683 |
|
|
Beckman Coulter, Inc. |
700 |
20,692 |
|
|
Biomet, Inc. |
11,260 |
309,650 |
|
|
Boston Scientific Corp. (a) |
14,450 |
606,894 |
|
|
C.R. Bard, Inc. |
1,200 |
66,600 |
|
|
DENTSPLY International, Inc. |
3,980 |
133,529 |
|
|
Fisher Scientific International, Inc. (a) |
1,800 |
53,928 |
|
|
Kensey Nash Corp. (a) |
3,900 |
73,164 |
|
|
Medical Action Industries, Inc. (a) |
23,200 |
249,168 |
|
|
Resmed, Inc. (a) |
2,600 |
84,266 |
|
|
St. Jude Medical, Inc. (a) |
6,340 |
220,759 |
|
|
Stryker Corp. |
1,730 |
107,001 |
|
|
Zimmer Holdings, Inc. (a) |
4,200 |
158,088 |
|
|
|
2,119,422 |
||
|
Health Care Providers & Services - 7.6% |
|||
|
Anthem, Inc. (a) |
5,346 |
316,751 |
|
|
Caremark Rx, Inc. (a) |
7,000 |
123,620 |
|
|
Community Health Systems, Inc. (a) |
7,400 |
152,070 |
|
|
IMS Health, Inc. |
7,200 |
119,520 |
|
|
Lincare Holdings, Inc. (a) |
1,600 |
52,352 |
|
|
McKesson Corp. |
6,610 |
171,331 |
|
|
Common Stocks - continued |
|||
|
Shares |
Value (Note 1) |
||
|
HEALTH CARE - continued |
|||
|
Health Care Providers & Services - continued |
|||
|
Oxford Health Plans, Inc. (a) |
1,500 |
$ 54,780 |
|
|
Renal Care Group, Inc. (a) |
1,200 |
37,584 |
|
|
Tenet Healthcare Corp. (a) |
5,700 |
105,165 |
|
|
Triad Hospitals, Inc. (a) |
6,200 |
186,930 |
|
|
UnitedHealth Group, Inc. |
4,700 |
382,815 |
|
|
Universal Health Services, Inc. Class B (a) |
1,020 |
45,645 |
|
|
Wellpoint Health Networks, Inc. (a) |
4,220 |
277,803 |
|
|
|
2,026,366 |
||
|
Pharmaceuticals - 3.4% |
|||
|
Abbott Laboratories |
5,700 |
249,546 |
|
|
Atrix Laboratories, Inc. (a) |
5,000 |
91,400 |
|
|
Johnson & Johnson |
600 |
34,212 |
|
|
Medicines Co. (a) |
3,600 |
60,408 |
|
|
Merck & Co., Inc. |
1,000 |
59,410 |
|
|
Salix Pharmaceuticals Ltd. (a) |
15,500 |
144,305 |
|
|
Schering-Plough Corp. |
11,600 |
262,856 |
|
|
|
902,137 |
||
|
TOTAL HEALTH CARE |
5,986,313 |
||
|
INDUSTRIALS - 8.6% |
|||
|
Aerospace & Defense - 0.4% |
|||
|
Mercury Computer Systems, Inc. (a) |
1,200 |
37,476 |
|
|
Northrop Grumman Corp. |
710 |
68,806 |
|
|
|
106,282 |
||
|
Airlines - 0.0% |
|||
|
Northwest Airlines Corp. (a) |
900 |
7,578 |
|
|
Building Products - 0.7% |
|||
|
American Standard Companies, Inc. (a) |
1,790 |
133,319 |
|
|
York International Corp. |
2,100 |
52,668 |
|
|
|
185,987 |
||
|
Commercial Services & Supplies - 5.9% |
|||
|
Apollo Group, Inc. Class A (a) |
4,780 |
197,175 |
|
|
Avery Dennison Corp. |
2,200 |
141,768 |
|
|
Career Education Corp. (a) |
1,000 |
38,910 |
|
|
Cendant Corp. (a) |
5,910 |
74,348 |
|
|
ChoicePoint, Inc. (a) |
1,826 |
68,621 |
|
|
Cintas Corp. |
1,200 |
60,564 |
|
|
Concord EFS, Inc. (a) |
8,600 |
129,000 |
|
|
Common Stocks - continued |
|||
|
Shares |
Value (Note 1) |
||
|
INDUSTRIALS - continued |
|||
|
Commercial Services & Supplies - continued |
|||
|
Education Management Corp. (a) |
700 |
$ 27,048 |
|
|
Equifax, Inc. |
2,910 |
70,713 |
|
|
First Data Corp. |
3,280 |
113,619 |
|
|
H&R Block, Inc. |
5,200 |
199,316 |
|
|
Herman Miller, Inc. |
2,700 |
53,835 |
|
|
Manpower, Inc. |
1,100 |
40,997 |
|
|
Paychex, Inc. |
1,040 |
30,368 |
|
|
Robert Half International, Inc. (a) |
7,140 |
140,301 |
|
|
Sabre Holdings Corp. Class A (a) |
6,560 |
142,746 |
|
|
Total System Services, Inc. |
1,700 |
22,950 |
|
|
|
1,552,279 |
||
|
Industrial Conglomerates - 0.2% |
|||
|
3M Co. |
500 |
64,925 |
|
|
Machinery - 0.8% |
|||
|
Danaher Corp. |
2,370 |
148,931 |
|
|
Pall Corp. |
700 |
13,356 |
|
|
SPX Corp. (a) |
1,000 |
47,200 |
|
|
|
209,487 |
||
|
Trading Companies & Distributors - 0.6% |
|||
|
Fastenal Co. |
4,370 |
156,140 |
|
|
TOTAL INDUSTRIALS |
2,282,678 |
||
|
INFORMATION TECHNOLOGY - 11.6% |
|||
|
Communications Equipment - 1.5% |
|||
|
Alcatel SA sponsored ADR |
19,000 |
108,490 |
|
|
Lucent Technologies, Inc. (a) |
17,000 |
29,750 |
|
|
Nokia Corp. sponsored ADR |
13,500 |
259,335 |
|
|
|
397,575 |
||
|
Computers & Peripherals - 1.3% |
|||
|
Dell Computer Corp. (a) |
1,900 |
54,283 |
|
|
Lexmark International, Inc. Class A (a) |
4,290 |
283,741 |
|
|
|
338,024 |
||
|
Electronic Equipment & Instruments - 0.2% |
|||
|
Symbol Technologies, Inc. |
1,500 |
15,435 |
|
|
Thermo Electron Corp. |
800 |
15,672 |
|
|
Vishay Intertechnology, Inc. (a) |
800 |
11,304 |
|
|
|
42,411 |
||
|
Common Stocks - continued |
|||
|
Shares |
Value (Note 1) |
||
|
INFORMATION TECHNOLOGY - continued |
|||
|
Internet Software & Services - 0.7% |
|||
|
Yahoo!, Inc. (a) |
10,400 |
$ 190,008 |
|
|
IT Consulting & Services - 1.1% |
|||
|
Affiliated Computer Services, Inc. Class A (a) |
1,400 |
70,000 |
|
|
MPS Group, Inc. (a) |
18,200 |
109,200 |
|
|
SunGard Data Systems, Inc. (a) |
4,900 |
114,513 |
|
|
|
293,713 |
||
|
Semiconductor Equipment & Products - 2.8% |
|||
|
Atmel Corp. (a) |
8,350 |
29,309 |
|
|
Fairchild Semiconductor International, Inc. Class A (a) |
4,200 |
64,302 |
|
|
NVIDIA Corp. (a) |
300 |
5,139 |
|
|
Semtech Corp. (a) |
340 |
5,127 |
|
|
Silicon Laboratories, Inc. (a) |
200 |
5,860 |
|
|
Taiwan Semiconductor Manufacturing Co. Ltd. sponsored ADR (a) |
54,100 |
497,720 |
|
|
United Microelectronics Corp. sponsored ADR (a) |
28,300 |
128,482 |
|
|
|
735,939 |
||
|
Software - 4.0% |
|||
|
Adobe Systems, Inc. |
3,700 |
109,261 |
|
|
BEA Systems, Inc. (a) |
6,400 |
70,650 |
|
|
Citrix Systems, Inc. (a) |
2,400 |
28,200 |
|
|
Concord Communications, Inc. (a) |
9,500 |
116,375 |
|
|
Electronic Arts, Inc. (a) |
5,280 |
358,301 |
|
|
Intuit, Inc. (a) |
1,700 |
91,698 |
|
|
Network Associates, Inc. (a) |
5,400 |
98,550 |
|
|
PeopleSoft, Inc. (a) |
1,200 |
23,568 |
|
|
Rational Software Corp. (a) |
3,800 |
35,150 |
|
|
Siebel Systems, Inc. (a) |
16,200 |
137,862 |
|
|
|
1,069,615 |
||
|
TOTAL INFORMATION TECHNOLOGY |
3,067,285 |
||
|
MATERIALS - 3.1% |
|||
|
Construction Materials - 0.2% |
|||
|
Lafarge North America, Inc. |
1,500 |
48,150 |
|
|
Containers & Packaging - 0.8% |
|||
|
Owens-Illinois, Inc. (a) |
13,650 |
214,305 |
|
|
Metals & Mining - 2.1% |
|||
|
Massey Energy Corp. |
2,300 |
20,355 |
|
|
Common Stocks - continued |
|||
|
Shares |
Value (Note 1) |
||
|
MATERIALS - continued |
|||
|
Metals & Mining - continued |
|||
|
Newmont Mining Corp. Holding Co. |
21,670 |
$ 507,295 |
|
|
Nucor Corp. |
800 |
40,192 |
|
|
|
567,842 |
||
|
TOTAL MATERIALS |
830,297 |
||
|
TELECOMMUNICATION SERVICES - 0.8% |
|||
|
Diversified Telecommunication Services - 0.5% |
|||
|
AT&T Corp. |
2,780 |
77,951 |
|
|
Covad Communications Group, Inc. (a) |
38,000 |
50,920 |
|
|
|
128,871 |
||
|
Wireless Telecommunication Services - 0.3% |
|||
|
KDDI Corp. |
24 |
79,041 |
|
|
TOTAL TELECOMMUNICATION SERVICES |
207,912 |
||
|
TOTAL COMMON STOCKS (Cost $21,129,293) |
21,856,988 |
||
|
Convertible Preferred Stocks - 0.0% |
|||
|
|
|
|
|
|
CONSUMER DISCRETIONARY - 0.0% |
|||
|
Internet & Catalog Retail - 0.0% |
|||
|
USA Interactive Series A, $0.995 |
190 |
8,835 |
|
|
Money Market Funds - 18.0% |
|||
|
Shares |
Value (Note 1) |
||
|
Fidelity Cash Central Fund, 1.47% (b) |
4,780,465 |
$ 4,780,465 |
|
|
TOTAL INVESTMENT PORTFOLIO - 100.4% (Cost $25,921,831) |
26,646,288 |
||
|
NET OTHER ASSETS - (0.4)% |
(103,680) |
||
|
NET ASSETS - 100% |
$ 26,542,608 |
||
|
Legend |
|
(a) Non-income producing |
|
(b) The rate quoted is the annualized seven-day yield of the fund at period end. A complete listing of the fund's holdings as of its most recent fiscal year end is available upon request. |
|
Other Information |
|
Purchases and sales of securities, other than short-term securities, aggregated $142,563,350 and $147,274,785, respectively. |
|
The fund placed a portion of its portfolio transactions with brokerage firms which are affiliates of the investment adviser. The commissions paid to these affiliated firms were $34,780 for the period. |
|
Income Tax Information |
|
At November 30, 2002, the fund had a capital loss carryforward of approximately $16,956,000 of which $10,016,000 and $6,940,000 will expire on November 30, 2009 and 2010, respectively. |
|
The fund intends to elect to defer to its fiscal year ending November 30, 2003 approximately $282,000 of losses recognized during the period November 1, 2002 to November 30, 2002. |
See accompanying notes which are an integral part of the financial statements.
Annual Report
Financial Statements
Statement of Assets and Liabilities
|
|
November 30, 2002 |
|
|
|
|
|
|
Assets |
|
|
|
Investment in securities, at value (cost $25,921,831) - See accompanying schedule |
|
$ 26,646,288 |
|
Receivable for investments sold |
|
23,665 |
|
Receivable for fund shares sold |
|
55,095 |
|
Dividends receivable |
|
6,218 |
|
Interest receivable |
|
6,020 |
|
Receivable from investment adviser for expense reductions |
|
11,344 |
|
Other receivables |
|
14,209 |
|
Total assets |
|
26,762,839 |
|
|
|
|
|
Liabilities |
|
|
|
Payable for investments purchased |
$ 115,168 |
|
|
Payable for fund shares redeemed |
40,808 |
|
|
Accrued management fee |
13,914 |
|
|
Distribution fees payable |
14,958 |
|
|
Other payables and accrued expenses |
35,383 |
|
|
Total liabilities |
|
220,231 |
|
|
|
|
|
Net Assets |
|
$ 26,542,608 |
|
Net Assets consist of: |
|
|
|
Paid in capital |
|
$ 43,262,500 |
|
Accumulated undistributed net realized gain (loss) on investments and foreign currency transactions |
|
(17,444,349) |
|
Net unrealized appreciation (depreciation) on investments and assets and liabilities in foreign currencies |
|
724,457 |
|
Net Assets |
|
$ 26,542,608 |
See accompanying notes which are an integral part of the financial statements.
Annual Report
Financial Statements - continued
Statement of Assets and Liabilities - continued
|
|
November 30, 2002 |
|
|
|
|
|
|
Calculation of Maximum Offering Price |
|
$ 6.47 |
|
|
|
|
|
Maximum offering price per share (100/94.25 of $6.47) |
|
$ 6.86 |
|
Class T: |
|
$ 6.43 |
|
|
|
|
|
Maximum offering price per share (100/96.50 of $6.43) |
|
$ 6.66 |
|
Class B: |
|
$ 6.37 |
|
|
|
|
|
Class C: |
|
$ 6.38 |
|
|
|
|
|
Institutional Class: |
|
$ 6.52 |
A Redemption price per share is equal to net asset value less any applicable contingent deferred sales charge.
See accompanying notes which are an integral part of the financial statements.
Annual Report
Statement of Operations
|
|
Year ended November 30, 2002 |
|
|
|
|
|
|
Investment Income |
|
|
|
Dividends |
|
$ 84,614 |
|
Interest |
|
53,272 |
|
Total income |
|
137,886 |
|
|
|
|
|
Expenses |
|
|
|
Management fee |
$ 204,862 |
|
|
Transfer agent fees |
165,975 |
|
|
Distribution fees |
229,874 |
|
|
Accounting fees and expenses |
61,470 |
|
|
Non-interested trustees' compensation |
115 |
|
|
Custodian fees and expenses |
16,983 |
|
|
Registration fees |
61,109 |
|
|
Audit |
12,871 |
|
|
Legal |
1,716 |
|
|
Miscellaneous |
10,233 |
|
|
Total expenses before reductions |
765,208 |
|
|
Expense reductions |
(148,791) |
616,417 |
|
Net investment income (loss) |
|
(478,531) |
|
Realized and Unrealized Gain (Loss) Net realized gain (loss) on: |
|
|
|
Investment securities |
(6,653,830) |
|
|
Foreign currency transactions |
(1,863) |
|
|
Total net realized gain (loss) |
|
(6,655,693) |
|
Change in net unrealized appreciation (depreciation) on: Investment securities |
|
(175,472) |
|
Net gain (loss) |
|
(6,831,165) |
|
Net increase (decrease) in net assets resulting from operations |
|
$ (7,309,696) |
See accompanying notes which are an integral part of the financial statements.
Annual Report
Financial Statements - continued
Statement of Changes in Net Assets
|
|
Year ended |
Year ended |
|
Increase (Decrease) in Net Assets |
|
|
|
Operations |
|
|
|
Net investment income (loss) |
$ (478,531) |
$ (193,523) |
|
Net realized gain (loss) |
(6,655,693) |
(10,633,685) |
|
Change in net unrealized appreciation (depreciation) |
(175,472) |
1,723,136 |
|
Net increase (decrease) in net assets resulting |
(7,309,696) |
(9,104,072) |
|
Distributions to shareholders from net realized gain |
- |
(22,418) |
|
Share transactions - net increase (decrease) |
(963,336) |
36,177,370 |
|
Total increase (decrease) in net assets |
(8,273,032) |
27,050,880 |
|
|
|
|
|
Net Assets |
|
|
|
Beginning of period |
34,815,640 |
7,764,760 |
|
End of period |
$ 26,542,608 |
$ 34,815,640 |
See accompanying notes which are an integral part of the financial statements.
Annual Report
Financial Highlights - Class A
|
Years ended November 30, |
2002 |
2001 |
2000 F |
|
Selected Per-Share Data |
|
|
|
|
Net asset value, beginning of period |
$ 8.08 |
$ 9.05 |
$ 10.00 |
|
Income from Investment Operations |
|
|
|
|
Net investment income (loss) E |
(.08) |
(.01) |
- |
|
Net realized and unrealized gain (loss) |
(1.53) |
(.95) |
(.95) |
|
Total from investment operations |
(1.61) |
(.96) |
(.95) |
|
Distributions from net realized gain |
- |
(.01) |
- |
|
Net asset value, end of period |
$ 6.47 |
$ 8.08 |
$ 9.05 |
|
Total Return B,C,D |
(19.93)% |
(10.62)% |
(9.50)% |
|
Ratios to Average Net Assets G |
|
|
|
|
Expenses before expense reductions |
2.05% |
2.06% |
31.94% A |
|
Expenses net of voluntary waivers, if any |
1.69% |
1.75% |
1.75% A |
|
Expenses net of all reductions |
1.49% |
1.71% |
1.75% A |
|
Net investment income (loss) |
(1.07)% |
(.14)% |
.99% A |
|
Supplemental Data |
|
|
|
|
Net assets, end of period (000 omitted) |
$ 2,620 |
$ 3,320 |
$ 1,789 |
|
Portfolio turnover rate |
473% |
481% |
139% A |
B Total returns for periods of less than one year are not annualized.
C Total returns would have been lower had certain expenses not been reduced during the periods shown.
D Total returns do not include the effect of the sales charges.
E Calculated based on average shares outstanding during the period.
F For the period November 13, 2000 (commencement of operations) to November 30, 2000.
G Expense ratios reflect operating expenses of the class. Expenses before reductions do not reflect amounts reimbursed by the investment adviser or reductions from directed brokerage or other expense offset arrangements and do not represent the amount paid by the class during periods when reimbursements or reductions occur. Expense ratios before reductions for start-up periods may not be representative of longer-term operating periods. Expenses net of any voluntary waivers reflects expenses after reimbursement by the investment adviser but prior to reductions from directed brokerage or other expense offset arrangements. Expenses net of all reductions represent the net expenses paid by the class.
See accompanying notes which are an integral part of the financial statements.
Annual Report
Financial Highlights - Class T
|
Years ended November 30, |
2002 |
2001 |
2000 F |
|
Selected Per-Share Data |
|
|
|
|
Net asset value, beginning of period |
$ 8.06 |
$ 9.05 |
$ 10.00 |
|
Income from Investment Operations |
|
|
|
|
Net investment income (loss) E |
(.10) |
(.03) |
- |
|
Net realized and unrealized gain (loss) |
(1.53) |
(.95) |
(.95) |
|
Total from investment operations |
(1.63) |
(.98) |
(.95) |
|
Distributions from net realized gain |
- |
(.01) |
- |
|
Net asset value, end of period |
$ 6.43 |
$ 8.06 |
$ 9.05 |
|
Total Return B,C,D |
(20.22)% |
(10.84)% |
(9.50)% |
|
Ratios to Average Net Assets G |
|
|
|
|
Expenses before expense reductions |
2.16% |
2.30% |
32.36% A |
|
Expenses net of voluntary waivers, if any |
1.92% |
2.00% |
2.00% A |
|
Expenses net of all reductions |
1.72% |
1.96% |
2.00% A |
|
Net investment income (loss) |
(1.29)% |
(.39)% |
.74% A |
|
Supplemental Data |
|
|
|
|
Net assets, end of period (000 omitted) |
$ 10,511 |
$ 14,165 |
$ 2,767 |
|
Portfolio turnover rate |
473% |
481% |
139% A |
A Annualized
B Total returns for periods of less than one year are not annualized.
C Total returns would have been lower had certain expenses not been reduced during the periods shown.
D Total returns do not include the effect of the sales charges.
E Calculated based on average shares outstanding during the period.
F For the period November 13, 2000 (commencement of operations) to November 30, 2000.
G Expense ratios reflect operating expenses of the class. Expenses before reductions do not reflect amounts reimbursed by the investment adviser or reductions from directed brokerage or other expense offset arrangements and do not represent the amount paid by the class during periods when reimbursements or reductions occur. Expense ratios before reductions for start-up periods may not be representative of longer-term operating periods. Expenses net of any voluntary waivers reflects expenses after reimbursement by the investment adviser but prior to reductions from directed brokerage or other expense offset arrangements. Expenses net of all reductions represent the net expenses paid by the class.
See accompanying notes which are an integral part of the financial statements.
Annual Report
Financial Highlights - Class B
|
Years ended November 30, |
2002 |
2001 |
2000 F |
|
Selected Per-Share Data |
|
|
|
|
Net asset value, beginning of period |
$ 8.02 |
$ 9.05 |
$ 10.00 |
|
Income from Investment Operations |
|
|
|
|
Net investment income (loss) E |
(.13) |
(.08) |
- |
|
Net realized and unrealized gain (loss) |
(1.52) |
(.94) |
(.95) |
|
Total from investment operations |
(1.65) |
(1.02) |
(.95) |
|
Distributions from net realized gain |
- |
(.01) |
- |
|
Net asset value, end of period |
$ 6.37 |
$ 8.02 |
$ 9.05 |
|
Total Return B,C,D |
(20.57)% |
(11.29)% |
(9.50)% |
|
Ratios to Average Net Assets G |
|
|
|
|
Expenses before expense reductions |
2.73% |
2.86% |
32.87% A |
|
Expenses net of voluntary waivers, if any |
2.43% |
2.50% |
2.50% A |
|
Expenses net of all reductions |
2.23% |
2.46% |
2.50% A |
|
Net investment income (loss) |
(1.81)% |
(.89)% |
.24% A |
|
Supplemental Data |
|
|
|
|
Net assets, end of period (000 omitted) |
$ 6,262 |
$ 8,038 |
$ 1,659 |
|
Portfolio turnover rate |
473% |
481% |
139% A |
A Annualized
B Total returns for periods of less than one year are not annualized.
C Total returns would have been lower had certain expenses not been reduced during the periods shown.
D Total returns do not include the effect of the contingent deferred sales charge.
E Calculated based on average shares outstanding during the period.
F For the period November 13, 2000 (commencement of operations) to November 30, 2000.
G Expense ratios reflect operating expenses of the class. Expenses before reductions do not reflect amounts reimbursed by the investment adviser or reductions from directed brokerage or other expense offset arrangements and do not represent the amount paid by the class during periods when reimbursements or reductions occur. Expense ratios before reductions for start-up periods may not be representative of longer-term operating periods. Expenses net of any voluntary waivers reflects expenses after reimbursement by the investment adviser but prior to reductions from directed brokerage or other expense offset arrangements. Expenses net of all reductions represent the net expenses paid by the class.
See accompanying notes which are an integral part of the financial statements.
Annual Report
Financial Highlights - Class C
|
Years ended November 30, |
2002 |
2001 |
2000 F |
|
Selected Per-Share Data |
|
|
|
|
Net asset value, beginning of period |
$ 8.03 |
$ 9.05 |
$ 10.00 |
|
Income from Investment Operations |
|
|
|
|
Net investment income (loss) E |
(.13) |
(.08) |
- |
|
Net realized and unrealized gain (loss) |
(1.52) |
(.93) |
(.95) |
|
Total from investment operations |
(1.65) |
(1.01) |
(.95) |
|
Distributions from net realized gain |
- |
(.01) |
- |
|
Net asset value, end of period |
$ 6.38 |
$ 8.03 |
$ 9.05 |
|
Total Return B,C,D |
(20.55)% |
(11.18)% |
(9.50)% |
|
Ratios to Average Net Assets G |
|
|
|
|
Expenses before expense reductions |
2.58% |
2.79% |
32.69% A |
|
Expenses net of voluntary waivers, if any |
2.36% |
2.50% |
2.50% A |
|
Expenses net of all reductions |
2.16% |
2.46% |
2.50% A |
|
Net investment income (loss) |
(1.74)% |
(.89)% |
.24% A |
|
Supplemental Data |
|
|
|
|
Net assets, end of period (000 omitted) |
$ 6,636 |
$ 8,532 |
$ 1,224 |
|
Portfolio turnover rate |
473% |
481% |
139% A |
A Annualized
B Total returns for periods of less than one year are not annualized.
C Total returns would have been lower had certain expenses not been reduced during the periods shown.
D Total returns do not include the effect of the contingent deferred sales charge.
E Calculated based on average shares outstanding during the period.
F For the period November 13, 2000 (commencement of operations) to November 30, 2000.
G Expense ratios reflect operating expenses of the class. Expenses before reductions do not reflect amounts reimbursed by the investment adviser or reductions from directed brokerage or other expense offset arrangements and do not represent the amount paid by the class during periods when reimbursements or reductions occur. Expense ratios before reductions for start-up periods may not be representative of longer-term operating periods. Expenses net of any voluntary waivers reflects expenses after reimbursement by the investment adviser but prior to reductions from directed brokerage or other expense offset arrangements. Expenses net of all reductions represent the net expenses paid by the class.
See accompanying notes which are an integral part of the financial statements.
Annual Report
Financial Highlights - Institutional Class
|
Years ended November 30, |
2002 |
2001 |
2000 E |
|
Selected Per-Share Data |
|
|
|
|
Net asset value, beginning of period |
$ 8.11 |
$ 9.06 |
$ 10.00 |
|
Income from Investment Operations |
|
|
|
|
Net investment income (loss) D |
(.05) |
.01 |
.01 |
|
Net realized and unrealized gain (loss) |
(1.54) |
(.95) |
(.95) |
|
Total from investment operations |
(1.59) |
(.94) |
(.94) |
|
Distributions from net realized gain |
- |
(.01) |
- |
|
Net asset value, end of period |
$ 6.52 |
$ 8.11 |
$ 9.06 |
|
Total Return B,C |
(19.61)% |
(10.39)% |
(9.40)% |
|
Ratios to Average Net Assets F |
|
|
|
|
Expenses before expense reductions |
1.43% |
1.73% |
31.51% A |
|
Expenses net of voluntary waivers, if any |
1.27% |
1.50% |
1.50% A |
|
Expenses net of all reductions |
1.07% |
1.46% |
1.50% A |
|
Net investment income (loss) |
(.64)% |
.11% |
1.24% A |
|
Supplemental Data |
|
|
|
|
Net assets, end of period (000 omitted) |
$ 513 |
$ 761 |
$ 325 |
|
Portfolio turnover rate |
473% |
481% |
139% A |
A Annualized
B Total returns for periods of less than one year are not annualized.
C Total returns would have been lower had certain expenses not been reduced during the periods shown.
D Calculated based on average shares outstanding during the period.
E For the period November 13, 2000 (commencement of operations) to November 30, 2000.
F Expense ratios reflect operating expenses of the class. Expenses before reductions do not reflect amounts reimbursed by the investment adviser or reductions from directed brokerage or other expense offset arrangements and do not represent the amount paid by the class during periods when reimbursements or reductions occur. Expense ratios before reductions for start-up periods may not be representative of longer-term operating periods. Expenses net of any voluntary waivers reflects expenses after reimbursement by the investment adviser but prior to reductions from directed brokerage or other expense offset arrangements. Expenses net of all reductions represent the net expenses paid by the class.
See accompanying notes which are an integral part of the financial statements.
Annual Report
Notes to Financial Statements
For the period ended November 30, 2002
1. Significant Accounting Policies.
Fidelity Advisor Aggressive Growth Fund (the fund) is a fund of Fidelity Securities Fund (the trust) and is authorized to issue an unlimited number of shares. The trust is registered under the Investment Company Act of 1940, as amended (the 1940 Act), as an open-end management investment company organized as a Massachusetts business trust.
The fund offers Class A, Class T, Class B, Class C, and Institutional Class shares, each of which has equal rights as to assets and voting privileges. Each class has exclusive voting rights with respect to matters that affect that class. Class B shares will automatically convert to Class A shares after a holding period of seven years from the initial date of purchase. Investment income, realized and unrealized capital gains and losses, the common expenses of the fund, and certain fund-level expense reductions, if any, are allocated on a pro rata basis to each class based on the relative net assets of each class to the total net assets of the fund. Each class differs with respect to transfer agent and distribution and service plan fees incurred. Certain expense reductions also differ by class.
The financial statements have been prepared in conformity with accounting principles generally accepted in the United States of America, which require management to make certain estimates and assumptions at the date of the financial statements. The following summarizes the significant accounting policies of the fund:
Security Valuation. Net asset value per share (NAV calculation) is calculated as of the close of business of the New York Stock Exchange, normally 4:00 p.m. Eastern time. Equity securities for which market quotations are available are valued at the last sale price or official closing price (closing bid price or last evaluated quote if no sale has occurred) on the primary market or exchange on which they trade. If an event that is expected to materially affect the value of a security occurs after the close of an exchange or market on which that security trades, but prior to the NAV calculation, then that security will be fair valued taking the event into account. Securities (including restricted securities) for which market quotations are not readily available are valued at their fair value as determined in good faith under consistently applied procedures under the general supervision of the Board of Trustees. Price movements in futures contracts and ADRs, market and trading trends, the bid/ask quotes of brokers and off-exchange institutional trading may be reviewed in the course of making a good faith determination of a security's fair value. Short-term securities with remaining maturities of sixty days or less for which quotations are not readily available are valued on the basis of amortized cost. Investments in open-end investment companies are valued at their net asset value each business day.
Annual Report
Notes to Financial Statements - continued
1. Significant Accounting Policies - continued
Foreign Currency. The fund uses foreign currency contracts to facilitate transactions in foreign-denominated securities. Losses from these transactions may arise from changes in the value of the foreign currency or if the counterparties do not perform under the contracts' terms.
Foreign denominated assets, including investment securities, and liabilities are translated into U.S. dollars at the exchange rate at period end. Purchases and sales of investment securities, income and dividends received and expenses denominated in foreign currencies are translated into U.S. dollars at the exchange rate in effect on the transaction date.
The effects of exchange rate fluctuations on investments are included with the net realized and unrealized gain (loss) on investment securities. Other foreign currency transactions resulting in realized and unrealized gain (loss) are disclosed separately.
Investment Transactions and Income. Security transactions are accounted for as of trade date. Gains and losses on securities sold are determined on the basis of identified cost. Dividend income is recorded on the ex-dividend date, except for certain dividends from foreign securities where the ex-dividend date may have passed, which are recorded as soon as the fund is informed of the ex-dividend date. Non-cash dividends included in dividend income, if any, are recorded at the fair market value of the securities received. Interest income, which includes amortization of premium and accretion of discount on debt securities, as required, is accrued as earned. Investment income is recorded net of foreign taxes withheld where recovery of such taxes is uncertain.
Expenses. Most expenses of the trust can be directly attributed to a fund. Expenses which cannot be directly attributed are apportioned among the funds in the trust.
Income Tax Information and Distributions to Shareholders. Each year the fund intends to qualify as a regulated investment company under Subchapter M of the Internal Revenue Code. As a result, no provision for income taxes is required. Foreign taxes are provided for based on each fund's understanding of the tax rules and rates that exist in the foreign markets in which it invests. Income dividends and capital gain distributions are declared separately for each class. Distributions are recorded on the ex-dividend date.
Income and capital gain distributions are determined in accordance with income tax regulations, which may differ from generally accepted accounting principles. Capital accounts within the financial statements are adjusted for permanent and temporary book and tax differences. These adjustments have no impact on net assets or the results of operations. Temporary differences will reverse in a subsequent period. These differences are primarily due to foreign currency transactions, prior period premium and
Annual Report
1. Significant Accounting Policies - continued
Income Tax Information and Distributions to Shareholders - continued
discount on debt securities, net operating losses, capital loss carryforwards, and losses deferred due to wash sales and excise tax regulations.
The tax-basis components of distributable earnings and the federal tax cost as of period end was as follows:
|
Unrealized appreciation |
$ 2,239,336 |
|
|
Unrealized depreciation |
(1,721,922) |
|
|
Net unrealized appreciation (depreciation) |
517,414 |
|
|
Capital loss carryforward |
(16,955,568) |
|
|
Total Distributable earnings |
$ (16,438,154) |
|
|
Cost for federal income tax purposes |
$ 26,128,874 |
|
Change in Accounting Principle. Effective December 1, 2001, the fund adopted the provisions of the AICPA Audit and Accounting Guide for Investment Companies and began amortizing premium and discount on all debt securities, as required. The cumulative effect of this accounting change had no impact on total net assets of the fund, but resulted in a $3,235 increase to the cost of securities held and a corresponding increase to accumulated net undistributed realized gain (loss), based on securities held by the fund on December 1, 2001.
2. Operating Policies.
Repurchase Agreements. Fidelity Management & Research Company (FMR) has received an Exemptive Order from the Securities and Exchange Commission (the SEC) which permits the fund and other affiliated entities of FMR to transfer uninvested cash balances into joint trading accounts. These accounts are then invested in repurchase agreements that are collateralized by U.S. Treasury or Government obligations. The fund may also invest directly with institutions, in repurchase agreements that are collateralized by commercial paper obligations and corporate obligations. The custodian bank receives the collateral, which is marked-to-market daily and maintained at a value at least equal to the principal amount of the repurchase agreement (including accrued interest).
3. Purchases and Sales of Investments.
Information regarding purchases and sales of securities is included under the caption "Other Information" at the end of the fund's Schedule of Investments.
Annual Report
Notes to Financial Statements - continued
4. Fees and Other Transactions with Affiliates.
Management Fee. FMR and its affiliates provide the fund with investment management related services for which the fund pays a monthly management fee.
The management fee is the sum of an individual fund fee rate of .35% of the fund's average net assets and a group fee rate that averaged .28% during the period. The group fee rate is based upon the average net assets of all the mutual funds advised by FMR. The group fee rate decreases as assets under management increase and increases as assets under management decrease. For the period, the total annual management fee rate was .63% of the fund's average net assets.
Distribution and Service Plan. In accordance with Rule 12b-1 of the 1940 Act, the Fund has adopted separate Distribution and Service Plans for each class of shares. Certain classes pay Fidelity Distributors Corporation (FDC), an affiliate of FMR, separate Distribution and Service Fees, each of which is based on an annual percentage of each class' average net assets. Class A and Class T Plans also authorize the use of brokerage commissions to pay distribution expenses. In addition, FDC may pay financial intermediaries for selling shares of the fund and providing shareholder support services. For the period, the Distribution and Service Fee rates, the total amounts paid to and retained by FDC and the amount of distribution expenses paid with brokerage commissions were as follows:
|
|
Distribution |
Service |
Paid to |
Retained |
Paid with |
|
Class A |
.02% |
.25% |
$ 8,124 |
$ 89 |
$ $628 |
|
Class T |
.27% |
.25% |
71,103 |
151 |
2,702 |
|
Class B |
.75% |
.25% |
72,291 |
54,218 |
- |
|
Class C |
.75% |
.25% |
78,356 |
21,574 |
- |
|
|
|
|
$ 229,874 |
$ 76,032 |
$ 3,330 |
Sales Load. FDC receives a front-end sales charge of up to 5.75% for selling Class A shares, and 3.50% for selling Class T shares of the fund. FDC receives the proceeds of contingent deferred sales charges (CDSC) levied on Class A, Class T, Class B, and Class C redemptions. These charges depend on the holding period. The deferred sales charges range from 5% to 1% for Class B, 1% for Class C, and .25% for certain purchases of Class A and Class T shares.
Annual Report
4. Fees and Other Transactions with Affiliates - continued
Sales Load - continued
For the period, sales charge amounts paid to and retained by FDC were as follows:
|
|
Paid to |
Retained |
|
Class A |
$ 27,184 |
$ 7,186 |
|
Class T |
44,784 |
7,875 |
|
Class B* |
31,520 |
31,520 |
|
Class C* |
2,366 |
2,366 |
|
|
$ 105,854 |
$ 48,947 |
* When Class B and Class C shares are initially sold, FDC pays commissions from its own resources to financial intermediaries through which the sales are made.
Transfer Agent Fees. Fidelity Investments Institutional Operations Company, Inc. (FIIOC), an affiliate of FMR, is the transfer, dividend disbursing and shareholder servicing agent (collectively referred to as the transfer agent) for each class of the fund. FIIOC receives account fees and asset-based fees that vary according to the account size and type of account of the shareholders of the respective classes of the fund. FIIOC pays for typesetting, printing and mailing of all shareholder reports, except proxy statements. For the period, the following amounts were paid to FIIOC:
|
|
Amount |
% of |
|
Class A |
$ 19,216 |
.64 |
|
Class T |
68,306 |
.50 |
|
Class B |
42,072 |
.58 |
|
Class C |
34,340 |
.44 |
|
Institutional Class |
2,041 |
.29 |
|
|
$ 165,975 |
|
Accounting Fees. Fidelity Service Company, Inc. (FSC), an affiliate of FMR, maintains the fund's accounting records. The fee is based on the level of average net assets for the month plus out-of-pocket expenses.
Central Funds. The fund may invest in affiliated Central Funds managed by Fidelity Investments Money Management, Inc. (FIMM), an affiliate of FMR. The Central Funds are open-end investment companies available only to investment companies and other accounts managed by FMR and its affiliates. The Central Funds seek preservation of capital and current income and do not pay a management fee. Income distributions earned by the fund are recorded as income in the accompanying financial statements and totaled $43,634 for the period.
Annual Report
Notes to Financial Statements - continued
4. Fees and Other Transactions with Affiliates - continued
Brokerage Commissions. The fund placed a portion of its portfolio transactions with brokerage firms which are affiliates of the investment adviser. The commissions paid to these affiliated firms are shown under the caption "Other Information" at the end of the fund's Schedule of Investments.
5. Committed Line of Credit.
The fund participates with other funds managed by FMR in a $3.5 billion credit facility (the "line of credit") to be utilized for temporary or emergency purposes to fund shareholder redemptions or for other short-term liquidity purposes. The fund has agreed to pay commitment fees on its pro rata portion of the line of credit. During the period, there were no borrowings on this line of credit.
6. Expense Reductions.
FMR agreed to reimburse the classes of the fund to the extent operating expenses exceeded certain levels of average net assets as noted in the table below. Some expenses, for example interest expense, are excluded from this reimbursement.
|
|
Expense |
Reimbursement |
|
|
|
|
|
Class A |
1.75%-*1.50% |
$ 10,823 |
|
Class T |
2.00%-*1.75% |
33,640 |
|
Class B |
2.50%-*2.25% |
21,336 |
|
Class C |
2.50%-*2.25% |
17,293 |
|
Institutional Class |
1.50%-*1.25% |
1,144 |
|
|
|
$ 84,236 |
* Expense limitation in effect at period-end.
Many of the brokers with whom FMR places trades on behalf of the fund provided services to the fund in addition to trade execution. These services may include payments of expenses on behalf of the fund to support distribution of fund shares for Class A and Class T ("Distribution Expense Reductions") and to pay other fund expenses, such as custody fees ("Other Expense Reductions") collectively referred to as "Directed Brokerage" in the accompanying table. Directed brokerage generally benefits all shareholders of
Annual Report
6. Expense Reductions - continued
each class by reducing fund expenses. Each of Class A and Class T shareholders' Other Expense Reduction benefit is reduced by the amount of its Distribution Expense Reduction. All of the applicable expense reductions are noted in the table below.
|
|
Directed |
|
|
|
Distribution |
Other |
|
|
|
|
|
Fund Level |
$ |
$ 61,225 |
|
Class A |
628 |
|
|
Class T |
2,702 |
|
|
|
$ 3,330 |
$ 61,225 |
7. Distributions to Shareholders.
Distributions to shareholders of each class were as follows:
|
|
Year ended |
Year ended |
|
From net realized gain |
|
|
|
Class A |
$ - |
$ 3,027 |
|
Class T |
- |
9,442 |
|
Class B |
- |
4,873 |
|
Class C |
- |
4,440 |
|
Institutional Class |
- |
636 |
|
Total |
$ - |
$ 22,418 |
Annual Report
Notes to Financial Statements - continued
8. Share Transactions.
Transactions for each class of shares were as follows:
|
|
Shares |
Dollars |
||
|
|
Years ended November 30, |
Years ended November 30, |
||
|
|
2002 |
2001 |
2002 |
2001 |
|
Class A |
|
|
|
|
|
Shares sold |
165,182 |
444,403 |
$ 1,240,636 |
$ 4,306,002 |
|
Reinvestment of distributions |
- |
207 |
- |
1,935 |
|
Shares redeemed |
(171,008) |
(231,476) |
(1,293,424) |
(2,054,651) |
|
Net increase (decrease) |
(5,826) |
213,134 |
$ (52,788) |
$ 2,253,286 |
|
Class T |
|
|
|
|
|
Shares sold |
903,899 |
2,239,199 |
$ 7,000,780 |
$ 21,822,601 |
|
Reinvestment of distributions |
- |
938 |
- |
8,749 |
|
Shares redeemed |
(1,027,358) |
(788,246) |
(7,601,666) |
(6,792,125) |
|
Net increase (decrease) |
(123,459) |
1,451,891 |
$ (600,886) |
$ 15,039,225 |
|
Class B |
|
|
|
|
|
Shares sold |
347,968 |
1,146,833 |
$ 2,574,720 |
$ 11,147,186 |
|
Reinvestment of distributions |
- |
459 |
- |
4,280 |
|
Shares redeemed |
(366,934) |
(328,386) |
(2,702,296) |
(2,750,504) |
|
Net increase (decrease) |
(18,966) |
818,906 |
$ (127,576) |
$ 8,400,962 |
|
Class C |
|
|
|
|
|
Shares sold |
378,395 |
1,236,726 |
$ 2,890,698 |
$ 12,477,205 |
|
Reinvestment of distributions |
- |
436 |
- |
4,074 |
|
Shares redeemed |
(400,792) |
(309,914) |
(2,983,429) |
(2,603,523) |
|
Net increase (decrease) |
(22,397) |
927,248 |
$ (92,731) |
$ 9,877,756 |
|
Institutional Class |
|
|
|
|
|
Shares sold |
27,286 |
97,418 |
$ 220,096 |
$ 957,774 |
|
Reinvestment of distributions |
- |
57 |
- |
532 |
|
Shares redeemed |
(42,260) |
(39,613) |
(309,451) |
(352,165) |
|
Net increase (decrease) |
(14,974) |
57,862 |
$ (89,355) |
$ 606,141 |
Annual Report
Report of Independent Accountants
To the Trustees of Fidelity Securities Fund and the Shareholders of Fidelity Advisor Aggressive Growth Fund:
In our opinion, the accompanying statement of assets and liabilities, including the schedule of investments, and the related statements of operations and of changes in net assets and the financial highlights present fairly, in all material respects, the financial position of Fidelity Advisor Aggressive Growth Fund (a fund of Fidelity Securities Fund) at November 30, 2002 and the results of its operations, the changes in its net assets and the financial highlights for the periods indicated, in conformity with accounting principles generally accepted in the United States of America. These financial statements and financial highlights (hereafter referred to as "financial statements") are the responsibility of the Fidelity Advisor Aggressive Growth Fund's management; our responsibility is to express an opinion on these financial statements based on our audits. We conducted our audits of these financial statements in accordance with auditing standards generally accepted in the United States of America which require that we plan and perform the audit to obtain reasonable assurance about whether the financial statements are free of material misstatement. An audit includes examining, on a test basis, evidence supporting the amounts and disclosures in the financial statements, assessing the accounting principles used and significant estimates made by management, and evaluating the overall financial statement presentation. We believe that our audits, which included confirmation of securities at November 30, 2002 by correspondence with the custodian and brokers, provide a reasonable basis for our opinion.
/s/ PricewaterhouseCoopers LLP
PricewaterhouseCoopers LLP
Boston, Massachusetts
January 10, 2003
Annual Report
Trustees and Officers
The Trustees and executive officers of the trust and fund, as applicable, are listed below. The Board of Trustees governs the fund and is responsible for protecting the interests of shareholders. The Trustees are experienced executives who meet periodically throughout the year to oversee the fund's activities, review contractual arrangements with companies that provide services to the fund, and review the fund's performance. Except for William O. McCoy, each of the Trustees oversees 269 funds advised by FMR or an affiliate. Mr. McCoy oversees 271 funds advised by FMR or an affiliate.
The Trustees hold office without limit in time except that (a) any Trustee may resign; (b) any Trustee may be removed by written instrument, signed by at least two-thirds of the number of Trustees prior to such removal; (c) any Trustee who requests to be retired or who has become incapacitated by illness or injury may be retired by written instrument signed by a majority of the other Trustees; and (d) any Trustee may be removed at any special meeting of shareholders by a two-thirds vote of the outstanding voting securities of the trust. In any event, each non-interested Trustee shall retire not later than the last day of the calendar year in which his or her 72nd birthday occurs. The executive officers hold office without limit in time, except that any officer may resign or may be removed by a vote of a majority of the Trustees at any regular meeting or any special meeting of the Trustees. Except as indicated, each individual has held the office shown or other offices in the same company for the past five years.
The fund's Statement of Additional Information (SAI) includes more information about the Trustees. To request a free copy, call Fidelity at 1-877-208-0098.
Interested Trustees*:
Correspondence intended for each Trustee who is an "interested person" (as defined in the 1940 Act) may be sent to 82 Devonshire Street, Boston, Massachusetts 02109.
|
Name, Age; Principal Occupation |
|
|
Edward C. Johnson 3d (72)** |
|
|
|
Year of Election or Appointment: 1984 Trustee of Fidelity Securities Fund. Mr. Johnson is Chairman of the Board of Trustees. Mr. Johnson serves as Chief Executive Officer, Chairman, and a Director of FMR Corp.; a Director and Chairman of the Board and of the Executive Committee of FMR; Chairman and a Director of Fidelity Management & Research (Far East) Inc.; Chairman (1998) and a Director of Fidelity Investments Money Management, Inc.; and Chairman (2001) and a Director (2000) of FMR Co., Inc. |
|
Abigail P. Johnson (40)** |
|
|
|
Year of Election or Appointment: 2001 Senior Vice President of Advisor Aggressive Growth (2001). Ms. Johnson also serves as Senior Vice President of other Fidelity funds (2001). She is President and a Director of FMR (2001), Fidelity Investments Money Management, Inc. (2001), FMR Co., Inc. (2001), and a Director of FMR Corp. Previously, Ms. Johnson managed a number of Fidelity funds. |
|
Peter S. Lynch (59) |
|
|
|
Year of Election or Appointment: 1990 Vice Chairman and a Director of FMR, and Vice Chairman (2001) and a Director (2000) of FMR Co., Inc. Prior to May 31, 1990, he was a Director of FMR and Executive Vice President of FMR (a position he held until March 31, 1991), Vice President of Fidelity® Magellan® Fund and FMR Growth Group Leader, and Managing Director of FMR Corp. Mr. Lynch was also Vice President of Fidelity Investments Corporate Services. In addition, he serves as a Trustee of Boston College, Massachusetts Eye & Ear Infirmary, Historic Deerfield, John F. Kennedy Library, and the Museum of Fine Arts of Boston. |
* Trustees have been determined to be "Interested Trustees" by virtue of, among other things, their affiliation with the trust or various entities under common control with FMR.
** Edward C. Johnson 3d, Trustee, is Abigail P. Johnson's father.
Annual Report
Non-Interested Trustees:
Correspondence intended for each non-interested Trustee (that is, the Trustees other than the Interested Trustees) may be sent to Fidelity Investments, P.O. Box 55235, Boston, Massachusetts 02205-5235.
|
Name, Age; Principal Occupation |
|
|
J. Michael Cook (60) |
|
|
|
Year of Election or Appointment: 2001 Prior to Mr. Cook's retirement in May 1999, he served as Chairman and Chief Executive Officer of Deloitte & Touche LLP (accounting/consulting), Chairman of the Deloitte & Touche Foundation, and a member of the Board of Deloitte Touche Tohmatsu. He currently serves as a Director of Comcast (telecommunications, 2002), International Flavors & Fragrances, Inc. (2000), Rockwell Automation International (2000), The Dow Chemical Company (2000), and HCA - The Healthcare Company (1999). He is a Member of the Advisory Board of the Securities Regulation Institute and of the Directorship Group, Chairman Emeritus of the Board of Catalyst (a leading organization for the advancement of women in business), and is Chairman of the Accountability Advisory Panel to the Comptroller General of the United States. He also serves as a member of the Board of Overseers of the Columbia Business School and a Member of the Advisory Board of the Graduate School of Business of the University of Florida, his alma mater. |
|
Ralph F. Cox (70) |
|
|
|
Year of Election or Appointment: 1991 Mr. Cox is President of RABAR Enterprises (management consulting for the petroleum industry). Prior to February 1994, he was President of Greenhill Petroleum Corporation (petroleum exploration and production). Until March 1990, Mr. Cox was President and Chief Operating Officer of Union Pacific Resources Company (exploration and production). He is a Director of CH2M Hill Companies (engineering), and Abraxas Petroleum (petroleum exploration and production, 1999). In addition, he is a member of advisory boards of Texas A&M University and the University of Texas at Austin. |
|
Phyllis Burke Davis (70) |
|
|
|
Year of Election or Appointment: 1992 Mrs. Davis is retired from Avon Products, Inc. (consumer products) where she held various positions including Senior Vice President of Corporate Affairs and Group Vice President of U.S. product marketing, sales, distribution, and manufacturing. Mrs. Davis is a member of the Toshiba International Advisory Group of Toshiba Corporation (2001) and a member of the Board of Directors of the Southampton Hospital in Southampton, N.Y. (1998). Previously, she served as a Director of BellSouth Corporation (telecommunications), Eaton Corporation (diversified industrial), the TJX Companies, Inc. (retail stores), Hallmark Cards, Inc., and Nabisco Brands, Inc. |
|
Robert M. Gates (59) |
|
|
|
Year of Election or Appointment: 1997 Dr. Gates is President of Texas A&M University (2002). He was Director of the Central Intelligence Agency (CIA) from 1991 to 1993. From 1989 to 1991, Dr. Gates served as Assistant to the President of the United States and Deputy National Security Advisor. Dr. Gates is a Director of Charles Stark Draper Laboratory (non-profit), NACCO Industries, Inc. (mining and manufacturing), and Parker Drilling Co., Inc. (drilling and rental tools for the energy industry, 2001). He also serves as a member of the Advisory Board of VoteHere.net (secure internet voting, 2001). Previously, Dr. Gates served as a Director of LucasVarity PLC (automotive components and diesel engines), a Director of TRW Inc. (automotive, space, defense, and information technology), and Dean of the George Bush School of Government and Public Service at Texas A&M University (1999-2001). Dr. Gates also is a Trustee of the Forum for International Policy. |
|
Donald J. Kirk (70) |
|
|
|
Year of Election or Appointment: 1987 Mr. Kirk is a Governor of the American Stock Exchange (2001), a Trustee and former Chairman of the Board of Trustees of the Greenwich Hospital Association, a Director of the Yale-New Haven Health Services Corp. (1998), and a Director Emeritus and former Chairman of the Board of Directors of National Arts Strategies Inc. Mr. Kirk was an Executive-in-Residence (1995-2000) and a Professor (1987-1995) at Columbia University Graduate School of Business. Prior to 1987, he was Chairman of the Financial Accounting Standards Board. Previously, Mr. Kirk served as a Governor of the National Association of Securities Dealers, Inc. (1996-2002), a member and Vice Chairman of the Public Oversight Board of the American Institute of Certified Public Accountants' SEC Practice Section (1995-2002), a Director of General Re Corporation (reinsurance, 1987-1998) and as a Director of Valuation Research Corp. (appraisals and valuations). |
|
Marie L. Knowles (56) |
|
|
|
Year of Election or Appointment: 2001 Prior to Ms. Knowles' retirement in June 2000, she served as Executive Vice President and Chief Financial Officer of Atlantic Richfield Company (ARCO) (diversified energy, 1996-2000). From 1993 to 1996, she was a Senior Vice President of ARCO and President of ARCO Transportation Company. She served as a Director of ARCO from 1996 to 1998. She currently serves as a Director of Phelps Dodge Corporation (copper mining and manufacturing), URS Corporation (multidisciplinary engineering, 1999), and McKesson Corporation (healthcare service, 2002). Ms. Knowles is a Trustee of the Brookings Institution and the Catalina Island Conservancy and also serves as a member of the Advisory Board for the School of Engineering of the University of Southern California. |
|
Ned C. Lautenbach (58) |
|
|
|
Year of Election or Appointment: 2000 Mr. Lautenbach has been a partner of Clayton, Dubilier & Rice, Inc. (private equity investment firm) since September 1998. Previously, Mr. Lautenbach was with the International Business Machines Corporation (IBM) from 1968 until his retirement in 1998. He was most recently Senior Vice President and Group Executive of Worldwide Sales and Services. From 1993 to 1995, he was Chairman of IBM World Trade Corporation, and from 1994 to 1998 was a member of IBM's Corporate Executive Committee. Mr. Lautenbach serves as Chairman and Chief Executive Officer (1999) and as a Director (1998) of Acterna Corporation (communications test equipment). He is also Co-Chairman and C.E.O. of Covansys, Inc. (global provider of business and technology solutions, 2000). In addition, he is a Director of Eaton Corporation (diversified industrial, 1997), Axcelis Technologies (semiconductors, 2000), and the Philharmonic Center for the Arts in Naples, Florida (1999). He also serves on the Board of Trustees of Fairfield University and is a member of the Council on Foreign Relations. |
|
Name, Age; Principal Occupation |
|
|
Marvin L. Mann (69) |
|
|
|
Year of Election or Appointment: 1993 Mr. Mann is Chairman of the non-interested Trustees (2001). He is Chairman Emeritus of Lexmark International, Inc. (computer peripherals) where he remains a member of the Board. Prior to 1991, he held the positions of Vice President of International Business Machines Corporation (IBM) and President and General Manager of various IBM divisions and subsidiaries. Mr. Mann is a Board member of Imation Corp. (imaging and information storage, 1997) and Acterna Corporation (communications test equipment, 1999). He is also a member of the Director Services Committee of the Investment Company Institute. In addition, Mr. Mann is a member of the President's Cabinet at the University of Alabama and the Board of Visitors of the Culverhouse College of Commerce and Business Administration at the University of Alabama. |
|
William O. McCoy (69) |
|
|
|
Year of Election or Appointment: 1997 Prior to his retirement in December 1994, Mr. McCoy was Vice Chairman of the Board of BellSouth Corporation (telecommunications) and President of BellSouth Enterprises. He is currently a Director of Liberty Corporation (holding company), Duke Realty Corporation (real estate), Progress Energy, Inc. (electric utility), and Acterna Corporation (communications test equipment, 1999). He is also a partner of Franklin Street Partners (private investment management firm, 1997) and a member of the Research Triangle Foundation Board. In addition, Mr. McCoy served as the Interim Chancellor (1999-2000) and a member of the Board of Visitors (1994-1998) for the University of North Carolina at Chapel Hill and currently serves on the Board of Directors of the University of North Carolina Health Care System and the Board of Visitors of the Kenan-Flagler Business School (University of North Carolina at Chapel Hill). He also served as Vice President of Finance for the University of North Carolina (16-school system, 1995-1998). |
|
William S. Stavropoulos (63) |
|
|
|
Year of Election or Appointment: 2002 Mr. Stavropoulos is Chairman of the Board and Chairman of the Executive Committee (2000) and a Director of The Dow Chemical Company. Since joining The Dow Chemical Company in 1967, Mr. Stavropoulos served in numerous senior management positions, including President (1993-2000) and Chief Executive Officer (1995-2000). Currently, he is a Director of NCR Corporation (data warehousing and technology solutions, 1997), BellSouth Corporation (telecommunications, 1997), Chemical Financial Corporation, Computer Associates International Inc. (integrated computer software products, 2002), and Maersk Inc. (industrial conglomerate, 2002). He also serves as a member of the Board of Trustees of the American Enterprise Institute for Public Policy Research and Fordham University. In addition, Mr. Stavropoulos is a member of the American Chemical Society, The Business Council, J.P. Morgan International Council, World Business Council for Sustainable Development, and the University of Notre Dame Advisory Council for the College of Science. |
Executive Officers:
Correspondence intended for each executive officer may be sent to 82 Devonshire Street, Boston, Massachusetts 02109.
|
Name, Age; Principal Occupation |
|
|
John B. McDowell (44) |
|
|
|
Year of Election or Appointment: 2002 Vice President of Advisor Aggressive Growth. Mr. McDowell also serves as Vice President of certain Equity Funds (2002). He is Senior Vice President of FMR (1999), FMR Co., Inc. (2001), and Fidelity Management Trust Company (FMTC). Since joining Fidelity Investments in 1985, Mr. McDowell has worked as a research analyst and manager. |
|
Name, Age; Principal Occupation |
|
|
Eric D. Roiter (54) |
|
|
|
Year of Election or Appointment: 2000 Secretary of Advisor Aggressive Growth. He also serves as Secretary of other Fidelity funds (1998); Vice President, General Counsel, and Clerk of FMR Co., Inc. (2001) and FMR (1998); Vice President and Clerk of FDC (1998); Assistant Clerk of Fidelity Management & Research (U.K.) Inc. (2001) and Fidelity Management & Research (Far East) Inc. (2001); and Assistant Secretary of Fidelity Investments Money Management Inc. (2001). Prior to joining Fidelity, Mr. Roiter was with the law firm of Debevoise & Plimpton, as an associate (1981-1984) and as a partner (1985-1997), and served as an Assistant General Counsel of the U.S. Securities and Exchange Commission (1979-1981). Mr. Roiter was an Adjunct Member, Faculty of Law, at Columbia University Law School (1996-1997). |
|
Maria F. Dwyer (43) |
|
|
|
Year of Election or Appointment: 2002 President and Treasurer of Advisor Aggressive Growth. Ms. Dwyer also serves as President and Treasurer of other Fidelity funds (2002) and is a Vice President (1999) and an employee (1996) of FMR. Prior to joining Fidelity, Ms. Dwyer served as Director of Compliance for MFS Investment Management. |
|
Timothy F. Hayes (51) |
|
|
|
Year of Election or Appointment: 2002 Chief Financial Officer of Advisor Aggressive Growth. Mr. Hayes also serves as Chief Financial Officer of other Fidelity funds (2002). In 2001, Mr. Hayes was appointed President of Fidelity Investments Operations Group (FIOG), which includes Fidelity Pricing and Cash Management Services Group (FPCMS), where he was appointed President in 1998. Previously, Mr. Hayes served as Chief Financial Officer of Fidelity Investments Corporate Systems and Service Group (1998) and Fidelity Systems Company (1997-1998). |
|
John H. Costello (56) |
|
|
|
Year of Election or Appointment: 2000 Assistant Treasurer of Advisor Aggressive Growth. Mr. Costello also serves as Assistant Treasurer of other Fidelity funds and is an employee of FMR. |
|
Name, Age; Principal Occupation |
|
|
Francis V. Knox, Jr. (55) |
|
|
|
Year of Election or Appointment: 2002 Assistant Treasurer of Advisor Aggressive Growth. Mr. Knox also serves as Assistant Treasurer of other Fidelity funds (2002), and is a Vice President and an employee of FMR. Previously, Mr. Knox served as Vice President of Investment & Advisor Compliance (1990-2001), and Compliance Officer of Fidelity Management & Research (U.K.) Inc. (1992-2002), Fidelity Management & Research (Far East) Inc. (1991-2002), and FMR Corp. (1995-2002). |
|
Mark Osterheld (47) |
|
|
|
Year of Election or Appointment: 2002 Assistant Treasurer of Advisor Aggressive Growth. Mr. Osterheld also serves as Assistant Treasurer of other Fidelity funds (2002) and is an employee of FMR. |
|
Thomas J. Simpson (44) |
|
|
|
Year of Election or Appointment: 2000 Assistant Treasurer of Advisor Aggressive Growth. Mr. Simpson is Assistant Treasurer of other Fidelity funds (2000) and an employee of FMR (1996). Prior to joining FMR, Mr. Simpson was Vice President and Fund Controller of Liberty Investment Services (1987-1995). |
Annual Report
Proxy Voting Results
A special meeting of the fund's shareholders was held on July 17, 2002. The results of votes taken among shareholders on proposals before them are reported below. Each vote reported represents one dollar of net asset value held on the record date for the meeting.
|
PROPOSAL 1 |
||
|
To continue the effectiveness of Article VIII, Section 4 of the Declaration of Trust.* |
||
|
|
# of |
% of |
|
Affirmative |
34,152,718,540.11 |
89.928 |
|
Against |
1,595,684,478.44 |
4.202 |
|
Abstain |
2,229,268,880.72 |
5.870 |
|
TOTAL |
37,977,671,899.27 |
100.00 |
|
PROPOSAL 2 |
||
|
To authorize the Trustees to adopt an amended and restated Declaration of Trust.* |
||
|
|
# of |
% of |
|
Affirmative |
33,359,879,895.48 |
87.841 |
|
Against |
2,506,585,409.20 |
6.600 |
|
Abstain |
2,111,206,594.59 |
5.559 |
|
TOTAL |
37,977,671,899.27 |
100.00 |
|
PROPOSAL 3 |
||
|
To elect the thirteen nominees specified below as Trustees.* |
||
|
|
# of |
% of |
|
J. Michael Cook |
||
|
Affirmative |
36,277,611,366.72 |
95.392 |
|
Withheld |
1,750,060,532.55 |
4.608 |
|
TOTAL |
37,977,671,899.27 |
100.00 |
|
Ralph F. Cox |
||
|
Affirmative |
36,182,850,121.37 |
95.274 |
|
Withheld |
1,794,821,777.90 |
4.726 |
|
TOTAL |
37,977,671,899.27 |
100.00 |
|
Phyllis Burke Davis |
||
|
Affirmative |
36,151,180,469.12 |
95.191 |
|
Withheld |
1,826,491,430.15 |
4.809 |
|
TOTAL |
37,977,671,899.27 |
100.00 |
|
|
# of |
% of |
|
Robert M. Gates |
||
|
Affirmative |
36,207,443,324.51 |
95.339 |
|
Withheld |
1,770,228,574.76 |
4.661 |
|
TOTAL |
37,977,671,899.27 |
100.00 |
|
Abigail P. Johnson |
||
|
Affirmative |
36,153,684,587.30 |
95.197 |
|
Withheld |
1,823,987,311.97 |
4.803 |
|
TOTAL |
37,977,671,899.27 |
100.00 |
|
Edward C. Johnson 3d |
||
|
Affirmative |
36,146,668,992.04 |
95.179 |
|
Withheld |
1,831,002,907.23 |
4.821 |
|
TOTAL |
37,977,671,899.27 |
100.00 |
|
Donald J. Kirk |
||
|
Affirmative |
36,212,215,628.07 |
95.351 |
|
Withheld |
1,765,456,271.20 |
4.649 |
|
TOTAL |
37,977,671,899.27 |
100.00 |
|
Marie L. Knowles |
||
|
Affirmative |
36,228,946,938.21 |
95.395 |
|
Withheld |
1,748,724,961.06 |
4.605 |
|
TOTAL |
37,977,671,899.27 |
100.00 |
|
Ned C. Lautenbach |
||
|
Affirmative |
36,247,557,672.80 |
95.444 |
|
Withheld |
1,730,114,226.47 |
4.556 |
|
TOTAL |
37,977,671,899.27 |
100.00 |
|
Peter S. Lynch |
||
|
Affirmative |
36,238,626,074.48 |
95.421 |
|
Withheld |
1,739,045,824.79 |
4.579 |
|
TOTAL |
37,977,671,899.27 |
100.00 |
|
Marvin L. Mann |
||
|
Affirmative |
36,208314,198.20 |
95.341 |
|
Withheld |
1,769,357,701.07 |
4.659 |
|
TOTAL |
37,977,671,899.27 |
100.00 |
* Denotes trust-wide proposals and voting results.
Annual Report
Proxy Voting Results - continued
|
|
# of |
% of |
|
William O. McCoy |
||
|
Affirmative |
36,216,504,381.47 |
95.371 |
|
Withheld |
1,758,167,517.80 |
4.629 |
|
TOTAL |
37,977,671,899.27 |
100.00 |
|
William S. Stavropoulos |
||
|
Affirmative |
36,124,608,895.89 |
95.121 |
|
Withheld |
1,853,063,003.38 |
4.879 |
|
TOTAL |
37,977,671,899.27 |
100.00 |
|
PROPOSAL 6 |
||
|
To amend the fund's fundamental investment limitation concerning lending. |
||
|
|
# of |
% of |
|
Affirmative |
16,103,992.09 |
87.543 |
|
Against |
957,507.22 |
5.205 |
|
Abstain |
1,333,989.77 |
7.252 |
|
TOTAL |
18,395,489.08 |
100.00 |
Annual Report
Annual Report
Annual Report
Annual Report
Annual Report
Annual Report
Annual Report
Investment Adviser
Fidelity Management & Research Company
Boston, MA
Investment Sub-Advisers
FMR Co., Inc.
Fidelity Management & Research
(U.K.) Inc.
Fidelity Management & Research
(Far East) Inc.
Fidelity Investments Japan Limited
General Distributor
Fidelity Distributors Corporation
Boston, MA
Transfer and Shareholder
Servicing Agents
Fidelity Investments Institutional
Operations Company, Inc.
Boston, MA
Custodian
State Street Bank and Trust Company
Quincy, MA
Annual Report
|
Fidelity Advisor Aggressive Growth Fund |
|
Fidelity Advisor Asset Allocation Fund |
|
Fidelity Advisor Balanced Fund |
|
Fidelity Advisor Biotechnology Fund |
|
Fidelity Advisor California Municipal Income Fund |
|
Fidelity Advisor Consumer Industries Fund |
|
Fidelity Advisor Cyclical Industries Fund |
|
Fidelity Advisor Developing Communications Fund |
|
Fidelity Advisor Diversified International Fund |
|
Fidelity Advisor Dividend Growth Fund |
|
Fidelity Advisor Dynamic Capital Appreciation Fund |
|
Fidelity Advisor Electronics Fund |
|
Fidelity Advisor Emerging Asia Fund |
|
Fidelity Advisor Emerging Markets Income Fund |
|
Fidelity Advisor Equity Growth Fund |
|
Fidelity Advisor Equity Income Fund |
|
Fidelity Advisor Equity Value Fund |
|
Fidelity Advisor Europe Capital Appreciation Fund |
|
Fidelity Advisor Fifty Fund |
|
Fidelity Advisor Financial Services Fund |
|
Fidelity Advisor Floating Rate High Income Fund |
|
Fidelity Advisor Global Equity Fund |
|
Fidelity Advisor Government Investment Fund |
|
Fidelity Advisor Growth & Income Fund |
|
Fidelity Advisor Growth Opportunities |
|
Fidelity Advisor Health Care Fund |
|
Fidelity Advisor High Income Advantage Fund |
|
Fidelity Advisor High Income Fund |
|
Fidelity Advisor Inflation-Protected Bond Fund |
|
Fidelity Advisor Intermediate Bond Fund |
|
Fidelity Advisor International Capital Appreciation Fund |
|
Fidelity Advisor Investment Grade Bond Fund |
|
Fidelity Advisor Japan Fund |
|
Fidelity Advisor Korea Fund |
|
Fidelity Advisor Large Cap Fund |
|
Fidelity Advisor Latin America Fund |
|
Fidelity Advisor Leveraged Company Stock Fund |
|
Fidelity Advisor Mid Cap Fund |
|
Fidelity Advisor Mortgage Securities Fund |
|
Fidelity Advisor Municipal Income Fund |
|
Fidelity Advisor Natural Resources Fund |
|
Fidelity Advisor New York Municipal Income Fund |
|
Fidelity Advisor Overseas Fund |
|
Fidelity Advisor Real Estate Fund |
|
Fidelity Advisor Short Fixed-Income Fund |
|
Fidelity Advisor Small Cap Fund |
|
Fidelity Advisor Strategic Growth Fund |
|
Fidelity Advisor Strategic Income Fund |
|
Fidelity Advisor Tax Managed |
|
Fidelity Advisor Technology Fund |
|
Fidelity Advisor Telecommunications & Utilities Growth Fund |
|
Fidelity Advisor Value Strategies Fund |
|
Prime Fund |
|
Tax-Exempt Fund |
|
Treasury Fund |
AAGI-ANN-0103 335837
1.750682.102
(Fidelity Investment logo)(registered trademark)