UNITED STATES
SECURITIES AND EXCHANGE COMMISSION
WASHINGTON, D.C. 20549
FORM N-CSR
CERTIFIED SHAREHOLDER REPORT OF REGISTERED MANAGEMENT
INVESTMENT COMPANIES
Investment Company Act file number 811-4108
Oppenheimer Variable Account Funds
(Exact name of registrant as specified in charter)
6803 South Tucson Way, Centennial, Colorado 80112-3924
(Address of principal executive offices) (Zip code)
Cynthia Lo Bessette
OFI Global Asset Management, Inc.
225 Liberty Street, New York, New York 10281-1008
(Name and address of agent for service)
Registrant’s telephone number, including area code: (303) 768-3200
Date of fiscal year end: December 31
Date of reporting period: 6/30/2016
Item 1. Reports to Stockholders.
|
|
||||
| June 30, 2016 |
||||
|
Oppenheimer |
||||
| Discovery Mid Cap Growth Fund/VA |
Semiannual Report | |||
| A Series of Oppenheimer Variable Account Funds
|
||||
|
SEMIANNUAL REPORT |
||||
|
Listing of Top Holdings |
||||
|
Fund Performance Discussion |
||||
|
Financial Statements |

PORTFOLIO MANAGERS: Ronald J. Zibelli, Jr., CFA and Justin Livengood, CFA
AVERAGE ANNUAL TOTAL RETURNS FOR THE PERIODS ENDED 6/30/16
| Inception Date |
6-Months | 1-Year | 5-Year | 10-Year | ||||||||||||||||
|
Non-Service Shares |
8/15/86 | 1.63% | -1.33% | 9.86% | 5.41% | |||||||||||||||
|
Service Shares |
10/16/00 | 1.50 | -1.57 | 9.58 | 5.14 | |||||||||||||||
|
Russell MidCap Growth Index |
2.15 | -2.14 | 9.98 | 8.12 | ||||||||||||||||
Performance data quoted represents past performance, which does not guarantee future results. The investment return and principal value of an investment in the Fund will fluctuate so that an investor’s shares, when redeemed, may be worth more or less than their original cost. Current performance may be lower or higher than the performance quoted. For performance data current to the most recent month end, call us at 1.800.988.8287. The Fund’s total returns should not be expected to be the same as the returns of other funds, whether or not both funds have the same portfolio managers and/or similar names. The Fund’s total returns include changes in share price and reinvested distributions but do not include the charges associated with the separate account products that offer this Fund. Such performance would have been lower if such charges were taken into account.
The Fund’s performance is compared to the performance of the Russell MidCap Growth Index. The Russell MidCap Growth Index measures the performance of the mid-cap growth segment of the U.S. equity universe. It includes those Russell MidCap companies with higher price-to-book ratios and higher forecasted growth values. The Index is unmanaged and cannot be purchased directly by investors. While index comparisons may be useful to provide a benchmark for the Fund’s performance, it must be noted that the Fund’s investments are not limited to the investments comprising the Index. Index performance includes reinvestment of income, but does not reflect transaction costs, fees, expenses or taxes. Index performance is shown for illustrative purposes only as a benchmark for the Fund’s performance, and does not predict or depict performance of the Fund. The Fund’s performance reflects the effects of the Fund’s business and operating expenses.
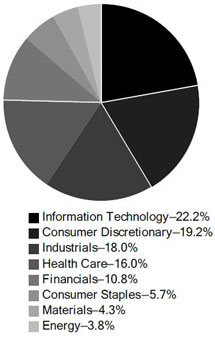
TOP HOLDINGS AND ALLOCATIONS
2 OPPENHEIMER DISCOVERY MID CAP GROWTH FUND/VA
Fund Performance Discussion
The Fund’s Non-Service shares produced a return of 1.63% during the reporting period, underperforming the Russell MidCap Growth Index (the “Index”) return of 2.15% and outperforming the Morningstar U.S. Insurance Fund Mid-Cap Growth peer group’s return of 0.18%.
The Fund’s Non-Service shares ranked in the 19th percentile (21 out of 99 funds) in Morningstar’s U.S. Insurance Fund Mid-Cap Growth peer group over the 1-year period ended June 30, 2016. Over the longer-term, Fund’s Non-Service shares ranked in the 8th (9 out of 96 funds), 21st (18 out of 93 funds), and 80th (69 out of 78 funds) percentiles for the 3-, 5- and 10-year periods ended June 30, 2016, respectively. Note that we have managed the Fund under the current investment process for six years.
The Fund generated its strongest results versus the Index in consumer discretionary, health care, materials, and industrials sectors, as a result of stronger relative stock selection. The Fund underperformed the Index in the consumer staples, information technology and financials sectors.
MARKET OVERVIEW
The first half of 2016 was a volatile time for global equity markets. China’s slowing economy, big swings in crude oil prices, and the interest rate hike path indicated by the Fed in its December 2015 communication contributed to a tumultuous environment. March saw a temporary relief rally as communication from the Fed turned more accommodative in light of this weak start to the year. Oil prices and commodities rose, but continued to experience volatility through the close of the reporting period. However, unanswered questions, including how quickly the Fed would raise interest rates and whether Britain would decide to exit the E.U. on its June 23 vote, made for an uncertain period. The U.K. surprised the markets by ultimately deciding to exit the E.U. As a result, markets dropped sharply and remained volatile through the reporting period’s end.
TOP INDIVIDUAL CONTRIBUTORS
Top performing stocks for the Fund this reporting period included Ulta Salon, NVIDIA and Equinix. Ulta Salon, a leading specialty retailer of beauty products, had a strong reporting period. In a treacherous first quarter for many retailers, Ulta delivered significantly better-than-expected results and guidance. Ulta has grown revenue and earnings per share (“EPS”) by more than 20% for the past four calendar years, including 24% revenue growth and 30% EPS growth in the most recent quarter. NVIDIA Corp., a visual computing company that develops graphics chips for use in PCs, mobile devices, servers, automobiles and supercomputers, reported revenue above consensus over the first quarter of its fiscal year and guided second quarter revenue ahead of consensus expectations driven by broad-based growth. We believe the company is positioned to benefit from growth opportunities across all four key platforms, with a particularly strong competitive position in the gaming market. Equinix, a global leader in data center colocation and interconnection services, had a solid quarter with its shares up over 17%. The company once again reported stronger-than-expected quarterly profit and sold eight data centers in the EU to Digital Realty Trust, which reduced debt and gave them new liquidity for future growth.
TOP INDIVIDUAL DETRACTORS
Detractors from performance this reporting period included ServiceNow and Palo Alto Networks. ServiceNow, a provider of software services to automate and manage IT services for enterprises, traded down sharply on disappointing fourth quarter billings results and slightly lower than expected fiscal year 2016 guidance. Palo Alto Networks, a provider of network security solutions, reported fourth quarter guidance that missed consensus estimates, with management pointing to longer sales cycles and a weak economic picture. We exited our positions in both stocks during the reporting period and invested the proceeds in other areas of the information technology sector, such as semiconductor and semiconductor capital equipment companies.
STRATEGY & OUTLOOK
Our long-term investment process seeks dynamic companies with above average and sustainable revenue and earnings growth that we believe are positioned to outperform. This includes leading firms in structurally attractive industries with committed management teams that have proven records of performance.
The macroeconomic environment is characterized by anemic economic expansion, weak corporate profit trends and very low interest rates. Widespread efforts by monetary and fiscal authorities to stimulate improved economic performance are producing limited results thus far. The Brexit vote towards the end of the reporting period does not change the direction of these underlying global dynamics, but does exacerbate and accelerate their impact. We believe that high quality companies generating superior growth profiles will continue to outperform over time.
3 OPPENHEIMER DISCOVERY MID CAP GROWTH FUND/VA
The Fund’s investment strategy and focus can change over time. The mention of specific fund holdings does not constitute a recommendation by OppenheimerFunds, Inc. or its affiliates.
Shares of Oppenheimer funds are not deposits or obligations of any bank, are not guaranteed by any bank, are not insured by the FDIC or any other agency, and involve investment risks, including the possible loss of the principal amount invested..
The Morningstar U.S. Insurance Fund Mid-Cap Growth Funds Category Average is the average return of the mutual funds within the investment category as defined by Morningstar. Returns include the reinvestment of distributions but do not consider sales charges. Morningstar U.S. Insurance Fund Mid-Cap Growth Funds Category Average performance is shown for illustrative purposes only and does not predict or depict the performance of the Fund.
Morningstar ranking is for Non-Service shares and ranking may include more than one share class of funds in the category, including other share classes of this Fund. Ranking is based on total return as of 6/30/16, without considering sales charges. Different share classes may have different expenses and performance characteristics. Fund rankings are subject to change monthly. The Fund’s total-return percentile rank is relative to all funds that are in the Morningstar U.S. Insurance Fund Mid-Cap Growth Funds category. The highest (or most favorable) percentile rank is 1 and the lowest (or least favorable) percentile rank is 100. The top-performing fund in a category will always receive a rank of 1.
4 OPPENHEIMER DISCOVERY MID CAP GROWTH FUND/VA
Fund Expenses
Fund Expenses. As a shareholder of the Fund, you incur two types of costs: (1) transaction costs and (2) ongoing costs, including management fees; distribution and service fees; and other Fund expenses. These examples are intended to help you understand your ongoing costs (in dollars) of investing in the Fund and to compare these costs with the ongoing costs of investing in other mutual funds.
The examples are based on an investment of $1,000.00 invested at the beginning of the period and held for the entire 6-month period ended June 30, 2016.
Actual Expenses. The first section of the table provides information about actual account values and actual expenses. You may use the information in this section for the class of shares you hold, together with the amount you invested, to estimate the expense that you paid over the period. Simply divide your account value by $1,000.00 (for example, an $8,600.00 account value divided by $1,000.00 = 8.60), then multiply the result by the number in the first section under the heading entitled “Expenses Paid During 6 Months Ended June 30, 2016” to estimate the expenses you paid on your account during this period.
Hypothetical Example for Comparison Purposes.
The second section of the table provides information about hypothetical account values and hypothetical expenses based on the Fund’s actual expense ratio for each class of shares, and an assumed rate of return of 5% per year for each class before expenses, which is not the actual return. The hypothetical account values and expenses may not be used to estimate the actual ending account balance or expenses you paid for the period. You may use this information to compare the ongoing costs of investing in the Fund and other funds. To do so, compare this 5% hypothetical example for the class of shares you hold with the 5% hypothetical examples that appear in the shareholder reports of the other funds.
Please note that the expenses shown in the table are meant to highlight your ongoing costs only and do not reflect any charges associated with the separate accounts that offer this Fund. Therefore, the “hypothetical” lines of the table are useful in comparing ongoing costs only, and will not help you determine the relative total costs of owning different funds. In addition, if these separate account charges were included your costs would have been higher.
| Actual | Beginning Value |
Ending Account Value |
Expenses Paid During 6 Months Ended June 30, 2016 |
|||||||||||||||
| Non-Service shares |
$ | 1,000.00 | $ | 1,016.30 | $ | 4.02 | ||||||||||||
| Service shares |
1,000.00 | 1,015.00 | 5.27 | |||||||||||||||
| Hypothetical (5% return before expenses) |
||||||||||||||||||
| Non-Service shares |
1,000.00 | 1,020.89 | 4.03 | |||||||||||||||
| Service shares |
1,000.00 | 1,019.64 | 5.29 | |||||||||||||||
Expenses are equal to the Fund’s annualized expense ratio for that class, multiplied by the average account value over the period, multiplied by 182/366 (to reflect the one-half year period). Those annualized expense ratios, excluding indirect expenses from affiliated funds, based on the 6-month period ended June 30, 2016 are as follows:
| Class | Expense Ratios | |||||
| Non-Service shares |
0.80% | |||||
| Service shares |
1.05 | |||||
The expense ratios reflect voluntary and/or contractual waivers and/or reimbursements of expenses by the Fund’s Manager. Some of these undertakings may be modified or terminated at any time, as indicated in the Fund’s prospectus. The “Financial Highlights” tables in the Fund’s financial statements, included in this report, also show the gross expense ratios, without such waivers or reimbursements and reduction to custodian expenses, if applicable.
5 OPPENHEIMER DISCOVERY MID CAP GROWTH FUND/VA
STATEMENT OF INVESTMENTS June 30, 2016 Unaudited
6 OPPENHEIMER DISCOVERY MID CAP GROWTH FUND/VA
Footnotes to Statement of Investments
1. Non-income producing security.
2. Rate shown is the 7-day yield at period end.
3. Is or was an affiliate, as defined in the Investment Company Act of 1940, as amended, at or during the reporting period, by virtue of the Fund owning at least 5% of the voting securities of the issuer or as a result of the Fund and the issuer having the same investment adviser. Transactions during the reporting period in which the issuer was an affiliate are as follows:
| Shares December 31, 2015 |
Gross Additions |
Gross Reductions |
Shares June 30, 2016 |
|||||||
|
|
||||||||||
| Oppenheimer Institutional Money Market Fund, Cl. E |
20,396,181 | 153,651,971 | 144,206,904 | 29,841,248 | ||||||
| Value | Income | |||||||||
|
|
||||||||||
| Oppenheimer Institutional Money Market Fund, Cl. E |
$ 29,841,248 | $ | 50,915 | |||||||
See accompanying Notes to Financial Statements.
7 OPPENHEIMER DISCOVERY MID CAP GROWTH FUND/VA
STATEMENT OF ASSETS AND LIABILITIES June 30, 2016 Unaudited
|
|
||||
| Assets |
||||
| Investments, at value—see accompanying statement of investments: | ||||
| Unaffiliated companies (cost $510,095,620) | $ | 649,902,458 | ||
| Affiliated companies (cost $29,841,248) | 29,841,248 | |||
|
|
|
|||
| 679,743,706 | ||||
|
|
||||
| Cash | 500,000 | |||
|
|
||||
| Receivables and other assets: | ||||
| Investments sold | 5,816,728 | |||
| Shares of beneficial interest sold | 174,602 | |||
| Dividends | 159,413 | |||
| Other | 50,299 | |||
|
|
|
|||
| Total assets
|
|
686,444,748
|
| |
|
|
||||
| Liabilities |
||||
| Payables and other liabilities: | ||||
| Investments purchased | 14,762,867 | |||
| Shares of beneficial interest redeemed | 3,684,743 | |||
| Trustees’ compensation | 41,844 | |||
| Shareholder communications | 16,865 | |||
| Distribution and service plan fees | 7,037 | |||
| Other | 11,866 | |||
|
|
|
|||
| Total liabilities | 18,525,222 | |||
|
|
||||
| Net Assets |
$ | 667,919,526 | ||
|
|
|
|||
|
|
||||
| Composition of Net Assets |
||||
| Par value of shares of beneficial interest | $ | 9,279 | ||
|
|
||||
| Additional paid-in capital | 498,760,344 | |||
|
|
||||
| Accumulated net investment income | 137,067 | |||
|
|
||||
| Accumulated net realized gain on investments | 29,205,998 | |||
|
|
||||
| Net unrealized appreciation on investments | 139,806,838 | |||
|
|
|
|||
| Net Assets |
$ | 667,919,526 | ||
|
|
|
|||
|
|
||||
| Net Asset Value Per Share |
||||
| Non-Service Shares: | ||||
| Net asset value, redemption price per share and offering price per share (based on net assets of $633,486,322 and 8,779,933 shares of beneficial interest outstanding) | $72.15 | |||
|
|
||||
| Service Shares: | ||||
| Net asset value, redemption price per share and offering price per share (based on net assets of $34,433,204 and 498,758 shares of beneficial interest outstanding) | $69.04 | |||
See accompanying Notes to Financial Statements.
8 OPPENHEIMER DISCOVERY MID CAP GROWTH FUND/VA
STATEMENT OF OPERATIONS For the Six Months Ended June 30, 2016 Unaudited
|
|
||||
| Investment Income |
||||
| Dividends: | ||||
| Unaffiliated companies (net of foreign withholding taxes of $3,282 ) | $ | 2,469,904 | ||
| Affiliated companies | 50,915 | |||
|
|
|
|||
| Total investment income | 2,520,819 | |||
|
|
||||
| Expenses |
||||
| Management fees | 2,298,364 | |||
|
|
||||
| Distribution and service plan fees - Service shares | 41,926 | |||
|
|
||||
| Transfer and shareholder servicing agent fees: | ||||
| Non-Service shares | 304,351 | |||
| Service shares | 16,787 | |||
|
|
||||
| Shareholder communications: | ||||
| Non-Service shares | 20,478 | |||
| Service shares | 1,128 | |||
|
|
||||
| Trustees’ compensation | 16,170 | |||
|
|
||||
| Borrowing fees | 5,963 | |||
|
|
||||
| Custodian fees and expenses | 2,299 | |||
|
|
||||
| Other | 30,416 | |||
|
|
|
|||
| Total expenses | 2,737,882 | |||
| Less reduction to custodian expenses | (228) | |||
| Less waivers and reimbursements of expenses | (120,603) | |||
|
|
|
|||
| Net expenses
|
|
2,617,051
|
| |
|
|
||||
| Net Investment Loss | (96,232) | |||
|
|
||||
| Realized and Unrealized Gain (Loss) |
||||
| Net realized gain on investments from unaffiliated companies | 30,429,218 | |||
|
|
||||
| Net change in unrealized appreciation/depreciation on investments | (21,612,935) | |||
|
|
||||
| Net Increase in Net Assets Resulting from Operations |
$ | 8,720,051 | ||
|
|
|
|||
See accompanying Notes to Financial Statements.
9 OPPENHEIMER DISCOVERY MID CAP GROWTH FUND/VA
STATEMENTS OF CHANGES IN NET ASSETS
| Six Months Ended June 30, 2016 (Unaudited) |
Year Ended December 31, 2015 |
|||||||
|
|
||||||||
| Operations |
||||||||
| Net investment loss | $ | (96,232) | $ | (1,807,584) | ||||
|
|
||||||||
| Net realized gain | 30,429,218 | 54,533,950 | ||||||
|
|
||||||||
| Net change in unrealized appreciation/depreciation | (21,612,935) | (5,614,443) | ||||||
|
|
|
|||||||
| Net increase in net assets resulting from operations
|
|
8,720,051
|
|
|
47,111,923
|
| ||
|
|
||||||||
| Dividends and/or Distributions to Shareholders |
||||||||
| Distributions from net realized gain: | ||||||||
| Non-Service shares | (48,415,668) | (61,563,484) | ||||||
| Service shares | (2,737,189) | (2,875,460) | ||||||
|
|
|
|||||||
|
|
(51,152,857)
|
|
|
(64,438,944)
|
| |||
|
|
||||||||
| Beneficial Interest Transactions |
||||||||
| Net increase (decrease) in net assets resulting from beneficial interest transactions: | ||||||||
| Non-Service shares | 13,073,647 | (5,761,632) | ||||||
| Service shares | (200,342) | 7,088,846 | ||||||
|
|
|
|||||||
|
|
12,873,305
|
|
|
1,327,214
|
| |||
|
|
||||||||
| Net Assets |
||||||||
| Total decrease | (29,559,501) | (15,999,807) | ||||||
|
|
||||||||
| Beginning of period | 697,479,027 | 713,478,834 | ||||||
|
|
|
|||||||
| End of period (including accumulated net investment income of $137,067 and $233,299, respectively) | $ | 667,919,526 | $ | 697,479,027 | ||||
|
|
|
|||||||
See accompanying Notes to Financial Statements.
10 OPPENHEIMER DISCOVERY MID CAP GROWTH FUND/VA
FINANCIAL HIGHLIGHTS
| Non-Service Shares | Six Months Ended June 30, 2016 (Unaudited) |
Year Ended December 31, 2015 |
Year Ended December 31, 2014 |
Year Ended December 31, 2013 |
Year Ended December 31, 2012 |
Year Ended December 30, 20111 |
||||||||||||||||||
|
|
||||||||||||||||||||||||
| Per Share Operating Data |
||||||||||||||||||||||||
| Net asset value, beginning of period | $ | 76.85 | $ | 78.82 | $ | 74.51 | $ | 54.80 | $ | 47.06 | $ | 46.55 | ||||||||||||
|
|
||||||||||||||||||||||||
| Income (loss) from investment operations: | ||||||||||||||||||||||||
| Net investment income (loss)2 | (0.01) | (0.19) | (0.29) | (0.16) | 0.01 | (0.26) | ||||||||||||||||||
| Net realized and unrealized gain | 1.23 | 5.67 | 4.60 | 19.88 | 7.73 | 0.77 | ||||||||||||||||||
|
|
|
|||||||||||||||||||||||
| Total from investment operations | 1.22 | 5.48 | 4.31 | 19.72 | 7.74 | 0.51 | ||||||||||||||||||
|
|
||||||||||||||||||||||||
| Dividends and/or distributions to shareholders: | ||||||||||||||||||||||||
| Dividends from net investment income | 0.00 | 0.00 | 0.00 | (0.01) | 0.00 | 0.00 | ||||||||||||||||||
| Distributions from net realized gain | (5.92) | (7.45) | 0.00 | 0.00 | 0.00 | 0.00 | ||||||||||||||||||
|
|
|
|||||||||||||||||||||||
| Total dividends and/or distributions to shareholders | (5.92) | (7.45) | 0.00 | (0.01) | 0.00 | 0.00 | ||||||||||||||||||
|
|
||||||||||||||||||||||||
| Net asset value, end of period | $ | 72.15 | $ | 76.85 | $ | 78.82 | $ | 74.51 | $ | 54.80 | $ | 47.06 | ||||||||||||
|
|
|
|||||||||||||||||||||||
|
|
||||||||||||||||||||||||
| Total Return, at Net Asset Value3 |
1.63% | 6.61% | 5.78% | 35.98% | 16.45% | 1.09% | ||||||||||||||||||
|
|
||||||||||||||||||||||||
| Ratios/Supplemental Data |
||||||||||||||||||||||||
| Net assets, end of period (in thousands) | $ | 633,487 | $ | 660,450 | $ | 682,515 | $ | 725,406 | $ | 558,934 | $ | 543,020 | ||||||||||||
|
|
||||||||||||||||||||||||
| Average net assets (in thousands) | $ | 611,596 | $ | 695,736 | $ | 688,259 | $ | 618,970 | $ | 575,072 | $ | 605,083 | ||||||||||||
|
|
||||||||||||||||||||||||
| Ratios to average net assets:4 | ||||||||||||||||||||||||
| Net investment income (loss) | (0.02)% | (0.24)% | (0.39)% | (0.24)% | 0.03% | (0.53)% | ||||||||||||||||||
| Expenses excluding specific expenses listed below | 0.84% | 0.83% | 0.83% | 0.84% | 0.85% | 0.84% | ||||||||||||||||||
| Interest and fees from borrowings | 0.00%5 | 0.00%5 | 0.00% | 0.00% | 0.00% | 0.00% | ||||||||||||||||||
|
|
|
|||||||||||||||||||||||
| Total expenses6 | 0.84% | 0.83% | 0.83% | 0.84% | 0.85% | 0.84% | ||||||||||||||||||
| Expenses after payments, waivers and/or reimbursements and reduction to custodian expenses | 0.80% | 0.80% | 0.80% | 0.80% | 0.80% | 0.80% | ||||||||||||||||||
|
|
||||||||||||||||||||||||
| Portfolio turnover rate | 60% | 81% | 113% | 84% | 66% | 91% | ||||||||||||||||||
1. December 30, 2011 represents the last business day of the Fund’s reporting period. See Note 2 of the accompanying Notes.
2. Per share amounts calculated based on the average shares outstanding during the period.
3. Assumes an initial investment on the business day before the first day of the fiscal period, with all dividends and distributions reinvested in additional shares on the reinvestment date, and redemption at the net asset value calculated on the last business day of the fiscal period. Total returns are not annualized for periods less than one full year. Total return information does not reflect expenses that apply at the separate account level or to related insurance products. Inclusion of these charges would reduce the total return figures for all periods shown. Returns do not reflect the deduction of taxes that a shareholder would pay on fund distributions or the redemption of fund shares.
4. Annualized for periods less than one full year.
5. Less than 0.005%.
6. Total expenses including indirect expenses from affiliated fund fees and expenses were as follows:
11 OPPENHEIMER DISCOVERY MID CAP GROWTH FUND/VA
FINANCIAL HIGHLIGHTS Continued
| Service Shares | Six Months Ended June 30, 2016 (Unaudited) |
Year Ended December 31, 2015 |
Year Ended December 31, 2014 |
Year Ended December 31, 2013 |
Year Ended December 31, 2012 |
Year Ended December 30, 20111 |
||||||||||||||||||
|
|
||||||||||||||||||||||||
| Per Share Operating Data |
||||||||||||||||||||||||
| Net asset value, beginning of period | $ | 73.88 | $ | 76.21 | $ | 72.22 | $ | 53.25 | $ | 45.84 | $ | 45.46 | ||||||||||||
|
|
||||||||||||||||||||||||
| Income (loss) from investment operations: | ||||||||||||||||||||||||
| Net investment loss2 | (0.09) | (0.38) | (0.46) | (0.30) | (0.12) | (0.37) | ||||||||||||||||||
| Net realized and unrealized gain | 1.17 | 5.50 | 4.45 | 19.27 | 7.53 | 0.75 | ||||||||||||||||||
|
|
|
|||||||||||||||||||||||
| Total from investment operations | 1.08 | 5.12 | 3.99 | 18.97 | 7.41 | 0.38 | ||||||||||||||||||
|
|
||||||||||||||||||||||||
| Dividends and/or distributions to shareholders: | ||||||||||||||||||||||||
| Dividends from net investment income | 0.00 | 0.00 | 0.00 | 0.00 | 0.00 | 0.00 | ||||||||||||||||||
| Distributions from net realized gain | (5.92) | (7.45) | 0.00 | 0.00 | 0.00 | 0.00 | ||||||||||||||||||
|
|
|
|||||||||||||||||||||||
| Total dividends and/or distributions to shareholders | (5.92) | (7.45) | 0.00 | 0.00 | 0.00 | 0.00 | ||||||||||||||||||
|
|
||||||||||||||||||||||||
| Net asset value, end of period | $ | 69.04 | $ | 73.88 | $ | 76.21 | $ | 72.22 | $ | 53.25 | $ | 45.84 | ||||||||||||
|
|
|
|||||||||||||||||||||||
|
|
||||||||||||||||||||||||
| Total Return, at Net Asset Value3 |
1.50% | 6.35% | 5.53% | 35.62% | 16.17% | 0.83% | ||||||||||||||||||
|
|
||||||||||||||||||||||||
| Ratios/Supplemental Data |
||||||||||||||||||||||||
| Net assets, end of period (in thousands) | $ | 34,433 | $ | 37,029 | $ | 30,964 | $ | 36,549 | $ | 35,942 | $ | 35,773 | ||||||||||||
|
|
||||||||||||||||||||||||
| Average net assets (in thousands) | $ | 33,731 | $ | 32,812 | $ | 32,927 | $ | 35,905 | $ | 37,842 | $ | 37,775 | ||||||||||||
|
|
||||||||||||||||||||||||
| Ratios to average net assets:4 | ||||||||||||||||||||||||
| Net investment loss | (0.27)% | (0.49)% | (0.64)% | (0.49)% | (0.22)% | (0.78)% | ||||||||||||||||||
| Expenses excluding specific expenses listed below | 1.09% | 1.08% | 1.08% | 1.09% | 1.10% | 1.09% | ||||||||||||||||||
| Interest and fees from borrowings | 0.00%5 | 0.00%5 | 0.00% | 0.00% | 0.00% | 0.00% | ||||||||||||||||||
|
|
|
|||||||||||||||||||||||
| Total expenses6 | 1.09% | 1.08% | 1.08% | 1.09% | 1.10% | 1.09% | ||||||||||||||||||
| Expenses after payments, waivers and/or reimbursements and reduction to custodian expenses | 1.05% | 1.05% | 1.05% | 1.05% | 1.05% | 1.05% | ||||||||||||||||||
|
|
||||||||||||||||||||||||
| Portfolio turnover rate | 60% | 81% | 113% | 84% | 66% | 91% | ||||||||||||||||||
1. December 30, 2011 represents the last business day of the Fund’s reporting period. See Note 2 of the accompanying Notes.
2. Per share amounts calculated based on the average shares outstanding during the period.
3. Assumes an initial investment on the business day before the first day of the fiscal period, with all dividends and distributions reinvested in additional shares on the reinvestment date, and redemption at the net asset value calculated on the last business day of the fiscal period. Total returns are not annualized for periods less than one full year. Total return information does not reflect expenses that apply at the separate account level or to related insurance products. Inclusion of these charges would reduce the total return figures for all periods shown. Returns do not reflect the deduction of taxes that a shareholder would pay on fund distributions or the redemption of fund shares.
4. Annualized for periods less than one full year.
5. Less than 0.005%.
6. Total expenses including indirect expenses from affiliated fund fees and expenses were as follows:
12 OPPENHEIMER DISCOVERY MID CAP GROWTH FUND/VA
NOTES TO FINANCIAL STATEMENTS June 30, 2016 Unaudited
1. Organization
Oppenheimer Discovery Mid Cap Growth Fund/VA (the “Fund”), a separate series of Oppenheimer Variable Account Funds, is a diversified open-end management investment company registered under the Investment Company Act of 1940 (“1940 Act”), as amended. The Fund’s investment objective is to seek capital appreciation. The Fund’s investment adviser is OFI Global Asset Management, Inc. (“OFI Global” or the “Manager”), a wholly-owned subsidiary of OppenheimerFunds, Inc. (“OFI” or the “Sub-Adviser”). The Manager has entered into a sub-advisory agreement with OFI. Shares of the Fund are sold only to separate accounts of life insurance companies.
The Fund offers two classes of shares. Both classes are sold at their offering price, which is the net asset value per share, to separate investment accounts of participating insurance companies as an underlying investment for variable life insurance policies, variable annuity contracts or other investment products. The class of shares designated as Service shares is subject to a distribution and service plan. Both classes of shares have identical rights and voting privileges with respect to the Fund in general and exclusive voting rights on matters that affect that class alone. Earnings, net assets and net asset value per share may differ due to each class having its own expenses, such as transfer and shareholder servicing agent fees and shareholder communications, directly attributable to that class.
The following is a summary of significant accounting policies followed in the Fund’s preparation of financial statements in accordance with accounting principles generally accepted in the United States (“U.S. GAAP”).
2. Significant Accounting Policies
Security Valuation. All investments in securities are recorded at their estimated fair value, as described in Note 3.
Reporting Period End Date. The last day of the Fund’s reporting period is the last day the New York Stock Exchange was open for trading during the period. The Fund’s financial statements have been presented through that date to maintain consistency with the Fund’s net asset value calculations used for shareholder transactions.
Allocation of Income, Expenses, Gains and Losses. Income, expenses (other than those attributable to a specific class), gains and losses are allocated on a daily basis to each class of shares based upon the relative proportion of net assets represented by such class. Operating expenses directly attributable to a specific class are charged against the operations of that class.
Dividends and Distributions to Shareholders. Dividends and distributions to shareholders, which are determined in accordance with income tax regulations and may differ from U.S. GAAP, are recorded on the ex-dividend date. Income and capital gain distributions, if any, are declared and paid annually or at other times as deemed necessary by the Manager.
The tax character of distributions is determined as of the Fund’s fiscal year end. Therefore, a portion of the Fund’s distributions made to shareholders prior to the Fund’s fiscal year end may ultimately be categorized as a tax return of capital.
Investment Income. Dividend income is recorded on the ex-dividend date or upon ex-dividend notification in the case of certain foreign dividends where the ex-dividend date may have passed. Non-cash dividends included in dividend income, if any, are recorded at the fair market value of the securities received. Interest income is recognized on an accrual basis. Discount and premium, which are included in interest income on the Statement of Operations, are amortized or accreted daily.
Return of Capital Estimates. Distributions received from the Fund’s investments in Real Estate Investments Trusts (REITs), generally are comprised of income and return of capital. The Fund records investment income and return of capital based on estimates. Such estimates are based on historical information available from each REIT and other industry sources. These estimates may subsequently be revised based on information received from REITs after their tax reporting periods are concluded.
Custodian Fees. “Custodian fees and expenses” in the Statement of Operations may include interest expense incurred by the Fund on any cash overdrafts of its custodian account during the period. Such cash overdrafts may result from the effects of failed trades in portfolio securities and from cash outflows resulting from unanticipated shareholder redemption activity. The Fund pays interest to its custodian on such cash overdrafts, to the extent they are not offset by positive cash balances maintained by the Fund, at a rate equal to the Federal Funds Rate plus 0.50%. The “Reduction to custodian expenses” line item, if applicable, represents earnings on cash balances maintained by the Fund during the period. Such interest expense and other custodian fees may be paid with these earnings.
Security Transactions. Security transactions are recorded on the trade date. Realized gains and losses on securities sold are determined on the basis of identified cost.
Indemnifications. The Fund’s organizational documents provide current and former Trustees and officers with a limited indemnification against liabilities arising in connection with the performance of their duties to the Fund. In the normal course of business, the Fund may also enter into contracts that provide general indemnifications. The Fund’s maximum exposure under these arrangements is unknown as this would be dependent on future claims that may be made against the Fund. The risk of material loss from such claims is considered remote.
Federal Taxes. The Fund intends to comply with provisions of the Internal Revenue Code applicable to regulated investment companies and to
13 OPPENHEIMER DISCOVERY MID CAP GROWTH FUND/VA
NOTES TO FINANCIAL STATEMENTS Unaudited / Continued
2. Significant Accounting Policies (Continued)
distribute substantially all of its investment company taxable income to shareholders. Therefore, no federal income or excise tax provision is required. The Fund files income tax returns in U.S. federal and applicable state jurisdictions. The statute of limitations on the Fund’s tax return filings generally remains open for the three preceding fiscal reporting period ends. The Fund has analyzed its tax positions for the fiscal year ended December 31, 2015, including open tax years, and does not believe there are any uncertain tax positions requiring recognition in the Fund’s financial statements.
During the fiscal year ended December 31, 2015, the Fund did not utilize any capital loss carryforward to offset capital gains realized in that fiscal year. Capital loss carryforwards with no expiration, if any, must be utilized prior to those with expiration dates. Capital losses with no expiration will be carried forward to future years if not offset by gains.
At period end, it is estimated that the Fund will not have any capital loss carryforwards. The estimated capital loss carryforward represents the carryforward as of the end of the last fiscal year, increased or decreased by capital losses or gains realized in the first six months of the current fiscal year. During the reporting period, it is estimated that the Fund will not utilize any capital loss carryforward to offset realized capital gains.
Net investment income (loss) and net realized gain (loss) may differ for financial statement and tax purposes. The character of dividends and distributions made during the fiscal year from net investment income or net realized gains are determined in accordance with federal income tax requirements, which may differ from the character of net investment income or net realized gains presented in those financial statements in accordance with U.S. GAAP. Also, due to timing of dividends and distributions, the fiscal year in which amounts are distributed may differ from the fiscal year in which the income or net realized gain was recorded by the Fund.
The aggregate cost of securities and other investments and the composition of unrealized appreciation and depreciation of securities and other investments for federal income tax purposes at period end are noted in the following table. The primary difference between book and tax appreciation or depreciation of securities and other investments, if applicable, is attributable to the tax deferral of losses or tax realization of financial statement unrealized gain or loss.
| Federal tax cost of securities |
$ | 540,571,590 | ||
|
|
|
|||
| Gross unrealized appreciation |
$ | 142,442,360 | ||
| Gross unrealized depreciation |
(3,270,244) | |||
|
|
|
|||
| Net unrealized appreciation |
$ | 139,172,116 | ||
|
|
|
Use of Estimates. The preparation of financial statements in conformity with U.S. GAAP requires management to make estimates and assumptions that affect the reported amounts of assets and liabilities and disclosure of contingent assets and liabilities at the date of the financial statements and the reported amounts of increases and decreases in net assets from operations during the reporting period. Actual results could differ from those estimates.
3. Securities Valuation
The Fund calculates the net asset value of its shares as of 4:00 P.M. Eastern time, on each day the New York Stock Exchange (the “Exchange”) is open for trading, except in the case of a scheduled early closing of the Exchange, in which case the Fund will calculate net asset value of the shares as of the scheduled early closing time of the Exchange.
The Fund’s Board has adopted procedures for the valuation of the Fund’s securities and has delegated the day-to-day responsibility for valuation determinations under those procedures to the Manager. The Manager has established a Valuation Committee which is responsible for determining a “fair valuation” for any security for which market quotations are not “readily available.” The Valuation Committee’s fair valuation determinations are subject to review, approval and ratification by the Fund’s Board at its next regularly scheduled meeting covering the calendar quarter in which the fair valuation was determined.
Valuation Methods and Inputs
Securities are valued using unadjusted quoted market prices, when available, as supplied primarily by third party pricing services or dealers.
The following methodologies are used to determine the market value or the fair value of the types of securities described below:
Securities traded on a registered U.S. securities exchange (including exchange-traded derivatives other than futures and futures options) are valued based on the last sale price of the security reported on the principal exchange on which it is traded, prior to the time when the Fund’s assets are valued. In the absence of a sale, the security is valued at the mean between the bid and asked price on the principal exchange or, if not available from the principal exchange, obtained from two dealers. If bid and asked prices are not available from either the exchange or two dealers, the security is valued by using one of the following methodologies (listed in order of priority): (1) a bid from the principal exchange, (2) the mean between the bid and asked price as provided by a single dealer, or (3) a bid from a single dealer. A security of a foreign issuer traded on a foreign exchange, but not listed on a registered U.S. securities exchange, is valued based on the last sale price on the principal exchange on which the security is traded, as identified by the third party pricing service used by the Manager, prior to the time when the Fund’s assets are valued. If the last sale price is unavailable, the security is valued at the most recent official closing price on the principal exchange on which it is traded. If the last sales price or official closing price for a foreign security is not available, the security is valued at the mean between the bid and asked price per the exchange or, if not available from the exchange, obtained from two dealers. If bid and asked prices are not available from either the exchange or two dealers, the security is valued by using one of the following methodologies (listed in order of priority): (1) a bid from the exchange, (2) the mean between the bid and asked price as provided by a single dealer, or (3) a bid from a single dealer.
Shares of a registered investment company that are not traded on an exchange are valued at that investment company’s net asset value per share.
Corporate and government debt securities (of U.S. or foreign issuers) and municipal debt securities, event-linked bonds, loans, mortgage-backed securities, collateralized mortgage obligations, and asset-backed securities are valued at the mean between the “bid” and “asked” prices utilizing
14 OPPENHEIMER DISCOVERY MID CAP GROWTH FUND/VA
3. Securities Valuation (Continued)
evaluated prices obtained from third party pricing services or broker-dealers who may use matrix pricing methods to determine the evaluated prices.
Short-term money market type debt securities with a remaining maturity of sixty days or less are valued at cost adjusted by the amortization of discount or premium to maturity (amortized cost), which approximates market value. Short-term debt securities with a remaining maturity in excess of sixty days are valued at the mean between the “bid” and “asked” prices utilizing evaluated prices obtained from third party pricing services or broker-dealers.
A description of the standard inputs that may generally be considered by the third party pricing vendors in determining their evaluated prices is provided below.
| Security Type |
Standard inputs generally considered by third-party pricing vendors | |
| Corporate debt, government debt, municipal, mortgage-backed and asset-backed securities |
Reported trade data, broker-dealer price quotations, benchmark yields, issuer spreads on comparable securities, the credit quality, yield, maturity, and other appropriate factors. | |
| Loans |
Information obtained from market participants regarding reported trade data and broker-dealer price quotations. | |
| Event-linked bonds |
Information obtained from market participants regarding reported trade data and broker-dealer price quotations. |
If a market value or price cannot be determined for a security using the methodologies described above, or if, in the “good faith” opinion of the Manager, the market value or price obtained does not constitute a “readily available market quotation,” or a significant event has occurred that would materially affect the value of the security, the security is fair valued either (i) by a standardized fair valuation methodology applicable to the security type or the significant event as previously approved by the Valuation Committee and the Fund’s Board or (ii) as determined in good faith by the Manager’s Valuation Committee. The Valuation Committee considers all relevant facts that are reasonably available, through either public information or information available to the Manager, when determining the fair value of a security. Fair value determinations by the Manager are subject to review, approval and ratification by the Fund’s Board at its next regularly scheduled meeting covering the calendar quarter in which the fair valuation was determined. Those fair valuation standardized methodologies include, but are not limited to, valuing securities at the last sale price or initially at cost and subsequently adjusting the value based on: changes in company specific fundamentals, changes in an appropriate securities index, or changes in the value of similar securities which may be further adjusted for any discounts related to security-specific resale restrictions. When possible, such methodologies use observable market inputs such as unadjusted quoted prices of similar securities, observable interest rates, currency rates and yield curves. The methodologies used for valuing securities are not necessarily an indication of the risks associated with investing in those securities nor can it be assured that the Fund can obtain the fair value assigned to a security if it were to sell the security.
To assess the continuing appropriateness of security valuations, the Manager, or its third party service provider who is subject to oversight by the Manager, regularly compares prior day prices, prices on comparable securities, and sale prices to the current day prices and challenges those prices exceeding certain tolerance levels with the third party pricing service or broker source. For those securities valued by fair valuations, whether through a standardized fair valuation methodology or a fair valuation determination, the Valuation Committee reviews and affirms the reasonableness of the valuations based on such methodologies and fair valuation determinations on a regular basis after considering all relevant information that is reasonably available.
Classifications
Each investment asset or liability of the Fund is assigned a level at measurement date based on the significance and source of the inputs to its valuation. Various data inputs are used in determining the value of each of the Fund’s investments as of the reporting period end. These data inputs are categorized in the following hierarchy under applicable financial accounting standards:
1) Level 1-unadjusted quoted prices in active markets for identical assets or liabilities (including securities actively traded on a securities exchange)
2) Level 2-inputs other than unadjusted quoted prices that are observable for the asset or liability (such as unadjusted quoted prices for similar assets and market corroborated inputs such as interest rates, prepayment speeds, credit risks, etc.)
3) Level 3-significant unobservable inputs (including the Manager’s own judgments about assumptions that market participants would use in pricing the asset or liability).
The inputs used for valuing securities are not necessarily an indication of the risks associated with investing in those securities.
The Fund classifies each of its investments in investment companies which are publicly offered as Level 1. Investment companies that are not publicly offered are measured using net asset value as a practical expedient, and are not classified in the fair value hierarchy.
The table below categorizes amounts that are included in the Fund’s Statement of Assets and Liabilities at period end based on valuation input level:
15 OPPENHEIMER DISCOVERY MID CAP GROWTH FUND/VA
NOTES TO FINANCIAL STATEMENTS Unaudited / Continued
3. Securities Valuation (Continued)
| Level 1— Unadjusted Quoted Prices |
Level 2— Other Significant Observable Inputs |
Level 3— Significant Inputs |
Value | |||||||||||||
|
|
||||||||||||||||
| Assets Table |
||||||||||||||||
| Investments, at Value: |
||||||||||||||||
| Common Stocks |
||||||||||||||||
| Consumer Discretionary |
$ | 124,713,413 | $ | — | $ | — | $ | 124,713,413 | ||||||||
| Consumer Staples |
36,930,227 | — | — | 36,930,227 | ||||||||||||
| Energy |
24,515,405 | — | — | 24,515,405 | ||||||||||||
| Financials |
70,358,019 | — | — | 70,358,019 | ||||||||||||
| Health Care |
104,067,524 | — | — | 104,067,524 | ||||||||||||
| Industrials |
116,886,540 | — | — | 116,886,540 | ||||||||||||
| Information Technology |
144,641,503 | — | — | 144,641,503 | ||||||||||||
| Materials |
27,789,828 | — | — | 27,789,828 | ||||||||||||
| Investment Company |
29,841,247 | — | — | 29,841,247 | ||||||||||||
|
|
|
|||||||||||||||
| Total Assets |
$ | 679,743,706 | $ | — | $ | — | $ | 679,743,706 | ||||||||
|
|
|
|||||||||||||||
Forward currency exchange contracts and futures contracts, if any, are reported at their unrealized appreciation/depreciation at measurement date, which represents the change in the contract’s value from trade date. All additional assets and liabilities included in the above table are reported at their market value at measurement date.
4. Investments and Risks
Investments in Affiliated Funds. The Fund is permitted to invest in other mutual funds advised by the Manager (“Affiliated Funds”). Affiliated Funds are open-end management investment companies registered under the 1940 Act, as amended. The Manager is the investment adviser of, and the Sub-Adviser provides investment and related advisory services to, the Affiliated Funds. When applicable, the Fund’s investments in Affiliated Funds are included in the Statement of Investments. Shares of Affiliated Funds are valued at their net asset value per share. As a shareholder, the Fund is subject to its proportional share of the Affiliated Funds’ expenses, including their management fee. The Manager will waive fees and/or reimburse Fund expenses in an amount equal to the indirect management fees incurred through the Fund’s investment in the Affiliated Funds.
Each of the Affiliated Funds in which the Fund invests has its own investment risks, and those risks can affect the value of the Fund’s investments and therefore the value of the Fund’s shares. To the extent that the Fund invests more of its assets in one Affiliated Fund than in another, the Fund will have greater exposure to the risks of that Affiliated Fund.
Investment in Oppenheimer Institutional Money Market Fund. The Fund is permitted to invest daily available cash balances in a money market Affiliated Fund. The Fund may invest the available cash in Class E shares of Oppenheimer Institutional Money Market Fund (“IMMF”) to seek current income while preserving liquidity or for defensive purposes. IMMF is regulated as a money market fund under the Investment Company Act of 1940, as amended.
Equity Security Risk. Stocks and other equity securities fluctuate in price. The value of the Fund’s portfolio may be affected by changes in the equity markets generally. Equity markets may experience significant short-term volatility and may fall sharply at times. Different markets may behave differently from each other and U.S. equity markets may move in the opposite direction from one or more foreign stock markets. Adverse events in any part of the equity or fixed-income markets may have unexpected negative effects on other market segments.
The prices of individual equity securities generally do not all move in the same direction at the same time and a variety of factors can affect the price of a particular company’s securities. These factors may include, but are not limited to, poor earnings reports, a loss of customers, litigation against the company, general unfavorable performance of the company’s sector or industry, or changes in government regulations affecting the company or its industry.
5. Market Risk Factors
The Fund’s investments in securities and/or financial derivatives may expose the Fund to various market risk factors:
Commodity Risk. Commodity risk relates to the change in value of commodities or commodity indexes as they relate to increases or decreases in the commodities market. Commodities are physical assets that have tangible properties. Examples of these types of assets are crude oil, heating oil, metals, livestock, and agricultural products.
Credit Risk. Credit risk relates to the ability of the issuer of debt to meet interest and principal payments, or both, as they come due. In general, lower-grade, higher-yield debt securities are subject to credit risk to a greater extent than lower-yield, higher-quality securities.
Equity Risk. Equity risk relates to the change in value of equity securities as they relate to increases or decreases in the general market.
Foreign Exchange Rate Risk. Foreign exchange rate risk relates to the change in the U.S. dollar value of a security held that is denominated in a foreign currency. The U.S. dollar value of a foreign currency denominated security will decrease as the dollar appreciates against the currency, while the U.S. dollar value will increase as the dollar depreciates against the currency.
Interest Rate Risk. Interest rate risk refers to the fluctuations in value of fixed-income securities resulting from the inverse relationship between price and yield. For example, an increase in general interest rates will tend to reduce the market value of already issued fixed-income investments, and
16 OPPENHEIMER DISCOVERY MID CAP GROWTH FUND/VA
5. Market Risk Factors (Continued)
a decline in general interest rates will tend to increase their value. In addition, debt securities with longer maturities, which tend to have higher yields, are subject to potentially greater fluctuations in value from changes in interest rates than obligations with shorter maturities.
Volatility Risk. Volatility risk refers to the magnitude of the movement, but not the direction of the movement, in a financial instrument’s price over a defined time period. Large increases or decreases in a financial instrument’s price over a relative time period typically indicate greater volatility risk, while small increases or decreases in its price typically indicate lower volatility risk.
6. Shares of Beneficial Interest
The Fund has authorized an unlimited number of $0.001 par value shares of beneficial interest of each class. Transactions in shares of beneficial interest were as follows:
| Six Months Ended June 30, 2016 | Year Ended December 31, 2015 | |||||||||||||||||||
| Shares | Amount | Shares | Amount | |||||||||||||||||
|
|
||||||||||||||||||||
| Non-Service Shares |
||||||||||||||||||||
| Sold |
146,606 | $ | 10,736,692 | 316,843 | $ | 25,835,263 | ||||||||||||||
| Dividends and/or distributions reinvested |
674,971 | 48,415,668 | 772,150 | 61,563,484 | ||||||||||||||||
| Redeemed |
(635,482 | ) | (46,078,713) | (1,154,717 | ) | (93,160,379) | ||||||||||||||
|
|
|
|||||||||||||||||||
| Net increase (decrease) |
186,095 | $ | 13,073,647 | (65,724 | ) | $ | (5,761,632) | |||||||||||||
|
|
|
|||||||||||||||||||
|
|
||||||||||||||||||||
| Service Shares |
||||||||||||||||||||
| Sold |
29,057 | $ | 2,029,005 | 153,951 | $ | 11,748,349 | ||||||||||||||
| Dividends and/or distributions reinvested |
39,877 | 2,737,189 | 37,465 | 2,875,460 | ||||||||||||||||
| Redeemed |
(71,388 | ) | (4,966,536) | (96,510 | ) | (7,534,963) | ||||||||||||||
|
|
|
|||||||||||||||||||
| Net increase (decrease) |
(2,454 | ) | $ | (200,342) | 94,906 | $ | 7,088,846 | |||||||||||||
|
|
|
|||||||||||||||||||
7. Purchases and Sales of Securities
The aggregate cost of purchases and proceeds from sales of securities, other than short-term obligations and investments in IMMF, for the reporting period were as follows:
| Purchases | Sales | |||||||||||
|
|
||||||||||||
| Investment securities |
$ | 380,717,963 | $ | 416,050,916 | ||||||||
8. Fees and Other Transactions with Affiliates
Management Fees. Under the investment advisory agreement, the Fund pays the Manager a management fee based on the daily net assets of the Fund at an annual rate as shown in the following table:
| Fee Schedule | ||||
|
|
||||
| Up to $200 million |
0.75% | |||
| Next $200 million |
0.72 | |||
| Next $200 million |
0.69 | |||
| Next $200 million |
0.66 | |||
| Next $700 million |
0.60 | |||
| Over $1.5 billion |
0.58 | |||
The Fund’s effective management fee for the reporting period was 0.72% of average annual net assets before any applicable waivers.
Sub-Adviser Fees. The Manager has retained the Sub-Adviser to provide the day-to-day portfolio management of the Fund. Under the Sub-Advisory Agreement, the Manager pays the Sub-Adviser an annual fee in monthly installments, equal to a percentage of the investment management fee collected by the Manager from the Fund, which shall be calculated after any investment management fee waivers. The fee paid to the Sub-Adviser is paid by the Manager, not by the Fund.
Transfer Agent Fees. OFI Global (the “Transfer Agent”) serves as the transfer and shareholder servicing agent for the Fund. The Fund pays the Transfer Agent a fee based on annual net assets. Fees incurred and average net assets for each class with respect to these services are detailed in the Statement of Operations and Financial Highlights, respectively.
Sub-Transfer Agent Fees. The Transfer Agent has retained Shareholder Services, Inc., a wholly-owned subsidiary of OFI (the “Sub-Transfer Agent”), to provide the day-to-day transfer agent and shareholder servicing of the Fund. Under the Sub-Transfer Agency Agreement, the Transfer Agent pays the Sub-Transfer Agent an annual fee in monthly installments, equal to a percentage of the transfer agent fee collected by the Transfer Agent from the Fund, which shall be calculated after any applicable fee waivers. The fee paid to the Sub-Transfer Agent is paid by the Transfer Agent, not by the Fund.
Trustees’ Compensation. The Fund’s Board of Trustees (“Board”) has adopted a compensation deferral plan for Independent Trustees that enables Trustees to elect to defer receipt of all or a portion of the annual compensation they are entitled to receive from the Fund. For purposes of determining
17 OPPENHEIMER DISCOVERY MID CAP GROWTH FUND/VA
NOTES TO FINANCIAL STATEMENTS Unaudited / Continued
8. Fees and Other Transactions with Affiliates (Continued)
the amount owed to the Trustees under the plan, deferred amounts are treated as though equal dollar amounts had been invested in shares of the Fund or in other Oppenheimer funds selected by the Trustees. The Fund purchases shares of the funds selected for deferral by the Trustees in amounts equal to his or her deemed investment, resulting in a Fund asset equal to the deferred compensation liability. Such assets are included as a component of “Other” within the asset section of the Statement of Assets and Liabilities. Deferral of Trustees’ fees under the plan will not affect the net assets of the Fund and will not materially affect the Fund’s assets, liabilities or net investment income per share. Amounts will be deferred until distributed in accordance with the compensation deferral plan.
Distribution and Service Plan for Service Shares. The Fund has adopted a Distribution and Service Plan (the “Plan”) pursuant to Rule 12b-1 under the 1940 Act for Service shares to pay OppenheimerFunds Distributor, Inc. (the “Distributor”), for distribution related services, personal service and account maintenance for the Fund’s Service shares. Under the Plan, payments are made periodically at an annual rate of 0.25% of the daily net assets of Service shares of the Fund. The Distributor currently uses all of those fees to compensate sponsors of the insurance product that offers Fund shares, for providing personal service and maintenance of accounts of their variable contract owners that hold Service shares. These fees are paid out of the Fund’s assets on an on-going basis and increase operating expenses of the Service shares, which results in lower performance compared to the Fund’s shares that are not subject to a service fee. Fees incurred by the Fund under the Plan are detailed in the Statement of Operations.
Waivers and Reimbursements of Expenses. The Manager has contractually agreed to limit the Fund’s expenses after payments, waivers and/or reimbursements and reduction to custodian expenses, excluding expenses incurred directly or indirectly by the Fund as a result of investments in other investment companies, wholly-owned subsidiaries and pooled investment vehicles; so that those expenses, as percentages of daily net assets, will not exceed the annual rate of 0.80% for Non-Service shares and 1.05% for Service shares. The expense limitations do not include interest and fees from borrowing, and other expenses not incurred in the ordinary course of the Fund’s business. During the reporting period, the Manager waived fees and/or reimbursed the Fund $103,513 and $5,586 for Non-Service and Service shares, respectively.
The Manager will waive fees and/or reimburse Fund expenses in an amount equal to the indirect management fees incurred through the Fund’s investment in IMMF. During the reporting period, the Manager waived fees and/or reimbursed the Fund $11,504 for IMMF management fees.
Waivers and/or reimbursements may be modified or terminated as set forth according to the terms in the prospectus.
9. Borrowings and Other Financing
Joint Credit Facility. A number of mutual funds managed by the Manager participate in a $1.28 billion revolving credit facility (the “Facility”) intended to provide short-term financing, if necessary, subject to certain restrictions in connection with atypical redemption activity. Expenses and fees related to the Facility are paid by the participating funds and are disclosed separately or as other expenses on the Statement of Operations. The Fund did not utilize the Facility during the reporting period.
10. Pending Litigation
In 2009, several putative class action lawsuits were filed and later consolidated before the U.S. District Court for the District of Colorado against OppenheimerFunds, Inc. (“OFI”), OppenheimerFunds Distributor, Inc. (“OFDI”), and Oppenheimer Rochester California Municipal Fund, a fund advised by OFI Global Asset Management, Inc. and distributed by the Distributor (the “California Fund”), in connection with the California Fund’s investment performance. The plaintiffs asserted claims against OFI, OFDI and certain present and former trustees and officers of the California Fund under the federal securities laws, alleging, among other things, that the disclosure documents of the California Fund contained misrepresentations and omissions and the investment policies of the California Fund were not followed. Plaintiffs in the suit filed an amended complaint and defendants filed a motion to dismiss. In 2011, the court issued an order which granted in part and denied in part the defendants’ motion to dismiss. In 2012, plaintiffs filed a motion, which defendants opposed, to certify a class and appoint class representatives and class counsel. In March 2015, the court granted plaintiffs’ motion for class certification. In May 2015, the U.S. Court of Appeals for the Tenth Circuit vacated the class certification order and remanded the matter to the district court for further proceedings. In October 2015, the district court reaffirmed its order and determined that the suit will proceed as a class action. In December 2015, the Tenth Circuit denied defendants’ petition to appeal the district court’s reaffirmed class certification order.
OFI and OFDI believe the suit is without merit; that it is premature to render any opinion as to the likelihood of an outcome unfavorable to them in the suit; and that no estimate can yet be made as to the amount or range of any potential loss. Furthermore, OFI believes that the suit should not impair the ability of OFI or OFDI to perform their respective duties to the Fund and that the outcome of the suit should not have any material effect on the operations of any of the Oppenheimer funds.
18 OPPENHEIMER DISCOVERY MID CAP GROWTH FUND/VA
PORTFOLIO PROXY VOTING POLICIES AND GUIDELINES; UPDATES TO STATEMENTS OF INVESTMENTS Unaudited
The Fund has adopted Portfolio Proxy Voting Policies and Guidelines under which the Fund votes proxies relating to securities (“portfolio proxies”) held by the Fund. A description of the Fund’s Portfolio Proxy Voting Policies and Guidelines is available (i) without charge, upon request, by calling the Fund toll-free at 1.800.525.7048, (ii) on the Fund’s website at www.oppenheimerfunds.com, and (iii) on the SEC’s website at www.sec.gov. In addition, the Fund is required to file Form N-PX, with its complete proxy voting record for the 12 months ended June 30th, no later than August 31st of each year. The Fund’s voting record is available (i) without charge, upon request, by calling the Fund toll-free at 1.800.525.7048, and (ii) in the Form N-PX filing on the SEC’s website at www.sec.gov.
The Fund files its complete schedule of portfolio holdings with the SEC for the first quarter and the third quarter of each fiscal year on Form N-Q. The Fund’s Form N-Q filings are available on the SEC’s website at www.sec.gov. Those forms may be reviewed and copied at the SEC’s Public Reference Room in Washington, D.C. Information on the operation of the Public Reference Room may be obtained by calling 1-800-SEC-0330.
19 OPPENHEIMER DISCOVERY MID CAP GROWTH FUND/VA
DISTRIBUTION SOURCES Unaudited
For any distribution that took place over the Fund’s reporting period, the table below details on a per-share basis the percentage of the Fund’s total distribution payment amount that was derived from the following sources: net income, net profit from the sale of securities, and other capital sources. This information is based upon income and capital gains using generally accepted accounting principles as of the date of each distribution. Because the Fund is actively managed, the relative amount of the Fund’s total distributions derived from various sources over the calendar year may change. Please note that this information should not be used for tax reporting purposes as the tax character of distributable income may differ from the amounts used for this notification. You will receive IRS tax forms in the first quarter of each calendar year detailing the actual amount of the taxable and non-taxable portion of distributions paid to you during the tax year.
For the most current information, please go to oppenheimerfunds.com. Select your Fund, then the ’Detailed’ tab; where ‘Dividends’ are shown, the Fund’s latest pay date will be followed by the sources of any distribution, updated daily.
|
Fund Name |
Pay |
Net Income |
Net Profit |
Other Capital |
||||||||||||
|
Oppenheimer Discovery Mid Cap Growth Fund/VA |
|
6/21/16 |
|
|
0.0% |
|
|
100.0% |
|
|
0.0% |
| ||||
20 OPPENHEIMER DISCOVERY MID CAP GROWTH FUND/VA
THIS PAGE INTENTIONALLY LEFT BLANK.
21 OPPENHEIMER DISCOVERY MID CAP GROWTH FUND/VA
THIS PAGE INTENTIONALLY LEFT BLANK.
22 OPPENHEIMER DISCOVERY MID CAP GROWTH FUND/VA
THIS PAGE INTENTIONALLY LEFT BLANK.
23 OPPENHEIMER DISCOVERY MID CAP GROWTH FUND/VA
OPPENHEIMER DISCOVERY MID CAP GROWTH FUND/VA
A Series of Oppenheimer Variable Account Funds
| Trustees and Officers | Sam Freedman, Chairman of the Board of Trustees and Trustee | |
| Jon S. Fossel, Trustee | ||
| Richard F. Grabish, Trustee | ||
| Beverly L. Hamilton, Trustee | ||
| Victoria J. Herget, Trustee | ||
| Robert J. Malone, Trustee | ||
| F. William Marshall, Jr., Trustee | ||
| Karen L. Stuckey, Trustee | ||
| James D. Vaughn, Trustee | ||
| Arthur P. Steinmetz, Trustee, President and Principal Executive Officer | ||
| Ronald J. Zibelli, Jr., Vice President | ||
| Justin Livengood, Vice President | ||
| Cynthia Lo Bessette, Secretary and Chief Legal Officer | ||
| Jennifer Sexton, Vice President and Chief Business Officer | ||
| Mary Ann Picciotto, Chief Compliance Officer and Chief Anti-Money Laundering Officer | ||
| Brian S. Petersen, Treasurer and Principal Financial & Accounting Officer | ||
| Manager | OFI Global Asset Management, Inc. | |
| Sub-Adviser | OppenheimerFunds, Inc. | |
| Distributor | OppenheimerFunds Distributor, Inc. | |
| Transfer and | OFI Global Asset Management, Inc. | |
| Shareholder | ||
| Servicing Agent | ||
| Sub-Transfer Agent | Shareholder Services, Inc. | |
| DBA OppenheimerFunds Services | ||
| Independent | KPMG LLP | |
| Registered | ||
| Public | ||
| Accounting | ||
| Firm | ||
| Legal Counsel | Ropes & Gray LLP | |
| Before investing in any of the Oppenheimer funds, investors should carefully consider a fund’s investment objectives, risks, charges and expenses. Fund prospectuses and summary prospectuses contain this and other information about the funds, and may be obtained by asking your financial advisor, or calling us at 1.800.988.8287. Read prospectuses and summary prospectuses carefully before investing. | ||
| The financial statements included herein have been taken from the records of the Fund without examination of those records by the independent registered public accounting firm. | ||
| © 2016 OppenheimerFunds, Inc. All rights reserved. Oppenheimer funds are distributed by OppenheimerFunds Distributor, Inc. | ||

|
|
||||
| June 30, 2016 |
||||
|
Oppenheimer |
||||
| Conservative Balanced Fund/VA |
Semiannual Report | |||
| A Series of Oppenheimer Variable Account Funds
|
||||
| SEMIANNUAL REPORT |
||||
| Listing of Top Holdings |
||||
| Fund Performance Discussion |
||||
| Financial Statements |
||||

PORTFOLIO MANAGERS: Krishna Memani and Magnus Krantz
AVERAGE ANNUAL TOTAL RETURNS FOR THE PERIODS ENDED 6/30/16
| Inception Date |
6-Months | 1-Year | 5-Year | 10-Year | ||||||||||||||||
| Non-Service Shares |
2/9/87 | 4.20% | 3.70% | 6.90% | 2.77% | |||||||||||||||
| Service Shares |
5/1/02 | 4.03 | 3.45 | 6.62 | 2.51 | |||||||||||||||
| Russell 3000 Index |
3.62 | 2.14 | 11.60 | 7.40 | ||||||||||||||||
| Barclays U.S. Aggregate Bond Index |
5.31 | 6.00 | 3.76 | 5.13 | ||||||||||||||||
| Reference Index |
4.92 | 5.06 | 6.82 | 6.55 | ||||||||||||||||
Performance data quoted represents past performance, which does not guarantee future results. The investment return and principal value of an investment in the Fund will fluctuate so that an investor’s shares, when redeemed, may be worth more or less than their original cost. Current performance may be lower or higher than the performance quoted. For performance data current to the most recent month end, call us at 1.800.988.8287. The Fund’s total returns should not be expected to be the same as the returns of other funds, whether or not both funds have the same portfolio managers and/or similar names. The Fund’s total returns include changes in share price and reinvested distributions but do not include the charges associated with the separate account products that offer this Fund. Such performance would have been lower if such charges were taken into account.
The Fund’s performance is compared to the performance of the Russell 3000 Index, the Barclays U.S. Aggregate Bond Index and the Fund’s Reference Index. The Russell 3000 Index measures the performance of the largest 3,000 U.S. companies, representing approximately 98% of the investable U.S. equity market. The Barclays U.S. Aggregate Bond Index is an index of U.S dollar-denominated, investment-grade U.S. corporate government and mortgage-backed securities. The Fund’s Reference Index is a customized weighted index currently comprised of 65% of the Barclays U.S. Aggregate Bond Index and 35% of the Russell 3000 Index. The Indices are unmanaged and cannot be purchased directly by investors. Index performance is shown for illustrative purposes only and does not predict or depict the performance of the Fund. While index comparisons may be useful to provide a benchmark for the Fund’s performance, it must be noted that the Fund’s investments are not limited to the investments comprising the indices. Index performance includes reinvestment of income, but does not reflect transaction costs, fees, expenses or taxes. Index performance is shown for illustrative purposes only as a benchmark for the Fund’s performance, and does not predict or depict performance of the Fund. The Fund’s performance reflects the effects of the Fund’s business and operating expenses.
TOP HOLDINGS AND ALLOCATIONS
2 OPPENHEIMER CONSERVATIVE BALANCED FUND/VA
Fund Performance Discussion
The Fund’s Non-Service shares produced a return of 4.20% during the reporting period. On a relative basis, the Fund’s Reference Index returned 4.92%. The Fund’s Reference Index is a customized weighted index currently comprised of the following underlying broad-based security indices: 65% of the Barclays U.S. Aggregate Bond Index and 35% of the Russell 3000 Index. Measured separately, the Barclays U.S. Aggregate Bond Index returned 5.31% and the Russell 3000 Index returned 3.62%.
MARKET OVERVIEW
2016 started off with credit markets widening amid stock market weakness. The Federal Reserve’s (the “Fed”) statement in January suggested they would continue gradually raising rates this year, which further roiled markets as global growth continued to show risk of slowing further. Risk asset weakness and the Bank of Japan cutting rates to negative levels at the end of January helped U.S. Treasury yields fall dramatically.
By mid-February markets began to turn. The European Central Bank (“ECB”) hinted it would likely ease further, the Bank of Japan’s tone remained dovish, China signaled it would provide further stimulus, and better than expected economic data helped turn sentiment. A dovish Fed statement in mid-March and further dovish statements from Chair Yellen (sometimes at odds with other Fed speakers) helped the better trend in risk sentiment persist.
The second quarter of 2016 began with improving data momentum, payrolls and wages remained steady, while survey indicators such as the Institute for Supply Management (“ISM”) and consumer sentiment also improved. Chinese and emerging market growth looked to have stabilized or modestly strengthened. The market continued to price for one with the potential of two hikes by the Federal Reserve in 2016, as core consumer price inflation data remained stable at about 2.2% year-over-year, and headline inflation stabilized at about 1%.
Data trends continued into May, which led to expectations that the Fed would hike at least twice during 2016 – including the potential for a June hike. A weak May payrolls report caused the market to back off the possibility of two hikes, as did a dovish Chair Yellen in her press conference after the mid-June Federal Open Market Committee meeting.
The big surprise news came late in June with voters in the United Kingdom opting to drop out of the European Union. U.S. markets became extremely volatile for two days. However, risk assets sharply rebounded, while bond yields remain depressed on expectations of further central bank easing.
EQUITY STRATEGY REVIEW
The equity strategy produced positive absolute performance during the reporting period, but underperformed the Russell 3000 Index. The equity strategy’s underperformance stemmed primarily from weaker relative stock selection in the information technology and energy sectors. The equity strategy outperformed the Russell 3000 Index in the health care, financials and industrials sectors, due largely to stronger relative stock selection.
The equity strategy’s top contributors to performance included Johnson & Johnson, Digital Realty Trust, Inc. and Verizon Communications, Inc. Johnson & Johnson is engaged in the research and development, manufacture and sale of products in the health care industry. The company reported positive earnings results due in part to strong prescription drug revenue and a weakening dollar. Johnson & Johnson also announced that it expects to increase profit margins this year, partly due to cost cuts. Digital Realty (“DLR”) is a real estate investment trust (“REIT”) that owns, acquires, develops and manages technology-related real estate, including data centers. The company performed strongly during the reporting period, showing improved leasing results and higher profitability. In addition, DLR completed a key acquisition of TelX, which provides valuable services to clients who need to connect with many internet and telecom providers inside datacenters. This acquisition is expected to be accretive to both revenue and earnings growth over the next few years, and enhances the value proposition DLR can offer its tenants. Verizon benefited as competitive intensity in wireless has shown signs of abating, allowing investors to have greater confidence in its dividend yield relative to other stable U.S. income stocks. The company entered the year at 11x earnings per share (“EPS”) and 5% dividend yield following comments from management that overall company EPS would be flat in 2016 relative to 2015 due to a divesture that left the company with some stranded costs to work out over 2016. However, as industry trends have improved and management has made improved progress on its cost reductions, the stock’s performance has improved.
The equity strategy’s top detractors from performance included Citigroup, Inc., Apple, Inc. and Alphabet, Inc. Starting with Citigroup, over the first half of the reporting period, the stock, along with other large banking companies, underperformed largely as a result of inaction by the Fed. Net interest margins—a key metric of profitability—were under pressure as interest rates remained low. Investors had expected that with a rise in short-term rates, this measure of
3 OPPENHEIMER CONSERVATIVE BALANCED FUND/VA
profitability would expand, providing a boost to earnings growth over the near- to-mid-term. Though the Fed indeed raised rates in December, weak economic data greatly decreased the likelihood that more rate hikes are coming, pressuring Citigroup and its peers. Apple experienced declines over the closing months of the period. The company reported a disappointing quarter and outlook as the iPhone 6S is lapping very difficult prior year results in addition to a decelerating global macro-economy. Alphabet, the holding company of Google, reported a decent quarter, yet the results did not satisfy elevated investor expectations. With very widespread ownership, the stock experienced declines following the earnings release.
FIXED-INCOME STRATEGY REVIEW
The Fund’s fixed-income strategy underperformed the Barclays U.S. Aggregate Bond Index this reporting period. The strategy’s underperformance stemmed from selection in investment grade credit and commercial mortgage-backed securities (“CMBS”). Positive contributors to performance included security selection in agency MBS and an underweight position in U.S. Treasuries.
The Fund’s investment strategy and focus can change over time. The mention of specific fund holdings does not constitute a recommendation by OppenheimerFunds, Inc. or its affiliates.
Shares of Oppenheimer funds are not deposits or obligations of any bank, are not guaranteed by any bank, are not insured by the FDIC or any other agency, and involve investment risks, including the possible loss of the principal amount invested.
4 OPPENHEIMER CONSERVATIVE BALANCED FUND/VA
Fund Expenses
Fund Expenses. As a shareholder of the Fund, you incur two types of costs: (1) transaction costs and (2) ongoing costs, including management fees; distribution and service fees; and other Fund expenses. These examples are intended to help you understand your ongoing costs (in dollars) of investing in the Fund and to compare these costs with the ongoing costs of investing in other mutual funds.
The examples are based on an investment of $1,000.00 invested at the beginning of the period and held for the entire 6-month period ended June 30, 2016.
Actual Expenses. The first section of the table provides information about actual account values and actual expenses. You may use the information in this section for the class of shares you hold, together with the amount you invested, to estimate the expense that you paid over the period. Simply divide your account value by $1,000.00 (for example, an $8,600.00 account value divided by $1,000.00 = 8.60), then multiply the result by the number in the first section under the heading entitled “Expenses Paid During 6 Months Ended June 30, 2016” to estimate the expenses you paid on your account during this period.
Hypothetical Example for Comparison Purposes.
The second section of the table provides information about hypothetical account values and hypothetical expenses based on the Fund’s actual expense ratio for each class of shares, and an assumed rate of return of 5% per year for each class before expenses, which is not the actual return. The hypothetical account values and expenses may not be used to estimate the actual ending account balance or expenses you paid for the period. You may use this information to compare the ongoing costs of investing in the Fund and other funds. To do so, compare this 5% hypothetical example for the class of shares you hold with the 5% hypothetical examples that appear in the shareholder reports of the other funds.
Please note that the expenses shown in the table are meant to highlight your ongoing costs only and do not reflect any charges associated with the separate accounts that offer this Fund. Therefore, the “hypothetical” lines of the table are useful in comparing ongoing costs only, and will not help you determine the relative total costs of owning different funds. In addition, if these separate account charges were included your costs would have been higher.
| Actual | Beginning Account Value January 1, 2016 |
Ending Account Value June 30, 2016 |
Expenses Paid During 6 Months Ended June 30, 2016 |
|||||||||
| Non-Service shares |
$ | 1,000.00 | $ | 1,042.00 | $ | 3.41 | ||||||
| Service shares |
1,000.00 | 1,040.30 | 4.68 | |||||||||
| Hypothetical | ||||||||||||
| (5% return before expenses)
|
||||||||||||
| Non-Service shares |
1,000.00 | 1,021.53 | 3.37 | |||||||||
| Service shares |
1,000.00 | 1,020.29 | 4.63 | |||||||||
Expenses are equal to the Fund’s annualized expense ratio for that class, multiplied by the average account value over the period, multiplied by 182/366 (to reflect the one-half year period). Those annualized expense ratios, excluding indirect expenses from affiliated funds, based on the 6-month period ended June 30, 2016 are as follows:
| Class | Expense Ratios | |||||||
| Non-Service shares |
0.67% | |||||||
| Service shares |
0.92 | |||||||
The expense ratios reflect voluntary and/or contractual waivers and/or reimbursements of expenses by the Fund’s Manager. Some of these undertakings may be modified or terminated at any time, as indicated in the Fund’s prospectus. The “Financial Highlights” tables in the Fund’s financial statements, included in this report, also show the gross expense ratios, without such waivers or reimbursements and reduction to custodian expenses, if applicable.
5 OPPENHEIMER CONSERVATIVE BALANCED FUND/VA
STATEMENT OF INVESTMENTS June 30, 2016 Unaudited
6 OPPENHEIMER CONSERVATIVE BALANCED FUND/VA
7 OPPENHEIMER CONSERVATIVE BALANCED FUND/VA
STATEMENT OF INVESTMENTS Unaudited / Continued
8 OPPENHEIMER CONSERVATIVE BALANCED FUND/VA
9 OPPENHEIMER CONSERVATIVE BALANCED FUND/VA
STATEMENT OF INVESTMENTS Unaudited / Continued
10 OPPENHEIMER CONSERVATIVE BALANCED FUND/VA
11 OPPENHEIMER CONSERVATIVE BALANCED FUND/VA
STATEMENT OF INVESTMENTS Unaudited / Continued
12 OPPENHEIMER CONSERVATIVE BALANCED FUND/VA
13 OPPENHEIMER CONSERVATIVE BALANCED FUND/VA
STATEMENT OF INVESTMENTS Unaudited / Continued
14 OPPENHEIMER CONSERVATIVE BALANCED FUND/VA
15 OPPENHEIMER CONSERVATIVE BALANCED FUND/VA
STATEMENT OF INVESTMENTS Unaudited / Continued
| Counterparty | Exercise Price | Expiration Date | Contracts | |||||||||||||||||||||||||
|
|
||||||||||||||||||||||||||||
| Over-the-Counter Options Purchased—0.1% |
|
|||||||||||||||||||||||||||
|
|
||||||||||||||||||||||||||||
| iShares iBoxx $ High Yield Corporate Bond Exchange Traded Fund Call1 | BOA | USD | 83.000 | 9/16/16 | USD | 418 | 84,595 | |||||||||||||||||||||
|
|
||||||||||||||||||||||||||||
| iShares iBoxx $ High Yield Corporate Bond Exchange Traded Fund Call1 | CITNA-B | USD | 83.000 | 9/16/16 | USD | 562 | 113,738 | |||||||||||||||||||||
|
|
||||||||||||||||||||||||||||
| iShares iBoxx $ High Yield Corporate Bond Exchange Traded Fund Call1 | BOA | USD | 83.000 | 9/16/16 | USD | 561 | 113,535 | |||||||||||||||||||||
|
|
|
|||||||||||||||||||||||||||
| Total Over-the-Counter Options Purchased (Cost $222,725) |
|
311,868
|
| |||||||||||||||||||||||||
|
|
||||||||||||||||||||||||||||
| Total Investments, at Value (Cost $247,086,650) | 111.2% | 260,254,215 | ||||||||||||||||||||||||||
|
|
||||||||||||||||||||||||||||
| Net Other Assets (Liabilities) | (11.2) | (26,132,863) | ||||||||||||||||||||||||||
|
|
|
|||||||||||||||||||||||||||
| Net Assets | 100.0% | $ | 234,121,352 | |||||||||||||||||||||||||
|
|
|
|||||||||||||||||||||||||||
Footnotes to Statement of Investments
1. Non-income producing security.
2. Security is a Master Limited Partnership.
16 OPPENHEIMER CONSERVATIVE BALANCED FUND/VA
Footnotes to Statement of Investments (Continued)
3. Represents securities sold under Rule 144A, which are exempt from registration under the Securities Act of 1933, as amended. These securities have been determined to be liquid under guidelines established by the Board of Trustees. These securities amount to $34,518,372 or 14.74% of the Fund’s net assets at period end.
4. Represents the current interest rate for a variable or increasing rate security.
5. Interest-Only Strips represent the right to receive the monthly interest payments on an underlying pool of mortgage loans. These securities typically decline in price as interest rates decline.
Most other fixed income securities increase in price when interest rates decline. The principal amount of the underlying pool represents the notional amount on which current interest is calculated. The price of these securities is typically more sensitive to changes in prepayment rates than traditional mortgage-backed securities (for example, GNMA pass-throughs). Interest rates disclosed represent current yields based upon the current cost basis and estimated timing and amount of future cash flows. These securities amount to $1,654,336 or 0.71% of the
Fund’s net assets at period end.
6. Principal-Only Strips represent the right to receive the monthly principal payments on an underlying pool of mortgage loans. The value of these securities generally increases as interest rates decline and prepayment rates rise. The price of these securities is typically more volatile than that of coupon-bearing bonds of the same maturity. Interest rates disclosed represent current yields based upon the current cost basis and estimated timing of future cash flows. These securities amount to $75,058 or 0.03% of the Fund’s net assets at period end.
7. All or a portion of the security position is when-issued or delayed delivery to be delivered and settled after period end. See Note 4 of the accompanying Notes.
8. Interest rate is less than 0.0005%.
9. This bond has no contractual maturity date, is not redeemable and contractually pays an indefinite stream of interest. Rate reported represents the current interest rate for this variable rate security.
10. Rate shown is the 7-day yield at period end.
11. Is or was an affiliate, as defined in the Investment Company Act of 1940, as amended, at or during the reporting period, by virtue of the Fund owning at least 5% of the voting securities of the issuer or as a result of the Fund and the issuer having the same investment adviser. Transactions during the reporting period in which the issuer was an affiliate are as follows:
| Shares December 31, 2015 |
Gross Additions |
Gross Reductions |
Shares June 30, 2016 |
|||||||||||||
|
|
||||||||||||||||
| Oppenheimer Institutional Money Market Fund, Cl. E | 5,367,607 | — | — | 5,367,607 | ||||||||||||
|
Value |
Income | |||||||||||||||
|
|
||||||||||||||||
| Oppenheimer Institutional Money Market Fund, Cl. E | $ | 5,367,607 | $ | 11,891 | ||||||||||||
|
|
||||||||||||||||||||
| Futures Contracts as of June 30, 2016 |
| |||||||||||||||||||
| Description | Exchange | Buy/Sell | Expiration Date | Number of Contracts | Value | Unrealized Appreciation (Depreciation) |
||||||||||||||
|
|
||||||||||||||||||||
| United States Treasury Long Bonds | CBT | Sell | 9/21/16 | 11 | $ 1,895,781 | $ | (16,728) | |||||||||||||
| United States Treasury Nts., 10 yr. | CBT | Sell | 9/21/16 | 112 | 14,894,250 | (156,694) | ||||||||||||||
| United States Treasury Nts., 2 yr. | CBT | Buy | 9/30/16 | 52 | 11,405,062 | 29,229 | ||||||||||||||
| United States Treasury Nts., 5 yr. | CBT | Buy | 9/30/16 | 25 | 3,054,102 | 55,880 | ||||||||||||||
| United States Ultra Bonds | CBT | Buy | 9/21/16 | 50 | 9,318,750 | 606,159 | ||||||||||||||
|
|
|
|||||||||||||||||||
| $ | 517,846 | |||||||||||||||||||
|
|
|
|||||||||||||||||||
| Glossary: | ||
| Counterparty Abbreviations | ||
| BOA | Bank of America NA | |
| CITNA-B | Citibank NA | |
| Exchange Abbreviations | ||
| CBT | Chicago Board of Trade | |
See accompanying Notes to Financial Statements.
17 OPPENHEIMER CONSERVATIVE BALANCED FUND/VA
STATEMENT OF ASSETS AND LIABILITIES June 30, 2016 Unaudited
|
|
||||
| Assets |
||||
| Investments, at value—see accompanying statement of investments: | ||||
| Unaffiliated companies (cost $241,719,043) | $ | 254,886,608 | ||
| Affiliated companies (cost $5,367,607) | 5,367,607 | |||
|
|
|
|||
| 260,254,215 | ||||
|
|
||||
| Cash | 19,956,671 | |||
|
|
||||
| Cash used for collateral on futures | 260,000 | |||
|
|
||||
| Receivables and other assets: | ||||
| Investments sold (including $9,397,948 sold on a when-issued or delayed delivery basis) | 11,338,655 | |||
| Interest, dividends and principal paydowns | 926,827 | |||
| Variation margin receivable | 23,885 | |||
| Shares of beneficial interest sold | 14,768 | |||
| Other | 41,506 | |||
|
|
|
|||
| Total assets | 292,816,527 | |||
|
|
||||
| Liabilities |
||||
| Payables and other liabilities: | ||||
| Investments purchased (including $55,529,777 purchased on a when-issued or delayed delivery basis) | 58,469,957 | |||
| Shares of beneficial interest redeemed | 121,347 | |||
| Variation margin payable | 45,313 | |||
| Trustees’ compensation | 34,517 | |||
| Distribution and service plan fees | 11,166 | |||
| Other | 12,875 | |||
|
|
|
|||
| Total liabilities | 58,695,175 | |||
|
|
||||
| Net Assets | $ | 234,121,352 | ||
|
|
|
|||
|
|
||||
| Composition of Net Assets |
||||
| Par value of shares of beneficial interest | $ | 15,961 | ||
|
|
||||
| Additional paid-in capital | 228,238,436 | |||
|
|
||||
| Accumulated net investment income | 1,959,549 | |||
|
|
||||
| Accumulated net realized loss on investments | (9,775,713) | |||
|
|
||||
| Net unrealized appreciation on investments and translation of assets and liabilities denominated in foreign currencies | 13,683,119 | |||
|
|
|
|||
| Net Assets | $ | 234,121,352 | ||
|
|
|
|||
|
|
||||
| Net Asset Value Per Share |
||||
| Non-Service Shares: | ||||
| Net asset value, redemption price per share and offering price per share (based on net assets of $178,990,202 and 12,169,478 shares of beneficial interest outstanding) | $14.71 | |||
|
|
||||
| Service Shares: | ||||
| Net asset value, redemption price per share and offering price per share (based on net assets of $55,131,150 and 3,791,986 shares of beneficial interest outstanding) | $14.54 | |||
See accompanying Notes to Financial Statements.
18 OPPENHEIMER CONSERVATIVE BALANCED FUND/VA
STATEMENT OF OPERATIONS For the Six Months Ended June 30, 2016 Unaudited
|
|
||||
| Investment Income |
||||
| Interest: | ||||
| Unaffiliated companies (net of foreign withholding taxes of $594) | $ | 2,174,962 | ||
|
|
||||
| Dividends: | ||||
| Unaffiliated companies (net of foreign withholding taxes of $6,074) | 729,971 | |||
| Affiliated companies | 11,891 | |||
|
|
|
|||
| Total investment income |
|
2,916,824
|
| |
|
|
||||
| Expenses |
||||
| Management fees | 860,267 | |||
|
|
||||
| Distribution and service plan fees—Service shares | 66,779 | |||
|
|
||||
| Transfer and shareholder servicing agent fees: | ||||
| Non-Service shares | 88,582 | |||
| Service shares | 26,756 | |||
|
|
||||
| Shareholder communications: | ||||
| Non-Service shares | 19,141 | |||
| Service shares | 5,788 | |||
|
|
||||
| Custodian fees and expenses | 24,301 | |||
|
|
||||
| Trustees’ compensation | 7,984 | |||
|
|
||||
| Borrowing fees | 2,037 | |||
|
|
||||
| Other | 38,335 | |||
|
|
|
|||
| Total expenses | 1,139,970 | |||
| Less reduction to custodian expenses | (1,062) | |||
| Less waivers and reimbursements of expenses | (297,235) | |||
|
|
|
|||
| Net expenses |
|
841,673
|
| |
|
|
||||
| Net Investment Income | 2,075,151 | |||
|
|
||||
| Realized and Unrealized Gain |
||||
| Net realized gain on: | ||||
| Investments from unaffiliated companies (including premiums on options exercised) | 2,325,389 | |||
| Closing and expiration of futures contracts | 297,187 | |||
|
|
|
|||
| Net realized gain | 2,622,576 | |||
|
|
||||
| Net change in unrealized appreciation/depreciation on: | ||||
| Investments | 4,265,623 | |||
| Translation of assets and liabilities denominated in foreign currencies | 650 | |||
| Futures contracts | 491,201 | |||
|
|
|
|||
| Net change in unrealized appreciation/depreciation |
|
4,757,474
|
| |
|
|
||||
| Net Increase in Net Assets Resulting from Operations |
$ | 9,455,201 | ||
|
|
|
|||
See accompanying Notes to Financial Statements.
19 OPPENHEIMER CONSERVATIVE BALANCED FUND/VA
STATEMENTS OF CHANGES IN NET ASSETS
| Six Months Ended June 30, 2016 (Unaudited) |
Year Ended December 31, 2015 |
|||||||
|
|
||||||||
| Operations |
||||||||
| Net investment income | $ | 2,075,151 | $ | 5,143,739 | ||||
|
|
||||||||
| Net realized gain | 2,622,576 | 8,011,492 | ||||||
|
|
||||||||
| Net change in unrealized appreciation/depreciation | 4,757,474 | (10,889,422) | ||||||
|
|
|
|||||||
| Net increase in net assets resulting from operations |
|
9,455,201
|
|
|
2,265,809
|
| ||
|
|
||||||||
| Dividends and/or Distributions to Shareholders |
||||||||
| Dividends from net investment income: | ||||||||
| Non-Service shares | (4,214,715) | (4,370,338) | ||||||
| Service shares | (1,155,621) | (1,196,499) | ||||||
|
|
|
|||||||
|
|
(5,370,336)
|
|
|
(5,566,837)
|
| |||
|
|
||||||||
| Beneficial Interest Transactions |
||||||||
| Net increase (decrease) in net assets resulting from beneficial interest transactions: | ||||||||
| Non-Service shares | (6,434,244) | (18,739,351) | ||||||
| Service shares | 1,839,033 | (10,891,668) | ||||||
|
|
|
|||||||
|
|
(4,595,211)
|
|
|
(29,631,019)
|
| |||
|
|
||||||||
| Net Assets |
||||||||
| Total decrease | (510,346) | (32,932,047) | ||||||
|
|
||||||||
| Beginning of period | 234,631,698 | 267,563,745 | ||||||
|
|
|
|||||||
| End of period (including accumulated net investment income of $1,959,549 and $5,254,734) | $ | 234,121,352 | $ | 234,631,698 | ||||
|
|
|
|||||||
See accompanying Notes to Financial Statements.
20 OPPENHEIMER CONSERVATIVE BALANCED FUND/VA
FINANCIAL HIGHLIGHTS
| Non-Service Shares | Six Months Ended June 30, 2016 (Unaudited) |
Year Ended December 31, 2015 |
Year Ended December 31, 2014 |
Year Ended December 31, 2013 |
Year Ended December 31, 2012 |
Year Ended December 30, 20111 |
||||||||||||||||||
|
|
||||||||||||||||||||||||
| Per Share Operating Data |
||||||||||||||||||||||||
| Net asset value, beginning of period | $ | 14.46 | $ | 14.67 | $ | 13.84 | $ | 12.52 | $ | 11.30 | $ | 11.47 | ||||||||||||
|
|
||||||||||||||||||||||||
| Income (loss) from investment operations: | ||||||||||||||||||||||||
| Net investment income2 | 0.13 | 0.31 | 0.29 | 0.25 | 0.29 | 0.20 | ||||||||||||||||||
| Net realized and unrealized gain (loss) | 0.47 | (0.18) | 0.83 | 1.38 | 1.09 | (0.11) | ||||||||||||||||||
|
|
|
|||||||||||||||||||||||
| Total from investment operations | 0.60 | 0.13 | 1.12 | 1.63 | 1.38 | 0.09 | ||||||||||||||||||
|
|
||||||||||||||||||||||||
| Dividends and/or distributions to shareholders: | ||||||||||||||||||||||||
| Dividends from net investment income | (0.35) | (0.34) | (0.29) | (0.31) | (0.16) | (0.26) | ||||||||||||||||||
|
|
||||||||||||||||||||||||
| Net asset value, end of period | $ | 14.71 | $ | 14.46 | $ | 14.67 | $ | 13.84 | $ | 12.52 | $ | 11.30 | ||||||||||||
|
|
|
|||||||||||||||||||||||
|
|
||||||||||||||||||||||||
| Total Return, at Net Asset Value3 |
4.20% | 0.83% | 8.20% | 13.17% | 12.34% | 0.72% | ||||||||||||||||||
|
|
||||||||||||||||||||||||
| Ratios/Supplemental Data |
||||||||||||||||||||||||
| Net assets, end of period (in thousands) | $ | 178,990 | $ | 182,406 | $ | 203,684 | $ | 213,697 | $ | 218,032 | $ | 128,383 | ||||||||||||
|
|
||||||||||||||||||||||||
| Average net assets (in thousands) | $ | 178,097 | $ | 194,208 | $ | 208,556 | $ | 218,090 | $ | 191,416 | $ | 141,848 | ||||||||||||
|
|
||||||||||||||||||||||||
| Ratios to average net assets:4 | ||||||||||||||||||||||||
| Net investment income | 1.86% | 2.09% | 2.03% | 1.87% | 2.46% | 1.70% | ||||||||||||||||||
| Expenses excluding specific expenses listed below | 0.93% | 0.91% | 0.90% | 0.89% | 0.90% | 0.91% | ||||||||||||||||||
| Interest and fees from borrowings | 0.00%5 | 0.00%5 | 0.00% | 0.00% | 0.00% | 0.00% | ||||||||||||||||||
|
|
|
|||||||||||||||||||||||
| Total expenses6 | 0.93% | 0.91% | 0.90% | 0.89% | 0.90% | 0.91% | ||||||||||||||||||
| Expenses after payments, waivers and/or reimbursements and reduction to custodian expenses | 0.67% | 0.67% | 0.67% | 0.66% | 0.66% | 0.67% | ||||||||||||||||||
|
|
||||||||||||||||||||||||
| Portfolio turnover rate7 | 36% | 68% | 98% | 187% | 110% | 102% | ||||||||||||||||||
1. December 30, 2011 represents the last business day of the Fund’s reporting period. See Note 2 of the accompanying Notes.
2. Per share amounts calculated based on the average shares outstanding during the period.
3. Assumes an initial investment on the business day before the first day of the fiscal period, with all dividends and distributions reinvested in additional shares on the reinvestment date, and redemption at the net asset value calculated on the last business day of the fiscal period. Total returns are not annualized for periods less than one full year. Total return information does not reflect expenses that apply at the separate account level or to related insurance products. Inclusion of these charges would reduce the total return figures for all periods shown. Returns do not reflect the deduction of taxes that a shareholder would pay on fund distributions or the redemption of fund shares.
4. Annualized for periods less than one full year.
5. Less than 0.005%.
6. Total expenses including indirect expenses from affiliated fund fees and expenses were as follows:
| Six Months Ended June 30, 2016 | 0.93% | |||||
| Year Ended December 31, 2015 | 0.91% | |||||
| Year Ended December 31, 2014 | 0.90% | |||||
| Year Ended December 31, 2013 | 0.90% | |||||
| Year Ended December 31, 2012 | 0.91% | |||||
| Year Ended December 30, 2011 | 0.93% |
7. The portfolio turnover rate excludes purchase and sale transactions of To Be Announced (TBA) mortgage-related securities as follows:
| Purchase Transactions | Sale Transactions | |||||||
|
|
||||||||
| Six Months Ended June 30, 2016 |
$367,695,755 | $365,682,751 | ||||||
| Year Ended December 31, 2015 |
$829,988,104 | $849,696,153 | ||||||
| Year Ended December 31, 2014 |
$697,503,637 | $678,765,376 | ||||||
| Year Ended December 31, 2013 |
$794,398,216 | $800,879,825 | ||||||
| Year Ended December 31, 2012 |
$555,111,600 | $549,805,766 | ||||||
| Year Ended December 30, 2011 |
$450,804,195 | $453,759,282 | ||||||
See accompanying Notes to Financial Statements.
21 OPPENHEIMER CONSERVATIVE BALANCED FUND/VA
FINANCIAL HIGHLIGHTS Continued
| Service Shares | Six Months Ended June 30, 2016 (Unaudited) |
Year Ended December 31, 2015 |
Year Ended December 31, 2014 |
Year Ended December 31, 2013 |
Year Ended December 31, 2012 |
Year Ended December 30, 20111 |
||||||||||||||||||
|
|
||||||||||||||||||||||||
| Per Share Operating Data |
||||||||||||||||||||||||
| Net asset value, beginning of period | $ | 14.28 | $ | 14.49 | $ | 13.66 | $ | 12.37 | $ | 11.17 | $ | 11.35 | ||||||||||||
|
|
||||||||||||||||||||||||
| Income (loss) from investment operations: | ||||||||||||||||||||||||
| Net investment income2 | 0.11 | 0.27 | 0.25 | 0.21 | 0.26 | 0.16 | ||||||||||||||||||
| Net realized and unrealized gain (loss) | 0.46 | (0.18) | 0.84 | 1.36 | 1.08 | (0.11) | ||||||||||||||||||
|
|
|
|||||||||||||||||||||||
| Total from investment operations | 0.57 | 0.09 | 1.09 | 1.57 | 1.34 | 0.05 | ||||||||||||||||||
|
|
||||||||||||||||||||||||
| Dividends and/or distributions to shareholders: | ||||||||||||||||||||||||
| Dividends from net investment income | (0.31) | (0.30) | (0.26) | (0.28) | (0.14) | (0.23) | ||||||||||||||||||
|
|
||||||||||||||||||||||||
| Net asset value, end of period | $ | 14.54 | $ | 14.28 | $ | 14.49 | $ | 13.66 | $ | 12.37 | $ | 11.17 | ||||||||||||
|
|
|
|||||||||||||||||||||||
|
|
||||||||||||||||||||||||
| Total Return, at Net Asset Value3 |
4.03% | 0.57% | 8.02% | 12.83% | 12.11% | 0.38% | ||||||||||||||||||
|
|
||||||||||||||||||||||||
| Ratios/Supplemental Data |
||||||||||||||||||||||||
| Net assets, end of period (in thousands) | $ | 55,131 | $ | 52,226 | $ | 63,880 | $ | 69,601 | $ | 72,872 | $ | 77,551 | ||||||||||||
|
|
||||||||||||||||||||||||
| Average net assets (in thousands) | $ | 53,794 | $ | 59,085 | $ | 65,450 | $ | 72,332 | $ | 76,257 | $ | 85,157 | ||||||||||||
|
|
||||||||||||||||||||||||
| Ratios to average net assets:4 | ||||||||||||||||||||||||
| Net investment income | 1.61% | 1.84% | 1.78% | 1.62% | 2.18% | 1.45% | ||||||||||||||||||
| Expenses excluding specific expenses listed below | 1.18% | 1.16% | 1.15% | 1.15% | 1.16% | 1.16% | ||||||||||||||||||
| Interest and fees from borrowings | 0.00%5 | 0.00%5 | 0.00% | 0.00% | 0.00% | 0.00% | ||||||||||||||||||
|
|
|
|||||||||||||||||||||||
| Total expenses6 | 1.18% | 1.16% | 1.15% | 1.15% | 1.16% | 1.16% | ||||||||||||||||||
| Expenses after payments, waivers and/or reimbursements and reduction to custodian expenses | 0.92% | 0.92% | 0.92% | 0.92% | 0.92% | 0.92% | ||||||||||||||||||
|
|
||||||||||||||||||||||||
| Portfolio turnover rate7 | 36% | 68% | 98% | 187% | 110% | 102% | ||||||||||||||||||
1. December 30, 2011 represents the last business day of the Fund’s reporting period. See Note 2 of the accompanying Notes.
2. Per share amounts calculated based on the average shares outstanding during the period.
3. Assumes an initial investment on the business day before the first day of the fiscal period, with all dividends and distributions reinvested in additional shares on the reinvestment date, and redemption at the net asset value calculated on the last business day of the fiscal period. Total returns are not annualized for periods less than one full year. Total return information does not reflect expenses that apply at the separate account level or to related insurance products. Inclusion of these charges would reduce the total return figures for all periods shown. Returns do not reflect the deduction of taxes that a shareholder would pay on fund distributions or the redemption of fund shares.
4. Annualized for periods less than one full year.
5. Less than 0.005%.
6. Total expenses including indirect expenses from affiliated fund fees and expenses were as follows:
| Six Months Ended June 30, 2016 | 1.18% | |||||
| Year Ended December 31, 2015 | 1.16% | |||||
| Year Ended December 31, 2014 | 1.15% | |||||
| Year Ended December 31, 2013 | 1.16% | |||||
| Year Ended December 31, 2012 | 1.17% | |||||
| Year Ended December 30, 2011 | 1.18% |
7. The portfolio turnover rate excludes purchase and sale transactions of To Be Announced (TBA) mortgage-related securities as follows:
| Purchase Transactions | Sale Transactions | |||||||
|
|
||||||||
| Six Months Ended June 30, 2016 |
$367,695,755 | $365,682,751 | ||||||
| Year Ended December 31, 2015 |
$829,988,104 | $849,696,153 | ||||||
| Year Ended December 31, 2014 |
$697,503,637 | $678,765,376 | ||||||
| Year Ended December 31, 2013 |
$794,398,216 | $800,879,825 | ||||||
| Year Ended December 31, 2012 |
$555,111,600 | $549,805,766 | ||||||
| Year Ended December 30, 2011 |
$450,804,195 | $453,759,282 | ||||||
See accompanying Notes to Financial Statements.
22 OPPENHEIMER CONSERVATIVE BALANCED FUND/VA
NOTES TO FINANCIAL STATEMENTS June 30, 2016 Unaudited
1. Organization
Oppenheimer Conservative Balanced Fund/VA (the “Fund”), a separate series of Oppenheimer Variable Account Funds, is a diversified open-end management investment company registered under the Investment Company Act of 1940 (“1940 Act”), as amended. The Fund’s main investment objective is to seek total return. The Fund’s investment adviser is OFI Global Asset Management, Inc. (“OFI Global” or the “Manager”), a wholly-owned subsidiary of OppenheimerFunds, Inc. (“OFI” or the “Sub-Adviser”). The Manager has entered into a sub-advisory agreement with OFI. Shares of the Fund are sold only to separate accounts of life insurance companies.
The Fund offers two classes of shares. Both classes are sold at their offering price, which is the net asset value per share, to separate investment accounts of participating insurance companies as an underlying investment for variable life insurance policies, variable annuity contracts or other investment products. The class of shares designated as Service shares is subject to a distribution and service plan. Both classes of shares have identical rights and voting privileges with respect to the Fund in general and exclusive voting rights on matters that affect that class alone. Earnings, net assets and net asset value per share may differ due to each class having its own expenses, such as transfer and shareholder servicing agent fees and shareholder communications, directly attributable to that class.
The following is a summary of significant accounting policies followed in the Fund’s preparation of financial statements in accordance with accounting principles generally accepted in the United States (“U.S. GAAP”).
2. Significant Accounting Policies
Security Valuation. All investments in securities are recorded at their estimated fair value, as described in Note 3.
Reporting Period End Date. The last day of the Fund’s reporting period is the last day the New York Stock Exchange was open for trading during the period. The Fund’s financial statements have been presented through that date to maintain consistency with the Fund’s net asset value calculations used for shareholder transactions.
Foreign Currency Translation. The Fund’s accounting records are maintained in U.S. dollars. The values of securities denominated in foreign currencies and amounts related to the purchase and sale of foreign securities and foreign investment income are translated into U.S. dollars as of the close of the New York Stock Exchange (the “Exchange”), normally 4:00 P.M. Eastern time, on each day the Exchange is open for trading. Foreign exchange rates may be valued primarily using a reliable bank, dealer or service authorized by the Board of Trustees.
Reported net realized gains and losses from foreign currency transactions arise from sales of portfolio securities, sales and maturities of short-term securities, sales of foreign currencies, exchange rate fluctuations between the trade and settlement dates on securities transactions, and the difference between the amounts of dividends, interest, and foreign withholding taxes recorded on the Fund’s books and the U.S. dollar equivalent of the amounts actually received or paid. Net unrealized appreciation and depreciation on the translation of assets and liabilities denominated in foreign currencies arise from changes in the values of assets and liabilities, including investments in securities at fiscal period end, resulting from changes in exchange rates.
The effect of changes in foreign currency exchange rates on investments is separately identified from the fluctuations arising from changes in market values of securities held and reported with all other foreign currency gains and losses in the Fund’s Statement of Operations.
Allocation of Income, Expenses, Gains and Losses. Income, expenses (other than those attributable to a specific class), gains and losses are allocated on a daily basis to each class of shares based upon the relative proportion of net assets represented by such class. Operating expenses directly attributable to a specific class are charged against the operations of that class.
Dividends and Distributions to Shareholders. Dividends and distributions to shareholders, which are determined in accordance with income tax regulations and may differ from U.S. GAAP, are recorded on the ex-dividend date. Income and capital gain distributions, if any, are declared and paid annually or at other times as deemed necessary by the Manager.
The tax character of distributions is determined as of the Fund’s fiscal year end. Therefore, a portion of the Fund’s distributions made to shareholders prior to the Fund’s fiscal year end may ultimately be categorized as a tax return of capital.
Investment Income. Dividend income is recorded on the ex-dividend date or upon ex-dividend notification in the case of certain foreign dividends where the ex-dividend date may have passed. Non-cash dividends included in dividend income, if any, are recorded at the fair market value of the securities received. Interest income is recognized on an accrual basis. Discount and premium, which are included in interest income on the Statement of Operations, are amortized or accreted daily.
Return of Capital Estimates. Distributions received from the Fund’s investments in Master Limited Partnerships (MLPs) and Real Estate Investments Trusts (REITs), generally are comprised of income and return of capital. The Fund records investment income and return of capital based on estimates. Such estimates are based on historical information available from each MLP, REIT and other industry sources. These estimates may subsequently be revised based on information received from MLPs and REITs after their tax reporting periods are concluded.
Custodian Fees. “Custodian fees and expenses” in the Statement of Operations may include interest expense incurred by the Fund on any cash overdrafts of its custodian account during the period. Such cash overdrafts may result from the effects of failed trades in portfolio securities and from cash outflows resulting from unanticipated shareholder redemption activity. The Fund pays interest to its custodian on such cash overdrafts, to the extent they are not offset by positive cash balances maintained by the Fund, at a rate equal to the Federal Funds Rate plus 0.50%. The “Reduction to custodian
23 OPPENHEIMER CONSERVATIVE BALANCED FUND/VA
NOTES TO FINANCIAL STATEMENTS Unaudited / Continued
2. Significant Accounting Policies (Continued)
expenses” line item, if applicable, represents earnings on cash balances maintained by the Fund during the period. Such interest expense and other custodian fees may be paid with these earnings.
Security Transactions. Security transactions are recorded on the trade date. Realized gains and losses on securities sold are determined on the basis of identified cost.
Indemnifications. The Fund’s organizational documents provide current and former Trustees and officers with a limited indemnification against liabilities arising in connection with the performance of their duties to the Fund. In the normal course of business, the Fund may also enter into contracts that provide general indemnifications. The Fund’s maximum exposure under these arrangements is unknown as this would be dependent on future claims that may be made against the Fund. The risk of material loss from such claims is considered remote.
Federal Taxes. The Fund intends to comply with provisions of the Internal Revenue Code applicable to regulated investment companies and to distribute substantially all of its investment company taxable income to shareholders. Therefore, no federal income or excise tax provision is required. The Fund files income tax returns in U.S. federal and applicable state jurisdictions. The statute of limitations on the Fund’s tax return filings generally remains open for the three preceding fiscal reporting period ends. The Fund has analyzed its tax positions for the fiscal year ended December 31, 2015, including open tax years, and does not believe there are any uncertain tax positions requiring recognition in the Fund’s financial statements.
During the fiscal year ended December 31, 2015, the Fund utilized $7,623,518 of capital loss carryforward to offset capital gains realized in that fiscal year. The Fund had post-October losses of $241,220. Details of the fiscal year ended December 31, 2015 capital loss carryforwards are included in the table below. Capital loss carryforwards with no expiration, if any, must be utilized prior to those with expiration dates. Capital losses with no expiration will be carried forward to future years if not offset by gains.
| Expiring | ||||
|
|
||||
| 2016 |
$ | 3,323,244 | ||
| 2017 |
8,580,875 | |||
|
|
|
|||
| Total |
$ | 11,904,119 | ||
|
|
|
|||
At period end, it is estimated that the capital loss carryforwards would be $9,281,543 expiring by 2017. The estimated capital loss carryforward represents the carryforward as of the end of the last fiscal year, increased or decreased by capital losses or gains realized in the first six months of the current fiscal year. During the reporting period, it is estimated that the Fund will utilize $2,622,576 of capital loss carryforward to offset realized capital gains.
Net investment income (loss) and net realized gain (loss) may differ for financial statement and tax purposes. The character of dividends and distributions made during the fiscal year from net investment income or net realized gains are determined in accordance with federal income tax requirements, which may differ from the character of net investment income or net realized gains presented in those financial statements in accordance with U.S. GAAP. Also, due to timing of dividends and distributions, the fiscal year in which amounts are distributed may differ from the fiscal year in which the income or net realized gain was recorded by the Fund.
The aggregate cost of securities and other investments and the composition of unrealized appreciation and depreciation of securities and other investments for federal income tax purposes at period end are noted in the following table. The primary difference between book and tax appreciation or depreciation of securities and other investments, if applicable, is attributable to the tax deferral of losses or tax realization of financial statement unrealized gain or loss.
| Federal tax cost of securities |
$ | 247,309,732 | ||
|
|
|
|||
| Gross unrealized appreciation |
$ | 17,018,175 | ||
| Gross unrealized depreciation |
(3,558,138) | |||
|
|
|
|||
| Net unrealized appreciation |
$ | 13,460,037 | ||
|
|
|
Use of Estimates. The preparation of financial statements in conformity with U.S. GAAP requires management to make estimates and assumptions that affect the reported amounts of assets and liabilities and disclosure of contingent assets and liabilities at the date of the financial statements and the reported amounts of increases and decreases in net assets from operations during the reporting period. Actual results could differ from those estimates.
3. Securities Valuation
The Fund calculates the net asset value of its shares as of 4:00 P.M. Eastern time, on each day the New York Stock Exchange (the “Exchange”) is open for trading, except in the case of a scheduled early closing of the Exchange, in which case the Fund will calculate net asset value of the shares as of the scheduled early closing time of the Exchange.
The Fund’s Board has adopted procedures for the valuation of the Fund’s securities and has delegated the day-to-day responsibility for valuation determinations under those procedures to the Manager. The Manager has established a Valuation Committee which is responsible for determining a “fair valuation” for any security for which market quotations are not “readily available.” The Valuation Committee’s fair valuation determinations are subject to review, approval and ratification by the Fund’s Board at its next regularly scheduled meeting covering the calendar quarter in which the fair valuation
24 OPPENHEIMER CONSERVATIVE BALANCED FUND/VA
3. Securities Valuation (Continued)
was determined.
Valuation Methods and Inputs
Securities are valued using unadjusted quoted market prices, when available, as supplied primarily by third party pricing services or dealers.
The following methodologies are used to determine the market value or the fair value of the types of securities described below:
Securities traded on a registered U.S. securities exchange (including exchange-traded derivatives other than futures and futures options) are valued based on the last sale price of the security reported on the principal exchange on which it is traded, prior to the time when the Fund’s assets are valued. In the absence of a sale, the security is valued at the mean between the bid and asked price on the principal exchange or, if not available from the principal exchange, obtained from two dealers. If bid and asked prices are not available from either the exchange or two dealers, the security is valued by using one of the following methodologies (listed in order of priority): (1) a bid from the principal exchange, (2) the mean between the bid and asked price as provided by a single dealer, or (3) a bid from a single dealer. A security of a foreign issuer traded on a foreign exchange, but not listed on a registered U.S. securities exchange, is valued based on the last sale price on the principal exchange on which the security is traded, as identified by the third party pricing service used by the Manager, prior to the time when the Fund’s assets are valued. If the last sale price is unavailable, the security is valued at the most recent official closing price on the principal exchange on which it is traded. If the last sales price or official closing price for a foreign security is not available, the security is valued at the mean between the bid and asked price per the exchange or, if not available from the exchange, obtained from two dealers. If bid and asked prices are not available from either the exchange or two dealers, the security is valued by using one of the following methodologies (listed in order of priority): (1) a bid from the exchange, (2) the mean between the bid and asked price as provided by a single dealer, or (3) a bid from a single dealer.
Shares of a registered investment company that are not traded on an exchange are valued at that investment company’s net asset value per share.
Corporate and government debt securities (of U.S. or foreign issuers) and municipal debt securities, event-linked bonds, loans, mortgage-backed securities, collateralized mortgage obligations, and asset-backed securities are valued at the mean between the “bid” and “asked” prices utilizing evaluated prices obtained from third party pricing services or broker-dealers who may use matrix pricing methods to determine the evaluated prices.
Short-term money market type debt securities with a remaining maturity of sixty days or less are valued at cost adjusted by the amortization of discount or premium to maturity (amortized cost), which approximates market value. Short-term debt securities with a remaining maturity in excess of sixty days are valued at the mean between the “bid” and “asked” prices utilizing evaluated prices obtained from third party pricing services or broker-dealers.
Structured securities, swaps, swaptions, and other over-the-counter derivatives are valued utilizing evaluated prices obtained from third party pricing services or broker-dealers.
Futures contracts and futures options traded on a commodities or futures exchange will be valued at the final settlement price or official closing price on the principal exchange as reported by such principal exchange at its trading session ending at, or most recently prior to, the time when the Fund’s assets are valued.
A description of the standard inputs that may generally be considered by the third party pricing vendors in determining their evaluated prices is provided below.
| Security Type | Standard inputs generally considered by third-party pricing vendors | |||
| Corporate debt, government debt, municipal, mortgage-backed and asset-backed securities | Reported trade data, broker-dealer price quotations, benchmark yields, issuer spreads on comparable securities, the credit quality, yield, maturity, and other appropriate factors. | |||
| Loans | Information obtained from market participants regarding reported trade data and broker-dealer price quotations. | |||
| Event-linked bonds | Information obtained from market participants regarding reported trade data and broker-dealer price quotations. |
If a market value or price cannot be determined for a security using the methodologies described above, or if, in the “good faith” opinion of the Manager, the market value or price obtained does not constitute a “readily available market quotation,” or a significant event has occurred that would materially affect the value of the security, the security is fair valued either (i) by a standardized fair valuation methodology applicable to the security type or the significant event as previously approved by the Valuation Committee and the Fund’s Board or (ii) as determined in good faith by the Manager’s Valuation Committee. The Valuation Committee considers all relevant facts that are reasonably available, through either public information or information available to the Manager, when determining the fair value of a security. Fair value determinations by the Manager are subject to review, approval and ratification by the Fund’s Board at its next regularly scheduled meeting covering the calendar quarter in which the fair valuation was determined. Those fair valuation standardized methodologies include, but are not limited to, valuing securities at the last sale price or initially at cost and subsequently adjusting the value based on: changes in company specific fundamentals, changes in an appropriate securities index, or changes in the value of similar securities which may be further adjusted for any discounts related to security-specific resale restrictions. When possible, such methodologies use observable market inputs such as unadjusted quoted prices of similar securities, observable interest rates, currency rates and yield curves. The methodologies used for valuing securities are not necessarily an indication of the risks associated with investing in those securities nor can it be assured that the Fund can obtain the fair value assigned to a security if it were to sell the security.
To assess the continuing appropriateness of security valuations, the Manager, or its third party service provider who is subject to oversight by the
25 OPPENHEIMER CONSERVATIVE BALANCED FUND/VA
NOTES TO FINANCIAL STATEMENTS Unaudited / Continued
3. Securities Valuation (Continued)
Manager, regularly compares prior day prices, prices on comparable securities, and sale prices to the current day prices and challenges those prices exceeding certain tolerance levels with the third party pricing service or broker source. For those securities valued by fair valuations, whether through a standardized fair valuation methodology or a fair valuation determination, the Valuation Committee reviews and affirms the reasonableness of the valuations based on such methodologies and fair valuation determinations on a regular basis after considering all relevant information that is reasonably available.
Classifications
Each investment asset or liability of the Fund is assigned a level at measurement date based on the significance and source of the inputs to its valuation. Various data inputs are used in determining the value of each of the Fund’s investments as of the reporting period end. These data inputs are categorized in the following hierarchy under applicable financial accounting standards:
1) Level 1-unadjusted quoted prices in active markets for identical assets or liabilities (including securities actively traded on a securities exchange)
2) Level 2-inputs other than unadjusted quoted prices that are observable for the asset or liability (such as unadjusted quoted prices for similar assets and market corroborated inputs such as interest rates, prepayment speeds, credit risks, etc.)
3) Level 3-significant unobservable inputs (including the Manager’s own judgments about assumptions that market participants would use in pricing the asset or liability).
The inputs used for valuing securities are not necessarily an indication of the risks associated with investing in those securities.
The Fund classifies each of its investments in investment companies which are publicly offered as Level 1. Investment companies that are not publicly offered are measured using net asset value as a practical expedient, and are not classified in the fair value hierarchy.
The table below categorizes amounts that are included in the Fund’s Statement of Assets and Liabilities at period end based on valuation input level:
| Level 1— Unadjusted |
Level 2— Other Significant Observable Inputs |
Level 3— Significant Unobservable Inputs |
Value | |||||||||||||
|
|
||||||||||||||||
| Assets Table |
||||||||||||||||
| Investments, at Value: |
||||||||||||||||
| Common Stocks |
||||||||||||||||
| Consumer Discretionary |
$ | 10,128,194 | $ | — | $ | — | $ | 10,128,194 | ||||||||
| Consumer Staples |
7,809,672 | — | — | 7,809,672 | ||||||||||||
| Energy |
5,172,423 | — | — | 5,172,423 | ||||||||||||
| Financials |
13,306,872 | — | — | 13,306,872 | ||||||||||||
| Health Care |
11,712,544 | — | — | 11,712,544 | ||||||||||||
| Industrials |
11,435,421 | — | — | 11,435,421 | ||||||||||||
| Information Technology |
15,062,016 | — | — | 15,062,016 | ||||||||||||
| Materials |
2,366,047 | — | — | 2,366,047 | ||||||||||||
| Telecommunication Services |
1,634,818 | — | — | 1,634,818 | ||||||||||||
| Utilities |
2,553,535 | — | — | 2,553,535 | ||||||||||||
| Asset-Backed Securities |
— | 16,418,664 | — | 16,418,664 | ||||||||||||
| Mortgage-Backed Obligations |
— | 81,993,836 | — | 81,993,836 | ||||||||||||
| U.S. Government Obligations |
— | 820,318 | — | 820,318 | ||||||||||||
| Non-Convertible Corporate Bonds and Notes | — | 74,160,380 | — | 74,160,380 | ||||||||||||
| Investment Company |
5,367,607 | — | — | 5,367,607 | ||||||||||||
| Over-the-Counter Options Purchased | — | 311,868 | — | 311,868 | ||||||||||||
|
|
|
|||||||||||||||
| Total Investments, at Value |
86,549,149 | 173,705,066 | — | 260,254,215 | ||||||||||||
| Other Financial Instruments: |
||||||||||||||||
| Futures contracts |
691,268 | — | — | 691,268 | ||||||||||||
|
|
|
|||||||||||||||
| Total Assets |
$ | 87,240,417 | $ | 173,705,066 | $ | — | $ | 260,945,483 | ||||||||
|
|
|
|||||||||||||||
| Liabilities Table |
||||||||||||||||
| Other Financial Instruments: |
||||||||||||||||
| Futures contracts |
$ | (173,422) | $ | — | $ | — | $ | (173,422) | ||||||||
|
|
|
|||||||||||||||
| Total Liabilities |
$ | (173,422) | $ | — | $ | — | $ | (173,422) | ||||||||
|
|
|
|||||||||||||||
Forward currency exchange contracts and futures contracts, if any, are reported at their unrealized appreciation/depreciation at measurement date, which represents the change in the contract’s value from trade date. All additional assets and liabilities included in the above table are reported at their market value at measurement date.
4. Investments and Risks
Investments in Affiliated Funds. The Fund is permitted to invest in other mutual funds advised by the Manager (“Affiliated Funds”). Affiliated Funds are open-end management investment companies registered under the 1940 Act, as amended. The Manager is the investment adviser of, and the Sub-Adviser provides investment and related advisory services to, the Affiliated Funds. When applicable, the Fund’s investments in Affiliated Funds are included in the Statement of Investments. Shares of Affiliated Funds are valued at their net asset value per share. As a shareholder, the Fund is subject to
26 OPPENHEIMER CONSERVATIVE BALANCED FUND/VA
4. Investments and Risks (Continued)
its proportional share of the Affiliated Funds’ expenses, including their management fee. The Manager will waive fees and/or reimburse Fund expenses in an amount equal to the indirect management fees incurred through the Fund’s investment in the Affiliated Funds.
Each of the Affiliated Funds in which the Fund invests has its own investment risks, and those risks can affect the value of the Fund’s investments and therefore the value of the Fund’s shares. To the extent that the Fund invests more of its assets in one Affiliated Fund than in another, the Fund will have greater exposure to the risks of that Affiliated Fund.
Investment in Oppenheimer Institutional Money Market Fund. The Fund is permitted to invest daily available cash balances in a money market Affiliated Fund. The Fund may invest the available cash in Class E shares of Oppenheimer Institutional Money Market Fund (“IMMF”) to seek current income while preserving liquidity or for defensive purposes. IMMF is regulated as a money market fund under the Investment Company Act of 1940, as amended.
Master Limited Partnerships (“MLPs”). MLPs issue common units that represent an equity ownership interest in a partnership and provide limited voting rights. MLP common units are registered with the Securities and Exchange Commission (“SEC”), and are freely tradable on securities exchanges such as the NYSE and the NASDAQ Stock Market (“NASDAQ”), or in the over-the-counter (“OTC”) market. An MLP consists of one or more general partners, who conduct the business, and one or more limited partners, who contribute capital. MLP common unit holders have a limited role in the partnership’s operations and management. The Fund, as a limited partner, normally would not be liable for the debts of the MLP beyond the amounts the Fund has contributed, but would not be shielded to the same extent that a shareholder of a corporation would be. In certain circumstances creditors of an MLP would have the right to seek return of capital distributed to a limited partner. This right of an MLP’s creditors would continue after the Fund sold its investment in the MLP.
Securities on a When-Issued or Delayed Delivery Basis. The Fund may purchase securities on a “when-issued” basis, and may purchase or sell securities on a “delayed delivery” basis. “When-issued” or “delayed delivery” refers to securities whose terms and indenture are available and for which a market exists, but which are not available for immediate delivery. Delivery and payment for securities that have been purchased by the Fund on a when-issued basis normally takes place within six months and possibly as long as two years or more after the trade date. During this period, such securities do not earn interest, are subject to market fluctuation and may increase or decrease in value prior to their delivery. The purchase of securities on a when-issued basis may increase the volatility of the Fund’s net asset value to the extent the Fund executes such transactions while remaining substantially fully invested. When the Fund engages in when-issued or delayed delivery transactions, it relies on the buyer or seller, as the case may be, to complete the transaction. Their failure to do so may cause the Fund to lose the opportunity to obtain or dispose of the security at a price and yield it considers advantageous. The Fund may also sell securities that it purchased on a when-issued basis or forward commitment prior to settlement of the original purchase.
At period end, the Fund had purchased securities issued on a when-issued or delayed delivery basis and sold securities issued on a delayed delivery basis as follows:
| When-Issued or Delayed Delivery Basis Transactions | ||
|
| ||
| Purchased securities |
$55,529,777 | |
| Sold securities |
9,397,948 | |
The Fund may enter into “forward roll” transactions with respect to mortgage-related securities. In this type of transaction, the Fund sells a mortgage-related security to a buyer and simultaneously agrees to repurchase a similar security (same type, coupon and maturity) at a later date at a set price. During the period between the sale and the repurchase, the Fund will not be entitled to receive interest and principal payments on the securities that have been sold. The Fund records the incremental difference between the forward purchase and sale of each forward roll as realized gain (loss) on investments or as fee income in the case of such transactions that have an associated fee in lieu of a difference in the forward purchase and sale price.
Forward roll transactions may be deemed to entail embedded leverage since the Fund purchases mortgage-related securities with extended settlement dates rather than paying for the securities under a normal settlement cycle. This embedded leverage increases the Fund’s market value of investments relative to its net assets which can incrementally increase the volatility of the Fund’s performance. Forward roll transactions can be replicated over multiple settlement periods.
Risks of entering into forward roll transactions include the potential inability of the counterparty to meet the terms of the agreement; the potential of the Fund to receive inferior securities at redelivery as compared to the securities sold to the counterparty; and counterparty credit risk.
Equity Security Risk. Stocks and other equity securities fluctuate in price. The value of the Fund’s portfolio may be affected by changes in the equity markets generally. Equity markets may experience significant short-term volatility and may fall sharply at times. Different markets may behave differently from each other and U.S. equity markets may move in the opposite direction from one or more foreign stock markets. Adverse events in any part of the equity or fixed-income markets may have unexpected negative effects on other market segments.
The prices of individual equity securities generally do not all move in the same direction at the same time and a variety of factors can affect the price of a particular company’s securities. These factors may include, but are not limited to, poor earnings reports, a loss of customers, litigation against the company, general unfavorable performance of the company’s sector or industry, or changes in government regulations affecting the company or its
27 OPPENHEIMER CONSERVATIVE BALANCED FUND/VA
NOTES TO FINANCIAL STATEMENTS Unaudited / Continued
4. Investments and Risks (Continued)
industry.
5. Market Risk Factors
The Fund’s investments in securities and/or financial derivatives may expose the Fund to various market risk factors:
Commodity Risk. Commodity risk relates to the change in value of commodities or commodity indexes as they relate to increases or decreases in the commodities market. Commodities are physical assets that have tangible properties. Examples of these types of assets are crude oil, heating oil, metals, livestock, and agricultural products.
Credit Risk. Credit risk relates to the ability of the issuer of debt to meet interest and principal payments, or both, as they come due. In general, lower-grade, higher-yield debt securities are subject to credit risk to a greater extent than lower-yield, higher-quality securities.
Equity Risk. Equity risk relates to the change in value of equity securities as they relate to increases or decreases in the general market.
Foreign Exchange Rate Risk. Foreign exchange rate risk relates to the change in the U.S. dollar value of a security held that is denominated in a foreign currency. The U.S. dollar value of a foreign currency denominated security will decrease as the dollar appreciates against the currency, while the U.S. dollar value will increase as the dollar depreciates against the currency.
Interest Rate Risk. Interest rate risk refers to the fluctuations in value of fixed-income securities resulting from the inverse relationship between price and yield. For example, an increase in general interest rates will tend to reduce the market value of already issued fixed-income investments, and a decline in general interest rates will tend to increase their value. In addition, debt securities with longer maturities, which tend to have higher yields, are subject to potentially greater fluctuations in value from changes in interest rates than obligations with shorter maturities.
Volatility Risk. Volatility risk refers to the magnitude of the movement, but not the direction of the movement, in a financial instrument’s price over a defined time period. Large increases or decreases in a financial instrument’s price over a relative time period typically indicate greater volatility risk, while small increases or decreases in its price typically indicate lower volatility risk.
6. Use of Derivatives
The Fund’s investment objective not only permits the Fund to purchase investment securities, it also allows the Fund to enter into various types of derivatives contracts, including, but not limited to, futures contracts, forward currency exchange contracts, credit default swaps, interest rate swaps, total return swaps, variance swaps and purchased and written options. In doing so, the Fund will employ strategies in differing combinations to permit it to increase, decrease, or change the level or types of exposure to market risk factors. These instruments may allow the Fund to pursue its objectives more quickly and efficiently than if it were to make direct purchases or sales of securities capable of effecting a similar response to market factors. Such contracts may be entered into through a bilateral over-the-counter (“OTC”) transaction, or through a securities or futures exchange and cleared through a clearinghouse.
Derivatives may have little or no initial cash investment relative to their market value exposure and therefore can produce significant gains or losses in excess of their cost due to unanticipated changes in the market risk factors and the overall market. This use of embedded leverage allows the Fund to increase its market value exposure relative to its net assets and can substantially increase the volatility of the Fund’s performance. In instances where the Fund is using derivatives to decrease, or hedge, exposures to market risk factors for securities held by the Fund, there are also risks that those derivatives may not perform as expected resulting in losses for the combined or hedged positions. Some derivatives have the potential for unlimited loss, regardless of the size of the Fund’s initial investment.
Additional associated risks from investing in derivatives also exist and potentially could have significant effects on the valuation of the derivative and the Fund. Typically, the associated risks are not the risks that the Fund is attempting to increase or decrease exposure to, per its investment objectives, but are the additional risks from investing in derivatives. Examples of these associated risks are liquidity risk, which is the risk that the Fund will not be able to sell the derivative in the open market in a timely manner, and counterparty credit risk, which is the risk that the counterparty will not fulfill its obligation to the Fund.
The Fund’s actual exposures to these market risk factors and associated risks during the period are discussed in further detail, by derivative type, below.
Futures Contracts
A futures contract is a commitment to buy or sell a specific amount of a commodity, financial instrument or currency at a negotiated price on a stipulated future date. The Fund may buy and sell futures contracts and may also buy or write put or call options on these futures contracts. Futures contracts and options thereon are generally entered into on a regulated futures exchange and cleared through a clearinghouse associated with the exchange.
Upon entering into a futures contract, the Fund is required to deposit either cash or securities (initial margin) in an amount equal to a certain percentage of the contract value in an account registered in the futures commission merchant’s name. Subsequent payments (variation margin) are paid to or from the futures commission merchant each day equal to the daily changes in the contract value. Such payments are recorded as unrealized gains and losses. Should the Fund fail to make requested variation margin payments, the futures commission merchant can gain access to the initial margin to satisfy the Fund’s payment obligations.
Futures contracts are reported on a schedule following the Statement of Investments. Securities held by a futures commission merchant to cover initial margin requirements on open futures contracts are noted in the Statement of Investments. Cash held by a futures commission merchant to cover initial margin requirements on open futures contracts and the receivable and/or payable for the daily mark to market for the variation margin are noted in the Statement of Assets and Liabilities. The net change in unrealized appreciation and depreciation is reported in the Statement of Operations. Realized gains
28 OPPENHEIMER CONSERVATIVE BALANCED FUND/VA
6. Use of Derivatives (Continued)
(losses) are reported in the Statement of Operations at the closing or expiration of futures contracts.
The Fund has purchased futures contracts on various bonds and notes to increase exposure to interest rate risk.
The Fund has sold futures contracts on various bonds and notes to decrease exposure to interest rate risk.
During the reporting period, the Fund had an ending monthly average market value of $16,654,605 and $11,393,192 on futures contracts purchased and sold, respectively.
Additional associated risks of entering into futures contracts (and related options) include the possibility that there may be an illiquid market where the Fund is unable to liquidate the contract or enter into an offsetting position and, if used for hedging purposes, the risk that the price of the contract will correlate imperfectly with the prices of the Fund’s securities.
Option Activity
The Fund may buy and sell put and call options, or write put and call options. When an option is written, the Fund receives a premium and becomes obligated to sell or purchase the underlying security, currency or other underlying financial instrument at a fixed price, upon exercise of the option.
Options can be traded through an exchange or through a privately negotiated arrangement with a dealer in an OTC transaction. Options traded through an exchange are generally cleared through a clearinghouse (such as The Options Clearing Corporation). The difference between the premium received or paid, and market value of the option, is recorded as unrealized appreciation or depreciation. The net change in unrealized appreciation or depreciation is reported in the Statement of Operations. When an option is exercised, the cost of the security purchased or the proceeds of the security sale are adjusted by the amount of premium received or paid. Upon the expiration or closing of the option transaction, a gain or loss is reported in the Statement of Operations.
The Fund has purchased call options on individual equity securities and/or equity indexes to increase exposure to equity risk. A purchased call option becomes more valuable as the price of the underlying financial instrument appreciates relative to the strike price.
The Fund has purchased put options on individual equity securities and/or equity indexes to decrease exposure to equity risk. A purchased put option becomes more valuable as the price of the underlying financial instrument depreciates relative to the strike price.
During the reporting period, the Fund had an ending monthly average market value of $106,233 and $341 on purchased call options and purchased put options, respectively.
Options written, if any, are reported in a schedule following the Statement of Investments and as a liability in the Statement of Assets and Liabilities. Securities held in collateral accounts to cover potential obligations with respect to outstanding written options are noted in the Statement of Investments.
The risk in writing a call option is that the market price of the security increases and if the option is exercised, the Fund must either purchase the security at a higher price for delivery or, if the Fund owns the underlying security, give up the opportunity for profit. The risk in writing a put option is that the Fund may incur a loss if the market price of the security decreases and the option is exercised. The risk in buying an option is that the Fund pays a premium whether or not the option is exercised. The Fund also has the additional risk that there may be an illiquid market where the Fund is unable to close the contract.
The Fund has written put options on individual equity securities and/or equity indexes to increase exposure to equity risk. A written put option becomes more valuable as the price of the underlying financial instrument appreciates relative to the strike price.
During the reporting period, the Fund had an ending monthly average market value of $3,295 on written put options.
Additional associated risks to the Fund include counterparty credit risk and liquidity risk.
Written option activity for the reporting period was as follows:
| Number of Contracts | Amount of Premiums | |||||||
|
|
||||||||
| Options outstanding as of December 31, 2015 | – | $ | – | |||||
| Options written | 924 | 35,112 | ||||||
| Options exercised | (924) | (35,112) | ||||||
|
|
|
|||||||
| Options outstanding as of June 30, 2016 | – | $ | – | |||||
|
|
|
|||||||
Counterparty Credit Risk. Derivative positions are subject to the risk that the counterparty will not fulfill its obligation to the Fund. The Fund intends to enter into derivative transactions with counterparties that the Manager believes to be creditworthy at the time of the transaction.
The Fund’s risk of loss from counterparty credit risk on OTC derivatives is generally limited to the aggregate unrealized gain netted against any collateral held by the Fund. For OTC options purchased, the Fund bears the risk of loss of the amount of the premiums paid plus the positive change in market values net of any collateral held by the Fund should the counterparty fail to perform under the contracts. Options written by the Fund do not typically give rise to counterparty credit risk, as options written generally obligate the Fund and not the counterparty to perform.
To reduce counterparty risk with respect to OTC transactions, the Fund has entered into master netting arrangements, established within the Fund’s International Swap and Derivatives Association, Inc. (“ISDA”) master agreements, which allow the Fund to make (or to have an entitlement to receive) a single net payment in the event of default (close-out netting) for outstanding payables and receivables with respect to certain OTC positions in swaps, options, swaptions, and forward currency exchange contracts for each individual counterparty. In addition, the Fund may require that certain counterparties post cash and/or securities in collateral accounts to cover their net payment obligations for those derivative contracts subject to ISDA master agreements. If the counterparty fails to perform under these contracts and agreements, the cash and/or securities will be made available to the Fund.
29 OPPENHEIMER CONSERVATIVE BALANCED FUND/VA
NOTES TO FINANCIAL STATEMENTS Unaudited / Continued
6. Use of Derivatives (Continued)
ISDA master agreements include credit related contingent features which allow counterparties to OTC derivatives to terminate derivative contracts prior to maturity in the event that, for example, the Fund’s net assets decline by a stated percentage or the Fund fails to meet the terms of its ISDA master agreements, which would cause the Fund to accelerate payment of any net liability owed to the counterparty.
For financial reporting purposes, the Fund does not offset derivative assets and derivative liabilities that are subject to netting arrangements in the Statement of Assets and Liabilities. Bankruptcy or insolvency laws of a particular jurisdiction may impose restrictions on or prohibitions against the right of offset in bankruptcy, insolvency or other events.
The Fund’s risk of loss from counterparty credit risk on exchange-traded derivatives cleared through a clearinghouse and for centrally cleared swaps is generally considered lower than as compared to OTC derivatives. However, counterparty credit risk exists with respect to initial and variation margin deposited/paid by the Fund that is held in futures commission merchant, broker and/or clearinghouse accounts for such exchange-traded derivatives and for centrally cleared swaps.
With respect to centrally cleared swaps, such transactions will be submitted for clearing, and if cleared, will be held in accounts at futures commission merchants or brokers that are members of clearinghouses. While brokers, futures commission merchants and clearinghouses are required to segregate customer margin from their own assets, in the event that a broker, futures commission merchant or clearinghouse becomes insolvent or goes into bankruptcy and at that time there is a shortfall in the aggregate amount of margin held by the broker, futures commission merchant or clearinghouse for all its customers, U.S. bankruptcy laws will typically allocate that shortfall on a pro-rata basis across all the broker’s, futures commission merchant’s or clearinghouse’s customers, potentially resulting in losses to the Fund.
There is the risk that a broker, futures commission merchant or clearinghouse will decline to clear a transaction on the Fund’s behalf, and the Fund may be required to pay a termination fee to the executing broker with whom the Fund initially enters into the transaction. Clearinghouses may also be permitted to terminate centrally cleared swaps at any time. The Fund is also subject to the risk that the broker or futures commission merchant will improperly use the Fund’s assets deposited/paid as initial or variation margin to satisfy payment obligations of another customer. In the event of a default by another customer of the broker or futures commission merchant, the Fund might not receive its variation margin payments from the clearinghouse, due to the manner in which variation margin payments are aggregated for all customers of the broker/futures commission merchant.
Collateral and margin requirements differ by type of derivative. Margin requirements are established by the broker, futures commission merchant or clearinghouse for exchange-traded and cleared derivatives, including centrally cleared swaps. Brokers, futures commission merchants and clearinghouses can ask for margin in excess of the regulatory minimum, or increase the margin amount, in certain circumstances.
Collateral terms are contract specific for OTC derivatives. For derivatives traded under an ISDA master agreement, the collateral requirements are typically calculated by netting the mark to market amount for each transaction under such agreement and comparing that amount to the value of any collateral currently pledged by the Fund or the counterparty.
For financial reporting purposes, cash collateral that has been pledged to cover obligations of the Fund, if any, is reported separately on the Statement of Assets and Liabilities as cash pledged as collateral. Non-cash collateral pledged by the Fund, if any, is noted in the Statement of Investments. Generally, the amount of collateral due from or to a party must exceed a minimum transfer amount threshold (e.g. $250,000) before a transfer has to be made. To the extent amounts due to the Fund from its counterparties are not fully collateralized, contractually or otherwise, the Fund bears the risk of loss from counterparty nonperformance.
The following table presents by counterparty the Fund’s OTC derivative assets net of the related collateral pledged by the Fund at June 30, 2016:
| Gross Amounts Not Offset in the Statement of Assets & Liabilities | ||||||||||||||||||||
| Counterparty | Gross Amounts Not Offset in the Statement of Assets & Liabilities* |
Financial Instruments Available for Offset |
Financial Instruments Collateral Received** |
Cash Collateral Received** |
Net Amount | |||||||||||||||
|
|
||||||||||||||||||||
| Bank of America NA | $ | 198,130 | $ | – | $ | – | $ | – | $ | 198,130 | ||||||||||
| Citibank NA | 113,738 | – | – | – | 113,738 | |||||||||||||||
|
|
|
|||||||||||||||||||
| $ | 311,868 | $ | – | $ | – | $ | – | $ | 311,868 | |||||||||||
|
|
|
|||||||||||||||||||
*OTC derivatives are reported gross on the Statement of Assets and Liabilities. Exchange traded options and margin related to centrally cleared swaps and futures are excluded from these reported amounts.
**Reported collateral posted for the benefit of the Fund within this table is limited to the net outstanding amount due from an individual counterparty. The collateral posted for the benefit of the Fund may exceed these amounts.
The following table presents the valuations of derivative instruments by risk exposure as reported within the Statement of Assets and Liabilities at period end:
| Asset Derivatives | Liability Derivatives | |||||||||||||||
| Derivatives Not Accounted for as Hedging Instruments |
Statement of Assets and Liabilities Location |
Value | Statement of Assets and Liabilities Location |
Value | ||||||||||||
|
|
||||||||||||||||
| Interest rate contracts | Variation margin receivable | $ | 23,885* | Variation margin payable | $ | 45,313* | ||||||||||
| Equity contracts | Investments, at value | 311,868** | — | |||||||||||||
|
|
|
|
|
|||||||||||||
| Total | $ | 335,753 | $ | 45,313 | ||||||||||||
|
|
|
|
|
|||||||||||||
*Includes only the current day’s variation margin. Prior variation margin movements have been reflected in cash on the Statement of Assets and Liabilities upon receipt or payment.
**Amounts relate to purchased option contracts and purchased swaption contracts, if any.
30 OPPENHEIMER CONSERVATIVE BALANCED FUND/VA
6. Use of Derivatives (Continued)
The effect of derivative instruments on the Statement of Operations is as follows:
| Amount of Realized Gain or (Loss) Recognized on Derivatives | ||||||||||||
|
|
||||||||||||
| Derivatives Not Accounted for as Hedging Instruments |
Investments from unaffiliated companies (including premiums on options exercised)* |
Closing and expiration of futures contracts |
Total | |||||||||
|
|
||||||||||||
| Interest rate contracts | $ | (65,957) | $ | 297,187 | $ | 231,230 | ||||||
*Includes purchased option contracts and purchased swaption contracts, if any.
| Amount of Change in Unrealized Gain or (Loss) Recognized on Derivatives | ||||||||||||
|
|
||||||||||||
| Derivatives Not Accounted for as Hedging Instruments |
Investments* | Futures contracts |
Total | |||||||||
|
|
||||||||||||
| Equity contracts | $ | 89,143 | $ | — | $ | 89,143 | ||||||
| Interest rate contracts | — | 491,201 | 491,201 | |||||||||
|
|
|
|||||||||||
| Total | $ | 89,143 | $ | 491,201 | $ | 580,344 | ||||||
|
|
|
|||||||||||
*Includes purchased option contracts and purchased swaption contracts, if any.
7. Shares of Beneficial Interest
The Fund has authorized an unlimited number of $0.001 par value shares of beneficial interest of each class. Transactions in shares of beneficial interest were as follows:
| Six Months Ended June 30, 2016
|
Year Ended December 31, 2015
|
|||||||||||||||
| Shares | Amount | Shares | Amount | |||||||||||||
|
|
||||||||||||||||
| Non-Service Shares |
||||||||||||||||
| Sold | 98,667 | $ | 1,437,448 | 192,335 | $ | 2,822,887 | ||||||||||
| Dividends and/or distributions reinvested | 289,075 | 4,214,715 | 299,338 | 4,370,338 | ||||||||||||
| Redeemed | (831,390) | (12,086,407 | ) | (1,759,489) | (25,932,576) | |||||||||||
|
|
|
|||||||||||||||
| Net decrease | (443,648) | $ | (6,434,244 | ) | (1,267,816) | $ | (18,739,351) | |||||||||
|
|
|
|||||||||||||||
|
|
||||||||||||||||
| Service Shares |
||||||||||||||||
| Sold | 542,241 | $ | 7,717,530 | 228,285 | $ | 3,296,473 | ||||||||||
| Dividends and/or distributions reinvested | 80,196 | 1,155,621 | 82,918 | 1,196,499 | ||||||||||||
| Redeemed | (488,479) | (7,034,118 | ) | (1,062,479) | (15,384,640) | |||||||||||
|
|
|
|||||||||||||||
| Net increase (decrease) | 133,958 | $ | 1,839,033 | (751,276) | $ | (10,891,668) | ||||||||||
|
|
|
|||||||||||||||
8. Purchases and Sales of Securities
The aggregate cost of purchases and proceeds from sales of securities, other than short-term obligations and investments in IMMF, for the reporting period were as follows:
| Purchases | Sales | |||||||||
|
|
||||||||||
| Investment securities | $72,722,698 | $72,185,763 | ||||||||
| U.S. government and government agency obligations |
449,883 | 1,071,144 | ||||||||
| To Be Announced (TBA) mortgage-related securities |
367,695,755 | 365,682,751 | ||||||||
9. Fees and Other Transactions with Affiliates
Management Fees. Under the investment advisory agreement, the Fund pays the Manager a management fee based on the daily net assets of the Fund at an annual rate as shown in the following table:
| Fee Schedule | ||||
| Up to $200 million |
0.75 | % | ||
| Next $200 million |
0.72 | |||
| Next $200 million |
0.69 | |||
| Next $200 million |
0.66 | |||
| Over $800 million |
0.60 | |||
The Fund’s effective management fee for the reporting period was 0.75% of average annual net assets before any applicable waivers.
31 OPPENHEIMER CONSERVATIVE BALANCED FUND/VA
NOTES TO FINANCIAL STATEMENTS Unaudited / Continued
9. Fees and Other Transactions with Affiliates (Continued)
Sub-Adviser Fees. The Manager has retained the Sub-Adviser to provide the day-to-day portfolio management of the Fund. Under the Sub-Advisory Agreement, the Manager pays the Sub-Adviser an annual fee in monthly installments, equal to a percentage of the investment management fee collected by the Manager from the Fund, which shall be calculated after any investment management fee waivers. The fee paid to the Sub-Adviser is paid by the Manager, not by the Fund.
Transfer Agent Fees. OFI Global (the “Transfer Agent”) serves as the transfer and shareholder servicing agent for the Fund. The Fund pays the Transfer Agent a fee based on annual net assets. Fees incurred and average net assets for each class with respect to these services are detailed in the Statement of Operations and Financial Highlights, respectively.
Sub-Transfer Agent Fees. The Transfer Agent has retained Shareholder Services, Inc., a wholly-owned subsidiary of OFI (the “Sub-Transfer Agent”), to provide the day-to-day transfer agent and shareholder servicing of the Fund. Under the Sub-Transfer Agency Agreement, the Transfer Agent pays the Sub-Transfer Agent an annual fee in monthly installments, equal to a percentage of the transfer agent fee collected by the Transfer Agent from the Fund, which shall be calculated after any applicable fee waivers. The fee paid to the Sub-Transfer Agent is paid by the Transfer Agent, not by the Fund.
Trustees’ Compensation. The Fund’s Board of Trustees (“Board”) has adopted a compensation deferral plan for Independent Trustees that enables Trustees to elect to defer receipt of all or a portion of the annual compensation they are entitled to receive from the Fund. For purposes of determining the amount owed to the Trustees under the plan, deferred amounts are treated as though equal dollar amounts had been invested in shares of the Fund or in other Oppenheimer funds selected by the Trustees. The Fund purchases shares of the funds selected for deferral by the Trustees in amounts equal to his or her deemed investment, resulting in a Fund asset equal to the deferred compensation liability. Such assets are included as a component of “Other” within the asset section of the Statement of Assets and Liabilities. Deferral of Trustees’ fees under the plan will not affect the net assets of the Fund and will not materially affect the Fund’s assets, liabilities or net investment income per share. Amounts will be deferred until distributed in accordance with the compensation deferral plan.
Distribution and Service Plan for Service Shares. The Fund has adopted a Distribution and Service Plan (the “Plan”) pursuant to Rule 12b-1 under the 1940 Act for Service shares to pay OppenheimerFunds Distributor, Inc. (the “Distributor”), for distribution related services, personal service and account maintenance for the Fund’s Service shares. Under the Plan, payments are made periodically at an annual rate of 0.25% of the daily net assets of Service shares of the Fund. The Distributor currently uses all of those fees to compensate sponsors of the insurance product that offers Fund shares, for providing personal service and maintenance of accounts of their variable contract owners that hold Service shares. These fees are paid out of the Fund’s assets on an on-going basis and increase operating expenses of the Service shares, which results in lower performance compared to the Fund’s shares that are not subject to a service fee. Fees incurred by the Fund under the Plan are detailed in the Statement of Operations.
Waivers and Reimbursements of Expenses. The Manager has contractually agreed to limit the Fund’s expenses after payments, waivers and/or reimbursements and reduction to custodian expenses, excluding expenses incurred directly or indirectly by the Fund as a result of investments in other investment companies, wholly-owned subsidiaries and pooled investment vehicles; so that those expenses, as percentages of daily net assets, will not exceed the annual rate of 0.67% for Non-Service shares and 0.92% for Service shares. The expense limitations do not include interest and fees from borrowing, and other expenses not incurred in the ordinary course of the Fund’s business. During the reporting period, the Manager waived fees and/or reimbursed the Fund $226,249 and $68,309 for Non-Service and Service shares, respectively.
The Manager will waive fees and/or reimburse Fund expenses in an amount equal to the indirect management fees incurred through the Fund’s investment in IMMF. During the reporting period, the Manager waived fees and/or reimbursed the Fund $2,677 for IMMF management fees.
Waivers and/or reimbursements may be modified or terminated as set forth according to the terms in the prospectus.
10. Borrowings and Other Financing
Joint Credit Facility. A number of mutual funds managed by the Manager participate in a $1.28 billion revolving credit facility (the “Facility”) intended to provide short-term financing, if necessary, subject to certain restrictions in connection with atypical redemption activity. Expenses and fees related to the Facility are paid by the participating funds and are disclosed separately or as other expenses on the Statement of Operations. The Fund did not utilize the Facility during the reporting period.
11. Pending Litigation
In 2009, several putative class action lawsuits were filed and later consolidated before the U.S. District Court for the District of Colorado against OppenheimerFunds, Inc. (“OFI”), OppenheimerFunds Distributor, Inc. (“OFDI”), and Oppenheimer Rochester California Municipal Fund, a fund advised by OFI Global Asset Management, Inc. and distributed by the Distributor (the “California Fund”), in connection with the California Fund’s investment performance. The plaintiffs asserted claims against OFI, OFDI and certain present and former trustees and officers of the California Fund under the federal securities laws, alleging, among other things, that the disclosure documents of the California Fund contained misrepresentations and omissions and the investment policies of the California Fund were not followed. Plaintiffs in the suit filed an amended complaint and defendants filed a motion to dismiss. In 2011, the court issued an order which granted in part and denied in part the defendants’ motion to dismiss. In 2012, plaintiffs filed a motion, which defendants opposed, to certify a class and appoint class representatives and class counsel. In March 2015, the court granted plaintiffs’ motion
32 OPPENHEIMER CONSERVATIVE BALANCED FUND/VA
11. Pending Litigation (Continued)
for class certification. In May 2015, the U.S. Court of Appeals for the Tenth Circuit vacated the class certification order and remanded the matter to the district court for further proceedings. In October 2015, the district court reaffirmed its order and determined that the suit will proceed as a class action. In December 2015, the Tenth Circuit denied defendants’ petition to appeal the district court’s reaffirmed class certification order.
OFI and OFDI believe the suit is without merit; that it is premature to render any opinion as to the likelihood of an outcome unfavorable to them in the suit; and that no estimate can yet be made as to the amount or range of any potential loss. Furthermore, OFI believes that the suit should not impair the ability of OFI or OFDI to perform their respective duties to the Fund and that the outcome of the suit should not have any material effect on the operations of any of the Oppenheimer funds.
33 OPPENHEIMER CONSERVATIVE BALANCED FUND/VA
PORTFOLIO PROXY VOTING POLICIES AND GUIDELINES; UPDATES TO STATEMENTS OF INVESTMENTS Unaudited
The Fund has adopted Portfolio Proxy Voting Policies and Guidelines under which the Fund votes proxies relating to securities (“portfolio proxies”) held by the Fund. A description of the Fund’s Portfolio Proxy Voting Policies and Guidelines is available (i) without charge, upon request, by calling the Fund toll-free at 1.800.525.7048, (ii) on the Fund’s website at www.oppenheimerfunds.com, and (iii) on the SEC’s website at www.sec.gov. In addition, the Fund is required to file Form N-PX, with its complete proxy voting record for the 12 months ended June 30th, no later than August 31st of each year. The Fund’s voting record is available (i) without charge, upon request, by calling the Fund toll-free at 1.800.525.7048, and (ii) in the Form N-PX filing on the SEC’s website at www.sec.gov.
The Fund files its complete schedule of portfolio holdings with the SEC for the first quarter and the third quarter of each fiscal year on Form N-Q. The Fund’s Form N-Q filings are available on the SEC’s website at www.sec.gov. Those forms may be reviewed and copied at the SEC’s Public Reference Room in Washington, D.C. Information on the operation of the Public Reference Room may be obtained by calling 1-800-SEC-0330.
34 OPPENHEIMER CONSERVATIVE BALANCED FUND/VA
DISTRIBUTION SOURCES Unaudited
For any distribution that took place over the Fund’s reporting period, the table below details on a per-share basis the percentage of the Fund’s total distribution payment amount that was derived from the following sources: net income, net profit from the sale of securities, and other capital sources. This information is based upon income and capital gains using generally accepted accounting principles as of the date of each distribution. Because the Fund is actively managed, the relative amount of the Fund’s total distributions derived from various sources over the calendar year may change. Please note that this information should not be used for tax reporting purposes as the tax character of distributable income may differ from the amounts used for this notification. You will receive IRS tax forms in the first quarter of each calendar year detailing the actual amount of the taxable and non-taxable portion of distributions paid to you during the tax year.
For the most current information, please go to oppenheimerfunds.com. Select your Fund, then the ‘Detailed’ tab; where ‘Dividends’ are shown, the Fund’s latest pay date will be followed by the sources of any distribution, updated daily.
| Fund Name | Pay Date |
Net Income |
Net Profit from Sale |
Other Capital Sources | ||||
| Oppenheimer Conservative Balanced Fund/VA | 6/21/16 | 87.2% | 12.8% | 0.0% |
35 OPPENHEIMER CONSERVATIVE BALANCED FUND/VA
OPPENHEIMER CONSERVATIVE BALANCED FUND/VA
A Series of Oppenheimer Variable Account Funds
| Trustees and Officers | Sam Freedman, Chairman of the Board of Trustees and Trustee | |
| Jon S. Fossel, Trustee | ||
| Richard F. Grabish, Trustee | ||
| Beverly L. Hamilton, Trustee | ||
| Victoria J. Herget, Trustee | ||
| Robert J. Malone, Trustee | ||
| F. William Marshall, Jr., Trustee | ||
| Karen L. Stuckey, Trustee | ||
| James D. Vaughn, Trustee | ||
| Arthur P. Steinmetz, Trustee, President and Principal Executive Officer | ||
| Magnus Krantz, Vice President | ||
| Krishna Memani, Vice President | ||
| Cynthia Lo Bessette, Secretary and Chief Legal Officer | ||
| Jennifer Sexton, Vice President and Chief Business Officer | ||
| Mary Ann Picciotto, Chief Compliance Officer and Chief Anti-Money Laundering Officer | ||
| Brian S. Petersen, Treasurer and Principal Financial & Accounting Officer | ||
| Manager | OFI Global Asset Management, Inc. | |
| Sub-Adviser | OppenheimerFunds, Inc. | |
| Distributor | OppenheimerFunds Distributor, Inc. | |
| Transfer and Shareholder Servicing Agent |
OFI Global Asset Management, Inc. | |
| Sub-Transfer Agent | Shareholder Services, Inc. | |
| DBA OppenheimerFunds Services | ||
| Independent Registered Public Accounting Firm |
KPMG LLP | |
| Legal Counsel | Ropes & Gray LLP | |
| Before investing in any of the Oppenheimer funds, investors should carefully consider a fund’s investment objectives, risks, charges and expenses. Fund prospectuses and summary prospectuses contain this and other information about the funds, and may be obtained by asking your financial advisor, or calling us at 1.800.988.8287. Read prospectuses and summary prospectuses carefully before investing. | ||
| The financial statements included herein have been taken from the records of the Fund without examination of those records by the independent registered public accounting firm. | ||
| © 2016 OppenheimerFunds, Inc. All rights reserved. Oppenheimer funds are distributed by OppenheimerFunds Distributor, Inc. | ||

|
|
||||
| June 30, 2016 |
||||
|
Oppenheimer |
||||
| Capital Appreciation Fund/VA |
Semiannual Report | |||
| A Series of Oppenheimer Variable Account Funds
|
||||
|
SEMIANNUAL REPORT |
||||
|
Listing of Top Holdings |
||||
|
Fund Performance Discussion |
||||
|
Financial Statements |
||||

PORTFOLIO MANAGER: Michael Kotlarz
AVERAGE ANNUAL TOTAL RETURNS FOR THE PERIODS ENDED 6/30/16
| Inception Date |
6-Months | 1-Year | 5-Year | 10-Year | ||||||||||||||||
| Non-Service Shares |
4/3/85 | -6.29% | -6.84% | 9.22% | 5.71% | |||||||||||||||
| Service Shares |
9/18/01 | -6.40 | -7.07 | 8.95 | 5.44 | |||||||||||||||
| S&P 500 Index |
3.84 | 3.99 | 12.10 | 7.42 | ||||||||||||||||
| Russell 1000 Growth Index |
1.36 | 3.02 | 12.35 | 8.78 | ||||||||||||||||
Performance data quoted represents past performance, which does not guarantee future results. The investment return and principal value of an investment in the Fund will fluctuate so that an investor’s shares, when redeemed, may be worth more or less than their original cost. Current performance may be lower or higher than the performance quoted. For performance data current to the most recent month end, call us at 1.800.988.8287. The Fund’s total returns should not be expected to be the same as the returns of other funds, whether or not both funds have the same portfolio managers and/or similar names. The Fund’s total returns include changes in share price and reinvested distributions but do not include the charges associated with the separate account products that offer this Fund. Such performance would have been lower if such charges were taken into account.
The Fund’s performance is compared to the performance of the S&P 500 Index and the Russell 1000 Growth Index. The S&P 500 Index is a broad-based measure of domestic stock performance. The Russell 1000 Growth Index measures the performance of the large-cap growth segment of the U.S. equity universe. It includes those Russell 1000 companies with higher price-to-book ratios and higher forecasted growth values. The Indices are unmanaged and cannot be purchased directly by investors. Index performance is shown for illustrative purposes only and does not predict or depict the performance of the Fund. While index comparisons may be useful to provide a benchmark for the Fund’s performance, it must be noted that the Fund’s investments are not limited to the investments comprising the Index. Index performance includes reinvestment of income, but does not reflect transaction costs, fees, expenses or taxes. Index performance is shown for illustrative purposes only as a benchmark for the Fund’s performance, and does not predict or depict performance of the Fund. The Fund’s performance reflects the effects of the Fund’s business and operating expenses.
TOP HOLDINGS AND ALLOCATIONS
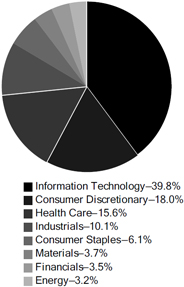
2 OPPENHEIMER CAPITAL APPRECIATION FUND/VA
Fund Performance Discussion
In a volatile market environment, the Fund’s Non-Service shares generated a cumulative total return of -6.29%. In comparison, the Fund underperformed the Russell 1000 Growth Index (the “Index”), which returned 1.36% for the same period. The Fund’s underperformance stemmed largely from stock selection in the health care and financials sectors, and both stock selection within and an underweight allocation to consumer staples. The Fund outperformed the Index in the materials sector due to stock selection, and in the energy sector, as a result of an overweight position and stock selection.
MARKET OVERVIEW
The first half of 2016 was a volatile time for global equity markets. China’s slowing economy, falling crude oil prices, and the aggressive interest rate hike path indicated by the Federal Reserve (the “Fed”) in its December 2015 communication, contributed to a tumultuous environment. March saw a temporary relief rally as communication from the Fed turned more accommodative in light of this weak start to the year. Oil prices and commodities started to pick up, but continued to experience volatility through the close of the reporting period. However, unanswered questions, including how quickly the Fed would raise interest rates and whether Britain would decide to exit the E.U. on its June 23 vote, made for an uncertain period. The U.K. surprised the markets by ultimately deciding to exit the E.U. As a result, markets dropped sharply and remained volatile through the reporting period’s end.
TOP INDIVIDUAL CONTRIBUTORS
Top contributors to the Fund’s performance this period included NVIDIA Corp., Facebook, Inc. and Oracle Corp. NVIDIA Corp., a visual computing company that develops graphics chips for use in PCs, mobile devices, servers, automobiles and supercomputers, reported revenue above consensus over the first quarter of its fiscal year and guided second quarter revenue ahead of consensus expectations driven by broad-based growth. We believe the company is positioned to benefit from growth opportunities across all four key platforms, with a particularly strong competitive position in the gaming market. Shares of Facebook, the world’s largest social networking site, rallied after the company reported record revenue from mobile advertising. Marketers are flocking to Facebook because of its knack for getting well-targeted ads in front of consumers. Oracle, the business software giant, reported profit that topped estimates and posted strong gains in revenue from cloud-based businesses, signaling that it’s making progress in the transition away from traditional software. Additionally, the board authorized repurchases of as much as $10 billion of common stock under its existing buyback program.
TOP INDIVIDUAL DETRACTORS
Detractors from performance this reporting period included Allergan plc, Valeant Pharmaceuticals International, Inc. and Biogen, Inc. Allergan, formerly known as Actavis, is a specialty pharmaceuticals manufacturer that markets branded drugs for patients suffering from diseases principally in the eye care, neuroscience, medical aesthetics/dermatology, women’s health and gastroenterology categories. In November 2015, the company announced that it was merging with Pfizer to create a global pharmaceuticals company, and expected the deal to close in the second half of 2016. The merger was called off in early April after unprecedented actions by the U.S. Treasury department made the economics of the transaction unattractive, leading to a decline in share price. Valeant Pharmaceuticals International said it is under investigation by the U.S. Securities and Exchange Commission in a previously undisclosed probe, in addition to its delayed financial results. We have since sold our position. Biogen is a biopharmaceutical company that experienced declines in June 2016 after reporting top-line results from the Phase 2 study of opicinumab, a drug being developed to treat multiple sclerosis. The trial did not meet any of its key endpoints, a disappointment which led a fall in share price.
STRATEGY & OUTLOOK
Global markets remain volatile, discounting a wide array of conflicting signals and divergent monetary and geopolitical policies and pressures. Global commodities, including energy, have rallied as Chinese economic data looks to be bottoming. We are watching carefully to see if this nascent cyclical recovery has legs in order to add more economic sensitivity to the portfolio and are closely monitoring the fallout from the Brexit vote. The U.S. economy remains an attractive place for investment as economic growth is stable and the employment picture remains robust. Despite these conflicting trends, our process remains consistent and we seek that companies with capital discipline, strong management and sustainable competitive advantages that we believe have the greatest prospects for outperformance over time.
The Fund’s investment strategy and focus can change over time. The mention of specific fund holdings does not constitute a recommendation by OppenheimerFunds, Inc. or its affiliates.
Shares of Oppenheimer funds are not deposits or obligations of any bank, are not guaranteed by any bank, are not insured by the FDIC or any other agency, and involve investment risks, including the possible loss of the principal amount invested.
3 OPPENHEIMER CAPITAL APPRECIATION FUND/VA
Fund Expenses
Fund Expenses. As a shareholder of the Fund, you incur two types of costs: (1) transaction costs and (2) ongoing costs, including management fees; distribution and service fees; and other Fund expenses. These examples are intended to help you understand your ongoing costs (in dollars) of investing in the Fund and to compare these costs with the ongoing costs of investing in other mutual funds.
The examples are based on an investment of $1,000.00 invested at the beginning of the period and held for the entire 6-month period ended June 30, 2016.
Actual Expenses. The first section of the table provides information about actual account values and actual expenses. You may use the information in this section for the class of shares you hold, together with the amount you invested, to estimate the expense that you paid over the period. Simply divide your account value by $1,000.00 (for example, an $8,600.00 account value divided by $1,000.00 = 8.60), then multiply the result by the number in the first section under the heading entitled “Expenses Paid During 6 Months Ended June 30, 2016” to estimate the expenses you paid on your account during this period.
Hypothetical Example for Comparison Purposes.
The second section of the table provides information about hypothetical account values and hypothetical expenses based on the Fund’s actual expense ratio for each class of shares, and an assumed rate of return of 5% per year for each class before expenses, which is not the actual return. The hypothetical account values and expenses may not be used to estimate the actual ending account balance or expenses you paid for the period. You may use this information to compare the ongoing costs of investing in the Fund and other funds. To do so, compare this 5% hypothetical example for the class of shares you hold with the 5% hypothetical examples that appear in the shareholder reports of the other funds.
Please note that the expenses shown in the table are meant to highlight your ongoing costs only and do not reflect any charges associated with the separate accounts that offer this Fund. Therefore, the “hypothetical” lines of the table are useful in comparing ongoing costs only, and will not help you determine the relative total costs of owning different funds. In addition, if these separate account charges were included your costs would have been higher.
| Actual | Beginning Value |
Ending Account Value |
Expenses Paid During June 30, 2016 |
|||||||||
| Non-Service shares |
$ | 1,000.00 | $ | 937.10 | $ | 3.86 | ||||||
| Service shares |
1,000.00 | 936.00 | 5.07 | |||||||||
| Hypothetical | ||||||||||||
| (5% return before expenses) | ||||||||||||
| Non-Service shares |
1,000.00 | 1,020.89 | 4.03 | |||||||||
| Service shares |
1,000.00 | 1,019.64 | 5.29 | |||||||||
Expenses are equal to the Fund’s annualized expense ratio for that class, multiplied by the average account value over the period, multiplied by 182/366 (to reflect the one-half year period). Those annualized expense ratios, excluding indirect expenses from affiliated funds, based on the 6-month period ended June 30, 2016 are as follows:
| Class | Expense Ratios | |||||
| Non-Service shares |
0.80% | |||||
| Service shares |
1.05 | |||||
The expense ratios reflect voluntary and/or contractual waivers and/or reimbursements of expenses by the Fund’s Manager. Some of these undertakings may be modified or terminated at any time, as indicated in the Fund’s prospectus. The “Financial Highlights” tables in the Fund’s financial statements, included in this report, also show the gross expense ratios, without such waivers or reimbursements and reduction to custodian expenses, if applicable.
4 OPPENHEIMER CAPITAL APPRECIATION FUND/VA
STATEMENT OF INVESTMENTS June 30, 2016 Unaudited
5 OPPENHEIMER CAPITAL APPRECIATION FUND/VA
STATEMENT OF INVESTMENTS Unaudited / Continued
Footnotes to Statement of Investments
1. Non-income producing security.
2. Rate shown is the 7-day yield at period end.
3. Is or was an affiliate, as defined in the Investment Company Act of 1940, as amended, at or during the reporting period, by virtue of the Fund owning at least 5% of the voting securities of the issuer or as a result of the Fund and the issuer having the same investment adviser. Transactions during the reporting period in which the issuer was an affiliate are as follows:
| Shares December 31, 2015 |
Gross Additions |
Gross Reductions |
Shares June 30, 2016 |
|||||||||||||
|
|
||||||||||||||||
| Oppenheimer Institutional Money Market Fund, Cl. E |
8,225,463 | 147,722,290 | 129,922,190 | 26,025,563 | ||||||||||||
| Value | Income | |||||||||||||||
|
|
||||||||||||||||
| Oppenheimer Institutional Money Market Fund, Cl. E |
$ | 26,025,563 | $ | 23,729 | ||||||||||||
See accompanying Notes to Financial Statements.
6 OPPENHEIMER CAPITAL APPRECIATION FUND/VA
STATEMENT OF ASSETS AND LIABILITIES June 30, 2016 Unaudited
|
|
||||
| Assets |
||||
| Investments, at value—see accompanying statement of investments: | ||||
| Unaffiliated companies (cost $635,599,561) | $ | 761,947,597 | ||
| Affiliated companies (cost $26,025,563) | 26,025,563 | |||
|
|
|
|||
| 787,973,160 | ||||
|
|
||||
| Cash | 2,000,000 | |||
|
|
||||
| Receivables and other assets: | ||||
| Investments sold | 19,888,910 | |||
| Shares of beneficial interest sold | 1,584,591 | |||
| Dividends | 533,757 | |||
| Other | 74,810 | |||
|
|
|
|||
| Total assets | 812,055,228 | |||
|
|
||||
| Liabilities |
||||
| Payables and other liabilities: | ||||
| Investments purchased | 28,710,354 | |||
| Shares of beneficial interest redeemed | 322,804 | |||
| Trustees’ compensation | 65,386 | |||
| Distribution and service plan fees | 56,300 | |||
| Shareholder communications | 38,535 | |||
| Other | 14,996 | |||
|
|
|
|||
| Total liabilities | 29,208,375 | |||
|
|
||||
| Net Assets |
$ | 782,846,853 | ||
|
|
|
|||
|
|
||||
| Composition of Net Assets |
||||
| Par value of shares of beneficial interest | $ | 16,963 | ||
|
|
||||
| Additional paid-in capital | 636,631,741 | |||
|
|
||||
| Accumulated net investment loss | (1,197,992) | |||
|
|
||||
| Accumulated net realized gain on investments | 21,061,632 | |||
|
|
||||
| Net unrealized appreciation on investments and translation of assets and liabilities denominated in foreign currencies | 126,334,509 | |||
|
|
|
|||
| Net Assets |
$ | 782,846,853 | ||
|
|
|
|||
|
|
||||
| Net Asset Value Per Share |
||||
| Non-Service Shares: | ||||
| Net asset value, redemption price per share and offering price per share (based on net assets of $510,819,912 and 11,023,005 shares of beneficial interest outstanding) | $46.34 | |||
|
|
||||
| Service Shares: | ||||
| Net asset value, redemption price per share and offering price per share (based on net assets of $272,026,941 and 5,940,485 shares of beneficial interest outstanding) | $45.79 | |||
See accompanying Notes to Financial Statements.
7 OPPENHEIMER CAPITAL APPRECIATION FUND/VA
STATEMENT OF OPERATIONS For the Six Months Ended June 30, 2016 Unaudited
|
|
||||
| Investment Income |
||||
| Dividends: | ||||
| Unaffiliated companies (net of foreign withholding taxes of $3,306) | $ | 3,660,281 | ||
| Affiliated companies | 23,729 | |||
|
|
|
|||
| Total investment income | 3,684,010 | |||
|
|
||||
| Expenses |
||||
| Management fees | 2,764,632 | |||
|
|
||||
| Distribution and service plan fees - Service shares | 342,910 | |||
|
|
||||
| Transfer and shareholder servicing agent fees: | ||||
| Non-Service shares | 254,594 | |||
| Service shares | 137,354 | |||
|
|
||||
| Shareholder communications: | ||||
| Non-Service shares | 17,423 | |||
| Service shares | 9,359 | |||
|
|
||||
| Trustees’ compensation | 19,127 | |||
|
|
||||
| Borrowing fees | 7,525 | |||
|
|
||||
| Custodian fees and expenses | 5,937 | |||
|
|
||||
| Other | 33,615 | |||
|
|
|
|||
| Total expenses | 3,592,476 | |||
| Less reduction to custodian expenses | (887) | |||
| Less waivers and reimbursements of expenses | (105,024) | |||
|
|
|
|||
| Net expenses | 3,486,565 | |||
|
|
||||
| Net Investment Income |
197,445 | |||
|
|
||||
| Realized and Unrealized Gain (Loss) |
||||
| Net realized gain on investments | 22,195,317 | |||
|
|
||||
| Net change in unrealized appreciation/depreciation on: | ||||
| Investments | (78,162,142) | |||
| Translation of assets and liabilities denominated in foreign currencies | 5,907 | |||
|
|
|
|||
| Net change in unrealized appreciation/depreciation | (78,156,235) | |||
|
|
||||
| Net Decrease in Net Assets Resulting from Operations |
$ | (55,763,473) | ||
|
|
|
|||
See accompanying Notes to Financial Statements.
8 OPPENHEIMER CAPITAL APPRECIATION FUND/VA
STATEMENTS OF CHANGES IN NET ASSETS
| Six Months Ended June 30, 2016 (Unaudited) |
Year Ended December 31, 2015 |
|||||||
|
|
||||||||
| Operations |
||||||||
| Net investment income | $ | 197,445 | $ | 2,548,712 | ||||
|
|
||||||||
| Net realized gain | 22,195,317 | 91,601,467 | ||||||
|
|
||||||||
| Net change in unrealized appreciation/depreciation | (78,156,235) | (62,184,920) | ||||||
|
|
|
|||||||
| Net increase (decrease) in net assets resulting from operations | (55,763,473) | 31,965,259 | ||||||
|
|
||||||||
| Dividends and/or Distributions to Shareholders |
||||||||
| Dividends from net investment income: | ||||||||
| Non-Service shares | (2,123,971) | (554,707) | ||||||
| Service shares | (318,481) | — | ||||||
|
|
|
|||||||
| (2,442,452) | (554,707) | |||||||
|
|
||||||||
| Distributions from net realized gain: | ||||||||
| Non-Service shares | (53,815,550) | (106,184,924) | ||||||
| Service shares | (29,108,236) | (59,885,291) | ||||||
|
|
|
|||||||
| (82,923,786) | (166,070,215) | |||||||
|
|
||||||||
| Beneficial Interest Transactions |
||||||||
| Net increase in net assets resulting from beneficial interest transactions: | ||||||||
| Non-Service shares | 38,019,358 | 32,611,326 | ||||||
| Service shares | 3,705,765 | 30,119,410 | ||||||
|
|
|
|||||||
| 41,725,123 | 62,730,736 | |||||||
|
|
||||||||
| Net Assets |
||||||||
| Total decrease | (99,404,588) | (71,928,927) | ||||||
|
|
||||||||
| Beginning of period | 882,251,441 | 954,180,368 | ||||||
|
|
|
|||||||
| End of period (including accumulated net investment income (loss) of $(1,197,992) and $1,047,015, respectively) | $ | 782,846,853 | $ | 882,251,441 | ||||
|
|
|
|||||||
See accompanying Notes to Financial Statements.
9 OPPENHEIMER CAPITAL APPRECIATION FUND/VA
FINANCIAL HIGHLIGHTS
| Non-Service Shares | Six Months June 30, 2016 |
Year Ended December 31, 2015 |
Year Ended December 31, 2014 |
Year Ended December 31, 2013 |
Year Ended December 31, 2012 |
Year Ended December 30, 20111 |
||||||||||||||||||
|
|
||||||||||||||||||||||||
| Per Share Operating Data |
||||||||||||||||||||||||
| Net asset value, beginning of period | $ | 55.49 | $ | 64.87 | $ | 57.88 | $ | 45.06 | $ | 39.75 | $ | 40.35 | ||||||||||||
|
|
||||||||||||||||||||||||
| Income (loss) from investment operations: | ||||||||||||||||||||||||
| Net investment income2 | 0.03 | 0.22 | 0.09 | 0.23 | 0.42 | 0.23 | ||||||||||||||||||
| Net realized and unrealized gain (loss) | (3.50) | 2.25 | 8.64 | 13.09 | 5.18 | (0.69) | ||||||||||||||||||
|
|
|
|||||||||||||||||||||||
| Total from investment operations | (3.47) | 2.47 | 8.73 | 13.32 | 5.60 | (0.46) | ||||||||||||||||||
|
|
||||||||||||||||||||||||
| Dividends and/or distributions to shareholders: | ||||||||||||||||||||||||
| Dividends from net investment income | (0.22) | (0.06) | (0.27) | (0.50) | (0.29) | (0.14) | ||||||||||||||||||
| Distributions from net realized gain | (5.46) | (11.79) | (1.47) | 0.00 | 0.00 | 0.00 | ||||||||||||||||||
|
|
|
|||||||||||||||||||||||
| Total dividends and/or distributions to shareholders | (5.68) | (11.85) | (1.74) | (0.50) | (0.29) | (0.14) | ||||||||||||||||||
|
|
||||||||||||||||||||||||
| Net asset value, end of period | $ | 46.34 | $ | 55.49 | $ | 64.87 | $ | 57.88 | $ | 45.06 | $ | 39.75 | ||||||||||||
|
|
|
|||||||||||||||||||||||
|
|
||||||||||||||||||||||||
| Total Return, at Net Asset Value3 |
(6.29)% | 3.54% | 15.41% | 29.74% | 14.12% | (1.15)% | ||||||||||||||||||
|
|
||||||||||||||||||||||||
| Ratios/Supplemental Data |
||||||||||||||||||||||||
| Net assets, end of period (in thousands) | $ | 510,820 | $ | 564,514 | $ | 616,862 | $ | 626,907 | $ | 573,684 | $ | 637,868 | ||||||||||||
|
|
||||||||||||||||||||||||
| Average net assets (in thousands) | $ | 510,942 | $ | 601,110 | $ | 614,272 | $ | 595,912 | $ | 600,121 | $ | 713,770 | ||||||||||||
|
|
||||||||||||||||||||||||
| Ratios to average net assets:4 | ||||||||||||||||||||||||
| Net investment income | 0.14% | 0.36% | 0.15% | 0.44% | 0.95% | 0.57% | ||||||||||||||||||
| Expenses excluding specific expenses listed below | 0.83% | 0.81% | 0.80% | 0.81% | 0.81% | 0.80% | ||||||||||||||||||
| Interest and fees from borrowings | 0.00%5 | 0.00%5 | 0.00% | 0.00% | 0.00% | 0.00% | ||||||||||||||||||
|
|
|
|||||||||||||||||||||||
| Total expenses6 | 0.83% | 0.81% | 0.80% | 0.81% | 0.81% | 0.80% | ||||||||||||||||||
| Expenses after payments, waivers and/or reimbursements and reduction to custodian expenses | 0.80% | 0.80% | 0.80% | 0.80% | 0.80% | 0.80% | ||||||||||||||||||
|
|
||||||||||||||||||||||||
| Portfolio turnover rate | 52% | 60% | 61% | 77% | 28% | 27% | ||||||||||||||||||
1. December 30, 2011 represents the last business day of the Fund’s reporting period. See Note 2 of the accompanying Notes.
2. Per share amounts calculated based on the average shares outstanding during the period.
3. Assumes an initial investment on the business day before the first day of the fiscal period, with all dividends and distributions reinvested in additional shares on the reinvestment date, and redemption at the net asset value calculated on the last business day of the fiscal period. Total returns are not annualized for periods less than one full year. Total return information does not reflect expenses that apply at the separate account level or to related insurance products. Inclusion of these charges would reduce the total return figures for all periods shown. Returns do not reflect the deduction of taxes that a shareholder would pay on fund distributions or the redemption of fund shares.
4. Annualized for periods less than one full year.
5. Less than 0.005%.
6. Total expenses including indirect expenses from affiliated fund fees and expenses were as follows:
See accompanying Notes to Financial Statements.
10 OPPENHEIMER CAPITAL APPRECIATION FUND/VA
| Service Shares | Six Months June 30, 2016 |
Year Ended December 31, 2015 |
Year Ended December 31, 2014 |
Year Ended December 31, 2013 |
Year Ended December 31, 2012 |
Year Ended December 30, 20111 |
||||||||||||||||||
|
|
||||||||||||||||||||||||
| Per Share Operating Data |
||||||||||||||||||||||||
| Net asset value, beginning of period | $ | 54.80 | $ | 64.30 | $ | 57.37 | $ | 44.66 | $ | 39.40 | $ | 39.99 | ||||||||||||
|
|
||||||||||||||||||||||||
| Income (loss) from investment operations: | ||||||||||||||||||||||||
| Net investment income (loss)2 | (0.03) | 0.07 | (0.06) | 0.10 | 0.31 | 0.13 | ||||||||||||||||||
| Net realized and unrealized gain (loss) | (3.46) | 2.22 | 8.57 | 12.98 | 5.12 | (0.68) | ||||||||||||||||||
|
|
|
|||||||||||||||||||||||
| Total from investment operations | (3.49) | 2.29 | 8.51 | 13.08 | 5.43 | (0.55) | ||||||||||||||||||
|
|
||||||||||||||||||||||||
| Dividends and/or distributions to shareholders: | ||||||||||||||||||||||||
| Dividends from net investment income | (0.06) | 0.00 | (0.11) | (0.37) | (0.17) | (0.04) | ||||||||||||||||||
| Distributions from net realized gain | (5.46) | (11.79) | (1.47) | 0.00 | 0.00 | 0.00 | ||||||||||||||||||
|
|
|
|||||||||||||||||||||||
| Total dividends and/or distributions to shareholders | (5.52) | (11.79) | (1.58) | (0.37) | (0.17) | (0.04) | ||||||||||||||||||
|
|
||||||||||||||||||||||||
| Net asset value, end of period | $ | 45.79 | $ | 54.80 | $ | 64.30 | $ | 57.37 | $ | 44.66 | $ | 39.40 | ||||||||||||
|
|
|
|||||||||||||||||||||||
|
|
||||||||||||||||||||||||
| Total Return, at Net Asset Value3 |
(6.40)% | 3.27% | 15.13% | 29.43% | 13.81% | (1.37)% | ||||||||||||||||||
|
|
||||||||||||||||||||||||
| Ratios/Supplemental Data |
||||||||||||||||||||||||
| Net assets, end of period (in thousands) | $ | 272,027 | $ | 317,737 | $ | 337,318 | $ | 364,214 | $ | 366,664 | $ | 375,330 | ||||||||||||
|
|
||||||||||||||||||||||||
| Average net assets (in thousands) | $ | 275,644 | $ | 332,468 | $ | 343,254 | $ | 367,615 | $ | 382,196 | $ | 407,413 | ||||||||||||
|
|
||||||||||||||||||||||||
| Ratios to average net assets:4 | ||||||||||||||||||||||||
| Net investment income (loss) | (0.11)% | 0.12% | (0.10)% | 0.20% | 0.71% | 0.32% | ||||||||||||||||||
| Expenses excluding specific expenses listed below | 1.08% | 1.06% | 1.05% | 1.06% | 1.06% | 1.05% | ||||||||||||||||||
| Interest and fees from borrowings | 0.00%5 | 0.00%5 | 0.00% | 0.00% | 0.00% | 0.00% | ||||||||||||||||||
|
|
|
|||||||||||||||||||||||
| Total expenses6 | 1.08% | 1.06% | 1.05% | 1.06% | 1.06% | 1.05% | ||||||||||||||||||
| Expenses after payments, waivers and/or reimbursements and reduction to custodian expenses | 1.05% | 1.05% | 1.05% | 1.05% | 1.05% | 1.05% | ||||||||||||||||||
|
|
||||||||||||||||||||||||
| Portfolio turnover rate | 52% | 60% | 61% | 77% | 28% | 27% | ||||||||||||||||||
1. December 30, 2011 represents the last business day of the Fund’s reporting period. See Note 2 of the accompanying Notes.
2. Per share amounts calculated based on the average shares outstanding during the period.
3. Assumes an initial investment on the business day before the first day of the fiscal period, with all dividends and distributions reinvested in additional shares on the reinvestment date, and redemption at the net asset value calculated on the last business day of the fiscal period. Total returns are not annualized for periods less than one full year. Total return information does not reflect expenses that apply at the separate account level or to related insurance products. Inclusion of these charges would reduce the total return figures for all periods shown. Returns do not reflect the deduction of taxes that a shareholder would pay on fund distributions or the redemption of fund shares.
4. Annualized for periods less than one full year.
5. Less than 0.005%.
6. Total expenses including indirect expenses from affiliated fund fees and expenses were as follows:
| Six Months Ended June 30, 2016 |
1.08 | % | ||||
| Year Ended December 31, 2015 |
1.06 | % | ||||
| Year Ended December 31, 2014 |
1.05 | % | ||||
| Year Ended December 31, 2013 |
1.06 | % | ||||
| Year Ended December 31, 2012 |
1.06 | % | ||||
| Year Ended December 30, 2011 |
1.05 | % | ||||
See accompanying Notes to Financial Statements.
11 OPPENHEIMER CAPITAL APPRECIATION FUND/VA
NOTES TO FINANCIAL STATEMENTS June 30, 2016 Unaudited
1. Organization
Oppenheimer Capital Appreciation Fund/VA (the “Fund”), a separate series of Oppenheimer Variable Account Funds, is a diversified open-end management investment company registered under the Investment Company Act of 1940 (“1940 Act”), as amended. The Fund’s investment objective is to seek capital appreciation. The Fund’s investment adviser is OFI Global Asset Management, Inc. (“OFI Global” or the “Manager”), a wholly-owned subsidiary of OppenheimerFunds, Inc. (“OFI” or the “Sub-Adviser”). The Manager has entered into a sub-advisory agreement with OFI. Shares of the Fund are sold only to separate accounts of life insurance companies.
The Fund offers two classes of shares. Both classes are sold at their offering price, which is the net asset value per share, to separate investment accounts of participating insurance companies as an underlying investment for variable life insurance policies, variable annuity contracts or other investment products. The class of shares designated as Service shares is subject to a distribution and service plan. Both classes of shares have identical rights and voting privileges with respect to the Fund in general and exclusive voting rights on matters that affect that class alone. Earnings, net assets and net asset value per share may differ due to each class having its own expenses, such as transfer and shareholder servicing agent fees and shareholder communications, directly attributable to that class.
The following is a summary of significant accounting policies followed in the Fund’s preparation of financial statements in accordance with accounting principles generally accepted in the United States (“U.S. GAAP”).
2. Significant Accounting Policies
Security Valuation. All investments in securities are recorded at their estimated fair value, as described in Note 3.
Reporting Period End Date. The last day of the Fund’s reporting period is the last day the New York Stock Exchange was open for trading during the period. The Fund’s financial statements have been presented through that date to maintain consistency with the Fund’s net asset value calculations used for shareholder transactions.
Foreign Currency Translation. The Fund’s accounting records are maintained in U.S. dollars. The values of securities denominated in foreign currencies and amounts related to the purchase and sale of foreign securities and foreign investment income are translated into U.S. dollars as of the close of the New York Stock Exchange (the “Exchange”), normally 4:00 P.M. Eastern time, on each day the Exchange is open for trading. Foreign exchange rates may be valued primarily using a reliable bank, dealer or service authorized by the Board of Trustees.
Reported net realized gains and losses from foreign currency transactions arise from sales of portfolio securities, sales and maturities of short-term securities, sales of foreign currencies, exchange rate fluctuations between the trade and settlement dates on securities transactions, and the difference between the amounts of dividends, interest, and foreign withholding taxes recorded on the Fund’s books and the U.S. dollar equivalent of the amounts actually received or paid. Net unrealized appreciation and depreciation on the translation of assets and liabilities denominated in foreign currencies arise from changes in the values of assets and liabilities, including investments in securities at fiscal period end, resulting from changes in exchange rates.
The effect of changes in foreign currency exchange rates on investments is separately identified from the fluctuations arising from changes in market values of securities held and reported with all other foreign currency gains and losses in the Fund’s Statement of Operations.
Allocation of Income, Expenses, Gains and Losses. Income, expenses (other than those attributable to a specific class), gains and losses are allocated on a daily basis to each class of shares based upon the relative proportion of net assets represented by such class. Operating expenses directly attributable to a specific class are charged against the operations of that class.
Dividends and Distributions to Shareholders. Dividends and distributions to shareholders, which are determined in accordance with income tax regulations and may differ from U.S. GAAP, are recorded on the ex-dividend date. Income and capital gain distributions, if any, are declared and paid annually or at other times as deemed necessary by the Manager.
The tax character of distributions is determined as of the Fund’s fiscal year end. Therefore, a portion of the Fund’s distributions made to shareholders prior to the Fund’s fiscal year end may ultimately be categorized as a tax return of capital.
Investment Income. Dividend income is recorded on the ex-dividend date or upon ex-dividend notification in the case of certain foreign dividends where the ex-dividend date may have passed. Non-cash dividends included in dividend income, if any, are recorded at the fair market value of the securities received. Interest income is recognized on an accrual basis. Discount and premium, which are included in interest income on the Statement of Operations, are amortized or accreted daily.
Return of Capital Estimates. Distributions received from the Fund’s investments in Real Estate Investments Trusts (REITs), generally are comprised of income and return of capital. The Fund records investment income and return of capital based on estimates. Such estimates are based on historical information available from each REIT and other industry sources. These estimates may subsequently be revised based on information received from REITs after their tax reporting periods are concluded.
Custodian Fees. “Custodian fees and expenses” in the Statement of Operations may include interest expense incurred by the Fund on any cash overdrafts of its custodian account during the period. Such cash overdrafts may result from the effects of failed trades in portfolio securities and from cash outflows resulting from unanticipated shareholder redemption activity. The Fund pays interest to its custodian on such cash overdrafts, to the extent they are not offset by positive cash balances maintained by the Fund, at a rate equal to the Federal Funds Rate plus 0.50%. The “Reduction to custodian
12 OPPENHEIMER CAPITAL APPRECIATION FUND/VA
2. Significant Accounting Policies (Continued)
expenses” line item, if applicable, represents earnings on cash balances maintained by the Fund during the period. Such interest expense and other custodian fees may be paid with these earnings.
Security Transactions. Security transactions are recorded on the trade date. Realized gains and losses on securities sold are determined on the basis of identified cost.
Indemnifications. The Fund’s organizational documents provide current and former Trustees and officers with a limited indemnification against liabilities arising in connection with the performance of their duties to the Fund. In the normal course of business, the Fund may also enter into contracts that provide general indemnifications. The Fund’s maximum exposure under these arrangements is unknown as this would be dependent on future claims that may be made against the Fund. The risk of material loss from such claims is considered remote.
Federal Taxes. The Fund intends to comply with provisions of the Internal Revenue Code applicable to regulated investment companies and to distribute substantially all of its investment company taxable income to shareholders. Therefore, no federal income or excise tax provision is required. The Fund files income tax returns in U.S. federal and applicable state jurisdictions. The statute of limitations on the Fund’s tax return filings generally remains open for the three preceding fiscal reporting period ends. The Fund has analyzed its tax positions for the fiscal year ended December 31, 2015, including open tax years, and does not believe there are any uncertain tax positions requiring recognition in the Fund’s financial statements.
During the fiscal year ended December 31, 2015, the Fund did not utilize any capital loss carryforward to offset capital gains realized in that fiscal year. Capital loss carryforwards with no expiration, if any, must be utilized prior to those with expiration dates. Capital losses with no expiration will be carried forward to future years if not offset by gains.
At period end, it is estimated that the Fund will not have any capital loss carryforwards. The estimated capital loss carryforward represents the carryforward as of the end of the last fiscal year, increased or decreased by capital losses or gains realized in the first six months of the current fiscal year. During the reporting period, it is estimated that the Fund will not utilize any capital loss carryforward to offset realized capital gains.
Net investment income (loss) and net realized gain (loss) may differ for financial statement and tax purposes. The character of dividends and distributions made during the fiscal year from net investment income or net realized gains are determined in accordance with federal income tax requirements, which may differ from the character of net investment income or net realized gains presented in those financial statements in accordance with U.S. GAAP. Also, due to timing of dividends and distributions, the fiscal year in which amounts are distributed may differ from the fiscal year in which the income or net realized gain was recorded by the Fund.
The aggregate cost of securities and other investments and the composition of unrealized appreciation and depreciation of securities and other investments for federal income tax purposes at period end are noted in the following table. The primary difference between book and tax appreciation or depreciation of securities and other investments, if applicable, is attributable to the tax deferral of losses or tax realization of financial statement unrealized gain or loss.
| Federal tax cost of securities |
$ | 662,517,800 | ||
|
|
|
|||
| Gross unrealized appreciation |
$ | 129,060,186 | ||
| Gross unrealized depreciation |
(3,618,353) | |||
|
|
|
|||
| Net unrealized appreciation |
$ | 125,441,833 | ||
|
|
|
Use of Estimates. The preparation of financial statements in conformity with U.S. GAAP requires management to make estimates and assumptions that affect the reported amounts of assets and liabilities and disclosure of contingent assets and liabilities at the date of the financial statements and the reported amounts of increases and decreases in net assets from operations during the reporting period. Actual results could differ from those estimates.
3. Securities Valuation
The Fund calculates the net asset value of its shares as of 4:00 P.M. Eastern time, on each day the New York Stock Exchange (the “Exchange”) is open for trading, except in the case of a scheduled early closing of the Exchange, in which case the Fund will calculate net asset value of the shares as of the scheduled early closing time of the Exchange.
The Fund’s Board has adopted procedures for the valuation of the Fund’s securities and has delegated the day-to-day responsibility for valuation determinations under those procedures to the Manager. The Manager has established a Valuation Committee which is responsible for determining a “fair valuation” for any security for which market quotations are not “readily available.” The Valuation Committee’s fair valuation determinations are subject to review, approval and ratification by the Fund’s Board at its next regularly scheduled meeting covering the calendar quarter in which the fair valuation was determined.
Valuation Methods and Inputs
Securities are valued using unadjusted quoted market prices, when available, as supplied primarily by third party pricing services or dealers.
The following methodologies are used to determine the market value or the fair value of the types of securities described below:
Securities traded on a registered U.S. securities exchange (including exchange-traded derivatives other than futures and futures options) are valued based on the last sale price of the security reported on the principal exchange on which it is traded, prior to the time when the Fund’s assets are valued. In the absence of a sale, the security is valued at the mean between the bid and asked price on the principal exchange or, if not available from the
13 OPPENHEIMER CAPITAL APPRECIATION FUND/VA
NOTES TO FINANCIAL STATEMENTS Unaudited / Continued
3. Securities Valuation (Continued)
principal exchange, obtained from two dealers. If bid and asked prices are not available from either the exchange or two dealers, the security is valued by using one of the following methodologies (listed in order of priority): (1) a bid from the principal exchange, (2) the mean between the bid and asked price as provided by a single dealer, or (3) a bid from a single dealer. A security of a foreign issuer traded on a foreign exchange, but not listed on a registered U.S. securities exchange, is valued based on the last sale price on the principal exchange on which the security is traded, as identified by the third party pricing service used by the Manager, prior to the time when the Fund’s assets are valued. If the last sale price is unavailable, the security is valued at the most recent official closing price on the principal exchange on which it is traded. If the last sales price or official closing price for a foreign security is not available, the security is valued at the mean between the bid and asked price per the exchange or, if not available from the exchange, obtained from two dealers. If bid and asked prices are not available from either the exchange or two dealers, the security is valued by using one of the following methodologies (listed in order of priority): (1) a bid from the exchange, (2) the mean between the bid and asked price as provided by a single dealer, or (3) a bid from a single dealer.
Shares of a registered investment company that are not traded on an exchange are valued at that investment company’s net asset value per share.
Corporate and government debt securities (of U.S. or foreign issuers) and municipal debt securities, event-linked bonds, loans, mortgage-backed securities, collateralized mortgage obligations, and asset-backed securities are valued at the mean between the “bid” and “asked” prices utilizing evaluated prices obtained from third party pricing services or broker-dealers who may use matrix pricing methods to determine the evaluated prices.
Short-term money market type debt securities with a remaining maturity of sixty days or less are valued at cost adjusted by the amortization of discount or premium to maturity (amortized cost), which approximates market value. Short-term debt securities with a remaining maturity in excess of sixty days are valued at the mean between the “bid” and “asked” prices utilizing evaluated prices obtained from third party pricing services or broker-dealers.
A description of the standard inputs that may generally be considered by the third party pricing vendors in determining their evaluated prices is provided below.
| Security Type | Standard inputs generally considered by third-party pricing vendors | |
| Corporate debt, government debt, municipal, mortgage-backed and asset-backed securities | Reported trade data, broker-dealer price quotations, benchmark yields, issuer spreads on comparable securities, the credit quality, yield, maturity, and other appropriate factors. | |
| Loans | Information obtained from market participants regarding reported trade data and broker-dealer price quotations. | |
| Event-linked bonds | Information obtained from market participants regarding reported trade data and broker-dealer price quotations. |
If a market value or price cannot be determined for a security using the methodologies described above, or if, in the “good faith” opinion of the Manager, the market value or price obtained does not constitute a “readily available market quotation,” or a significant event has occurred that would materially affect the value of the security, the security is fair valued either (i) by a standardized fair valuation methodology applicable to the security type or the significant event as previously approved by the Valuation Committee and the Fund’s Board or (ii) as determined in good faith by the Manager’s Valuation Committee. The Valuation Committee considers all relevant facts that are reasonably available, through either public information or information available to the Manager, when determining the fair value of a security. Fair value determinations by the Manager are subject to review, approval and ratification by the Fund’s Board at its next regularly scheduled meeting covering the calendar quarter in which the fair valuation was determined. Those fair valuation standardized methodologies include, but are not limited to, valuing securities at the last sale price or initially at cost and subsequently adjusting the value based on: changes in company specific fundamentals, changes in an appropriate securities index, or changes in the value of similar securities which may be further adjusted for any discounts related to security-specific resale restrictions. When possible, such methodologies use observable market inputs such as unadjusted quoted prices of similar securities, observable interest rates, currency rates and yield curves. The methodologies used for valuing securities are not necessarily an indication of the risks associated with investing in those securities nor can it be assured that the Fund can obtain the fair value assigned to a security if it were to sell the security.
To assess the continuing appropriateness of security valuations, the Manager, or its third party service provider who is subject to oversight by the Manager, regularly compares prior day prices, prices on comparable securities, and sale prices to the current day prices and challenges those prices exceeding certain tolerance levels with the third party pricing service or broker source. For those securities valued by fair valuations, whether through a standardized fair valuation methodology or a fair valuation determination, the Valuation Committee reviews and affirms the reasonableness of the valuations based on such methodologies and fair valuation determinations on a regular basis after considering all relevant information that is reasonably available.
Classifications
Each investment asset or liability of the Fund is assigned a level at measurement date based on the significance and source of the inputs to its valuation. Various data inputs are used in determining the value of each of the Fund’s investments as of the reporting period end. These data inputs are categorized in the following hierarchy under applicable financial accounting standards:
1) Level 1-unadjusted quoted prices in active markets for identical assets or liabilities (including securities actively traded on a securities exchange)
2) Level 2-inputs other than unadjusted quoted prices that are observable for the asset or liability (such as unadjusted quoted prices for similar assets and market corroborated inputs such as interest rates, prepayment speeds, credit risks, etc.)
14 OPPENHEIMER CAPITAL APPRECIATION FUND/VA
3. Securities Valuation (Continued)
3) Level 3-significant unobservable inputs (including the Manager’s own judgments about assumptions that market participants would use in pricing the asset or liability).
The inputs used for valuing securities are not necessarily an indication of the risks associated with investing in those securities.
The Fund classifies each of its investments in investment companies which are publicly offered as Level 1. Investment companies that are not publicly offered are measured using net asset value as a practical expedient, and are not classified in the fair value hierarchy.
The table below categorizes amounts that are included in the Fund’s Statement of Assets and Liabilities at period end based on valuation input level:
| Level 1— Unadjusted Quoted Prices |
Level 2— Other Significant Observable Inputs |
Level 3— Significant Unobservable Inputs |
Value | |||||||||||||
|
|
||||||||||||||||
| Assets Table |
||||||||||||||||
| Investments, at Value: |
||||||||||||||||
| Common Stocks |
||||||||||||||||
| Consumer Discretionary |
$ | 136,760,409 | $ | — | $ | — | $ | 136,760,409 | ||||||||
| Consumer Staples |
46,721,071 | — | — | 46,721,071 | ||||||||||||
| Energy |
24,722,658 | — | — | 24,722,658 | ||||||||||||
| Financials |
26,368,322 | — | — | 26,368,322 | ||||||||||||
| Health Care |
119,099,891 | — | — | 119,099,891 | ||||||||||||
| Industrials |
76,709,910 | — | — | 76,709,910 | ||||||||||||
| Information Technology |
303,163,519 | — | — | 303,163,519 | ||||||||||||
| Materials |
28,401,817 | — | — | 28,401,817 | ||||||||||||
| Investment Company |
26,025,563 | — | — | 26,025,563 | ||||||||||||
|
|
|
|||||||||||||||
| Total Assets |
$ | 787,973,160 | $ | — | $ | — | $ | 787,973,160 | ||||||||
|
|
|
|||||||||||||||
Forward currency exchange contracts and futures contracts, if any, are reported at their unrealized appreciation/depreciation at measurement date, which represents the change in the contract’s value from trade date. All additional assets and liabilities included in the above table are reported at their market value at measurement date.
4. Investments and Risks
Investments in Affiliated Funds. The Fund is permitted to invest in other mutual funds advised by the Manager (“Affiliated Funds”). Affiliated Funds are open-end management investment companies registered under the 1940 Act, as amended. The Manager is the investment adviser of, and the Sub-Adviser provides investment and related advisory services to, the Affiliated Funds. When applicable, the Fund’s investments in Affiliated Funds are included in the Statement of Investments. Shares of Affiliated Funds are valued at their net asset value per share. As a shareholder, the Fund is subject to its proportional share of the Affiliated Funds’ expenses, including their management fee. The Manager will waive fees and/or reimburse Fund expenses in an amount equal to the indirect management fees incurred through the Fund’s investment in the Affiliated Funds.
Each of the Affiliated Funds in which the Fund invests has its own investment risks, and those risks can affect the value of the Fund’s investments and therefore the value of the Fund’s shares. To the extent that the Fund invests more of its assets in one Affiliated Fund than in another, the Fund will have greater exposure to the risks of that Affiliated Fund.
Investment in Oppenheimer Institutional Money Market Fund. The Fund is permitted to invest daily available cash balances in a money market Affiliated Fund. The Fund may invest the available cash in Class E shares of Oppenheimer Institutional Money Market Fund (“IMMF”) to seek current income while preserving liquidity or for defensive purposes. IMMF is regulated as a money market fund under the Investment Company Act of 1940, as amended.
Equity Security Risk. Stocks and other equity securities fluctuate in price. The value of the Fund’s portfolio may be affected by changes in the equity markets generally. Equity markets may experience significant short-term volatility and may fall sharply at times. Different markets may behave differently from each other and U.S. equity markets may move in the opposite direction from one or more foreign stock markets. Adverse events in any part of the equity or fixed-income markets may have unexpected negative effects on other market segments.
The prices of individual equity securities generally do not all move in the same direction at the same time and a variety of factors can affect the price of a particular company’s securities. These factors may include, but are not limited to, poor earnings reports, a loss of customers, litigation against the company, general unfavorable performance of the company’s sector or industry, or changes in government regulations affecting the company or its industry.
5. Market Risk Factors
The Fund’s investments in securities and/or financial derivatives may expose the Fund to various market risk factors:
Commodity Risk. Commodity risk relates to the change in value of commodities or commodity indexes as they relate to increases or decreases in the commodities market. Commodities are physical assets that have tangible properties. Examples of these types of assets are crude oil, heating oil, metals, livestock, and agricultural products.
15 OPPENHEIMER CAPITAL APPRECIATION FUND/VA
NOTES TO FINANCIAL STATEMENTS Unaudited / Continued
5. Market Risk Factors (Continued)
Credit Risk. Credit risk relates to the ability of the issuer of debt to meet interest and principal payments, or both, as they come due. In general, lower-grade, higher-yield debt securities are subject to credit risk to a greater extent than lower-yield, higher-quality securities.
Equity Risk. Equity risk relates to the change in value of equity securities as they relate to increases or decreases in the general market.
Foreign Exchange Rate Risk. Foreign exchange rate risk relates to the change in the U.S. dollar value of a security held that is denominated in a foreign currency. The U.S. dollar value of a foreign currency denominated security will decrease as the dollar appreciates against the currency, while the U.S. dollar value will increase as the dollar depreciates against the currency.
Interest Rate Risk. Interest rate risk refers to the fluctuations in value of fixed-income securities resulting from the inverse relationship between price and yield. For example, an increase in general interest rates will tend to reduce the market value of already issued fixed-income investments, and a decline in general interest rates will tend to increase their value. In addition, debt securities with longer maturities, which tend to have higher yields, are subject to potentially greater fluctuations in value from changes in interest rates than obligations with shorter maturities.
Volatility Risk. Volatility risk refers to the magnitude of the movement, but not the direction of the movement, in a financial instrument’s price over a defined time period. Large increases or decreases in a financial instrument’s price over a relative time period typically indicate greater volatility risk, while small increases or decreases in its price typically indicate lower volatility risk.
6. Shares of Beneficial Interest
The Fund has authorized an unlimited number of $0.001 par value shares of beneficial interest of each class. Transactions in shares of beneficial interest were as follows:
| Six Months Ended June 30, 2016 | Year Ended December 31, 2015 | |||||||||||||||
| Shares | Amount | Shares | Amount | |||||||||||||
|
|
||||||||||||||||
| Non-Service Shares |
||||||||||||||||
| Sold |
346,352 | $ | 17,565,567 | 257,353 | $ | 15,042,314 | ||||||||||
| Dividends and/or distributions reinvested | 1,203,259 | 55,939,521 | 1,895,571 | 106,739,631 | ||||||||||||
| Redeemed |
(700,272) | (35,485,730) | (1,488,512) | (89,170,619) | ||||||||||||
|
|
|
|||||||||||||||
| Net increase |
849,339 | $ | 38,019,358 | 664,412 | $ | 32,611,326 | ||||||||||
|
|
|
|||||||||||||||
|
|
||||||||||||||||
| Service Shares |
||||||||||||||||
| Sold |
297,774 | $ | 14,616,207 | 931,104 | $ | 54,653,065 | ||||||||||
| Dividends and/or distributions reinvested | 640,546 | 29,426,717 | 1,075,333 | 59,885,291 | ||||||||||||
| Redeemed |
(795,528) | (40,337,159) | (1,455,061) | (84,418,946) | ||||||||||||
|
|
|
|||||||||||||||
| Net increase |
142,792 | $ | 3,705,765 | 551,376 | $ | 30,119,410 | ||||||||||
|
|
|
|||||||||||||||
7. Purchases and Sales of Securities
The aggregate cost of purchases and proceeds from sales of securities, other than short-term obligations and investments in IMMF, for the reporting period were as follows:
| Purchases | Sales | |||||||
|
|
||||||||
| Investment securities |
$ | 412,998,970 | $ | 474,872,687 | ||||
8. Fees and Other Transactions with Affiliates
Management Fees. Under the investment advisory agreement, the Fund pays the Manager a management fee based on the daily net assets of the Fund at an annual rate as shown in the following table:
| Fee Schedule | ||||
| Up to $200 million |
0.75% | |||
| Next $200 million |
0.72 | |||
| Next $200 million |
0.69 | |||
| Next $200 million |
0.66 | |||
| Next $200 million |
0.60 | |||
| Over $1 billion |
0.58 | |||
The Fund’s effective management fee for the reporting period was 0.71% of average annual net assets before any applicable waivers.
Sub-Adviser Fees. The Manager has retained the Sub-Adviser to provide the day-to-day portfolio management of the Fund. Under the Sub-Advisory Agreement, the Manager pays the Sub-Adviser an annual fee in monthly installments, equal to a percentage of the investment management fee collected by the Manager from the Fund, which shall be calculated after any investment management fee waivers. The fee paid to the Sub-Adviser is paid by the Manager, not by the Fund.
Transfer Agent Fees. OFI Global (the “Transfer Agent”) serves as the transfer and shareholder servicing agent for the Fund. The Fund pays the Transfer Agent a fee based on annual net assets. Fees incurred and average net assets for each class with respect to these services are detailed in the Statement of Operations and Financial Highlights, respectively.
16 OPPENHEIMER CAPITAL APPRECIATION FUND/VA
8. Fees and Other Transactions with Affiliates (Continued)
Sub-Transfer Agent Fees. The Transfer Agent has retained Shareholder Services, Inc., a wholly-owned subsidiary of OFI (the “Sub-Transfer Agent”), to provide the day-to-day transfer agent and shareholder servicing of the Fund. Under the Sub-Transfer Agency Agreement, the Transfer Agent pays the Sub-Transfer Agent an annual fee in monthly installments, equal to a percentage of the transfer agent fee collected by the Transfer Agent from the Fund, which shall be calculated after any applicable fee waivers. The fee paid to the Sub-Transfer Agent is paid by the Transfer Agent, not by the Fund.
Trustees’ Compensation. The Fund’s Board of Trustees (“Board”) has adopted a compensation deferral plan for Independent Trustees that enables Trustees to elect to defer receipt of all or a portion of the annual compensation they are entitled to receive from the Fund. For purposes of determining the amount owed to the Trustees under the plan, deferred amounts are treated as though equal dollar amounts had been invested in shares of the Fund or in other Oppenheimer funds selected by the Trustees. The Fund purchases shares of the funds selected for deferral by the Trustees in amounts equal to his or her deemed investment, resulting in a Fund asset equal to the deferred compensation liability. Such assets are included as a component of “Other” within the asset section of the Statement of Assets and Liabilities. Deferral of Trustees’ fees under the plan will not affect the net assets of the Fund and will not materially affect the Fund’s assets, liabilities or net investment income per share. Amounts will be deferred until distributed in accordance with the compensation deferral plan.
Distribution and Service Plan for Service Shares. The Fund has adopted a Distribution and Service Plan (the “Plan”) pursuant to Rule 12b-1 under the 1940 Act for Service shares to pay OppenheimerFunds Distributor, Inc. (the “Distributor”), for distribution related services, personal service and account maintenance for the Fund’s Service shares. Under the Plan, payments are made periodically at an annual rate of 0.25% of the daily net assets of Service shares of the Fund. The Distributor currently uses all of those fees to compensate sponsors of the insurance product that offers Fund shares, for providing personal service and maintenance of accounts of their variable contract owners that hold Service shares. These fees are paid out of the Fund’s assets on an on-going basis and increase operating expenses of the Service shares, which results in lower performance compared to the Fund’s shares that are not subject to a service fee. Fees incurred by the Fund under the Plan are detailed in the Statement of Operations.
Waivers and Reimbursements of Expenses. The Manager has voluntarily agreed to limit the Fund’s expenses after payments, waivers and/or reimbursements and reduction to custodian expenses, excluding expenses incurred directly or indirectly by the Fund as a result of investments in other investment companies, wholly-owned subsidiaries and pooled investment vehicles; so that those expenses, as percentages of daily net assets, will not exceed the annual rate of 0.80% for Non-Service shares and 1.05% for Service shares. The expense limitations do not include interest and fees from borrowing, and other expenses not incurred in the ordinary course of the Fund’s business. During the reporting period, the Manager waived fees and/or reimbursed the Fund $65,456 and $34,365 for Non-Service and Service shares, respectively.
The Manager will waive fees and/or reimburse Fund expenses in an amount equal to the indirect management fees incurred through the Fund’s investment in IMMF. During the reporting period, the Manager waived fees and/or reimbursed the Fund $5,203 for IMMF management fees.
Waivers and/or reimbursements may be modified or terminated as set forth according to the terms in the prospectus.
9. Borrowings and Other Financing
Joint Credit Facility. A number of mutual funds managed by the Manager participate in a $1.28 billion revolving credit facility (the “Facility”) intended to provide short-term financing, if necessary, subject to certain restrictions in connection with atypical redemption activity. Expenses and fees related to the Facility are paid by the participating funds and are disclosed separately or as other expenses on the Statement of Operations. The Fund did not utilize the Facility during the reporting period.
10. Pending Litigation
In 2009, several putative class action lawsuits were filed and later consolidated before the U.S. District Court for the District of Colorado against OppenheimerFunds, Inc. (“OFI”), OppenheimerFunds Distributor, Inc. (“OFDI”), and Oppenheimer Rochester California Municipal Fund, a fund advised by OFI Global Asset Management, Inc. and distributed by the Distributor (the “California Fund”), in connection with the California Fund’s investment performance. The plaintiffs asserted claims against OFI, OFDI and certain present and former trustees and officers of the California Fund under the federal securities laws, alleging, among other things, that the disclosure documents of the California Fund contained misrepresentations and omissions and the investment policies of the California Fund were not followed. Plaintiffs in the suit filed an amended complaint and defendants filed a motion to dismiss. In 2011, the court issued an order which granted in part and denied in part the defendants’ motion to dismiss. In 2012, plaintiffs filed a motion, which defendants opposed, to certify a class and appoint class representatives and class counsel. In March 2015, the court granted plaintiffs’ motion for class certification. In May 2015, the U.S. Court of Appeals for the Tenth Circuit vacated the class certification order and remanded the matter to the district court for further proceedings. In October 2015, the district court reaffirmed its order and determined that the suit will proceed as a class action. In December 2015, the Tenth Circuit denied defendants’ petition to appeal the district court’s reaffirmed class certification order.
OFI and OFDI believe the suit is without merit; that it is premature to render any opinion as to the likelihood of an outcome unfavorable to them in the suit; and that no estimate can yet be made as to the amount or range of any potential loss. Furthermore, OFI believes that the suit should not impair the ability of OFI or OFDI to perform their respective duties to the Fund and that the outcome of the suit should not have any material effect on the operations of any of the Oppenheimer funds.
17 OPPENHEIMER CAPITAL APPRECIATION FUND/VA
PORTFOLIO PROXY VOTING POLICIES AND GUIDELINES; UPDATES TO STATEMENTS OF INVESTMENTS Unaudited
The Fund has adopted Portfolio Proxy Voting Policies and Guidelines under which the Fund votes proxies relating to securities (“portfolio proxies”) held by the Fund. A description of the Fund’s Portfolio Proxy Voting Policies and Guidelines is available (i) without charge, upon request, by calling the Fund toll-free at 1.800.525.7048, (ii) on the Fund’s website at www.oppenheimerfunds.com, and (iii) on the SEC’s website at www.sec.gov. In addition, the Fund is required to file Form N-PX, with its complete proxy voting record for the 12 months ended June 30th, no later than August 31st of each year. The Fund’s voting record is available (i) without charge, upon request, by calling the Fund toll-free at 1.800.525.7048, and (ii) in the Form N-PX filing on the SEC’s website at www.sec.gov.
The Fund files its complete schedule of portfolio holdings with the SEC for the first quarter and the third quarter of each fiscal year on Form N-Q. The Fund’s Form N-Q filings are available on the SEC’s website at www.sec.gov. Those forms may be reviewed and copied at the SEC’s Public Reference Room in Washington, D.C. Information on the operation of the Public Reference Room may be obtained by calling 1-800-SEC-0330.
18 OPPENHEIMER CAPITAL APPRECIATION FUND/VA
DISTRIBUTION SOURCES Unaudited
For any distribution that took place over the Fund’s reporting period, the table below details on a per-share basis the percentage of the Fund’s total distribution payment amount that was derived from the following sources: net income, net profit from the sale of securities, and other capital sources. This information is based upon income and capital gains using generally accepted accounting principles as of the date of each distribution. Because the Fund is actively managed, the relative amount of the Fund’s total distributions derived from various sources over the calendar year may change. Please note that this information should not be used for tax reporting purposes as the tax character of distributable income may differ from the amounts used for this notification. You will receive IRS tax forms in the first quarter of each calendar year detailing the actual amount of the taxable and non-taxable portion of distributions paid to you during the tax year.
For the most current information, please go to oppenheimerfunds.com. Select your Fund, then the ‘Detailed’ tab; where ‘Dividends’ are shown, the Fund’s latest pay date will be followed by the sources of any distribution, updated daily.
|
Fund Name |
Pay Date |
Net Income |
Net Profit |
Other
|
||||||||||||
| Oppenheimer Capital Appreciation Fund/VA |
6/21/16 | 2.5% | 79.6% | 17.9% | ||||||||||||
19 OPPENHEIMER CAPITAL APPRECIATION FUND/VA
OPPENHEIMER CAPITAL APPRECIATION FUND/VA
A Series of Oppenheimer Variable Account Funds
| Trustees and Officers | Sam Freedman, Chairman of the Board of Trustees and Trustee | |
| Jon S. Fossel, Trustee | ||
| Richard F. Grabish, Trustee | ||
| Beverly L. Hamilton, Trustee | ||
| Victoria J. Herget, Trustee | ||
| Robert J. Malone, Trustee | ||
| F. William Marshall, Jr., Trustee | ||
| Karen L. Stuckey, Trustee | ||
| James D. Vaughn, Trustee | ||
| Arthur P. Steinmetz, Trustee, President and Principal Executive Officer | ||
| Michael Kotlarz, Vice President | ||
| Cynthia Lo Bessette, Secretary and Chief Legal Officer | ||
| Jennifer Sexton, Vice President and Chief Business Officer | ||
| Mary Ann Picciotto, Chief Compliance Officer and Chief Anti-Money Laundering Officer | ||
| Brian S. Petersen, Treasurer and Principal Financial & Accounting Officer | ||
| Manager | OFI Global Asset Management, Inc. | |
| Sub-Adviser | OppenheimerFunds, Inc. | |
| Distributor | OppenheimerFunds Distributor, Inc. | |
| Transfer and Shareholder Servicing Agent |
OFI Global Asset Management, Inc. | |
| Sub-Transfer Agent | Shareholder Services, Inc. | |
| DBA OppenheimerFunds Services | ||
| Independent Registered Public Accounting Firm |
KPMG LLP | |
| Legal Counsel | Ropes & Gray LLP | |
| Before investing in any of the Oppenheimer funds, investors should carefully consider a fund’s investment objectives, risks, charges and expenses. Fund prospectuses and summary prospectuses contain this and other information about the funds, and may be obtained by asking your financial advisor, or calling us at 1.800.988.8287. Read prospectuses and summary prospectuses carefully before investing. | ||
| The financial statements included herein have been taken from the records of the Fund without examination of those records by the independent registered public accounting firm. | ||
| © 2016 OppenheimerFunds, Inc. All rights reserved. Oppenheimer funds are distributed by OppenheimerFunds Distributor, Inc. | ||

|
|
||||
| June 30, 2016 |
||||
|
Oppenheimer |
||||
| Core Bond Fund/VA |
Semiannual Report | |||
| A Series of Oppenheimer Variable Account Funds
|
||||
| SEMIANNUAL REPORT |
||||
| Listing of Top Holdings |
||||
| Fund Performance Discussion |
||||
| Financial Statements |
||||
PORTFOLIO MANAGERS: Krishna Memani and Peter A. Strzalkowski, CFA
AVERAGE ANNUAL TOTAL RETURNS FOR THE PERIODS ENDED 6/30/16
| Inception Date |
6-Months | 1-Year | 5-Year | 10-Year | ||||||||||||||||
| Non-Service Shares |
4/3/85 | 5.02% | 5.57% | 5.49% | 1.10% | |||||||||||||||
| Service Shares |
5/1/02 | 4.82 | 5.10 | 5.20 | 0.83 | |||||||||||||||
| Barclays Credit Index |
7.54 | 7.55 | 5.20 | 6.11 | ||||||||||||||||
| Barclays U.S. Aggregate Bond Index |
5.31 | 6.00 | 3.76 | 5.13 | ||||||||||||||||
| Citigroup Broad Investment Grade Bond Index |
5.36 | 5.98 | 3.77 | 5.23 | ||||||||||||||||
Performance data quoted represents past performance, which does not guarantee future results. The investment return and principal value of an investment in the Fund will fluctuate so that an investor’s shares, when redeemed, may be worth more or less than their original cost. Current performance may be lower or higher than the performance quoted. For performance data current to the most recent month end, call us at 1.800.988.8287. The Fund’s total returns should not be expected to be the same as the returns of other funds, whether or not both funds have the same portfolio managers and/or similar names. The Fund’s total returns include changes in share price and reinvested distributions but do not include the charges associated with the separate account products that offer this Fund. Such performance would have been lower if such charges were taken into account.
The Fund’s performance is compared to the performance of the Barclays Credit Index, an index of non-convertible U.S. investment grade corporate bonds; the Barclays U.S. Aggregate Bond Index, an index of U.S. corporate and government bonds and the Citigroup Broad Investment Grade Bond Index, an index of institutionally traded U.S. Treasury Bonds, government-sponsored bonds, mortgage-backed securities and corporate securities. The indices are unmanaged and cannot be purchased directly by investors. While index comparisons may be useful to provide a benchmark for the Fund’s performance, it must be noted that the Fund’s investments are not limited to the investments comprising the indices. Index performance includes reinvestment of income, but does not reflect transaction costs, fees, expenses or taxes. Index performance is shown for illustrative purposes only as a benchmark for the Fund’s performance, and does not predict or depict performance of the Fund. The Fund’s performance reflects the effects of the Fund’s business and operating expenses.
TOP HOLDINGS AND ALLOCATIONS
| PORTFOLIO ALLOCATION | ||||
| Mortgage-Backed Obligations |
||||
| Government Agency |
27.5% | |||
| Non-Agency |
13.7 | |||
| Non-Convertible Corporate Bonds and Notes |
36.5 | |||
| Asset-Backed Securities |
8.2 | |||
| Short-Term Notes |
6.9 | |||
| Investment Company |
||||
| Oppenheimer Institutional Money Market Fund |
6.2 | |||
| U.S. Government Obligations |
0.9 | |||
| Over-the-Counter Options Purchased |
0.1 | |||
| Portfolio holdings and allocations are subject to change. Percentages are as of June 30, 2016, and are based on the total market value of investments. | ||||
2 OPPENHEIMER CORE BOND FUND/VA
Fund Performance Discussion
MARKET OVERVIEW
2016 started off with credit markets widening amid stock market weakness. The Federal Reserve’s (the “Fed”) statement in January suggested they would continue gradually raising rates this year, which further roiled markets as global growth continued to show risk of slowing further. Risk asset weakness and the Bank of Japan cutting rates to negative levels at the end of January helped U.S. Treasury yields fall dramatically.
By mid-February markets began to turn. The European Central Bank (“ECB”) hinted it would likely ease further, the Bank of Japan’s tone remained dovish, China signaled it would provide further stimulus, and better than expected economic data helped turn sentiment. A dovish Fed statement in mid-March and further dovish statements from Chair Yellen (sometimes at odds with other Fed speakers) helped the better trend in risk sentiment persist.
The second quarter of 2016 began with improving data momentum, payrolls and wages remained steady, while survey indicators such as the Institute for Supply Management (ISM) and consumer sentiment also improved. Chinese and emerging market growth looked to have stabilized or modestly strengthened. The market continued to price for one with the potential of two hikes by the Federal Reserve in 2016, as core consumer price inflation data remained stable at about 2.2% year-over-year, and headline inflation stabilized at about 1%.
Data trends continued into May, which led to expectations that the Fed would hike at least twice during 2016 – including the potential for a June hike. A weak May payrolls report caused the market to back off the possibility of two hikes, as did a dovish Chair Yellen in her press conference after the mid-June Federal Open Market Committee meeting.
The big surprise news came late in June with voters in the United Kingdom opting to drop out of the European Union. U.S. markets became extremely volatile for two days. However, risk assets sharply rebounded, while bond yields remain depressed on expectations of further central bank easing. The market priced out hikes until at least late 2017.
FUND REVIEW
Against this backdrop, the Fund’s Non-Service shares produced a return of 5.02% during the reporting period. On a relative basis, the Fund underperformed its benchmarks, the Barclays U.S. Aggregate Bond Index (the “Index”), the Barclays Credit Index and the Citigroup Broad Investment Grade Bond Index, which returned 5.31%, 7.54%, and 5.36%, respectively. The Fund’s underperformance versus the Index this reporting period stemmed from selection in investment grade credit and commercial mortgage-backed securities (“CMBS”). Positive contributors to performance included security selection in agency MBS and an underweight position in U.S. Treasuries.
STRATEGY & OUTLOOK
The Fund continues to maintain an overweight to credit versus the Index as we believe that the U.S. credit cycle, while maturing, has not yet turned. Strong demand for investment grade corporates continues as yields elsewhere in the world have plummeted and in many jurisdictions are negative – even for higher rated corporate debt. This has caused flows into U.S. investment grade fixed-income markets. Even record gross supply in May was met with strong demand, leaving spreads only slightly off their lows. Although volatility will remain high post the Brexit vote, we believe that investment grade credit will remain well supported.
Brexit and other challenges to global growth and inflation will likely keep yields on government securities in the U.S. and other developed markets low, and the Fed away from hiking again before year end.
Although technicals remain strong for high quality U.S. dollar assets, credit spreads could be challenged and volatile along with other risk assets. We therefore have been taking a more defensive stance toward credit exposure. In particular, during the reporting period, we reduced our car loan asset-backed security exposure and will continue to reduce as bonds mature or pre-pay. Underwriting of car loans the last few years appears less rigorous than earlier post crisis vintages and is a cause of our caution.
We continue to opportunistically look for opportunities within agency MBS, increasing and decreasing exposure and positioning among the various mortgage securities available.
3 OPPENHEIMER CORE BOND FUND/VA
Within corporates, we have made few changes to the portfolio, maintaining overweights in banks and automotives. We also maintain a position in BB-rated corporates concentrated in domestic names. We remain focused on credits with improving profiles that offer attractive valuations.
The Fund’s investment strategy and focus can change over time. The mention of specific fund holdings does not constitute a recommendation by OppenheimerFunds, Inc. or its affiliates.
Shares of Oppenheimer funds are not deposits or obligations of any bank, are not guaranteed by any bank, are not insured by the FDIC or any other agency, and involve investment risks, including the possible loss of the principal amount invested.
4 OPPENHEIMER CORE BOND FUND/VA
Fund Expenses
Fund Expenses. As a shareholder of the Fund, you incur two types of costs: (1) transaction costs and (2) ongoing costs, including management fees; distribution and service fees; and other Fund expenses. These examples are intended to help you understand your ongoing costs (in dollars) of investing in the Fund and to compare these costs with the ongoing costs of investing in other mutual funds.
The examples are based on an investment of $1,000.00 invested at the beginning of the period and held for the entire 6-month period ended June 30, 2016.
Actual Expenses. The first section of the table provides information about actual account values and actual expenses. You may use the information in this section for the class of shares you hold, together with the amount you invested, to estimate the expense that you paid over the period. Simply divide your account value by $1,000.00 (for example, an $8,600.00 account value divided by $1,000.00 = 8.60), then multiply the result by the number in the first section under the heading entitled “Expenses Paid During 6 Months Ended June 30, 2016” to estimate the expenses you paid on your account during this period.
Hypothetical Example for Comparison Purposes.
The second section of the table provides information about hypothetical account values and hypothetical expenses based on the Fund’s actual expense ratio for each class of shares, and an assumed rate of return of 5% per year for each class before expenses, which is not the actual return. The hypothetical account values and expenses may not be used to estimate the actual ending account balance or expenses you paid for the period. You may use this information to compare the ongoing costs of investing in the Fund and other funds. To do so, compare this 5% hypothetical example for the class of shares you hold with the 5% hypothetical examples that appear in the shareholder reports of the other funds.
Please note that the expenses shown in the table are meant to highlight your ongoing costs only and do not reflect any charges associated with the separate accounts that offer this Fund. Therefore, the “hypothetical” lines of the table are useful in comparing ongoing costs only, and will not help you determine the relative total costs of owning different funds. In addition, if these separate account charges were included your costs would have been higher.
| Actual | Beginning Account Value January 1, 2016 |
Ending Account Value June 30, 2016 |
Expenses Paid During 6 Months Ended |
|||||||||
| Non-Service shares |
$ 1,000.00 | $ 1,050.20 | $ 3.83 | |||||||||
| Service shares |
1,000.00 | 1,048.20 | 5.10 | |||||||||
| Hypothetical | ||||||||||||
| (5% return before expenses) | ||||||||||||
| Non-Service shares |
1,000.00 | 1,021.13 | 3.78 | |||||||||
| Service shares |
1,000.00 | 1,019.89 | 5.03 | |||||||||
Expenses are equal to the Fund’s annualized expense ratio for that class, multiplied by the average account value over the period, multiplied by 182/366 (to reflect the one-half year period). Those annualized expense ratios, excluding indirect expenses from affiliated funds, based on the 6-month period ended June 30, 2016 are as follows:
| Class | Expense Ratios | |||
| Non-Service shares |
0.75% | |||
| Service shares |
1.00 | |||
The expense ratios reflect voluntary and/or contractual waivers and/or reimbursements of expenses by the Fund’s Manager. Some of these undertakings may be modified or terminated at any time, as indicated in the Fund’s prospectus. The “Financial Highlights” tables in the Fund’s financial statements, included in this report, also show the gross expense ratios, without such waivers or reimbursements and reduction to custodian expenses, if applicable.
5 OPPENHEIMER CORE BOND FUND/VA
STATEMENT OF INVESTMENTS June 30, 2016 Unaudited
6 OPPENHEIMER CORE BOND FUND/VA
7 OPPENHEIMER CORE BOND FUND/VA
STATEMENT OF INVESTMENTS Unaudited / Continued
8 OPPENHEIMER CORE BOND FUND/VA
9 OPPENHEIMER CORE BOND FUND/VA
STATEMENT OF INVESTMENTS Unaudited / Continued
10 OPPENHEIMER CORE BOND FUND/VA
11 OPPENHEIMER CORE BOND FUND/VA
STATEMENT OF INVESTMENTS Unaudited / Continued
12 OPPENHEIMER CORE BOND FUND/VA
| 13 OPPENHEIMER CORE BOND FUND/VA |
STATEMENT OF INVESTMENTS Unaudited / Continued
14 OPPENHEIMER CORE BOND FUND/VA
15 OPPENHEIMER CORE BOND FUND/VA
STATEMENT OF INVESTMENTS Unaudited / Continued
| Counterparty | Exercise Price | Expiration Date | Contracts | |||||||||||||||||||||||||
|
|
||||||||||||||||||||||||||||
| Over-the-Counter Options Purchased—0.1% | ||||||||||||||||||||||||||||
|
|
||||||||||||||||||||||||||||
| iShares iBoxx $ High Yield Corporate Bond Exchange Traded Fund Call12 | BOA | USD | 83.000 | 9/16/16 | USD | 388 | 78,523 | |||||||||||||||||||||
|
|
||||||||||||||||||||||||||||
| iShares iBoxx $ High Yield Corporate Bond Exchange Traded Fund Call12 | CITNA-B | USD | 83.000 | 9/16/16 | USD | 338 | 68,405 | |||||||||||||||||||||
|
|
||||||||||||||||||||||||||||
| iShares iBoxx $ High Yield Corporate Bond Exchange Traded Fund Call12 | BOA | USD | 83.000 | 9/16/16 | USD | 340 | 68,809 | |||||||||||||||||||||
|
|
|
|||||||||||||||||||||||||||
| Total Over-the-Counter Options Purchased (Cost $154,820)
|
|
215,737
|
| |||||||||||||||||||||||||
|
|
||||||||||||||||||||||||||||
| Total Investments, at Value (Cost $181,155,050) | 128.0% | 183,312,103 | ||||||||||||||||||||||||||
|
|
||||||||||||||||||||||||||||
| Net Other Assets (Liabilities) | (28.0) | (40,134,038) | ||||||||||||||||||||||||||
|
|
|
|||||||||||||||||||||||||||
| Net Assets | 100.0% | $ | 143,178,065 | |||||||||||||||||||||||||
|
|
|
|||||||||||||||||||||||||||
Footnotes to Statement of Investments
1. Represents securities sold under Rule 144A, which are exempt from registration under the Securities Act of 1933, as amended. These securities have been determined to be liquid under guidelines established by the Board of Trustees. These securities amount to $31,583,719 or 22.06% of the Fund’s net assets at period end.
2. Represents the current interest rate for a variable or increasing rate security.
3. Interest-Only Strips represent the right to receive the monthly interest payments on an underlying pool of mortgage loans. These securities typically decline in price as interest rates decline. Most other fixed income securities increase in price when interest rates decline. The principal amount of the underlying pool represents the notional amount on which current interest is calculated. The price of these securities is typically more sensitive to changes in prepayment rates than traditional mortgage-backed securities (for example, GNMA pass-throughs). Interest rates disclosed represent current yields based upon the current cost basis and estimated timing and amount of future cash flows. These securities amount to $1,996,477 or 1.39% of the Fund’s net assets at period end.
4. Interest rate is less than 0.0005%.
5. Principal-Only Strips represent the right to receive the monthly principal payments on an underlying pool of mortgage loans. The value of these securities generally increases as interest rates decline and prepayment rates rise. The price of these securities is typically more volatile than that of coupon-bearing bonds of the same maturity. Interest rates disclosed represent current yields based upon the current cost basis and estimated timing of future cash flows. These securities amount to $112,487 or 0.08% of the Fund’s net assets at period end.
6. All or a portion of the security position is when-issued or delayed delivery to be delivered and settled after period end. See Note 4 of the accompanying Notes.
7. All or a portion of the security position is held in accounts at a futures clearing merchant and pledged to cover margin requirements on open futures contracts and written options on futures, if applicable. The aggregate market value of such securities is $35,799. See Note 6 of the accompanying Notes.
8. This bond has no contractual maturity date, is not redeemable and contractually pays an indefinite stream of interest. Rate reported represents the current interest rate for this variable rate security.
9. Security issued in an exempt transaction without registration under the Securities Act of 1933. Such securities amount to $7,297,766 or 5.10% of the Fund’s net assets, and have been determined to be liquid pursuant to guidelines adopted by the Board of Trustees.
10. Rate shown is the 7-day yield at period end.
11. Is or was an affiliate, as defined in the Investment Company Act of 1940, as amended, at or during the reporting period, by virtue of the Fund owning at least 5% of the voting securities of the issuer or as a result of the Fund and the issuer having the same investment adviser. Transactions during the reporting period in which the issuer was an affiliate are as follows:
| Shares December 31, 2015 |
Gross Additions |
Gross Reductions |
Shares June 30, 2016 |
|||||||||||||
|
|
||||||||||||||||
| Oppenheimer Institutional Money Market Fund, Cl. E |
24,144,526 | 73,748,956 | 86,548,059 | 11,345,423 | ||||||||||||
|
Value |
Income | |||||||||||||||
|
|
||||||||||||||||
| Oppenheimer Institutional Money Market Fund, Cl. E |
$ | 11,345,423 | $ | 44,090 | ||||||||||||
| Total |
||||||||||||||||
12. Non-income producing security.
16 OPPENHEIMER CORE BOND FUND/VA
| Footnotes to Statement of Investments (Continued) |
| Future Contracts as of June 30, 2016 |
| Description | Exchange | Buy/Sell | Expiration Date | Number of Contracts | Value | Unrealized Appreciation (Depreciation) |
||||||||||||||||||
|
|
||||||||||||||||||||||||
| United States Treasury Long Bonds | CBT | Sell | 9/21/16 | 37 | $ | 6,376,719 | $ | (187,374) | ||||||||||||||||
| United States Treasury Nts., 10 yr. | CBT | Sell | 9/21/16 | 85 | 11,303,672 | (80,031) | ||||||||||||||||||
| United States Treasury Nts., 2 yr. |
CBT | Buy | 9/30/16 | 50 | 10,966,407 | 18,816 | ||||||||||||||||||
| United States Treasury Nts., 5 yr. |
CBT | Buy | 9/30/16 | 17 | 2,076,789 | 37,998 | ||||||||||||||||||
| United States Ultra Bonds |
CBT | Buy | 9/21/16 | 67 | 12,487,125 | 812,426 | ||||||||||||||||||
|
|
|
|||||||||||||||||||||||
| $ | 601,835 | |||||||||||||||||||||||
|
|
|
|||||||||||||||||||||||
Glossary:
| Counterparty Abbreviations | ||||
| BOA | Bank of America NA | |||
| CITNA-B | Citibank NA | |||
| Exchange Abbreviations | ||||
| CBT | Chicago Board of Trade |
See accompanying Notes to Financial Statements.
17 OPPENHEIMER CORE BOND FUND/VA
STATEMENT OF ASSETS AND LIABILITIES June 30, 2016 Unaudited
|
|
||||
|
Assets |
||||
| Investments, at value—see accompanying statement of investments: | ||||
| Unaffiliated companies (cost $169,809,627) | $ | 171,966,680 | ||
| Affiliated companies (cost $11,345,423) | 11,345,423 | |||
|
|
|
|||
| 183,312,103 | ||||
|
|
||||
| Cash | 500,348 | |||
|
|
||||
| Cash used for collateral on futures | 220,000 | |||
|
|
||||
| Receivables and other assets: | ||||
| Investments sold (including $8,506,658 sold on a when-issued or delayed delivery basis) | 11,010,587 | |||
| Interest, dividends and principal paydowns | 750,774 | |||
| Variation margin receivable | 38,496 | |||
| Shares of beneficial interest sold | 25,756 | |||
| Other | 36,389 | |||
|
|
|
|||
| Total assets | 195,894,453 | |||
|
|
||||
|
Liabilities |
||||
| Payables and other liabilities: | ||||
| Investments purchased (including $50,758,581 purchased on a when-issued or delayed delivery basis) | 52,452,927 | |||
| Shares of beneficial interest redeemed | 140,073 | |||
| Variation margin payable | 60,719 | |||
| Trustees’ compensation | 27,510 | |||
| Distribution and service plan fees | 11,020 | |||
| Shareholder communications | 6,775 | |||
| Other | 17,364 | |||
|
|
|
|||
| Total liabilities | 52,716,388 | |||
|
|
||||
| Net Assets |
$ | 143,178,065 | ||
|
|
|
|||
|
|
||||
|
Composition of Net Assets |
||||
| Par value of shares of beneficial interest | $ | 18,449 | ||
|
|
||||
| Additional paid-in capital | 222,993,946 | |||
|
|
||||
| Accumulated net investment income | 1,075,014 | |||
|
|
||||
| Accumulated net realized loss on investments | (83,668,231) | |||
|
|
||||
| Net unrealized appreciation on investments | 2,758,887 | |||
|
|
|
|||
| Net Assets |
$ | 143,178,065 | ||
|
|
|
|||
|
|
||||
|
Net Asset Value Per Share |
||||
| Non-Service Shares: | ||||
| Net asset value, redemption price per share and offering price per share (based on net assets of $89,014,044 and 11,417,199 shares of beneficial interest outstanding) | $7.80 | |||
|
|
||||
| Service Shares: | ||||
| Net asset value, redemption price per share and offering price per share (based on net assets of $54,164,021 and 7,031,364 shares of beneficial interest outstanding) | $7.70 | |||
See accompanying Notes to Financial Statements.
18 OPPENHEIMER CORE BOND FUND/VA
STATEMENT OF OPERATIONS For the Six Months Ended June 30, 2016 Unaudited
|
|
||||
| Investment Income |
||||
| Interest - unaffiliated companies | $ | 2,220,571 | ||
|
|
||||
| Fee income on when-issued securities | 397,292 | |||
|
|
||||
| Dividends - affiliated companies | 44,090 | |||
|
|
|
|||
| Total investment income |
|
2,661,953
|
| |
|
|
||||
| Expenses |
||||
| Management fees | 412,784 | |||
|
|
||||
| Distribution and service plan fees - Service shares | 64,402 | |||
|
|
||||
| Transfer and shareholder servicing agent fees: | ||||
| Non-Service shares | 43,005 | |||
| Service shares | 25,792 | |||
|
|
||||
| Shareholder communications: | ||||
| Non-Service shares | 10,496 | |||
| Service shares | 6,294 | |||
|
|
||||
| Legal, auditing and other professional fees | 36,610 | |||
|
|
||||
| Custodian fees and expenses | 24,045 | |||
|
|
||||
| Trustees’ compensation | 8,636 | |||
|
|
||||
| Borrowing fees | 1,175 | |||
|
|
||||
| Other | 3,660 | |||
|
|
|
|||
| Total expenses | 636,899 | |||
| Less reduction to custodian expenses | (182) | |||
| Less waivers and reimbursements of expenses | (55,070) | |||
|
|
|
|||
| Net expenses |
|
581,647
|
| |
|
|
||||
| Net Investment Income |
|
2,080,306
|
| |
|
|
||||
| Realized and Unrealized Gain (Loss) |
||||
| Net realized gain (loss) on: | ||||
| Investments from unaffiliated companies (including premiums on options exercised) | (2,421,611) | |||
| Closing and expiration of futures contracts | 120,796 | |||
|
|
|
|||
| Net realized loss | (2,300,815) | |||
|
|
||||
| Net change in unrealized appreciation/depreciation on: | ||||
| Investments | 6,327,841 | |||
| Futures contracts | 557,172 | |||
|
|
|
|||
| Net change in unrealized appreciation/depreciation |
|
6,885,013
|
| |
|
|
||||
| Net Increase in Net Assets Resulting from Operations |
$ | 6,664,504 | ||
|
|
|
|||
See accompanying Notes to Financial Statements.
19 OPPENHEIMER CORE BOND FUND/VA
STATEMENTS OF CHANGES IN NET ASSETS
| Six Months Ended June 30, 2016 (Unaudited) |
Year Ended December 31, 2015 |
|||||||
|
|
||||||||
| Operations |
||||||||
| Net investment income | $ | 2,080,306 | $ | 4,848,365 | ||||
|
|
||||||||
| Net realized loss | (2,300,815) | (345,781) | ||||||
|
|
||||||||
| Net change in unrealized appreciation/depreciation | 6,885,013 | (3,220,897) | ||||||
|
|
|
|||||||
| Net increase in net assets resulting from operations |
|
6,664,504
|
|
|
1,281,687
|
| ||
|
|
||||||||
| Dividends and/or Distributions to Shareholders |
||||||||
| Dividends from net investment income: | ||||||||
| Non-Service shares | (3,248,135) | (3,667,301) | ||||||
| Service shares | (1,867,358) | (2,079,404) | ||||||
|
|
|
|||||||
|
|
(5,115,493)
|
|
|
(5,746,705)
|
| |||
|
|
||||||||
| Beneficial Interest Transactions |
||||||||
| Net increase (decrease) in net assets resulting from beneficial interest transactions: | ||||||||
| Non-Service shares | 2,891,827 | (2,833,378) | ||||||
| Service shares | 1,058,236 | 1,545,644 | ||||||
|
|
|
|||||||
|
|
3,950,063
|
|
|
(1,287,734)
|
| |||
|
|
||||||||
| Net Assets |
||||||||
| Total increase (decrease) | 5,499,074 | (5,752,752) | ||||||
|
|
||||||||
| Beginning of period | 137,678,991 | 143,431,743 | ||||||
|
|
|
|||||||
| End of period (including accumulated net investment income of $1,075,014 and $4,110,201, respectively) | $ | 143,178,065 | $ | 137,678,991 | ||||
|
|
|
|||||||
See accompanying Notes to Financial Statements.
20 OPPENHEIMER CORE BOND FUND/VA
FINANCIAL HIGHLIGHTS
| Non-Service Shares | Six Months Ended June 30, 2016 (Unaudited) |
Year Ended December 31, 2015 |
Year Ended December 31, 2014 |
Year Ended December 31, 2013 |
Year Ended December 31, 2012 |
Year Ended December 30, 20111 |
||||||||||||||||||
|
|
||||||||||||||||||||||||
| Per Share Operating Data |
||||||||||||||||||||||||
| Net asset value, beginning of period | $ | 7.71 | $ | 7.96 | $ | 7.83 | $ | 8.26 | $ | 7.88 | $ | 7.73 | ||||||||||||
|
|
||||||||||||||||||||||||
| Income (loss) from investment operations: | ||||||||||||||||||||||||
| Net investment income2 | 0.12 | 0.27 | 0.30 | 0.36 | 0.35 | 0.36 | ||||||||||||||||||
| Net realized and unrealized gain (loss) | 0.26 | (0.19) | 0.26 | (0.37) | 0.44 | 0.25 | ||||||||||||||||||
|
|
|
|||||||||||||||||||||||
| Total from investment operations | 0.38 | 0.08 | 0.56 | (0.01) | 0.79 | 0.61 | ||||||||||||||||||
|
|
||||||||||||||||||||||||
| Dividends and/or distributions to shareholders: | ||||||||||||||||||||||||
| Dividends from net investment income | (0.29) | (0.33) | (0.43) | (0.42) | (0.41) | (0.46) | ||||||||||||||||||
|
|
||||||||||||||||||||||||
| Net asset value, end of period | $ | 7.80 | $ | 7.71 | $ | 7.96 | $ | 7.83 | $ | 8.26 | $ | 7.88 | ||||||||||||
|
|
|
|||||||||||||||||||||||
|
|
||||||||||||||||||||||||
| Total Return, at Net Asset Value3 |
5.02% | 0.96% | 7.27% | (0.10)% | 10.29% | 8.27% | ||||||||||||||||||
|
|
||||||||||||||||||||||||
| Ratios/Supplemental Data |
||||||||||||||||||||||||
| Net assets, end of period (in thousands) | $ | 89,014 | $ | 85,160 | $ | 90,757 | $ | 96,785 | $ | 116,989 | $ | 122,271 | ||||||||||||
|
|
||||||||||||||||||||||||
| Average net assets (in thousands) | $ | 86,508 | $ | 89,919 | $ | 94,336 | $ | 105,012 | $ | 119,547 | $ | 127,341 | ||||||||||||
|
|
||||||||||||||||||||||||
| Ratios to average net assets:4 | ||||||||||||||||||||||||
| Net investment income | 3.12% | 3.46% | 3.72% | 4.51% | 4.34% | 4.71% | ||||||||||||||||||
| Expenses excluding specific expenses listed below | 0.83% | 0.82% | 0.80% | 0.80% | 0.77% | 0.77% | ||||||||||||||||||
| Interest and fees from borrowings | 0.00%5 | 0.00%5 | 0.00% | 0.00% | 0.00% | 0.00% | ||||||||||||||||||
|
|
|
|||||||||||||||||||||||
| Total expenses6 | 0.83% | 0.82% | 0.80% | 0.80% | 0.77% | 0.77% | ||||||||||||||||||
| Expenses after payments, waivers and/or reimbursements and reduction to custodian expenses | 0.75% | 0.75% | 0.75% | 0.75% | 0.75% | 0.75% | ||||||||||||||||||
|
|
||||||||||||||||||||||||
| Portfolio turnover rate7 | 39% | 73% | 127% | 115% | 140% | 99% | ||||||||||||||||||
1. December 30, 2011 represents the last business day of the Fund’s reporting period. See Note 2 of the accompanying Notes.
2. Per share amounts calculated based on the average shares outstanding during the period.
3. Assumes an initial investment on the business day before the first day of the fiscal period, with all dividends and distributions reinvested in additional shares on the reinvestment date, and redemption at the net asset value calculated on the last business day of the fiscal period. Total returns are not annualized for periods less than one full year. Total return information does not reflect expenses that apply at the separate account level or to related insurance products. Inclusion of these charges would reduce the total return figures for all periods shown. Returns do not reflect the deduction of taxes that a shareholder would pay on fund distributions or the redemption of fund shares.
4. Annualized for periods less than one full year.
5. Less than 0.005%.
6. Total expenses including indirect expenses from affiliated fund fees and expenses were as follows:
| Six Months Ended June 30, 2016 |
0.84 | % | ||||
| Year Ended December 31, 2015 |
0.83 | % | ||||
| Year Ended December 31, 2014 |
0.81 | % | ||||
| Year Ended December 31, 2013 |
0.81 | % | ||||
| Year Ended December 31, 2012 |
0.79 | % | ||||
| Year Ended December 30, 2011 |
0.79 | % | ||||
7. The portfolio turnover rate excludes purchase and sale transactions of To Be Announced (TBA) mortgage-related securities as follows:
| Purchase Transactions | Sale Transactions | |||||||
|
|
||||||||
| Six Months Ended June 30, 2016 |
$330,077,334 | $325,582,368 | ||||||
| Year Ended December 31, 2015 |
$697,962,198 | $709,720,690 | ||||||
| Year Ended December 31, 2014 |
$560,409,975 | $543,669,748 | ||||||
| Year Ended December 31, 2013 |
$776,927,298 | $806,883,121 | ||||||
| Year Ended December 31, 2012 |
$930,202,858 | $942,406,652 | ||||||
| Year Ended December 30, 2011 |
$911,850,847 | $909,531,196 | ||||||
See accompanying Notes to Financial Statements.
21 OPPENHEIMER CORE BOND FUND/VA
FINANCIAL HIGHLIGHTS Continued
| Service Shares | Six Months Ended June 30, 2016 (Unaudited) |
Year Ended December 31, 2015 |
Year Ended December 31, |
Year Ended December 31, 2013 |
Year Ended December 31, 2012 |
Year Ended December 30, 20111 |
||||||||||||||||||
|
|
||||||||||||||||||||||||
| Per Share Operating Data |
||||||||||||||||||||||||
| Net asset value, beginning of period | $ | 7.61 | $ | 7.86 | $ | 7.74 | $ | 8.17 | $ | 7.79 | $ | 7.65 | ||||||||||||
|
|
||||||||||||||||||||||||
| Income (loss) from investment operations: | ||||||||||||||||||||||||
| Net investment income2 | 0.11 | 0.25 | 0.27 | 0.34 | 0.33 | 0.34 | ||||||||||||||||||
| Net realized and unrealized gain (loss) | 0.25 | (0.19) | 0.26 | (0.37) | 0.44 | 0.24 | ||||||||||||||||||
|
|
|
|||||||||||||||||||||||
| Total from investment operations | 0.36 | 0.06 | 0.53 | (0.03) | 0.77 | 0.58 | ||||||||||||||||||
|
|
||||||||||||||||||||||||
| Dividends and/or distributions to shareholders: | ||||||||||||||||||||||||
| Dividends from net investment income | (0.27) | (0.31) | (0.41) | (0.40) | (0.39) | (0.44) | ||||||||||||||||||
|
|
||||||||||||||||||||||||
| Net asset value, end of period | $ | 7.70 | $ | 7.61 | $ | 7.86 | $ | 7.74 | $ | 8.17 | $ | 7.79 | ||||||||||||
|
|
|
|||||||||||||||||||||||
|
|
||||||||||||||||||||||||
| Total Return, at Net Asset Value3 |
4.82% | 0.70% | 6.93% | (0.38)% | 10.17% | 7.93% | ||||||||||||||||||
|
|
||||||||||||||||||||||||
| Ratios/Supplemental Data |
||||||||||||||||||||||||
| Net assets, end of period (in thousands) | $ | 54,164 | $ | 52,519 | $ | 52,675 | $ | 54,946 | $ | 64,694 | $ | 62,294 | ||||||||||||
|
|
||||||||||||||||||||||||
| Average net assets (in thousands) | $ | 51,884 | $ | 54,016 | $ | 55,215 | $ | 59,523 | $ | 67,116 | $ | 58,629 | ||||||||||||
|
|
||||||||||||||||||||||||
| Ratios to average net assets:4 | ||||||||||||||||||||||||
| Net investment income | 2.86% | 3.21% | 3.47% | 4.26% | 4.07% | 4.42% | ||||||||||||||||||
| Expenses excluding specific expenses listed below | 1.08% | 1.07% | 1.04% | 1.05% | 1.02% | 1.02% | ||||||||||||||||||
| Interest and fees from borrowings | 0.00%5 | 0.00%5 | 0.00% | 0.00% | 0.00% | 0.00% | ||||||||||||||||||
|
|
|
|||||||||||||||||||||||
| Total expenses6 | 1.08% | 1.07% | 1.04% | 1.05% | 1.02% | 1.02% | ||||||||||||||||||
| Expenses after payments, waivers and/or reimbursements and reduction to custodian expenses | 1.00% | 1.00% | 1.00% | 1.00% | 1.00% | 1.00% | ||||||||||||||||||
|
|
||||||||||||||||||||||||
| Portfolio turnover rate7 | 39% | 73% | 127% | 115% | 140% | 99% | ||||||||||||||||||
1. December 30, 2011 represents the last business day of the Fund’s reporting period. See Note 2 of the accompanying Notes.
2. Per share amounts calculated based on the average shares outstanding during the period.
3. Assumes an initial investment on the business day before the first day of the fiscal period, with all dividends and distributions reinvested in additional shares on the reinvestment date, and redemption at the net asset value calculated on the last business day of the fiscal period. Total returns are not annualized for periods less than one full year. Total return information does not reflect expenses that apply at the separate account level or to related insurance products. Inclusion of these charges would reduce the total return figures for all periods shown. Returns do not reflect the deduction of taxes that a shareholder would pay on fund distributions or the redemption of fund shares.
4. Annualized for periods less than one full year.
5. Less than 0.005%.
6. Total expenses including indirect expenses from affiliated fund fees and expenses were as follows:
| Six Months Ended June 30, 2016 |
1.09 | % | ||||
| Year Ended December 31, 2015 |
1.08 | % | ||||
| Year Ended December 31, 2014 |
1.05 | % | ||||
| Year Ended December 31, 2013 |
1.06 | % | ||||
| Year Ended December 31, 2012 |
1.04 | % | ||||
| Year Ended December 30, 2011 |
1.04 | % | ||||
7. The portfolio turnover rate excludes purchase and sale transactions of To Be Announced (TBA) mortgage-related securities as follows:
| Purchase Transactions | Sale Transactions | |||||||
|
|
||||||||
| Six Months Ended June 30, 2016 |
$330,077,334 | $325,582,368 | ||||||
| Year Ended December 31, 2015 |
$697,962,198 | $709,720,690 | ||||||
| Year Ended December 31, 2014 |
$560,409,975 | $543,669,748 | ||||||
| Year Ended December 31, 2013 |
$776,927,298 | $806,883,121 | ||||||
| Year Ended December 31, 2012 |
$930,202,858 | $942,406,652 | ||||||
| Year Ended December 30, 2011 |
$911,850,847 | $909,531,196 | ||||||
See accompanying Notes to Financial Statements.
22 OPPENHEIMER CORE BOND FUND/VA
NOTES TO FINANCIAL STATEMENTS June 30, 2016 Unaudited
1. Organization
Oppenheimer Core Bond Fund/VA (the “Fund”), a separate series of Oppenheimer Variable Account Funds, is a diversified open-end management investment company registered under the Investment Company Act of 1940 (“1940 Act”), as amended. The Fund’s main investment objective is to seek total return. The Fund’s investment adviser is OFI Global Asset Management, Inc. (“OFI Global” or the “Manager”), a wholly-owned subsidiary of OppenheimerFunds, Inc. (“OFI” or the “Sub-Adviser”). The Manager has entered into a sub-advisory agreement with OFI. Shares of the Fund are sold only to separate accounts of life insurance companies.
The Fund offers two classes of shares. Both classes are sold at their offering price, which is the net asset value per share, to separate investment accounts of participating insurance companies as an underlying investment for variable life insurance policies, variable annuity contracts or other investment products. The class of shares designated as Service shares is subject to a distribution and service plan. Both classes of shares have identical rights and voting privileges with respect to the Fund in general and exclusive voting rights on matters that affect that class alone. Earnings, net assets and net asset value per share may differ due to each class having its own expenses, such as transfer and shareholder servicing agent fees and shareholder communications, directly attributable to that class.
The following is a summary of significant accounting policies followed in the Fund’s preparation of financial statements in accordance with accounting principles generally accepted in the United States (“U.S. GAAP”).
2. Significant Accounting Policies
Security Valuation. All investments in securities are recorded at their estimated fair value, as described in Note 3.
Reporting Period End Date. The last day of the Fund’s reporting period is the last day the New York Stock Exchange was open for trading during the period. The Fund’s financial statements have been presented through that date to maintain consistency with the Fund’s net asset value calculations used for shareholder transactions.
Allocation of Income, Expenses, Gains and Losses. Income, expenses (other than those attributable to a specific class), gains and losses are allocated on a daily basis to each class of shares based upon the relative proportion of net assets represented by such class. Operating expenses directly attributable to a specific class are charged against the operations of that class.
Dividends and Distributions to Shareholders. Dividends and distributions to shareholders, which are determined in accordance with income tax regulations and may differ from U.S. GAAP, are recorded on the ex-dividend date. Income and capital gain distributions, if any, are declared and paid annually or at other times as deemed necessary by the Manager.
The tax character of distributions is determined as of the Fund’s fiscal year end. Therefore, a portion of the Fund’s distributions made to shareholders prior to the Fund’s fiscal year end may ultimately be categorized as a tax return of capital.
Investment Income. Dividend income is recorded on the ex-dividend date or upon ex-dividend notification in the case of certain foreign dividends where the ex-dividend date may have passed. Non-cash dividends included in dividend income, if any, are recorded at the fair market value of the securities received. Interest income is recognized on an accrual basis. Discount and premium, which are included in interest income on the Statement of Operations, are amortized or accreted daily.
Custodian Fees. “Custodian fees and expenses” in the Statement of Operations may include interest expense incurred by the Fund on any cash overdrafts of its custodian account during the period. Such cash overdrafts may result from the effects of failed trades in portfolio securities and from cash outflows resulting from unanticipated shareholder redemption activity. The Fund pays interest to its custodian on such cash overdrafts, to the extent they are not offset by positive cash balances maintained by the Fund, at a rate equal to the Federal Funds Rate plus 0.50%. The “Reduction to custodian expenses” line item, if applicable, represents earnings on cash balances maintained by the Fund during the period. Such interest expense and other custodian fees may be paid with these earnings.
Security Transactions. Security transactions are recorded on the trade date. Realized gains and losses on securities sold are determined on the basis of identified cost.
Indemnifications. The Fund’s organizational documents provide current and former Trustees and officers with a limited indemnification against liabilities arising in connection with the performance of their duties to the Fund. In the normal course of business, the Fund may also enter into contracts that provide general indemnifications. The Fund’s maximum exposure under these arrangements is unknown as this would be dependent on future claims that may be made against the Fund. The risk of material loss from such claims is considered remote.
Federal Taxes. The Fund intends to comply with provisions of the Internal Revenue Code applicable to regulated investment companies and to distribute substantially all of its investment company taxable income to shareholders. Therefore, no federal income or excise tax provision is required. The Fund files income tax returns in U.S. federal and applicable state jurisdictions. The statute of limitations on the Fund’s tax return filings generally remains open for the three preceding fiscal reporting period ends. The Fund has analyzed its tax positions for the fiscal year ended December 31, 2015, including open tax years, and does not believe there are any uncertain tax positions requiring recognition in the Fund’s financial statements.
23 OPPENHEIMER CORE BOND FUND/VA
NOTES TO FINANCIAL STATEMENTS Unaudited / Continued
2. Significant Accounting Policies (Continued)
During the fiscal year ended December 31, 2015, the Fund utilized did not utilize any capital loss carryforward to offset capital gains realized in that fiscal year. Details of the fiscal year ended December 31, 2015 capital loss carryforwards are included in the table below. Capital loss carryforwards with no expiration, if any, must be utilized prior to those with expiration dates. Capital losses with no expiration will be carried forward to future years if not offset by gains.
| Expiring | ||||
|
|
||||
| 2016 |
$ | 5,303,131 | ||
| 2017 |
75,069,850 | |||
| No expiration |
941,683 | |||
|
|
|
|||
| Total |
$ | 81,314,664 | ||
|
|
|
|||
At period end, it is estimated that the capital loss carryforwards would be $80,372,981 expiring by 2017 and $3,242,498, which will not expire. The estimated capital loss carryforward represents the carryforward as of the end of the last fiscal year, increased or decreased by capital losses or gains realized in the first six months of the current fiscal year. During the reporting period, it is estimated that the Fund will not utilize any capital loss carryforward to offset realized capital gains.
Net investment income (loss) and net realized gain (loss) may differ for financial statement and tax purposes. The character of dividends and distributions made during the fiscal year from net investment income or net realized gains are determined in accordance with federal income tax requirements, which may differ from the character of net investment income or net realized gains presented in those financial statements in accordance with U.S. GAAP. Also, due to timing of dividends and distributions, the fiscal year in which amounts are distributed may differ from the fiscal year in which the income or net realized gain was recorded by the Fund.
The aggregate cost of securities and other investments and the composition of unrealized appreciation and depreciation of securities and other investments for federal income tax purposes at period end are noted in the following table. The primary difference between book and tax appreciation or depreciation of securities and other investments, if applicable, is attributable to the tax deferral of losses or tax realization of financial statement unrealized gain or loss.
| Federal tax cost of securities |
$ | 181,157,302 | ||
| Federal tax cost of other investments |
7,248,095 | |||
|
|
|
|||
| Total federal tax cost |
$ | 188,405,397 | ||
|
|
|
|||
| Gross unrealized appreciation |
$ | 5,843,466 | ||
| Gross unrealized depreciation |
(3,086,830) | |||
|
|
|
|||
| Net unrealized appreciation |
$ | 2,756,636 | ||
|
|
|
Use of Estimates. The preparation of financial statements in conformity with U.S. GAAP requires management to make estimates and assumptions that affect the reported amounts of assets and liabilities and disclosure of contingent assets and liabilities at the date of the financial statements and the reported amounts of increases and decreases in net assets from operations during the reporting period. Actual results could differ from those estimates.
3. Securities Valuation
The Fund calculates the net asset value of its shares as of 4:00 P.M. Eastern time, on each day the New York Stock Exchange (the “Exchange”) is open for trading, except in the case of a scheduled early closing of the Exchange, in which case the Fund will calculate net asset value of the shares as of the scheduled early closing time of the Exchange.
The Fund’s Board has adopted procedures for the valuation of the Fund’s securities and has delegated the day-to-day responsibility for valuation determinations under those procedures to the Manager. The Manager has established a Valuation Committee which is responsible for determining a “fair valuation” for any security for which market quotations are not “readily available.” The Valuation Committee’s fair valuation determinations are subject to review, approval and ratification by the Fund’s Board at its next regularly scheduled meeting covering the calendar quarter in which the fair valuation was determined.
Valuation Methods and Inputs
Securities are valued using unadjusted quoted market prices, when available, as supplied primarily by third party pricing services or dealers.
The following methodologies are used to determine the market value or the fair value of the types of securities described below:
Securities traded on a registered U.S. securities exchange (including exchange-traded derivatives other than futures and futures options) are valued based on the last sale price of the security reported on the principal exchange on which it is traded, prior to the time when the Fund’s assets are valued. In the absence of a sale, the security is valued at the mean between the bid and asked price on the principal exchange or, if not available from the principal exchange, obtained from two dealers. If bid and asked prices are not available from either the exchange or two dealers, the security is valued by using one of the following methodologies (listed in order of priority): (1) a bid from the principal exchange, (2) the mean between the bid and asked price as provided by a single dealer, or (3) a bid from a single dealer. A security of a foreign issuer traded on a foreign exchange, but not listed on a registered U.S. securities exchange, is valued based on the last sale price on the principal exchange on which the security is traded, as identified by the third party pricing service used by the Manager, prior to the time when the Fund’s assets are valued. If the last sale price is unavailable, the security is valued at the most recent official closing price on the principal exchange on which it is traded. If the last sales price or official closing price for a foreign
24 OPPENHEIMER CORE BOND FUND/VA
3. Securities Valuation (Continued)
security is not available, the security is valued at the mean between the bid and asked price per the exchange or, if not available from the exchange, obtained from two dealers. If bid and asked prices are not available from either the exchange or two dealers, the security is valued by using one of the following methodologies (listed in order of priority): (1) a bid from the exchange, (2) the mean between the bid and asked price as provided by a single dealer, or (3) a bid from a single dealer.
Shares of a registered investment company that are not traded on an exchange are valued at that investment company’s net asset value per share.
Corporate and government debt securities (of U.S. or foreign issuers) and municipal debt securities, event-linked bonds, loans, mortgage-backed securities, collateralized mortgage obligations, and asset-backed securities are valued at the mean between the “bid” and “asked” prices utilizing evaluated prices obtained from third party pricing services or broker-dealers who may use matrix pricing methods to determine the evaluated prices.
Short-term money market type debt securities with a remaining maturity of sixty days or less are valued at cost adjusted by the amortization of discount or premium to maturity (amortized cost), which approximates market value. Short-term debt securities with a remaining maturity in excess of sixty days are valued at the mean between the “bid” and “asked” prices utilizing evaluated prices obtained from third party pricing services or broker-dealers.
Futures contracts and futures options traded on a commodities or futures exchange will be valued at the final settlement price or official closing price on the principal exchange as reported by such principal exchange at its trading session ending at, or most recently prior to, the time when the Fund’s assets are valued.
A description of the standard inputs that may generally be considered by the third party pricing vendors in determining their evaluated prices is provided below.
| Security Type | Standard inputs generally considered by third-party pricing vendors | |||
| Corporate debt, government debt, municipal, mortgage-backed and asset-backed securities | Reported trade data, broker-dealer price quotations, benchmark yields, issuer spreads on comparable securities, the credit quality, yield, maturity, and other appropriate factors. | |||
| Loans | Information obtained from market participants regarding reported trade data and broker-dealer price quotations. | |||
| Event-linked bonds | Information obtained from market participants regarding reported trade data and broker-dealer price quotations. |
If a market value or price cannot be determined for a security using the methodologies described above, or if, in the “good faith” opinion of the Manager, the market value or price obtained does not constitute a “readily available market quotation,” or a significant event has occurred that would materially affect the value of the security, the security is fair valued either (i) by a standardized fair valuation methodology applicable to the security type or the significant event as previously approved by the Valuation Committee and the Fund’s Board or (ii) as determined in good faith by the Manager’s Valuation Committee. The Valuation Committee considers all relevant facts that are reasonably available, through either public information or information available to the Manager, when determining the fair value of a security. Fair value determinations by the Manager are subject to review, approval and ratification by the Fund’s Board at its next regularly scheduled meeting covering the calendar quarter in which the fair valuation was determined. Those fair valuation standardized methodologies include, but are not limited to, valuing securities at the last sale price or initially at cost and subsequently adjusting the value based on: changes in company specific fundamentals, changes in an appropriate securities index, or changes in the value of similar securities which may be further adjusted for any discounts related to security-specific resale restrictions. When possible, such methodologies use observable market inputs such as unadjusted quoted prices of similar securities, observable interest rates, currency rates and yield curves. The methodologies used for valuing securities are not necessarily an indication of the risks associated with investing in those securities nor can it be assured that the Fund can obtain the fair value assigned to a security if it were to sell the security.
To assess the continuing appropriateness of security valuations, the Manager, or its third party service provider who is subject to oversight by the Manager, regularly compares prior day prices, prices on comparable securities, and sale prices to the current day prices and challenges those prices exceeding certain tolerance levels with the third party pricing service or broker source. For those securities valued by fair valuations, whether through a standardized fair valuation methodology or a fair valuation determination, the Valuation Committee reviews and affirms the reasonableness of the valuations based on such methodologies and fair valuation determinations on a regular basis after considering all relevant information that is reasonably available.
Classifications
Each investment asset or liability of the Fund is assigned a level at measurement date based on the significance and source of the inputs to its valuation. Various data inputs are used in determining the value of each of the Fund’s investments as of the reporting period end. These data inputs are categorized in the following hierarchy under applicable financial accounting standards:
1) Level 1-unadjusted quoted prices in active markets for identical assets or liabilities (including securities actively traded on a securities exchange)
2) Level 2-inputs other than unadjusted quoted prices that are observable for the asset or liability (such as unadjusted quoted prices for similar assets and market corroborated inputs such as interest rates, prepayment speeds, credit risks, etc.)
3) Level 3-significant unobservable inputs (including the Manager’s own judgments about assumptions that market participants would use in pricing the asset or liability).
The inputs used for valuing securities are not necessarily an indication of the risks associated with investing in those securities.
25 OPPENHEIMER CORE BOND FUND/VA
NOTES TO FINANCIAL STATEMENTS Unaudited / Continued
3. Securities Valuation (Continued)
The Fund classifies each of its investments in investment companies which are publicly offered as Level 1. Investment companies that are not publicly offered are measured using net asset value as a practical expedient, and are not classified in the fair value hierarchy.
The table below categorizes amounts that are included in the Fund’s Statement of Assets and Liabilities at period end based on valuation input level:
| Level 1— Unadjusted Quoted Prices |
Level 2— Other Significant Observable Inputs |
Level 3— Significant Unobservable Inputs |
Value | |||||||||||||
|
|
||||||||||||||||
| Assets Table |
||||||||||||||||
| Investments, at Value: |
||||||||||||||||
| Asset-Backed Securities |
$ | — | $ | 14,964,996 | $ | — | $ | 14,964,996 | ||||||||
| Mortgage-Backed Obligations |
— | 75,500,305 | 50,587 | 75,550,892 | ||||||||||||
| U.S. Government Obligations |
— | 1,730,942 | — | 1,730,942 | ||||||||||||
| Corporate Bonds and Notes |
— | 66,917,632 | — | 66,917,632 | ||||||||||||
| Short-Term Notes |
— | 12,586,481 | — | 12,586,481 | ||||||||||||
| Over-the-Counter Options Purchased |
— | 215,737 | — | 215,737 | ||||||||||||
| Investment Company |
11,345,423 | — | — | 11,345,423 | ||||||||||||
|
|
|
|||||||||||||||
| Total Investments, at Value |
11,345,423 | 171,916,093 | 50,587 | 183,312,103 | ||||||||||||
| Other Financial Instruments: |
||||||||||||||||
| Futures contracts |
869,240 | — | — | 869,240 | ||||||||||||
|
|
|
|||||||||||||||
| Total Assets |
$ | 12,214,663 | $ | 171,916,093 | $ | 50,587 | $ | 184,181,343 | ||||||||
|
|
|
|||||||||||||||
| Liabilities Table |
||||||||||||||||
| Other Financial Instruments: |
||||||||||||||||
| Futures contracts |
$ | (267,405) | $ | — | $ | — | $ | (267,405) | ||||||||
|
|
|
|||||||||||||||
| Total Liabilities |
$ | (267,405) | $ | — | $ | — | $ | (267,405) | ||||||||
|
|
|
|||||||||||||||
Forward currency exchange contracts and futures contracts, if any, are reported at their unrealized appreciation/depreciation at measurement date, which represents the change in the contract’s value from trade date. All additional assets and liabilities included in the above table are reported at their market value at measurement date.
4. Investments and Risks
Investments in Affiliated Funds. The Fund is permitted to invest in other mutual funds advised by the Manager (“Affiliated Funds”). Affiliated Funds are open-end management investment companies registered under the 1940 Act, as amended. The Manager is the investment adviser of, and the Sub-Adviser provides investment and related advisory services to, the Affiliated Funds. When applicable, the Fund’s investments in Affiliated Funds are included in the Statement of Investments. Shares of Affiliated Funds are valued at their net asset value per share. As a shareholder, the Fund is subject to its proportional share of the Affiliated Funds’ expenses, including their management fee. The Manager will waive fees and/or reimburse Fund expenses in an amount equal to the indirect management fees incurred through the Fund’s investment in the Affiliated Funds.
Each of the Affiliated Funds in which the Fund invests has its own investment risks, and those risks can affect the value of the Fund’s investments and therefore the value of the Fund’s shares. To the extent that the Fund invests more of its assets in one Affiliated Fund than in another, the Fund will have greater exposure to the risks of that Affiliated Fund.
Investment in Oppenheimer Institutional Money Market Fund. The Fund is permitted to invest daily available cash balances in a money market Affiliated Fund. The Fund may invest the available cash in Class E shares of Oppenheimer Institutional Money Market Fund (“IMMF”) to seek current income while preserving liquidity or for defensive purposes. IMMF is regulated as a money market fund under the Investment Company Act of 1940, as amended.
Securities on a When-Issued or Delayed Delivery Basis. The Fund may purchase securities on a “when-issued” basis, and may purchase or sell securities on a “delayed delivery” basis. “When-issued” or “delayed delivery” refers to securities whose terms and indenture are available and for which a market exists, but which are not available for immediate delivery. Delivery and payment for securities that have been purchased by the Fund on a when-issued basis normally takes place within six months and possibly as long as two years or more after the trade date. During this period, such securities do not earn interest, are subject to market fluctuation and may increase or decrease in value prior to their delivery. The purchase of securities on a when-issued basis may increase the volatility of the Fund’s net asset value to the extent the Fund executes such transactions while remaining substantially fully invested. When the Fund engages in when-issued or delayed delivery transactions, it relies on the buyer or seller, as the case may be, to complete the transaction. Their failure to do so may cause the Fund to lose the opportunity to obtain or dispose of the security at a price and yield it considers advantageous. The Fund may also sell securities that it purchased on a when-issued basis or forward commitment prior to settlement of the original purchase.
At period end, the Fund had purchased securities issued on a when-issued or delayed delivery basis and sold securities issued on a delayed delivery basis as follows:
26 OPPENHEIMER CORE BOND FUND/VA
4. Investments and Risks (Continued)
| When-Issued or Delayed Delivery Basis Transactions | ||
|
| ||
| Purchased securities |
$50,758,581 | |
| Sold securities |
8,506,658 | |
The Fund may enter into “forward roll” transactions with respect to mortgage-related securities. In this type of transaction, the Fund sells a mortgage-related security to a buyer and simultaneously agrees to repurchase a similar security (same type, coupon and maturity) at a later date at a set price. During the period between the sale and the repurchase, the Fund will not be entitled to receive interest and principal payments on the securities that have been sold. The Fund records the incremental difference between the forward purchase and sale of each forward roll as realized gain (loss) on investments or as fee income in the case of such transactions that have an associated fee in lieu of a difference in the forward purchase and sale price.
Forward roll transactions may be deemed to entail embedded leverage since the Fund purchases mortgage-related securities with extended settlement dates rather than paying for the securities under a normal settlement cycle. This embedded leverage increases the Fund’s market value of investments relative to its net assets which can incrementally increase the volatility of the Fund’s performance. Forward roll transactions can be replicated over multiple settlement periods.
Risks of entering into forward roll transactions include the potential inability of the counterparty to meet the terms of the agreement; the potential of the Fund to receive inferior securities at redelivery as compared to the securities sold to the counterparty; and counterparty credit risk.
5. Market Risk Factors
The Fund’s investments in securities and/or financial derivatives may expose the Fund to various market risk factors:
Commodity Risk. Commodity risk relates to the change in value of commodities or commodity indexes as they relate to increases or decreases in the commodities market. Commodities are physical assets that have tangible properties. Examples of these types of assets are crude oil, heating oil, metals, livestock, and agricultural products.
Credit Risk. Credit risk relates to the ability of the issuer of debt to meet interest and principal payments, or both, as they come due. In general, lower-grade, higher-yield debt securities are subject to credit risk to a greater extent than lower-yield, higher-quality securities.
Equity Risk. Equity risk relates to the change in value of equity securities as they relate to increases or decreases in the general market.
Foreign Exchange Rate Risk. Foreign exchange rate risk relates to the change in the U.S. dollar value of a security held that is denominated in a foreign currency. The U.S. dollar value of a foreign currency denominated security will decrease as the dollar appreciates against the currency, while the U.S. dollar value will increase as the dollar depreciates against the currency.
Interest Rate Risk. Interest rate risk refers to the fluctuations in value of fixed-income securities resulting from the inverse relationship between price and yield. For example, an increase in general interest rates will tend to reduce the market value of already issued fixed-income investments, and a decline in general interest rates will tend to increase their value. In addition, debt securities with longer maturities, which tend to have higher yields, are subject to potentially greater fluctuations in value from changes in interest rates than obligations with shorter maturities.
Volatility Risk. Volatility risk refers to the magnitude of the movement, but not the direction of the movement, in a financial instrument’s price over a defined time period. Large increases or decreases in a financial instrument’s price over a relative time period typically indicate greater volatility risk, while small increases or decreases in its price typically indicate lower volatility risk.
6. Use of Derivatives
The Fund’s investment objective not only permits the Fund to purchase investment securities, it also allows the Fund to enter into various types of derivatives contracts, including, but not limited to, futures contracts, forward currency exchange contracts, credit default swaps, interest rate swaps, total return swaps, variance swaps and purchased and written options. In doing so, the Fund will employ strategies in differing combinations to permit it to increase, decrease, or change the level or types of exposure to market risk factors. These instruments may allow the Fund to pursue its objectives more quickly and efficiently than if it were to make direct purchases or sales of securities capable of effecting a similar response to market factors. Such contracts may be entered into through a bilateral over-the-counter (“OTC”) transaction, or through a securities or futures exchange and cleared through a clearinghouse.
Derivatives may have little or no initial cash investment relative to their market value exposure and therefore can produce significant gains or losses in excess of their cost due to unanticipated changes in the market risk factors and the overall market. This use of embedded leverage allows the Fund to increase its market value exposure relative to its net assets and can substantially increase the volatility of the Fund’s performance. In instances where the Fund is using derivatives to decrease, or hedge, exposures to market risk factors for securities held by the Fund, there are also risks that those derivatives may not perform as expected resulting in losses for the combined or hedged positions. Some derivatives have the potential for unlimited loss, regardless of the size of the Fund’s initial investment.
Additional associated risks from investing in derivatives also exist and potentially could have significant effects on the valuation of the derivative and the Fund. Typically, the associated risks are not the risks that the Fund is attempting to increase or decrease exposure to, per its investment objectives, but are the additional risks from investing in derivatives. Examples of these associated risks are liquidity risk, which is the risk that the Fund will not be able to sell the derivative in the open market in a timely manner, and counterparty credit risk, which is the risk that the counterparty will not fulfill its obligation to the Fund.
The Fund’s actual exposures to these market risk factors and associated risks during the period are discussed in further detail, by derivative type,
27 OPPENHEIMER CORE BOND FUND/VA
NOTES TO FINANCIAL STATEMENTS Unaudited / Continued
6. Use of Derivatives (Continued)
below.
Futures Contracts
A futures contract is a commitment to buy or sell a specific amount of a commodity, financial instrument or currency at a negotiated price on a stipulated future date. The Fund may buy and sell futures contracts and may also buy or write put or call options on these futures contracts. Futures contracts and options thereon are generally entered into on a regulated futures exchange and cleared through a clearinghouse associated with the exchange.
Upon entering into a futures contract, the Fund is required to deposit either cash or securities (initial margin) in an amount equal to a certain percentage of the contract value in an account registered in the futures commission merchant’s name. Subsequent payments (variation margin) are paid to or from the futures commission merchant each day equal to the daily changes in the contract value. Such payments are recorded as unrealized gains and losses. Should the Fund fail to make requested variation margin payments, the futures commission merchant can gain access to the initial margin to satisfy the Fund’s payment obligations.
Futures contracts are reported on a schedule following the Statement of Investments. Securities held by a futures commission merchant to cover initial margin requirements on open futures contracts are noted in the Statement of Investments. Cash held by a futures commission merchant to cover initial margin requirements on open futures contracts and the receivable and/or payable for the daily mark to market for the variation margin are noted in the Statement of Assets and Liabilities. The net change in unrealized appreciation and depreciation is reported in the Statement of Operations. Realized gains (losses) are reported in the Statement of Operations at the closing or expiration of futures contracts.
The Fund has purchased futures contracts on various bonds and notes to increase exposure to interest rate risk.
The Fund has sold futures contracts on various bonds and notes to decrease exposure to interest rate risk.
During the reporting period, the Fund had an ending monthly average market value of $15,761,783 and $14,409,000 on futures contracts purchased and sold, respectively.
Additional associated risks of entering into futures contracts (and related options) include the possibility that there may be an illiquid market where the Fund is unable to liquidate the contract or enter into an offsetting position and, if used for hedging purposes, the risk that the price of the contract will correlate imperfectly with the prices of the Fund’s securities.
Option Activity
The Fund may buy and sell put and call options, or write put and call options. When an option is written, the Fund receives a premium and becomes obligated to sell or purchase the underlying security, currency or other underlying financial instrument at a fixed price, upon exercise of the option.
Options can be traded through an exchange or through a privately negotiated arrangement with a dealer in an OTC transaction. Options traded through an exchange are generally cleared through a clearinghouse (such as The Options Clearing Corporation). The difference between the premium received or paid, and market value of the option, is recorded as unrealized appreciation or depreciation. The net change in unrealized appreciation or depreciation is reported in the Statement of Operations. When an option is exercised, the cost of the security purchased or the proceeds of the security sale are adjusted by the amount of premium received or paid. Upon the expiration or closing of the option transaction, a gain or loss is reported in the Statement of Operations.
The Fund has purchased call options on treasury and/or euro futures to increase exposure to interest rate risk. A purchased call option becomes more valuable as the price of the underlying financial instrument appreciates relative to the strike price.
The Fund has purchased put options on treasury and/or euro futures to decrease exposure to interest rate risk. A purchased put option becomes more valuable as the price of the underlying financial instrument depreciates relative to the strike price.
During the reporting period, the Fund had an ending monthly average market value of $67,945 and $341 on purchased call options and purchased put options, respectively.
Options written, if any, are reported in a schedule following the Statement of Investments and as a liability in the Statement of Assets and Liabilities. Securities held in collateral accounts to cover potential obligations with respect to outstanding written options are noted in the Statement of Investments.
The risk in writing a call option is that the market price of the security increases and if the option is exercised, the Fund must either purchase the security at a higher price for delivery or, if the Fund owns the underlying security, give up the opportunity for profit. The risk in writing a put option is that the Fund may incur a loss if the market price of the security decreases and the option is exercised. The risk in buying an option is that the Fund pays a premium whether or not the option is exercised. The Fund also has the additional risk that there may be an illiquid market where the Fund is unable to close the contract.
The Fund has written put options on treasury and/or euro futures to increase exposure to interest rate risk. A written put option becomes more valuable as the price of the underlying financial instrument appreciates relative to the strike price.
During the reporting period, the Fund had an ending monthly average market value of $3,052 on written put options.
Additional associated risks to the Fund include counterparty credit risk and liquidity risk.
At period end the fund had no outstanding written options.
Counterparty Credit Risk. Derivative positions are subject to the risk that the counterparty will not fulfill its obligation to the Fund. The Fund intends to enter into derivative transactions with counterparties that the Manager believes to be creditworthy at the time of the transaction.
The Fund’s risk of loss from counterparty credit risk on OTC derivatives is generally limited to the aggregate unrealized gain netted against any collateral held by the Fund. For OTC options purchased, the Fund bears the risk of loss of the amount of the premiums paid plus the positive change
28 OPPENHEIMER CORE BOND FUND/VA
6. Use of Derivatives (Continued)
in market values net of any collateral held by the Fund should the counterparty fail to perform under the contracts. Options written by the Fund do not typically give rise to counterparty credit risk, as options written generally obligate the Fund and not the counterparty to perform.
To reduce counterparty risk with respect to OTC transactions, the Fund has entered into master netting arrangements, established within the Fund’s International Swap and Derivatives Association, Inc. (“ISDA”) master agreements, which allow the Fund to make (or to have an entitlement to receive) a single net payment in the event of default (close-out netting) for outstanding payables and receivables with respect to certain OTC positions in swaps, options, swaptions, and forward currency exchange contracts for each individual counterparty. In addition, the Fund may require that certain counterparties post cash and/or securities in collateral accounts to cover their net payment obligations for those derivative contracts subject to ISDA master agreements. If the counterparty fails to perform under these contracts and agreements, the cash and/or securities will be made available to the Fund.
ISDA master agreements include credit related contingent features which allow counterparties to OTC derivatives to terminate derivative contracts prior to maturity in the event that, for example, the Fund’s net assets decline by a stated percentage or the Fund fails to meet the terms of its ISDA master agreements, which would cause the Fund to accelerate payment of any net liability owed to the counterparty.
For financial reporting purposes, the Fund does not offset derivative assets and derivative liabilities that are subject to netting arrangements in the Statement of Assets and Liabilities. Bankruptcy or insolvency laws of a particular jurisdiction may impose restrictions on or prohibitions against the right of offset in bankruptcy, insolvency or other events.
The Fund’s risk of loss from counterparty credit risk on exchange-traded derivatives cleared through a clearinghouse and for centrally cleared swaps is generally considered lower than as compared to OTC derivatives. However, counterparty credit risk exists with respect to initial and variation margin deposited/paid by the Fund that is held in futures commission merchant, broker and/or clearinghouse accounts for such exchange-traded derivatives and for centrally cleared swaps.
With respect to centrally cleared swaps, such transactions will be submitted for clearing, and if cleared, will be held in accounts at futures commission merchants or brokers that are members of clearinghouses. While brokers, futures commission merchants and clearinghouses are required to segregate customer margin from their own assets, in the event that a broker, futures commission merchant or clearinghouse becomes insolvent or goes into bankruptcy and at that time there is a shortfall in the aggregate amount of margin held by the broker, futures commission merchant or clearinghouse for all its customers, U.S. bankruptcy laws will typically allocate that shortfall on a pro-rata basis across all the broker’s, futures commission merchant’s or clearinghouse’s customers, potentially resulting in losses to the Fund.
There is the risk that a broker, futures commission merchant or clearinghouse will decline to clear a transaction on the Fund’s behalf, and the Fund may be required to pay a termination fee to the executing broker with whom the Fund initially enters into the transaction. Clearinghouses may also be permitted to terminate centrally cleared swaps at any time. The Fund is also subject to the risk that the broker or futures commission merchant will improperly use the Fund’s assets deposited/paid as initial or variation margin to satisfy payment obligations of another customer. In the event of a default by another customer of the broker or futures commission merchant, the Fund might not receive its variation margin payments from the clearinghouse, due to the manner in which variation margin payments are aggregated for all customers of the broker/futures commission merchant.
Collateral and margin requirements differ by type of derivative. Margin requirements are established by the broker, futures commission merchant or clearinghouse for exchange-traded and cleared derivatives, including centrally cleared swaps. Brokers, futures commission merchants and clearinghouses can ask for margin in excess of the regulatory minimum, or increase the margin amount, in certain circumstances.
Collateral terms are contract specific for OTC derivatives. For derivatives traded under an ISDA master agreement, the collateral requirements are typically calculated by netting the mark to market amount for each transaction under such agreement and comparing that amount to the value of any collateral currently pledged by the Fund or the counterparty.
For financial reporting purposes, cash collateral that has been pledged to cover obligations of the Fund, if any, is reported separately on the Statement of Assets and Liabilities as cash pledged as collateral. Non-cash collateral pledged by the Fund, if any, is noted in the Statement of Investments. Generally, the amount of collateral due from or to a party must exceed a minimum transfer amount threshold (e.g. $250,000) before a transfer has to be made. To the extent amounts due to the Fund from its counterparties are not fully collateralized, contractually or otherwise, the Fund bears the risk of loss from counterparty nonperformance.
The following table presents by counterparty the Fund’s OTC derivative assets net of the related collateral pledged by the Fund at period end:
| Gross Amounts Not Offset in the Statement of Assets & Liabilities | ||||||||||||||||||||
| Counterparty | Gross Amounts Not Offset in the Statement of Assets & Liabilities* |
Financial Instruments Available for Offset |
Financial Instruments Collateral Received** |
Cash Collateral Received** |
Net Amount | |||||||||||||||
|
|
||||||||||||||||||||
| Bank of America NA | $ | 147,332 | $ | – | $ | – | $ | – | $ | 147,332 | ||||||||||
| Citibank NA | 68,405 | – | – | – | 68,405 | |||||||||||||||
|
|
|
|||||||||||||||||||
| $ | 215,737 | $ | – | $ | – | $ | – | $ | 215,737 | |||||||||||
|
|
|
|||||||||||||||||||
*OTC derivatives are reported gross on the Statement of Assets and Liabilities. Exchange traded options and margin related to centrally cleared swaps and futures are excluded from these reported amounts.
**Reported collateral posted for the benefit of the Fund within this table is limited to the net outstanding amount due from an individual counterparty. The collateral posted for the benefit of the Fund may exceed these amounts.
The following table presents the valuations of derivative instruments by risk exposure as reported within the Statement of Assets and Liabilities at period end:
29 OPPENHEIMER CORE BOND FUND/VA
NOTES TO FINANCIAL STATEMENTS Unaudited / Continued
6. Use of Derivatives (Continued)
| Asset Derivatives | Liability Derivatives | |||||||||||||||
| Derivatives Not Accounted for as Hedging Instruments |
Statement of Assets and Liabilities Location |
Value | Statement of Assets and Liabilities Location |
Value | ||||||||||||
|
|
||||||||||||||||
| Interest rate contracts |
Variation margin receivable | $ | 38,496* | Variation margin payable | $ | 60,719* | ||||||||||
| Interest rate contracts |
Investments, at value | 215,737** | ||||||||||||||
|
|
|
|
|
|||||||||||||
| Total |
$ | 254,233 | $ | 60,719 | ||||||||||||
|
|
|
|
|
|||||||||||||
*Includes only the current day’s variation margin. Prior variation margin movements have been reflected in cash on the Statement of Assets and Liabilities upon receipt or payment.
**Amounts relate to purchased option contracts and purchased swaption contracts.
The effect of derivative instruments on the Statement of Operations is as follows:
| Amount of Realized Gain or (Loss) Recognized on Derivatives |
||||||||||||
| Derivatives | Investment | Closing and | ||||||||||
| Not Accounted | from | expiration | ||||||||||
| for as Hedging | unaffiliated | of futures | ||||||||||
| Instruments | companies* | contracts | Total | |||||||||
|
|
||||||||||||
| Interest rate contracts |
$ | (63,543) | $ | 120,796 | $ | 57,253 | ||||||
*Includes purchased option contracts, purchased swaption contracts, written option contracts exercised and written swaption contracts exercised, if any.
| Amount of Change in Unrealized Gain or (Loss) Recognized on Derivatives |
||||||||||||
| Derivatives | ||||||||||||
| Not Accounted | ||||||||||||
| for as Hedging | Futures | |||||||||||
| Instruments | Investments* | contracts | Total | |||||||||
|
|
||||||||||||
| Interest rate contracts |
$ | 60,917 | $ | 557,172 | $ | 618,089 | ||||||
*Includes purchased option contracts and purchased swaption contracts, if any.
7. Shares of Beneficial Interest
The Fund has authorized an unlimited number of $0.001 par value shares of beneficial interest of each class. Transactions in shares of beneficial interest were as follows:
| Six Months Ended June 30, 2016 | Year Ended December 31, 2015 | |||||||||||||||||||
| Shares | Amount | Shares | Amount | |||||||||||||||||
|
|
||||||||||||||||||||
| Non-Service Shares |
||||||||||||||||||||
| Sold |
875,210 | $ | 6,915,912 | 1,062,552 | $ | 8,456,159 | ||||||||||||||
| Dividends and/or distributions reinvested |
420,198 | 3,248,135 | 476,892 | 3,667,301 | ||||||||||||||||
| Redeemed |
(925,116) | (7,272,220) | (1,900,400) | (14,956,838) | ||||||||||||||||
|
|
|
|||||||||||||||||||
| Net increase (decrease) |
370,292 | $ | 2,891,827 | (360,956) | $ | (2,833,378) | ||||||||||||||
|
|
|
|||||||||||||||||||
|
|
||||||||||||||||||||
| Service Shares |
||||||||||||||||||||
| Sold |
1,729,552 | $ | 13,430,355 | 2,849,289 | $ | 22,223,803 | ||||||||||||||
| Dividends and/or distributions reinvested |
244,739 | 1,867,358 | 273,246 | 2,079,404 | ||||||||||||||||
| Redeemed |
(1,843,509) | (14,239,477) | (2,925,634) | (22,757,563) | ||||||||||||||||
|
|
|
|||||||||||||||||||
| Net increase |
130,782 | $ | 1,058,236 | 196,901 | $ | 1,545,644 | ||||||||||||||
|
|
|
|||||||||||||||||||
8. Purchases and Sales of Securities
The aggregate cost of purchases and proceeds from sales of securities, other than short-term obligations and investments in IMMF, for the reporting period were as follows:
| Purchases | Sales | |||||||
|
|
||||||||
| Investment securities |
$45,746,670 | $43,053,286 | ||||||
| U.S. government and government agency obligations |
615,831 | 1,153,338 | ||||||
| To Be Announced (TBA) mortgage-related securities |
330,077,334 | 325,582,368 | ||||||
9. Fees and Other Transactions with Affiliates
Management Fees. Under the investment advisory agreement, the Fund pays the Manager a management fee based on the daily net assets of the Fund at an annual rate as shown in the following table:
30 OPPENHEIMER CORE BOND FUND/VA
9. Fees and Other Transactions with Affiliates (Continued)
| Fee Schedule | ||||
|
| ||||
| Up to $1 billion |
0.60% | |||
| Over $1 billion |
0.50 | |||
The Fund’s effective management fee for the reporting period was 0.60% of average annual net assets before any applicable waivers.
Sub-Adviser Fees. The Manager has retained the Sub-Adviser to provide the day-to-day portfolio management of the Fund. Under the Sub-Advisory Agreement, the Manager pays the Sub-Adviser an annual fee in monthly installments, equal to a percentage of the investment management fee collected by the Manager from the Fund, which shall be calculated after any investment management fee waivers. The fee paid to the Sub-Adviser is paid by the Manager, not by the Fund.
Transfer Agent Fees. OFI Global (the “Transfer Agent”) serves as the transfer and shareholder servicing agent for the Fund. The Fund pays the Transfer Agent a fee based on annual net assets. Fees incurred and average net assets for each class with respect to these services are detailed in the Statement of Operations and Financial Highlights, respectively.
Sub-Transfer Agent Fees. The Transfer Agent has retained Shareholder Services, Inc., a wholly-owned subsidiary of OFI (the “Sub-Transfer Agent”), to provide the day-to-day transfer agent and shareholder servicing of the Fund. Under the Sub-Transfer Agency Agreement, the Transfer Agent pays the Sub-Transfer Agent an annual fee in monthly installments, equal to a percentage of the transfer agent fee collected by the Transfer Agent from the Fund, which shall be calculated after any applicable fee waivers. The fee paid to the Sub-Transfer Agent is paid by the Transfer Agent, not by the Fund.
Trustees’ Compensation. The Fund’s Board of Trustees (“Board”) has adopted a compensation deferral plan for Independent Trustees that enables Trustees to elect to defer receipt of all or a portion of the annual compensation they are entitled to receive from the Fund. For purposes of determining the amount owed to the Trustees under the plan, deferred amounts are treated as though equal dollar amounts had been invested in shares of the Fund or in other Oppenheimer funds selected by the Trustees. The Fund purchases shares of the funds selected for deferral by the Trustees in amounts equal to his or her deemed investment, resulting in a Fund asset equal to the deferred compensation liability. Such assets are included as a component of “Other” within the asset section of the Statement of Assets and Liabilities. Deferral of Trustees’ fees under the plan will not affect the net assets of the Fund and will not materially affect the Fund’s assets, liabilities or net investment income per share. Amounts will be deferred until distributed in accordance with the compensation deferral plan.
Distribution and Service Plan for Service Shares. The Fund has adopted a Distribution and Service Plan (the “Plan”) pursuant to Rule 12b-1 under the 1940 Act for Service shares to pay OppenheimerFunds Distributor, Inc. (the “Distributor”), for distribution related services, personal service and account maintenance for the Fund’s Service shares. Under the Plan, payments are made periodically at an annual rate of 0.25% of the daily net assets of Service shares of the Fund. The Distributor currently uses all of those fees to compensate sponsors of the insurance product that offers Fund shares, for providing personal service and maintenance of accounts of their variable contract owners that hold Service shares. These fees are paid out of the Fund’s assets on an on-going basis and increase operating expenses of the Service shares, which results in lower performance compared to the Fund’s shares that are not subject to a service fee. Fees incurred by the Fund under the Plan are detailed in the Statement of Operations.
Waivers and Reimbursements of Expenses. The Manager has contractually agreed to limit the Fund’s expenses after payments, waivers and/or reimbursements and reduction to custodian expenses, excluding expenses incurred directly or indirectly by the Fund as a result of investments in other investment companies, wholly-owned subsidiaries and pooled investment vehicles; so that those expenses, as percentages of daily net assets, will not exceed the annual rate of 0.75% for Non-Service shares and 1.00% for Service shares. The expense limitations do not include interest and fees from borrowing, and other expenses not incurred in the ordinary course of the Fund’s business. During the reporting period, the Manager waived fees and/or reimbursed the Fund $28,226 and $16,800 for Non-Service and Service shares, respectively.
The Manager will waive fees and/or reimburse Fund expenses in an amount equal to the indirect management fees incurred through the Fund’s investment in IMMF. During the reporting period, the Manager waived fees and/or reimbursed the Fund $10,044 for IMMF management fees.
Waivers and/or reimbursements may be modified or terminated as set forth according to the terms in the prospectus.
10. Borrowings and Other Financing
Joint Credit Facility. A number of mutual funds managed by the Manager participate in a $1.28 billion revolving credit facility (the “Facility”) intended to provide short-term financing, if necessary, subject to certain restrictions in connection with atypical redemption activity. Expenses and fees related to the Facility are paid by the participating funds and are disclosed separately or as other expenses on the Statement of Operations. The Fund did not utilize the Facility during the reporting period.
11. Pending Litigation
In 2009, several putative class action lawsuits were filed and later consolidated before the U.S. District Court for the District of Colorado against OppenheimerFunds, Inc. (“OFI”), OppenheimerFunds Distributor, Inc. (“OFDI”), and Oppenheimer Rochester California Municipal Fund, a fund advised by OFI Global Asset Management, Inc. and distributed by the Distributor (the “California Fund”), in connection with the California Fund’s investment
31 OPPENHEIMER CORE BOND FUND/VA
NOTES TO FINANCIAL STATEMENTS Unaudited / Continued
11. Pending Litigation (Continued)
performance. The plaintiffs asserted claims against OFI, OFDI and certain present and former trustees and officers of the California Fund under the federal securities laws, alleging, among other things, that the disclosure documents of the California Fund contained misrepresentations and omissions and the investment policies of the California Fund were not followed. Plaintiffs in the suit filed an amended complaint and defendants filed a motion to dismiss. In 2011, the court issued an order which granted in part and denied in part the defendants’ motion to dismiss. In 2012, plaintiffs filed a motion, which defendants opposed, to certify a class and appoint class representatives and class counsel. In March 2015, the court granted plaintiffs’ motion for class certification. In May 2015, the U.S. Court of Appeals for the Tenth Circuit vacated the class certification order and remanded the matter to the district court for further proceedings. In October 2015, the district court reaffirmed its order and determined that the suit will proceed as a class action. In December 2015, the Tenth Circuit denied defendants’ petition to appeal the district court’s reaffirmed class certification order.
OFI and OFDI believe the suit is without merit; that it is premature to render any opinion as to the likelihood of an outcome unfavorable to them in the suit; and that no estimate can yet be made as to the amount or range of any potential loss. Furthermore, OFI believes that the suit should not impair the ability of OFI or OFDI to perform their respective duties to the Fund and that the outcome of the suit should not have any material effect on the operations of any of the Oppenheimer funds.
32 OPPENHEIMER CORE BOND FUND/VA
PORTFOLIO PROXY VOTING POLICIES AND GUIDELINES; UPDATES TO STATEMENTS OF INVESTMENTS Unaudited
The Fund has adopted Portfolio Proxy Voting Policies and Guidelines under which the Fund votes proxies relating to securities (“portfolio proxies”) held by the Fund. A description of the Fund’s Portfolio Proxy Voting Policies and Guidelines is available (i) without charge, upon request, by calling the Fund toll-free at 1.800.525.7048, (ii) on the Fund’s website at www.oppenheimerfunds.com, and (iii) on the SEC’s website at www.sec.gov. In addition, the Fund is required to file Form N-PX, with its complete proxy voting record for the 12 months ended June 30th, no later than August 31st of each year. The Fund’s voting record is available (i) without charge, upon request, by calling the Fund toll-free at 1.800.525.7048, and (ii) in the Form N-PX filing on the SEC’s website at www.sec.gov.
The Fund files its complete schedule of portfolio holdings with the SEC for the first quarter and the third quarter of each fiscal year on Form N-Q. The Fund’s Form N-Q filings are available on the SEC’s website at www.sec.gov. Those forms may be reviewed and copied at the SEC’s Public Reference Room in Washington, D.C. Information on the operation of the Public Reference Room may be obtained by calling 1-800-SEC-0330.
33 OPPENHEIMER CORE BOND FUND/VA
DISTRIBUTION SOURCES Unaudited
For any distribution that took place over the Fund’s reporting period, the table below details on a per-share basis the percentage of the Fund’s total distribution payment amount that was derived from the following sources: net income, net profit from the sale of securities, and other capital sources. This information is based upon income and capital gains using generally accepted accounting principles as of the date of each distribution. Because the Fund is actively managed, the relative amount of the Fund’s total distributions derived from various sources over the calendar year may change. Please note that this information should not be used for tax reporting purposes as the tax character of distributable income may differ from the amounts used for this notification. You will receive IRS tax forms in the first quarter of each calendar year detailing the actual amount of the taxable and non-taxable portion of distributions paid to you during the tax year.
For the most current information, please go to oppenheimerfunds.com. Select your Fund, then the ‘Detailed’ tab; where ‘Dividends’ are shown, the Fund’s latest pay date will be followed by the sources of any distribution, updated daily.
| Fund Name | Pay | Net Income | Net Profit | Other | ||||||||||
| Date | from Sale | Capital | ||||||||||||
| Sources | ||||||||||||||
| Oppenheimer Core Bond Fund/VA |
6/21/16 | 87.9% | 0.0% | 12.1% | ||||||||||
34 OPPENHEIMER CORE BOND FUND/VA
THIS PAGE INTENTIONALLY LEFT BLANK.
35 OPPENHEIMER CORE BOND FUND/VA
OPPENHEIMER CORE BOND FUND/VA
A Series of Oppenheimer Variable Account Funds
| Trustees and Officers | Sam Freedman, Chairman of the Board of Trustees and Trustee | |
| Jon S. Fossel, Trustee | ||
| Richard F. Grabish, Trustee | ||
| Beverly L. Hamilton, Trustee | ||
| Victoria J. Herget, Trustee | ||
| Robert J. Malone, Trustee | ||
| F. William Marshall, Jr., Trustee | ||
| Karen L. Stuckey, Trustee | ||
| James D. Vaughn, Trustee | ||
| Arthur P. Steinmetz, Trustee, President and Principal Executive Officer | ||
| Krishna Memani, Vice President | ||
| Peter A. Strzalkowski, Vice President | ||
| Cynthia Lo Bessette, Secretary and Chief Legal Officer | ||
| Jennifer Sexton, Vice President and Chief Business Officer | ||
| Mary Ann Picciotto, Chief Compliance Officer and Chief Anti-Money Laundering Officer | ||
| Brian S. Petersen, Treasurer and Principal Financial & Accounting Officer | ||
| Manager | OFI Global Asset Management, Inc. | |
| Sub-Adviser | OppenheimerFunds, Inc. | |
| Distributor | OppenheimerFunds Distributor, Inc. | |
| Transfer and Shareholder Servicing Agent |
OFI Global Asset Management, Inc. | |
| Sub-Transfer Agent | Shareholder Services, Inc. | |
| DBA OppenheimerFunds Services | ||
| Independent Registered Public Accounting Firm |
KPMG LLP | |
| Legal Counsel | Ropes & Gray LLP | |
| Before investing in any of the Oppenheimer funds, investors should carefully consider a fund’s investment objectives, risks, charges and expenses. Fund prospectuses and summary prospectuses contain this and other information about the funds, and may be obtained by asking your financial advisor, or calling us at 1.800.988.8287. Read prospectuses and summary prospectuses carefully before investing. | ||
| The financial statements included herein have been taken from the records of the Fund without examination of those records by the independent registered public accounting firm. | ||
| © 2016 OppenheimerFunds, Inc. All rights reserved. Oppenheimer funds are distributed by OppenheimerFunds Distributor, Inc. | ||

|
|
||||
| June 30, 2016 |
||||
|
Oppenheimer |
||||
| Global Fund/VA |
Semiannual Report | |||
| A Series of Oppenheimer Variable Account Funds
|
||||
| SEMIANNUAL REPORT |
||||
| Listing of Top Holdings |
||||
| Fund Performance Discussion |
||||
| Financial Statements |
||||

PORTFOLIO MANAGER: Rajeev Bhaman, CFA
AVERAGE ANNUAL TOTAL RETURNS FOR THE PERIODS ENDED 6/30/16
| Inception Date |
6-Months | 1-Year | 5-Year | 10-Year | ||||||||||||||||
|
Non-Service Shares |
11/12/90 | -8.18% | -13.46% | 5.15% | 4.91% | |||||||||||||||
|
Service Shares |
7/13/00 | -8.29 | -13.68 | 4.89 | 4.64 | |||||||||||||||
|
MSCI All Country World Index |
1.23 | -3.73 | 5.38 | 4.26 | ||||||||||||||||
Performance data quoted represents past performance, which does not guarantee future results. The investment return and principal value of an investment in the Fund will fluctuate so that an investor’s shares, when redeemed, may be worth more or less than their original cost. Current performance may be lower or higher than the performance quoted. For performance data current to the most recent month end, call us at 1.800.988.8287. The Fund’s total returns include changes in share price and reinvested distributions but should not be expected to be the same as the returns of other funds, whether or not both funds have the same portfolio managers and/or similar names. The Fund’s total returns do not include the charges associated with the separate account products that offer this Fund. Such performance would have been lower if such charges were taken into account.
The Fund’s performance is compared to the performance of the MSCI All Country (AC) World Index, a free float-adjusted market capitalization weighted index that is designed to measure the equity market performance of developed and emerging markets. The Index is unmanaged and cannot be purchased directly by investors. While index comparisons may be useful to provide a benchmark for the Fund’s performance, it must be noted that the Fund’s investments are not limited to the investments comprising the Index. Index performance includes reinvestment of income, but does not reflect transaction costs, fees, expenses or taxes. Index performance is shown for illustrative purposes only as a benchmark for the Fund’s performance, and does not predict or depict performance of the Fund. The Fund’s performance reflects the effects of the Fund’s business and operating expenses.
TOP HOLDINGS AND ALLOCATIONS
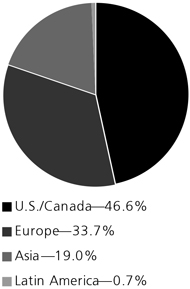
2 OPPENHEIMER GLOBAL FUND/VA
Fund Performance Discussion
For the period ended June 30, 2016, the Fund’s Non-Service shares returned -8.18% versus the MSCI All Country World Index, its benchmark, which returned 1.23%. The year thus far has truly been an annus horribilis. After a reasonable 2015, where the Fund meaningfully outperformed its benchmark, the new year has proven to be completely the opposite. The market dislocation that resulted from expectations of the Federal Reserve (the “Fed”) raising rates this year led to a severe underperformance of all things growth related. Perceived safety and stability were sought after as were the dogs of the previous year. This meant that the best performing segments of the market were utilities, commodities and all things bond-like. Oil rebounded from its year end lows and brought hope to some that we were in for a return to prices seen in early 2015. We believe that it is unlikely. Our orientation towards long-term growth companies has not been the flavor of the semester. The political season too has hurt some of our companies, particularly in health care where the posturing over price controls and eagerness to demonstrate populist rhetoric has particularly hurt the biotechnology sector. We have not helped ourselves either by our choice of European financials, which have been a disaster, as European policy makers seem not to be able to get out of their own way and exacerbate the crisis in financials that has continued for the better part of this decade.
MARKET REVIEW
The market of the past few months can be characterized by W.B. Yeats’ words in his poem, The Second Coming, “the best lack all conviction while the worst are full of passionate intensity.” An unwillingness to consider a future that isn’t dire led to what is often called a “risk-off” market, where businesses that have a larger proportion of their value in future growth came into disfavor. Concerns over the Fed raising rates in the short term combined with low growth in the world benefited stable earners such as utilities and punished companies that are options on future growth such as biotechnology firms. A turn in oil prices off the bottom in the first quarter led to outperformance in commodity stocks that had been massively oversold. The woes of the financial sector continued, with market activity and risk tolerance massively attenuated, especially in Europe, and ongoing litigation and capital regulation. Regulators have provided no relief to the uncertainty around increased future capital requirements, which has put pressure on fees and earnings. Further, zealous prosecutors still seem to find ways of increasing fines and penalties on the financial sector for the misdeeds, both actual and supposed, of the past. This too has detracted from confidence in the markets.
Currencies have performed in line with the underlying economic trends in the various regions. The dollar has been strong. The euro and pound sterling weakened particularly with Brexit – the British public’s referendum decision to exit the European Union. This causes nothing but uncertainty in the near term and adds to underlying volatility in markets. The commodity currencies of Australia and Canada have followed the fortunes of oil with significant declines as oil fell to $30 per barrel but have come back as oil moved back into the $40’s. The Japanese yen strengthened substantially from 120 yen to the dollar to almost 100 yen, which is not going to help Japanese exporters. Emerging markets currencies have also been mixed with significant gains in the Brazilian real as the belief that the impeachment of President Dilma Rousseff would lead to better policies, stability in the Chinese renminbi despite worries of a serious devaluation to come, and weakness in the South African rand.
The interest rate environment has been for lower rates almost everywhere, with government debt in Japan, Switzerland and Germany even yielding negative rates across various tenors. U.S. Government paper still seems to offer a positive coupon and lower credits coming with fatter spreads to Treasuries. This may change.
FUND REVIEW
Our pivot to cheap European financials was met with a hefty smack upside the head. Our confidence in the scientific prowess of the drug discovery engines of the 21st century was trampled on by the stampede to the exit door with the hearing of the murmurs of Fed rate rises and the increased eagerness to promise free products and services, even life preserving high cost medicines upon which billions of dollars of risk capital have been ventured. These were the cause of much of our woes though not the only ones. Our lack of conviction in wishing to own utilities, regulated or other, and other bond proxies hurt too as these were the sectors that performed best. Our structural bet against commodities, which helped in 2015, had the opposite impact in 2016. Quality and growth orientation seemed to attract opprobrium not salutes. We compounded these problems with a couple of stand-out poor performing investments especially with SunEdison and Banca Monte dei Paschi Di Siena. The former stumbled its way towards bankruptcy while the latter is still hostage to the archaic and arcane Italian laws that prevent banks from collecting on the collateral that backs granted credit. There seems to be a willingness to legislatively move in the right direction but it is not a given. In mitigation, these risk positions were sized below 1% of the portfolio. We had a couple of failures in drug trials of our Pharma companies with Circassia Pharmaceutical’s cat allergy vaccine showing no benefit versus the placebo, and a couple of drug candidates at Bluebird Bio, BioMarin Pharmaceutical, and
3 OPPENHEIMER GLOBAL FUND/VA
Celldex Therapeutics, all showing no clear benefit versus placebo. In many of these cases it was not that the drug did not show benefit, it was that the response to placebo was inexplicably good.
There were a couple of positives. Our long held positions in Keyence, a pioneer in sensors and scanners that help manufacturing efficiency; Intuit, the owner of Turbotax and Quickbooks; Aetna, the health insurer along with DLF, the largest owner of quality real estate in the Indian capital region, performed well.
OUTLOOK AND POSITIONING
Our thematic, long-term, investment style leads us towards quality businesses with sustainability of both enterprise and advantaged position. We hope to buy these at prices that do not fully reflect their future value, usually because the current understanding of that value by the market is misestimated for a reason that is temporary. For that, we have to be willing to go against the market’s current beliefs and have deep conviction in the correctness of our view. Unpopularity is a price we are willing to incur for a while.
We see risk of higher rates that is not being priced in the market today at all. We see a belief in the necessity of availability of expensive-to-provide medical treatments for a price that severely undervalues the research effort and risk dollars expended that is unjustified. We see a pessimism and a loss of confidence in structures that have delivered increasing prosperity for over half a century, which we think is unreasonable.
To that end, we are invested greatly in businesses that connect the world - physically and virtually, such as Facebook, Google (Alphabet), United Parcel Service and Airbus; businesses that connect savers with investors and lenders, such as the banks and S&P Global ( the renamed McGraw Hill Financial); businesses that cure intractable diseases and make it more affordable and rational, such as Vertex Pharmaceuticals, Gilead Sciences, Aetna and Anthem; businesses that allow people to spend their hard earned money on things that give them pleasure, such as Walt Disney and LVMH Moet Hennessy Louis Vuitton, and on daily necessities, such as Unilever and Colgate-Palmolive. We also believe that companies that do things that allow businesses and people to be more efficient will continue to be valuable, such as Intuit and PayPal. Where we believe we are advantaged is in seeing these connections and their implementability globally.
We believe deeply in being diversified across a range of businesses across industries and geographies that are the source of opportunity and stability. Our perspective that this should be a fund for all seasons is firm, notwithstanding the last few months.
The Fund’s investment strategy and focus can change over time. The mention of specific fund holdings does not constitute a recommendation by OppenheimerFunds, Inc. or its affiliates.
Shares of Oppenheimer funds are not deposits or obligations of any bank, are not guaranteed by any bank, are not insured by the FDIC or any other agency, and involve investment risks, including the possible loss of the principal amount invested.
4 OPPENHEIMER GLOBAL FUND/VA
Fund Expenses
Fund Expenses. As a shareholder of the Fund, you incur two types of costs: (1) transaction costs and (2) ongoing costs, including management fees; distribution and service fees; and other Fund expenses. These examples are intended to help you understand your ongoing costs (in dollars) of investing in the Fund and to compare these costs with the ongoing costs of investing in other mutual funds.
The examples are based on an investment of $1,000.00 invested at the beginning of the period and held for the entire 6-month period ended June 30, 2016.
Actual Expenses. The first section of the table provides information about actual account values and actual expenses. You may use the information in this section for the class of shares you hold, together with the amount you invested, to estimate the expense that you paid over the period. Simply divide your account value by $1,000.00 (for example, an $8,600.00 account value divided by $1,000.00 = 8.60), then multiply the result by the number in the first section under the heading entitled “Expenses Paid During 6 Months Ended June 30, 2016” to estimate the expenses you paid on your account during this period.
Hypothetical Example for Comparison Purposes.
The second section of the table provides information about hypothetical account values and hypothetical expenses based on the Fund’s actual expense ratio for each class of shares, and an assumed rate of return of 5% per year for each class before expenses, which is not the actual return. The hypothetical account values and expenses may not be used to estimate the actual ending account balance or expenses you paid for the period. You may use this information to compare the ongoing costs of investing in the Fund and other funds. To do so, compare this 5% hypothetical example for the class of shares you hold with the 5% hypothetical examples that appear in the shareholder reports of the other funds.
Please note that the expenses shown in the table are meant to highlight your ongoing costs only and do not reflect any charges associated with the separate accounts that offer this Fund. Therefore, the “hypothetical” lines of the table are useful in comparing ongoing costs only, and will not help you determine the relative total costs of owning different funds. In addition, if these separate account charges were included your costs would have been higher.
| Actual | Beginning Value |
Ending Value |
Expenses Paid During |
|||||||||
| Non-Service shares |
$ | 1,000.00 | $ | 918.20 | $ | 3.68 | ||||||
| Service shares |
1,000.00 | 917.10 | 4.87 | |||||||||
| Hypothetical | ||||||||||||
| (5% return before expenses) | ||||||||||||
| Non-Service shares |
1,000.00 | 1,021.03 | 3.88 | |||||||||
| Service shares |
1,000.00 | 1,019.79 | 5.14 | |||||||||
Expenses are equal to the Fund’s annualized expense ratio for that class, multiplied by the average account value over the period, multiplied by 182/366 (to reflect the one-half year period). Those annualized expense ratios, excluding indirect expenses from affiliated funds, based on the 6-month period ended June 30, 2016 are as follows:
| Class | Expense Ratios | |||||||
| Non-Service shares |
0.77% | |||||||
| Service shares |
1.02 | |||||||
The expense ratios reflect voluntary and/or contractual waivers and/or reimbursements of expenses by the Fund’s Manager. Some of these undertakings may be modified or terminated at any time, as indicated in the Fund’s prospectus. The “Financial Highlights” tables in the Fund’s financial statements, included in this report, also show the gross expense ratios, without such waivers or reimbursements and reduction to custodian expenses, if applicable.
5 OPPENHEIMER GLOBAL FUND/VA
STATEMENT OF INVESTMENTS June 30, 2016 Unaudited
6 OPPENHEIMER GLOBAL FUND/VA
Footnotes to Statement of Investments
1. Non-income producing security.
2. Rate shown is the 7-day yield at period end.
3. Is or was an affiliate, as defined in the Investment Company Act of 1940, as amended, at or during the reporting period, by virtue of the Fund owning at least 5% of the voting securities of the issuer or as a result of the Fund and the issuer having the same investment adviser. Transactions during the reporting period in which the issuer was an affiliate are as follows:
| Shares December 31, 2015 |
Gross Additions |
Gross Reductions |
Shares June 30, 2016 |
|||||||||||||
|
|
||||||||||||||||
| Oppenheimer Institutional Money Market Fund, Cl. E |
20,379,539 | 120,194,241 | 98,610,478 | 41,963,302 | ||||||||||||
| Value | Income | |||||||
|
|
||||||||
| Oppenheimer Institutional Money Market Fund, Cl. E |
$ | 41,963,302 | $ | 36,783 | ||||
| Distribution of investments representing geographic holdings, as a percentage of total investments at value, is as follows: | ||||||||||
| Geographic Holdings | Value | Percent | ||||||||
|
| ||||||||||
| United States |
$ | 1,019,970,457 | 46.6 | % | ||||||
| Japan |
300,771,336 | 13.9 | ||||||||
| Germany |
186,072,396 | 8.6 | ||||||||
| France |
159,553,566 | 7.3 | ||||||||
| United Kingdom |
105,998,905 | 4.9 | ||||||||
| Switzerland |
88,530,337 | 4.1 | ||||||||
| India |
85,388,331 | 4.0 | ||||||||
| Spain |
75,932,542 | 3.5 | ||||||||
| Sweden |
63,319,346 | 2.9 | ||||||||
| Italy |
29,999,457 | 1.4 | ||||||||
| China |
22,789,131 | 1.1 | ||||||||
| Ireland |
14,144,808 | 0.7 | ||||||||
| Brazil |
12,183,248 | 0.6 | ||||||||
| Denmark |
7,045,305 | 0.3 | ||||||||
| Cayman Islands |
2,117,771 | 0.1 | ||||||||
|
|
| |||||||||
| Total |
$ | 2,173,816,936 | 100.0 | % | ||||||
|
|
| |||||||||
See accompanying Notes to Financial Statements.
7 OPPENHEIMER GLOBAL FUND/VA
STATEMENT OF ASSETS AND LIABILITIES June 30, 2016 Unaudited
|
|
||||
| Assets |
||||
| Investments, at value—see accompanying statement of investments: | ||||
| Unaffiliated companies (cost $1,316,535,189) | $ | 2,131,853,634 | ||
| Affiliated companies (cost $41,963,302) | 41,963,302 | |||
|
|
|
|||
| 2,173,816,936 | ||||
|
|
||||
| Cash | 2,141,332 | |||
|
|
||||
| Cash—foreign currencies (cost $113,596) | 116,138 | |||
|
|
||||
| Receivables and other assets: | ||||
| Dividends | 6,410,602 | |||
| Shares of beneficial interest sold | 4,404,016 | |||
| Investments sold | 1,933,736 | |||
| Other | 111,132 | |||
|
|
|
|||
| Total assets | 2,188,933,892 | |||
|
|
||||
| Liabilities |
||||
| Payables and other liabilities: | ||||
| Shares of beneficial interest redeemed | 4,432,428 | |||
| Distribution and service plan fees | 198,770 | |||
| Foreign capital gains tax | 171,385 | |||
| Trustees’ compensation | 93,508 | |||
| Shareholder communications | 75,290 | |||
| Other | 60,699 | |||
|
|
|
|||
| Total liabilities | 5,032,080 | |||
|
|
||||
| Net Assets |
$ | 2,183,901,812 | ||
|
|
|
|||
|
|
||||
| Composition of Net Assets |
||||
| Par value of shares of beneficial interest | $ | 68,263 | ||
|
|
||||
| Additional paid-in capital | 1,347,742,168 | |||
|
|
||||
| Accumulated net investment income | 16,882,908 | |||
|
|
||||
| Accumulated net realized gain on investments and foreign currency transactions | 4,473,805 | |||
|
|
||||
| Net unrealized appreciation on investments and translation of assets and liabilities denominated in foreign currencies | 814,734,668 | |||
|
|
|
|||
| Net Assets | $ | 2,183,901,812 | ||
|
|
|
|||
|
|
||||
| Net Asset Value Per Share |
||||
| Non-Service Shares: | ||||
| Net asset value, redemption price per share and offering price per share (based on net assets of $1,231,078,957 and 38,317,360 shares of beneficial interest outstanding) | $32.13 | |||
|
|
||||
| Service Shares: | ||||
| Net asset value, redemption price per share and offering price per share (based on net assets of $952,822,855 and 29,945,528 shares of beneficial interest outstanding) | $31.82 | |||
See accompanying Notes to Financial Statements.
8 OPPENHEIMER GLOBAL FUND/VA
STATEMENT OF OPERATIONS For the Six Months Ended June 30, 2016 Unaudited
|
|
||||
| Investment Income |
||||
| Dividends: | ||||
| Unaffiliated companies (net of foreign withholding taxes of $2,633,094) | $ | 28,820,014 | ||
| Affiliated companies | 36,783 | |||
|
|
||||
| Interest | 13 | |||
|
|
|
|||
| Total investment income |
|
28,856,810
|
| |
|
|
||||
| Expenses |
||||
| Management fees | 7,124,104 | |||
|
|
||||
| Distribution and service plan fees: | ||||
| Service shares | 1,214,781 | |||
|
|
||||
| Transfer and shareholder servicing agent fees: | ||||
| Non-Service shares | 631,050 | |||
| Service shares | 486,683 | |||
|
|
||||
| Shareholder communications: | ||||
| Non-Service shares | 39,625 | |||
| Service shares | 30,550 | |||
|
|
||||
| Custodian fees and expenses | 72,329 | |||
|
|
||||
| Trustees’ compensation | 36,477 | |||
|
|
||||
| Borrowing fees | 21,877 | |||
|
|
||||
| Other | 99,381 | |||
|
|
|
|||
| Total expenses | 9,756,857 | |||
| Less reduction to custodian expenses | (666) | |||
| Less waivers and reimbursements of expenses | (8,224) | |||
|
|
|
|||
| Net expenses |
|
9,747,967
|
| |
|
|
||||
| Net Investment Income | 19,108,843 | |||
|
|
||||
| Realized and Unrealized Gain (Loss) |
||||
| Net realized gain on: | ||||
| Investments from unaffiliated companies | 33,996,906 | |||
| Foreign currency transactions | 238,220 | |||
|
|
|
|||
| Net realized gain | 34,235,126 | |||
|
|
||||
| Net change in unrealized appreciation/depreciation on: | ||||
| Investments | (285,445,367) | |||
| Translation of assets and liabilities denominated in foreign currencies | 28,803,603 | |||
|
|
|
|||
| Net change in unrealized appreciation/depreciation
|
|
(256,641,764)
|
| |
|
|
||||
| Net Decrease in Net Assets Resulting from Operations | $ | (203,297,795) | ||
|
|
|
|||
See accompanying Notes to Financial Statements.
9 OPPENHEIMER GLOBAL FUND/VA
STATEMENTS OF CHANGES IN NET ASSETS
| Six Months Ended June 30, 2016 (Unaudited) |
Year Ended December 31, 2015 |
|||||||
|
|
||||||||
| Operations |
||||||||
| Net investment income | $ | 19,108,843 | $ | 20,616,652 | ||||
|
|
||||||||
| Net realized gain | 34,235,126 | 169,082,914 | ||||||
|
|
||||||||
| Net change in unrealized appreciation/depreciation | (256,641,764) | (88,101,127) | ||||||
|
|
|
|||||||
| Net increase (decrease) in net assets resulting from operations
|
|
(203,297,795)
|
|
|
101,598,439
|
| ||
|
|
||||||||
| Dividends and/or Distributions to Shareholders |
||||||||
| Dividends from net investment income: | ||||||||
| Non-Service shares | (13,598,845) | (19,562,644) | ||||||
| Service shares | (7,587,430) | (13,304,683) | ||||||
|
|
|
|||||||
|
|
(21,186,275)
|
|
|
(32,867,327)
|
| |||
|
|
||||||||
| Distributions from net realized gain: | ||||||||
| Non-Service shares | (86,197,755) | (97,527,552) | ||||||
| Service shares | (67,272,765) | (81,961,759) | ||||||
|
|
|
|||||||
|
|
(153,470,520)
|
|
|
(179,489,311)
|
| |||
|
|
||||||||
| Beneficial Interest Transactions |
||||||||
| Net increase (decrease) in net assets resulting from beneficial interest transactions: | ||||||||
| Non-Service shares | 39,328,148 | (4,461,169) | ||||||
| Service shares | 34,816,751 | (69,555,025) | ||||||
|
|
|
|||||||
|
|
74,144,899
|
|
|
(74,016,194)
|
| |||
|
|
||||||||
| Net Assets |
||||||||
| Total decrease | (303,809,691) | (184,774,393) | ||||||
|
|
||||||||
| Beginning of period | 2,487,711,503 | 2,672,485,896 | ||||||
|
|
|
|||||||
| End of period (including accumulated net investment income of $16,882,908 and $18,960,340, respectively) | $ | 2,183,901,812 | $ | 2,487,711,503 | ||||
|
|
|
|||||||
See accompanying Notes to Financial Statements.
10 OPPENHEIMER GLOBAL FUND/VA
FINANCIAL HIGHLIGHTS
| Non-Service Shares | Six Months Ended June 30, 2016 (Unaudited) |
Year Ended December 31, 2015 |
Year Ended December 31, 2014 |
Year Ended December 31, 2013 |
Year Ended December 31, 2012 |
Year Ended December 30, 20111 |
||||||||||||||||||
|
|
||||||||||||||||||||||||
| Per Share Operating Data |
||||||||||||||||||||||||
| Net asset value, beginning of period | $ | 38.00 | $ | 39.50 | $ | 40.86 | $ | 32.55 | $ | 27.46 | $ | 30.30 | ||||||||||||
|
|
||||||||||||||||||||||||
| Income (loss) from investment operations: | ||||||||||||||||||||||||
| Net investment income2 | 0.32 | 0.35 | 0.50 | 0.41 | 0.44 | 0.65 | ||||||||||||||||||
| Net realized and unrealized gain (loss) | (3.37) | 1.40 | 0.46 | 8.40 | 5.29 | (3.11) | ||||||||||||||||||
|
|
|
|||||||||||||||||||||||
| Total from investment operations | (3.05) | 1.75 | 0.96 | 8.81 | 5.73 | (2.46) | ||||||||||||||||||
|
|
||||||||||||||||||||||||
| Dividends and/or distributions to shareholders: | ||||||||||||||||||||||||
| Dividends from net investment income | (0.38) | (0.54) | (0.46) | (0.50) | (0.64) | (0.38) | ||||||||||||||||||
| Distributions from net realized gain | (2.44) | (2.71) | (1.86) | 0.00 | 0.00 | 0.00 | ||||||||||||||||||
|
|
|
|||||||||||||||||||||||
| Total dividends and/or distributions to shareholders | (2.82) | (3.25) | (2.32) | (0.50) | (0.64) | (0.38) | ||||||||||||||||||
|
|
||||||||||||||||||||||||
| Net asset value, end of period | $ | 32.13 | $ | 38.00 | $ | 39.50 | $ | 40.86 | $ | 32.55 | $ | 27.46 | ||||||||||||
|
|
|
|||||||||||||||||||||||
|
|
||||||||||||||||||||||||
| Total Return, at Net Asset Value3 |
(8.18)% | 3.94% | 2.29% | 27.31% | 21.27% | (8.29)% | ||||||||||||||||||
|
|
||||||||||||||||||||||||
| Ratios/Supplemental Data |
||||||||||||||||||||||||
| Net assets, end of period (in thousands) | $ | 1,231,079 | $ | 1,406,001 | $ | 1,468,107 | $ | 1,397,026 | $ | 1,252,127 | $ | 1,165,141 | ||||||||||||
|
|
||||||||||||||||||||||||
| Average net assets (in thousands) | $ | 1,266,486 | $ | 1,502,338 | $ | 1,532,383 | $ | 1,333,848 | $ | 1,206,244 | $ | 1,335,403 | ||||||||||||
|
|
||||||||||||||||||||||||
| Ratios to average net assets:4 | ||||||||||||||||||||||||
| Net investment income | 1.82% | 0.86% | 1.24% | 1.13% | 1.48% | 2.17% | ||||||||||||||||||
| Expenses excluding specific expenses listed below | 0.77% | 0.76% | 0.76% | 0.77% | 0.76% | 0.76% | ||||||||||||||||||
| Interest and fees from borrowings | 0.00%5 | 0.00%5 | 0.00% | 0.00% | 0.00% | 0.00% | ||||||||||||||||||
|
|
|
|||||||||||||||||||||||
| Total expenses6 | 0.77% | 0.76% | 0.76% | 0.77% | 0.76% | 0.76% | ||||||||||||||||||
| Expenses after payments, waivers and/or reimbursements and reduction to custodian expenses | 0.77% | 0.76% | 0.76% | 0.77% | 0.76% | 0.76% | ||||||||||||||||||
|
|
||||||||||||||||||||||||
| Portfolio turnover rate | 3% | 14% | 13% | 11% | 14% | 13% | ||||||||||||||||||
1. December 30, 2011 represents the last business day of the Fund’s reporting period. See Note 2 of the accompanying Notes.
2. Per share amounts calculated based on the average shares outstanding during the period.
3. Assumes an initial investment on the business day before the first day of the fiscal period, with all dividends and distributions reinvested in additional shares on the reinvestment date, and redemption at the net asset value calculated on the last business day of the fiscal period. Total returns are not annualized for periods less than one full year. Total return information does not reflect expenses that apply at the separate account level or to related insurance products. Inclusion of these charges would reduce the total return figures for all periods shown. Returns do not reflect the deduction of taxes that a shareholder would pay on fund distributions or the redemption of fund shares.
4. Annualized for periods less than one full year.
5. Less than 0.005%.
6. Total expenses including indirect expenses from affiliated fund fees and expenses were as follows:
See accompanying Notes to Financial Statements.
11 OPPENHEIMER GLOBAL FUND/VA
FINANCIAL HIGHLIGHTS Continued
| Service Shares | Six Months Ended June 30, 2016 (Unaudited) |
Year Ended December 31, 2015 |
Year Ended December 31, 2014 |
Year Ended December 31, 2013 |
Year Ended December 31, 2012 |
Year Ended December 30, 20111 |
||||||||||||||||||
|
|
||||||||||||||||||||||||
| Per Share Operating Data |
||||||||||||||||||||||||
| Net asset value, beginning of period | $ | 37.59 | $ | 39.10 | $ | 40.47 | $ | 32.25 | $ | 27.21 | $ | 30.04 | ||||||||||||
|
|
||||||||||||||||||||||||
| Income (loss) from investment operations: | ||||||||||||||||||||||||
| Net investment income2 | 0.27 | 0.25 | 0.40 | 0.32 | 0.36 | 0.56 | ||||||||||||||||||
| Net realized and unrealized gain (loss) | (3.33) | 1.39 | 0.44 | 8.32 | 5.25 | (3.08) | ||||||||||||||||||
|
|
|
|||||||||||||||||||||||
| Total from investment operations | (3.06) | 1.64 | 0.84 | 8.64 | 5.61 | (2.52) | ||||||||||||||||||
|
|
||||||||||||||||||||||||
| Dividends and/or distributions to shareholders: | ||||||||||||||||||||||||
| Dividends from net investment income | (0.27) | (0.44) | (0.35) | (0.42) | (0.57) | (0.31) | ||||||||||||||||||
| Distributions from net realized gain | (2.44) | (2.71) | (1.86) | 0.00 | 0.00 | 0.00 | ||||||||||||||||||
|
|
|
|||||||||||||||||||||||
| Total dividends and/or distributions to shareholders | (2.71) | (3.15) | (2.21) | (0.42) | (0.57) | (0.31) | ||||||||||||||||||
|
|
||||||||||||||||||||||||
| Net asset value, end of period | $ | 31.82 | $ | 37.59 | $ | 39.10 | $ | 40.47 | $ | 32.25 | $ | 27.21 | ||||||||||||
|
|
|
|||||||||||||||||||||||
|
|
||||||||||||||||||||||||
| Total Return, at Net Asset Value3 |
(8.29)% | 3.67% | 2.06% | 26.99% | 20.95% | (8.53)% | ||||||||||||||||||
|
|
||||||||||||||||||||||||
| Ratios/Supplemental Data |
||||||||||||||||||||||||
| Net assets, end of period (in thousands) | $ | 952,823 | $ | 1,081,711 | $ | 1,204,379 | $ | 1,216,285 | $ | 1,130,388 | $ | 1,003,839 | ||||||||||||
|
|
||||||||||||||||||||||||
| Average net assets (in thousands) | $ | 976,751 | $ | 1,219,501 | $ | 1,265,528 | $ | 1,174,119 | $ | 1,069,295 | $ | 1,091,128 | ||||||||||||
|
|
||||||||||||||||||||||||
| Ratios to average net assets:4 | ||||||||||||||||||||||||
| Net investment income | 1.57% | 0.63% | 0.99% | 0.89% | 1.23% | 1.90% | ||||||||||||||||||
| Expenses excluding specific expenses listed below | 1.02% | 1.01% | 1.01% | 1.02% | 1.01% | 1.01% | ||||||||||||||||||
| Interest and fees from borrowings | 0.00%5 | 0.00%5 | 0.00% | 0.00% | 0.00% | 0.00% | ||||||||||||||||||
|
|
|
|||||||||||||||||||||||
| Total expenses6 | 1.02% | 1.01% | 1.01% | 1.02% | 1.01% | 1.01% | ||||||||||||||||||
| Expenses after payments, waivers and/or reimbursements and reduction to custodian expenses | 1.02% | 1.01% | 1.01% | 1.02% | 1.01% | 1.01% | ||||||||||||||||||
|
|
||||||||||||||||||||||||
| Portfolio turnover rate | 3% | 14% | 13% | 11% | 14% | 13% | ||||||||||||||||||
1. December 30, 2011 represents the last business day of the Fund’s reporting period. See Note 2 of the accompanying Notes.
2. Per share amounts calculated based on the average shares outstanding during the period.
3. Assumes an initial investment on the business day before the first day of the fiscal period, with all dividends and distributions reinvested in additional shares on the reinvestment date, and redemption at the net asset value calculated on the last business day of the fiscal period. Total returns are not annualized for periods less than one full year. Total return information does not reflect expenses that apply at the separate account level or to related insurance products. Inclusion of these charges would reduce the total return figures for all periods shown. Returns do not reflect the deduction of taxes that a shareholder would pay on fund distributions or the redemption of fund shares.
4. Annualized for periods less than one full year.
5. Less than 0.005%.
6. Total expenses including indirect expenses from affiliated fund fees and expenses were as follows:
See accompanying Notes to Financial Statements.
12 OPPENHEIMER GLOBAL FUND/VA
NOTES TO FINANCIAL STATEMENTS June 30, 2016 Unaudited
1. Organization
Oppenheimer Global Fund/VA (the “Fund”), a separate series of Oppenheimer Variable Account Funds, is a diversified open-end management investment company registered under the Investment Company Act of 1940 (“1940 Act”), as amended. The Fund’s main investment objective is to seek capital appreciation. The Fund’s investment adviser is OFI Global Asset Management, Inc. (“OFI Global” or the “Manager”), a wholly-owned subsidiary of OppenheimerFunds, Inc. (“OFI” or the “Sub-Adviser”). The Manager has entered into a sub-advisory agreement with OFI. Shares of the Fund are sold only to separate accounts of life insurance companies.
The Fund offers two classes of shares. Both classes are sold at their offering price, which is the net asset value per share, to separate investment accounts of participating insurance companies as an underlying investment for variable life insurance policies, variable annuity contracts or other investment products. The class of shares designated as Service shares is subject to a distribution and service plan. Both classes of shares have identical rights and voting privileges with respect to the Fund in general and exclusive voting rights on matters that affect that class alone. Earnings, net assets and net asset value per share may differ due to each class having its own expenses, such as transfer and shareholder servicing agent fees and shareholder communications, directly attributable to that class.
The following is a summary of significant accounting policies followed in the Fund’s preparation of financial statements in accordance with accounting principles generally accepted in the United States (“U.S. GAAP”).
2. Significant Accounting Policies
Security Valuation. All investments in securities are recorded at their estimated fair value, as described in Note 3.
Reporting Period End Date. The last day of the Fund’s reporting period is the last day the New York Stock Exchange was open for trading during the period. The Fund’s financial statements have been presented through that date to maintain consistency with the Fund’s net asset value calculations used for shareholder transactions.
Foreign Currency Translation. The Fund’s accounting records are maintained in U.S. dollars. The values of securities denominated in foreign currencies and amounts related to the purchase and sale of foreign securities and foreign investment income are translated into U.S. dollars as of the close of the New York Stock Exchange (the “Exchange”), normally 4:00 P.M. Eastern time, on each day the Exchange is open for trading. Foreign exchange rates may be valued primarily using a reliable bank, dealer or service authorized by the Board of Trustees.
Reported net realized gains and losses from foreign currency transactions arise from sales of portfolio securities, sales and maturities of short-term securities, sales of foreign currencies, exchange rate fluctuations between the trade and settlement dates on securities transactions, and the difference between the amounts of dividends, interest, and foreign withholding taxes recorded on the Fund’s books and the U.S. dollar equivalent of the amounts actually received or paid. Net unrealized appreciation and depreciation on the translation of assets and liabilities denominated in foreign currencies arise from changes in the values of assets and liabilities, including investments in securities at fiscal period end, resulting from changes in exchange rates.
The effect of changes in foreign currency exchange rates on investments is separately identified from the fluctuations arising from changes in market values of securities held and reported with all other foreign currency gains and losses in the Fund’s Statement of Operations.
Allocation of Income, Expenses, Gains and Losses. Income, expenses (other than those attributable to a specific class), gains and losses are allocated on a daily basis to each class of shares based upon the relative proportion of net assets represented by such class. Operating expenses directly attributable to a specific class are charged against the operations of that class.
Dividends and Distributions to Shareholders. Dividends and distributions to shareholders, which are determined in accordance with income tax regulations and may differ from U.S. GAAP, are recorded on the ex-dividend date. Income and capital gain distributions, if any, are declared and paid annually or at other times as deemed necessary by the Manager.
The tax character of distributions is determined as of the Fund’s fiscal year end. Therefore, a portion of the Fund’s distributions made to shareholders prior to the Fund’s fiscal year end may ultimately be categorized as a tax return of capital.
Investment Income. Dividend income is recorded on the ex-dividend date or upon ex-dividend notification in the case of certain foreign dividends where the ex-dividend date may have passed. Non-cash dividends included in dividend income, if any, are recorded at the fair market value of the securities received. Interest income is recognized on an accrual basis. Discount and premium, which are included in interest income on the Statement of Operations, are amortized or accreted daily.
Custodian Fees. “Custodian fees and expenses” in the Statement of Operations may include interest expense incurred by the Fund on any cash overdrafts of its custodian account during the period. Such cash overdrafts may result from the effects of failed trades in portfolio securities and from cash outflows resulting from unanticipated shareholder redemption activity. The Fund pays interest to its custodian on such cash overdrafts, to the extent they are not offset by positive cash balances maintained by the Fund, at a rate equal to the Federal Funds Rate plus 0.50%. The “Reduction to custodian expenses” line item, if applicable, represents earnings on cash balances maintained by the Fund during the period. Such interest expense and other custodian fees may be paid with these earnings.
Security Transactions. Security transactions are recorded on the trade date. Realized gains and losses on securities sold are determined on the basis of identified cost.
13 OPPENHEIMER GLOBAL FUND/VA
NOTES TO FINANCIAL STATEMENTS Unaudited / Continued
2. Significant Accounting Policies (Continued)
Indemnifications. The Fund’s organizational documents provide current and former Trustees and officers with a limited indemnification against liabilities arising in connection with the performance of their duties to the Fund. In the normal course of business, the Fund may also enter into contracts that provide general indemnifications. The Fund’s maximum exposure under these arrangements is unknown as this would be dependent on future claims that may be made against the Fund. The risk of material loss from such claims is considered remote.
Federal Taxes. The Fund intends to comply with provisions of the Internal Revenue Code applicable to regulated investment companies and to distribute substantially all of its investment company taxable income to shareholders. Therefore, no federal income or excise tax provision is required. The Fund files income tax returns in U.S. federal and applicable state jurisdictions. The statute of limitations on the Fund’s tax return filings generally remains open for the three preceding fiscal reporting period ends. The Fund has analyzed its tax positions for the fiscal year ended December 31, 2015, including open tax years, and does not believe there are any uncertain tax positions requiring recognition in the Fund’s financial statements.
During the fiscal year ended December 31, 2015, the Fund did not utilize any capital loss carryforward to offset capital gains realized in that fiscal year. Capital loss carryforwards with no expiration, if any, must be utilized prior to those with expiration dates. Capital losses with no expiration will be carried forward to future years if not offset by gains.
At period end, it is estimated that the Fund will not have any capital loss carryforwards. The estimated capital loss carryforward represents the carryforward as of the end of the last fiscal year, increased or decreased by capital losses or gains realized in the first six months of the current fiscal year. During the reporting period, it is estimated that the Fund will not utilize any capital loss carryforward to offset realized capital gains.
Net investment income (loss) and net realized gain (loss) may differ for financial statement and tax purposes. The character of dividends and distributions made during the fiscal year from net investment income or net realized gains are determined in accordance with federal income tax requirements, which may differ from the character of net investment income or net realized gains presented in those financial statements in accordance with U.S. GAAP. Also, due to timing of dividends and distributions, the fiscal year in which amounts are distributed may differ from the fiscal year in which the income or net realized gain was recorded by the Fund.
The aggregate cost of securities and other investments and the composition of unrealized appreciation and depreciation of securities and other investments for federal income tax purposes at period end are noted in the following table. The primary difference between book and tax appreciation or depreciation of securities and other investments, if applicable, is attributable to the tax deferral of losses or tax realization of financial statement unrealized gain or loss.
| Federal tax cost of securities |
$ | 1,379,996,309 | ||
| Federal tax cost of other investments |
113,596 | |||
|
|
|
|||
| Total federal tax cost |
$ | 1,380,109,905 | ||
|
|
|
|||
| Gross unrealized appreciation |
$ | 986,567,559 | ||
| Gross unrealized depreciation |
(193,330,709) | |||
|
|
|
|||
| Net unrealized appreciation |
$ | 793,236,850 | ||
|
|
|
Certain foreign countries impose a tax on capital gains which is accrued by the Fund based on unrealized appreciation, if any, on affected securities. The tax is paid when the gain is realized.
Use of Estimates. The preparation of financial statements in conformity with U.S. GAAP requires management to make estimates and assumptions that affect the reported amounts of assets and liabilities and disclosure of contingent assets and liabilities at the date of the financial statements and the reported amounts of increases and decreases in net assets from operations during the reporting period. Actual results could differ from those estimates.
3. Securities Valuation
The Fund calculates the net asset value of its shares as of 4:00 P.M. Eastern time, on each day the New York Stock Exchange (the “Exchange”) is open for trading, except in the case of a scheduled early closing of the Exchange, in which case the Fund will calculate net asset value of the shares as of the scheduled early closing time of the Exchange.
The Fund’s Board has adopted procedures for the valuation of the Fund’s securities and has delegated the day-to-day responsibility for valuation determinations under those procedures to the Manager. The Manager has established a Valuation Committee which is responsible for determining a “fair valuation” for any security for which market quotations are not “readily available.” The Valuation Committee’s fair valuation determinations are subject to review, approval and ratification by the Fund’s Board at its next regularly scheduled meeting covering the calendar quarter in which the fair valuation was determined.
Valuation Methods and Inputs
Securities are valued using unadjusted quoted market prices, when available, as supplied primarily by third party pricing services or dealers.
The following methodologies are used to determine the market value or the fair value of the types of securities described below:
Securities traded on a registered U.S. securities exchange (including exchange-traded derivatives other than futures and futures options) are valued based on the last sale price of the security reported on the principal exchange on which it is traded, prior to the time when the Fund’s assets are valued. In the absence of a sale, the security is valued at the mean between the bid and asked price on the principal exchange or, if not available from the principal exchange, obtained from two dealers. If bid and asked prices are not available from either the exchange or two dealers, the security is valued
14 OPPENHEIMER GLOBAL FUND/VA
3. Securities Valuation (Continued)
by using one of the following methodologies (listed in order of priority): (1) a bid from the principal exchange, (2) the mean between the bid and asked price as provided by a single dealer, or (3) a bid from a single dealer. A security of a foreign issuer traded on a foreign exchange, but not listed on a registered U.S. securities exchange, is valued based on the last sale price on the principal exchange on which the security is traded, as identified by the third party pricing service used by the Manager, prior to the time when the Fund’s assets are valued. If the last sale price is unavailable, the security is valued at the most recent official closing price on the principal exchange on which it is traded. If the last sales price or official closing price for a foreign security is not available, the security is valued at the mean between the bid and asked price per the exchange or, if not available from the exchange, obtained from two dealers. If bid and asked prices are not available from either the exchange or two dealers, the security is valued by using one of the following methodologies (listed in order of priority): (1) a bid from the exchange, (2) the mean between the bid and asked price as provided by a single dealer, or (3) a bid from a single dealer.
Shares of a registered investment company that are not traded on an exchange are valued at that investment company’s net asset value per share.
Corporate and government debt securities (of U.S. or foreign issuers) and municipal debt securities, event-linked bonds, loans, mortgage-backed securities, collateralized mortgage obligations, and asset-backed securities are valued at the mean between the “bid” and “asked” prices utilizing evaluated prices obtained from third party pricing services or broker-dealers who may use matrix pricing methods to determine the evaluated prices.
Short-term money market type debt securities with a remaining maturity of sixty days or less are valued at cost adjusted by the amortization of discount or premium to maturity (amortized cost), which approximates market value. Short-term debt securities with a remaining maturity in excess of sixty days are valued at the mean between the “bid” and “asked” prices utilizing evaluated prices obtained from third party pricing services or broker-dealers.
A description of the standard inputs that may generally be considered by the third party pricing vendors in determining their evaluated prices is provided below.
| Security Type | Standard inputs generally considered by third-party pricing vendors | |
| Corporate debt, government debt, municipal, mortgage-backed and asset-backed securities | Reported trade data, broker-dealer price quotations, benchmark yields, issuer spreads on comparable securities, the credit quality, yield, maturity, and other appropriate factors. | |
| Loans | Information obtained from market participants regarding reported trade data and broker-dealer price quotations. | |
| Event-linked bonds | Information obtained from market participants regarding reported trade data and broker-dealer price quotations. |
If a market value or price cannot be determined for a security using the methodologies described above, or if, in the “good faith” opinion of the Manager, the market value or price obtained does not constitute a “readily available market quotation,” or a significant event has occurred that would materially affect the value of the security, the security is fair valued either (i) by a standardized fair valuation methodology applicable to the security type or the significant event as previously approved by the Valuation Committee and the Fund’s Board or (ii) as determined in good faith by the Manager’s Valuation Committee. The Valuation Committee considers all relevant facts that are reasonably available, through either public information or information available to the Manager, when determining the fair value of a security. Fair value determinations by the Manager are subject to review, approval and ratification by the Fund’s Board at its next regularly scheduled meeting covering the calendar quarter in which the fair valuation was determined. Those fair valuation standardized methodologies include, but are not limited to, valuing securities at the last sale price or initially at cost and subsequently adjusting the value based on: changes in company specific fundamentals, changes in an appropriate securities index, or changes in the value of similar securities which may be further adjusted for any discounts related to security-specific resale restrictions. When possible, such methodologies use observable market inputs such as unadjusted quoted prices of similar securities, observable interest rates, currency rates and yield curves. The methodologies used for valuing securities are not necessarily an indication of the risks associated with investing in those securities nor can it be assured that the Fund can obtain the fair value assigned to a security if it were to sell the security.
To assess the continuing appropriateness of security valuations, the Manager, or its third party service provider who is subject to oversight by the Manager, regularly compares prior day prices, prices on comparable securities, and sale prices to the current day prices and challenges those prices exceeding certain tolerance levels with the third party pricing service or broker source. For those securities valued by fair valuations, whether through a standardized fair valuation methodology or a fair valuation determination, the Valuation Committee reviews and affirms the reasonableness of the valuations based on such methodologies and fair valuation determinations on a regular basis after considering all relevant information that is reasonably available.
Classifications
Each investment asset or liability of the Fund is assigned a level at measurement date based on the significance and source of the inputs to its valuation. Various data inputs are used in determining the value of each of the Fund’s investments as of the reporting period end. These data inputs are categorized in the following hierarchy under applicable financial accounting standards:
1) Level 1-unadjusted quoted prices in active markets for identical assets or liabilities (including securities actively traded on a securities exchange)
2) Level 2-inputs other than unadjusted quoted prices that are observable for the asset or liability (such as unadjusted quoted prices for similar assets and market corroborated inputs such as interest rates, prepayment speeds, credit risks, etc.)
3) Level 3-significant unobservable inputs (including the Manager’s own judgments about assumptions that market participants would use in pricing
15 OPPENHEIMER GLOBAL FUND/VA
NOTES TO FINANCIAL STATEMENTS Unaudited / Continued
3. Securities Valuation (Continued)
the asset or liability).
The inputs used for valuing securities are not necessarily an indication of the risks associated with investing in those securities.
The Fund classifies each of its investments in investment companies which are publicly offered as Level 1. Investment companies that are not publicly offered are measured using net asset value as a practical expedient, and are not classified in the fair value hierarchy.
The table below categorizes amounts that are included in the Fund’s Statement of Assets and Liabilities at period end based on valuation input level:
| Level 1— Unadjusted Quoted Prices |
Level 2— Other Significant Observable Inputs |
Level 3— Significant Unobservable Inputs |
Value | |||||||||||||
|
|
||||||||||||||||
| Assets Table |
||||||||||||||||
| Investments, at Value: |
||||||||||||||||
| Common Stocks |
||||||||||||||||
| Consumer Discretionary |
$ | 109,133,286 | $ | 178,011,713 | $ | — | $ | 287,144,999 | ||||||||
| Consumer Staples |
58,723,236 | 68,057,810 | — | 126,781,046 | ||||||||||||
| Energy |
361,388 | 34,130,123 | — | 34,491,511 | ||||||||||||
| Financials |
188,818,549 | 255,133,137 | — | 443,951,686 | ||||||||||||
| Health Care |
266,031,959 | 71,271,514 | — | 337,303,473 | ||||||||||||
| Industrials |
102,266,231 | 175,768,596 | — | 278,034,827 | ||||||||||||
| Information Technology |
331,965,778 | 195,383,152 | — | 527,348,930 | ||||||||||||
| Materials |
— | 18,770,829 | — | 18,770,829 | ||||||||||||
| Telecommunication Services |
— | 42,727,437 | — | 42,727,437 | ||||||||||||
| Preferred Stocks |
1,063,838 | 34,235,058 | — | 35,298,896 | ||||||||||||
| Investment Company |
41,963,302 | — | — | 41,963,302 | ||||||||||||
|
|
|
|||||||||||||||
| Total Assets |
$ | 1,100,327,567 | $ | 1,073,489,369 | $ | — | $ | 2,173,816,936 | ||||||||
|
|
|
|||||||||||||||
Forward currency exchange contracts and futures contracts, if any, are reported at their unrealized appreciation/depreciation at measurement date, which represents the change in the contract’s value from trade date. All additional assets and liabilities included in the above table are reported at their market value at measurement date.
4. Investments and Risks
Risks of Foreign Investing. The Fund may invest in foreign securities which are subject to special risks. Securities traded in foreign markets may be less liquid and more volatile than those traded in U.S. markets. Foreign issuers are usually not subject to the same accounting and disclosure requirements that U.S. companies are subject to, which may make it difficult for the Fund to evaluate a foreign company’s operations or financial condition. A change in the value of a foreign currency against the U.S. dollar will result in a change in the U.S. dollar value of investments denominated in that foreign currency and in the value of any income or distributions the Fund may receive on those investments. The value of foreign investments may be affected by exchange control regulations, foreign taxes, higher transaction and other costs, delays in the settlement of transactions, changes in economic or monetary policy in the United States or abroad, expropriation or nationalization of a company’s assets, or other political and economic factors. In addition, due to the inter-relationship of global economies and financial markets, changes in political and economic factors in one country or region could adversely affect conditions in another country or region. Investments in foreign securities may also expose the Fund to time-zone arbitrage risk. Foreign securities may trade on weekends or other days when the Fund does not price its shares. At times, the Fund may emphasize investments in a particular country or region and may be subject to greater risks from adverse events that occur in that country or region. Foreign securities and foreign currencies held in foreign banks and securities depositories may be subject to limited or no regulatory oversight.
Investments in Affiliated Funds. The Fund is permitted to invest in other mutual funds advised by the Manager (“Affiliated Funds”). Affiliated Funds are open-end management investment companies registered under the 1940 Act, as amended. The Manager is the investment adviser of, and the Sub-Adviser provides investment and related advisory services to, the Affiliated Funds. When applicable, the Fund’s investments in Affiliated Funds are included in the Statement of Investments. Shares of Affiliated Funds are valued at their net asset value per share. As a shareholder, the Fund is subject to its proportional share of the Affiliated Funds’ expenses, including their management fee. The Manager will waive fees and/or reimburse Fund expenses in an amount equal to the indirect management fees incurred through the Fund’s investment in the Affiliated Funds.
Each of the Affiliated Funds in which the Fund invests has its own investment risks, and those risks can affect the value of the Fund’s investments and therefore the value of the Fund’s shares. To the extent that the Fund invests more of its assets in one Affiliated Fund than in another, the Fund will have greater exposure to the risks of that Affiliated Fund.
Investment in Oppenheimer Institutional Money Market Fund. The Fund is permitted to invest daily available cash balances in a money market Affiliated Fund. The Fund may invest the available cash in Class E shares of Oppenheimer Institutional Money Market Fund (“IMMF”) to seek current income while preserving liquidity or for defensive purposes. IMMF is regulated as a money market fund under the Investment Company Act of 1940, as amended.
16 OPPENHEIMER GLOBAL FUND/VA
4. Investments and Risks (Continued)
Equity Security Risk. Stocks and other equity securities fluctuate in price. The value of the Fund’s portfolio may be affected by changes in the equity markets generally. Equity markets may experience significant short-term volatility and may fall sharply at times. Different markets may behave differently from each other and U.S. equity markets may move in the opposite direction from one or more foreign stock markets. Adverse events in any part of the equity or fixed-income markets may have unexpected negative effects on other market segments.
The prices of individual equity securities generally do not all move in the same direction at the same time and a variety of factors can affect the price of a particular company’s securities. These factors may include, but are not limited to, poor earnings reports, a loss of customers, litigation against the company, general unfavorable performance of the company’s sector or industry, or changes in government regulations affecting the company or its industry.
5. Market Risk Factors
The Fund’s investments in securities and/or financial derivatives may expose the Fund to various market risk factors:
Commodity Risk. Commodity risk relates to the change in value of commodities or commodity indexes as they relate to increases or decreases in the commodities market. Commodities are physical assets that have tangible properties. Examples of these types of assets are crude oil, heating oil, metals, livestock, and agricultural products.
Credit Risk. Credit risk relates to the ability of the issuer of debt to meet interest and principal payments, or both, as they come due. In general, lower-grade, higher-yield debt securities are subject to credit risk to a greater extent than lower-yield, higher-quality securities.
Equity Risk. Equity risk relates to the change in value of equity securities as they relate to increases or decreases in the general market.
Foreign Exchange Rate Risk. Foreign exchange rate risk relates to the change in the U.S. dollar value of a security held that is denominated in a foreign currency. The U.S. dollar value of a foreign currency denominated security will decrease as the dollar appreciates against the currency, while the U.S. dollar value will increase as the dollar depreciates against the currency.
Interest Rate Risk. Interest rate risk refers to the fluctuations in value of fixed-income securities resulting from the inverse relationship between price and yield. For example, an increase in general interest rates will tend to reduce the market value of already issued fixed-income investments, and a decline in general interest rates will tend to increase their value. In addition, debt securities with longer maturities, which tend to have higher yields, are subject to potentially greater fluctuations in value from changes in interest rates than obligations with shorter maturities.
Volatility Risk. Volatility risk refers to the magnitude of the movement, but not the direction of the movement, in a financial instrument’s price over a defined time period. Large increases or decreases in a financial instrument’s price over a relative time period typically indicate greater volatility risk, while small increases or decreases in its price typically indicate lower volatility risk.
6. Shares of Beneficial Interest
The Fund has authorized an unlimited number of $0.001 par value shares of beneficial interest of each class. Transactions in shares of beneficial interest were as follows:
| Six Months Ended June 30, 2016 | Year Ended December 31, 2015 | |||||||||||||||
| Shares | Amount | Shares | Amount | |||||||||||||
|
|
||||||||||||||||
| Non-Service Shares |
||||||||||||||||
| Sold |
943,655 | $ | 32,514,756 | 3,090,155 | $ | 125,761,536 | ||||||||||
| Dividends and/or distributions reinvested |
3,043,507 | 99,796,600 | 2,891,830 | 117,090,196 | ||||||||||||
| Redeemed |
(2,671,308 | ) | (92,983,208 | ) | (6,149,839 | ) | (247,312,901) | |||||||||
|
|
|
|||||||||||||||
| Net increase (decrease) |
1,315,854 | $ | 39,328,148 | (167,854 | ) | $ | (4,461,169) | |||||||||
|
|
|
|||||||||||||||
|
|
||||||||||||||||
| Service Shares |
||||||||||||||||
| Sold |
1,041,966 | $ | 35,266,289 | 5,612,447 | $ | 223,502,452 | ||||||||||
| Dividends and/or distributions reinvested |
2,305,519 | 74,860,195 | 2,375,130 | 95,266,442 | ||||||||||||
| Redeemed |
(2,177,727 | ) | (75,309,733 | ) | (10,010,458 | ) | (388,323,919) | |||||||||
|
|
|
|||||||||||||||
| Net increase (decrease) |
1,169,758 | $ | 34,816,751 | (2,022,881 | ) | $ | (69,555,025) | |||||||||
|
|
|
|||||||||||||||
7. Purchases and Sales of Securities
The aggregate cost of purchases and proceeds from sales of securities, other than short-term obligations and investments in IMMF, for the reporting period were as follows:
| Purchases | Sales | |||||||||||
|
|
||||||||||||
| Investment securities |
$61,565,424 | $172,169,104 | ||||||||||
8. Fees and Other Transactions with Affiliates
Management Fees. Under the investment advisory agreement, the Fund pays the Manager a management fee based on the daily net assets of the Fund at an annual rate as shown in the following table:
17 OPPENHEIMER GLOBAL FUND/VA
NOTES TO FINANCIAL STATEMENTS Unaudited / Continued
8. Fees and Other Transactions with Affiliates (Continued)
| Fee Schedule | ||||||
|
| ||||||
| Up to $200 million |
0.75 | % | ||||
| Next $200 million |
0.72 | |||||
| Next $200 million |
0.69 | |||||
| Next $200 million |
0.66 | |||||
| Next $4.2 billion |
0.60 | |||||
| Over $5 billion |
0.58 | |||||
The Fund’s effective management fee for the reporting period was 0.64% of average annual net assets before any applicable waivers.
Sub-Adviser Fees. The Manager has retained the Sub-Adviser to provide the day-to-day portfolio management of the Fund. Under the Sub-Advisory Agreement, the Manager pays the Sub-Adviser an annual fee in monthly installments, equal to a percentage of the investment management fee collected by the Manager from the Fund, which shall be calculated after any investment management fee waivers. The fee paid to the Sub-Adviser is paid by the Manager, not by the Fund.
Transfer Agent Fees. OFI Global (the “Transfer Agent”) serves as the transfer and shareholder servicing agent for the Fund. The Fund pays the Transfer Agent a fee based on annual net assets. Fees incurred and average net assets for each class with respect to these services are detailed in the Statement of Operations and Financial Highlights, respectively.
Sub-Transfer Agent Fees. The Transfer Agent has retained Shareholder Services, Inc., a wholly-owned subsidiary of OFI (the “Sub-Transfer Agent”), to provide the day-to-day transfer agent and shareholder servicing of the Fund. Under the Sub-Transfer Agency Agreement, the Transfer Agent pays the Sub-Transfer Agent an annual fee in monthly installments, equal to a percentage of the transfer agent fee collected by the Transfer Agent from the Fund, which shall be calculated after any applicable fee waivers. The fee paid to the Sub-Transfer Agent is paid by the Transfer Agent, not by the Fund.
Trustees’ Compensation. The Fund’s Board of Trustees (“Board”) has adopted a compensation deferral plan for Independent Trustees that enables Trustees to elect to defer receipt of all or a portion of the annual compensation they are entitled to receive from the Fund. For purposes of determining the amount owed to the Trustees under the plan, deferred amounts are treated as though equal dollar amounts had been invested in shares of the Fund or in other Oppenheimer funds selected by the Trustees. The Fund purchases shares of the funds selected for deferral by the Trustees in amounts equal to his or her deemed investment, resulting in a Fund asset equal to the deferred compensation liability. Such assets are included as a component of “Other” within the asset section of the Statement of Assets and Liabilities. Deferral of Trustees’ fees under the plan will not affect the net assets of the Fund and will not materially affect the Fund’s assets, liabilities or net investment income per share. Amounts will be deferred until distributed in accordance with the compensation deferral plan.
Distribution and Service Plan for Service Shares. The Fund has adopted a Distribution and Service Plan (the “Plan”) pursuant to Rule 12b-1 under the 1940 Act for Service shares to pay OppenheimerFunds Distributor, Inc. (the “Distributor”), for distribution related services, personal service and account maintenance for the Fund’s Service shares. Under the Plan, payments are made periodically at an annual rate of 0.25% of the daily net assets of Service shares of the Fund. The Distributor currently uses all of those fees to compensate sponsors of the insurance product that offers Fund shares, for providing personal service and maintenance of accounts of their variable contract owners that hold Service shares. These fees are paid out of the Fund’s assets on an on-going basis and increase operating expenses of the Service shares, which results in lower performance compared to the Fund’s shares that are not subject to a service fee. Fees incurred by the Fund under the Plan are detailed in the Statement of Operations.
Waivers and Reimbursements of Expenses. The Manager has contractually agreed to limit the Fund’s expenses after payments, waivers and/or reimbursements and reduction to custodian expenses, excluding expenses incurred directly or indirectly by the Fund as a result of investments in other investment companies, wholly-owned subsidiaries and pooled investment vehicles; so that those expenses, as percentages of daily net assets, will not exceed the annual rate of 1.00% for Non-Service shares and 1.25% for Service shares. The expense limitations do not include interest and fees from borrowing, and other expenses not incurred in the ordinary course of the Fund’s business.
The Manager will waive fees and/or reimburse Fund expenses in an amount equal to the indirect management fees incurred through the Fund’s investment in IMMF. During the reporting period, the Manager waived fees and/or reimbursed the Fund $8,224 for IMMF management fees.
Waivers and/or reimbursements may be modified or terminated as set forth according to the terms in the prospectus.
9. Borrowings and Other Financing
Joint Credit Facility. A number of mutual funds managed by the Manager participate in a $1.28 billion revolving credit facility (the “Facility”) intended to provide short-term financing, if necessary, subject to certain restrictions in connection with atypical redemption activity. Expenses and fees related to the Facility are paid by the participating funds and are disclosed separately or as other expenses on the Statement of Operations. The Fund did not utilize the Facility during the reporting period.
10. Pending Litigation
In 2009, several putative class action lawsuits were filed and later consolidated before the U.S. District Court for the District of Colorado against
18 OPPENHEIMER GLOBAL FUND/VA
10. Pending Litigation (Continued)
OppenheimerFunds, Inc. (“OFI”), OppenheimerFunds Distributor, Inc. (“OFDI”), and Oppenheimer Rochester California Municipal Fund, a fund advised by OFI Global Asset Management, Inc. and distributed by the Distributor (the “California Fund”), in connection with the California Fund’s investment performance. The plaintiffs asserted claims against OFI, OFDI and certain present and former trustees and officers of the California Fund under the federal securities laws, alleging, among other things, that the disclosure documents of the California Fund contained misrepresentations and omissions and the investment policies of the California Fund were not followed. Plaintiffs in the suit filed an amended complaint and defendants filed a motion to dismiss. In 2011, the court issued an order which granted in part and denied in part the defendants’ motion to dismiss. In 2012, plaintiffs filed a motion, which defendants opposed, to certify a class and appoint class representatives and class counsel. In March 2015, the court granted plaintiffs’ motion for class certification. In May 2015, the U.S. Court of Appeals for the Tenth Circuit vacated the class certification order and remanded the matter to the district court for further proceedings. In October 2015, the district court reaffirmed its order and determined that the suit will proceed as a class action. In December 2015, the Tenth Circuit denied defendants’ petition to appeal the district court’s reaffirmed class certification order.
OFI and OFDI believe the suit is without merit; that it is premature to render any opinion as to the likelihood of an outcome unfavorable to them in the suit; and that no estimate can yet be made as to the amount or range of any potential loss. Furthermore, OFI believes that the suit should not impair the ability of OFI or OFDI to perform their respective duties to the Fund and that the outcome of the suit should not have any material effect on the operations of any of the Oppenheimer funds.
19 OPPENHEIMER GLOBAL FUND/VA
PORTFOLIO PROXY VOTING POLICIES AND GUIDELINES; UPDATES TO STATEMENTS OF INVESTMENTS Unaudited
The Fund has adopted Portfolio Proxy Voting Policies and Guidelines under which the Fund votes proxies relating to securities (“portfolio proxies”) held by the Fund. A description of the Fund’s Portfolio Proxy Voting Policies and Guidelines is available (i) without charge, upon request, by calling the Fund toll-free at 1.800.525.7048, (ii) on the Fund’s website at www.oppenheimerfunds.com, and (iii) on the SEC’s website at www.sec.gov. In addition, the Fund is required to file Form N-PX, with its complete proxy voting record for the 12 months ended June 30th, no later than August 31st of each year. The Fund’s voting record is available (i) without charge, upon request, by calling the Fund toll-free at 1.800.525.7048, and (ii) in the Form N-PX filing on the SEC’s website at www.sec.gov.
The Fund files its complete schedule of portfolio holdings with the SEC for the first quarter and the third quarter of each fiscal year on Form N-Q. The Fund’s Form N-Q filings are available on the SEC’s website at www.sec.gov. Those forms may be reviewed and copied at the SEC’s Public Reference Room in Washington, D.C. Information on the operation of the Public Reference Room may be obtained by calling 1-800-SEC-0330.
20 OPPENHEIMER GLOBAL FUND/VA
DISTRIBUTION SOURCES Unaudited
For any distribution that took place over the Fund’s reporting period, the table below details on a per-share basis the percentage of the Fund’s total distribution payment amount that was derived from the following sources: net income, net profit from the sale of securities, and other capital sources. This information is based upon income and capital gains using generally accepted accounting principles as of the date of each distribution. Because the Fund is actively managed, the relative amount of the Fund’s total distributions derived from various sources over the calendar year may change. Please note that this information should not be used for tax reporting purposes as the tax character of distributable income may differ from the amounts used for this notification. You will receive IRS tax forms in the first quarter of each calendar year detailing the actual amount of the taxable and non-taxable portion of distributions paid to you during the tax year.
For the most current information, please go to oppenheimerfunds.com. Select your Fund, then the ’Detailed’ tab; where ‘Dividends’ are shown, the Fund’s latest pay date will be followed by the sources of any distribution, updated daily.
|
Fund Name |
Pay Date |
Net Income |
Net Profit from Sale |
Other
| ||||||||||
|
Oppenheimer Global Fund/VA
|
|
6/21/16
|
|
|
11.5%
|
|
|
64.9%
|
|
23.6%
| ||||
21 OPPENHEIMER GLOBAL FUND/VA
THIS PAGE INTENTIONALLY LEFT BLANK.
22 OPPENHEIMER GLOBAL FUND/VA
THIS PAGE INTENTIONALLY LEFT BLANK.
23 OPPENHEIMER GLOBAL FUND/VA
OPPENHEIMER GLOBAL FUND/VA
A Series of Oppenheimer Variable Account Funds
| Trustees and Officers | Sam Freedman, Chairman of the Board of Trustees and Trustee | |
| Jon S. Fossel, Trustee | ||
| Richard F. Grabish, Trustee | ||
| Beverly L. Hamilton, Trustee | ||
| Victoria J. Herget, Trustee | ||
| Robert J. Malone, Trustee | ||
| F. William Marshall, Jr., Trustee | ||
| Karen L. Stuckey, Trustee | ||
| James D. Vaughn, Trustee | ||
| Arthur P. Steinmetz, Trustee, President and Principal Executive Officer | ||
| Rajeev Bhaman, Vice President | ||
| Cynthia Lo Bessette, Secretary and Chief Legal Officer | ||
| Jennifer Sexton, Vice President and Chief Business Officer | ||
| Mary Ann Picciotto, Chief Compliance Officer and Chief Anti-Money Laundering Officer | ||
| Brian S. Petersen, Treasurer and Principal Financial & Accounting Officer | ||
| Manager | OFI Global Asset Management, Inc. | |
| Sub-Adviser | OppenheimerFunds, Inc. | |
| Distributor | OppenheimerFunds Distributor, Inc. | |
| Transfer and Shareholder Servicing Agent |
OFI Global Asset Management, Inc. | |
| Sub-Transfer Agent | Shareholder Services, Inc. | |
| DBA OppenheimerFunds Services | ||
| Independent Registered Public Accounting Firm |
KPMG LLP | |
| Legal Counsel | Ropes & Gray LLP | |
| Before investing in any of the Oppenheimer funds, investors should carefully consider a fund’s investment objectives, risks, charges and expenses. Fund prospectuses and summary prospectuses contain this and other information about the funds, and may be obtained by asking your financial advisor, or calling us at 1.800.988.8287. Read prospectuses and summary prospectuses carefully before investing. | ||
| The financial statements included herein have been taken from the records of the Fund without examination of those records by the independent registered public accounting firm. | ||
| © 2016 OppenheimerFunds, Inc. All rights reserved. Oppenheimer funds are distributed by OppenheimerFunds Distributor, Inc. | ||


|
||||
| June 30, 2016 |
||||
|
Oppenheimer |
||||
| Main Street Fund®/VA |
Semiannual Report | |||
| A Series of Oppenheimer Variable Account Funds
|
||||
| SEMIANNUAL REPORT |
||||
| Listing of Top Holdings |
||||
| Fund Performance Discussion |
||||
| Financial Statements |
||||
PORTFOLIO MANAGERS: Manind Govil, CFA, Benjamin Ram and Paul Larson
AVERAGE ANNUAL TOTAL RETURNS FOR THE PERIODS ENDED 6/30/16
| Inception Date |
6-Months | 1-Year | 5-Year | 10-Year | ||||||||||||||||
| Non-Service Shares |
7/5/95 | 4.62% | 5.67% | 12.38% | 7.01% | |||||||||||||||
| Service Shares |
7/13/00 | 4.49 | 5.40 | 12.11 | 6.74 | |||||||||||||||
| S&P 500 Index |
3.84 | 3.99 | 12.10 | 7.42 | ||||||||||||||||
Performance data quoted represents past performance, which does not guarantee future results. The investment return and principal value of an investment in the Fund will fluctuate so that an investor’s shares, when redeemed, may be worth more or less than their original cost. Current performance may be lower or higher than the performance quoted. For performance data current to the most recent month end, call us at 1.800.988.8287. The Fund’s total returns should not be expected to be the same as the returns of other funds, whether or not both funds have the same portfolio managers and/or similar names. The Fund’s total returns include changes in share price and reinvested distributions but do not include the charges associated with the separate account products that offer this Fund. Such performance would have been lower if such charges were taken into account.
The Fund’s performance is compared to the performance of the S&P 500 Index. The S&P 500 Index is a broad-based measure of domestic stock performance. The Index is unmanaged and cannot be purchased directly by investors. While index comparisons may be useful to provide a benchmark for the Fund’s performance, it must be noted that the Fund’s investments are not limited to the investments comprising the Index. Index performance includes reinvestment of income, but does not reflect transaction costs, fees, expenses or taxes. Index performance is shown for illustrative purposes only as a benchmark for the Fund’s performance, and does not predict or depict performance of the Fund. The Fund’s performance reflects the effects of the Fund’s business and operating expenses.
TOP HOLDINGS AND ALLOCATIONS
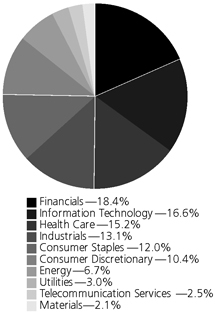
2 OPPENHEIMER MAIN STREET FUND/VA
Fund Performance Discussion
The Fund’s Non-Service shares returned 4.62% during the reporting period. In comparison, the Fund outperformed the S&P 500 Index (the “Index”), which returned 3.84%. The Fund’s outperformance relative to the Index stemmed largely from stronger relative stock selection in the financials, health care and industrials sectors. The Fund underperformed the Index in the energy and information technology sectors due primarily to stock selection, and in the telecommunication services sector as a result of an underweight position.
MARKET OVERVIEW
Markets remained turbulent during the reporting period. However, despite the volatility, the Index and the Fund experienced gains. The reporting period also saw a continued rotation away from growth stocks and into value stocks. This is a significant reversal from 2015 when growth stocks, in general, significantly outperformed. Another big trend has been demand for so called bond proxy stocks with above average dividend yields. This trend was magnified post Brexit as treasury yields, already at historic lows, were under further pressure and future rate hike expectations continued to be pushed farther out.
The reporting period saw the market driven by several important macroeconomic trends and events:
| ● | Uncertainty over when or if the Federal Reserve (the “Fed”) would raise interest rates, an especially important issue for financials. |
| ● | Continued slow but steady recovery in domestic consumer employment and consumption. |
| ● | Decelerating emerging markets growth, contributing to the weakness in export demand for commodities and other industrial products. |
| ● | Competitive currency devaluations, including negative interest rates in a growing number of jurisdictions, thrusting the world economy into uncharted territory. |
| ● | Impact of Brexit and the increased uncertainty for global markets as a result. |
As investors, it is important to know what is and what is not within one’s circle of competence. We humbly admit that accurately and consistently predicting outcomes of complex factors such as those listed above is largely outside our circle. As such, we strive to keep the portfolio in an all-weather orientation. Whether rates, commodity prices, currencies or even whole economies go up or down, our goal is to have a portfolio that can out-perform no matter the environment. If our strategy includes not making oversized macro factor bets, a reasonable question is, “What types of risks are you willing to take?” First, we believe identifying companies with sustainable competitive advantages (or economic moats, if you prefer), is squarely in the middle of our circle of competence. Second, we believe we have the skills to identify company management teams that are likely to successfully execute on their plans. Lastly, we believe that correctly valuing stocks and seeing within what expectations the market is pricing is also within our skillset. It is not by accident that we weight the portfolio more heavily towards companies that we believe have structural competitive advantages and/or management teams that are executing (e.g. gaining market share, expanding profit margins), with at least reasonable stock valuations.
Allow us to use a metaphor. If managing the portfolio was like betting on horses, we’d readily admit that we cannot predict ahead of time the weather or track conditions. But we do believe we can find the strongest horses (advantaged business models), the best jockeys (executing management teams), and can see when the payoff odds are in our favor (when valuations appear reasonable). To offset our agnostic position on the conditions, we seek to ensure we have some horses in the stable that will win no matter the weather. In short, it boils down to mostly stock selection.
TOP INDIVIDUAL CONTRIBUTORS
Top contributors to the Fund’s performance this period included Kraft Heinz Co., Philip Morris International, Inc. and Johnson & Johnson.
Kraft Heinz produces processed food and beverages. The company delivered improved top line trends which had been an investor concern while also continuing to make dramatic improvements in its cost structure.
3 OPPENHEIMER MAIN STREET FUND/VA
Philip Morris is the world’s second largest tobacco company—selling tobacco-related products internationally outside the U.S. The stock benefited as management continued to execute well, which has led to share gains in many markets worldwide. Additionally, as the U.S. dollar flattened (relative to other currencies), the stock was boosted further as investors appear to expect the pressure on the company’s earnings—from a strengthening dollar—to subside.
Johnson & Johnson is engaged in the research and development, manufacture and sale of products in the health care industry. The company reported positive earnings results due in part to strong prescription drug revenue and a weakening dollar. Johnson & Johnson also announced that it expects to increase profit margins this year, partly due to cost cuts.
TOP INDIVIDUAL DETRACTORS
Detractors from performance this reporting period included Citigroup, Inc., Alphabet, Inc. and Express Scripts Holding Co.
Starting with Citigroup, over the first half of the reporting period, the stock, along with other large banking companies, underperformed largely as a result of inaction by the Fed. Net interest margins—a key metric of profitability—were under pressure as interest rates remained low. Investors had expected that with a rise in short-term rates, this measure of profitability would expand, providing a boost to earnings growth over the near- to-mid-term. Though the Fed indeed raised rates in December, weak economic data greatly decreased the likelihood that more rate hikes are coming, pressuring Citigroup and its peers. We keep Citi in the portfolio because the overall company is strengthened by selling non-core operations. In addition, the stock has the potential to benefit if interest rates rise.
Alphabet, the holding company of Google, reported a decent quarter, yet the results did not satisfy elevated investor expectations. With very widespread ownership, the stock experienced declines following the earnings release, yet we continue to believe that the company is on the right side of secular trends in the advertising market.
The stock of pharmacy benefit manager (PBM) Express Scripts Holding suffered as the company is in a dispute with its largest customer, Anthem, over pricing. We believe the company’s stock price reflects the potential loss of Anthem and the dispute should only have a modest impact on Express’ selling season.
STRATEGY & OUTLOOK
While bottom-up company research and stock selection continue to be central to our process and strategy, we do have some observations about the current environment. First, the U.S. economy continues its “slow and steady” growth. This is being driven by favorable employment and inflation data while home prices and innovation also continue to help drive the economy higher. However, rhetoric around Brexit and U.S. elections could cause global contagion by slowing global trade.
Secondly, U.S. corporate revenues, earnings, and free cash flow seem have topped out for the near term, but earnings growth may resume due to productivity improvements. The energy and industrials sectors have also showed signs of bottoming. Additionally, while we have previously seen revenue and accounting earnings growth, it has not translated into commensurate cash available for shareholders. From a valuation perspective, U.S. equities look favorable based on current interest rate levels.
We remain laser-focused on the rise in “accounting shenanigans” and the rising spread between Generally Accepted Accounting Principles (GAAP) earnings and pro-forma adjusted earnings. While these two measurements have always diverged, the historical normal spread has increased from approximately 5-10% to 30%. This, combined with ongoing financial engineering, e.g., tax inversions and other obfuscations, have caused us to place increasing emphasis on judging the attractiveness of an investment based on free cash flow, rather than earnings.
Though we remain overweight financials, the mix of our position skews towards non-lender financials such as CME Group. In addition to Net Interest Margin pressure, we expect credit to start increasing. But this expectation is increasingly being priced in.
We believe the risks inherent to this market include the misallocation of capital, fueled by an environment of ongoing relatively low interest rates and possibly leading to “bubble-like” valuations for some companies. We intend to maintain our discipline around valuation. Additionally, while innovation is alive and well and continuing to help generate economic growth, fundamental disruptions across market segments have been elevated. We continue to be focused on potential disruption risk to our companies.
Traditionally, during periods of economic uncertainty and heightened market volatility, investors favor stocks of higher quality companies—with greater consistency and stability of revenue and earnings— leading to relatively better stock performance of those companies. We think focusing on companies with
4 OPPENHEIMER MAIN STREET FUND/VA
economic moats and skilled management teams positions us well, should this environment come to pass. During times of economic volatility such companies frequently widen their lead over weaker competitors. We seek to invest in companies, characterized by these qualities, at compelling valuations and believe this disciplined approach has the potential to generate superior long-term performance.
The Fund’s investment strategy and focus can change over time. The mention of specific fund holdings does not constitute a recommendation by OppenheimerFunds, Inc. or its affiliates.
Shares of Oppenheimer funds are not deposits or obligations of any bank, are not guaranteed by any bank, are not insured by the FDIC or any other agency, and involve investment risks, including the possible loss of the principal amount invested.
5 OPPENHEIMER MAIN STREET FUND/VA
Fund Expenses
Fund Expenses. As a shareholder of the Fund, you incur two types of costs: (1) transaction costs and (2) ongoing costs, including management fees; distribution and service fees; and other Fund expenses. These examples are intended to help you understand your ongoing costs (in dollars) of investing in the Fund and to compare these costs with the ongoing costs of investing in other mutual funds.
The examples are based on an investment of $1,000.00 invested at the beginning of the period and held for the entire 6-month period ended June 30, 2016.
Actual Expenses. The first section of the table provides information about actual account values and actual expenses. You may use the information in this section for the class of shares you hold, together with the amount you invested, to estimate the expense that you paid over the period. Simply divide your account value by $1,000.00 (for example, an $8,600.00 account value divided by $1,000.00 = 8.60), then multiply the result by the number in the first section under the heading entitled “Expenses Paid During 6 Months Ended June 30, 2016” to estimate the expenses you paid on your account during this period.
Hypothetical Example for Comparison Purposes.
The second section of the table provides information about hypothetical account values and hypothetical expenses based on the Fund’s actual expense ratio for each class of shares, and an assumed rate of return of 5% per year for each class before expenses, which is not the actual return. The hypothetical account values and expenses may not be used to estimate the actual ending account balance or expenses you paid for the period. You may use this information to compare the ongoing costs of investing in the Fund and other funds. To do so, compare this 5% hypothetical example for the class of shares you hold with the 5% hypothetical examples that appear in the shareholder reports of the other funds.
Please note that the expenses shown in the table are meant to highlight your ongoing costs only and do not reflect any charges associated with the separate accounts that offer this Fund. Therefore, the “hypothetical” lines of the table are useful in comparing ongoing costs only, and will not help you determine the relative total costs of owning different funds. In addition, if these separate account charges were included your costs would have been higher.
| Actual | Beginning Account Value |
Ending Value |
Expenses Paid During |
|||||||||
| Non-Service shares |
$ | 1,000.00 | $ | 1,046.20 | $ | 4.03 | ||||||
| Service shares |
1,000.00 | 1,044.90 | 5.30 | |||||||||
| Hypothetical | ||||||||||||
| (5% return before expenses)
|
||||||||||||
| Non-Service shares |
1,000.00 | 1,020.93 | 3.98 | |||||||||
| Service shares |
1,000.00 | 1,019.69 | 5.24 | |||||||||
Expenses are equal to the Fund’s annualized expense ratio for that class, multiplied by the average account value over the period, multiplied by 182/366 (to reflect the one-half year period). Those annualized expense ratios, excluding indirect expenses from affiliated funds, based on the 6-month period ended June 30, 2016 are as follows:
| Class | Expense Ratios | |||
| Non-Service shares |
0.79% | |||
| Service shares |
1.04 | |||
The expense ratios reflect voluntary and/or contractual waivers and/or reimbursements of expenses by the Fund’s Manager. Some of these undertakings may be modified or terminated at any time, as indicated in the Fund’s prospectus. The “Financial Highlights” tables in the Fund’s financial statements, included in this report, also show the gross expense ratios, without such waivers or reimbursements and reduction to custodian expenses, if applicable.
6 OPPENHEIMER MAIN STREET FUND/VA
STATEMENT OF INVESTMENTS June 30, 2016 Unaudited
7 OPPENHEIMER MAIN STREET FUND/VA
STATEMENT OF INVESTMENTS Unaudited / Continued
Footnotes to Statement of Investments
1. Non-income producing security.
2. Security is a Master Limited Partnership.
3. Rate shown is the 7-day yield at period end.
4. Is or was an affiliate, as defined in the Investment Company Act of 1940, as amended, at or during the reporting period, by virtue of the Fund owning at least 5% of the voting securities of the issuer or as a result of the Fund and the issuer having the same investment adviser. Transactions during the reporting period in which the issuer was an affiliate are as follows:
| Shares December 31, 2015 |
Gross Additions |
Gross Reductions |
Shares June 30, 2016 |
|||||||||||||
|
|
||||||||||||||||
| Oppenheimer Institutional Money Market Fund, Cl. E | 18,174,708 | 123,249,783 | 122,932,525 | 18,491,966 | ||||||||||||
| Value | Income | |||||||||||||||
|
|
||||||||||||||||
| Oppenheimer Institutional Money Market Fund, Cl. E | $ | 18,491,966 | $ | 52,690 | ||||||||||||
See accompanying Notes to Financial Statements.
8 OPPENHEIMER MAIN STREET FUND/VA
STATEMENT OF ASSETS AND LIABILITIES June 30, 2016 Unaudited
|
|
||||
| Assets |
||||
| Investments, at value—see accompanying statement of investments: | ||||
| Unaffiliated companies (cost $896,229,405) | $ | 1,201,558,260 | ||
| Affiliated companies (cost $18,491,966) | 18,491,966 | |||
|
|
|
|||
| 1,220,050,226 | ||||
|
|
||||
| Cash | 750,303 | |||
|
|
||||
| Receivables and other assets: | ||||
| Investments sold | 10,447,560 | |||
| Dividends | 2,192,090 | |||
| Shares of beneficial interest sold | 422,721 | |||
| Other | 92,741 | |||
|
|
|
|||
| Total assets | 1,233,955,641 | |||
|
|
||||
| Liabilities |
||||
| Payables and other liabilities: | ||||
| Investments purchased | 1,789,576 | |||
| Shares of beneficial interest redeemed | 1,647,983 | |||
| Distribution and service plan fees | 145,059 | |||
| Trustees’ compensation | 81,524 | |||
| Shareholder communications | 26,119 | |||
| Other | 18,882 | |||
|
|
|
|||
| Total liabilities | 3,709,143 | |||
|
|
||||
| Net Assets | $ | 1,230,246,498 | ||
|
|
|
|||
|
|
||||
| Composition of Net Assets |
||||
| Par value of shares of beneficial interest | $ | 46,429 | ||
|
|
||||
| Additional paid-in capital | 920,790,744 | |||
|
|
||||
| Accumulated net investment income | 5,796,952 | |||
|
|
||||
| Accumulated net realized loss on investments and foreign currency transactions | (1,704,934) | |||
|
|
||||
| Net unrealized appreciation on investments and translation of assets and liabilities denominated in foreign currencies | 305,317,307 | |||
|
|
|
|||
| Net Assets | $ | 1,230,246,498 | ||
|
|
|
|||
|
|
||||
| Net Asset Value Per Share |
||||
|
Non-Service Shares: |
||||
|
Net asset value, redemption price per share and offering price per share (based on net assets of $516,813,515 and 19,405,755 shares of beneficial interest outstanding) |
$26.63 | |||
|
|
||||
|
Service Shares: |
||||
|
Net asset value, redemption price per share and offering price per share (based on net assets of $713,432,983 and 27,023,127 shares of beneficial interest outstanding) |
$26.40 | |||
See accompanying Notes to Financial Statements.
9 OPPENHEIMER MAIN STREET FUND/VA
STATEMENT OF OPERATIONS For the Six Months Ended June 30, 2016 Unaudited
|
|
||||
| Investment Income |
||||
| Dividends: | ||||
| Unaffiliated companies (net of foreign withholding taxes of $65,655) | $ | 11,427,305 | ||
| Affiliated companies | 52,690 | |||
|
|
||||
| Interest | 18 | |||
|
|
|
|||
| Total investment income
|
|
11,480,013
|
| |
|
|
||||
| Expenses |
||||
| Management fees | 3,932,931 | |||
|
|
||||
| Distribution and service plan fees - Service shares | 849,144 | |||
|
|
||||
| Transfer and shareholder servicing agent fees: | ||||
| Non-Service shares | 248,758 | |||
| Service shares | 340,168 | |||
|
|
||||
| Shareholder communications: | ||||
| Non-Service shares | 25,206 | |||
| Service shares | 34,452 | |||
|
|
||||
| Trustees’ compensation | 25,297 | |||
|
|
||||
| Borrowing fees | 10,661 | |||
|
|
||||
| Custodian fees and expenses | 3,823 | |||
|
|
||||
| Other | 40,161 | |||
|
|
|
|||
| Total expenses | 5,510,601 | |||
| Less reduction to custodian expenses | (249) | |||
| Less waivers and reimbursements of expenses | (11,522) | |||
|
|
|
|||
| Net expenses
|
|
5,498,830
|
| |
|
|
||||
| Net Investment Income
|
|
5,981,183
|
| |
|
|
||||
| Realized and Unrealized Gain |
||||
| Net realized gain on: | ||||
| Investments from unaffiliated companies | 2,535,631 | |||
| Foreign currency transactions | 9,147 | |||
|
|
|
|||
| Net realized gain | 2,544,778 | |||
|
|
||||
| Net change in unrealized appreciation/depreciation on: | ||||
| Investments | 41,555,530 | |||
| Translation of assets and liabilities denominated in foreign currencies | 1,505,297 | |||
|
|
|
|||
| Net change in unrealized appreciation/depreciation
|
|
43,060,827
|
| |
|
|
||||
| Net Increase in Net Assets Resulting from Operations | $ | 51,586,788 | ||
|
|
|
|||
See accompanying Notes to Financial Statements.
10 OPPENHEIMER MAIN STREET FUND/VA
STATEMENTS OF CHANGES IN NET ASSETS
| Six Months Ended June 30, 2016 (Unaudited) |
Year Ended December 31, 2015 |
|||||||
|
|
||||||||
| Operations |
||||||||
| Net investment income | $ | 5,981,183 | $ | 11,743,405 | ||||
|
|
||||||||
| Net realized gain | 2,544,778 | 162,442,794 | ||||||
|
|
||||||||
| Net change in unrealized appreciation/depreciation | 43,060,827 | (133,007,686) | ||||||
|
|
|
|||||||
| Net increase in net assets resulting from operations |
|
51,586,788
|
|
|
41,178,513
|
| ||
|
|
||||||||
| Dividends and/or Distributions to Shareholders |
||||||||
| Dividends from net investment income: | ||||||||
| Non-Service shares | (5,704,268) | (5,010,080) | ||||||
| Service shares | (6,065,396) | (4,935,637) | ||||||
|
|
|
|||||||
|
|
(11,769,664)
|
|
|
(9,945,717)
|
| |||
|
|
||||||||
| Distributions from net realized gain: | ||||||||
| Non-Service shares | (60,632,296) | (81,805,950) | ||||||
| Service shares | (84,601,632) | (115,456,402) | ||||||
|
|
|
|||||||
|
|
(145,233,928)
|
|
|
(197,262,352)
|
| |||
|
|
||||||||
| Beneficial Interest Transactions |
||||||||
| Net increase in net assets resulting from beneficial interest transactions: | ||||||||
| Non-Service shares | 42,281,521 | 27,294,558 | ||||||
| Service shares | 59,597,554 | 6,563,579 | ||||||
|
|
|
|||||||
|
|
101,879,075
|
|
|
33,858,137
|
| |||
|
|
||||||||
| Net Assets |
||||||||
| Total decrease | (3,537,729) | (132,171,419) | ||||||
|
|
||||||||
| Beginning of period | 1,233,784,227 | 1,365,955,646 | ||||||
|
|
|
|||||||
| End of period (including accumulated net investment income of $5,796,952 and $11,585,433, respectively) | $ | 1,230,246,498 | $ | 1,233,784,227 | ||||
|
|
|
|||||||
See accompanying Notes to Financial Statements.
11 OPPENHEIMER MAIN STREET FUND/VA
FINANCIAL HIGHLIGHTS
| Non-Service Shares | Six Months Ended June 30, 2016 (Unaudited) |
Year Ended December 31, 2015 |
Year Ended December 31, 2014 |
Year Ended December 31, 2013 |
Year Ended December 31, 2012 |
Year Ended December 30, 20111 |
||||||||||||||||||
|
|
||||||||||||||||||||||||
| Per Share Operating Data |
||||||||||||||||||||||||
| Net asset value, beginning of period | $ | 29.24 | $ | 33.61 | $ | 31.24 | $ | 23.97 | $ | 20.71 | $ | 20.88 | ||||||||||||
|
|
||||||||||||||||||||||||
| Income (loss) from investment operations: | ||||||||||||||||||||||||
| Net investment income2 | 0.17 | 0.33 | 0.28 | 0.24 | 0.26 | 0.16 | ||||||||||||||||||
| Net realized and unrealized gain (loss) | 1.14 | 0.80 | 3.01 | 7.33 | 3.22 | (0.16) | ||||||||||||||||||
|
|
|
|||||||||||||||||||||||
| Total from investment operations | 1.31 | 1.13 | 3.29 | 7.57 | 3.48 | 0.00 | ||||||||||||||||||
|
|
||||||||||||||||||||||||
| Dividends and/or distributions to shareholders: | ||||||||||||||||||||||||
| Dividends from net investment income | (0.34) | (0.32) | (0.27) | (0.30) | (0.22) | (0.17) | ||||||||||||||||||
| Distributions from net realized gain | (3.58) | (5.18) | (0.65) | 0.00 | 0.00 | 0.00 | ||||||||||||||||||
|
|
|
|||||||||||||||||||||||
| Total dividends and/or distributions to shareholders | (3.92) | (5.50) | (0.92) | (0.30) | (0.22) | (0.17) | ||||||||||||||||||
|
|
||||||||||||||||||||||||
| Net asset value, end of period | $ | 26.63 | $ | 29.24 | $ | 33.61 | $ | 31.24 | $ | 23.97 | $ | 20.71 | ||||||||||||
|
|
|
|||||||||||||||||||||||
|
|
||||||||||||||||||||||||
| Total Return, at Net Asset Value3 |
4.62% | 3.33% | 10.70% | 31.77% | 16.87% | (0.01)% | ||||||||||||||||||
|
|
||||||||||||||||||||||||
| Ratios/Supplemental Data |
||||||||||||||||||||||||
| Net assets, end of period (in thousands) | $ | 516,813 | $ | 518,456 | $ | 559,933 | $ | 561,016 | $ | 481,089 | $ | 392,861 | ||||||||||||
|
|
||||||||||||||||||||||||
| Average net assets (in thousands) | $ | 500,039 | $ | 541,020 | $ | 554,449 | $ | 517,750 | $ | 466,231 | $ | 426,354 | ||||||||||||
|
|
||||||||||||||||||||||||
| Ratios to average net assets:4 | ||||||||||||||||||||||||
| Net investment income | 1.16% | 1.05% | 0.86% | 0.87% | 1.12% | 0.79% | ||||||||||||||||||
| Expenses excluding specific expenses listed below | 0.79% | 0.78% | 0.77% | 0.78% | 0.78% | 0.78% | ||||||||||||||||||
| Interest and fees from borrowings | 0.00%5 | 0.00%5 | 0.00% | 0.00% | 0.00% | 0.00% | ||||||||||||||||||
|
|
|
|||||||||||||||||||||||
| Total expenses6 | 0.79% | 0.78% | 0.77% | 0.78% | 0.78% | 0.78% | ||||||||||||||||||
| Expenses after payments, waivers and/or reimbursements and reduction to custodian expenses | 0.79% | 0.78% | 0.77% | 0.78% | 0.78% | 0.78% | ||||||||||||||||||
|
|
||||||||||||||||||||||||
| Portfolio turnover rate | 16% | 44% | 43% | 49% | 37% | 38% | ||||||||||||||||||
1. December 30, 2011 represents the last business day of the Fund’s reporting period. See Note 2 of the accompanying Notes.
2. Per share amounts calculated based on the average shares outstanding during the period.
3. Assumes an initial investment on the business day before the first day of the fiscal period, with all dividends and distributions reinvested in additional shares on the reinvestment date, and redemption at the net asset value calculated on the last business day of the fiscal period. Total returns are not annualized for periods less than one full year. Total return information does not reflect expenses that apply at the separate account level or to related insurance products. Inclusion of these charges would reduce the total return figures for all periods shown. Returns do not reflect the deduction of taxes that a shareholder would pay on fund distributions or the redemption of fund shares.
4. Annualized for periods less than one full year.
5. Less than 0.005%.
6. Total expenses including indirect expenses from affiliated fund fees and expenses were as follows:
| Six Months Ended June 30, 2016 |
0.79 | % | ||||
| Year Ended December 31, 2015 |
0.78 | % | ||||
| Year Ended December 31, 2014 |
0.77 | % | ||||
| Year Ended December 31, 2013 |
0.78 | % | ||||
| Year Ended December 31, 2012 |
0.78 | % | ||||
| Year Ended December 30, 2011 |
0.78 | % |
See accompanying Notes to Financial Statements.
12 OPPENHEIMER MAIN STREET FUND/VA
| Service Shares | Six Months Ended June 30, 2016 |
Year Ended December 31, |
Year Ended December 31, 2014 |
Year Ended December 31, |
Year Ended 2012 |
Year Ended December 30, |
||||||||||||||||||
|
|
||||||||||||||||||||||||
| Per Share Operating Data |
||||||||||||||||||||||||
| Net asset value, beginning of period | $ | 28.98 | $ | 33.33 | $ | 30.99 | $ | 23.78 | $ | 20.53 | $ | 20.71 | ||||||||||||
|
|
||||||||||||||||||||||||
| Income (loss) from investment operations: | ||||||||||||||||||||||||
| Net investment income2 | 0.13 | 0.25 | 0.19 | 0.17 | 0.20 | 0.11 | ||||||||||||||||||
| Net realized and unrealized gain (loss) | 1.13 | 0.80 | 2.99 | 7.27 | 3.20 | (0.17) | ||||||||||||||||||
|
|
|
|||||||||||||||||||||||
| Total from investment operations | 1.26 | 1.05 | 3.18 | 7.44 | 3.40 | (0.06) | ||||||||||||||||||
|
|
||||||||||||||||||||||||
| Dividends and/or distributions to shareholders: | ||||||||||||||||||||||||
| Dividends from net investment income | (0.26) | (0.22) | (0.19) | (0.23) | (0.15) | (0.12) | ||||||||||||||||||
| Distributions from net realized gain | (3.58) | (5.18) | (0.65) | 0.00 | 0.00 | 0.00 | ||||||||||||||||||
|
|
|
|||||||||||||||||||||||
| Total dividends and/or distributions to shareholders | (3.84) | (5.40) | (0.84) | (0.23) | (0.15) | (0.12) | ||||||||||||||||||
|
|
||||||||||||||||||||||||
| Net asset value, end of period | $ | 26.40 | $ | 28.98 | $ | 33.33 | $ | 30.99 | $ | 23.78 | $ | 20.53 | ||||||||||||
|
|
|
|||||||||||||||||||||||
|
|
||||||||||||||||||||||||
|
|
||||||||||||||||||||||||
| Total Return, at Net Asset Value3 |
4.49% | 3.11% | 10.40% | 31.44% | 16.61% | (0.32)% | ||||||||||||||||||
|
|
||||||||||||||||||||||||
|
|
||||||||||||||||||||||||
| Ratios/Supplemental Data |
||||||||||||||||||||||||
| Net assets, end of period (in thousands) | $ | 713,433 | $ | 715,328 | $ | 806,023 | $ | 915,027 | $ | 869,372 | $ | 1,003,184 | ||||||||||||
|
|
||||||||||||||||||||||||
| Average net assets (in thousands) | $ | 683,770 | $ | 757,218 | $ | 856,467 | $ | 895,073 | $ | 913,871 | $ | 1,094,254 | ||||||||||||
|
|
||||||||||||||||||||||||
| Ratios to average net assets:4 | ||||||||||||||||||||||||
| Net investment income | 0.91% | 0.80% | 0.61% | 0.62% | 0.85% | 0.54% | ||||||||||||||||||
| Expenses excluding specific expenses listed below | 1.04% | 1.03% | 1.02% | 1.04% | 1.03% | 1.03% | ||||||||||||||||||
| Interest and fees from borrowings | 0.00%5 | 0.00%5 | 0.00% | 0.00% | 0.00% | 0.00% | ||||||||||||||||||
|
|
|
|||||||||||||||||||||||
| Total expenses6 | 1.04% | 1.03% | 1.02% | 1.04% | 1.03% | 1.03% | ||||||||||||||||||
| Expenses after payments, waivers and/or reimbursements and reduction to custodian expenses | 1.04% | 1.03% | 1.02% | 1.04% | 1.03% | 1.03% | ||||||||||||||||||
|
|
||||||||||||||||||||||||
| Portfolio turnover rate | 16% | 44% | 43% | 49% | 37% | 38% | ||||||||||||||||||
1. December 30, 2011 represents the last business day of the Fund’s reporting period. See Note 2 of the accompanying Notes.
2. Per share amounts calculated based on the average shares outstanding during the period.
3. Assumes an initial investment on the business day before the first day of the fiscal period, with all dividends and distributions reinvested in additional shares on the reinvestment date, and redemption at the net asset value calculated on the last business day of the fiscal period. Total returns are not annualized for periods less than one full year. Total return information does not reflect expenses that apply at the separate account level or to related insurance products. Inclusion of these charges would reduce the total return figures for all periods shown. Returns do not reflect the deduction of taxes that a shareholder would pay on fund distributions or the redemption of fund shares.
4. Annualized for periods less than one full year.
5. Less than 0.005%.
6. Total expenses including indirect expenses from affiliated fund fees and expenses were as follows:
| Six Months Ended June 30, 2016 |
1.04% | |||||
| Year Ended December 31, 2015 |
1.03% | |||||
| Year Ended December 31, 2014 |
1.02% | |||||
| Year Ended December 31, 2013 |
1.04% | |||||
| Year Ended December 31, 2012 |
1.03% | |||||
| Year Ended December 30, 2011 |
1.03% |
See accompanying Notes to Financial Statements.
13 OPPENHEIMER MAIN STREET FUND/VA
NOTES TO FINANCIAL STATEMENTS June 30, 2016 Unaudited
1. Organization
Oppenheimer Main Street Fund/VA (the “Fund”), a separate series of Oppenheimer Variable Account Funds, is a diversified open-end management investment company registered under the Investment Company Act of 1940 (“1940 Act”), as amended. The Fund’s investment objective is to seek capital appreciation. The Fund’s investment adviser is OFI Global Asset Management, Inc. (“OFI Global” or the “Manager”), a wholly-owned subsidiary of OppenheimerFunds, Inc. (“OFI” or the “Sub-Adviser”). The Manager has entered into a sub-advisory agreement with OFI. Shares of the Fund are sold only to separate accounts of life insurance companies.
The Fund offers two classes of shares. Both classes are sold at their offering price, which is the net asset value per share, to separate investment accounts of participating insurance companies as an underlying investment for variable life insurance policies, variable annuity contracts or other investment products. The class of shares designated as Service shares is subject to a distribution and service plan. Both classes of shares have identical rights and voting privileges with respect to the Fund in general and exclusive voting rights on matters that affect that class alone. Earnings, net assets and net asset value per share may differ due to each class having its own expenses, such as transfer and shareholder servicing agent fees and shareholder communications, directly attributable to that class.
The following is a summary of significant accounting policies followed in the Fund’s preparation of financial statements in accordance with accounting principles generally accepted in the United States (“U.S. GAAP”).
2. Significant Accounting Policies
Security Valuation. All investments in securities are recorded at their estimated fair value, as described in Note 3.
Reporting Period End Date. The last day of the Fund’s reporting period is the last day the New York Stock Exchange was open for trading during the period. The Fund’s financial statements have been presented through that date to maintain consistency with the Fund’s net asset value calculations used for shareholder transactions.
Foreign Currency Translation. The Fund’s accounting records are maintained in U.S. dollars. The values of securities denominated in foreign currencies and amounts related to the purchase and sale of foreign securities and foreign investment income are translated into U.S. dollars as of the close of the New York Stock Exchange (the “Exchange”), normally 4:00 P.M. Eastern time, on each day the Exchange is open for trading. Foreign exchange rates may be valued primarily using a reliable bank, dealer or service authorized by the Board of Trustees.
Reported net realized gains and losses from foreign currency transactions arise from sales of portfolio securities, sales and maturities of short-term securities, sales of foreign currencies, exchange rate fluctuations between the trade and settlement dates on securities transactions, and the difference between the amounts of dividends, interest, and foreign withholding taxes recorded on the Fund’s books and the U.S. dollar equivalent of the amounts actually received or paid. Net unrealized appreciation and depreciation on the translation of assets and liabilities denominated in foreign currencies arise from changes in the values of assets and liabilities, including investments in securities at fiscal period end, resulting from changes in exchange rates.
The effect of changes in foreign currency exchange rates on investments is separately identified from the fluctuations arising from changes in market values of securities held and reported with all other foreign currency gains and losses in the Fund’s Statement of Operations.
Allocation of Income, Expenses, Gains and Losses. Income, expenses (other than those attributable to a specific class), gains and losses are allocated on a daily basis to each class of shares based upon the relative proportion of net assets represented by such class. Operating expenses directly attributable to a specific class are charged against the operations of that class.
Dividends and Distributions to Shareholders. Dividends and distributions to shareholders, which are determined in accordance with income tax regulations and may differ from U.S. GAAP, are recorded on the ex-dividend date. Income and capital gain distributions, if any, are declared and paid annually or at other times as deemed necessary by the Manager.
The tax character of distributions is determined as of the Fund’s fiscal year end. Therefore, a portion of the Fund’s distributions made to shareholders prior to the Fund’s fiscal year end may ultimately be categorized as a tax return of capital.
Investment Income. Dividend income is recorded on the ex-dividend date or upon ex-dividend notification in the case of certain foreign dividends where the ex-dividend date may have passed. Non-cash dividends included in dividend income, if any, are recorded at the fair market value of the securities received. Interest income is recognized on an accrual basis. Discount and premium, which are included in interest income on the Statement of Operations, are amortized or accreted daily.
Return of Capital Estimates. Distributions received from the Fund’s investments in Master Limited Partnerships (MLPs) and Real Estate Investments Trusts (REITs), generally are comprised of income and return of capital. The Fund records investment income and return of capital based on estimates. Such estimates are based on historical information available from each MLP, REIT and other industry sources. These estimates may subsequently be revised based on information received from MLPs and REITs after their tax reporting periods are concluded.
Custodian Fees. “Custodian fees and expenses” in the Statement of Operations may include interest expense incurred by the Fund on any cash overdrafts of its custodian account during the period. Such cash overdrafts may result from the effects of failed trades in portfolio securities and from cash outflows resulting from unanticipated shareholder redemption activity. The Fund pays interest to its custodian on such cash overdrafts, to the extent they are not offset by positive cash balances maintained by the Fund, at a rate equal to the Federal Funds Rate plus 0.50%. The “Reduction to custodian
14 OPPENHEIMER MAIN STREET FUND/VA
2. Significant Accounting Policies (Continued)
expenses” line item, if applicable, represents earnings on cash balances maintained by the Fund during the period. Such interest expense and other custodian fees may be paid with these earnings.
Security Transactions. Security transactions are recorded on the trade date. Realized gains and losses on securities sold are determined on the basis of identified cost.
Indemnifications. The Fund’s organizational documents provide current and former Trustees and officers with a limited indemnification against liabilities arising in connection with the performance of their duties to the Fund. In the normal course of business, the Fund may also enter into contracts that provide general indemnifications. The Fund’s maximum exposure under these arrangements is unknown as this would be dependent on future claims that may be made against the Fund. The risk of material loss from such claims is considered remote.
Federal Taxes. The Fund intends to comply with provisions of the Internal Revenue Code applicable to regulated investment companies and to distribute substantially all of its investment company taxable income to shareholders. Therefore, no federal income or excise tax provision is required. The Fund files income tax returns in U.S. federal and applicable state jurisdictions. The statute of limitations on the Fund’s tax return filings generally remains open for the three preceding fiscal reporting period ends. The Fund has analyzed its tax positions for the fiscal year ended December 31, 2015, including open tax years, and does not believe there are any uncertain tax positions requiring recognition in the Fund’s financial statements.
During the fiscal year ended December 31, 2015, the Fund utilized $2,513,988 of capital loss carryforward to offset capital gains realized in that fiscal year. Details of the fiscal year ended December 31, 2015 capital loss carryforwards are included in the table below. Capital loss carryforwards with no expiration, if any, must be utilized prior to those with expiration dates. Capital losses with no expiration will be carried forward to future years if not offset by gains.
| Expiring | ||||
|
|
||||
| 2016 | $ | 2,513,988 | ||
At period end, it is estimated that the Fund will not have any capital loss carryforwards. The estimated capital loss carryforward represents the carryforward as of the end of the last fiscal year, increased or decreased by capital losses or gains realized in the first six months of the current fiscal year. During the reporting period, it is estimated that the Fund will utilize $2,513,988 of capital loss carryforward to offset realized capital gains.
Net investment income (loss) and net realized gain (loss) may differ for financial statement and tax purposes. The character of dividends and distributions made during the fiscal year from net investment income or net realized gains are determined in accordance with federal income tax requirements, which may differ from the character of net investment income or net realized gains presented in those financial statements in accordance with U.S. GAAP. Also, due to timing of dividends and distributions, the fiscal year in which amounts are distributed may differ from the fiscal year in which the income or net realized gain was recorded by the Fund.
The aggregate cost of securities and other investments and the composition of unrealized appreciation and depreciation of securities and other investments for federal income tax purposes at period end are noted in the following table. The primary difference between book and tax appreciation or depreciation of securities and other investments, if applicable, is attributable to the tax deferral of losses or tax realization of financial statement unrealized gain or loss.
| Federal tax cost of securities |
$ | 916,603,718 | ||
|
|
|
|||
| Gross unrealized appreciation |
$ | 315,205,760 | ||
| Gross unrealized depreciation |
(11,759,252) | |||
|
|
|
|||
| Net unrealized appreciation |
$ | 303,446,508 | ||
|
|
|
Use of Estimates. The preparation of financial statements in conformity with U.S. GAAP requires management to make estimates and assumptions that affect the reported amounts of assets and liabilities and disclosure of contingent assets and liabilities at the date of the financial statements and the reported amounts of increases and decreases in net assets from operations during the reporting period. Actual results could differ from those estimates.
3. Securities Valuation
The Fund calculates the net asset value of its shares as of 4:00 P.M. Eastern time, on each day the New York Stock Exchange (the “Exchange”) is open for trading, except in the case of a scheduled early closing of the Exchange, in which case the Fund will calculate net asset value of the shares as of the scheduled early closing time of the Exchange.
The Fund’s Board has adopted procedures for the valuation of the Fund’s securities and has delegated the day-to-day responsibility for valuation determinations under those procedures to the Manager. The Manager has established a Valuation Committee which is responsible for determining a “fair valuation” for any security for which market quotations are not “readily available.” The Valuation Committee’s fair valuation determinations are subject to review, approval and ratification by the Fund’s Board at its next regularly scheduled meeting covering the calendar quarter in which the fair valuation was determined.
15 OPPENHEIMER MAIN STREET FUND/VA
NOTES TO FINANCIAL STATEMENTS Unaudited / Continued
3. Securities Valuation (Continued)
Valuation Methods and Inputs
Securities are valued using unadjusted quoted market prices, when available, as supplied primarily by third party pricing services or dealers.
The following methodologies are used to determine the market value or the fair value of the types of securities described below:
Securities traded on a registered U.S. securities exchange (including exchange-traded derivatives other than futures and futures options) are valued based on the last sale price of the security reported on the principal exchange on which it is traded, prior to the time when the Fund’s assets are valued. In the absence of a sale, the security is valued at the mean between the bid and asked price on the principal exchange or, if not available from the principal exchange, obtained from two dealers. If bid and asked prices are not available from either the exchange or two dealers, the security is valued by using one of the following methodologies (listed in order of priority): (1) a bid from the principal exchange, (2) the mean between the bid and asked price as provided by a single dealer, or (3) a bid from a single dealer. A security of a foreign issuer traded on a foreign exchange, but not listed on a registered U.S. securities exchange, is valued based on the last sale price on the principal exchange on which the security is traded, as identified by the third party pricing service used by the Manager, prior to the time when the Fund’s assets are valued. If the last sale price is unavailable, the security is valued at the most recent official closing price on the principal exchange on which it is traded. If the last sales price or official closing price for a foreign security is not available, the security is valued at the mean between the bid and asked price per the exchange or, if not available from the exchange, obtained from two dealers. If bid and asked prices are not available from either the exchange or two dealers, the security is valued by using one of the following methodologies (listed in order of priority): (1) a bid from the exchange, (2) the mean between the bid and asked price as provided by a single dealer, or (3) a bid from a single dealer.
Shares of a registered investment company that are not traded on an exchange are valued at that investment company’s net asset value per share.
Corporate and government debt securities (of U.S. or foreign issuers) and municipal debt securities, event-linked bonds, loans, mortgage-backed securities, collateralized mortgage obligations, and asset-backed securities are valued at the mean between the “bid” and “asked” prices utilizing evaluated prices obtained from third party pricing services or broker-dealers who may use matrix pricing methods to determine the evaluated prices.
Short-term money market type debt securities with a remaining maturity of sixty days or less are valued at cost adjusted by the amortization of discount or premium to maturity (amortized cost), which approximates market value. Short-term debt securities with a remaining maturity in excess of sixty days are valued at the mean between the “bid” and “asked” prices utilizing evaluated prices obtained from third party pricing services or broker-dealers.
A description of the standard inputs that may generally be considered by the third party pricing vendors in determining their evaluated prices is provided below.
| Security Type | Standard inputs generally considered by third-party pricing vendors | |
| Corporate debt, government debt, municipal, mortgage-backed and asset-backed securities | Reported trade data, broker-dealer price quotations, benchmark yields, issuer spreads on comparable securities, the credit quality, yield, maturity, and other appropriate factors. | |
| Loans | Information obtained from market participants regarding reported trade data and broker-dealer price quotations. | |
| Event-linked bonds | Information obtained from market participants regarding reported trade data and broker-dealer price quotations. |
If a market value or price cannot be determined for a security using the methodologies described above, or if, in the “good faith” opinion of the Manager, the market value or price obtained does not constitute a “readily available market quotation,” or a significant event has occurred that would materially affect the value of the security, the security is fair valued either (i) by a standardized fair valuation methodology applicable to the security type or the significant event as previously approved by the Valuation Committee and the Fund’s Board or (ii) as determined in good faith by the Manager’s Valuation Committee. The Valuation Committee considers all relevant facts that are reasonably available, through either public information or information available to the Manager, when determining the fair value of a security. Fair value determinations by the Manager are subject to review, approval and ratification by the Fund’s Board at its next regularly scheduled meeting covering the calendar quarter in which the fair valuation was determined. Those fair valuation standardized methodologies include, but are not limited to, valuing securities at the last sale price or initially at cost and subsequently adjusting the value based on: changes in company specific fundamentals, changes in an appropriate securities index, or changes in the value of similar securities which may be further adjusted for any discounts related to security-specific resale restrictions. When possible, such methodologies use observable market inputs such as unadjusted quoted prices of similar securities, observable interest rates, currency rates and yield curves. The methodologies used for valuing securities are not necessarily an indication of the risks associated with investing in those securities nor can it be assured that the Fund can obtain the fair value assigned to a security if it were to sell the security.
To assess the continuing appropriateness of security valuations, the Manager, or its third party service provider who is subject to oversight by the Manager, regularly compares prior day prices, prices on comparable securities, and sale prices to the current day prices and challenges those prices exceeding certain tolerance levels with the third party pricing service or broker source. For those securities valued by fair valuations, whether through a standardized fair valuation methodology or a fair valuation determination, the Valuation Committee reviews and affirms the reasonableness of the valuations based on such methodologies and fair valuation determinations on a regular basis after considering all relevant information that is reasonably available.
16 OPPENHEIMER MAIN STREET FUND/VA
3. Securities Valuation (Continued)
Classifications
Each investment asset or liability of the Fund is assigned a level at measurement date based on the significance and source of the inputs to its valuation. Various data inputs are used in determining the value of each of the Fund’s investments as of the reporting period end. These data inputs are categorized in the following hierarchy under applicable financial accounting standards:
1) Level 1-unadjusted quoted prices in active markets for identical assets or liabilities (including securities actively traded on a securities exchange)
2) Level 2-inputs other than unadjusted quoted prices that are observable for the asset or liability (such as unadjusted quoted prices for similar assets and market corroborated inputs such as interest rates, prepayment speeds, credit risks, etc.)
3) Level 3-significant unobservable inputs (including the Manager’s own judgments about assumptions that market participants would use in pricing the asset or liability).
The inputs used for valuing securities are not necessarily an indication of the risks associated with investing in those securities.
The Fund classifies each of its investments in investment companies which are publicly offered as Level 1. Investment companies that are not publicly offered are measured using net asset value as a practical expedient, and are not classified in the fair value hierarchy.
The table below categorizes amounts that are included in the Fund’s Statement of Assets and Liabilities at period end based on valuation input level:
| Level 3— | ||||||||||||||||
| Level 1— | Level 2— | Significant | ||||||||||||||
| Unadjusted | Other Significant | Unobservable | ||||||||||||||
| Quoted Prices | Observable Inputs | Inputs | Value | |||||||||||||
|
|
||||||||||||||||
| Assets Table |
||||||||||||||||
| Investments, at Value: |
||||||||||||||||
| Common Stocks |
||||||||||||||||
| Consumer Discretionary |
$ | 125,214,795 | $ | — | $ | — | $ | 125,214,795 | ||||||||
| Consumer Staples |
143,985,065 | — | — | 143,985,065 | ||||||||||||
| Energy |
80,560,202 | — | — | 80,560,202 | ||||||||||||
| Financials |
220,745,726 | — | — | 220,745,726 | ||||||||||||
| Health Care |
183,158,769 | — | — | 183,158,769 | ||||||||||||
| Industrials |
157,700,670 | — | — | 157,700,670 | ||||||||||||
| Information Technology |
198,798,104 | — | — | 198,798,104 | ||||||||||||
| Materials |
25,640,770 | — | — | 25,640,770 | ||||||||||||
| Telecommunication Services |
29,500,830 | — | — | 29,500,830 | ||||||||||||
| Utilities |
36,253,329 | — | — | 36,253,329 | ||||||||||||
| Investment Company |
18,491,966 | — | — | 18,491,966 | ||||||||||||
|
|
|
|||||||||||||||
| Total Assets |
$ | 1,220,050,226 | $ | — | $ | — | $ | 1,220,050,226 | ||||||||
|
|
|
|||||||||||||||
Forward currency exchange contracts and futures contracts, if any, are reported at their unrealized appreciation/depreciation at measurement date, which represents the change in the contract’s value from trade date. All additional assets and liabilities included in the above table are reported at their market value at measurement date.
4. Investments and Risks
Investments in Affiliated Funds. The Fund is permitted to invest in other mutual funds advised by the Manager (“Affiliated Funds”). Affiliated Funds are open-end management investment companies registered under the 1940 Act, as amended. The Manager is the investment adviser of, and the Sub-Adviser provides investment and related advisory services to, the Affiliated Funds. When applicable, the Fund’s investments in Affiliated Funds are included in the Statement of Investments. Shares of Affiliated Funds are valued at their net asset value per share. As a shareholder, the Fund is subject to its proportional share of the Affiliated Funds’ expenses, including their management fee. The Manager will waive fees and/or reimburse Fund expenses in an amount equal to the indirect management fees incurred through the Fund’s investment in the Affiliated Funds.
Each of the Affiliated Funds in which the Fund invests has its own investment risks, and those risks can affect the value of the Fund’s investments and therefore the value of the Fund’s shares. To the extent that the Fund invests more of its assets in one Affiliated Fund than in another, the Fund will have greater exposure to the risks of that Affiliated Fund.
Investment in Oppenheimer Institutional Money Market Fund. The Fund is permitted to invest daily available cash balances in a money market Affiliated Fund. The Fund may invest the available cash in Class E shares of Oppenheimer Institutional Money Market Fund (“IMMF”) to seek current income while preserving liquidity or for defensive purposes. IMMF is regulated as a money market fund under the Investment Company Act of 1940, as amended.
Master Limited Partnerships (“MLPs”). MLPs issue common units that represent an equity ownership interest in a partnership and provide limited voting rights. MLP common units are registered with the Securities and Exchange Commission (“SEC”), and are freely tradable on securities exchanges such as the NYSE and the NASDAQ Stock Market (“NASDAQ”), or in the over-the-counter (“OTC”) market. An MLP consists of one or more general partners, who conduct the business, and one or more limited partners, who contribute capital. MLP common unit holders have a limited role in the partnership’s operations and management. The Fund, as a limited partner, normally would not be liable for the debts of the MLP beyond the amounts
17 OPPENHEIMER MAIN STREET FUND/VA
NOTES TO FINANCIAL STATEMENTS Unaudited / Continued
4. Investments and Risks (Continued)
the Fund has contributed, but would not be shielded to the same extent that a shareholder of a corporation would be. In certain circumstances creditors of an MLP would have the right to seek return of capital distributed to a limited partner. This right of an MLP’s creditors would continue after the Fund sold its investment in the MLP.
Equity Security Risk. Stocks and other equity securities fluctuate in price. The value of the Fund’s portfolio may be affected by changes in the equity markets generally. Equity markets may experience significant short-term volatility and may fall sharply at times. Different markets may behave differently from each other and U.S. equity markets may move in the opposite direction from one or more foreign stock markets. Adverse events in any part of the equity or fixed-income markets may have unexpected negative effects on other market segments.
The prices of individual equity securities generally do not all move in the same direction at the same time and a variety of factors can affect the price of a particular company’s securities. These factors may include, but are not limited to, poor earnings reports, a loss of customers, litigation against the company, general unfavorable performance of the company’s sector or industry, or changes in government regulations affecting the company or its industry.
5. Market Risk Factors
The Fund’s investments in securities and/or financial derivatives may expose the Fund to various market risk factors:
Commodity Risk. Commodity risk relates to the change in value of commodities or commodity indexes as they relate to increases or decreases in the commodities market. Commodities are physical assets that have tangible properties. Examples of these types of assets are crude oil, heating oil, metals, livestock, and agricultural products.
Credit Risk. Credit risk relates to the ability of the issuer of debt to meet interest and principal payments, or both, as they come due. In general, lower-grade, higher-yield debt securities are subject to credit risk to a greater extent than lower-yield, higher-quality securities.
Equity Risk. Equity risk relates to the change in value of equity securities as they relate to increases or decreases in the general market.
Foreign Exchange Rate Risk. Foreign exchange rate risk relates to the change in the U.S. dollar value of a security held that is denominated in a foreign currency. The U.S. dollar value of a foreign currency denominated security will decrease as the dollar appreciates against the currency, while the U.S. dollar value will increase as the dollar depreciates against the currency.
Interest Rate Risk. Interest rate risk refers to the fluctuations in value of fixed-income securities resulting from the inverse relationship between price and yield. For example, an increase in general interest rates will tend to reduce the market value of already issued fixed-income investments, and a decline in general interest rates will tend to increase their value. In addition, debt securities with longer maturities, which tend to have higher yields, are subject to potentially greater fluctuations in value from changes in interest rates than obligations with shorter maturities.
Volatility Risk. Volatility risk refers to the magnitude of the movement, but not the direction of the movement, in a financial instrument’s price over a defined time period. Large increases or decreases in a financial instrument’s price over a relative time period typically indicate greater volatility risk, while small increases or decreases in its price typically indicate lower volatility risk.
6. Shares of Beneficial Interest
The Fund has authorized an unlimited number of $0.001 par value shares of beneficial interest of each class. Transactions in shares of beneficial interest were as follows:
| Six Months Ended June 30, 2016 | Year Ended December 31, 2015 | |||||||||||||||
| Shares | Amount | Shares | Amount | |||||||||||||
|
|
||||||||||||||||
| Non-Service Shares |
||||||||||||||||
| Sold |
447,391 | $ | 12,940,603 | 517,352 | $ | 15,973,699 | ||||||||||
| Dividends and/or distributions reinvested |
2,522,303 | 66,336,564 | 2,966,041 | 86,816,030 | ||||||||||||
| Redeemed |
(1,294,344 | ) | (36,995,646) | (2,414,970 | ) | (75,495,171) | ||||||||||
|
|
|
|||||||||||||||
| Net increase |
1,675,350 | $ | 42,281,521 | 1,068,423 | $ | 27,294,558 | ||||||||||
|
|
|
|||||||||||||||
|
|
||||||||||||||||
| Service Shares |
||||||||||||||||
| Sold |
1,870,495 | $ | 53,998,889 | 1,895,395 | $ | 56,747,875 | ||||||||||
| Dividends and/or distributions reinvested |
3,477,830 | 90,667,028 | 4,144,304 | 120,392,039 | ||||||||||||
| Redeemed |
(3,009,656 | ) | (85,068,363) | (5,534,911 | ) | (170,576,335) | ||||||||||
|
|
|
|||||||||||||||
| Net increase |
2,338,669 | $ | 59,597,554 | 504,788 | $ | 6,563,579 | ||||||||||
|
|
|
|||||||||||||||
7. Purchases and Sales of Securities
The aggregate cost of purchases and proceeds from sales of securities, other than short-term obligations and investments in IMMF, for the reporting period were as follows:
| Purchases | Sales | |||||||
|
|
||||||||
| Investment securities |
$ 186,703,607 | $ 235,380,289 | ||||||
18 OPPENHEIMER MAIN STREET FUND/VA
8. Fees and Other Transactions with Affiliates
Management Fees. Under the investment advisory agreement, the Fund pays the Manager a management fee based on the daily net assets of the Fund at an annual rate as shown in the following table:
| Fee Schedule | ||||||
|
| ||||||
| Up to $200 million | 0.75 | % | ||||
| Next $200 million | 0.72 | |||||
| Next $200 million | 0.69 | |||||
| Next $200 million | 0.66 | |||||
| Next $200 million | 0.60 | |||||
| Next $4 billion | 0.58 | |||||
| Over $5 billion | 0.56 | |||||
The Fund’s effective management fee for the reporting period was 0.67% of average annual net assets before any applicable waivers.
Sub-Adviser Fees. The Manager has retained the Sub-Adviser to provide the day-to-day portfolio management of the Fund. Under the Sub-Advisory Agreement, the Manager pays the Sub-Adviser an annual fee in monthly installments, equal to a percentage of the investment management fee collected by the Manager from the Fund, which shall be calculated after any investment management fee waivers. The fee paid to the Sub-Adviser is paid by the Manager, not by the Fund.
Transfer Agent Fees. OFI Global (the “Transfer Agent”) serves as the transfer and shareholder servicing agent for the Fund. The Fund pays the Transfer Agent a fee based on annual net assets. Fees incurred and average net assets for each class with respect to these services are detailed in the Statement of Operations and Financial Highlights, respectively.
Sub-Transfer Agent Fees. The Transfer Agent has retained Shareholder Services, Inc., a wholly-owned subsidiary of OFI (the “Sub-Transfer Agent”), to provide the day-to-day transfer agent and shareholder servicing of the Fund. Under the Sub-Transfer Agency Agreement, the Transfer Agent pays the Sub-Transfer Agent an annual fee in monthly installments, equal to a percentage of the transfer agent fee collected by the Transfer Agent from the Fund, which shall be calculated after any applicable fee waivers. The fee paid to the Sub-Transfer Agent is paid by the Transfer Agent, not by the Fund.
Trustees’ Compensation. The Fund’s Board of Trustees (“Board”) has adopted a compensation deferral plan for Independent Trustees that enables Trustees to elect to defer receipt of all or a portion of the annual compensation they are entitled to receive from the Fund. For purposes of determining the amount owed to the Trustees under the plan, deferred amounts are treated as though equal dollar amounts had been invested in shares of the Fund or in other Oppenheimer funds selected by the Trustees. The Fund purchases shares of the funds selected for deferral by the Trustees in amounts equal to his or her deemed investment, resulting in a Fund asset equal to the deferred compensation liability. Such assets are included as a component of “Other” within the asset section of the Statement of Assets and Liabilities. Deferral of Trustees’ fees under the plan will not affect the net assets of the Fund and will not materially affect the Fund’s assets, liabilities or net investment income per share. Amounts will be deferred until distributed in accordance with the compensation deferral plan.
Distribution and Service Plan for Service Shares. The Fund has adopted a Distribution and Service Plan (the “Plan”) pursuant to Rule 12b-1 under the 1940 Act for Service shares to pay OppenheimerFunds Distributor, Inc. (the “Distributor”), for distribution related services, personal service and account maintenance for the Fund’s Service shares. Under the Plan, payments are made periodically at an annual rate of 0.25% of the daily net assets of Service shares of the Fund. The Distributor currently uses all of those fees to compensate sponsors of the insurance product that offers Fund shares, for providing personal service and maintenance of accounts of their variable contract owners that hold Service shares. These fees are paid out of the Fund’s assets on an on-going basis and increase operating expenses of the Service shares, which results in lower performance compared to the Fund’s shares that are not subject to a service fee. Fees incurred by the Fund under the Plan are detailed in the Statement of Operations.
Waivers and Reimbursements of Expenses. The Manager has voluntarily agreed to limit the Fund’s expenses after payments, waivers and/or reimbursements and reduction to custodian expenses, excluding expenses incurred directly or indirectly by the Fund as a result of investments in other investment companies, wholly-owned subsidiaries and pooled investment vehicles; so that those expenses, as percentages of daily net assets, will not exceed the annual rate of 0.80% for Non-Service shares and 1.05% for Service shares. The expense limitations do not include interest and fees from borrowing, and other expenses not incurred in the ordinary course of the Fund’s business.
The Manager will waive fees and/or reimburse Fund expenses in an amount equal to the indirect management fees incurred through the Fund’s investment in IMMF. During the reporting period, the Manager waived fees and/or reimbursed the Fund $11,522 for IMMF management fees.
Waivers and/or reimbursements may be modified or terminated as set forth according to the terms in the prospectus.
9. Borrowings and Other Financing
Joint Credit Facility. A number of mutual funds managed by the Manager participate in a $1.28 billion revolving credit facility (the “Facility”) intended to provide short-term financing, if necessary, subject to certain restrictions in connection with atypical redemption activity. Expenses and fees related to the Facility are paid by the participating funds and are disclosed separately or as other expenses on the Statement of Operations. The Fund did not utilize the Facility during the reporting period.
19 OPPENHEIMER MAIN STREET FUND/VA
NOTES TO FINANCIAL STATEMENTS Unaudited / Continued
10. Pending Litigation
In 2009, several putative class action lawsuits were filed and later consolidated before the U.S. District Court for the District of Colorado against OppenheimerFunds, Inc. (“OFI”), OppenheimerFunds Distributor, Inc. (“OFDI”), and Oppenheimer Rochester California Municipal Fund, a fund advised by OFI Global Asset Management, Inc. and distributed by the Distributor (the “California Fund”), in connection with the California Fund’s investment performance. The plaintiffs asserted claims against OFI, OFDI and certain present and former trustees and officers of the California Fund under the federal securities laws, alleging, among other things, that the disclosure documents of the California Fund contained misrepresentations and omissions and the investment policies of the California Fund were not followed. Plaintiffs in the suit filed an amended complaint and defendants filed a motion to dismiss. In 2011, the court issued an order which granted in part and denied in part the defendants’ motion to dismiss. In 2012, plaintiffs filed a motion, which defendants opposed, to certify a class and appoint class representatives and class counsel. In March 2015, the court granted plaintiffs’ motion for class certification. In May 2015, the U.S. Court of Appeals for the Tenth Circuit vacated the class certification order and remanded the matter to the district court for further proceedings. In October 2015, the district court reaffirmed its order and determined that the suit will proceed as a class action. In December 2015, the Tenth Circuit denied defendants’ petition to appeal the district court’s reaffirmed class certification order.
OFI and OFDI believe the suit is without merit; that it is premature to render any opinion as to the likelihood of an outcome unfavorable to them in the suit; and that no estimate can yet be made as to the amount or range of any potential loss. Furthermore, OFI believes that the suit should not impair the ability of OFI or OFDI to perform their respective duties to the Fund and that the outcome of the suit should not have any material effect on the operations of any of the Oppenheimer funds.
20 OPPENHEIMER MAIN STREET FUND/VA
PORTFOLIO PROXY VOTING POLICIES AND GUIDELINES; UPDATES TO STATEMENTS OF INVESTMENTS Unaudited
The Fund has adopted Portfolio Proxy Voting Policies and Guidelines under which the Fund votes proxies relating to securities (“portfolio proxies”) held by the Fund. A description of the Fund’s Portfolio Proxy Voting Policies and Guidelines is available (i) without charge, upon request, by calling the Fund toll-free at 1.800.525.7048, (ii) on the Fund’s website at www.oppenheimerfunds.com, and (iii) on the SEC’s website at www.sec.gov. In addition, the Fund is required to file Form N-PX, with its complete proxy voting record for the 12 months ended June 30th, no later than August 31st of each year. The Fund’s voting record is available (i) without charge, upon request, by calling the Fund toll-free at 1.800.525.7048, and (ii) in the Form N-PX filing on the SEC’s website at www.sec.gov.
The Fund files its complete schedule of portfolio holdings with the SEC for the first quarter and the third quarter of each fiscal year on Form N-Q. The Fund’s Form N-Q filings are available on the SEC’s website at www.sec.gov. Those forms may be reviewed and copied at the SEC’s Public Reference Room in Washington, D.C. Information on the operation of the Public Reference Room may be obtained by calling 1-800-SEC-0330.
21 OPPENHEIMER MAIN STREET FUND/VA
DISTRIBUTION SOURCES Unaudited
For any distribution that took place over the Fund’s reporting period, the table below details on a per-share basis the percentage of the Fund’s total distribution payment amount that was derived from the following sources: net income, net profit from the sale of securities, and other capital sources. This information is based upon income and capital gains using generally accepted accounting principles as of the date of each distribution. For certain securities, such as Real Estate Investment Trusts (“REITs”) and Master Limited Partnerships (“MLPs”), the percentages attributed to each category are estimated using historical information because the character of the amounts received from the REITs and MLPs in which the Fund invests is unknown until after the end of the calendar year. Because the Fund is actively managed, the relative amount of the Fund’s total distributions derived from various sources over the calendar year may change. Please note that this information should not be used for tax reporting purposes as the tax character of distributable income may differ from the amounts used for this notification. You will receive IRS tax forms in the first quarter of each calendar year detailing the actual amount of the taxable and non-taxable portion of distributions paid to you during the tax year.
For the most current information, please go to oppenheimerfunds.com. Select your Fund, then the ‘Detailed’ tab; where ‘Dividends’ are shown, the Fund’s latest pay date will be followed by the sources of any distribution, updated daily.
| Fund Name | Pay | Net Income | Net Profit | Other | ||||
| Date | from Sale | Capital | ||||||
| Sources | ||||||||
|
Oppenheimer Main Street Fund/VA |
6/21/16 | 9.0% | 57.1% | 33.9% |
22 OPPENHEIMER MAIN STREET FUND/VA
THIS PAGE INTENTIONALLY LEFT BLANK.
23 OPPENHEIMER MAIN STREET FUND/VA
OPPENHEIMER MAIN STREET FUND/VA
A Series of Oppenheimer Variable Account Funds
| Trustees and Officers | Sam Freedman, Chairman of the Board of Trustees and Trustee | |
| Jon S. Fossel, Trustee | ||
| Richard F. Grabish, Trustee | ||
| Beverly L. Hamilton, Trustee | ||
| Victoria J. Herget, Trustee | ||
| Robert J. Malone, Trustee | ||
| F. William Marshall, Jr., Trustee | ||
| Karen L. Stuckey, Trustee | ||
| James D. Vaughn, Trustee | ||
| Arthur P. Steinmetz, President and Principal Executive Officer | ||
| Manind Govil, Vice President | ||
| Benjamin Ram, Vice President | ||
| Paul Larson, Vice President | ||
| Arthur S. Gabinet, Secretary and Chief Legal Officer | ||
| Jennifer Sexton, Vice President and Chief Business Officer | ||
| Mary Ann Picciotto, Chief Compliance Officer and Chief Anti-Money Laundering Officer | ||
| Brian S. Petersen, Treasurer and Principal Financial & Accounting Officer | ||
| Manager | OFI Global Asset Management, Inc. | |
| Sub-Adviser | OppenheimerFunds, Inc. | |
| Distributor | OppenheimerFunds Distributor, Inc. | |
| Transfer and | OFI Global Asset Management, Inc. | |
| Shareholder | ||
| Servicing Agent | ||
| Sub-Transfer Agent | Shareholder Services, Inc. | |
| DBA OppenheimerFunds Services | ||
| Independent | KPMG LLP | |
| Registered | ||
| Public | ||
| Accounting | ||
| Firm | ||
| Legal Counsel | Ropes & Gray LLP | |
| Before investing in any of the Oppenheimer funds, investors should carefully consider a fund’s investment objectives, risks, charges and expenses. Fund prospectuses and summary prospectuses contain this and other information about the funds, and may be obtained by asking your financial advisor, or calling us at 1.800.988.8287. Read prospectuses and summary prospectuses carefully before investing. | ||
| The financial statements included herein have been taken from the records of the Fund without examination of those records by the independent registered public accounting firm. | ||
| © 2016 OppenheimerFunds, Inc. All rights reserved. Oppenheimer funds are distributed by OppenheimerFunds Distributor, Inc. | ||

|
|
||||
|
June 30, 2016
|
||||
|
Oppenheimer |
||||
| Main Street Small Cap Fund/VA |
Semiannual Report | |||
| A Series of Oppenheimer Variable Account Funds
|
||||
|
SEMIANNUAL REPORT |
||||
|
Listing of Top Holdings |
||||
|
Fund Performance Discussion |
||||
|
Financial Statements |

PORTFOLIO MANAGERS: Matthew P. Ziehl, CFA, Raymond Anello, CFA, Raman Vardharaj, CFA, Joy Budzinski, Kristin Ketner, Magnus Krantz and Adam Weiner.
AVERAGE ANNUAL TOTAL RETURNS FOR THE PERIODS ENDED 6/30/16
| Inception Date |
6-Months | 1-Year | 5-Year | 10-Year | ||||||||||||||||
| Non-Service Shares |
5/1/98 | 2.90% | -6.40% | 10.38% | 6.92% | |||||||||||||||
| Service Shares |
7/16/01 | 2.76 | -6.65 | 10.11 | 6.65 | |||||||||||||||
| Russell 2000 Index |
2.22 | -6.73 | 8.35 | 6.20 | ||||||||||||||||
Performance data quoted represents past performance, which does not guarantee future results. The investment return and principal value of an investment in the Fund will fluctuate so that an investor’s shares, when redeemed, may be worth more or less than their original cost. Current performance may be lower or higher than the performance quoted. For performance data current to the most recent month end, call us at 1.800.988.8287. The Fund’s total returns include changes in share price and reinvested distributions but should not be expected to be the same as the returns of other funds, whether or not both funds have the same portfolio managers and/or similar names. The Fund’s total returns do not include the charges associated with the separate account products that offer this Fund. Such performance would have been lower if such charges were taken into account.
The Fund’s performance is compared to the performance of the Russell 2000 Index, which measures the performance of the small-cap segment of the U.S. equity universe. The Russell 2000 Index is a subset of the Russell 3000 Index representing approximately 10% of the total market capitalization of that index. It includes approximately 2000 of the smallest securities based on a combination of their market cap and current index membership. The Index is unmanaged and cannot be purchased directly by investors. While index comparisons may be useful to provide a benchmark for the Fund’s performance, it must be noted that the Fund’s investments are not limited to the investments comprising the Index. Index performance includes reinvestment of income, but does not reflect transaction costs, fees, expenses or taxes. Index performance is shown for illustrative purposes only as a benchmark for the Fund’s performance, and does not predict or depict performance of the Fund. The Fund’s performance reflects the effects of the Fund’s business and operating expenses.
TOP HOLDINGS AND ALLOCATIONS
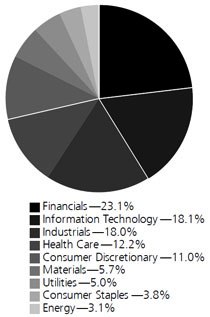
2 OPPENHEIMER MAIN STREET SMALL CAP FUND/VA
Fund Performance Discussion
The Fund’s Non-Service shares returned 2.90% during the reporting period. In comparison, the Fund outperformed the Russell 2000 Index (the “Index”), which returned 2.22%. The Fund’s outperformance relative to the Index stemmed largely from stronger relative stock selection in the health care, utilities and consumer discretionary sectors. Within these sectors, an underweight position in health care and a slight overweight position in utilities relative to the Index, also benefited the Fund. The Fund underperformed the Index in the information technology, materials and industrials sectors, as a result of weaker relative stock selection.
MARKET OVERVIEW
Markets remained turbulent during the reporting period. However, despite the volatility, the Index and the Fund experienced gains. The reporting period also saw a continued rotation away from growth stocks and into value stocks. This is a significant reversal from 2015 when growth stocks, in general, significantly outperformed. Another big trend has been demand for so called bond proxy stocks with above average dividend yields. This trend was magnified post Brexit as treasury yields, already at historic lows, were under further pressure and future rate hike expectations continued to be pushed farther out.
The reporting period saw the market driven by several important macroeconomic trends and events:
| ● | Uncertainty over when or if the Federal Reserve (the “Fed”) would raise interest rates, an especially important issue for financials. |
| ● | Continued slow but steady recovery in domestic consumer employment and consumption. |
| ● | Decelerating emerging markets growth, contributing to the weakness in export demand for commodities and other industrial products. |
| ● | Competitive currency devaluations, including negative interest rates in a growing number of jurisdictions, thrusting the world economy into uncharted territory. |
| ● | Impact of Brexit and the increased uncertainty for global markets as a result. |
We strive to keep the portfolio in an all-weather orientation. Whether rates, commodity prices, currencies or even whole economies go up or down, our goal is to have a portfolio that can out-perform no matter the environment, because we avoid making oversized macro factor bets.
Allow us to use a metaphor. If managing the portfolio was like betting on horses, we’d readily admit that we cannot predict ahead of time the weather or track conditions. But we do believe we can find the strongest horses (advantaged business models), the best jockeys (executing management teams), and can see when the payoff odds are in our favor (when valuations appear reasonable). To offset our agnostic position on the conditions, we seek to ensure we have some horses in the stable that will win no matter the weather. In short, it boils down to mostly stock selection.
TOP INDIVIDUAL CONTRIBUTORS
Top contributors to the Fund’s performance this period included WellCare Health Plans, Inc., Burlington Stores, Inc. and DuPont Fabros Technology, Inc.
WellCare is a managed care company for government-sponsored healthcare coverage with a focus on Medicare and Medicaid programs. Investors reacted favorably when the company updated its longer term growth goals of doubling its revenue within five years and attaining an after tax margin of at least 2%. WellCare also has a strong cash position and this, combined with a new credit facility, has increased deployable cash for potential acquisitions and accelerating growth. (If two big proposed mergers—Aetna/Humana and Anthem/Cigna—eventually occur, divestitures would be likely, resulting in possible acquisition opportunities for WellCare.) Additionally, the Center for Medicare and Medicaid (CMS) announced its preliminary 2017 rates which should bode well for the company’s Medicare Advantage business. This continues to be our largest holding in Health Care as our confidence in the company’s margin recovery is strengthened by both CMS’ rate outlook as well as expected growth in both Medicare and Medicaid spending.
Burlington owns and operates branded apparel retail stores throughout the U.S. and Puerto Rico. During the fourth quarter of 2015, both weather and secular issues negatively impacted apparel retailers and department stores—pushing earnings down by 10%-15% for many. In contrast, Burlington executed extremely
3 OPPENHEIMER MAIN STREET SMALL CAP FUND/VA
well and grew earnings despite being in the early stages of a transition to an off-price retail model. Management’s success in a challenging environment led to rising investor confidence and boosted the stock higher.
Data center REIT DuPont Fabros Technology (“DFT”) reported solid fourth quarter operating and leasing results in February. Then in March, the company announced a land purchase to enter a new market in Portland, plus an equity offering to fund development of additional space in several markets pursuant to large new lease commitments. Altogether, DFT is showing solid execution against the rather straightforward “wholesale” business strategy laid out at its fall 2015 Investor Day, whereby the company would continue to pursue large-scale deployments with cloud service providers who need highly efficient, scalable space in key markets such as Northern Virginia, where DFT is a major player.
TOP INDIVIDUAL DETRACTORS
Detractors from performance this reporting period included Korn/Ferry International, Ultragenyx Pharmaceutical, Inc. and Imperva, Inc.
Executive recruiter and talent management firm Korn/Ferry’s stock retrenched in the first half of 2016 after several years of solid price appreciation. Fiscal third quarter earnings results came in as expected, but forward revenue guidance was lower than anticipated largely due to currency headwinds. Guidance was lowered further in June on the fiscal year-end report. The company has increased its foreign sales exposure due to the major Hay Group acquisition completed in late 2015. Integration efforts and expected cost synergies remain on track, and in fact are coming in slightly ahead of initial expectations. We maintain our position, as Korn/Ferry is executing solidly in all of its key businesses despite external challenges, and the stock is very attractively valued.
Ultragenyx is a development stage biopharmaceutical company focused on products to treat rare and ultra-rare diseases with an initial focus on debilitating metabolic genetic diseases. The stock was down with the biotech selloff of the first quarter of 2016. At period end, we remain positive on the company.
Imperva develops protection software and services for databases and business applications. Excellent quarterly results were overshadowed by a conservative outlook relative to lofty expectations, especially on bottom line earnings per share (EPS). The market opportunity continues to look robust and Imperva is investing heavily to capitalize on this, but with the market shifting its focus slightly towards bottom line profitability rather than top-line growth, the company was caught out of touch with sentiment and was punished as a result. We continue to like the company fundamentally and expect the market to eventually refocus on these types of high growth stocks.
STRATEGY & OUTLOOK
While bottom-up company research and stock selection continue to be central to our process and strategy, we do have some observations about the current environment. First, the U.S. economy continues its “slow and steady” growth. This is being driven by favorable employment and inflation data while home prices and innovation also continue to help drive the economy higher. However, rhetoric around Brexit and U.S. elections could cause global contagion by slowing global trade.
Another risk inherent to this market is the misallocation of capital, fueled by an environment of ongoing relatively low interest rates and possibly leading to “bubble-like” valuations for some companies. We intend to maintain our discipline around valuation. Additionally, while innovation is alive and well and continuing to help generate economic growth, fundamental disruptions across market segments have been elevated. We continue to be focused on potential disruption risk to our companies.
Traditionally, during periods of economic uncertainty and heightened market volatility, investors favor stocks of higher quality companies—with greater consistency and stability of revenue and earnings—leading to relatively better stock performance of those companies. We think focusing on companies with competitive advantages and skilled management teams positions us well, should this environment come to pass. During times of economic volatility such companies frequently widen their lead over weaker competitors. We seek to invest in companies, characterized by these qualities, at compelling valuations and believe this disciplined approach has the potential to generate superior long-term performance.
The Fund’s investment strategy and focus can change over time. The mention of specific fund holdings does not constitute a recommendation by OppenheimerFunds, Inc. or its affiliates.
Shares of Oppenheimer funds are not deposits or obligations of any bank, are not guaranteed by any bank, are not insured by the FDIC or any other agency, and involve investment risks, including the possible loss of the principal amount invested.
4 OPPENHEIMER MAIN STREET SMALL CAP FUND/VA
Fund Expenses
Fund Expenses. As a shareholder of the Fund, you incur two types of costs: (1) transaction costs and (2) ongoing costs, including management fees; distribution and service fees; and other Fund expenses. These examples are intended to help you understand your ongoing costs (in dollars) of investing in the Fund and to compare these costs with the ongoing costs of investing in other mutual funds.
The examples are based on an investment of $1,000.00 invested at the beginning of the period and held for the entire 6-month period ended June 30, 2016.
Actual Expenses. The first section of the table provides information about actual account values and actual expenses. You may use the information in this section for the class of shares you hold, together with the amount you invested, to estimate the expense that you paid over the period. Simply divide your account value by $1,000.00 (for example, an $8,600.00 account value divided by $1,000.00 = 8.60), then multiply the result by the number in the first section under the heading entitled “Expenses Paid During 6 Months Ended June 30, 2016” to estimate the expenses you paid on your account during this period.
Hypothetical Example for Comparison Purposes.
The second section of the table provides information about hypothetical account values and hypothetical expenses based on the Fund’s actual expense ratio for each class of shares, and an assumed rate of return of 5% per year for each class before expenses, which is not the actual return. The hypothetical account values and expenses may not be used to estimate the actual ending account balance or expenses you paid for the period. You may use this information to compare the ongoing costs of investing in the Fund and other funds. To do so, compare this 5% hypothetical example for the class of shares you hold with the 5% hypothetical examples that appear in the shareholder reports of the other funds.
Please note that the expenses shown in the table are meant to highlight your ongoing costs only and do not reflect any charges associated with the separate accounts that offer this Fund. Therefore, the “hypothetical” lines of the table are useful in comparing ongoing costs only, and will not help you determine the relative total costs of owning different funds. In addition, if these separate account charges were included your costs would have been higher.
| Actual | Beginning Account Value January 1, 2016 |
Ending Account Value June 30, 2016 |
Expenses Paid During 6 Months Ended June 30, 2016 |
|||||||||
| Non-Service shares |
$ | 1,000.00 | $ | 1,029.00 | $ | 4.04 | ||||||
| Service shares |
1,000.00 | 1,027.60 | 5.31 | |||||||||
| Hypothetical | ||||||||||||
| (5% return before expenses) | ||||||||||||
| Non-Service shares |
1,000.00 | 1,020.89 | 4.03 | |||||||||
| Service shares |
1,000.00 | 1,019.64 | 5.29 | |||||||||
Expenses are equal to the Fund’s annualized expense ratio for that class, multiplied by the average account value over the period, multiplied by 182/366 (to reflect the one-half year period). Those annualized expense ratios, excluding indirect expenses from affiliated funds, based on the 6-month period ended June 30, 2016 are as follows:
| Class | Expense Ratios | |||||||
| Non-Service shares |
0.80% | |||||||
| Service shares |
1.05 | |||||||
The expense ratios reflect voluntary and/or contractual waivers and/or reimbursements of expenses by the Fund’s Manager. Some of these undertakings may be modified or terminated at any time, as indicated in the Fund’s prospectus. The “Financial Highlights” tables in the Fund’s financial statements, included in this report, also show the gross expense ratios, without such waivers or reimbursements and reduction to custodian expenses, if applicable.
5 OPPENHEIMER MAIN STREET SMALL CAP FUND/VA
STATEMENT OF INVESTMENTS June 30, 2016 Unaudited
6 OPPENHEIMER MAIN STREET SMALL CAP FUND/VA
Footnotes to Statement of Investments
1. Non-income producing security.
2. Security is a Master Limited Partnership.
3. Rate shown is the 7-day yield at period end.
4. Is or was an affiliate, as defined in the Investment Company Act of 1940, as amended, at or during the reporting period, by virtue of the Fund owning at least 5% of the voting securities of the issuer or as a result of the Fund and the issuer having the same investment adviser. Transactions during the reporting period in which the issuer was an affiliate are as follows:
| Shares December 31, 2015 |
Gross Additions |
Gross Reductions |
Shares June 30, 2016 |
|||||||||||||||||
|
|
||||||||||||||||||||
| Oppenheimer Institutional Money Market Fund, Cl. E | 14,384,001 | 156,164,425 | 145,059,536 | 25,488,890 | ||||||||||||||||
| Value | Income | |||||||||||||||||||
|
|
||||||||||||||||||||
| Oppenheimer Institutional Money Market Fund, Cl. E | $ | 25,488,890 | $ | 49,302 | ||||||||||||||||
See accompanying Notes to Financial Statements.
7 OPPENHEIMER MAIN STREET SMALL CAP FUND/VA
STATEMENT OF ASSETS AND LIABILITIES June 30, 2016 Unaudited
|
|
||||
| Assets |
||||
| Investments, at value—see accompanying statement of investments: | ||||
| Unaffiliated companies (cost $799,230,639) | $ | 958,656,489 | ||
| Affiliated companies (cost $25,488,890) | 25,488,890 | |||
|
|
|
|||
| 984,145,379 | ||||
|
|
||||
| Cash | 1,000,000 | |||
|
|
||||
| Receivables and other assets: | ||||
| Dividends | 1,306,984 | |||
| Investments sold | 976,217 | |||
| Shares of beneficial interest sold | 161,006 | |||
| Other | 49,248 | |||
|
|
|
|||
| Total assets | 987,638,834 | |||
|
|
||||
| Liabilities |
||||
| Payables and other liabilities: | ||||
| Shares of beneficial interest redeemed | 3,465,375 | |||
| Distribution and service plan fees | 176,894 | |||
| Shareholder communications | 57,633 | |||
| Trustees’ compensation | 40,381 | |||
| Other | 15,448 | |||
|
|
|
|||
| Total liabilities | 3,755,731 | |||
|
|
||||
| Net Assets | $ | 983,883,103 | ||
|
|
|
|||
|
|
||||
| Composition of Net Assets |
||||
| Par value of shares of beneficial interest | $ | 47,370 | ||
|
|
||||
| Additional paid-in capital | 826,333,568 | |||
|
|
||||
| Accumulated net investment income | 3,081,682 | |||
|
|
||||
| Accumulated net realized loss on investments and foreign currency transactions | (5,005,367) | |||
|
|
||||
| Net unrealized appreciation on investments and translation of assets and liabilities denominated in foreign currencies | 159,425,850 | |||
|
|
|
|||
| Net Assets | $ | 983,883,103 | ||
|
|
|
|||
|
|
||||
| Net Asset Value Per Share |
||||
| Non-Service Shares: | ||||
| Net asset value, redemption price per share and offering price per share (based on net assets of $129,421,374 and 6,165,319 shares of beneficial interest outstanding) | $20.99 | |||
|
|
||||
|
Service Shares: |
||||
|
Net asset value, redemption price per share and offering price per share (based on net assets of $854,461,729 and 41,204,340 shares of beneficial interest outstanding) |
$20.74 | |||
See accompanying Notes to Financial Statements.
8 OPPENHEIMER MAIN STREET SMALL CAP FUND/VA
STATEMENT OF OPERATIONS For the Six Months Ended June 30, 2016 Unaudited
|
|
||||
| Investment Income |
||||
| Dividends: | ||||
| Unaffiliated companies (net of foreign withholding taxes of $4,654) | $ | 7,945,470 | ||
| Affiliated companies | 49,302 | |||
|
|
||||
| Interest | 7 | |||
|
|
|
|||
| Total investment income | 7,994,779 | |||
|
|
||||
| Expenses |
||||
| Management fees | 3,267,345 | |||
|
|
||||
| Distribution and service plan fees - Service shares | 1,029,875 | |||
|
|
||||
| Transfer and shareholder servicing agent fees: | ||||
| Non-Service shares | 62,416 | |||
| Service shares | 412,550 | |||
|
|
||||
| Shareholder communications: | ||||
| Non-Service shares | 7,565 | |||
| Service shares | 50,171 | |||
|
|
||||
| Trustees’ compensation | 21,287 | |||
|
|
||||
| Borrowing fees | 8,694 | |||
|
|
||||
| Custodian fees and expenses | 2,646 | |||
|
|
||||
| Other | 35,094 | |||
|
|
|
|||
| Total expenses | 4,897,643 | |||
| Less reduction to custodian expenses | (339) | |||
| Less waivers and reimbursements of expenses | (57,500) | |||
|
|
|
|||
| Net expenses | 4,839,804 | |||
|
|
||||
| Net Investment Income | 3,154,975 | |||
|
|
||||
| Realized and Unrealized Gain (Loss) |
||||
| Net realized loss on: | ||||
| Investments from unaffiliated companies | (3,504,370) | |||
| Foreign currency transactions | (881) | |||
|
|
|
|||
| Net realized loss | (3,505,251) | |||
|
|
||||
| Net change in unrealized appreciation/depreciation on: | ||||
| Investments | 27,504,662 | |||
| Translation of assets and liabilities denominated in foreign currencies | 746,383 | |||
|
|
|
|||
| Net change in unrealized appreciation/depreciation | 28,251,045 | |||
|
|
||||
| Net Increase in Net Assets Resulting from Operations | $ | 27,900,769 | ||
|
|
|
|||
See accompanying Notes to Financial Statements.
9 OPPENHEIMER MAIN STREET SMALL CAP FUND/VA
STATEMENTS OF CHANGES IN NET ASSETS
| Six Months Ended June 30, 2016 (Unaudited) |
Year Ended December 31, 2015 |
|||||||
|
|
||||||||
| Operations |
||||||||
| Net investment income | $ | 3,154,975 | $ | 2,875,881 | ||||
|
|
||||||||
| Net realized gain (loss) | (3,505,251) | 41,953,892 | ||||||
|
|
||||||||
| Net change in unrealized appreciation/depreciation | 28,251,045 | (107,664,132) | ||||||
|
|
|
|||||||
| Net increase (decrease) in net assets resulting from operations | 27,900,769 | (62,834,359) | ||||||
|
|
||||||||
| Dividends and/or Distributions to Shareholders |
||||||||
| Dividends from net investment income: | ||||||||
| Non-Service shares | (682,044) | (1,186,413) | ||||||
| Service shares | (2,155,681) | (5,919,665) | ||||||
|
|
|
|||||||
| (2,837,725) | (7,106,078) | |||||||
|
|
||||||||
| Distributions from net realized gain: | ||||||||
| Non-Service shares | (5,056,399) | (19,582,501) | ||||||
| Service shares | (33,184,812) | (137,100,829) | ||||||
|
|
|
|||||||
| (38,241,211) | (156,683,330) | |||||||
|
|
||||||||
| Beneficial Interest Transactions |
||||||||
| Net increase in net assets resulting from beneficial interest transactions: | ||||||||
| Non-Service shares | 2,365,066 | 21,318,007 | ||||||
| Service shares | 8,873,464 | 86,089,174 | ||||||
|
|
|
|||||||
| 11,238,530 | 107,407,181 | |||||||
|
|
||||||||
| Net Assets |
||||||||
| Total decrease | (1,939,637) | (119,216,586) | ||||||
|
|
||||||||
| Beginning of period | 985,822,740 | 1,105,039,326 | ||||||
|
|
|
|||||||
| End of period (including accumulated net investment income of $3,081,682 and $2,764,432, respectively) | $ | 983,883,103 | $ | 985,822,740 | ||||
|
|
|
|||||||
See accompanying Notes to Financial Statements.
10 OPPENHEIMER MAIN STREET SMALL CAP FUND/VA
FINANCIAL HIGHLIGHTS
| Non-Service Shares | Six Months Ended June 30, 2016 (Unaudited) |
Year Ended December 31, |
Year Ended December 31, |
Year Ended December 31, |
Year Ended December 31, |
Year Ended December 30, |
||||||||||||||||||
|
|
||||||||||||||||||||||||
| Per Share Operating Data |
||||||||||||||||||||||||
| Net asset value, beginning of period | $ | 21.32 | $ | 26.56 | $ | 27.80 | $ | 20.14 | $ | 17.17 | $ | 17.66 | ||||||||||||
|
|
||||||||||||||||||||||||
| Income (loss) from investment operations: | ||||||||||||||||||||||||
| Net investment income2 | 0.09 | 0.12 | 0.26 | 0.16 | 0.21 | 0.10 | ||||||||||||||||||
| Net realized and unrealized gain (loss) | 0.53 | (1.28) | 2.74 | 8.01 | 2.87 | (0.48) | ||||||||||||||||||
|
|
|
|||||||||||||||||||||||
| Total from investment operations | 0.62 | (1.16) | 3.00 | 8.17 | 3.08 | (0.38) | ||||||||||||||||||
|
|
||||||||||||||||||||||||
| Dividends and/or distributions to shareholders: | ||||||||||||||||||||||||
| Dividends from net investment income | (0.11) | (0.23) | (0.25) | (0.22) | (0.11) | (0.11) | ||||||||||||||||||
| Distributions from net realized gain | (0.84) | (3.85) | (3.99) | (0.29) | 0.00 | 0.00 | ||||||||||||||||||
|
|
|
|||||||||||||||||||||||
| Total dividends and/or distributions to shareholders | (0.95) | (4.08) | (4.24) | (0.51) | (0.11) | (0.11) | ||||||||||||||||||
|
|
||||||||||||||||||||||||
| Net asset value, end of period | $ | 20.99 | $ | 21.32 | $ | 26.56 | $ | 27.80 | $ | 20.14 | $ | 17.17 | ||||||||||||
|
|
|
|||||||||||||||||||||||
|
|
||||||||||||||||||||||||
| Total Return, at Net Asset Value3 |
2.90% | (5.90)% | 11.93% | 41.01% | 17.99% | (2.21)% | ||||||||||||||||||
|
|
||||||||||||||||||||||||
| Ratios/Supplemental Data |
||||||||||||||||||||||||
| Net assets, end of period (in thousands) | $ | 129,421 | $ | 129,104 | $ | 136,402 | $ | 134,692 | $ | 87,267 | $ | 79,722 | ||||||||||||
|
|
||||||||||||||||||||||||
| Average net assets (in thousands) | $ | 125,494 | $ | 134,932 | $ | 133,864 | $ | 113,522 | $ | 83,790 | $ | 86,796 | ||||||||||||
|
|
||||||||||||||||||||||||
| Ratios to average net assets:4 | ||||||||||||||||||||||||
| Net investment income | 0.88% | 0.49% | 0.99% | 0.67% | 1.09% | 0.58% | ||||||||||||||||||
| Expenses excluding specific expenses listed below | 0.81% | 0.80% | 0.80% | 0.81% | 0.83% | 0.83% | ||||||||||||||||||
| Interest and fees from borrowings | 0.00%5 | 0.00%5 | 0.00% | 0.00% | 0.00% | 0.00% | ||||||||||||||||||
|
|
|
|||||||||||||||||||||||
| Total expenses6 | 0.81% | 0.80% | 0.80% | 0.81% | 0.83% | 0.83% | ||||||||||||||||||
| Expenses after payments, waivers and/or reimbursements and reduction to custodian expenses | 0.80% | 0.80% | 0.79% | 0.80% | 0.80% | 0.80% | ||||||||||||||||||
|
|
||||||||||||||||||||||||
| Portfolio turnover rate | 26% | 43% | 65% | 60% | 92% | 108% | ||||||||||||||||||
1. December 30, 2011 represents the last business day of the Fund’s reporting period. See Note 2 of the accompanying Notes.
2. Per share amounts calculated based on the average shares outstanding during the period.
3. Assumes an initial investment on the business day before the first day of the fiscal period, with all dividends and distributions reinvested in additional shares on the reinvestment date, and redemption at the net asset value calculated on the last business day of the fiscal period. Total returns are not annualized for periods less than one full year. Total return information does not reflect expenses that apply at the separate account level or to related insurance products. Inclusion of these charges would reduce the total return figures for all periods shown. Returns do not reflect the deduction of taxes that a shareholder would pay on fund distributions or the redemption of fund shares.
4. Annualized for periods less than one full year.
5. Less than 0.005%.
6. Total expenses including indirect expenses from affiliated fund fees and expenses were as follows:
See accompanying Notes to Financial Statements.
11 OPPENHEIMER MAIN STREET SMALL CAP FUND/VA
FINANCIAL HIGHLIGHTS Continued
| Service Shares | Six Months Ended June 30, 2016 (Unaudited) |
Year Ended December 31, |
Year Ended December 31, |
Year Ended December 31, |
Year Ended December 31, |
Year Ended December 30, |
||||||||||||||||||
|
|
||||||||||||||||||||||||
| Per Share Operating Data |
||||||||||||||||||||||||
| Net asset value, beginning of period | $ | 21.05 | $ | 26.26 | $ | 27.53 | $ | 19.96 | $ | 17.02 | $ | 17.50 | ||||||||||||
|
|
||||||||||||||||||||||||
| Income (loss) from investment operations: | ||||||||||||||||||||||||
| Net investment income2 | 0.06 | 0.06 | 0.19 | 0.10 | 0.15 | 0.06 | ||||||||||||||||||
| Net realized and unrealized gain (loss) | 0.52 | (1.25) | 2.71 | 7.93 | 2.85 | (0.47) | ||||||||||||||||||
|
|
|
|||||||||||||||||||||||
| Total from investment operations | 0.58 | (1.19) | 2.90 | 8.03 | 3.00 | (0.41) | ||||||||||||||||||
|
|
||||||||||||||||||||||||
| Dividends and/or distributions to shareholders: | ||||||||||||||||||||||||
| Dividends from net investment income | (0.05) | (0.17) | (0.18) | (0.17) | (0.06) | (0.07) | ||||||||||||||||||
| Distributions from net realized gain | (0.84) | (3.85) | (3.99) | (0.29) | 0.00 | 0.00 | ||||||||||||||||||
|
|
|
|||||||||||||||||||||||
| Total dividends and/or distributions to shareholders | (0.89) | (4.02) | (4.17) | (0.46) | (0.06) | (0.07) | ||||||||||||||||||
|
|
||||||||||||||||||||||||
| Net asset value, end of period | $ | 20.74 | $ | 21.05 | $ | 26.26 | $ | 27.53 | $ | 19.96 | $ | 17.02 | ||||||||||||
|
|
|
|||||||||||||||||||||||
|
|
||||||||||||||||||||||||
| Total Return, at Net Asset Value3 |
2.76% | (6.09)% | 11.66% | 40.62% | 17.67% | (2.38)% | ||||||||||||||||||
|
|
||||||||||||||||||||||||
| Ratios/Supplemental Data |
||||||||||||||||||||||||
| Net assets, end of period (in thousands) | $ | 854,462 | $ | 856,719 | $ | 968,637 | $ | 990,168 | $ | 849,920 | $ | 790,752 | ||||||||||||
|
|
||||||||||||||||||||||||
| Average net assets (in thousands) | $ | 829,505 | $ | 927,514 | $ | 957,874 | $ | 935,083 | $ | 836,487 | $ | 823,201 | ||||||||||||
|
|
||||||||||||||||||||||||
| Ratios to average net assets:4 | ||||||||||||||||||||||||
| Net investment income | 0.63% | 0.24% | 0.75% | 0.43% | 0.82% | 0.34% | ||||||||||||||||||
| Expenses excluding specific expenses listed below | 1.06% | 1.05% | 1.05% | 1.06% | 1.08% | 1.08% | ||||||||||||||||||
| Interest and fees from borrowings | 0.00%5 | 0.00%5 | 0.00% | 0.00% | 0.00% | 0.00% | ||||||||||||||||||
|
|
|
|||||||||||||||||||||||
| Total expenses6 | 1.06% | 1.05% | 1.05% | 1.06% | 1.08% | 1.08% | ||||||||||||||||||
| Expenses after payments, waivers and/or reimbursements and reduction to custodian expenses | 1.05% | 1.05% | 1.04% | 1.05% | 1.05% | 1.05% | ||||||||||||||||||
|
|
||||||||||||||||||||||||
| Portfolio turnover rate | 26% | 43% | 65% | 60% | 92% | 108% | ||||||||||||||||||
1. December 30, 2011 represents the last business day of the Fund’s reporting period. See Note 2 of the accompanying Notes.
2. Per share amounts calculated based on the average shares outstanding during the period.
3. Assumes an initial investment on the business day before the first day of the fiscal period, with all dividends and distributions reinvested in additional shares on the reinvestment date, and redemption at the net asset value calculated on the last business day of the fiscal period. Total returns are not annualized for periods less than one full year. Total return information does not reflect expenses that apply at the separate account level or to related insurance products. Inclusion of these charges would reduce the total return figures for all periods shown. Returns do not reflect the deduction of taxes that a shareholder would pay on fund distributions or the redemption of fund shares.
4. Annualized for periods less than one full year.
5. Less than 0.005%.
6. Total expenses including indirect expenses from affiliated fund fees and expenses were as follows:
See accompanying Notes to Financial Statements.
12 OPPENHEIMER MAIN STREET SMALL CAP FUND/VA
NOTES TO FINANCIAL STATEMENTS June 30, 2016 Unaudited
1. Organization
Oppenheimer Main Street Small Cap Fund/VA (the “Fund”), a separate series of Oppenheimer Variable Account Funds, is a diversified open-end management investment company registered under the Investment Company Act of 1940 (“1940 Act”), as amended. The Fund’s investment objective is to seek capital appreciation. The Fund’s investment adviser is OFI Global Asset Management, Inc. (“OFI Global” or the “Manager”), a wholly-owned subsidiary of OppenheimerFunds, Inc. (“OFI” or the “Sub-Adviser”). The Manager has entered into a sub-advisory agreement with OFI. Shares of the Fund are sold only to separate accounts of life insurance companies.
The Fund offers two classes of shares. Both classes are sold at their offering price, which is the net asset value per share, to separate investment accounts of participating insurance companies as an underlying investment for variable life insurance policies, variable annuity contracts or other investment products. The class of shares designated as Service shares is subject to a distribution and service plan. Both classes of shares have identical rights and voting privileges with respect to the Fund in general and exclusive voting rights on matters that affect that class alone. Earnings, net assets and net asset value per share may differ due to each class having its own expenses, such as transfer and shareholder servicing agent fees and shareholder communications, directly attributable to that class.
The following is a summary of significant accounting policies followed in the Fund’s preparation of financial statements in accordance with accounting principles generally accepted in the United States (“U.S. GAAP”).
2. Significant Accounting Policies
Security Valuation. All investments in securities are recorded at their estimated fair value, as described in Note 3.
Reporting Period End Date. The last day of the Fund’s reporting period is the last day the New York Stock Exchange was open for trading during the period. The Fund’s financial statements have been presented through that date to maintain consistency with the Fund’s net asset value calculations used for shareholder transactions.
Foreign Currency Translation. The Fund’s accounting records are maintained in U.S. dollars. The values of securities denominated in foreign currencies and amounts related to the purchase and sale of foreign securities and foreign investment income are translated into U.S. dollars as of the close of the New York Stock Exchange (the “Exchange”), normally 4:00 P.M. Eastern time, on each day the Exchange is open for trading. Foreign exchange rates may be valued primarily using a reliable bank, dealer or service authorized by the Board of Trustees.
Reported net realized gains and losses from foreign currency transactions arise from sales of portfolio securities, sales and maturities of short-term securities, sales of foreign currencies, exchange rate fluctuations between the trade and settlement dates on securities transactions, and the difference between the amounts of dividends, interest, and foreign withholding taxes recorded on the Fund’s books and the U.S. dollar equivalent of the amounts actually received or paid. Net unrealized appreciation and depreciation on the translation of assets and liabilities denominated in foreign currencies arise from changes in the values of assets and liabilities, including investments in securities at fiscal period end, resulting from changes in exchange rates.
The effect of changes in foreign currency exchange rates on investments is separately identified from the fluctuations arising from changes in market values of securities held and reported with all other foreign currency gains and losses in the Fund’s Statement of Operations.
Allocation of Income, Expenses, Gains and Losses. Income, expenses (other than those attributable to a specific class), gains and losses are allocated on a daily basis to each class of shares based upon the relative proportion of net assets represented by such class. Operating expenses directly attributable to a specific class are charged against the operations of that class.
Dividends and Distributions to Shareholders. Dividends and distributions to shareholders, which are determined in accordance with income tax regulations and may differ from U.S. GAAP, are recorded on the ex-dividend date. Income and capital gain distributions, if any, are declared and paid annually or at other times as deemed necessary by the Manager.
The tax character of distributions is determined as of the Fund’s fiscal year end. Therefore, a portion of the Fund’s distributions made to shareholders prior to the Fund’s fiscal year end may ultimately be categorized as a tax return of capital.
Investment Income. Dividend income is recorded on the ex-dividend date or upon ex-dividend notification in the case of certain foreign dividends where the ex-dividend date may have passed. Non-cash dividends included in dividend income, if any, are recorded at the fair market value of the securities received. Interest income is recognized on an accrual basis. Discount and premium, which are included in interest income on the Statement of Operations, are amortized or accreted daily.
Return of Capital Estimates. Distributions received from the Fund’s investments in Master Limited Partnerships (MLPs) and Real Estate Investments Trusts (REITs), generally are comprised of income and return of capital. The Fund records investment income and return of capital based on estimates. Such estimates are based on historical information available from each MLP, REIT and other industry sources. These estimates may subsequently be revised based on information received from MLPs and REITs after their tax reporting periods are concluded.
Custodian Fees. “Custodian fees and expenses” in the Statement of Operations may include interest expense incurred by the Fund on any cash overdrafts of its custodian account during the period. Such cash overdrafts may result from the effects of failed trades in portfolio securities and from cash outflows resulting from unanticipated shareholder redemption activity. The Fund pays interest to its custodian on such cash overdrafts, to the extent they are not offset by positive cash balances maintained by the Fund, at a rate equal to the Federal Funds Rate plus 0.50%. The “Reduction to custodian
13 OPPENHEIMER MAIN STREET SMALL CAP FUND/VA
NOTES TO FINANCIAL STATEMENTS Unaudited / Continued
2. Significant Accounting Policies (Continued)
expenses” line item, if applicable, represents earnings on cash balances maintained by the Fund during the period. Such interest expense and other custodian fees may be paid with these earnings.
Security Transactions. Security transactions are recorded on the trade date. Realized gains and losses on securities sold are determined on the basis of identified cost.
Indemnifications. The Fund’s organizational documents provide current and former Trustees and officers with a limited indemnification against liabilities arising in connection with the performance of their duties to the Fund. In the normal course of business, the Fund may also enter into contracts that provide general indemnifications. The Fund’s maximum exposure under these arrangements is unknown as this would be dependent on future claims that may be made against the Fund. The risk of material loss from such claims is considered remote.
Federal Taxes. The Fund intends to comply with provisions of the Internal Revenue Code applicable to regulated investment companies and to distribute substantially all of its investment company taxable income to shareholders. Therefore, no federal income or excise tax provision is required. The Fund files income tax returns in U.S. federal and applicable state jurisdictions. The statute of limitations on the Fund’s tax return filings generally remains open for the three preceding fiscal reporting period ends. The Fund has analyzed its tax positions for the fiscal year ended December 31, 2015, including open tax years, and does not believe there are any uncertain tax positions requiring recognition in the Fund’s financial statements.
During the fiscal year ended December 31, 2015, the Fund did not utilize any capital loss carryforward to offset capital gains realized in that fiscal year. Capital loss carryforwards with no expiration, if any, must be utilized prior to those with expiration dates. Capital losses with no expiration will be carried forward to future years if not offset by gains.
At period end, it is estimated that the capital loss carryforwards would be $3,505,251, which will not expire. The estimated capital loss carryforward represents the carryforward as of the end of the last fiscal year, increased or decreased by capital losses or gains realized in the first six months of the current fiscal year. During the reporting period, it is estimated that the Fund will not utilize any capital loss carryforward to offset realized capital gains.
Net investment income (loss) and net realized gain (loss) may differ for financial statement and tax purposes. The character of dividends and distributions made during the fiscal year from net investment income or net realized gains are determined in accordance with federal income tax requirements, which may differ from the character of net investment income or net realized gains presented in those financial statements in accordance with U.S. GAAP. Also, due to timing of dividends and distributions, the fiscal year in which amounts are distributed may differ from the fiscal year in which the income or net realized gain was recorded by the Fund.
The aggregate cost of securities and other investments and the composition of unrealized appreciation and depreciation of securities and other investments for federal income tax purposes at period end are noted in the following table. The primary difference between book and tax appreciation or depreciation of securities and other investments, if applicable, is attributable to the tax deferral of losses or tax realization of financial statement unrealized gain or loss.
| Federal tax cost of securities |
$ | 826,852,443 | ||
|
|
|
|||
| Gross unrealized appreciation |
$ | 191,862,069 | ||
| Gross unrealized depreciation |
(34,569,133) | |||
|
|
|
|||
| Net unrealized appreciation |
$ | 157,292,936 | ||
|
|
|
Use of Estimates. The preparation of financial statements in conformity with U.S. GAAP requires management to make estimates and assumptions that affect the reported amounts of assets and liabilities and disclosure of contingent assets and liabilities at the date of the financial statements and the reported amounts of increases and decreases in net assets from operations during the reporting period. Actual results could differ from those estimates.
3. Securities Valuation
The Fund calculates the net asset value of its shares as of 4:00 P.M. Eastern time, on each day the New York Stock Exchange (the “Exchange”) is open for trading, except in the case of a scheduled early closing of the Exchange, in which case the Fund will calculate net asset value of the shares as of the scheduled early closing time of the Exchange.
The Fund’s Board has adopted procedures for the valuation of the Fund’s securities and has delegated the day-to-day responsibility for valuation determinations under those procedures to the Manager. The Manager has established a Valuation Committee which is responsible for determining a “fair valuation” for any security for which market quotations are not “readily available.” The Valuation Committee’s fair valuation determinations are subject to review, approval and ratification by the Fund’s Board at its next regularly scheduled meeting covering the calendar quarter in which the fair valuation was determined.
Valuation Methods and Inputs
Securities are valued using unadjusted quoted market prices, when available, as supplied primarily by third party pricing services or dealers.
The following methodologies are used to determine the market value or the fair value of the types of securities described below:
Securities traded on a registered U.S. securities exchange (including exchange-traded derivatives other than futures and futures options) are valued based on the last sale price of the security reported on the principal exchange on which it is traded, prior to the time when the Fund’s assets are valued. In the absence of a sale, the security is valued at the mean between the bid and asked price on the principal exchange or, if not available from the principal exchange, obtained from two dealers. If bid and asked prices are not available from either the exchange or two dealers, the security is valued
14 OPPENHEIMER MAIN STREET SMALL CAP FUND/VA
3. Securities Valuation (Continued)
by using one of the following methodologies (listed in order of priority): (1) a bid from the principal exchange, (2) the mean between the bid and asked price as provided by a single dealer, or (3) a bid from a single dealer. A security of a foreign issuer traded on a foreign exchange, but not listed on a registered U.S. securities exchange, is valued based on the last sale price on the principal exchange on which the security is traded, as identified by the third party pricing service used by the Manager, prior to the time when the Fund’s assets are valued. If the last sale price is unavailable, the security is valued at the most recent official closing price on the principal exchange on which it is traded. If the last sales price or official closing price for a foreign security is not available, the security is valued at the mean between the bid and asked price per the exchange or, if not available from the exchange, obtained from two dealers. If bid and asked prices are not available from either the exchange or two dealers, the security is valued by using one of the following methodologies (listed in order of priority): (1) a bid from the exchange, (2) the mean between the bid and asked price as provided by a single dealer, or (3) a bid from a single dealer.
Shares of a registered investment company that are not traded on an exchange are valued at that investment company’s net asset value per share.
Corporate and government debt securities (of U.S. or foreign issuers) and municipal debt securities, event-linked bonds, loans, mortgage-backed securities, collateralized mortgage obligations, and asset-backed securities are valued at the mean between the “bid” and “asked” prices utilizing evaluated prices obtained from third party pricing services or broker-dealers who may use matrix pricing methods to determine the evaluated prices.
Short-term money market type debt securities with a remaining maturity of sixty days or less are valued at cost adjusted by the amortization of discount or premium to maturity (amortized cost), which approximates market value. Short-term debt securities with a remaining maturity in excess of sixty days are valued at the mean between the “bid” and “asked” prices utilizing evaluated prices obtained from third party pricing services or broker-dealers.
A description of the standard inputs that may generally be considered by the third party pricing vendors in determining their evaluated prices is provided below.
| Security Type | Standard inputs generally considered by third-party pricing vendors | |
| Corporate debt, government debt, municipal, mortgage- backed and asset-backed securities | Reported trade data, broker-dealer price quotations, benchmark yields, issuer spreads on comparable securities, the credit quality, yield, maturity, and other appropriate factors. | |
| Loans | Information obtained from market participants regarding reported trade data and broker-dealer price quotations. | |
| Event-linked bonds | Information obtained from market participants regarding reported trade data and broker-dealer price quotations. |
If a market value or price cannot be determined for a security using the methodologies described above, or if, in the “good faith” opinion of the Manager, the market value or price obtained does not constitute a “readily available market quotation,” or a significant event has occurred that would materially affect the value of the security, the security is fair valued either (i) by a standardized fair valuation methodology applicable to the security type or the significant event as previously approved by the Valuation Committee and the Fund’s Board or (ii) as determined in good faith by the Manager’s Valuation Committee. The Valuation Committee considers all relevant facts that are reasonably available, through either public information or information available to the Manager, when determining the fair value of a security. Fair value determinations by the Manager are subject to review, approval and ratification by the Fund’s Board at its next regularly scheduled meeting covering the calendar quarter in which the fair valuation was determined. Those fair valuation standardized methodologies include, but are not limited to, valuing securities at the last sale price or initially at cost and subsequently adjusting the value based on: changes in company specific fundamentals, changes in an appropriate securities index, or changes in the value of similar securities which may be further adjusted for any discounts related to security-specific resale restrictions. When possible, such methodologies use observable market inputs such as unadjusted quoted prices of similar securities, observable interest rates, currency rates and yield curves. The methodologies used for valuing securities are not necessarily an indication of the risks associated with investing in those securities nor can it be assured that the Fund can obtain the fair value assigned to a security if it were to sell the security.
To assess the continuing appropriateness of security valuations, the Manager, or its third party service provider who is subject to oversight by the Manager, regularly compares prior day prices, prices on comparable securities, and sale prices to the current day prices and challenges those prices exceeding certain tolerance levels with the third party pricing service or broker source. For those securities valued by fair valuations, whether through a standardized fair valuation methodology or a fair valuation determination, the Valuation Committee reviews and affirms the reasonableness of the valuations based on such methodologies and fair valuation determinations on a regular basis after considering all relevant information that is reasonably available.
Classifications
Each investment asset or liability of the Fund is assigned a level at measurement date based on the significance and source of the inputs to its valuation. Various data inputs are used in determining the value of each of the Fund’s investments as of the reporting period end. These data inputs are categorized in the following hierarchy under applicable financial accounting standards:
1) Level 1-unadjusted quoted prices in active markets for identical assets or liabilities (including securities actively traded on a securities exchange)
2) Level 2-inputs other than unadjusted quoted prices that are observable for the asset or liability (such as unadjusted quoted prices for similar assets and market corroborated inputs such as interest rates, prepayment speeds, credit risks, etc.)
3) Level 3-significant unobservable inputs (including the Manager’s own judgments about assumptions that market participants would use in pricing
15 OPPENHEIMER MAIN STREET SMALL CAP FUND/VA
NOTES TO FINANCIAL STATEMENTS Unaudited / Continued
3. Securities Valuation (Continued)
the asset or liability).
The inputs used for valuing securities are not necessarily an indication of the risks associated with investing in those securities.
The Fund classifies each of its investments in those investment companies which are publicly offered as Level 1. Investment companies that are not publicly offered are measured using net asset value as a practical expedient, and are not classified in the fair value hierarchy.
The table below categorizes amounts that are included in the Fund’s Statement of Assets and Liabilities at period end based on valuation input level:
| Level 1— Unadjusted Quoted Prices |
Level 2— Other Significant |
Level 3— Significant Unobservable Inputs |
Value | |||||||||||||
|
|
||||||||||||||||
| Assets Table |
||||||||||||||||
| Investments, at Value: |
||||||||||||||||
| Common Stocks |
||||||||||||||||
| Consumer Discretionary |
$ | 105,637,501 | $ | — | $ | — | $ | 105,637,501 | ||||||||
| Consumer Staples |
36,019,769 | — | — | 36,019,769 | ||||||||||||
| Energy |
29,263,237 | — | — | 29,263,237 | ||||||||||||
| Financials |
221,888,211 | — | — | 221,888,211 | ||||||||||||
| Health Care |
115,639,281 | 2,787,305 | — | 118,426,586 | ||||||||||||
| Industrials |
171,719,287 | — | — | 171,719,287 | ||||||||||||
| Information Technology |
173,586,901 | — | — | 173,586,901 | ||||||||||||
| Materials |
54,169,923 | — | — | 54,169,923 | ||||||||||||
| Utilities |
47,945,074 | — | — | 47,945,074 | ||||||||||||
| Investment Company |
25,488,890 | — | — | 25,488,890 | ||||||||||||
|
|
|
|||||||||||||||
| Total Assets |
$ | 981,358,074 | $ | 2,787,305 | $ | — | $ | 984,145,379 | ||||||||
|
|
|
|||||||||||||||
Forward currency exchange contracts and futures contracts, if any, are reported at their unrealized appreciation/depreciation at measurement date, which represents the change in the contract’s value from trade date. All additional assets and liabilities included in the above table are reported at their market value at measurement date.
4. Investments and Risks
Investments in Affiliated Funds. The Fund is permitted to invest in other mutual funds advised by the Manager (“Affiliated Funds”). Affiliated Funds are open-end management investment companies registered under the 1940 Act, as amended. The Manager is the investment adviser of, and the Sub-Adviser provides investment and related advisory services to, the Affiliated Funds. When applicable, the Fund’s investments in Affiliated Funds are included in the Statement of Investments. Shares of Affiliated Funds are valued at their net asset value per share. As a shareholder, the Fund is subject to its proportional share of the Affiliated Funds’ expenses, including their management fee. The Manager will waive fees and/or reimburse Fund expenses in an amount equal to the indirect management fees incurred through the Fund’s investment in the Affiliated Funds.
Each of the Affiliated Funds in which the Fund invests has its own investment risks, and those risks can affect the value of the Fund’s investments and therefore the value of the Fund’s shares. To the extent that the Fund invests more of its assets in one Affiliated Fund than in another, the Fund will have greater exposure to the risks of that Affiliated Fund.
Investment in Oppenheimer Institutional Money Market Fund. The Fund is permitted to invest daily available cash balances in a money market Affiliated Fund. The Fund may invest the available cash in Class E shares of Oppenheimer Institutional Money Market Fund (“IMMF”) to seek current income while preserving liquidity or for defensive purposes. IMMF is regulated as a money market fund under the Investment Company Act of 1940, as amended.
Master Limited Partnerships (“MLPs”). MLPs issue common units that represent an equity ownership interest in a partnership and provide limited voting rights. MLP common units are registered with the Securities and Exchange Commission (“SEC”), and are freely tradable on securities exchanges such as the NYSE and the NASDAQ Stock Market (“NASDAQ”), or in the over-the-counter (“OTC”) market. An MLP consists of one or more general partners, who conduct the business, and one or more limited partners, who contribute capital. MLP common unit holders have a limited role in the partnership’s operations and management. The Fund, as a limited partner, normally would not be liable for the debts of the MLP beyond the amounts the Fund has contributed, but would not be shielded to the same extent that a shareholder of a corporation would be. In certain circumstances creditors of an MLP would have the right to seek return of capital distributed to a limited partner. This right of an MLP’s creditors would continue after the Fund sold its investment in the MLP.
Equity Security Risk. Stocks and other equity securities fluctuate in price. The value of the Fund’s portfolio may be affected by changes in the equity markets generally. Equity markets may experience significant short-term volatility and may fall sharply at times. Different markets may behave differently from each other and U.S. equity markets may move in the opposite direction from one or more foreign stock markets. Adverse events in any part of the equity or fixed-income markets may have unexpected negative effects on other market segments.
The prices of individual equity securities generally do not all move in the same direction at the same time and a variety of factors can affect the price of a particular company’s securities. These factors may include, but are not limited to, poor earnings reports, a loss of customers, litigation against the
16 OPPENHEIMER MAIN STREET SMALL CAP FUND/VA
4. Investments and Risks (Continued)
company, general unfavorable performance of the company’s sector or industry, or changes in government regulations affecting the company or its industry.
5. Market Risk Factors
The Fund’s investments in securities and/or financial derivatives may expose the Fund to various market risk factors:
Commodity Risk. Commodity risk relates to the change in value of commodities or commodity indexes as they relate to increases or decreases in the commodities market. Commodities are physical assets that have tangible properties. Examples of these types of assets are crude oil, heating oil, metals, livestock, and agricultural products.
Credit Risk. Credit risk relates to the ability of the issuer of debt to meet interest and principal payments, or both, as they come due. In general, lower-grade, higher-yield debt securities are subject to credit risk to a greater extent than lower-yield, higher-quality securities.
Equity Risk. Equity risk relates to the change in value of equity securities as they relate to increases or decreases in the general market.
Foreign Exchange Rate Risk. Foreign exchange rate risk relates to the change in the U.S. dollar value of a security held that is denominated in a foreign currency. The U.S. dollar value of a foreign currency denominated security will decrease as the dollar appreciates against the currency, while the U.S. dollar value will increase as the dollar depreciates against the currency.
Interest Rate Risk. Interest rate risk refers to the fluctuations in value of fixed-income securities resulting from the inverse relationship between price and yield. For example, an increase in general interest rates will tend to reduce the market value of already issued fixed-income investments, and a decline in general interest rates will tend to increase their value. In addition, debt securities with longer maturities, which tend to have higher yields, are subject to potentially greater fluctuations in value from changes in interest rates than obligations with shorter maturities.
Volatility Risk. Volatility risk refers to the magnitude of the movement, but not the direction of the movement, in a financial instrument’s price over a defined time period. Large increases or decreases in a financial instrument’s price over a relative time period typically indicate greater volatility risk, while small increases or decreases in its price typically indicate lower volatility risk.
6. Shares of Beneficial Interest
The Fund has authorized an unlimited number of $0.001 par value shares of beneficial interest of each class. Transactions in shares of beneficial interest were as follows:
| Six Months Ended June 30, 2016 | Year Ended December 31, 2015 | |||||||||||||||
| Shares | Amount | Shares | Amount | |||||||||||||
|
|
||||||||||||||||
| Non-Service Shares |
||||||||||||||||
| Sold |
624,284 | $ | 12,935,488 | 1,409,497 | $ | 33,342,939 | ||||||||||
| Dividends and/or distributions reinvested |
272,999 | 5,738,443 | 876,695 | 20,768,914 | ||||||||||||
| Redeemed |
(786,171) | (16,308,865) | (1,368,306) | (32,793,846) | ||||||||||||
|
|
|
|||||||||||||||
| Net increase |
111,112 | $ | 2,365,066 | 917,886 | $ | 21,318,007 | ||||||||||
|
|
|
|||||||||||||||
|
|
| |||||||||||||||
| Service Shares |
||||||||||||||||
| Sold |
2,150,091 | $ | 42,647,029 | 3,720,118 | $ | 87,937,386 | ||||||||||
| Dividends and/or distributions reinvested |
1,701,516 | 35,340,493 | 6,109,352 | 143,020,494 | ||||||||||||
| Redeemed |
(3,353,609) | (69,114,058) | (6,013,134) | (144,868,706) | ||||||||||||
|
|
|
|||||||||||||||
| Net increase |
497,998 | $ | 8,873,464 | 3,816,336 | $ | 86,089,174 | ||||||||||
|
|
|
|||||||||||||||
7. Purchases and Sales of Securities
The aggregate cost of purchases and proceeds from sales of securities, other than short-term obligations and investments in IMMF, for the reporting period were as follows:
| Purchases | Sales | |||||||
|
|
||||||||
| Investment securities |
$244,498,691 | $276,641,041 | ||||||
8. Fees and Other Transactions with Affiliates
Management Fees. Under the investment advisory agreement, the Fund pays the Manager a management fee based on the daily net assets of the Fund at an annual rate as shown in the following table:
| Fee Schedule | ||||
| Up to $200 million |
0.75% | |||
| Next $200 million |
0.72 | |||
| Next $200 million |
0.69 | |||
| Next $200 million |
0.66 | |||
| Next $200 million |
0.60 | |||
| Next $4 billion |
0.58 | |||
| Over $5 billion |
0.56 | |||
17 OPPENHEIMER MAIN STREET SMALL CAP FUND/VA
NOTES TO FINANCIAL STATEMENTS Unaudited / Continued
8. Fees and Other Transactions with Affiliates (Continued)
The Fund’s effective management fee for the reporting period was 0.69% of average annual net assets before any applicable waivers.
Sub-Adviser Fees. The Manager has retained the Sub-Adviser to provide the day-to-day portfolio management of the Fund. Under the Sub-Advisory Agreement, the Manager pays the Sub-Adviser an annual fee in monthly installments, equal to a percentage of the investment management fee collected by the Manager from the Fund, which shall be calculated after any investment management fee waivers. The fee paid to the Sub-Adviser is paid by the Manager, not by the Fund.
Transfer Agent Fees. OFI Global (the “Transfer Agent”) serves as the transfer and shareholder servicing agent for the Fund. The Fund pays the Transfer Agent a fee based on annual net assets. Fees incurred and average net assets for each class with respect to these services are detailed in the Statement of Operations and Financial Highlights, respectively.
Sub-Transfer Agent Fees. The Transfer Agent has retained Shareholder Services, Inc., a wholly-owned subsidiary of OFI (the “Sub-Transfer Agent”), to provide the day-to-day transfer agent and shareholder servicing of the Fund. Under the Sub-Transfer Agency Agreement, the Transfer Agent pays the Sub-Transfer Agent an annual fee in monthly installments, equal to a percentage of the transfer agent fee collected by the Transfer Agent from the Fund, which shall be calculated after any applicable fee waivers. The fee paid to the Sub-Transfer Agent is paid by the Transfer Agent, not by the Fund.
Trustees’ Compensation. The Fund’s Board of Trustees (“Board”) has adopted a compensation deferral plan for Independent Trustees that enables Trustees to elect to defer receipt of all or a portion of the annual compensation they are entitled to receive from the Fund. For purposes of determining the amount owed to the Trustee under the plan, deferred amounts are treated as though equal dollar amounts had been invested in shares of the Fund or in other Oppenheimer funds selected by the Trustee. The Fund purchases shares of the funds selected for deferral by the Trustee in amounts equal to his or her deemed investment, resulting in a Fund asset equal to the deferred compensation liability. Such assets are included as a component of “Other” within the asset section of the Statement of Assets and Liabilities. Deferral of Trustees’ fees under the plan will not affect the net assets of the Fund and will not materially affect the Fund’s assets, liabilities or net investment income per share. Amounts will be deferred until distributed in accordance with the compensation deferral plan.
Distribution and Service Plan for Service Shares. The Fund has adopted a Distribution and Service Plan (the “Plan”) pursuant to Rule 12b-1 under the 1940 Act for Service shares to pay OppenheimerFunds Distributor, Inc. (the “Distributor”), for distribution related services, personal service and account maintenance for the Fund’s Service shares. Under the Plan, payments are made periodically at an annual rate of 0.25% of the daily net assets of Service shares of the Fund. The Distributor currently uses all of those fees to compensate sponsors of the insurance product that offers Fund shares, for providing personal service and maintenance of accounts of their variable contract owners that hold Service shares. These fees are paid out of the Fund’s assets on an on-going basis and increase operating expenses of the Service shares, which results in lower performance compared to the Fund’s shares that are not subject to a service fee. Fees incurred by the Fund under the Plan are detailed in the Statement of Operations.
Waivers and Reimbursements of Expenses. The Manager has contractually agreed to limit the Fund’s expenses after payments, waivers and/or reimbursements and reduction to custodian expenses, excluding expenses incurred directly or indirectly by the Fund as a result of investments in other investment companies, wholly-owned subsidiaries and pooled investment vehicles; so that those expenses, as percentages of daily net assets, will not exceed the annual rate of 0.80% for Non-Service shares and 1.05% for Service shares. The expense limitations do not include interest and fees from borrowing, and other expenses not incurred in the ordinary course of the Fund’s business. During the reporting period, the Manager waived fees and/or reimbursed the Fund $6,333 and $40,447 for Non-Service and Service shares, respectively.
The Manager will waive fees and/or reimburse Fund expenses in an amount equal to the indirect management fees incurred through the Fund’s investment in IMMF. During the reporting period, the Manager waived fees and/or reimbursed the Fund $10,720 for IMMF management fees.
Waivers and/or reimbursements may be modified or terminated as set forth according to the terms in the prospectus.
9. Risk Exposures and the Use of Derivative Instruments
Joint Credit Facility. A number of mutual funds managed by the Manager participate in a $1.28 billion revolving credit facility (the “Facility”) intended to provide short-term financing, if necessary, subject to certain restrictions in connection with atypical redemption activity. Expenses and fees related to the Facility are paid by the participating funds and are disclosed separately or as other expenses on the Statement of Operations. The Fund did not utilize the Facility during the reporting period.
10. Pending Litigation
In 2009, several putative class action lawsuits were filed and later consolidated before the U.S. District Court for the District of Colorado against OppenheimerFunds, Inc. (“OFI”), OppenheimerFunds Distributor, Inc. (“OFDI”), and Oppenheimer Rochester California Municipal Fund, a fund advised by OFI Global Asset Management, Inc. and distributed by the Distributor (the “California Fund”), in connection with the California Fund’s investment performance. The plaintiffs asserted claims against OFI, OFDI and certain present and former trustees and officers of the California Fund under the federal securities laws, alleging, among other things, that the disclosure documents of the California Fund contained misrepresentations and omissions and the investment policies of the California Fund were not followed. Plaintiffs in the suit filed an amended complaint and defendants filed a motion to
18 OPPENHEIMER MAIN STREET SMALL CAP FUND/VA
10. Pending Litigation (Continued)
dismiss. In 2011, the court issued an order which granted in part and denied in part the defendants’ motion to dismiss. In 2012, plaintiffs filed a motion, which defendants opposed, to certify a class and appoint class representatives and class counsel. In March 2015, the court granted plaintiffs’ motion for class certification. In May 2015, the U.S. Court of Appeals for the Tenth Circuit vacated the class certification order and remanded the matter to the district court for further proceedings. In October 2015, the district court reaffirmed its order and determined that the suit will proceed as a class action. In December 2015, the Tenth Circuit denied defendants’ petition to appeal the district court’s reaffirmed class certification order.
OFI and OFDI believe the suit is without merit; that it is premature to render any opinion as to the likelihood of an outcome unfavorable to them in the suit; and that no estimate can yet be made as to the amount or range of any potential loss. Furthermore, OFI believes that the suit should not impair the ability of OFI or OFDI to perform their respective duties to the Fund and that the outcome of the suit should not have any material effect on the operations of any of the Oppenheimer funds.
19 OPPENHEIMER MAIN STREET SMALL CAP FUND/VA
PORTFOLIO PROXY VOTING POLICIES AND GUIDELINES; UPDATES TO STATEMENTS OF INVESTMENTS Unaudited
The Fund has adopted Portfolio Proxy Voting Policies and Guidelines under which the Fund votes proxies relating to securities (“portfolio proxies”) held by the Fund. A description of the Fund’s Portfolio Proxy Voting Policies and Guidelines is available (i) without charge, upon request, by calling the Fund toll-free at 1.800.525.7048, (ii) on the Fund’s website at www.oppenheimerfunds.com, and (iii) on the SEC’s website at www.sec.gov. In addition, the Fund is required to file Form N-PX, with its complete proxy voting record for the 12 months ended June 30th, no later than August 31st of each year. The Fund’s voting record is available (i) without charge, upon request, by calling the Fund toll-free at 1.800.525.7048, and (ii) in the Form N-PX filing on the SEC’s website at www.sec.gov.
The Fund files its complete schedule of portfolio holdings with the SEC for the first quarter and the third quarter of each fiscal year on Form N-Q. The Fund’s Form N-Q filings are available on the SEC’s website at www.sec.gov. Those forms may be reviewed and copied at the SEC’s Public Reference Room in Washington, D.C. Information on the operation of the Public Reference Room may be obtained by calling 1-800-SEC-0330.
20 OPPENHEIMER MAIN STREET SMALL CAP FUND/VA
DISTRIBUTION SOURCES Unaudited
For any distribution that took place over the Fund’s reporting period, the table below details on a per-share basis the percentage of the Fund’s total distribution payment amount that was derived from the following sources: net income, net profit from the sale of securities, and other capital sources. This information is based upon income and capital gains using generally accepted accounting principles as of the date of each distribution. For certain securities, such as Real Estate Investment Trusts (“REITs”) and Master Limited Partnerships (“MLPs”), the percentages attributed to each category are estimated using historical information because the character of the amounts received from the REITs and MLPs in which the Fund invests is unknown until after the end of the calendar year. Because the Fund is actively managed, the relative amount of the Fund’s total distributions derived from various sources over the calendar year may change. Please note that this information should not be used for tax reporting purposes as the tax character of distributable income may differ from the amounts used for this notification. You will receive IRS tax forms in the first quarter of each calendar year detailing the actual amount of the taxable and non-taxable portion of distributions paid to you during the tax year.
For the most current information, please go to oppenheimerfunds.com. Select your Fund, then the ‘Detailed’ tab; where ‘Dividends’ are shown, the Fund’s latest pay date will be followed by the sources of any distribution, updated daily.
|
Fund Name |
Pay |
Net Income |
Net Profit |
Other | ||||||||||
|
Oppenheimer Main Street Small Cap Fund®/VA
|
|
6/21/16
|
|
|
15.5%
|
|
|
47.9%
|
|
36.6%
| ||||
21 OPPENHEIMER MAIN STREET SMALL CAP FUND/VA
THIS PAGE INTENTIONALLY LEFT BLANK.
22 OPPENHEIMER MAIN STREET SMALL CAP FUND/VA
THIS PAGE INTENTIONALLY LEFT BLANK.
23 OPPENHEIMER MAIN STREET SMALL CAP FUND/VA
OPPENHEIMER MAIN STREET SMALL CAP FUND/VA
A Series of Oppenheimer Variable Account Funds
| Trustees and Officers | Sam Freedman, Chairman of the Board of Trustees and Trustee | |
| Jon S. Fossel, Trustee | ||
| Richard F. Grabish, Trustee | ||
| Beverly L. Hamilton, Trustee | ||
| Victoria J. Herget, Trustee | ||
| Robert J. Malone, Trustee | ||
| F. William Marshall, Jr., Trustee | ||
| Karen L. Stuckey, Trustee | ||
| James D. Vaughn, Trustee | ||
| Arthur P. Steinmetz, President and Principal Executive Officer | ||
| Matthew P. Ziehl, Vice President | ||
| Raymond Anello, Vice President | ||
| Raman Vardharaj, Vice President | ||
| Joy Budzinski, Vice President | ||
| Kristin Ketner, Vice President | ||
| Magnus Krantz, Vice President | ||
| Adam Weiner, Vice President | ||
| Cynthia Lo Bessette, Secretary and Chief Legal Officer | ||
| Jennifer Sexton, Vice President and Chief Business Officer | ||
| Mary Ann Picciotto, Chief Compliance Officer and Chief Anti-Money Laundering Officer | ||
| Brian S. Petersen, Treasurer and Principal Financial & Accounting Officer | ||
| Manager | OFI Global Asset Management, Inc. | |
| Sub-Adviser | OppenheimerFunds, Inc. | |
| Distributor | OppenheimerFunds Distributor, Inc. | |
| Transfer and Shareholder Servicing Agent |
OFI Global Asset Management, Inc. | |
| Sub-Transfer Agent | Shareholder Services, Inc. | |
| DBA OppenheimerFunds Services | ||
| Independent Registered Public Accounting Firm |
KPMG LLP | |
| Legal Counsel | Ropes & Gray LLP | |
| Before investing in any of the Oppenheimer funds, investors should carefully consider a fund’s investment objectives, risks, charges and expenses. Fund prospectuses and summary prospectuses contain this and other information about the funds, and may be obtained by asking your financial advisor, or calling us at 1.800.988.8287. Read prospectuses and summary prospectuses carefully before investing. | ||
| The financial statements included herein have been taken from the records of the Fund without examination of those records by the independent registered public accounting firm. | ||
| © 2016 OppenheimerFunds, Inc. All rights reserved. Oppenheimer funds are distributed by OppenheimerFunds Distributor, Inc. | ||


|
||||
|
June 30, 2016
|
||||
|
Oppenheimer |
||||
| Government Money Fund/VA* | Semiannual Report | |||
| A Series of Oppenheimer Variable Account Funds
|
||||
|
SEMIANNUAL REPORT |
||||
|
Listing of Top Holdings |
||||
|
Fund Performance Discussion |
||||
|
Financial Statements |
||||
|
*Prior to April 29, 2016, the Fund was named Oppenheimer Money Fund/VA | ||||
PORTFOLIO MANAGERS: Christopher Proctor, CFA and Adam S. Wilde, CFA
Performance data quoted represents past performance, which does not guarantee future results. Yields include dividends in a hypothetical investment for the periods shown. Current performance may be lower or higher than the performance quoted. For performance data current to the most recent month end, call us at 1.800.988.8287. The yields take into account voluntary fee waivers and/or expense reimbursements, without which yields would have been lower. Some of these undertakings may be modified at any time, as indicated in the prospectus. There is no guarantee that the Fund will maintain a positive yield. The Fund’s performance should not be expected to be the same as the returns of other funds, whether or not both funds have the same portfolio managers and/or similar names. The Fund’s performance does not include the charges associated with the separate account products that offer this Fund. Such performance would have been lower if such charges were taken into account.
2 OPPENHEIMER GOVERNMENT MONEY FUND/VA
Fund Performance Discussion
While the Federal Reserve (the “Fed”) rate hike in December now seems to be a distant memory, rates in 2016 continued to inch higher with the month of May being the most favorable. For example, 1-month Libor at the end of May was at a level last witnessed in the first half of 2009. In June, 1-month Libor began the month on a steep decline, but with the Brexit vote, rebounded by month-end. U.S. Treasury yields on the other hand plummeted at the end of June, but remain in better shape versus this time last year.
MARKET OVERVIEW
The first half of 2016 was a volatile time for global equity markets. China’s slowing economy, falling crude oil prices, and the aggressive interest rate hike path indicated by the Fed in its December 2015 communication, contributed to a tumultuous environment. March saw a temporary relief rally as communication from the Fed turned more accommodative in light of this weak start to the year. Oil prices and commodities started to pick up, but continued to experience volatility through the close of the reporting period. However, unanswered questions, including how quickly the Fed would raise interest rates and whether Britain would decide to exit the E.U. on its June 23 vote, made for an uncertain period. The U.K. surprised the markets by ultimately deciding to exit the E.U. As a result, markets dropped sharply and remained volatile through the reporting period’s end.
On Fed rate hikes, Fed Chairwoman Janet Yellen and the Federal Open Market Committee (“FOMC”) released statements and minutes that indicated the pace of rate hikes would be slow. The Brexit only further strengthened that stance, and the assumption that central banks throughout the globe would continue to be accommodative.
FUND REVIEW
On April 29, 2016, we successfully converted Oppenheimer Money Fund/VA to Oppenheimer Government Money Fund/VA. As such, the Fund is now compliant with holding at least 99.5% of assets in cash, U.S. Government Securities, and/or repurchase agreements that are fully collateralized with Government Securities.
We continued to maintain the weighted average maturity (WAM) of the Fund below the industry average and maintained an above average liquidity profile to accommodate the cash flow of the Fund.
Given these conservative measures, the Fund continued to generate consistent and competitive levels of current income.
STRATEGY & OUTLOOK
The outlook for the Fund is to remain a conservative option with sizeable exposure to overnight government repurchase agreements and short term Agency Discount notes.
An investment in the Fund is not insured or guaranteed by the Federal Deposit Insurance Corporation or any other government agency. Although the Fund seeks to preserve the value of your investment at $1.00 per share, it is possible to lose money by investing in the Fund.
Shares of Oppenheimer funds are not deposits or obligations of any bank, are not guaranteed by any bank, are not insured by the FDIC or any other agency, and involve investment risks, including the possible loss of the principal amount invested.
3 OPPENHEIMER GOVERNMENT MONEY FUND/VA
Fund Expenses
Fund Expenses. As a shareholder of the Fund, you incur two types of costs: (1) transaction costs and (2) ongoing costs, including management fees; and other Fund expenses. These examples are intended to help you understand your ongoing costs (in dollars) of investing in the Fund and to compare these costs with the ongoing costs of investing in other mutual funds.
The examples are based on an investment of $1,000.00 invested at the beginning of the period and held for the entire 6-month period ended June 30, 2016.
Actual Expenses. The first section of the table provides information about actual account values and actual expenses. You may use the information in this section, together with the amount you invested, to estimate the expense that you paid over the period. Simply divide your account value by $1,000.00 (for example, an $8,600.00 account value divided by $1,000.00 = 8.60), then multiply the result by the number in the first section under the heading entitled “Expenses Paid During During 6 Months Ended June 30, 2016” to estimate the expenses you paid on your account during this period.
Hypothetical Example for Comparison Purposes.
The second section of the table provides information about hypothetical account values and hypothetical expenses based on the Fund’s actual expense ratio, and an assumed rate of return of 5% per year before expenses, which is not the actual return. The hypothetical account values and expenses may not be used to estimate the actual ending account balance or expenses you paid for the period. You may use this information to compare the ongoing costs of investing in the Fund and other funds. To do so, compare this 5% hypothetical example with the 5% hypothetical examples that appear in the shareholder reports of the other funds.
Please note that the expenses shown in the table are meant to highlight your ongoing costs only and do not reflect any charges associated with the separate accounts that offer this Fund. Therefore, the “hypothetical” lines of the table are useful in comparing ongoing costs only, and will not help you determine the relative total costs of owning different funds. In addition, if these separate account charges were included your costs would have been higher.
| Actual | Beginning Account Value |
Ending Account Value |
Expenses Paid
During June 30, 2016 |
|||||||||
|
|
||||||||||||
| $ | 1,000.00 | $ | 1,000.10 | $ | 1.74 | |||||||
|
|
||||||||||||
| Hypothetical | ||||||||||||
| (5% return before expenses) | ||||||||||||
| 1,000.00 | 1,023.12 | 1.76 | ||||||||||
|
|
||||||||||||
Expenses are equal to the Fund’s annualized expense ratio, multiplied by the average account value over the period, multiplied by 182/366 (to reflect the one-half year period). This annualized expense ratio, excluding indirect expenses from affiliated funds, based on the 6-month period ended June 30, 2016 is as follows:
| Expense Ratio |
|
|
| 0.35% |
|
|
The expense ratio reflects voluntary and/or contractual waivers and/or reimbursements of expenses by the Fund’s Manager. Some of these undertakings may be modified or terminated at any time, as indicated in the Fund’s prospectus. The “Financial Highlights” table in the Fund’s financial statements, included in this report, also shows the gross expense ratio, without such waivers or reimbursements and reduction to custodian expenses, if applicable.
4 OPPENHEIMER GOVERNMENT MONEY FUND/VA
STATEMENT OF INVESTMENTS June 30, 2016 Unaudited
| Maturity Date* | Final Legal Maturity Date** |
Principal Amount |
Value | |||||||||||||
|
|
||||||||||||||||
| U.S. Government Agencies—55.8% |
||||||||||||||||
|
|
||||||||||||||||
| Fannie Mae: |
||||||||||||||||
| 0.22% |
8/1/16 | 8/1/16 | $ | 18,025,000 | $ | 18,021,585 | ||||||||||
| 0.235% |
7/5/16 | 7/5/16 | 1,500,000 | 1,499,961 | ||||||||||||
| 0.25% |
8/5/16 | 8/5/16 | 10,000,000 | 9,997,570 | ||||||||||||
|
|
||||||||||||||||
| Federal Agricultural Mortgage Corp., 0.20% |
8/2/16 | 8/2/16 | 38,000,000 | 37,993,244 | ||||||||||||
|
|
||||||||||||||||
| Federal Farm Credit Bank, 0.49%1 |
7/1/16 | 3/22/17 | 1,000,000 | 999,194 | ||||||||||||
|
|
||||||||||||||||
| Federal Home Loan Bank: |
||||||||||||||||
| 0.126% |
7/1/16 | 7/1/16 | 102,700,000 | 102,700,000 | ||||||||||||
| 0.182% |
7/21/16 | 7/21/16 | 45,300,000 | 45,295,432 | ||||||||||||
| 0.215% |
7/6/16 | 7/6/16 | 63,650,000 | 63,648,100 | ||||||||||||
| 0.22% |
7/7/16 | 7/7/16 | 23,190,000 | 23,189,148 | ||||||||||||
| 0.233% |
7/8/16 | 7/8/16 | 10,750,000 | 10,749,513 | ||||||||||||
| 0.235% |
7/5/16 | 7/5/16 | 1,200,000 | 1,199,969 | ||||||||||||
| 0.235% |
7/11/16 | 7/11/16 | 2,900,000 | 2,899,811 | ||||||||||||
| 0.244% |
7/13/16 | 7/13/16 | 11,610,000 | 11,609,056 | ||||||||||||
| 0.245% |
7/18/16 | 7/18/16 | 3,300,000 | 3,299,618 | ||||||||||||
| 0.26% |
7/29/16 | 7/29/16 | 19,400,000 | 19,396,077 | ||||||||||||
| 0.267% |
7/27/16 | 7/27/16 | 89,000,000 | 88,982,862 | ||||||||||||
| 0.298% |
7/15/16 | 7/15/16 | 24,215,000 | 24,212,195 | ||||||||||||
| 0.30% |
7/25/16 | 7/25/16 | 50,000,000 | 49,990,000 | ||||||||||||
| 0.305% |
8/5/16 | 8/5/16 | 1,000,000 | 999,704 | ||||||||||||
| 0.305% |
7/20/16 | 7/20/16 | 41,300,000 | 41,293,350 | ||||||||||||
| 0.32% |
7/22/16 | 7/22/16 | 8,400,000 | 8,398,432 | ||||||||||||
| 0.39% |
9/13/16 | 9/13/16 | 9,700,000 | 9,692,224 | ||||||||||||
| 0.40% |
9/21/16 | 9/21/16 | 4,200,000 | 4,196,173 | ||||||||||||
|
|
||||||||||||||||
| Freddie Mac: |
||||||||||||||||
| 0.21% |
7/12/16 | 7/12/16 | 5,000,000 | 4,999,679 | ||||||||||||
| 0.23% |
7/25/16 | 7/25/16 | 12,693,000 | 12,691,054 | ||||||||||||
| 0.501% |
10/3/16 | 10/3/16 | 1,000,000 | 998,694 | ||||||||||||
|
|
||||||||||||||||
| Tennessee Valley Authority: |
||||||||||||||||
| 0.25% |
7/19/16 | 7/19/16 | 34,000,000 | 33,995,750 | ||||||||||||
| 0.254% |
7/5/16 | 7/5/16 | 29,000,000 | 28,999,182 | ||||||||||||
|
|
|
|||||||||||||||
| Total U.S. Government Agencies (Cost $661,947,577) |
|
661,947,577 | ||||||||||||||
|
|
||||||||||||||||
| Short-Term Investments—42.2% |
||||||||||||||||
|
|
||||||||||||||||
| Repurchase Agreements2 (Cost $500,000,000)
|
|
500,000,000
|
|
|
500,000,000
|
| ||||||||||
|
|
||||||||||||||||
| Total Investments, at Value (Cost $1,161,947,577) |
98.0% | 1,161,947,577 | ||||||||||||||
|
|
||||||||||||||||
| Net Other Assets (Liabilities) |
2.0 | 23,521,093 | ||||||||||||||
|
|
|
|||||||||||||||
| Net Assets |
100.0% | $ | 1,185,468,670 | |||||||||||||
|
|
|
|||||||||||||||
Footnotes to Statement of Investments
Short-term notes and direct bank obligations are generally traded on a discount basis; the interest rate shown is the discount rate received by the Fund at the time of purchase. Other securities normally bear interest at the rates shown.
* The Maturity Date represents the date used to calculate the Fund’s weighted average maturity as determined under Rule 2a-7.
** If different from the Maturity Date, the Final Legal Maturity Date includes any maturity date extensions which may be affected at the option of the issuer or unconditional payments of principal by the issuer which may be affected at the option of the Fund, and represents the date used to calculate the Fund’s weighted average life as determined under Rule 2a-7.
1. Represents the current interest rate for a variable or increasing rate security.
2. Repurchase agreements:
| Counterparty | Lending Rate |
Settlement Date |
Maturity Date |
Principal Amount |
Collateralized By | Collateral Received, at Value |
Repurchase Agreements, at Value |
Repurchase Agreement Proceeds to be Received(1) |
||||||||||||||||||||||
|
|
||||||||||||||||||||||||||||||
| South Street Securities LLC | 0.50% | 6/30/16 | 7/1/16 | $ | 400,000,000 | U.S. Treasury Nts., 1.25%, 11/30/18 and U.S. Government Agency Mortgages, 1.03%-5.20%, 9/1/16-5/1/46 | $ | (408,005,689) | $ 400,000,000 | $ 400,005,556 | ||||||||||||||||||||
|
|
||||||||||||||||||||||||||||||
| Toronto Dominion Bank | 0.40 | 6/30/16 | 7/1/16 | 100,000,000 | U.S. Treasury Nts., 2.125%, 9/30/21; U.S. Treasury Bills, 0%, 7/7/16; U.S. Government Agency Mortgages, 3.50%-4%, 5/20/45-11/20/45 | (102,001,134) | 100,000,000 | 100,001,111 | ||||||||||||||||||||||
|
|
|
|||||||||||||||||||||||||||||
| $ | (510,006,823) | $500,000,000 | $500,006,667 | |||||||||||||||||||||||||||
|
|
|
|||||||||||||||||||||||||||||
1. Includes accrued interest.
The following issuer is or was an affiliate, as defined in the Investment Company Act of 1940, at or during the reporting period by virtue of the Fund owning at least 5% of the voting securities of the issuer or as a result of the Fund and the issuer having the same investment adviser. There were no affiliate securities held by the Fund at period end. Transactions during the period in which the issuer was an affiliate are as follows:
5 OPPENHEIMER GOVERNMENT MONEY FUND/VA
STATEMENT OF INVESTMENTS Unaudited / Continued
Footnotes to Statement of Investments (Continued)
| Shares December 31, 2015 |
Gross Additions |
Gross Reductions |
Shares June 30, 2016 |
|||||||||||||
|
|
||||||||||||||||
| Oppenheimer Institutional Money Market Fund, Cl. E |
131,359,385 | 126,653,654 | 258,013,039 | — | ||||||||||||
| Income | ||||||||||||||||
|
|
||||||||||||||||
| Oppenheimer Institutional Money Market Fund, Cl. E |
$ | 190,049 | ||||||||||||||
See accompanying Notes to Financial Statements.
6 OPPENHEIMER GOVERNMENT MONEY FUND/VA
STATEMENT OF ASSETS AND LIABILITIES June 30, 2016 Unaudited
|
|
||||
| Assets |
||||
| Investments, at value—see accompanying statement of investments-unaffiliated companies (cost $1,161,947,577) |
$ | 1,161,947,577 | ||
|
|
||||
| Cash |
11,266,280 | |||
|
|
||||
| Receivables and other assets: |
||||
| Shares of beneficial interest sold |
23,319,849 | |||
| Interest |
6,789 | |||
| Other |
191,466 | |||
|
|
|
|||
| Total assets |
1,196,731,961 | |||
|
|
||||
| Liabilities |
||||
| Payables and other liabilities: |
||||
| Investments purchased |
11,113,796 | |||
| Shares of beneficial interest redeemed |
105,774 | |||
| Trustees’ compensation |
28,341 | |||
| Dividends |
3,199 | |||
| Other |
12,181 | |||
|
|
|
|||
| Total liabilities |
11,263,291 | |||
|
|
||||
| Net Assets |
$ | 1,185,468,670 | ||
|
|
|
|||
|
|
||||
| Composition of Net Assets |
||||
| Par value of shares of beneficial interest |
$ | 1,185,441 | ||
|
|
||||
| Additional paid-in capital |
1,184,262,535 | |||
|
|
||||
| Accumulated net investment income |
20,909 | |||
|
|
||||
| Accumulated net realized loss on investments |
(215) | |||
|
|
|
|||
| Net Assets – applicable to 1,185,441,278 shares of beneficial interest outstanding |
$ | 1,185,468,670 | ||
|
|
|
|||
|
|
||||
| Net Asset Value, Redemption Price Per Share and Offering Price Per Share |
$1.00 | |||
See accompanying Notes to Financial Statements.
7 OPPENHEIMER GOVERNMENT MONEY FUND/VA
STATEMENT OF OPERATIONS For the Six Months Ended June 30, 2016 Unaudited
|
|
||||
| Investment Income |
||||
| Interest |
$ | 3,970,730 | ||
|
|
||||
| Dividends from affiliated companies |
190,049 | |||
|
|
|
|||
| Total investment income
|
|
4,160,779
|
| |
|
|
||||
| Expenses |
||||
| Management fees |
4,686,024 | |||
|
|
||||
| Transfer and shareholder servicing agent fees |
1,151,532 | |||
|
|
||||
| Shareholder communications |
14,064 | |||
|
|
||||
| Trustees’ compensation |
51,128 | |||
|
|
||||
| Custodian fees and expenses |
7,594 | |||
|
|
||||
| Other |
137,537 | |||
|
|
|
|||
| Total expenses |
6,047,879 | |||
| Less reduction to custodian expenses |
(6,134) | |||
| Less waivers and reimbursements of expenses |
(1,995,916) | |||
|
|
|
|||
| Net expenses
|
|
4,045,829
|
| |
|
|
||||
| Net Investment Income
|
|
114,950
|
| |
|
|
||||
| Net realized loss |
(215) | |||
|
|
||||
| Net Increase in Net Assets Resulting from Operations |
$ | 114,735 | ||
|
|
|
|||
See accompanying Notes to Financial Statements.
8 OPPENHEIMER GOVERNMENT MONEY FUND/VA
STATEMENTS OF CHANGES IN NET ASSETS
| Six Months Ended June 30, 2016 (Unaudited) |
Year Ended December 31, 2015 |
|||||||
|
|
||||||||
| Operations |
||||||||
| Net investment income |
$ | 114,950 | $ | 114,454 | ||||
|
|
||||||||
| Net realized gain (loss) |
(215) | 22,016 | ||||||
|
|
|
|||||||
| Net increase in net assets resulting from operations
|
|
114,735
|
|
|
136,470
|
| ||
|
|
||||||||
| Dividends and/or Distributions to Shareholders |
||||||||
| Dividends from net investment income |
(119,696) | (119,146) | ||||||
|
|
||||||||
| Beneficial Interest Transactions |
||||||||
| Net increase (decrease) in net assets resulting from beneficial interest transactions |
(1,463,162,418) | 2,133,322,061 | ||||||
|
|
||||||||
| Net Assets |
||||||||
| Total increase (decrease) |
(1,463,167,379) | 2,133,339,385 | ||||||
|
|
||||||||
| Beginning of period |
2,648,636,049 | 515,296,664 | ||||||
|
|
|
|||||||
| End of period (including accumulated net investment income of $20,909 and $25,655, respectively) |
$ | 1,185,468,670 | $ | 2,648,636,049 | ||||
|
|
|
|||||||
See accompanying Notes to Financial Statements.
9 OPPENHEIMER GOVERNMENT MONEY FUND/VA
FINANCIAL HIGHLIGHTS
| Six Months Ended June 30, 2016 (Unaudited) |
Year Ended December 31, 2015 |
Year Ended December 31, 2014 |
Year Ended December 31, 2013 |
Year Ended December 31, 2012 |
Year Ended December 30, 20111 |
|||||||||||||||||||
|
|
||||||||||||||||||||||||
| Per Share Operating Data |
||||||||||||||||||||||||
| Net asset value, beginning of period |
$ | 1.00 | $ | 1.00 | $ | 1.00 | $ | 1.00 | $ | 1.00 | $ | 1.00 | ||||||||||||
|
|
||||||||||||||||||||||||
| Income (loss) from investment operations: |
||||||||||||||||||||||||
| Net investment income2 |
0.003 | 0.003 | 0.003 | 0.003 | 0.003 | 0.003 | ||||||||||||||||||
| Net realized gain (loss) |
0.003 | 0.003 | 0.003 | 0.003 | 0.003 | 0.003 | ||||||||||||||||||
|
|
|
|||||||||||||||||||||||
| Total from investment operations |
0.003 | 0.003 | 0.003 | 0.003 | 0.003 | 0.003 | ||||||||||||||||||
|
|
||||||||||||||||||||||||
| Dividends and/or distributions to shareholders: |
||||||||||||||||||||||||
| Dividends from net investment income |
(0.00)3 | (0.00)3 | (0.00)3 | (0.00)3 | (0.00)3 | (0.00)3 | ||||||||||||||||||
|
|
||||||||||||||||||||||||
| Net asset value, end of period |
$ | 1.00 | $ | 1.00 | $ | 1.00 | $ | 1.00 | $ | 1.00 | $ | 1.00 | ||||||||||||
|
|
|
|||||||||||||||||||||||
|
|
||||||||||||||||||||||||
| Total Return, at Net Asset Value4 |
0.01% | 0.01% | 0.01% | 0.01% | 0.01% | 0.01% | ||||||||||||||||||
|
|
||||||||||||||||||||||||
| Ratios/Supplemental Data |
||||||||||||||||||||||||
| Net assets, end of period (in thousands) |
$ | 1,185,469 | $ | 2,648,636 | $ | 515,297 | $ | 177,026 | $ | 174,428 | $ | 163,973 | ||||||||||||
|
|
||||||||||||||||||||||||
| Average net assets (in thousands) |
$ | 2,305,333 | $ | 1,144,581 | $ | 329,045 | $ | 178,263 | $ | 164,276 | $ | 156,127 | ||||||||||||
|
|
||||||||||||||||||||||||
| Ratios to average net assets:5 |
||||||||||||||||||||||||
| Net investment income |
0.01% | 0.01% | 0.01% | 0.01% | 0.01% | 0.01% | ||||||||||||||||||
| Total expenses6 |
0.53% | 0.53% | 0.57% | 0.61% | 0.62% | 0.61% | ||||||||||||||||||
| Expenses after payments, waivers and/or reimbursements and reduction to custodian expenses | 0.35% | 0.19% | 0.15% | 0.22% | 0.30% | 0.29% | ||||||||||||||||||
1. December 30, 2011 represents the last business day of the Fund’s reporting period.
2. Per share amounts calculated based on the average shares outstanding during the period.
3. Less than $0.005 per share.
4. Assumes an initial investment on the business day before the first day of the fiscal period, with all dividends and distributions reinvested in additional shares on the reinvestment date, and redemption at the net asset value calculated on the last business day of the fiscal period. Total returns are not annualized for periods less than one full year. Total return information does not reflect expenses that apply at the separate account level or to related insurance products. Inclusion of these charges would reduce the total return figures for all periods shown. Returns do not reflect the deduction of taxes that a shareholder would pay on fund distributions or the redemption of fund shares.
5. Annualized for periods less than one full year.
6. Total expenses including indirect expenses from affiliated fund fees and expenses were as follows:
See accompanying Notes to Financial Statements.
10 OPPENHEIMER GOVERNMENT MONEY FUND/VA
NOTES TO FINANCIAL STATEMENTS June 30, 2016 Unaudited
1. Organization
Oppenheimer Government Money Fund/VA, formerly Oppenheimer Money Fund/VA (the “Fund”), a separate series of Oppenheimer Variable Account Funds, is a diversified open-end management investment company registered under the Investment Company Act of 1940 (“1940 Act”), as amended. The Fund’s investment objective is to seek income consistent with stability of principal. The Fund’s investment adviser is OFI Global Asset Management, Inc. (“OFI Global” or the “Manager”), a wholly-owned subsidiary of OppenheimerFunds, Inc. (“OFI” or the “Sub-Adviser”). The Manager has entered into a sub-advisory agreement with OFI. Shares of the Fund are sold only to separate accounts of life insurance companies.
The following is a summary of significant accounting policies followed in the Fund’s preparation of financial statements in accordance with accounting principles generally accepted in the United States (“U.S. GAAP”).
2. Significant Accounting Policies
Security Valuation. All investments in securities are recorded at their estimated fair value, as described in Note 3.
Reporting Period End Date. The last day of the Fund’s reporting period is the last day the New York Stock Exchange was open for trading during the period. The Fund’s financial statements have been presented through that date to maintain consistency with the Fund’s net asset value calculations used for shareholder transactions.
Dividends and Distributions to Shareholders. Dividends and distributions to shareholders, which are determined in accordance with income tax regulations and may differ from U.S. GAAP, are recorded on the ex-dividend date. Income distributions, if any, are declared daily and paid monthly. Capital gain distributions, if any, are declared and paid annually but may be paid at other times to maintain the net asset value per share at $1.00.
The tax character of distributions is determined as of the Fund’s fiscal year end. Therefore, a portion of the Fund’s distributions made to shareholders prior to the Fund’s fiscal year end may ultimately be categorized as a tax return of capital.
Investment Income. Interest income is recognized on an accrual basis. Discount and premium, which are included in interest income on the Statement of Operations, are amortized or accreted daily.
Custodian Fees. “Custodian fees and expenses” in the Statement of Operations may include interest expense incurred by the Fund on any cash overdrafts of its custodian account during the period. Such cash overdrafts may result from the effects of failed trades in portfolio securities and from cash outflows resulting from unanticipated shareholder redemption activity. The Fund pays interest to its custodian on such cash overdrafts, to the extent they are not offset by positive cash balances maintained by the Fund, at a rate equal to the Federal Funds Rate plus 0.50%. The “Reduction to custodian expenses” line item, if applicable, represents earnings on cash balances maintained by the Fund during the period. Such interest expense and other custodian fees may be paid with these earnings.
Security Transactions. Security transactions are recorded on the trade date. Realized gains and losses on securities sold are determined on the basis of identified cost.
Indemnifications. The Fund’s organizational documents provide current and former Trustees and officers with a limited indemnification against liabilities arising in connection with the performance of their duties to the Fund. In the normal course of business, the Fund may also enter into contracts that provide general indemnifications. The Fund’s maximum exposure under these arrangements is unknown as this would be dependent on future claims that may be made against the Fund. The risk of material loss from such claims is considered remote.
Federal Taxes. The Fund intends to comply with provisions of the Internal Revenue Code applicable to regulated investment companies and to distribute substantially all of its investment company taxable income to shareholders. Therefore, no federal income or excise tax provision is required. The Fund files income tax returns in U.S. federal and applicable state jurisdictions. The statute of limitations on the Fund’s tax return filings generally remains open for the three preceding fiscal reporting period ends.
Use of Estimates. The preparation of financial statements in conformity with U.S. GAAP requires management to make estimates and assumptions that affect the reported amounts of assets and liabilities and disclosure of contingent assets and liabilities at the date of the financial statements and the reported amounts of increases and decreases in net assets from operations during the reporting period. Actual results could differ from those estimates.
Money Market Fund Reform. In accordance with the Reform Rules, adopted by the Securities and Exchange Commission (SEC) in July 2014, the Fund’s name changed from Oppenheimer Money Fund/VA to Oppenheimer Government Money Fund/VA on April 29, 2016. Additionally the Board of Trustees approved the adoption of a new non-fundamental investment policy requiring each Fund to invest 99.5% or more of its total assets in cash, government securities, and/or repurchase agreements that are collateralized fully by cash and/or government securities.
3. Securities Valuation
The Fund calculates the net asset value of its shares as of 4:00 P.M. Eastern time, on each day the New York Stock Exchange (the “Exchange”) is open for trading, except in the case of a scheduled early closing of the Exchange, in which case the Fund will calculate net asset value of the shares as of the
11 OPPENHEIMER GOVERNMENT MONEY FUND/VA
NOTES TO FINANCIAL STATEMENTS Unaudited / Continued
3. Securities Valuation (Continued)
scheduled early closing time of the Exchange.
The Fund’s Board has adopted procedures for the valuation of the Fund’s securities and has delegated the day-to-day responsibility for valuation determinations under those procedures to the Manager. The Manager has established a Valuation Committee which is responsible for determining a “fair valuation” for any security for which market quotations are not “readily available.” The Valuation Committee’s fair valuation determinations are subject to review, approval and ratification by the Fund’s Board at its next regularly scheduled meeting covering the calendar quarter in which the fair valuation was determined.
Valuation Methods and Inputs
Securities are valued at cost adjusted by the amortization of discount or premium to maturity (amortized cost), which approximates market value. If amortized cost is determined not to approximate market value, the fair value of the portfolio securities will be determined under procedures approved by the Fund’s Board of Trustees.
If a market value or price cannot be determined for a security using the methodologies described above, or if, in the “good faith” opinion of the Manager, the market value or price obtained does not constitute a “readily available market quotation,” or a significant event has occurred that would materially affect the value of the security, the security is fair valued either (i) by a standardized fair valuation methodology applicable to the security type or the significant event as previously approved by the Valuation Committee and the Fund’s Board or (ii) as determined in good faith by the Manager’s Valuation Committee. The Valuation Committee considers all relevant facts that are reasonably available, through either public information or information available to the Manager, when determining the fair value of a security. Fair value determinations by the Manager are subject to review, approval and ratification by the Fund’s Board at its next regularly scheduled meeting covering the calendar quarter in which the fair valuation was determined. Those fair valuation standardized methodologies include, but are not limited to, valuing securities at the last sale price or initially at cost and subsequently adjusting the value based on: changes in company specific fundamentals, changes in an appropriate securities index, or changes in the value of similar securities which may be further adjusted for any discounts related to security-specific resale restrictions. When possible, such methodologies use observable market inputs such as unadjusted quoted prices of similar securities, observable interest rates, currency rates and yield curves. The methodologies used for valuing securities are not necessarily an indication of the risks associated with investing in those securities nor can it be assured that the Fund can obtain the fair value assigned to a security if it were to sell the security.
To assess the continuing appropriateness of security valuations, the Manager, or its third party service provider who is subject to oversight by the Manager, regularly compares prior day prices, prices on comparable securities, and sale prices to the current day prices and challenges those prices exceeding certain tolerance levels with the third party pricing service or broker source. For those securities valued by fair valuations, whether through a standardized fair valuation methodology or a fair valuation determination, the Valuation Committee reviews and affirms the reasonableness of the valuations based on such methodologies and fair valuation determinations on a regular basis after considering all relevant information that is reasonably available.
Classifications
Each investment asset or liability of the Fund is assigned a level at measurement date based on the significance and source of the inputs to its valuation. Various data inputs are used in determining the value of each of the Fund’s investments as of the reporting period end. These data inputs are categorized in the following hierarchy under applicable financial accounting standards:
1) Level 1-unadjusted quoted prices in active markets for identical assets or liabilities (including securities actively traded on a securities exchange)
2) Level 2-inputs other than unadjusted quoted prices that are observable for the asset or liability (such as unadjusted quoted prices for similar assets and market corroborated inputs such as interest rates, prepayment speeds, credit risks, etc.)
3) Level 3-significant unobservable inputs (including the Manager’s own judgments about assumptions that market participants would use in pricing the asset or liability).
The inputs used for valuing securities are not necessarily an indication of the risks associated with investing in those securities.
The table below categorizes amounts that are included in the Fund’s Statement of Assets and Liabilities at period end based on valuation input level:
| Level 1— Unadjusted Quoted Prices |
Level 2— Other Significant Observable Inputs |
Level 3— Significant Unobservable Inputs |
Value | |||||||||||||||||||
|
|
||||||||||||||||||||||
| Assets Table |
||||||||||||||||||||||
| Investments, at Value: |
||||||||||||||||||||||
| U.S. Government Agencies |
$ | — | $ | 661,947,577 | $ | — | $ | 661,947,577 | ||||||||||||||
| Short-Term Investments |
— | 500,000,000 | $ | — | 500,000,000 | |||||||||||||||||
|
|
||||||||||||||||||||||
| Total Assets |
$ | — | $ | 1,161,947,577 | $ | — | $ | 1,161,947,577 | ||||||||||||||
|
|
||||||||||||||||||||||
4. Investments and Risks
Investments in Affiliated Funds. The Fund is permitted to invest in other mutual funds advised by the Manager (“Affiliated Funds”). Affiliated Funds are open-end management investment companies registered under the 1940 Act, as amended. The Manager is the investment adviser of, and the Sub-Adviser provides investment and related advisory services to, the Affiliated Funds. When applicable, the Fund’s investments in Affiliated Funds are included in the Statement of Investments. Shares of Affiliated Funds are valued at their net asset value per share. As a shareholder, the Fund is subject to
12 OPPENHEIMER GOVERNMENT MONEY FUND/VA
4. Investments and Risks (Continued)
its proportional share of the Affiliated Funds’ expenses, including their management fee. The Manager will waive fees and/or reimburse Fund expenses in an amount equal to the indirect management fees incurred through the Fund’s investment in the Affiliated Funds.
Each of the Affiliated Funds in which the Fund invests has its own investment risks, and those risks can affect the value of the Fund’s investments and therefore the value of the Fund’s shares. To the extent that the Fund invests more of its assets in one Affiliated Fund than in another, the Fund will have greater exposure to the risks of that Affiliated Fund.
Investment in Oppenheimer Institutional Money Market Fund. The Fund is permitted to invest daily available cash balances in a money market Affiliated Fund. The Fund may invest the available cash in Class E shares of Oppenheimer Institutional Money Market Fund (“IMMF”) to seek current income while preserving liquidity or for defensive purposes. IMMF is regulated as a money market fund under the Investment Company Act of 1940, as amended.
5. Market Risk Factors
The Fund’s investments in securities and/or financial derivatives may expose the Fund to various market risk factors:
Commodity Risk. Commodity risk relates to the change in value of commodities or commodity indexes as they relate to increases or decreases in the commodities market. Commodities are physical assets that have tangible properties. Examples of these types of assets are crude oil, heating oil, metals, livestock, and agricultural products.
Credit Risk. Credit risk relates to the ability of the issuer of debt to meet interest and principal payments, or both, as they come due. In general, lower-grade, higher-yield debt securities are subject to credit risk to a greater extent than lower-yield, higher-quality securities.
Equity Risk. Equity risk relates to the change in value of equity securities as they relate to increases or decreases in the general market.
Foreign Exchange Rate Risk. Foreign exchange rate risk relates to the change in the U.S. dollar value of a security held that is denominated in a foreign currency. The U.S. dollar value of a foreign currency denominated security will decrease as the dollar appreciates against the currency, while the U.S. dollar value will increase as the dollar depreciates against the currency.
Interest Rate Risk. Interest rate risk refers to the fluctuations in value of fixed-income securities resulting from the inverse relationship between price and yield. For example, an increase in general interest rates will tend to reduce the market value of already issued fixed-income investments, and a decline in general interest rates will tend to increase their value. In addition, debt securities with longer maturities, which tend to have higher yields, are subject to potentially greater fluctuations in value from changes in interest rates than obligations with shorter maturities.
Volatility Risk. Volatility risk refers to the magnitude of the movement, but not the direction of the movement, in a financial instrument’s price over a defined time period. Large increases or decreases in a financial instrument’s price over a relative time period typically indicate greater volatility risk, while small increases or decreases in its price typically indicate lower volatility risk.
6. Shares of Beneficial Interest
The Fund has authorized an unlimited number of $0.001 par value shares of beneficial interest. Transactions in shares of beneficial interest were as follows:
| Six Months Ended June 30, 2016 | Year Ended December 31, 2015 | |||||||||||||||
| Shares | Amount | Shares | Amount | |||||||||||||
|
|
||||||||||||||||
| Sold |
873,419,412 | $ | 873,419,412 | 3,416,245,044 | $ | 3,416,245,044 | ||||||||||
| Dividends and/or distributions reinvested | 119,696 | 119,696 | 112,387 | 112,387 | ||||||||||||
| Redeemed |
(2,336,701,526) | (2,336,701,526) | (1,283,035,370) | (1,283,035,370) | ||||||||||||
|
|
|
|||||||||||||||
| Net increase (decrease) |
(1,463,162,418) | $ | (1,463,162,418) | 2,133,322,061 | $ | 2,133,322,061 | ||||||||||
|
|
|
|||||||||||||||
7. Fees and Other Transactions with Affiliates
Management Fees. Under the investment advisory agreement, the Fund pays the Manager a management fee based on the daily net assets of the Fund at an annual rate as shown in the following table:
| Fee Schedule | ||||
|
|
||||
| Up to $500 million |
0.450% | |||
| Next $500 million |
0.425 | |||
| Next $500 million |
0.400 | |||
| Over $1.5 billion |
0.375 | |||
The Fund’s effective management fee for the reporting period was 0.41% of average annual net assets before any applicable waivers.
Sub-Adviser Fees. The Manager has retained the Sub-Adviser to provide the day-to-day portfolio management of the Fund. Under the Sub-Advisory Agreement, the Manager pays the Sub-Adviser an annual fee in monthly installments, equal to a percentage of the investment management fee collected by the Manager from the Fund, which shall be calculated after any investment management fee waivers. The fee paid to the Sub-Adviser is paid by the Manager, not by the Fund.
13 OPPENHEIMER GOVERNMENT MONEY FUND/VA
NOTES TO FINANCIAL STATEMENTS Unaudited / Continued
7. Fees and Other Transactions with Affiliates (Continued)
Transfer Agent Fees. OFI Global (the “Transfer Agent”) serves as the transfer and shareholder servicing agent for the Fund. The Fund pays the Transfer Agent a fee based on annual net assets. Fees incurred and average net assets with respect to these services are detailed in the Statement of Operations and Financial Highlights, respectively.
Sub-Transfer Agent Fees. The Transfer Agent has retained Shareholder Services, Inc., a wholly-owned subsidiary of OFI (the “Sub-Transfer Agent”), to provide the day-to-day transfer agent and shareholder servicing of the Fund. Under the Sub-Transfer Agency Agreement, the Transfer Agent pays the Sub-Transfer Agent an annual fee in monthly installments, equal to a percentage of the transfer agent fee collected by the Transfer Agent from the Fund, which shall be calculated after any applicable fee waivers. The fee paid to the Sub-Transfer Agent is paid by the Transfer Agent, not by the Fund.
Trustees’ Compensation. The Fund’s Board of Trustees (“Board”) has adopted a compensation deferral plan for Independent Trustees that enables Trustees to elect to defer receipt of all or a portion of the annual compensation they are entitled to receive from the Fund. For purposes of determining the amount owed to the Trustees under the plan, deferred amounts are treated as though equal dollar amounts had been invested in shares of the Fund or in other Oppenheimer funds selected by the Trustees. The Fund purchases shares of the funds selected for deferral by the Trustees in amounts equal to his or her deemed investment, resulting in a Fund asset equal to the deferred compensation liability. Such assets are included as a component of “Other” within the asset section of the Statement of Assets and Liabilities. Deferral of Trustees’ fees under the plan will not affect the net assets of the Fund and will not materially affect the Fund’s assets, liabilities or net investment income per share. Amounts will be deferred until distributed in accordance with the compensation deferral plan.
Waivers and Reimbursements of Expenses. The Manager has voluntarily undertaken to waive fees and/or reimburse expenses to the extent necessary to assist the Fund in attempting to maintain a positive yield. There is no guarantee that the Fund will maintain a positive yield. During the reporting period, the Manager waived fees and/or reimbursed the Fund $1,635,020.
The Manager has contractually agreed to limit the Fund’s expenses after payments, waivers and/or reimbursements and reduction to custodian expenses, excluding expenses incurred directly or indirectly by the Fund as a result of investments in other investment companies, wholly-owned subsidiaries and pooled investment vehicles; so that those expenses, as percentages of daily net assets, will not exceed the annual rate of 0.50%. As a result of this limitation, the Manager waived $316,040 for the reporting period.
The Manager is permitted to recapture previously waived and/or reimbursed fees in any given fiscal year if the recapture would not: 1) cause the Fund to generate a negative daily yield, and 2) exceed amounts previously waived and/or reimbursed under this arrangement during the current and prior three fiscal years. The reimbursement to the Manager of such previous waivers and reimbursements would not include any portion of distribution and/or service fees. At period end, the following waived and/or reimbursed amounts are eligible for recapture:
| Expiration Date | ||||
|
|
||||
| December 31, 2016 |
$ | 486,156 | ||
| December 31, 2017 |
1,378,598 | |||
| December 31, 2018 |
3,773,037 | |||
| December 31, 2019 |
1,951,060 | |||
The Manager has not recaptured any previously waived and/or reimbursed amounts during the reporting period.
The Manager will waive fees and/or reimburse Fund expenses in an amount equal to the indirect management fees incurred through the Fund’s investment in IMMF. During the reporting period, the Manager waived fees and/or reimbursed the Fund $44,856 for IMMF management fees.
Waivers and/or reimbursements may be modified or terminated as set forth according to the terms in the prospectus.
8. Borrowings and Other Financing
Repurchase Agreements. In a repurchase transaction, a Fund buys a security and simultaneously sells it back to an approved institution for delivery on an agreed-upon future date. The resale price exceeds the purchase price by an amount that reflects an agreed-upon interest rate effective for the period during which the repurchase agreement is in effect. Approved institutions include U.S. commercial banks, U.S. branches of foreign banks or broker-dealers that have been designated as primary dealers in government securities. They must meet credit requirements set by the investment adviser from time to time. Repurchase agreements must be fully collateralized. However, if the seller fails to pay the repurchase price on the delivery date, a Fund may incur costs in disposing of the collateral and may experience losses if there is any delay in its ability to do so. If the default on the part of the seller is due to its bankruptcy, a Fund’s ability to liquidate the collateral may be delayed or limited.
The following is a summary by counterparty of the market value of Borrowings and Other Financing Transactions and collateral (received) as of period end:
14 OPPENHEIMER GOVERNMENT MONEY FUND/VA
8. Borrowings and Other Financing (Continued)
| Counterparty | Repurchase Agreement Proceeds to be Received(1) |
Collateral (Received) / Pledged | Net Exposure(2) | |||||||||
|
|
||||||||||||
| Repurchase Agreement |
||||||||||||
| South Street Securities LLC |
$ | 400,005,556 | $ | (408,005,689) | $ | (8,000,133) | ||||||
| Toronto Dominion Bank |
100,001,111 | (102,001,134) | (2,000,023) | |||||||||
|
|
|
|||||||||||
| $ | 500,006,667 | |||||||||||
|
|
|
|||||||||||
1. Includes accrued interest.
2. Net exposure represents the net receivable/payable that would be due from the counterparty in the event of default.
9. Pending Litigation
In 2009, several putative class action lawsuits were filed and later consolidated before the U.S. District Court for the District of Colorado against OppenheimerFunds, Inc. (“OFI”), OppenheimerFunds Distributor, Inc. (“OFDI”), and Oppenheimer Rochester California Municipal Fund, a fund advised by OFI Global Asset Management, Inc. and distributed by the Distributor (the “California Fund”), in connection with the California Fund’s investment performance. The plaintiffs asserted claims against OFI, OFDI and certain present and former trustees and officers of the California Fund under the federal securities laws, alleging, among other things, that the disclosure documents of the California Fund contained misrepresentations and omissions and the investment policies of the California Fund were not followed. Plaintiffs in the suit filed an amended complaint and defendants filed a motion to dismiss. In 2011, the court issued an order which granted in part and denied in part the defendants’ motion to dismiss. In 2012, plaintiffs filed a motion, which defendants opposed, to certify a class and appoint class representatives and class counsel. In March 2015, the court granted plaintiffs’ motion for class certification. In May 2015, the U.S. Court of Appeals for the Tenth Circuit vacated the class certification order and remanded the matter to the district court for further proceedings. In October 2015, the district court reaffirmed its order and determined that the suit will proceed as a class action. In December 2015, the Tenth Circuit denied defendants’ petition to appeal the district court’s reaffirmed class certification order.
OFI and OFDI believe the suit is without merit; that it is premature to render any opinion as to the likelihood of an outcome unfavorable to them in the suit; and that no estimate can yet be made as to the amount or range of any potential loss. Furthermore, OFI believes that the suit should not impair the ability of OFI or OFDI to perform their respective duties to the Fund and that the outcome of the suit should not have any material effect on the operations of any of the Oppenheimer funds.
15 OPPENHEIMER GOVERNMENT MONEY FUND/VA
PORTFOLIO PROXY VOTING POLICIES AND GUIDELINES; UPDATES TO STATEMENTS OF INVESTMENTS Unaudited
The Fund has adopted Portfolio Proxy Voting Policies and Guidelines under which the Fund votes proxies relating to securities (“portfolio proxies”) held by the Fund. A description of the Fund’s Portfolio Proxy Voting Policies and Guidelines is available (i) without charge, upon request, by calling the Fund toll-free at 1.800.525.7048, (ii) on the Fund’s website at www.oppenheimerfunds.com, and (iii) on the SEC’s website at www.sec.gov. In addition, the Fund is required to file Form N-PX, with its complete proxy voting record for the 12 months ended June 30th, no later than August 31st of each year. The Fund’s voting record is available (i) without charge, upon request, by calling the Fund toll-free at 1.800.525.7048, and (ii) in the Form N-PX filing on the SEC’s website at www.sec.gov.
The Fund files its complete schedule of portfolio holdings with the SEC for the first quarter and the third quarter of each fiscal year on Form N-Q. The Fund’s Form N-Q filings are available on the SEC’s website at www.sec.gov. Those forms may be reviewed and copied at the SEC’s Public Reference Room in Washington, D.C. Information on the operation of the Public Reference Room may be obtained by calling 1-800-SEC-0330.
16 OPPENHEIMER GOVERNMENT MONEY FUND/VA
DISTRIBUTION SOURCES Unaudited
For any distribution that took place over the Fund’s reporting period, the table below details on a per-share basis the percentage of the Fund’s total distribution payment amount that was derived from the following sources: net income, net profit from the sale of securities, and other capital sources. This information is based upon income and capital gains using generally accepted accounting principles as of the date of each distribution. Because the Fund is actively managed, the relative amount of the Fund’s total distributions derived from various sources over the calendar year may change. Please note that this information should not be used for tax reporting purposes as the tax character of distributable income may differ from the amounts used for this notification. You will receive IRS tax forms in the first quarter of each calendar year detailing the actual amount of the taxable and non-taxable portion of distributions paid to you during the tax year.
For the most current information, please go to oppenheimerfunds.com. Select your Fund, then the ‘Detailed’ tab; where ‘Dividends’ are shown, the Fund’s latest pay date will be followed by the sources of any distribution, updated daily.
|
Fund Name |
Pay Date |
Net Income |
Net Profit |
Other
| ||||||||||
|
Oppenheimer Government Money Fund/VA
|
|
1/15/16
|
|
|
96.3%
|
|
|
0.0%
|
|
3.7%
| ||||
|
Oppenheimer Government Money Fund/VA
|
|
2/19/16
|
|
|
95.8%
|
|
|
0.0%
|
|
4.2%
| ||||
|
Oppenheimer Government Money Fund/VA
|
|
3/18/16
|
|
|
95.9%
|
|
|
0.1%
|
|
4.0%
| ||||
|
Oppenheimer Government Money Fund/VA
|
|
4/15/16
|
|
|
95.9%
|
|
|
0.0%
|
|
4.1%
| ||||
|
Oppenheimer Government Money Fund/VA
|
|
5/20/16
|
|
|
96.8%
|
|
|
0.0%
|
|
3.2%
| ||||
|
Oppenheimer Government Money Fund/VA
|
|
6/17/16
|
|
|
95.9%
|
|
|
0.0%
|
|
4.1%
| ||||
17 OPPENHEIMER GOVERNMENT MONEY FUND/VA
THIS PAGE INTENTIONALLY LEFT BLANK.
18 OPPENHEIMER GOVERNMENT MONEY FUND/VA
THIS PAGE INTENTIONALLY LEFT BLANK.
19 OPPENHEIMER GOVERNMENT MONEY FUND/VA
OPPENHEIMER GOVERNMENT MONEY FUND/VA
A Series of Oppenheimer Variable Account Funds
| Trustees and Officers | Sam Freedman, Chairman of the Board of Trustees and Trustee | |
| Jon S. Fossel, Trustee | ||
| Richard F. Grabish, Trustee | ||
| Beverly L. Hamilton, Trustee | ||
| Victoria J. Herget, Trustee | ||
| Robert J. Malone, Trustee | ||
| F. William Marshall, Jr., Trustee | ||
| Karen L. Stuckey, Trustee | ||
| James D. Vaughn, Trustee | ||
| Arthur P. Steinmetz, President and Principal Executive Officer | ||
| Christopher Proctor, Vice President | ||
| Adam S. Wilde, Vice President | ||
| Cynthia Lo Bessette, Secretary and Chief Legal Officer | ||
| Jennifer Sexton, Vice President and Chief Business Officer | ||
| Mary Ann Picciotto, Chief Compliance Officer and Chief Anti-Money Laundering Officer | ||
| Brian S. Petersen, Treasurer and Principal Financial & Accounting Officer | ||
| Manager | OFI Global Asset Management, Inc. | |
| Sub-Adviser | OppenheimerFunds, Inc. | |
| Distributor | OppenheimerFunds Distributor, Inc. | |
| Transfer and Shareholder Servicing Agent |
OFI Global Asset Management, Inc. | |
| Sub-Transfer Agent | Shareholder Services, Inc. | |
| DBA OppenheimerFunds Services | ||
| Independent Registered Public Accounting Firm |
KPMG LLP | |
| Legal Counsel | Ropes & Gray LLP | |
| Before investing in any of the Oppenheimer funds, investors should carefully consider a fund’s investment objectives, risks, charges and expenses. Fund prospectuses and summary prospectuses contain this and other information about the funds, and may be obtained by asking your financial advisor, or calling us at 1.800.988.8287. Read prospectuses and summary prospectuses carefully before investing. | ||
| The financial statements included herein have been taken from the records of the Fund without examination of those records by the independent registered public accounting firm. | ||
| © 2016 OppenheimerFunds, Inc. All rights reserved. Oppenheimer funds are distributed by OppenheimerFunds Distributor, Inc. | ||

|
|

| June 30, 2016 |
||||
|
Oppenheimer |
Semiannual Report | |||
|
Global Strategic Income Fund/VA
|
||||
| A Series of Oppenheimer Variable Account Funds
|
||||
|
SEMIANNUAL REPORT
|
||||
| Listing of Top Holdings
|
||||
| Fund Performance Discussion
|
||||
| Financial Statements |
PORTFOLIO MANAGERS: Michael A. Mata, Krishna Memani and Hemant Baijal
AVERAGE ANNUAL TOTAL RETURNS FOR THE PERIODS ENDED 6/30/16
| Inception Date |
6-Months | 1-Year | 5-Year | 10-Year | ||||||||||||||||||||
| Non-Service Shares | 5/3/93 | 4.38% | 0.66% | 2.74% | 5.19% | |||||||||||||||||||
|
|
||||||||||||||||||||||||
| Service Shares | 3/19/01 | 4.17 | 0.36 | 2.45 | 4.92 | |||||||||||||||||||
|
|
||||||||||||||||||||||||
| Barclays U.S. Aggregate Bond Index | 5.31 | 6.00 | 3.76 | 5.13 | ||||||||||||||||||||
|
|
||||||||||||||||||||||||
| Citigroup World Government Bond Index | 10.74 | 11.26 | 1.18 | 4.22 | ||||||||||||||||||||
|
|
||||||||||||||||||||||||
| Citigroup Non-U.S. World Government Bond Index | 13.50 | 13.85 | 0.31 | 3.97 | ||||||||||||||||||||
|
|
||||||||||||||||||||||||
| J.P. Morgan Domestic High Yield Index | 9.82 | 1.53 | 6.19 | 7.72 | ||||||||||||||||||||
|
|
||||||||||||||||||||||||
| Reference Index | 9.97 | 7.84 | 3.18 | 5.56 | ||||||||||||||||||||
|
|
||||||||||||||||||||||||
Performance data quoted represents past performance, which does not guarantee future results. The investment return and principal value of an investment in the Fund will fluctuate so that an investor’s shares, when redeemed, may be worth more or less than their original cost. Current performance may be lower or higher than the performance quoted. For performance data current to the most recent month end, call us at 1.800.988.8287. The Fund’s total returns should not be expected to be the same as the returns of other funds, whether or not both funds have the same portfolio managers and/or similar names. The Fund’s total returns include changes in share price and reinvested distributions but do not include the charges associated with the separate account products that offer this Fund. Such performance would have been lower if such charges were taken into account.
The Fund’s performance is compared to the performance of the Barclays U.S. Aggregate Bond Index, the Citigroup World Government Bond Index, the Citigroup Non-U.S. World Government Bond Index, the J.P. Morgan Domestic High Yield Index and the Fund’s Reference Index. The Barclays U.S. Aggregate Bond Index is an index of U.S. Government and corporate bonds. The Citigroup World Government Bond Index is an index of debt securities of major foreign government bond markets. The Citigroup Non-U.S. World Government Bond Index is an index of fixed rate government bonds with a maturity of one year or longer and amounts outstanding of at least U.S. $25 million. The J.P. Morgan Domestic High Yield Index is an unmanaged index of high yield fixed income securities issued by U.S. companies. The Fund’s Reference Index is a customized weighted index currently comprised of the following underlying broad-based security indices: 40% Citigroup Non-U.S. World Government Bond Index, 30% J.P. Morgan Domestic High Yield Index, and 30% Barclays U.S. Aggregate Bond Index. The indices are unmanaged and cannot be purchased directly by investors. While index comparisons may be useful to provide a benchmark for the Fund’s performance, it must be noted that the Fund’s investments are not limited to the investments comprising the indices. Index performance includes reinvestment of income, but does not reflect transaction costs, fees, expenses or taxes. Index performance is shown for illustrative purposes only as a benchmark for the Fund’s performance, and does not predict or depict performance of the Fund. The Fund’s performance reflects the effects of the Fund’s business and operating expenses.
2 OPPENHEIMER GLOBAL STRATEGIC INCOME FUND/VA
TOP HOLDINGS AND ALLOCATIONS
3 OPPENHEIMER GLOBAL STRATEGIC INCOME FUND/VA
Fund Performance Discussion
The Fund’s Non-Service shares produced a return of 4.38% during the reporting period. In comparison, the Fund underperformed the 9.97% return of its Reference Index (the “Index”), which currently is composed of the following broad-based securities indices: 40% Citigroup Non-U.S. World Government Bond Index, 30% J.P. Morgan Domestic High Yield Index, and 30% Barclays U.S. Aggregate Bond Index.
MARKET OVERVIEW
2016 started off with credit markets widening amid stock market weakness, as government bond yields fell. The 10-year U.S. Treasury began the year at just over 2.20% but had fallen below 2% by the end of January. The Federal Reserve’s (“Fed”) statement in late January suggested the central bank would continue gradually raising rates this year, which further roiled markets as global growth continued to show risk of slowing further. Risk asset weakness and the Bank of Japan (“BoJ”) cutting rates to negative levels at the end of January helped U.S. Treasury yields fall dramatically toward all-time lows by mid-February. Through the first six weeks of the year, at the sector level, U.S. investment-grade industrial bonds were wider by about 40 basis points compared to Treasury yields, while bank bonds were particularly weak, widening by about 60 basis points. The 10-year U.S. Treasury briefly traded below 1.70%, close to the four-year low.
By mid-February, markets began to turn positive. The European Central Bank (“ECB”) hinted it would likely ease further, the BoJ’s tone remained dovish, China signaled it would provide further stimulus, and better than expected economic data helped turn sentiment. A dovish Fed statement in mid-March and further dovish statements from Chair Yellen (sometimes at odds with other Fed speakers) helped the better trend in risk sentiment persist.
The second quarter of 2016 began with improving data momentum, payrolls and wages remained steady, and survey indicators such as the Institute for Supply Management (“ISM”) and consumer sentiment also improved. Chinese and emerging market growth looked to have stabilized or modestly strengthened. The market continued to price for one with the potential of two hikes by the Fed in 2016, as core consumer price inflation data remained stable at about 2.2% year-over-year, and headline inflation stabilized at about 1%.
The ECB continued to leave the Deposit Facility rate steady at -0.40% as markets began to price the risk of Brexit. Their corporate bond buying program began in early June. Still, credit spreads appeared to have largely priced in a referendum vote to remain in the EU and remained unchanged on the second quarter until a surprise vote to leave the EU caused spreads to widen. 10-year German yields continued to fall leading up to the UK referendum initially touching negative levels in mid-June. After the Brexit vote, 10-year German government bond yields fell into negative territory joining shorter maturity debt. The 10-year German bond yield fell about 30 basis points (“bps”) to -0.13% at period end.
BoJ policymakers maintained their purchase programs and maintained their negative policy rate. Japanese first quarter Gross Domestic Product (“GDP”) growth was better than expected with inflation continuing to be muted. This was little solace to local markets, where long maturity bonds continued to rally with yields on 10-year and 30-year Japanese Government Bonds (“JGBs”) lower. By the end of May, 30-year Japanese bond yields had fallen 20 bps to about 30 bps. After the Brexit vote and the global yield rally, 30-year JGBs traded close to zero, while 10-year fell to yield lows at -0.22 bps.
In Brazil, the lower house of Congress voted to impeach President Rousseff, which led to the Senate voting for impeachment in May. After the April vote, 10-year government bond yields plummeted by almost 2% to 12.25%. The change in regime was positive for risk assets as well as sovereign credit spreads. Brazilian sovereign 5-year credit default swaps (“CDS”) tightened significantly from 400 bps in early April down to 320 bps by period end.
The Reserve Bank of India cut interest rates in April, while the government announced economic reforms. In Mexico, the central bank raised interest rates right at the end of the period in order to prop up the peso.
The big surprise news came late in June with voters in the United Kingdom opting to drop out of the European Union. U.S. markets became extremely volatile for two days. However, risk assets sharply rebounded, while bond yields remain depressed on expectations of further central bank easing. The market priced out hikes until at least late 2017.
During the second quarter of 2016, commodity prices continued to climb with West Texas crude oil climbing over $50/barrel in early June, before ending just under $49/barrel which continued to help support some energy and metals & mining firm equities and credit spreads. High yield spreads overall tightened about 70 bps during the quarter, led by commodity-related sectors.
4 OPPENHEIMER GLOBAL STRATEGIC INCOME FUND/VA
In U.S. fixed income, 10-year U.S. Treasury yields started the second quarter at about 1.75% and remained in a range from 1.65% to 1.95% for much of the quarter. However, after the Brexit vote in late June, Treasuries caught a flight to quality bid to finish the reporting period near 1.50% after touching 1.40% intraday, testing the all-time low yields.
Investment-grade credit spreads tightened strongly in April and remained range bound for May, sold off in June, particularly after the UK referendum, but still finished tighter on the quarter. Current coupon Agency Mortgage spreads were stable in April and May, but widened in June as additional supply and funding pressures hit the market.
FUND REVIEW
During the reporting period, the Fund’s underperformance versus the Index stemmed largely from its underweight position in foreign exchange, which performed positively when risk sentiment improved. High yield also was a negative relative contributor, particularly over the second half of the reporting period, as the Fund was underweight strong performing names in the energy and metal and mining sectors.
The most significant positive contributors versus the Index included allocations to leveraged loans and mortgage-backed securities (“MBS”).
STRATEGY & OUTLOOK
We think risk to global growth has diminished significantly. Emerging market growth momentum appears to have bottomed. While Chinese growth still remains a risk, the downside risks elsewhere have diminished. Overall we think the macro pictures will be rather bland, which suggests the search for yield among fixed income investors will likely continue.
We believe the Fed is unlikely to hike this year given their focus on global economic fragilities, and if they do, it will be late in the year and only once. Other central banks are likely to continue easing further. The Bank of England is poised to ease after expectations for UK growth was reduced following the Brexit vote. The ECB will likely remain on hold for now but with an easing bias, particularly with the ECB’s corporate bond buying program just beginning. The Bank of Japan and the government are likely to announce easier monetary and fiscal policies in the coming days.
Easy central bank monetary policy is likely to be a floor under risk markets. We also think oil will be less of a factor for many markets as long as it remains in a $40-60/barrel range.
In the U.S., we believe the credit cycle has peaked but continues to extend even as defaults continue to slowly rise. However, credit markets in the U.S. and elsewhere will likely continue to benefit from easy global central bank policy and the global search for yield.
In our opinion, U.S. fixed income assets will remain the beneficiary of foreign inflows. With about a third of developed market government bonds yielding below zero, the U.S. continues to look attractive.
We expect both U.S. Treasuries and corporate debt to perform well given the continued search for yield.
During the reporting period, we reduced the Fund’s exposure to Europe. Negative yields in some European government bond markets are not attractive in our view. However, European investment-grade corporate debt has the potential to perform well given positive yields and the ECB purchasing the debt.
We increased emerging market local rates and credit exposures. The Fed remaining on hold and easier central bank policies in many jurisdictions should help local rates markets. We also increased exposure to senior loans, which we see as offering value compared to other credit markets that have rallied significantly since their worst levels in February.
As of the end of the reporting period, the Fund’s largest allocation remained to high yield corporate bonds. Allocations to investment-grade mortgage backed securities, investment-grade corporate bonds and senior floating rate loans are the next largest sectors.
The Fund’s investment strategy and focus can change over time. The mention of specific fund holdings does not constitute a recommendation by OppenheimerFunds, Inc. or its affiliates.
Shares of Oppenheimer funds are not deposits or obligations of any bank, are not guaranteed by any bank, are not insured by the FDIC or any other agency, and involve investment risks, including the possible loss of the principal amount invested.
5 OPPENHEIMER GLOBAL STRATEGIC INCOME FUND/VA
Fund Expenses
Fund Expenses. As a shareholder of the Fund, you incur two types of costs: (1) transaction costs and (2) ongoing costs, including management fees; distribution and service fees; and other Fund expenses. These examples are intended to help you understand your ongoing costs (in dollars) of investing in the Fund and to compare these costs with the ongoing costs of investing in other mutual funds.
The examples are based on an investment of $1,000.00 invested at the beginning of the period and held for the entire 6-month period ended June 30, 2016.
Actual Expenses. The first section of the table provides information about actual account values and actual expenses. You may use the information in this section for the class of shares you hold, together with the amount you invested, to estimate the expense that you paid over the period. Simply divide your account value by $1,000.00 (for example, an $8,600.00 account value divided by $1,000.00 = 8.60), then multiply the result by the number in the first section under the heading entitled “Expenses Paid During 6 Months Ended June 30, 2016” to estimate the expenses you paid on your account during this period.
Hypothetical Example for Comparison Purposes.
The second section of the table provides information about hypothetical account values and hypothetical expenses based on the Fund’s actual expense ratio for each class of shares, and an assumed rate of return of 5% per year for each class before expenses, which is not the actual return. The hypothetical account values and expenses may not be used to estimate the actual ending account balance or expenses you paid for the period. You may use this information to compare the ongoing costs of investing in the Fund and other funds. To do so, compare this 5% hypothetical example for the class of shares you hold with the 5% hypothetical examples that appear in the shareholder reports of the other funds.
Please note that the expenses shown in the table are meant to highlight your ongoing costs only and do not reflect any charges associated with the separate accounts that offer this Fund. Therefore, the “hypothetical” lines of the table are useful in comparing ongoing costs only, and will not help you determine the relative total costs of owning different funds. In addition, if these separate account charges were included your costs would have been higher.
| Actual | Beginning Account Value January 1, 2016 |
Ending Account Value June 30, 2016 |
Expenses Paid During 6 Months Ended June 30, 2016 |
|||||||||||||||||||||
| Non-Service shares |
$ | 1,000.00 | $ | 1,043.80 | $ | 3.77 | ||||||||||||||||||
| Service shares |
1,000.00 | 1,041.70 | 4.99 | |||||||||||||||||||||
| Hypothetical (5% return before expenses) |
||||||||||||||||||||||||
| Non-Service shares |
1,000.00 | 1,021.18 | 3.73 | |||||||||||||||||||||
| Service shares |
1,000.00 | 1,019.99 | 4.93 | |||||||||||||||||||||
Expenses are equal to the Fund’s annualized expense ratio for that class, multiplied by the average account value over the period, multiplied by 182/366 (to reflect the one-half year period). Those annualized expense ratios, excluding indirect expenses from affiliated funds, based on the 6-month period ended June 30, 2016 are as follows:
| Class | Expense Ratios | |||
| Non-Service shares |
0.74% | |||
| Service shares |
0.98 | |||
The expense ratios reflect voluntary and/or contractual waivers and/or reimbursements of expenses by the Fund’s Manager. Some of these undertakings may be modified or terminated at any time, as indicated in the Fund’s prospectus. The “Financial Highlights” tables in the Fund’s financial statements, included in this report, also show the gross expense ratios, without such waivers or reimbursements and reduction to custodian expenses, if applicable.
6 OPPENHEIMER GLOBAL STRATEGIC INCOME FUND/VA
CONSOLIDATED STATEMENT OF INVESTMENTS June 30, 2016 Unaudited
7 OPPENHEIMER GLOBAL STRATEGIC INCOME FUND/VA
CONSOLIDATED STATEMENT OF INVESTMENTS Unaudited / Continued
8 OPPENHEIMER GLOBAL STRATEGIC INCOME FUND/VA
9 OPPENHEIMER GLOBAL STRATEGIC INCOME FUND/VA
CONSOLIDATED STATEMENT OF INVESTMENTS Unaudited / Continued
10 OPPENHEIMER GLOBAL STRATEGIC INCOME FUND/VA
11 OPPENHEIMER GLOBAL STRATEGIC INCOME FUND/VA
CONSOLIDATED STATEMENT OF INVESTMENTS Unaudited / Continued
12 OPPENHEIMER GLOBAL STRATEGIC INCOME FUND/VA
13 OPPENHEIMER GLOBAL STRATEGIC INCOME FUND/VA
CONSOLIDATED STATEMENT OF INVESTMENTS Unaudited / Continued
14 OPPENHEIMER GLOBAL STRATEGIC INCOME FUND/VA
15 OPPENHEIMER GLOBAL STRATEGIC INCOME FUND/VA
CONSOLIDATED STATEMENT OF INVESTMENTS Unaudited / Continued
16 OPPENHEIMER GLOBAL STRATEGIC INCOME FUND/VA
17 OPPENHEIMER GLOBAL STRATEGIC INCOME FUND/VA
CONSOLIDATED STATEMENT OF INVESTMENTS Unaudited / Continued
18 OPPENHEIMER GLOBAL STRATEGIC INCOME FUND/VA
19 OPPENHEIMER GLOBAL STRATEGIC INCOME FUND/VA
CONSOLIDATED STATEMENT OF INVESTMENTS Unaudited / Continued
20 OPPENHEIMER GLOBAL STRATEGIC INCOME FUND/VA
21 OPPENHEIMER GLOBAL STRATEGIC INCOME FUND/VA
CONSOLIDATED STATEMENT OF INVESTMENTS Unaudited / Continued
22 OPPENHEIMER GLOBAL STRATEGIC INCOME FUND/VA
23 OPPENHEIMER GLOBAL STRATEGIC INCOME FUND/VA
CONSOLIDATED STATEMENT OF INVESTMENTS Unaudited / Continued
24 OPPENHEIMER GLOBAL STRATEGIC INCOME FUND/VA
| Counterparty | Exercise Price | Expiration Date | Contracts | |||||||||||||||||||||||||
|
|
||||||||||||||||||||||||||||
| Over-the-Counter Options Purchased—0.1% |
|
|||||||||||||||||||||||||||
|
|
||||||||||||||||||||||||||||
| AUD Currency Call13 | BAC | AUD | 1.090 | 8/29/16 | AUD | 49,550,000 | 85,911 | |||||||||||||||||||||
|
|
||||||||||||||||||||||||||||
| CAD Currency Put13 | DEU | CAD | 1.325 | 9/1/16 | CAD | 23,590,000 | 136,327 | |||||||||||||||||||||
|
|
||||||||||||||||||||||||||||
| CAD Currency Put13 | RBS | CAD | 1.315 | 8/5/16 | CAD | 11,638,110 | 55,060 | |||||||||||||||||||||
|
|
||||||||||||||||||||||||||||
| EUR Currency Put13 | RBS | EUR | 1.115 | 7/13/16 | EUR | 17,665,000 | 201,328 | |||||||||||||||||||||
|
|
||||||||||||||||||||||||||||
| GBP Currency Put13,18 | DEU | GBP | 1.300 | 9/28/16 | GBP | 1,057,684 | 74,191 | |||||||||||||||||||||
|
|
||||||||||||||||||||||||||||
| iShares iBoxx $ High Yield Corporate Bond Exchange Traded Fund Call13 | BOA | USD | 83.000 | 9/16/16 | USD | 1,064 | 215,332 | |||||||||||||||||||||
|
|
||||||||||||||||||||||||||||
| iShares iBoxx $ High Yield Corporate Bond Exchange Traded Fund Call13 | BOA | USD | 83.000 | 9/16/16 | USD | 936 | 189,428 | |||||||||||||||||||||
|
|
||||||||||||||||||||||||||||
| iShares iBoxx $ High Yield Corporate Bond Exchange Traded Fund Call13 | CITNA-B | USD | 83.000 | 9/16/16 | USD | 936 | 189,428 | |||||||||||||||||||||
25 OPPENHEIMER GLOBAL STRATEGIC INCOME FUND/VA
CONSOLIDATED STATEMENT OF INVESTMENTS Unaudited / Continued
| Counterparty | Exercise Price | Expiration Date | Contracts | Value | ||||||||||||||||||||
|
|
||||||||||||||||||||||||
| Over-the-Counter Options Purchased (Continued) |
|
|||||||||||||||||||||||
|
|
||||||||||||||||||||||||
| JPY Currency Call13,19 | DEU | JPY | 120.000 | 8/2/16 | JPY | 1,520,000 | $ | 55,743 | ||||||||||||||||
|
|
||||||||||||||||||||||||
| S&P 500 Index Call13 | DEU | USD | 2100.000 | 8/19/16 | USD | 20,981 | 783,179 | |||||||||||||||||
|
|
||||||||||||||||||||||||
| TWD Currency Put13,20 | DEU | TWD | 33.000 | 8/5/16 | TWD | 584,118,093 | 26,285 | |||||||||||||||||
|
|
|
|||||||||||||||||||||||
| Total Over-the-Counter Options Purchased (Cost $2,931,649) | 2,012,212 | |||||||||||||||||||||||
| Counterparty | Pay / Receive Floating Rate |
Floating Rate | Fixed Rate | Expiration Date |
Notional Amount (000’s) |
|||||||||||||||||||
|
|
||||||||||||||||||||||||
| Over-the-Counter Interest Rate Swaption Purchased—0.0% |
|
|||||||||||||||||||||||
|
|
||||||||||||||||||||||||
| Interest Rate Swap maturing 5/30/33 Call13 (Cost $115,675) | BAC | Receive | |
Six-Month GBP BBA LIBOR |
|
3.990% | 5/30/23 | GBP | 1,235 | 44,397 | ||||||||||||||
|
|
||||||||||||||||||||||||
| Total Investments, at Value (Cost $1,868,701,277) | 104.5% | 1,832,903,580 | ||||||||||||||||||||||
|
|
||||||||||||||||||||||||
| Net Other Assets (Liabilities) | (4.5) | (79,185,376) | ||||||||||||||||||||||
|
|
|
|||||||||||||||||||||||
| Net Assets | 100.0% | $ | 1,753,718,204 | |||||||||||||||||||||
|
|
|
|||||||||||||||||||||||
Consolidated Footnotes to Statement of Investments
1. Represents securities sold under Rule 144A, which are exempt from registration under the Securities Act of 1933, as amended. These securities have been determined to be liquid under guidelines established by the Board of Trustees. These securities amount to $528,579,717 or 30.14% of the Fund’s net assets at period end.
2. Represents the current interest rate for a variable or increasing rate security.
3. Interest-Only Strips represent the right to receive the monthly interest payments on an underlying pool of mortgage loans. These securities typically decline in price as interest rates decline. Most other fixed income securities increase in price when interest rates decline. The principal amount of the underlying pool represents the notional amount on which current interest is calculated. The price of these securities is typically more sensitive to changes in prepayment rates than traditional mortgage-backed securities (for example, GNMA pass-throughs). Interest rates disclosed represent current yields based upon the current cost basis and estimated timing and amount of future cash flows. These securities amount to $3,722,432 or 0.21% of the Fund’s net assets at period end.
4. Interest rate is less than 0.0005%.
5. All or a portion of the security position is when-issued or delayed delivery to be delivered and settled after period end. See Note 4 of the accompanying Consolidated Notes.
6. All or a portion of the security position is held in accounts at a futures clearing merchant and pledged to cover margin requirements on open futures contracts and written options on futures, if applicable. The aggregate market value of such securities is $2,308,583. See Note 6 of the accompanying Consolidated Notes.
7. All or a portion of the security position is held in segregated accounts and pledged to cover margin requirements under certain derivative contracts. The aggregate market value of such securities is $1,296,368. See Note 6 of the accompanying Consolidated Notes.
8. This security is not accruing income because the issuer has missed an interest payment on it and/or is not anticipated to make future interest and or principal payments. The rate shown is the contractual interest rate. See Note 4 of the accompanying Consolidated Notes.
9. Restricted security. The aggregate value of restricted securities at period end was $3,822,912, which represents 0.22% of the Fund’s net assets. See Note 4 of the accompanying Consolidated Notes. Information concerning restricted securities is as follows:
| Security | Acquisition Dates |
Cost | Value | Unrealized Depreciation |
||||||||||||
|
|
||||||||||||||||
| Deutsche Bank AG, Coriolanus Ltd. Sec. Credit Linked Bonds, 69.959% Sr. Sec. Nts., 12/31/17 | 10/16/07 | $ | 2,543,389 | $ | 2,338,812 | $ | 204,577 | |||||||||
| LBC Tank Terminals Holding Netherlands BV, 6.875% Sr. Unsec. Nts., 5/15/23 | 5/8/13 – 4/17/14 | 1,574,413 | 1,484,100 | 90,313 | ||||||||||||
|
|
|
|||||||||||||||
| $ | 4,117,802 | $ | 3,822,912 | $ | 294,890 | |||||||||||
|
|
|
|||||||||||||||
10. This bond has no contractual maturity date, is not redeemable and contractually pays an indefinite stream of interest. Rate reported represents the current interest rate for this variable rate security.
11. All or a portion of this security is owned by the subsidiary. See Note 2 of the accompanying Consolidated Notes.
12. Denotes an inflation-indexed security: coupon or principal are indexed to a consumer price index.
13. Non-income producing security.
14. Security received as the result of issuer reorganization.
15. Zero coupon bond reflects effective yield on the original acquisition date.
16. Rate shown is the 7-day yield at period end.
17. Is or was an affiliate, as defined in the Investment Company Act of 1940, as amended, at or during the reporting period, by virtue of the Fund owning at least 5% of the voting securities of the issuer or as a result of the Fund and the issuer having the same investment adviser. Transactions during the reporting period in which the issuer was an affiliate are as follows:
| Shares December 31, 2015 |
Gross Additions |
Gross Reductions |
Shares June 30, 2016 |
|||||||||||||
|
|
||||||||||||||||
| Oppenheimer Institutional Money Market Fund, Cl. E | 92,728,261 | 387,767,770 | 374,078,540 | 106,417,491 | ||||||||||||
| Oppenheimer Master Event-Linked Bond Fund, LLC | 3,158,849 | — | 104,887 | 3,053,962 | ||||||||||||
| Oppenheimer Master Loan Fund, LLC | 6,443,877 | 4,998,627 | — | 11,442,504 | ||||||||||||
| Oppenheimer Ultra-Short Duration Fund, Cl. Y | — | 7,994,509 | — | 7,994,509 | ||||||||||||
| Value | Income | Realized Loss | ||||||||||||||
|
|
||||||||||||||||
| Oppenheimer Institutional Money Market Fund, Cl. E | $ | 106,417,491 | $ | 400,133 | $ | — | ||||||||||
| Oppenheimer Master Event-Linked Bond Fund, LLC | 47,116,424 | 1,326,051a | 606,503 a | |||||||||||||
| Oppenheimer Master Loan Fund, LLC | 171,587,208 | 2,542,018 b | 2,440,509 b | |||||||||||||
26 OPPENHEIMER GLOBAL STRATEGIC INCOME FUND/VA
Consolidated Footnotes to Statement of Investments (Continued)
| Value | Income | Realized Loss | ||||||||||
|
|
||||||||||||
| Oppenheimer Ultra-Short Duration Fund, Cl. Y | $ | 40,052,488 | $ | 62,047 | $ | — | ||||||
|
|
|
|||||||||||
| Total | $ | 365,173,611 | $ | 4,330,249 | $ | 3,047,012 | ||||||
|
|
|
|||||||||||
a. Represents the amount allocated to the Fund from Oppenheimer Master Event-Linked Bond Fund, LLC.
b. Represents the amount allocated to the Fund from Oppenheimer Master Loan Fund, LLC.
18. Digital option becomes ineligible for exercise if at any time spot rates are less than or equal to USD 1.064 per EUR 1 or greater than or equal to USD 1.146 per EUR 1.
19. If the Spot Rate, at the Expiration Time on the Expiration Date, is (a) in respect of the First Currency Pair, greater than or equal to the First Digital Level, and (b) in respect of the Second Currency Pair, less than or equal to the Second Digital Level (a“Digital Event”) then, the In-the-Money Amount shall be the Digital Payment Amount. In all other circumstances the In-the-Money Amount will be Zero. First Currency Pair: USD/CNH, Second Currency Pair: USD/JPY, First Digital Level: CNH 7.00 per USD 1.00, Second Digital Level: JPY 120.00 per USD 1.00.
20. Knock-out option becomes ineligible for exercise if at 15:00 hours local time in Tokyo on 8/5/2016 the spot rate is greater than or equal to 105 JPY per 1 USD.
| Distribution of investments representing geographic holdings, as a percentage of total investments at value, is as follows: | ||||||
| Geographic Holdings | Value | Percent | ||||
|
| ||||||
| United States | $ | 1,428,139,290 | 77.9% | |||
| United Kingdom | 38,966,610 | 2.1 | ||||
| Indonesia | 31,248,457 | 1.7 | ||||
| France | 24,536,369 | 1.3 | ||||
| Netherlands | 24,088,057 | 1.3 | ||||
| Mexico | 21,253,141 | 1.2 | ||||
| Italy | 19,969,000 | 1.1 | ||||
| Canada | 18,691,785 | 1.0 | ||||
| Turkey | 17,746,697 | 1.0 | ||||
| Supranational | 16,634,702 | 0.9 | ||||
| Brazil | 13,449,351 | 0.7 | ||||
| Ireland | 12,890,268 | 0.7 | ||||
| Luxembourg | 11,993,728 | 0.7 | ||||
| Colombia | 11,982,683 | 0.7 | ||||
| Spain | 10,628,892 | 0.6 | ||||
| Peru | 10,473,657 | 0.6 | ||||
| Kazakhstan | 9,872,830 | 0.5 | ||||
| Germany | 9,430,343 | 0.5 | ||||
| India | 9,361,813 | 0.5 | ||||
| Hungary | 7,174,652 | 0.4 | ||||
| South Africa | 6,667,233 | 0.4 | ||||
| Russia | 5,936,584 | 0.3 | ||||
| Portugal | 5,701,375 | 0.3 | ||||
| Argentina | 5,437,145 | 0.3 | ||||
| China | 5,397,687 | 0.3 | ||||
| Belgium | 4,728,100 | 0.3 | ||||
| Uruguay | 4,716,763 | 0.3 | ||||
| Switzerland | 4,698,240 | 0.3 | ||||
| Austria | 3,367,953 | 0.2 | ||||
| Australia | 3,281,860 | 0.2 | ||||
| Romania | 3,180,964 | 0.2 | ||||
| Morocco | 2,888,511 | 0.2 | ||||
| Denmark | 2,502,797 | 0.1 | ||||
| Philippines | 2,367,425 | 0.1 | ||||
| Jersey, Channel Islands | 2,162,559 | 0.1 | ||||
| Croatia | 1,870,916 | 0.1 | ||||
| Serbia | 1,848,439 | 0.1 | ||||
| Israel | 1,743,475 | 0.1 | ||||
| Oman | 1,680,969 | 0.1 | ||||
| Greece | 1,644,575 | 0.1 | ||||
| Japan | 1,608,313 | 0.1 | ||||
| United Arab Emirates | 2,294,763 | 0.1 | ||||
| Jamaica | 1,231,200 | 0.1 | ||||
| Sweden | 1,119,358 | 0.1 | ||||
| New Zealand | 1,013,088 | 0.1 | ||||
| Panama | 849,225 | 0.0 | ||||
| Singapore | 732,830 | 0.0 | ||||
| South Korea | 632,929 | 0.0 | ||||
| Norway | 606,713 | 0.0 | ||||
| Thailand | 570,002 | 0.0 | ||||
| Dominican Republic | 469,625 | 0.0 | ||||
| Namibia | 429,450 | 0.0 | ||||
| Senegal | 406,938 | 0.0 | ||||
| Finland | 355,638 | 0.0 | ||||
27 OPPENHEIMER GLOBAL STRATEGIC INCOME FUND/VA
CONSOLIDATED STATEMENT OF INVESTMENTS Unaudited / Continued
| Geographic Holdings (Continued) | Value | Percent | ||||
|
| ||||||
| Eurozone | $ | 201,328 | 0.0% | |||
| Taiwan | 26,285 | 0.0 | ||||
|
|
| |||||
| Total | $ | 1,832,903,580 | 100.0% | |||
|
|
| |||||
|
|
||||||||||||||||||||
| Forward Currency Exchange Contracts as of June 30, 2016 |
| |||||||||||||||||||
| Counterparty | Settlement Month(s) | Currency Purchased (000’s) | Currency Sold (000’s) | Unrealized Appreciation |
Unrealized Depreciation |
|||||||||||||||
|
|
||||||||||||||||||||
| BAC | 08/2016 | EUR | 7,300 | USD | 8,261 | $ | — | $ | 144,639 | |||||||||||
| BAC | 07/2016 | IDR | 72,521,000 | USD | 5,508 | — | 19,386 | |||||||||||||
| BAC | 08/2016 | MYR | 22,265 | USD | 5,551 | 29,661 | — | |||||||||||||
| BAC | 07/2016 - 08/2016 | USD | 21,023 | IDR | 291,963,000 | — | 998,996 | |||||||||||||
| BAC | 07/2016 | USD | 8,840 | SGD | 12,050 | — | 103,309 | |||||||||||||
| BNP | 07/2016 | BRL | 17,940 | USD | 5,589 | — | 4,350 | |||||||||||||
| BNP | 08/2016 | CLP | 20,000 | USD | 29 | 1,215 | — | |||||||||||||
| BNP | 07/2016 | COP | 89,000 | USD | 29 | 864 | — | |||||||||||||
| BNP | 08/2016 | MXN | 344,600 | USD | 18,267 | 512,838 | — | |||||||||||||
| BNP | 07/2016 - 08/2016 | USD | 10,523 | BRL | 35,510 | — | 482,187 | |||||||||||||
| BNP | 08/2016 | USD | 3,843 | MXN | 71,100 | — | 31,370 | |||||||||||||
| BOA | 07/2016 | BRL | 20,070 | USD | 5,531 | 716,649 | — | |||||||||||||
| BOA | 11/2016 | EUR | 950 | USD | 1,086 | — | 26,561 | |||||||||||||
| BOA | 07/2016 - 08/2016 | IDR | 230,923,000 | USD | 17,262 | 209,743 | 32,048 | |||||||||||||
| BOA | 08/2016 | INR | 606,000 | USD | 8,910 | 8,480 | — | |||||||||||||
| BOA | 11/2016 | MXN | 161,100 | USD | 8,563 | 125,647 | — | |||||||||||||
| BOA | 08/2016 | MYR | 20,355 | USD | 5,052 | 49,576 | — | |||||||||||||
| BOA | 07/2016 | PLN | 56,120 | USD | 14,451 | — | 226,673 | |||||||||||||
| BOA | 07/2016 | TRY | 10,650 | USD | 3,629 | 73,399 | — | |||||||||||||
| BOA | 07/2016 | USD | 6,253 | BRL | 20,070 | 4,866 | — | |||||||||||||
| BOA | 07/2016 | USD | 14,433 | EUR | 12,730 | 304,605 | — | |||||||||||||
| BOA | 11/2016 | USD | 7,271 | GBP | 5,025 | 571,709 | — | |||||||||||||
| BOA | 07/2016 | USD | 8,713 | IDR | 119,890,000 | — | 360,730 | |||||||||||||
| BOA | 08/2016 - 11/2016 | USD | 13,351 | MXN | 250,200 | — | 191,534 | |||||||||||||
| BOA | 07/2016 | USD | 18,968 | PLN | 74,450 | 183,107 | 74,478 | |||||||||||||
| BOA | 07/2016 | USD | 15,304 | TRY | 45,340 | — | 443,481 | |||||||||||||
| BOA | 08/2016 | ZAR | 274,090 | USD | 17,594 | 823,895 | — | |||||||||||||
| CITNA-B | 11/2016 | EUR | 1,435 | USD | 1,618 | — | 17,661 | |||||||||||||
| CITNA-B | 11/2016 | MXN | 16,200 | USD | 845 | 28,215 | — | |||||||||||||
| CITNA-B | 07/2016 | PLN | 26,250 | USD | 6,643 | 6,803 | — | |||||||||||||
| CITNA-B | 07/2016 | TRY | 24,870 | USD | 8,511 | 135,007 | — | |||||||||||||
| CITNA-B | 08/2016 | USD | 4,218 | HUF | 1,199,000 | 33,759 | 29,177 | |||||||||||||
| CITNA-B | 07/2016 | USD | 5,361 | PLN | 21,390 | — | 60,325 | |||||||||||||
| DEU | 08/2016 - 11/2016 | EUR | 9,720 | USD | 10,909 | — | 93,073 | |||||||||||||
| DEU | 08/2016 | HUF | 1,472,000 | USD | 5,285 | — | 111,991 | |||||||||||||
| DEU | 07/2016 | TRY | 40,890 | USD | 13,999 | 158,574 | — | |||||||||||||
| DEU | 11/2016 | USD | 476 | EUR | 415 | 12,722 | — | |||||||||||||
| GSCO-OT | 07/2016 | AUD | 12,740 | USD | 9,376 | 116,965 | — | |||||||||||||
| GSCO-OT | 07/2016 | BRL | 7,240 | USD | 2,158 | 96,185 | — | |||||||||||||
| GSCO-OT | 07/2016 | IDR | 121,868,000 | USD | 8,656 | 567,749 | — | |||||||||||||
| GSCO-OT | 07/2016 | USD | 9,409 | AUD | 12,740 | — | 83,523 | |||||||||||||
| GSCO-OT | 07/2016 - 08/2016 | USD | 4,444 | BRL | 14,640 | 1,755 | 94,637 | |||||||||||||
| GSCO-OT | 07/2016 - 08/2016 | USD | 12,118 | IDR | 166,389,000 | 17,627 | 477,666 | |||||||||||||
| HSBC | 11/2016 | EUR | 8,325 | USD | 9,392 | 9,286 | 114,693 | |||||||||||||
| HSBC | 11/2016 | GBP | 7,865 | USD | 11,247 | — | 760,527 | |||||||||||||
| HSBC | 08/2016 | USD | 7,854 | EUR | 6,890 | 192,930 | — | |||||||||||||
| JPM | 08/2016 | CLP | 5,719,000 | USD | 8,325 | 285,968 | — | |||||||||||||
| JPM | 11/2016 | EUR | 4,885 | USD | 5,496 | — | 46,371 | |||||||||||||
| JPM | 07/2016 | IDR | 239,189,000 | USD | 17,823 | 280,432 | — | |||||||||||||
| JPM | 11/2016 | MXN | 318,500 | USD | 17,033 | 145,042 | — | |||||||||||||
| JPM | 07/2016 | PLN | 47,080 | USD | 11,903 | 34,200 | 7,934 | |||||||||||||
| JPM | 07/2016 | RUB | 1,749,000 | USD | 26,800 | 373,610 | — | |||||||||||||
| JPM | 07/2016 | SGD | 8,578 | USD | 6,365 | 1,852 | — | |||||||||||||
| JPM | 07/2016 | TRY | 22,460 | USD | 7,651 | 139,166 | — | |||||||||||||
| JPM | 11/2016 | USD | 10,988 | EUR | 9,560 | 325,206 | — | |||||||||||||
| JPM | 11/2016 | USD | 40,972 | GBP | 28,125 | 3,473,385 | — | |||||||||||||
| JPM | 07/2016 | USD | 17,946 | IDR | 239,189,000 | 33,807 | 190,953 | |||||||||||||
| JPM | 08/2016 - 11/2016 | USD | 13,128 | MXN | 245,100 | — | 138,528 | |||||||||||||
| JPM | 07/2016 | USD | 10,461 | RUB | 693,100 | — | 307,288 | |||||||||||||
| JPM | 07/2016 | USD | 6,377 | SGD | 8,578 | 10,763 | — | |||||||||||||
| JPM | 07/2016 | USD | 8,435 | TRY | 24,890 | — | 183,322 | |||||||||||||
| JPM | 08/2016 | USD | 6,475 | ZAR | 98,620 | — | 151,800 | |||||||||||||
28 OPPENHEIMER GLOBAL STRATEGIC INCOME FUND/VA
| Forward Currency Exchange Contracts (Continued) |
| |||||||||||||||||||||||||||
| Counterparty | Settlement Month(s) | Currency Purchased (000’s) | Currency Sold (000’s) | Unrealized Appreciation |
Unrealized Depreciation |
|||||||||||||||||||||||
|
|
||||||||||||||||||||||||||||
| MSCO | 08/2016 - 11/2016 | EUR | 12,540 | USD | 14,226 | $ | — | $ | 256,885 | |||||||||||||||||||
| MSCO | 11/2016 | GBP | 5,700 | USD | 7,913 | 12,129 | 325,607 | |||||||||||||||||||||
| MSCO | 11/2016 | USD | 25,150 | EUR | 22,095 | 501,279 | — | |||||||||||||||||||||
| MSCO | 11/2016 | USD | 26 | MXN | 500 | — | 538 | |||||||||||||||||||||
| RBS | 08/2016 | BRL | 17,570 | USD | 5,121 | 300,109 | — | |||||||||||||||||||||
| RBS | 07/2016 - 08/2016 | COP | 31,874,000 | USD | 10,651 | 204,514 | — | |||||||||||||||||||||
| RBS | 11/2016 | USD | 8,960 | MXN | 169,700 | — | 192,223 | |||||||||||||||||||||
| RBS | 07/2016 | USD | 5,790 | PLN | 23,210 | — | 93,078 | |||||||||||||||||||||
| RBS | 07/2016 | USD | 2,728 | RUB | 179,000 | — | 52,731 | |||||||||||||||||||||
| RBS | 07/2016 | USD | 3,605 | TRY | 10,590 | — | 76,539 | |||||||||||||||||||||
| RBS | 08/2016 | USD | 4,884 | ZAR | 73,810 | — | 76,000 | |||||||||||||||||||||
| TDB | 07/2016 | BRL | 9,370 | USD | 2,919 | — | 2,271 | |||||||||||||||||||||
| TDB | 11/2016 | EUR | 710 | USD | 796 | — | 3,951 | |||||||||||||||||||||
| TDB | 07/2016 | USD | 2,606 | BRL | 9,370 | — | 310,914 | |||||||||||||||||||||
| TDB | 08/2016 | USD | 8,436 | CLP | 5,772,000 | — | 254,235 | |||||||||||||||||||||
| TDB | 07/2016 | USD | 5,426 | COP | 15,962,000 | 35,708 | 53,511 | |||||||||||||||||||||
| TDB | 11/2016 | USD | 57,596 | EUR | 50,755 | 975,588 | — | |||||||||||||||||||||
| TDB | 12/2016 | USD | 2,368 | PHP | 113,000 | — | 12,165 | |||||||||||||||||||||
| TDB | 11/2016 | USD | 160 | SGD | 220 | — | 2,854 | |||||||||||||||||||||
|
|
|
|||||||||||||||||||||||||||
| Total Unrealized Appreciation and Depreciation | $ | 12,126,589 | $ | 7,722,713 | ||||||||||||||||||||||||
|
|
|
|||||||||||||||||||||||||||
| Futures Contracts as of June 30, 2016 |
| |||||||||||||||||||||||||
| Description | Exchange | Buy/Sell | Expiration Date | Number of Contracts |
Value | Unrealized Appreciation (Depreciation) |
||||||||||||||||||||
|
|
||||||||||||||||||||||||||
| United States Treasury Long Bonds | CBT | Sell | 9/21/16 | 25 | $ | 4,308,594 | $ | (38,505) | ||||||||||||||||||
| United States Treasury Long Bonds | CBT | Buy | 9/21/16 | 27 | 4,653,282 | 247,951 | ||||||||||||||||||||
| United States Treasury Nts., 10 yr. | CBT | Sell | 9/21/16 | 727 | 96,679,641 | (266,158) | ||||||||||||||||||||
| United States Treasury Nts., 10 yr. | CBT | Buy | 9/21/16 | 32 | 4,255,500 | 108,619 | ||||||||||||||||||||
| United States Treasury Nts., 2 yr. | CBT | Buy | 9/30/16 | 386 | 84,660,657 | 443,630 | ||||||||||||||||||||
| United States Treasury Nts., 5 yr. | CBT | Sell | 9/30/16 | 28 | 3,420,594 | (48,913) | ||||||||||||||||||||
| United States Ultra Bonds | CBT | Buy | 9/21/16 | 197 | 36,715,875 | 2,389,552 | ||||||||||||||||||||
|
|
|
|||||||||||||||||||||||||
| $ | 2,836,176 | |||||||||||||||||||||||||
|
|
|
|||||||||||||||||||||||||
| Over-the-Counter Options Written at June 30, 2016 |
| |||||||||||||||||||||||||||||||||||
| Description | Counterparty | Exercise Price | Expiration Date | Number of Contracts | Premiums Received | Value | ||||||||||||||||||||||||||||||
|
|
||||||||||||||||||||||||||||||||||||
| AUD Currency Put | BAC | NZD | 1.042 | 8/29/16 | AUD | (49,550,000) | $ | 268,597 | $ | (460,150) | ||||||||||||||||||||||||||
|
|
||||||||||||||||||||||||||||||||||||
| AUD Currency Call | BAC | NZD | 1.120 | 8/29/16 | AUD | (49,550,000) | 156,651 | (19,222) | ||||||||||||||||||||||||||||
|
|
||||||||||||||||||||||||||||||||||||
| CAD Currency Put | DEU | CAD | 1.370 | 9/1/16 | CAD | (24,390,000) | 105,215 | (41,463) | ||||||||||||||||||||||||||||
|
|
||||||||||||||||||||||||||||||||||||
| CAD Currency Call | DEU | CAD | 1.260 | 9/1/16 | CAD | (22,430,000) | 94,883 | (85,548) | ||||||||||||||||||||||||||||
|
|
||||||||||||||||||||||||||||||||||||
| CAD Currency Put1 | RBS | CAD | 1.325 | 8/5/16 | CAD | (11,726,613) | 103,371 | (23,336) | ||||||||||||||||||||||||||||
|
|
||||||||||||||||||||||||||||||||||||
| EUR Currency Put | RBS | USD | 1.075 | 7/13/16 | EUR | (17,665,000) | 142,026 | (11,094) | ||||||||||||||||||||||||||||
|
|
||||||||||||||||||||||||||||||||||||
| S&P 500 Index Call | DEU | USD | 2141.100 | 8/19/16 | USD | (41,962) | 902,183 | (692,625) | ||||||||||||||||||||||||||||
|
|
||||||||||||||||||||||||||||||||||||
| TWD Currency Put2 | DEU | TWD | 34.000 | 8/5/16 | TWD | (601,818,642) | 23,011 | (5,416) | ||||||||||||||||||||||||||||
|
|
|
|||||||||||||||||||||||||||||||||||
| Total Over-the-Counter Options Written | $ | 1,795,937 | $ | (1,338,854) | ||||||||||||||||||||||||||||||||
|
|
|
|||||||||||||||||||||||||||||||||||
1. Knock-in option becomes eligible for exercise if at any time spot rates are greater than or equal to 1.3700 CAD per 1 USD.
2. Knock-out option becomes ineligible for exercise if at 15:00 hours local time in Tokyo on 8/5/2016 the spot rate is greater than or equal to 1.05 JPY per 1 USD.
| Centrally Cleared Credit Default Swaps at June 30, 2016 |
| |||||||||||||||||||||||||||
| Reference Asset | Buy/Sell Protection |
Fixed Rate | Maturity Date | Notional Amount |
Premiums Received/(Paid) |
Value | ||||||||||||||||||||||
|
|
||||||||||||||||||||||||||||
| CDX.HY.25 | Buy | 5.000 | % | 12/20/20 | USD | 8,663 | $ | 19,443 | $ | (354,931 | ) | |||||||||||||||||
| Over-the-Counter Credit Default Swaps at June 30, 2016 |
| |||||||||||||||||||||||||||||||
| Reference Asset | Counterparty | Buy/Sell Protection |
Fixed Rate | Maturity Date | Notional Amount |
Premiums Received/ |
Value | |||||||||||||||||||||||||
|
|
||||||||||||||||||||||||||||||||
| Alpha Bank AE | BAC | Buy | 5.000 | % | 3/20/17 | EUR | 1,165 | $ | (136,738 | ) | $ | 92,009 | ||||||||||||||||||||
|
|
||||||||||||||||||||||||||||||||
| Banco Bilbao Vizcaya Argentaria Sociedad Anonima | UBS | Sell | 3.000 | 12/20/17 | EUR | 125 | (60 | ) | 4,618 | |||||||||||||||||||||||
|
|
||||||||||||||||||||||||||||||||
| Banco Bilbao Vizcaya Argentaria Sociedad Anonima | UBS | Sell | 3.000 | 12/20/17 | EUR | 125 | (60 | ) | 4,618 | |||||||||||||||||||||||
|
|
||||||||||||||||||||||||||||||||
| Banco Santander SA | UBS | Sell | 3.000 | 9/20/17 | EUR | 250 | (997 | ) | 7,622 | |||||||||||||||||||||||
|
|
||||||||||||||||||||||||||||||||
| Federative Republic of Brazil | BNP | Sell | 1.000 | 12/20/18 | USD | 1,190 | 94,152 | (16,892 | ) | |||||||||||||||||||||||
|
|
||||||||||||||||||||||||||||||||
| Hellenic Republic | BAC | Sell | 1.000 | 3/20/20 | USD | 475 | 168,651 | (126,773 | ) | |||||||||||||||||||||||
|
|
||||||||||||||||||||||||||||||||
| Hellenic Republic | BAC | Sell | 1.000 | 3/20/20 | USD | 475 | 180,526 | (126,773 | ) | |||||||||||||||||||||||
|
|
||||||||||||||||||||||||||||||||
| Malaysia | BOA | Buy | 1.000 | 12/20/20 | USD | 765 | (40,897 | ) | 10,435 | |||||||||||||||||||||||
|
|
||||||||||||||||||||||||||||||||
| Malaysia | BOA | Buy | 1.000 | 12/20/20 | USD | 385 | (26,693 | ) | 5,252 | |||||||||||||||||||||||
|
|
||||||||||||||||||||||||||||||||
| Malaysia | BOA | Buy | 1.000 | 12/20/20 | USD | 705 | (36,881 | ) | 9,617 | |||||||||||||||||||||||
29 OPPENHEIMER GLOBAL STRATEGIC INCOME FUND/VA
CONSOLIDATED STATEMENT OF INVESTMENTS Unaudited / Continued
| Over-the-Counter Credit Default Swaps (Continued) |
|
|||||||||||||||||||||||||||
| Reference Asset | Counterparty | Buy/Sell Protection |
Fixed Rate |
Maturity Date |
Notional Amount (000’s) |
Premiums Received/(Paid) | Value | |||||||||||||||||||||
|
|
||||||||||||||||||||||||||||
| Malaysia | MOS-A | Buy | 1.000% | 12/20/20 | USD | 765 | $ | (48,374 | ) | $ | 10,435 | |||||||||||||||||
|
|
||||||||||||||||||||||||||||
| Republic of Peru | BNP | Buy | 1.000 | 12/20/20 | USD | 964 | (27,540 | ) | 8,242 | |||||||||||||||||||
|
|
||||||||||||||||||||||||||||
| Russian Federation | BNP | Buy | 1.000 | 12/20/20 | USD | 765 | (81,669 | ) | 33,715 | |||||||||||||||||||
|
|
||||||||||||||||||||||||||||
| State Bank of India | BNP | Sell | 1.000 | 9/20/19 | USD | 1,740 | 71,791 | (10,004) | ||||||||||||||||||||
|
|
|
|||||||||||||||||||||||||||
| Total Over-the-Counter Credit Default Swaps | $ | 115,211 | $ | (93,879) | ||||||||||||||||||||||||
|
|
|
|||||||||||||||||||||||||||
The table that follows shows the undiscounted maximum potential payment by the Fund related to selling credit protection in credit default swaps:
| Type of Reference Asset on which the Fund Sold Protection |
Total Maximum for Selling (Undiscounted) |
Amount Recoverable* | Reference Asset Rating Range** |
|||||||||||||||||
| Investment Grade Single Name Corporate Debt | $ | 1,740,000 | — | EUR | BBB- | |||||||||||||||
| Investment Grade Sovereign Debt | 660,000 | EUR | — | BBB to BBB- | ||||||||||||||||
| Non-Investment Grade Sovereign Debt | 2,140,000 | — | EUR | BB to B- | ||||||||||||||||
|
|
|
|
|
|||||||||||||||||
| Total USD | $ | 3,880,000 | $ | — | ||||||||||||||||
|
|
|
|
|
|||||||||||||||||
| Total EUR | 660,000 | EUR | — | EUR | ||||||||||||||||
|
|
|
|
|
|||||||||||||||||
*The Fund has no amounts recoverable from related purchased protection. In addition, the Fund has no recourse provisions under the credit derivatives and holds no collateral which can offset or reduce potential payments under a triggering event.
**The period end reference asset security ratings, as rated by any rating organization, are included in the equivalent Standard & Poor’s rating category. The reference asset rating represents the likelihood of a potential credit event on the reference asset which would result in a related payment by the Fund.
| Centrally Cleared Interest Rate Swaps at June 30, 2016 |
|
|||||||||||||||||||||||
| Counterparty | Pay/Receive Floating Rate |
Floating Rate | Fixed Rate | Maturity Date | Notional Amount (000’s) | Value | ||||||||||||||||||
|
|
||||||||||||||||||||||||
| Three-Month | ||||||||||||||||||||||||
| ZAR JIBAR | ||||||||||||||||||||||||
| DEU | Receive | SAFEX | 8.310% | 6/29/26 | ZAR | 56,100 | $ | 3,840 | ||||||||||||||||
|
|
||||||||||||||||||||||||
| Six-Month PLN | ||||||||||||||||||||||||
| DEU | Receive | WIBOR WIBO | 1.920 | 6/29/21 | PLN | 21,650 | 33,493 | |||||||||||||||||
|
|
||||||||||||||||||||||||
| MXN TIIE | ||||||||||||||||||||||||
| JPM | Pay | BANXICO | 6.100 | 4/16/26 | MXN | 81,000 | 13,418 | |||||||||||||||||
|
|
|
|||||||||||||||||||||||
| Total Centrally Cleared Interest Rate Swaps | $ | 50,751 | ||||||||||||||||||||||
|
|
|
|||||||||||||||||||||||
|
|
||||||||||||||||||||||||
| Over-the-Counter Interest Rate Swaps at June 30, 2016 |
|
|||||||||||||||||||||||
| Counterparty | Pay/Receive Floating Rate |
Floating Rate | Fixed Rate | Maturity Date | Notional Amount (000’s) | Value | ||||||||||||||||||
|
|
||||||||||||||||||||||||
| Three-Month | ||||||||||||||||||||||||
| DEU | Pay | KRW CD KSDA | 1.480% | 4/20/18 | KRW | 102,630,000 | $ | 370,621 | ||||||||||||||||
|
|
||||||||||||||||||||||||
| Three-Month | ||||||||||||||||||||||||
| DEU | Receive | KRW CD KSDA | 1.670 | 4/20/26 | KRW | 21,990,000 | (661,322) | |||||||||||||||||
|
|
||||||||||||||||||||||||
| SIB | Pay | BZDI | 12.550 | 1/2/25 | BRL | 21,670 | 43,298 | |||||||||||||||||
|
|
|
|||||||||||||||||||||||
| Total Over-the-Counter Interest Rate Swaps | $ | (247,403) | ||||||||||||||||||||||
|
|
|
|||||||||||||||||||||||
Glossary:
Counterparty Abbreviations
| BAC | Barclays Bank plc | |
| BNP | BNP Paribas | |
| BOA | Bank of America NA | |
| CITNA-B | Citibank NA | |
| DEU | Deutsche Bank AG | |
| GSCO-OT | Goldman Sachs Bank USA | |
| HSBC | HSBC Bank USA NA | |
| JPM | JPMorgan Chase Bank NA | |
| MOS-A | Morgan Stanley | |
| MSCO | Morgan Stanley Capital Services, Inc. | |
| RBS | Royal Bank of Scotland plc (The) | |
| SIB | Banco Santander SA | |
| TDB | Toronto Dominion Bank | |
| UBS | UBS AG |
Currency abbreviations indicate amounts reporting in currencies
| AUD | Australian Dollar | |
| BRL | Brazilian Real | |
| CAD | Canadian Dollar | |
| CLP | Chilean Peso | |
| CNH | Offshore Chinese Renminbi | |
| COP | Colombian Peso |
30 OPPENHEIMER GLOBAL STRATEGIC INCOME FUND/VA
Currency abbreviations indicate amounts reporting in currencies (Continued)
| EUR | Euro | |
| GBP | British Pound Sterling | |
| HUF | Hungarian Forint | |
| IDR | Indonesian Rupiah | |
| INR | Indian Rupee | |
| JPY | Japanese Yen | |
| KRW | South Korean Won | |
| MXN | Mexican Nuevo Peso | |
| MYR | Malaysian Ringgit | |
| PHP | Philippine Peso | |
| PLN | Polish Zloty | |
| RUB | Russian Ruble | |
| SGD | Singapore Dollar | |
| TRY | New Turkish Lira | |
| TWD | New Taiwan Dollar | |
| ZAR | South African Rand | |
| Definitions | ||
| BANXICO | Banco de Mexico | |
| BBA LIBOR | British Bankers’ Association London-Interbank Offered Rate | |
| BZDI | Brazil Interbank Deposit Rate | |
| CD | Certificate of Deposit | |
| CDX.HY.25 | Markit CDX High Yield Index | |
| JIBAR SAFEX | South Africa Johannesburg Interbank Agreed Rate/Futures Exchange | |
| KSDA | Korean Securities Dealers Assn. | |
| S&P | Standard & Poor’s | |
| TIIE | Interbank Equilibrium Interest Rate | |
| WIBOR WIBO | Poland Warsaw Interbank Offer Bid Rate | |
| Exchange Abbreviations | ||
| CBT | Chicago Board of Trade | |
See accompanying Notes to Consolidated Financial Statements.
31 OPPENHEIMER GLOBAL STRATEGIC INCOME FUND/VA
CONSOLIDATED STATEMENT OF ASSETS AND LIABILITIES June 30, 2016 Unaudited
|
|
||||
| Assets |
||||
| Investments, at value—see accompanying consolidated statement of investments: | ||||
| Unaffiliated companies (cost $1,499,637,322) | $ | 1,467,729,969 | ||
| Affiliated companies (cost $369,063,955) | 365,173,611 | |||
|
|
|
|||
| 1,832,903,580 | ||||
|
|
||||
| Cash | 21,021,390 | |||
|
|
||||
| Cash used for collateral on centrally cleared swaps | 1,149,350 | |||
|
|
||||
| Unrealized appreciation on forward currency exchange contracts | 12,126,589 | |||
|
|
||||
| Swaps, at value (premiums paid $399,909) | 600,482 | |||
|
|
||||
| Centrally cleared swaps, at value | 50,751 | |||
|
|
||||
| Receivables and other assets: | ||||
| Investments sold (including $24,491,154 sold on a when-issued or delayed delivery basis) | 52,323,007 | |||
| Interest, dividends and principal paydowns | 15,203,682 | |||
| Shares of beneficial interest sold | 119,939 | |||
| Variation margin receivable | 51,567 | |||
| Other | 176,382 | |||
|
|
|
|||
| Total assets |
|
1,935,726,719
|
| |
|
|
||||
| Liabilities |
||||
| Bank overdraft-foreign | 31,833 | |||
|
|
||||
| Unrealized depreciation on forward currency exchange contracts | 7,722,713 | |||
|
|
||||
| Options written, at value (premiums received $1,795,937) | 1,338,854 | |||
|
|
||||
| Swaps, at value (premiums received $515,120) | 941,764 | |||
|
|
||||
| Centrally cleared swaps, at value (premiums received $19,443) | 354,931 | |||
|
|
||||
| Payables and other liabilities: | ||||
| Investments purchased (including $139,481,710 purchased on a when-issued or delayed delivery basis) | 168,282,802 | |||
| Shares of beneficial interest redeemed | 2,540,333 | |||
| Distribution and service plan fees | 274,177 | |||
| Variation margin payable | 253,228 | |||
| Shareholder communications | 106,718 | |||
| Trustees’ compensation | 90,213 | |||
| Other | 70,949 | |||
|
|
|
|||
| Total liabilities |
|
182,008,515
|
| |
|
|
||||
| Net Assets | $ | 1,753,718,204 | ||
|
|
|
|||
|
|
||||
|
|
||||
| Composition of Net Assets |
||||
| Par value of shares of beneficial interest | $ | 355,100 | ||
|
|
||||
| Additional paid-in capital | 1,931,243,686 | |||
|
|
||||
| Accumulated net investment income | 40,566,810 | |||
|
|
||||
| Accumulated net realized loss on investments and foreign currency transactions | (189,739,116) | |||
|
|
||||
| Net unrealized depreciation on investments and translation of assets and liabilities denominated in foreign currencies | (28,708,276) | |||
|
|
|
|||
| Net Assets | $ | 1,753,718,204 | ||
|
|
|
|||
|
|
||||
|
|
||||
| Net Asset Value Per Share |
||||
| Non-Service Shares: | ||||
| Net asset value, redemption price per share and offering price per share (based on net assets of $415,726,672 and 85,968,455 shares of beneficial interest outstanding) | $4.84 | |||
|
|
||||
| Service Shares: | ||||
| Net asset value, redemption price per share and offering price per share (based on net assets of $1,337,991,532 and 269,131,579 shares of beneficial interest outstanding) | $4.97 | |||
See accompanying Notes to Consolidated Financial Statements.
32 OPPENHEIMER GLOBAL STRATEGIC INCOME FUND/VA
CONSOLIDATED STATEMENT OF OPERATIONS For the Six Months Ended June 30, 2016 Unaudited
|
|
||||
| Allocation of Income and Expenses from Master Funds1 |
||||
| Net investment income allocated from Oppenheimer Master Event-Linked Bond Fund, LLC: | ||||
| Interest | $ | 1,324,119 | ||
| Dividends | 1,932 | |||
| Expenses | (105,237) | |||
|
|
|
|||
| Net investment income allocated from Oppenheimer Master Event-Linked Bond Fund, LLC | 1,220,814 | |||
|
|
||||
| Net investment income allocated from Oppenheimer Master Loan Fund, LLC | ||||
| Interest | 2,529,644 | |||
| Dividends | 12,374 | |||
| Expenses | (204,086) | |||
|
|
|
|||
| Net investment income allocated from Oppenheimer Master Loan Fund, LLC | 2,337,932 | |||
|
|
|
|||
| Total allocation of net investment income from master funds |
|
3,558,746
|
| |
|
|
||||
| Investment Income |
||||
| Interest - unaffiliated companies (net of foreign withholding taxes of $273,762) | 35,040,264 | |||
|
|
||||
| Fee income on when-issued securities | 999,119 | |||
|
|
||||
| Dividends: | ||||
| Unaffiliated companies (net of foreign withholding taxes of $(4)) | 188 | |||
| Affiliated companies | 462,180 | |||
|
|
|
|||
| Total investment income |
|
36,501,751
|
| |
|
|
||||
| Expenses |
||||
| Management fees | 5,342,072 | |||
|
|
||||
| Distribution and service plan fees: | ||||
| Service shares | 1,663,562 | |||
|
|
||||
| Transfer and shareholder servicing agent fees: | ||||
| Non-Service shares | 208,938 | |||
| Service shares | 666,367 | |||
|
|
||||
| Shareholder communications: | ||||
| Non-Service shares | 20,608 | |||
| Service shares | 65,522 | |||
|
|
||||
| Custodian fees and expenses | 74,297 | |||
|
|
||||
| Trustees’ compensation | 35,021 | |||
|
|
||||
| Borrowing fees | 15,677 | |||
|
|
||||
| Other | 119,646 | |||
|
|
|
|||
| Total expenses | 8,211,710 | |||
| Less reduction to custodian expenses | (4,526) | |||
| Less waivers and reimbursements of expenses | (417,974) | |||
|
|
|
|||
| Net expenses
|
|
7,789,210
|
| |
|
|
||||
| Net Investment Income | 32,271,287 | |||
33 OPPENHEIMER GLOBAL STRATEGIC INCOME FUND/VA
CONSOLIDATED STATEMENT OF OPERATIONS Unaudited / Continued
|
|
||||
| Realized and Unrealized Gain (Loss) |
||||
| Net realized gain (loss) on: | ||||
| Investments from unaffiliated companies (including premiums on options exercised) | $ | (44,052,484) | ||
| Closing and expiration of option contracts written | 410,150 | |||
| Closing and expiration of futures contracts | (949,505) | |||
| Foreign currency transactions | (20,698,389) | |||
| Swap contracts | (566,326) | |||
| Swaption contracts | 1,043,475 | |||
|
|
||||
| Net realized loss allocated from: | ||||
| Oppenheimer Master Event-Linked Bond Fund, LLC | (606,503) | |||
| Oppenheimer Master Loan Fund, LLC | (2,440,509) | |||
|
|
|
|||
| Net realized loss | (67,860,091) | |||
|
|
||||
| Net change in unrealized appreciation/depreciation on: | ||||
| Investments | 76,071,639 | |||
| Translation of assets and liabilities denominated in foreign currencies | 20,550,540 | |||
| Futures contracts | 2,423,412 | |||
| Option contracts written | 418,163 | |||
| Swap contracts | 1,536,633 | |||
| Swaption contracts | 1,465,085 | |||
|
|
||||
| Net change in unrealized appreciation/depreciation allocated from: | ||||
| Oppenheimer Master Event-Linked Bond Fund, LLC | 676,127 | |||
| Oppenheimer Master Loan Fund, LLC | 5,421,469 | |||
|
|
|
|||
| Net change in unrealized appreciation/depreciation |
|
108,563,068
|
| |
|
|
||||
| Net Increase in Net Assets Resulting from Operations | $ | 72,974,264 | ||
|
|
|
|||
1. The Fund invests in certain affiliated mutual funds that expect to be treated as partnerships for tax purposes. See Note 1 of the accompanying Consolidated Notes.
See accompanying Notes to Consolidated Financial Statements.
34 OPPENHEIMER GLOBAL STRATEGIC INCOME FUND/VA
CONSOLIDATED STATEMENTS OF CHANGES IN NET ASSETS
| Six Months Ended June 30, 2016 (Unaudited) |
Year Ended December 31, 2015 |
|||||||
|
|
||||||||
| Operations |
||||||||
| Net investment income | $ | 32,271,287 | $ | 86,850,429 | ||||
|
|
||||||||
| Net realized loss | (67,860,091) | (53,432,958) | ||||||
|
|
||||||||
| Net change in unrealized appreciation/depreciation | 108,563,068 | (75,538,414) | ||||||
|
|
|
|||||||
| Net increase (decrease) in net assets resulting from operations |
|
72,974,264
|
|
|
(42,120,943)
|
| ||
|
|
||||||||
| Dividends and/or Distributions to Shareholders |
||||||||
| Dividends from net investment income: | ||||||||
| Non-Service shares | (20,719,866) | (29,479,205) | ||||||
| Service shares | (61,256,620) | (81,704,570) | ||||||
|
|
|
|||||||
|
|
(81,976,486)
|
|
|
(111,183,775)
|
| |||
|
|
||||||||
| Beneficial Interest Transactions |
||||||||
| Net increase (decrease) in net assets resulting from beneficial interest transactions: | ||||||||
| Non-Service shares | (11,159,809) | (120,101,219) | ||||||
| Service shares | (30,972,451) | (59,939,490) | ||||||
|
|
|
|||||||
|
|
(42,132,260)
|
|
|
(180,040,709)
|
| |||
|
|
||||||||
| Net Assets |
||||||||
| Total decrease | (51,134,482) | (333,345,427) | ||||||
|
|
||||||||
| Beginning of period | 1,804,852,686 | 2,138,198,113 | ||||||
|
|
|
|||||||
| End of period (including accumulated net investment income of $40,566,810 and $90,272,009, respectively) |
$ |
1,753,718,204 |
|
$ |
1,804,852,686 |
| ||
|
|
|
|||||||
See accompanying Notes to Consolidated Financial Statements.
35 OPPENHEIMER GLOBAL STRATEGIC INCOME FUND/VA
CONSOLIDATED FINANCIAL HIGHLIGHTS
| Non-Service Shares | Six Months Ended June 30, 2016 (Unaudited) |
Year Ended December 31, 2015 |
Year Ended December 31, 2014 |
Year Ended December 31, 2013 |
Year Ended December 31, 2012 |
Year Ended December 30, 20111 |
||||||||||||||||||
|
|
||||||||||||||||||||||||
| Per Share Operating Data |
||||||||||||||||||||||||
| Net asset value, beginning of period | $4.88 | $5.30 | $5.38 | $5.67 | $5.38 | $5.58 | ||||||||||||||||||
|
|
||||||||||||||||||||||||
| Income (loss) from investment operations: | ||||||||||||||||||||||||
| Net investment income2 | 0.10 | 0.23 | 0.26 | 0.28 | 0.33 | 0.36 | ||||||||||||||||||
| Net realized and unrealized gain (loss) | 0.11 | (0.34) | (0.11) | (0.29) | 0.36 | (0.31) | ||||||||||||||||||
|
|
|
|||||||||||||||||||||||
| Total from investment operations | 0.21 | (0.11) | 0.15 | (0.01) | 0.69 | 0.05 | ||||||||||||||||||
|
|
||||||||||||||||||||||||
| Dividends and/or distributions to shareholders: | ||||||||||||||||||||||||
| Dividends from net investment income | (0.25) | (0.31) | (0.23) | (0.28) | (0.34) | (0.18) | ||||||||||||||||||
| Distributions from net realized gain | 0.00 | 0.00 | 0.00 | 0.00 | (0.06) | (0.07) | ||||||||||||||||||
|
|
|
|||||||||||||||||||||||
| Total dividends and/or distributions to shareholders | (0.25) | (0.31) | (0.23) | (0.28) | (0.40) | (0.25) | ||||||||||||||||||
|
|
||||||||||||||||||||||||
| Net asset value, end of period | $4.84 | $4.88 | $5.30 | $5.38 | $5.67 | $5.38 | ||||||||||||||||||
|
|
|
|||||||||||||||||||||||
|
|
||||||||||||||||||||||||
|
|
||||||||||||||||||||||||
| Total Return, at Net Asset Value3 |
4.38% | (2.26)% | 2.84% | (0.13)% | 13.53% | 0.85% | ||||||||||||||||||
|
|
||||||||||||||||||||||||
|
|
||||||||||||||||||||||||
| Ratios/Supplemental Data |
||||||||||||||||||||||||
| Net assets, end of period (in thousands) | $415,727 | $429,710 | $586,951 | $738,741 | $741,996 | $648,084 | ||||||||||||||||||
|
|
||||||||||||||||||||||||
| Average net assets (in thousands) | $420,103 | $510,765 | $707,673 | $734,707 | $690,351 | $694,868 | ||||||||||||||||||
|
|
||||||||||||||||||||||||
| Ratios to average net assets:4,5 | ||||||||||||||||||||||||
| Net investment income | 3.88% | 4.51% | 4.73% | 5.12% | 6.01% | 6.50% | ||||||||||||||||||
| Expenses excluding specific expenses listed below | 0.78% | 0.76% | 0.74% | 0.74% | 0.77% | 0.77% | ||||||||||||||||||
| Interest and fees from borrowings | 0.00%6 | 0.00%6 | 0.00% | 0.00% | 0.00% | 0.00% | ||||||||||||||||||
|
|
|
|||||||||||||||||||||||
| Total expenses7 | 0.78% | 0.76% | 0.74% | 0.74% | 0.77% | 0.77% | ||||||||||||||||||
| Expenses after payments, waivers and/or reimbursements and reduction to custodian expenses | 0.74% | 0.73% | 0.71% | 0.72% | 0.71% | 0.71% | ||||||||||||||||||
|
|
||||||||||||||||||||||||
| Portfolio turnover rate8 | 43% | 79% | 93% | 107% | 78% | 49% | ||||||||||||||||||
1. December 30, 2011 represents the last business day of the Fund’s reporting period. See Note 2 of the accompanying Notes.
2. Per share amounts calculated based on the average shares outstanding during the period.
3. Assumes an initial investment on the business day before the first day of the fiscal period, with all dividends and distributions reinvested in additional shares on the reinvestment date, and redemption at the net asset value calculated on the last business day of the fiscal period. Total returns are not annualized for periods less than one full year. Total return information does not reflect expenses that apply at the separate account level or to related insurance products. Inclusion of these charges would reduce the total return figures for all periods shown. Returns do not reflect the deduction of taxes that a shareholder would pay on fund distributions or the redemption of fund shares.
4. Annualized for periods less than one full year.
5. Includes the Fund’s share of the allocated expenses and/or net investment income from the master funds.
6. Less than 0.005%.
7. Total expenses including indirect expenses from affiliated fund fees and expenses were as follows:
| Six Months Ended June 30, 2016 |
0.79% | |||||
| Year Ended December 31, 2015 |
0.77% | |||||
| Year Ended December 31, 2014 |
0.75% | |||||
| Year Ended December 31, 2013 |
0.74% | |||||
| Year Ended December 31, 2012 |
0.77% | |||||
| Year Ended December 30, 2011 |
0.77% |
8. The portfolio turnover rate excludes purchase and sale transactions of To Be Announced (TBA) mortgage-related securities as follows:
| Purchase Transactions | Sale Transactions | |||||||||
|
|
||||||||||
| Six Months Ended June 30, 2016 |
$877,685,156 | $829,309,065 | ||||||||
| Year Ended December 31, 2015 |
$1,225,140,927 | $1,266,426,777 | ||||||||
| Year Ended December 31, 2014 |
$1,348,552,640 | $1,337,346,996 | ||||||||
| Year Ended December 31, 2013 |
$4,294,357,677 | $4,679,296,373 | ||||||||
| Year Ended December 31, 2012 |
$3,862,820,437 | $3,466,796,233 | ||||||||
| Year Ended December 30, 2011 |
$1,050,654,783 | $1,039,506,614 | ||||||||
See accompanying Notes to Consolidated Financial Statements.
36 OPPENHEIMER GLOBAL STRATEGIC INCOME FUND/VA
| Service Shares | Six Months Ended June 30, 2016 (Unaudited) |
Year Ended December 31, 2015 |
Year Ended December 31, 2014 |
Year Ended December 31, 2013 |
Year Ended December 31, 2012 |
Year Ended December 30, 20111 |
||||||||||||||||||
|
|
||||||||||||||||||||||||
| Per Share Operating Data |
||||||||||||||||||||||||
| Net asset value, beginning of period | $5.00 | $5.42 | $5.50 | $5.79 | $5.49 | $5.68 | ||||||||||||||||||
|
|
||||||||||||||||||||||||
| Income (loss) from investment operations: | ||||||||||||||||||||||||
| Net investment income2 | 0.09 | 0.23 | 0.25 | 0.27 | 0.33 | 0.35 | ||||||||||||||||||
| Net realized and unrealized gain (loss) | 0.12 | (0.35) | (0.11) | (0.29) | 0.36 | (0.31) | ||||||||||||||||||
|
|
|
|||||||||||||||||||||||
| Total from investment operations | 0.21 | (0.12) | 0.14 | (0.02) | 0.69 | 0.04 | ||||||||||||||||||
|
|
||||||||||||||||||||||||
| Dividends and/or distributions to shareholders: | ||||||||||||||||||||||||
| Dividends from net investment income | (0.24) | (0.30) | (0.22) | (0.27) | (0.33) | (0.16) | ||||||||||||||||||
| Distributions from net realized gain | 0.00 | 0.00 | 0.00 | 0.00 | (0.06) | (0.07) | ||||||||||||||||||
|
|
|
|||||||||||||||||||||||
| Total dividends and/or distributions to shareholders | (0.24) | (0.30) | (0.22) | (0.27) | (0.39) | (0.23) | ||||||||||||||||||
|
|
||||||||||||||||||||||||
| Net asset value, end of period | $4.97 | $5.00 | $5.42 | $5.50 | $5.79 | $5.49 | ||||||||||||||||||
|
|
|
|||||||||||||||||||||||
|
|
||||||||||||||||||||||||
|
|
||||||||||||||||||||||||
| Total Return, at Net Asset Value3 |
4.17% | (2.49)% | 2.49% | (0.37)% | 13.15% | 0.65% | ||||||||||||||||||
|
|
||||||||||||||||||||||||
|
|
||||||||||||||||||||||||
| Ratios/Supplemental Data |
||||||||||||||||||||||||
| Net assets, end of period (in thousands) | $1,337,991 | $1,375,143 | $1,551,247 | $1,716,026 | $1,840,721 | $1,604,906 | ||||||||||||||||||
|
|
||||||||||||||||||||||||
| Average net assets (in thousands) | $1,339,846 | $1,496,350 | $1,646,615 | $1,794,640 | $1,715,995 | $1,673,715 | ||||||||||||||||||
|
|
||||||||||||||||||||||||
| Ratios to average net assets:4,5 | ||||||||||||||||||||||||
| Net investment income | 3.63% | 4.26% | 4.48% | 4.88% | 5.76% | 6.25% | ||||||||||||||||||
| Expenses excluding specific expenses listed below | 1.03% | 1.01% | 0.99% | 0.99% | 1.02% | 1.02% | ||||||||||||||||||
| Interest and fees from borrowings | 0.00%6 | 0.00%6 | 0.00% | 0.00% | 0.00% | 0.00% | ||||||||||||||||||
|
|
|
|||||||||||||||||||||||
| Total expenses7 | 1.03% | 1.01% | 0.99% | 0.99% | 1.02% | 1.02% | ||||||||||||||||||
| Expenses after payments, waivers and/or reimbursements and reduction to custodian expenses | 0.98% | 0.98% | 0.96% | 0.97% | 0.96% | 0.96% | ||||||||||||||||||
|
|
||||||||||||||||||||||||
| Portfolio turnover rate8 | 43% | 79% | 93% | 107% | 78% | 49% | ||||||||||||||||||
1. December 30, 2011 represents the last business day of the Fund’s reporting period. See Note 2 of the accompanying Notes.
2. Per share amounts calculated based on the average shares outstanding during the period.
3. Assumes an initial investment on the business day before the first day of the fiscal period, with all dividends and distributions reinvested in additional shares on the reinvestment date, and redemption at the net asset value calculated on the last business day of the fiscal period. Total returns are not annualized for periods less than one full year. Total return information does not reflect expenses that apply at the separate account level or to related insurance products. Inclusion of these charges would reduce the total return figures for all periods shown. Returns do not reflect the deduction of taxes that a shareholder would pay on fund distributions or the redemption of fund shares.
4. Annualized for periods less than one full year.
5. Includes the Fund’s share of the allocated expenses and/or net investment income from the master funds.
6. Less than 0.005%.
7. Total expenses including indirect expenses from affiliated fund fees and expenses were as follows:
| Six Months Ended June 30, 2016 |
1.04% | |||||
| Year Ended December 31, 2015 |
1.02% | |||||
| Year Ended December 31, 2014 |
1.00% | |||||
| Year Ended December 31, 2013 |
0.99% | |||||
| Year Ended December 31, 2012 |
1.02% | |||||
| Year Ended December 30, 2011 |
1.02% |
8. The portfolio turnover rate excludes purchase and sale transactions of To Be Announced (TBA) mortgage-related securities as follows:
| Purchase Transactions | Sale Transactions | |||||||||
|
|
||||||||||
| Six Months Ended June 30, 2016 |
$877,685,156 | $829,309,065 | ||||||||
| Year Ended December 31, 2015 |
$1,225,140,927 | $1,266,426,777 | ||||||||
| Year Ended December 31, 2014 |
$1,348,552,640 | $1,337,346,996 | ||||||||
| Year Ended December 31, 2013 |
$4,294,357,677 | $4,679,296,373 | ||||||||
| Year Ended December 31, 2012 |
$3,862,820,437 | $3,466,796,233 | ||||||||
| Year Ended December 30, 2011 |
$1,050,654,783 | $1,039,506,614 | ||||||||
See accompanying Notes to Consolidated Financial Statements.
37 OPPENHEIMER GLOBAL STRATEGIC INCOME FUND/VA
NOTES TO CONSOLIDATED FINANCIAL STATEMENTS June 30, 2016 Unaudited
1. Organization
Oppenheimer Global Strategic Income Fund/VA (the “Fund”), a separate series of Oppenheimer Variable Account Funds, is a diversified open-end management investment company registered under the Investment Company Act of 1940 (“1940 Act”), as amended. The Fund’s main investment objective is to seek total return. The Fund’s investment adviser is OFI Global Asset Management, Inc. (“OFI Global” or the “Manager”), a wholly-owned subsidiary of OppenheimerFunds, Inc. (“OFI” or the “Sub-Adviser”). The Manager has entered into a sub-advisory agreement with OFI. Shares of the Fund are sold only to separate accounts of life insurance companies.
The Fund offers two classes of shares. Both classes are sold at their offering price, which is the net asset value per share, to separate investment accounts of participating insurance companies as an underlying investment for variable life insurance policies, variable annuity contracts or other investment products. The class of shares designated as Service shares is subject to a distribution and service plan. Both classes of shares have identical rights and voting privileges with respect to the Fund in general and exclusive voting rights on matters that affect that class alone. Earnings, net assets and net asset value per share may differ due to each class having its own expenses, such as transfer and shareholder servicing agent fees and shareholder communications, directly attributable to that class.
The following is a summary of significant accounting policies followed in the Fund’s preparation of financial statements in accordance with accounting principles generally accepted in the United States (“U.S. GAAP”).
2. Significant Accounting Policies
Security Valuation. All investments in securities are recorded at their estimated fair value, as described in Note 3.
Reporting Period End Date. The last day of the Fund’s reporting period is the last day the New York Stock Exchange was open for trading during the period. The Fund’s financial statements have been presented through that date to maintain consistency with the Fund’s net asset value calculations used for shareholder transactions.
Basis for Consolidation. The Fund has established a Cayman Islands exempted company, Oppenheimer Global Strategic Income Fund (Cayman) Ltd., which is wholly-owned and controlled by the Fund (the “Subsidiary”). The Fund and Subsidiary are both managed by the Manager. The Fund may invest up to 25% of its total assets in the Subsidiary. The Subsidiary invests primarily in commodity-linked derivatives (including commodity futures, financial futures, options and swap contracts) and exchange traded funds related to gold or other special minerals (“Gold ETFs”). The Subsidiary is subject to the same investment restrictions and guidelines, and follows the same compliance policies and procedures, as the Fund.
The financial statements have been consolidated and include accounts of the Fund and the Subsidiary. Accordingly, all inter-company transactions and balances have been eliminated. At period end, the Fund owned 182,275 shares with net assets of $15,946,644 in the Subsidiary.
Other financial information at period end:
| Total market value of investments |
$ | 8,205,751 | ||
| Net assets |
$ | 15,946,644 | ||
| Net income (loss) |
$ | 142,380 | ||
| Net realized gain (loss) |
$ | 34,779 | ||
| Net change in unrealized appreciation/depreciation |
$ | 171,637 |
Foreign Currency Translation. The Fund’s accounting records are maintained in U.S. dollars. The values of securities denominated in foreign currencies and amounts related to the purchase and sale of foreign securities and foreign investment income are translated into U.S. dollars as of the close of the New York Stock Exchange (the “Exchange”), normally 4:00 P.M. Eastern time, on each day the Exchange is open for trading. Foreign exchange rates may be valued primarily using a reliable bank, dealer or service authorized by the Board of Trustees.
Reported net realized gains and losses from foreign currency transactions arise from sales of portfolio securities, sales and maturities of short-term securities, sales of foreign currencies, exchange rate fluctuations between the trade and settlement dates on securities transactions, and the difference between the amounts of dividends, interest, and foreign withholding taxes recorded on the Fund’s books and the U.S. dollar equivalent of the amounts actually received or paid. Net unrealized appreciation and depreciation on the translation of assets and liabilities denominated in foreign currencies arise from changes in the values of assets and liabilities, including investments in securities at fiscal period end, resulting from changes in exchange rates.
The effect of changes in foreign currency exchange rates on investments is separately identified from the fluctuations arising from changes in market values of securities held and reported with all other foreign currency gains and losses in the Fund’s Consolidated Statement of Operations.
Allocation of Income, Expenses, Gains and Losses. Income, expenses (other than those attributable to a specific class), gains and losses are allocated on a daily basis to each class of shares based upon the relative proportion of net assets represented by such class. Operating expenses directly attributable to a specific class are charged against the operations of that class.
Dividends and Distributions to Shareholders. Dividends and distributions to shareholders, which are determined in accordance with income tax regulations and may differ from U.S. GAAP, are recorded on the ex-dividend date. Income and capital gain distributions, if any, are declared and paid annually or at other times as deemed necessary by the Manager.
The tax character of distributions is determined as of the Fund’s fiscal year end. Therefore, a portion of the Fund’s distributions made to shareholders prior to the Fund’s fiscal year end may ultimately be categorized as a tax return of capital.
38 OPPENHEIMER GLOBAL STRATEGIC INCOME FUND/VA
2. Significant Accounting Policies (Continued)
Investment Income. Dividend income is recorded on the ex-dividend date or upon ex-dividend notification in the case of certain foreign dividends where the ex-dividend date may have passed. Non-cash dividends included in dividend income, if any, are recorded at the fair market value of the securities received. Interest income is recognized on an accrual basis. Discount and premium, which are included in interest income on the Consolidated Statement of Operations, are amortized or accreted daily.
Custodian Fees. “Custodian fees and expenses” in the Consolidated Statement of Operations may include interest expense incurred by the Fund on any cash overdrafts of its custodian account during the period. Such cash overdrafts may result from the effects of failed trades in portfolio securities and from cash outflows resulting from unanticipated shareholder redemption activity. The Fund pays interest to its custodian on such cash overdrafts, to the extent they are not offset by positive cash balances maintained by the Fund, at a rate equal to the Federal Funds Rate plus 0.50%. The “Reduction to custodian expenses” line item, if applicable, represents earnings on cash balances maintained by the Fund during the period. Such interest expense and other custodian fees may be paid with these earnings.
Security Transactions. Security transactions are recorded on the trade date. Realized gains and losses on securities sold are determined on the basis of identified cost.
Indemnifications. The Fund’s organizational documents provide current and former Trustees and officers with a limited indemnification against liabilities arising in connection with the performance of their duties to the Fund. In the normal course of business, the Fund may also enter into contracts that provide general indemnifications. The Fund’s maximum exposure under these arrangements is unknown as this would be dependent on future claims that may be made against the Fund. The risk of material loss from such claims is considered remote.
Federal Taxes. The Fund intends to comply with provisions of the Internal Revenue Code applicable to regulated investment companies and to distribute substantially all of its investment company taxable income to shareholders. Therefore, no federal income or excise tax provision is required. The Fund files income tax returns in U.S. federal and applicable state jurisdictions. The statute of limitations on the Fund’s tax return filings generally remains open for the three preceding fiscal reporting period ends. The Fund has analyzed its tax positions for the fiscal year ended December 31, 2015, including open tax years, and does not believe there are any uncertain tax positions requiring recognition in the Fund’s financial statements.
Subchapter M requires, among other things, that at least 90% of the Fund’s gross income be derived from securities or derived with respect to its business of investing in securities (typically referred to as “qualifying income”). Income from commodity-linked derivatives may not be treated as “qualifying income” for purposes of the 90% gross income requirement. The Internal Revenue Service (IRS) has previously issued a number of private letter rulings which conclude that income derived from commodity index-linked notes and investments in a wholly-owned subsidiary will be “qualifying income.” As a result, the Fund will gain exposure to commodities through commodity-linked notes and its wholly-owned subsidiary.
The IRS has suspended the granting of private letter rulings pending further review. As a result, there can be no assurance that the IRS will not change its position with respect to commodity-linked notes and wholly-owned subsidiaries. In addition, future legislation and guidance from the Treasury and the IRS may adversely affect the fund’s ability to gain exposure to commodities through commodity-linked notes and its wholly-owned subsidiary.
The Fund is required to include in income for federal income tax purposes all of the subsidiary’s net income and gains whether or not such income is distributed by the subsidiary. Net income and gains from the subsidiary are generally treated as ordinary income by the Fund, regardless of the character of the subsidiary’s underlying income. Net losses from the subsidiary do not pass through to the Fund for federal income tax purposes.
During the fiscal year ended December 31, 2015, the Fund did not utilize any capital loss carryforward to offset capital gains realized in that fiscal year. Details of the fiscal year ended December 31, 2015 capital loss carryforwards are included in the table below. Capital loss carryforwards with no expiration, if any, must be utilized prior to those with expiration dates. Capital losses with no expiration will be carried forward to future years if not offset by gains.
| Expiring | ||||
|
|
||||
| 2016 |
$ | 3,339,490 | ||
| No expiration |
108,831,615 | |||
|
|
|
|||
| Total |
$ | 112,171,105 | ||
|
|
|
|||
At period end, it is estimated that the capital loss carryforwards would be $3,339,490 expiring by 2016 and $176,691,706, which will not expire. The estimated capital loss carryforward represents the carryforward as of the end of the last fiscal year, increased or decreased by capital losses or gains realized in the first six months of the current fiscal year. During the reporting period, it is estimated that the Fund will not utilize any capital loss carryforward to offset realized capital gains.
Net investment income (loss) and net realized gain (loss) may differ for financial statement and tax purposes. The character of dividends and distributions made during the fiscal year from net investment income or net realized gains are determined in accordance with federal income tax requirements, which may differ from the character of net investment income or net realized gains presented in those financial statements in accordance with U.S. GAAP. Also, due to timing of dividends and distributions, the fiscal year in which amounts are distributed may differ from the fiscal year in which the income or net realized gain was recorded by the Fund.
The aggregate cost of securities and other investments and the composition of unrealized appreciation and depreciation of securities and other investments for federal income tax purposes at period end are noted in the following table. The primary difference between book and tax appreciation
39 OPPENHEIMER GLOBAL STRATEGIC INCOME FUND/VA
NOTES TO CONSOLIDATED FINANCIAL STATEMENTS Unaudited / Continued
2. Significant Accounting Policies (Continued)
or depreciation of securities and other investments, if applicable, is attributable to the tax deferral of losses or tax realization of financial statement unrealized gain or loss.
| Federal tax cost of securities |
$ | 1,869,221,428 | ||
| Federal tax cost of other investments |
21,077,861 | |||
|
|
|
|||
| Total federal tax cost |
$ | 1,890,299,289 | ||
|
|
|
|||
| Gross unrealized appreciation |
$ | 51,037,808 | ||
| Gross unrealized depreciation |
(80,266,235) | |||
|
|
|
|||
| Net unrealized depreciation | $ | (29,228,427) | ||
|
|
|
Use of Estimates. The preparation of financial statements in conformity with U.S. GAAP requires management to make estimates and assumptions that affect the reported amounts of assets and liabilities and disclosure of contingent assets and liabilities at the date of the financial statements and the reported amounts of increases and decreases in net assets from operations during the reporting period. Actual results could differ from those estimates.
3. Securities Valuation
The Fund calculates the net asset value of its shares as of 4:00 P.M. Eastern time, on each day the New York Stock Exchange (the “Exchange”) is open for trading, except in the case of a scheduled early closing of the Exchange, in which case the Fund will calculate net asset value of the shares as of the scheduled early closing time of the Exchange.
The Fund’s Board has adopted procedures for the valuation of the Fund’s securities and has delegated the day-to-day responsibility for valuation determinations under those procedures to the Manager. The Manager has established a Valuation Committee which is responsible for determining a “fair valuation” for any security for which market quotations are not “readily available.” The Valuation Committee’s fair valuation determinations are subject to review, approval and ratification by the Fund’s Board at its next regularly scheduled meeting covering the calendar quarter in which the fair valuation was determined.
Valuation Methods and Inputs
Securities are valued using unadjusted quoted market prices, when available, as supplied primarily by third party pricing services or dealers.
The following methodologies are used to determine the market value or the fair value of the types of securities described below:
Securities traded on a registered U.S. securities exchange (including exchange-traded derivatives other than futures and futures options) are valued based on the last sale price of the security reported on the principal exchange on which it is traded, prior to the time when the Fund’s assets are valued. In the absence of a sale, the security is valued at the mean between the bid and asked price on the principal exchange or, if not available from the principal exchange, obtained from two dealers. If bid and asked prices are not available from either the exchange or two dealers, the security is valued by using one of the following methodologies (listed in order of priority): (1) a bid from the principal exchange, (2) the mean between the bid and asked price as provided by a single dealer, or (3) a bid from a single dealer. A security of a foreign issuer traded on a foreign exchange, but not listed on a registered U.S. securities exchange, is valued based on the last sale price on the principal exchange on which the security is traded, as identified by the third party pricing service used by the Manager, prior to the time when the Fund’s assets are valued. If the last sale price is unavailable, the security is valued at the most recent official closing price on the principal exchange on which it is traded. If the last sales price or official closing price for a foreign security is not available, the security is valued at the mean between the bid and asked price per the exchange or, if not available from the exchange, obtained from two dealers. If bid and asked prices are not available from either the exchange or two dealers, the security is valued by using one of the following methodologies (listed in order of priority): (1) a bid from the exchange, (2) the mean between the bid and asked price as provided by a single dealer, or (3) a bid from a single dealer.
Shares of a registered investment company that are not traded on an exchange are valued at that investment company’s net asset value per share.
Corporate and government debt securities (of U.S. or foreign issuers) and municipal debt securities, event-linked bonds, loans, mortgage-backed securities, collateralized mortgage obligations, and asset-backed securities are valued at the mean between the “bid” and “asked” prices utilizing evaluated prices obtained from third party pricing services or broker-dealers who may use matrix pricing methods to determine the evaluated prices.
Short-term money market type debt securities with a remaining maturity of sixty days or less are valued at cost adjusted by the amortization of discount or premium to maturity (amortized cost), which approximates market value. Short-term debt securities with a remaining maturity in excess of sixty days are valued at the mean between the “bid” and “asked” prices utilizing evaluated prices obtained from third party pricing services or broker-dealers.
Structured securities, swaps, swaptions, and other over-the-counter derivatives are valued utilizing evaluated prices obtained from third party pricing services or broker-dealers.
Forward foreign currency exchange contracts are valued utilizing current and forward currency rates obtained from third party pricing services. When the settlement date of a contract is an interim date for which a quotation is not available, interpolated values are derived using the nearest dated forward currency rate.
Futures contracts and futures options traded on a commodities or futures exchange will be valued at the final settlement price or official closing price on the principal exchange as reported by such principal exchange at its trading session ending at, or most recently prior to, the time when the Fund’s assets are valued.
A description of the standard inputs that may generally be considered by the third party pricing vendors in determining their evaluated prices is provided
40 OPPENHEIMER GLOBAL STRATEGIC INCOME FUND/VA
3. Securities Valuation (Continued)
below.
| Security Type |
Standard inputs generally considered by third-party pricing vendors | |
|
| ||
| Corporate debt, government debt, municipal, mortgage- backed and asset-backed securities | Reported trade data, broker-dealer price quotations, benchmark yields, issuer spreads on comparable securities, the credit quality, yield, maturity, and other appropriate factors. | |
|
| ||
| Loans | Information obtained from market participants regarding reported trade data and broker-dealer price quotations. | |
|
| ||
| Event-linked bonds | Information obtained from market participants regarding reported trade data and broker-dealer price quotations. | |
|
| ||
| Structured securities | Relevant market information such as the price of underlying financial instruments, stock market indices, foreign currencies, interest rate spreads, commodities, or the occurrence of other specific events. | |
|
| ||
| Swaps | Relevant market information, including underlying reference assets such as credit spreads, credit event probabilities, index values, individual security values, forward interest rates, variable interest rates, volatility measures, and forward currency rates. | |
If a market value or price cannot be determined for a security using the methodologies described above, or if, in the “good faith” opinion of the Manager, the market value or price obtained does not constitute a “readily available market quotation,” or a significant event has occurred that would materially affect the value of the security, the security is fair valued either (i) by a standardized fair valuation methodology applicable to the security type or the significant event as previously approved by the Valuation Committee and the Fund’s Board or (ii) as determined in good faith by the Manager’s Valuation Committee. The Valuation Committee considers all relevant facts that are reasonably available, through either public information or information available to the Manager, when determining the fair value of a security. Fair value determinations by the Manager are subject to review, approval and ratification by the Fund’s Board at its next regularly scheduled meeting covering the calendar quarter in which the fair valuation was determined. Those fair valuation standardized methodologies include, but are not limited to, valuing securities at the last sale price or initially at cost and subsequently adjusting the value based on: changes in company specific fundamentals, changes in an appropriate securities index, or changes in the value of similar securities which may be further adjusted for any discounts related to security-specific resale restrictions. When possible, such methodologies use observable market inputs such as unadjusted quoted prices of similar securities, observable interest rates, currency rates and yield curves. The methodologies used for valuing securities are not necessarily an indication of the risks associated with investing in those securities nor can it be assured that the Fund can obtain the fair value assigned to a security if it were to sell the security.
To assess the continuing appropriateness of security valuations, the Manager, or its third party service provider who is subject to oversight by the Manager, regularly compares prior day prices, prices on comparable securities, and sale prices to the current day prices and challenges those prices exceeding certain tolerance levels with the third party pricing service or broker source. For those securities valued by fair valuations, whether through a standardized fair valuation methodology or a fair valuation determination, the Valuation Committee reviews and affirms the reasonableness of the valuations based on such methodologies and fair valuation determinations on a regular basis after considering all relevant information that is reasonably available.
Classifications
Each investment asset or liability of the Fund is assigned a level at measurement date based on the significance and source of the inputs to its valuation. Various data inputs are used in determining the value of each of the Fund’s investments as of the reporting period end. These data inputs are categorized in the following hierarchy under applicable financial accounting standards:
1) Level 1-unadjusted quoted prices in active markets for identical assets or liabilities (including securities actively traded on a securities exchange)
2) Level 2-inputs other than unadjusted quoted prices that are observable for the asset or liability (such as unadjusted quoted prices for similar assets and market corroborated inputs such as interest rates, prepayment speeds, credit risks, etc.)
3) Level 3-significant unobservable inputs (including the Manager’s own judgments about assumptions that market participants would use in pricing the asset or liability).
The inputs used for valuing securities are not necessarily an indication of the risks associated with investing in those securities.
The Fund classifies each of its investments in investment companies which are publicly offered as Level 1. Investment companies that are not publicly offered are measured using net asset value as a practical expedient, and are not classified in the fair value hierarchy.
The table below categorizes amounts that are included in the Fund’s Consolidated Statement of Assets and Liabilities at period end based on valuation input level:
| Level 1— Unadjusted Quoted Prices |
Level 2— Other Significant Observable Inputs |
Level 3— Significant Unobservable Inputs |
Value | |||||||||||||
|
|
||||||||||||||||
| Assets Table | ||||||||||||||||
| Investments, at Value: | ||||||||||||||||
| Asset-Backed Securities | $ | — | $ | 103,436,721 | $ | 16,634,701 | $ | 120,071,422 | ||||||||
| Mortgage-Backed Obligations | — | 316,656,466 | — | 316,656,466 | ||||||||||||
41 OPPENHEIMER GLOBAL STRATEGIC INCOME FUND/VA
NOTES TO CONSOLIDATED FINANCIAL STATEMENTS Unaudited / Continued
3. Securities Valuation (Continued)
| Level 1— Unadjusted Quoted Prices |
Level 2— Other Significant Observable Inputs |
Level 3— Significant Unobservable Inputs |
Value | |||||||||||||
| Investments, at Value: (Continued) | ||||||||||||||||
| U.S. Government Obligations | $ | — | $ | 32,041,404 | $ | — | $ | 32,041,404 | ||||||||
| Foreign Government Obligations | — | 104,256,690 | — | 104,256,690 | ||||||||||||
| Corporate Loans | — | 3,235,301 | — | 3,235,301 | ||||||||||||
| Corporate Bonds and Notes | — | 850,214,210 | 27,800 | 850,242,010 | ||||||||||||
| Common Stocks | 4,227,190 | — | 15 | 4,227,205 | ||||||||||||
| Rights, Warrants and Certificates | — | — | — | — | ||||||||||||
| Structured Securities | — | 6,380,049 | 2,577,009 | 8,957,058 | ||||||||||||
| Short-Term Note | — | 25,985,804 | — | 25,985,804 | ||||||||||||
| Investment Companies | 146,469,979 | — | — | 146,469,979 | ||||||||||||
| Over-the-Counter Options Purchased | — | 2,012,212 | — | 2,012,212 | ||||||||||||
| Over-the-Counter Interest Rate Swaption Purchased | — | 44,397 | — | 44,397 | ||||||||||||
|
|
|
|||||||||||||||
| Total Investments, at Value | 150,697,169 | 1,444,263,254 | 19,239,525 | 1,614,199,948 | ||||||||||||
| Other Financial Instruments: | ||||||||||||||||
| Swaps, at value | — | 600,482 | — | 600,482 | ||||||||||||
| Centrally cleared swaps, at value | — | 50,751 | — | 50,751 | ||||||||||||
| Futures contracts | 3,189,752 | — | — | 3,189,752 | ||||||||||||
| Forward currency exchange contracts | — | 12,126,589 | — | 12,126,589 | ||||||||||||
|
|
|
|||||||||||||||
| Total Assets excluding investment companies valued using practical expedient | $ | 153,886,921 | $ | 1,457,041,076 | $ | 19,239,525 | 1,630,167,522 | |||||||||
|
|
|
|||||||||||||||
| Investment companies valued using practical expedient | 218,703,632 | |||||||||||||||
|
|
|
|||||||||||||||
| Total Assets | $ | 1,848,871,154 | ||||||||||||||
|
|
|
|||||||||||||||
| Liabilities Table | ||||||||||||||||
| Other Financial Instruments: | ||||||||||||||||
| Swaps, at value | $ | — | $ | (941,764) | $ | — | $ | (941,764) | ||||||||
| Centrally cleared swaps, at value | — | (354,931) | — | (354,931) | ||||||||||||
| Options written, at value | — | (1,338,854) | — | (1,338,854) | ||||||||||||
| Futures contracts | (353,576) | — | — | (353,576) | ||||||||||||
| Forward currency exchange contracts | — | (7,722,713) | — | (7,722,713) | ||||||||||||
|
|
|
|||||||||||||||
| Total Liabilities | $ | (353,576) | $ | (10,358,262) | $ | — | $ | (10,711,838) | ||||||||
|
|
|
|||||||||||||||
Forward currency exchange contracts and futures contracts, if any, are reported at their unrealized appreciation/depreciation at measurement date, which represents the change in the contract’s value from trade date. All additional assets and liabilities included in the above table are reported at their market value at measurement date.
The following is a reconciliation of assets in which significant unobservable inputs (level 3) were used in determining fair value:
| Value as of December 31, 2015 |
Realized gain (loss) | Change in unrealized appreciation/ depreciation |
Accretion/ (amortization) of premium/ discounta |
|||||||||||||||||
|
|
||||||||||||||||||||
| Assets Table | ||||||||||||||||||||
| Investments, at Value: | ||||||||||||||||||||
| Asset-Backed Securities |
$ | 16,991,566 | $ | — | $ | (417,053) | $ | 60,188 | ||||||||||||
| Mortgage-Backer Obligations |
16,686 | (48,004) | 49,339 | — | ||||||||||||||||
| Corporate Loans |
7,452 | (1,440,560) | 1,433,108 | — | ||||||||||||||||
| Corporate Bonds and Notes |
29,997 | 1 | (2,177) | (20) | ||||||||||||||||
| Common Stocks |
1,255,935 | (2,111,954) | 2,061,624 | — | ||||||||||||||||
| Structured Securities |
4,439,555 | (146,101) | (587,883) | 24,926 | ||||||||||||||||
|
|
|
|||||||||||||||||||
| Total Assets |
$ | 22,741,191 | $ | (3,746,618) | $ | 2,536,958 | $ | 85,094 | ||||||||||||
|
|
|
|||||||||||||||||||
| a. Included in net investment income. | ||||||||||||||||||||
| Purchases | Sales | Transfers into Level 3 |
Transfers out of Level 3 |
Value as of June 30, 2016 |
||||||||||||||||
|
|
||||||||||||||||||||
| Assets Table | ||||||||||||||||||||
| Investments, at Value: | ||||||||||||||||||||
| Asset-Backed Securities |
$ | — | $ | — | $ | — | $ | — | $ | 16,634,701 | ||||||||||
| Mortgage-Backed Obligations |
— | (18,021) | — | — | — | |||||||||||||||
| Corporate Loans |
— | — | — | — | — | |||||||||||||||
| Corporate Bonds and Notes |
— | (1) | — | — | 27,800 | |||||||||||||||
| Common Stocks |
— | (1,205,590) | — | — | 15 | |||||||||||||||
| Structured Securities |
— | (1,153,488) | — | — | 2,577,009 | |||||||||||||||
|
|
|
|||||||||||||||||||
| Total Assets |
$ | — | $ | (2,377,100) | $ | — | $ | — | $ | 19,239,525 | ||||||||||
|
|
|
|||||||||||||||||||
The total change in unrealized appreciation/depreciation included in the Consolidated Statement of Operations attributable to Level 3 investments still held at period end:
42 OPPENHEIMER GLOBAL STRATEGIC INCOME FUND/VA
3. Securities Valuation (Continued)
| Change in unrealized appreciation/ depreciation |
||||
|
|
||||
| Assets Table |
||||
| Investments, at Value |
||||
| Asset-Backed Securities |
$ | (417,053) | ||
| Mortgaged-Backed Obligations |
||||
| Corporate Bonds and Notes |
(2,176) | |||
| Structured Securities |
(587,883) | |||
|
|
|
|||
| Total |
$ | (1,007,112) | ||
|
|
|
|||
The following table summarizes the valuation techniques and significant unobservable inputs used in determining fair value measurements for those investments classified as Level 3 at period end:
| Value as of June 30, 2016 |
Valuation Technique |
Unobservable Input |
Range of Unobservable Inputs |
Unobservable Input Used |
||||||||||||||||||||
| Assets Table | ||||||||||||||||||||||||
| Investments, at Value: | ||||||||||||||||||||||||
| Asset-Backed Securities |
$ | 16,634,701 | Broker quotes | N/A | N/A | N/A | (a) | |||||||||||||||||
| Corporate Bonds and Notes |
27,800 | Broker quotes | N/A | N/A | N/A | (a) | ||||||||||||||||||
| Estimated recovery | ||||||||||||||||||||||||
| Common Stocks |
15 | proceeds | Nominal Value | N/A | $0.01/share | (b) | ||||||||||||||||||
| Structured Securities |
2,577,009 | Broker quotes | N/A | N/A | N/A | (a) | ||||||||||||||||||
|
|
|
|||||||||||||||||||||||
| Total |
$ | 19,239,525 | ||||||||||||||||||||||
|
|
|
|||||||||||||||||||||||
(a) Securities classified as Level 3 whose unadjusted values were provided by a pricing service or broker-dealer for which such inputs are unobservable. The Manager periodically reviews pricing vendor and broker methodologies and inputs to confirm they are determined using unobservable inputs and have been appropriately classified. Such securities’ fair valuations could change significantly based on changes in unobservable inputs used by the pricing service or broker.
(b) The Fund fair values certain common stocks held at a nominal value to reflect the low probability of receipt of future payments to be received as a result of a merger. The Manager monitors such investments for additional market information or the occurrence of a significant event which would warrant a re-evaluation of the security’s fair valuation. A significant increase (decrease) in the future distribution amount, or a significant increase (decrease) to the probability of payment rate, will result in a significant increase (decrease) to the fair value of the investment.
4. Investments and Risks
Risks of Foreign Investing. The Fund may invest in foreign securities which are subject to special risks. Securities traded in foreign markets may be less liquid and more volatile than those traded in U.S. markets. Foreign issuers are usually not subject to the same accounting and disclosure requirements that U.S. companies are subject to, which may make it difficult for the Fund to evaluate a foreign company’s operations or financial condition. A change in the value of a foreign currency against the U.S. dollar will result in a change in the U.S. dollar value of investments denominated in that foreign currency and in the value of any income or distributions the Fund may receive on those investments. The value of foreign investments may be affected by exchange control regulations, foreign taxes, higher transaction and other costs, delays in the settlement of transactions, changes in economic or monetary policy in the United States or abroad, expropriation or nationalization of a company’s assets, or other political and economic factors. In addition, due to the inter-relationship of global economies and financial markets, changes in political and economic factors in one country or region could adversely affect conditions in another country or region. Investments in foreign securities may also expose the Fund to time-zone arbitrage risk. Foreign securities may trade on weekends or other days when the Fund does not price its shares. At times, the Fund may emphasize investments in a particular country or region and may be subject to greater risks from adverse events that occur in that country or region. Foreign securities and foreign currencies held in foreign banks and securities depositories may be subject to limited or no regulatory oversight.
Investments in Affiliated Funds. The Fund is permitted to invest in other mutual funds advised by the Manager (“Affiliated Funds”). Affiliated Funds are open-end management investment companies registered under the 1940 Act, as amended. The Manager is the investment adviser of, and the Sub-Adviser provides investment and related advisory services to, the Affiliated Funds. When applicable, the Fund’s investments in Affiliated Funds are included in the Consolidated Statement of Investments. Shares of Affiliated Funds are valued at their net asset value per share. As a shareholder, the Fund is subject to its proportional share of the Affiliated Funds’ expenses, including their management fee. The Manager will waive fees and/or reimburse Fund expenses in an amount equal to the indirect management fees incurred through the Fund’s investment in the Affiliated Funds.
Each of the Affiliated Funds in which the Fund invests has its own investment risks, and those risks can affect the value of the Fund’s investments and therefore the value of the Fund’s shares. To the extent that the Fund invests more of its assets in one Affiliated Fund than in another, the Fund will have greater exposure to the risks of that Affiliated Fund.
Investment in Oppenheimer Institutional Money Market Fund. The Fund is permitted to invest daily available cash balances in a money market Affiliated Fund. The Fund may invest the available cash in Class E shares of Oppenheimer Institutional Money Market Fund (“IMMF”) to seek current income while preserving liquidity or for defensive purposes. IMMF is regulated as a money market fund under the Investment Company Act of 1940, as amended.
43 OPPENHEIMER GLOBAL STRATEGIC INCOME FUND/VA
NOTES TO CONSOLIDATED FINANCIAL STATEMENTS Unaudited / Continued
4. Investments and Risks (Continued)
Investment in Oppenheimer Master Funds. The Fund is permitted to invest in entities sponsored and/or advised by the Manager or an affiliate. Certain of these entities in which the Fund invests are mutual funds registered under the Investment Company Act of 1940 that expect to be treated as partnerships for tax purposes, specifically Oppenheimer Master Loan Fund, LLC (“Master Loan”) and Oppenheimer Master Event-Linked Bond Fund, LLC (“Master Event-Linked Bond”) (the “Master Funds”). Each Master Fund has its own investment risks, and those risks can affect the value of the Fund’s investments and therefore the value of the Fund’s shares. To the extent that the Fund invests more of its assets in one Master Fund than in another, the Fund will have greater exposure to the risks of that Master Fund.
The investment objective of Master Loan is to seek income. The investment objective of Master Event-Linked Bond is to seek total return. The Fund’s investments in the Master Funds are included in the Consolidated Statement of Investments. The Fund recognizes income and gain/(loss) on its investments in each Master Fund according to its allocated pro-rata share, based on its relative proportion of total outstanding Master Fund shares held, of the total net income earned and the net gain/(loss) realized on investments sold by the Master Funds. As a shareholder, the Fund is subject to its proportional share of the Master Funds’ expenses, including their management fee. The Manager will waive fees and/or reimburse Fund expenses in an amount equal to the indirect management fees incurred through the Fund’s investment in the Master Funds. The Fund owns 13.2% of Master Loan and 15.4% of Master Event-Linked Bond at period end.
Structured Securities. The Fund invests in structured securities whose market values, interest rates and/or redemption prices are linked to the performance of underlying foreign currencies, interest rate spreads, stock market indices, prices of individual securities, commodities or other financial instruments or the occurrence of other specific events. The structured securities are often leveraged, increasing the volatility of each note’s market value relative to the change in the underlying linked financial element or event. Fluctuations in value of these securities are recorded as unrealized gains and losses in the accompanying Consolidated Statement of Operations. The Fund records a realized gain or loss when a structured security is sold or matures.
Loans. The Fund invests in loans made to U.S. and foreign borrowers that are corporations, partnerships or other business entities. The Fund will do so directly as an original lender or by assignment or indirectly through participation agreements or certain derivative instruments. While many of these loans will be collateralized, the Fund can also invest in uncollateralized loans. Loans are often issued in connection with recapitalizations, acquisitions, leveraged buyouts, and refinancing of borrowers. The loans often pay interest at rates that float above (or are adjusted periodically based on) a benchmark that reflects current interest rates although the Fund can also invest in loans with fixed interest rates.
Securities on a When-Issued or Delayed Delivery Basis. The Fund may purchase securities on a “when-issued” basis, and may purchase or sell securities on a “delayed delivery” basis. “When-issued” or “delayed delivery” refers to securities whose terms and indenture are available and for which a market exists, but which are not available for immediate delivery. Delivery and payment for securities that have been purchased by the Fund on a when-issued basis normally takes place within six months and possibly as long as two years or more after the trade date. During this period, such securities do not earn interest, are subject to market fluctuation and may increase or decrease in value prior to their delivery. The purchase of securities on a when-issued basis may increase the volatility of the Fund’s net asset value to the extent the Fund executes such transactions while remaining substantially fully invested. When the Fund engages in when-issued or delayed delivery transactions, it relies on the buyer or seller, as the case may be, to complete the transaction. Their failure to do so may cause the Fund to lose the opportunity to obtain or dispose of the security at a price and yield it considers advantageous. The Fund may also sell securities that it purchased on a when-issued basis or forward commitment prior to settlement of the original purchase.
At period end, the Fund had purchased securities issued on a when-issued or delayed delivery basis and sold securities issued on a delayed delivery basis as follows:
| When-Issued or Delayed Delivery Basis Transactions |
||||
|
|
||||
| Purchased securities |
$139,481,710 | |||
| Sold securities |
24,491,154 | |||
The Fund may enter into “forward roll” transactions with respect to mortgage-related securities. In this type of transaction, the Fund sells a mortgage-related security to a buyer and simultaneously agrees to repurchase a similar security (same type, coupon and maturity) at a later date at a set price. During the period between the sale and the repurchase, the Fund will not be entitled to receive interest and principal payments on the securities that have been sold. The Fund records the incremental difference between the forward purchase and sale of each forward roll as realized gain (loss) on investments or as fee income in the case of such transactions that have an associated fee in lieu of a difference in the forward purchase and sale price.
Forward roll transactions may be deemed to entail embedded leverage since the Fund purchases mortgage-related securities with extended settlement dates rather than paying for the securities under a normal settlement cycle. This embedded leverage increases the Fund’s market value of investments relative to its net assets which can incrementally increase the volatility of the Fund’s performance. Forward roll transactions can be replicated over multiple settlement periods.
Risks of entering into forward roll transactions include the potential inability of the counterparty to meet the terms of the agreement; the potential of the Fund to receive inferior securities at redelivery as compared to the securities sold to the counterparty; and counterparty credit risk.
Restricted Securities. At period end, investments in securities included issues that are restricted. A restricted security may have a contractual
44 OPPENHEIMER GLOBAL STRATEGIC INCOME FUND/VA
4. Investments and Risks (Continued)
restriction on its resale and is valued under methods approved by the Board of Trustees as reflecting fair value. Securities that are restricted are marked with an applicable footnote on the Consolidated Statement of Investments. Restricted securities are reported on a schedule following the Consolidated Statement of Investments.
Equity Security Risk. Stocks and other equity securities fluctuate in price. The value of the Fund’s portfolio may be affected by changes in the equity markets generally. Equity markets may experience significant short-term volatility and may fall sharply at times. Different markets may behave differently from each other and U.S. equity markets may move in the opposite direction from one or more foreign stock markets. Adverse events in any part of the equity or fixed-income markets may have unexpected negative effects on other market segments.
The prices of individual equity securities generally do not all move in the same direction at the same time and a variety of factors can affect the price of a particular company’s securities. These factors may include, but are not limited to, poor earnings reports, a loss of customers, litigation against the company, general unfavorable performance of the company’s sector or industry, or changes in government regulations affecting the company or its industry.
Credit Risk. The Fund invests in high-yield, non-investment-grade bonds, which may be subject to a greater degree of credit risk. Credit risk relates to the ability of the issuer to meet interest or principal payments or both as they become due. The Fund may acquire securities that have missed an interest payment, and is not obligated to dispose of securities whose issuers or underlying obligors subsequently miss an interest payment.
Information concerning securities not accruing interest at period end is as follows:
| Cost |
$15,047,820 | |||
| Market Value |
$2,819,518 | |||
| Market Value as % of Net Assets |
0.16% |
Sovereign Debt Risk. The Fund invests in sovereign debt securities, which are subject to certain special risks. These risks include, but are not limited to, the risk that a governmental entity may delay or refuse, or otherwise be unable, to pay interest or repay the principal on its sovereign debt. There may also be no legal process for collecting sovereign debt that a government does not pay or bankruptcy proceedings through which all or part of such sovereign debt may be collected. In addition, a restructuring or default of sovereign debt may also cause additional impacts to the financial markets, such as downgrades to credit ratings, reduced liquidity and increased volatility, among others.
5. Market Risk Factors
The Fund’s investments in securities and/or financial derivatives may expose the Fund to various market risk factors:
Commodity Risk. Commodity risk relates to the change in value of commodities or commodity indexes as they relate to increases or decreases in the commodities market. Commodities are physical assets that have tangible properties. Examples of these types of assets are crude oil, heating oil, metals, livestock, and agricultural products.
Credit Risk. Credit risk relates to the ability of the issuer of debt to meet interest and principal payments, or both, as they come due. In general, lower-grade, higher-yield debt securities are subject to credit risk to a greater extent than lower-yield, higher-quality securities.
Equity Risk. Equity risk relates to the change in value of equity securities as they relate to increases or decreases in the general market.
Foreign Exchange Rate Risk. Foreign exchange rate risk relates to the change in the U.S. dollar value of a security held that is denominated in a foreign currency. The U.S. dollar value of a foreign currency denominated security will decrease as the dollar appreciates against the currency, while the U.S. dollar value will increase as the dollar depreciates against the currency.
Interest Rate Risk. Interest rate risk refers to the fluctuations in value of fixed-income securities resulting from the inverse relationship between price and yield. For example, an increase in general interest rates will tend to reduce the market value of already issued fixed-income investments, and a decline in general interest rates will tend to increase their value. In addition, debt securities with longer maturities, which tend to have higher yields, are subject to potentially greater fluctuations in value from changes in interest rates than obligations with shorter maturities.
Volatility Risk. Volatility risk refers to the magnitude of the movement, but not the direction of the movement, in a financial instrument’s price over a defined time period. Large increases or decreases in a financial instrument’s price over a relative time period typically indicate greater volatility risk, while small increases or decreases in its price typically indicate lower volatility risk.
6. Use of Derivatives
The Fund’s investment objective not only permits the Fund to purchase investment securities, it also allows the Fund to enter into various types of derivatives contracts, including, but not limited to, futures contracts, forward currency exchange contracts, credit default swaps, interest rate swaps, total return swaps, variance swaps and purchased and written options. In doing so, the Fund will employ strategies in differing combinations to permit it to increase, decrease, or change the level or types of exposure to market risk factors. These instruments may allow the Fund to pursue its objectives more quickly and efficiently than if it were to make direct purchases or sales of securities capable of effecting a similar response to market factors. Such contracts may be entered into through a bilateral over-the-counter (“OTC”) transaction, or through a securities or futures exchange and cleared through a clearinghouse.
Derivatives may have little or no initial cash investment relative to their market value exposure and therefore can produce significant gains or losses in excess of their cost due to unanticipated changes in the market risk factors and the overall market. This use of embedded leverage allows the Fund to
45 OPPENHEIMER GLOBAL STRATEGIC INCOME FUND/VA
NOTES TO CONSOLIDATED FINANCIAL STATEMENTS Unaudited / Continued
6. Use of Derivatives (Continued)
increase its market value exposure relative to its net assets and can substantially increase the volatility of the Fund’s performance. In instances where the Fund is using derivatives to decrease, or hedge, exposures to market risk factors for securities held by the Fund, there are also risks that those derivatives may not perform as expected resulting in losses for the combined or hedged positions. Some derivatives have the potential for unlimited loss, regardless of the size of the Fund’s initial investment.
Additional associated risks from investing in derivatives also exist and potentially could have significant effects on the valuation of the derivative and the Fund. Typically, the associated risks are not the risks that the Fund is attempting to increase or decrease exposure to, per its investment objectives, but are the additional risks from investing in derivatives. Examples of these associated risks are liquidity risk, which is the risk that the Fund will not be able to sell the derivative in the open market in a timely manner, and counterparty credit risk, which is the risk that the counterparty will not fulfill its obligation to the Fund.
The Fund’s actual exposures to these market risk factors and associated risks during the period are discussed in further detail, by derivative type, below.
Forward Currency Exchange Contracts
The Fund may enter into forward currency exchange contracts (“forward contracts”) for the purchase or sale of a foreign currency at a negotiated rate at a future date. Such contracts are traded in the OTC inter-bank currency dealer market.
Forward contracts are reported on a schedule following the Consolidated Statement of Investments. The unrealized appreciation (depreciation) is reported in the Consolidated Statement of Assets and Liabilities as a receivable (or payable) and in the Consolidated Statement of Operations within the change in unrealized appreciation (depreciation). At contract close, the difference between the original cost of the contract and the value at the close date is recorded as a realized gain (loss) in the Consolidated Statement of Operations.
The Fund has entered into forward contracts with the obligation to purchase specified foreign currencies in the future at a currently negotiated forward rate in order to take a positive investment perspective on the related currency. These forward contracts seek to increase exposure to foreign exchange rate risk.
The Fund has entered into forward contracts with the obligation to purchase specified foreign currencies in the future at a currently negotiated forward rate in order to decrease exposure to foreign exchange rate risk associated with foreign currency denominated securities held by the Fund.
The Fund has entered into forward contracts with the obligation to sell specified foreign currencies in the future at a currently negotiated forward rate in order to take a negative investment perspective on the related currency. These forward contracts seek to increase exposure to foreign exchange rate risk.
The Fund has entered into forward contracts with the obligation to sell specified foreign currencies in the future at a currently negotiated forward rate in order to decrease exposure to foreign exchange rate risk associated with foreign currency denominated securities held by the Fund.
During the reporting period, the Fund had daily average contract amounts on forward contracts to buy and sell of $397,823,603 and $582,320,611, respectively.
Additional associated risk to the Fund includes counterparty credit risk. Counterparty credit risk arises from the possibility that the counterparty to a forward contract will default and fail to perform its obligations to the Fund.
Futures Contracts
A futures contract is a commitment to buy or sell a specific amount of a commodity, financial instrument or currency at a negotiated price on a stipulated future date. The Fund may buy and sell futures contracts and may also buy or write put or call options on these futures contracts. Futures contracts and options thereon are generally entered into on a regulated futures exchange and cleared through a clearinghouse associated with the exchange.
Upon entering into a futures contract, the Fund is required to deposit either cash or securities (initial margin) in an amount equal to a certain percentage of the contract value in an account registered in the futures commission merchant’s name. Subsequent payments (variation margin) are paid to or from the futures commission merchant each day equal to the daily changes in the contract value. Such payments are recorded as unrealized gains and losses. Should the Fund fail to make requested variation margin payments, the futures commission merchant can gain access to the initial margin to satisfy the Fund’s payment obligations.
Futures contracts are reported on a schedule following the Consolidated Statement of Investments. Securities held by a futures commission merchant to cover initial margin requirements on open futures contracts are noted in the Consolidated Statement of Investments. Cash held by a futures commission merchant to cover initial margin requirements on open futures contracts and the receivable and/or payable for the daily mark to market for the variation margin are noted in the Consolidated Statement of Assets and Liabilities. The net change in unrealized appreciation and depreciation is reported in the Consolidated Statement of Operations. Realized gains (losses) are reported in the Consolidated Statement of Operations at the closing or expiration of futures contracts.
The Fund has purchased futures contracts on various bonds and notes to increase exposure to interest rate risk.
The Fund has sold futures contracts on various bonds and notes to decrease exposure to interest rate risk.
The Fund has sold futures contracts on various equity indexes to decrease exposure to equity risk.
During the reporting period, the Fund had an ending monthly average market value of $126,861,899 and $86,136,317 on futures contracts purchased and sold, respectively.
Additional associated risks of entering into futures contracts (and related options) include the possibility that there may be an illiquid market where the Fund is unable to liquidate the contract or enter into an offsetting position and, if used for hedging purposes, the risk that the price of the contract will correlate imperfectly with the prices of the Fund’s securities.
46 OPPENHEIMER GLOBAL STRATEGIC INCOME FUND/VA
6. Use of Derivatives (Continued)
Option Activity
The Fund may buy and sell put and call options, or write put and call options. When an option is written, the Fund receives a premium and becomes obligated to sell or purchase the underlying security, currency or other underlying financial instrument at a fixed price, upon exercise of the option.
Options can be traded through an exchange or through a privately negotiated arrangement with a dealer in an OTC transaction. Options traded through an exchange are generally cleared through a clearinghouse (such as The Options Clearing Corporation). The difference between the premium received or paid, and market value of the option, is recorded as unrealized appreciation or depreciation. The net change in unrealized appreciation or depreciation is reported in the Consolidated Statement of Operations. When an option is exercised, the cost of the security purchased or the proceeds of the security sale are adjusted by the amount of premium received or paid. Upon the expiration or closing of the option transaction, a gain or loss is reported in the Consolidated Statement of Operations.
The Fund has purchased call options on currencies to increase exposure to foreign exchange rate risk. A purchased call option becomes more valuable as the price of the underlying financial instrument appreciates relative to the strike price.
The Fund has purchased put options on currencies to decrease exposure to foreign exchange rate risk. A purchased put option becomes more valuable as the price of the underlying financial instrument depreciates relative to the strike price.
The Fund has purchased call options on treasury and/or euro futures to increase exposure to interest rate risk. A purchased call option becomes more valuable as the price of the underlying financial instrument appreciates relative to the strike price.
The Fund has purchased put options on treasury and/or euro futures to decrease exposure to interest rate risk. A purchased put option becomes more valuable as the price of the underlying financial instrument depreciates relative to the strike price.
The Fund has purchased call options on individual equity securities and/or equity indexes to increase exposure to equity risk. A purchased call option becomes more valuable as the price of the underlying financial instrument appreciates relative to the strike price.
During the reporting period, the Fund had an ending monthly average market value of $515,318 and $692,521 on purchased call options and purchased put options, respectively.
Options written, if any, are reported in a schedule following the Consolidated Statement of Investments and as a liability in the Consolidated Statement of Assets and Liabilities. Securities held in collateral accounts to cover potential obligations with respect to outstanding written options are noted in the Consolidated Statement of Investments.
The risk in writing a call option is that the market price of the security increases and if the option is exercised, the Fund must either purchase the security at a higher price for delivery or, if the Fund owns the underlying security, give up the opportunity for profit. The risk in writing a put option is that the Fund may incur a loss if the market price of the security decreases and the option is exercised. The risk in buying an option is that the Fund pays a premium whether or not the option is exercised. The Fund also has the additional risk that there may be an illiquid market where the Fund is unable to close the contract.
The Fund has written put options on currencies to increase exposure to foreign exchange rate risk. A written put option becomes more valuable as the price of the underlying financial instrument appreciates relative to the strike price.
The Fund has written call options on currencies to decrease exposure to foreign exchange rate risk. A written call option becomes more valuable as the price of the underlying financial instrument depreciates relative to the strike price.
The Fund has written put options on treasury and/or euro futures to increase exposure to interest rate risk. A written put option becomes more valuable as the price of the underlying financial instrument appreciates relative to the strike price.
The Fund has written call options on individual equity securities and/or equity indexes to decrease exposure to equity risk. A written call option becomes more valuable as the price of the underlying financial instrument depreciates relative to the strike price.
During the reporting period, the Fund had an ending monthly average market value of $386,929 and $473,607 on written call options and written put options, respectively.
Additional associated risks to the Fund include counterparty credit risk and liquidity risk.
Written option activity for the reporting period was as follows:
| Number of Contracts |
Amount of Premiums |
|||||||
| Options outstanding as of December 31, 2015 | 64,770,515,000 | $ | 2,061,032 | |||||
| Options written | 87,887,739,565 | 3,094,038 | ||||||
| Options closed or expired | (128,650,000) | (410,150) | ||||||
| Options exercised | (151,752,432,348) | (2,948,983) | ||||||
|
|
|
|||||||
| Options outstanding as of June 30, 2016 | 777,172,217 | $ | 1,795,937 | |||||
|
|
|
|||||||
Swap Contracts
The Fund may enter into swap contract agreements with a counterparty to exchange a series of cash flows based on either specified reference rates, the price or volatility of asset or non-asset references, or the occurrence of a credit event, over a specified period. Swaps can be executed in a bi-lateral privately negotiated arrangement with a dealer in an OTC transaction (“OTC swaps”) or executed on a regulated market. Certain swaps, regardless of the venue of their execution, are required to be cleared through a clearinghouse (“centrally cleared swaps”). Swap contracts may include interest rate, equity, debt, index, total return, credit default, currency, and volatility swaps.
47 OPPENHEIMER GLOBAL STRATEGIC INCOME FUND/VA
NOTES TO CONSOLIDATED FINANCIAL STATEMENTS Unaudited / Continued
6. Use of Derivatives (Continued)
Swap contracts are reported on a schedule following the Consolidated Statement of Investments. The values of centrally cleared swap and OTC swap contracts are aggregated by positive and negative values and disclosed separately on the Consolidated Statement of Assets and Liabilities. The unrealized appreciation (depreciation) related to the change in the valuation of the notional amount of the swap is combined with the accrued interest due to (owed by) the Fund, if any, at termination or settlement. The net change in this amount during the period is included on the Consolidated Statement of Operations. The Fund also records any periodic payments received from (paid to) the counterparty, including at termination, under such contracts as realized gain (loss) on the Consolidated Statement of Operations.
Swap contract agreements are exposed to the market risk factor of the specific underlying reference rate or asset. Swap contracts are typically more attractively priced compared to similar investments in related cash securities because they isolate the risk to one market risk factor and eliminate the other market risk factors. Investments in cash securities (for instance bonds) have exposure to multiple risk factors (credit and interest rate risk). Because swaps have embedded leverage, they can expose the Fund to substantial risk in the isolated market risk factor.
Credit Default Swap Contracts. A credit default swap is a contract that enables an investor to buy or sell protection against a defined-issuer credit event, such as the issuer’s failure to make timely payments of interest or principal on a debt security, bankruptcy or restructuring. The Fund may enter into credit default swaps either by buying or selling protection on a corporate issuer, sovereign issuer, or a basket or index of issuers (the “reference asset”).
The buyer of protection pays a periodic fee to the seller of protection based on the notional amount of the swap contract. The seller of protection agrees to compensate the buyer of protection for future potential losses as a result of a credit event on the reference asset. The contract effectively transfers the credit event risk of the reference asset from the buyer of protection to the seller of protection.
The ongoing value of the contract will fluctuate throughout the term of the contract based primarily on the credit risk of the reference asset. If the credit quality of the reference asset improves relative to the credit quality at contract initiation, the buyer of protection may have an unrealized loss greater than the anticipated periodic fee owed. This unrealized loss would be the result of current credit protection being cheaper than the cost of credit protection at contract initiation. If the buyer elects to terminate the contract prior to its maturity, and there has been no credit event, this unrealized loss will become realized. If the contract is held to maturity, and there has been no credit event, the realized loss will be equal to the periodic fee paid over the life of the contract.
If there is a credit event, the buyer of protection can exercise its rights under the contract and receive a payment from the seller of protection equal to the notional amount of the swap less the market value of specified debt securities issued by the reference asset. Upon exercise of the contract the difference between such value and the notional amount is recorded as realized gain (loss) and is included on the Consolidated Statement of Operations.
The Fund has sold credit protection through credit default swaps to increase exposure to the credit risk of individual issuers and/or indexes of issuers that are either unavailable or considered to be less attractive in the bond market.
The Fund has purchased credit protection through credit default swaps to decrease exposure to the credit risk of individual issuers and/or indexes of issuers.
The Fund has engaged in spread curve trades by simultaneously purchasing and selling protection through credit default swaps referenced to the same reference asset but with different maturities. Spread curve trades attempt to gain exposure to credit risk on a forward basis by realizing gains on the expected differences in spreads.
For the reporting period, the Fund had ending monthly average notional amounts of $17,714,455 and $19,234,473 on credit default swaps to buy protection and credit default swaps to sell protection, respectively.
Additional associated risks to the Fund include counterparty credit risk and liquidity risk.
Currency Swap Contracts. A currency swap contract is an agreement between counterparties to exchange different currencies at contract inception that are equivalent to a notional value. The exchange at contract inception is made at the current spot rate. The contract also includes an agreement to reverse the exchange of the same notional values of those currencies at contract termination. The re-exchange at contract termination may take place at the same exchange rate, a specified rate or the then current spot rate. Certain currency swap contracts provide for exchanging the currencies only at contract termination and can provide for only a net payment in the settlement currency, typically USD. A currency swap contract may also include the exchange of periodic payments, between the counterparties, that are based on interest rates available in the respective currencies at contract inception. Other currency swap contracts may not provide for exchanging the different currencies at all, and only for exchanging interest cash flows based on the notional value in the contract.
The Fund has entered into currency swap contracts with the obligation to pay an interest rate on the dollar notional amount and receive an interest rate on the various foreign currency notional amounts. These currency swap contracts increase exposure to, or decrease exposure away from, foreign exchange and interest rate risk.
For the reporting period, the Fund had ending monthly average notional amounts of $3,841,011 on currency swaps which receive a fixed rate. Additional associated risks to the Fund include counterparty credit risk and liquidity risk.
Interest Rate Swap Contracts. An interest rate swap is an agreement between counterparties to exchange periodic payments based on interest rates. One cash flow stream will typically be a floating rate payment based upon a specified floating interest rate while the other is typically a fixed interest rate.
The Fund has entered into interest rate swaps in which it pays a floating interest rate and receives a fixed interest rate in order to increase exposure to interest rate risk. Typically, if relative interest rates rise, payments made by the Fund under a swap agreement will be greater than the payments received by the Fund.
The Fund has entered into interest rate swaps in which it pays a fixed interest rate and receives a floating interest rate in order to decrease
48 OPPENHEIMER GLOBAL STRATEGIC INCOME FUND/VA
6. Use of Derivatives (Continued)
exposure to interest rate risk. Typically, if relative interest rates rise, payments received by the Fund under the swap agreement will be greater than the payments made by the Fund.
For the reporting period, the Fund had ending monthly average notional amounts of $23,593,548 and $75,530,063 on interest rate swaps which pay a fixed rate and interest rate swaps which receive a fixed rate, respectively.
Additional associated risks to the Fund include counterparty credit risk and liquidity risk.
Swaption Transactions
The Fund may enter into a swaption contract which grants the purchaser the right, but not the obligation, to enter into a swap transaction at preset terms detailed in the underlying agreement within a specified period of time. The purchaser pays a premium to the swaption writer who bears the risk of unfavorable changes in the preset terms on the underlying swap.
Purchased swaptions are reported as a component of investments in the Consolidated Statement of Investments and the Consolidated Statement of Assets and Liabilities. Written swaptions are reported on a schedule following the Consolidated Statement of Investments and their value is reported as a separate asset or liability line item in the Consolidated Statement of Assets and Liabilities. The net change in unrealized appreciation or depreciation on written swaptions is separately reported in the Consolidated Statement of Operations. When a swaption is exercised, the cost of the swap is adjusted by the amount of premium paid or received. Upon the expiration or closing of an unexercised swaption contract, a gain or loss is reported in the Consolidated Statement of Operations for the amount of the premium paid or received.
The Fund generally will incur a greater risk when it writes a swaption than when it purchases a swaption. When the Fund writes a swaption it will become obligated, upon exercise of the swaption, according to the terms of the underlying agreement. Swaption contracts written by the Fund do not give rise to counterparty credit risk prior to exercise as they obligate the Fund, not its counterparty, to perform. When the Fund purchases a swaption it only risks losing the amount of the premium it paid if the swaption expires unexercised. However, when the Fund exercises a purchased swaption there is a risk that the counterparty will fail to perform or otherwise default on its obligations under the swaption contract.
The Fund has purchased swaptions which gives it the option to enter into an interest rate swap in which it pays a floating interest rate and receives a fixed interest rate in order to increase exposure to interest rate risk. A purchased swaption of this type becomes more valuable as the reference interest rate decreases relative to the preset interest rate.
The Fund has purchased swaptions which gives it the option to enter into an interest rate swap in which it pays a fixed interest rate and receives a floating interest rate in order to decrease exposure to interest rate risk. A purchased swaption of this type becomes more valuable as the reference interest rate increases relative to the preset interest rate.
The Fund has purchased swaptions which gives it the option to sell credit protection through credit default swaps in order to increase exposure to the credit risk of individual issuers and/ or indexes of issuers. A purchased swaption of this type becomes more valuable as the likelihood of a credit event on the reference asset decreases.
The Fund has written swaptions which gives it the obligation, if exercised by the purchaser, to enter into an interest rate swap in which it pays a floating interest rate and receives a fixed interest rate in order to increase exposure to interest rate risk. A written swaption of this type becomes more valuable as the reference interest rate decreases relative to the preset interest rate.
The Fund has written swaptions which gives it the obligation, if exercised by the purchaser, to enter into an interest rate swap in which it pays a fixed interest rate and receives a floating interest rate in order to decrease exposure to interest rate risk. A written swaption of this type becomes more valuable as the reference interest rate increases relative to the preset interest rate.
During the reporting period, the Fund had an ending monthly average market value of $2,624,581 and $1,690,172 on purchased and written swaptions, respectively.
Written swaption activity for the reporting period was as follows:
| Notional Amount | Amount of Premiums |
|||||||
|
|
||||||||
| Swaptions outstanding as of |
||||||||
| December 31, 2015 |
362,297,441 | $ | 1,043,474 | |||||
| Swaptions written |
1,411,090,000 | 4,109,288 | ||||||
| Swaptions closed or expired |
(362,297,441 | ) | (1,043,475 | ) | ||||
| Swaptions exercised |
(1,411,090,000 | ) | (4,109,287 | ) | ||||
|
|
|
|||||||
| Swaptions outstanding as of June 30, 2016 | – | $ | – | |||||
|
|
|
|||||||
Counterparty Credit Risk. Derivative positions are subject to the risk that the counterparty will not fulfill its obligation to the Fund. The Fund intends to enter into derivative transactions with counterparties that the Manager believes to be creditworthy at the time of the transaction.
The Fund’s risk of loss from counterparty credit risk on OTC derivatives is generally limited to the aggregate unrealized gain netted against any collateral held by the Fund. For OTC options purchased, the Fund bears the risk of loss of the amount of the premiums paid plus the positive change in market values net of any collateral held by the Fund should the counterparty fail to perform under the contracts. Options written by the Fund do not typically give rise to counterparty credit risk, as options written generally obligate the Fund and not the counterparty to perform.
To reduce counterparty risk with respect to OTC transactions, the Fund has entered into master netting arrangements, established within the Fund’s International Swap and Derivatives Association, Inc. (“ISDA”) master agreements, which allow the Fund to make (or to have an entitlement to receive) a single net payment in the event of default (close-out netting) for outstanding payables and receivables with respect to certain OTC positions in swaps, options, swaptions, and forward currency exchange contracts for each individual counterparty. In addition, the Fund may require that certain
49 OPPENHEIMER GLOBAL STRATEGIC INCOME FUND/VA
NOTES TO CONSOLIDATED FINANCIAL STATEMENTS Unaudited / Continued
6. Use of Derivatives (Continued)
counterparties post cash and/or securities in collateral accounts to cover their net payment obligations for those derivative contracts subject to ISDA master agreements. If the counterparty fails to perform under these contracts and agreements, the cash and/or securities will be made available to the Fund.
At period end, the Fund has required certain counterparties to post collateral of $18,322,121.
ISDA master agreements include credit related contingent features which allow counterparties to OTC derivatives to terminate derivative contracts prior to maturity in the event that, for example, the Fund’s net assets decline by a stated percentage or the Fund fails to meet the terms of its ISDA master agreements, which would cause the Fund to accelerate payment of any net liability owed to the counterparty.
For financial reporting purposes, the Fund does not offset derivative assets and derivative liabilities that are subject to netting arrangements in the Consolidated Statement of Assets and Liabilities. Bankruptcy or insolvency laws of a particular jurisdiction may impose restrictions on or prohibitions against the right of offset in bankruptcy, insolvency or other events.
The Fund’s risk of loss from counterparty credit risk on exchange-traded derivatives cleared through a clearinghouse and for centrally cleared swaps is generally considered lower than as compared to OTC derivatives. However, counterparty credit risk exists with respect to initial and variation margin deposited/paid by the Fund that is held in futures commission merchant, broker and/or clearinghouse accounts for such exchange-traded derivatives and for centrally cleared swaps.
With respect to centrally cleared swaps, such transactions will be submitted for clearing, and if cleared, will be held in accounts at futures commission merchants or brokers that are members of clearinghouses. While brokers, futures commission merchants and clearinghouses are required to segregate customer margin from their own assets, in the event that a broker, futures commission merchant or clearinghouse becomes insolvent or goes into bankruptcy and at that time there is a shortfall in the aggregate amount of margin held by the broker, futures commission merchant or clearinghouse for all its customers, U.S. bankruptcy laws will typically allocate that shortfall on a pro-rata basis across all the broker’s, futures commission merchant’s or clearinghouse’s customers, potentially resulting in losses to the Fund.
There is the risk that a broker, futures commission merchant or clearinghouse will decline to clear a transaction on the Fund’s behalf, and the Fund may be required to pay a termination fee to the executing broker with whom the Fund initially enters into the transaction. Clearinghouses may also be permitted to terminate centrally cleared swaps at any time. The Fund is also subject to the risk that the broker or futures commission merchant will improperly use the Fund’s assets deposited/paid as initial or variation margin to satisfy payment obligations of another customer. In the event of a default by another customer of the broker or futures commission merchant, the Fund might not receive its variation margin payments from the clearinghouse, due to the manner in which variation margin payments are aggregated for all customers of the broker/futures commission merchant.
Collateral and margin requirements differ by type of derivative. Margin requirements are established by the broker, futures commission merchant or clearinghouse for exchange-traded and cleared derivatives, including centrally cleared swaps. Brokers, futures commission merchants and clearinghouses can ask for margin in excess of the regulatory minimum, or increase the margin amount, in certain circumstances.
Collateral terms are contract specific for OTC derivatives. For derivatives traded under an ISDA master agreement, the collateral requirements are typically calculated by netting the mark to market amount for each transaction under such agreement and comparing that amount to the value of any collateral currently pledged by the Fund or the counterparty.
For financial reporting purposes, cash collateral that has been pledged to cover obligations of the Fund, if any, is reported separately on the Consolidated Statement of Assets and Liabilities as cash pledged as collateral. Non-cash collateral pledged by the Fund, if any, is noted in the Consolidated Statement of Investments. Generally, the amount of collateral due from or to a party must exceed a minimum transfer amount threshold (e.g. $250,000) before a transfer has to be made. To the extent amounts due to the Fund from its counterparties are not fully collateralized, contractually or otherwise, the Fund bears the risk of loss from counterparty nonperformance.
The following table presents by counterparty the Fund’s OTC derivative assets net of the related collateral pledged by the Fund at June 30, 2016:
| Gross Amounts Not Offset in the Consolidated Statement of Assets & Liabilities |
||||||||||||||||||||
| Counterparty | Gross Amounts Not Offset Statement of Assets & Liabilities* |
Financial Instruments Available for Offset |
Financial Instruments Collateral Received** |
Cash Collateral Received** |
Net Amount | |||||||||||||||
|
|
||||||||||||||||||||
| Banco Santander SA | $ | 43,298 | $ | – | $ | – | $ | – | $ | 43,298 | ||||||||||
| Bank of America NA | 3,501,740 | (1,355,505) | (2,146,235) | – | – | |||||||||||||||
| Barclays Bank plc | 251,978 | (251,978) | – | – | – | |||||||||||||||
| BNP Paribas | 556,874 | (544,803) | (12,071) | – | – | |||||||||||||||
| Citibank NA | 393,212 | (107,163) | (286,049) | – | – | |||||||||||||||
| Deutsche Bank NA | 1,617,642 | (1,617,642) | – | – | – | |||||||||||||||
| Goldman Sachs Bank USA | 800,281 | (655,826) | (144,455) | – | – | |||||||||||||||
| HSBC Bank USA NA | 202,216 | (202,216) | – | – | – | |||||||||||||||
| JPMorgan Chase Bank NA | 5,103,431 | (1,026,196) | (3,647,973) | – | 429,262 | |||||||||||||||
| Morgan Stanley | 10,435 | – | – | – | 10,435 | |||||||||||||||
| Morgan Stanley Capital Services, Inc. | 513,408 | (513,408) | – | – | – | |||||||||||||||
| Royal Bank of Scotland plc (The) | 761,011 | (525,001) | (236,010) | – | – | |||||||||||||||
| Toronto Dominion Bank | 1,011,296 | (639,901) | (371,395) | – | – | |||||||||||||||
50 OPPENHEIMER GLOBAL STRATEGIC INCOME FUND/VA
6. Use of Derivatives (Continued)
| Gross Amounts Not Offset in the Consolidated Statement of Assets & Liabilities |
||||||||||||||||||||
| Counterparty | Gross Amounts Not Offset in the Consolidated Statement of Assets & Liabilities* |
Financial Instruments Available for Offset |
Financial Instruments Collateral Received** |
Cash Collateral Received** |
Net Amount | |||||||||||||||
|
|
||||||||||||||||||||
| UBS AG |
$ | 16,858 | $ | – | $ | – | $ | – | $ | 16,858 | ||||||||||
|
|
|
|
|
|
|
|
|
|
|
|||||||||||
| $ | 14,783,680 | $ | (7,439,639) | $ | (6,844,188) | $ | – | $ | 499,853 | |||||||||||
|
|
|
|
|
|
|
|
|
|
|
|||||||||||
*OTC derivatives are reported gross on the Statement of Assets and Liabilities. Exchange traded options and margin related to centrally cleared swaps and futures are excluded from these reported amounts.
**Reported collateral posted for the benefit of the Fund within this table is limited to the net outstanding amount due from an individual counterparty. The collateral posted for the benefit of the Fund may exceed these amounts.
The following table presents by counterparty the Fund’s OTC derivative liabilities net of the related collateral pledged by the Fund at June 30, 2016:
| Gross Amounts Not Offset in the Consolidated Statement of Assets & Liabilities |
||||||||||||||||||||
| Counterparty | Gross Amounts Not Offset in the Consolidated Statement of Assets & Liabilities* |
Financial Instruments Available for Offset |
Financial Instruments Collateral Pledged** |
Cash Collateral Pledged** | Net Amount | |||||||||||||||
|
|
||||||||||||||||||||
| Bank of America NA | $ | (1,355,505) | $ | 1,355,505 | $ | – | $ | – | $ | – | ||||||||||
| Barclays Bank plc | (1,999,248) | 251,978 | 636,982 | – | (1,110,288) | |||||||||||||||
| BNP Paribas | (544,803) | 544,803 | – | – | – | |||||||||||||||
| Citibank NA | (107,163) | 107,163 | – | – | – | |||||||||||||||
| Deutsche AG | (1,691,438) | 1,617,642 | 73,796 | – | – | |||||||||||||||
| Goldman Sachs Bank USA | (655,826) | 655,826 | – | – | – | |||||||||||||||
| HSBC Bank USA NA | (875,220) | 202,216 | 486,009 | – | (186,995) | |||||||||||||||
| JPMorgan Chase Bank NA | (1,026,196) | 1,026,196 | – | – | – | |||||||||||||||
| Morgan Stanley Capital Services, Inc. | (583,030) | 513,408 | – | – | (69,622) | |||||||||||||||
| Royal Bank of Scotland plc (The) | (525,001) | 525,001 | – | – | – | |||||||||||||||
| Toronto Dominion Bank | (639,901) | 639,901 | – | – | – | |||||||||||||||
|
|
|
|
|
|
|
|
|
|
|
|||||||||||
| $ | (10,003,331) | $ | 7,439,639 | $ | 1,196,787 | $ | – | $ | (1,366,905) | |||||||||||
|
|
|
|
|
|
|
|
|
|
|
|||||||||||
*OTC derivatives are reported gross on the Consolidated Statement of Assets and Liabilities. Exchange traded options and margin related to centrally cleared swaps and futures are excluded from these reported amounts.
**Reported collateral pledged within this table is limited to the net outstanding amount due from the Fund. The securities pledged as collateral by the Fund as reported on the Consolidated Statements of Investments may exceed these amounts.
The following table presents the valuations of derivative instruments by risk exposure as reported within the Consolidated Statement of Assets and Liabilities at period end:
| Asset Derivatives |
Liability Derivatives |
|||||||||||
| Derivatives Not Accounted for as Hedging Instruments |
Consolidated Statement of Assets and Liabilities Location |
Value | Consolidated Statement of Assets and Liabilities Location |
Value | ||||||||
|
|
||||||||||||
| Credit contracts | Swaps, at value | $ | 186,563 | Swaps, at value | $ | 280,442 | ||||||
| Interest rate contracts | Swaps, at value | 413,919 | Swaps, at value | 661,322 | ||||||||
| Credit contracts | Centrally cleared swaps, at value | 354,931 | ||||||||||
| Interest rate contracts | Centrally cleared swaps, at value | 50,751 | ||||||||||
| Interest rate contracts | Variation margin receivable | 51,567* | Variation margin payable | 253,228* | ||||||||
| Forward currency exchange contracts | Unrealized appreciation on forward currency exchange contracts | 12,126,589 | Unrealized depreciation on forward currency exchange contracts | 7,722,713 | ||||||||
| Equity contracts | Options written, at value | 692,625 | ||||||||||
| Forward currency exchange contracts | Options written, at value | 646,229 | ||||||||||
| Equity contracts | Investments, at value | 783,179** | ||||||||||
| Forward currency exchange contracts | Investments, at value | 634,845** | ||||||||||
| Interest rate contracts | Investments, at value | 638,585** | ||||||||||
|
|
|
|
|
|||||||||
| Total | $ | 14,885,998 | $ | 10,611,490 | ||||||||
|
|
|
|
|
|||||||||
*Includes only the current day’s variation margin. Prior variation margin movements have been reflected in cash on the Consolidated Statement of Assets and Liabilities upon receipt or payment.
**Amounts relate to purchased option contracts and purchased swaption contracts.
51 OPPENHEIMER GLOBAL STRATEGIC INCOME FUND/VA
NOTES TO CONSOLIDATED FINANCIAL STATEMENTS Unaudited / Continued
6. Use of Derivatives (Continued)
The effect of derivative instruments on the Consolidated Statement of Operations is as follows:
| Amount of Realized Gain or (Loss) Recognized on Derivatives | ||||||||||||||||||||||||||||
|
|
||||||||||||||||||||||||||||
| Derivatives Not Accounted for as Hedging Instruments |
Investment from unaffiliated companies (including premiums on options exercised)* |
Closing and expiration of swaption contracts written |
Closing and expiration of option contracts written |
Closing and expiration of futures contracts |
Foreign currency transactions |
Swap contracts | Total | |||||||||||||||||||||
|
|
||||||||||||||||||||||||||||
| Credit contracts | $ | — | $ | — | $ | — | $ | — | $ | — | $ | 491,211 | $ | 491,211 | ||||||||||||||
| Equity contracts | — | — | — | 819,519 | — | — | 819,519 | |||||||||||||||||||||
| Forward currency exchange contracts | (614,186) | — | 410,150 | — | 2,264,381 | (21,919) | 2,038,426 | |||||||||||||||||||||
| Interest rate contracts | (2,037,227) | 1,043,475 | — | (1,769,024 | ) | — | (1,035,618) | (3,798,394 | ) | |||||||||||||||||||
|
|
|
|||||||||||||||||||||||||||
| Total | $ | (2,651,413) | $ | 1,043,475 | $ | 410,150 | $ | (949,505 | ) | $ | 2,264,381 | $ | (566,326) | $ | (449,238) | |||||||||||||
|
|
|
|||||||||||||||||||||||||||
*Includes purchased options contracts, purchased swaption contracts, written options contracts exercised and written swaption contracts exercised, if any.
| Amount of Change in Unrealized Gain or (Loss) Recognized on Derivatives | ||||||||||||||||||||||||||||
|
|
||||||||||||||||||||||||||||
| Derivatives Not Accounted for as Hedging Instruments |
Investments* | Option contracts written |
Swaption contracts written |
Futures contracts |
Translation of assets and liabilities denominated in foreign currencies |
Swap contracts |
Total | |||||||||||||||||||||
|
|
||||||||||||||||||||||||||||
| Credit contracts | $ | — | $ | — | $ | — | $ | — | $ | — | $ | (305,101) | $ | (305,101) | ||||||||||||||
| Equity contracts | (119,004 | ) | 209,558 | — | — | — | — | 90,554 | ||||||||||||||||||||
| Forward currency exchange contracts | (281,450 | ) | 208,605 | — | — | 797,833 | 1,512,906 | 2,237,894 | ||||||||||||||||||||
| Interest rate contracts | 98,360 | — | 1,465,085 | 2,423,412 | — | 328,828 | 4,315,685 | |||||||||||||||||||||
|
|
|
|||||||||||||||||||||||||||
| Total | $ | (302,094) | $ | 418,163 | $ | 1,465,085 | $ | 2,423,412 | $ | 797,833 | $ | 1,536,633 | $ | 6,339,032 | ||||||||||||||
|
|
|
|||||||||||||||||||||||||||
*Includes purchased option contracts and purchased swaption contracts, if any.
7. Shares of Beneficial Interest
The Fund has authorized an unlimited number of $0.001 par value shares of beneficial interest of each class. Transactions in shares of beneficial interest were as follows:
| Six Months Ended June 30, 2016 | Year Ended December 31, 2015 | |||||||||||||||
| Shares | Amount | Shares | Amount | |||||||||||||
|
|
||||||||||||||||
| Non-Service Shares |
||||||||||||||||
| Sold |
1,050,891 | $ | 5,189,637 | 4,671,962 | $ | 23,990,179 | ||||||||||
| Dividends and/or distributions reinvested |
4,307,665 | 20,719,866 | 5,825,930 | 29,479,205 | ||||||||||||
| Redeemed |
(7,518,956) | (37,069,312) | (33,212,336) | (173,570,603) | ||||||||||||
|
|
|
|||||||||||||||
| Net decrease |
(2,160,400) | $ | (11,159,809) | (22,714,444) | $ | (120,101,219) | ||||||||||
|
|
|
|||||||||||||||
|
|
||||||||||||||||
| Service Shares |
||||||||||||||||
| Sold |
6,424,957 | $ | 32,305,881 | 13,496,560 | $ | 71,281,913 | ||||||||||
| Dividends and/or distributions reinvested |
12,375,075 | 61,256,620 | 15,712,417 | 81,704,570 | ||||||||||||
| Redeemed |
(24,809,996) | (124,534,952) | (40,362,328) | (212,925,973) | ||||||||||||
|
|
|
|||||||||||||||
| Net decrease |
(6,009,964) | $ | (30,972,451) | (11,153,351) | $ | (59,939,490) | ||||||||||
|
|
|
|||||||||||||||
8. Purchases and Sales of Securities
The aggregate cost of purchases and proceeds from sales of securities, other than short-term obligations and investments in IMMF, for the reporting period were as follows:
| Purchases | Sales | |||||||
|
|
||||||||
| Investment securities |
$ | 615,749,335 | $ | 699,388,201 | ||||
| U.S. government and government agency obligations |
34,182,366 | 38,946,758 | ||||||
| To Be Announced (TBA) mortgage-related securities |
877,685,156 | 829,309,065 | ||||||
9. Fees and Other Transactions with Affiliates
Management Fees. Under the investment advisory agreement, the Fund pays the Manager a management fee based on the daily net assets of the
52 OPPENHEIMER GLOBAL STRATEGIC INCOME FUND/VA
9. Fees and Other Transactions with Affiliates (Continued)
Fund at an annual rate as shown in the following table:
| Fee Schedule |
||||
| Up to $200 million |
0.75% | |||
| Next $200 million |
0.72 | |||
| Next $200 million |
0.69 | |||
| Next $200 million |
0.66 | |||
| Next $200 million |
0.60 | |||
| Next $4 billion |
0.50 | |||
| Over $5 billion |
0.48 | |||
The Manager also provides investment management related services to the Subsidiary. The Subsidiary pays the Manager a monthly management fee at an annual rate according to the above schedule. The Subsidiary also pays certain other expenses including custody and directors’ fees.
The Fund’s effective management fee for the reporting period was 0.61% of average annual net assets before any Subsidiary management fees or any applicable waivers.
Sub-Adviser Fees. The Manager has retained the Sub-Adviser to provide the day-to-day portfolio management of the Fund and the Subsidiary. Under the Sub-Advisory Agreement, the Manager pays the Sub-Adviser an annual fee in monthly installments, equal to a percentage of the investment management fee collected by the Manager from the Fund and the Subsidiary, which shall be calculated after any investment management fee waivers. The fee paid to the Sub-Adviser is paid by the Manager, not by the Fund.
Transfer Agent Fees. OFI Global (the “Transfer Agent”) serves as the transfer and shareholder servicing agent for the Fund. The Fund pays the Transfer Agent a fee based on annual net assets. Fees incurred and average net assets for each class with respect to these services are detailed in the Consolidated Statement of Operations and Consolidated Financial Highlights, respectively.
Sub-Transfer Agent Fees. The Transfer Agent has retained Shareholder Services, Inc., a wholly-owned subsidiary of OFI (the “Sub-Transfer Agent”), to provide the day-to-day transfer agent and shareholder servicing of the Fund. Under the Sub-Transfer Agency Agreement, the Transfer Agent pays the Sub-Transfer Agent an annual fee in monthly installments, equal to a percentage of the transfer agent fee collected by the Transfer Agent from the Fund, which shall be calculated after any applicable fee waivers. The fee paid to the Sub-Transfer Agent is paid by the Transfer Agent, not by the Fund.
Trustees’ Compensation. The Fund’s Board of Trustees (“Board”) has adopted a compensation deferral plan for Independent Trustees that enables Trustees to elect to defer receipt of all or a portion of the annual compensation they are entitled to receive from the Fund. For purposes of determining the amount owed to the Trustees under the plan, deferred amounts are treated as though equal dollar amounts had been invested in shares of the Fund or in other Oppenheimer funds selected by the Trustees. The Fund purchases shares of the funds selected for deferral by the Trustees in amounts equal to his or her deemed investment, resulting in a Fund asset equal to the deferred compensation liability. Such assets are included as a component of “Other” within the asset section of the Consolidated Statement of Assets and Liabilities. Deferral of Trustees’ fees under the plan will not affect the net assets of the Fund and will not materially affect the Fund’s assets, liabilities or net investment income per share. Amounts will be deferred until distributed in accordance with the compensation deferral plan.
Distribution and Service Plan for Service Shares. The Fund has adopted a Distribution and Service Plan (the “Plan”) pursuant to Rule 12b-1 under the 1940 Act for Service shares to pay OppenheimerFunds Distributor, Inc. (the “Distributor”), for distribution related services, personal service and account maintenance for the Fund’s Service shares. Under the Plan, payments are made periodically at an annual rate of 0.25% of the daily net assets of Service shares of the Fund. The Distributor currently uses all of those fees to compensate sponsors of the insurance product that offers Fund shares, for providing personal service and maintenance of accounts of their variable contract owners that hold Service shares. These fees are paid out of the Fund’s assets on an on-going basis and increase operating expenses of the Service shares, which results in lower performance compared to the Fund’s shares that are not subject to a service fee. Fees incurred by the Fund under the Plan are detailed in the Consolidated Statement of Operations.
Waivers and Reimbursements of Expenses. The Manager has voluntarily agreed to limit the Fund’s expenses after payments, waivers and/or reimbursements and reduction to custodian expenses, excluding expenses incurred directly or indirectly by the Fund as a result of investments in other investment companies, wholly-owned subsidiaries and pooled investment vehicles; so that those expenses, as percentages of daily net assets, will not exceed the annual rate of 0.75% for Non-Service shares and 1.00% for Service shares. The expense limitations do not include interest and fees from borrowing, and other expenses not incurred in the ordinary course of the Fund’s business.
The Manager has contractually agreed to waive the management fee it receives from the Fund in an amount equal to the management fee it receives from the Subsidiary. During the reporting period, the Manager waived $90,200.
The Manager will waive fees and/or reimburse Fund expenses in an amount equal to the indirect management fees incurred through the Fund’s investments in underlying funds managed by the Manager or its affiliates. During the reporting period, the Manager waived fees and/or reimbursed the Fund $327,774 for management fees.
Waivers and/or reimbursements may be modified or terminated as set forth according to the terms in the prospectus.
53 OPPENHEIMER GLOBAL STRATEGIC INCOME FUND/VA
NOTES TO CONSOLIDATED FINANCIAL STATEMENTS Unaudited / Continued
10. Borrowings and Other Financing
Joint Credit Facility. A number of mutual funds managed by the Manager participate in a $1.28 billion revolving credit facility (the “Facility”) intended to provide short-term financing, if necessary, subject to certain restrictions in connection with atypical redemption activity. Expenses and fees related to the Facility are paid by the participating funds and are disclosed separately or as other expenses on the Consolidated Statement of Operations. The Fund did not utilize the Facility during the reporting period.
11. Pending Litigation
In 2009, several putative class action lawsuits were filed and later consolidated before the U.S. District Court for the District of Colorado against OppenheimerFunds, Inc. (“OFI”), OppenheimerFunds Distributor, Inc. (“OFDI”), and Oppenheimer Rochester California Municipal Fund, a fund advised by OFI Global Asset Management, Inc. and distributed by the Distributor (the “California Fund”), in connection with the California Fund’s investment performance. The plaintiffs asserted claims against OFI, OFDI and certain present and former trustees and officers of the California Fund under the federal securities laws, alleging, among other things, that the disclosure documents of the California Fund contained misrepresentations and omissions and the investment policies of the California Fund were not followed. Plaintiffs in the suit filed an amended complaint and defendants filed a motion to dismiss. In 2011, the court issued an order which granted in part and denied in part the defendants’ motion to dismiss. In 2012, plaintiffs filed a motion, which defendants opposed, to certify a class and appoint class representatives and class counsel. In March 2015, the court granted plaintiffs’ motion for class certification. In May 2015, the U.S. Court of Appeals for the Tenth Circuit vacated the class certification order and remanded the matter to the district court for further proceedings. In October 2015, the district court reaffirmed its order and determined that the suit will proceed as a class action. In December 2015, the Tenth Circuit denied defendants’ petition to appeal the district court’s reaffirmed class certification order.
OFI and OFDI believe the suit is without merit; that it is premature to render any opinion as to the likelihood of an outcome unfavorable to them in the suit; and that no estimate can yet be made as to the amount or range of any potential loss. Furthermore, OFI believes that the suit should not impair the ability of OFI or OFDI to perform their respective duties to the Fund and that the outcome of the suit should not have any material effect on the operations of any of the Oppenheimer funds.
54 OPPENHEIMER GLOBAL STRATEGIC INCOME FUND/VA
PORTFOLIO PROXY VOTING POLICIES AND GUIDELINES; UPDATES TO STATEMENTS OF INVESTMENTS Unaudited
The Fund has adopted Portfolio Proxy Voting Policies and Guidelines under which the Fund votes proxies relating to securities (“portfolio proxies”) held by the Fund. A description of the Fund’s Portfolio Proxy Voting Policies and Guidelines is available (i) without charge, upon request, by calling the Fund toll-free at 1.800.525.7048, (ii) on the Fund’s website at www.oppenheimerfunds.com, and (iii) on the SEC’s website at www.sec.gov. In addition, the Fund is required to file Form N-PX, with its complete proxy voting record for the 12 months ended June 30th, no later than August 31st of each year. The Fund’s voting record is available (i) without charge, upon request, by calling the Fund toll-free at 1.800.525.7048, and (ii) in the Form N-PX filing on the SEC’s website at www.sec.gov.
The Fund files its complete schedule of portfolio holdings with the SEC for the first quarter and the third quarter of each fiscal year on Form N-Q. The Fund’s Form N-Q filings are available on the SEC’s website at www.sec.gov. Those forms may be reviewed and copied at the SEC’s Public Reference Room in Washington, D.C. Information on the operation of the Public Reference Room may be obtained by calling 1-800-SEC-0330.
55 OPPENHEIMER GLOBAL STRATEGIC INCOME FUND/VA
DISTRIBUTION SOURCES Unaudited
For any distribution that took place over the Fund’s reporting period, the table below details on a per-share basis the percentage of the Fund’s total distribution payment amount that was derived from the following sources: net income, net profit from the sale of securities, and other capital sources.
This information is based upon income and capital gains using generally accepted accounting principles as of the date of each distribution. Because the Fund is actively managed, the relative amount of the Fund’s total distributions derived from various sources over the calendar year may change. Please note that this information should not be used for tax reporting purposes as the tax character of distributable income may differ from the amounts used for this notification. You will receive IRS tax forms in the first quarter of each calendar year detailing the actual amount of the taxable and non-taxable portion of distributions paid to you during the tax year.
For the most current information, please go to oppenheimerfunds.com. Select your Fund, then the ’Detailed’ tab; where ‘Dividends’ are shown, the Fund’s latest pay date will be followed by the sources of any distribution, updated daily.
| Fund Name | Pay Date |
Net Income | Net Profit from Sale |
Other Capital Sources |
||||||||||||
| Oppenheimer Global Strategic Income Fund/VA |
6/21/16 | 85.0 | % | 0.0 | % | 15.0 | % | |||||||||
56 OPPENHEIMER GLOBAL STRATEGIC INCOME FUND/VA
THIS PAGE INTENTIONALLY LEFT BLANK.
57 OPPENHEIMER GLOBAL STRATEGIC INCOME FUND/VA
THIS PAGE INTENTIONALLY LEFT BLANK.
58 OPPENHEIMER GLOBAL STRATEGIC INCOME FUND/VA
THIS PAGE INTENTIONALLY LEFT BLANK.
59 OPPENHEIMER GLOBAL STRATEGIC INCOME FUND/VA
OPPENHEIMER GLOBAL STRATEGIC INCOME FUND/VA
A Series of Oppenheimer Variable Account Funds
| Trustees and Officers | Sam Freedman, Chairman of the Board of Trustees and Trustee | |
| Jon S. Fossel, Trustee | ||
| Richard F. Grabish, Trustee | ||
| Beverly L. Hamilton, Trustee | ||
| Victoria J. Herget, Trustee | ||
| Robert J. Malone, Trustee | ||
| F. William Marshall, Jr., Trustee | ||
| Karen L. Stuckey, Trustee | ||
| James D. Vaughn, Trustee | ||
| Arthur P. Steinmetz, Trustee, President and Principal Executive Officer | ||
| Krishna Memani, Vice President | ||
| Michael A. Mata. Vice President | ||
| Hemant Baijal, Vice President | ||
| Cynthia Lo Bessette, Secretary and Chief Legal Officer | ||
| Jennifer Sexton, Vice President and Chief Business Officer | ||
| Mary Ann Picciotto, Chief Compliance Officer and Chief Anti-Money Laundering Officer | ||
| Brian S. Petersen, Treasurer and Principal Financial & Accounting Officer | ||
| Manager | OFI Global Asset Management, Inc. | |
| Sub-Adviser | OppenheimerFunds, Inc. | |
| Distributor | OppenheimerFunds Distributor, Inc. | |
| Transfer and Shareholder Servicing Agent | OFI Global Asset Management, Inc. | |
| Sub-Transfer Agent | Shareholder Services, Inc. | |
| DBA OppenheimerFunds Services | ||
| Independent Registered Public Accounting Firm | KPMG LLP | |
| Legal Counsel | Ropes & Gray LLP | |
| Before investing in any of the Oppenheimer funds, investors should carefully consider a fund’s investment objectives, risks, charges and expenses. Fund prospectuses and summary prospectuses contain this and other information about the funds, and may be obtained by asking your financial advisor, or calling us at 1.800.988.8287. Read prospectuses and summary prospectuses carefully before investing. | ||
| The financial statements included herein have been taken from the records of the Fund without examination of those records by the independent registered public accounting firm. | ||
| © 2016 OppenheimerFunds, Inc. All rights reserved. Oppenheimer funds are distributed by OppenheimerFunds Distributor, Inc. | ||


|
||||
|
June 30, 2016
|
||||
|
Oppenheimer |
||||
| Equity Income Fund/VA |
Semiannual Report | |||
| A Series of Oppenheimer Variable Account Funds
|
||||
|
SEMIANNUAL REPORT |
||||
|
Listing of Top Holdings |
||||
|
Fund Performance Discussion |
||||
|
Financial Statements |
PORTFOLIO MANAGER: Michael S. Levine, CFA
AVERAGE ANNUAL TOTAL RETURNS FOR THE PERIODS ENDED 6/30/16
| Inception Date |
6-Months | 1-Year | 5-Year | 10-Year | ||||||||||||||||
|
Non-Service Shares |
1/2/03 | 0.36% | -9.51% | 6.00% | 6.41% | |||||||||||||||
|
Service Shares |
9/18/06 | 0.28 | -9.73 | 5.65 | 3.47* | |||||||||||||||
|
Russell 1000 Value Index |
6.30 | 2.86 | 11.35 | 6.13 | ||||||||||||||||
*Shows performance since inception.
Performance data quoted represents past performance, which does not guarantee future results. The investment return and principal value of an investment in the Fund will fluctuate so that an investor’s shares, when redeemed, may be worth more or less than their original cost. Current performance may be lower or higher than the performance quoted. For performance data current to the most recent month end, call us at 1.800.988.8287. The Fund’s total returns should not be expected to be the same as the returns of other funds, whether or not both funds have the same portfolio managers and/or similar names. The Fund’s total returns include changes in share price and reinvested distributions but do not include the charges associated with the separate account products that offer this Fund. Such performance would have been lower if such charges were taken into account.
The Fund’s performance is compared to the performance of the Russell 1000 Value Index. The Russell 1000 Value Index measures the performance of the large-cap value segment of the U.S. equity universe. It includes those Russell 1000 companies with lower price-to-book ratios and lower expected growth values. The Index is unmanaged and cannot be purchased directly by investors. While index comparisons may be useful to provide a benchmark for the Fund’s performance, it must be noted that the Fund’s investments are not limited to the investments comprising the Index. Index performance includes reinvestment of income, but does not reflect transaction costs, fees, expenses or taxes. Index performance is shown for illustrative purposes only as a benchmark for the Fund’s performance, and does not predict or depict performance of the Fund. The Fund’s performance reflects the effects of the Fund’s business and operating expenses.
TOP HOLDINGS AND ALLOCATIONS
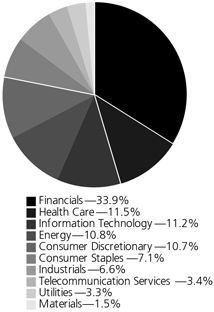
2 OPPENHEIMER EQUITY INCOME FUND/VA
Fund Performance Discussion
The Fund’s Non-Service shares returned 0.36% during the reporting period. In comparison, the Fund underperformed the Russell 1000 Value Index (the “Index”), which returned 6.30%. On a sector basis, the most significant detractors from performance versus the Index included stock selection and overweight positions in financials and consumer discretionary, and stock selection in information technology and health care. The Fund outperformed the Index within the consumer staples sector due to stock selection and the telecommunication services sector as a result of an overweight position.
MARKET OVERVIEW
The first half of 2016 was a volatile time for global equity markets. Concerns about slowing global economic growth, a sharp drop in crude oil prices in early 2016, and sharp declines in global interest rates contributed to a tumultuous environment. March saw a temporary relief rally as communication from the Fed turned more accommodative in light of this weak start to the year. Furthermore, an apparent bottom in commodity prices helped investor sentiment. However, unanswered questions, including how quickly the Fed would raise interest rates and whether Britain would decide to exit the E.U. on its June 23 vote, made for an uncertain period. The U.K. surprised the markets by ultimately deciding to exit the E.U. As a result, markets dropped sharply and remained volatile through the reporting period’s end.
TOP INDIVIDUAL CONTRIBUTORS
Top contributors to the Fund’s performance this period included AT&T, Inc., Communications Sales & Leasing, Inc. (CSAL) and Chevron Corp.
AT&T performed well during the reporting period as its defensive characteristics and attractive dividend yield appealed to investors.
CSAL is a telecom infrastructure real estate investment trust (REIT) created from the separation from Windstream last year. After performing very poorly post separation, CSAL rebounded strongly during the reporting period as the company diversified its tenant base which assuaged investor concerns about the sustainability of the dividend. We’ve trimmed our position modestly as the stock has appreciated, but with an 8% yield we continue to like the name.
Chevron benefited from the sharp bounce off the oil price lows seen in the first quarter of 2016. Furthermore, Chevron’s attractive yield and more focused capital spending plans were rewarded by the market.
TOP INDIVIDUAL DETRACTORS
Detractors from performance this reporting period included Citigroup, Inc., United Continental Holdings, Inc. (“United”) and Allergan plc.
Citigroup is a leading money center banking company. Financials in general and Citi in particular had a difficult reporting period due to credit concerns surrounding energy exposures as well as continued very low interest rates. While both of these concerns are valid, we believe the fears are more than discounted in Citi’s stock, as well as in the stock of many Financials. Energy losses are going to increase, but we believe Citi should be well prepared for them. Also, while low interest rates are a negative for financials, we believe Citi’s stock already reflects this. We received encouraging news from the Fed’s Comprehensive Capital Analysis and Review (CCAR) process during the second quarter that could lead to an increased dividend and larger share buyback.
United detracted from performance as industry revenue trends remain somewhat soft and concerns about international travel increased following the Brexit vote. We own United because we believe airline industry fundamentals have structurally improved following years/decades of poor industry operating performance. Industry consolidation and better management execution have resulted in record levels of profitability while lower oil prices have also helped. While United has lagged the industry following its merger with Continental a few years ago, we believe the company will be able to close the margin gap with its peer group.
Allergan, formerly known as Actavis, is a specialty pharmaceuticals manufacturer. Last July, Allergan announced the sale of its generic business, which sells approximately 1,000 generic and branded generic products globally, to Teva Pharmaceuticals for approximately $40 billion. The transaction is expected to close in the first half of 2016 and may allow the company to pursue additional opportunities in its expanding branded pharmaceuticals business. In November 2015, the company announced that it was merging with Pfizer to create a global pharmaceuticals company, and expected the deal to close in the second half of 2016. Allergan declined in the first quarter as concerns increased during March about the likelihood of the transaction closing. Subsequently, the merger was called off in early April after unprecedented actions by the U.S. Treasury department made the economics of the transaction unattractive.
3 OPPENHEIMER EQUITY INCOME FUND/VA
STRATEGY & OUTLOOK
The economic and market environment remain extremely volatile. While the U.S. economy continues to grow, it is unlikely that growth will be robust. Recent concerns about job growth, the fallout from the Brexit vote and continued declines in interest rates are all weighing on sentiment—both investor sentiment and corporate investment intentions. On the positive side, we are encouraged that commodity prices appear to have found a floor and we expect crude oil supply/ demand to improve during the second half of the year which should lend further support to commodity prices. While higher energy prices would offset some of the tailwinds consumers have been experiencing for the past 18 months, we think stable to modestly higher commodity prices will be a net positive to the manufacturing economy. We remain disciplined regarding valuations and, as a result, we see the potential for heightened risk in safe haven asset classes that have been performing well of late. While value stocks have significantly underperformed the market during the past few years, we continue to believe that the Fund is well positioned to benefit when value investing begins to outperform again. Furthermore, we continue to target an above-average dividend yield.
The Fund’s investment strategy and focus can change over time. The mention of specific fund holdings does not constitute a recommendation by OppenheimerFunds, Inc. or its affiliates.
Shares of Oppenheimer funds are not deposits or obligations of any bank, are not guaranteed by any bank, are not insured by the FDIC or any other agency, and involve investment risks, including the possible loss of the principal amount invested.
4 OPPENHEIMER EQUITY INCOME FUND/VA
Fund Expenses
Fund Expenses. As a shareholder of the Fund, you incur two types of costs: (1) transaction costs and (2) ongoing costs, including management fees; distribution and service fees; and other Fund expenses. These examples are intended to help you understand your ongoing costs (in dollars) of investing in the Fund and to compare these costs with the ongoing costs of investing in other mutual funds.
The examples are based on an investment of $1,000.00 invested at the beginning of the period and held for the entire 6-month period ended June 30, 2016.
Actual Expenses. The first section of the table provides information about actual account values and actual expenses. You may use the information in this section for the class of shares you hold, together with the amount you invested, to estimate the expense that you paid over the period. Simply divide your account value by $1,000.00 (for example, an $8,600.00 account value divided by $1,000.00 = 8.60), then multiply the result by the number in the first section under the heading entitled “Expenses Paid During 6 Months Ended June 30, 2016” to estimate the expenses you paid on your account during this period.
Hypothetical Example for Comparison Purposes.
The second section of the table provides information about hypothetical account values and hypothetical expenses based on the Fund’s actual expense ratio for each class of shares, and an assumed rate of return of 5% per year for each class before expenses, which is not the actual return. The hypothetical account values and expenses may not be used to estimate the actual ending account balance or expenses you paid for the period. You may use this information to compare the ongoing costs of investing in the Fund and other funds. To do so, compare this 5% hypothetical example for the class of shares you hold with the 5% hypothetical examples that appear in the shareholder reports of the other funds.
Please note that the expenses shown in the table are meant to highlight your ongoing costs only and do not reflect any charges associated with the separate accounts that offer this Fund. Therefore, the “hypothetical” lines of the table are useful in comparing ongoing costs only, and will not help you determine the relative total costs of owning different funds. In addition, if these separate account charges were included your costs would have been higher.
| Actual | Beginning Value |
Ending Value June 30, 2016 |
Expenses Paid During |
|||||||||
| Non-Service shares |
$ | 1,000.00 | $ | 1,003.60 | $ | 3.99 | ||||||
| Service shares |
1,000.00 | 1,002.80 | 5.24 | |||||||||
| Hypothetical | ||||||||||||
| (5% return before expenses) | ||||||||||||
| Non-Service shares |
1,000.00 | 1,020.89 | 4.03 | |||||||||
| Service shares |
1,000.00 | 1,019.64 | 5.29 | |||||||||
Expenses are equal to the Fund’s annualized expense ratio for that class, multiplied by the average account value over the period, multiplied by 182/366 (to reflect the one-half year period). Those annualized expense ratios, excluding indirect expenses from affiliated funds, based on the 6-month period ended June 30, 2016 are as follows:
| Class | Expense Ratios | |||
| Non-Service shares |
0.80% | |||
| Service shares |
1.05 | |||
The expense ratios reflect voluntary and/or contractual waivers and/or reimbursements of expenses by the Fund’s Manager. Some of these undertakings may be modified or terminated at any time, as indicated in the Fund’s prospectus. The “Financial Highlights” tables in the Fund’s financial statements, included in this report, also show the gross expense ratios, without such waivers or reimbursements and reduction to custodian expenses, if applicable.
5 OPPENHEIMER EQUITY INCOME FUND/VA
STATEMENT OF INVESTMENTS June 30, 2016 Unaudited
6 OPPENHEIMER EQUITY INCOME FUND/VA
| Exercise Price | Expiration Date | Contracts | ||||||||||||||||||||||
|
|
||||||||||||||||||||||||
| Exchange-Traded Option Purchased—0.0% |
||||||||||||||||||||||||
|
|
||||||||||||||||||||||||
| Navistar International Corp. Put2 (Cost $122) |
USD | 8.000 | 7/15/16 | USD | 2 | 50 | ||||||||||||||||||
|
|
||||||||||||||||||||||||
| Total Investments, at Value (Cost $7,439,485) | 100.2% | 7,792,537 | ||||||||||||||||||||||
|
|
||||||||||||||||||||||||
| Net Other Assets (Liabilities) | (0.2) | (15,934) | ||||||||||||||||||||||
|
|
|
|||||||||||||||||||||||
| Net Assets | 100.0% | $ | 7,776,603 | |||||||||||||||||||||
|
|
|
|||||||||||||||||||||||
Footnotes to Statement of Investments
1. All or a portion of the security position is held in segregated accounts and pledged to cover margin requirements with respect to outstanding written options. The aggregate market value of such securities is $ 117,190
2. Non-income producing security.
3. Security is a Master Limited Partnership.
4. Represents securities sold under Rule 144A, which are exempt from registration under the Securities Act of 1933, as amended. These securities have been determined to be liquid under guidelines established by the Board of Trustees. These securities amount to $36,040 or 0.46% of the Fund’s net assets at period end.
5. Rate shown is the 7-day yield at period end.
6. Is or was an affiliate, as defined in the Investment Company Act of 1940, as amended, at or during the reporting period, by virtue of the Fund owning at least 5% of the voting securities of the issuer or as a result of the Fund and the issuer having the same investment adviser. Transactions during the reporting period in which the issuer was an affiliate are as follows:
| Shares | Gross | Gross | Shares | |||||||||||||
| December 31, 2015 | Additions | Reductions | June 30, 2016 | |||||||||||||
|
|
||||||||||||||||
| Oppenheimer Institutional Money Market Fund, Cl. E |
60,375 | 768,787 | 676,726 | 152,436 | ||||||||||||
7 OPPENHEIMER EQUITY INCOME FUND/VA
STATEMENT OF INVESTMENTS Unaudited / Continued
Footnotes to Statement of Investments (Continued)
| Value | Income | |||||||
|
|
||||||||
| Oppenheimer Institutional Money Market Fund, Cl. E |
$ | 152,436 | $ | 95 | ||||
|
|
||||||||||||||||||||||||||||
| Exchange-Traded Options Written at June 30, 2016 |
|
|||||||||||||||||||||||||||
| Description | Exercise Price | Expiration Date | Number of Contracts | Premiums Received | Value | |||||||||||||||||||||||
|
|
||||||||||||||||||||||||||||
| American Electric Power Co., Inc. Call |
USD | 67.500 | 8/19/16 | USD | (4) | $ | 556 | $ | (1,280) | |||||||||||||||||||
|
|
||||||||||||||||||||||||||||
| AT&T, Inc. Call | USD | 40.000 | 7/15/16 | USD | (20) | 1,539 | (6,280) | |||||||||||||||||||||
|
|
||||||||||||||||||||||||||||
| Best Buy Co., Inc. Call | USD | 31.000 | 7/15/16 | USD | (1) | 55 | (55) | |||||||||||||||||||||
|
|
||||||||||||||||||||||||||||
| Chevron Corp. Call | USD | 100.000 | 7/15/16 | USD | (5) | 1,735 | (2,415) | |||||||||||||||||||||
|
|
||||||||||||||||||||||||||||
| Kinder Morgan, Inc. Call | USD | 18.000 | 7/15/16 | USD | (1) | 58 | (86) | |||||||||||||||||||||
|
|
||||||||||||||||||||||||||||
| Marathon Oil Corp. Call | USD | 14.000 | 7/15/16 | USD | (2) | 248 | (240) | |||||||||||||||||||||
|
|
||||||||||||||||||||||||||||
| Micron Technology, Inc. Call | USD | 13.000 | 7/15/16 | USD | (1) | 82 | (107) | |||||||||||||||||||||
|
|
||||||||||||||||||||||||||||
| NRG Energy, Inc. Call | USD | 14.000 | 7/15/16 | USD | (5) | 460 | (588) | |||||||||||||||||||||
|
|
||||||||||||||||||||||||||||
| PPL Corp. Call | USD | 39.000 | 7/15/16 | USD | (5) | 320 | (50) | |||||||||||||||||||||
|
|
|
|||||||||||||||||||||||||||
| Total Exchange-Traded Options Written | $ | 5,053 | $ (11,101) | |||||||||||||||||||||||||
|
|
|
|||||||||||||||||||||||||||
See accompanying Notes to Financial Statements.
8 OPPENHEIMER EQUITY INCOME FUND/VA
STATEMENT OF ASSETS AND LIABILITIES June 30, 2016 Unaudited
|
|
||||
| Assets |
||||
| Investments, at value—see accompanying statement of investments: | ||||
| Unaffiliated companies (cost $7,287,049) | $ | 7,640,101 | ||
| Affiliated companies (cost $152,436) | 152,436 | |||
|
|
|
|||
| 7,792,537 | ||||
|
|
||||
| Cash | 6,694 | |||
|
|
||||
| Receivables and other assets: | ||||
| Investments sold | 24,102 | |||
| Interest and dividends | 17,871 | |||
| Shares of beneficial interest sold | 429 | |||
| Other | 12,627 | |||
|
|
|
|||
| Total assets | 7,854,260 | |||
|
|
||||
| Liabilities |
||||
| Options written, at value (premiums received $5,053) | 11,101 | |||
|
|
||||
| Payables and other liabilities: | ||||
| Investments purchased | 38,829 | |||
| Trustees’ compensation | 10,354 | |||
| Legal, auditing and other professional fees | 6,578 | |||
| Shareholder communications | 4,811 | |||
| Shares of beneficial interest redeemed | 4,249 | |||
| Distribution and service plan fees | 1,526 | |||
| Other | 209 | |||
|
|
|
|||
| Total liabilities | 77,657 | |||
|
|
||||
| Net Assets |
$ | 7,776,603 | ||
|
|
|
|||
|
|
||||
| Composition of Net Assets |
||||
| Par value of shares of beneficial interest | $ | 701 | ||
|
|
||||
| Additional paid-in capital | 8,025,173 | |||
|
|
||||
| Accumulated net investment loss | (80,845) | |||
|
|
||||
| Accumulated net realized loss on investments | (515,430) | |||
|
|
||||
| Net unrealized appreciation on investments | 347,004 | |||
|
|
|
|||
| Net Assets |
$ | 7,776,603 | ||
|
|
|
|||
|
|
||||
| Net Asset Value Per Share |
||||
| Non-Service Shares: | ||||
| Net asset value, redemption price per share and offering price per share (based on net assets of $336,925 and 36,914 shares of beneficial interest outstanding) | $9.13 | |||
|
|
||||
| Service Shares: | ||||
| Net asset value, redemption price per share and offering price per share (based on net assets of $7,439,678 and 663,870 shares of beneficial interest outstanding) | $11.21 | |||
See accompanying Notes to Financial Statements.
9 OPPENHEIMER EQUITY INCOME FUND/VA
STATEMENT OF OPERATIONS For the Six Months Ended June 30, 2016 Unaudited
|
|
||||
| Investment Income |
||||
| Dividends: | ||||
| Unaffiliated companies (net of foreign withholding taxes of $ 1,714) | $ 141,678 | |||
| Affiliated companies | 95 | |||
|
|
||||
| Interest | 9,055 | |||
|
|
|
|||
| Total investment income |
|
150,828
|
| |
|
|
||||
| Expenses |
||||
| Management fees | 29,149 | |||
|
|
||||
| Distribution and service plan fees: | ||||
| Service shares | 9,306 | |||
|
|
||||
| Transfer and shareholder servicing agent fees: | ||||
| Non-Service shares | 158 | |||
| Service shares | 3,729 | |||
|
|
||||
| Shareholder communications: | ||||
| Non-Service shares | 115 | |||
| Service shares | 2,696 | |||
|
|
||||
| Legal, auditing and other professional fees | 28,024 | |||
|
|
||||
| Trustees’ compensation | 4,955 | |||
|
|
||||
| Custodian fees and expenses | 718 | |||
|
|
||||
| Borrowing fees | 78 | |||
|
|
||||
| Other | 1,693 | |||
|
|
|
|||
| Total expenses | 80,621 | |||
| Less reduction to custodian expenses | (1) | |||
| Less waivers and reimbursements of expenses | (40,037) | |||
|
|
|
|||
| Net expenses |
|
40,583
|
| |
|
|
||||
| Net Investment Income |
|
110,245
|
| |
|
|
||||
| Realized and Unrealized Gain (Loss) |
||||
| Net realized gain (loss) on: | ||||
| Investments from unaffiliated companies (including premiums on options exercised) | (236,071) | |||
| Closing and expiration of option contracts written | 12,135 | |||
| Short Positions | (149) | |||
|
|
|
|||
| Net realized loss | (224,085) | |||
|
|
||||
| Net change in unrealized appreciation/depreciation on: | ||||
| Investments | 108,349 | |||
| Option contracts written | (10,910) | |||
|
|
|
|||
| Net change in unrealized appreciation/depreciation |
|
97,439
|
| |
|
|
||||
| Net Decrease in Net Assets Resulting from Operations |
|
$ (16,401)
|
| |
|
|
|
|||
See accompanying Notes to Financial Statements.
10 OPPENHEIMER EQUITY INCOME FUND/VA
STATEMENTS OF CHANGES IN NET ASSETS
| Six Months Ended June 30, 2016 |
Year Ended December 31, 2015 |
|||||||
|
|
||||||||
| Operations |
||||||||
| Net investment income | $ | 110,245 | $ | 257,353 | ||||
|
|
||||||||
| Net realized loss | (224,085) | (151,710) | ||||||
|
|
||||||||
| Net change in unrealized appreciation/depreciation | 97,439 | (1,094,652) | ||||||
|
|
|
|||||||
| Net decrease in net assets resulting from operations
|
|
(16,401)
|
|
|
(989,009)
|
| ||
|
|
||||||||
| Dividends and/or Distributions to Shareholders |
||||||||
| Dividends from net investment income: | ||||||||
| Non-Service shares | (21,464) | (10,233) | ||||||
| Service shares | (396,306) | (287,911) | ||||||
|
|
|
|||||||
|
|
(417,770)
|
|
|
(298,144)
|
| |||
|
|
||||||||
| Distributions from net realized gain: | ||||||||
| Non-Service shares | — | (25,987) | ||||||
| Service shares | — | (746,892) | ||||||
|
|
|
|||||||
|
|
—
|
|
|
(772,879)
|
| |||
|
|
||||||||
| Beneficial Interest Transactions |
||||||||
| Net increase (decrease) in net assets resulting from beneficial interest transactions: | ||||||||
| Non-Service shares | 31,515 | 91,789 | ||||||
| Service shares | (340,596) | (1,019,497) | ||||||
|
|
|
|||||||
|
|
(309,081)
|
|
|
(927,708)
|
| |||
|
|
||||||||
| Net Assets |
||||||||
| Total decrease | (743,252) | (2,987,740) | ||||||
|
|
||||||||
| Beginning of period | 8,519,855 | 11,507,595 | ||||||
|
|
|
|||||||
| End of period (including accumulated net investment income (loss) of $(80,845) and $226,680, respectively) | $
|
7,776,603
|
|
$
|
8,519,855
|
| ||
|
|
|
|||||||
See accompanying Notes to Financial Statements.
11 OPPENHEIMER EQUITY INCOME FUND/VA
FINANCIAL HIGHLIGHTS
| Non-Service Shares | Six Months Ended June 30, 2016 (Unaudited) |
Year Ended December 31, 2015 |
Year Ended December 31, 2014 |
Year Ended December 31, 2013 |
Year Ended December 31, 2012 |
Year Ended December 30, 20111 |
||||||||||||||||||
|
|
||||||||||||||||||||||||
| Per Share Operating Data |
||||||||||||||||||||||||
| Net asset value, beginning of period | $9.72 | $12.09 | $11.64 | $9.15 | $8.00 | $8.49 | ||||||||||||||||||
|
|
||||||||||||||||||||||||
| Income (loss) from investment operations: | ||||||||||||||||||||||||
| Net investment income2 | 0.14 | 0.29 | 0.25 | 0.21 | 0.16 | 0.15 | ||||||||||||||||||
| Net realized and unrealized gain (loss) | (0.11) | (1.28) | 1.01 | 2.42 | 1.11 | (0.56) | ||||||||||||||||||
|
|
|
|||||||||||||||||||||||
| Total from investment operations | 0.03 | (0.99) | 1.26 | 2.63 | 1.27 | (0.41) | ||||||||||||||||||
|
|
||||||||||||||||||||||||
| Dividends and/or distributions to shareholders: | ||||||||||||||||||||||||
| Dividends from net investment income | (0.62) | (0.39) | (0.22) | (0.14) | (0.12) | (0.08) | ||||||||||||||||||
| Distributions from net realized gain | 0.00 | (0.99) | (0.59) | 0.00 | 0.00 | 0.00 | ||||||||||||||||||
|
|
|
|||||||||||||||||||||||
| Total dividends and/or distributions to shareholders | (0.62) | (1.38) | (0.81) | (0.14) | (0.12) | (0.08) | ||||||||||||||||||
|
|
||||||||||||||||||||||||
| Net asset value, end of period | $9.13 | $9.72 | $12.09 | $11.64 | $9.15 | $8.00 | ||||||||||||||||||
|
|
|
|||||||||||||||||||||||
|
|
||||||||||||||||||||||||
| Total Return, at Net Asset Value3 |
0.36% | (9.58)% | 11.08% | 28.93% | 16.08% | (4.93)% | ||||||||||||||||||
|
|
||||||||||||||||||||||||
| Ratios/Supplemental Data |
||||||||||||||||||||||||
| Net assets, end of period (in thousands) | $337 | $325 | $302 | $227 | $154 | $104 | ||||||||||||||||||
|
|
||||||||||||||||||||||||
| Average net assets (in thousands) | $318 | $318 | $266 | $195 | $132 | $101 | ||||||||||||||||||
|
|
||||||||||||||||||||||||
| Ratios to average net assets:4 | ||||||||||||||||||||||||
| Net investment income | 2.96% | 2.64% | 2.08% | 2.00% | 1.82% | 1.78% | ||||||||||||||||||
| Expenses excluding specific expenses listed below | 1.84% | 1.52% | 1.42% | 1.64% | 1.75% | 1.83% | ||||||||||||||||||
| Interest and fees from borrowings | 0.00%5 | 0.00%5 | 0.00% | 0.00% | 0.00% | 0.00% | ||||||||||||||||||
|
|
|
|||||||||||||||||||||||
| Total expenses6 | 1.84% | 1.52% | 1.42% | 1.64% | 1.75% | 1.83% | ||||||||||||||||||
| Expenses after payments, waivers and/or reimbursements and reduction to custodian expenses | 0.80% | 0.80% | 0.80% | 0.80% | 0.80% | 0.80% | ||||||||||||||||||
|
|
||||||||||||||||||||||||
| Portfolio turnover rate | 23% | 44% | 40% | 159% | 87% | 86% | ||||||||||||||||||
1. December 30, 2011 represents the last business day of the Fund’s reporting period. See Note 2 of the accompanying Notes.
2. Per share amounts calculated based on the average shares outstanding during the period.
3. Assumes an initial investment on the business day before the first day of the fiscal period, with all dividends and distributions reinvested in additional shares on the reinvestment date, and redemption at the net asset value calculated on the last business day of the fiscal period. Total returns are not annualized for periods less than one full year. Total return information does not reflect expenses that apply at the separate account level or to related insurance products. Inclusion of these charges would reduce the total return figures for all periods shown. Returns do not reflect the deduction of taxes that a shareholder would pay on fund distributions or the redemption of fund shares.
4. Annualized for periods less than one full year.
5. Less than 0.005%.
6. Total expenses including indirect expenses from affiliated fund fees and expenses were as follows:
12 OPPENHEIMER EQUITY INCOME FUND/VA
| Service Shares | Six Months Ended June 30, 2016 (Unaudited) |
Year Ended December 31, 2015 |
Year Ended December 31, 2014 |
Year Ended December 31, 2013 |
Year Ended December 31, 2012 |
Year Ended December 30, 20111 |
||||||||||||||||||
|
|
||||||||||||||||||||||||
| Per Share Operating Data |
||||||||||||||||||||||||
| Net asset value, beginning of period | $11.81 | $14.43 | $13.78 | $10.83 | $9.69 | $10.23 | ||||||||||||||||||
|
|
||||||||||||||||||||||||
| Income (loss) from investment operations: | ||||||||||||||||||||||||
| Net investment income2 | 0.16 | 0.33 | 0.26 | 0.22 | 0.13 | 0.11 | ||||||||||||||||||
| Net realized and unrealized gain (loss) | (0.13) | (1.58) | 1.19 | 2.87 | 1.13 | (0.56) | ||||||||||||||||||
|
|
|
|||||||||||||||||||||||
| Total from investment operations | 0.03 | (1.25) | 1.45 | 3.09 | 1.26 | (0.45) | ||||||||||||||||||
|
|
||||||||||||||||||||||||
| Dividends and/or distributions to shareholders: | ||||||||||||||||||||||||
| Dividends from net investment income | (0.63) | (0.38) | (0.21) | (0.14) | (0.12) | (0.09) | ||||||||||||||||||
| Distributions from net realized gain | 0.00 | (0.99) | (0.59) | 0.00 | 0.00 | 0.00 | ||||||||||||||||||
|
|
|
|||||||||||||||||||||||
| Total dividends and/or distributions to shareholders | (0.63) | (1.37) | (0.80) | (0.14) | (0.12) | (0.09) | ||||||||||||||||||
|
|
||||||||||||||||||||||||
| Net asset value, end of period | $11.21 | $11.81 | $14.43 | $13.78 | $10.83 | $9.69 | ||||||||||||||||||
|
|
|
|||||||||||||||||||||||
|
|
||||||||||||||||||||||||
| Total Return, at Net Asset Value3 |
0.28% | (9.82)% | 10.73% | 28.70% | 13.09% | (4.48)% | ||||||||||||||||||
|
|
||||||||||||||||||||||||
| Ratios/Supplemental Data |
||||||||||||||||||||||||
| Net assets, end of period (in thousands) | $7,440 | $8,195 | $11,206 | $10,862 | $6,897 | $6,885 | ||||||||||||||||||
|
|
||||||||||||||||||||||||
| Average net assets (in thousands) | $7,490 | $10,265 | $11,020 | $8,549 | $7,095 | $7,449 | ||||||||||||||||||
|
|
||||||||||||||||||||||||
| Ratios to average net assets:4 | ||||||||||||||||||||||||
| Net investment income | 2.83% | 2.43% | 1.82% | 1.78% | 1.26% | 1.08% | ||||||||||||||||||
| Expenses excluding specific expenses listed below | 2.09% | 1.76% | 1.67% | 1.89% | 1.93% | 1.90% | ||||||||||||||||||
| Interest and fees from borrowings | 0.00%5 | 0.00%5 | 0.00% | 0.00% | 0.00% | 0.00% | ||||||||||||||||||
|
|
|
|||||||||||||||||||||||
| Total expenses6 | 2.09% | 1.76% | 1.67% | 1.89% | 1.93% | 1.90% | ||||||||||||||||||
| Expenses after payments, waivers and/or reimbursements and reduction to custodian expenses | 1.05% | 1.05% | 1.05% | 1.05% | 1.04% | 1.05% | ||||||||||||||||||
|
|
||||||||||||||||||||||||
| Portfolio turnover rate | 23% | 44% | 40% | 159% | 87% | 86% | ||||||||||||||||||
1. December 30, 2011 represents the last business day of the Fund’s reporting period. See Note 2 of the accompanying Notes.
2. Per share amounts calculated based on the average shares outstanding during the period.
3. Assumes an initial investment on the business day before the first day of the fiscal period, with all dividends and distributions reinvested in additional shares on the reinvestment date, and redemption at the net asset value calculated on the last business day of the fiscal period. Total returns are not annualized for periods less than one full year. Total return information does not reflect expenses that apply at the separate account level or to related insurance products. Inclusion of these charges would reduce the total return figures for all periods shown. Returns do not reflect the deduction of taxes that a shareholder would pay on fund distributions or the redemption of fund shares.
4. Annualized for periods less than one full year.
5. Less than 0.005%.
6. Total expenses including indirect expenses from affiliated fund fees and expenses were as follows:
13 OPPENHEIMER EQUITY INCOME FUND/VA
NOTES TO FINANCIAL STATEMENTS June 30, 2016 Unaudited
1. Organization
Oppenheimer Equity Income Fund/VA (the “Fund”), a separate series of Oppenheimer Variable Account Funds, is a diversified open-end management investment company registered under the Investment Company Act of 1940 (“1940 Act”), as amended. The Fund’s investment objective is to seek total return. The Fund’s investment adviser is OFI Global Asset Management, Inc. (“OFI Global” or the “Manager”), a wholly-owned subsidiary of OppenheimerFunds, Inc. (“OFI” or the “Sub-Adviser”). The Manager has entered into a sub-advisory agreement with OFI. Shares of the Fund are sold only to separate accounts of life insurance companies.
The Fund offers two classes of shares. Both classes are sold at their offering price, which is the net asset value per share, to separate investment accounts of participating insurance companies as an underlying investment for variable life insurance policies, variable annuity contracts or other investment products. The class of shares designated as Service shares is subject to a distribution and service plan. Both classes of shares have identical rights and voting privileges with respect to the Fund in general and exclusive voting rights on matters that affect that class alone. Earnings, net assets and net asset value per share may differ due to each class having its own expenses, such as transfer and shareholder servicing agent fees and shareholder communications, directly attributable to that class.
The following is a summary of significant accounting policies followed in the Fund’s preparation of financial statements in accordance with accounting principles generally accepted in the United States (“U.S. GAAP”).
2. Significant Accounting Policies
Security Valuation. All investments in securities are recorded at their estimated fair value, as described in Note 3.
Reporting Period End Date. The last day of the Fund’s reporting period is the last day the New York Stock Exchange was open for trading during the period. The Fund’s financial statements have been presented through that date to maintain consistency with the Fund’s net asset value calculations used for shareholder transactions.
Allocation of Income, Expenses, Gains and Losses. Income, expenses (other than those attributable to a specific class), gains and losses are allocated on a daily basis to each class of shares based upon the relative proportion of net assets represented by such class. Operating expenses directly attributable to a specific class are charged against the operations of that class.
Dividends and Distributions to Shareholders. Dividends and distributions to shareholders, which are determined in accordance with income tax regulations and may differ from U.S. GAAP, are recorded on the ex-dividend date. Income and capital gain distributions, if any, are declared and paid annually or at other times as deemed necessary by the Manager.
The tax character of distributions is determined as of the Fund’s fiscal year end. Therefore, a portion of the Fund’s distributions made to shareholders prior to the Fund’s fiscal year end may ultimately be categorized as a tax return of capital.
Investment Income. Dividend income is recorded on the ex-dividend date or upon ex-dividend notification in the case of certain foreign dividends where the ex-dividend date may have passed. Non-cash dividends included in dividend income, if any, are recorded at the fair market value of the securities received. Interest income is recognized on an accrual basis. Discount and premium, which are included in interest income on the Statement of Operations, are amortized or accreted daily.
Return of Capital Estimates. Distributions received from the Fund’s investments in Master Limited Partnerships (MLPs) and Real Estate Investments Trusts (REITs), generally are comprised of income and return of capital. The Fund records investment income and return of capital based on estimates. Such estimates are based on historical information available from each MLP, REIT and other industry sources. These estimates may subsequently be revised based on information received from MLPs and REITs after their tax reporting periods are concluded.
Custodian Fees. “Custodian fees and expenses” in the Statement of Operations may include interest expense incurred by the Fund on any cash overdrafts of its custodian account during the period. Such cash overdrafts may result from the effects of failed trades in portfolio securities and from cash outflows resulting from unanticipated shareholder redemption activity. The Fund pays interest to its custodian on such cash overdrafts, to the extent they are not offset by positive cash balances maintained by the Fund, at a rate equal to the Federal Funds Rate plus 0.50%. The “Reduction to custodian expenses” line item, if applicable, represents earnings on cash balances maintained by the Fund during the period. Such interest expense and other custodian fees may be paid with these earnings.
Security Transactions. Security transactions are recorded on the trade date. Realized gains and losses on securities sold are determined on the basis of identified cost.
Indemnifications. The Fund’s organizational documents provide current and former Trustees and officers with a limited indemnification against liabilities arising in connection with the performance of their duties to the Fund. In the normal course of business, the Fund may also enter into contracts that provide general indemnifications. The Fund’s maximum exposure under these arrangements is unknown as this would be dependent on future claims that may be made against the Fund. The risk of material loss from such claims is considered remote.
Federal Taxes. The Fund intends to comply with provisions of the Internal Revenue Code applicable to regulated investment companies and to
14 OPPENHEIMER EQUITY INCOME FUND/VA
2. Significant Accounting Policies (Continued)
distribute substantially all of its investment company taxable income to shareholders. Therefore, no federal income or excise tax provision is required. The Fund files income tax returns in U.S. federal and applicable state jurisdictions. The statute of limitations on the Fund’s tax return filings generally remains open for the three preceding fiscal reporting period ends. The Fund has analyzed its tax positions for the fiscal year ended December 31, 2015, including open tax years, and does not believe there are any uncertain tax positions requiring recognition in the Fund’s financial statements.
During the fiscal year ended December 31, 2015, the Fund did not utilize any capital loss carryforward to offset capital gains realized in that fiscal year. Details of the fiscal year ended December 31, 2015 capital loss carryforwards are included in the table below. Capital loss carryforwards with no expiration, if any, must be utilized prior to those with expiration dates. Capital losses with no expiration will be carried forward to future years if not offset by gains.
| Expiring | ||||
|
|
||||
| No expiration |
$ | 204,205 | ||
At period end, it is estimated that the capital loss carryforwards would be $428,290 which will not expire. The estimated capital loss carryforward represents the carryforward as of the end of the last fiscal year, increased or decreased by capital losses or gains realized in the first six months of the current fiscal year. During the reporting period, it is estimated that the Fund will not utilize any capital loss carryforward to offset realized capital gains.
Net investment income (loss) and net realized gain (loss) may differ for financial statement and tax purposes. The character of dividends and distributions made during the fiscal year from net investment income or net realized gains are determined in accordance with federal income tax requirements, which may differ from the character of net investment income or net realized gains presented in those financial statements in accordance with U.S. GAAP. Also, due to timing of dividends and distributions, the fiscal year in which amounts are distributed may differ from the fiscal year in which the income or net realized gain was recorded by the Fund.
The aggregate cost of securities and other investments and the composition of unrealized appreciation and depreciation of securities and other investments for federal income tax purposes at period end are noted in the following table. The primary difference between book and tax appreciation or depreciation of securities and other investments, if applicable, is attributable to the tax deferral of losses or tax realization of financial statement unrealized gain or loss.
| Federal tax cost of securities | $ | 7,518,023 | ||
| Federal tax cost of other investments | (5,053) | |||
|
|
|
|||
| Total federal tax cost | $ | 7,512,970 | ||
|
|
|
|||
| Gross unrealized appreciation | $ | 774,576 | ||
| Gross unrealized depreciation | (506,110) | |||
|
|
|
|||
| Net unrealized appreciation | $ | 268,466 | ||
|
|
|
Use of Estimates. The preparation of financial statements in conformity with U.S. GAAP requires management to make estimates and assumptions that affect the reported amounts of assets and liabilities and disclosure of contingent assets and liabilities at the date of the financial statements and the reported amounts of increases and decreases in net assets from operations during the reporting period. Actual results could differ from those estimates.
3. Securities Valuation
The Fund calculates the net asset value of its shares as of 4:00 P.M. Eastern time, on each day the New York Stock Exchange (the “Exchange”) is open for trading, except in the case of a scheduled early closing of the Exchange, in which case the Fund will calculate net asset value of the shares as of the scheduled early closing time of the Exchange.
The Fund’s Board has adopted procedures for the valuation of the Fund’s securities and has delegated the day-to-day responsibility for valuation determinations under those procedures to the Manager. The Manager has established a Valuation Committee which is responsible for determining a “fair valuation” for any security for which market quotations are not “readily available.” The Valuation Committee’s fair valuation determinations are subject to review, approval and ratification by the Fund’s Board at its next regularly scheduled meeting covering the calendar quarter in which the fair valuation was determined.
Valuation Methods and Inputs
Securities are valued using unadjusted quoted market prices, when available, as supplied primarily by third party pricing services or dealers.
The following methodologies are used to determine the market value or the fair value of the types of securities described below:
Securities traded on a registered U.S. securities exchange (including exchange-traded derivatives other than futures and futures options) are valued based on the last sale price of the security reported on the principal exchange on which it is traded, prior to the time when the Fund’s assets are valued. In the absence of a sale, the security is valued at the mean between the bid and asked price on the principal exchange or, if not available from the principal exchange, obtained from two dealers. If bid and asked prices are not available from either the exchange or two dealers, the security is valued by using one of the following methodologies (listed in order of priority): (1) a bid from the principal exchange, (2) the mean between the bid and asked price as provided by a single dealer, or (3) a bid from a single dealer. A security of a foreign issuer traded on a foreign exchange, but not listed on a registered U.S. securities exchange, is valued based on the last sale price on the principal exchange on which the security is traded, as identified by the third party pricing service used by the Manager, prior to the time when the Fund’s assets are valued. If the last sale price is unavailable, the security is
15 OPPENHEIMER EQUITY INCOME FUND/VA
NOTES TO FINANCIAL STATEMENTS Unaudited / Continued
3. Securities Valuation (Continued)
valued at the most recent official closing price on the principal exchange on which it is traded. If the last sales price or official closing price for a foreign security is not available, the security is valued at the mean between the bid and asked price per the exchange or, if not available from the exchange, obtained from two dealers. If bid and asked prices are not available from either the exchange or two dealers, the security is valued by using one of the following methodologies (listed in order of priority): (1) a bid from the exchange, (2) the mean between the bid and asked price as provided by a single dealer, or (3) a bid from a single dealer.
Shares of a registered investment company that are not traded on an exchange are valued at that investment company’s net asset value per share.
Corporate and government debt securities (of U.S. or foreign issuers) and municipal debt securities, event-linked bonds, loans, mortgage-backed securities, collateralized mortgage obligations, and asset-backed securities are valued at the mean between the “bid” and “asked” prices utilizing evaluated prices obtained from third party pricing services or broker-dealers who may use matrix pricing methods to determine the evaluated prices.
Short-term money market type debt securities with a remaining maturity of sixty days or less are valued at cost adjusted by the amortization of discount or premium to maturity (amortized cost), which approximates market value. Short-term debt securities with a remaining maturity in excess of sixty days are valued at the mean between the “bid” and “asked” prices utilizing evaluated prices obtained from third party pricing services or broker-dealers.
Structured securities, swaps, swaptions, and other over-the-counter derivatives are valued utilizing evaluated prices obtained from third party pricing services or broker-dealers.
A description of the standard inputs that may generally be considered by the third party pricing vendors in determining their evaluated prices is provided below.
| Security Type | Standard inputs generally considered by third-party pricing vendors | |
| Corporate debt, government debt, municipal, mortgage- backed and asset-backed securities |
Reported trade data, broker-dealer price quotations, benchmark yields, issuer spreads on comparable securities, the credit quality, yield, maturity, and other appropriate factors. | |
| Loans |
Information obtained from market participants regarding reported trade data and broker-dealer price quotations. | |
| Event-linked bonds |
Information obtained from market participants regarding reported trade data and broker-dealer price quotations. | |
| Structured securities |
Relevant market information such as the price of underlying financial instruments, stock market indices, foreign currencies, interest rate spreads, commodities, or the occurrence of other specific events. | |
| Swaps |
Relevant market information, including underlying reference assets such as credit spreads, credit event probabilities, index values, individual security values, forward interest rates, variable interest rates, volatility measures, and forward currency rates. |
If a market value or price cannot be determined for a security using the methodologies described above, or if, in the “good faith” opinion of the Manager, the market value or price obtained does not constitute a “readily available market quotation,” or a significant event has occurred that would materially affect the value of the security, the security is fair valued either (i) by a standardized fair valuation methodology applicable to the security type or the significant event as previously approved by the Valuation Committee and the Fund’s Board or (ii) as determined in good faith by the Manager’s Valuation Committee. The Valuation Committee considers all relevant facts that are reasonably available, through either public information or information available to the Manager, when determining the fair value of a security. Fair value determinations by the Manager are subject to review, approval and ratification by the Fund’s Board at its next regularly scheduled meeting covering the calendar quarter in which the fair valuation was determined. Those fair valuation standardized methodologies include, but are not limited to, valuing securities at the last sale price or initially at cost and subsequently adjusting the value based on: changes in company specific fundamentals, changes in an appropriate securities index, or changes in the value of similar securities which may be further adjusted for any discounts related to security-specific resale restrictions. When possible, such methodologies use observable market inputs such as unadjusted quoted prices of similar securities, observable interest rates, currency rates and yield curves. The methodologies used for valuing securities are not necessarily an indication of the risks associated with investing in those securities nor can it be assured that the Fund can obtain the fair value assigned to a security if it were to sell the security.
To assess the continuing appropriateness of security valuations, the Manager, or its third party service provider who is subject to oversight by the Manager, regularly compares prior day prices, prices on comparable securities, and sale prices to the current day prices and challenges those prices exceeding certain tolerance levels with the third party pricing service or broker source. For those securities valued by fair valuations, whether through a standardized fair valuation methodology or a fair valuation determination, the Valuation Committee reviews and affirms the reasonableness of the valuations based on such methodologies and fair valuation determinations on a regular basis after considering all relevant information that is reasonably available.
Classifications
Each investment asset or liability of the Fund is assigned a level at measurement date based on the significance and source of the inputs to its valuation. Various data inputs are used in determining the value of each of the Fund’s investments as of the reporting period end. These data inputs are categorized in the following hierarchy under applicable financial accounting standards:
1) Level 1-unadjusted quoted prices in active markets for identical assets or liabilities (including securities actively traded on a securities exchange)
16 OPPENHEIMER EQUITY INCOME FUND/VA
3. Securities Valuation (Continued)
2) Level 2-inputs other than unadjusted quoted prices that are observable for the asset or liability (such as unadjusted quoted prices for similar assets and market corroborated inputs such as interest rates, prepayment speeds, credit risks, etc.)
3) Level 3-significant unobservable inputs (including the Manager’s own judgments about assumptions that market participants would use in pricing the asset or liability).
The inputs used for valuing securities are not necessarily an indication of the risks associated with investing in those securities.
The Fund classifies each of its investments in investment companies which are publicly offered as Level 1. Investment companies that are not publicly offered are measured using net asset value as a practical expedient, and are not classified in the fair value hierarchy.
The table below categorizes amounts that are included in the Fund’s Statement of Assets and Liabilities at period end based on valuation input level:
| Level 1— Unadjusted Quoted Prices |
Level 2— Other Significant Observable Inputs |
Level 3— Significant Inputs |
Value | |||||||||||||
|
|
||||||||||||||||
| Assets Table |
||||||||||||||||
| Investments, at Value: |
||||||||||||||||
| Common Stocks |
||||||||||||||||
| Consumer Discretionary |
$ | 725,377 | $ | — | $ | — | $ | 725,377 | ||||||||
| Consumer Staples |
481,238 | — | — | 481,238 | ||||||||||||
| Energy |
729,838 | — | — | 729,838 | ||||||||||||
| Financials |
2,287,891 | — | — | 2,287,891 | ||||||||||||
| Health Care |
778,702 | — | — | 778,702 | ||||||||||||
| Industrials |
444,992 | — | — | 444,992 | ||||||||||||
| Information Technology |
757,970 | — | — | 757,970 | ||||||||||||
| Materials |
102,855 | — | — | 102,855 | ||||||||||||
| Telecommunication Services |
231,501 | — | — | 231,501 | ||||||||||||
| Utilities |
219,670 | — | — | 219,670 | ||||||||||||
| Preferred Stocks |
607,463 | 95,634 | — | 703,097 | ||||||||||||
| Rights, Warrants and Certificates |
68 | — | — | 68 | ||||||||||||
| Non-Convertible Corporate Bond and Note |
— | 17,482 | — | 17,482 | ||||||||||||
| Convertible Corporate Bonds and Notes |
— | 145,024 | — | 145,024 | ||||||||||||
| Structured Security |
— | 14,346 | — | 14,346 | ||||||||||||
| Investment Company |
152,436 | — | — | 152,436 | ||||||||||||
| Exchange-Traded Option Purchased |
50 | — | — | 50 | ||||||||||||
|
|
|
|||||||||||||||
| Total Assets |
$ | 7,520,051 | $ | 272,486 | $ | — | $ | 7,792,537 | ||||||||
|
|
|
|||||||||||||||
| Liabilities Table |
||||||||||||||||
| Other Financial Instruments: |
||||||||||||||||
| Options written, at value |
$ | — | $ | (11,101) | $ | — | $ | (11,101) | ||||||||
|
|
|
|||||||||||||||
| Total Liabilities |
$ | — | $ | (11,101) | $ | — | $ | (11,101) | ||||||||
|
|
|
|||||||||||||||
Forward currency exchange contracts and futures contracts, if any, are reported at their unrealized appreciation/depreciation at measurement date, which represents the change in the contract’s value from trade date. All additional assets and liabilities included in the above table are reported at their market value at measurement date.
The table below shows the transfers between Level 1 and Level 2. The Fund’s policy is to recognize transfers in and transfers out as of the beginning of the reporting period.
| Transfers into Level 1* | Transfers out of Level 2* | |||||||
|
|
||||||||
| Assets Table |
||||||||
| Investments, at Value: |
||||||||
| Preferred Stocks |
$ | 126,635 | $ | (126,635) | ||||
|
|
|
|||||||
| Total Assets |
$ | 126,635 | $ | (126,635) | ||||
|
|
|
|||||||
* Transfers from Level 2 to Level 1 are a result of the availability of quoted prices from an active market which were not available and have become available.
4. Investments and Risks
Investments in Affiliated Funds. The Fund is permitted to invest in other mutual funds advised by the Manager (“Affiliated Funds”). Affiliated Funds are open-end management investment companies registered under the 1940 Act, as amended. The Manager is the investment adviser of, and the Sub-Adviser provides investment and related advisory services to, the Affiliated Funds. When applicable, the Fund’s investments in Affiliated Funds are included in the Statement of Investments. Shares of Affiliated Funds are valued at their net asset value per share. As a shareholder, the Fund is subject to its proportional share of the Affiliated Funds’ expenses, including their management fee. The Manager will waive fees and/or reimburse Fund expenses in an amount equal to the indirect management fees incurred through the Fund’s investment in the Affiliated Funds.
17 OPPENHEIMER EQUITY INCOME FUND/VA
NOTES TO FINANCIAL STATEMENTS Unaudited / Continued
4. Investments and Risks (Continued)
Each of the Affiliated Funds in which the Fund invests has its own investment risks, and those risks can affect the value of the Fund’s investments and therefore the value of the Fund’s shares. To the extent that the Fund invests more of its assets in one Affiliated Fund than in another, the Fund will have greater exposure to the risks of that Affiliated Fund.
Investment in Oppenheimer Institutional Money Market Fund. The Fund is permitted to invest daily available cash balances in a money market Affiliated Fund. The Fund may invest the available cash in Class E shares of Oppenheimer Institutional Money Market Fund (“IMMF”) to seek current income while preserving liquidity or for defensive purposes. IMMF is regulated as a money market fund under the Investment Company Act of 1940, as amended.
Master Limited Partnerships (“MLPs”). MLPs issue common units that represent an equity ownership interest in a partnership and provide limited voting rights. MLP common units are registered with the Securities and Exchange Commission (“SEC”), and are freely tradable on securities exchanges such as the NYSE and the NASDAQ Stock Market (“NASDAQ”), or in the over-the-counter (“OTC”) market. An MLP consists of one or more general partners, who conduct the business, and one or more limited partners, who contribute capital. MLP common unit holders have a limited role in the partnership’s operations and management. The Fund, as a limited partner, normally would not be liable for the debts of the MLP beyond the amounts the Fund has contributed, but would not be shielded to the same extent that a shareholder of a corporation would be. In certain circumstances creditors of an MLP would have the right to seek return of capital distributed to a limited partner. This right of an MLP’s creditors would continue after the Fund sold its investment in the MLP.
Structured Securities. The Fund invests in structured securities whose market values, interest rates and/or redemption prices are linked to the performance of underlying foreign currencies, interest rate spreads, stock market indices, prices of individual securities, commodities or other financial instruments or the occurrence of other specific events. The structured securities are often leveraged, increasing the volatility of each note’s market value relative to the change in the underlying linked financial element or event. Fluctuations in value of these securities are recorded as unrealized gains and losses in the accompanying Statement of Operations. The Fund records a realized gain or loss when a structured security is sold or matures.
Equity Security Risk. Stocks and other equity securities fluctuate in price. The value of the Fund’s portfolio may be affected by changes in the equity markets generally. Equity markets may experience significant short-term volatility and may fall sharply at times. Different markets may behave differently from each other and U.S. equity markets may move in the opposite direction from one or more foreign stock markets. Adverse events in any part of the equity or fixed-income markets may have unexpected negative effects on other market segments.
The prices of individual equity securities generally do not all move in the same direction at the same time and a variety of factors can affect the price of a particular company’s securities. These factors may include, but are not limited to, poor earnings reports, a loss of customers, litigation against the company, general unfavorable performance of the company’s sector or industry, or changes in government regulations affecting the company or its industry.
5. Market Risk Factors
The Fund’s investments in securities and/or financial derivatives may expose the Fund to various market risk factors:
Commodity Risk. Commodity risk relates to the change in value of commodities or commodity indexes as they relate to increases or decreases in the commodities market. Commodities are physical assets that have tangible properties. Examples of these types of assets are crude oil, heating oil, metals, livestock, and agricultural products.
Credit Risk. Credit risk relates to the ability of the issuer of debt to meet interest and principal payments, or both, as they come due. In general, lower-grade, higher-yield debt securities are subject to credit risk to a greater extent than lower-yield, higher-quality securities.
Equity Risk. Equity risk relates to the change in value of equity securities as they relate to increases or decreases in the general market.
Foreign Exchange Rate Risk. Foreign exchange rate risk relates to the change in the U.S. dollar value of a security held that is denominated in a foreign currency. The U.S. dollar value of a foreign currency denominated security will decrease as the dollar appreciates against the currency, while the U.S. dollar value will increase as the dollar depreciates against the currency.
Interest Rate Risk. Interest rate risk refers to the fluctuations in value of fixed-income securities resulting from the inverse relationship between price and yield. For example, an increase in general interest rates will tend to reduce the market value of already issued fixed-income investments, and a decline in general interest rates will tend to increase their value. In addition, debt securities with longer maturities, which tend to have higher yields, are subject to potentially greater fluctuations in value from changes in interest rates than obligations with shorter maturities.
Volatility Risk. Volatility risk refers to the magnitude of the movement, but not the direction of the movement, in a financial instrument’s price over a defined time period. Large increases or decreases in a financial instrument’s price over a relative time period typically indicate greater volatility risk, while small increases or decreases in its price typically indicate lower volatility risk.
6. Use of Derivatives
The Fund’s investment objective not only permits the Fund to purchase investment securities, it also allows the Fund to enter into various types of derivatives contracts, including, but not limited to, futures contracts, forward currency exchange contracts, credit default swaps, interest rate swaps, total return swaps, variance swaps and purchased and written options. In doing so, the Fund will employ strategies in differing combinations to permit
18 OPPENHEIMER EQUITY INCOME FUND/VA
6. Use of Derivatives (Continued)
it to increase, decrease, or change the level or types of exposure to market risk factors. These instruments may allow the Fund to pursue its objectives more quickly and efficiently than if it were to make direct purchases or sales of securities capable of effecting a similar response to market factors. Such contracts may be entered into through a bilateral over-the-counter (“OTC”) transaction, or through a securities or futures exchange and cleared through a clearinghouse.
Derivatives may have little or no initial cash investment relative to their market value exposure and therefore can produce significant gains or losses in excess of their cost due to unanticipated changes in the market risk factors and the overall market. This use of embedded leverage allows the Fund to increase its market value exposure relative to its net assets and can substantially increase the volatility of the Fund’s performance. In instances where the Fund is using derivatives to decrease, or hedge, exposures to market risk factors for securities held by the Fund, there are also risks that those derivatives may not perform as expected resulting in losses for the combined or hedged positions. Some derivatives have the potential for unlimited loss, regardless of the size of the Fund’s initial investment.
Additional associated risks from investing in derivatives also exist and potentially could have significant effects on the valuation of the derivative and the Fund. Typically, the associated risks are not the risks that the Fund is attempting to increase or decrease exposure to, per its investment objectives, but are the additional risks from investing in derivatives. Examples of these associated risks are liquidity risk, which is the risk that the Fund will not be able to sell the derivative in the open market in a timely manner, and counterparty credit risk, which is the risk that the counterparty will not fulfill its obligation to the Fund.
The Fund’s actual exposures to these market risk factors and associated risks during the period are discussed in further detail, by derivative type, below.
Option Activity
The Fund may buy and sell put and call options, or write put and call options. When an option is written, the Fund receives a premium and becomes obligated to sell or purchase the underlying security, currency or other underlying financial instrument at a fixed price, upon exercise of the option.
Options can be traded through an exchange or through a privately negotiated arrangement with a dealer in an OTC transaction. Options traded through an exchange are generally cleared through a clearinghouse (such as The Options Clearing Corporation). The difference between the premium received or paid, and market value of the option, is recorded as unrealized appreciation or depreciation. The net change in unrealized appreciation or depreciation is reported in the Statement of Operations. When an option is exercised, the cost of the security purchased or the proceeds of the security sale are adjusted by the amount of premium received or paid. Upon the expiration or closing of the option transaction, a gain or loss is reported in the Statement of Operations.
The Fund has purchased put options on individual equity securities and/or equity indexes to decrease exposure to equity risk. A purchased put option becomes more valuable as the price of the underlying financial instrument depreciates relative to the strike price.
During the reporting period, the Fund had an ending monthly average market value of $157 on purchased put options.
Options written, if any, are reported in a schedule following the Statement of Investments and as a liability in the Statement of Assets and Liabilities. Securities held in collateral accounts to cover potential obligations with respect to outstanding written options are noted in the Statement of Investments.
The risk in writing a call option is that the market price of the security increases and if the option is exercised, the Fund must either purchase the security at a higher price for delivery or, if the Fund owns the underlying security, give up the opportunity for profit. The risk in writing a put option is that the Fund may incur a loss if the market price of the security decreases and the option is exercised. The risk in buying an option is that the Fund pays a premium whether or not the option is exercised. The Fund also has the additional risk that there may be an illiquid market where the Fund is unable to close the contract.
The Fund has written put options on individual equity securities and/or equity indexes to increase exposure to equity risk. A written put option becomes more valuable as the price of the underlying financial instrument appreciates relative to the strike price.
The Fund has written call options on individual equity securities and/or equity indexes to decrease exposure to equity risk. A written call option becomes more valuable as the price of the underlying financial instrument depreciates relative to the strike price.
During the reporting period, the Fund had an ending monthly average market value of $4,485 and $1,210 on written call options and written put options, respectively.
Additional associated risks to the Fund include counterparty credit risk and liquidity risk.
Written option activity for the reporting period was as follows:
| Number of Contracts |
Amount of Premiums |
|||||||
|
|
||||||||
| Options outstanding as of December 31, 2015 | 49 | $ | 9,487 | |||||
| Options written |
271 | 29,908 | ||||||
| Options closed or expired |
(145) | (12,135) | ||||||
| Options exercised |
(131) | (22,207) | ||||||
|
|
|
|||||||
| Options outstanding as of June 30, 2016 | 44 | $ | 5,053 | |||||
|
|
|
|||||||
Counterparty Credit Risk. Derivative positions are subject to the risk that the counterparty will not fulfill its obligation to the Fund. The Fund intends to enter into derivative transactions with counterparties that the Manager believes to be creditworthy at the time of the transaction.
19 OPPENHEIMER EQUITY INCOME FUND/VA
NOTES TO FINANCIAL STATEMENTS Unaudited / Continued
6. Use of Derivatives (Continued)
For financial reporting purposes, the Fund does not offset derivative assets and derivative liabilities that are subject to netting arrangements in the Statement of Assets and Liabilities. Bankruptcy or insolvency laws of a particular jurisdiction may impose restrictions on or prohibitions against the right of offset in bankruptcy, insolvency or other events.
The Fund’s risk of loss from counterparty credit risk on exchange-traded derivatives cleared through a clearinghouse and for centrally cleared swaps is generally considered lower than as compared to OTC derivatives. However, counterparty credit risk exists with respect to initial and variation margin deposited/paid by the Fund that is held in futures commission merchant, broker and/or clearinghouse accounts for such exchange-traded derivatives and for centrally cleared swaps.
With respect to centrally cleared swaps, such transactions will be submitted for clearing, and if cleared, will be held in accounts at futures commission merchants or brokers that are members of clearinghouses. While brokers, futures commission merchants and clearinghouses are required to segregate customer margin from their own assets, in the event that a broker, futures commission merchant or clearinghouse becomes insolvent or goes into bankruptcy and at that time there is a shortfall in the aggregate amount of margin held by the broker, futures commission merchant or clearinghouse for all its customers, U.S. bankruptcy laws will typically allocate that shortfall on a pro-rata basis across all the broker’s, futures commission merchant’s or clearinghouse’s customers, potentially resulting in losses to the Fund.
There is the risk that a broker, futures commission merchant or clearinghouse will decline to clear a transaction on the Fund’s behalf, and the Fund may be required to pay a termination fee to the executing broker with whom the Fund initially enters into the transaction. Clearinghouses may also be permitted to terminate centrally cleared swaps at any time. The Fund is also subject to the risk that the broker or futures commission merchant will improperly use the Fund’s assets deposited/paid as initial or variation margin to satisfy payment obligations of another customer. In the event of a default by another customer of the broker or futures commission merchant, the Fund might not receive its variation margin payments from the clearinghouse, due to the manner in which variation margin payments are aggregated for all customers of the broker/futures commission merchant.
Collateral and margin requirements differ by type of derivative. Margin requirements are established by the broker, futures commission merchant or clearinghouse for exchange-traded and cleared derivatives, including centrally cleared swaps. Brokers, futures commission merchants and clearinghouses can ask for margin in excess of the regulatory minimum, or increase the margin amount, in certain circumstances.
The following table presents the valuations of derivative instruments by risk exposure as reported within the Statement of Assets and Liabilities at period end:
| Asset Derivatives |
Liability Derivatives |
|||||||||||
| Derivatives Not Accounted for as Hedging Instruments |
Statement of Assets and Liabilities Location |
Value | Statement of Assets and Liabilities Location |
Value | ||||||||
|
|
||||||||||||
| Equity contracts |
Investments, at value |
$ | 50* | Options written, at value |
$ | 11,101 | ||||||
*Amounts relate to purchased option contracts and purchased swaption contracts, if any.
The effect of derivative instruments on the Statement of Operations is as follows:
| Amount of Realized Gain or (Loss) Recognized on Derivatives | ||||||||||||
|
|
||||||||||||
| Derivatives Not Accounted for as Hedging Instruments |
Investment on options |
Closing and expiration of option contracts written |
Total | |||||||||
|
|
||||||||||||
| Equity contracts |
$ | 1,188 | $ | 12,135 | $ | 13,323 | ||||||
*Includes purchased option contracts and purchased swaption contracts and written option contracts exercised, if any.
| Amount of Change in Unrealized Gain or (Loss) Recognized on Derivatives | ||||||||||||
|
|
||||||||||||
| Derivatives Not Accounted for as Hedging Instruments |
Investments* | Option contracts written |
Total | |||||||||
|
|
||||||||||||
| Equity contracts |
$ | 1,181 | $ | (10,910) | $ | (9,729) | ||||||
*Includes purchased option contracts and purchased swaption contracts, if any.
7. Shares of Beneficial Interest
The Fund has authorized an unlimited number of $0.001 par value shares of beneficial interest of each class. Transactions in shares of beneficial interest were as follows:
20 OPPENHEIMER EQUITY INCOME FUND/VA
7. Shares of Beneficial Interest (Continued)
| Six Months Ended June 30, 2016 | Year Ended December 31, 2015 | |||||||||||||||
| Shares | Amount | Shares | Amount | |||||||||||||
|
|
||||||||||||||||
| Non-Service Shares |
||||||||||||||||
| Sold |
4,501 | $ | 42,193 | 6,593 | $ | 71,817 | ||||||||||
| Dividends and/or distributions reinvested |
2,351 | 21,464 | 3,275 | 36,220 | ||||||||||||
| Redeemed |
(3,358) | (32,142) | (1,387) | (16,248) | ||||||||||||
|
|
|
|||||||||||||||
| Net increase |
3,494 | $ | 31,515 | 8,481 | $ | 91,789 | ||||||||||
|
|
|
|||||||||||||||
|
|
||||||||||||||||
| Service Shares |
||||||||||||||||
| Sold |
12,465 | $ | 139,400 | 73,064 | $ | 1,015,107 | ||||||||||
| Dividends and/or distributions reinvested |
35,353 | 396,306 | 76,880 | 1,034,803 | ||||||||||||
| Redeemed |
(77,884) | (876,302) | (232,573) | (3,069,407) | ||||||||||||
|
|
|
|||||||||||||||
| Net decrease |
(30,066) | $ | (340,596) | (82,629) | $ | (1,019,497) | ||||||||||
|
|
|
|||||||||||||||
8. Purchases and Sales of Securities
The aggregate cost of purchases and proceeds from sales of securities, other than short-term obligations and investments in IMMF, for the reporting period were as follows:
| Purchases | Sales | |||||||||
|
|
||||||||||
| Investment securities |
$1,839,317 | $2,536,093 | ||||||||
9. Fees and Other Transactions with Affiliates
Management Fees. Under the investment advisory agreement, the Fund pays the Manager a management fee based on the daily net assets of the Fund at an annual rate as shown in the following table:
| Fee Schedule | ||||
|
|
||||
| Up to $200 million |
0.75% | |||
| Next $200 million |
0.72 | |||
| Next $200 million |
0.69 | |||
| Next $200 million |
0.66 | |||
| Over $800 million |
0.60 | |||
The Fund’s effective management fee for the reporting period was 0.75% of average annual net assets before any applicable waivers.
Sub-Adviser Fees. The Manager has retained the Sub-Adviser to provide the day-to-day portfolio management of the Fund. Under the Sub-Advisory Agreement, the Manager pays the Sub-Adviser an annual fee in monthly installments, equal to a percentage of the investment management fee collected by the Manager from the Fund, which shall be calculated after any investment management fee waivers. The fee paid to the Sub-Adviser is paid by the Manager, not by the Fund.
Transfer Agent Fees. OFI Global (the “Transfer Agent”) serves as the transfer and shareholder servicing agent for the Fund. The Fund pays the Transfer Agent a fee based on annual net assets. Fees incurred and average net assets for each class with respect to these services are detailed in the Statement of Operations and Financial Highlights, respectively.
Sub-Transfer Agent Fees. The Transfer Agent has retained Shareholder Services, Inc., a wholly-owned subsidiary of OFI (the “Sub-Transfer Agent”), to provide the day-to-day transfer agent and shareholder servicing of the Fund. Under the Sub-Transfer Agency Agreement, the Transfer Agent pays the Sub-Transfer Agent an annual fee in monthly installments, equal to a percentage of the transfer agent fee collected by the Transfer Agent from the Fund, which shall be calculated after any applicable fee waivers. The fee paid to the Sub-Transfer Agent is paid by the Transfer Agent, not by the Fund.
Trustees’ Compensation. The Fund’s Board of Trustees (“Board”) has adopted a compensation deferral plan for Independent Trustees that enables Trustees to elect to defer receipt of all or a portion of the annual compensation they are entitled to receive from the Fund. For purposes of determining the amount owed to the Trustees under the plan, deferred amounts are treated as though equal dollar amounts had been invested in shares of the Fund or in other Oppenheimer funds selected by the Trustees. The Fund purchases shares of the funds selected for deferral by the Trustees in amounts equal to his or her deemed investment, resulting in a Fund asset equal to the deferred compensation liability. Such assets are included as a component of “Other” within the asset section of the Statement of Assets and Liabilities. Deferral of Trustees’ fees under the plan will not affect the net assets of the Fund and will not materially affect the Fund’s assets, liabilities or net investment income per share. Amounts will be deferred until distributed in accordance with the compensation deferral plan.
Distribution and Service Plan for Service Shares. The Fund has adopted a Distribution and Service Plan (the “Plan”) pursuant to Rule 12b-1 under the 1940 Act for Service shares to pay OppenheimerFunds Distributor, Inc. (the “Distributor”), for distribution related services, personal service and account maintenance for the Fund’s Service shares. Under the Plan, payments are made periodically at an annual rate of 0.25% of the daily net assets of
21 OPPENHEIMER EQUITY INCOME FUND/VA
NOTES TO FINANCIAL STATEMENTS Unaudited / Continued
9. Fees and Other Transactions with Affiliates (Continued)
Service shares of the Fund. The Distributor currently uses all of those fees to compensate sponsors of the insurance product that offers Fund shares, for providing personal service and maintenance of accounts of their variable contract owners that hold Service shares. These fees are paid out of the Fund’s assets on an on-going basis and increase operating expenses of the Service shares, which results in lower performance compared to the Fund’s shares that are not subject to a service fee. Fees incurred by the Fund under the Plan are detailed in the Statement of Operations.
Waivers and Reimbursements of Expenses. The Manager has contractually agreed to limit the Fund’s expenses after payments, waivers and/or reimbursements and reduction to custodian expenses, excluding expenses incurred directly or indirectly by the Fund as a result of investments in other investment companies, wholly-owned subsidiaries and pooled investment vehicles; so that those expenses, as percentages of daily net assets, will not exceed the annual rate of 0.80% for Non-Service shares and 1.05% for Service shares. The expense limitations do not include interest and fees from borrowing, and other expenses not incurred in the ordinary course of the Fund’s business. During the reporting period, the Manager waived fees and/or reimbursed the Fund $1,635 and $38,381 for Non-Service and Service shares, respectively.
The Manager will waive fees and/or reimburse Fund expenses in an amount equal to the indirect management fees incurred through the Fund’s investment in IMMF. During the reporting period, the Manager waived fees and/or reimbursed the Fund $21 for IMMF management fees.
Waivers and/or reimbursements may be modified or terminated as set forth according to the terms in the prospectus.
10. Risk Exposures and the Use of Derivative Instruments
Securities Sold Short. The Fund sells securities that it does not own, and it will therefore be obligated to purchase such securities at a future date. Upon entering into a short position, the Fund is required to segregate cash or securities at its custodian which are pledged for the benefit of the lending broker and/or to deposit and pledge cash directly at the lending broker, with a value equal to a certain percentage, exceeding 100%, of the value of the securities that it sold short. Cash that has been segregated and pledged for this purpose will be disclosed on the Statement of Assets and Liabilities; securities that have been segregated and pledged for this purpose are disclosed as such in the Statement of Investments. The value of the open short position is recorded as a liability, and the Fund records an unrealized gain or loss to the extent of the difference between the proceeds received and the change in value of the open short position. The Fund records a realized gain or loss when the short position is closed out. By entering into short sales, the Fund bears the market risk of increases in value of the security sold short in excess of the proceeds received. Until the security is replaced, the Fund is required to pay the lender any dividend or interest earned. Dividend expense on short sales is treated as an expense in the Statement of Operations.
At period end, the Fund had no outstanding securities sold short.
Joint Credit Facility. A number of mutual funds managed by the Manager participate in a $1.28 billion revolving credit facility (the “Facility”) intended to provide short-term financing, if necessary, subject to certain restrictions in connection with atypical redemption activity. Expenses and fees related to the Facility are paid by the participating funds and are disclosed separately or as other expenses on the Statement of Operations. The Fund did not utilize the Facility during the reporting period.
11. Pending Litigation
In 2009, several putative class action lawsuits were filed and later consolidated before the U.S. District Court for the District of Colorado against OppenheimerFunds, Inc. (“OFI”), OppenheimerFunds Distributor, Inc. (“OFDI”), and Oppenheimer Rochester California Municipal Fund, a fund advised by OFI Global Asset Management, Inc. and distributed by the Distributor (the “California Fund”), in connection with the California Fund’s investment performance. The plaintiffs asserted claims against OFI, OFDI and certain present and former trustees and officers of the California Fund under the federal securities laws, alleging, among other things, that the disclosure documents of the California Fund contained misrepresentations and omissions and the investment policies of the California Fund were not followed. Plaintiffs in the suit filed an amended complaint and defendants filed a motion to dismiss. In 2011, the court issued an order which granted in part and denied in part the defendants’ motion to dismiss. In 2012, plaintiffs filed a motion, which defendants opposed, to certify a class and appoint class representatives and class counsel. In March 2015, the court granted plaintiffs’ motion for class certification. In May 2015, the U.S. Court of Appeals for the Tenth Circuit vacated the class certification order and remanded the matter to the district court for further proceedings. In October 2015, the district court reaffirmed its order and determined that the suit will proceed as a class action. In December 2015, the Tenth Circuit denied defendants’ petition to appeal the district court’s reaffirmed class certification order.
OFI and OFDI believe the suit is without merit; that it is premature to render any opinion as to the likelihood of an outcome unfavorable to them in the suit; and that no estimate can yet be made as to the amount or range of any potential loss. Furthermore, OFI believes that the suit should not impair the ability of OFI or OFDI to perform their respective duties to the Fund and that the outcome of the suit should not have any material effect on the operations of any of the Oppenheimer funds.
22 OPPENHEIMER EQUITY INCOME FUND/VA
PORTFOLIO PROXY VOTING POLICIES AND GUIDELINES; UPDATES TO STATEMENTS OF INVESTMENTS Unaudited
The Fund has adopted Portfolio Proxy Voting Policies and Guidelines under which the Fund votes proxies relating to securities (“portfolio proxies”) held by the Fund. A description of the Fund’s Portfolio Proxy Voting Policies and Guidelines is available (i) without charge, upon request, by calling the Fund toll-free at 1.800.525.7048, (ii) on the Fund’s website at www.oppenheimerfunds.com, and (iii) on the SEC’s website at www.sec.gov. In addition, the Fund is required to file Form N-PX, with its complete proxy voting record for the 12 months ended June 30th, no later than August 31st of each year. The Fund’s voting record is available (i) without charge, upon request, by calling the Fund toll-free at 1.800.525.7048, and (ii) in the Form N-PX filing on the SEC’s website at www.sec.gov.
The Fund files its complete schedule of portfolio holdings with the SEC for the first quarter and the third quarter of each fiscal year on Form N-Q. The Fund’s Form N-Q filings are available on the SEC’s website at www.sec.gov. Those forms may be reviewed and copied at the SEC’s Public Reference Room in Washington, D.C. Information on the operation of the Public Reference Room may be obtained by calling 1-800-SEC-0330.
23 OPPENHEIMER EQUITY INCOME FUND/VA
DISTRIBUTION SOURCES Unaudited
For any distribution that took place over the Fund’s reporting period, the table below details on a per-share basis the percentage of the Fund’s total distribution payment amount that was derived from the following sources: net income, net profit from the sale of securities, and other capital sources. This information is based upon income and capital gains using generally accepted accounting principles as of the date of each distribution. For certain securities, such as Real Estate Investment Trusts (“REITs”) and Master Limited Partnerships (“MLPs”), the percentages attributed to each category are estimated using historical information because the character of the amounts received from the REITs and MLPs in which the Fund invests is unknown until after the end of the calendar year. Because the Fund is actively managed, the relative amount of the Fund’s total distributions derived from various sources over the calendar year may change. Please note that this information should not be used for tax reporting purposes as the tax character of distributable income may differ from the amounts used for this notification. You will receive IRS tax forms in the first quarter of each calendar year detailing the actual amount of the taxable and non-taxable portion of distributions paid to you during the tax year.
For the most current information, please go to oppenheimerfunds.com. Select your Fund, then the ‘Detailed’ tab; where ‘Dividends’ are shown, the Fund’s latest pay date will be followed by the sources of any distribution, updated daily.
| Fund Name | Pay Date |
Net Income | Net Profit from Sale |
Other Capital Sources | ||||||||||
| Oppenheimer Equity Income Fund/VA |
6/21/16 | 50.1% | 0.0% | 49.9% | ||||||||||
24 OPPENHEIMER EQUITY INCOME FUND/VA
THIS PAGE INTENTIONALLY LEFT BLANK.
25 OPPENHEIMER EQUITY INCOME FUND/VA
THIS PAGE INTENTIONALLY LEFT BLANK.
26 OPPENHEIMER EQUITY INCOME FUND/VA
THIS PAGE INTENTIONALLY LEFT BLANK.
27 OPPENHEIMER EQUITY INCOME FUND/VA
OPPENHEIMER EQUITY INCOME FUND/VA
A Series of Oppenheimer Variable Account Funds
| Trustees and Officers | Sam Freedman, Chairman of the Board of Trustees and Trustee | |
| Jon S. Fossel, Trustee | ||
| Richard F. Grabish, Trustee | ||
| Beverly L. Hamilton, Trustee | ||
| Victoria J. Herget, Trustee | ||
| Robert J. Malone, Trustee | ||
| F. William Marshall, Jr., Trustee | ||
| Karen L. Stuckey, Trustee | ||
| James D. Vaughn, Trustee | ||
| Arthur P. Steinmetz, Trustee, President and Principal Executive Officer | ||
| Michael S. Levine, Vice President | ||
| Cynthia Lo Bessette, Secretary and Chief Legal Officer | ||
| Jennifer Sexton, Vice President and Chief Business Officer | ||
| Mary Ann Picciotto, Chief Compliance Officer and Chief Anti-Money Laundering Officer | ||
| Brian S. Petersen, Treasurer and Principal Financial & Accounting Officer | ||
| Manager | OFI Global Asset Management, Inc. | |
| Sub-Adviser | OppenheimerFunds, Inc. | |
| Distributor | OppenheimerFunds Distributor, Inc. | |
| Transfer and Shareholder Servicing Agent |
OFI Global Asset Management, Inc. | |
| Sub-Transfer Agent | Shareholder Services, Inc. | |
| DBA OppenheimerFunds Services | ||
| Independent | KPMG LLP | |
| Registered | ||
| Public | ||
| Accounting | ||
| Firm | ||
| Legal Counsel | Ropes & Gray LLP | |
| Before investing in any of the Oppenheimer funds, investors should carefully consider a fund’s investment objectives, risks, charges and expenses. Fund prospectuses and summary prospectuses contain this and other information about the funds, and may be obtained by asking your financial advisor, or calling us at 1.800.988.8287. Read prospectuses and summary prospectuses carefully before investing. | ||
| The financial statements included herein have been taken from the records of the Fund without examination of those records by the independent registered public accounting firm. | ||
| © 2016 OppenheimerFunds, Inc. All rights reserved. Oppenheimer funds are distributed by OppenheimerFunds Distributor, Inc. | ||

PORTFOLIO MANAGERS: Mark Hamilton, Dokyoung Lee, CFA, Ben Rockmuller, CFA and Alessio de Longis, CFA
AVERAGE ANNUAL TOTAL RETURNS FOR THE PERIODS ENDED 6/30/16
| Inception Date |
6-Months |
1-Year |
Since Inception |
|||||||||||||
| Non-Service Shares |
11/14/13 | 3.46% | -0.01% | 1.94% | ||||||||||||
| Service Shares |
11/14/13 | 3.21 | -0.39 | 1.69 | ||||||||||||
| Bank of America Merrill Lynch 3-Month U.S. Treasury Bill Index |
0.15 | 0.19 | 0.10 | |||||||||||||
Performance data quoted represents past performance, which does not guarantee future results. The investment return and principal value of an investment in the Fund will fluctuate so that an investor’s shares, when redeemed, may be worth more or less than their original cost. Current performance may be lower or higher than the performance quoted. For performance data current to the most recent month end, call us at 1.800.988.8287. The Fund’s total returns should not be expected to be the same as the returns of other funds, whether or not both funds have the same portfolio managers and/or similar names. The Fund’s total returns include changes in share price and reinvested distributions but do not include the charges associated with the separate account products that offer this Fund. Such performance would have been lower if such charges were taken into account.
The Fund’s performance is compared to the performance of the Bank of America Merrill Lynch 3-Month U.S. Treasury Bill Index. The Bank of America Merrill Lynch 3-month U.S. Treasury Bill Index is an index of short-term U.S. Government securities with a remaining term to final maturity of less than three months. The index is unmanaged, includes the reinvestment of dividends and cannot be purchased directly by investors. While index comparisons may be useful to provide a benchmark for the Fund’s performance, it must be noted that the Fund’s investments are not limited to the investments comprising the Index. Index performance includes reinvestment of income, but does not reflect transaction costs, fees, expenses or taxes. Index performance is shown for illustrative purposes only as a benchmark for the Fund’s performance, and does not predict or depict performance of the Fund. The Fund’s performance reflects the effects of the Fund’s business and operating expenses.
TOP HOLDINGS AND ALLOCATIONS
2 OPPENHEIMER GLOBAL MULTI-ALTERNATIVES FUND/VA
Fund Performance Discussion
The Fund’s Non-Service shares returned 3.46% during the reporting period, versus the Bank of America Merrill Lynch 3-Month U.S. Treasury Bill Index (the “Index”), which returned 0.15% during the same period. The Fund outperformed the Index in a period where the alternative strategies and assets it invests in performed better than the Index.
MARKET OVERVIEW
2016 started off with credit markets widening amid stock market weakness. The Federal Reserve’s (the “Fed”) statement in January suggested they would continue gradually raising rates this year, which further roiled markets as global growth continued to show risk of slowing further. Risk asset weakness and the Bank of Japan cutting rates to negative levels at the end of January helped U.S. Treasury yields fall dramatically.
By mid-February markets began to turn. The European Central Bank (the “ECB”) hinted it would likely ease further, the Bank of Japan’s tone remained dovish, China signaled it would provide further stimulus, and better than expected economic data helped turn sentiment. A dovish Fed statement in mid-March and further dovish statements from Chair Yellen (sometimes at odds with other Fed speakers) helped the better trend in risk sentiment persist.
The second quarter of 2016 began with improving data momentum: payrolls and wages remained steady, while survey indicators such as the Institute for Supply Management (the “ISM”) and consumer sentiment also improved. Chinese and emerging market growth looked to have stabilized or modestly strengthened. The market continued to price for one with the potential of two hikes by the Federal Reserve in 2016, as core consumer price inflation data remained stable at about 2.2% year-over-year, and headline inflation stabilized at about 1%.
Data trends continued into May, which led to expectations that the Fed would hike at least twice during 2016 – including the potential for a June hike. A weak May payrolls report caused the market to back off the possibility of two hikes, as did a dovish Chair Yellen in her press conference after the mid-June Federal Open Market Committee meeting.
The big surprise news came late in June with voters in the United Kingdom opting to drop out of the European Union. U.S. markets became extremely volatile for two days. However, risk assets sharply rebounded, while bond yields remain depressed on expectations of further central bank easing.
FUND REVIEW
Top contributors to the Fund’s performance this reporting period included its exposure to master limited partnerships (“MLPs”) and quantitative alpha strategies.
Our MLP strategy seeks to invest in U.S. midstream MLPs that the investment team believes have attractive risk and reward characteristics. After experiencing declines over the first half of the reporting period, the asset class performed well over the second half. While the depths of this energy cycle appear to be behind us, a recovery is far from complete. The supply-demand picture for both crude oil and natural gas has improved and suggest a resumption of growth lies ahead. Importantly for midstream investors, the call on U.S.-sourced volumes over the medium-term appears to have shifted higher, which over time should aid midstream asset utilization. This fundamentally positive commodity outlook, combined with midstream valuations that remain below long-term averages, we believe, makes a compelling case for midstream investment.
The Fund’s Global Multi Strategy is a systematic alpha-oriented alternative strategy. It leverages four key strategies that seek to generate attractive risk-adjusted returns that exhibit low correlation to traditional stocks and bonds. All four strategies produced positive returns, with the strongest being Global Macro, which involves tactical positioning in broad asset and/or sector classes.
A slight detractor from performance was the Fund’s Currency Alpha strategy. Our Currency Alpha strategy is a total return strategy focused on fundamental and systematic dislocations across currency markets. The strategy can be long and/or short currencies against the U.S. dollar. It has a go-anywhere mandate across currencies and seeks opportunities regardless of dollar bull or bear market cycles. During the reporting period, the currency strategy has had a U.S. dollar long bias, mainly driven by macro environment and the Fed moving forward with the normalization in interest rates. This positioning worked against the Fund when the U.S. dollar sold off.
3 OPPENHEIMER GLOBAL MULTI-ALTERNATIVES FUND/VA
STRATEGY & OUTLOOK
The Fund is comprised of a flexible blend of alternative strategies and assets and is designed to be a turnkey alternative solution that improves the risk/reward tradeoff of a traditional balanced portfolio. We classify alternatives into three categories: Alpha alternatives, such as the Global Multi Strategy, Fundamental Alpha Strategies, and the Currency Alpha Strategy, rely less on the direction of major markets and economic factors to generate returns. Income alternatives (e.g., MLPs, loans, and event-linked bonds) provide exposure to relatively stable income producing assets with less interest rate sensitivity than traditional fixed income allocations. Real asset alternatives, like Commodities and Global Real Estate, could help guard against inflation over the long-term. We combine these strategies and assets to provide a core, alternative exposure that can potentially offset some of the risk from equity drawdowns, rising interest rates and inflationary shocks.
As we look ahead, we expect a continuation in this year’s seesaw behavior, in which global markets alternate between risk-on and risk-off. In terms of the macro environment, we are seeing a relatively weaker economic picture as our macro regime framework continues to indicate that most of the developed economies remain at cyclical peaks and are likely to oscillate between slowdown and expansion regimes for the near-term. Most central banks, excluding the U.S., are trying to counterbalance this by supportive monetary policy, but the long-term effects seem to be dissipating. Risks remain somewhat elevated, with the economic drag from Brexit, weakness in European financials, the ongoing structural transition in China, and uncertainty surrounding the direction of Fed policy. Elevated risks coupled with a muted growth outlook are causing a high degree of financial market uncertainty that may persist for some time. In such an environment, further diversifying in alternatives can improve the risk /reward profile for investors. Thus we believe that diversifying risk, controlling volatility and managing the downside has the potential to be a winning strategy going forward. Because the Fund is comprised of a number of different alternative assets and strategies, with diversifying properties as well as the potential to generate attractive total returns, we believe it can play a particularly valuable role in investors’ portfolios.
The Fund’s investment strategy and focus can change over time. The mention of specific fund holdings does not constitute a recommendation by OppenheimerFunds, Inc. or its affiliates.
Shares of Oppenheimer funds are not deposits or obligations of any bank, are not guaranteed by any bank, are not insured by the FDIC or any other agency, and involve investment risks, including the possible loss of the principal amount invested.
4 OPPENHEIMER GLOBAL MULTI-ALTERNATIVES FUND/VA
Fund Expenses
Fund Expenses. As a shareholder of the Fund, you incur two types of costs: (1) transaction costs and (2) ongoing costs, including management fees; distribution and service fees; and other Fund expenses. These examples are intended to help you understand your ongoing costs (in dollars) of investing in the Fund and to compare these costs with the ongoing costs of investing in other mutual funds.
The examples are based on an investment of $1,000.00 invested at the beginning of the period and held for the entire 6-month period ended June 30, 2016.
Actual Expenses. The first section of the table provides information about actual account values and actual expenses. You may use the information in this section for the class of shares you hold, together with the amount you invested, to estimate the expense that you paid over the period. Simply divide your account value by $1,000.00 (for example, an $8,600.00 account value divided by $1,000.00 = 8.60), then multiply the result by the number in the first section under the heading entitled “Expenses Paid During 6 Months Ended June 30, 2016” to estimate the expenses you paid on your account during this period.
Hypothetical Example for Comparison Purposes.
The second section of the table provides information about hypothetical account values and hypothetical expenses based on the Fund’s actual expense ratio for each class of shares, and an assumed rate of return of 5% per year for each class before expenses, which is not the actual return. The hypothetical account values and expenses may not be used to estimate the actual ending account balance or expenses you paid for the period. You may use this information to compare the ongoing costs of investing in the Fund and other funds. To do so, compare this 5% hypothetical example for the class of shares you hold with the 5% hypothetical examples that appear in the shareholder reports of the other funds.
Please note that the expenses shown in the table are meant to highlight your ongoing costs only and do not reflect any charges associated with the separate accounts that offer this Fund. Therefore, the “hypothetical” lines of the table are useful in comparing ongoing costs only, and will not help you determine the relative total costs of owning different funds. In addition, if these separate account charges were included your costs would have been higher.
| Actual |
Beginning Account Value January 1, 2016 |
Ending Account Value June 30, 2016 |
Expenses Paid During 6 Months Ended June 30, 2016 |
|||||||||||||
| Non-Service shares |
$ | 1,000.00 | $ | 1,034.60 | $ | 7.00 | ||||||||||
| Service shares |
1,000.00 | 1,032.10 | 8.27 | |||||||||||||
| Hypothetical | ||||||||||||||||
| (5% return before expenses) |
||||||||||||||||
| Non-Service shares |
1,000.00 | 1,018.00 | 6.95 | |||||||||||||
| Service shares |
1,000.00 | 1,016.76 | 8.21 | |||||||||||||
Expenses are equal to the Fund’s annualized expense ratio for that class, multiplied by the average account value over the period, multiplied by 182/366 (to reflect the one-half year period). Those annualized expense ratios, excluding indirect expenses from affiliated funds, based on the 6-month period ended June 30, 2016 are as follows:
| Class | Expense Ratios | |||||||
| Non-Service shares |
1.38% | |||||||
| Service shares |
1.63 | |||||||
The expense ratios reflect voluntary and/or contractual waivers and/or reimbursements of expenses by the Fund’s Manager. Some of these undertakings may be modified or terminated at any time, as indicated in the Fund’s prospectus. The “Financial Highlights” tables in the Fund’s financial statements, included in this report, also show the gross expense ratios, without such waivers or reimbursements and reduction to custodian expenses, if applicable.
5 OPPENHEIMER GLOBAL MULTI-ALTERNATIVES FUND/VA
| CONSOLIDATED STATEMENT OF INVESTMENTS June 30, 2016 Unaudited |
6 OPPENHEIMER GLOBAL MULTI-ALTERNATIVES FUND/VA
7 OPPENHEIMER GLOBAL MULTI-ALTERNATIVES FUND/VA
| CONSOLIDATED STATEMENT OF INVESTMENTS Unaudited / Continued |
8 OPPENHEIMER GLOBAL MULTI-ALTERNATIVES FUND/VA
9 OPPENHEIMER GLOBAL MULTI-ALTERNATIVES FUND/VA
| CONSOLIDATED STATEMENT OF INVESTMENTS Unaudited / Continued |
10 OPPENHEIMER GLOBAL MULTI-ALTERNATIVES FUND/VA
11 OPPENHEIMER GLOBAL MULTI-ALTERNATIVES FUND/VA
| CONSOLIDATED STATEMENT OF INVESTMENTS Unaudited / Continued |
12 OPPENHEIMER GLOBAL MULTI-ALTERNATIVES FUND/VA
| Counterparty | Exercise Price | Expiration Date | Contracts | Value | ||||||||||||||||||||||||
|
|
||||||||||||||||||||||||||||
| Over-the-Counter Options Purchased—0.5% |
| |||||||||||||||||||||||||||
|
|
||||||||||||||||||||||||||||
| BRL Currency Call1 |
BOA | BRL | 3.150 | 11/9/16 | BRL | 29,060,000 | $ | 145,678 | ||||||||||||||||||||
|
|
||||||||||||||||||||||||||||
| CAD Currency Put1,17 |
BOA | CAD | 1.320 | 7/15/16 | CAD | 46,086,000 | 70,788 | |||||||||||||||||||||
|
|
||||||||||||||||||||||||||||
| CAD Currency Put1,18 |
CITNA-B | MXN | 12.000 | 7/13/16 | CAD | 911,500 | — | |||||||||||||||||||||
|
|
||||||||||||||||||||||||||||
| CHF Currency Put1,19 |
BOA | JPY | 110.000 | 11/24/16 | CHF | 906,600 | 668,963 | |||||||||||||||||||||
|
|
||||||||||||||||||||||||||||
| CNH Currency Put1 |
GSG | CNH | 6.800 | 4/5/17 | CNH | 47,600,000 | 166,886 | |||||||||||||||||||||
|
|
||||||||||||||||||||||||||||
| COP Currency Call1 |
CITNA-B | COP | 2940.000 | 8/4/16 | COP | 54,213,292,000 | 487,920 | |||||||||||||||||||||
|
|
||||||||||||||||||||||||||||
| EUR Currency Put1,20 |
NOM | USD | 1.090 | 7/27/16 | EUR | 27,670,000 | 122,191 | |||||||||||||||||||||
|
|
||||||||||||||||||||||||||||
| JPY Currency Call1 |
DEU | KRW | 12.000 | 9/27/16 | JPY | 1,844,740,000 | 185,377 | |||||||||||||||||||||
|
|
||||||||||||||||||||||||||||
| TWD Currency Put1 |
GSG | TWD | 32.700 | 8/4/16 | TWD | 904,477,000 | 72,358 | |||||||||||||||||||||
|
|
|
|||||||||||||||||||||||||||
| Total Over-the-Counter Options Purchased (Cost $1,887,801) |
|
1,920,161 | ||||||||||||||||||||||||||
| Counterparty | Pay/Receive Floating Rate |
Floating Rate | Fixed Rate | Expiration Date |
Notional Amount (000’s) | |||||||||||||||||||||||||||
|
|
||||||||||||||||||||||||||||||||
| Over-the-Counter Interest Rate Swaptions Purchased—0.1% |
|
|||||||||||||||||||||||||||||||
|
|
||||||||||||||||||||||||||||||||
| Interest Rate Swap maturing |
Six-Month JPY BBA | |||||||||||||||||||||||||||||||
| 11/2/27 Call1 |
GSG | Receive | LIBOR | 1.070% | 11/20/17 | JPY | 560,000 | 5,067 | ||||||||||||||||||||||||
|
|
||||||||||||||||||||||||||||||||
| Interest Rate Swap maturing |
Six-Month JPY BBA | |||||||||||||||||||||||||||||||
| 11/22/27 Call1 |
GSG | Receive | LIBOR | 1.070 | 11/20/17 | JPY | 424,000 | 3,837 | ||||||||||||||||||||||||
|
|
||||||||||||||||||||||||||||||||
| Interest Rate Swap maturing |
Three-Month USD | |||||||||||||||||||||||||||||||
| 3/21/28 Call1 |
GSG | Receive | BBA LIBOR | 2.580 | 3/19/18 | USD | 1,100 | 18,622 | ||||||||||||||||||||||||
|
|
||||||||||||||||||||||||||||||||
| Interest Rate Swap maturing |
Three-Month USD | |||||||||||||||||||||||||||||||
| 3/26/29 Call1 |
GSG | Receive | BBA LIBOR | 2.185 | 3/22/19 | USD | 3,300 | 121,363 | ||||||||||||||||||||||||
|
|
||||||||||||||||||||||||||||||||
| Interest Rate Swap maturing |
Three-Month USD | |||||||||||||||||||||||||||||||
| 4/18/28 Call1 |
GSG | Receive | BBA LIBOR | 2.505 | 4/16/18 | USD | 3,750 | 71,727 | ||||||||||||||||||||||||
|
|
||||||||||||||||||||||||||||||||
| Interest Rate Swap maturing |
Three-Month USD | |||||||||||||||||||||||||||||||
| 4/18/28 Call1 |
GSG | Receive | BBA LIBOR | 2.505 | 4/16/18 | USD | 2,200 | 42,080 | ||||||||||||||||||||||||
|
|
||||||||||||||||||||||||||||||||
| Interest Rate Swap maturing 7/25/28 Call1 |
GSG | Receive | |
Six-Month JPY BBA LIBOR |
|
1.050 | 7/23/18 | JPY | 630,000 | 24,838 | ||||||||||||||||||||||
|
|
|
|||||||||||||||||||||||||||||||
| Total Over-the-Counter Interest Rate Swaptions Purchased (Cost $920,645) |
|
287,534 | ||||||||||||||||||||||||||||||
|
|
||||||||||||||||||||||||||||||||
| Total Investments, at Value (Cost $422,315,539) |
|
100.9% | 425,552,906 | |||||||||||||||||||||||||||||
|
|
||||||||||||||||||||||||||||||||
| Net Other Assets (Liabilities) |
|
(0.9 | ) | (3,861,926) | ||||||||||||||||||||||||||||
|
|
|
|||||||||||||||||||||||||||||||
| Net Assets |
100.0% | $ | 421,690,980 | |||||||||||||||||||||||||||||
|
|
|
|||||||||||||||||||||||||||||||
Footnotes to Consolidated Statement of Investments
1. Non-income producing security.
2. All or portion of the security position is held in segregated accounts and pledged to cover margin requirements with respect to securities sold short. The aggregate market value of such securities is $ 9,863,035. See Note 10 of accompanying Consolidated Notes
3. Security is a Master Limited Partnership.
4. Security received as the result of issuer reorganization
5. Represents securities sold under Rule 144A, which are exempt from registration under the Securities Act of 1933, as amended. These securities have been determined to be liquid under guidelines established by the Board of Trustees. These securities amount to $84,313,296 or 19.99% of the Fund’s net assets at period end
6. Represents the current interest rate for a variable or increasing rate security.
7. This security is not accruing income because the issuer has missed an interest payment on it and/or is not anticipated to make future interest and or principal payments. The rate shown is the contractual interest rate. See Note 4 of the accompanying Consolidated Notes.
8. This bond has no contractual maturity date, is not redeemable and contractually pays an indefinite stream of interest. Rate reported represents the current interest rate for this variable rate security.
9. Restricted security. The aggregate value of restricted securities at period end was $2,217,885, which represents 0.53% of the Fund’s net assets. See Note 4 of the accompanying Consolidated Notes. Information concerning restricted securities is as follows:
| Security | Acquisition Dates |
Cost | Value | Unrealized Appreciation/ (Depreciation) |
||||||||||||
|
|
||||||||||||||||
| Bosphorus Ltd. Catastrophe Linked Nts., 4.036%, 8/17/18 | 8/11/15 | $ | 500,000 | $ | 506,725 | $ | 6,725 | |||||||||
| Kizuna Re II Ltd. Catastrophe Linked Nts., 2.499%, 4/6/18 | 3/13/14 – 6/24/15 | 954,703 | 951,472 | (3,231) | ||||||||||||
| Nakama Re Ltd. Catastrophe Linked Nts., 3.124%, 1/14/21 | 12/14/15 | 250,000 | 251,263 | 1,263 | ||||||||||||
| OAS Financial Ltd., 8% Sr. Unsec. Nts., 7/2/21 | 9/3/14 | 204,171 | 1,250 | (202,921) | ||||||||||||
| Ursa Re Ltd. Catastrophe Linked Nts., 5%, 9/21/18 | 12/16/15 – 3/29/16 | 501,058 | 507,175 | 6,117 | ||||||||||||
|
|
|
|||||||||||||||
| $ | 2,409,932 | $ | 2,217,885 | $ | (192,047) | |||||||||||
|
|
|
|||||||||||||||
10. All or a portion of the security position is when-issued or delayed delivery to be delivered and settled after period end. See Note 4 of the accompanying Consolidated Notes.
11. Zero coupon bond reflects effective yield on the original acquisition date.
12. All or a portion of the security position is held in accounts at a futures clearing merchant and pledged to cover margin requirements on open futures contracts and written options on futures, if applicable. The aggregate market value of such securities is $9,062,056. See Note 6 of the accompanying Consolidated Notes.
13. All or a portion of the security position is held in segregated accounts and pledged to cover margin requirements under certain derivative contracts. The aggregate market value of such securities is $6,275,269. See Note 6 of the accompanying Consolidated Notes.
13 OPPENHEIMER GLOBAL MULTI-ALTERNATIVES FUND/VA
CONSOLIDATED STATEMENT OF INVESTMENTS Unaudited / Continued
Footnotes to Consolidated Statement of Investments (Continued)
14. Is or was an affiliate, as defined in the Investment Company Act of 1940, as amended, at or during the reporting period, by virtue of the Fund owning at least 5% of the voting securities of the issuer or as a result of the Fund and the issuer having the same investment adviser. Transactions during the reporting period in which the issuer was an affiliate are as follows:
| Shares December 31, 2015 |
Gross Additions |
Gross Reductions | Shares June 30, 2016 |
|||||||||||||
| Oppenheimer Institutional Money Market Fund, Cl. E |
23,203,584 | 133,120,235 | 129,302,224 | 27,021,595 | ||||||||||||
| Value | Income | |||||||||||||||
| Oppenheimer Institutional Money Market Fund, Cl. E |
$ | 27,021,595 | $ | 79,105 | ||||||||||||
15. All or a portion of this security is owned by the subsidiary. See Note 2 of the accompanying Consolidated Notes.
16. Rate shown is the 7-day yield at period end.
17. Knock-out option is ineligible for exercise if at any time spot rates are greater than or equal to 1.37 CAD per 1 USD.
18. One-Touch Binary option becomes eligible for exercise if at any time spot rates are less than or equal to 12 MXN per 1 CAD and Knock-out option is ineligible for exercise if at any time spot rates are less than or equal to 11.5 MXN per 1 CAD.
19. Digital option becomes eligible for exercise if at any time spot rates are less than or equal to 110.00000 JPY per 1 CHF.
20. Knock-out option becomes ineligible for exercise if at any time spot rates are less than or equal to USD 1.0400 per 1 EUR.
Distribution of investments representing geographic holdings, as a percentage of total investments at value, is as follows:
| Geographic Holdings | Value | Percent | ||||||||||
| United States |
$ | 301,684,933 | 70.9 | % | ||||||||
| Japan |
28,183,965 | 6.6 | ||||||||||
| Sweden |
14,637,565 | 3.4 | ||||||||||
| France |
12,475,872 | 2.9 | ||||||||||
| Italy |
11,379,656 | 2.7 | ||||||||||
| Supranational |
7,977,630 | 1.9 | ||||||||||
| Bermuda |
5,061,282 | 1.2 | ||||||||||
| Russia |
5,041,235 | 1.2 | ||||||||||
| Brazil |
4,779,167 | 1.1 | ||||||||||
| Cayman Islands |
4,590,204 | 1.1 | ||||||||||
| Switzerland |
3,828,824 | 0.9 | ||||||||||
| Spain |
3,265,522 | 0.8 | ||||||||||
| Canada |
2,701,912 | 0.6 | ||||||||||
| Eurozone |
2,397,162 | 0.6 | ||||||||||
| Colombia |
2,102,382 | 0.5 | ||||||||||
| Ireland |
1,559,082 | 0.4 | ||||||||||
| United Kingdom |
1,464,490 | 0.3 | ||||||||||
| Australia |
1,463,690 | 0.3 | ||||||||||
| Hong Kong |
1,334,739 | 0.3 | ||||||||||
| China |
1,165,590 | 0.3 | ||||||||||
| Turkey |
1,113,743 | 0.3 | ||||||||||
| Singapore |
1,020,085 | 0.2 | ||||||||||
| Argentina |
926,720 | 0.2 | ||||||||||
| Mexico |
785,500 | 0.2 | ||||||||||
| Netherlands |
646,469 | 0.2 | ||||||||||
| Chile |
633,855 | 0.2 | ||||||||||
| Germany |
491,993 | 0.1 | ||||||||||
| Barbados |
423,900 | 0.1 | ||||||||||
| Jersey, Channel Islands |
308,937 | 0.1 | ||||||||||
| Luxembourg |
293,938 | 0.1 | ||||||||||
| South Africa |
255,938 | 0.1 | ||||||||||
| Peru |
250,000 | 0.1 | ||||||||||
| Dominican Republic |
208,750 | 0.1 | ||||||||||
| India |
202,972 | 0.0 | ||||||||||
| Macau |
195,560 | 0.0 | ||||||||||
| Ukraine |
190,000 | 0.0 | ||||||||||
| Jamaica |
168,000 | 0.0 | ||||||||||
| China Offshore |
166,886 | 0.0 | ||||||||||
| Venezuela |
102,400 | 0.0 | ||||||||||
| Taiwan |
72,358 | 0.0 | ||||||||||
|
|
|
|||||||||||
| Total |
$ | 425,552,906 | 100.0 | % | ||||||||
|
|
|
|||||||||||
| Shares Sold Short | Value | |||||||
| Securities Sold Short—(9.5)% |
||||||||
| Common Stock Securities Sold Short—(9.5)% |
||||||||
| AGCO Corp. |
(26,510 | ) | $ | (1,249,416 | ) | |||
| Air Lease Corp., Cl. A |
(52,605 | ) | (1,408,762 | ) | ||||
| Aircastle Ltd. |
(24,325 | ) | (475,797 | ) | ||||
| Aker Solutions ASA |
(244,171 | ) | (1,060,010 | ) | ||||
| athenahealth, Inc. |
(4,430 | ) | (611,384 | ) | ||||
| Boeing Co. (The) |
(13,220 | ) | (1,716,881 | ) | ||||
14 OPPENHEIMER GLOBAL MULTI-ALTERNATIVES FUND/VA
| Shares Sold Short | Value | |||||||
|
|
||||||||
| Common Stock Securities Sold Short (Continued) |
||||||||
|
|
||||||||
| Camden Property Trust |
(16,730 | ) | $ | (1,479,267) | ||||
|
|
||||||||
| Caterpillar, Inc. |
(19,310 | ) | (1,463,891) | |||||
|
|
||||||||
| CBL & Associates Properties, Inc. |
(57,290 | ) | (533,370) | |||||
|
|
||||||||
| Charter Communications, Inc., Cl. A |
(8,785 | ) | (2,008,602) | |||||
|
|
||||||||
| Cheniere Energy, Inc. |
(26,850 | ) | (1,008,217) | |||||
|
|
||||||||
| Cie Financiere Richemont SA |
(19,443 | ) | (1,140,624) | |||||
|
|
||||||||
| CNH Industrial NV |
(144,010 | ) | (1,029,671) | |||||
|
|
||||||||
| Colgate-Palmolive Co. |
(21,770 | ) | (1,593,564) | |||||
|
|
||||||||
| Comcast Corp., Cl. A |
(11,240 | ) | (732,736) | |||||
|
|
||||||||
| Comerica, Inc. |
(10,302 | ) | (423,721) | |||||
|
|
||||||||
| Commerce Bancshares, Inc. |
(20,292 | ) | (971,987) | |||||
|
|
||||||||
| Deere & Co. |
(20,200 | ) | (1,637,008) | |||||
|
|
||||||||
| Ensco plc, Cl. A |
(69,960 | ) | (679,312) | |||||
|
|
||||||||
| Fastenal Co. |
(14,620 | ) | (648,982) | |||||
|
|
||||||||
| Franklin Resources, Inc. |
(34,290 | ) | (1,144,257) | |||||
|
|
||||||||
| Gulfmark Offshore, Inc., Cl. A |
(9,820 | ) | (30,737) | |||||
|
|
||||||||
| Intel Corp. |
(39,930 | ) | (1,309,704) | |||||
|
|
||||||||
| Oracle Corp. |
(29,875 | ) | (1,222,784) | |||||
|
|
||||||||
| Pennsylvania Real Estate Investment Trust |
(73,402 | ) | (1,574,473) | |||||
|
|
||||||||
| Procter & Gamble Co. (The) |
(19,355 | ) | (1,638,788) | |||||
|
|
||||||||
| Rio Tinto plc, Sponsored ADR |
(19,000 | ) | (594,700) | |||||
|
|
||||||||
| RLJ Lodging Trust |
(45,190 | ) | (969,325) | |||||
|
|
||||||||
| SAP SE, ADR |
(8,670 | ) | (650,423) | |||||
|
|
||||||||
| Southern Copper Corp. |
(52,550 | ) | (1,417,799) | |||||
|
|
||||||||
| Subsea 7 SA |
(216,575 | ) | (2,119,773) | |||||
|
|
||||||||
| Tidewater, Inc. |
(45,460 | ) | (200,479) | |||||
|
|
||||||||
| Tiffany & Co. |
(8,760 | ) | (531,206) | |||||
|
|
||||||||
| Transocean Ltd. |
(12,808 | ) | (152,287) | |||||
|
|
||||||||
| W.W. Grainger, Inc. |
(2,910 | ) | (661,297) | |||||
|
|
||||||||
| Walt Disney Co. (The) |
(8,730 | ) | (853,969) | |||||
|
|
||||||||
| Weingarten Realty Investors |
(53,763 | ) | (2,194,606) | |||||
|
|
||||||||
| Zions Bancorporation |
(27,990 | ) | (703,389) | |||||
|
|
|
|||||||
| Total Securities Sold Short (Proceeds $42,083,630) |
$ | (39,843,198) | ||||||
|
|
|
|||||||
|
|
||||||||||||||||||||||||||
| Forward Currency Exchange Contracts as of June 30, 2016 |
||||||||||||||||||||||||||
| Counterparty | Settlement Month(s) | Currency Purchased (000’s) | Currency Sold (000’s) |
Unrealized Appreciation |
Unrealized Depreciation |
|||||||||||||||||||||
|
|
||||||||||||||||||||||||||
| BAC |
07/2016 | KRW | 8,050,400 | USD | 6,827 | $ | 152,901 | $ | — | |||||||||||||||||
| BAC |
07/2016 | USD | 6,831 | JPY | 692,000 | 125,232 | — | |||||||||||||||||||
| BNP |
07/2016 | BRL | 41,290 | USD | 12,270 | 583,656 | — | |||||||||||||||||||
| BNP |
07/2016 - 10/2016 | USD | 15,975 | BRL | 51,690 | 10,011 | 36,601 | |||||||||||||||||||
| BOA |
07/2016 | BRL | 9,670 | USD | 3,013 | — | 2,345 | |||||||||||||||||||
| BOA |
09/2016 | CLP | 4,158,000 | USD | 5,992 | 245,200 | — | |||||||||||||||||||
| BOA |
09/2016 | IDR | 82,900,000 | USD | 6,106 | 113,742 | — | |||||||||||||||||||
| BOA |
07/2016 | USD | 2,666 | BRL | 9,670 | — | 343,858 | |||||||||||||||||||
| BOA |
09/2016 | USD | 2,022 | CHF | 1,930 | 35,979 | — | |||||||||||||||||||
| BOA |
09/2016 | USD | 2,606 | EUR | 2,365 | — | 26,621 | |||||||||||||||||||
| BOA |
07/2016 | USD | 6,802 | KRW | 8,050,400 | — | 177,957 | |||||||||||||||||||
| BOA |
07/2016 | USD | 9,174 | SEK | 74,000 | 424,812 | — | |||||||||||||||||||
| CITNA-B |
09/2016 | CAD | 1,725 | USD | 1,330 | 5,248 | — | |||||||||||||||||||
| CITNA-B |
09/2016 | EUR | 2,350 | USD | 2,677 | — | 61,272 | |||||||||||||||||||
| CITNA-B |
09/2016 | GBP | 2,150 | USD | 2,909 | — | 44,444 | |||||||||||||||||||
| CITNA-B |
09/2016 | NZD | 1,895 | USD | 1,328 | 19,645 | — | |||||||||||||||||||
| CITNA-B |
09/2016 | TRY | 3,820 | USD | 1,274 | 29,960 | — | |||||||||||||||||||
| CITNA-B |
09/2016 | USD | 8,652 | CAD | 11,119 | 44,435 | — | |||||||||||||||||||
| CITNA-B |
09/2016 | USD | 2,731 | EUR | 2,440 | 15,740 | — | |||||||||||||||||||
| CITNA-B |
09/2016 | USD | 2,795 | JPY | 290,400 | — | 24,501 | |||||||||||||||||||
| DEU |
09/2016 | USD | 2,637 | CHF | 2,565 | — | 2,062 | |||||||||||||||||||
| DEU |
09/2016 | USD | 1,322 | SEK | 10,990 | 18,565 | — | |||||||||||||||||||
| GSCO-OT |
07/2016 - 08/2016 | BRL | 31,140 | USD | 9,455 | 199,121 | 3,775 | |||||||||||||||||||
| GSCO-OT |
09/2016 | JPY | 155,000 | USD | 1,492 | 13,304 | — | |||||||||||||||||||
| GSCO-OT |
07/2016 | USD | 4,640 | BRL | 15,570 | — | 206,851 | |||||||||||||||||||
| GSCO-OT |
04/2017 | USD | 1,505 | CNH | 10,000 | 26,652 | — | |||||||||||||||||||
| GSCO-OT |
09/2016 | USD | 2,437 | EUR | 2,215 | — | 27,924 | |||||||||||||||||||
| HSBC |
09/2016 | USD | 5,031 | EUR | 4,400 | 134,834 | — | |||||||||||||||||||
| JPM |
07/2016 | BRL | 32,000 | USD | 9,969 | — | 7,759 | |||||||||||||||||||
| JPM |
09/2016 | CHF | 3,595 | USD | 3,737 | — | 38,269 | |||||||||||||||||||
| JPM |
09/2016 | EUR | 630 | USD | 713 | — | 11,572 | |||||||||||||||||||
15 OPPENHEIMER GLOBAL MULTI-ALTERNATIVES FUND/VA
CONSOLIDATED STATEMENT OF INVESTMENTS Unaudited / Continued
|
|
||||||||||||||||||||||||||
| Forward Currency Exchange Contracts (Continued) |
||||||||||||||||||||||||||
| Counterparty | Settlement Month(s) | Currency Purchased (000’s) | Currency Sold (000’s) |
Unrealized Appreciation |
Unrealized Depreciation |
|||||||||||||||||||||
|
|
||||||||||||||||||||||||||
| JPM |
09/2016 | HUF | 363,000 | USD | 1,296 | $ | — | $ | 20,242 | |||||||||||||||||
| JPM |
09/2016 | KRW | 1,531,000 | USD | 1,303 | 24,031 | — | |||||||||||||||||||
| JPM |
09/2016 | NOK | 23,060 | USD | 2,756 | — | 812 | |||||||||||||||||||
| JPM |
07/2016 | USD | 9,061 | BRL | 32,000 | — | 901,174 | |||||||||||||||||||
| JPM |
09/2016 - 10/2016 | USD | 24,779 | EUR | 22,182 | 253,148 | 172,851 | |||||||||||||||||||
| JPM |
09/2016 | USD | 3,730 | GBP | 2,600 | 266,229 | — | |||||||||||||||||||
| JPM |
09/2016 | USD | 1,212 | MXN | 23,200 | — | 46,442 | |||||||||||||||||||
| JPM |
09/2016 | USD | 2,409 | THB | 85,000 | — | 7,119 | |||||||||||||||||||
| JPM |
09/2016 | ZAR | 64,100 | USD | 4,092 | 189,929 | — | |||||||||||||||||||
| MSCO |
07/2016 | JPY | 692,000 | USD | 6,825 | — | 119,214 | |||||||||||||||||||
| MSCO |
08/2016 - 10/2016 | USD | 9,551 | EUR | 8,500 | 99,079 | 5,670 | |||||||||||||||||||
| MSCO |
09/2016 | USD | 2,561 | HUF | 741,000 | — | 42,850 | |||||||||||||||||||
| MSCO |
09/2016 | USD | 3,828 | JPY | 397,000 | — | 27,369 | |||||||||||||||||||
| MSCO |
07/2016 | USD | 6,120 | SEK | 49,800 | 230,157 | — | |||||||||||||||||||
| RBS |
09/2016 | CHF | 1,275 | USD | 1,329 | — | 17,010 | |||||||||||||||||||
| RBS |
09/2016 | USD | 3,110 | AUD | 4,220 | — | 28,160 | |||||||||||||||||||
| RBS |
11/2016 | USD | 18,501 | JPY | 2,000,000 | — | 961,621 | |||||||||||||||||||
| RBS |
09/2016 | USD | 1,301 | NOK | 10,920 | — | 3,405 | |||||||||||||||||||
| TDB |
07/2016 | BRL | 15,950 | USD | 4,436 | 529,250 | — | |||||||||||||||||||
| TDB |
09/2016 | GBP | 905 | USD | 1,286 | — | 80,598 | |||||||||||||||||||
| TDB |
07/2016 | USD | 4,969 | BRL | 15,950 | 3,867 | — | |||||||||||||||||||
| TDB |
09/2016 | USD | 2,677 | GBP | 1,825 | 245,167 | — | |||||||||||||||||||
|
|
|
|||||||||||||||||||||||||
| Total Unrealized Appreciation and Depreciation |
$ | 4,039,894 | $ | 3,450,348 | ||||||||||||||||||||||
|
|
|
|||||||||||||||||||||||||
| Futures Contracts as of June 30, 2016 |
|
|||||||||||||||||||||||
| Description | Exchange | Buy/Sell | Expiration Date | Number of Contracts | Value | Unrealized Appreciation (Depreciation) |
||||||||||||||||||
| Brent Crude Oil* |
ICE | Buy | 7/29/16 | 17 | $ | 845,070 | $ | 8,811 | ||||||||||||||||
| CAC 40 10 Index |
PAR | Sell | 7/15/16 | 314 | 14,753,860 | (252,997) | ||||||||||||||||||
| Euro-BTP |
EUX | Sell | 9/08/16 | 9 | 1,424,353 | (13,651) | ||||||||||||||||||
| FTSE 100 Index |
ICE | Sell | 9/16/16 | 178 | 15,218,916 | (1,270,342) | ||||||||||||||||||
| Gas Oil* |
NYM | Sell | 7/29/16 | 12 | 756,655 | 39,208 | ||||||||||||||||||
| Gold (100 oz.)* |
CMX | Buy | 8/29/16 | 8 | 1,056,480 | 82,301 | ||||||||||||||||||
| Lean Hogs* |
CME | Sell | 7/15/16 | 26 | 861,640 | (10,166) | ||||||||||||||||||
| Natural Gas* |
NYM | Sell | 7/27/16 | 34 | 994,160 | (172,120) | ||||||||||||||||||
| Nickel* |
LME | Buy | 7/18/16 | 17 | 959,820 | 107,556 | ||||||||||||||||||
| Russell 2000 Mini Index |
NYF | Sell | 9/16/16 | 261 | 29,947,140 | (94,537) | ||||||||||||||||||
| S&P 500 E-Mini Index |
CME | Buy | 9/16/16 | 80 | 8,360,800 | (57,029) | ||||||||||||||||||
| S&P 500 E-Mini Index |
CME | Sell | 9/16/16 | 132 | 13,795,320 | (367,588) | ||||||||||||||||||
| S&P/TSX 60 Index |
MON | Sell | 9/15/16 | 34 | 4,285,955 | (24,477) | ||||||||||||||||||
| Soybean* |
CBT | Buy | 8/12/16 | 15 | 880,687 | 68,020 | ||||||||||||||||||
| SPI 200 Index |
SFE | Sell | 9/15/16 | 32 | 3,088,208 | (38,484) | ||||||||||||||||||
| STOXX Europe 600 Index |
EUX | Sell | 9/16/16 | 879 | 15,953,816 | (347,326) | ||||||||||||||||||
| Sugar #11 World* |
NYB | Buy | 9/30/16 | 42 | 956,323 | 130,839 | ||||||||||||||||||
| United States Treasury Long Bonds | CBT | Buy | 9/21/16 | 40 | 6,893,750 | 386,494 | ||||||||||||||||||
| United States Treasury Nts., 10 yr. |
CBT | Sell | 9/21/16 | 94 | 12,500,531 | (331,359) | ||||||||||||||||||
| United States Treasury Nts., 10 yr. |
CBT | Buy | 9/21/16 | 51 | 6,782,203 | 179,040 | ||||||||||||||||||
| Wheat* |
CBT | Buy | 9/14/16 | 35 | 779,625 | (62,988) | ||||||||||||||||||
| WTI Crude Oil* |
NYM | Buy | 7/20/16 | 8 | 386,640 | 26,360 | ||||||||||||||||||
| Zinc* |
LME | Sell | 7/18/16 | 17 | 893,350 | (85,692) | ||||||||||||||||||
|
|
|
|||||||||||||||||||||||
| $ | (2,100,127) | |||||||||||||||||||||||
|
|
|
|||||||||||||||||||||||
*All or a portion of this security is owned by the subsidiary. See Note 1 of the accompanying Consolidated Notes.
| Over-the-Counter Options Written at June 30, 2016 |
| |||||||||||||||||||||||||||||||
| Description | Counterparty | Exercise Price | Expiration Date | Number of Contracts | Premiums Received | Value | ||||||||||||||||||||||||||
| CNH Currency Put |
GSG | CNH | 7.500 | 4/5/17 | CNH | (52,500,000) | $ | 65,240 | $ | (39,952) | ||||||||||||||||||||||
| COP Currency Call |
CITNA-B | COP | 2800.000 | 8/4/16 | COP | (103,263,414,000) | 344,471 | (309,790) | ||||||||||||||||||||||||
| EUR Currency Put |
DEU | USD | 1.133 | 9/21/16 | EUR | (18,429,000) | 560,899 | (596,086) | ||||||||||||||||||||||||
| EUR Currency Call |
DEU | USD | 1.133 | 9/21/16 | EUR | (18,429,000) | 561,733 | (199,236) | ||||||||||||||||||||||||
| EUR Currency Call |
JPM | USD | 1.108 | 7/5/16 | EUR | (1,980,000) | 21,714 | (9,938) | ||||||||||||||||||||||||
| EUR Currency Put |
JPM | USD | 1.108 | 7/5/16 | EUR | (1,980,000) | 22,985 | (8,468) | ||||||||||||||||||||||||
| EUR Currency Call |
TDB | USD | 1.100 | 7/5/16 | EUR | (2,000,000) | 17,492 | (20,436) | ||||||||||||||||||||||||
| EUR Currency Put |
TDB | USD | 1.100 | 7/5/16 | EUR | (2,000,000) | 17,193 | (3,554) | ||||||||||||||||||||||||
| GBP Currency Put |
GSG | USD | 1.318 | 7/5/16 | GBP | (1,670,000) | 33,281 | (12,543) | ||||||||||||||||||||||||
| GBP Currency Call |
GSG | USD | 1.348 | 7/6/16 | GBP | (1,645,000) | 12,726 | (5,366) | ||||||||||||||||||||||||
| GBP Currency Put |
GSG | USD | 1.348 | 7/6/16 | GBP | (1,645,000) | 14,502 | (43,846) | ||||||||||||||||||||||||
16 OPPENHEIMER GLOBAL MULTI-ALTERNATIVES FUND/VA
| Over-the-Counter Options Written (Continued) |
| |||||||||||||||||||||||||||||||
| Description | Counterparty | Exercise Price | Expiration Date | Number of Contracts | Premiums Received | Value | ||||||||||||||||||||||||||
| GBP Currency Call |
GSG | USD | 1.318 | 7/5/16 | GBP | (1,670,000 | ) | $ | 36,998 | $ | (25,075 | ) | ||||||||||||||||||||
| GBP Currency Call |
JPM | USD | 1.372 | 7/1/16 | GBP | (1,585,000 | ) | 50,218 | — | |||||||||||||||||||||||
| GBP Currency Put |
JPM | USD | 1.372 | 7/1/16 | GBP | (1,585,000 | ) | 49,783 | (73,701 | ) | ||||||||||||||||||||||
| GBP Currency Call |
TDB | USD | 1.335 | 7/5/16 | GBP | (1,645,000 | ) | 20,544 | (10,400 | ) | ||||||||||||||||||||||
| GBP Currency Put |
TDB | USD | 1.346 | 7/7/16 | GBP | (1,645,000 | ) | 18,097 | (42,795 | ) | ||||||||||||||||||||||
| GBP Currency Put |
TDB | USD | 1.335 | 7/5/16 | GBP | (1,645,000 | ) | 20,461 | (26,182 | ) | ||||||||||||||||||||||
| GBP Currency Call |
TDB | USD | 1.346 | 7/7/16 | GBP | (1,645,000 | ) | 17,739 | (8,430 | ) | ||||||||||||||||||||||
| JPY Currency Call |
DEU | KRW | 12.700 | 9/27/16 | JPY | (1,844,740,000 | ) | 216,057 | (74,168 | ) | ||||||||||||||||||||||
| JPY Currency Put |
GSG | JPY | 102.290 | 7/1/16 | JPY | (227,000,000 | ) | 24,092 | (20,884 | ) | ||||||||||||||||||||||
| JPY Currency Call |
GSG | JPY | 102.290 | 7/1/16 | JPY | (227,000,000 | ) | 26,655 | (227 | ) | ||||||||||||||||||||||
| JPY Currency Call |
TDB | JPY | 101.630 | 7/5/16 | JPY | (223,000,000 | ) | 22,816 | (1,784 | ) | ||||||||||||||||||||||
| JPY Currency Put |
TDB | JPY | 101.630 | 7/5/16 | JPY | (223,000,000 | ) | 23,313 | (36,126 | ) | ||||||||||||||||||||||
| TWD Currency Put |
GSG | TWD | 33.200 | 8/4/16 | TWD | (918,307,000 | ) | 154,425 | (26,631 | ) | ||||||||||||||||||||||
|
|
|
|||||||||||||||||||||||||||||||
| Total Over-the-Counter Options Written |
|
$ | 2,353,434 | $ | (1,595,618 | ) | ||||||||||||||||||||||||||
|
|
|
|||||||||||||||||||||||||||||||
| Centrally Cleared Credit Default Swaps at June 30, 2016 |
| |||||||||||||||||||||||||||||||
| Reference Asset | Buy/Sell Protection |
Fixed Rate | Maturity Date | Notional Amount (000’s) |
Premiums Received/ (Paid) |
Value | ||||||||||||||||||||||||||
| CDX.HY.24 |
Buy | 5.000% | 6/20/20 | USD | 181 | $ | 11,644 | $ | (9,610 | ) | ||||||||||||||||||||||
| CDX.HY.24 |
Buy | 5.000 | 6/20/20 | USD | 887 | 63,389 | (47,009 | ) | ||||||||||||||||||||||||
| CDX.HY.24 |
Buy | 5.000 | 6/20/20 | USD | 107 | 5,495 | (5,662 | ) | ||||||||||||||||||||||||
| CDX.HY.24 |
Buy | 5.000 | 6/20/20 | USD | 1,862 | 144,017 | (98,692 | ) | ||||||||||||||||||||||||
| CDX.HY.24 |
Buy | 5.000 | 6/20/20 | USD | 215 | 13,140 | (11,376 | ) | ||||||||||||||||||||||||
| CDX.HY.25 |
Buy | 5.000 | 12/20/20 | USD | 9,531 | 235,859 | (390,505 | ) | ||||||||||||||||||||||||
| CDX.HY.25 |
Buy | 5.000 | 12/20/20 | USD | 12,628 | (25,958 | ) | (517,429 | ) | |||||||||||||||||||||||
| CDX.IG.25 |
Sell | 1.000 | 12/20/20 | USD | 5,655 | (44,408 | ) | 42,814 | ||||||||||||||||||||||||
| iTraxx.Main.24 |
Buy | 1.000 | 12/20/20 | EUR | 5,160 | 69,067 | (42,243 | ) | ||||||||||||||||||||||||
|
|
|
|||||||||||||||||||||||||||||||
| Total of Cleared Credit Default Swaps |
|
$ | 472,245 | $ | (1,079,712 | ) | ||||||||||||||||||||||||||
|
|
|
|||||||||||||||||||||||||||||||
| Over-the-Counter Credit Default Swaps at June 30, 2016 |
| |||||||||||||||||||||||||||||||
| Reference Asset | Counterparty | Buy/Sell Protection |
Fixed Rate | Maturity Date | Notional Amount (000’s) |
Premiums Received/ (Paid) |
Value | |||||||||||||||||||||||||
| Altria Group, Inc. | JPM | Sell | 1.000% | 6/20/21 | USD | 1,540 | $ | (55,864 | ) | $ | 50,578 | |||||||||||||||||||||
| American Express Co. | BOA | Buy | 1.000 | 6/20/21 | USD | 1,540 | 38,487 | (38,545 | ) | |||||||||||||||||||||||
| Boeing Co. (The) | JPM | Buy | 1.000 | 6/20/21 | USD | 1,540 | 44,304 | (45,862 | ) | |||||||||||||||||||||||
| Bristol-Myers Squibb Co. | JPM | Sell | 1.000 | 6/20/21 | USD | 1,540 | (70,681 | ) | 66,279 | |||||||||||||||||||||||
| CDX.NA.HY.21 | CITNA-B | Buy | 5.000 | 12/20/18 | USD | 1,125 | (34,531 | ) | (74,844 | ) | ||||||||||||||||||||||
| CDX.NA.HY.21 | CITNA-B | Sell | 5.000 | 12/20/18 | USD | 288 | 160,725 | (98,899 | ) | |||||||||||||||||||||||
| CDX.NA.HY.21 | GSG | Sell | 5.000 | 12/20/18 | USD | 84 | 46,161 | (29,010 | ) | |||||||||||||||||||||||
| CDX.NA.HY.25 | GSG | Buy | 5.000 | 12/20/20 | USD | 1,125 | (194,688 | ) | 106,563 | |||||||||||||||||||||||
| CDX.NA.HY.25 | GSG | Sell | 5.000 | 12/20/20 | USD | 353 | 234,113 | (201,410 | ) | |||||||||||||||||||||||
| Computer Sciences Corp. | BOA | Buy | 5.000 | 6/20/21 | USD | 1,540 | 314,996 | (299,763 | ) | |||||||||||||||||||||||
| ConocoPhillips | GSG | Buy | 1.000 | 6/20/21 | USD | 1,540 | (91,982 | ) | 39,735 | |||||||||||||||||||||||
| Ei Du Pont de Nemours & Co. | JPM | Buy | 1.000 | 6/20/21 | USD | 1,540 | 41,841 | (41,987 | ) | |||||||||||||||||||||||
| Expedia, Inc. | BNP | Buy | 1.000 | 6/20/21 | USD | 1,540 | (20,383 | ) | 3,111 | |||||||||||||||||||||||
| Ford Motor Co. | BNP | Buy | 5.000 | 6/20/21 | USD | 1,540 | 248,432 | (252,670 | ) | |||||||||||||||||||||||
| Gap, Inc. (The) | BAC | Sell | 1.000 | 6/20/21 | USD | 1,540 | 113,804 | (169,254 | ) | |||||||||||||||||||||||
| Home Depot, Inc. (The) | BAC | Sell | 1.000 | 6/20/21 | USD | 1,540 | (59,970 | ) | 53,832 | |||||||||||||||||||||||
| Honeywell International, Inc. | JPM | Sell | 1.000 | 6/20/21 | USD | 1,540 | (60,915 | ) | 52,344 | |||||||||||||||||||||||
| Kinder Morgan, Inc. | GSG | Sell | 1.000 | 6/20/21 | USD | 1,540 | 157,554 | (106,748 | ) | |||||||||||||||||||||||
| Kingdom of Spain | BAC | Buy | 1.000 | 12/20/20 | USD | 4,278 | 30,105 | (2,624 | ) | |||||||||||||||||||||||
| Kingdom of Spain | BAC | Buy | 1.000 | 6/20/21 | USD | 449 | (1,152 | ) | 652 | |||||||||||||||||||||||
| Kroger Co. (The) | BNP | Buy | 1.000 | 6/20/21 | USD | 1,540 | 27,516 | (24,175 | ) | |||||||||||||||||||||||
| Malaysia | BNP | Buy | 1.000 | 6/20/21 | USD | 775 | (22,856 | ) | 17,502 | |||||||||||||||||||||||
| Malaysia | BNP | Buy | 1.000 | 12/20/20 | USD | 1,700 | (110,693 | ) | 23,189 | |||||||||||||||||||||||
| Malaysia | MOS-A | Buy | 1.000 | 12/20/20 | USD | 1,700 | (85,394 | ) | 23,189 | |||||||||||||||||||||||
| Mckesson Corp. | JPM | Buy | 1.000 | 6/20/21 | USD | 1,540 | 51,490 | (50,971 | ) | |||||||||||||||||||||||
| Motorola Solutions, Inc. | GSG | Sell | 1.000 | 6/20/21 | USD | 1,540 | 22,465 | (33,143 | ) | |||||||||||||||||||||||
| Norfolk Southern Corp. | BAC | Buy | 1.000 | 6/20/21 | USD | 1,540 | 44,224 | (42,292 | ) | |||||||||||||||||||||||
| Portugal Obrigacoes Do Tesouro | GSG | Buy | 1.000 | 6/20/21 | USD | 1,400 | (157,783 | ) | 119,883 | |||||||||||||||||||||||
| Portuguese Republic | BAC | Buy | 1.000 | 12/20/20 | USD | 2,567 | (96,674 | ) | 190,384 | |||||||||||||||||||||||
| Portuguese Republic | GSG | Buy | 1.000 | 6/20/21 | USD | 568 | (46,803 | ) | 48,638 | |||||||||||||||||||||||
| Republic of Austria | BAC | Buy | 1.000 | 12/20/20 | USD | 1,454 | 55,320 | (47,531 | ) | |||||||||||||||||||||||
| Republic of Austria | GSG | Buy | 1.000 | 6/20/21 | USD | 314 | 11,120 | (10,880 | ) | |||||||||||||||||||||||
| Republic of Italy | BAC | Buy | 1.000 | 12/20/20 | USD | 5,133 | 5,513 | 79,557 | ||||||||||||||||||||||||
| Republic of Italy | BAC | Buy | 1.000 | 6/20/21 | USD | 532 | (10,856 | ) | 10,474 | |||||||||||||||||||||||
| Sherwin-Williams Co. (The) | BOA | Sell | 1.000 | 6/20/21 | USD | 1,540 | (36,909 | ) | 11,666 | |||||||||||||||||||||||
| United Parcel Service of America | JPM | Sell | 1.000 | 6/20/21 | USD | 1,540 | (65,555 | ) | 58,097 | |||||||||||||||||||||||
17 OPPENHEIMER GLOBAL MULTI-ALTERNATIVES FUND/VA
CONSOLIDATED STATEMENT OF INVESTMENTS Unaudited / Continued
|
| ||||||||||||||||||||||||||||||
| Over-the-Counter Credit Default Swaps (Continued) | ||||||||||||||||||||||||||||||
| Reference Asset | Counterparty | Buy/Sell Protection |
Fixed Rate | Maturity Date | Notional Amount (000’s) |
Premiums Received/(Paid) | Value | |||||||||||||||||||||||
| Weyerhaeuser Co. |
GSG | Sell | 1.000% | 6/20/21 | USD | 1,540 | $ | 4,758 | $ 12,441 | |||||||||||||||||||||
|
|
| |||||||||||||||||||||||||||||
| Total Over-the-Counter Credit Default Swaps |
|
$ | 429,239 | $ (602,494) | ||||||||||||||||||||||||||
|
|
| |||||||||||||||||||||||||||||
The table that follows shows the undiscounted maximum potential payment by the Fund related to selling credit protection in credit default swaps:
| Type of Reference Asset on which the Fund Sold Protection | Total Maximum Potential Payments for Selling Credit Protection (Undiscounted) |
Amount Recoverable* | Reference Asset Rating Range** |
|||||||||
| Investment Grade Corporate Debt Indexes |
$5,655,000 | $— | BBB+ | |||||||||
| Non-Investment Grade Corporate Debt Indexes |
725,149 | 24,409,170 | B to CCC | |||||||||
| Investment Grade Single Name Corporate Debt |
13,860,000 | — | A+ to BBB- | |||||||||
| Non-Investment Grade Single Name Corporate Debt |
1,540,000 | — | BB+ | |||||||||
|
|
|
|
|
|||||||||
| Total |
$21,780,149 | $24,409,170 | ||||||||||
|
|
|
|
|
|||||||||
* The Fund has no amounts recoverable from related purchased protection. In addition, the Fund has no recourse provisions under the credit derivatives and holds no collateral which can offset or reduce potential payments under a triggering event.
** The period end reference asset security ratings, as rated by any rating organization, are included in the equivalent Standard & Poor’s rating category. The reference asset rating represents the likelihood of a potential credit event on the reference asset which would result in a related payment of the Fund.
| Centrally Cleared Interest Rate Swaps at June 30, 2016 | ||||||||||||||||||||||||||||||
| Counterparty | Pay/Receive Floating Rate |
Floating Rate | Fixed Rate | Maturity Date | Notional Amount (000’s) | Premiums Received / (Paid) |
Value | |||||||||||||||||||||||
| BAC |
Pay | |
Three-Month SEK STIBOR SIDE |
|
1.418% | 11/12/25 | SEK | 1,840 | $ | — | $17,277 | |||||||||||||||||||
| BAC |
Receive | |
Three-Month SEK STIBOR SIDE |
|
1.365 | 8/10/25 | SEK | 4,580 | — | 42,557 | ||||||||||||||||||||
| BAC |
Receive | |
Six-Month JPY BBA LIBOR |
|
0.468 | 11/12/25 | JPY | 23,000 | — | (10,741) | ||||||||||||||||||||
| BAC |
Receive | |
Three-Month SEK STIBOR SIDE |
|
1.630 | 7/3/25 | SEK | 66,785 | 19,369 | 859,442 | ||||||||||||||||||||
| BAC |
Pay | |
Three-Month SEK STIBOR SIDE |
|
1.501 | 12/9/25 | SEK | 5,120 | — | 52,045 | ||||||||||||||||||||
| BOA |
Receive | |
Six-Month AUD BBR BBSW |
|
3.105 | 12/7/25 | AUD | 12,620 | — | (751,667) | ||||||||||||||||||||
| BOA |
Receive | |
Three-Month USD BBA LIBOR |
|
1.670 | 5/5/26 | USD | 290 | — | 8,775 | ||||||||||||||||||||
| CITNA-B |
Receive | |
Three-Month USD BBA LIBOR |
|
2.318 | 8/10/25 | USD | 165 | (4 | ) | 15,665 | |||||||||||||||||||
| GSG |
Receive | |
Three-Month USD BBA LIBOR |
|
2.197 | 11/12/25 | USD | 145 | — | 12,926 | ||||||||||||||||||||
| JPM |
Receive | |
Six-Month JPY BBA LIBOR |
|
0.100 | 6/6/26 | JPY | 35,000 | — | (4,189) | ||||||||||||||||||||
| JPM |
Pay | |
Six-Month JPY BBA LIBOR |
|
0.593 | 7/10/25 | JPY | 948,000 | — | (557,935) | ||||||||||||||||||||
| JPM |
Pay | |
Three-Month SEK STIBOR SIDE |
|
1.070 | 6/7/26 | SEK | 3,550 | — | 14,671 | ||||||||||||||||||||
| JPM |
Receive | |
Six-Month AUD BBR BBSW |
|
2.396 | 6/3/26 | AUD | 930 | — | (12,657) | ||||||||||||||||||||
| JPM |
Receive | |
Six-Month JPY BBA LIBOR |
|
0.566 | 8/6/25 | JPY | 13,000 | — | (7,339) | ||||||||||||||||||||
| JPM |
Pay | |
Six-Month JPY BBA LIBOR |
|
0.595 | 8/11/25 | JPY | 29,000 | — | (17,164) | ||||||||||||||||||||
| JPM |
Receive | |
Six-Month JPY BBA LIBOR |
|
0.461 | 12/9/25 | JPY | 28,000 | — | (12,932) | ||||||||||||||||||||
| JPM |
Receive | |
Three-Month USD BBA LIBOR |
|
2.350 | 7/10/25 | USD | 9,170 | (2,532 | ) | 909,781 | |||||||||||||||||||
|
|
| |||||||||||||||||||||||||||||
| Total of Centrally Cleared Interest Rate Swaps |
|
$ | 16,833 | $ 558,515 | ||||||||||||||||||||||||||
|
|
| |||||||||||||||||||||||||||||
| Over-the-Counter Interest Rate Swaps at June 30, 2016 | ||||||||||||||||||||||||||||||
| Counterparty | PAy/Receive Floating Rate |
Floating Rate | Fixed Rate | Maturity Date | Notional Amount (000’s) | Value | ||||||||||||||||||||||||
| BOA |
Pay | |
Three-Month CNY CNREPOFIX=CFXS |
|
2.605% | 3/26/21 | CNY | 3,900 | $ (3,572) | |||||||||||||||||||||
| BOA |
Pay | |
Three-Month CNY CNREPOFIX=CFXS |
|
2.900 | 7/24/20 | CNY | 14,000 | 13,137 | |||||||||||||||||||||
| GSG |
Pay | |
Three-Month CNY CNREPOFIX=CFXS |
|
2.830 | 8/14/20 | CNY | 3,250 | 1,931 | |||||||||||||||||||||
|
| ||||||||||||||||||||||||||||||
| Total of Over-the-Counter Interest Rate Swaps |
|
$ 11,496 | ||||||||||||||||||||||||||||
|
| ||||||||||||||||||||||||||||||
18 OPPENHEIMER GLOBAL MULTI-ALTERNATIVES FUND/VA
|
|
||||||||||||||||||||||||||
| Over-the-Counter Total Return Swaps at June 30, 2016 |
| |||||||||||||||||||||||||
| Reference Asset | Counterparty | Pay/Receive Total Return* |
Floating Rate | Maturity Date | Notional Amount (000’s) |
Value | ||||||||||||||||||||
|
|
||||||||||||||||||||||||||
| CGAUOPAU Custom Basket | CITNA-B | Receive | |
One-Month AUD BBR BBSW plus 50 basis points |
|
3/9/17 | AUD | 8,499 | $ | 127,784 | ||||||||||||||||
|
|
||||||||||||||||||||||||||
| CGCNOCAD Custom Basket | CITNA-B | Receive | |
One-Month CAD BA CDOR plus 80 basis points |
|
3/7/17 | CAD | 8,084 | (239,791) | |||||||||||||||||
|
|
||||||||||||||||||||||||||
| GSEHOPCN Custom Basket | GSG | Pay |
|
One-Month HKD HIBOR HKAB minus 25 basis points |
|
6/22/17 | HKD | 14,465 | (240,719) | |||||||||||||||||
|
|
||||||||||||||||||||||||||
| GSEHOPHK Custom Basket | GSG | Receive | |
One-Month HKD HIBOR HKAB plus 40 basis points |
|
6/7/17 | HKD | 49,264 | 76,416 | |||||||||||||||||
|
|
||||||||||||||||||||||||||
| GSOPRUSS Custom Basket | GSG | Receive | |
One-Month USD BBA LIBOR plus 35 basis points |
|
6/7/17 | USD | 30,163 | (163,249) | |||||||||||||||||
|
|
||||||||||||||||||||||||||
| GSOPSPS3 Custom Basket | GSG | Receive | |
One-Month USD BBA LIBOR plus 35 basis points |
|
4/7/17 | USD | 21,759 | 213,649 | |||||||||||||||||
|
|
||||||||||||||||||||||||||
| HIN6 Index | GSG | Pay | No Floating Rate | 8/3/16 | HKD | 50,511 | (374,334) | |||||||||||||||||||
|
|
||||||||||||||||||||||||||
| iBoxx USD Liquid Leveraged | ||||||||||||||||||||||||||
| Loans Index Series 1 Version 1 |
MOS-A | Receive | USD BBA LIBOR | 9/26/16 | USD | 663 | 11,896 | |||||||||||||||||||
|
|
||||||||||||||||||||||||||
| iBoxx USD Liquid Leveraged Loans Index Series 1 Version 1 |
MOS-A | Receive | USD BBA LIBOR | 9/26/16 | USD | 1,659 | 20,716 | |||||||||||||||||||
|
|
||||||||||||||||||||||||||
| iBoxx USD Liquid Leveraged Loans Index Series 1 Version 1 |
GSG | Receive | USD BBA LIBOR | 9/26/16 | USD | 1,077 | 656 | |||||||||||||||||||
|
|
||||||||||||||||||||||||||
| JPCMOLNG Custom Basket | JPM | Receive | |
One-Month USD BBA LIBOR plus 30 basis points |
|
12/7/16 | USD | 9,415 | 93,192 | |||||||||||||||||
|
|
||||||||||||||||||||||||||
| JPCMOSHR Custom Basket | JPM | Pay | |
One-Month USD BBA LIBOR minus 85 basis points |
|
12/7/16 | USD | 9,453 | 104,342 | |||||||||||||||||
|
|
||||||||||||||||||||||||||
| JPEBCACO Custom Basket | JPM | Receive | |
One-Month EUR EURIBOR plus 10 basis points |
|
10/6/16 | EUR | 13,854 | (832,426) | |||||||||||||||||
|
|
||||||||||||||||||||||||||
| JPEBUKXO Custom Basket | JPM | Receive | |
One-Month GBP BBA LIBOR plus 20 basis points |
|
10/6/16 | GBP | 10,763 | 636,416 | |||||||||||||||||
|
|
||||||||||||||||||||||||||
| OEX Index | GSG | Pay | |
One-Month USD BBA LIBOR minus 35 basis points |
|
4/7/17 | USD | 10,703 | (12,577) | |||||||||||||||||
|
|
||||||||||||||||||||||||||
| OEX Index | GSG | Pay | |
One-Month USD BBA LIBOR minus 35 basis points |
|
4/13/17 | USD | 11,209 | 37,555 | |||||||||||||||||
|
|
||||||||||||||||||||||||||
| PowerShares Senior Loan | One-Month USD BBA LIBOR | |||||||||||||||||||||||||
| Exchange Traded Fund | CITNA-B | Receive | minus 190 basis points | 11/3/16 | USD | 12,935 | (10,841) | |||||||||||||||||||
|
|
||||||||||||||||||||||||||
| PowerShares Senior Loan Exchange Traded Fund | CITNA-B | Receive | |
One-Month USD BBA LIBOR minus 125 basis points |
|
11/3/16 | USD | 60,038 | (80,673) | |||||||||||||||||
|
|
|
|||||||||||||||||||||||||
| Total Over-the-Counter Total Return Swaps | $ | (631,988) | ||||||||||||||||||||||||
|
|
|
|||||||||||||||||||||||||
* Fund will pay or receive the total return of the reference asset depending on whether the return is positive or negative. For contracts where the Fund has elected to receive the total return of the reference asset if positive, it will be responsible for paying the floating rate and the total return of the reference asset if negative. If the Fund has elected to pay the total return of the reference asset if positive, it will receive the floating rate and the total return of the reference asset if negative.
| Over-the-Counter Volatility Swaps at June 30, 2016 |
| |||||||||||||||||||||||||||
| Reference Asset | Counterparty | Pay/Receive Volatility* |
Strike Price | Maturity Date | Notional Amount | Value | ||||||||||||||||||||||
|
|
||||||||||||||||||||||||||||
| GBP/JPY spot exchange rate |
DEU | Receive | $ | 23.000 | 8/5/16 | GBP | 3,700 | $ | 105,852 | |||||||||||||||||||
* Fund will pay or receive the volatility of the reference asset depending on whether the realized volatility of the reference asset exceeds or is less than the strike price. For contracts where the Fund has elected to receive the volatility of the reference asset, it will receive a net payment of the difference between the realized volatility and the strike price multiplied by the notional amount if the realized volatility exceeds the strike price; the Fund will make a net payment of the absolute value of the difference of the realized volatility and the strike price multiplied by the notional amount if the realized volatility is less than the strike price. For contracts where the Fund has elected to pay the volatility of the reference asset, it will make a net payment of the difference between the realized volatility and the strike price multiplied by the notional amount if the realized volatility exceeds the strike price; the Fund will receive a net payment of the absolute value of the difference of the realized and the strike price multiplied by the notional amount if the realized volatility is less than the strike price.
| Glossary: | ||
| Counterparty Abbreviations | ||
| BAC |
Barclays Bank plc | |
| BNP |
BNP Paribas | |
| BOA |
Bank of America NA | |
| CITNA-B |
Citibank NA | |
| DEU |
Deutsche Bank AG | |
| GSCO-OT |
Goldman Sachs Bank USA | |
| GSG |
Goldman Sachs Group, Inc. (The) | |
| HSBC |
HSBC Bank USA NA | |
| JPM |
JPMorgan Chase Bank NA | |
| MOS-A |
Morgan Stanley | |
| MSCO |
Morgan Stanley Capital Services, Inc. | |
| NOM |
Nomura Global Financial Products, Inc. | |
| RBS |
Royal Bank of Scotland plc (The) | |
| TDB |
Toronto Dominion Bank | |
19 OPPENHEIMER GLOBAL MULTI-ALTERNATIVES FUND/VA
CONSOLIDATED STATEMENT OF INVESTMENTS Unaudited / Continued
| Currency abbreviations indicate amounts reporting in currencies | ||
| AUD |
Australian Dollar | |
| BRL |
Brazilian Real | |
| CAD |
Canadian Dollar | |
| CHF |
Swiss Franc | |
| CLP |
Chilean Peso | |
| CNH |
Offshore Chinese Renminbi | |
| CNY |
Chinese Renminbi | |
| COP |
Colombian Peso | |
| EUR |
Euro | |
| GBP |
British Pound Sterling | |
| HKD |
Hong Kong Dollar | |
| HUF |
Hungarian Forint | |
| IDR |
Indonesian Rupiah | |
| JPY |
Japanese Yen | |
| KRW |
South Korean Won | |
| MXN |
Mexican Nuevo Peso | |
| NOK |
Norwegian Krone | |
| NZD |
New Zealand Dollar | |
| SEK |
Swedish Krona | |
| THB |
Thailand Baht | |
| TRY |
New Turkish Lira | |
| TWD |
New Taiwan Dollar | |
| ZAR |
South African Rand | |
| Definitions | ||
| BA CDOR |
Canada Bankers Acceptances Deposit Offering Rate | |
| BBA LIBOR |
British Bankers’ Association London - Interbank Offered Rate | |
| BBR |
Bank Bill Rate | |
| BBSW |
Bank Bill Swap Reference Rate (Australian Financial Market) | |
| BTP |
Italian Treasury Bonds | |
| CDX.HY.24 |
Merkit CDX High Yield Index | |
| CDX.HY.25 |
Markit CDX High Yield Index | |
| CDX.IG.25 |
Markit CDX Investment Grade Index | |
| CDX.NA.HY.21 |
Markit CDX North American High Yield | |
| CDX.NA.HY.25 |
Markit CDX North American High Yield | |
| CGAUOPAU |
Custom Basket of Securities | |
| CGCNOCAD |
Custom Basket of Securities | |
| CNREPOFIX=CFXS |
Repurchase Fixing Rates | |
| EURIBOR |
Euro Interbank Offered Rate | |
| GSEHOPCN |
Custom Basket of Securities | |
| GSEHOPHK |
Custom Basket of Securities | |
| GSOPRUSS |
Custom Basket of Securities | |
| GSOPSPS3 |
Custom Basket of Securities | |
| HIBOR |
Hong Kong Interbank Offered Rate | |
| HIN6 |
The Hang Seng Index Futures | |
| HKAB |
Hong Kong Association of Banks | |
| iTraxx.Main.24 |
Credit Default Swap Trading Index for a Specific Basket of Securities | |
| JPCMOLNG |
Custom Basket of Securities | |
| JPCMOSHR |
Custom Basket of Securities | |
| JPEBCACO |
Custom Basket of Securities | |
| JPEBUKXO |
Custom Basket of Securities | |
| OEX |
S&P 100 Index | |
| STIBOR SIDE |
Stockholm Interbank Offered Rate | |
| Exchange Abbreviations | ||
| CBT |
Chicago Board of Trade | |
| CME |
Chicago Mercantile Exchanges | |
| CMX |
Commodity Exchange, Inc. | |
| EUX |
European Stock Exchange | |
| ICE |
Intercontinental Exchange | |
| LME |
London Metal Exchange | |
| MON |
Montreal Exchange | |
| NYB |
New York Board of Trade | |
| NYF |
New York Futures Exchange | |
| PAR |
Paris Stock Exchange | |
| SFE |
Sydney Futures Exchange | |
See accompanying Notes to Consolidated Financial Statements.
20 OPPENHEIMER GLOBAL MULTI-ALTERNATIVES FUND/VA
CONSOLIDATED STATEMENT OF ASSETS AND LIABILITIES June 30, 2016 Unaudited
| Assets |
||||
| Investments, at value—see accompanying consolidated statement of investments: |
||||
| Unaffiliated companies (cost $395,293,944) |
$ | 398,531,311 | ||
| Affiliated companies (cost $27,021,595) |
27,021,595 | |||
| 425,552,906 | ||||
| Cash | 1,919,631 | |||
| Cash used for collateral on futures | 771,050 | |||
| Cash used for collateral on centrally cleared swaps | 2,160,180 | |||
| Deposits with broker for securities sold short | 40,793,209 | |||
| Deposits with broker for foreign securities sold short | 4,220,637 | |||
| Unrealized appreciation on forward currency exchange contracts | 4,039,894 | |||
| Swaps, at value (net premiums paid $1,178,887) | 2,411,656 | |||
| Centrally cleared swaps, at value (net premiums paid $27,575) | 1,975,953 | |||
| Receivables and other assets: | ||||
| Investments sold (including $2,887,313 sold on a when-issued or delayed delivery basis) | 4,093,174 | |||
| Interest and dividends | 1,566,282 | |||
| Variation margin receivable | 73,643 | |||
| Shares of beneficial interest sold | 34 | |||
| Other | 16,349 | |||
| Total assets | 489,594,598 | |||
| Liabilities |
||||
| Securities sold short, at value (proceeds $42,083,630) - see accompanying consolidated statement of investments | 39,843,198 | |||
| Unrealized depreciation on forward currency exchange contracts | 3,450,348 | |||
| Options written, at value (premiums received $2,353,434) | 1,595,618 | |||
| Swaps, at value (net premiums received $1,608,126) | 3,528,790 | |||
| Centrally cleared swaps, at value (net premiums received $516,653) | 2,497,150 | |||
| Payables and other liabilities: | ||||
| Investments purchased (including $3,930,533 purchased on a when-issued or delayed delivery basis) | 15,558,001 | |||
| Variation margin payable | 1,326,762 | |||
| Dividends | 69,773 | |||
| Trustees’ compensation | 3,947 | |||
| Shareholder communications | 3,363 | |||
| Distribution and service plan fees | 402 | |||
| Shares of beneficial interest redeemed | 83 | |||
| Other | 26,183 | |||
| Total liabilities | 67,903,618 | |||
| Net Assets |
$ | 421,690,980 | ||
| Composition of Net Assets |
||||
| Par value of shares of beneficial interest | $ | 42,269 | ||
| Additional paid-in capital | 433,469,315 | |||
| Accumulated net investment loss | (3,397,636 | ) | ||
| Accumulated net realized loss on investments and foreign currency transactions | (12,348,268 | ) | ||
| Net unrealized appreciation on investments and translation of assets and liabilities denominated in foreign currencies | 3,925,300 | |||
| Net Assets |
$ | 421,690,980 | ||
| Net Asset Value Per Share |
||||
| Non-Service Shares: | ||||
| Net asset value, redemption price per share and offering price per share (based on net assets of $419,719,821 and 42,071,357 shares of beneficial interest outstanding) | $9.98 | |||
| Service Shares: | ||||
| Net asset value, redemption price per share and offering price per share (based on net assets of $1,971,159 and 197,997 shares of beneficial interest outstanding) | $9.96 | |||
See accompanying Notes to Consolidated Financial Statements.
21 OPPENHEIMER GLOBAL MULTI-ALTERNATIVES FUND/VA
CONSOLIDATED STATEMENT OF OPERATIONS For the Six Months Ended June 30, 2016 Unaudited
| Investment Income |
||||
| Interest - unaffiliated companies (net of foreign withholding taxes of $8,385) |
$ | 3,859,940 | ||
| Dividends: |
||||
| Unaffiliated companies (net of foreign withholding taxes of $35,680) |
1,525,701 | |||
| Affiliated companies |
79,105 | |||
| Total investment income
|
5,464,746 | |||
| Expenses |
||||
| Management fees |
2,087,955 | |||
| Distribution and service plan fees: |
||||
| Service shares |
2,385 | |||
| Transfer and shareholder servicing agent fees: |
||||
| Non-Service shares |
202,282 | |||
| Service shares |
956 | |||
| Shareholder communications: |
||||
| Non-Service shares |
7,244 | |||
| Service shares |
34 | |||
| Dividends on short sales |
347,377 | |||
| Custodian fees and expenses |
66,507 | |||
| Financing expense from short sales |
64,850 | |||
| Trustees’ compensation |
16,509 | |||
| Borrowing fees |
3,484 | |||
| Other |
91,494 | |||
| Total expenses |
2,891,077 | |||
| Less reduction to custodian expenses |
(624 | ) | ||
| Less waivers and reimbursements of expenses |
(73,616 | ) | ||
| Net expenses
|
|
2,816,837
|
| |
| Net Investment Income |
2,647,909 | |||
| Realized and Unrealized Gain (Loss) |
||||
| Net realized gain (loss) on: |
||||
| Investments from unaffiliated companies (including premiums on options exercised) |
(7,230,834 | ) | ||
| Closing and expiration of option contracts written |
3,172,633 | |||
| Closing and expiration of futures contracts |
871,833 | |||
| Foreign currency transactions |
10,838,334 | |||
| Short Positions |
1,972,955 | |||
| Swap contracts |
(17,139,330 | ) | ||
| Net realized loss |
(7,514,409 | ) | ||
| Net change in unrealized appreciation/depreciation on: |
||||
| Investments |
17,271,203 | |||
| Translation of assets and liabilities denominated in foreign currencies |
1,356,657 | |||
| Futures contracts |
(532,669 | ) | ||
| Option contracts written |
527,793 | |||
| Short positions |
(3,203,140 | ) | ||
| Swap contracts |
2,947,529 | |||
| Net change in unrealized appreciation/depreciation
|
18,367,373 | |||
| Net Increase in Net Assets Resulting from Operations |
$ | 13,500,873 | ||
See accompanying Notes to Consolidated Financial Statements.
22 OPPENHEIMER GLOBAL MULTI-ALTERNATIVES FUND/VA
CONSOLIDATED STATEMENTS OF CHANGES IN NET ASSETS
| Six Months Ended June 30, 2016 (Unaudited) |
Year Ended December 31, 2015 |
|||||||||||
|
|
||||||||||||
| Operations |
||||||||||||
| Net investment income |
$ | 2,647,909 | $ | 3,369,216 | ||||||||
|
|
||||||||||||
| Net realized loss |
(7,514,409 | ) | (4,484,971 | ) | ||||||||
|
|
||||||||||||
| Net change in unrealized appreciation/depreciation |
18,367,373 | (14,937,519 | ) | |||||||||
|
|
|
|||||||||||
| Net increase (decrease) in net assets resulting from operations |
|
13,500,873
|
|
|
(16,053,274
|
)
|
||||||
|
|
||||||||||||
| Dividends and/or Distributions to Shareholders |
||||||||||||
| Dividends from net investment income: |
||||||||||||
| Non-Service shares |
(173,263 | ) | (1,416,586 | ) | ||||||||
| Service shares |
— | (1,965 | ) | |||||||||
|
|
|
|||||||||||
|
|
(173,263
|
)
|
|
(1,418,551
|
)
|
|||||||
|
|
||||||||||||
| Beneficial Interest Transactions |
||||||||||||
| Net increase in net assets resulting from beneficial interest transactions: |
||||||||||||
| Non-Service shares |
169,143 | 161,111,575 | ||||||||||
| Service shares |
62,908 | 587,007 | ||||||||||
|
|
|
|||||||||||
|
|
232,051
|
|
|
161,698,582
|
|
|||||||
|
|
||||||||||||
| Net Assets |
||||||||||||
| Total increase |
13,559,661 | 144,226,757 | ||||||||||
|
|
||||||||||||
| Beginning of period |
408,131,319 | 263,904,562 | ||||||||||
|
|
|
|||||||||||
| End of period (including accumulated net investment loss of $3,397,636 and $5,872,282, respectively) |
$ | 421,690,980 | $ | 408,131,319 | ||||||||
|
|
|
|||||||||||
See accompanying Notes to Consolidated Financial Statements.
23 OPPENHEIMER GLOBAL MULTI-ALTERNATIVES FUND/VA
CONSOLIDATED FINANCIAL HIGHLIGHTS
| Non-Service Shares | Six Months Ended June 30, 2016 (Unaudited) |
Year Ended December 31, 2015 |
Year Ended December 31, 2014 |
Period Ended December 31, 20131 |
||||||||||||
| Per Share Operating Data |
||||||||||||||||
| Net asset value, beginning of period |
$9.66 | $10.04 | $9.92 | $10.00 | ||||||||||||
|
|
||||||||||||||||
| Income (loss) from investment operations: |
||||||||||||||||
| Net investment income (loss)2 |
0.06 | 0.09 | 0.08 | (0.02) | ||||||||||||
| Net realized and unrealized gain (loss) |
0.26 | (0.44) | 0.52 | (0.05) | ||||||||||||
|
|
|
|||||||||||||||
| Total from investment operations |
0.32 | (0.35) | 0.60 | (0.07) | ||||||||||||
|
|
||||||||||||||||
| Dividends and/or distributions to shareholders: |
||||||||||||||||
| Dividends from net investment income |
(0.00)3 | (0.03) | (0.25) | (0.01) | ||||||||||||
| Distributions from net realized gain |
0.00 | 0.00 | (0.21) | 0.00 | ||||||||||||
| Tax return of capital distribution |
0.00 | 0.00 | (0.02) | 0.00 | ||||||||||||
|
|
|
|||||||||||||||
| Total dividends and/or distributions to shareholders |
(0.00) | 3 | (0.03) | (0.48) | (0.01) | |||||||||||
|
|
||||||||||||||||
| Net asset value, end of period |
$9.98 | $9.66 | $10.04 | $9.92 | ||||||||||||
|
|
|
|||||||||||||||
|
|
||||||||||||||||
| Total Return, at Net Asset Value4 |
3.46% | (3.45)% | 6.02% | (0.69)% | ||||||||||||
|
|
||||||||||||||||
| Ratios/Supplemental Data |
||||||||||||||||
| Net assets, end of period (in thousands) |
$419,720 | $406,286 | $262,573 | $9,917 | ||||||||||||
|
|
||||||||||||||||
| Average net assets (in thousands) |
$406,881 | $363,975 | $161,988 | $9,827 | ||||||||||||
|
|
||||||||||||||||
| Ratios to average net assets:5 |
||||||||||||||||
| Net investment income (loss) |
1.30% | 0.92% | 0.77%6 | (1.85)%6 | ||||||||||||
| Expenses excluding specific expenses listed below |
1.22% | 1.24% | 1.33% | 7.16% | ||||||||||||
| Dividends and/or interest expense on securities sold short |
0.17% | 0.17% | 0.08% | 0.00% | ||||||||||||
| Borrowing expenses on securities sold short |
0.03% | 0.05% | 0.02% | 0.00% | ||||||||||||
| Interest and fees from borrowings |
0.00%7 | 0.00%7 | 0.00% | 0.00% | ||||||||||||
|
|
|
|||||||||||||||
| Total expenses8 |
1.42% | 1.46% | 1.43%6 | 7.16%6 | ||||||||||||
| Expenses after payments, waivers and/or reimbursements and reduction to custodian expenses | 1.38% | 1.41% | 1.31%6 | 3.33%6 | ||||||||||||
|
|
||||||||||||||||
| Portfolio turnover rate |
55% | 67% | 147% | 11% | ||||||||||||
1. For the period from November 14, 2013 (inception of offering) to December 31, 2013.
2. Per share amounts calculated based on the average shares outstanding during the period.
3. Less than $0.005 per share.
4. Assumes an initial investment on the business day before the first day of the fiscal period, with all dividends and distributions reinvested in additional shares on the reinvestment date, and redemption at the net asset value calculated on the last business day of the fiscal period. Total returns are not annualized for periods less than one full year. Total return information does not reflect expenses that apply at the separate account level or to related insurance products. Inclusion of these charges would reduce the total return figures for all periods shown. Returns do not reflect the deduction of taxes that a shareholder would pay on fund distributions or the redemption of fund shares.
5. Annualized for periods less than one full year.
6. Includes the Fund’s shares of the allocated expenses and/or net investment income from the master funds.
7. Less than 0.005%.
8. Total expenses including indirect expenses from affiliated fund fees and expenses were as follows:
| Six Months Ended June 30, 2016 |
1.43 | % | ||||
| Year Ended December 31, 2015 |
1.47 | % | ||||
| Year Ended December 31, 2014 |
1.45 | % | ||||
| Period Ended December 31, 2013 |
7.18 | % |
See accompanying Notes to Consolidated Financial Statements.
24 OPPENHEIMER GLOBAL MULTI-ALTERNATIVES FUND/VA
| Service Shares | Six Months Ended June 30, 2016 (Unaudited) |
Year Ended December 31, 2015 |
Year Ended December 31, 2014 |
Period Ended December 31, 20131 |
||||||||||||
| Per Share Operating Data |
||||||||||||||||
| Net asset value, beginning of period |
$9.65 | $10.03 | $9.92 | $10.00 | ||||||||||||
|
|
||||||||||||||||
| Income (loss) from investment operations: |
||||||||||||||||
| Net investment income (loss)2 |
0.05 | 0.07 | 0.08 | (0.03) | ||||||||||||
| Net realized and unrealized gain (loss) |
0.26 | (0.44 | ) | 0.50 | (0.04) | |||||||||||
|
|
|
|||||||||||||||
| Total from investment operations |
0.31 | (0.37 | ) | 0.58 | (0.07) | |||||||||||
|
|
||||||||||||||||
| Dividends and/or distributions to shareholders: |
||||||||||||||||
| Dividends from net investment income |
0.00 | (0.01 | ) | (0.25 | ) | (0.01) | ||||||||||
| Distributions from net realized gain |
0.00 | 0.00 | (0.21 | ) | 0.00 | |||||||||||
| Tax return of capital distribution |
0.00 | 0.00 | (0.01 | ) | 0.00 | |||||||||||
|
|
|
|||||||||||||||
| Total dividends and/or distributions to shareholders |
0.00 | (0.01 | ) | (0.47 | ) | (0.01) | ||||||||||
|
|
||||||||||||||||
| Net asset value, end of period |
$9.96 | $9.65 | $10.03 | $9.92 | ||||||||||||
|
|
|
|||||||||||||||
|
|
||||||||||||||||
| Total Return, at Net Asset Value3 |
3.21% | (3.68)% | 5.90% | (0.72)% | ||||||||||||
|
|
||||||||||||||||
| Ratios/Supplemental Data |
||||||||||||||||
| Net assets, end of period (in thousands) |
$1,971 | $1,845 | $1,332 | $10 | ||||||||||||
|
|
||||||||||||||||
| Average net assets (in thousands) |
$1,922 | $1,695 | $335 | $10 | ||||||||||||
|
|
||||||||||||||||
| Ratios to average net assets:4 |
||||||||||||||||
| Net investment income (loss) |
1.06% | 0.66% | 0.77%5 | (2.12)%5 | ||||||||||||
| Expenses excluding specific expenses listed below |
1.47% | 1.48% | 1.68% | 7.43% | ||||||||||||
| Dividends and/or interest expense on securities sold short |
0.17% | 0.17% | 0.08% | 0.00% | ||||||||||||
| Borrowing expenses on securities sold short |
0.03% | 0.05% | 0.02% | 0.00% | ||||||||||||
| Interest and fees from borrowings |
0.00%6 | 0.00%6 | 0.00% | 0.00% | ||||||||||||
|
|
|
|||||||||||||||
| Total expenses7 |
1.67% | 1.70% | 1.78%5 | 7.43%5 | ||||||||||||
| Expenses after payments, waivers and/or reimbursements and reduction to custodian expenses |
1.63% | 1.65% | 1.67%5 | 3.50%5 | ||||||||||||
|
|
||||||||||||||||
| Portfolio turnover rate |
55% | 67% | 147% | 11% | ||||||||||||
1. For the period from November 14, 2013 (inception of offering) to December 31, 2013.
2. Per share amounts calculated based on the average shares outstanding during the period.
3. Assumes an initial investment on the business day before the first day of the fiscal period, with all dividends and distributions reinvested in additional shares on the reinvestment date, and redemption at the net asset value calculated on the last business day of the fiscal period. Total returns are not annualized for periods less than one full year. Total return information does not reflect expenses that apply at the separate account level or to related insurance products. Inclusion of these charges would reduce the total return figures for all periods shown. Returns do not reflect the deduction of taxes that a shareholder would pay on fund distributions or the redemption of fund shares.
4. Annualized for periods less than one full year.
5. Includes the Fund’s shares of the allocated expenses and/or net investment income from the master funds.
6. Less than 0.005%.
7. Total expenses including indirect expenses from affiliated fund fees and expenses were as follows:
| Six Months Ended June 30, 2016 |
1.68 | % | ||||
| Year Ended December 31, 2015 |
1.71 | % | ||||
| Year Ended December 31, 2014 |
1.80 | % | ||||
| Period Ended December 31, 2013 |
7.45 | % |
See accompanying Notes to Consolidated Financial Statements.
25 OPPENHEIMER GLOBAL MULTI-ALTERNATIVES FUND/VA
NOTES TO CONSOLIDATED FINANCIAL STATEMENTS June 30, 2016 Unaudited
1. Organization
Oppenheimer Global Multi-Alternatives Fund/VA (the “Fund”) is a separate series of Oppenheimer Variable Account Funds, a diversified open-end management investment company registered under the Investment Company Act of 1940 (“1940 Act”), as amended. The Fund’s investment objective is to seek total return. The Fund’s investment adviser is OFI Global Asset Management, Inc. (“OFI Global” or the “Manager”), a wholly-owned subsidiary of OppenheimerFunds, Inc. (“OFI” or the “Sub-Adviser”). The Manager has entered into a sub-advisory agreement with OFI. The Sub-Adviser has entered into a sub-sub-advisory agreement with Cornerstone Real Estate Advisers LLC and OFI SteelPath, Inc. (collectively, the “Sub-Sub-Advisers”). Shares of the Fund are sold only to separate accounts of life insurance companies.
The Fund offers two classes of shares. Both classes are sold at their offering price, which is the net asset value per share, to separate investment accounts of participating insurance companies as an underlying investment for variable life insurance policies, variable annuity contracts or other investment products. The class of shares designated as Service shares is subject to a distribution and service plan. Both classes of shares have identical rights and voting privileges with respect to the Fund in general and exclusive voting rights on matters that affect that class alone. Earnings, net assets and net asset value per share may differ due to each class having its own expenses, such as transfer and shareholder servicing agent fees and shareholder communications, directly attributable to that class.
The following is a summary of significant accounting policies followed in the Fund’s preparation of financial statements in accordance with accounting principles generally accepted in the United States (“U.S. GAAP”).
2. Significant Accounting Policies
Security Valuation. All investments in securities are recorded at their estimated fair value, as described in Note 3.
Reporting Period End Date. The last day of the Fund’s reporting period is the last day the New York Stock Exchange was open for trading during the period. The Fund’s financial statements have been presented through that date to maintain consistency with the Fund’s net asset value calculations used for shareholder transactions.
Basis for Consolidation. The Fund has established a Cayman Islands exempted company, Oppenheimer Global Multi-Alternatives Fund/VA (Cayman) Ltd., which is wholly-owned and controlled by the Fund (the “Subsidiary”). The Fund and Subsidiary are both managed by the Manager. The Fund may invest up to 25% of its total assets in the Subsidiary. The Subsidiary invests primarily in commodity-linked derivatives (including commodity futures, financial futures, options and swap contracts) and certain fixed-income securities and other investments that may serve as margin or collateral for its derivatives positions. Investments in the Subsidiary are expected to provide the Fund with exposure to commodities markets within the limitations of the federal tax requirements that apply to the Fund. The Subsidiary is subject to the same investment restrictions and guidelines, and follows the same compliance policies and procedures, as the Fund.
The financial statements have been consolidated and include accounts of the Fund and the Subsidiary. Accordingly, all inter-company transactions and balances have been eliminated. At period end, the Fund owned 21,023 shares with net assets of $11,722,285 in the Subsidiary.
Other financial information at period end:
| Total market value of investments |
$ | 10,985,480 | ||
| Net assets |
$ | 11,722,285 | ||
| Net income (loss) |
$ | (63,249) | ||
| Net realized gain (loss) |
$ | 58,900 | ||
| Net change in unrealized appreciation/depreciation |
$ | 1,092,488 |
Foreign Currency Translation. The Fund’s accounting records are maintained in U.S. dollars. The values of securities denominated in foreign currencies and amounts related to the purchase and sale of foreign securities and foreign investment income are translated into U.S. dollars as of the close of the New York Stock Exchange (the “Exchange”), normally 4:00 P.M. Eastern time, on each day the Exchange is open for trading. Foreign exchange rates may be valued primarily using a reliable bank, dealer or service authorized by the Board of Trustees.
Reported net realized gains and losses from foreign currency transactions arise from sales of portfolio securities, sales and maturities of short-term securities, sales of foreign currencies, exchange rate fluctuations between the trade and settlement dates on securities transactions, and the difference between the amounts of dividends, interest, and foreign withholding taxes recorded on the Fund’s books and the U.S. dollar equivalent of the amounts actually received or paid. Net unrealized appreciation and depreciation on the translation of assets and liabilities denominated in foreign currencies arise from changes in the values of assets and liabilities, including investments in securities at fiscal period end, resulting from changes in exchange rates.
The effect of changes in foreign currency exchange rates on investments is separately identified from the fluctuations arising from changes in market values of securities held and reported with all other foreign currency gains and losses in the Fund’s Consolidated Statement of Operations.
Allocation of Income, Expenses, Gains and Losses. Income, expenses (other than those attributable to a specific class), gains and losses are allocated on a daily basis to each class of shares based upon the relative proportion of net assets represented by such class. Operating expenses directly attributable to a specific class are charged against the operations of that class.
Dividends and Distributions to Shareholders. Dividends and distributions to shareholders, which are determined in accordance with income tax regulations and may differ from U.S. generally accepted accounting principles, are recorded on the ex-dividend date. Income and capital gain distributions, if any, are declared and paid annually or at other times as deemed necessary by the Manager.
26 OPPENHEIMER GLOBAL MULTI-ALTERNATIVES FUND/VA
2. Significant Accounting Policies (Continued)
The tax character of distributions is determined as of the Fund’s fiscal year end. Therefore, a portion of the Fund’s distributions made to shareholders prior to the Fund’s fiscal year end may ultimately be categorized as a tax return of capital.
Investment Income. Dividend income is recorded on the ex-dividend date or upon ex-dividend notification in the case of certain foreign dividends where the ex-dividend date may have passed. Non-cash dividends included in dividend income, if any, are recorded at the fair market value of the securities received. Interest income is recognized on an accrual basis. Discount and premium, which are included in interest income on the Consolidated Statement of Operations, are amortized or accreted daily.
Return of Capital Estimates. Distributions received from the Fund’s investments in Master Limited Partnerships (MLPs) and Real Estate Investments Trusts (REITs), generally are comprised of income and return of capital. The Fund records investment income and return of capital based on estimates made at the time such distributions are received. Such estimates are based on historical information available from each MLP, REIT and other industry sources. These estimates may subsequently be revised based on information received from MLPs and REITs after their tax reporting periods are concluded.
Custodian Fees. “Custodian fees and expenses” in the Consolidated Statement of Operations may include interest expense incurred by the Fund on any cash overdrafts of its custodian account during the period. Such cash overdrafts may result from the effects of failed trades in portfolio securities and from cash outflows resulting from unanticipated shareholder redemption activity. The Fund pays interest to its custodian on such cash overdrafts, to the extent they are not offset by positive cash balances maintained by the Fund, at a rate equal to the Federal Funds Rate plus 0.50%. The “Reduction to custodian expenses” line item, if applicable, represents earnings on cash balances maintained by the Fund during the period. Such interest expense and other custodian fees may be paid with these earnings.
Security Transactions. Security transactions are recorded on the trade date. Realized gains and losses on securities sold are determined on the basis of identified cost.
Indemnifications. The Fund’s organizational documents provide current and former Trustees and officers with a limited indemnification against liabilities arising in connection with the performance of their duties to the Fund. In the normal course of business, the Fund may also enter into contracts that provide general indemnifications. The Fund’s maximum exposure under these arrangements is unknown as this would be dependent on future claims that may be made against the Fund. The risk of material loss from such claims is considered remote.
Federal Taxes. The Fund intends to comply with provisions of the Internal Revenue Code applicable to regulated investment companies and to distribute substantially all of its investment company taxable income to shareholders. Therefore, no federal income or excise tax provision is required. The Fund files income tax returns in U.S. federal and applicable state jurisdictions. The statute of limitations on the Fund’s tax return filings generally remains open for the three preceding fiscal reporting period ends. The Fund has analyzed its tax positions for the fiscal year ended December 31, 2015, including open tax years, and does not believe there are any uncertain tax positions requiring recognition in the Fund’s financial statements.
Subchapter M requires, among other things, that at least 90% of the Fund’s gross income be derived from securities or derived with respect to its business of investing in securities (typically referred to as “qualifying income”). Income from commodity-linked derivatives may not be treated as “qualifying income” for purposes of the 90% gross income requirement. The Internal Revenue Service (IRS) has previously issued a number of private letter rulings which conclude that income derived from commodity index-linked notes and investments in a wholly-owned subsidiary will be “qualifying income.” As a result, the Fund will gain exposure to commodities through commodity-linked notes and its wholly-owned subsidiary.
The IRS has suspended the granting of private letter rulings pending further review. As a result, there can be no assurance that the IRS will not change its position with respect to commodity-linked notes and wholly-owned subsidiaries. In addition, future legislation and guidance from the Treasury and the IRS may adversely affect the fund’s ability to gain exposure to commodities through commodity-linked notes and its wholly-owned subsidiary.
The Fund is required to include in income for federal income tax purposes all of the subsidiary’s net income and gains whether or not such income is distributed by the subsidiary. Net income and gains from the subsidiary are generally treated as ordinary income by the Fund, regardless of the character of the subsidiary’s underlying income. Net losses from the subsidiary do not pass through to the Fund for federal income tax purposes.
During the fiscal year ended December 31, 2015, the Fund did not utilize any capital loss carryforward to offset capital gains realized in that fiscal year. The Fund had post-October foreign currency losses of $131,091 and straddle losses of $8,294. Details of the fiscal year ended December 31, 2015 capital loss carryforwards are included in the table below. Capital loss carryforwards with no expiration, if any, must be utilized prior to those with expiration dates. Capital losses with no expiration will be carried forward to future years if not offset by gains.
| Expiring |
||||
| No expiration |
$ | 2,102,249 | ||
At period end, it is estimated that the capital loss carryforwards would be $9,616,658, which will not expire. The estimated capital loss carryforward represents the carryforward as of the end of the last fiscal year, increased or decreased by capital losses or gains realized in the first six months of the current fiscal year. During the reporting period, it is estimated that the Fund will not utilize any capital loss carryforward to offset realized capital gains.
Net investment income (loss) and net realized gain (loss) may differ for financial statement and tax purposes. The character of dividends and distributions made during the fiscal year from net investment income or net realized gains are determined in accordance with federal income tax
27 OPPENHEIMER GLOBAL MULTI-ALTERNATIVES FUND/VA
NOTES TO CONSOLIDATED FINANCIAL STATEMENTS Unaudited / Continued
2. Significant Accounting Policies (Continued)
requirements, which may differ from the character of net investment income or net realized gains presented in those financial statements in accordance with U.S. GAAP. Also, due to timing of dividends and distributions, the fiscal year in which amounts are distributed may differ from the fiscal year in which the income or net realized gain was recorded by the Fund.
The aggregate cost of securities and other investments and the composition of unrealized appreciation and depreciation of securities and other investments for federal income tax purposes at period end are noted in the following table. The primary difference between book and tax appreciation or depreciation of securities and other investments, if applicable, is attributable to the tax deferral of losses or tax realization of financial statement unrealized gain or loss.
| Federal tax cost of securities |
$ | 422,315,539 | ||
| Federal tax cost of other investments |
(132,186,600) | |||
|
|
|
|||
| Total federal tax cost |
$ | 290,128,939 | ||
|
|
|
|||
| Gross unrealized appreciation |
$ | 31,793,261 | ||
| Gross unrealized depreciation |
(27,897,105) | |||
|
|
|
|||
| Net unrealized appreciation |
$ | 3,896,156 | ||
|
|
|
Use of Estimates. The preparation of financial statements in conformity with accounting principles generally accepted in the United States of America requires management to make estimates and assumptions that affect the reported amounts of assets and liabilities and disclosure of contingent assets and liabilities at the date of the financial statements and the reported amounts of increases and decreases in net assets from operations during the reporting period. Actual results could differ from those estimates.
3. Securities Valuation
The Fund calculates the net asset value of its shares as of 4:00 P.M. Eastern time, on each day the New York Stock Exchange (the “Exchange”) is open for trading, except in the case of a scheduled early closing of the Exchange, in which case the Fund will calculate net asset value of the shares as of the scheduled early closing time of the Exchange.
The Fund’s Board has adopted procedures for the valuation of the Fund’s securities and has delegated the day-to-day responsibility for valuation determinations under those procedures to the Manager. The Manager has established a Valuation Committee which is responsible for determining a “fair valuation” for any security for which market quotations are not “readily available.” The Valuation Committee’s fair valuation determinations are subject to review, approval and ratification by the Fund’s Board at its next regularly scheduled meeting covering the calendar quarter in which the fair valuation was determined.
Valuation Methods and Inputs
Securities are valued using unadjusted quoted market prices, when available, as supplied primarily by third party pricing services or dealers.
The following methodologies are used to determine the market value or the fair value of the types of securities described below:
Securities traded on a registered U.S. securities exchange (including exchange-traded derivatives other than futures and futures options) are valued based on the last sale price of the security reported on the principal exchange on which it is traded, prior to the time when the Fund’s assets are valued. In the absence of a sale, the security is valued at the mean between the bid and asked price on the principal exchange or, if not available from the principal exchange, obtained from two dealers. If bid and asked prices are not available from either the exchange or two dealers, the security is valued by using one of the following methodologies (listed in order of priority): (1) a bid from the principal exchange, (2) the mean between the bid and asked price as provided by a single dealer, or (3) a bid from a single dealer. A security of a foreign issuer traded on a foreign exchange, but not listed on a registered U.S. securities exchange, is valued based on the last sale price on the principal exchange on which the security is traded, as identified by the third party pricing service used by the Manager, prior to the time when the Fund’s assets are valued. If the last sale price is unavailable, the security is valued at the most recent official closing price on the principal exchange on which it is traded. If the last sales price or official closing price for a foreign security is not available, the security is valued at the mean between the bid and asked price per the exchange or, if not available from the exchange, obtained from two dealers. If bid and asked prices are not available from either the exchange or two dealers, the security is valued by using one of the following methodologies (listed in order of priority): (1) a bid from the exchange, (2) the mean between the bid and asked price as provided by a single dealer, or (3) a bid from a single dealer.
Shares of a registered investment company that are not traded on an exchange are valued at that investment company’s net asset value per share.
Corporate and government debt securities (of U.S. or foreign issuers) and municipal debt securities, event-linked bonds, loans, mortgage-backed securities, collateralized mortgage obligations, and asset-backed securities are valued at the mean between the “bid” and “asked” prices utilizing evaluated prices obtained from third party pricing services or broker-dealers who may use matrix pricing methods to determine the evaluated prices.
Short-term money market type debt securities with a remaining maturity of sixty days or less are valued at cost adjusted by the amortization of discount or premium to maturity (amortized cost), which approximates market value. Short-term debt securities with a remaining maturity in excess of sixty days are valued at the mean between the “bid” and “asked” prices utilizing evaluated prices obtained from third party pricing services or broker-dealers.
Structured securities, swaps, swaptions, and other over-the-counter derivatives are valued utilizing evaluated prices obtained from third party pricing services or broker-dealers.
Forward foreign currency exchange contracts are valued utilizing current and forward currency rates obtained from third party pricing services. When the settlement date of a contract is an interim date for which a quotation is not available, interpolated values are derived using the nearest dated
28 OPPENHEIMER GLOBAL MULTI-ALTERNATIVES FUND/VA
3. Securities Valuation (Continued)
forward currency rate.
Futures contracts and futures options traded on a commodities or futures exchange will be valued at the final settlement price or official closing price on the principal exchange as reported by such principal exchange at its trading session ending at, or most recently prior to, the time when the Fund’s assets are valued.
A description of the standard inputs that may generally be considered by the third party pricing vendors in determining their evaluated prices is provided below.
| Security Type | Standard inputs generally considered by third-party pricing vendors | |
| Corporate debt, government debt, municipal, mortgage- backed and asset-backed securities | Reported trade data, broker-dealer price quotations, benchmark yields, issuer spreads on comparable securities, the credit quality, yield, maturity, and other appropriate factors. | |
| Loans | Information obtained from market participants regarding reported trade data and broker-dealer price quotations. | |
| Event-linked bonds | Information obtained from market participants regarding reported trade data and broker-dealer price quotations. | |
| Structured securities | Relevant market information such as the price of underlying financial instruments, stock market indices, foreign currencies, interest rate spreads, commodities, or the occurrence of other specific events. | |
| Swaps | Relevant market information, including underlying reference assets such as credit spreads, credit event probabilities, index values, individual security values, forward interest rates, variable interest rates, volatility measures, and forward currency rates. |
If a market value or price cannot be determined for a security using the methodologies described above, or if, in the “good faith” opinion of the Manager, the market value or price obtained does not constitute a “readily available market quotation,” or a significant event has occurred that would materially affect the value of the security, the security is fair valued either (i) by a standardized fair valuation methodology applicable to the security type or the significant event as previously approved by the Valuation Committee and the Fund’s Board or (ii) as determined in good faith by the Manager’s Valuation Committee. The Valuation Committee considers all relevant facts that are reasonably available, through either public information or information available to the Manager, when determining the fair value of a security. Fair value determinations by the Manager are subject to review, approval and ratification by the Fund’s Board at its next regularly scheduled meeting covering the calendar quarter in which the fair valuation was determined. Those fair valuation standardized methodologies include, but are not limited to, valuing securities at the last sale price or initially at cost and subsequently adjusting the value based on: changes in company specific fundamentals, changes in an appropriate securities index, or changes in the value of similar securities which may be further adjusted for any discounts related to security-specific resale restrictions. When possible, such methodologies use observable market inputs such as unadjusted quoted prices of similar securities, observable interest rates, currency rates and yield curves. The methodologies used for valuing securities are not necessarily an indication of the risks associated with investing in those securities nor can it be assured that the Fund can obtain the fair value assigned to a security if it were to sell the security.
To assess the continuing appropriateness of security valuations, the Manager, or its third party service provider who is subject to oversight by the Manager, regularly compares prior day prices, prices on comparable securities, and sale prices to the current day prices and challenges those prices exceeding certain tolerance levels with the third party pricing service or broker source. For those securities valued by fair valuations, whether through a standardized fair valuation methodology or a fair valuation determination, the Valuation Committee reviews and affirms the reasonableness of the valuations based on such methodologies and fair valuation determinations on a regular basis after considering all relevant information that is reasonably available.
Classifications
Each investment asset or liability of the Fund is assigned a level at measurement date based on the significance and source of the inputs to its valuation. Various data inputs are used in determining the value of each of the Fund’s investments as of the reporting period end. These data inputs are categorized in the following hierarchy under applicable financial accounting standards:
1) Level 1-unadjusted quoted prices in active markets for identical assets or liabilities (including securities actively traded on a securities exchange)
2) Level 2-inputs other than unadjusted quoted prices that are observable for the asset or liability (such as unadjusted quoted prices for similar assets and market corroborated inputs such as interest rates, prepayment speeds, credit risks, etc.)
3) Level 3-significant unobservable inputs (including the Manager’s own judgments about assumptions that market participants would use in pricing the asset or liability).
The inputs used for valuing securities are not necessarily an indication of the risks associated with investing in those securities.
The Fund classifies each of its investments in investment companies which are publicly offered as Level 1. Investment companies that are not publicly offered are measured using net asset value as a practical expedient, and are not classified in the fair value hierarchy.
The table below categorizes amounts that are included in the Fund’s Consolidated Statement of Assets and Liabilities at period end based on valuation input level:
29 OPPENHEIMER GLOBAL MULTI-ALTERNATIVES FUND/VA
NOTES TO CONSOLIDATED FINANCIAL STATEMENTS Unaudited / Continued
3. Securities Valuation (Continued)
| Level 1— Unadjusted |
Level 2— Other Significant Observable Inputs |
Level 3— Significant Inputs |
Value | |||||||||||||
|
|
||||||||||||||||
| Assets Table |
||||||||||||||||
| Investments, at Value: |
||||||||||||||||
| Common Stocks |
||||||||||||||||
| Consumer Discretionary |
$ | 6,628,518 | $ | 369,945 | $ | — | $ | 6,998,463 | ||||||||
| Consumer Staples |
5,352,096 | — | — | 5,352,096 | ||||||||||||
| Energy |
27,621,664 | — | — | 27,621,664 | ||||||||||||
| Financials |
23,380,094 | 8,786,380 | — | 32,166,474 | ||||||||||||
| Health Care |
12,488,394 | 1,656,528 | 6,316 | 14,151,238 | ||||||||||||
| Industrials |
15,332,575 | — | — | 15,332,575 | ||||||||||||
| Information Technology |
14,739,303 | — | — | 14,739,303 | ||||||||||||
| Materials |
5,875,816 | — | — | 5,875,816 | ||||||||||||
| Telecommunication Services |
3,780,415 | — | — | 3,780,415 | ||||||||||||
| Utilities |
4,510,698 | 224 | — | 4,510,922 | ||||||||||||
| Preferred Stocks |
— | 836,050 | — | 836,050 | ||||||||||||
| Asset-Backed Securities |
— | 15,923,048 | 1,274,326 | 17,197,374 | ||||||||||||
| Mortgage-Backed Obligation |
— | 2,014,384 | — | 2,014,384 | ||||||||||||
| Foreign Government Obligations |
— | 6,394,409 | — | 6,394,409 | ||||||||||||
| Non-Convertible Corporate Bonds and Notes |
— | 43,186,536 | — | 43,186,536 | ||||||||||||
| Convertible Corporate Bonds and Notes |
— | 2,207,030 | — | 2,207,030 | ||||||||||||
| Corporate Loans |
— | 12,187,779 | — | 12,187,779 | ||||||||||||
| Event-Linked Bonds |
249,250 | 53,311,775 | — | 53,561,025 | ||||||||||||
| Short-Term Notes |
— | 123,879,157 | — | 123,879,157 | ||||||||||||
| Investment Companies |
31,352,501 | — | — | 31,352,501 | ||||||||||||
| Over-the-Counter Options Purchased |
— | 1,920,161 | — | 1,920,161 | ||||||||||||
| Over-the-Counter Interest Rate Swaptions Purchased |
— | 287,534 | — | 287,534 | ||||||||||||
|
|
|
|||||||||||||||
| Total Investments, at Value |
151,311,324 | 272,960,940 | 1,280,642 | 425,552,906 | ||||||||||||
| Other Financial Instruments: |
||||||||||||||||
| Forward currency exchange contracts |
— | 4,039,894 | — | 4,039,894 | ||||||||||||
| Futures contracts |
1,028,629 | — | — | 1,028,629 | ||||||||||||
| Centrally cleared swaps, at value |
— | 1,975,953 | — | 1,975,953 | ||||||||||||
| Swaps, at value |
— | 2,411,656 | — | 2,411,656 | ||||||||||||
|
|
|
|||||||||||||||
| Total Assets |
$ | 152,339,953 | $ | 281,388,443 | $ | 1,280,642 | 435,009,038 | |||||||||
|
|
|
|||||||||||||||
| Liabilities Table |
||||||||||||||||
| Other Financial Instruments: |
||||||||||||||||
| Common Stock Securities Sold Short |
$ | (35,522,791) | $ | (4,320,407 | ) | $ | — | $ | (39,843,198) | |||||||
| Forward currency exchange contracts |
— | (3,450,348 | ) | — | (3,450,348) | |||||||||||
| Futures contracts |
(3,128,756 | ) | — | — | (3,128,756) | |||||||||||
| Options written, at value |
— | (1,595,618 | ) | — | (1,595,618) | |||||||||||
| Centrally cleared swaps, at value |
— | (2,497,150 | ) | — | (2,497,150) | |||||||||||
| Swaps, at value |
— | (3,528,790 | ) | — | (3,528,790) | |||||||||||
|
|
|
|||||||||||||||
| Total Liabilities |
$ | (38,651,547 | ) | $ | (15,392,313 | ) | $ | — | $ | (54,043,860) | ||||||
|
|
|
|||||||||||||||
Forward currency exchange contracts and futures contracts, if any, are reported at their unrealized appreciation/depreciation at measurement date, which represents the change in the contract’s value from trade date. All additional assets and liabilities included in the above table are reported at their market value at measurement date.
The table below shows the transfers between Level 1 and Level 2. The Fund’s policy is to recognize transfers in and transfers out as of the beginning of the reporting period.
| Transfers out of Level 1* |
Transfers into Level 2* |
|||||||
| Assets Table |
||||||||
| Investments, at Value: |
||||||||
| Common Stocks Utilities |
$ (521) | $ 521 | ||||||
|
|
|
|||||||
| Total Assets |
$ (521) | $ 521 | ||||||
|
|
|
|||||||
* Transfers from Level 1 to Level 2 are a result of a change from the use of an exchange traded price to a valuation received from a third-party pricing service or a fair valuation determined based on observable market information other than quoted prices from an active market.
4. Investments and Risks
Risks of Foreign Investing. The Fund may invest in foreign securities which are subject to special risks. Securities traded in foreign markets may
30 OPPENHEIMER GLOBAL MULTI-ALTERNATIVES FUND/VA
4. Investments and Risks (Continued)
be less liquid and more volatile than those traded in U.S. markets. Foreign issuers are usually not subject to the same accounting and disclosure requirements that U.S. companies are subject to, which may make it difficult for the Fund to evaluate a foreign company’s operations or financial condition. A change in the value of a foreign currency against the U.S. dollar will result in a change in the U.S. dollar value of investments denominated in that foreign currency and in the value of any income or distributions the Fund may receive on those investments. The value of foreign investments may be affected by exchange control regulations, foreign taxes, higher transaction and other costs, delays in the settlement of transactions, changes in economic or monetary policy in the United States or abroad, expropriation or nationalization of a company’s assets, or other political and economic factors. In addition, due to the inter-relationship of global economies and financial markets, changes in political and economic factors in one country or region could adversely affect conditions in another country or region. Investments in foreign securities may also expose the Fund to time-zone arbitrage risk. Foreign securities may trade on weekends or other days when the Fund does not price its shares. At times, the Fund may emphasize investments in a particular country or region and may be subject to greater risks from adverse events that occur in that country or region. Foreign securities and foreign currencies held in foreign banks and securities depositories may be subject to limited or no regulatory oversight.
Investments in Affiliated Funds. The Fund is permitted to invest in other mutual funds advised by the Manager (“Affiliated Funds”). Affiliated Funds are open-end management investment companies registered under the 1940 Act, as amended. The Manager is the investment adviser of, and the Sub-Adviser provides investment and related advisory services to, the Affiliated Funds. When applicable, the Fund’s investments in Affiliated Funds are included in the Consolidated Statement of Investments. Shares of Affiliated Funds are valued at their net asset value per share. As a shareholder, the Fund is subject to its proportional share of the Affiliated Funds’ expenses, including their management fee. The Manager will waive fees and/or reimburse Fund expenses in an amount equal to the indirect management fees incurred through the Fund’s investment in the Affiliated Funds.
Each of the Affiliated Funds in which the Fund invests has its own investment risks, and those risks can affect the value of the Fund’s investments and therefore the value of the Fund’s shares. To the extent that the Fund invests more of its assets in one Affiliated Fund than in another, the Fund will have greater exposure to the risks of that Affiliated Fund.
Investment in Oppenheimer Institutional Money Market Fund. The Fund is permitted to invest daily available cash balances in an affiliated money market fund. The Fund may invest the available cash in Class E shares of Oppenheimer Institutional Money Market Fund (“IMMF”) to seek current income while preserving liquidity or for defensive purposes. IMMF is a registered open-end management investment company, regulated as a money market fund under the 1940 Act. The Manager is the investment adviser of IMMF, and the Sub-Adviser provides investment and related advisory services to IMMF. When applicable, the Fund’s investment in IMMF is included in the Consolidated Statement of Investments. Shares of IMMF are valued at their net asset value per share. As a shareholder, the Fund is subject to its proportional share of IMMF’s Class E expenses, including its management fee. The Manager will waive fees and/or reimburse Fund expenses in an amount equal to the indirect management fees incurred through the Fund’s investment in IMMF.
Master Limited Partnerships (“MLPs”). MLPs issue common units that represent an equity ownership interest in a partnership and provide limited voting rights. MLP common units are registered with the Securities and Exchange Commission (“SEC”), and are freely tradable on securities exchanges such as the NYSE and the NASDAQ Stock Market (“NASDAQ”), or in the over-the-counter (“OTC”) market. An MLP consists of one or more general partners, who conduct the business, and one or more limited partners, who contribute capital. MLP common unit holders have a limited role in the partnership’s operations and management. The Fund, as a limited partner, normally would not be liable for the debts of the MLP beyond the amounts the Fund has contributed, but would not be shielded to the same extent that a shareholder of a corporation would be. In certain circumstances creditors of an MLP would have the right to seek return of capital distributed to a limited partner. This right of an MLP’s creditors would continue after the Fund sold its investment in the MLP.
Event-Linked Bonds. The Fund may invest in “event-linked” bonds. Event-linked bonds, which are sometimes referred to as “catastrophe” bonds, are fixed income securities for which the return of principal and payment of interest is contingent on the non-occurrence of a specific trigger event, such as a hurricane, earthquake, or other occurrence that leads to physical or economic loss. If the trigger event occurs prior to maturity, the Fund may lose all or a portion of its principal in addition to interest otherwise due from the security. Event-linked bonds may expose the Fund to certain other risks, including issuer default, adverse regulatory or jurisdictional interpretations, liquidity risk and adverse tax consequences. The Fund records the net change in market value of event-linked bonds on the Consolidated Statement of Operations as a change in unrealized appreciation or depreciation on investments. The Fund records a realized gain or loss on the Consolidated Statement of Operations upon the sale or maturity of such securities.
Loans. The Fund invests in loans made to U.S. and foreign borrowers that are corporations, partnerships or other business entities. The Fund will do so directly as an original lender or by assignment or indirectly through participation agreements or certain derivative instruments. While many of these loans will be collateralized, the Fund can also invest in uncollateralized loans. Loans are often issued in connection with recapitalizations, acquisitions, leveraged buyouts, and refinancing of borrowers. The loans often pay interest at rates that float above (or are adjusted periodically based on) a benchmark that reflects current interest rates although the Fund can also invest in loans with fixed interest rates.
Securities on a When-Issued or Delayed Delivery Basis. The Fund may purchase securities on a “when-issued” basis, and may purchase or sell securities on a “delayed delivery” basis. “When-issued” or “delayed delivery” refers to securities whose terms and indenture are available and for which a market exists, but which are not available for immediate delivery. Delivery and payment for securities that have been purchased by the Fund on a when-issued basis normally takes place within six months and possibly as long as two years or more after the trade date. During this period, such
31 OPPENHEIMER GLOBAL MULTI-ALTERNATIVES FUND/VA
NOTES TO CONSOLIDATED FINANCIAL STATEMENTS Unaudited / Continued
4. Investments and Risks (Continued)
securities do not earn interest, are subject to market fluctuation and may increase or decrease in value prior to their delivery. The purchase of securities on a when-issued basis may increase the volatility of the Fund’s net asset value to the extent the Fund executes such transactions while remaining substantially fully invested. When the Fund engages in when-issued or delayed delivery transactions, it relies on the buyer or seller, as the case may be, to complete the transaction. Their failure to do so may cause the Fund to lose the opportunity to obtain or dispose of the security at a price and yield it considers advantageous. The Fund may also sell securities that it purchased on a when-issued basis or forward commitment prior to settlement of the original purchase.
At period end, the Fund had purchased securities issued on a when-issued or delayed delivery basis and sold securities issued on a delayed delivery basis as follows:
| When-Issued or Delayed Delivery Basis Transactions |
||||
| Purchased securities |
$3,930,533 | |||
| Sold securities |
2,887,313 | |||
Restricted Securities. At period end, investments in securities included issues that are restricted. A restricted security may have a contractual restriction on its resale and is valued under methods approved by the Board of Trustees as reflecting fair value. Securities that are restricted are marked with an applicable footnote on the Consolidated Statement of Investments. Restricted securities are reported on a schedule following the Consolidated Statement of Investments.
Equity Security Risk. Stocks and other equity securities fluctuate in price. The value of the Fund’s portfolio may be affected by changes in the equity markets generally. Equity markets may experience significant short-term volatility and may fall sharply at times. Different markets may behave differently from each other and U.S. equity markets may move in the opposite direction from one or more foreign stock markets. Adverse events in any part of the equity or fixed-income markets may have unexpected negative effects on other market segments.
The prices of individual equity securities generally do not all move in the same direction at the same time and a variety of factors can affect the price of a particular company’s securities. These factors may include, but are not limited to, poor earnings reports, a loss of customers, litigation against the company, general unfavorable performance of the company’s sector or industry, or changes in government regulations affecting the company or its industry.
Credit Risk. The Fund invests in high-yield, non-investment-grade bonds, which may be subject to a greater degree of credit risk. Credit risk relates to the ability of the issuer to meet interest or principal payments or both as they become due. The Fund may acquire securities that have missed an interest payment, and is not obligated to dispose of securities whose issuers or underlying obligors subsequently miss an interest payment.
Information concerning securities not accruing interest at period end is as follows:
| Cost |
$2,295,886 | |||
| Market Value |
$1,259,739 | |||
| Market Value as % of Net Assets |
0.30% |
Sovereign Debt Risk. The Fund invests in sovereign debt securities, which are subject to certain special risks. These risks include, but are not limited to, the risk that a governmental entity may delay or refuse, or otherwise be unable, to pay interest or repay the principal on its sovereign debt. There may also be no legal process for collecting sovereign debt that a government does not pay or bankruptcy proceedings through which all or part of such sovereign debt may be collected. In addition, a restructuring or default of sovereign debt may also cause additional impacts to the financial markets, such as downgrades to credit ratings, reduced liquidity and increased volatility, among others.
5. Market Risk Factors
The Fund’s investments in securities and/or financial derivatives may expose the fund to various market risk factors:
Commodity Risk. Commodity risk relates to the change in value of commodities or commodity indexes as they relate to increases or decreases in the commodities market. Commodities are physical assets that have tangible properties. Examples of these types of assets are crude oil, heating oil, metals, livestock, and agricultural products.
Credit Risk. Credit risk relates to the ability of the issuer of debt to meet interest and principal payments, or both, as they come due. In general, lower-grade, higher-yield debt securities are subject to credit risk to a greater extent than lower-yield, higher-quality securities.
Equity Risk. Equity risk relates to the change in value of equity securities as they relate to increases or decreases in the general market.
Foreign Exchange Rate Risk. Foreign exchange rate risk relates to the change in the U.S. dollar value of a security held that is denominated in a foreign currency. The U.S. dollar value of a foreign currency denominated security will decrease as the dollar appreciates against the currency, while the U.S. dollar value will increase as the dollar depreciates against the currency.
Interest Rate Risk. Interest rate risk refers to the fluctuations in value of fixed-income securities resulting from the inverse relationship between price and yield. For example, an increase in general interest rates will tend to reduce the market value of already issued fixed-income investments, and a decline in general interest rates will tend to increase their value. In addition, debt securities with longer maturities, which tend to have higher yields,
32 OPPENHEIMER GLOBAL MULTI-ALTERNATIVES FUND/VA
5. Market Risk Factors (Continued)
are subject to potentially greater fluctuations in value from changes in interest rates than obligations with shorter maturities.
Volatility Risk. Volatility risk refers to the magnitude of the movement, but not the direction of the movement, in a financial instrument’s price over a defined time period. Large increases or decreases in a financial instrument’s price over a relative time period typically indicate greater volatility risk, while small increases or decreases in its price typically indicate lower volatility risk.
6. Use of Derivatives
The Fund’s investment objective not only permits the Fund to purchase investment securities, it also allows the Fund to enter into various types of derivatives contracts, including, but not limited to, futures contracts, forward currency exchange contracts, credit default swaps, interest rate swaps, total return swaps, variance swaps and purchased and written options. In doing so, the Fund will employ strategies in differing combinations to permit it to increase, decrease, or change the level or types of exposure to market risk factors. These instruments may allow the Fund to pursue its objectives more quickly and efficiently than if it were to make direct purchases or sales of securities capable of effecting a similar response to market factors. Such contracts may be entered into through a bilateral over-the-counter (“OTC”) transaction, or through a securities or futures exchange and cleared through a clearinghouse.
Derivatives may have little or no initial cash investment relative to their market value exposure and therefore can produce significant gains or losses in excess of their cost due to unanticipated changes in the market risk factors and the overall market. This use of embedded leverage allows the Fund to increase its market value exposure relative to its net assets and can substantially increase the volatility of the Fund’s performance. In instances where the Fund is using derivatives to decrease, or hedge, exposures to market risk factors for securities held by the Fund, there are also risks that those derivatives may not perform as expected resulting in losses for the combined or hedged positions. Some derivatives have the potential for unlimited loss, regardless of the size of the Fund’s initial investment.
Additional associated risks from investing in derivatives also exist and potentially could have significant effects on the valuation of the derivative and the Fund. Typically, the associated risks are not the risks that the Fund is attempting to increase or decrease exposure to, per its investment objectives, but are the additional risks from investing in derivatives. Examples of these associated risks are liquidity risk, which is the risk that the Fund will not be able to sell the derivative in the open market in a timely manner, and counterparty credit risk, which is the risk that the counterparty will not fulfill its obligation to the Fund.
The Fund’s actual exposures to these market risk factors and associated risks during the period are discussed in further detail, by derivative type, below.
Forward Currency Exchange Contracts
The Fund may enter into forward currency exchange contracts (“forward contracts”) for the purchase or sale of a foreign currency at a negotiated rate at a future date. Such contracts are traded in the OTC inter-bank currency dealer market.
Forward contracts are reported on a schedule following the Consolidated Statement of Investments. The unrealized appreciation (depreciation) is reported in the Consolidated Statement of Assets and Liabilities as a receivable (or payable) and in the Consolidated Statement of Operations within the change in unrealized appreciation (depreciation). At contract close, the difference between the original cost of the contract and the value at the close date is recorded as a realized gain (loss) in the Consolidated Statement of Operations.
The Fund has entered into forward contracts with the obligation to purchase specified foreign currencies in the future at a currently negotiated forward rate in order to take a positive investment perspective on the related currency. These forward contracts seek to increase exposure to foreign exchange rate risk.
The Fund has entered into forward contracts with the obligation to purchase specified foreign currencies in the future at a currently negotiated forward rate in order to decrease exposure to foreign exchange rate risk associated with foreign currency denominated securities held by the Fund.
The Fund has entered into forward contracts with the obligation to sell specified foreign currencies in the future at a currently negotiated forward rate in order to take a negative investment perspective on the related currency. These forward contracts seek to increase exposure to foreign exchange rate risk.
The Fund has entered into forward contracts with the obligation to sell specified foreign currencies in the future at a currently negotiated forward rate in order to decrease exposure to foreign exchange rate risk associated with foreign currency denominated securities held by the Fund.
During the reporting period, the Fund had daily average contract amounts on forward contracts to buy and sell of $119,812,517 and $178,547,913, respectively.
Additional associated risk to the Fund includes counterparty credit risk. Counterparty credit risk arises from the possibility that the counterparty to a forward contract will default and fail to perform its obligations to the Fund.
Futures Contracts
A futures contract is a commitment to buy or sell a specific amount of a commodity, financial instrument or currency at a negotiated price on a stipulated future date. The Fund may buy and sell futures contracts and may also buy or write put or call options on these futures contracts. Futures contracts and options thereon are generally entered into on a regulated futures exchange and cleared through a clearinghouse associated with the exchange.
Upon entering into a futures contract, the Fund is required to deposit either cash or securities (initial margin) in an amount equal to a certain percentage of the contract value in an account registered in the futures commission merchant’s name. Subsequent payments (variation margin) are paid to or from the futures commission merchant each day equal to the daily changes in the contract value. Such payments are recorded as unrealized gains and losses. Should the Fund fail to make requested variation margin payments, the futures commission merchant can gain access to the initial margin to
33 OPPENHEIMER GLOBAL MULTI-ALTERNATIVES FUND/VA
NOTES TO CONSOLIDATED FINANCIAL STATEMENTS Unaudited / Continued
6. Use of Derivatives (Continued)
satisfy the Fund’s payment obligations.
Futures contracts are reported on a schedule following the Consolidated Statement of Investments. Securities held by a futures commission merchant to cover initial margin requirements on open futures contracts are noted in the Consolidated Statement of Investments. Cash held by a futures commission merchant to cover initial margin requirements on open futures contracts and the receivable and/or payable for the daily mark to market for the variation margin are noted in the Consolidated Statement of Assets and Liabilities. The net change in unrealized appreciation and depreciation is reported in the Consolidated Statement of Operations. Realized gains (losses) are reported in the Consolidated Statement of Operations at the closing or expiration of futures contracts.
The Fund has purchased futures contracts on various bonds and notes to increase exposure to interest rate risk.
The Fund has sold futures contracts on various bonds and notes to decrease exposure to interest rate risk.
The Fund has purchased futures contracts on various equity indexes to increase exposure to equity risk.
The Fund has sold futures contracts on various equity indexes to decrease exposure to equity risk.
The Fund has purchased futures contracts, which have values that are linked to the price movement of the related volatility indexes, in order to increase exposure to volatility risk.
The Fund has sold futures contracts, which have values that are linked to the price movement of the related volatility indexes, in order to decrease exposure to volatility risk.
The Fund has purchased futures contracts, which have values that are linked to the price movement of the related commodities, in order to increase exposure to commodity risk.
The Fund has sold futures contracts, which have values that are linked to the price movement of the related commodities, in order to decrease exposure to commodity risk.
During the reporting period, the Fund had an ending monthly average market value of $34,671,543 and $98,088,560 on futures contracts purchased and sold, respectively.
Additional associated risks of entering into futures contracts (and related options) include the possibility that there may be an illiquid market where the Fund is unable to liquidate the contract or enter into an offsetting position and, if used for hedging purposes, the risk that the price of the contract will correlate imperfectly with the prices of the Fund’s securities.
Option Activity
The Fund may buy and sell put and call options, or write put and call options. When an option is written, the Fund receives a premium and becomes obligated to sell or purchase the underlying security, currency or other underlying financial instrument at a fixed price, upon exercise of the option.
Options can be traded through an exchange or through a privately negotiated arrangement with a dealer in an OTC transaction. Options traded through an exchange are generally cleared through a clearinghouse (such as The Options Clearing Corporation). The difference between the premium received or paid, and market value of the option, is recorded as unrealized appreciation or depreciation. The net change in unrealized appreciation or depreciation is reported in the Consolidated Statement of Operations. When an option is exercised, the cost of the security purchased or the proceeds of the security sale are adjusted by the amount of premium received or paid. Upon the expiration or closing of the option transaction, a gain or loss is reported in the Consolidated Statement of Operations.
The Fund has purchased call options on currencies to increase exposure to foreign exchange rate risk. A purchased call option becomes more valuable as the price of the underlying financial instrument appreciates relative to the strike price.
The Fund has purchased put options on currencies to decrease exposure to foreign exchange rate risk. A purchased put option becomes more valuable as the price of the underlying financial instrument depreciates relative to the strike price.
The Fund has purchased put options on treasury and/or euro futures to decrease exposure to interest rate risk. A purchased put option becomes more valuable as the price of the underlying financial instrument depreciates relative to the strike price.
The Fund has purchased call options on individual equity securities and/or equity indexes to increase exposure to equity risk. A purchased call option becomes more valuable as the price of the underlying financial instrument appreciates relative to the strike price.
The Fund has purchased put options on individual equity securities and/or equity indexes to decrease exposure to equity risk. A purchased put option becomes more valuable as the price of the underlying financial instrument depreciates relative to the strike price.
During the reporting period, the Fund had an ending monthly average market value of $596,894 and $711,863 on purchased call options and purchased put options, respectively.
Options written, if any, are reported in a schedule following the Consolidated Statement of Investments and as a liability in the Consolidated Statement of Assets and Liabilities. Securities held in collateral accounts to cover potential obligations with respect to outstanding written options are noted in the Consolidated Statement of Investments.
The risk in writing a call option is that the market price of the security increases and if the option is exercised, the Fund must either purchase the security at a higher price for delivery or, if the Fund owns the underlying security, give up the opportunity for profit. The risk in writing a put option is that the Fund may incur a loss if the market price of the security decreases and the option is exercised. The risk in buying an option is that the Fund pays a premium whether or not the option is exercised. The Fund also has the additional risk that there may be an illiquid market where the Fund is unable to close the contract.
The Fund has written put options on currencies to increase exposure to foreign exchange rate risk. A written put option becomes more valuable as the price of the underlying financial instrument appreciates relative to the strike price.
The Fund has written call options on currencies to decrease exposure to foreign exchange rate risk. A written call option becomes more valuable as
34 OPPENHEIMER GLOBAL MULTI-ALTERNATIVES FUND/VA
6. Use of Derivatives (Continued)
the price of the underlying financial instrument depreciates relative to the strike price.
The Fund has written call options on treasury and/or euro futures to decrease exposure to interest rate risk. A written call option becomes more valuable as the price of the underlying financial instrument depreciates relative to the strike price.
During the reporting period, the Fund had an ending monthly average market value of $780,394 and $549,779 on written call options and written put options, respectively.
Additional associated risks to the Fund include counterparty credit risk and liquidity risk.
Written option activity for the reporting period was as follows:
| Number of Contracts |
Amount of Premiums |
|||||||
|
|
||||||||
| Options outstanding as of December 31, 2015 | 5,400,003,810 | $ | 609,381 | |||||
| Options written |
140,556,603,630 | 8,682,627 | ||||||
| Options closed or expired |
(19,861,610,000) | (3,172,633) | ||||||
| Options exercised |
(19,054,838,440) | (3,765,941) | ||||||
|
|
|
|||||||
| Options outstanding as of June 30, 2016 | 107,040,159,000 | $ | 2,353,434 | |||||
|
|
|
|||||||
Swap Contracts
The Fund may enter into swap contract agreements with a counterparty to exchange a series of cash flows based on either specified reference rates, the price or volatility of asset or non-asset references, or the occurrence of a credit event, over a specified period. Swaps can be executed in a bi-lateral privately negotiated arrangement with a dealer in an OTC transaction (“OTC swaps”) or executed on a regulated market. Certain swaps, regardless of the venue of their execution, are required to be cleared through a clearinghouse (“centrally cleared swaps”). Swap contracts may include interest rate, equity, debt, index, total return, credit default, currency, and volatility swaps.
Swap contracts are reported on a schedule following the Consolidated Statement of Investments. The values of centrally cleared swap and OTC swap contracts are aggregated by positive and negative values and disclosed separately on the Consolidated Statement of Assets and Liabilities. The unrealized appreciation (depreciation) related to the change in the valuation of the notional amount of the swap is combined with the accrued interest due to (owed by) the Fund, if any, at termination or settlement. The net change in this amount during the period is included on the Consolidated Statement of Operations. The Fund also records any periodic payments received from (paid to) the counterparty, including at termination, under such contracts as realized gain (loss) on the Consolidated Statement of Operations.
Swap contract agreements are exposed to the market risk factor of the specific underlying reference rate or asset. Swap contracts are typically more attractively priced compared to similar investments in related cash securities because they isolate the risk to one market risk factor and eliminate the other market risk factors. Investments in cash securities (for instance bonds) have exposure to multiple risk factors (credit and interest rate risk). Because swaps have embedded leverage, they can expose the Fund to substantial risk in the isolated market risk factor.
Credit Default Swap Contracts. A credit default swap is a contract that enables an investor to buy or sell protection against a defined-issuer credit event, such as the issuer’s failure to make timely payments of interest or principal on a debt security, bankruptcy or restructuring. The Fund may enter into credit default swaps either by buying or selling protection on a corporate issuer, sovereign issuer, or a basket or index of issuers (the “reference asset”).
The buyer of protection pays a periodic fee to the seller of protection based on the notional amount of the swap contract. The seller of protection agrees to compensate the buyer of protection for future potential losses as a result of a credit event on the reference asset. The contract effectively transfers the credit event risk of the reference asset from the buyer of protection to the seller of protection.
The ongoing value of the contract will fluctuate throughout the term of the contract based primarily on the credit risk of the reference asset. If the credit quality of the reference asset improves relative to the credit quality at contract initiation, the buyer of protection may have an unrealized loss greater than the anticipated periodic fee owed. This unrealized loss would be the result of current credit protection being cheaper than the cost of credit protection at contract initiation. If the buyer elects to terminate the contract prior to its maturity, and there has been no credit event, this unrealized loss will become realized. If the contract is held to maturity, and there has been no credit event, the realized loss will be equal to the periodic fee paid over the life of the contract.
If there is a credit event, the buyer of protection can exercise its rights under the contract and receive a payment from the seller of protection equal to the notional amount of the swap less the market value of specified debt securities issued by the reference asset. Upon exercise of the contract the difference between such value and the notional amount is recorded as realized gain (loss) and is included on the Consolidated Statement of Operations.
The Fund has sold credit protection through credit default swaps to increase exposure to the credit risk of individual issuers and/or indexes of issuers that are either unavailable or considered to be less attractive in the bond market.
The Fund has purchased credit protection through credit default swaps to decrease exposure to the credit risk of individual issuers and/or indexes of issuers.
The Fund has engaged in spread curve trades by simultaneously purchasing and selling protection through credit default swaps referenced to the same reference asset but with different maturities. Spread curve trades attempt to gain exposure to credit risk on a forward basis by realizing gains on the expected differences in spreads.
35 OPPENHEIMER GLOBAL MULTI-ALTERNATIVES FUND/VA
NOTES TO CONSOLIDATED FINANCIAL STATEMENTS Unaudited / Continued
6. Use of Derivatives (Continued)
For the reporting period, the Fund had ending monthly average notional amounts of $65,437,631 and $19,873,214 on credit default swaps to buy protection and credit default swaps to sell protection, respectively.
Additional associated risks to the Fund include counterparty credit risk and liquidity risk.
Interest Rate Swap Contracts. An interest rate swap is an agreement between counterparties to exchange periodic payments based on interest rates. One cash flow stream will typically be a floating rate payment based upon a specified floating interest rate while the other is typically a fixed interest rate.
The Fund has entered into interest rate swaps in which it pays a floating interest rate and receives a fixed interest rate in order to increase exposure to interest rate risk. Typically, if relative interest rates rise, payments made by the Fund under a swap agreement will be greater than the payments received by the Fund.
The Fund has entered into interest rate swaps in which it pays a fixed interest rate and receives a floating interest rate in order to decrease exposure to interest rate risk. Typically, if relative interest rates rise, payments received by the Fund under the swap agreement will be greater than the payments made by the Fund.
For the reporting period, the Fund had ending monthly average notional amounts of $20,108,950 and $23,014,139 on interest rate swaps which pay a fixed rate and interest rate swaps which receive a fixed rate, respectively.
Additional associated risks to the Fund include counterparty credit risk and liquidity risk.
Total Return Swap Contracts. A total return swap is an agreement between counterparties to exchange periodic payments based on the value of asset or non-asset references. One cash flow is typically based on a non-asset reference (such as an interest rate) and the other on the total return of a reference asset (such as a security or a basket of securities or securities index). The total return of the reference asset typically includes appreciation or depreciation on the reference asset, plus any interest or dividend payments.
Total return swap contracts are exposed to the market risk factor of the specific underlying financial instrument or index. Total return swaps are less standard in structure than other types of swaps and can isolate and/or include multiple types of market risk factors including equity risk, credit risk, and interest rate risk.
The Fund has entered into total return swaps on various equity securities or indexes to increase exposure to equity risk. These equity risk related total return swaps require the Fund to pay a floating reference interest rate, and an amount equal to the negative price movement of securities or an index (expressed as a percentage) multiplied by the notional amount of the contract. The Fund will receive payments equal to the positive price movement of the same securities or index (expressed as a percentage) multiplied by the notional amount of the contract and, in some cases, dividends paid on the securities.
The Fund has entered into total return swaps on various equity securities or indexes to decrease exposure to equity risk. These equity risk related total return swaps require the Fund to pay an amount equal to the positive price movement of securities or an index (expressed as a percentage) multiplied by the notional amount of the contract and, in some cases, dividends paid on the securities. The Fund will receive payments of a floating reference interest rate and an amount equal to the negative price movement of the same securities or index (expressed as a percentage) multiplied by the notional amount of the contract.
The Fund has entered into total return swaps to increase exposure to the credit risk of various indexes or basket of securities. These credit risk related total return swaps require the Fund to pay to, or receive payments from, the counterparty based on the movement of credit spreads of the related indexes or securities.
The Fund has entered into total return swaps to decrease exposure to the credit risk of various indexes or basket of securities. These credit risk related total return swaps require the fund to pay to, or receive payments from, the counterparty based on the movement of credit spreads of the related indexes or securities.
For the reporting period, the Fund had ending monthly average notional amounts of $171,960,731 and $41,043,557 on total return swaps which are long the reference asset and total return swaps which are short the reference asset, respectively.
Additional associated risks to the Fund include counterparty credit risk and liquidity risk.
Volatility Swap Contracts. A volatility swap is an agreement between counterparties to exchange periodic payments based on the measured volatility of a reference security, index, currency or other reference investment over a specified time frame. One cash flow is typically based on the realized volatility of the reference investment as measured by changes in its price or level over the specified time period while the other cash flow is based on a specified rate representing expected volatility for the reference investment at the time the swap is executed, or the measured volatility of a different reference investment over the specified time period. The appreciation or depreciation on a volatility swap will typically depend on the magnitude of the reference investment’s volatility, or size of the movements in its price, over the specified time period, rather than general directional increases or decreases in its price.
Volatility swaps are less standard in structure than other types of swaps and provide pure, or isolated, exposure to volatility risk of the specific underlying reference investment. Volatility swaps are typically used to speculate on future volatility levels, to trade the spread between realized and expected volatility, or to decrease the volatility exposure of investments held by the Fund.
Variance swaps are a type of volatility swap where counterparties agree to exchange periodic payments based on the measured variance (or the volatility squared) of a reference security, index, or other reference investment over a specified time period. At payment date, a net cash flow will be exchanged based on the difference between the realized variance of the reference investment over the specified time period and the specified rate representing expected variance for the reference investment at the time the swap is executed multiplied by the notional amount of the contract.
The Fund has entered into volatility swaps to increase exposure to the volatility risk of various reference investments. These types of volatility swaps require the Fund to pay the measured volatility and receive a fixed rate payment. If the measured volatility of the related reference investment
36 OPPENHEIMER GLOBAL MULTI-ALTERNATIVES FUND/VA
6. Use of Derivatives (Continued)
increases over the period, the swaps will depreciate in value. Conversely, if the measured volatility of the related reference investment decreases over the period, the swaps will appreciate in value.
The Fund has entered into volatility swaps to decrease exposure to the volatility risk of various reference investments. These types of volatility swaps require the Fund to pay a fixed rate payment and receive the measured volatility. If the measured volatility of the related reference investment increases over the period, the swaps will appreciate in value. Conversely, if the measured volatility of the related reference investment decreases over the period, the swaps will depreciate in value.
The Fund has entered into variance swaps to increase exposure to the volatility risk of various reference investments. These types of volatility swaps require the Fund to make a payment if the measured price variance of the reference investment exceeds the specified fixed rate. If the measured variance of the related reference investment increases over the period, the swaps will depreciate in value. Conversely, if the measured variance of the related reference investment decreases over the period, the swaps will appreciate in value.
The Fund has entered into variance swaps to decrease exposure to the volatility risk of various reference investments. These types of volatility swaps require the Fund to make a payment if the measured price variance of the reference asset is less than the specified fixed rate. If the measured variance of the related reference investment increases over the period, the swaps will appreciate in value. Conversely, if the measured variance of the related reference investment decreases over the period, the swaps will depreciate in value.
For the reporting period, the Fund had ending monthly average notional amounts of $47,215 and $33,706 on volatility swaps which pay measured volatility/variance and volatility swaps which receive measured volatility/variance, respectively.
Additional associated risks to the Fund include counterparty credit risk and liquidity risk.
Swaption Transactions
The Fund may enter into a swaption contract which grants the purchaser the right, but not the obligation, to enter into a swap transaction at preset terms detailed in the underlying agreement within a specified period of time. The purchaser pays a premium to the swaption writer who bears the risk of unfavorable changes in the preset terms on the underlying swap.
Purchased swaptions are reported as a component of investments in the Consolidated Statement of Investments and the Consolidated Statement of Assets and Liabilities. Written swaptions are reported on a schedule following the Consolidated Statement of Investments and their value is reported as a separate asset or liability line item in the Consolidated Statement of Assets and Liabilities. The net change in unrealized appreciation or depreciation on written swaptions is separately reported in the Consolidated Statement of Operations. When a swaption is exercised, the cost of the swap is adjusted by the amount of premium paid or received. Upon the expiration or closing of an unexercised swaption contract, a gain or loss is reported in the Consolidated Statement of Operations for the amount of the premium paid or received.
The Fund generally will incur a greater risk when it writes a swaption than when it purchases a swaption. When the Fund writes a swaption it will become obligated, upon exercise of the swaption, according to the terms of the underlying agreement. Swaption contracts written by the Fund do not give rise to counterparty credit risk prior to exercise as they obligate the Fund, not its counterparty, to perform. When the Fund purchases a swaption it only risks losing the amount of the premium it paid if the swaption expires unexercised. However, when the Fund exercises a purchased swaption there is a risk that the counterparty will fail to perform or otherwise default on its obligations under the swaption contract.
The Fund has purchased swaptions which gives it the option to enter into an interest rate swap in which it pays a fixed interest rate and receives a floating interest rate in order to decrease exposure to interest rate risk. A purchased swaption of this type becomes more valuable as the reference interest rate increases relative to the preset interest rate.
During the reporting period, the Fund had an ending monthly average market value of $390,525 on purchased swaptions.
Counterparty Credit Risk. Derivative positions are subject to the risk that the counterparty will not fulfill its obligation to the Fund. The Fund intends to enter into derivative transactions with counterparties that the Manager believes to be creditworthy at the time of the transaction.
The Fund’s risk of loss from counterparty credit risk on OTC derivatives is generally limited to the aggregate unrealized gain netted against any collateral held by the Fund. For OTC options purchased, the Fund bears the risk of loss of the amount of the premiums paid plus the positive change in market values net of any collateral held by the Fund should the counterparty fail to perform under the contracts. Options written by the Fund do not typically give rise to counterparty credit risk, as options written generally obligate the Fund and not the counterparty to perform.
To reduce counterparty risk with respect to OTC transactions, the Fund has entered into master netting arrangements, established within the Fund’s International Swap and Derivatives Association, Inc. (“ISDA”) master agreements, which allow the Fund to make (or to have an entitlement to receive) a single net payment in the event of default (close-out netting) for outstanding payables and receivables with respect to certain OTC positions in swaps, options, swaptions, and forward currency exchange contracts for each individual counterparty. In addition, the Fund may require that certain counterparties post cash and/or securities in collateral accounts to cover their net payment obligations for those derivative contracts subject to ISDA master agreements. If the counterparty fails to perform under these contracts and agreements, the cash and/or securities will be made available to the Fund.
At period end, the Fund has required certain counterparties to post collateral of $2,429,884.
ISDA master agreements include credit related contingent features which allow counterparties to OTC derivatives to terminate derivative contracts prior to maturity in the event that, for example, the Fund’s net assets decline by a stated percentage or the Fund fails to meet the terms of its ISDA master agreements, which would cause the Fund to accelerate payment of any net liability owed to the counterparty.
For financial reporting purposes, the Fund does not offset derivative assets and derivative liabilities that are subject to netting arrangements in the Consolidated Statement of Assets and Liabilities. Bankruptcy or insolvency laws of a particular jurisdiction may impose restrictions on or prohibitions
37 OPPENHEIMER GLOBAL MULTI-ALTERNATIVES FUND/VA
NOTES TO CONSOLIDATED FINANCIAL STATEMENTS Unaudited / Continued
6. Use of Derivatives (Continued)
against the right of offset in bankruptcy, insolvency or other events.
The Fund’s risk of loss from counterparty credit risk on exchange-traded derivatives cleared through a clearinghouse and for centrally cleared swaps is generally considered lower than as compared to OTC derivatives. However, counterparty credit risk exists with respect to initial and variation margin deposited/paid by the Fund that is held in futures commission merchant, broker and/or clearinghouse accounts for such exchange-traded derivatives and for centrally cleared swaps.
With respect to centrally cleared swaps, such transactions will be submitted for clearing, and if cleared, will be held in accounts at futures commission merchants or brokers that are members of clearinghouses. While brokers, futures commission merchants and clearinghouses are required to segregate customer margin from their own assets, in the event that a broker, futures commission merchant or clearinghouse becomes insolvent or goes into bankruptcy and at that time there is a shortfall in the aggregate amount of margin held by the broker, futures commission merchant or clearinghouse for all its customers, U.S. bankruptcy laws will typically allocate that shortfall on a pro-rata basis across all the broker’s, futures commission merchant’s or clearinghouse’s customers, potentially resulting in losses to the Fund.
There is the risk that a broker, futures commission merchant or clearinghouse will decline to clear a transaction on the Fund’s behalf, and the Fund may be required to pay a termination fee to the executing broker with whom the Fund initially enters into the transaction. Clearinghouses may also be permitted to terminate centrally cleared swaps at any time. The Fund is also subject to the risk that the broker or futures commission merchant will improperly use the Fund’s assets deposited/paid as initial or variation margin to satisfy payment obligations of another customer. In the event of a default by another customer of the broker or futures commission merchant, the Fund might not receive its variation margin payments from the clearinghouse, due to the manner in which variation margin payments are aggregated for all customers of the broker/futures commission merchant.
Collateral and margin requirements differ by type of derivative. Margin requirements are established by the broker, futures commission merchant or clearinghouse for exchange-traded and cleared derivatives, including centrally cleared swaps. Brokers, futures commission merchants and clearinghouses can ask for margin in excess of the regulatory minimum, or increase the margin amount, in certain circumstances.
Collateral terms are contract specific for OTC derivatives. For derivatives traded under an ISDA master agreement, the collateral requirements are typically calculated by netting the mark to market amount for each transaction under such agreement and comparing that amount to the value of any collateral currently pledged by the Fund or the counterparty.
For financial reporting purposes, cash collateral that has been pledged to cover obligations of the Fund, if any, is reported separately on the Consolidated Statement of Assets and Liabilities as cash pledged as collateral. Non-cash collateral pledged by the Fund, if any, is noted in the Consolidated Statement of Investments. Generally, the amount of collateral due from or to a party must exceed a minimum transfer amount threshold (e.g. $250,000) before a transfer has to be made. To the extent amounts due to the Fund from its counterparties are not fully collateralized, contractually or otherwise, the Fund bears the risk of loss from counterparty nonperformance.
The following table presents by counterparty the Fund’s OTC derivative assets net of the related collateral pledged by the Fund at period end:
| Gross Amounts Not Offset in the Consolidated Statement of Assets & Liabilities |
||||||||||||||||||||
| Counterparty | Gross Amounts Not Offset in the Consolidated Statement of Assets & Liabilities* |
Financial Instruments Available for Offset |
Financial Instruments Collateral Received** |
Cash Collateral Received** |
Net Amount | |||||||||||||||
|
|
||||||||||||||||||||
| Bank of America NA | $ | 1,729,965 | $ | (892,661) | $ | (837,304) | $ | – | $ | – | ||||||||||
| Barclays Bank plc | 613,032 | (261,701) | (303,827) | – | 47,504 | |||||||||||||||
| BNP Paribas | 637,469 | (313,446) | – | – | 324,023 | |||||||||||||||
| Citibank NA | 730,732 | (730,732) | – | – | – | |||||||||||||||
| Deutsche Bank Securities, Inc. | 309,794 | (309,794) | – | – | – | |||||||||||||||
| Goldman Sachs Bank USA | 239,077 | (238,550) | (527) | – | – | |||||||||||||||
| Goldman Sachs Group, Inc. (The) | 1,184,245 | (1,184,245) | – | – | – | |||||||||||||||
| HSBC Bank USA NA | 134,834 | – | – | – | 134,834 | |||||||||||||||
| JPMorgan Chase Bank NA | 1,794,585 | (1,794,585) | – | – | – | |||||||||||||||
| Morgan Stanley | 55,801 | – | – | – | 55,801 | |||||||||||||||
| Morgan Stanley Capital Services, Inc. | 329,236 | (195,103) | – | (134,133) | – | |||||||||||||||
| Nomura Global Financial Products, Inc. | 122,191 | – | – | – | 122,191 | |||||||||||||||
| Toronto Dominion Bank | 778,284 | (230,305) | (344,299) | – | 203,680 | |||||||||||||||
|
|
|
|||||||||||||||||||
| $ | 8,659,245 | $ | (6,151,122) | $ | (1,485,957) | $ | (134,133) | $ | 888,033 | |||||||||||
|
|
|
|||||||||||||||||||
*OTC derivatives are reported gross on the Consolidated Statement of Assets and Liabilities. Exchange traded options and margin related to centrally cleared swaps and futures are excluded from these reported amounts.
**Reported collateral posted for the benefit of the Fund within this table is limited to the net outstanding amount due from an individual counterparty. The collateral posted for the benefit of the Fund may exceed these amounts.
The following table presents by counterparty the Fund’s OTC derivative liabilities net of the related collateral pledged by the Fund at June 30, 2016:
38 OPPENHEIMER GLOBAL MULTI-ALTERNATIVES FUND/VA
6. Use of Derivatives (Continued)
| Gross Amounts Not Offset in the Consolidated Statement of Assets & Liabilities |
||||||||||||||||||||
| Counterparty | Gross Amounts Not Offset in the Consolidated Statement of Assets & Liabilities* |
Financial Instruments Available for Offset |
Financial Instruments Collateral Pledged** |
Cash Collateral Pledged** | Net Amount | |||||||||||||||
|
|
||||||||||||||||||||
| Bank of America NA | $ | (892,661) | $ | 892,661 | $ | – | $ | – | $ | – | ||||||||||
| Barclays Bank plc | (261,701) | 261,701 | – | – | – | |||||||||||||||
| BNP Paribas | (313,446) | 313,446 | – | – | – | |||||||||||||||
| Citibank NA | (945,055) | 730,732 | 214,323 | – | – | |||||||||||||||
| Deutsche Bank Securities, Inc. | (871,552) | 309,794 | 561,758 | – | – | |||||||||||||||
| Goldman Sachs Bank USA | (238,550) | 238,550 | – | – | – | |||||||||||||||
| Goldman Sachs Group, Inc. (The) | (1,346,594) | 1,184,245 | 162,349 | – | – | |||||||||||||||
| JPMorgan Chase Bank NA | (2,269,593) | 1,794,585 | 475,008 | – | – | |||||||||||||||
| Morgan Stanley Capital Services, Inc. | (195,103) | 195,103 | – | – | – | |||||||||||||||
| Royal Bank of Scotland plc (The) | (1,010,196) | – | 1,010,196 | – | – | |||||||||||||||
| Toronto Dominion Bank | (230,305) | 230,305 | – | – | – | |||||||||||||||
|
|
|
|||||||||||||||||||
| $ | (8,574,756) | $ | 6,151,122 | $ | 2,423,634 | $ | – | $ | – | |||||||||||
|
|
|
|||||||||||||||||||
*OTC derivatives are reported gross on the Consolidated Statement of Assets and Liabilities. Exchange traded options and margin related to centrally cleared swaps and futures are excluded from these reported amounts.
**Reported collateral pledged within this table is limited to the net outstanding amount due from the Fund. The securities pledged as collateral by the Fund as reported on the Consolidated Statements of Investments may exceed these amounts.
The following table presents the valuations of derivative instruments by risk exposure as reported within the Consolidated Statement of Assets and Liabilities at period end:
| Asset Derivatives |
Liability Derivatives |
|||||||||||
| Derivatives Not Accounted for as Hedging Instruments |
Consolidated Statement of Assets and Liabilities Location |
Value | Consolidated Statement of Assets and Liabilities Location |
Value | ||||||||
|
|
||||||||||||
| Credit contracts |
Swaps, at value | $ | 1,001,382 | Swaps, at value | $ | 1,944,942 | ||||||
| Equity contracts |
Swaps, at value | 1,289,354 | Swaps, at value | 1,580,276 | ||||||||
| Interest rate contracts |
Swaps, at value | 15,068 | Swaps, at value | 3,572 | ||||||||
| Volatility contracts |
Swaps, at value | 105,852 | ||||||||||
| Credit contracts |
Centrally cleared swaps, at value | 42,814 | Centrally cleared swaps, at value | 1,122,526 | ||||||||
| Interest rate contracts |
Centrally cleared swaps, at value | 1,933,139 | Centrally cleared swaps, at value | 1,374,624 | ||||||||
| Commodity |
Variation margin receivable | 70,284* | Variation margin payable | 97,537* | ||||||||
| Equity contracts |
Variation margin payable | 1,202,975* | ||||||||||
| Interest rate contracts |
Variation margin receivable | 3,359* | Variation margin payable | 26,250* | ||||||||
| Forward currency exchange contracts |
Unrealized appreciation on forward currency exchange contracts | 4,039,894 | Unrealized depreciation on forward currency exchange contracts | 3,450,348 | ||||||||
| Options written, at value | 1,595,618 | |||||||||||
| Forward currency exchange contracts |
Investments, at value | 1,920,161** | ||||||||||
| Interest rate contracts |
Investments, at value | 287,534** | ||||||||||
|
|
|
|
|
|||||||||
| Total |
$ | 10,708,841 | $ | 12,398,668 | ||||||||
|
|
|
|
|
|||||||||
*Includes only the current day’s variation margin. Prior variation margin movements have been reflected in cash on the Consolidated Statement of Assets and Liabilities upon receipt or payment.
**Amounts relate to purchased option contracts and purchased swaption contracts, if any.
The effect of derivative instruments on the Consolidated Statement of Operations is as follows:
39 OPPENHEIMER GLOBAL MULTI-ALTERNATIVES FUND/VA
NOTES TO CONSOLIDATED FINANCIAL STATEMENTS Unaudited / Continued
6. Use of Derivatives (Continued)
| Amount of Realized Gain or (Loss) Recognized on Derivatives | ||||||||||||||||||||||||
|
|
||||||||||||||||||||||||
| Investment from | Closing and | |||||||||||||||||||||||
| Derivatives | unaffiliated | expiration | Closing and | |||||||||||||||||||||
| Not Accounted | companies(including | of option | expiration | Foreign | ||||||||||||||||||||
| for as Hedging | premiums on | contracts | of futures | currency | ||||||||||||||||||||
| Instruments | options exercised)* | written | contracts | transactions | Swap contracts | Total | ||||||||||||||||||
|
|
||||||||||||||||||||||||
| Commodity contracts | $ | — | $ | — | $ | 58,899 | $ | — | $ | — | $ | 58,899 | ||||||||||||
| Credit contracts | — | — | — | — | (1,173,588) | (1,173,588) | ||||||||||||||||||
| Equity contracts | (663,713) | — | 791,053 | — | (761,069) | (633,729) | ||||||||||||||||||
| Forward currency exchange contracts |
(214,158) | 3,172,633 | — | (3,999,976) | — | (1,041,501) | ||||||||||||||||||
| Interest rate contracts | — | — | (376,111) | — | 487,279 | 111,168 | ||||||||||||||||||
| Volatility contracts | — | — | 397,992 | — | (15,691,952) | (15,293,960) | ||||||||||||||||||
|
|
|
|||||||||||||||||||||||
| Total |
$ | (877,871) | $ | 3,172,633 | $ | 871,833 | $ | (3,999,976) | $ | (17,139,330) | $ | (17,972,711) | ||||||||||||
|
|
|
|||||||||||||||||||||||
*Includes purchased option contracts, purchased swaption contract, written option contracts exercised and written swaption contracts exercised, if any.
| Amount of Change in Unrealized Gain or (Loss) Recognized on Derivatives | ||||||||||||||||||||||||
|
|
||||||||||||||||||||||||
| Translation | ||||||||||||||||||||||||
| of assets and | ||||||||||||||||||||||||
| Derivatives | liabilities | |||||||||||||||||||||||
| Not Accounted | Option | denominated | ||||||||||||||||||||||
| for as Hedging | contracts | Futures | in foreign | |||||||||||||||||||||
| Instruments | Investments* | written | contracts | currencies | Swap contracts | Total | ||||||||||||||||||
|
|
||||||||||||||||||||||||
| Commodity contracts | $ | — | $ | — | $ | 293,628 | $ | — | $ | — | $ | 293,628 | ||||||||||||
| Credit contracts | — | — | — | — | 990,782 | 990,782 | ||||||||||||||||||
| Equity contracts | 522,754 | — | (1,085,521) | — | 1,203,224 | 640,457 | ||||||||||||||||||
| Forward currency exchange contracts |
(251,620) | 476,199 | — | (3,558,783) | — | (3,334,204) | ||||||||||||||||||
| Interest rate contracts | (260,105) | 51,594 | 182,256 | — | 464,805 | 438,550 | ||||||||||||||||||
| Volatility contracts | — | — | 76,968 | — | 288,718 | 365,686 | ||||||||||||||||||
|
|
|
|||||||||||||||||||||||
| Total | $ | 11,029 | $ | 527,793 | $ | (532,669) | $ | (3,558,783) | $ | 2,947,529 | $ | (605,101) | ||||||||||||
|
|
|
|||||||||||||||||||||||
*Includes purchased option contracts and purchased swaption contracts, if any.
7. Shares of Beneficial Interest
The Fund has authorized an unlimited number of $0.001 par value shares of beneficial interest of each class. Transactions in shares of beneficial interest were as follows:
| Six Months Ended June 30, 2016 | Year Ended December 31, 2015 | |||||||||||||||
| Shares | Amount | Shares | Amount | |||||||||||||
|
|
||||||||||||||||
| Non-Service Shares | ||||||||||||||||
| Sold | — | $ | — | 15,762,717 | $ | 159,728,797 | ||||||||||
| Dividends and/or distributions reinvested | 17,085 | 169,143 | 143,442 | 1,382,778 | ||||||||||||
| Redeemed | — | — | — | — | ||||||||||||
|
|
|
|||||||||||||||
| Net increase | 17,085 | $ | 169,143 | 15,906,159 | $ | 161,111,575 | ||||||||||
|
|
|
|||||||||||||||
|
|
||||||||||||||||
| Service Shares | ||||||||||||||||
| Sold | 31,088 | $ | 299,744 | 145,309 | $ | 1,456,569 | ||||||||||
| Dividends and/or distributions reinvested | — | — | 203 | 1,954 | ||||||||||||
| Redeemed | (24,280) | (236,836) | (87,055) | (871,516) | ||||||||||||
|
|
|
|||||||||||||||
| Net increase | 6,808 | $ | 62,908 | 58,457 | $ | 587,007 | ||||||||||
|
|
|
|||||||||||||||
8. Purchases and Sales of Securities
The aggregate cost of purchases and proceeds from sales of securities, other than short-term obligations and investments in IMMF, for the reporting period were as follows:
| Purchases | Sales | |||||||
|
|
||||||||
| Investment securities |
$119,923,162 | $124,185,908 | ||||||
9. Fees and Other Transactions with Affiliates
Management Fees. Under the investment advisory agreement, the Fund pays the Manager a management fee based on the daily net assets of the Fund at an annual rate as shown in the following table:
40 OPPENHEIMER GLOBAL MULTI-ALTERNATIVES FUND/VA
9. Fees and Other Transactions with Affiliates (Continued)
| Fee Schedule | ||||
|
|
||||
| Up to $500 million |
1.00% | |||
| Next $500 million |
0.95 | |||
| Next $4 billion |
0.90 | |||
| Over $5 billion |
0.88 | |||
The Manager also provides investment management related services to the Subsidiary. The Subsidiary pays the Manager a monthly management fee at an annual rate according to the above schedule. The Subsidiary also pays certain other expenses including custody and directors’ fees.
The Fund’s effective management fee for the reporting period was 1.00% of average annual net assets before any Subsidiary management fees or any applicable waivers.
Sub-Adviser Fees. The Manager has retained the Sub-Adviser to provide the day-to-day portfolio management of the Fund and the Subsidiary. Under the Sub-Advisory Agreement, the Manager pays the Sub-Adviser an annual fee in monthly installments, equal to a percentage of the investment management fee collected by the Manager from the Fund and the Subsidiary, which shall be calculated after any investment management fee waivers. The fee paid to the Sub-Adviser is paid by the Manager, not by the Fund.
Sub-Sub-Adviser Fees. The Sub-Adviser retains the Sub-Sub-Adviser to provide the day-today portfolio management of the Fund. Under the Sub-Sub-Advisory Agreement, the Sub-Adviser pays the Sub-Sub-Adviser an annual fee in monthly installments, based on the average daily net assets of the Fund. The fee paid to the Sub-Sub-Adviser under the Sub-Sub-Advisory agreement is paid by the Sub-Adviser, not by the Fund.
Transfer Agent Fees. OFI Global (the “Transfer Agent”) serves as the transfer and shareholder servicing agent for the Fund. The Fund pays the Transfer Agent a fee based on annual net assets. Fees incurred and average net assets for each class with respect to these services are detailed in the Consolidated Statement of Operations and Consolidated Financial Highlights, respectively.
Sub-Transfer Agent Fees. The Transfer Agent has retained Shareholder Services, Inc., a wholly-owned subsidiary of OFI (the “Sub-Transfer Agent”), to provide the day-to-day transfer agent and shareholder servicing of the Fund. Under the Sub-Transfer Agency Agreement, the Transfer Agent pays the Sub-Transfer Agent an annual fee in monthly installments, equal to a percentage of the transfer agent fee collected by the Transfer Agent from the Fund, which shall be calculated after any applicable fee waivers. The fee paid to the Sub-Transfer Agent is paid by the Transfer Agent, not by the Fund.
Trustees’ Compensation. The Fund’s Board of Trustees (“Board”) has adopted a compensation deferral plan for Independent Trustees that enables Trustees to elect to defer receipt of all or a portion of the annual compensation they are entitled to receive from the Fund. For purposes of determining the amount owed to the Trustee under the plan, deferred amounts are treated as though equal dollar amounts had been invested in shares of the Fund or in other Oppenheimer funds selected by the Trustee. The Fund purchases shares of the funds selected for deferral by the Trustee in amounts equal to his or her deemed investment, resulting in a Fund asset equal to the deferred compensation liability. Such assets are included as a component of “Other” within the asset section of the Consolidated Statement of Assets and Liabilities. Deferral of Trustees’ fees under the plan will not affect the net assets of the Fund and will not materially affect the Fund’s assets, liabilities or net investment income per share. Amounts will be deferred until distributed in accordance with the compensation deferral plan.
Distribution and Service Plan for Service Shares. The Fund has adopted a Distribution and Service Plan (the “Plan”) pursuant to Rule 12b-1 under the 1940 Act for Service shares to pay OppenheimerFunds Distributor, Inc. (the “Distributor”), for distribution related services, personal service and account maintenance for the Fund’s Service shares. Under the Plan, payments are made periodically at an annual rate of 0.25% of the daily net assets of Service shares of the Fund. The Distributor currently uses all of those fees to compensate sponsors of the insurance product that offers Fund shares, for providing personal service and maintenance of accounts of their variable contract owners that hold Service shares. These fees are paid out of the Fund’s assets on an on-going basis and increase operating expenses of the Service shares, which results in lower performance compared to the Fund’s shares that are not subject to a service fee. Fees incurred by the Fund under the Plan are detailed in the Consolidated Statement of Operations.
Waivers and Reimbursements of Expenses. The Manager has contractually agreed to waive fees and/or reimburse expenses to limit the Fund’s “Expenses after payments, waivers and/or reimbursements and reduction to custodian expenses” (excluding any applicable dividends tied to short sales expense, taxes, interest and fees from borrowing, any subsidiary expenses, Acquired Fund Fees and Expenses, brokerage commissions and certain other Fund expenses) so that, as percentages of average daily net assets, those expenses will not exceed the annual rate of 1.20% for Non-Service shares and 1.45% for Service shares. During the reporting period, the Manager waived fees and/or reimbursed the Fund $7 and $1 for Non-Service and Service shares, respectively.
The Manager has contractually agreed to waive the management fee it receives from the Fund in an amount equal to the management fee it receives from the Subsidiary. During the reporting period, the Manager waived $55,525.
The Manager will waive fees and/or reimburse Fund expenses in an amount equal to the indirect management fees incurred through the Fund’s investment in IMMF. During reporting period, the Manager waived fees and/or reimbursed the Fund $18,083 for IMMF management fees.
These undertakings may be modified or terminated as set forth according to the terms in the prospectus.
41 OPPENHEIMER GLOBAL MULTI-ALTERNATIVES FUND/VA
NOTES TO CONSOLIDATED FINANCIAL STATEMENTS Unaudited / Continued
10. Borrowing and Other Financing
Securities Sold Short. The Fund sells securities that it does not own, and it will therefore be obligated to purchase such securities at a future date. Upon entering into a short position, the Fund is required to segregate cash or securities at its custodian which are pledged for the benefit of the lending broker and/or to deposit and pledge cash directly at the lending broker, with a value equal to a certain percentage, exceeding 100%, of the value of the securities that it sold short. Cash that has been segregated and pledged for this purpose will be disclosed on the Consolidated Statement of Assets and Liabilities; securities that have been segregated and pledged for this purpose are disclosed as such in the Consolidated Statement of Investments. The aggregate market value of such cash and securities at period end is $54,876,881. The value of the open short position is recorded as a liability, and the Fund records an unrealized gain or loss to the extent of the difference between the proceeds received and the change in value of the open short position. The Fund records a realized gain or loss when the short position is closed out. By entering into short sales, the Fund bears the market risk of increases in value of the security sold short in excess of the proceeds received. Until the security is replaced, the Fund is required to pay the lender any dividend or interest earned. Dividend expense on short sales is treated as an expense in the Consolidated Statement of Operations.
Joint Credit Facility. A number of mutual funds managed by the Manager participate in a $1.28 billion revolving credit facility (the “Facility”) intended to provide short-term financing, if necessary, subject to certain restrictions in connection with atypical redemption activity. Expenses and fees related to the Facility are paid by the participating funds and are disclosed separately or as other expenses on the Consolidated Statement of Operations. The Fund did not utilize the Facility during the reporting period.
11. Pending Litigation
In 2009, several putative class action lawsuits were filed and later consolidated before the U.S. District Court for the District of Colorado against OppenheimerFunds, Inc. (“OFI”), OppenheimerFunds Distributor, Inc. (“OFDI”), and Oppenheimer Rochester California Municipal Fund, a fund advised by OFI Global Asset Management, Inc. and distributed by the Distributor (the “California Fund”), in connection with the California Fund’s investment performance. The plaintiffs asserted claims against OFI, OFDI and certain present and former trustees and officers of the California Fund under the federal securities laws, alleging, among other things, that the disclosure documents of the California Fund contained misrepresentations and omissions and the investment policies of the California Fund were not followed. Plaintiffs in the suit filed an amended complaint and defendants filed a motion to dismiss. In 2011, the court issued an order which granted in part and denied in part the defendants’ motion to dismiss. In 2012, plaintiffs filed a motion, which defendants opposed, to certify a class and appoint class representatives and class counsel. In March 2015, the court granted plaintiffs’ motion for class certification. In May 2015, the U.S. Court of Appeals for the Tenth Circuit vacated the class certification order and remanded the matter to the district court for further proceedings. In October 2015, the district court reaffirmed its order and determined that the suit will proceed as a class action. In December 2015, the Tenth Circuit denied defendants’ petition to appeal the district court’s reaffirmed class certification order.
OFI and OFDI believe the suit is without merit; that it is premature to render any opinion as to the likelihood of an outcome unfavorable to them in the suit; and that no estimate can yet be made as to the amount or range of any potential loss. Furthermore, OFI believes that the suit should not impair the ability of OFI or OFDI to perform their respective duties to the Fund and that the outcome of the suit should not have any material effect on the operations of any of the Oppenheimer funds.
42 OPPENHEIMER GLOBAL MULTI-ALTERNATIVES FUND/VA
PORTFOLIO PROXY VOTING POLICIES AND GUIDELINES; UPDATES TO STATEMENTS OF
INVESTMENTS Unaudited
The Fund has adopted Portfolio Proxy Voting Policies and Guidelines under which the Fund votes proxies relating to securities (“portfolio proxies”) held by the Fund. A description of the Fund’s Portfolio Proxy Voting Policies and Guidelines is available (i) without charge, upon request, by calling the Fund toll-free at 1.800.525.7048, (ii) on the Fund’s website at www.oppenheimerfunds.com, and (iii) on the SEC’s website at www.sec.gov. In addition, the Fund is required to file Form N-PX, with its complete proxy voting record for the 12 months ended June 30th, no later than August 31st of each year. The Fund’s voting record is available (i) without charge, upon request, by calling the Fund toll-free at 1.800.525.7048, and (ii) in the Form N-PX filing on the SEC’s website at www.sec.gov.
The Fund files its complete schedule of portfolio holdings with the SEC for the first quarter and the third quarter of each fiscal year on Form N-Q. The Fund’s Form N-Q filings are available on the SEC’s website at www.sec.gov. Those forms may be reviewed and copied at the SEC’s Public Reference Room in Washington, D.C. Information on the operation of the Public Reference Room may be obtained by calling 1-800-SEC-0330.
43 OPPENHEIMER GLOBAL MULTI-ALTERNATIVES FUND/VA
DISTRIBUTION SOURCES Unaudited
For any distribution that took place over the Fund’s reporting period, the table below details on a per-share basis the percentage of the Fund’s total distribution payment amount that was derived from the following sources: net income, net profit from the sale of securities, and other capital sources.
This information is based upon income and capital gains using generally accepted accounting principles as of the date of each distribution. For certain securities, such as Real Estate Investment Trusts (“REITs”) and Master Limited Partnerships (“MLPs”), the percentages attributed to each category are estimated using historical information because the character of the amounts received from the REITs and MLPs in which the Fund invests is unknown until after the end of the calendar year. Because the Fund is actively managed, the relative amount of the Fund’s total distributions derived from various sources over the calendar year may change. Please note that this information should not be used for tax reporting purposes as the tax character of distributable income may differ from the amounts used for this notification. You will receive IRS tax forms in the first quarter of each calendar year detailing the actual amount of the taxable and non-taxable portion of distributions paid to you during the tax year.
For the most current information, please go to oppenheimerfunds.com. Select your Fund, then the ‘Detailed’ tab; where ‘Dividends’ are shown, the Fund’s latest pay date will be followed by the sources of any distribution, updated daily.
| Fund Name | Pay | Net Income | Net Profit | Other | ||||||||||
| Date | from Sale | Capital | ||||||||||||
| Sources | ||||||||||||||
| Oppenheimer Global Multi-Alternatives Fund/VA | 6/21/16 | 37.0% | 0.0% | 63.0% | ||||||||||
44 OPPENHEIMER GLOBAL MULTI-ALTERNATIVES FUND/VA
THIS PAGE INTENTIONALLY LEFT BLANK.
45 OPPENHEIMER GLOBAL MULTI-ALTERNATIVES FUND/VA
THIS PAGE INTENTIONALLY LEFT BLANK.
46 OPPENHEIMER GLOBAL MULTI-ALTERNATIVES FUND/VA
THIS PAGE INTENTIONALLY LEFT BLANK.
47 OPPENHEIMER GLOBAL MULTI-ALTERNATIVES FUND/VA
OPPENHEIMER GLOBAL MULTI-ALTERNATIVES FUND/VA
A Series of Oppenheimer Variable Account Funds
| Trustees and Officers | Sam Freedman, Chairman of the Board of Trustees and Trustee | |
| Jon S. Fossel, Trustee | ||
| Richard F. Grabish, Trustee | ||
| Beverly L. Hamilton, Trustee | ||
| Victoria J. Herget, Trustee | ||
| Robert J. Malone, Trustee | ||
| F. William Marshall, Jr., Trustee | ||
| Karen L. Stuckey, Trustee | ||
| James D. Vaughn, Trustee | ||
| Arthur P. Steinmetz., Trustee, President and Principal Executive Officer | ||
| Mark Hamilton, Vice President | ||
| Benjamin Rockmuller, Vice President | ||
| Dokyoung Lee, Vice President | ||
| Alessio de Longis, Vice President | ||
| Cynthia Lo Bessette, Secretary and Chief Legal Officer | ||
| Jennifer Sexton, Vice President and Chief Business Officer | ||
| Mary Ann Picciotto, Chief Compliance Officer and Chief Anti-Money Laundering Officer | ||
| Brian S. Petersen, Treasurer and Principal Financial & Accounting Officer | ||
| Manager | OFI Global Asset Management, Inc. | |
| Sub-Adviser | OppenheimerFunds, Inc. | |
| Distributor | OppenheimerFunds Distributor, Inc. | |
| Transfer and | OFI Global Asset Management, Inc. | |
| Shareholder | ||
| Servicing Agent | ||
| Sub-Transfer Agent | Shareholder Services, Inc. | |
| DBA OppenheimerFunds Services | ||
| Independent | KPMG LLP | |
| Registered | ||
| Public | ||
| Accounting | ||
| Firm | ||
| Legal Counsel | Ropes & Gray LLP | |
| Before investing in any of the Oppenheimer funds, investors should carefully consider a fund’s investment objectives, risks, charges and expenses. Fund prospectuses and summary prospectuses contain this and other information about the funds, and may be obtained by asking your financial advisor, or calling us at 1.800.988.8287. Read prospectuses and summary prospectuses carefully before investing. | ||
| The financial statements included herein have been taken from the records of the Fund without examination of those records by the independent registered public accounting firm. | ||
| © 2016 OppenheimerFunds, Inc. All rights reserved. Oppenheimer funds are distributed by OppenheimerFunds Distributor, Inc. | ||

|
|
||||
|
June 30, 2016 |
||||
|
Oppenheimer |
||||
| International Growth Fund/VA |
Semiannual Report | |||
| A Series of Oppenheimer Variable Account Funds
|
||||
|
SEMIANNUAL REPORT |
||||
|
Listing of Top Holdings |
||||
|
Fund Performance Discussion |
||||
|
Financial Statements |

PORTFOLIO MANAGERS: George R. Evans, CFA, and Robert B. Dunphy, CFA
AVERAGE ANNUAL TOTAL RETURNS FOR THE PERIODS ENDED 6/30/16
| Inception Date |
6-Months | 1-Year | 5-Year | 10-Year | ||||||||||||||||
|
Non-Service Shares |
5/13/92 | -2.59% | -5.59% | 4.34% | 5.17% | |||||||||||||||
|
Service Shares |
3/19/01 | -2.72 | -6.00 | 4.14 | 4.88 | |||||||||||||||
|
MSCI AC World ex-U.S. Index |
-1.02 | -10.24 | 0.10 | 1.87 | ||||||||||||||||
Performance data quoted represents past performance, which does not guarantee future results. The investment return and principal value of an investment in the Fund will fluctuate so that an investor’s shares, when redeemed, may be worth more or less than their original cost. Current performance may be lower or higher than the performance quoted. For performance data current to the most recent month end, call us at 1.800.988.8287. The Fund’s total returns should not be expected to be the same as the returns of other funds, whether or not both funds have the same portfolio managers and/or similar names. The Fund’s total returns include changes in share price and reinvested distributions but do not include the charges associated with the separate account products that offer this Fund. Such performance would have been lower if such charges were taken into account.
The Fund’s performance is compared to the performance of the MSCI AC World ex-U.S. Index. The MSCI AC World ex-U.S. Index is designed to measure the equity market performance of developed and emerging markets and excludes the U.S. The Index is unmanaged and cannot be purchased directly by investors. While index comparisons may be useful to provide a benchmark for the Fund’s performance, it must be noted that the Fund’s investments are not limited to the investments comprising the Index. Index performance includes reinvestment of income, but does not reflect transaction costs, fees, expenses or taxes. Index performance is shown for illustrative purposes only as a benchmark for the Fund’s performance, and does not predict or depict performance of the Fund. The Fund’s performance reflects the effects of the Fund’s business and operating expenses.
TOP HOLDINGS AND ALLOCATIONS
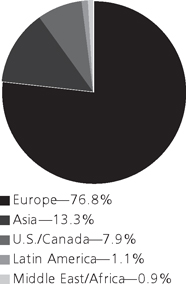
2 OPPENHEIMER INTERNATIONAL GROWTH FUND/VA
Fund Performance Discussion
In a volatile market environment, the Fund’s Non-Service shares generated a cumulative total return of -2.59%. On a relative basis, the Fund underperformed the MSCI AC World ex-U.S. Index (the “Index”), which returned -1.02%. The Fund’s underperformance relative to the Index stemmed largely from an overweight position and stock selection in the consumer discretionary sector and an underweight position in the energy sector. Stock selection within the materials, information technology and telecommunication services sectors detracted from performance to a lesser degree. The Fund outperformed the Index most in the financials sector due to an underweight position. We are structurally and perennially underweight in the sector due to our bias against the business characteristics inherent in most financial companies. Financials stock prices reacted particularly negatively to the United Kingdom’s (“UK”) decision to exit the European Union (“EU”), commonly referred to as Brexit. The Fund also outperformed the Index in industrials as a result of stronger relative stock selection.
As we have often said before, volatility is our friend. We understand that it is uncomfortable for investors so we seek to dampen it in the Fund by investing in a large number of companies in relatively equal amounts. But down markets give us the opportunity to buy stocks at prices that we could not get when sentiment is optimistic. As the market has pulled back, we have bought more shares in companies we already own and taken the opportunity to acquire some new ones that we have coveted for some time. In addition, as long term, bottom up, micro-economic—as opposed to macroeconomic—stock pickers, we did not make changes to our portfolio in anticipation of any particular Brexit vote outcomes.
MARKET OVERVIEW
The first half of 2016 was a volatile time for global equity markets. China’s slowing economy, falling crude oil prices, and the aggressive interest rate hike path indicated by the Federal Reserve (the “Fed”) in its December 2015 communication, contributed to a tumultuous environment. March saw a temporary relief rally as communication from the Fed turned more accommodative in light of this weak start to the year. Oil prices and commodities started to pick up, but continued to experience volatility through the close of the reporting period. However, unanswered questions, including how quickly the Fed would raise interest rates and whether Britain would decide to exit the EU on its June 23 vote, made for an uncertain period. The UK surprised the markets by ultimately deciding to exit the EU. As a result, markets dropped sharply and remained volatile through the reporting period’s end. See the Strategy & Outlook section of this report for more information on the Brexit and our views/outlook.
TOP INDIVIDUAL CONTRIBUTORS
Top contributors to the Fund’s performance this period included Nippon Telegraph & Telephone Corporation, Dollarama, Inc. and CIMIC Group Ltd. Nippon Telegraph & Telephone Corporation is the incumbent telecommunications service company in Japan. It provides voice, data and video streaming services over both fixed and mobile networks. In addition, it is one of the largest providers of data warehouse services in the world. We have owned the company for nearly two years as part of our Data Deluge investment theme. The company continues to execute well on its development plans and the stock has continued to react favorably. Dollarama is the largest dollar store chain in Canada with more than 1,000 locations, with plans to expand well beyond that over the next several years. The stock price rose over the first half of the reporting period after the company announced fiscal fourth quarter sales rose 32% year over year, and same store sales rose 7.9% year over year. The company increased both its dividend and stock buyback program. Given the weakness of the Canadian economy, we believe consumers will remain highly value conscious. We believe Dollarama is well positioned for this. CIMIC Group is an Australian construction and engineering firm with considerable exposure to mining and infrastructure spending in Asia. The company has been working through a considerable restructuring in an effort to adapt to a far less robust environment both for mining and Asian infrastructure spending. The company released a quarterly report that showed some promise that these efforts are bearing fruit.
TOP INDIVIDUAL DETRACTORS
Detractors from performance this reporting period included William Hill plc, Essentra plc and Domino’s Pizza Group plc. William Hill is a London-based bookmaker. Recent trends have been cyclically soft, especially for its online efforts, in addition to periodic regulatory noise, which affects the industry. We have been investors in the company for more than a dozen years and the returns have been good, despite recent weakness. We believe it has the potential to continue its long-term results. Essentra is an international supplier of specialty plastic packaging for health and personal care products, of fiber filters, and of customized protective components for use with industrial equipment. It also has a distribution business. During the reporting period, the company guided revenue and earnings expectations lower after losing a large filter customer. The stock price dropped as a result. In our opinion, the lower near-term revenue growth is fully reflected in the share price. We are positive on the longer-term outlook for the company and on its ability to trim expenses in the near term to maintain profitability at acceptable levels. Domino’s Pizza Group is the master franchiser for Domino’s Pizza stores in the UK, Ireland, Germany and Switzerland.
3 OPPENHEIMER INTERNATIONAL GROWTH FUND/VA
During the reporting period, the group acquired a significant stake in the Icelandic, Norwegian and Swedish franchises, with intent to become a majority owner. The company also announced a three for one stock split. After reaching new highs, the stock sold off in the wake of the Brexit vote, which acted as a catalyst for profit-taking. We remain owners.
STRATEGY & OUTLOOK
As expected, global markets had a negative reaction to the Brexit. The British exit from the EU may require companies to make adjustments in their operations, though the impact and timing will not be clear for some time. Furthermore, each company within each industry will not be affected in exactly the same way. Multi-national businesses always confront a wide variety of currency, regulatory, and trade restrictions. So, while the impact of Brexit is not yet clear, the issues it raises for companies are not. They deal with them as a routine part of managing global customer relationships and supply chains.
It has been our experience that exogenous shocks often provide opportunity. As Warren Buffett once noted, in the short run markets are a voting machine, and in the long run they are a weighing machine. Ultimately, the strength and durability of the economics of a business will drive the trajectory of its share price. This is unchanged by Brexit.
We want to remind investors that we are emphatically and insistently micro-economists. While we have opinions on macro-economic and political events, we do not base our investment decisions on them. Instead, we seek high-quality companies that are able to monetize long-term structural growth opportunities due to their meaningful and durable competitive advantages. We buy them when they are offered in the market at prices that we believe will enable us to realize a return on our capital above our hurdle rate. This is the discipline we will continue to follow.
The Fund’s investment strategy and focus can change over time. The mention of specific fund holdings does not constitute a recommendation by OppenheimerFunds, Inc. or its affiliates.
Shares of Oppenheimer funds are not deposits or obligations of any bank, are not guaranteed by any bank, are not insured by the FDIC or any other agency, and involve investment risks, including the possible loss of the principal amount invested.
4 OPPENHEIMER INTERNATIONAL GROWTH FUND/VA
Fund Expenses
Fund Expenses. As a shareholder of the Fund, you incur two types of costs: (1) transaction costs and (2) ongoing costs, including management fees; distribution and service fees; and other Fund expenses. These examples are intended to help you understand your ongoing costs (in dollars) of investing in the Fund and to compare these costs with the ongoing costs of investing in other mutual funds.
The examples are based on an investment of $1,000.00 invested at the beginning of the period and held for the entire 6-month period ended June 30, 2016.
Actual Expenses. The first section of the table provides information about actual account values and actual expenses. You may use the information in this section for the class of shares you hold, together with the amount you invested, to estimate the expense that you paid over the period. Simply divide your account value by $1,000.00 (for example, an $8,600.00 account value divided by $1,000.00 = 8.60), then multiply the result by the number in the first section under the heading entitled “Expenses Paid During 6 Months Ended June 30, 2016” to estimate the expenses you paid on your account during this period.
Hypothetical Example for Comparison Purposes.
The second section of the table provides information about hypothetical account values and hypothetical expenses based on the Fund’s actual expense ratio for each class of shares, and an assumed rate of return of 5% per year for each class before expenses, which is not the actual return. The hypothetical account values and expenses may not be used to estimate the actual ending account balance or expenses you paid for the period. You may use this information to compare the ongoing costs of investing in the Fund and other funds. To do so, compare this 5% hypothetical example for the class of shares you hold with the 5% hypothetical examples that appear in the shareholder reports of the other funds.
Please note that the expenses shown in the table are meant to highlight your ongoing costs only and do not reflect any charges associated with the separate accounts that offer this Fund. Therefore, the “hypothetical” lines of the table are useful in comparing ongoing costs only, and will not help you determine the relative total costs of owning different funds. In addition, if these separate account charges were included your costs would have been higher.
| Actual | Beginning Account Value January 1, 2016 |
Ending Account Value June 30, 2016 |
Expenses Paid During 6 Months Ended June 30, 2016 |
|||||||||
| Non-Service shares |
$ | 1,000.00 | $ | 974.10 | $ | 4.92 | ||||||
| Service shares |
1,000.00 | 972.80 | 6.15 | |||||||||
| Hypothetical | ||||||||||||
| (5% return before expenses) | ||||||||||||
| Non-Service shares |
1,000.00 | 1,019.89 | 5.03 | |||||||||
| Service shares |
1,000.00 | 1,018.65 | 6.29 | |||||||||
Expenses are equal to the Fund’s annualized expense ratio for that class, multiplied by the average account value over the period, multiplied by 182/366 (to reflect the one-half year period). Those annualized expense ratios, excluding indirect expenses from affiliated funds, based on the 6-month period ended June 30, 2016 are as follows:
| Class | Expense Ratios | |||||||
| Non-Service shares |
1.00% | |||||||
| Service shares |
1.25 | |||||||
The expense ratios reflect voluntary and/or contractual waivers and/or reimbursements of expenses by the Fund’s Manager. Some of these undertakings may be modified or terminated at any time, as indicated in the Fund’s prospectus. The “Financial Highlights” tables in the Fund’s financial statements, included in this report, also show the gross expense ratios, without such waivers or reimbursements and reduction to custodian expenses, if applicable.
5 OPPENHEIMER INTERNATIONAL GROWTH FUND/VA
STATEMENT OF INVESTMENTS June 30, 2016 Unaudited
6 OPPENHEIMER INTERNATIONAL GROWTH FUND/VA
Footnotes to Statement of Investments
1. Non-income producing security.
2. Rate shown is the 7-day yield at period end.
3. Is or was an affiliate, as defined in the Investment Company Act of 1940, as amended, at or during the reporting period, by virtue of the Fund owning at least 5% of the voting securities of the issuer or as a result of the Fund and the issuer having the same investment adviser. Transactions during the reporting period in which the issuer was an affiliate are as follows:
| Shares December 31, 2015 |
Gross Additions |
Gross Reductions |
Shares June 30, 2016 |
|||||||||||||
|
|
||||||||||||||||
| Oppenheimer Institutional Money Market Fund, Cl. E |
4,009,537 | 34,479,814 | 34,494,449 | 3,994,902 | ||||||||||||
|
Value |
Income | |||||||||||||||
|
|
||||||||||||||||
| Oppenheimer Institutional Money Market Fund, Cl. E | $ | 3,994,902 | $ | 13,933 | ||||||||||||
| Distribution of investments representing geographic holdings, as a percentage of total investments at value, is as follows: | ||||||||||||
| Geographic Holdings | Value | Percent | ||||||||||
|
|
||||||||||||
| United Kingdom |
$ | 108,657,927 | 22.9% | |||||||||
| France |
67,225,883 | 14.2 | ||||||||||
| Switzerland |
57,187,468 | 12.0 | ||||||||||
| Germany |
36,316,984 | 7.6 | ||||||||||
| Japan |
30,300,326 | 6.4 | ||||||||||
| Netherlands |
28,806,829 | 6.1 | ||||||||||
7 OPPENHEIMER INTERNATIONAL GROWTH FUND/VA
STATEMENT OF INVESTMENTS Unaudited / Continued
| Geographic Holdings (Continued) | Value | Percent | ||||||||||
|
|
||||||||||||
| Canada |
$ | 27,384,695 | 5.8% | |||||||||
| Spain |
21,831,163 | 4.6 | ||||||||||
| Denmark |
19,857,098 | 4.2 | ||||||||||
| Australia |
16,957,096 | 3.6 | ||||||||||
| Sweden |
12,703,200 | 2.7 | ||||||||||
| United States |
10,064,506 | 2.1 | ||||||||||
| India |
8,614,317 | 1.8 | ||||||||||
| Ireland |
6,370,585 | 1.3 | ||||||||||
| Finland |
5,396,378 | 1.1 | ||||||||||
| Thailand |
5,377,939 | 1.1 | ||||||||||
| South Africa |
4,306,929 | 0.9 | ||||||||||
| Mexico |
3,312,809 | 0.7 | ||||||||||
| China |
2,321,301 | 0.5 | ||||||||||
| Brazil |
1,728,732 | 0.4 | ||||||||||
|
|
|
|||||||||||
| Total |
$ | 474,722,165 | 100.0% | |||||||||
|
|
|
|||||||||||
See accompanying Notes to Financial Statements.
8 OPPENHEIMER INTERNATIONAL GROWTH FUND/VA
STATEMENT OF ASSETS AND LIABILITIES June 30, 2016 Unaudited
|
|
||||
| Assets |
||||
| Investments, at value—see accompanying statement of investments: | ||||
| Unaffiliated companies (cost $351,604,844) | $ | 470,727,263 | ||
| Affiliated companies (cost $3,994,902) | 3,994,902 | |||
|
|
|
|||
| 474,722,165 | ||||
|
|
||||
| Cash | 499,613 | |||
|
|
||||
| Cash—foreign currencies (cost $3,300) | 4 | |||
|
|
||||
| Receivables and other assets: | ||||
| Dividends | 2,393,371 | |||
| Shares of beneficial interest sold | 632,722 | |||
| Investments sold | 80,583 | |||
| Other | 28,411 | |||
|
|
|
|||
| Total assets |
|
478,356,869
|
| |
|
|
||||
| Liabilities |
||||
| Payables and other liabilities: | ||||
| Shares of beneficial interest redeemed | 338,941 | |||
| Foreign capital gains tax | 220,202 | |||
| Investments purchased | 140,071 | |||
| Distribution and service plan fees | 36,415 | |||
| Trustees’ compensation | 20,425 | |||
| Shareholder communications | 5,959 | |||
| Other | 24,224 | |||
|
|
|
|||
| Total liabilities
|
|
786,237
|
| |
|
|
||||
| Net Assets | $ | 477,570,632 | ||
|
|
|
|||
|
|
||||
| Composition of Net Assets |
||||
| Par value of shares of beneficial interest | $ | 227,226 | ||
|
|
||||
| Additional paid-in capital | 360,118,047 | |||
|
|
||||
| Accumulated net investment income | 4,644,415 | |||
|
|
||||
| Accumulated net realized loss on investments and foreign currency transactions | (6,227,355) | |||
|
|
||||
| Net unrealized appreciation on investments and translation of assets and liabilities denominated in foreign currencies | 118,808,299 | |||
|
|
|
|||
| Net Assets | $ | 477,570,632 | ||
|
|
|
|||
|
|
||||
| Net Asset Value Per Share |
||||
| Non-Service Shares: | ||||
| Net asset value, redemption price per share and offering price per share (based on net assets of $303,148,731 and 146,439,789 shares of beneficial interest outstanding) | $2.07 | |||
|
|
||||
| Service Shares: | ||||
| Net asset value, redemption price per share and offering price per share (based on net assets of $174,421,901 and 80,785,754 shares of beneficial interest outstanding) | $2.16 | |||
See accompanying Notes to Financial Statements.
9 OPPENHEIMER INTERNATIONAL GROWTH FUND/VA
STATEMENT OF OPERATIONS For the Six Months Ended June 30, 2016 Unaudited
|
|
||||
| Investment Income |
||||
| Dividends: | ||||
| Unaffiliated companies (net of foreign withholding taxes of $616,052) | $ | 7,592,170 | ||
| Affiliated companies | 13,933 | |||
|
|
||||
| Interest | 35 | |||
|
|
|
|||
| Total investment income
|
7,606,138 | |||
|
|
||||
| Expenses |
||||
| Management fees | 2,267,798 | |||
| Distribution and service plan fees —Service shares | 212,602 | |||
|
|
||||
| Transfer and shareholder servicing agent fees: | ||||
| Non-Service shares | 152,976 | |||
| Service shares | 85,195 | |||
|
|
||||
| Shareholder communications: | ||||
| Non-Service shares | 4,924 | |||
| Service shares | 2,754 | |||
|
|
||||
| Custodian fees and expenses | 24,101 | |||
|
|
||||
| Trustees’ compensation | 11,300 | |||
|
|
||||
| Borrowing fees | 4,252 | |||
|
|
||||
| Other | 44,371 | |||
|
|
|
|||
| Total expenses | 2,810,273 | |||
| Less reduction to custodian expenses | (163) | |||
| Less waivers and reimbursements of expenses | (211,254) | |||
|
|
|
|||
| Net expenses
|
2,598,856 | |||
|
|
||||
| Net Investment Income
|
|
5,007,282
|
| |
|
|
||||
| Realized and Unrealized Gain (Loss) |
||||
| Net realized gain on: | ||||
| Investments from unaffiliated companies (net of foreign capital gains tax of $6,698) | 718,512 | |||
| Foreign currency transactions | 5,340 | |||
|
|
|
|||
| Net realized gain | 723,852 | |||
|
|
||||
| Net change in unrealized appreciation/depreciation on: | ||||
| Investments (net of foreign capital gains tax of $150,566) | (20,015,212) | |||
| Translation of assets and liabilities denominated in foreign currencies | 1,877,831 | |||
|
|
|
|||
| Net change in unrealized appreciation/depreciation
|
|
(18,137,381)
|
| |
|
|
||||
| Net Decrease in Net Assets Resulting from Operations | $ | (12,406,247) | ||
|
|
|
|||
See accompanying Notes to Financial Statements.
10 OPPENHEIMER INTERNATIONAL GROWTH FUND/VA
STATEMENTS OF CHANGES IN NET ASSETS
| Six Months Ended June 30, 2016 (Unaudited) |
Year Ended December 31, 2015 |
|||||||
|
|
||||||||
| Operations |
||||||||
| Net investment income | $ | 5,007,282 | $ | 5,013,190 | ||||
|
|
||||||||
| Net realized gain | 723,852 | 12,349,329 | ||||||
|
|
||||||||
| Net change in unrealized appreciation/depreciation | (18,137,381) | (2,159,966) | ||||||
|
|
|
|||||||
| Net increase (decrease) in net assets resulting from operations
|
(12,406,247) | 15,202,553 | ||||||
|
|
||||||||
| Dividends and/or Distributions to Shareholders |
||||||||
| Dividends from net investment income: | ||||||||
| Non-Service shares | (3,398,645) | (4,005,137) | ||||||
| Service shares | (1,459,515) | (1,505,303) | ||||||
|
|
|
|||||||
|
|
(4,858,160)
|
|
(5,510,440) | |||||
|
|
||||||||
| Distributions from net realized gain: | ||||||||
| Non-Service shares | (7,229,895) | (24,445,588) | ||||||
| Service shares | (4,021,530) | (11,368,323) | ||||||
|
|
|
|||||||
|
|
(11,251,425)
|
|
(35,813,911) | |||||
|
|
||||||||
| Beneficial Interest Transactions |
||||||||
| Net increase (decrease) in net assets resulting from beneficial interest transactions: | ||||||||
| Non-Service shares | 4,171,901 | (24,199,401) | ||||||
| Service shares | 15,075,211 | 32,889,329 | ||||||
|
|
|
|||||||
|
|
19,247,112
|
|
8,689,928 | |||||
|
|
||||||||
| Net Assets |
||||||||
| Total decrease | (9,268,720) | (17,431,870) | ||||||
|
|
||||||||
| Beginning of period | 486,839,352 | 504,271,222 | ||||||
|
|
|
|||||||
| End of period (including accumulated net investment income of $4,644,415 and $4,495,293, respectively) | $ | 477,570,632 | $ | 486,839,352 | ||||
|
|
|
|||||||
See accompanying Notes to Financial Statements.
11 OPPENHEIMER INTERNATIONAL GROWTH FUND/VA
FINANCIAL HIGHLIGHTS
| Non-Service Shares
|
Six Months Ended June 30, 2016 (Unaudited)
|
Year Ended
|
Year Ended
|
Year Ended
|
Year Ended
|
Year Ended
|
||||||||||||||||||
|
|
||||||||||||||||||||||||
| Per Share Operating Data |
||||||||||||||||||||||||
| Net asset value, beginning of period | $ | 2.20 | $ | 2.31 | $ | 2.57 | $ | 2.07 | $ | 1.72 | $ | 1.87 | ||||||||||||
|
|
||||||||||||||||||||||||
| Income (loss) from investment operations: | ||||||||||||||||||||||||
| Net investment income2 | 0.02 | 0.03 | 0.03 | 0.03 | 0.03 | 0.02 | ||||||||||||||||||
| Net realized and unrealized gain (loss) | (0.08) | 0.06 | (0.21) | 0.50 | 0.35 | (0.15) | ||||||||||||||||||
|
|
|
|||||||||||||||||||||||
| Total from investment operations | (0.06) | 0.09 | (0.18) | 0.53 | 0.38 | (0.13) | ||||||||||||||||||
|
|
||||||||||||||||||||||||
| Dividends and/or distributions to shareholders: | ||||||||||||||||||||||||
| Dividends from net investment income | (0.02) | (0.03) | (0.03) | (0.03) | (0.03) | (0.02) | ||||||||||||||||||
| Distributions from net realized gain | (0.05) | (0.17) | (0.05) | 0.00 | 0.00 | 0.00 | ||||||||||||||||||
|
|
|
|||||||||||||||||||||||
| Total dividends and/or distributions to shareholders | (0.07) | (0.20) | (0.08) | (0.03) | (0.03) | (0.02) | ||||||||||||||||||
|
|
||||||||||||||||||||||||
| Net asset value, end of period | $ | 2.07 | $ | 2.20 | $ | 2.31 | $ | 2.57 | $ | 2.07 | $ | 1.72 | ||||||||||||
|
|
|
|||||||||||||||||||||||
|
|
||||||||||||||||||||||||
| Total Return, at Net Asset Value3 |
(2.59)% | 3.43% | (7.22)% | 25.87% | 22.22% | (7.16)% | ||||||||||||||||||
|
|
||||||||||||||||||||||||
| Ratios/Supplemental Data |
||||||||||||||||||||||||
| Net assets, end of period (in thousands) | $ | 303,149 | $ | 317,547 | $ | 358,756 | $ | 458,038 | $ | 348,449 | $ | 364,221 | ||||||||||||
|
|
||||||||||||||||||||||||
| Average net assets (in thousands) | $ | 307,172 | $ | 343,347 | $ | 400,556 | $ | 404,859 | $ | 332,018 | $ | 406,974 | ||||||||||||
|
|
||||||||||||||||||||||||
| Ratios to average net assets:4 | ||||||||||||||||||||||||
| Net investment income | 2.18% | 1.08% | 1.13% | 1.24% | 1.68% | 1.21% | ||||||||||||||||||
| Expenses excluding interest and fees from borrowings | 1.09% | 1.08% | 1.07% | 1.09% | 1.13% | 1.09% | ||||||||||||||||||
| Interest and fees from borrowings | 0.00%5 | 0.00%5 | 0.00% | 0.00% | 0.00% | 0.00% | ||||||||||||||||||
|
|
|
|||||||||||||||||||||||
| Total expenses6 | 1.09% | 1.08% | 1.07% | 1.09% | 1.13% | 1.09% | ||||||||||||||||||
| Expenses after payments, waivers and/or reimbursements and reduction to custodian expenses | 1.00% | 1.00% | 1.00% | 1.00% | 1.00% | 1.00% | ||||||||||||||||||
|
|
||||||||||||||||||||||||
| Portfolio turnover rate | 6% | 24% | 41% | 32% | 22% | 25% | ||||||||||||||||||
1. December 30, 2011 represents the last business day of the Fund’s reporting period. See Note 2 of the accompanying Notes.
2. Per share amounts calculated based on the average shares outstanding during the period.
3. Assumes an initial investment on the business day before the first day of the fiscal period, with all dividends and distributions reinvested in additional shares on the reinvestment date, and redemption at the net asset value calculated on the last business day of the fiscal period. Total returns are not annualized for periods less than one full year. Total return information does not reflect expenses that apply at the separate account level or to related insurance products. Inclusion of these charges would reduce the total return figures for all periods shown. Returns do not reflect the deduction of taxes that a shareholder would pay on fund distributions or the redemption of fund shares.
4. Annualized for periods less than one full year.
5. Less than 0.005%.
6. Total expenses including indirect expenses from affiliated fund fees and expenses were as follows:
12 OPPENHEIMER INTERNATIONAL GROWTH FUND/VA
| Service Shares
|
Six Months
|
Year Ended
|
Year Ended
|
Year Ended
|
Year Ended
|
Year Ended
|
||||||||||||||||||
|
|
||||||||||||||||||||||||
| Per Share Operating Data |
||||||||||||||||||||||||
| Net asset value, beginning of period | $ | 2.29 | $ | 2.40 | $ | 2.66 | $ | 2.14 | $ | 1.78 | $ | 1.94 | ||||||||||||
|
|
||||||||||||||||||||||||
| Income (loss) from investment operations: | ||||||||||||||||||||||||
| Net investment income2 | 0.02 | 0.02 | 0.02 | 0.02 | 0.03 | 0.02 | ||||||||||||||||||
| Net realized and unrealized gain (loss) | (0.08) | 0.06 | (0.21) | 0.53 | 0.35 | (0.17) | ||||||||||||||||||
|
|
|
|||||||||||||||||||||||
| Total from investment operations | (0.06) | 0.08 | (0.19) | 0.55 | 0.38 | (0.15) | ||||||||||||||||||
|
|
||||||||||||||||||||||||
| Dividends and/or distributions to shareholders: | ||||||||||||||||||||||||
| Dividends from net investment income | (0.02) | (0.02) | (0.02) | (0.03) | (0.02) | (0.01) | ||||||||||||||||||
| Distributions from net realized gain | (0.05) | (0.17) | (0.05) | 0.00 | 0.00 | 0.00 | ||||||||||||||||||
|
|
|
|||||||||||||||||||||||
| Total dividends and/or distributions to shareholders | (0.07) | (0.19) | (0.07) | (0.03) | (0.02) | (0.01) | ||||||||||||||||||
|
|
||||||||||||||||||||||||
| Net asset value, end of period | $ | 2.16 | $ | 2.29 | $ | 2.40 | $ | 2.66 | $ | 2.14 | $ | 1.78 | ||||||||||||
|
|
|
|||||||||||||||||||||||
|
|
||||||||||||||||||||||||
| Total Return, at Net Asset Value3 |
(2.72)% | 3.11% | (7.15)% | 25.71% | 21.68% | (7.61)% | ||||||||||||||||||
|
|
||||||||||||||||||||||||
| Ratios/Supplemental Data |
||||||||||||||||||||||||
| Net assets, end of period (in thousands) | $ | 174,422 | $ | 169,292 | $ | 145,515 | $ | 118,060 | $ | 68,997 | $ | 57,276 | ||||||||||||
|
|
||||||||||||||||||||||||
| Average net assets (in thousands) | $ | 171,069 | $ | 165,226 | $ | 128,694 | $ | 88,647 | $ | 63,118 | $ | 62,359 | ||||||||||||
|
|
||||||||||||||||||||||||
| Ratios to average net assets:4 | ||||||||||||||||||||||||
| Net investment income | 1.97% | 0.79% | 0.85% | 0.89% | 1.43% | 0.96% | ||||||||||||||||||
| Expenses excluding interest and fees from borrowings | 1.34% | 1.33% | 1.32% | 1.34% | 1.38% | 1.34% | ||||||||||||||||||
| Interest and fees from borrowings | 0.00%5 | 0.00%5 | 0.00% | 0.00% | 0.00% | 0.00% | ||||||||||||||||||
|
|
|
|||||||||||||||||||||||
| Total expenses6 | 1.34% | 1.33% | 1.32% | 1.34% | 1.38% | 1.34% | ||||||||||||||||||
| Expenses after payments, waivers and/or reimbursements and reduction to custodian expenses | 1.25% | 1.25% | 1.25% | 1.25% | 1.25% | 1.25% | ||||||||||||||||||
|
|
||||||||||||||||||||||||
| Portfolio turnover rate | 6% | 24% | 41% | 32% | 22% | 25% | ||||||||||||||||||
1. December 30, 2011 represents the last business day of the Fund’s reporting period. See Note 2 of the accompanying Notes.
2. Per share amounts calculated based on the average shares outstanding during the period.
3. Assumes an initial investment on the business day before the first day of the fiscal period, with all dividends and distributions reinvested in additional shares on the reinvestment date, and redemption at the net asset value calculated on the last business day of the fiscal period. Total returns are not annualized for periods less than one full year. Total return information does not reflect expenses that apply at the separate account level or to related insurance products. Inclusion of these charges would reduce the total return figures for all periods shown. Returns do not reflect the deduction of taxes that a shareholder would pay on fund distributions or the redemption of fund shares.
4. Annualized for periods less than one full year.
5. Less than 0.005%.
6. Total expenses including indirect expenses from affiliated fund fees and expenses were as follows:
13 OPPENHEIMER INTERNATIONAL GROWTH FUND/VA
NOTES TO FINANCIAL STATEMENTS June 30, 2016 Unaudited
1. Organization
Oppenheimer International Growth Fund/VA (the “Fund”), is a separate series of Oppenheimer Variable Account Funds, which is registered under the Investment Company Act of 1940 (“1940 Act”), as amended, as a diversified open-end management investment company. The Fund’s investment objective is to seek capital appreciation. The Fund’s investment adviser is OFI Global Asset Management, Inc. (“OFI Global” or the “Manager”), a wholly-owned subsidiary of OppenheimerFunds, Inc. (“OFI” or the “Sub-Adviser”). The Manager has entered into a sub-advisory agreement with OFI. Shares of the Fund are sold only to separate accounts of life insurance companies.
The Fund offers two classes of shares. Both classes are sold at their offering price, which is the net asset value per share, to separate investment accounts of participating insurance companies as an underlying investment for variable life insurance policies, variable annuity contracts or other investment products. The class of shares designated as Service shares is subject to a distribution and service plan. Both classes of shares have identical rights and voting privileges with respect to the Fund in general and exclusive voting rights on matters that affect that class alone. Earnings, net assets and net asset value per share may differ due to each class having its own expenses, such as transfer and shareholder servicing agent fees and shareholder communications, directly attributable to that class.
The following is a summary of significant accounting policies followed in the Fund’s preparation of financial statements in accordance with accounting principles generally accepted in the United States (“U.S. GAAP”).
2. Significant Accounting Policies
Security Valuation. All investments in securities are recorded at their estimated fair value, as described in Note 3.
Reporting Period End Date. The last day of the Fund’s reporting period is the last day the New York Stock Exchange was open for trading during the period. The Fund’s financial statements have been presented through that date to maintain consistency with the Fund’s net asset value calculations used for shareholder transactions.
Foreign Currency Translation. The Fund’s accounting records are maintained in U.S. dollars. The values of securities denominated in foreign currencies and amounts related to the purchase and sale of foreign securities and foreign investment income are translated into U.S. dollars as of the close of the New York Stock Exchange (the “Exchange”), normally 4:00 P.M. Eastern time, on each day the Exchange is open for trading. Foreign exchange rates may be valued primarily using a reliable bank, dealer or service authorized by the Board of Trustees.
Reported net realized gains and losses from foreign currency transactions arise from sales of portfolio securities, sales and maturities of short-term securities, sales of foreign currencies, exchange rate fluctuations between the trade and settlement dates on securities transactions, and the difference between the amounts of dividends, interest, and foreign withholding taxes recorded on the Fund’s books and the U.S. dollar equivalent of the amounts actually received or paid. Net unrealized appreciation and depreciation on the translation of assets and liabilities denominated in foreign currencies arise from changes in the values of assets and liabilities, including investments in securities at fiscal period end, resulting from changes in exchange rates.
The effect of changes in foreign currency exchange rates on investments is separately identified from the fluctuations arising from changes in market values of securities held and reported with all other foreign currency gains and losses in the Fund’s Statement of Operations.
Allocation of Income, Expenses, Gains and Losses. Income, expenses (other than those attributable to a specific class), gains and losses are allocated on a daily basis to each class of shares based upon the relative proportion of net assets represented by such class. Operating expenses directly attributable to a specific class are charged against the operations of that class.
Dividends and Distributions to Shareholders. Dividends and distributions to shareholders, which are determined in accordance with income tax regulations and may differ from U.S. GAAP, are recorded on the ex-dividend date. Income and capital gain distributions, if any, are declared and paid annually or at other times as deemed necessary by the Manager.
The tax character of distributions is determined as of the Fund’s fiscal year end. Therefore, a portion of the Fund’s distributions made to shareholders prior to the Fund’s fiscal year end may ultimately be categorized as a tax return of capital.
Investment Income. Dividend income is recorded on the ex-dividend date or upon ex-dividend notification in the case of certain foreign dividends where the ex-dividend date may have passed. Non-cash dividends included in dividend income, if any, are recorded at the fair market value of the securities received. Interest income is recognized on an accrual basis. Discount and premium, which are included in interest income on the Statement of Operations, are amortized or accreted daily.
Custodian Fees. “Custodian fees and expenses” in the Statement of Operations may include interest expense incurred by the Fund on any cash overdrafts of its custodian account during the period. Such cash overdrafts may result from the effects of failed trades in portfolio securities and from cash outflows resulting from unanticipated shareholder redemption activity. The Fund pays interest to its custodian on such cash overdrafts, to the extent they are not offset by positive cash balances maintained by the Fund, at a rate equal to the Federal Funds Rate plus 0.50%. The “Reduction to custodian expenses” line item, if applicable, represents earnings on cash balances maintained by the Fund during the period. Such interest expense and other custodian fees may be paid with these earnings.
Security Transactions. Security transactions are recorded on the trade date. Realized gains and losses on securities sold are determined on the basis of identified cost.
14 OPPENHEIMER INTERNATIONAL GROWTH FUND/VA
2. Significant Accounting Policies (Continued)
Indemnifications. The Fund’s organizational documents provide current and former Trustees and officers with a limited indemnification against liabilities arising in connection with the performance of their duties to the Fund. In the normal course of business, the Fund may also enter into contracts that provide general indemnifications. The Fund’s maximum exposure under these arrangements is unknown as this would be dependent on future claims that may be made against the Fund. The risk of material loss from such claims is considered remote.
Federal Taxes. The Fund intends to comply with provisions of the Internal Revenue Code applicable to regulated investment companies and to distribute substantially all of its investment company taxable income to shareholders. Therefore, no federal income or excise tax provision is required. The Fund files income tax returns in U.S. federal and applicable state jurisdictions. The statute of limitations on the Fund’s tax return filings generally remains open for the three preceding fiscal reporting period ends. The Fund has analyzed its tax positions for the fiscal year ended December 31, 2015, including open tax years, and does not believe there are any uncertain tax positions requiring recognition in the Fund’s financial statements.
During the fiscal year ended December 31, 2015, the Fund did not utilize any capital loss carryforward to offset capital gains realized in that fiscal year. Capital loss carryforwards with no expiration, if any, must be utilized prior to those with expiration dates. Capital losses with no expiration will be carried forward to future years if not offset by gains.
At period end, it is estimated that the Fund will not have any capital loss carryforwards. The estimated capital loss carryforward represents the carryforward as of the end of the last fiscal year, increased or decreased by capital losses or gains realized in the first six months of the current fiscal year. During the reporting period, it is estimated that the Fund will not utilize any capital loss carryforward to offset realized capital gains.
Net investment income (loss) and net realized gain (loss) may differ for financial statement and tax purposes. The character of dividends and distributions made during the fiscal year from net investment income or net realized gains are determined in accordance with federal income tax requirements, which may differ from the character of net investment income or net realized gains presented in those financial statements in accordance with U.S. GAAP. Also, due to timing of dividends and distributions, the fiscal year in which amounts are distributed may differ from the fiscal year in which the income or net realized gain was recorded by the Fund.
The aggregate cost of securities and other investments and the composition of unrealized appreciation and depreciation of securities and other investments for federal income tax purposes at period end are noted in the following table. The primary difference between book and tax appreciation or depreciation of securities and other investments, if applicable, is attributable to the tax deferral of losses or tax realization of financial statement unrealized gain or loss.
| Federal tax cost of securities |
$ | 362,640,893 | ||
| Federal tax cost of other investments |
3,300 | |||
|
|
|
|||
| Total federal tax cost |
$ | 362,644,193 | ||
|
|
|
|||
| Gross unrealized appreciation |
$ | 159,883,780 | ||
| Gross unrealized depreciation |
(48,116,630) | |||
|
|
|
|||
| Net unrealized appreciation |
$ | 111,767,150 | ||
|
|
|
Certain foreign countries impose a tax on capital gains which is accrued by the Fund based on unrealized appreciation, if any, on affected securities. The tax is paid when the gain is realized.
Use of Estimates. The preparation of financial statements in conformity with U.S. GAAP requires management to make estimates and assumptions that affect the reported amounts of assets and liabilities and disclosure of contingent assets and liabilities at the date of the financial statements and the reported amounts of increases and decreases in net assets from operations during the reporting period. Actual results could differ from those estimates.
3. Securities Valuation
The Fund calculates the net asset value of its shares as of 4:00 P.M. Eastern time, on each day the New York Stock Exchange (the “Exchange”) is open for trading, except in the case of a scheduled early closing of the Exchange, in which case the Fund will calculate net asset value of the shares as of the scheduled early closing time of the Exchange.
The Fund’s Board has adopted procedures for the valuation of the Fund’s securities and has delegated the day-to-day responsibility for valuation determinations under those procedures to the Manager. The Manager has established a Valuation Committee which is responsible for determining a “fair valuation” for any security for which market quotations are not “readily available.” The Valuation Committee’s fair valuation determinations are subject to review, approval and ratification by the Fund’s Board at its next regularly scheduled meeting covering the calendar quarter in which the fair valuation was determined.
Valuation Methods and Inputs
Securities are valued using unadjusted quoted market prices, when available, as supplied primarily by third party pricing services or dealers.
The following methodologies are used to determine the market value or the fair value of the types of securities described below:
Securities traded on a registered U.S. securities exchange (including exchange-traded derivatives other than futures and futures options) are valued based on the last sale price of the security reported on the principal exchange on which it is traded, prior to the time when the Fund’s assets are valued. In the absence of a sale, the security is valued at the mean between the bid and asked price on the principal exchange or, if not available from the principal exchange, obtained from two dealers. If bid and asked prices are not available from either the exchange or two dealers, the security is valued
15 OPPENHEIMER INTERNATIONAL GROWTH FUND/VA
NOTES TO FINANCIAL STATEMENTS Unaudited / Continued
3. Securities Valuation (Continued)
by using one of the following methodologies (listed in order of priority): (1) a bid from the principal exchange, (2) the mean between the bid and asked price as provided by a single dealer, or (3) a bid from a single dealer. A security of a foreign issuer traded on a foreign exchange, but not listed on a registered U.S. securities exchange, is valued based on the last sale price on the principal exchange on which the security is traded, as identified by the third party pricing service used by the Manager, prior to the time when the Fund’s assets are valued. If the last sale price is unavailable, the security is valued at the most recent official closing price on the principal exchange on which it is traded. If the last sales price or official closing price for a foreign security is not available, the security is valued at the mean between the bid and asked price per the exchange or, if not available from the exchange, obtained from two dealers. If bid and asked prices are not available from either the exchange or two dealers, the security is valued by using one of the following methodologies (listed in order of priority): (1) a bid from the exchange, (2) the mean between the bid and asked price as provided by a single dealer, or (3) a bid from a single dealer.
Shares of a registered investment company that are not traded on an exchange are valued at that investment company’s net asset value per share.
Corporate and government debt securities (of U.S. or foreign issuers) and municipal debt securities, event-linked bonds, loans, mortgage-backed securities, collateralized mortgage obligations, and asset-backed securities are valued at the mean between the “bid” and “asked” prices utilizing evaluated prices obtained from third party pricing services or broker-dealers who may use matrix pricing methods to determine the evaluated prices.
Short-term money market type debt securities with a remaining maturity of sixty days or less are valued at cost adjusted by the amortization of discount or premium to maturity (amortized cost), which approximates market value. Short-term debt securities with a remaining maturity in excess of sixty days are valued at the mean between the “bid” and “asked” prices utilizing evaluated prices obtained from third party pricing services or broker-dealers.
A description of the standard inputs that may generally be considered by the third party pricing vendors in determining their evaluated prices is provided below.
| Security Type | Standard inputs generally considered by third-party pricing vendors | |
| Corporate debt, government debt, municipal, mortgage-backed and asset-backed securities | Reported trade data, broker-dealer price quotations, benchmark yields, issuer spreads on comparable securities, the credit quality, yield, maturity, and other appropriate factors. | |
| Loans | Information obtained from market participants regarding reported trade data and broker-dealer price quotations. | |
| Event-linked bonds | Information obtained from market participants regarding reported trade data and broker-dealer price quotations. |
If a market value or price cannot be determined for a security using the methodologies described above, or if, in the “good faith” opinion of the Manager, the market value or price obtained does not constitute a “readily available market quotation,” or a significant event has occurred that would materially affect the value of the security, the security is fair valued either (i) by a standardized fair valuation methodology applicable to the security type or the significant event as previously approved by the Valuation Committee and the Fund’s Board or (ii) as determined in good faith by the Manager’s Valuation Committee. The Valuation Committee considers all relevant facts that are reasonably available, through either public information or information available to the Manager, when determining the fair value of a security. Fair value determinations by the Manager are subject to review, approval and ratification by the Fund’s Board at its next regularly scheduled meeting covering the calendar quarter in which the fair valuation was determined. Those fair valuation standardized methodologies include, but are not limited to, valuing securities at the last sale price or initially at cost and subsequently adjusting the value based on: changes in company specific fundamentals, changes in an appropriate securities index, or changes in the value of similar securities which may be further adjusted for any discounts related to security-specific resale restrictions. When possible, such methodologies use observable market inputs such as unadjusted quoted prices of similar securities, observable interest rates, currency rates and yield curves. The methodologies used for valuing securities are not necessarily an indication of the risks associated with investing in those securities nor can it be assured that the Fund can obtain the fair value assigned to a security if it were to sell the security.
To assess the continuing appropriateness of security valuations, the Manager, or its third party service provider who is subject to oversight by the Manager, regularly compares prior day prices, prices on comparable securities, and sale prices to the current day prices and challenges those prices exceeding certain tolerance levels with the third party pricing service or broker source. For those securities valued by fair valuations, whether through a standardized fair valuation methodology or a fair valuation determination, the Valuation Committee reviews and affirms the reasonableness of the valuations based on such methodologies and fair valuation determinations on a regular basis after considering all relevant information that is reasonably available.
Classifications
Each investment asset or liability of the Fund is assigned a level at measurement date based on the significance and source of the inputs to its valuation. Various data inputs are used in determining the value of each of the Fund’s investments as of the reporting period end. These data inputs are categorized in the following hierarchy under applicable financial accounting standards:
1) Level 1-unadjusted quoted prices in active markets for identical assets or liabilities (including securities actively traded on a securities exchange)
2) Level 2-inputs other than unadjusted quoted prices that are observable for the asset or liability (such as unadjusted quoted prices for similar assets and market corroborated inputs such as interest rates, prepayment speeds, credit risks, etc.)
3) Level 3-significant unobservable inputs (including the Manager’s own judgments about assumptions that market participants would use in pricing
16 OPPENHEIMER INTERNATIONAL GROWTH FUND/VA
3. Securities Valuation (Continued)
the asset or liability).
The inputs used for valuing securities are not necessarily an indication of the risks associated with investing in those securities.
The Fund classifies each of its investments in those investment companies which are publicly offered as Level 1. Investment companies that are not publicly offered are measured using net asset value as a practical expedient, and are not classified in the fair value hierarchy.
The table below categorizes amounts that are included in the Fund’s Statement of Assets and Liabilities at period end based on valuation input level:
| Level 1— Unadjusted Quoted Prices |
Level 2— Other Significant Observable Inputs |
Level 3— Significant Inputs |
Value | |||||||||||||
|
|
||||||||||||||||
| Assets Table |
||||||||||||||||
| Investments, at Value: |
||||||||||||||||
| Common Stocks |
||||||||||||||||
| Consumer Discretionary |
$ | 22,283,027 | $ | 79,616,216 | $ | — | $ | 101,899,243 | ||||||||
| Consumer Staples |
9,712,651 | 48,301,283 | — | 58,013,934 | ||||||||||||
| Energy |
— | 6,751,198 | — | 6,751,198 | ||||||||||||
| Financials |
2,444,754 | 11,780,560 | — | 14,225,314 | ||||||||||||
| Health Care |
— | 54,664,340 | — | 54,664,340 | ||||||||||||
| Industrials |
— | 98,716,531 | — | 98,716,531 | ||||||||||||
| Information Technology |
— | 78,084,860 | — | 78,084,860 | ||||||||||||
| Materials |
4,769,159 | 23,451,764 | — | 28,220,923 | ||||||||||||
| Telecommunication Services |
— | 30,068,172 | — | 30,068,172 | ||||||||||||
| Preferred Stock |
80,478 | — | — | 80,478 | ||||||||||||
| Rights, Warrants and Certificates |
— | 2,270 | — | 2,270 | ||||||||||||
| Investment Company |
3,994,902 | — | — | 3,994,902 | ||||||||||||
|
|
|
|||||||||||||||
| Total Assets |
$ | 43,284,971 | $ | 431,437,194 | $ | — | $ | 474,722,165 | ||||||||
|
|
|
|||||||||||||||
Forward currency exchange contracts and futures contracts, if any, are reported at their unrealized appreciation/depreciation at measurement date, which represents the change in the contract’s value from trade date. All additional assets and liabilities included in the above table are reported at their market value at measurement date.
4. Investments and Risks
Risks of Foreign Investing. The Fund may invest in foreign securities which are subject to special risks. Securities traded in foreign markets may be less liquid and more volatile than those traded in U.S. markets. Foreign issuers are usually not subject to the same accounting and disclosure requirements that U.S. companies are subject to, which may make it difficult for the Fund to evaluate a foreign company’s operations or financial condition. A change in the value of a foreign currency against the U.S. dollar will result in a change in the U.S. dollar value of investments denominated in that foreign currency and in the value of any income or distributions the Fund may receive on those investments. The value of foreign investments may be affected by exchange control regulations, foreign taxes, higher transaction and other costs, delays in the settlement of transactions, changes in economic or monetary policy in the United States or abroad, expropriation or nationalization of a company’s assets, or other political and economic factors. In addition, due to the inter-relationship of global economies and financial markets, changes in political and economic factors in one country or region could adversely affect conditions in another country or region. Investments in foreign securities may also expose the Fund to time-zone arbitrage risk. Foreign securities may trade on weekends or other days when the Fund does not price its shares. At times, the Fund may emphasize investments in a particular country or region and may be subject to greater risks from adverse events that occur in that country or region. Foreign securities and foreign currencies held in foreign banks and securities depositories may be subject to limited or no regulatory oversight.
Investments in Affiliated Funds. The Fund is permitted to invest in other mutual funds advised by the Manager (“Affiliated Funds”). Affiliated Funds are open-end management investment companies registered under the 1940 Act, as amended. The Manager is the investment adviser of, and the Sub-Adviser provides investment and related advisory services to, the Affiliated Funds. When applicable, the Fund’s investments in Affiliated Funds are included in the Statement of Investments. Shares of Affiliated Funds are valued at their net asset value per share. As a shareholder, the Fund is subject to its proportional share of the Affiliated Funds’ expenses, including their management fee. The Manager will waive fees and/or reimburse Fund expenses in an amount equal to the indirect management fees incurred through the Fund’s investment in the Affiliated Funds.
Each of the Affiliated Funds in which the Fund invests has its own investment risks, and those risks can affect the value of the Fund’s investments and therefore the value of the Fund’s shares. To the extent that the Fund invests more of its assets in one Affiliated Fund than in another, the Fund will have greater exposure to the risks of that Affiliated Fund.
Investment in Oppenheimer Institutional Money Market Fund. The Fund is permitted to invest daily available cash balances in a money market Affiliated Fund. The Fund may invest the available cash in Class E shares of Oppenheimer Institutional Money Market Fund (“IMMF”) to seek current income while preserving liquidity or for defensive purposes. IMMF is regulated as a money market fund under the Investment Company Act of 1940, as amended.
17 OPPENHEIMER INTERNATIONAL GROWTH FUND/VA
NOTES TO FINANCIAL STATEMENTS Unaudited / Continued
4. Investments and Risks (Continued)
Equity Security Risk. Stocks and other equity securities fluctuate in price. The value of the Fund’s portfolio may be affected by changes in the equity markets generally. Equity markets may experience significant short-term volatility and may fall sharply at times. Different markets may behave differently from each other and U.S. equity markets may move in the opposite direction from one or more foreign stock markets. Adverse events in any part of the equity or fixed-income markets may have unexpected negative effects on other market segments.
The prices of individual equity securities generally do not all move in the same direction at the same time and a variety of factors can affect the price of a particular company’s securities. These factors may include, but are not limited to, poor earnings reports, a loss of customers, litigation against the company, general unfavorable performance of the company’s sector or industry, or changes in government regulations affecting the company or its industry.
5. Market Risk Factors
The Fund’s investments in securities and/or financial derivatives may expose the Fund to various market risk factors:
Commodity Risk. Commodity risk relates to the change in value of commodities or commodity indexes as they relate to increases or decreases in the commodities market. Commodities are physical assets that have tangible properties. Examples of these types of assets are crude oil, heating oil, metals, livestock, and agricultural products.
Credit Risk. Credit risk relates to the ability of the issuer of debt to meet interest and principal payments, or both, as they come due. In general, lower-grade, higher-yield debt securities are subject to credit risk to a greater extent than lower-yield, higher-quality securities.
Equity Risk. Equity risk relates to the change in value of equity securities as they relate to increases or decreases in the general market.
Foreign Exchange Rate Risk. Foreign exchange rate risk relates to the change in the U.S. dollar value of a security held that is denominated in a foreign currency. The U.S. dollar value of a foreign currency denominated security will decrease as the dollar appreciates against the currency, while the U.S. dollar value will increase as the dollar depreciates against the currency.
Interest Rate Risk. Interest rate risk refers to the fluctuations in value of fixed-income securities resulting from the inverse relationship between price and yield. For example, an increase in general interest rates will tend to reduce the market value of already issued fixed-income investments, and a decline in general interest rates will tend to increase their value. In addition, debt securities with longer maturities, which tend to have higher yields, are subject to potentially greater fluctuations in value from changes in interest rates than obligations with shorter maturities.
Volatility Risk. Volatility risk refers to the magnitude of the movement, but not the direction of the movement, in a financial instrument’s price over a defined time period. Large increases or decreases in a financial instrument’s price over a relative time period typically indicate greater volatility risk, while small increases or decreases in its price typically indicate lower volatility risk.
6. Shares of Beneficial Interest
The Fund has authorized an unlimited number of $0.001 par value shares of beneficial interest of each class. Transactions in shares of beneficial interest were as follows:
| Six Months Ended June 30, 2016 | Year Ended December 31, 2015 | |||||||||||||||
| Shares | Amount | Shares | Amount | |||||||||||||
|
|
||||||||||||||||
| Non-Service Shares |
||||||||||||||||
| Sold |
8,941,085 | $ | 19,050,267 | 25,785,184 | $ | 60,862,122 | ||||||||||
| Dividends and/or distributions reinvested |
4,989,924 | 10,628,540 | 12,263,244 | 28,450,725 | ||||||||||||
| Redeemed |
(11,901,469 | ) | (25,506,906) | (48,734,993 | ) | (113,512,248) | ||||||||||
|
|
|
|||||||||||||||
| Net increase (decrease) |
2,029,540 | $ | 4,171,901 | (10,686,565 | ) | $ | (24,199,401) | |||||||||
|
|
|
|||||||||||||||
|
|
||||||||||||||||
| Service Shares |
||||||||||||||||
| Sold |
10,244,631 | $ | 22,831,385 | 20,290,959 | $ | 49,094,495 | ||||||||||
| Dividends and/or distributions reinvested |
2,468,940 | 5,481,045 | 5,341,754 | 12,873,626 | ||||||||||||
| Redeemed |
(5,936,049 | ) | (13,237,219) | (12,264,866 | ) | (29,078,792) | ||||||||||
|
|
|
|||||||||||||||
| Net increase |
6,777,522 | $ | 15,075,211 | 13,367,847 | $ | 32,889,329 | ||||||||||
|
|
|
|||||||||||||||
7. Purchases and Sales of Securities
The aggregate cost of purchases and proceeds from sales of securities, other than short-term obligations and investments in IMMF, for the reporting period were as follows:
| Purchases | Sales | |||||||||
|
|
||||||||||
| Investment securities |
$32,406,856 | $27,355,413 | ||||||||
8. Fees and Other Transactions with Affiliates
Management Fees. Under the investment advisory agreement, the Fund pays the Manager a management fee based on the daily net assets of the Fund at an annual rate as shown in the following table:
18 OPPENHEIMER INTERNATIONAL GROWTH FUND/VA
8. Fees and Other Transactions with Affiliates (Continued)
| Fee Schedule | ||||
| Up to $250 million |
1.00% | |||
| Next $250 million |
0.90 | |||
| Next $500 million |
0.85 | |||
| Over $1 billion |
0.82 | |||
The Fund’s effective management fee for the reporting period was 0.95% of average annual net assets before any applicable waivers.
Sub-Adviser Fees. The Manager has retained the Sub-Adviser to provide the day-to-day portfolio management of the Fund. Under the Sub-Advisory Agreement, the Manager pays the Sub-Adviser an annual fee in monthly installments, equal to a percentage of the investment management fee collected by the Manager from the Fund, which shall be calculated after any investment management fee waivers. The fee paid to the Sub-Adviser is paid by the Manager, not by the Fund.
Transfer Agent Fees. OFI Global (the “Transfer Agent”) serves as the transfer and shareholder servicing agent for the Fund. The Fund pays the Transfer Agent a fee based on annual net assets. Fees incurred and average net assets for each class with respect to these services are detailed in the Statement of Operations and Financial Highlights, respectively.
Sub-Transfer Agent Fees. The Transfer Agent has retained Shareholder Services, Inc., a wholly-owned subsidiary of OFI (the “Sub-Transfer Agent”), to provide the day-to-day transfer agent and shareholder servicing of the Fund. Under the Sub-Transfer Agency Agreement, the Transfer Agent pays the Sub-Transfer Agent an annual fee in monthly installments, equal to a percentage of the transfer agent fee collected by the Transfer Agent from the Fund, which shall be calculated after any applicable fee waivers. The fee paid to the Sub-Transfer Agent is paid by the Transfer Agent, not by the Fund.
Trustees’ Compensation. The Fund’s Board of Trustees (“Board”) has adopted a compensation deferral plan for Independent Trustees that enables Trustees to elect to defer receipt of all or a portion of the annual compensation they are entitled to receive from the Fund. For purposes of determining the amount owed to the Trustees under the plan, deferred amounts are treated as though equal dollar amounts had been invested in shares of the Fund or in other Oppenheimer funds selected by the Trustees. The Fund purchases shares of the funds selected for deferral by the Trustees in amounts equal to his or her deemed investment, resulting in a Fund asset equal to the deferred compensation liability. Such assets are included as a component of “Other” within the asset section of the Statement of Assets and Liabilities. Deferral of Trustees’ fees under the plan will not affect the net assets of the Fund and will not materially affect the Fund’s assets, liabilities or net investment income per share. Amounts will be deferred until distributed in accordance with the compensation deferral plan.
Distribution and Service Plan for Service Shares. The Fund has adopted a Distribution and Service Plan (the “Plan”) pursuant to Rule 12b-1 under the 1940 Act for Service shares to pay OppenheimerFunds Distributor, Inc. (the “Distributor”), for distribution related services, personal service and account maintenance for the Fund’s Service shares. Under the Plan, payments are made periodically at an annual rate of 0.25% of the daily net assets of Service shares of the Fund. The Distributor currently uses all of those fees to compensate sponsors of the insurance product that offers Fund shares, for providing personal service and maintenance of accounts of their variable contract owners that hold Service shares. These fees are paid out of the Fund’s assets on an on-going basis and increase operating expenses of the Service shares, which results in lower performance compared to the Fund’s shares that are not subject to a service fee. Fees incurred by the Fund under the Plan are detailed in the Statement of Operations.
Waivers and Reimbursements of Expenses. The Manager has contractually agreed to limit the Fund’s expenses after payments, waivers and/or reimbursements and reduction to custodian expenses, excluding expenses incurred directly or indirectly by the Fund as a result of investments in other investment companies, wholly-owned subsidiaries and pooled investment vehicles; so that those expenses, as percentages of daily net assets, will not exceed the annual rate of 1.00% for Non-Service shares and 1.25% for Service shares. The expense limitations do not include interest and fees from borrowing, and other expenses not incurred in the ordinary course of the Fund’s business. During the reporting period, the Manager waived fees and/or reimbursed the Fund $133,638 and $74,542 for Non-Service and Service shares, respectively.
The Manager will waive fees and/or reimburse Fund expenses in an amount equal to the indirect management fees incurred through the Fund’s investment in IMMF. During the reporting period, the Manager waived fees and/or reimbursed the Fund $3,074 for IMMF management fees.
Waivers and/or reimbursements may be modified or terminated as set forth according to the terms in the prospectus.
9. Borrowings and Other Financing
Joint Credit Facility. A number of mutual funds managed by the Manager participate in a $1.28 billion revolving credit facility (the “Facility”) intended to provide short-term financing, if necessary, subject to certain restrictions in connection with atypical redemption activity. Expenses and fees related to the Facility are paid by the participating funds and are disclosed separately or as other expenses on the Statement of Operations. The Fund did not utilize the Facility during the reporting period.
10. Pending Litigation
In 2009, several putative class action lawsuits were filed and later consolidated before the U.S. District Court for the District of Colorado against
19 OPPENHEIMER INTERNATIONAL GROWTH FUND/VA
NOTES TO FINANCIAL STATEMENTS Unaudited / Continued
10. Pending Litigation (Continued)
OppenheimerFunds, Inc. (“OFI”), OppenheimerFunds Distributor, Inc. (“OFDI”), and Oppenheimer Rochester California Municipal Fund, a fund advised by OFI Global Asset Management, Inc. and distributed by the Distributor (the “California Fund”), in connection with the California Fund’s investment performance. The plaintiffs asserted claims against OFI, OFDI and certain present and former trustees and officers of the California Fund under the federal securities laws, alleging, among other things, that the disclosure documents of the California Fund contained misrepresentations and omissions and the investment policies of the California Fund were not followed. Plaintiffs in the suit filed an amended complaint and defendants filed a motion to dismiss. In 2011, the court issued an order which granted in part and denied in part the defendants’ motion to dismiss. In 2012, plaintiffs filed a motion, which defendants opposed, to certify a class and appoint class representatives and class counsel. In March 2015, the court granted plaintiffs’ motion for class certification. In May 2015, the U.S. Court of Appeals for the Tenth Circuit vacated the class certification order and remanded the matter to the district court for further proceedings. In October 2015, the district court reaffirmed its order and determined that the suit will proceed as a class action. In December 2015, the Tenth Circuit denied defendants’ petition to appeal the district court’s reaffirmed class certification order.
OFI and OFDI believe the suit is without merit; that it is premature to render any opinion as to the likelihood of an outcome unfavorable to them in the suit; and that no estimate can yet be made as to the amount or range of any potential loss. Furthermore, OFI believes that the suit should not impair the ability of OFI or OFDI to perform their respective duties to the Fund and that the outcome of the suit should not have any material effect on the operations of any of the Oppenheimer funds.
20 OPPENHEIMER INTERNATIONAL GROWTH FUND/VA
PORTFOLIO PROXY VOTING POLICIES AND GUIDELINES; UPDATES TO STATEMENTS OF INVESTMENTS Unaudited
The Fund has adopted Portfolio Proxy Voting Policies and Guidelines under which the Fund votes proxies relating to securities (“portfolio proxies”) held by the Fund. A description of the Fund’s Portfolio Proxy Voting Policies and Guidelines is available (i) without charge, upon request, by calling the Fund toll-free at 1.800.525.7048, (ii) on the Fund’s website at www.oppenheimerfunds.com, and (iii) on the SEC’s website at www.sec.gov. In addition, the Fund is required to file Form N-PX, with its complete proxy voting record for the 12 months ended June 30th, no later than August 31st of each year. The Fund’s voting record is available (i) without charge, upon request, by calling the Fund toll-free at 1.800.525.7048, and (ii) in the Form N-PX filing on the SEC’s website at www.sec.gov.
The Fund files its complete schedule of portfolio holdings with the SEC for the first quarter and the third quarter of each fiscal year on Form N-Q. The Fund’s Form N-Q filings are available on the SEC’s website at www.sec.gov. Those forms may be reviewed and copied at the SEC’s Public Reference Room in Washington, D.C. Information on the operation of the Public Reference Room may be obtained by calling 1-800-SEC-0330.
21 OPPENHEIMER INTERNATIONAL GROWTH FUND/VA
DISTRIBUTION SOURCES Unaudited
For any distribution that took place over the Fund’s reporting period, the table below details on a per-share basis the percentage of the Fund’s total distribution payment amount that was derived from the following sources: net income, net profit from the sale of securities, and other capital sources. This information is based upon income and capital gains using generally accepted accounting principles as of the date of each distribution. Because the Fund is actively managed, the relative amount of the Fund’s total distributions derived from various sources over the calendar year may change. Please note that this information should not be used for tax reporting purposes as the tax character of distributable income may differ from the amounts used for this notification. You will receive IRS tax forms in the first quarter of each calendar year detailing the actual amount of the taxable and non-taxable portion of distributions paid to you during the tax year.
For the most current information, please go to oppenheimerfunds.com. Select your Fund, then the ‘Detailed’ tab; where ‘Dividends’ are shown, the Fund’s latest pay date will be followed by the sources of any distribution, updated daily.
|
Fund Name |
|
Pay Date |
|
|
Net Income |
|
|
Net Profit |
|
|
Other Sources |
| ||||
| Oppenheimer International Growth Fund/VA |
6/21/16 | 32.5% | 45.6% | 21.9% |
22 OPPENHEIMER INTERNATIONAL GROWTH FUND/VA
THIS PAGE INTENTIONALLY LEFT BLANK.
23 OPPENHEIMER INTERNATIONAL GROWTH FUND/VA
OPPENHEIMER INTERNATIONAL GROWTH FUND/VA
A Series of Oppenheimer Variable Account Funds
| Trustees and Officers | Sam Freedman, Chairman of the Board of Trustees and Trustee | |
| Jon S. Fossel, Trustee | ||
| Richard F. Grabish, Trustee | ||
| Beverly L. Hamilton, Trustee | ||
| Victoria J. Herget, Trustee | ||
| Robert J. Malone, Trustee | ||
| F. William Marshall, Jr., Trustee | ||
| Karen L. Stuckey, Trustee | ||
| James D. Vaughn, Trustee | ||
| Arthur P. Steinmetz, Trustee, President and Principal Executive Officer | ||
| George R. Evans, Vice President | ||
| Robert B. Dunphy, Vice President | ||
| Cynthia Lo Bessette, Secretary and Chief Legal Officer | ||
| Jennifer Sexton, Vice President and Chief Business Officer | ||
| Mary Ann Picciotto, Chief Compliance Officer and Chief Anti-Money Laundering Officer | ||
| Brian S. Petersen, Treasurer and Principal Financial & Accounting Officer | ||
| Manager | OFI Global Asset Management, Inc. | |
| Sub-Adviser | OppenheimerFunds, Inc. | |
| Distributor | OppenheimerFunds Distributor, Inc. | |
| Transfer and Shareholder Servicing Agent |
OFI Global Asset Management, Inc. | |
| Sub-Transfer Agent | Shareholder Services, Inc. | |
| DBA OppenheimerFunds Services | ||
| Independent | KPMG LLP | |
| Registered | ||
| Public | ||
| Accounting | ||
| Firm | ||
| Legal Counsel | Ropes & Gray LLP | |
| Before investing in any of the Oppenheimer funds, investors should carefully consider a fund’s investment objectives, risks, charges and expenses. Fund prospectuses and summary prospectuses contain this and other information about the funds, and may be obtained by asking your financial advisor, or calling us at 1.800.988.8287. Read prospectuses and summary prospectuses carefully before investing. | ||
| The financial statements included herein have been taken from the records of the Fund without examination of those records by the independent registered public accounting firm. | ||
| © 2016 OppenheimerFunds, Inc. All rights reserved. Oppenheimer funds are distributed by OppenheimerFunds Distributor, Inc. | ||

Item 2. Code of Ethics.
Not applicable to semiannual reports.
Item 3. Audit Committee Financial Expert.
Not applicable to semiannual reports.
Item 4. Principal Accountant Fees and Services.
Not applicable to semiannual reports.
Item 5. Audit Committee of Listed Registrants
Not applicable.
Item 6. Schedule of Investments.
a) Not applicable. The complete schedule of investments is included in Item 1 of this Form N-CSR.
b) Not applicable.
Item 7. Disclosure of Proxy Voting Policies and Procedures for Closed-End Management Investment Companies.
Not applicable.
Item 8. Portfolio Managers of Closed-End Management Investment Companies.
Not applicable.
Item 9. Purchases of Equity Securities by Closed-End Management Investment Company and Affiliated Purchasers.
Not applicable.
Item 10. Submission of Matters to a Vote of Security Holders.
The Fund’s Governance Committee Provisions with Respect to Nominations of Directors/Trustees to the Respective Boards
None
Item 11. Controls and Procedures.
Based on their evaluation of the registrant’s disclosure controls and procedures (as defined in rule 30a-3(c) under the Investment Company Act of 1940 (17 CFR 270.30a-3(c)) as of 6/30/2016, the registrant’s principal executive officer and principal financial officer found the registrant’s disclosure controls and procedures to provide reasonable assurances that information required to be disclosed by the registrant in the reports that it files under the Securities Exchange Act of 1934 (a) is accumulated and communicated to registrant’s management, including its principal executive officer and principal financial officer, to allow timely decisions regarding required disclosure, and (b) is recorded, processed, summarized and reported, within the time periods specified in the rules and forms adopted by the U.S. Securities and Exchange Commission.
There have been no changes in the registrant’s internal controls over financial reporting that occurred during the registrant’s second fiscal quarter of the period covered by this report that have materially affected, or are reasonably likely to materially affect, the registrant’s internal control over financial reporting.
Item 12. Exhibits.
| (a) |
(1) Not applicable to semiannual reports. |
(2) Exhibits attached hereto.
(3) Not applicable.
| (b) | Exhibit attached hereto. |
SIGNATURES
Pursuant to the requirements of the Securities Exchange Act of 1934 and the Investment Company Act of 1940, the registrant has duly caused this report to be signed on its behalf by the undersigned, thereunto duly authorized.
Oppenheimer Variable Account Funds
| By: | /s/ Arthur P. Steinmetz | |
| Arthur P. Steinmetz | ||
| Principal Executive Officer | ||
| Date: | 8/12/2016 |
Pursuant to the requirements of the Securities Exchange Act of 1934 and the Investment Company Act of 1940, this report has been signed below by the following persons on behalf of the registrant and in the capacities and on the dates indicated.
| By: | /s/ Arthur P. Steinmetz | |
| Arthur P. Steinmetz | ||
| Principal Executive Officer | ||
| Date: | 8/12/2016 |
| By: | /s/ Brian S. Petersen | |
| Brian S. Petersen | ||
| Principal Financial Officer | ||
| Date: | 8/12/2016 |