Oppenheimer
Main Street Small Cap Fund/VA®
A series of Oppenheimer Variable
Account Funds
Summary Prospectus April 28, 2017
| Before you invest, you may want to review the Fund’s prospectus, which contains more information about the Fund and its risks. You can find the Fund’s prospectus, Statement of Additional Information, Annual Report and other information about the Fund online at https://www.oppenheimerfunds.com/fund/MainStreetSmallCapFundVA. You can also get this information at no cost by calling 1.800.225.5677 or by sending an email request to: info@oppenheimerfunds.com. |
The
Fund’s prospectus and Statement of Additional Information (“SAI”), both dated April 28, 2017, and through page 28 of its most recent Annual Report, dated December 31, 2016, are
incorporated by reference into this Summary Prospectus. You can access the Fund’s prospectus and SAI at https://www.oppenheimerfunds.com/fund/MainStreetSmallCapFundVA. The Fund’s prospectus is also available from financial intermediaries who are authorized to sell
Fund shares.
Investment Objective. The Fund seeks capital appreciation.
Fees and Expenses of the
Fund. This table describes the fees and expenses that you may pay if you buy and hold or redeem shares of the Fund. The accompanying prospectus of the
participating insurance company provides information on initial or contingent deferred sales charges, exchange fees or redemption fees for that variable life insurance policy, variable annuity or other investment
product. The fees and expenses of those products are not charged by the Fund and are not reflected in this table. Expenses would be higher if those fees were included.
Shareholder Fees
(fees paid directly from your
investment)
| Non-Service | Service | ||
| Maximum Sales Charge (Load) imposed on purchases (as % of offering price) | None | None | |
| Maximum Deferred Sales Charge (Load) (as % of the lower of original offering price or redemption proceeds) | None | None | |
Annual Fund Operating Expenses
(expenses that you pay each year as a
percentage of the value of your investment)
| Non-Service Shares | Service Shares | ||
| Management Fees | 0.69% | 0.69% | |
| Distribution and/or Service (12b-1) Fees | None | 0.25% | |
| Other Expenses | 0.12% | 0.12% | |
| Total Annual Fund Operating Expenses | 0.81% | 1.06% | |
| Fee Waiver and/or Expense Reimbursement* | (0.01)% | (0.01)% | |
| Total Annual Fund Operating Expenses After Fee Waiver and/or Expense Reimbursement | 0.80% | 1.05% | |
| * | After discussions with the Fund’s Board, the Manager has contractually agreed to waive fees and/or reimburse the Fund for certain expenses in order to limit “Total Annual Fund Operating Expenses After Fee Waiver and/or Expense Reimbursement” (excluding any applicable dividend expense, taxes, interest and fees from borrowing, any subsidiary expenses, Acquired Fund Fees and Expenses, brokerage commissions, unusual and infrequent expenses and certain other Fund expenses) to annual rates of 0.80% for Non-Service Shares and 1.05% for Service Shares as calculated on the daily net assets of the Fund. This fee waiver and/or expense reimbursement may not be amended or withdrawn for one year from the date of this prospectus, unless approved by the Board. |
Example.The following Example is intended to help you compare the cost of investing in the Fund with the cost of investing in other mutual funds. Sales charges
and fees for the variable life insurance policy, variable annuity or other investment product offered by participating insurance companies are not charged by the Fund and are not reflected in the Example. The Example
assumes that you invest $10,000 in a class of shares of the Fund for the time periods indicated. The Example also assumes that your investment has a 5% return each year and that the Fund’s operating expenses
remain the same. Any applicable fee waivers and/or expense reimbursements are reflected in the below examples for the period

during which such fee waivers and/or expense
reimbursements are in effect. Although your actual costs may be higher or lower, based on these assumptions your expenses would be as follows, whether or not you redeemed your shares:
| 1 Year | 3 Years | 5 Years | 10 Years | ||
| Non-Service Shares | $82 | $259 | $450 | $1,005 | |
| Service Shares | $108 | $338 | $587 | $1,300 | |
Portfolio Turnover. The Fund pays transaction costs, such as commissions, when it buys and sells securities (or “turns over” its portfolio). A higher portfolio
turnover rate may indicate higher transaction costs. These costs, which are not reflected in the annual fund operating expenses or in the Example, affect the Fund’s performance. During the most recent fiscal
year, the Fund’s portfolio turnover rate was 65% of the average value of its portfolio.
Principal Investment
Strategies. Under normal market conditions, the Fund will invest at least 80% of its net assets, including any borrowings for investment purposes, in securities of
“small-cap” companies. A company’s “market capitalization” is the value of its outstanding common stock. The Fund considers small-cap companies to be those having a market capitalization
in the range of the Russell 2000® Index. The capitalization range of that index is subject to change at any time due to market activity or changes in the
composition of the index. The range of the Russell 2000® Index generally widens over time and it is reconstituted annually to preserve its market cap characteristics. The Fund
measures a company’s capitalization at the time the Fund buys a security and is not required to sell a security if the company’s capitalization moves outside of the Fund’s capitalization definition.
Although the Fund mainly invests in U.S. companies, it can invest in securities issued by companies or governments in any country. The Fund primarily invests in common stock but may also invest in other types of
securities that are consistent with its investment objective.
The portfolio managers use both
fundamental research and quantitative models to identify investment opportunities. While the process may change over time or vary in particular cases, in general the selection process currently:
| ■ | aims to maintain broad diversification across all major economic sectors; |
| ■ | uses a fundamental approach to analyze issuers based on factors such as a company’s financial performance, competitive strength, industry position, business practices and management; |
| ■ | also uses quantitative models, including sector-specific factors, to rank securities within each economic sector: and |
| ■ | considers market trends, current industry outlooks and general economic conditions. |
In constructing the portfolio,
the Fund seeks to limit exposure to so-called “top-down” or “macro” risks, such as overall stock market movements, economic cycles, and interest rate or currency fluctuations. Instead, the
portfolio managers seek to add value by selecting individual securities with superior company-specific fundamental attributes or relative valuations that they expect to outperform their industry and sector peers. This
is commonly referred to as a “bottom-up” approach to portfolio construction.
The portfolio managers consider
stock rankings, benchmark weightings and capitalization outlooks in determining security weightings for individual issuers. The portfolio managers might sell a security if the price is approaching their price target,
if the company’s competitive position has deteriorated or the company’s management has performed poorly, or if they have identified more attractive investment prospects.
Principal Risks. The price of the Fund’s shares can go up and down substantially. The value of the Fund’s investments may change because of broad changes in
the markets in which the Fund invests or because of poor investment selection, which could cause the Fund to underperform other funds with similar investment objectives. There is no assurance that the Fund will
achieve its investment objective. When you redeem your shares, they may be worth less than what you paid for them. These risks mean that you can lose money by investing in the Fund.
Risks of Investing in
Stocks. The value of the Fund’s portfolio may be affected by changes in the stock markets. Stock markets may experience significant short-term volatility and may fall sharply at times.
Adverse events in any part of the equity or fixed-income markets may have unexpected negative effects on other market segments. Different stock markets may behave differently from each other and U.S. stock markets may
move in the opposite direction from one or more foreign stock markets.
The prices of individual stocks
generally do not all move in the same direction at the same time. For example, “growth” stocks may perform well under circumstances in which “value” stocks in general have fallen. A variety of
factors can affect the price of a particular company’s stock. These factors may include, but are not limited to: poor earnings reports, a loss of customers, litigation against the company, general unfavorable
performance of the company’s sector or industry, or changes in government regulations affecting the company or its industry. To the extent that securities of a particular type are emphasized (for example foreign
stocks, stocks of small- or mid-cap companies, growth or value stocks, or stocks of companies in a particular industry), fund share values may fluctuate more in response to events affecting the market for those types
of securities.
Industry and Sector Focus. At times the Fund may increase the relative emphasis of its investments in a particular industry or sector. The prices of stocks of issuers in a particular industry or sector may go up and
down in response to changes in economic conditions, government regulations, availability of basic resources or supplies, or other events that affect that industry or sector more than others. To the extent that the
Fund increases the relative emphasis of its
2
investments in a particular industry or sector,
its share values may fluctuate in response to events affecting that industry or sector. To some extent that risk may be limited by the Fund’s policy of not concentrating its investments in any one industry.
Risks of Small-Cap
Companies. Small-cap companies may be either established or newer companies, including “unseasoned” companies that have typically been in operation for less than three years. While
smaller companies might offer greater opportunities for gain than larger companies, they also involve greater risk of loss. They may be more sensitive to changes in a company’s earnings expectations and may
experience more abrupt and erratic price movements. Smaller companies’ securities often trade in lower volumes and it might be harder for the Fund to dispose of its holdings at an acceptable price when it wants
to sell them. Small-cap companies may not have established markets for their products or services and may have fewer customers and product lines. They may have more limited access to financial resources and may not
have the financial strength to sustain them through business downturns or adverse market conditions. Since small-cap companies typically reinvest a high proportion of their earnings in their business, they may not pay
dividends for some time, particularly if they are newer companies. Small-cap companies may have unseasoned management or less depth in management skill than larger, more established companies. They may be more reliant
on the efforts of particular members of their management team and management changes may pose a greater risk to the success of the business. It may take a substantial period of time before the Fund realizes a gain on
an investment in a small-sized company, if it realizes any gain at all.
Who Is the Fund Designed
For? The Fund’s shares are available only as an investment option under certain variable annuity contracts, variable life insurance policies and
investment plans offered through insurance company separate accounts of participating insurance companies. The Fund is designed primarily for investors seeking capital appreciation. Those investors should be willing
to assume the risks of short-term share price fluctuations that are typical for a fund focusing on long-term capital appreciation of stocks of small sized companies. The Fund is not designed for investors needing
current income. The Fund is not a complete investment program and may not be appropriate for all investors. You should carefully consider your own investment goals and risk tolerance before investing in the
Fund.
An investment in the Fund is not a deposit of any bank and is not insured or guaranteed by the Federal Deposit Insurance Corporation or any other government agency.
The Fund’s Past
Performance. The bar chart and table below provide some indication of the risks of investing in the Fund by showing changes in the Fund’s Non-Service Shares
performance from calendar year to calendar year and by showing how the Fund’s average annual returns for the periods of time shown in the table compare with those of a broad measure of market performance.
Charges imposed by the insurance accounts that invest in the Fund are not included and the returns would be lower if they were. The Fund’s past investment performance is not necessarily an indication of how the
Fund will perform in the future. More recent performance information is available by calling the toll-free number on the back of this prospectus and on the Fund’s website at:
https://www.oppenheimerfunds.com/fund/MainStreetSmallCapFundVA
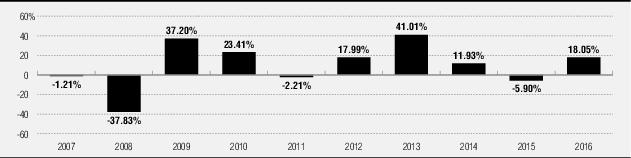
During the period
shown, the highest return before taxes for a calendar quarter was 31.71% (2nd Qtr 09) and the lowest return before taxes for a calendar quarter was -27.25% (4th Qtr 08).
The following table shows the
average annual total returns before taxes for each class of the Fund’s shares.
Average Annual Total Returns for the periods ended December 31, 2016
| 1 Year | 5 Years | 10 Years | ||
| Non-Service Shares (inception 5/1/1998) | 18.05% | 15.65% | 7.72% | |
| Service Shares (inception 7/16/2001) | 17.67% | 15.34% | 7.45% | |
| Russell 2000 Index | 21.31% | 14.46% | 7.07% | |
| (reflects no deduction for fees, expenses, or taxes) | ||||
Investment Adviser. OFI Global Asset Management, Inc. (the “Manager”) is the Fund’s investment adviser. OppenheimerFunds, Inc. (the
“Sub-Adviser”) is its sub-adviser.
Portfolio Managers. Matthew P. Ziehl, CFA, Raymond Anello, CFA, Raman Vardharaj, CFA, Joy Budzinski, Kristin Ketner, Magnus Krantz and Adam Weiner are each a portfolio
manager and Vice President of the Fund. Mr. Ziehl and Mr. Vardharaj have each been a portfolio manager and Vice President of the Fund since May 2009. Mr. Anello has been a
3
portfolio manager of the Fund since April 2011
and Vice President of the Fund since May 2011. Ms. Budzinski, Ms. Ketner, Mr. Krantz and Mr. Weiner have been portfolio managers and Vice Presidents of the Fund since April 2013. Mr. Ziehl and Mr. Weiner serve as
co-lead portfolio managers of the Fund.
Purchase and Sale of Fund
Shares. Shares of the Fund may be purchased only by separate investment accounts of participating insurance companies as an underlying investment for variable
life insurance policies, variable annuity contracts or other investment products. Individual investors cannot buy shares of the Fund directly. You may only submit instructions for buying or selling shares of the Fund
to your insurance company or its servicing agent, not directly to the Fund or its Transfer Agent. The accompanying prospectus of the participating insurance company provides information about how to select the Fund as
an investment option.
Taxes. Because shares of the Fund may be purchased only through insurance company separate accounts for variable annuity contracts, variable life insurance
policies or other investment products, provided certain requirements are met, any dividends and capital gains distributions will be taxable to the participating insurance company, if at all. Special tax rules apply to
life insurance companies, variable annuity contracts and variable life insurance contracts. For information on federal income taxation of a life insurance company with respect to its receipt of distributions from the
Fund and federal income taxation of owners of variable annuity or variable life insurance contracts, see the accompanying prospectus for the applicable contract.
Payments to Broker-Dealers and
Other Financial Intermediaries. The Fund, the Sub-Adviser, or their related companies may make payments to financial intermediaries, including to insurance companies that offer shares
of the Fund as an investment option. These payments for the sale of Fund shares and related services may create a conflict of interest by influencing the intermediary and your salesperson to recommend the Fund over
another investment. Ask your salesperson or visit your financial intermediary’s website for more information.
For More Information About Oppenheimer
Main Street Small Cap Fund/VA
You can access the Fund’s
prospectus and SAI at https://www.oppenheimerfunds.com/fund/MainStreetSmallCapFundVA. You can also request additional information about the Fund or your account:
| Telephone: | Call OppenheimerFunds Services toll-free: 1.800.988.8287 | |
| Mail: | For requests by mail: OppenheimerFunds Services P.O. Box 5270 Denver, Colorado 80217-5270 | For requests by courier or express mail: OppenheimerFunds Services 12100 East Iliff Avenue Suite 300 Aurora, Colorado 80014 |
| Internet: | You may request documents, and read or download certain documents at www.oppenheimerfunds.com | |
PR0297.001.0417